MSI Stealth 15M GeForce RTX Laptop Review: Gráficos mais rápidos do que o Dell XPS 15, HP Spectre x360, ou Asus ZenBook
Não confundir com o MSI GS66 Stealth de 15,6 polegadas, o MSI Stealth 15M de 15,6 polegadas é um modelo completamente diferente projetado para criadores de conteúdo, escritório ou uso profissional. Está na mesma categoria do MSI Prestige existente, Creator, Summit, ou série moderna de laptops, mas com importantes diferenças de especificação.
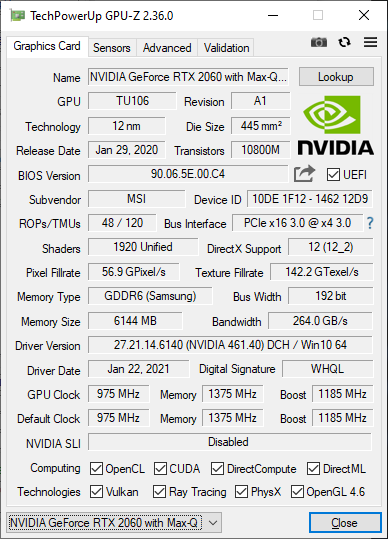
A característica diferencial da Stealth 15M é sua rápida GeForce RTX 2060 Max-Q ou RTX 3060 gráficos emparelhados com uma CPU da série 11ª geração Core U. A maioria dos outros laptops nesta categoria está limitada apenas aos gráficos Geforce GTX ou MX e vêm com CPUs Core série H, como o Dell XPS 15, HP Spectre x360 15, ou Asus ZenBook 15. O sistema MSI, portanto, oferecerá um desempenho gráfico significativamente mais rápido que a maioria de seus concorrentes imediatos - pelo menos no papel. Seu concorrente mais próximo é a HP Envy 15 2020 que vem com a mesma GPU RTX 2060 Max-Q, mas com um processador Core H ainda mais rápido.
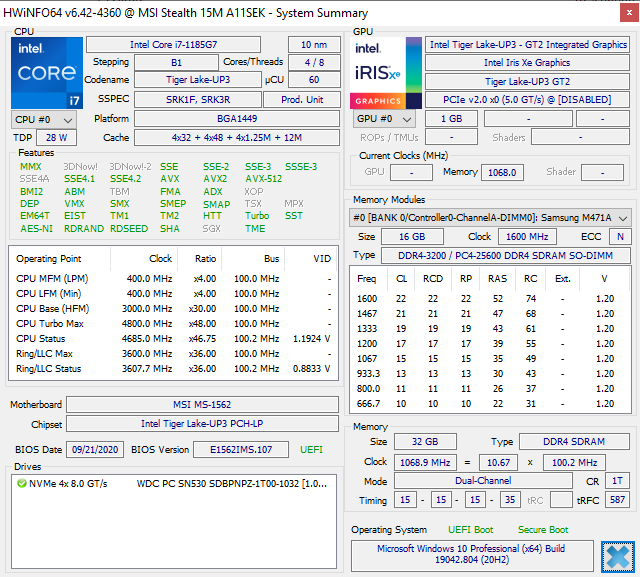
Nossa configuração em revisão está equipada com a CPU Tiger Lake Core i7-1185G7, 32 GB de RAM, GeForce RTX 2060 Max-Q GPU, 60 Hz FHD display, e 1 TB NVMe SSD por aproximadamente $1500 USD no varejo. As configurações atualizadas para lançamento em março de 2021 virão com a CPU Core i7-11375H, display de 144 Hz, e GeForce GPU RTX 3060. Todas as opções até agora têm um display com resolução fixa de 1080p.
Mais revisões da MSI:
potential competitors in comparison
Avaliação | Data | Modelo | Peso | Altura | Size | Resolução | Preço |
|---|---|---|---|---|---|---|---|
| 82.4 % v7 (old) | 02/2021 | MSI Stealth 15M A11SEK i7-1185G7, GeForce RTX 2060 Max-Q | 1.7 kg | 16.15 mm | 15.60" | 1920x1080 | |
| 85 % v7 (old) | 01/2020 | HP Spectre X360 15-5ZV31AV i7-10510U, GeForce MX250 | 2.1 kg | 19.3 mm | 15.60" | 3840x2160 | |
| 90.1 % v7 (old) | 06/2020 | Dell XPS 15 9500 Core i7 4K UHD i7-10875H, GeForce GTX 1650 Ti Mobile | 2 kg | 18 mm | 15.60" | 3840x2400 | |
| 86.6 % v7 (old) | 02/2021 | Lenovo ThinkPad T15p-20TN0006GE i7-10750H, GeForce GTX 1050 Mobile | 2.2 kg | 22.7 mm | 15.60" | 3840x2160 | |
| 87 % v7 (old) | 12/2020 | Asus ZenBook UX535-M01440 i7-10750H, GeForce GTX 1650 Ti Max-Q | 2 kg | 20 mm | 15.60" | 3840x2160 | |
| 85.2 % v7 (old) | 11/2019 | MSI Prestige 15 A10SC i7-10710U, GeForce GTX 1650 Max-Q | 1.7 kg | 16 mm | 15.60" | 3840x2160 |
Caso
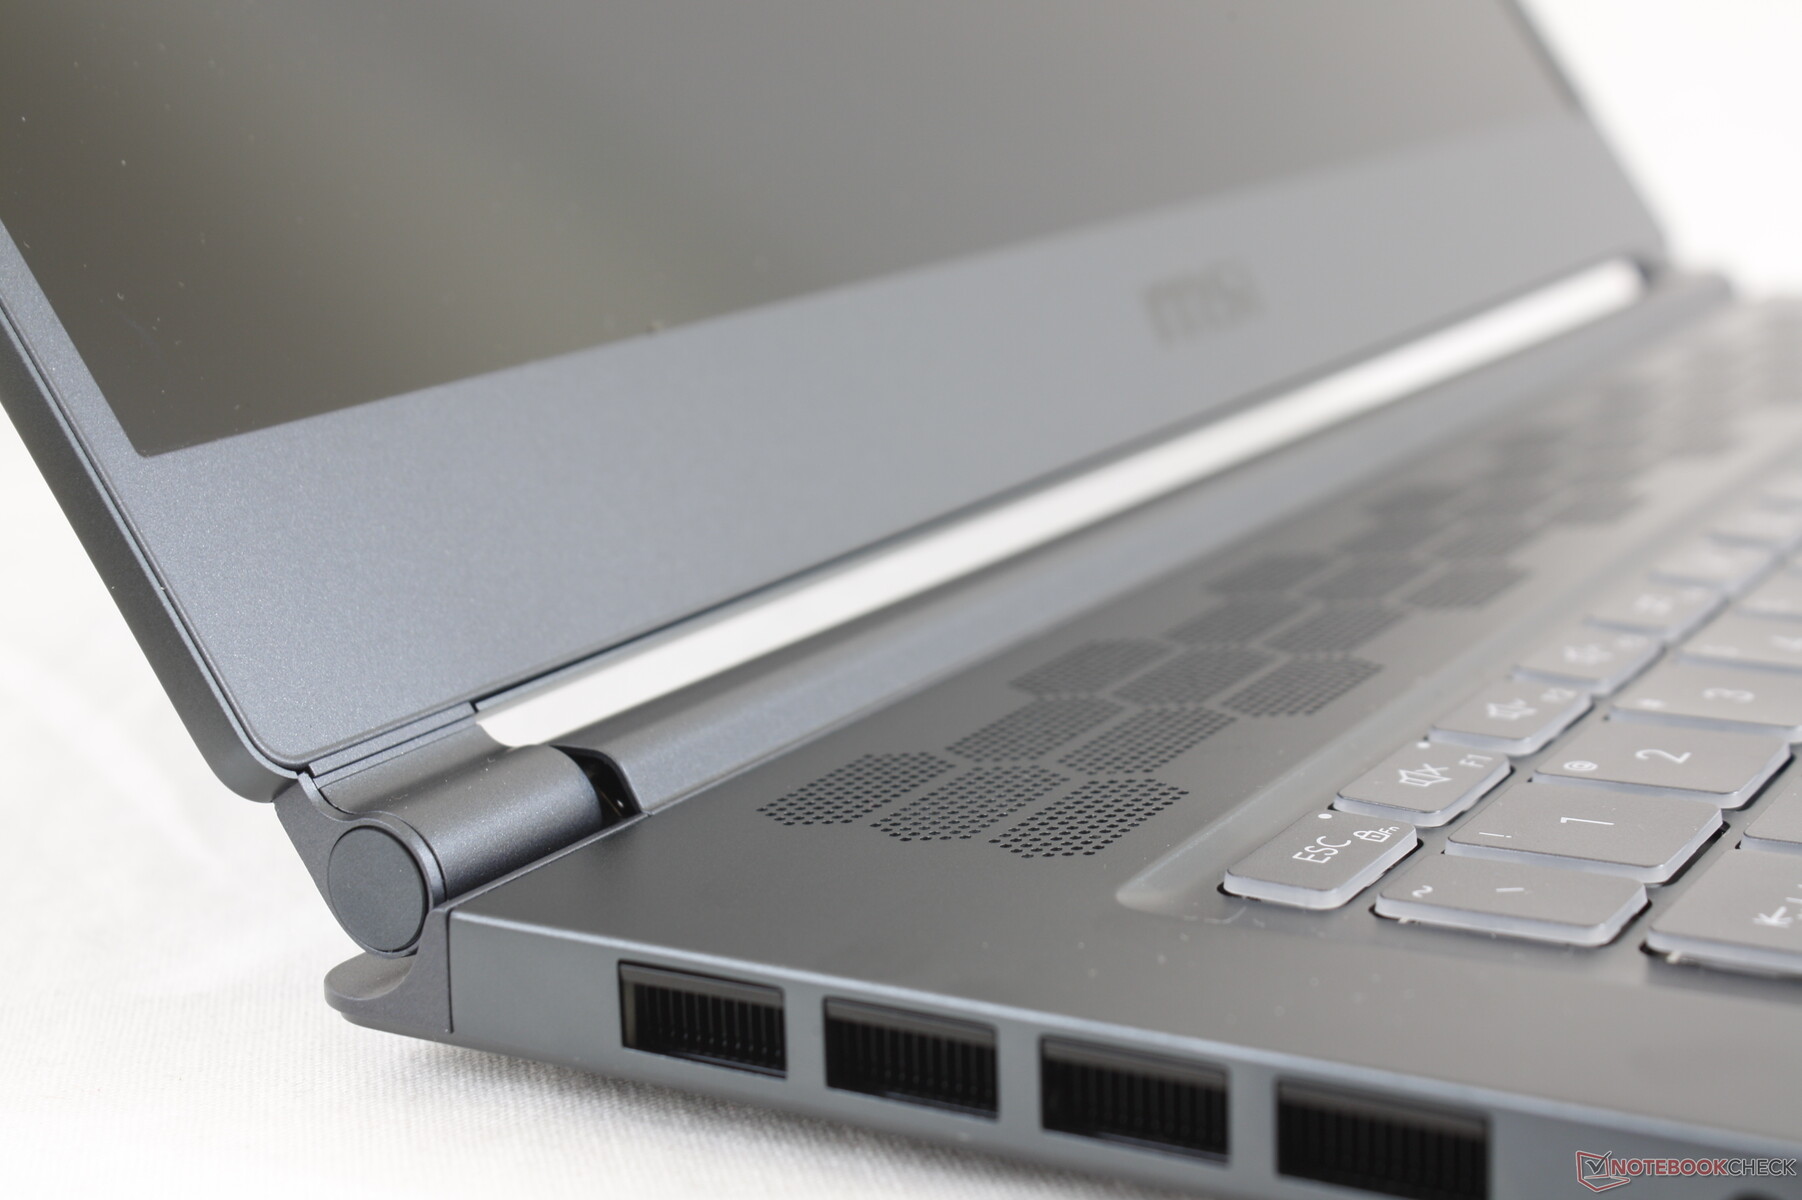
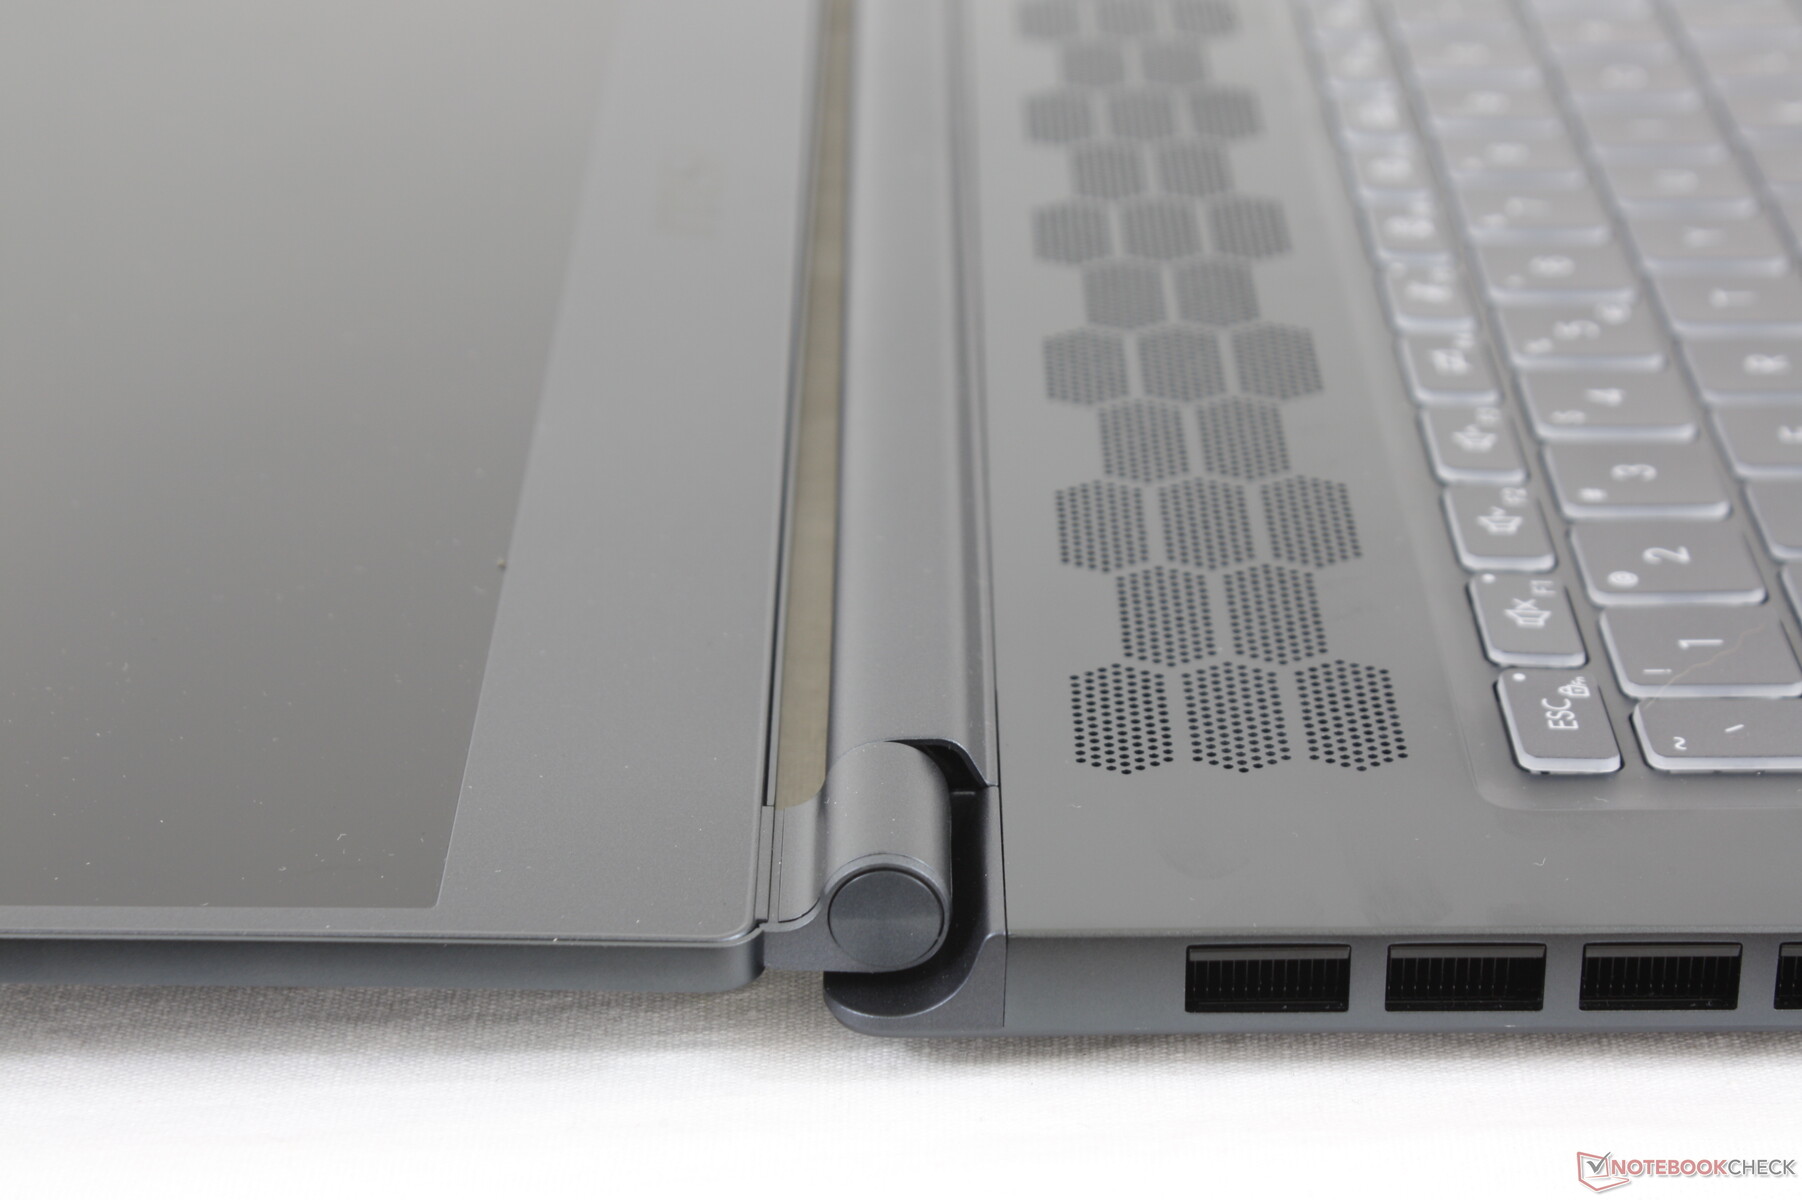
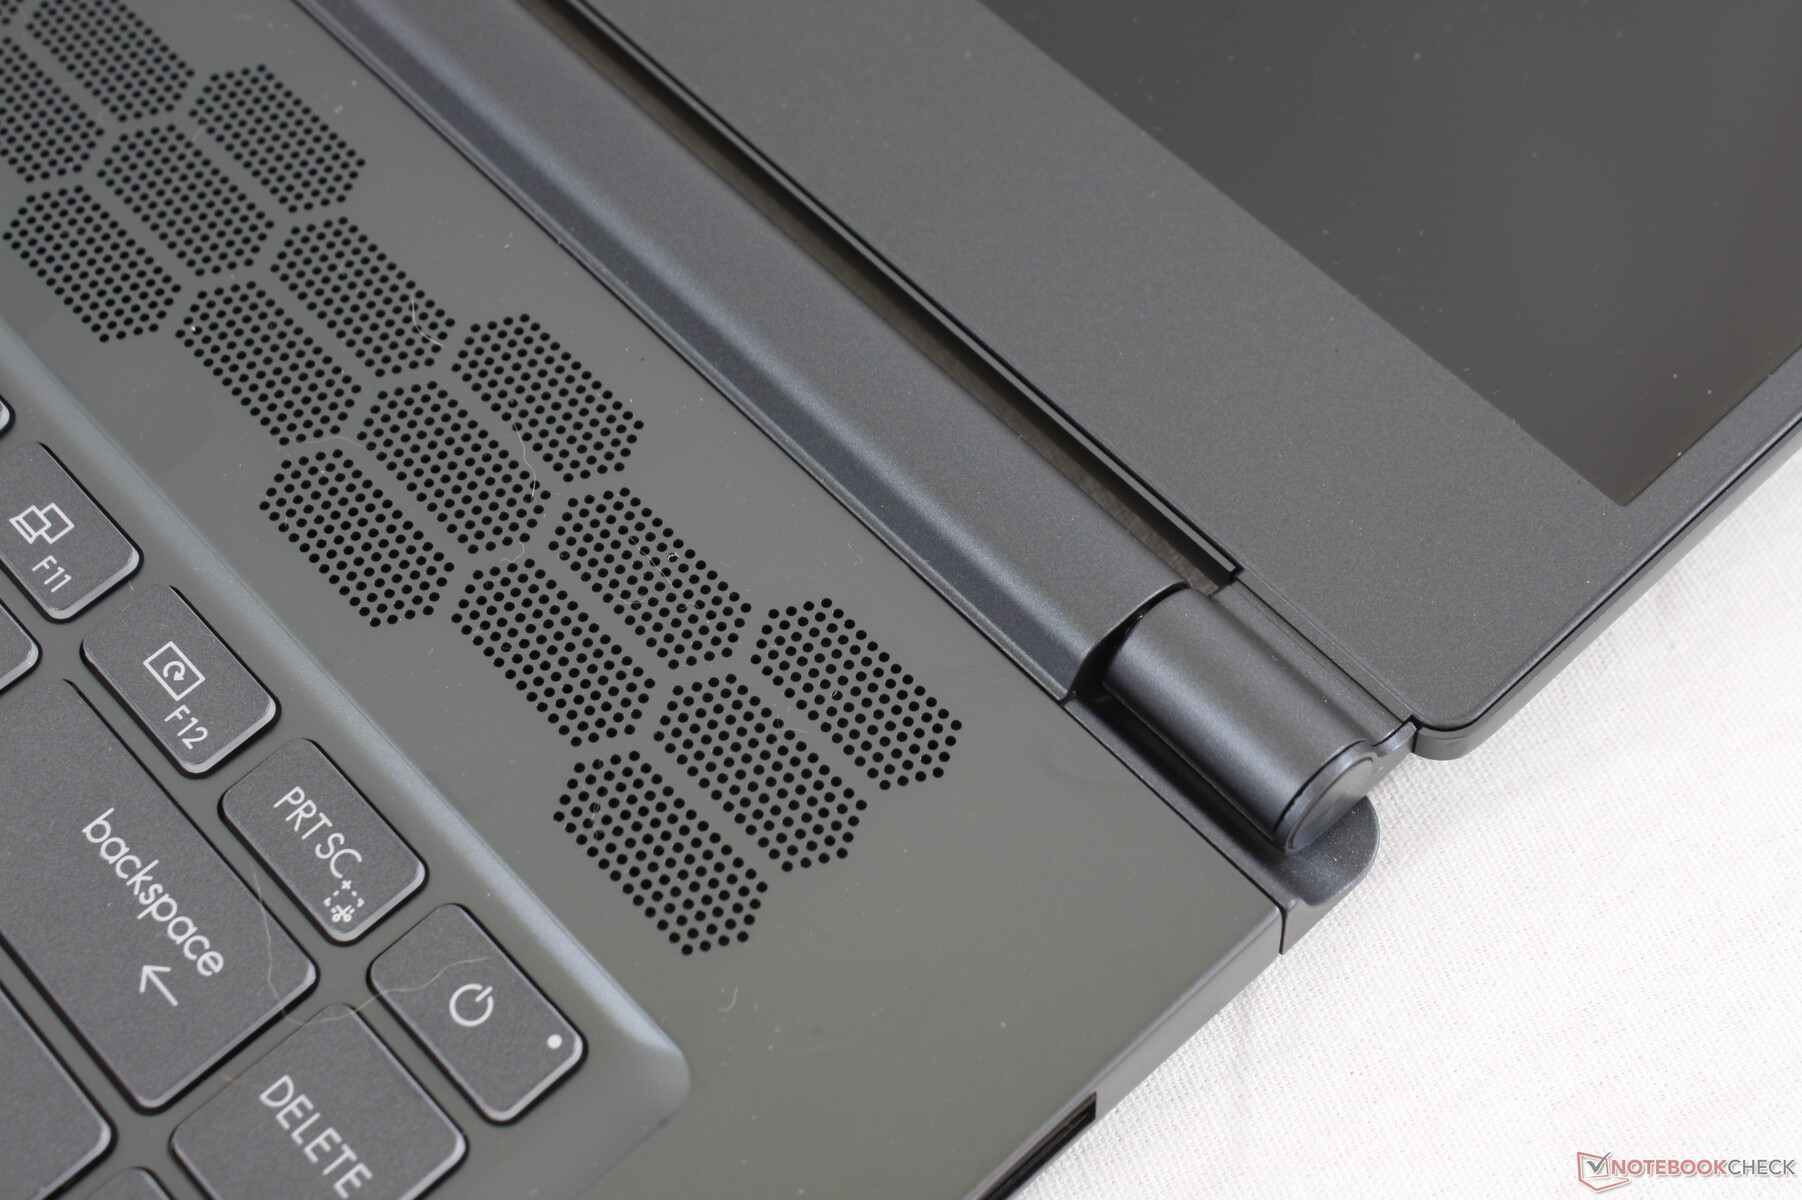
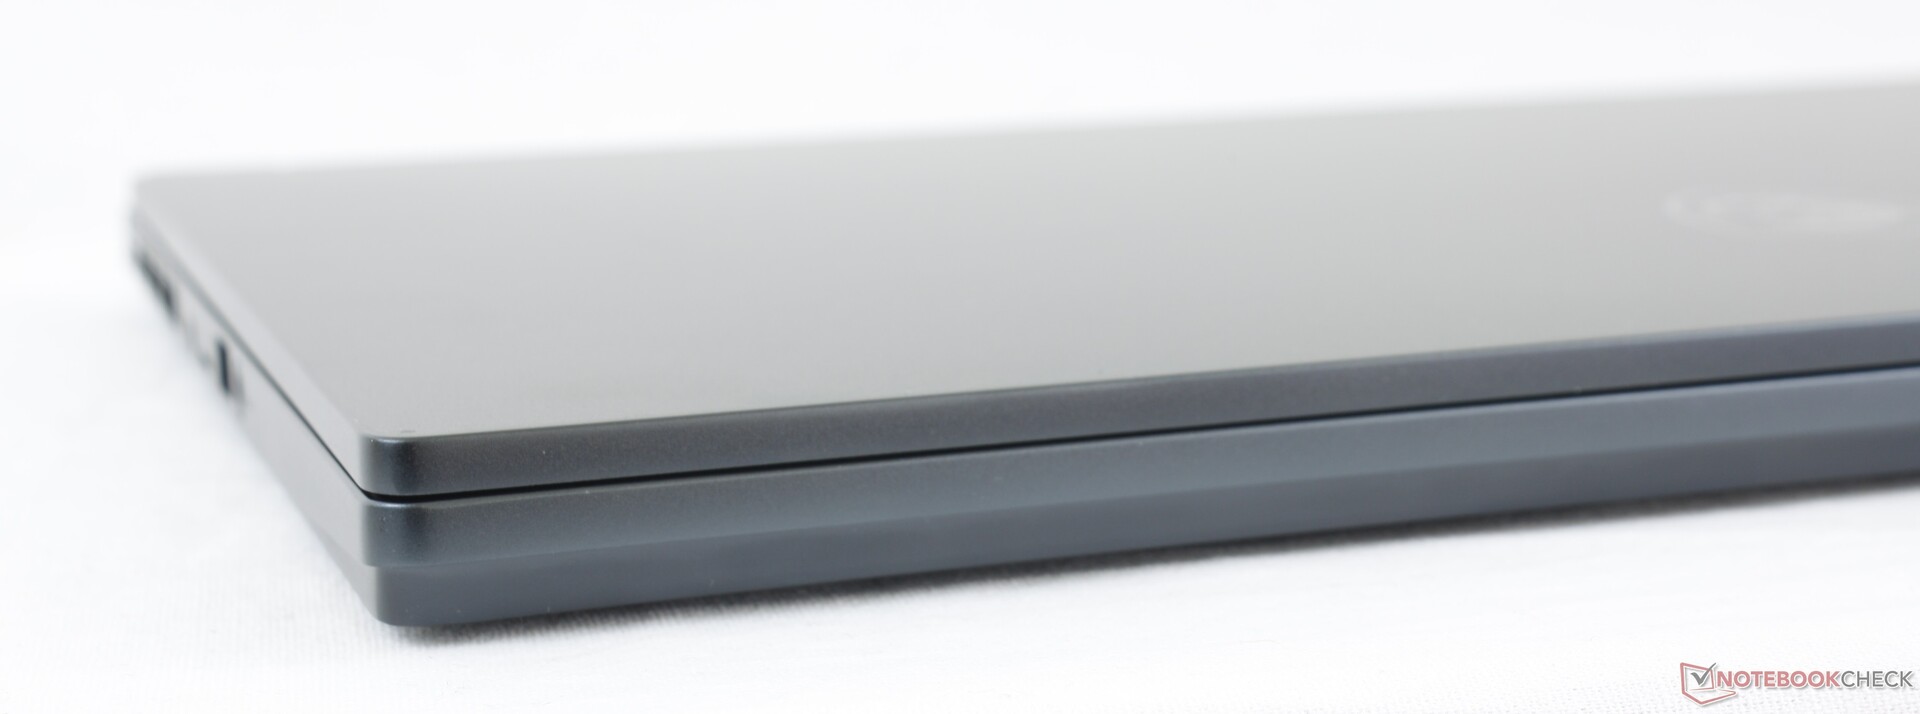
O design do chassi é diferente dos modelos Modernos, Creator, e Prestige. Mesmo assim, a Stealth 15M usa materiais de chassi metálicos similares para um visual e toque semelhantes. Isto também significa que ela sofre das mesmas vantagens e desvantagens para o melhor ou para o pior. Seu design fino e elegante é indiscutivelmente atraente, mas a base e a tampa são muito propensas à flexão quando comparadas ao XPS 15, Envy 15, Spectre x360 15, e à maioria dos outros laptops multimídia de 15,6 polegadas. Também não temos muita fé nas dobradiças fracas que duram mais de um par de anos.
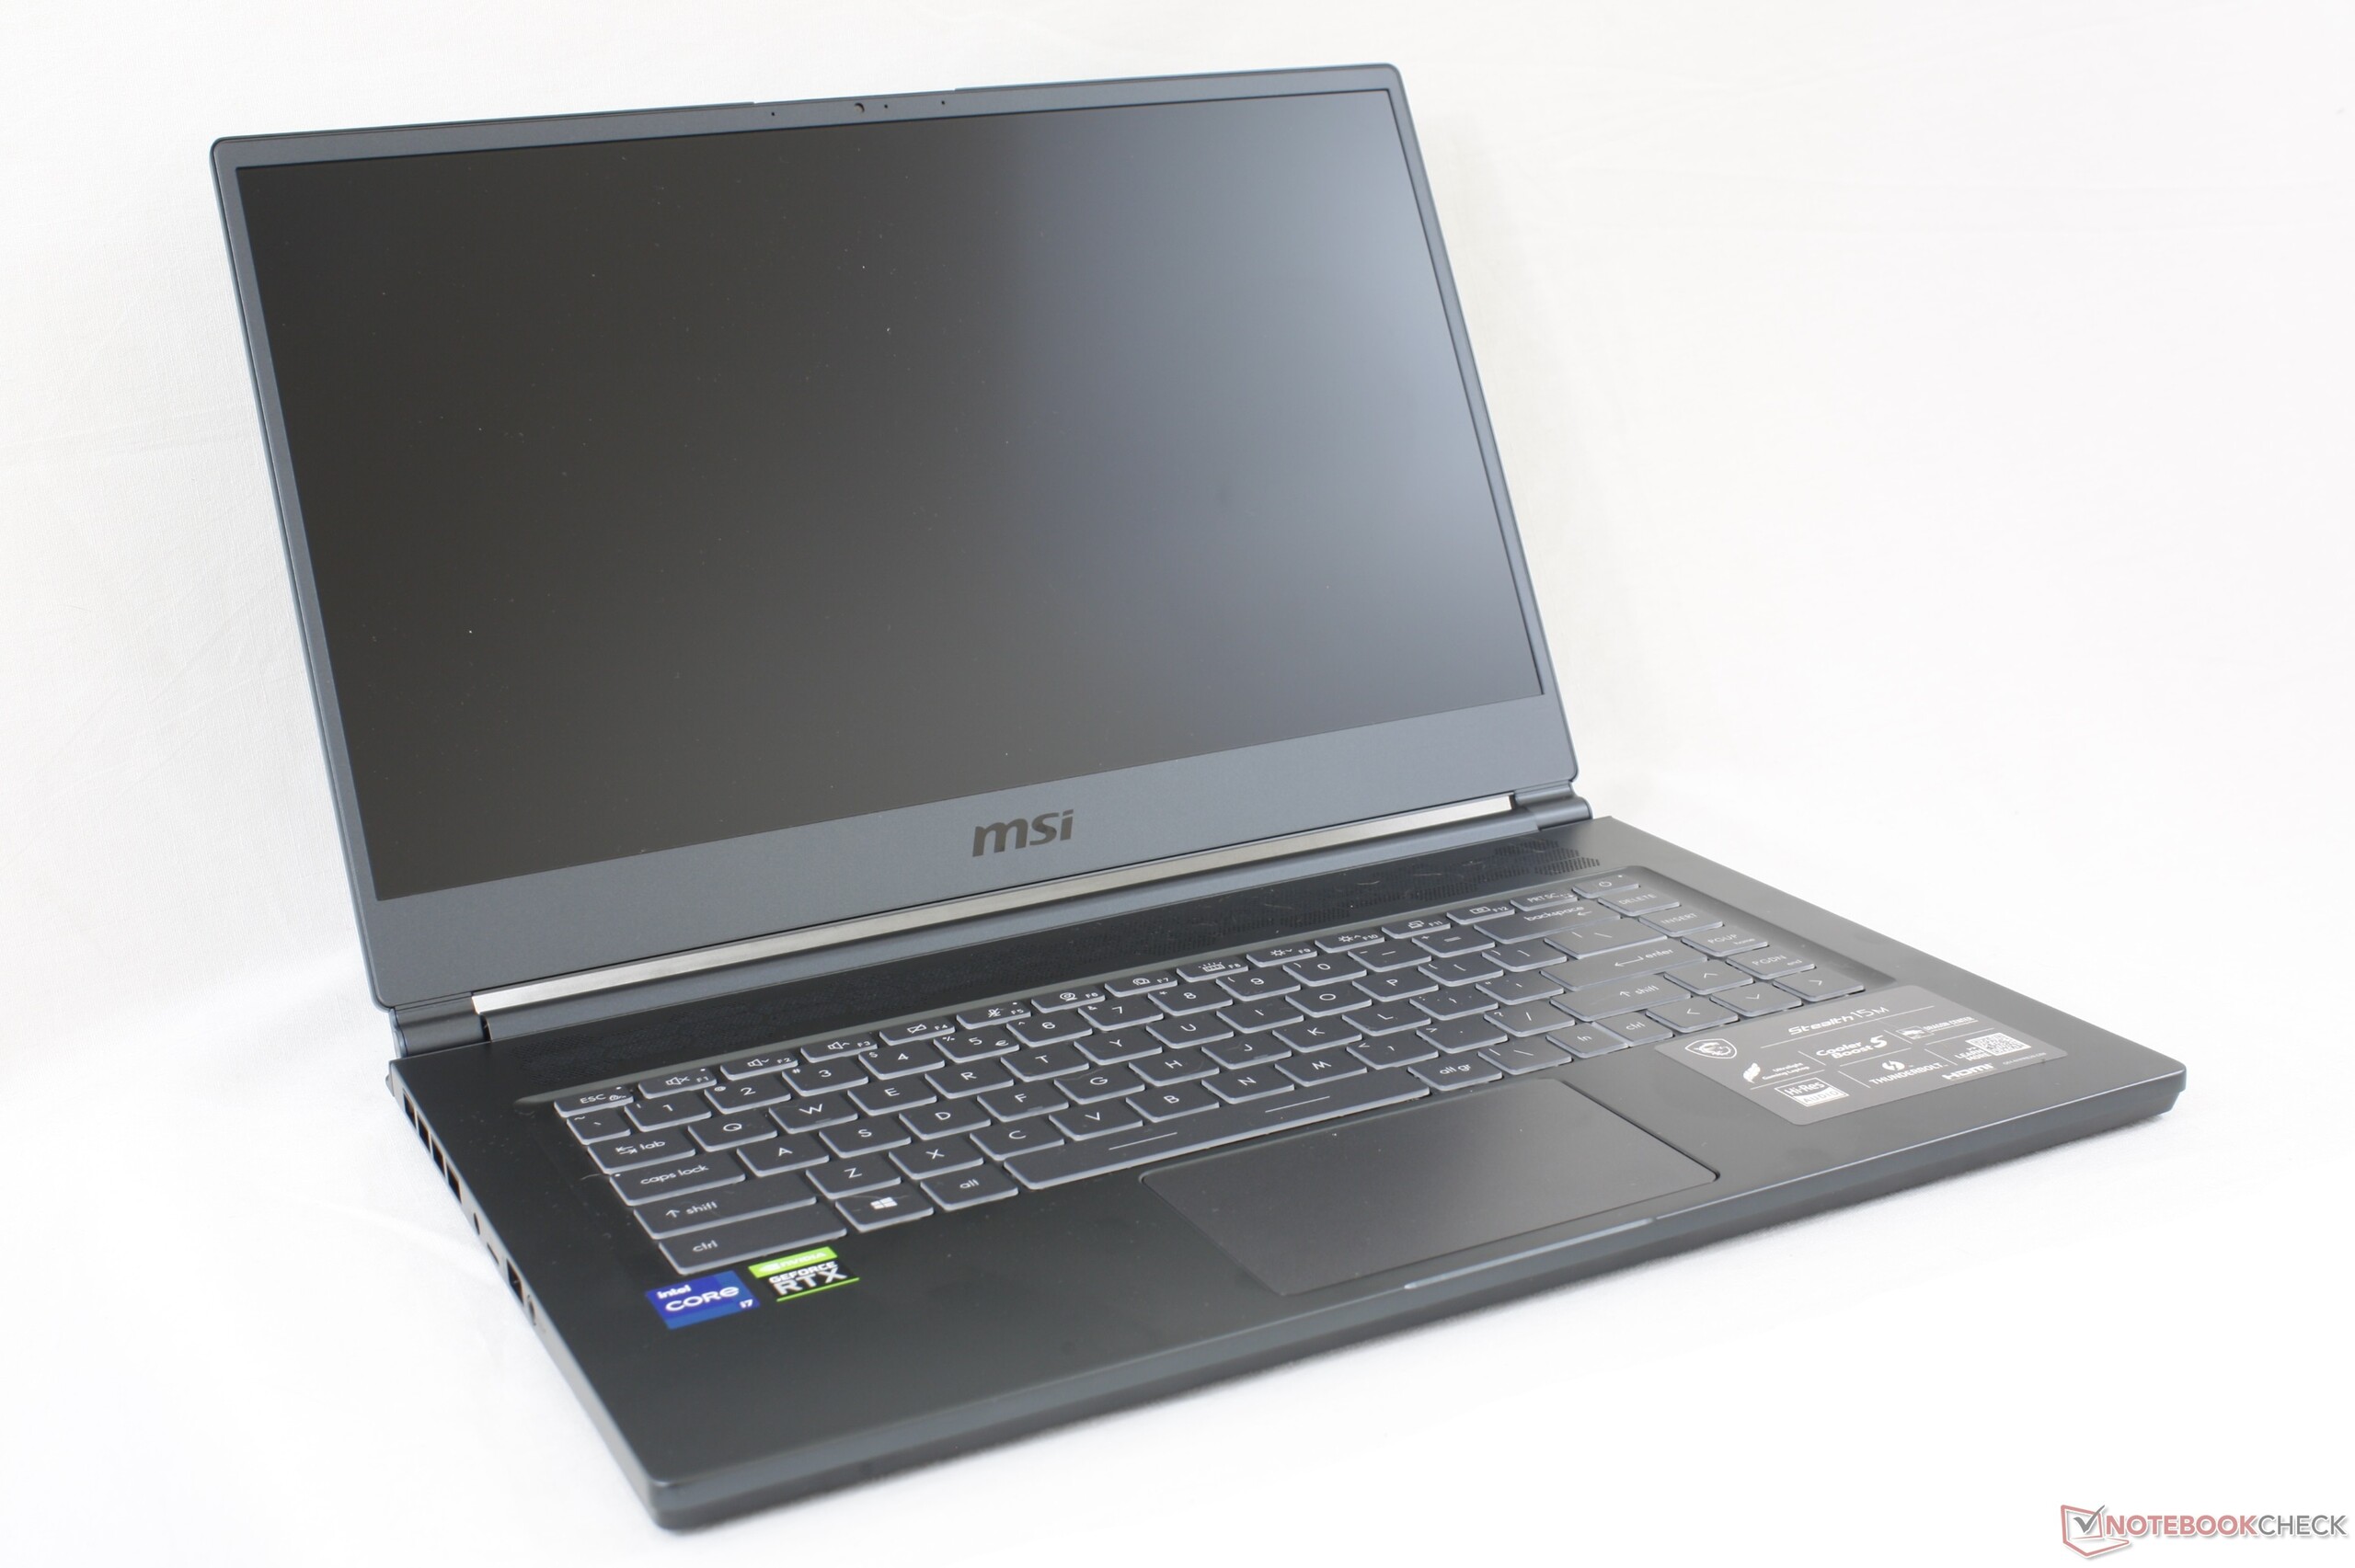
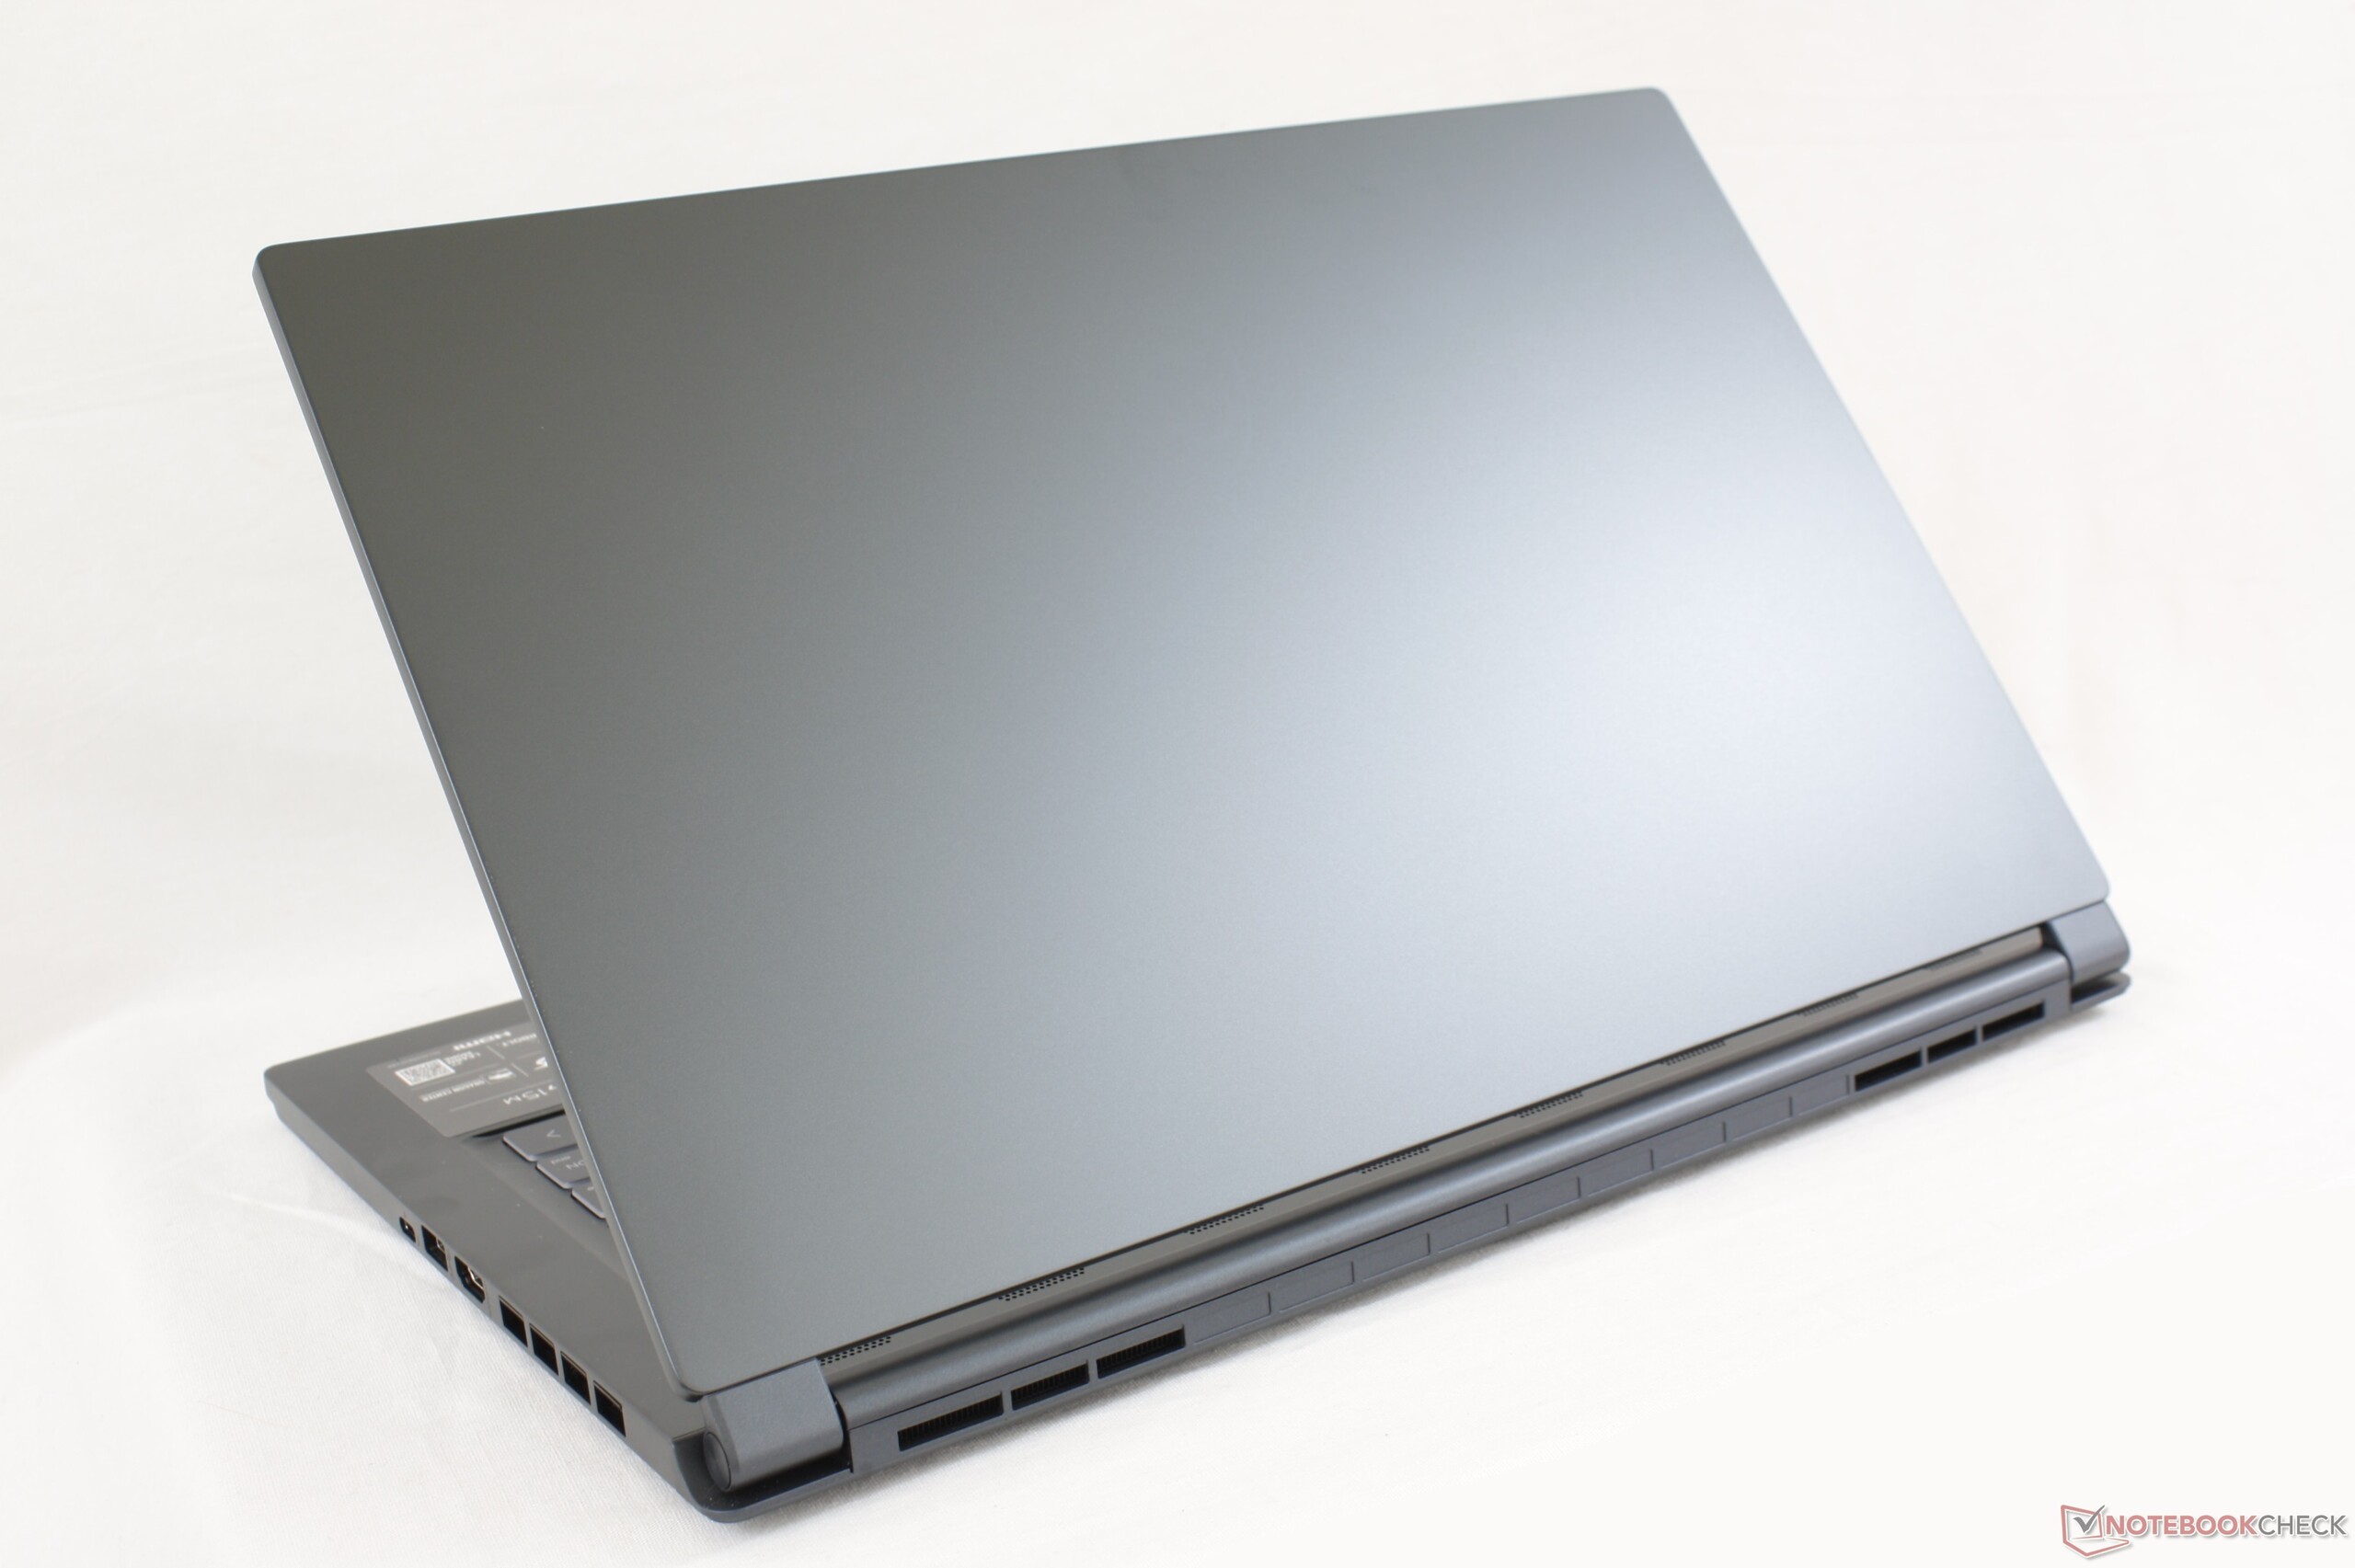
O baixo peso é uma característica importante do Stealth 15M, pois o sistema é aproximadamente 300 g mais leve que muitos de seus concorrentes de 15,6 polegadas, incluindo o XPS 15. O que torna a diferença de peso mais notável é que o MSI também vem com opções gráficas significativamente mais rápidas do que qualquer uma destas alternativas mais pesadas. É muita potência para não muito peso.
As dimensões gerais do MSI são maiores do que no XPS 15 e no Prestige 15 devido à moldura do queixo mais grossa.
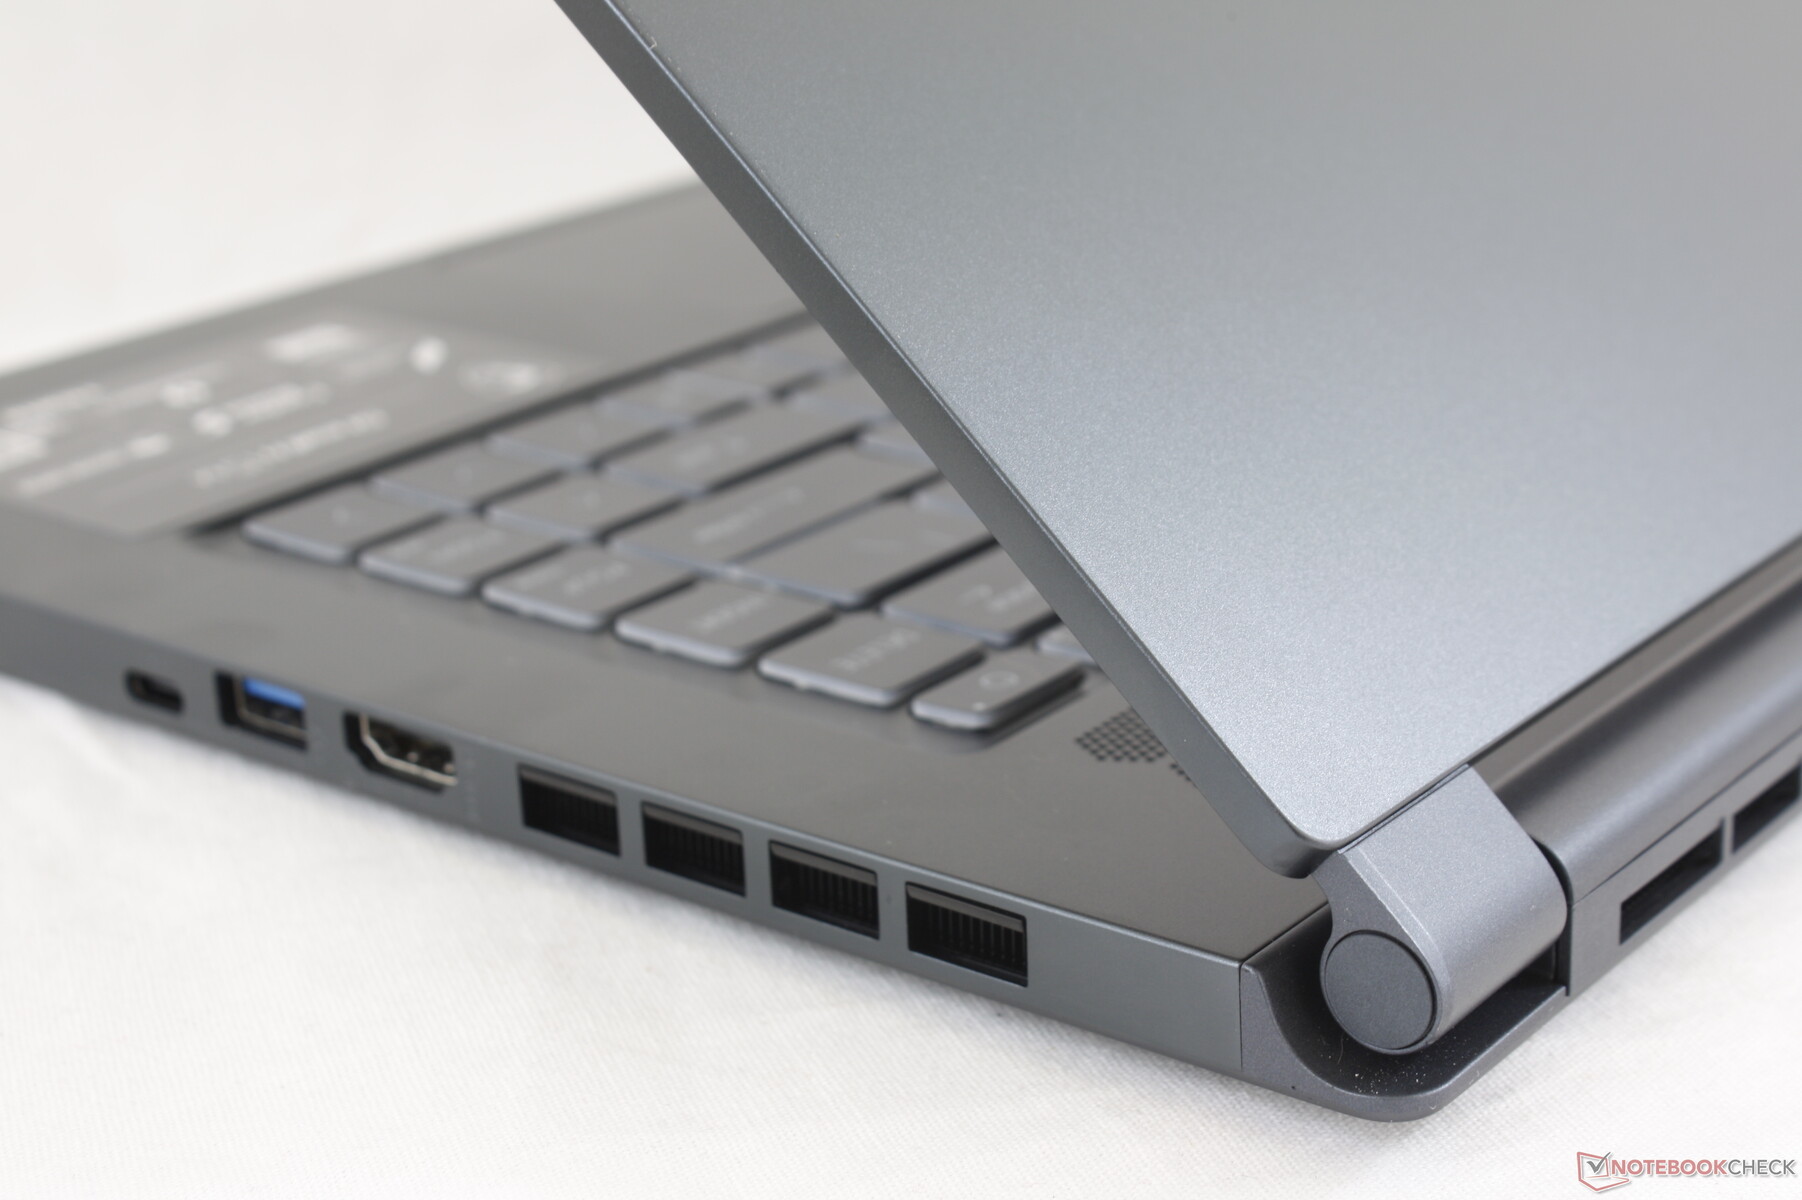
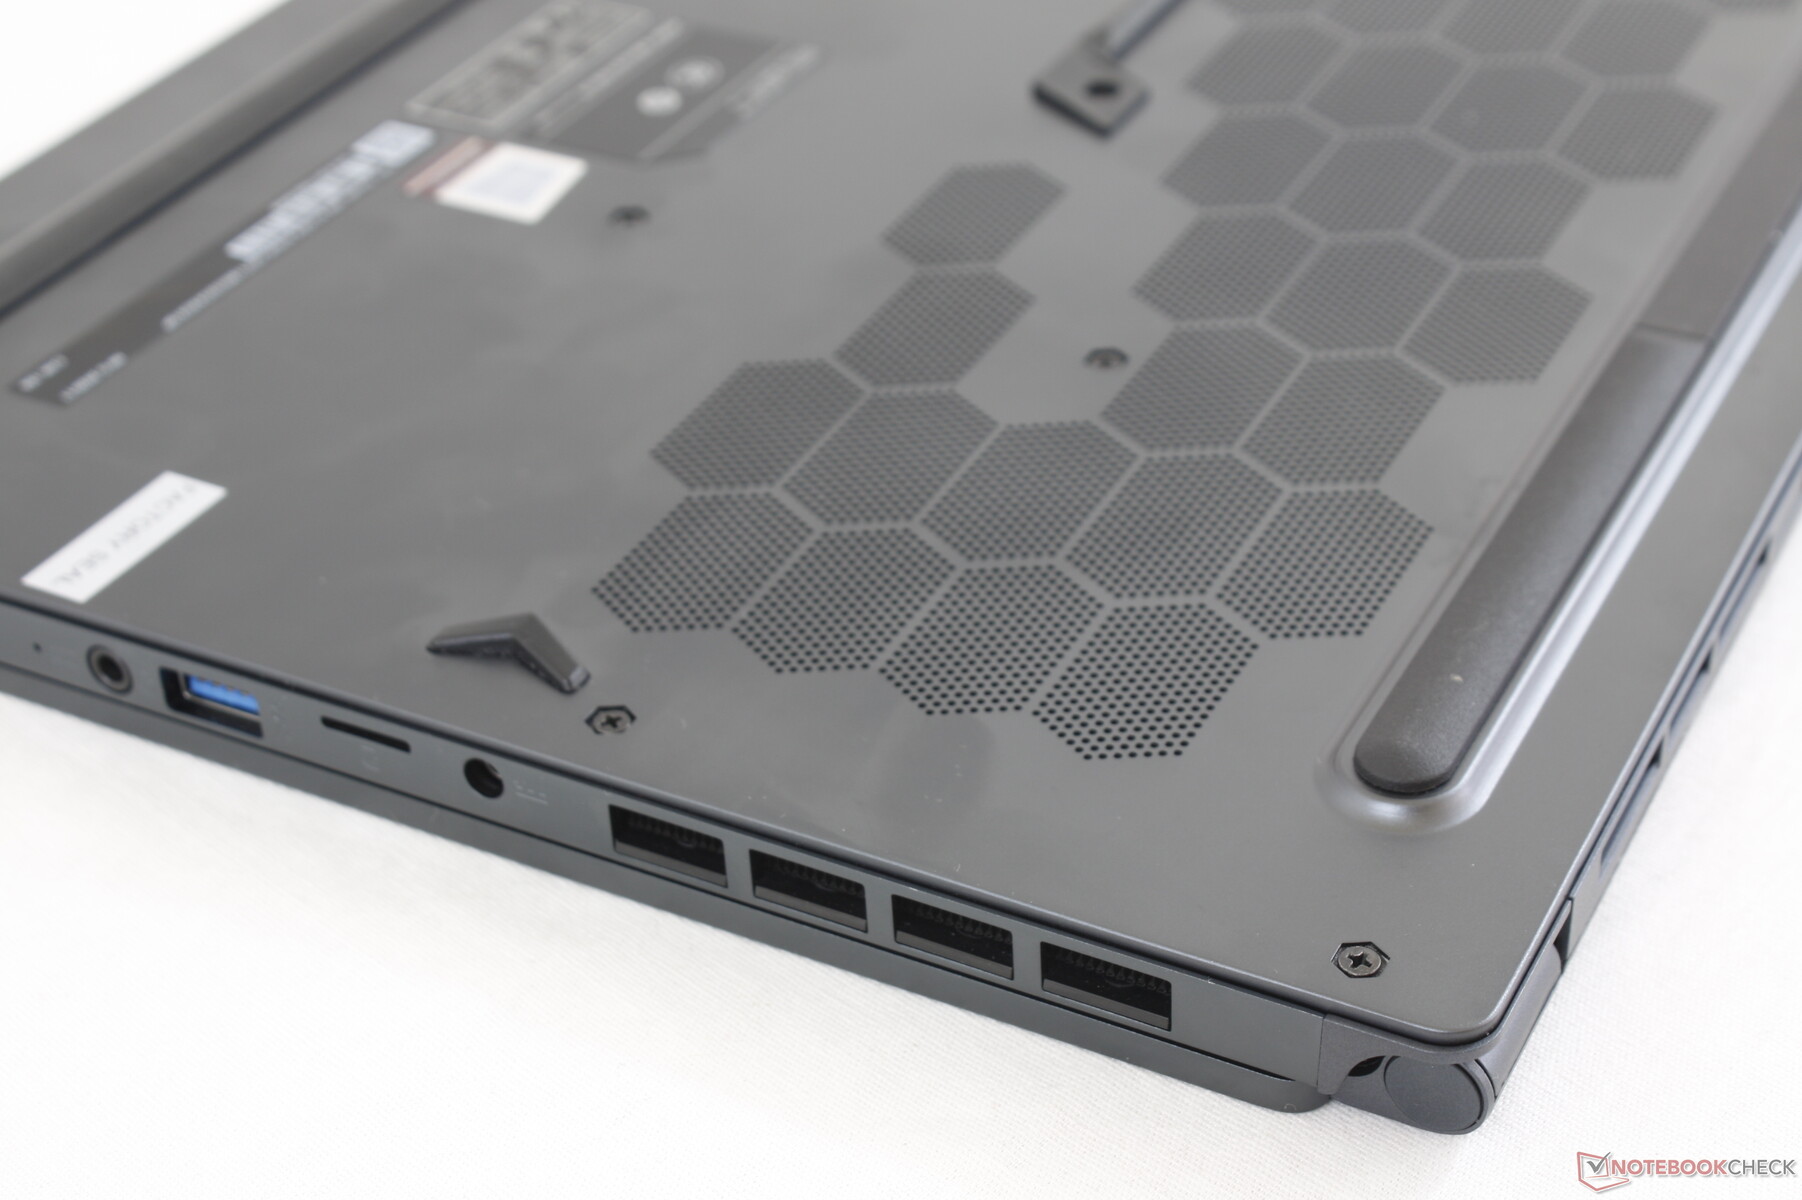
Conectividade
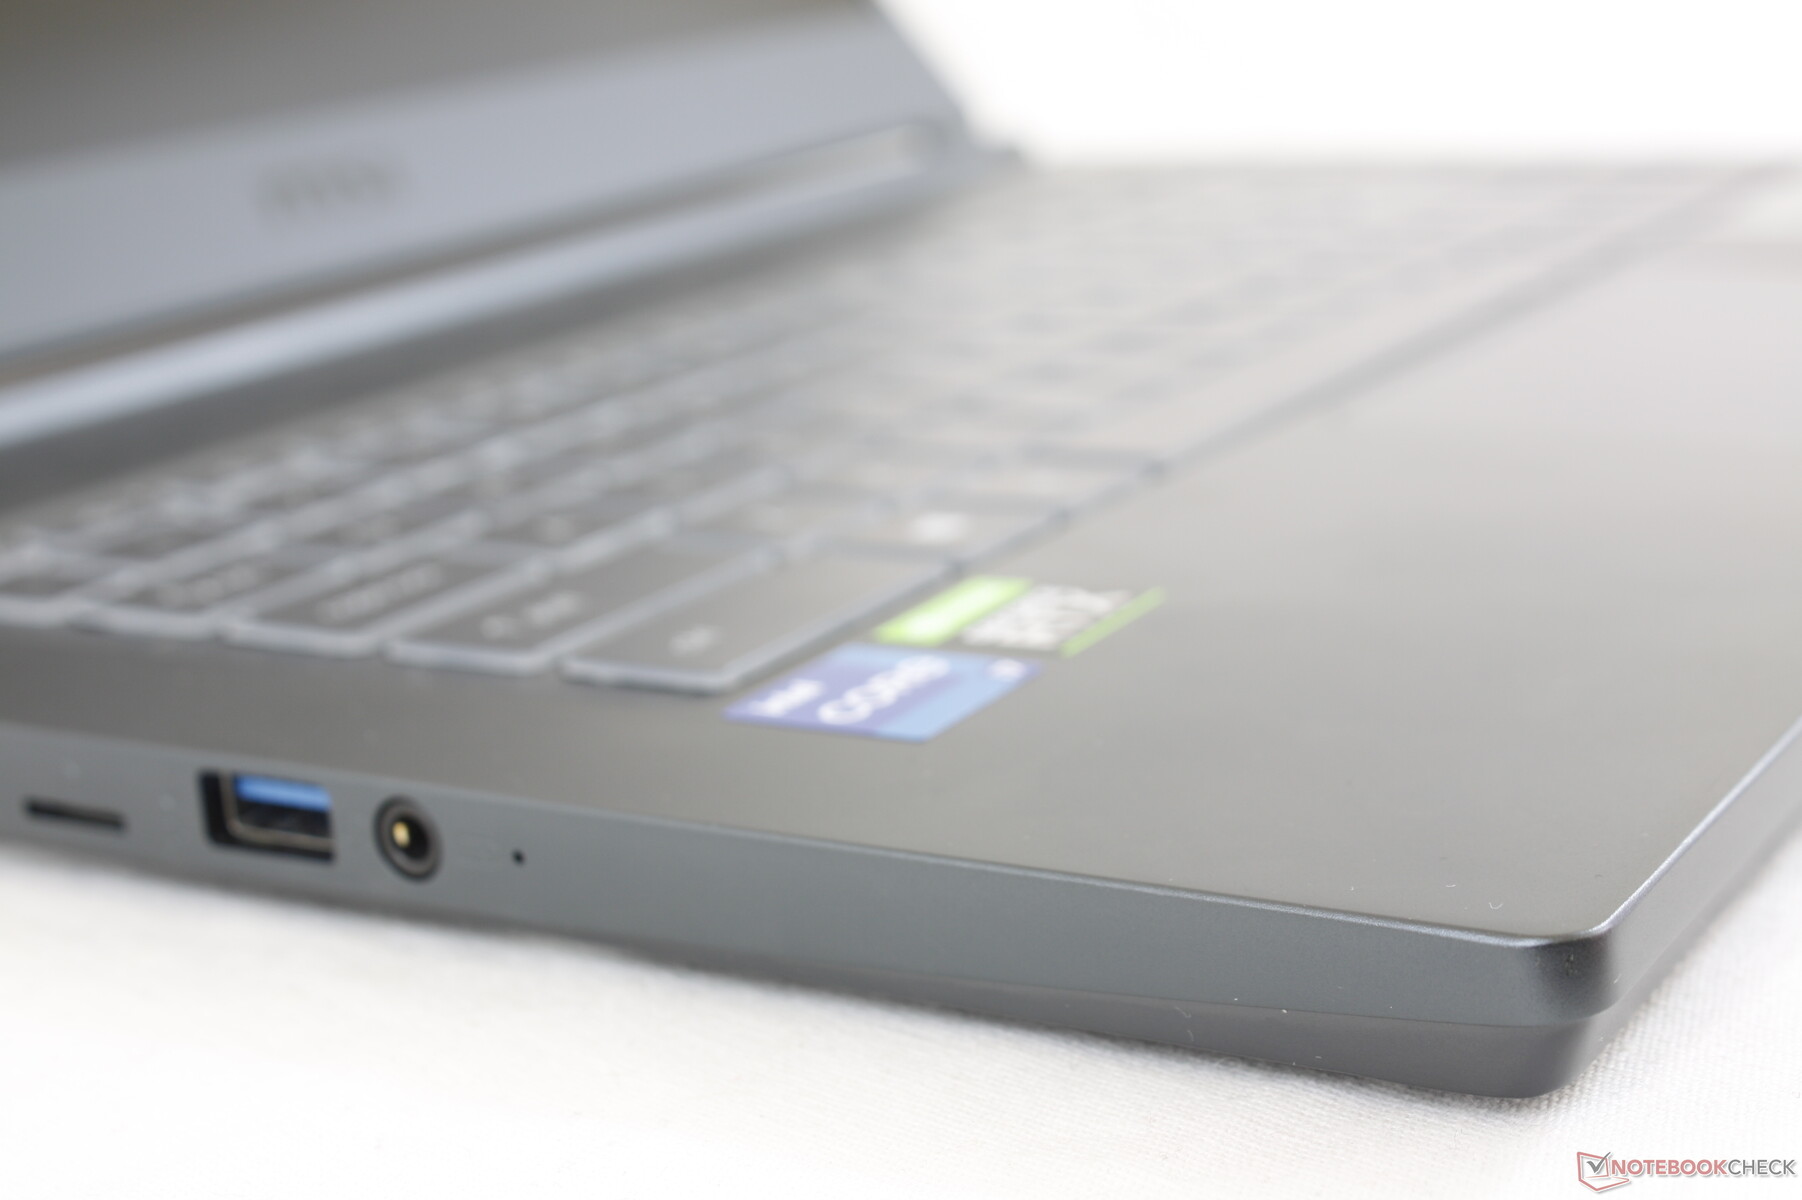
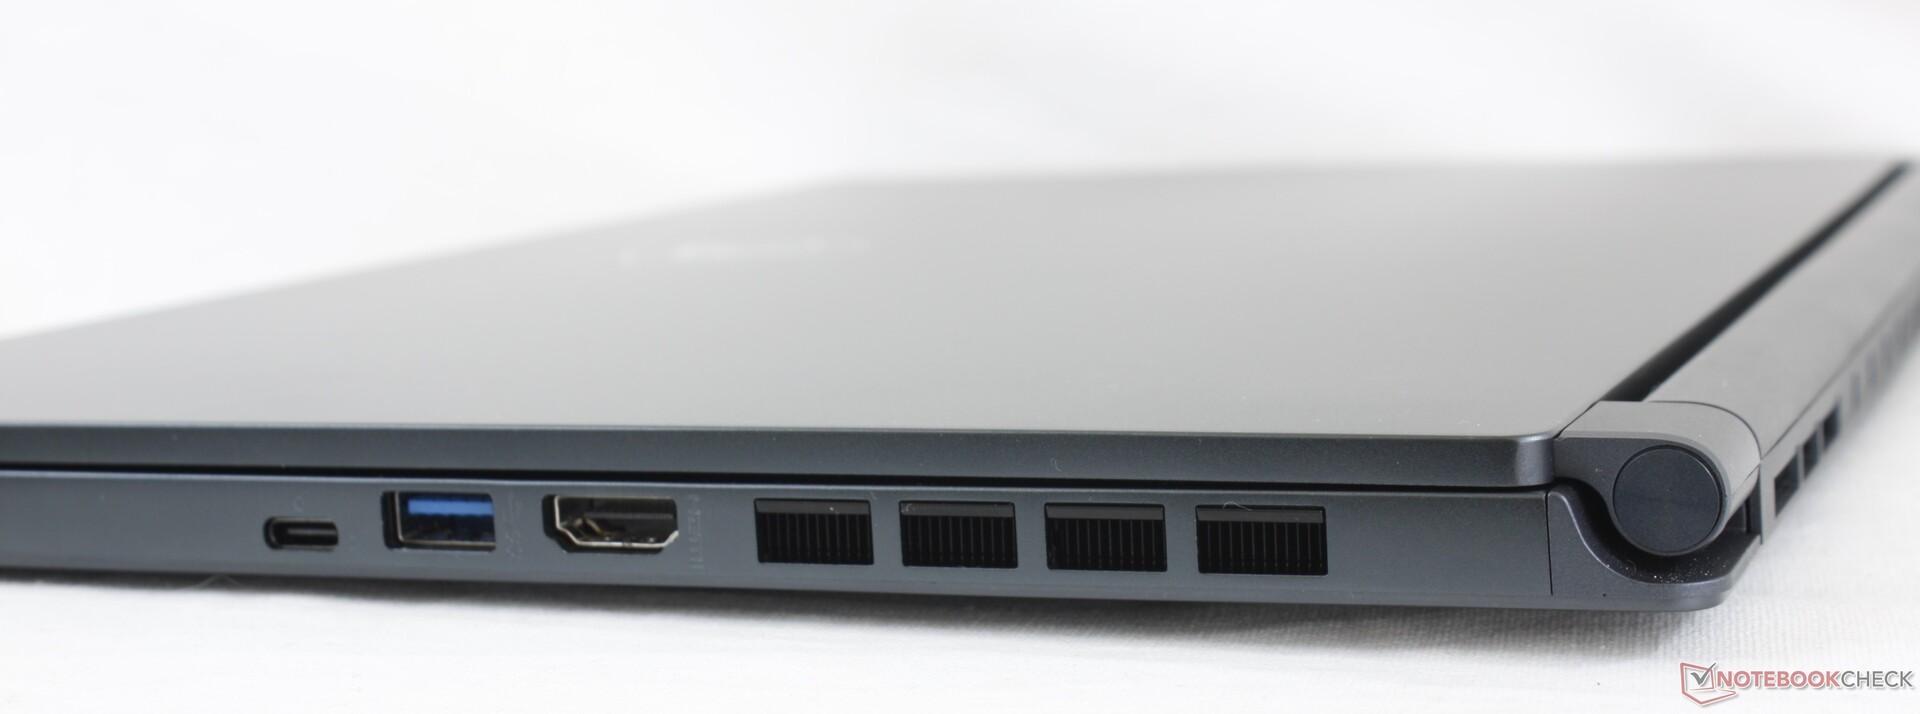
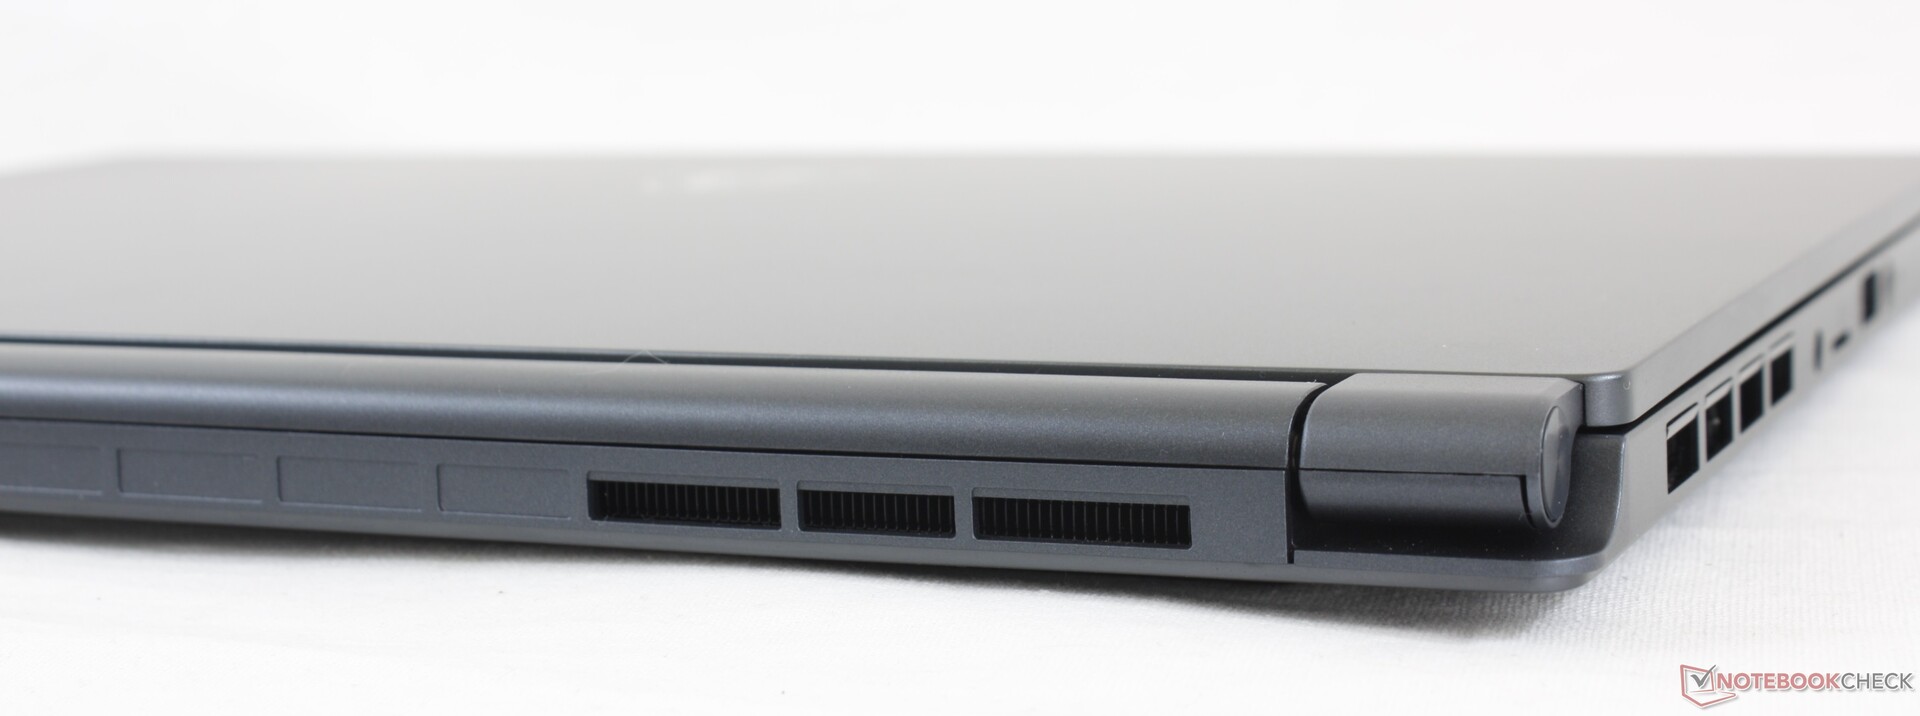
As opções de porta são similares às do Prestige 15, mas com uma porta de carregador de barril proprietária no lugar de uma das portas USB-C. A MSI provavelmente não poderia confiar completamente no carregamento USB-C aqui devido às maiores demandas de energia do modelo GeForce RTX 2060 Max-Q quando comparado com o GTX 1650 Max-Q do modelo Prestige. As portas aqui estão firmemente embaladas ao longo das bordas esquerda e direita.
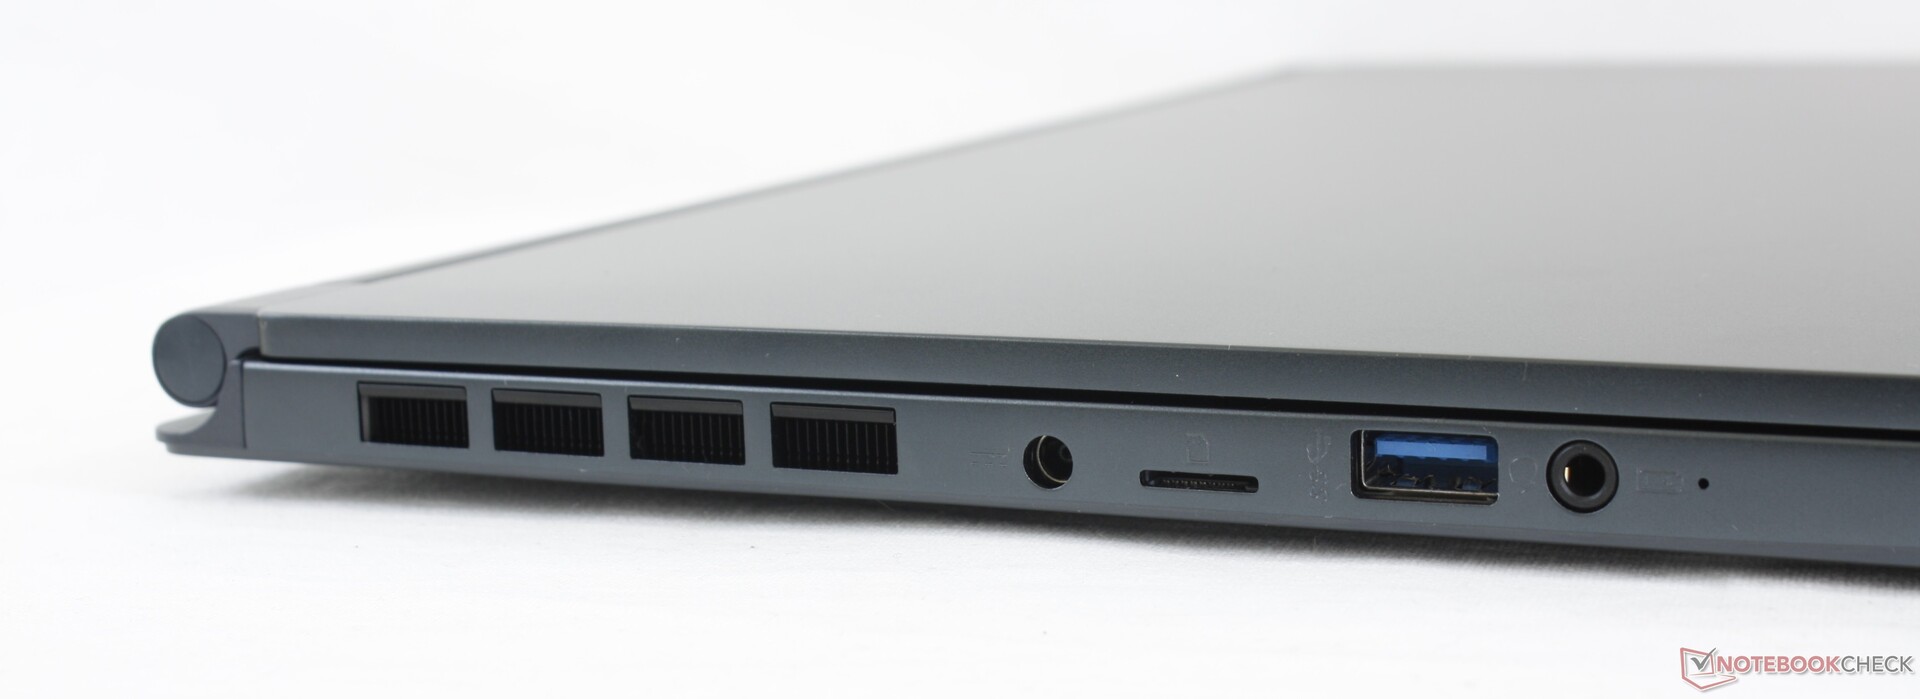
Leitor de cartões SD
O leitor MicroSD carregado com mola oferece taxas de transferência muito rápidas de cerca de 200 MB/s. A transferência de 1 GB de fotos de nossa placa de teste UHS-II para a área de trabalho leva cerca de 6 segundos.
| SD Card Reader | |
| average JPG Copy Test (av. of 3 runs) | |
| Dell XPS 15 9500 Core i7 4K UHD (Toshiba Exceria Pro SDXC 64 GB UHS-II) | |
| MSI Stealth 15M A11SEK (Toshiba Exceria Pro M501 microSDXC 32GB) | |
| HP Spectre X360 15-5ZV31AV (Toshiba Exceria Pro M501 UHS-II) | |
| MSI Prestige 15 A10SC (Toshiba Exceria Pro M501 UHS-II) | |
| Lenovo ThinkPad T15p-20TN0006GE (Toshiba Exceria Pro SDXC 64 GB UHS-II) | |
| Asus ZenBook UX535-M01440 (Toshiba Exceria Pro M501 microSDXC 64GB) | |
| maximum AS SSD Seq Read Test (1GB) | |
| MSI Stealth 15M A11SEK (Toshiba Exceria Pro M501 microSDXC 32GB) | |
| Dell XPS 15 9500 Core i7 4K UHD (Toshiba Exceria Pro SDXC 64 GB UHS-II) | |
| MSI Prestige 15 A10SC (Toshiba Exceria Pro M501 UHS-II) | |
| HP Spectre X360 15-5ZV31AV (Toshiba Exceria Pro M501 UHS-II) | |
| Lenovo ThinkPad T15p-20TN0006GE (Toshiba Exceria Pro SDXC 64 GB UHS-II) | |
| Asus ZenBook UX535-M01440 (Toshiba Exceria Pro M501 microSDXC 64GB) | |
Comunicação
Um Intel AX201 vem como padrão para conectividade Wi-Fi 6 e Bluetooth 5.1. Não tivemos nenhum problema quando acoplado ao nosso roteador de teste Netgear RAX200, embora as taxas de transmissão sejam muito mais lentas do que o esperado.
Webcam


Manutenção
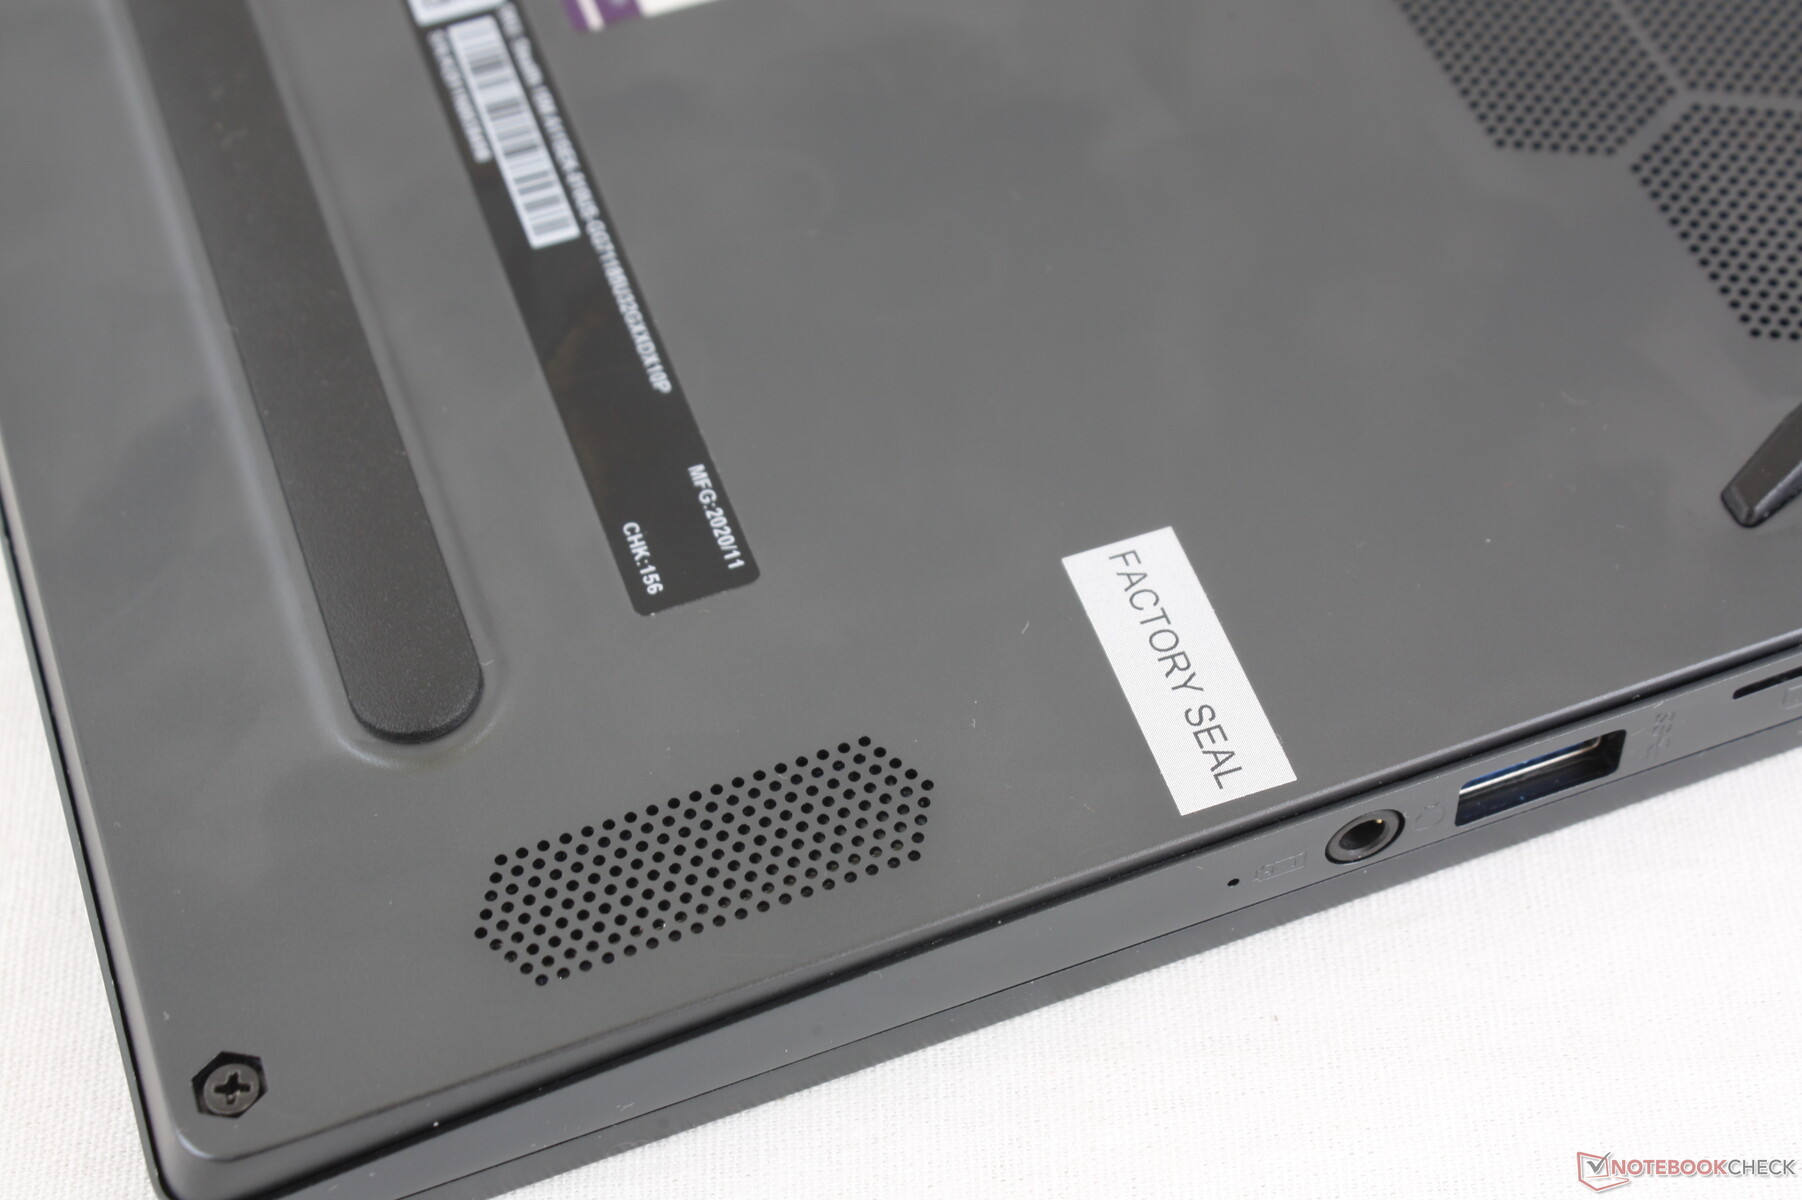
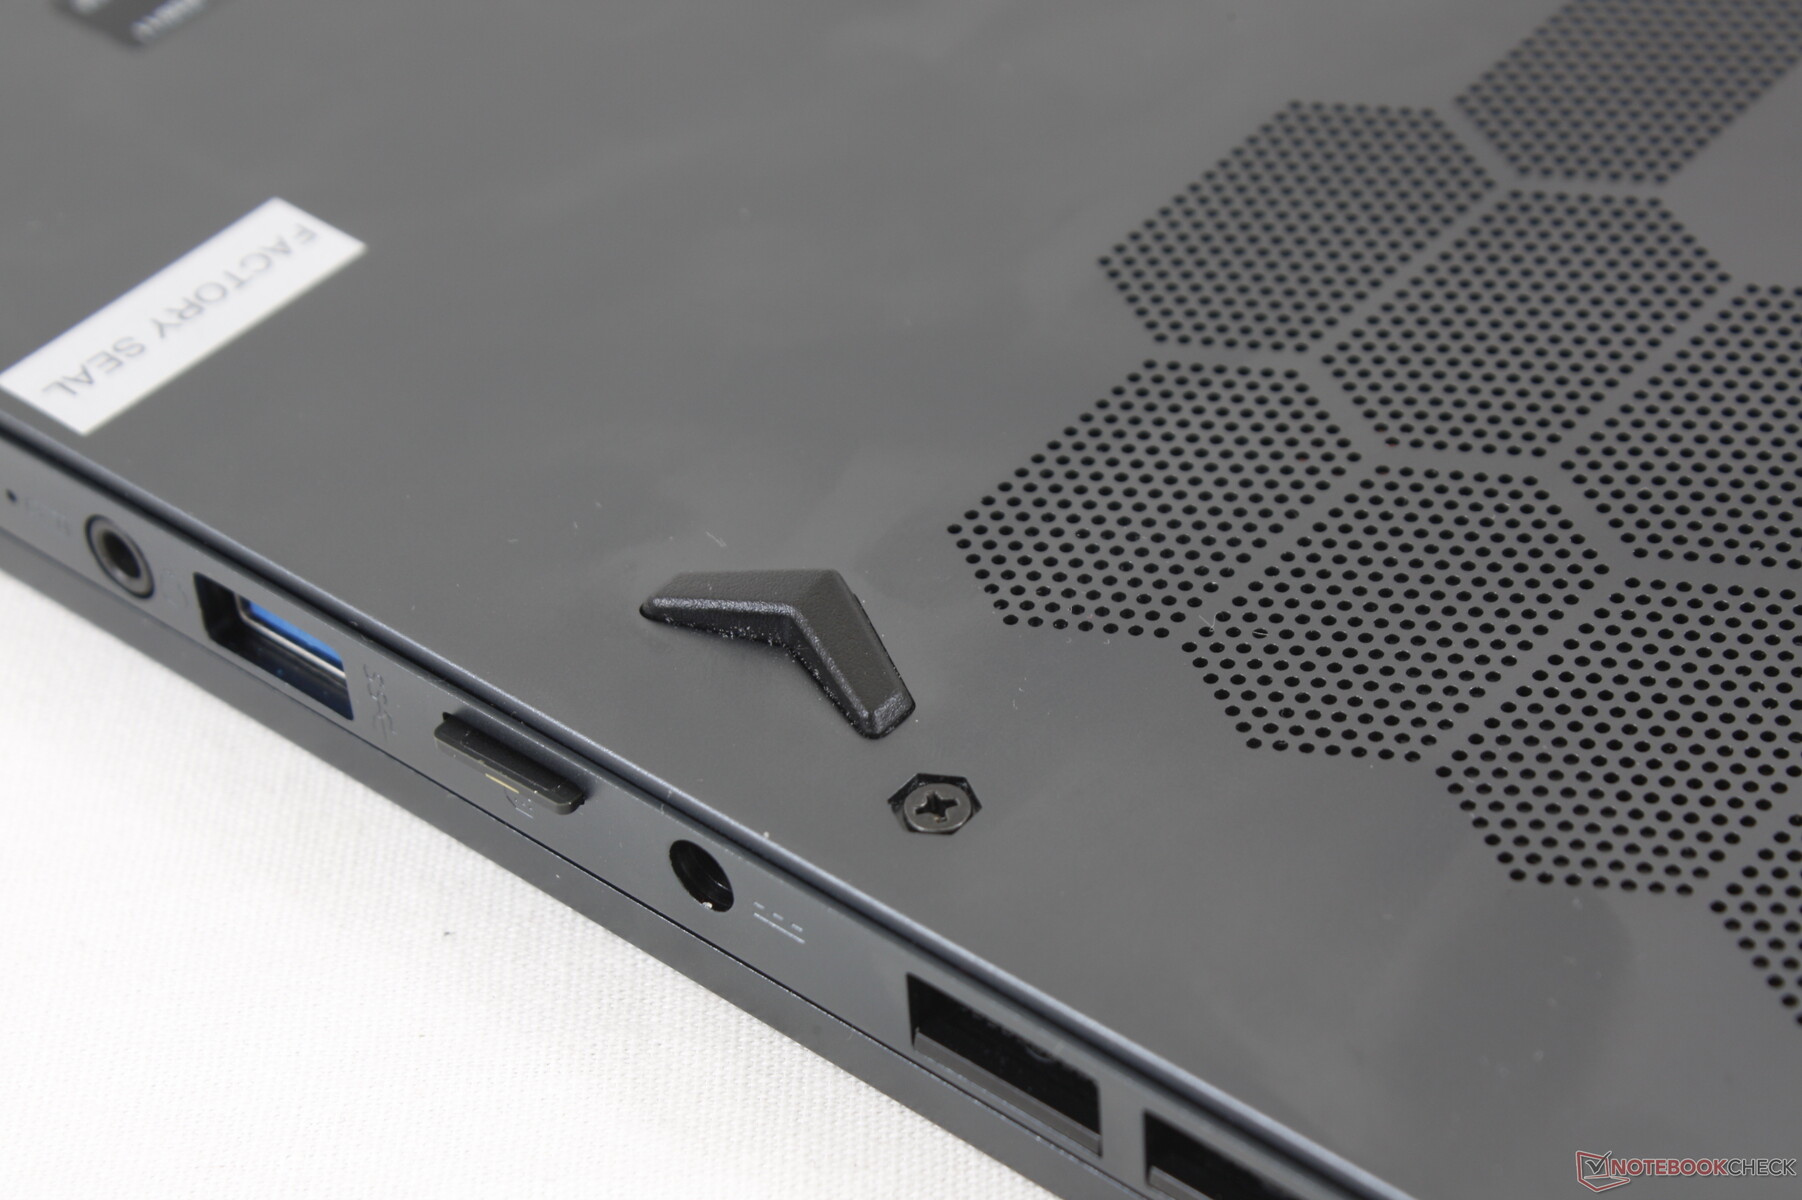
Apesar de nossos gritos, a MSI continua a desencorajar as atualizações do usuário final com um adesivo de "vedação de fábrica" sobre um dos parafusos da placa inferior. Reclamar garantia ou devoluções no varejo pode ser difícil porque os vendedores podem usar o selo quebrado contra você.
Acessórios e Garantia
A caixa de varejo inclui um adaptador USB-A para RJ-45 junto com a papelaria e um adaptador Ac. Não há um pano de limpeza de veludo diferente da caixa de varejo para o GS66.
Uma garantia de dois anos do fabricante vem como padrão.
Dispositivos de entrada
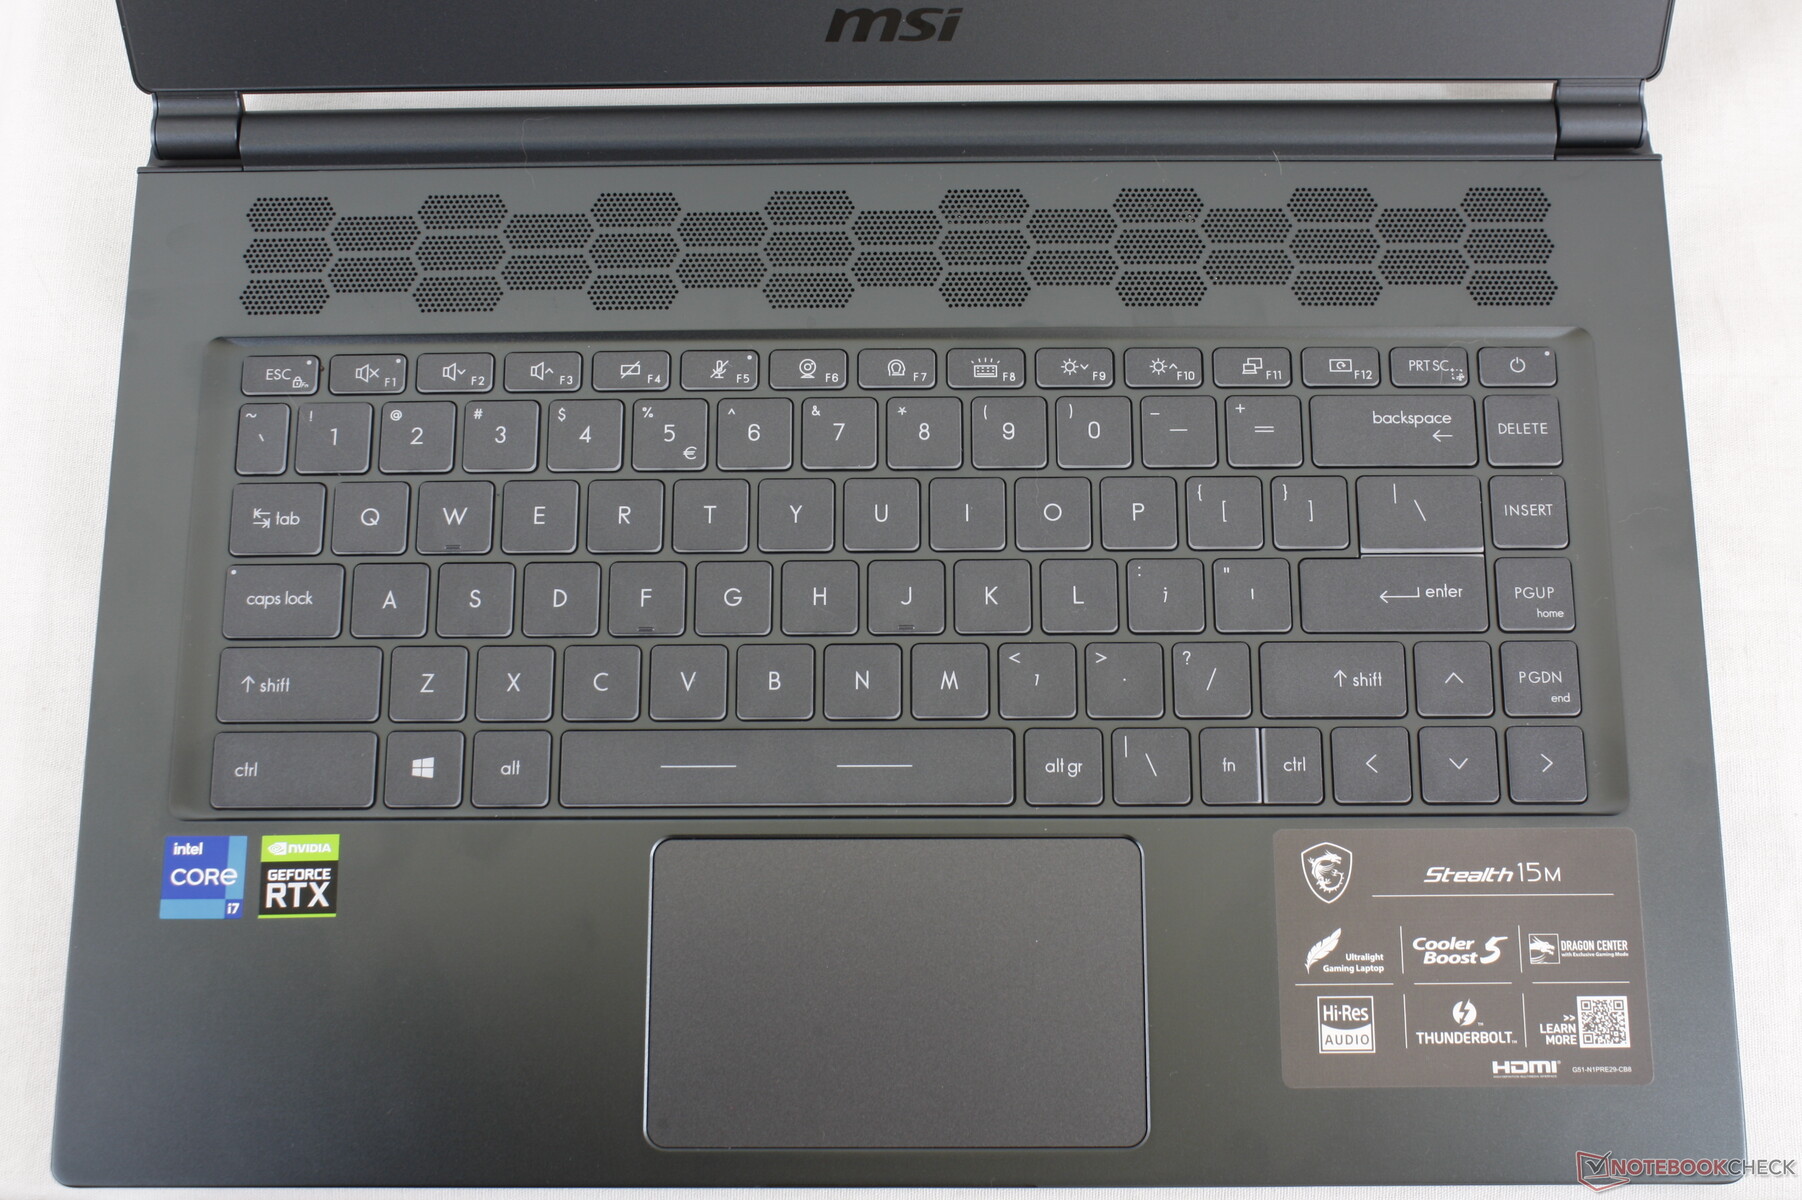
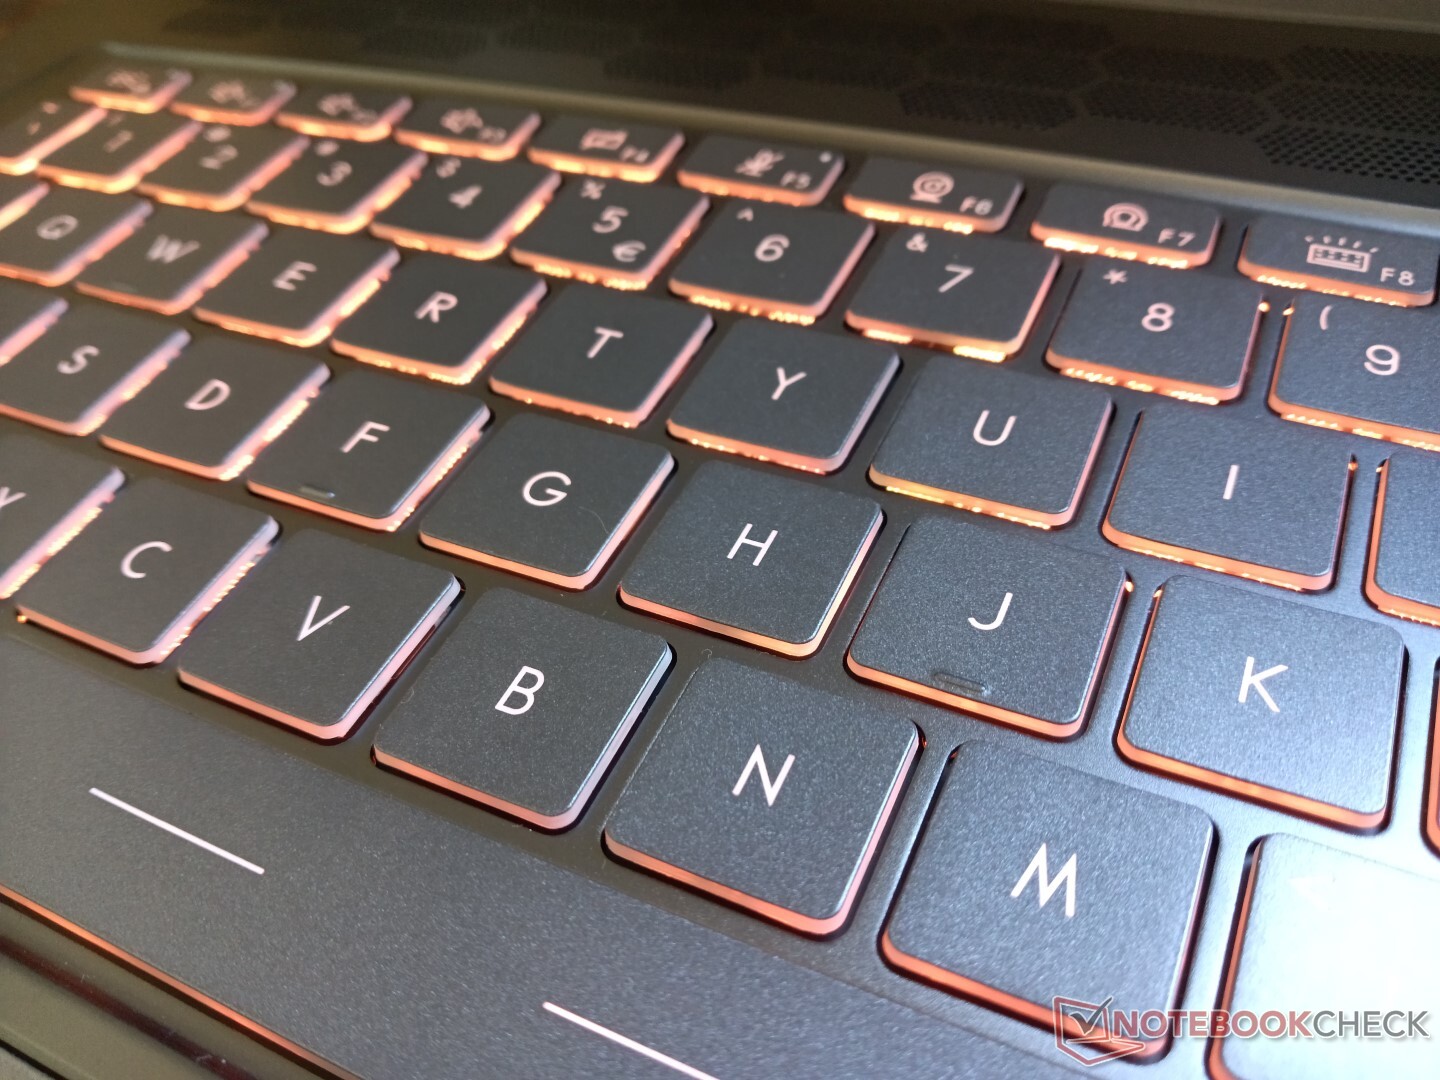
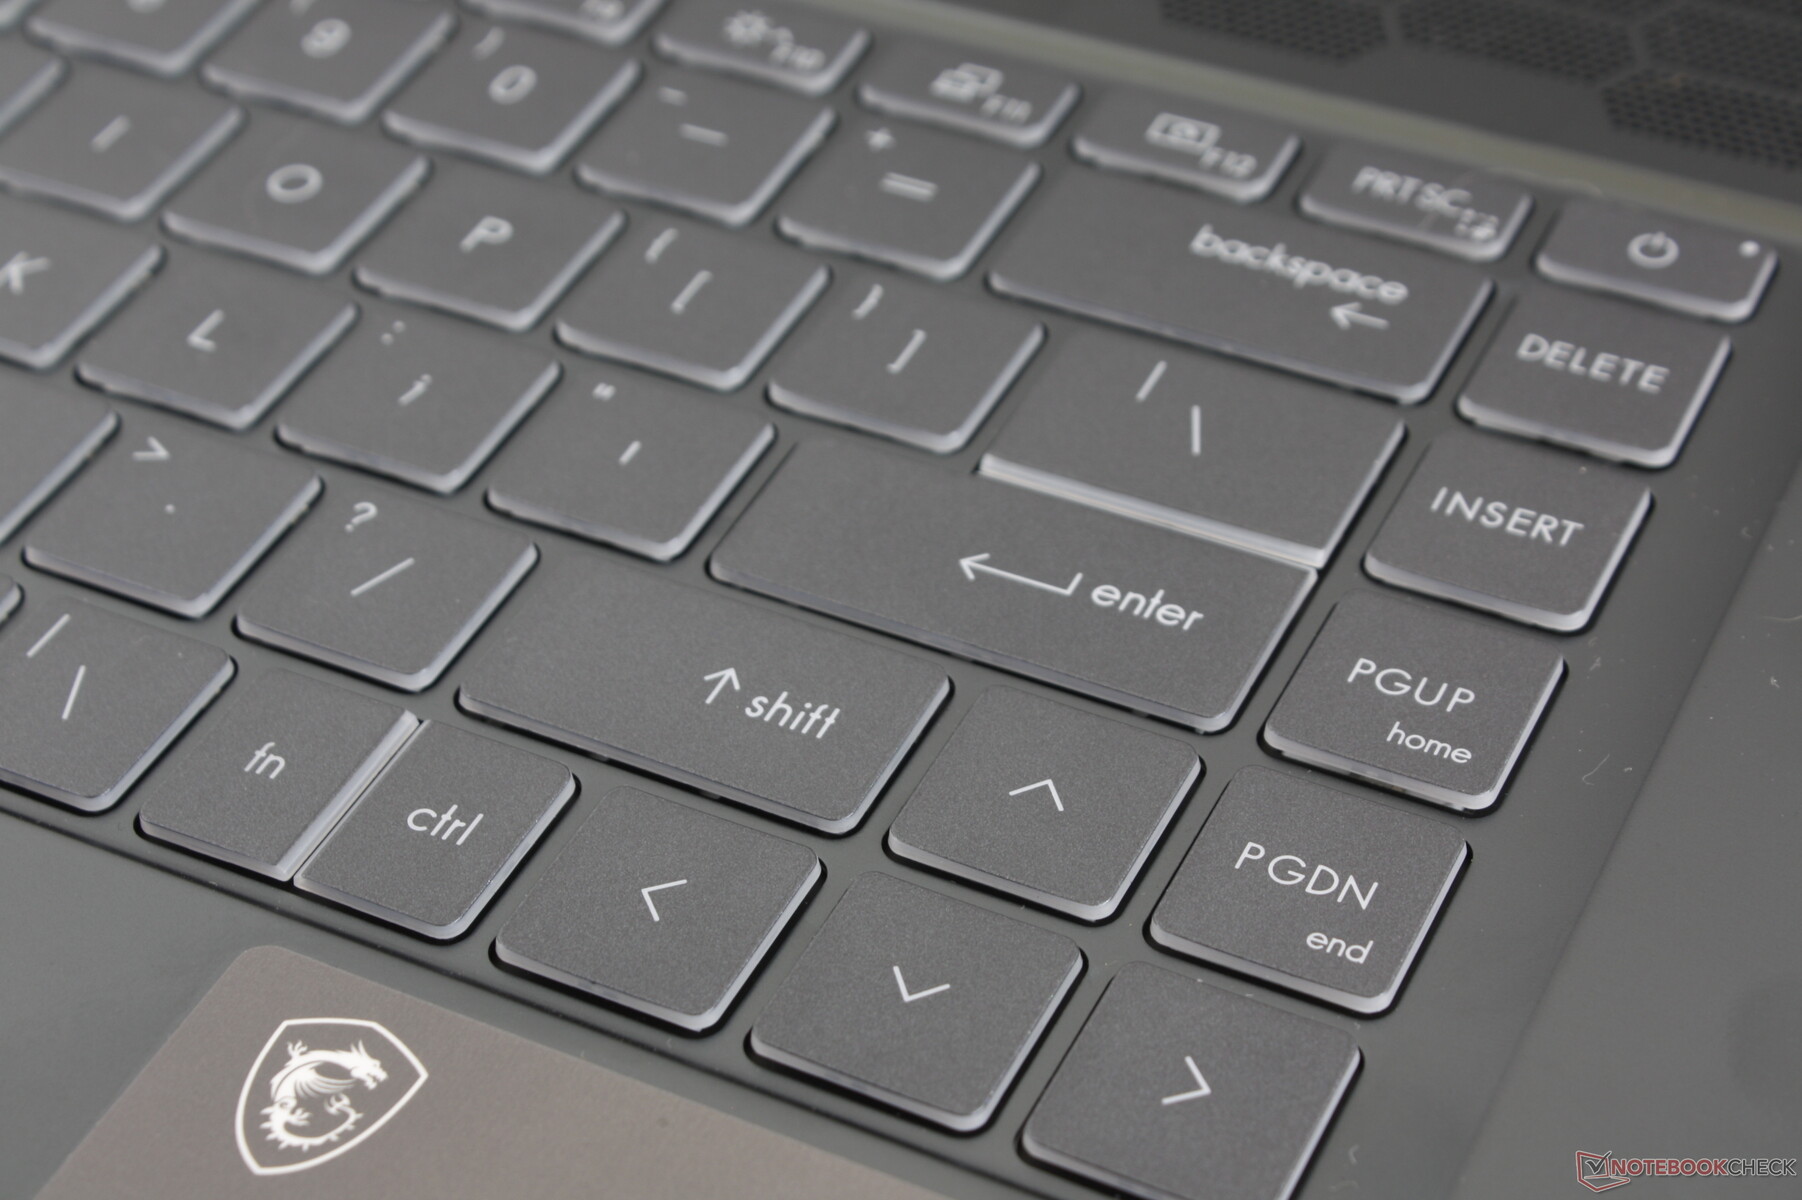
Teclado
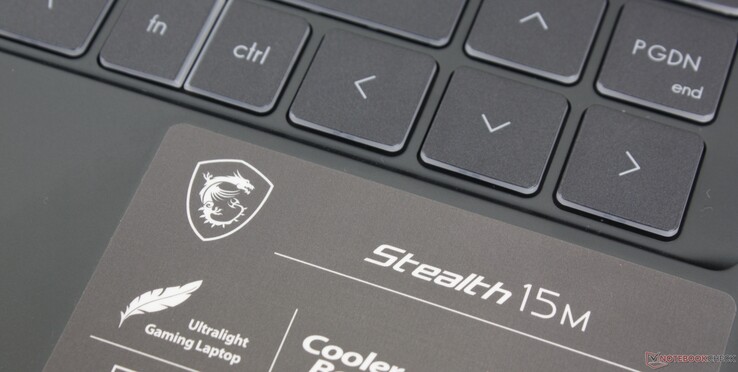
O feedback e o layout do teclado são idênticos ao que você encontrará no Prestige 15, exceto pelas teclas FN/Ctrl divididas perto da parte inferior direita. Assim, nossos comentários existentes sobre o teclado Prestige aplicam-se aqui incluindo as teclas leves e rasas em relação às teclas mais firmes do HP Spectre ou do Lenovo ThinkPad. Os usuários acostumados a digitar em um Asus ZenBook ou VivoBook encontrarão uma experiência familiar de digitação no Stealth 15M
Ao contrário do MSI Prestige, Modern, ou Creator, a luz de fundo do teclado aqui é compatível com as cores RGB via MSI Mystic Light. As opções são limitadas a uma única zona apenas em contraste com as configurações RGB por chave na série GS66.
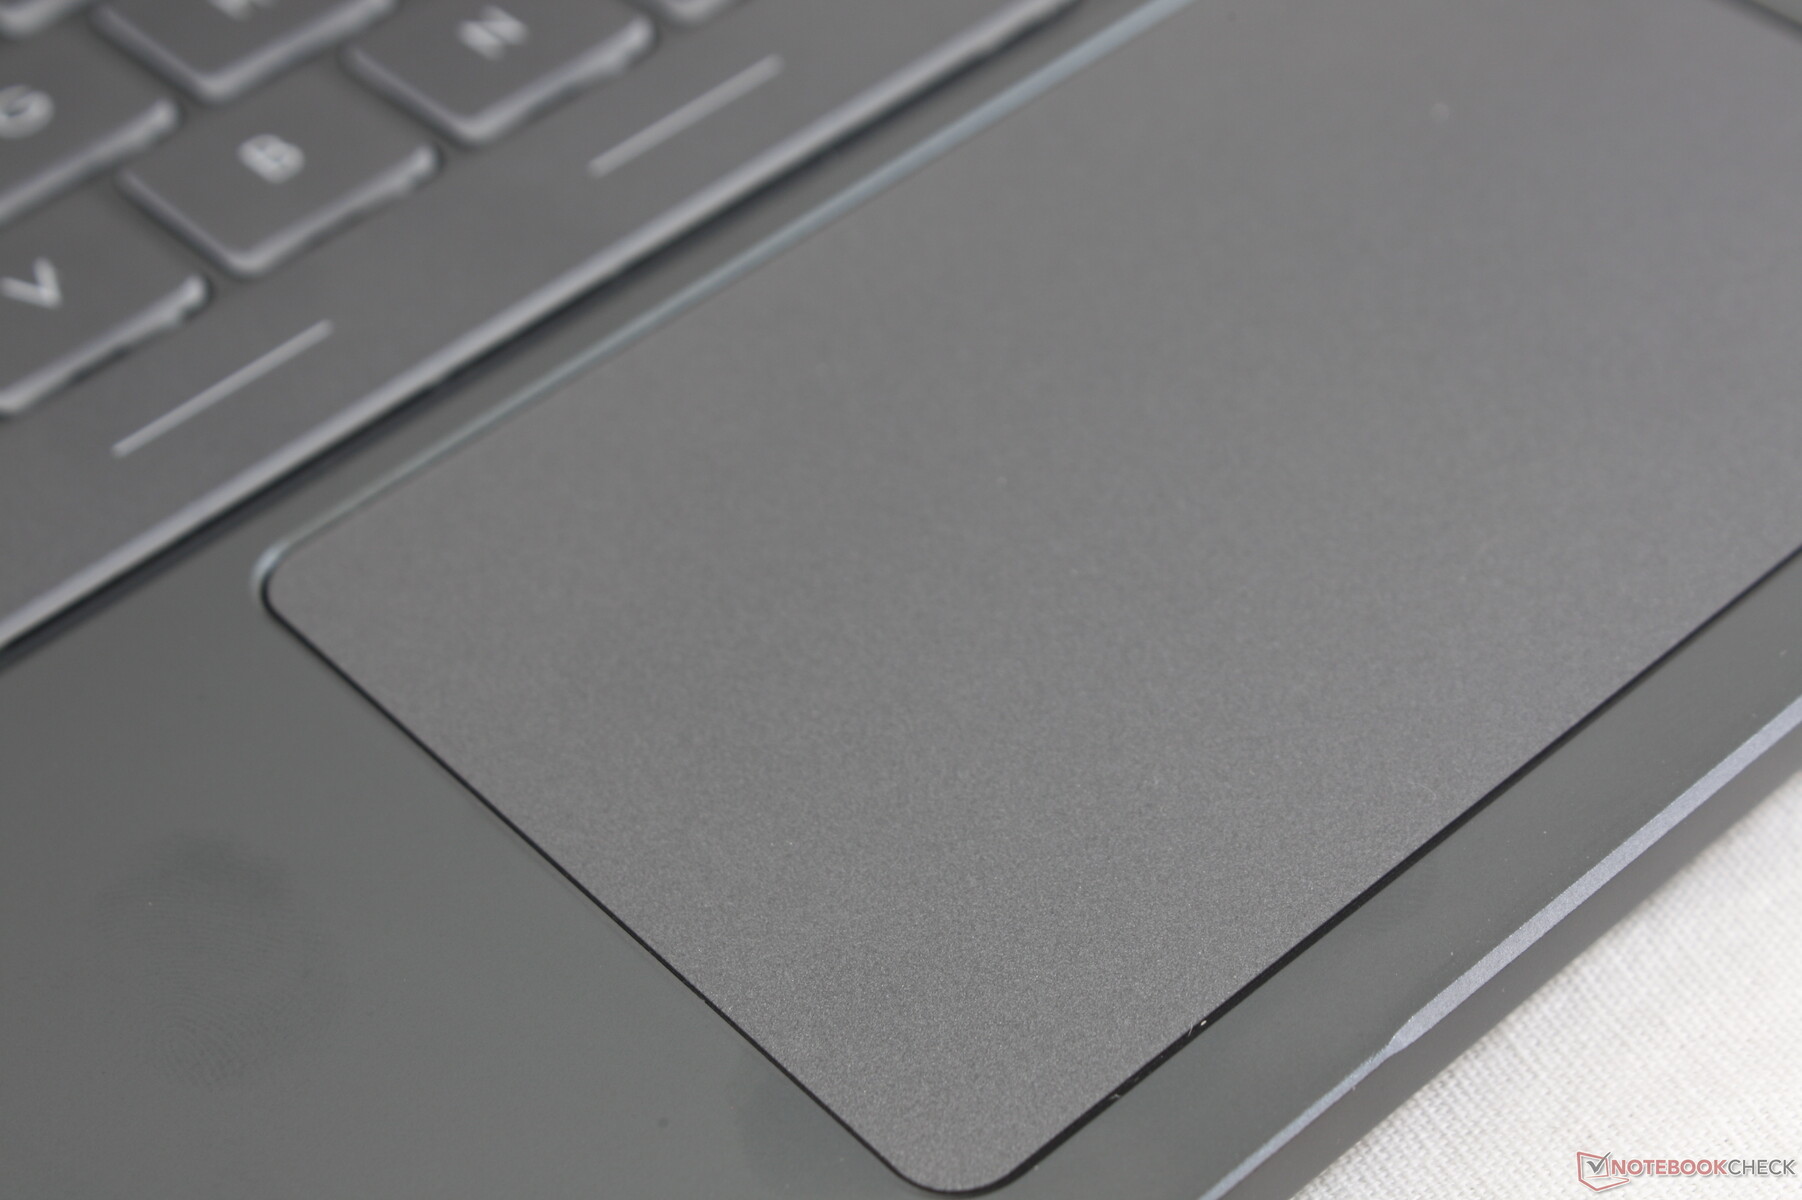
Touchpad
O clickpad (10,5 x 6,5 cm) é menor do que o do XPS 15 (15,1 x 9 cm) ou HP Spectre x360 15 (12 x 6 cm). O controle do cursor é suave, quase sem grudar, mesmo que deslize muito lentamente sobre a superfície. Seus botões integrados de clickpad, no entanto, são esponjosos e difíceis de usar por longos períodos. Um mouse externo é altamente recomendadose você precisar fazer muitos cliques.
Mostrar
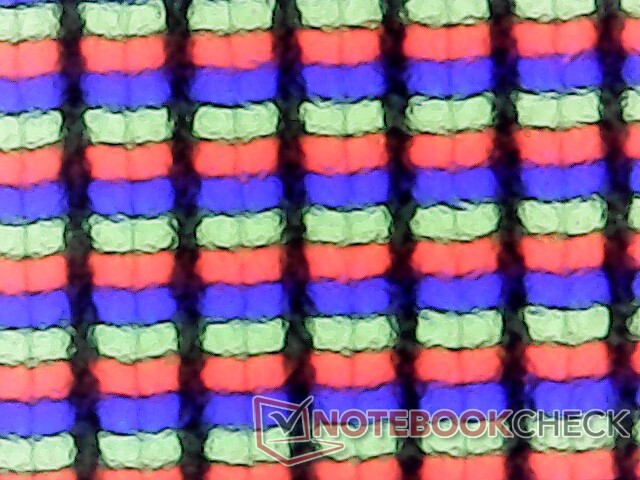
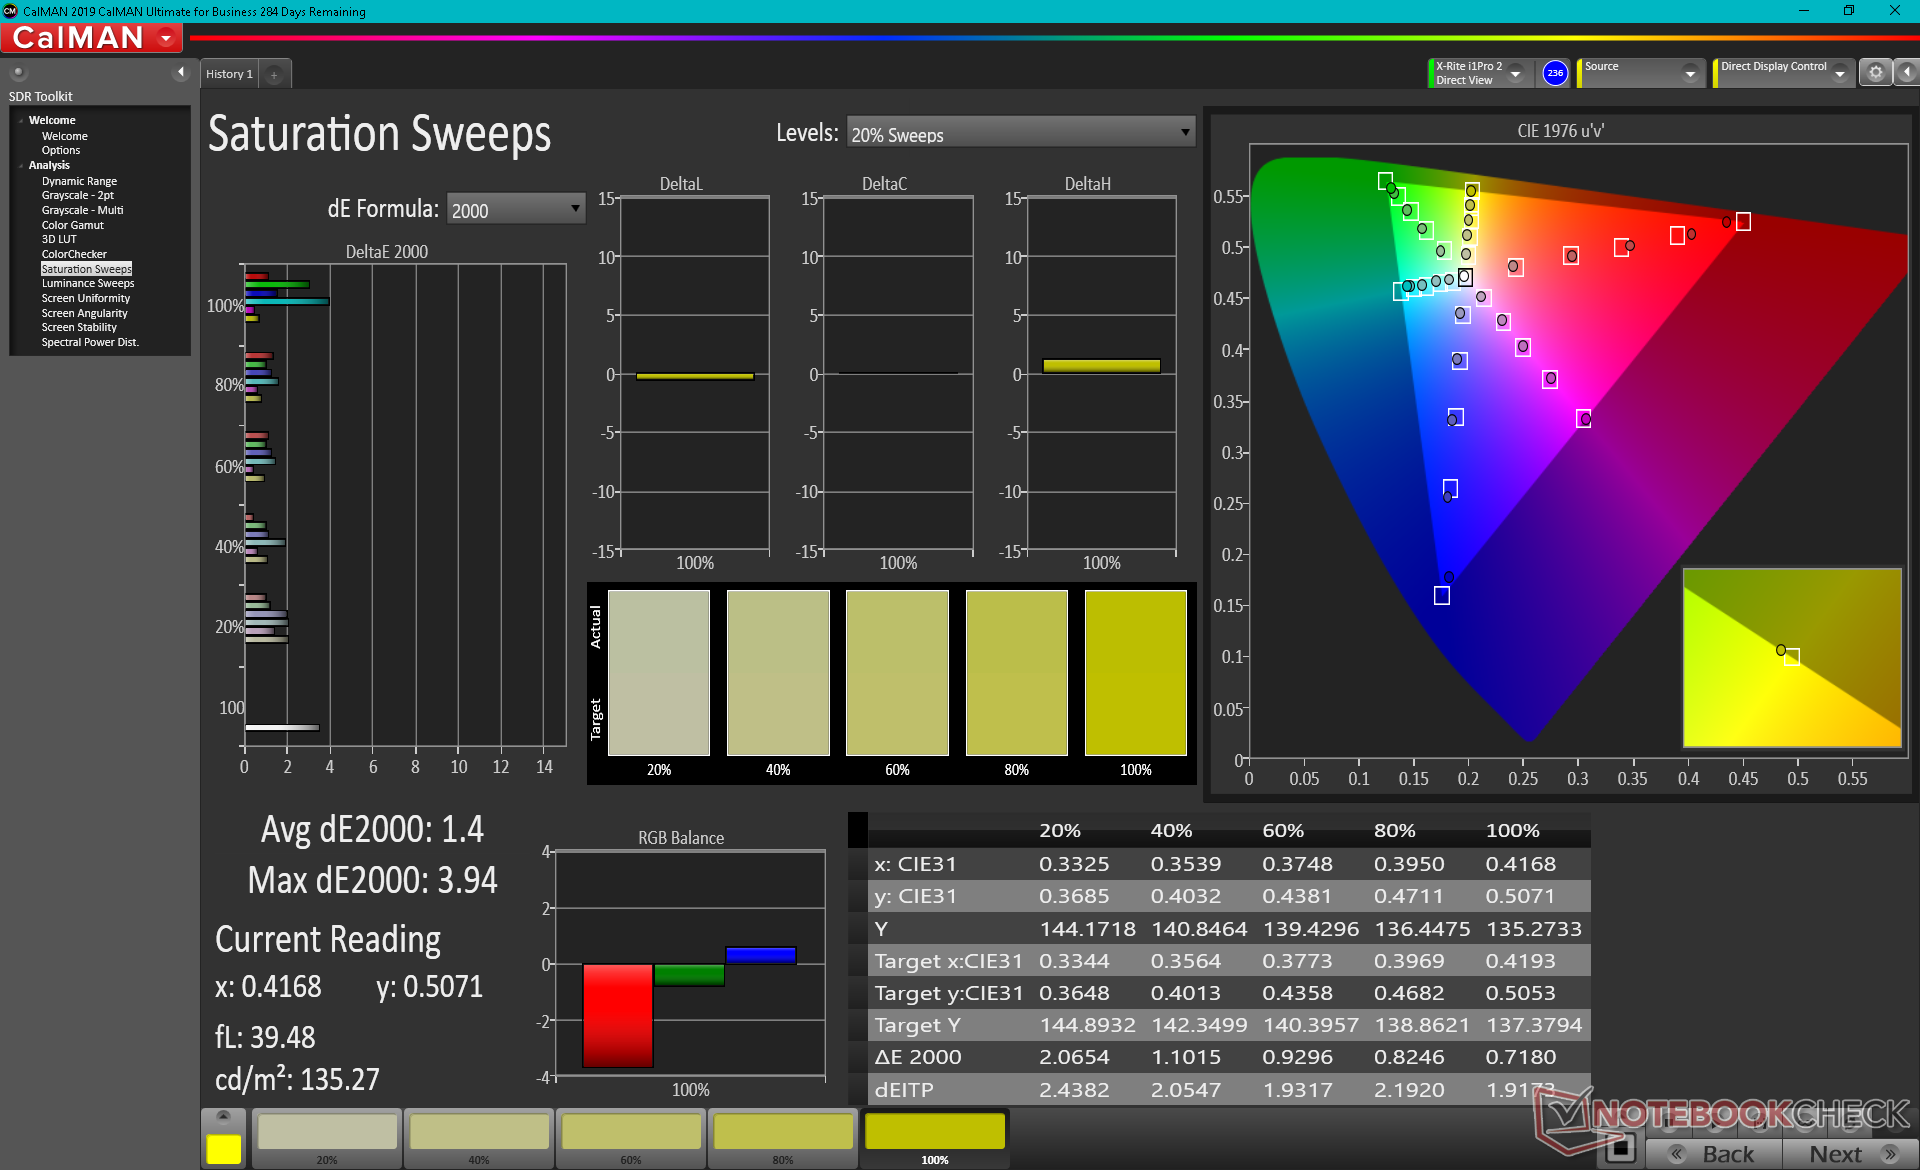
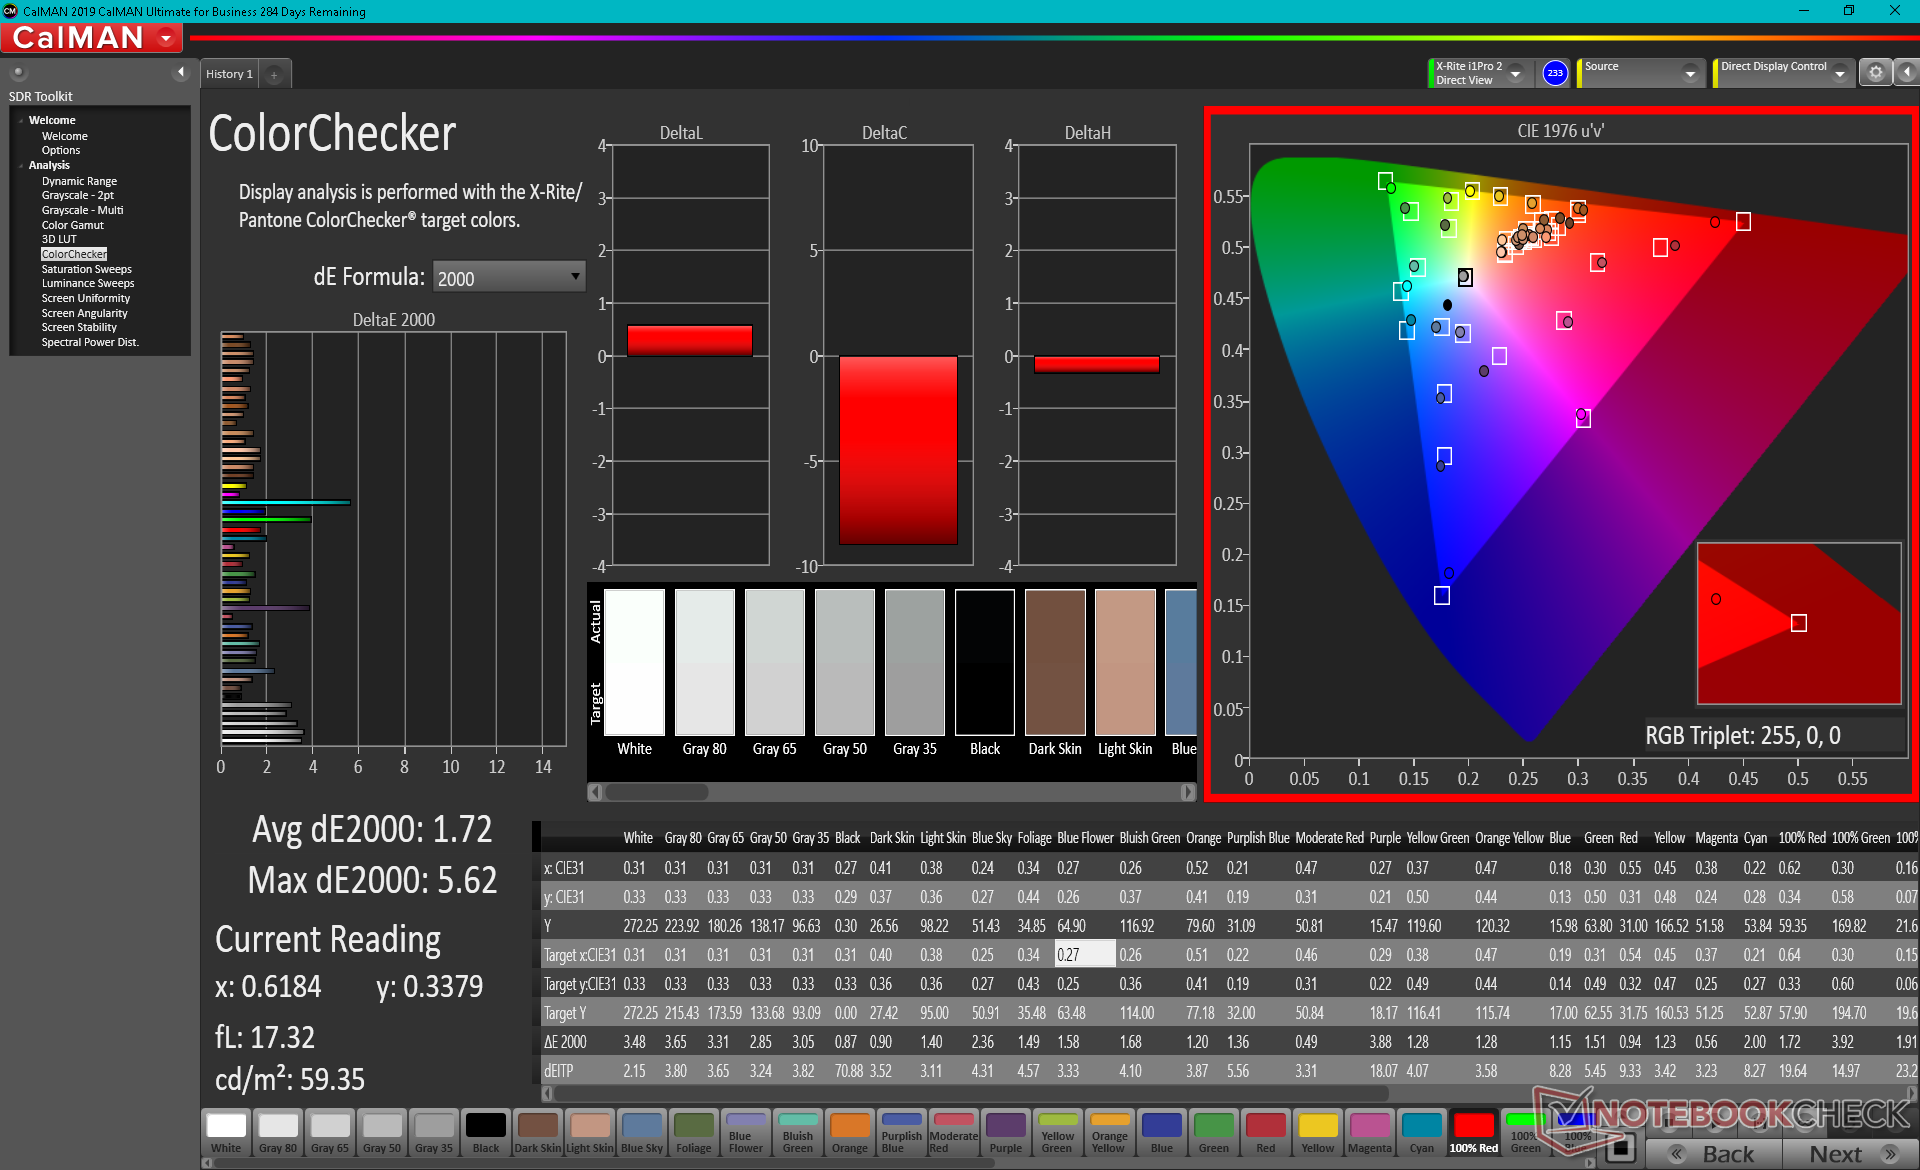
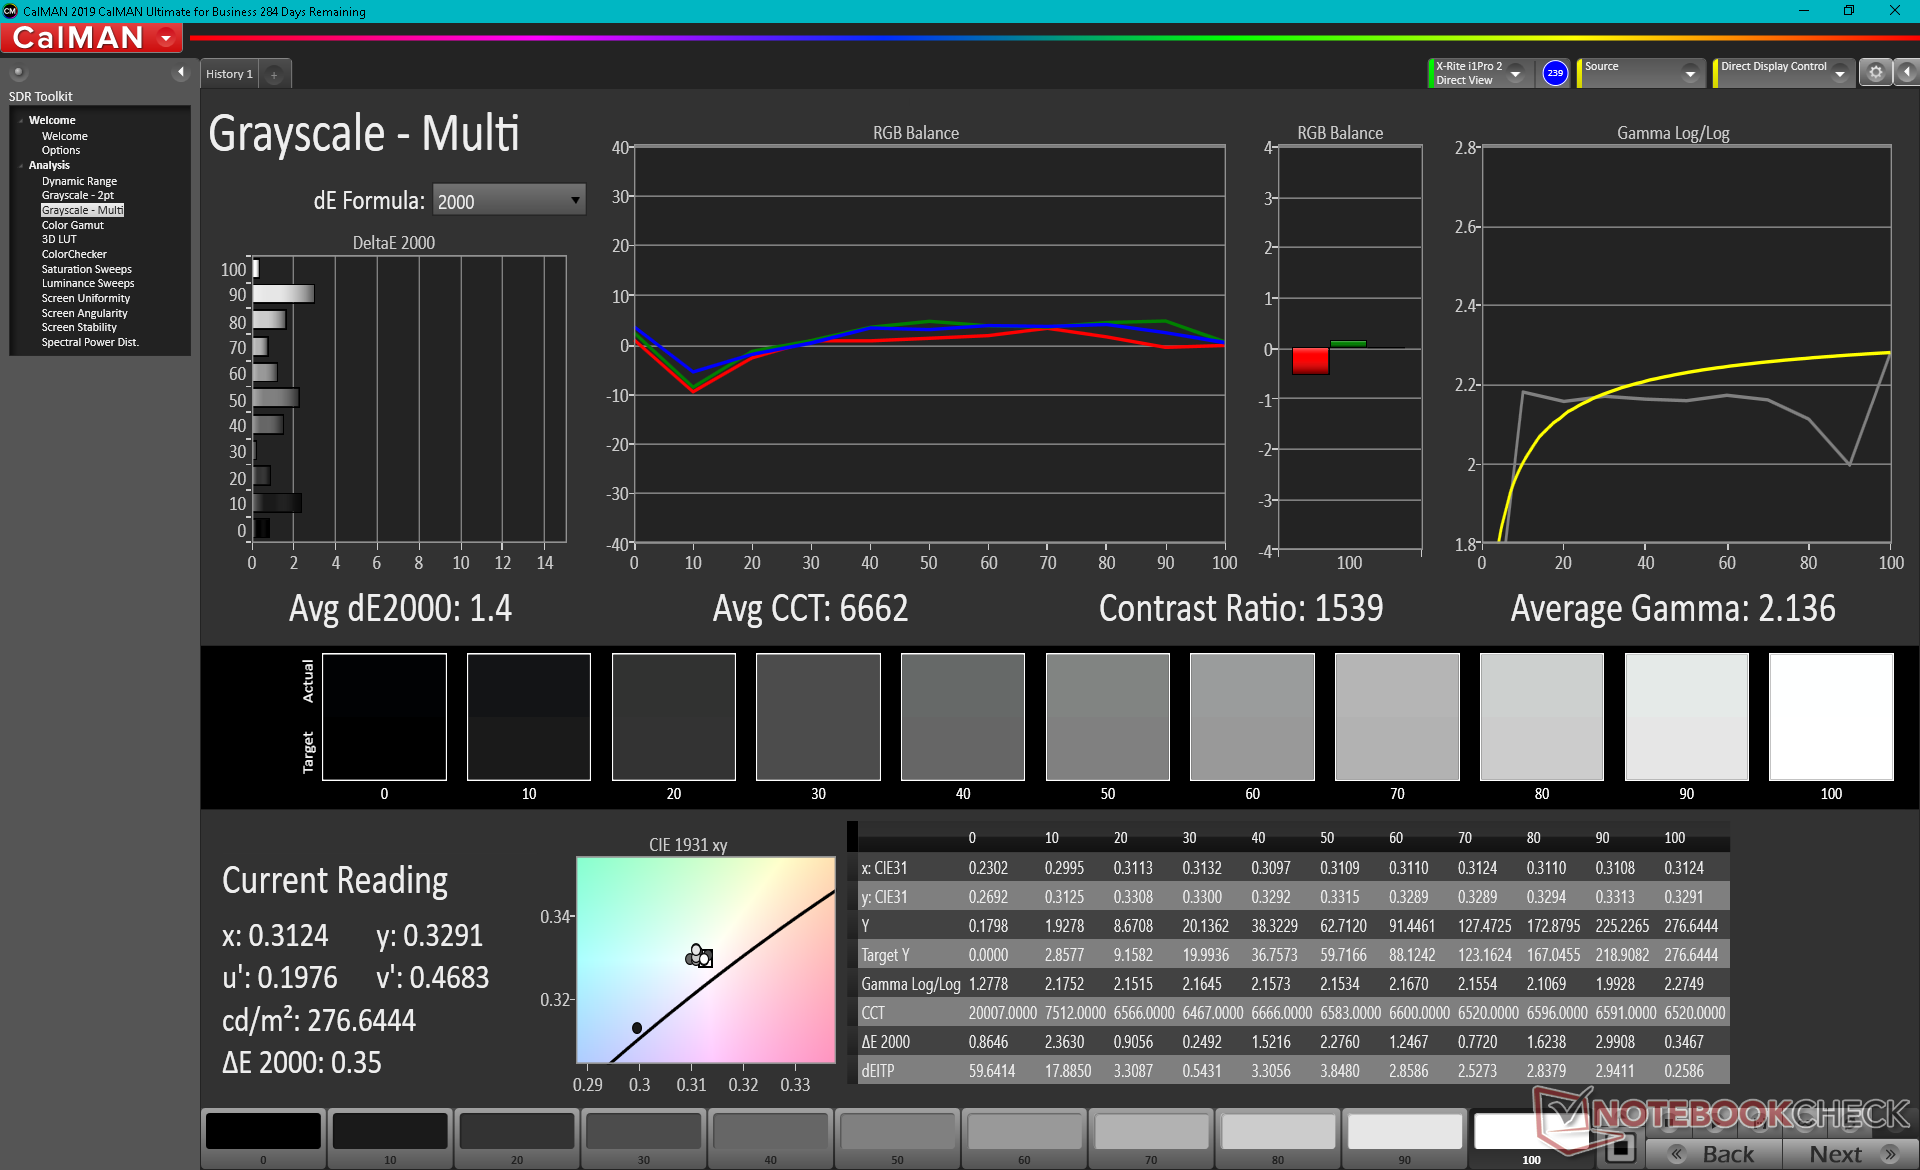
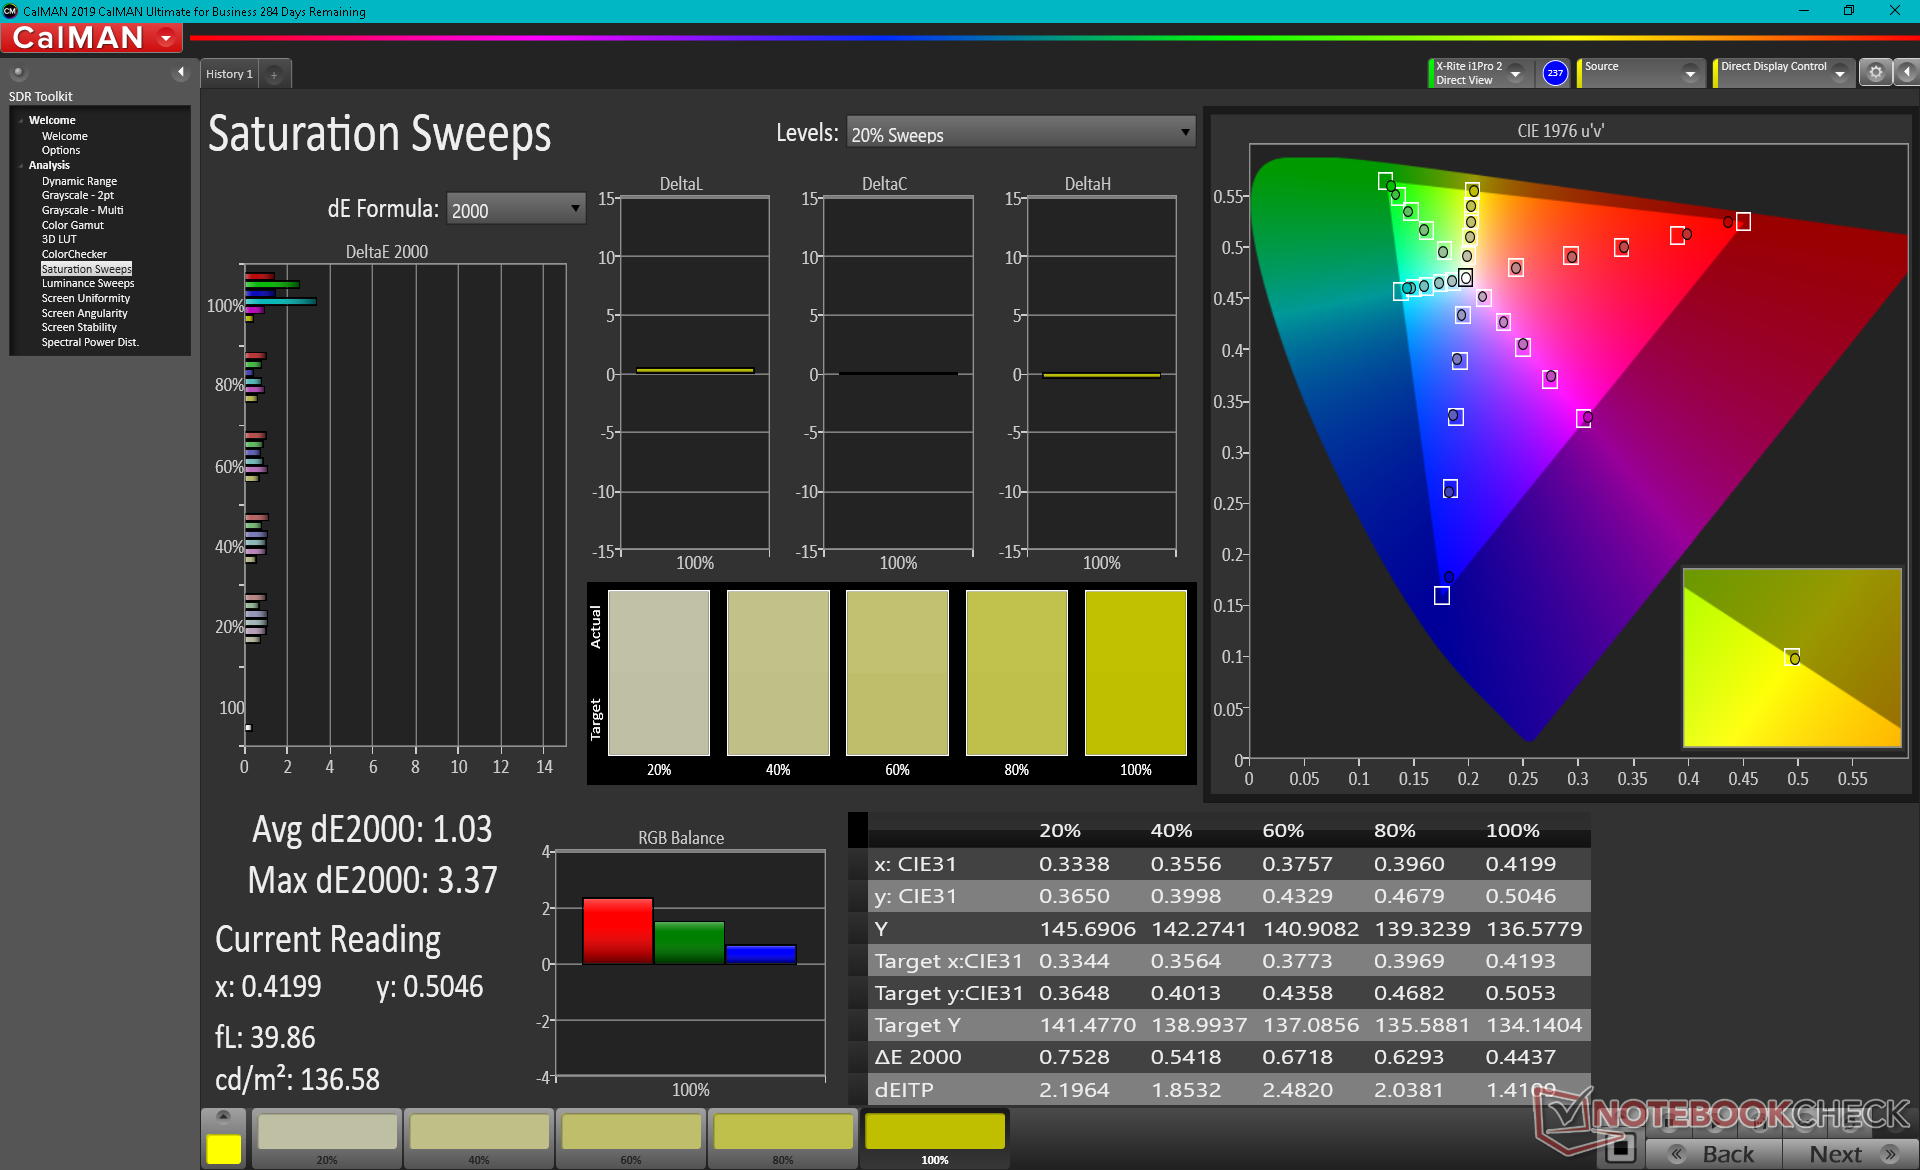
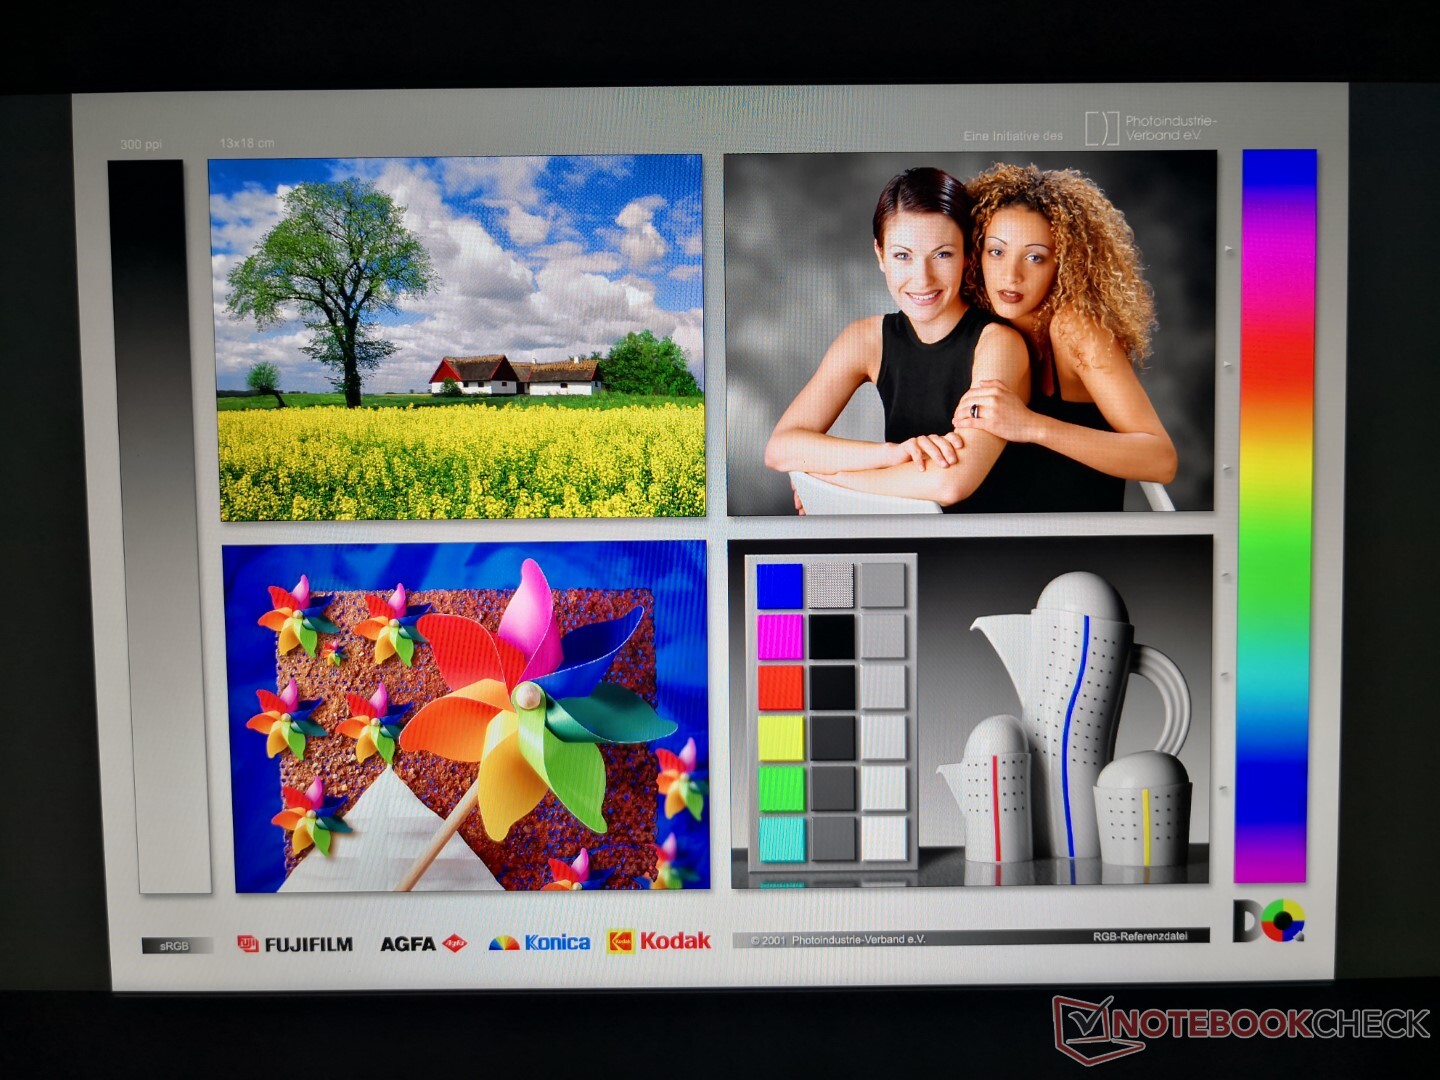
O Stealth 15M vem com o mesmo painel IPS 60 Hz Chi Mei N156HCE-EN1 como encontrado no Lenovo ThinkPad P52, Yoga 720-15IKB, Asus ZenBook Pro UX550, e até mesmo o próprio MSI Modern 15. Características inatas como a relação de contraste decente, espaço de cor, tempos de resposta preto-branco e qualidade visual geral são, portanto, bastante semelhantes entre estes sistemas, especialmente com o Moderno 15.
Uma desvantagem notável do visor é seu brilho máximo medíocre de apenas 279 nits. Apesar de ser utilizável para condições internas, é muito inferior à maioria dos outros laptops multimídia de 15,6 polegadas na mesma faixa de preço como mostra a tabela abaixo.


| |||||||||||||||||||||||||
iluminação: 82 %
iluminação com acumulador: 279 cd/m²
Contraste: 872:1 (Preto: 0.32 cd/m²)
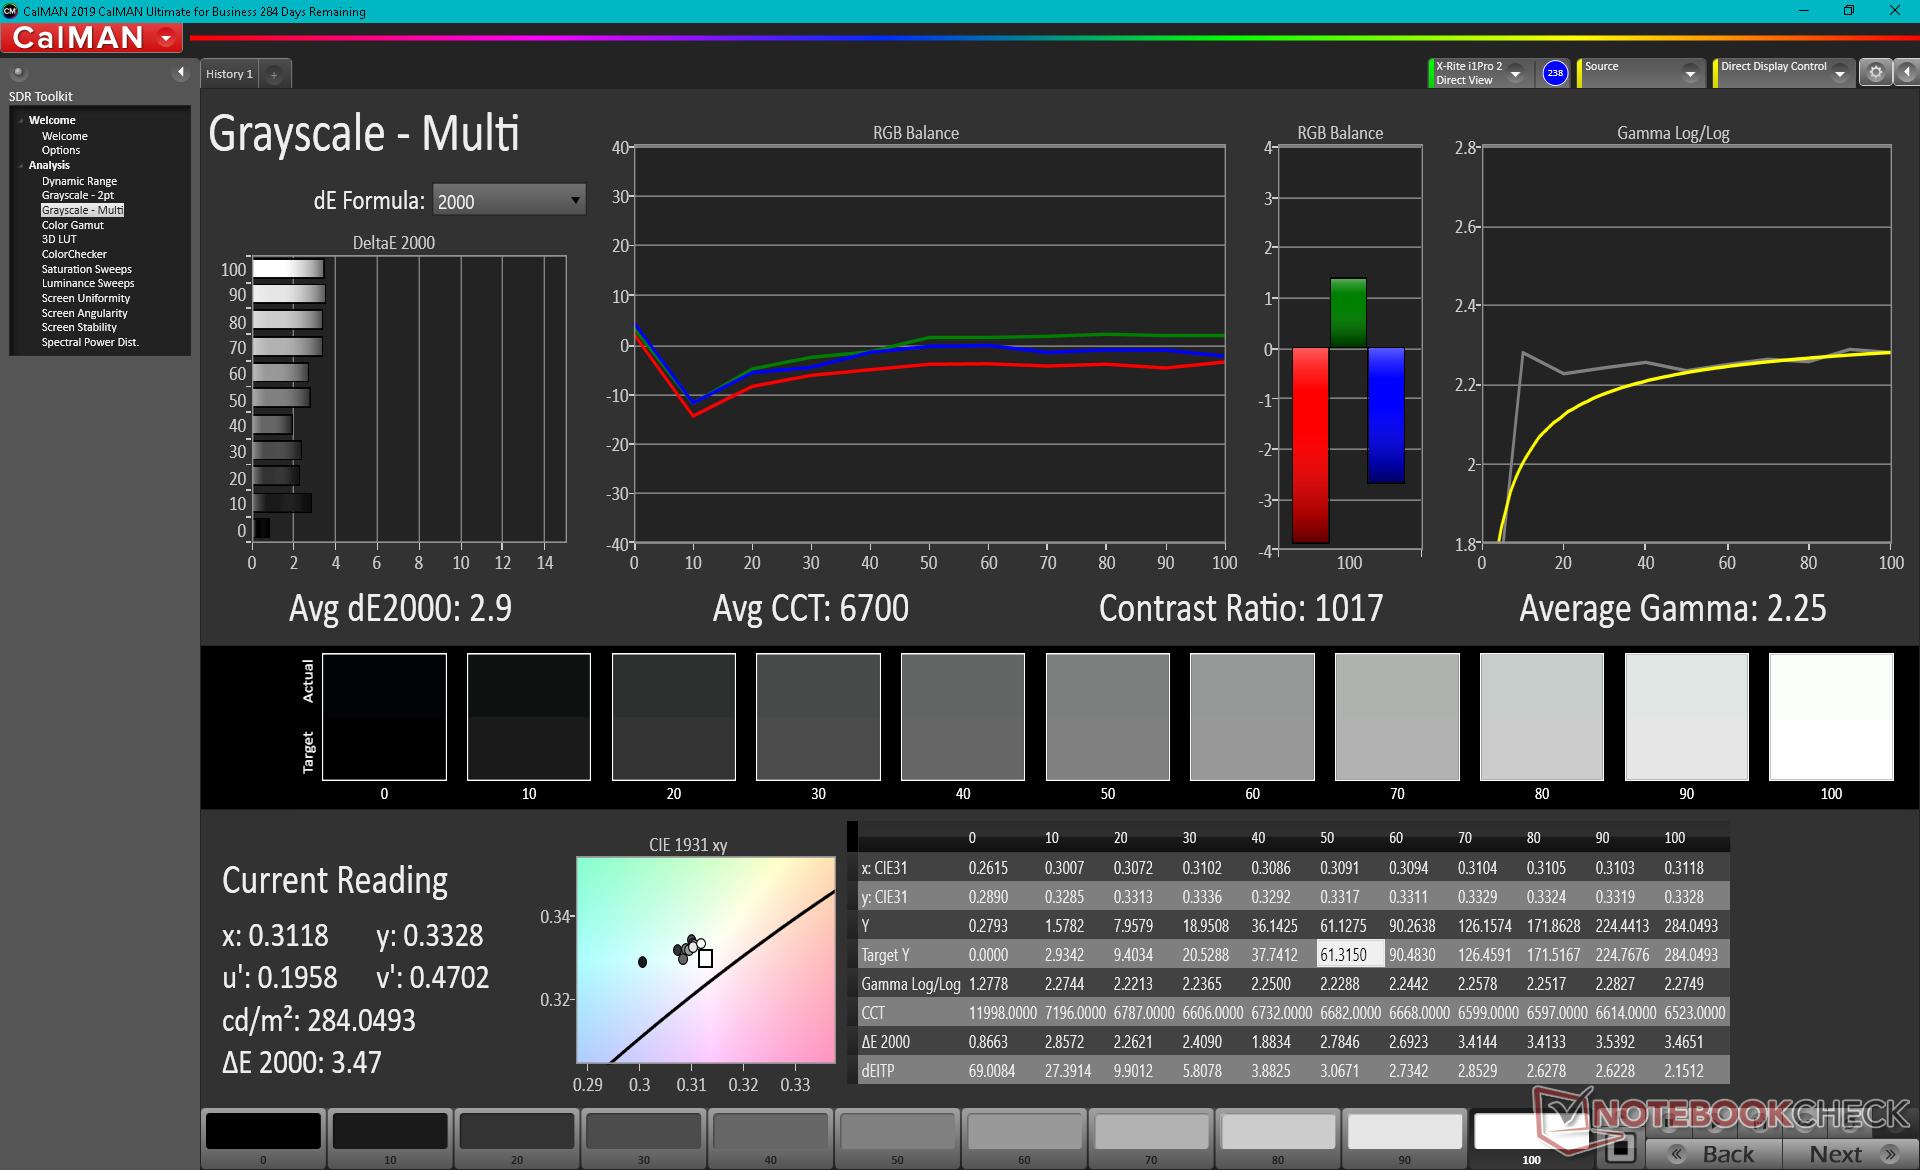
ΔE ColorChecker Calman: 1.72 | ∀{0.5-29.43 Ø4.71}
calibrated: 1.39
ΔE Greyscale Calman: 2.9 | ∀{0.09-98 Ø4.96}
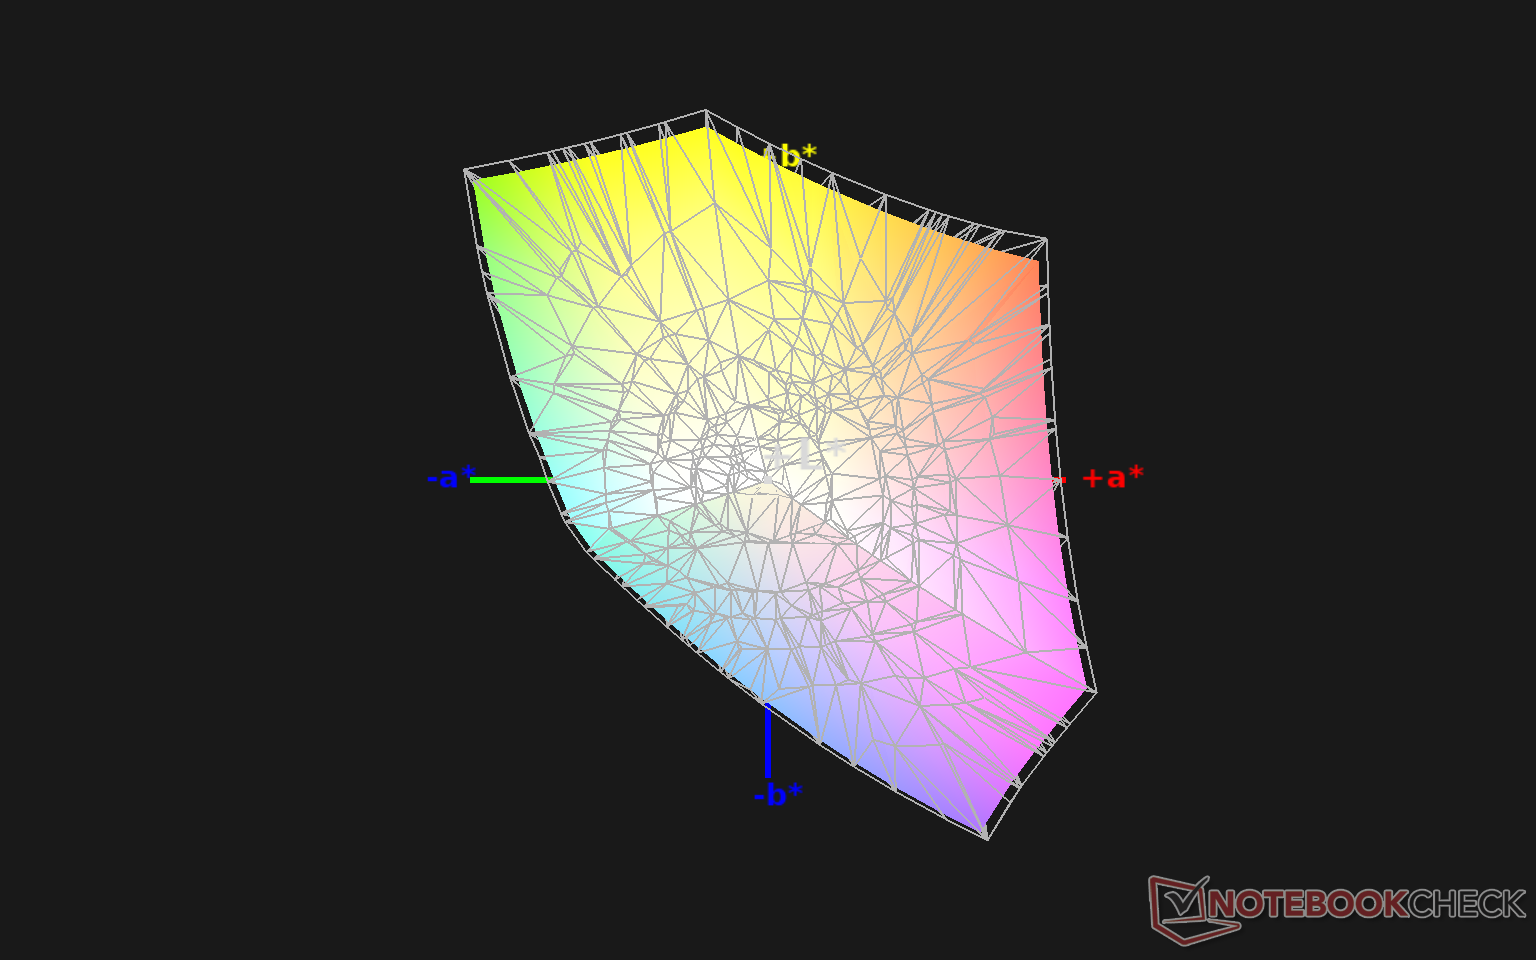
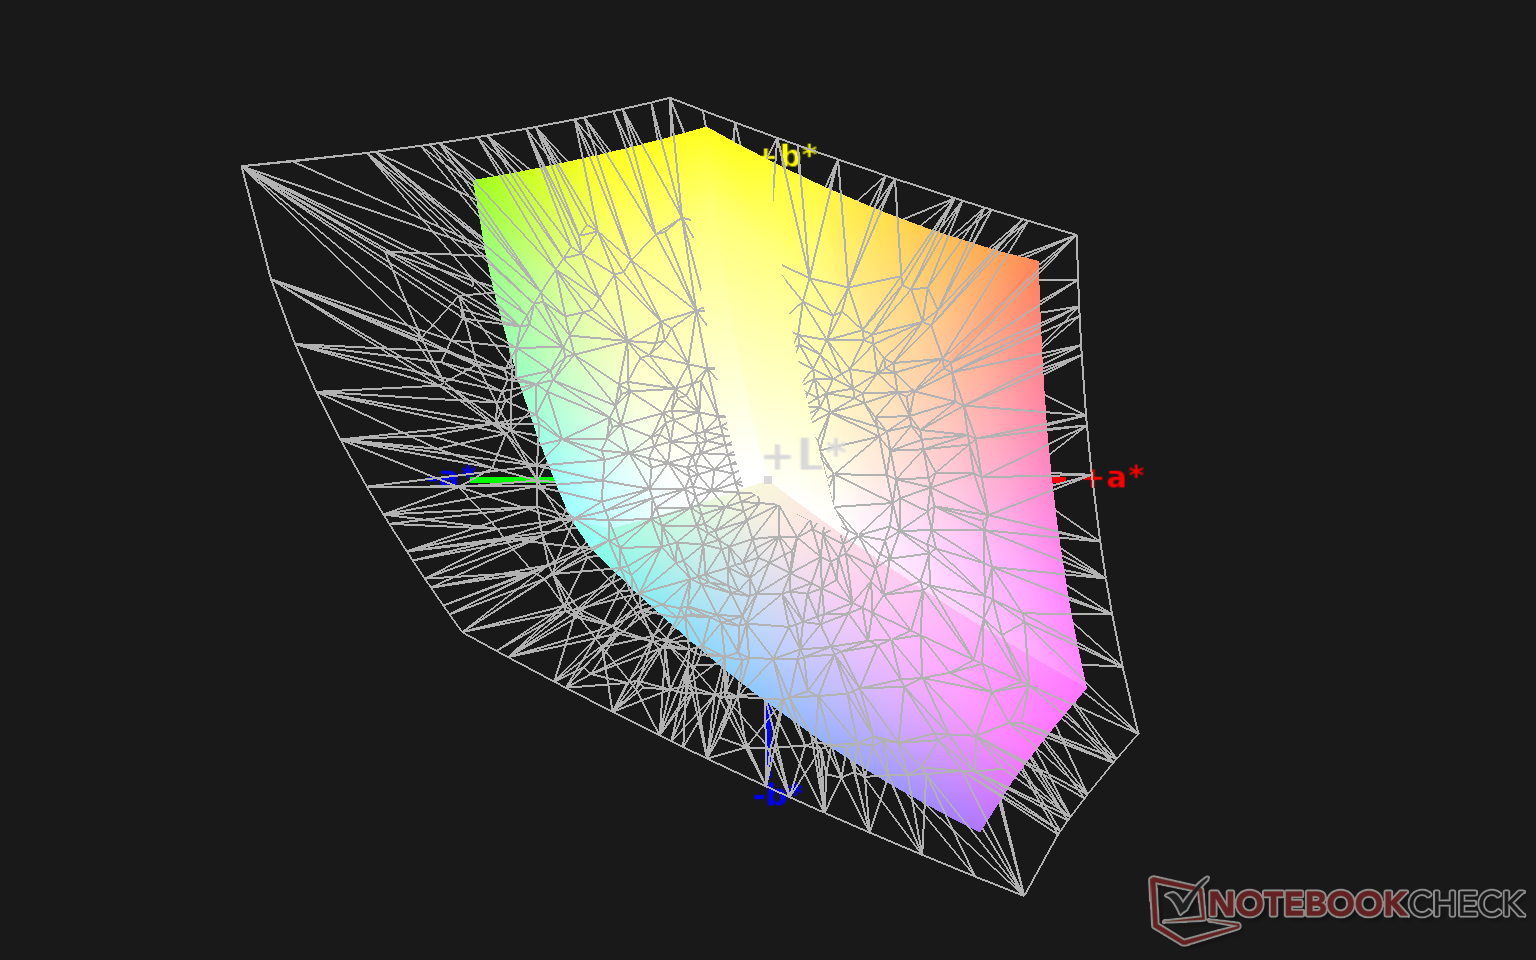
93.2% sRGB (Argyll 1.6.3 3D)
59% AdobeRGB 1998 (Argyll 1.6.3 3D)
64.1% AdobeRGB 1998 (Argyll 3D)
93.4% sRGB (Argyll 3D)
62% Display P3 (Argyll 3D)
Gamma: 2.3
CCT: 6700 K
| MSI Stealth 15M A11SEK Chi Mei N156HCE-EN1, IPS, 15.6", 1920x1080 | Dell XPS 15 9500 Core i7 4K UHD Sharp LQ156R1, IPS, 15.6", 3840x2400 | Lenovo ThinkPad T15p-20TN0006GE MNF601EA1-1, IPS LED, 15.6", 3840x2160 | Asus ZenBook UX535-M01440 BOE0866, IPS, 15.6", 3840x2160 | MSI Prestige 15 A10SC Sharp LQ156D1JW42, IPS, 15.6", 3840x2160 | HP Envy 15-ep0098nr Samsung SDC4145, AMOLED, 15.6", 3840x2160 | |
|---|---|---|---|---|---|---|
| Display | 36% | 33% | 9% | 29% | 35% | |
| Display P3 Coverage (%) | 62 | 89.7 45% | 86.8 40% | 68.8 11% | 82 32% | 88.5 43% |
| sRGB Coverage (%) | 93.4 | 100 7% | 99.3 6% | 99.5 7% | 98.3 5% | 100 7% |
| AdobeRGB 1998 Coverage (%) | 64.1 | 99.8 56% | 98.5 54% | 70.1 9% | 96.2 50% | 99.9 56% |
| Response Times | -4% | 27% | 31% | -22% | 95% | |
| Response Time Grey 50% / Grey 80% * (ms) | 47.6 ? | 54 ? -13% | 41.6 ? 13% | 34 ? 29% | 60 ? -26% | 0.8 ? 98% |
| Response Time Black / White * (ms) | 35.2 ? | 33.2 ? 6% | 21.2 ? 40% | 24 ? 32% | 41.2 ? -17% | 2.7 ? 92% |
| PWM Frequency (Hz) | 25000 ? | 26040 ? | 242.7 ? | |||
| Screen | -6% | 54% | 12% | -5% | -36% | |
| Brightness middle (cd/m²) | 279 | 557.9 100% | 595 113% | 402 44% | 464.5 66% | 374.3 34% |
| Brightness (cd/m²) | 252 | 541 115% | 594 136% | 375 49% | 451 79% | 379 50% |
| Brightness Distribution (%) | 82 | 91 11% | 94 15% | 84 2% | 92 12% | 91 11% |
| Black Level * (cd/m²) | 0.32 | 0.39 -22% | 0.32 -0% | 0.35 -9% | 0.5 -56% | |
| Contrast (:1) | 872 | 1431 64% | 1859 113% | 1149 32% | 929 7% | |
| Colorchecker dE 2000 * | 1.72 | 4.54 -164% | 1.2 30% | 2.47 -44% | 3.36 -95% | 5.47 -218% |
| Colorchecker dE 2000 max. * | 5.62 | 7.92 -41% | 2.5 56% | 4.32 23% | 7.06 -26% | 8.22 -46% |
| Colorchecker dE 2000 calibrated * | 1.39 | 3.82 -175% | 1 28% | 2.36 -70% | 3.42 -146% | 4.61 -232% |
| Greyscale dE 2000 * | 2.9 | 3.2 -10% | 1.4 52% | 2.26 22% | 1.3 55% | 2.3 21% |
| Gamma | 2.3 96% | 1.99 111% | 2.1 105% | 2.49 88% | 2.14 103% | 2.09 105% |
| CCT | 6700 97% | 6451 101% | 6492 100% | 6285 103% | 6596 99% | 6340 103% |
| Color Space (Percent of AdobeRGB 1998) (%) | 59 | 89.5 52% | 85.3 45% | 99 68% | 84.8 44% | 87.8 49% |
| Color Space (Percent of sRGB) (%) | 93.2 | 100 7% | 99.2 6% | 98.3 5% | 100 7% | |
| Média Total (Programa/Configurações) | 9% /
2% | 38% /
47% | 17% /
14% | 1% /
-1% | 31% /
-2% |
* ... menor é melhor
O painel cobre quase todo o sRGB e aproximadamente 60% do AdobeRGB, que é padrão na maioria dos Ultrabooks com displays de 1080p. Outros laptops com displays 4K como o próprio Prestige 15 da MSI geralmente oferecem cores mais profundas, visando o AdobeRGB em seu lugar.
O sistema é bem calibrado para fora da caixa com valores médios de escala de cinza e deltaE ColorChecker de apenas 2,9 e 1,72, respectivamente. Calibrar ainda mais o visor com nosso colorímetro X-Rite melhoraria as médias apenas marginalmente. Curiosamente, as cores teal e verde são representadas de forma mais imprecisa do que todas as outras cores por amplas margens, mesmo após a calibração.
Exibir tempos de resposta
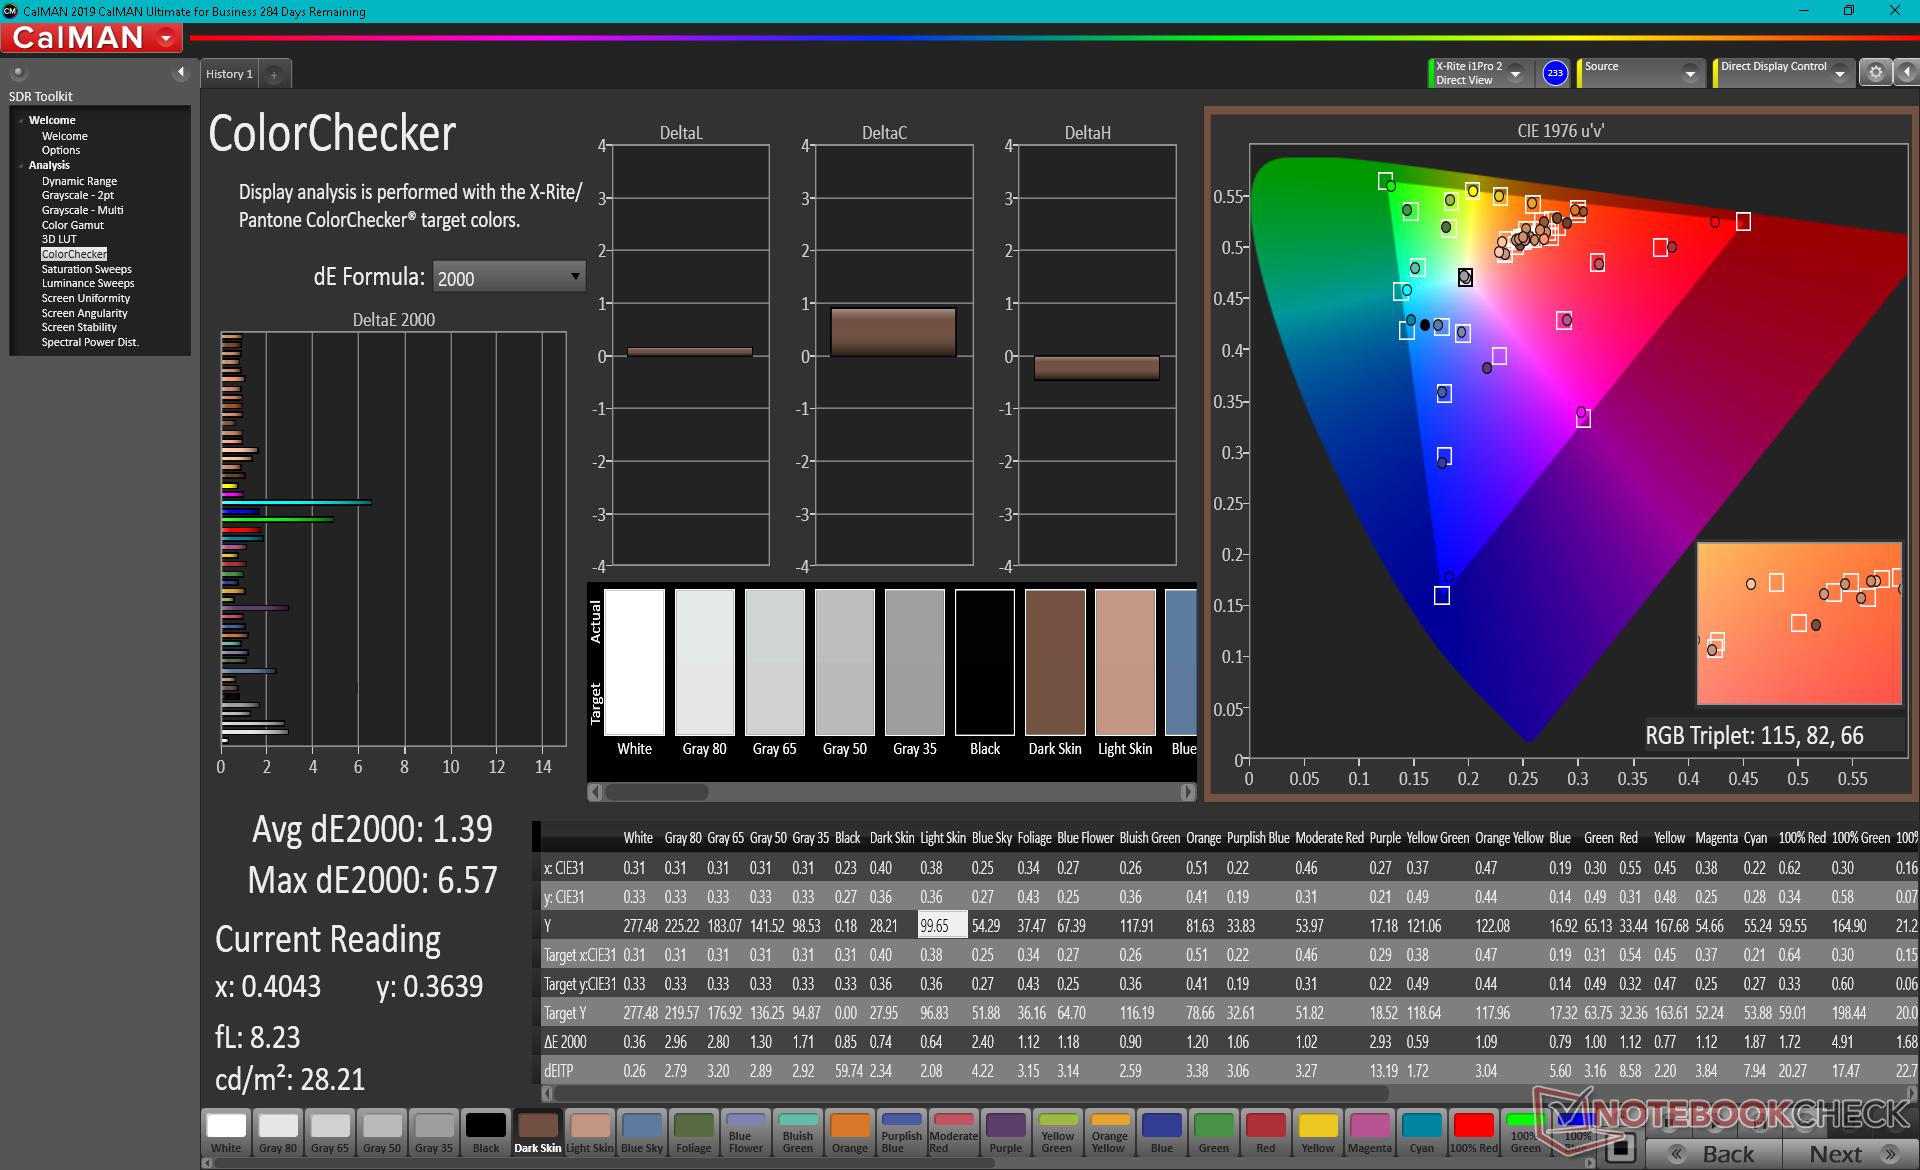
| ↔ Tempo de resposta preto para branco | ||
|---|---|---|
| 35.2 ms ... ascensão ↗ e queda ↘ combinadas | ↗ 22 ms ascensão | 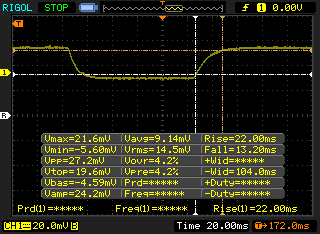 |
| ↘ 13.2 ms queda | ||
| A tela mostra taxas de resposta lentas em nossos testes e será insatisfatória para os jogadores. Em comparação, todos os dispositivos testados variam de 0.1 (mínimo) a 240 (máximo) ms. » 93 % de todos os dispositivos são melhores. Isso significa que o tempo de resposta medido é pior que a média de todos os dispositivos testados (19.8 ms). | ||
| ↔ Tempo de resposta 50% cinza a 80% cinza | ||
| 47.6 ms ... ascensão ↗ e queda ↘ combinadas | ↗ 25.2 ms ascensão | 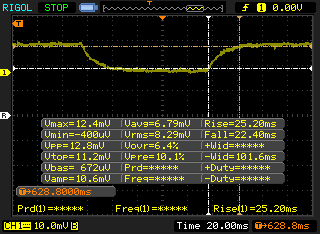 |
| ↘ 22.4 ms queda | ||
| A tela mostra taxas de resposta lentas em nossos testes e será insatisfatória para os jogadores. Em comparação, todos os dispositivos testados variam de 0.165 (mínimo) a 636 (máximo) ms. » 82 % de todos os dispositivos são melhores. Isso significa que o tempo de resposta medido é pior que a média de todos os dispositivos testados (31 ms). | ||
Cintilação da tela / PWM (modulação por largura de pulso)
| Tela tremeluzindo/PWM detectado | 25000 Hz | ≤ 25 % configuração de brilho |  |
A luz de fundo da tela pisca em 25000 Hz (pior caso, por exemplo, utilizando PWM) Cintilação detectada em uma configuração de brilho de 25 % e abaixo. Não deve haver cintilação ou PWM acima desta configuração de brilho. A frequência de 25000 Hz é bastante alta, então a maioria dos usuários sensíveis ao PWM não deve notar nenhuma oscilação. [pwm_comparison] Em comparação: 52 % de todos os dispositivos testados não usam PWM para escurecer a tela. Se PWM foi detectado, uma média de 7757 (mínimo: 5 - máximo: 343500) Hz foi medida. | |||
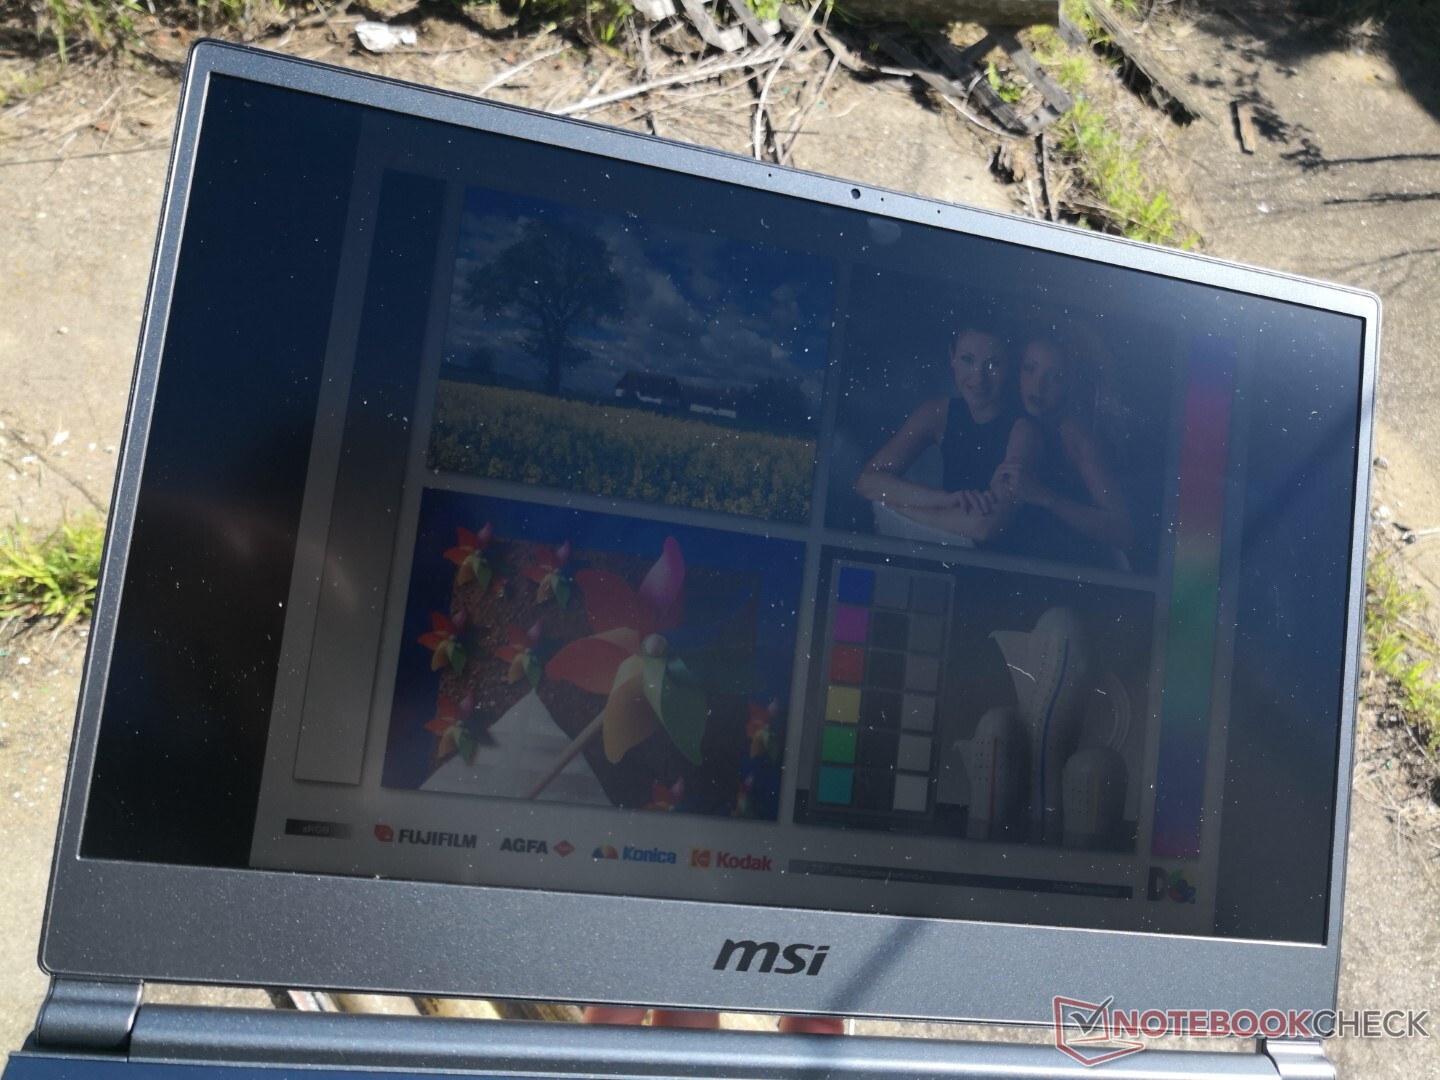
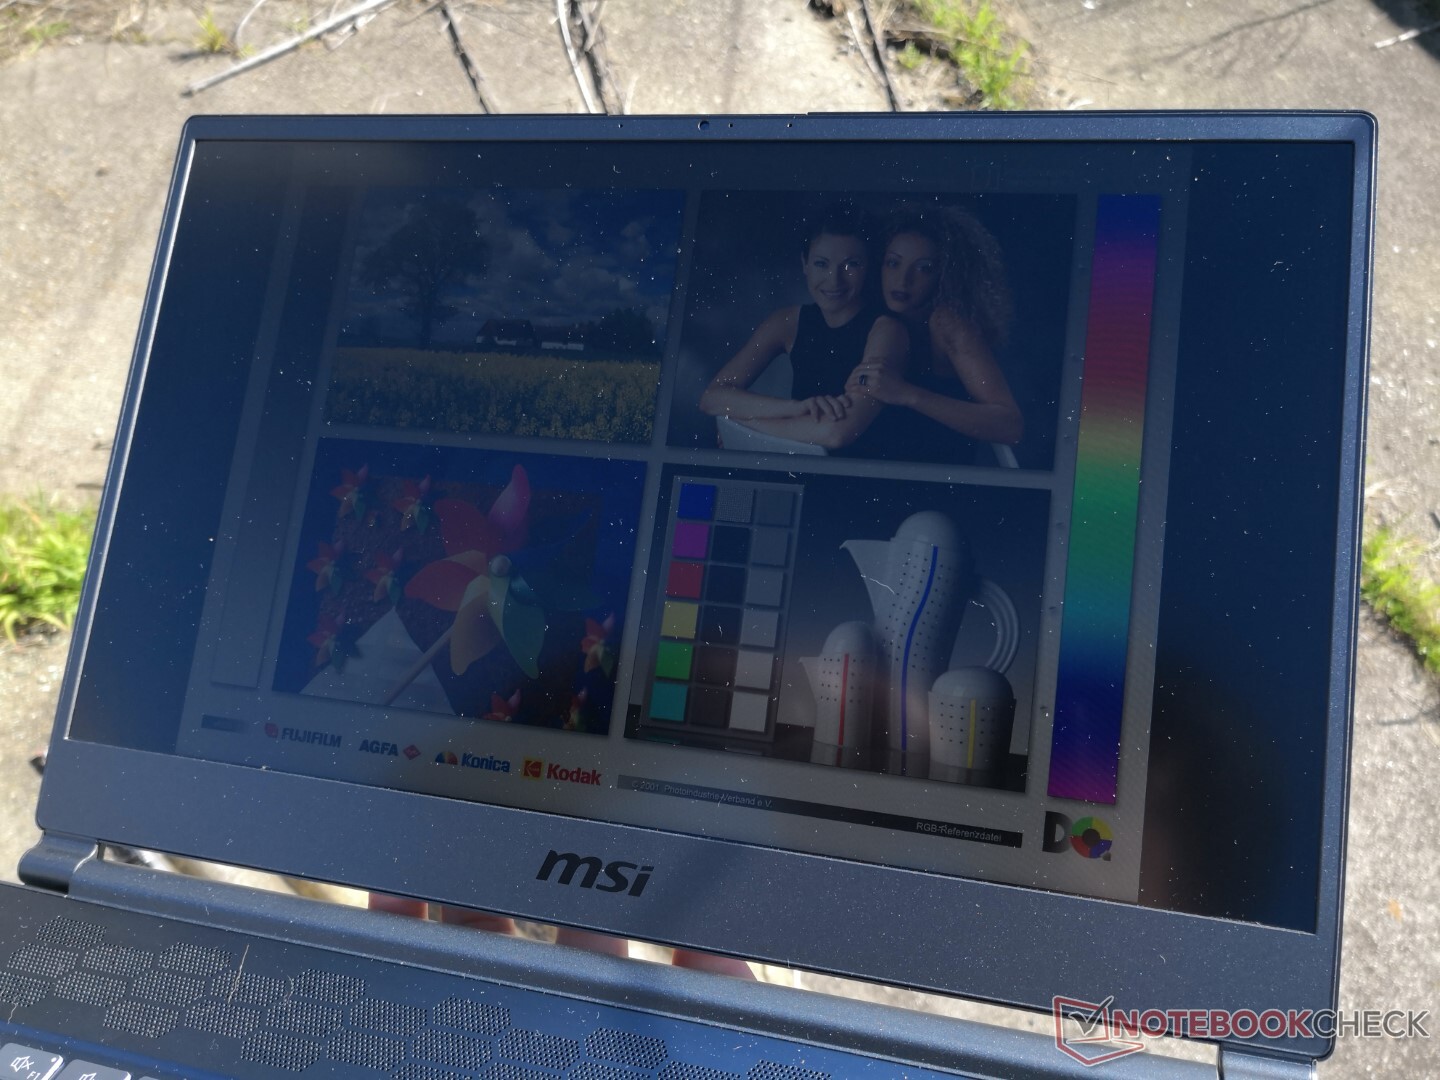
A visibilidade ao ar livre é meramente média devido ao nível de brilho máximo relativamente baixo. Isto é lamentável porque o design leve do chassi pode realmente encorajar os proprietários a usar o Stealth 15M ao ar livre com mais freqüência.
Desempenho
O sistema MSI é único na medida em que os usuários têm a opção de emparelhar a GPU GeForce RTX 2060 Max-Q com uma CPU da série Core U em vez da série Core H mais comum. As configurações mais recentes vêm com processadores ainda mais rápidos incluindo o 11º gênero Core i7-11375H e Nvidia Ampere GeForce RTX 3060 para substituir as CPUs mais antigas do 10º gênero e GPUs Turing.
Nossa unidade foi configurada para o modo Extreme Performance via MSI Dragon Center antes de executar quaisquer benchmarks de performance.
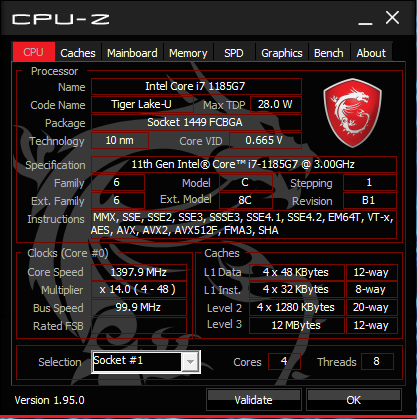
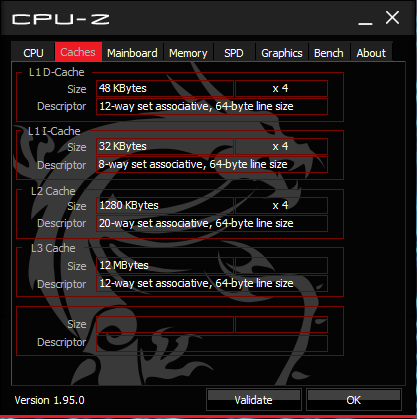
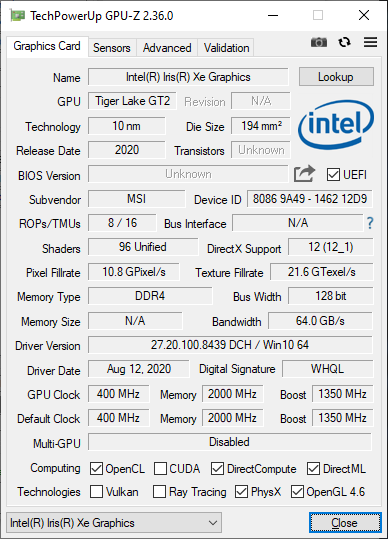
Processador
Da dúzia de laptops que testamos até agora com a mesma CPU Core i7-1185G7, nossa Stealth 15M é uma das mais rápidas com pontuações CineBench xT que são 12% a 16% mais altas do que a média. Seu excelente desempenho pode ser atribuído à boa sustentabilidade do Turbo Boost da CPU, como mostra nosso gráfico abaixo. A Summit E15 equipada com a mesma CPU, por exemplo, funcionaria cerca de 15% mais lenta do que nossa Stealth 15M após contabilizar qualquer estrangulamento de desempenho em ambos os sistemas. O desempenho de uma única linha é ainda mais impressionante com a pontuação do CineBench superando até mesmo o Corei7-10875H.
O desempenho geral multi-tarefa ainda é cerca de 23 a 27% mais lento do que o Core i7-10875H ou Core i7-10750H, mais ávido de energia do que o Core i7-10875H ou Core i7-10750H, como encontrado na maioria dos laptops de alto desempenho.
Cinebench R15: CPU Multi 64Bit | CPU Single 64Bit
Blender: v2.79 BMW27 CPU
7-Zip 18.03: 7z b 4 -mmt1 | 7z b 4
Geekbench 5.5: Single-Core | Multi-Core
HWBOT x265 Benchmark v2.2: 4k Preset
LibreOffice : 20 Documents To PDF
R Benchmark 2.5: Overall mean
Cinebench R15: CPU Multi 64Bit | CPU Single 64Bit
Blender: v2.79 BMW27 CPU
7-Zip 18.03: 7z b 4 -mmt1 | 7z b 4
Geekbench 5.5: Single-Core | Multi-Core
HWBOT x265 Benchmark v2.2: 4k Preset
LibreOffice : 20 Documents To PDF
R Benchmark 2.5: Overall mean
* ... menor é melhor
Desempenho do sistema
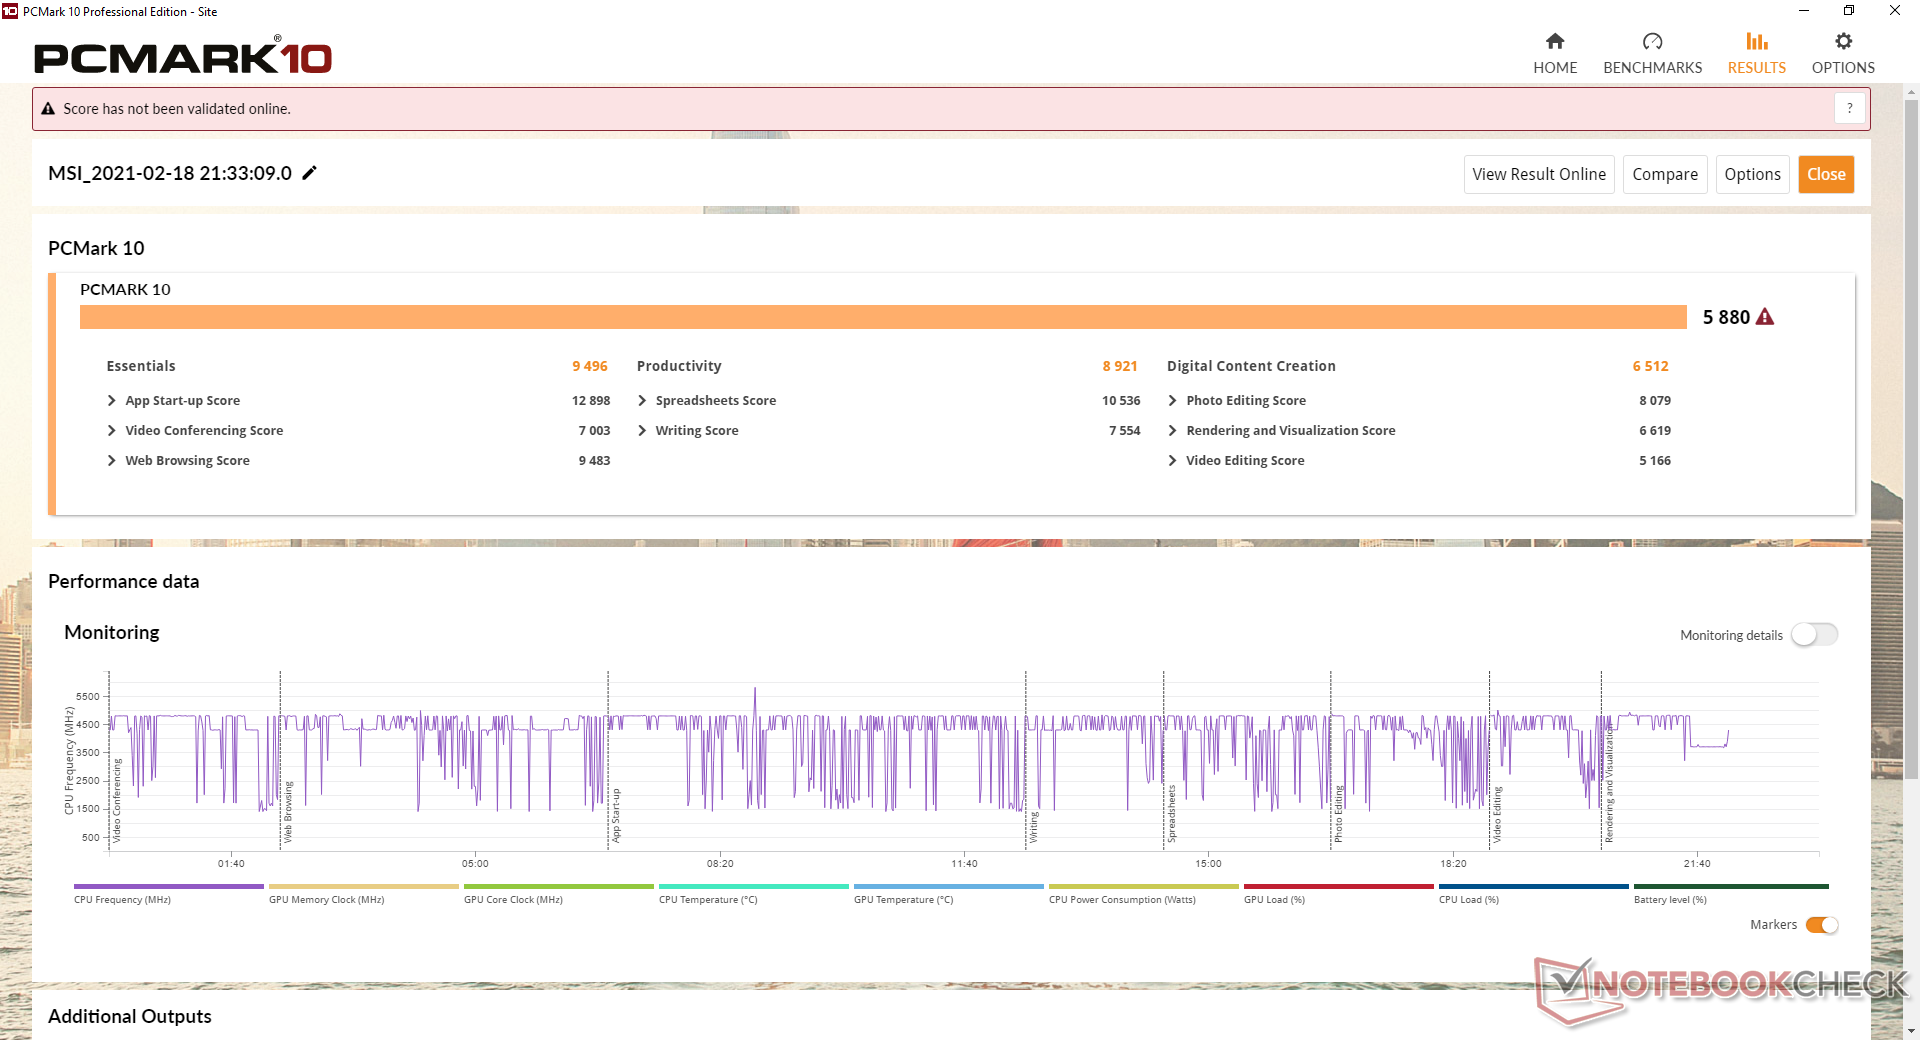
Os benchmarks PCMark são mais altos do que a maioria dos outros laptops multimídia Core da série H devido ao mais rápido GeForce GPU RTX e ao alto desempenho por watt da CPU.
Não tivemos nenhum problema de software durante nosso tempo com a unidade de teste. Os proprietários devem se familiarizar com o software MSI Dragon Center, pois ele é um centro de controle para a maioria das configurações do sistema
| PCMark 10 Score | 5880 pontos | |
Ajuda | ||
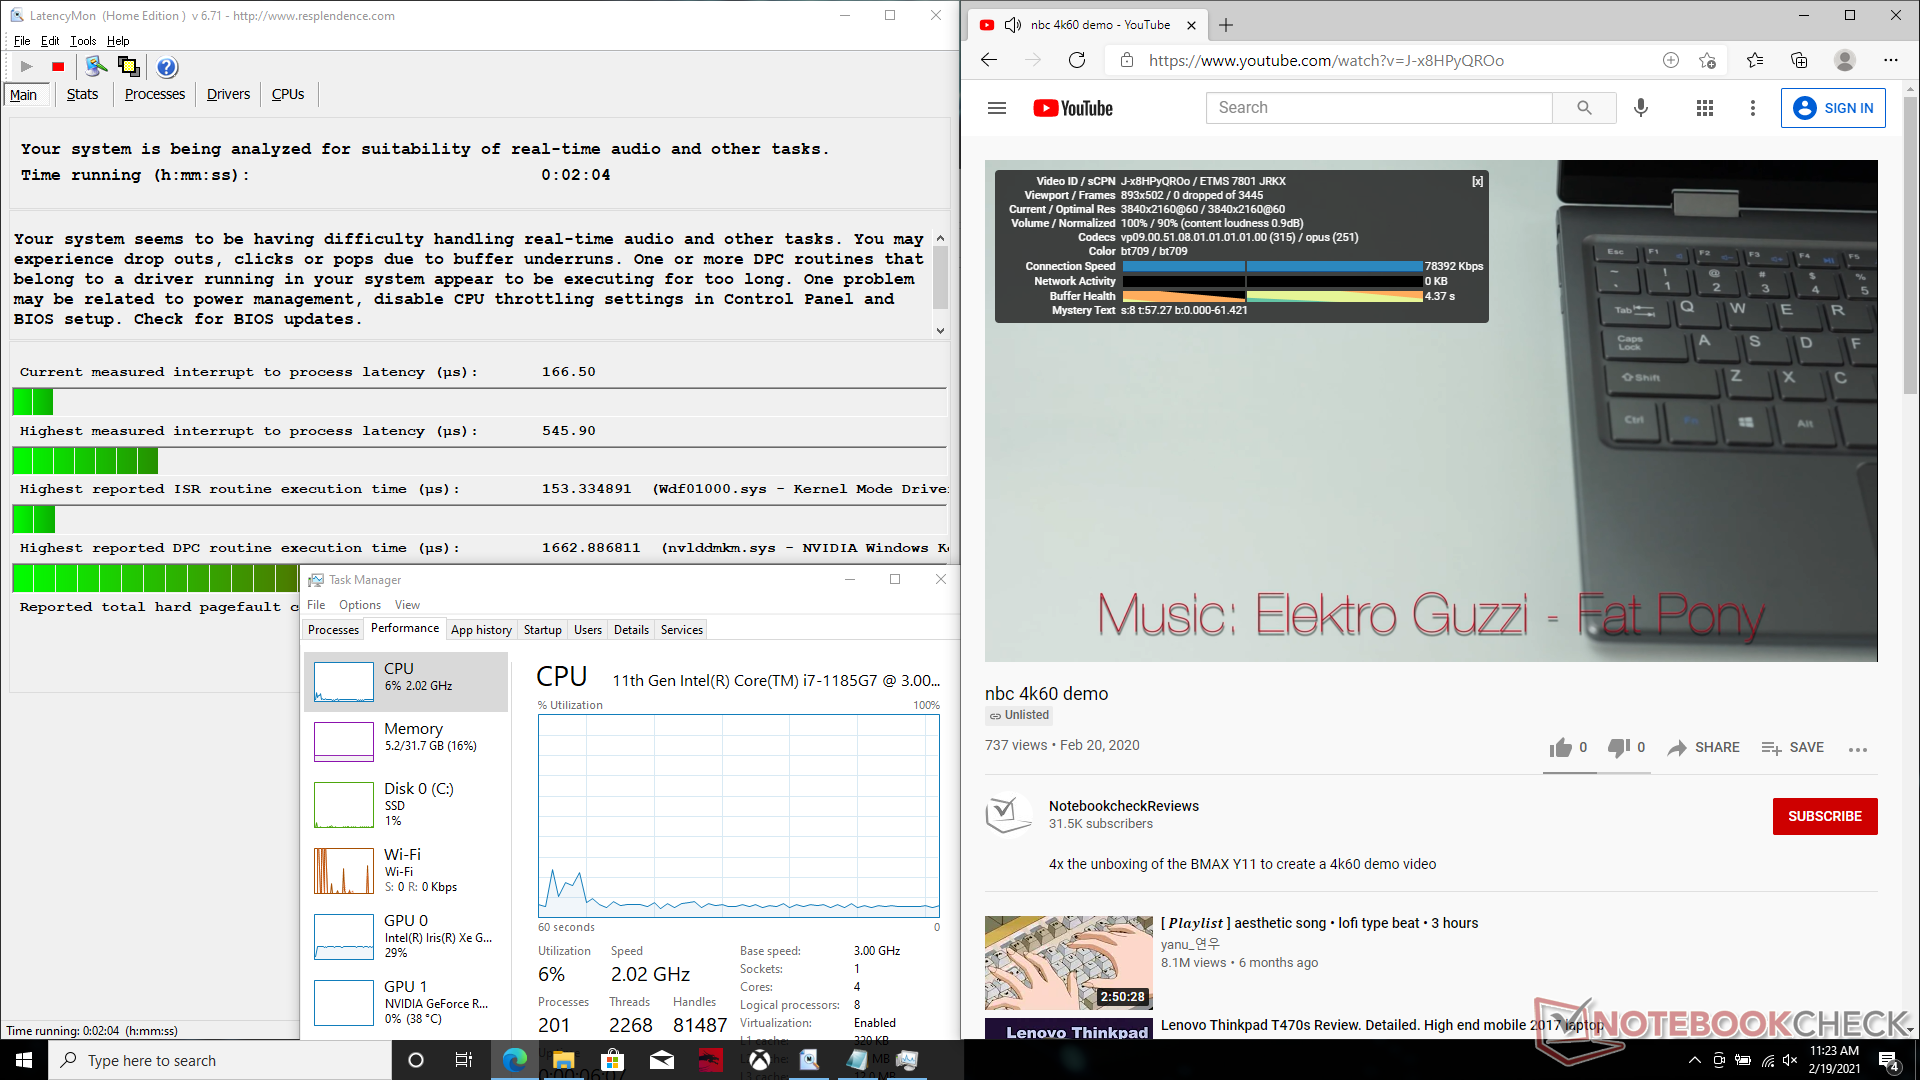
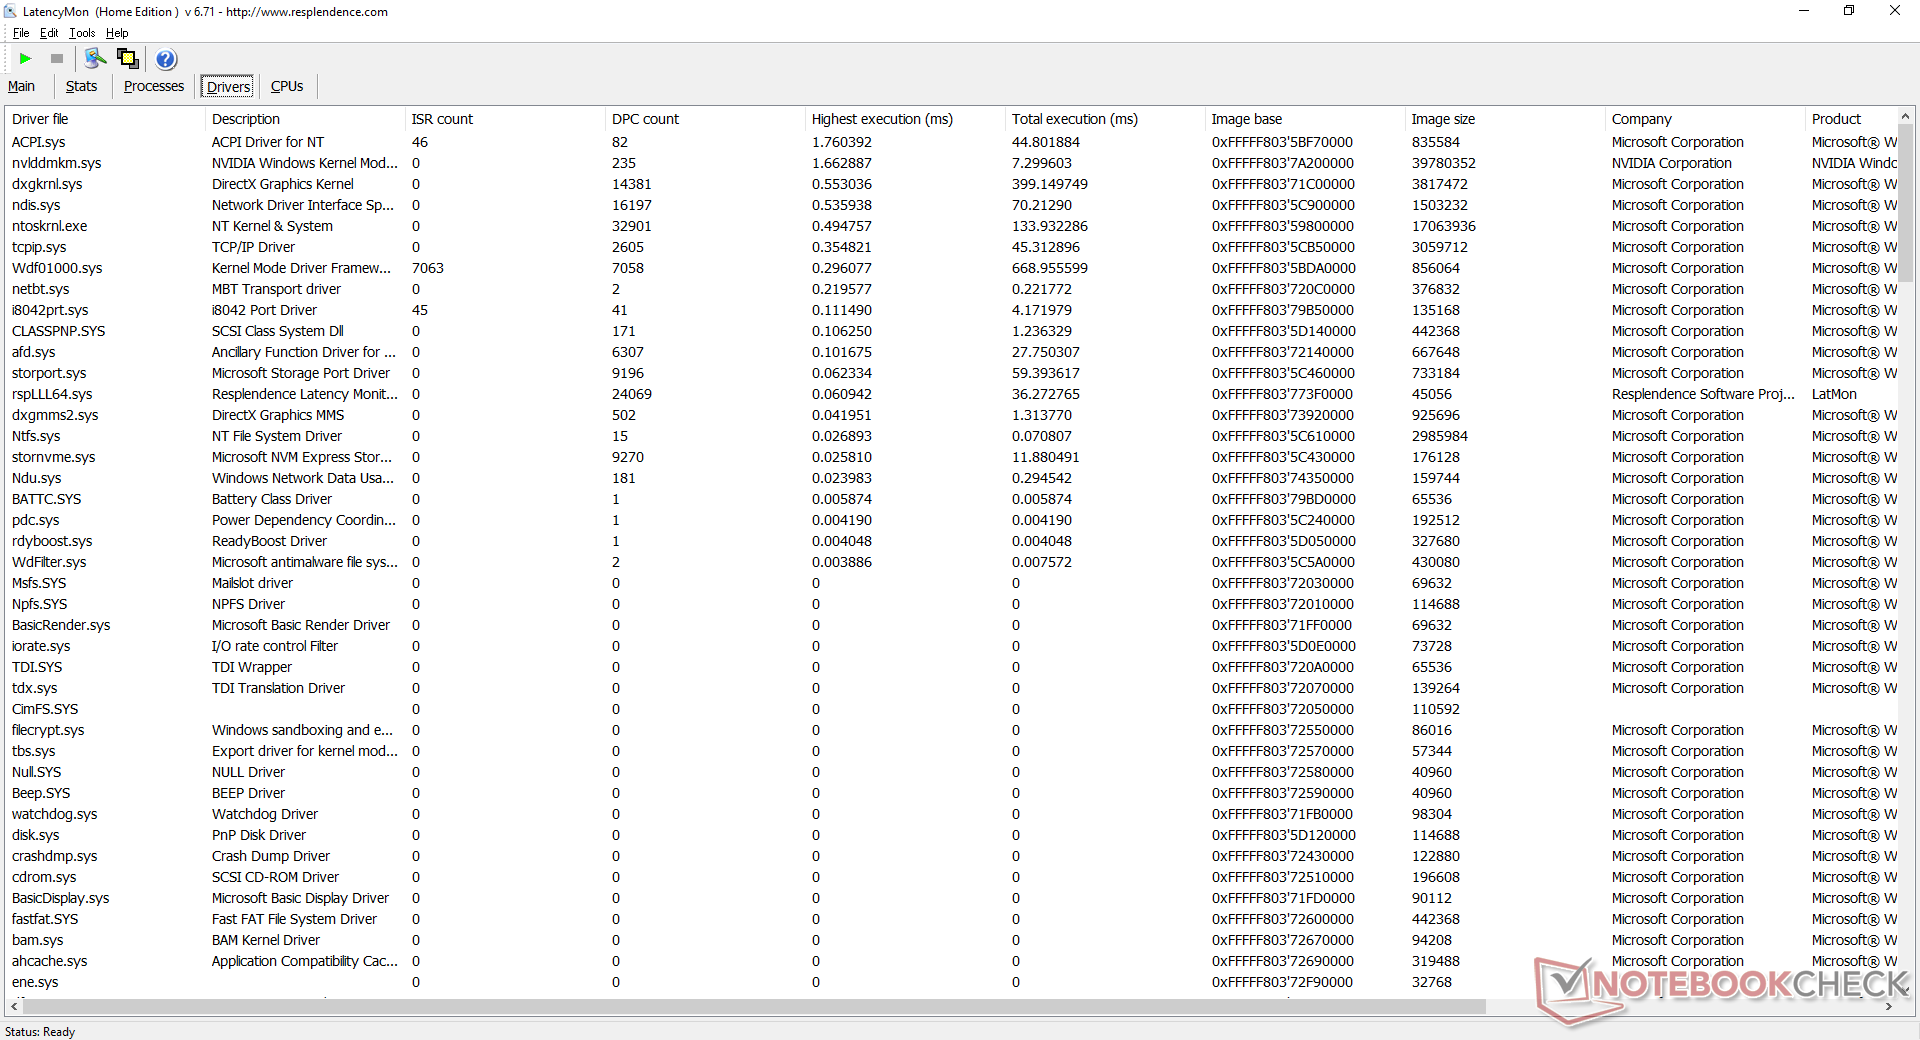
Latência do DPC
LatencyMon revela problemas de latência do DPC relacionados ao nvlddmkm.sys ao abrir várias abas do navegador em nossa página inicial. A reprodução de vídeo de 4K a 60 FPS é de outra forma suave e sem queda de quadros.
| DPC Latencies / LatencyMon - interrupt to process latency (max), Web, Youtube, Prime95 | |
| Dell XPS 15 9500 Core i7 4K UHD | |
| Lenovo ThinkPad T15p-20TN0006GE | |
| Asus ZenBook UX535-M01440 | |
| MSI Stealth 15M A11SEK | |
* ... menor é melhor
Dispositivos de armazenamento
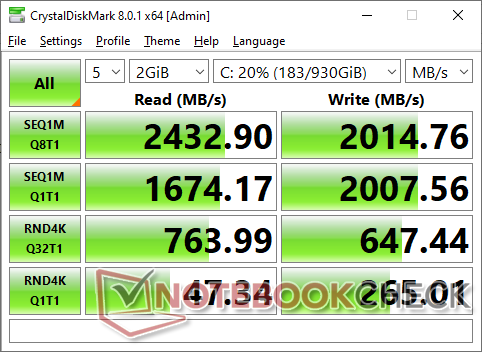
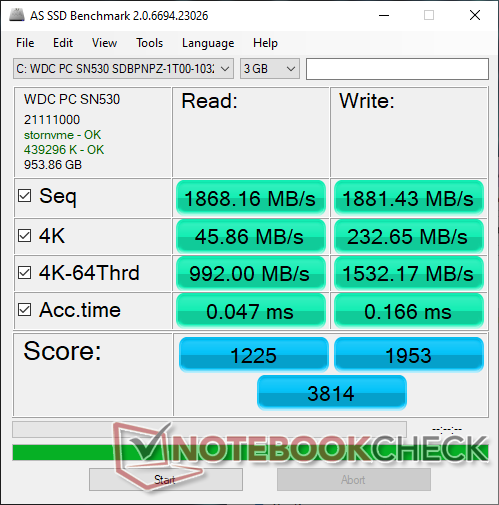
As opções de armazenamento interno são limitadas a um único slot M.2 PCIe 3.0 x4. Nossa unidade de teste vem com um WD SN530 de 1 TB que é um SSD NVMe de médio alcance, em contraste com a série SN750 mais alta. As taxas de leitura e escrita seqüencial ainda são muito boas em cerca de 2400 MB/s e 2000 MB/s, respectivamente, em comparação com >3000 MB/s em unidades mais caras.
| MSI Stealth 15M A11SEK WDC PC SN530 SDBPNPZ-1T00 | HP Spectre X360 15-5ZV31AV Intel SSD 660p 2TB SSDPEKNW020T8 | Dell XPS 15 9500 Core i7 4K UHD SK Hynix PC611 512GB | Asus ZenBook UX535-M01440 WDC PC SN730 SDBPNTY-1T00 | MSI Prestige 15 A10SC Samsung SSD PM981 MZVLB1T0HALR | |
|---|---|---|---|---|---|
| AS SSD | -26% | -16% | -11% | 4% | |
| Seq Read (MB/s) | 1868 | 1220 -35% | 2072 11% | 1886 1% | 1274 -32% |
| Seq Write (MB/s) | 1881 | 1152 -39% | 1486 -21% | 1221 -35% | 1395 -26% |
| 4K Read (MB/s) | 45.86 | 52.3 14% | 47.41 3% | 41.16 -10% | 50.3 10% |
| 4K Write (MB/s) | 232.6 | 146.6 -37% | 117.6 -49% | 101.2 -56% | 119.8 -48% |
| 4K-64 Read (MB/s) | 992 | 652 -34% | 967 -3% | 1022 3% | 1599 61% |
| 4K-64 Write (MB/s) | 1532 | 847 -45% | 715 -53% | 1618 6% | 1455 -5% |
| Access Time Read * (ms) | 0.047 | 0.077 -64% | 0.057 -21% | 0.058 -23% | 0.044 6% |
| Access Time Write * (ms) | 0.166 | 0.106 36% | 0.096 42% | 0.037 78% | 0.092 45% |
| Score Read (Points) | 1225 | 826 -33% | 1222 0% | 1252 2% | 1777 45% |
| Score Write (Points) | 1953 | 1109 -43% | 981 -50% | 1841 -6% | 1714 -12% |
| Score Total (Points) | 3814 | 2371 -38% | 2809 -26% | 3706 -3% | 4411 16% |
| Copy ISO MB/s (MB/s) | 2320 | 2070 -11% | 1999 -14% | 1611 -31% | 2830 22% |
| Copy Program MB/s (MB/s) | 681 | 571 -16% | 627 -8% | 509 -25% | 609 -11% |
| Copy Game MB/s (MB/s) | 1588 | 1219 -23% | 1001 -37% | 677 -57% | 1424 -10% |
| CrystalDiskMark 5.2 / 6 | -20% | -9% | -10% | -30% | |
| Write 4K (MB/s) | 262.6 | 151.5 -42% | 123.3 -53% | 110 -58% | 150.8 -43% |
| Read 4K (MB/s) | 45.41 | 59.3 31% | 41.85 -8% | 43.44 -4% | 47.3 4% |
| Write Seq (MB/s) | 2001 | 1424 -29% | 2054 3% | 1957 -2% | 981 -51% |
| Read Seq (MB/s) | 1659 | 1609 -3% | 1617 -3% | 1615 -3% | 976 -41% |
| Write 4K Q32T1 (MB/s) | 648 | 393.6 -39% | 413 -36% | 341.6 -47% | 442.7 -32% |
| Read 4K Q32T1 (MB/s) | 767 | 369.4 -52% | 377.5 -51% | 364.3 -53% | 499.7 -35% |
| Write Seq Q32T1 (MB/s) | 2002 | 1946 -3% | 2705 35% | 3081 54% | 1706 -15% |
| Read Seq Q32T1 (MB/s) | 2415 | 1934 -20% | 3442 43% | 3251 35% | 1758 -27% |
| Média Total (Programa/Configurações) | -23% /
-24% | -13% /
-13% | -11% /
-11% | -13% /
-8% |
* ... menor é melhor

Disk Throttling: DiskSpd Read Loop, Queue Depth 8
Desempenho da GPU
O desempenho gráfico está no mesmo nível de muitos laptops para superar facilmente quase todos os outros laptops multimídia ultra-finos de 15,6 polegadas. A atualização para a configuração GeForce RTX 3060 traria vantagens de desempenho ainda maiores, mas não podemos estimar o aumento no momento, pois ainda não testamos o RTX 3060 SKU.
Consulte nossa página dedicada no GeForce RTX 2060 Max-Q para obter mais informações técnicas e comparações de benchmark.
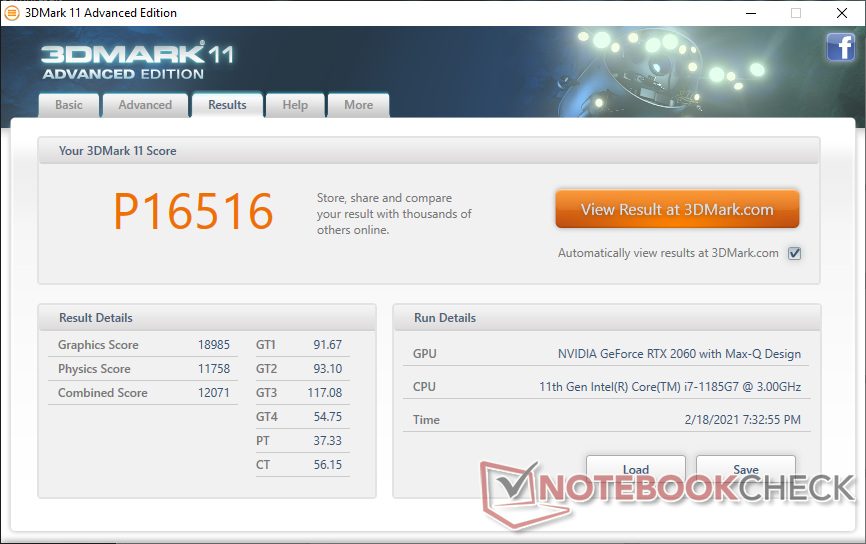
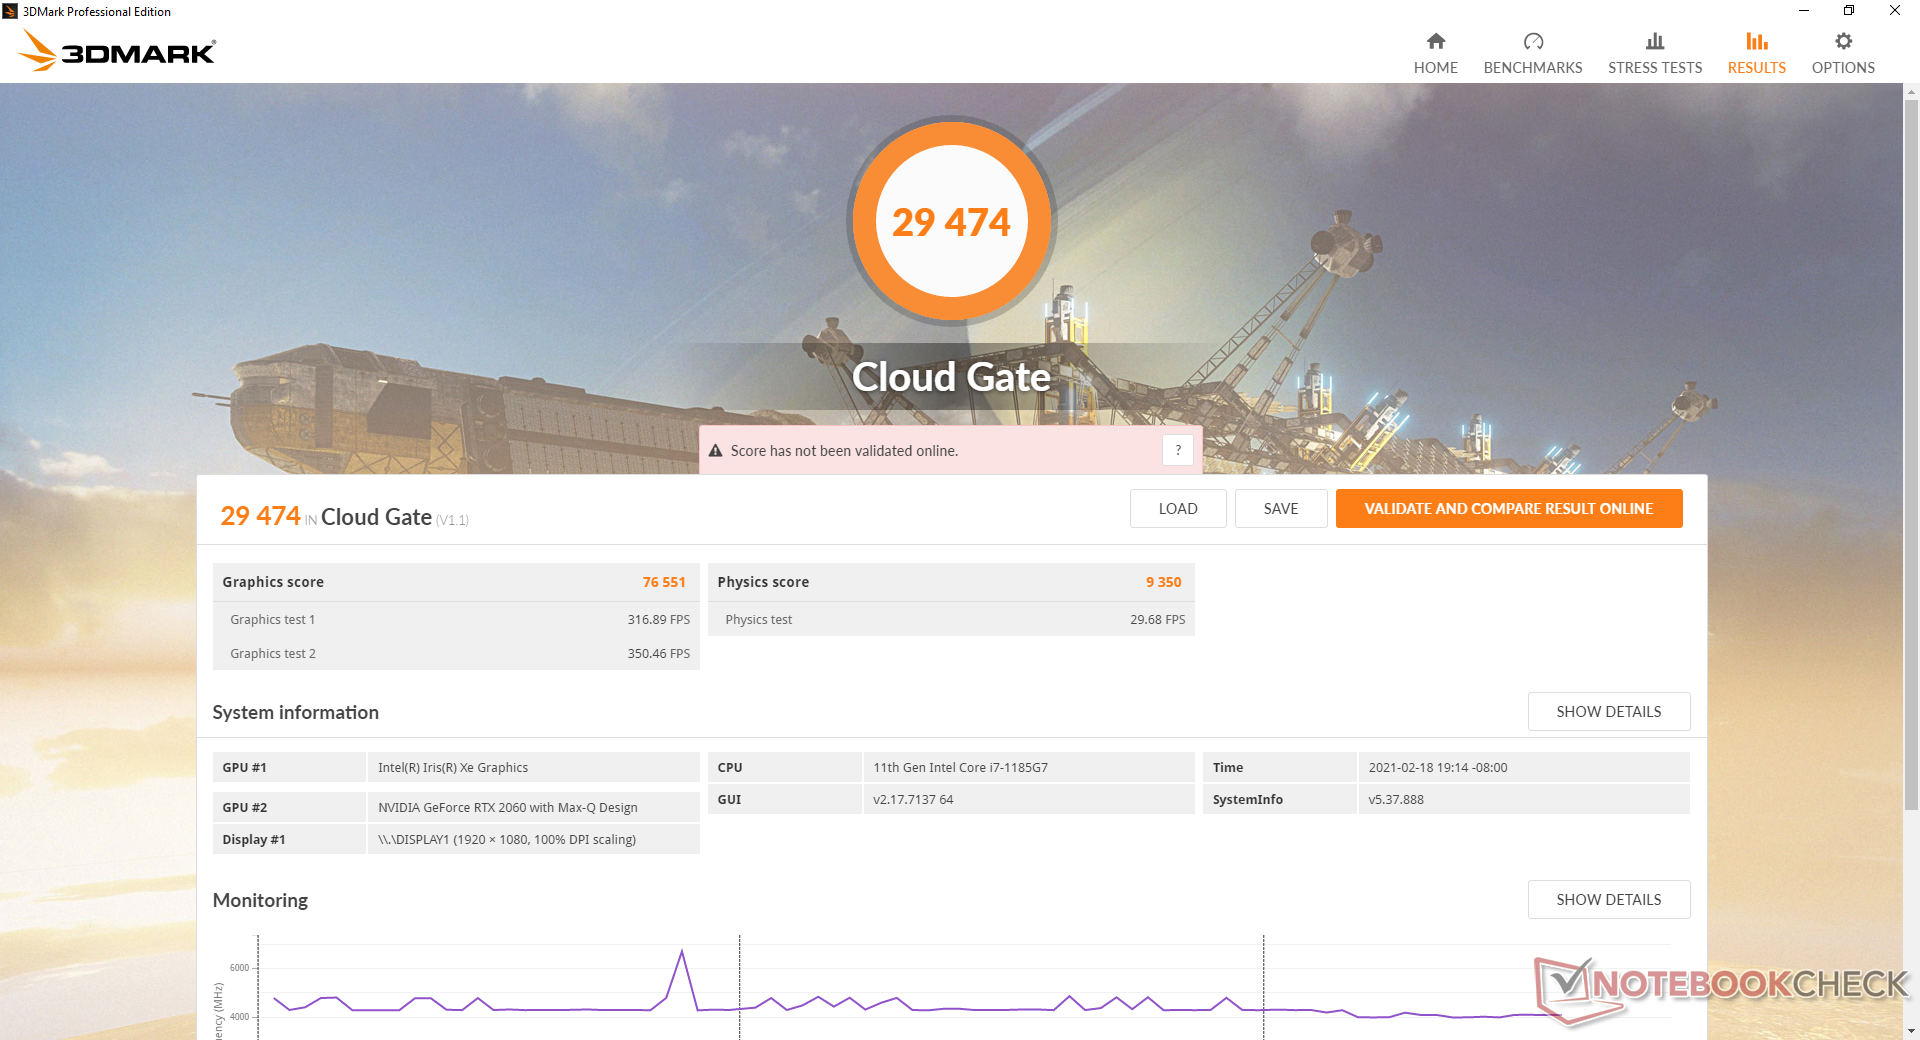
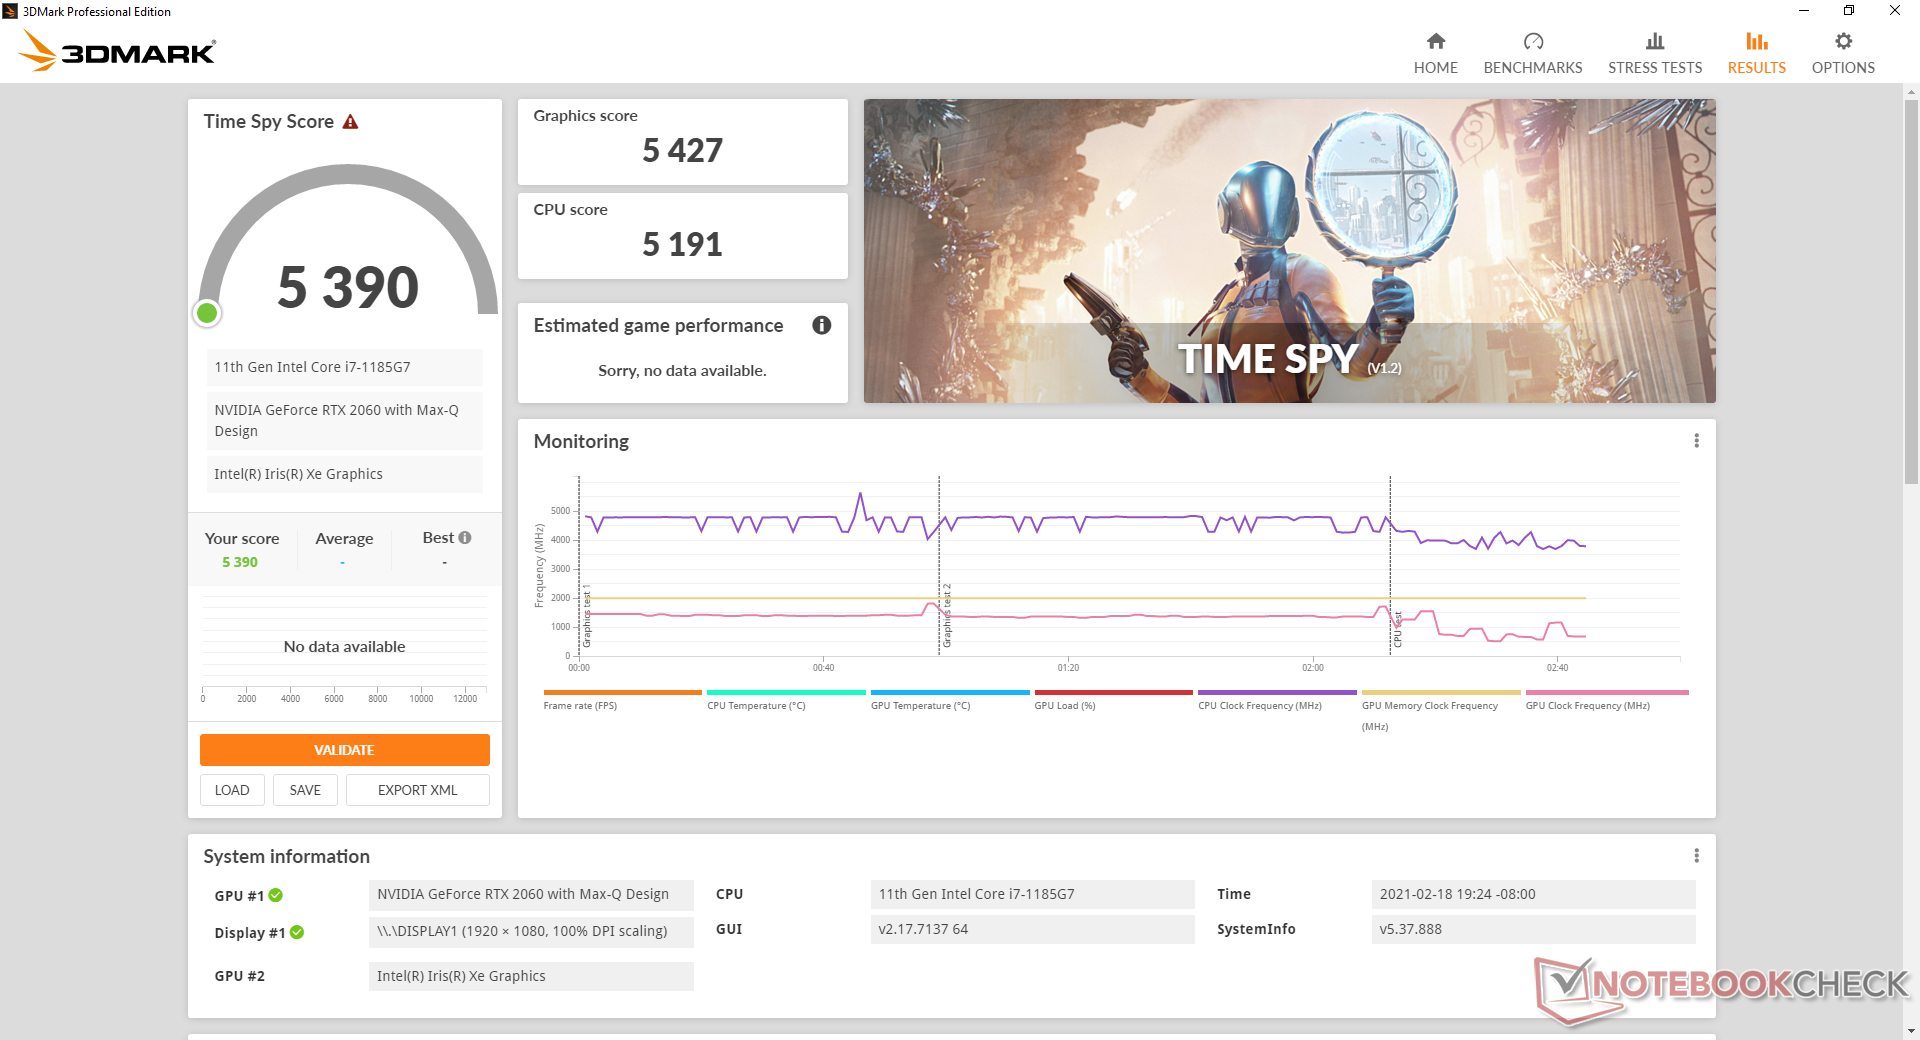
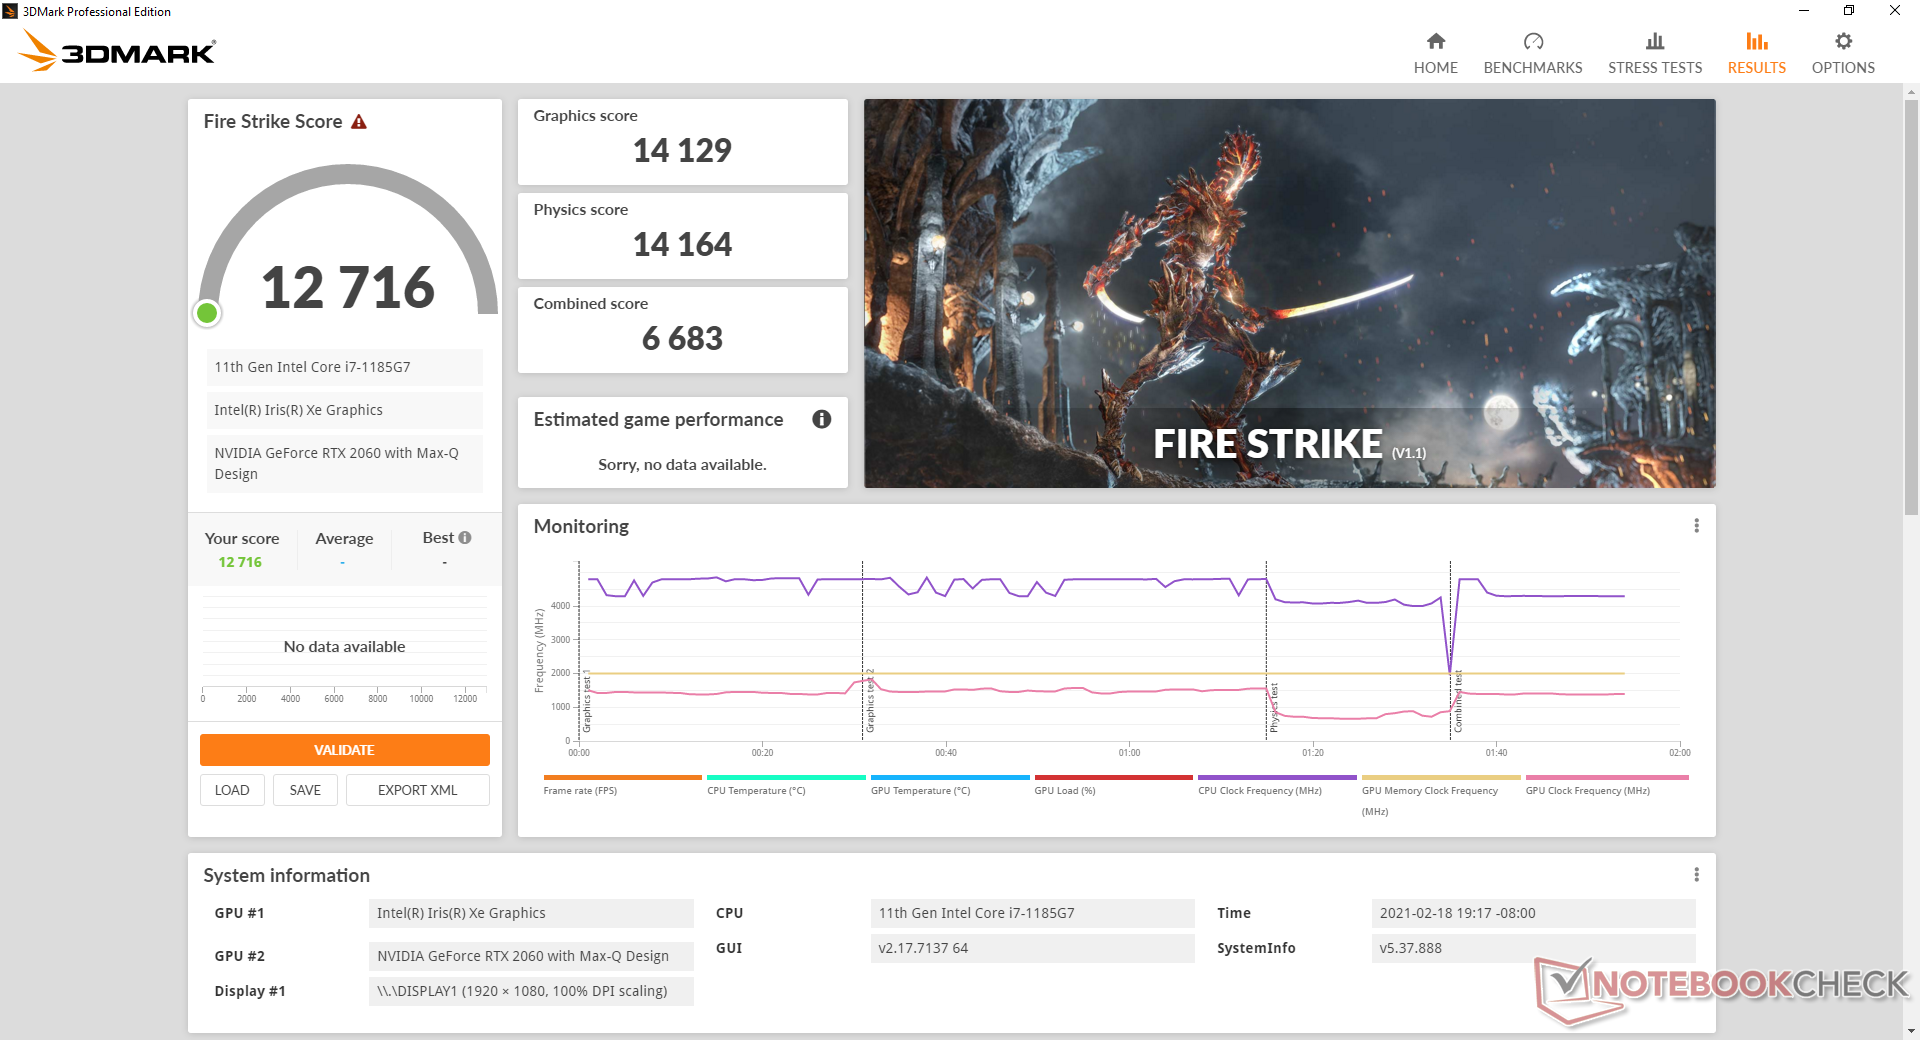
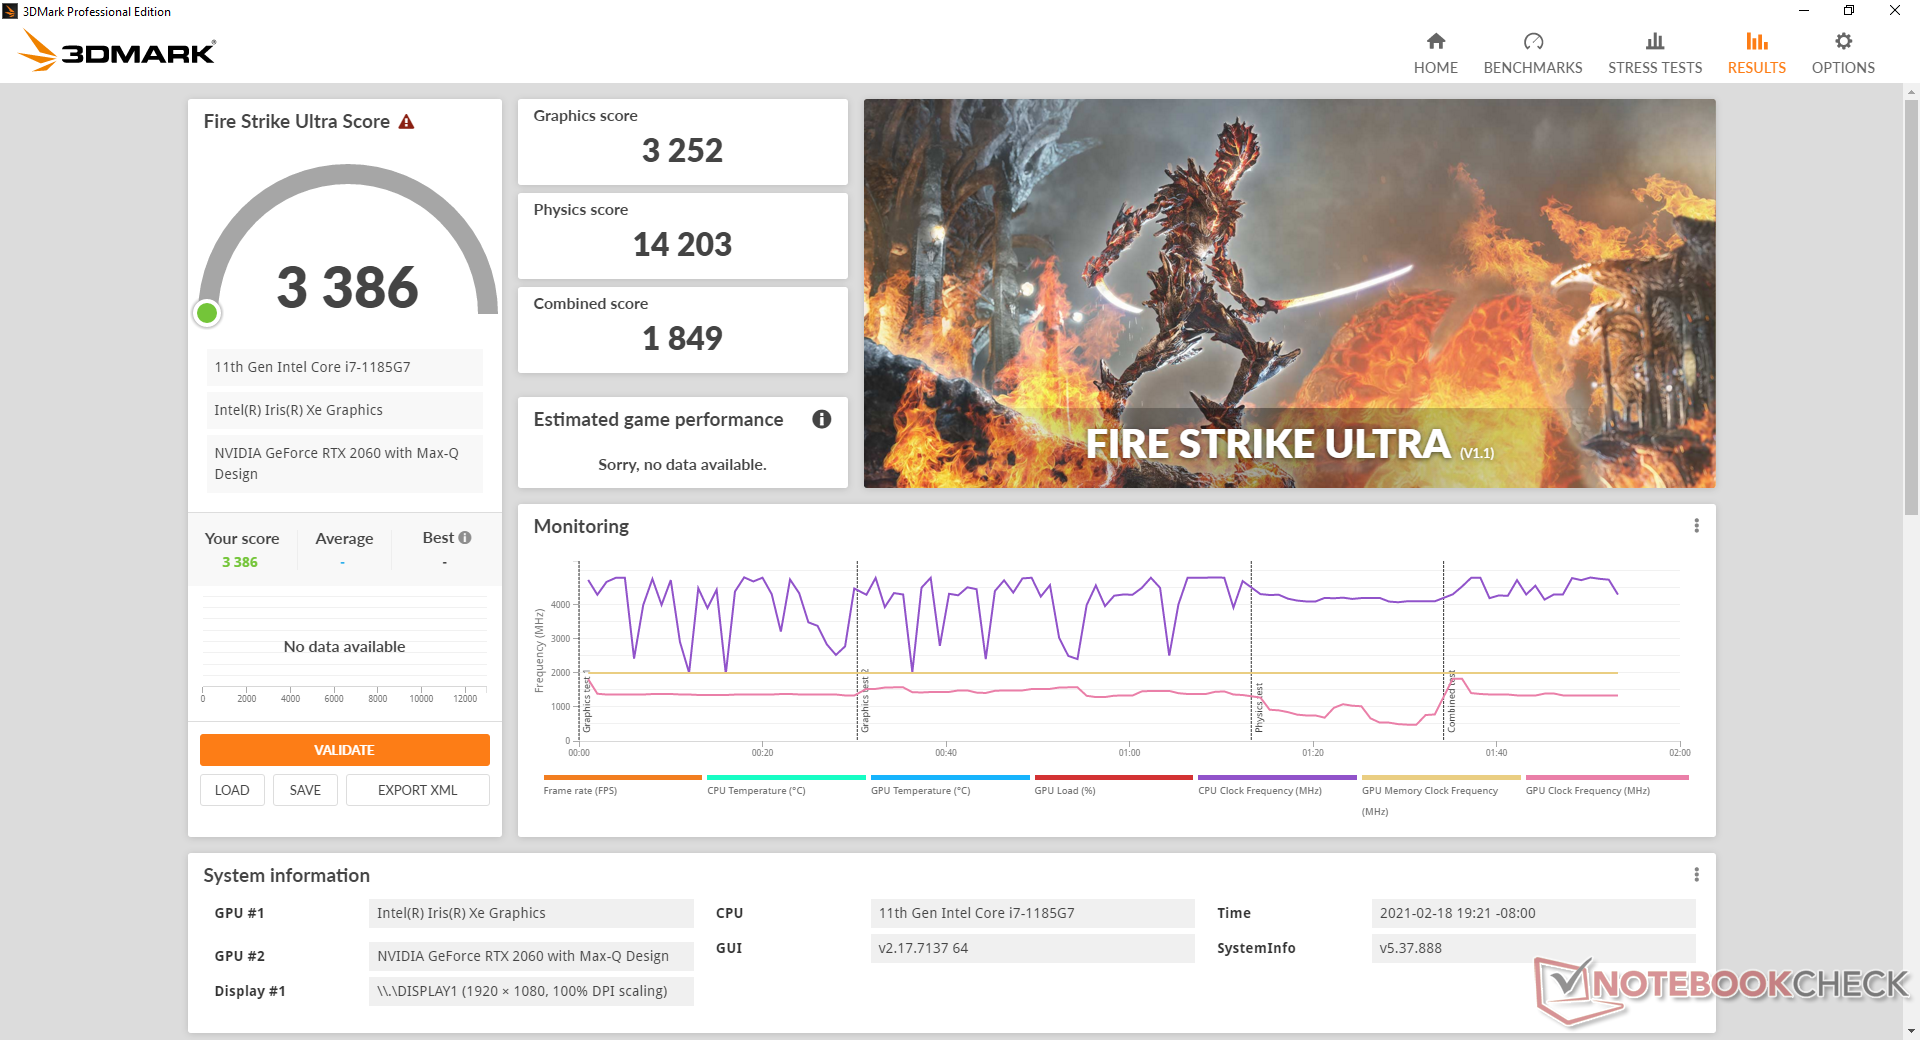
| 3DMark 11 Performance | 16516 pontos | |
| 3DMark Cloud Gate Standard Score | 29474 pontos | |
| 3DMark Fire Strike Score | 12716 pontos | |
| 3DMark Time Spy Score | 5390 pontos | |
Ajuda | ||
| Final Fantasy XV Benchmark | |
| 1280x720 Lite Quality | |
| MSI RTX 2060 Gaming Z 6G | |
| HP Envy 15-ep0098nr | |
| Média NVIDIA GeForce RTX 2060 Max-Q (126 - 141, n=3) | |
| MSI Stealth 15M A11SEK | |
| Lenovo ThinkPad E15 Gen2-20TD002MGE | |
| Lenovo Yoga Slim 7-14ARE | |
| Acer Aspire 5 A515-56-511A | |
| Honor MagicBook 15 4500U | |
| Dell Inspiron 15 5000 5502 | |
| 1920x1080 Standard Quality | |
| MSI RTX 2060 Gaming Z 6G | |
| HP Envy 15-ep0098nr | |
| Média NVIDIA GeForce RTX 2060 Max-Q (74.1 - 82.7, n=3) | |
| MSI Stealth 15M A11SEK | |
| Lenovo ThinkPad E15 Gen2-20TD002MGE | |
| Lenovo Yoga Slim 7-14ARE | |
| Honor MagicBook 15 4500U | |
| Dell Inspiron 15 5000 5502 | |
| 1920x1080 High Quality | |
| MSI RTX 2060 Gaming Z 6G | |
| HP Envy 15-ep0098nr | |
| Média NVIDIA GeForce RTX 2060 Max-Q (55.7 - 62.4, n=3) | |
| MSI Stealth 15M A11SEK | |
| Lenovo ThinkPad E15 Gen2-20TD002MGE | |
| Lenovo Yoga Slim 7-14ARE | |
| Dell Inspiron 15 5000 5502 | |
| GTA V | |
| 1920x1080 Lowest Settings possible | |
| MSI Stealth 15M A11SEK | |
| Média NVIDIA GeForce RTX 2060 Max-Q (n=1) | |
| Lenovo Yoga Slim 7-14ARE | |
| Acer Swift 3 SF314-42-R27B | |
| 1366x768 Normal/Off AF:4x | |
| MSI RTX 2060 Gaming Z 6G | |
| MSI Stealth 15M A11SEK | |
| Média NVIDIA GeForce RTX 2060 Max-Q (n=1) | |
| Acer Swift 3 SF314-42-R27B | |
| 1920x1080 Highest AA:4xMSAA + FX AF:16x | |
| MSI RTX 2060 Gaming Z 6G | |
| MSI Stealth 15M A11SEK | |
| Média NVIDIA GeForce RTX 2060 Max-Q (n=1) | |
| Lenovo Yoga Slim 7-14ARE | |
| Acer Swift 3 SF314-42-R27B | |
| Strange Brigade | |
| 1280x720 lowest AF:1 | |
| MSI Stealth 15M A11SEK | |
| Média NVIDIA GeForce RTX 2060 Max-Q (n=1) | |
| Lenovo Yoga Slim 7-14ARE | |
| 1920x1080 medium AA:medium AF:4 | |
| MSI Stealth 15M A11SEK | |
| Média NVIDIA GeForce RTX 2060 Max-Q (n=1) | |
| Lenovo Yoga Slim 7-14ARE | |
| 1920x1080 high AA:high AF:8 | |
| MSI Stealth 15M A11SEK | |
| Média NVIDIA GeForce RTX 2060 Max-Q (n=1) | |
| Lenovo Yoga Slim 7-14ARE | |
| 1920x1080 ultra AA:ultra AF:16 | |
| MSI Stealth 15M A11SEK | |
| Média NVIDIA GeForce RTX 2060 Max-Q (n=1) | |
| Lenovo Yoga Slim 7-14ARE | |
| baixo | média | alto | ultra | |
|---|---|---|---|---|
| GTA V (2015) | 173 | 164 | 119 | 68.2 |
| The Witcher 3 (2015) | 235.1 | 139.9 | 88.9 | 51.2 |
| Dota 2 Reborn (2015) | 144 | 130 | 119 | 116 |
| Final Fantasy XV Benchmark (2018) | 126 | 74.1 | 55.7 | |
| X-Plane 11.11 (2018) | 102 | 90 | 75.6 | |
| Strange Brigade (2018) | 276 | 130 | 106 | 93.1 |
Emissions
Ruído do sistema
O ruído do ventilador está sempre presente quando conectado a uma tomada CA a 32 dB(A) contra um fundo de 28 dB(A) mesmo que o sistema esteja configurado para o modo Silencioso via Dragon Center. Só quando o adaptador AC é desconectado é que os ventiladores estarão realmente ociosos para uma experiência silenciosa. Adoraríamos ver isto mudado em futuras revisões, pois o modo "Silencioso" deve se comportar da mesma forma, não importando se o adaptador CA está conectado ou não.
Nos jogos, o ruído dos ventiladores pode variar de 41 a 46 dB(A), dependendo da carga da CPU. Por exemplo, o ruído do ventilador é estável a 41 dB(A) ao rodar Witcher 3 mas é mais alto ao rodar 3DMark 06 mesmo que Witcher 3 possa ser mais intensivo em GPU. Esta faixa é semelhante ao que gravamos no Dell XPS 15, sendo mais silencioso que o Envy 15.
Habilitando o modo Cooler Boost, o barulho do ventilador atingirá seu máximo de 56 dB(A), não importa a carga na tela. Este modo geralmente não é o minério necessário recomendado na maioria dos casos, incluindo jogos, pois não oferece quase nenhum aumento de desempenho - apenas temperaturas mais frias.
Não podemos notar nenhuma lamentação da bobina de nossa unidade de teste.
| MSI Stealth 15M A11SEK GeForce RTX 2060 Max-Q, i7-1185G7, WDC PC SN530 SDBPNPZ-1T00 | Dell XPS 15 9500 Core i7 4K UHD GeForce GTX 1650 Ti Mobile, i7-10875H, SK Hynix PC611 512GB | Lenovo ThinkPad T15p-20TN0006GE GeForce GTX 1050 Mobile, i7-10750H, WDC PC SN730 SDBQNTY-512GB | Asus ZenBook UX535-M01440 GeForce GTX 1650 Ti Max-Q, i7-10750H, WDC PC SN730 SDBPNTY-1T00 | MSI Prestige 15 A10SC GeForce GTX 1650 Max-Q, i7-10710U, Samsung SSD PM981 MZVLB1T0HALR | HP Envy 15-ep0098nr GeForce RTX 2060 Max-Q, i7-10750H, Intel Optane Memory H10 with Solid State Storage 32GB + 512GB HBRPEKNX0202A(L/H) | |
|---|---|---|---|---|---|---|
| Noise | 7% | 7% | 17% | 11% | -4% | |
| desligado / ambiente * (dB) | 27.5 | 28.4 -3% | 29.3 -7% | 24.6 11% | 29.3 -7% | 26.4 4% |
| Idle Minimum * (dB) | 32.3 | 28.4 12% | 29.3 9% | 24.6 24% | 30.1 7% | 32.2 -0% |
| Idle Average * (dB) | 32.3 | 28.4 12% | 29.3 9% | 24.6 24% | 30.2 7% | 32.2 -0% |
| Idle Maximum * (dB) | 33.7 | 28.4 16% | 30.6 9% | 24.6 27% | 30.2 10% | 32.2 4% |
| Load Average * (dB) | 46.3 | 46 1% | 42.7 8% | 41.3 11% | 31.5 32% | 48.3 -4% |
| Witcher 3 ultra * (dB) | 41.3 | 42 -2% | 42.7 -3% | 42 -2% | 37 10% | 53.7 -30% |
| Load Maximum * (dB) | 56.2 | 47.1 16% | 42.7 24% | 41.4 26% | 47 16% | 58.8 -5% |
* ... menor é melhor
Barulho
| Ocioso |
| 32.3 / 32.3 / 33.7 dB |
| Carga |
| 46.3 / 56.2 dB |
 | ||
30 dB silencioso 40 dB(A) audível 50 dB(A) ruidosamente alto |
||
min: | ||
Temperatura
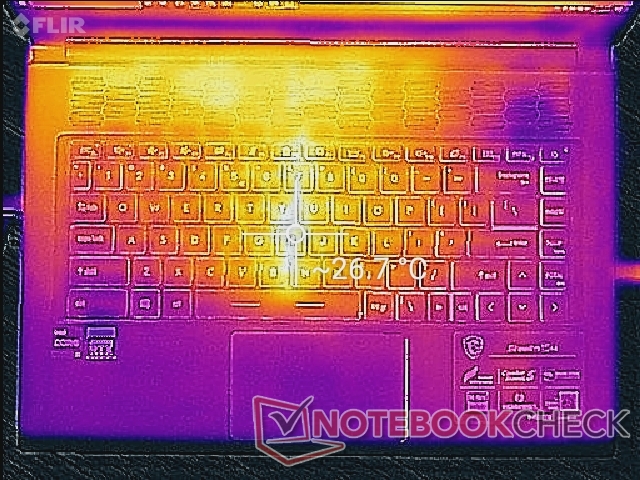
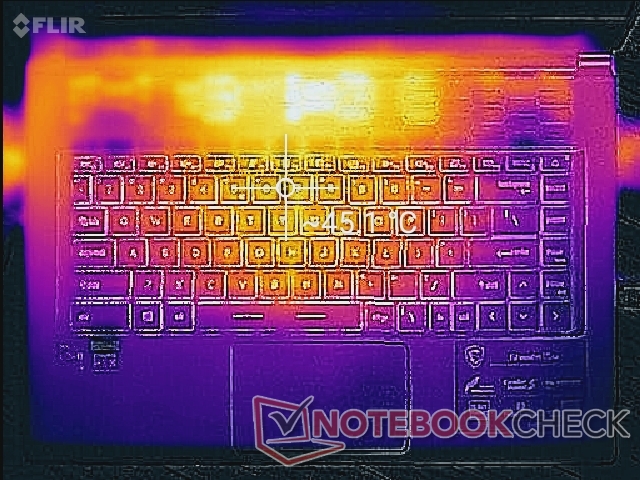
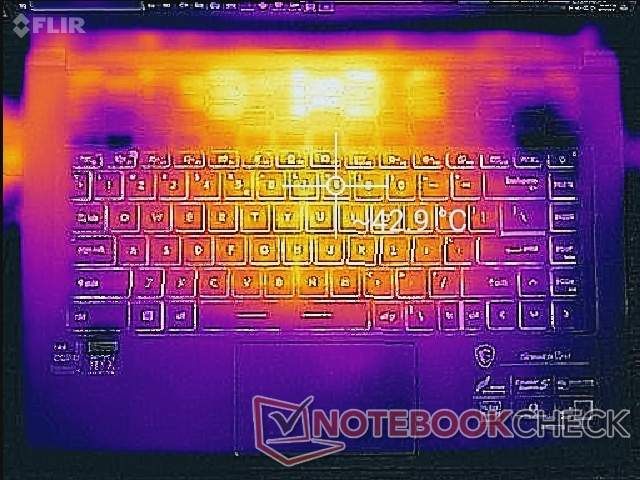
O desenvolvimento da temperatura superficial é em grande parte simétrico. O ponto quente no centro do teclado pode ser tão quente quanto 43 C a 45 C quando se corre com cargas exigentes como jogos para ser semelhante ao que observamos no GS66 , mas ainda mais frio que no XPS 15 e no Lenovo ThinkPad T15p. Assim, o MSI é capaz de oferecer um desempenho gráfico mais rápido do que seus concorrentes sem necessariamente rodar mais quente.
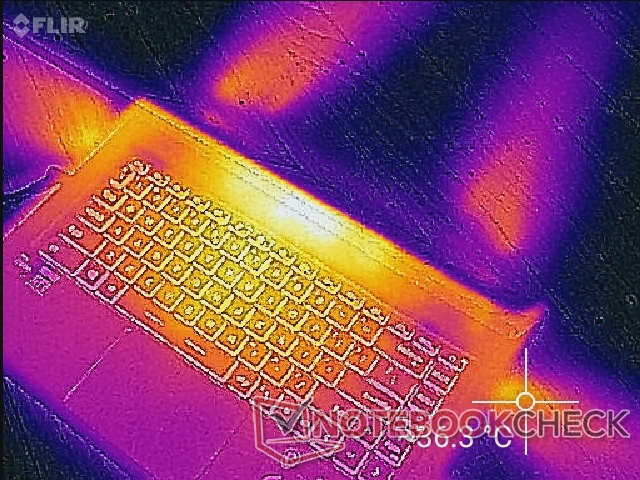
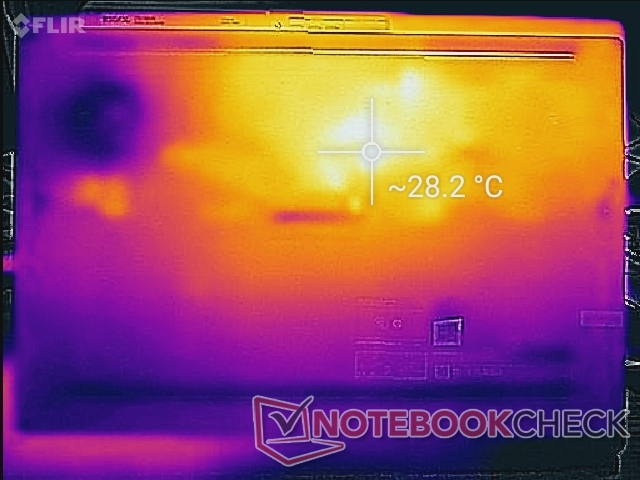
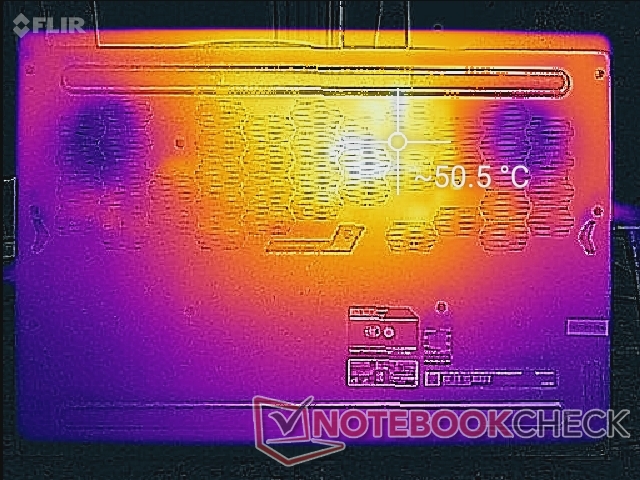
(-) A temperatura máxima no lado superior é 47.2 °C / 117 F, em comparação com a média de 36.8 °C / 98 F , variando de 21 a 71 °C para a classe Multimedia.
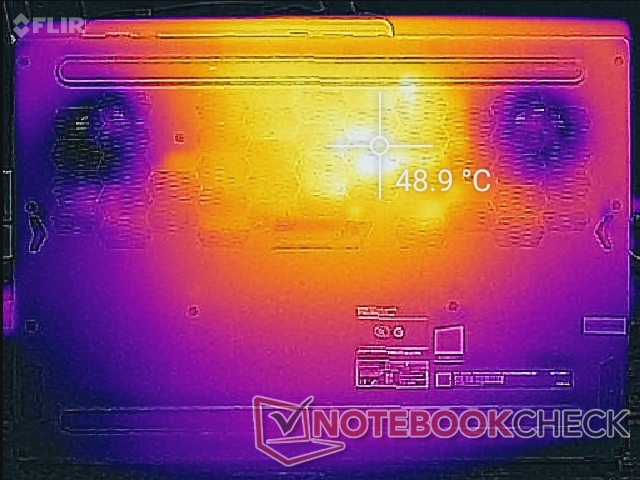
(-) A parte inferior aquece até um máximo de 47.4 °C / 117 F, em comparação com a média de 39.1 °C / 102 F
(+) Em uso inativo, a temperatura média para o lado superior é 22.6 °C / 73 F, em comparação com a média do dispositivo de 31.3 °C / ### class_avg_f### F.
(±) Jogando The Witcher 3, a temperatura média para o lado superior é 34.4 °C / 94 F, em comparação com a média do dispositivo de 31.3 °C / ## #class_avg_f### F.
(+) Os apoios para as mãos e o touchpad são mais frios que a temperatura da pele, com um máximo de 26.8 °C / 80.2 F e, portanto, são frios ao toque.
(±) A temperatura média da área do apoio para as mãos de dispositivos semelhantes foi 28.7 °C / 83.7 F (+1.9 °C / 3.5 F).
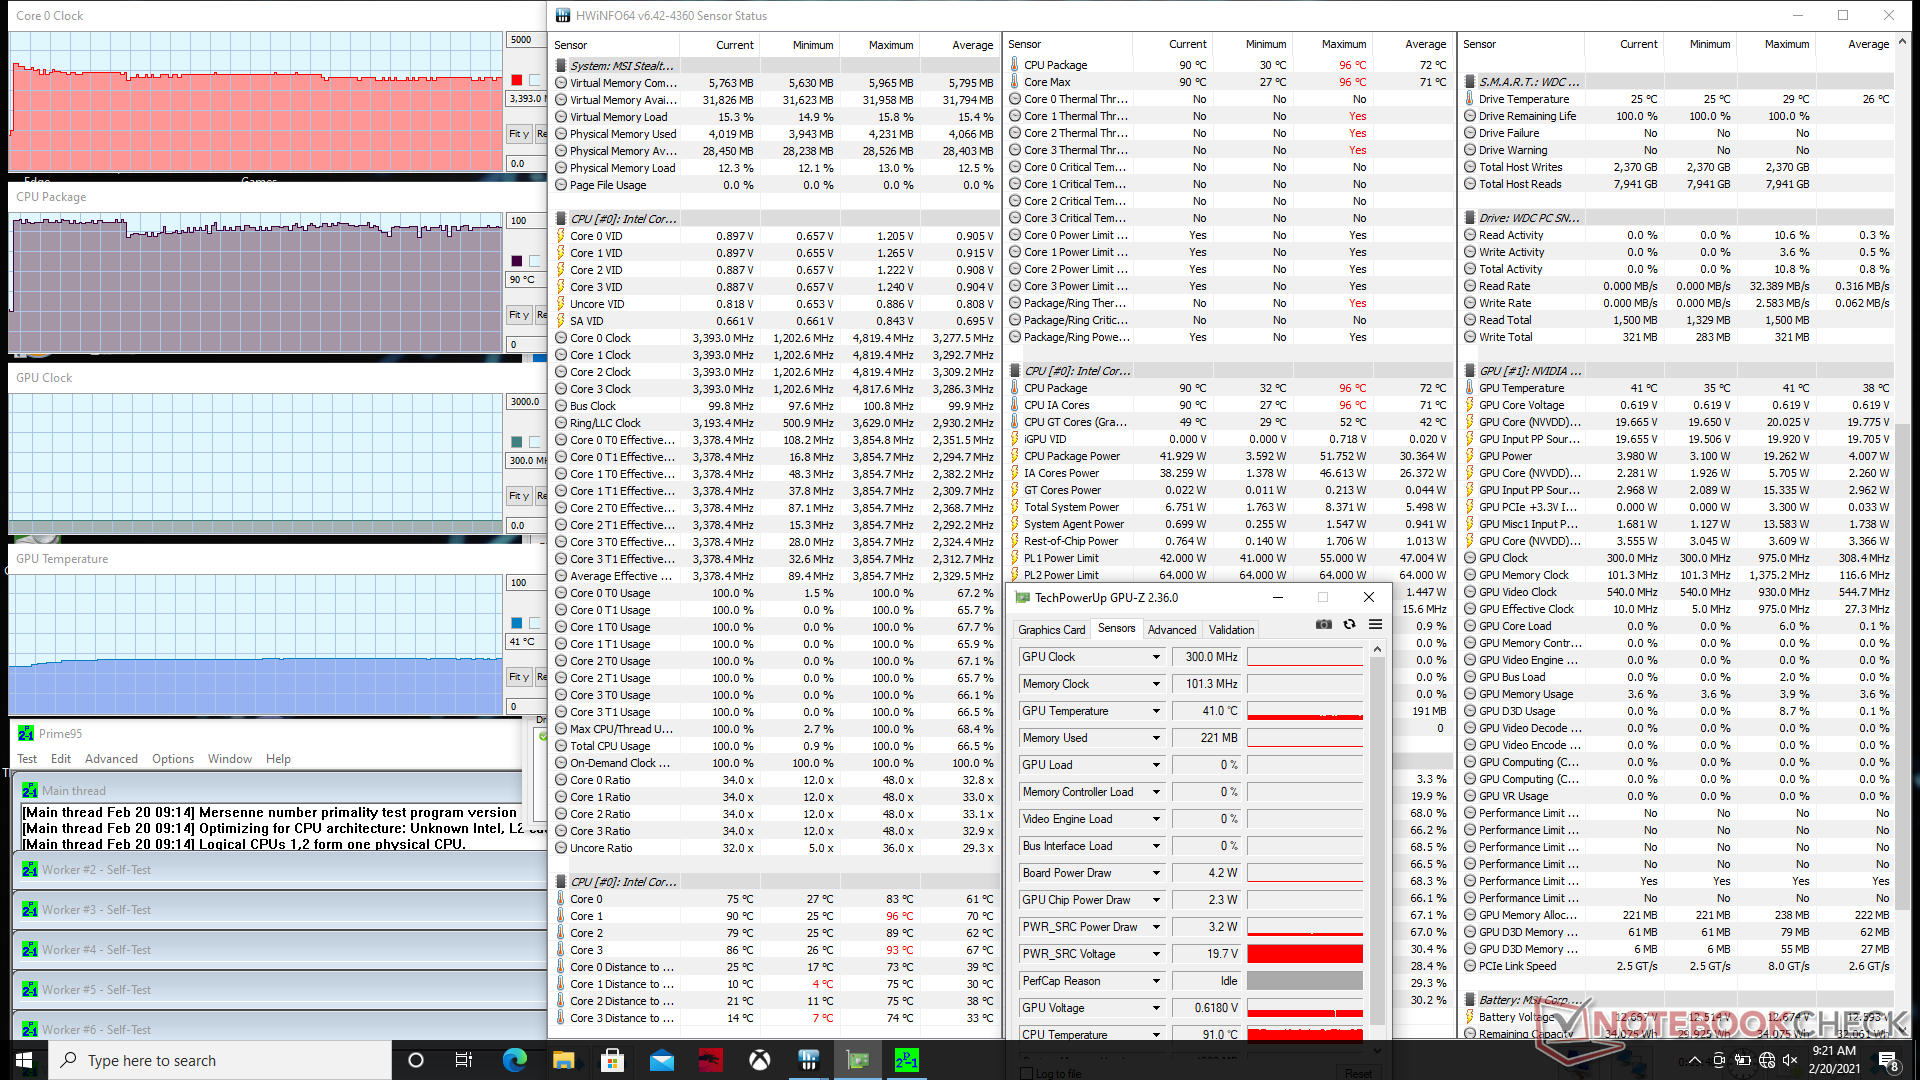
Teste de estresse
Quando estressado com Prime95, as taxas de relógio da CPU aumentariam para 3,9 GHz durante os primeiros segundos antes de cair para 3,5 GHz. O processador eventualmente estabilizaria na faixa de 3,3 a 3,4 GHz e a uma temperatura central de 90 C. A ativação do Cooler Boost faria quase a diferença.
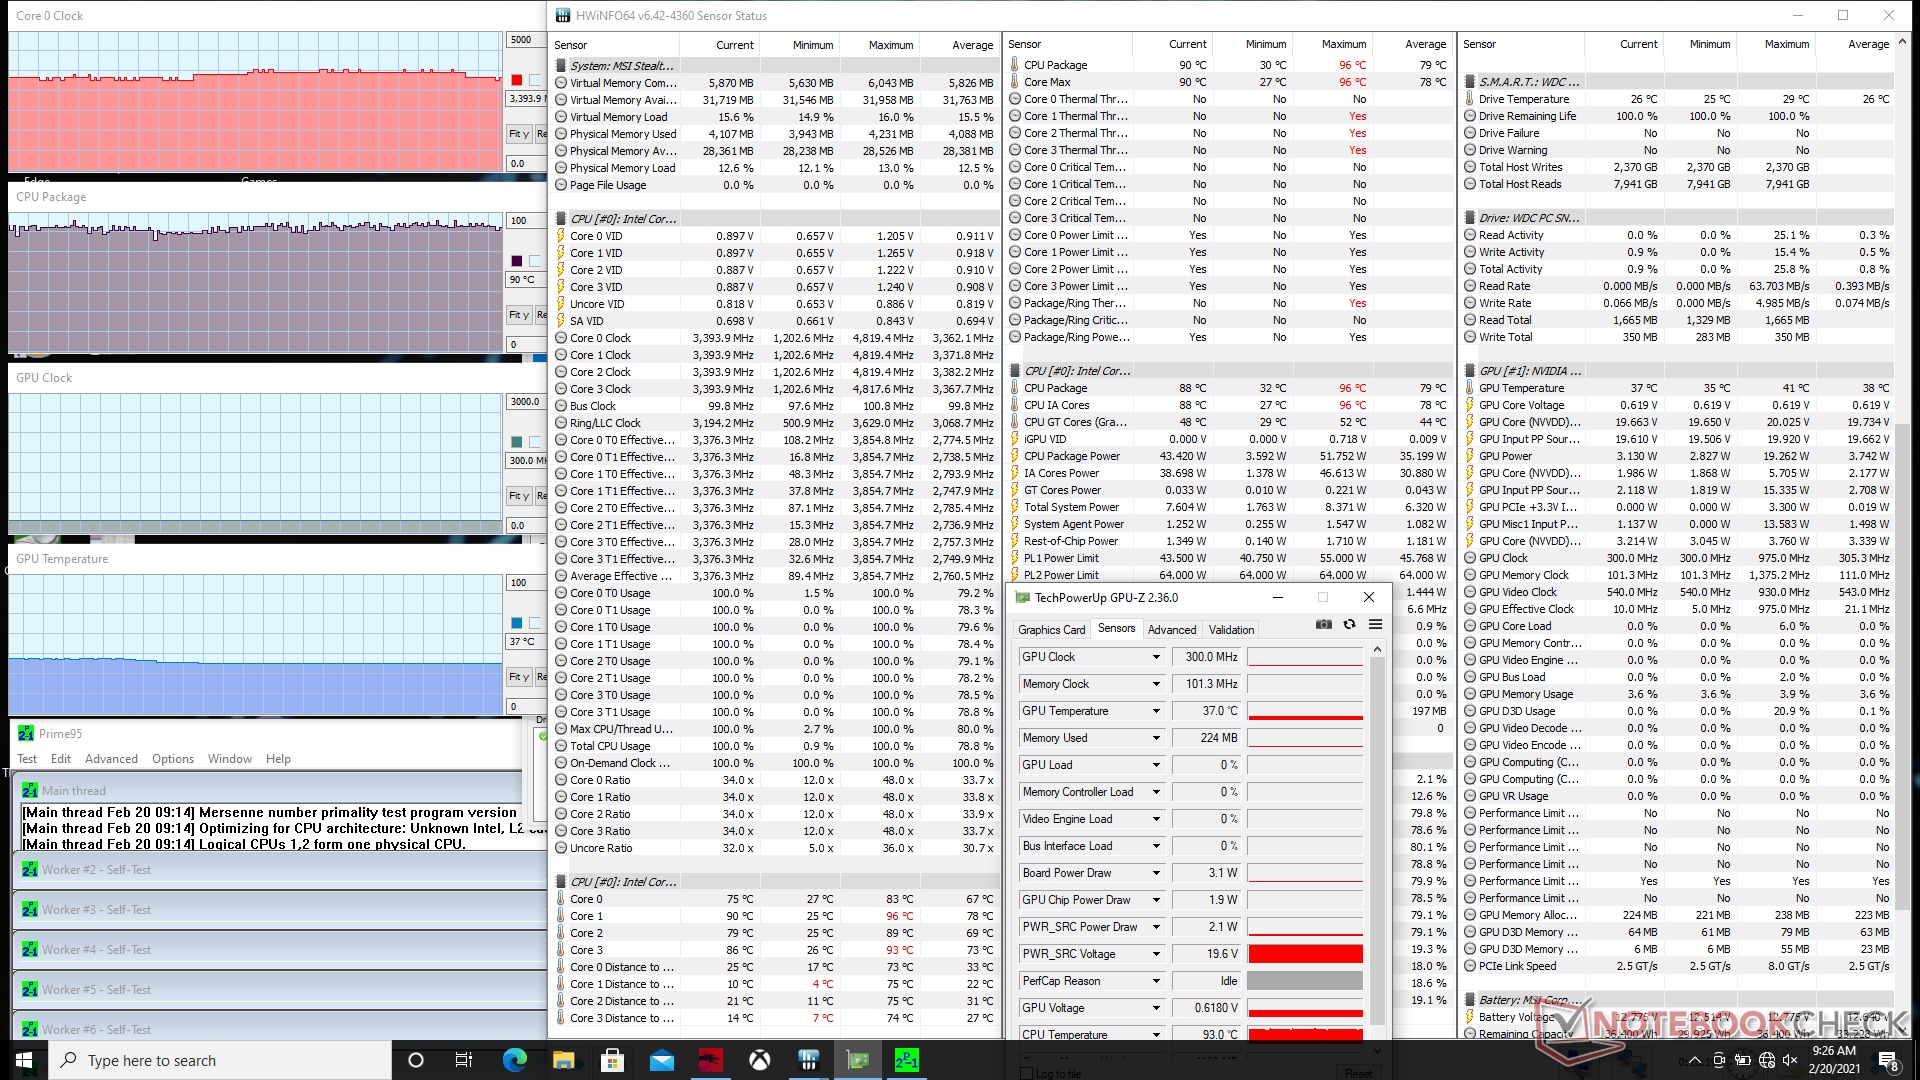
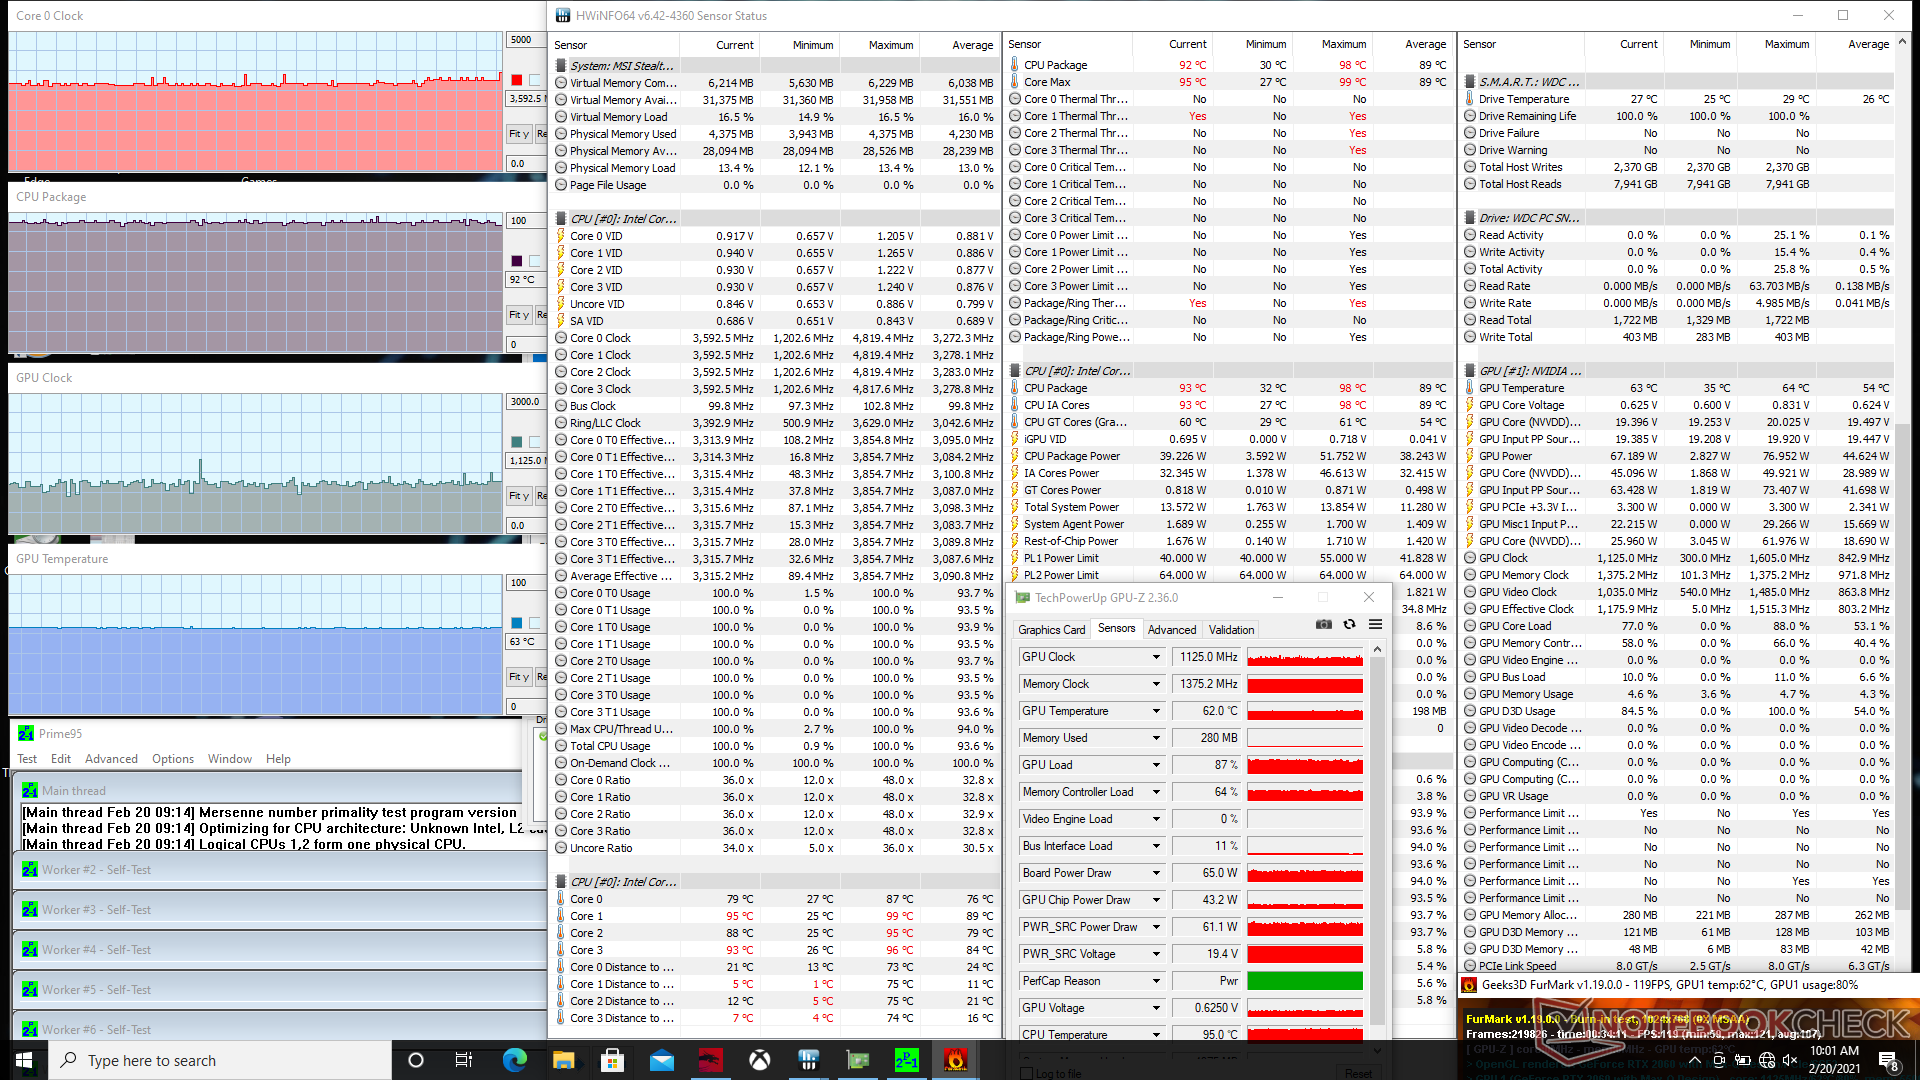
Quando estressado com Prime95 e FurMark simultaneamente, as temperaturas da CPU e GPU se estabilizariam em 83 C e 70 C, respectivamente. Curiosamente, permitir o Cooler Boost impulsionaria as taxas de relógio da CPU de 2,6 GHz para 3,3 GHz enquanto aumentava a temperatura central para 92 C. Inversamente, a temperatura da GPU cairia de 70 C para 63 C.
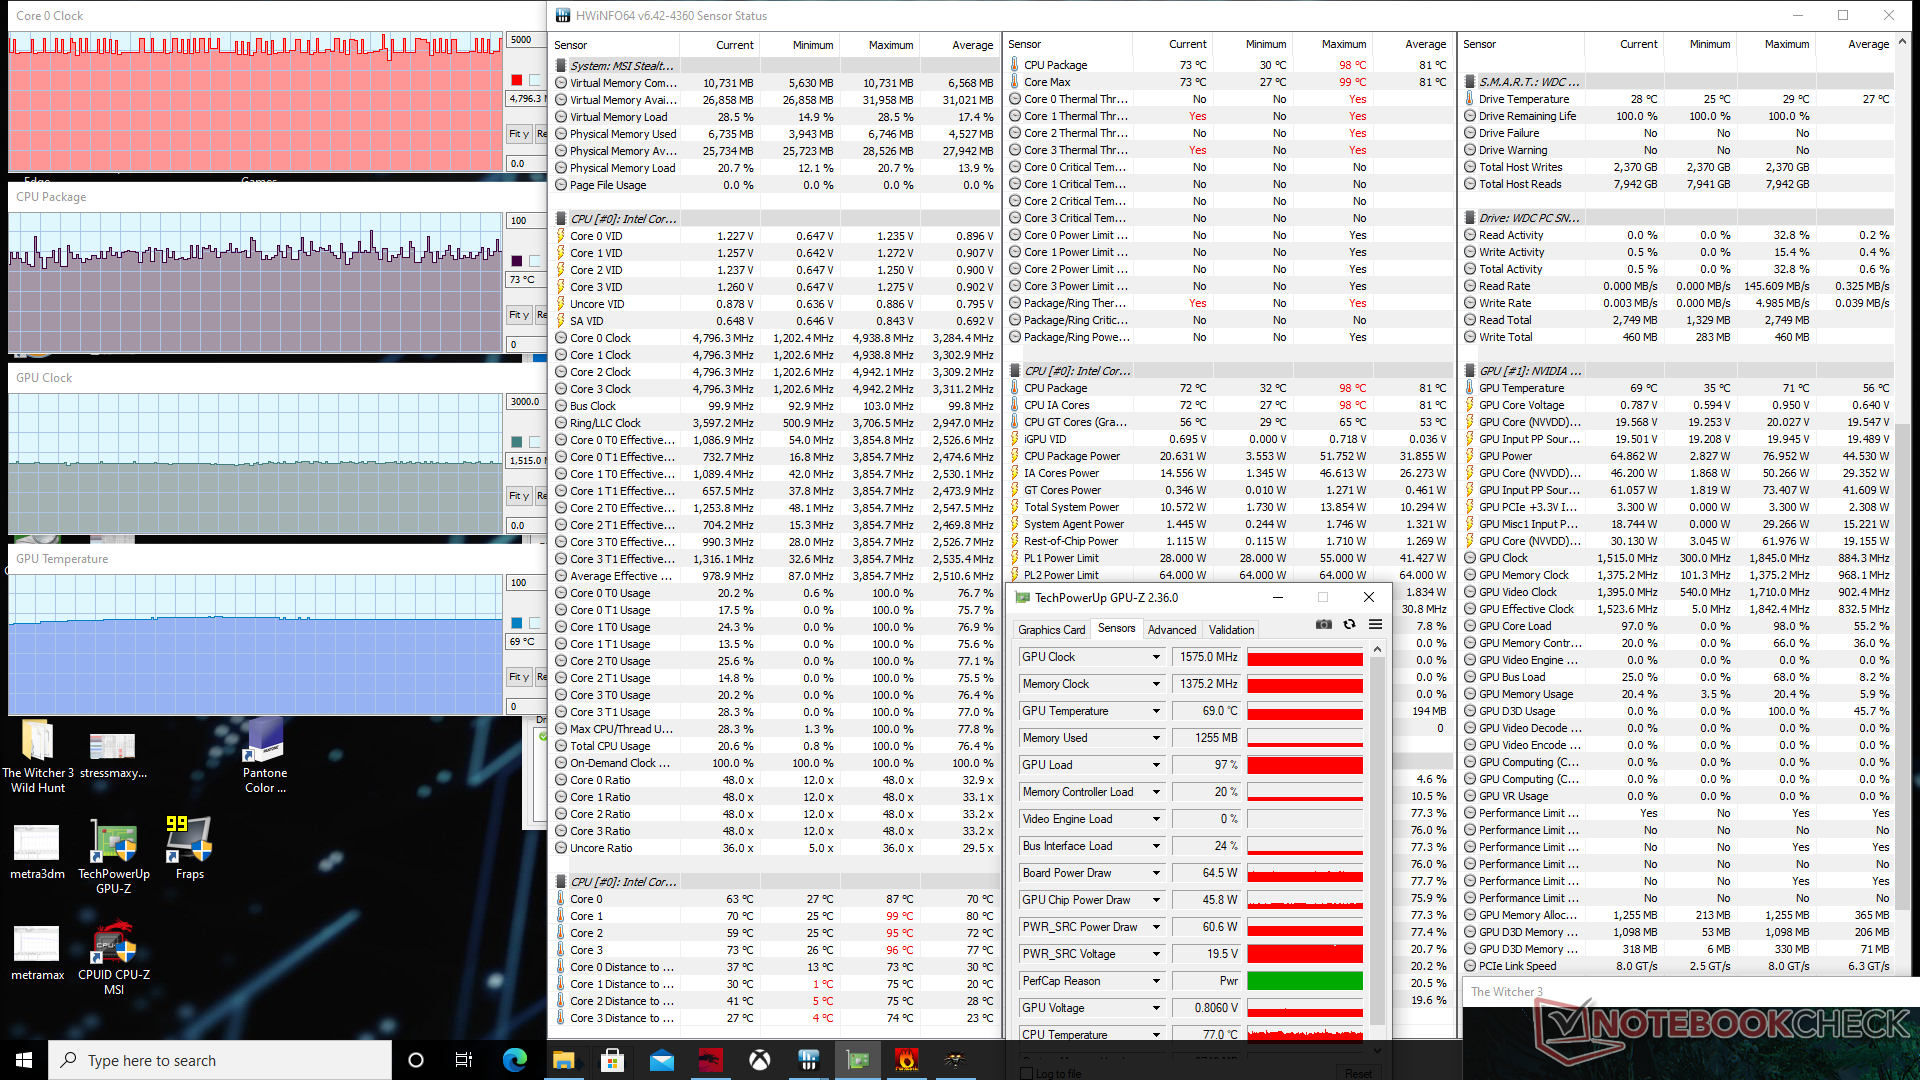
Rodando Witcher 3 faz com que as temperaturas de CPU e GPU se estabilizem em 73 C e 69 C, respectivamente. A ativação do Turbo Boost reduziria significativamente suas temperaturas centrais para apenas 53 C e 58 C. As taxas de relógio, entretanto, permanecem essencialmente inalteradas. O consumo de energia da placa GPU permanece estável em pouco menos de 65 W.
O funcionamento com baterias limitará o desempenho. Um Fire Strike rodando com energia de bateria retornaria pontuações de Física e Gráficos de 12781 e 4423 pontos, respectivamente, em comparação com 14164 e 14129 pontos quando em rede elétrica.

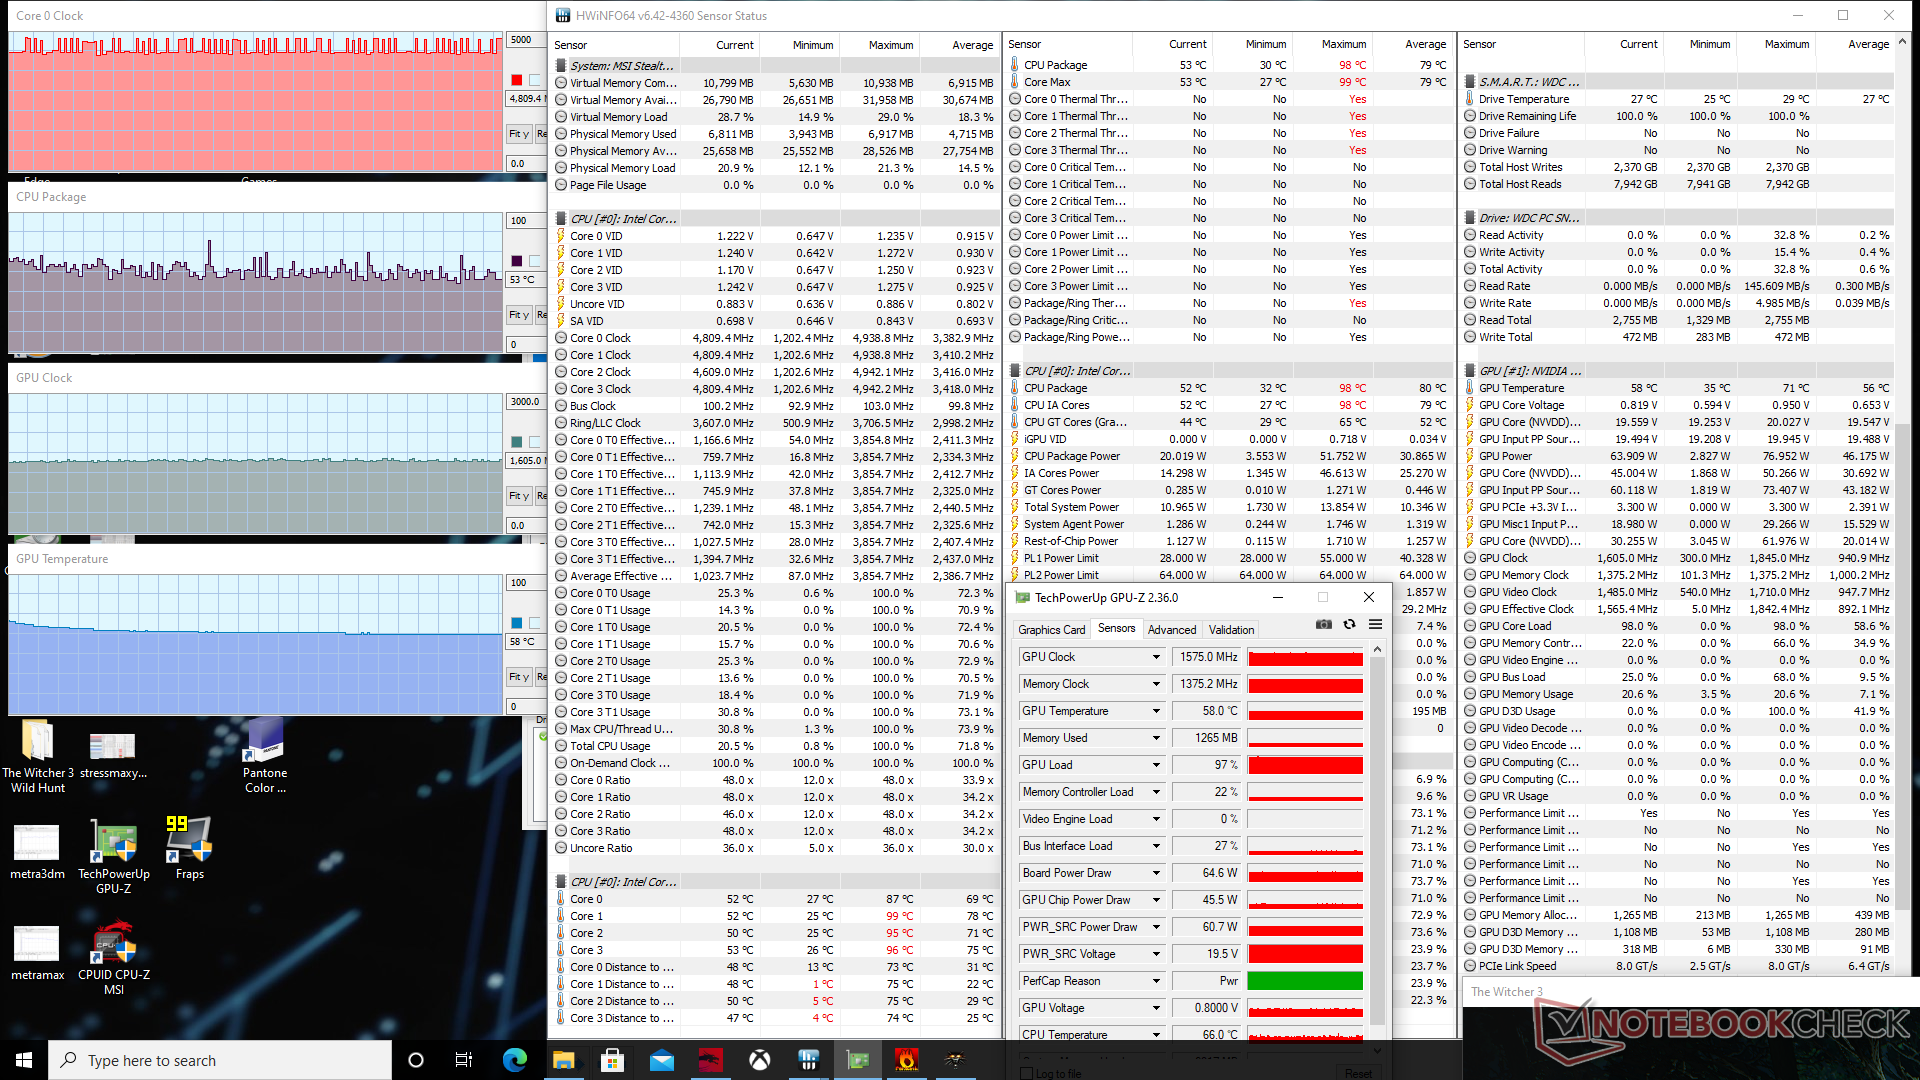
| RelógioCPU (GHz) | RelógioGPU (MHz) | Temperaturamédiada CPU (°C) | Temperaturamédiada GPU (°C) | |
| System Idle | -- | --32 | 35 | |
| Prime95 Stress (Turbo desligado) | 3.3 - 3.4 | -90 | 41 | |
| Prime95 Stress (Turbo on) | 3.3 - 3.6 | --90 | 37 | |
| Prime95 + FurMark Stress (Turbo off) | 2.6 - 2.7 | 1050 | 83 | 70 |
| Prime95 + FurMark Stress (Turbo on) | 3.3 - 3.5 | 1125 | 92 | 63 |
| Witcher 3 Stress (Turbo off) | 4.4 - 4.8 | 1575 | 73 | 69 |
| Witcher 3 Stress (Turbo on) | 4.4 - 4.8 | 1575 | 53 | 58 |
Oradores


MSI Stealth 15M A11SEK análise de áudio
(+) | os alto-falantes podem tocar relativamente alto (###valor### dB)
Graves 100 - 315Hz
(-) | quase nenhum baixo - em média 18.9% menor que a mediana
(±) | a linearidade dos graves é média (9.8% delta para a frequência anterior)
Médios 400 - 2.000 Hz
(+) | médios equilibrados - apenas 4.6% longe da mediana
(+) | médios são lineares (4.4% delta para frequência anterior)
Altos 2 - 16 kHz
(+) | agudos equilibrados - apenas 3.2% longe da mediana
(+) | os máximos são lineares (3.7% delta da frequência anterior)
Geral 100 - 16.000 Hz
(±) | a linearidade do som geral é média (17.6% diferença em relação à mediana)
Comparado com a mesma classe
» 50% de todos os dispositivos testados nesta classe foram melhores, 7% semelhantes, 43% piores
» O melhor teve um delta de 5%, a média foi 17%, o pior foi 45%
Comparado com todos os dispositivos testados
» 35% de todos os dispositivos testados foram melhores, 8% semelhantes, 57% piores
» O melhor teve um delta de 4%, a média foi 23%, o pior foi 134%
Apple MacBook 12 (Early 2016) 1.1 GHz análise de áudio
(+) | os alto-falantes podem tocar relativamente alto (###valor### dB)
Graves 100 - 315Hz
(±) | graves reduzidos - em média 11.3% menor que a mediana
(±) | a linearidade dos graves é média (14.2% delta para a frequência anterior)
Médios 400 - 2.000 Hz
(+) | médios equilibrados - apenas 2.4% longe da mediana
(+) | médios são lineares (5.5% delta para frequência anterior)
Altos 2 - 16 kHz
(+) | agudos equilibrados - apenas 2% longe da mediana
(+) | os máximos são lineares (4.5% delta da frequência anterior)
Geral 100 - 16.000 Hz
(+) | o som geral é linear (10.2% diferença em relação à mediana)
Comparado com a mesma classe
» 7% de todos os dispositivos testados nesta classe foram melhores, 2% semelhantes, 90% piores
» O melhor teve um delta de 5%, a média foi 18%, o pior foi 53%
Comparado com todos os dispositivos testados
» 5% de todos os dispositivos testados foram melhores, 1% semelhantes, 94% piores
» O melhor teve um delta de 4%, a média foi 23%, o pior foi 134%
Energy Management
Consumo de energia
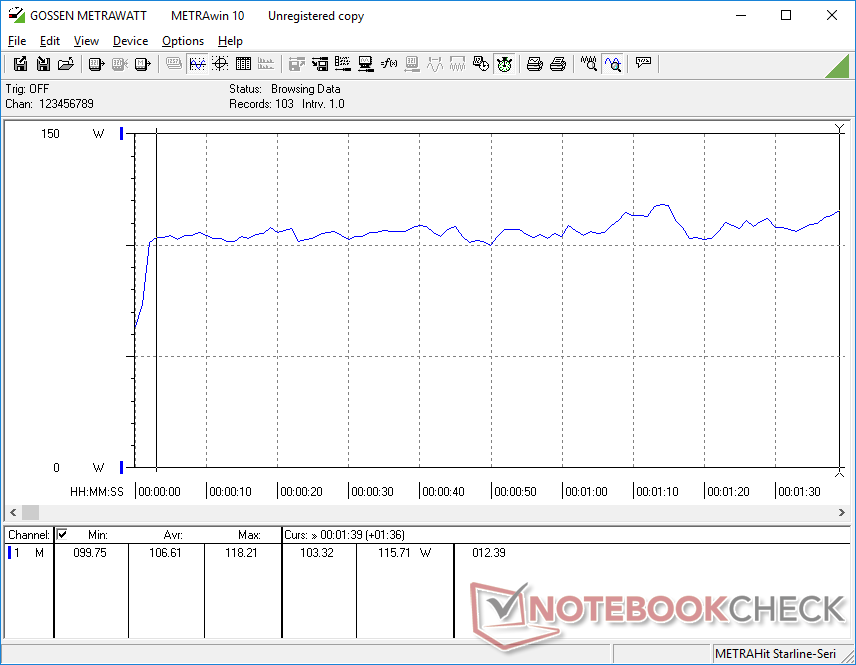
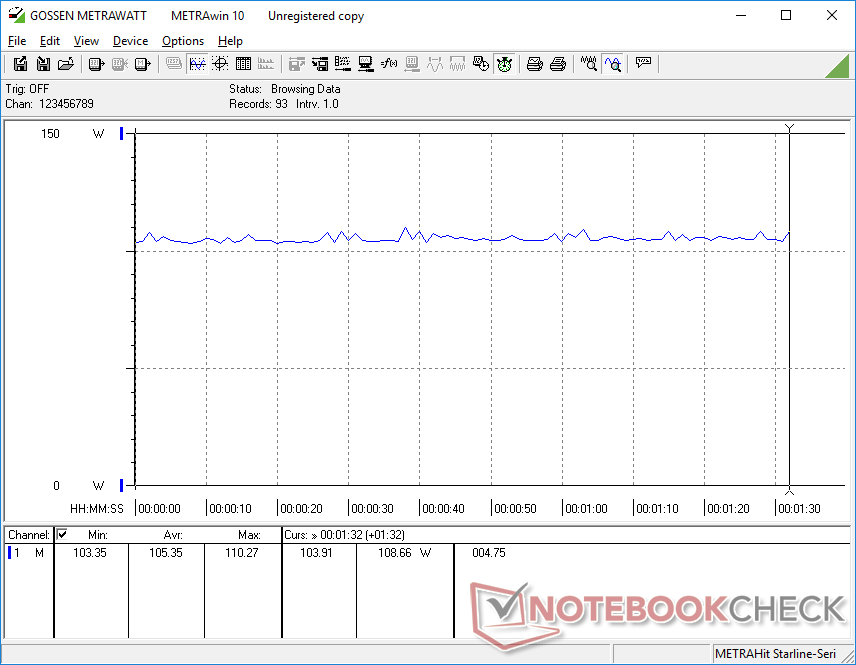
A manipulação na área de trabalho consome apenas 7 W quando na configuração de brilho mais baixa e no perfil de economia de energia e 18 W quando na luminosidade máxima e no perfil de alto desempenho. Rodando Witcher 3 consome cerca de 105 W para ser muito mais alto do que a maioria dos Ultrabooks da série Core U e até mesmo alguns laptops de nível básico como a Lenovo Legion 5 devido a nossa GeForce RTX GPU. Os proprietários da MSI estão obtendo cerca de 70% de desempenho gráfico superior ao do Dell XPS 15 9500 para um aumento de 13% no consumo de energia.
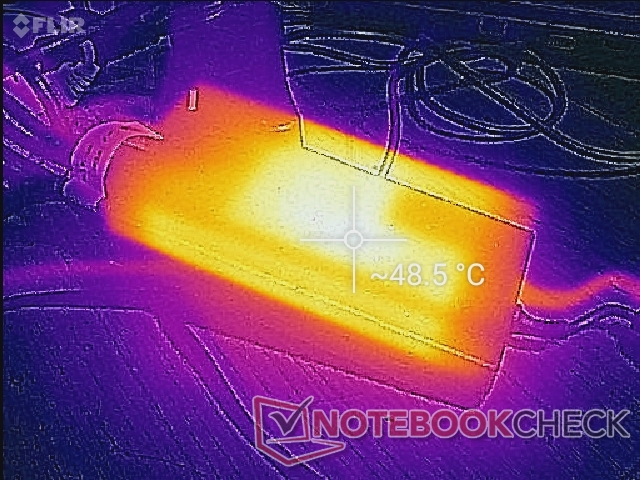
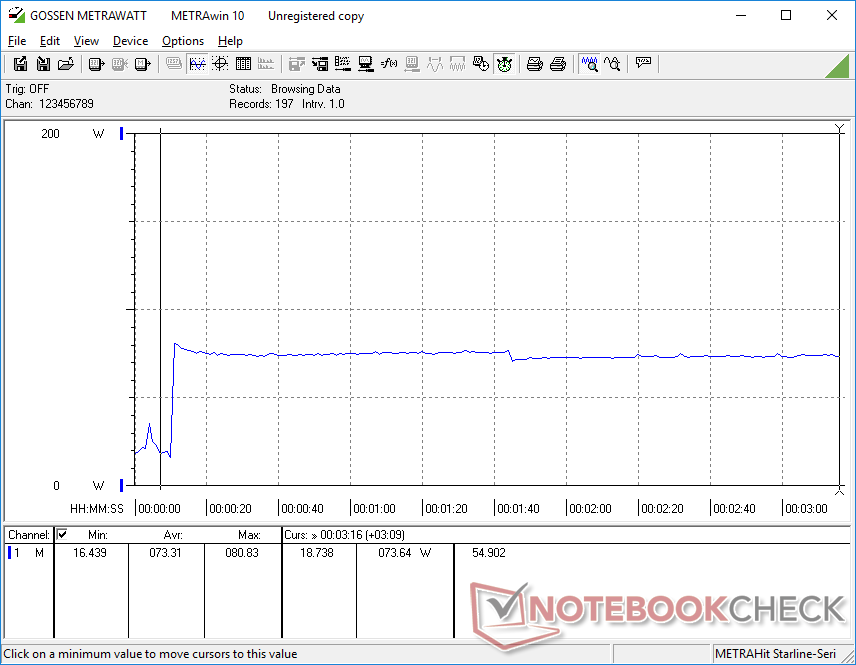
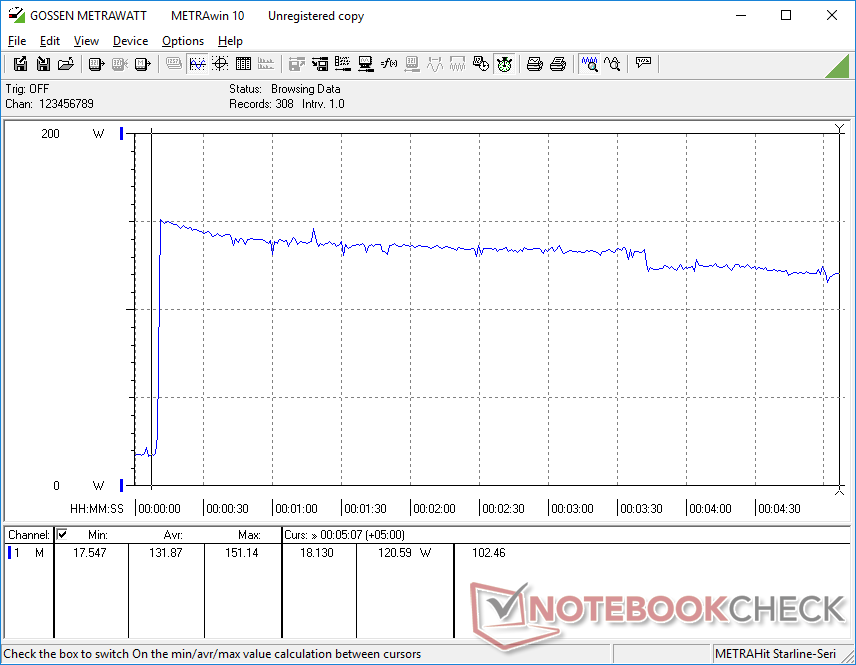
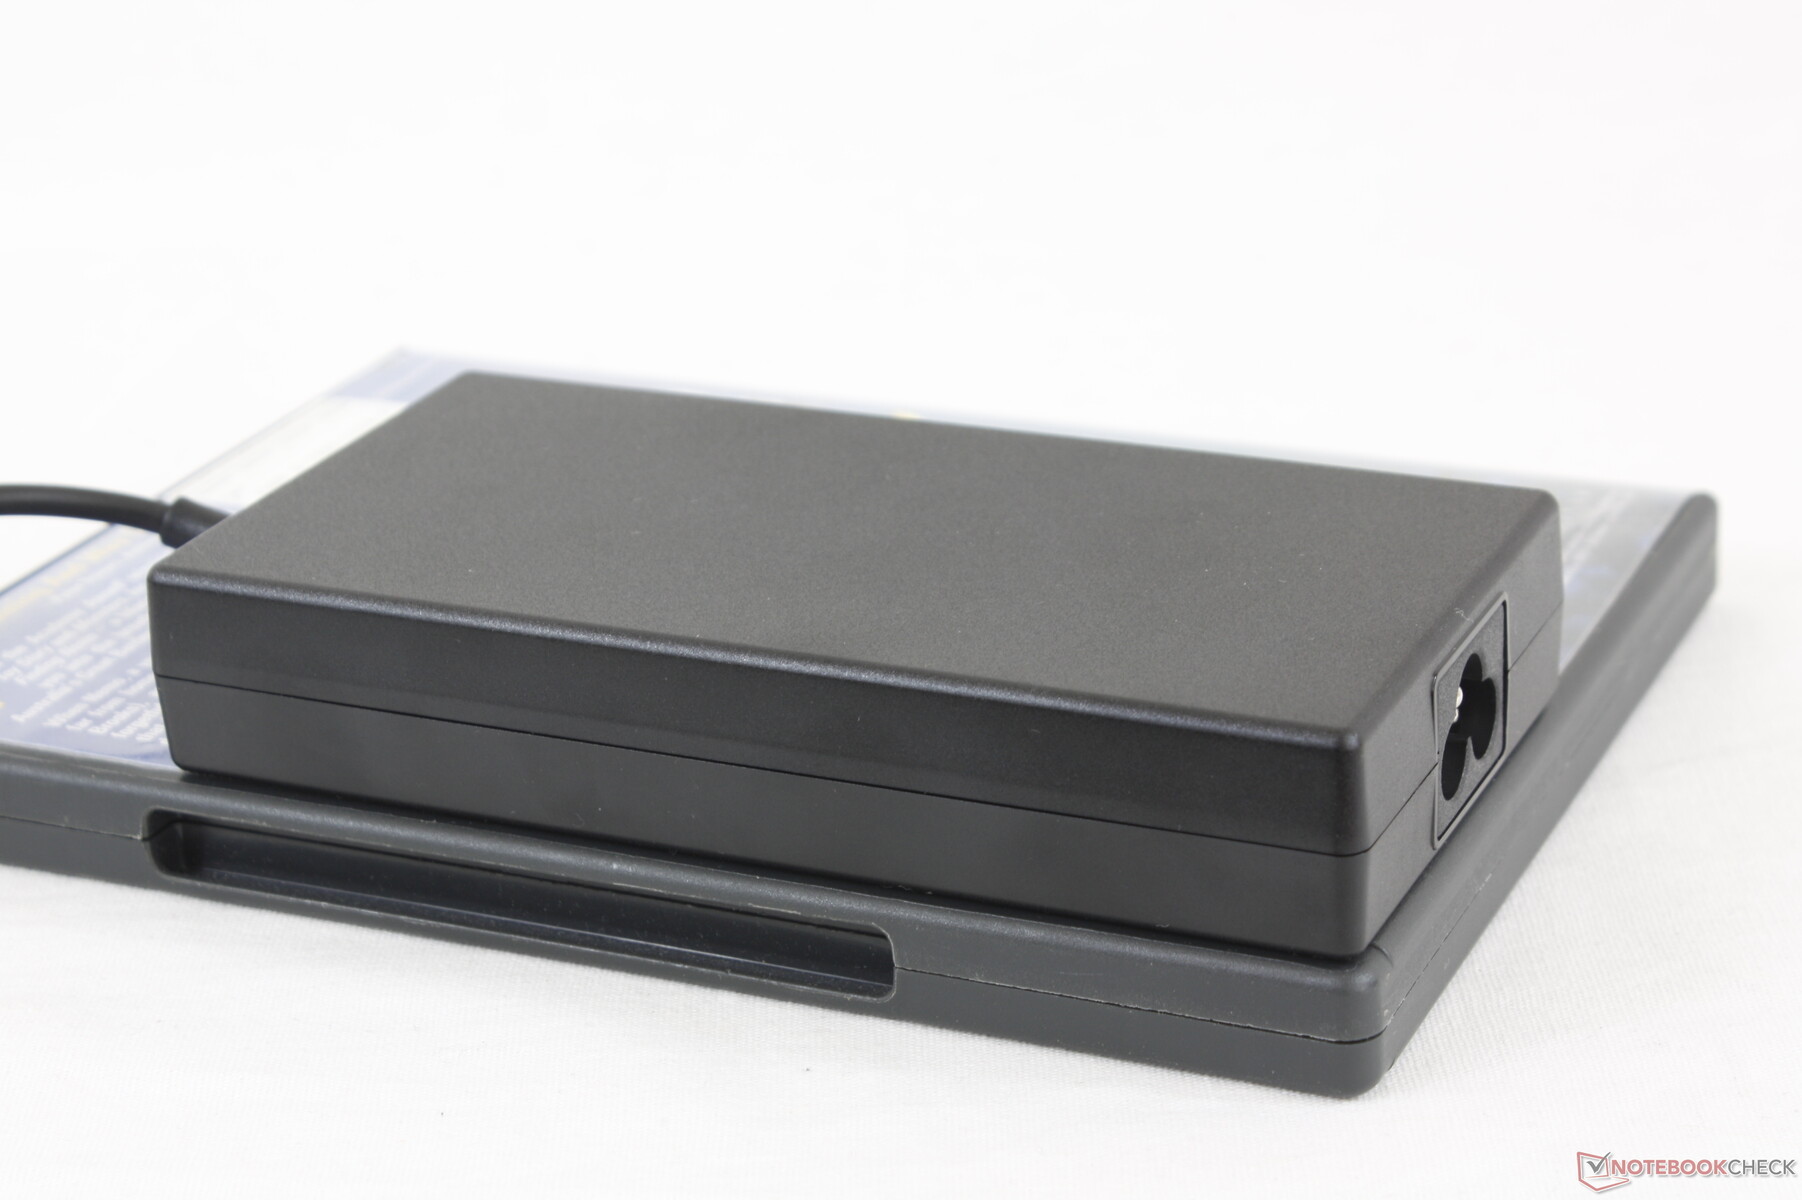
Somos capazes de medir um consumo máximo de 151 W a partir do pequeno-médio (13,6 x 6,8 x 1,9 cm) adaptador CA de 150 W ao executar simultaneamente Prime95 e FurMark. Esta taxa eventualmente cai e se estabiliza em torno de 120 W, como mostra nosso gráfico abaixo devido às limitações térmicas.
| desligado | |
| Ocioso | |
| Carga |
|
Key:
min: | |
| MSI Stealth 15M A11SEK i7-1185G7, GeForce RTX 2060 Max-Q, WDC PC SN530 SDBPNPZ-1T00, IPS, 1920x1080, 15.6" | Dell XPS 15 9500 Core i7 4K UHD i7-10875H, GeForce GTX 1650 Ti Mobile, SK Hynix PC611 512GB, IPS, 3840x2400, 15.6" | Lenovo ThinkPad T15p-20TN0006GE i7-10750H, GeForce GTX 1050 Mobile, WDC PC SN730 SDBQNTY-512GB, IPS LED, 3840x2160, 15.6" | Asus ZenBook UX535-M01440 i7-10750H, GeForce GTX 1650 Ti Max-Q, WDC PC SN730 SDBPNTY-1T00, IPS, 3840x2160, 15.6" | HP Envy 15-ep0098nr i7-10750H, GeForce RTX 2060 Max-Q, Intel Optane Memory H10 with Solid State Storage 32GB + 512GB HBRPEKNX0202A(L/H), AMOLED, 3840x2160, 15.6" | |
|---|---|---|---|---|---|
| Power Consumption | -1% | 7% | 23% | -21% | |
| Idle Minimum * (Watt) | 7.3 | 5.7 22% | 6 18% | 4.4 40% | 9.2 -26% |
| Idle Average * (Watt) | 10.1 | 13.5 -34% | 12.8 -27% | 9.8 3% | 14.5 -44% |
| Idle Maximum * (Watt) | 17.6 | 19.6 -11% | 16.1 9% | 14.5 18% | 18 -2% |
| Load Average * (Watt) | 106.6 | 114.1 -7% | 95.6 10% | 83 22% | 110.9 -4% |
| Witcher 3 ultra * (Watt) | 105.4 | 93 12% | 84 20% | 67 36% | 125.5 -19% |
| Load Maximum * (Watt) | 151.2 | 135.2 11% | 131.1 13% | 123 19% | 194.6 -29% |
* ... menor é melhor
Vida útil da bateria
Os tempos de funcionamento são em média de pouco mais de 6 horas de uso da WLAN no mundo real, a partir da pequena bateria interna de 52 Wh. O XPS 15 concorrente pode durar quase 3 horas mais quando em condições de teste semelhantes. A carga de vazio a cheio, no entanto, é relativamente rápida em apenas 1 a 1,5 horas. Adaptadores genéricos USB-C também podem ser usados para recarregar o sistema, embora a uma velocidade mais lenta.
| MSI Stealth 15M A11SEK i7-1185G7, GeForce RTX 2060 Max-Q, 52 Wh | Dell XPS 15 9500 Core i7 4K UHD i7-10875H, GeForce GTX 1650 Ti Mobile, 86 Wh | Lenovo ThinkPad T15p-20TN0006GE i7-10750H, GeForce GTX 1050 Mobile, 68 Wh | Asus ZenBook UX535-M01440 i7-10750H, GeForce GTX 1650 Ti Max-Q, 96 Wh | MSI Prestige 15 A10SC i7-10710U, GeForce GTX 1650 Max-Q, 82 Wh | HP Envy 15-ep0098nr i7-10750H, GeForce RTX 2060 Max-Q, 83 Wh | |
|---|---|---|---|---|---|---|
| Duração da bateria | 88% | 13% | 78% | 71% | 33% | |
| Reader / Idle (h) | 10.5 | 23 119% | 18.3 74% | 19.1 82% | 15 43% | |
| WiFi v1.3 (h) | 6.3 | 9.1 44% | 7.3 16% | 10.1 60% | 7.6 21% | 6 -5% |
| Load (h) | 1 | 2 100% | 1.1 10% | 2 100% | 2.1 110% | 1.6 60% |
Pro
Contra
Veredicto
O Stealth 15M tem algumas coisas a seu favor quando comparado com outros Ultrabooks ultra-finos de 15,6 polegadas. Suas opções GeForce RTX impulsionam instantaneamente o sistema para um dos mais rápidos em sua categoria quando se trata de gráficos. Ele também consegue ser mais leve do que seus concorrentes, apesar do desempenho superior da GPU. As temperaturas e o ruído do ventilador quando sob carga também não são tão mais quentes ou mais altos.
Super leve e super rápido. O Stealth 15M pode superar a maioria dos laptops multimídia em sua classe de tamanho, mas também é mais frágil e propenso a danos com o tempo.
Os maiores inconvenientes para o sistema são difíceis de ignorar. Em particular, o chassi ou esqueleto é muito mais propenso a empenar, dobrar e ranger do que os esqueletos dos laptops XPS 15, Spectre, ZenBook ou Yoga, que custam aproximadamente o mesmo que nossos MSI. Isto inclui também as dobradiças que são muito fracas no MSI. É um laptop de ótima aparência com desempenho de nível de jogo, mas a qualidade de construção frágil nos preocupa com sua longevidade.
Preço e disponibilidade
MSI Stealth 15M A11SEK
- 02/24/2021 v7 (old)
Allen Ngo
Price comparison

