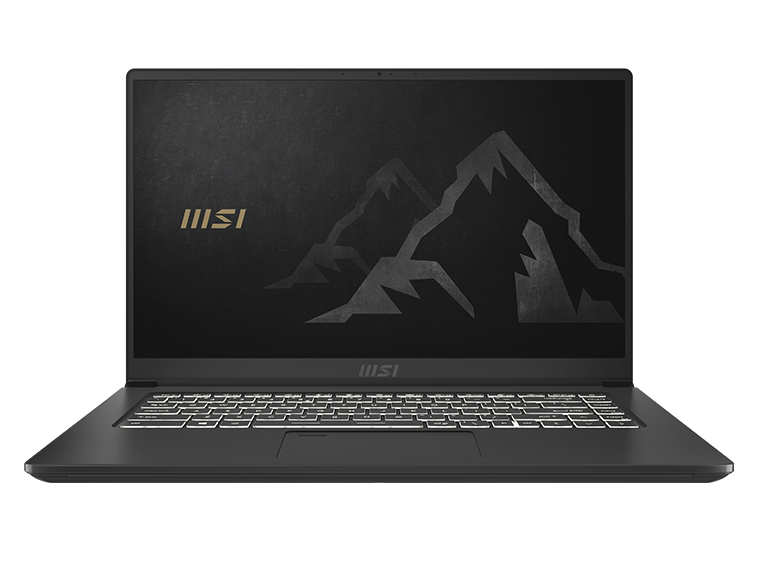
MSI Summit B15 A11M Revisão de Laptop: Abraçando a Iris Xe Over GeForce MX
A MSI revelou sua série Summit no CES 2021 que abrange uma gama de laptops projetados para locais de trabalho, escritórios, criação de conteúdo e outros ambientes semi-profissionais a profissionais. Os modelos top de linha incluem os de 13,4 polegadas Cúpula E13 e 15,6 polegadas Cúpula E15 cada venda a varejo por cerca de US$ 2.000,00.
O modelo que analisaremos aqui é um modelo de nível básico da série chamada Summit B15. Ao contrário dos modelos Summit E acima mencionados, o B15 não tem as guarnições douradas e opções de GPU discretas para um ponto de preço mais leve e acessível. Caso contrário, ele vem equipado com opções de processador similares da 11ª geração Tiger Lake-U. Os concorrentes diretos incluem outros laptops prosumer de gama média a média superior, como o HP Envy 15, XPG Xenia Xe, Lenovo ThinkBook 15, Microsoft Superfície Laptop 4ou o LG Gram série.
Mais revisões da MSI:
potential competitors in comparison
Avaliação | Data | Modelo | Peso | Altura | Size | Resolução | Preço |
|---|---|---|---|---|---|---|---|
| 81.2 % v7 (old) | 05/2021 | MSI Summit B15 A11M i7-1165G7, Iris Xe G7 96EUs | 1.5 kg | 16.9 mm | 15.60" | 1920x1080 | |
| 83.7 % v7 (old) | 02/2021 | MSI Summit E15 A11SCST i7-1185G7, GeForce GTX 1650 Ti Max-Q | 1.8 kg | 16.9 mm | 15.60" | 1920x1080 | |
| 86.8 % v7 (old) | 06/2020 | Dell XPS 15 9500 Core i5 i5-10300H, UHD Graphics 630 | 1.8 kg | 18 mm | 15.60" | 1920x1200 | |
| 85 % v7 (old) | 01/2020 | HP Spectre X360 15-5ZV31AV i7-10510U, GeForce MX250 | 2.1 kg | 19.3 mm | 15.60" | 3840x2160 | |
| 87.5 % v7 (old) | 05/2021 | ADATA XPG Xenia Xe i7-1165G7, Iris Xe G7 96EUs | 1.7 kg | 14.9 mm | 15.60" | 1920x1080 | |
| 85.2 % v7 (old) | 03/2020 | Asus ZenBook 15 UX534FTC-A8190T i7-10510U, GeForce GTX 1650 Max-Q | 1.6 kg | 18.9 mm | 15.60" | 1920x1080 |
Caso
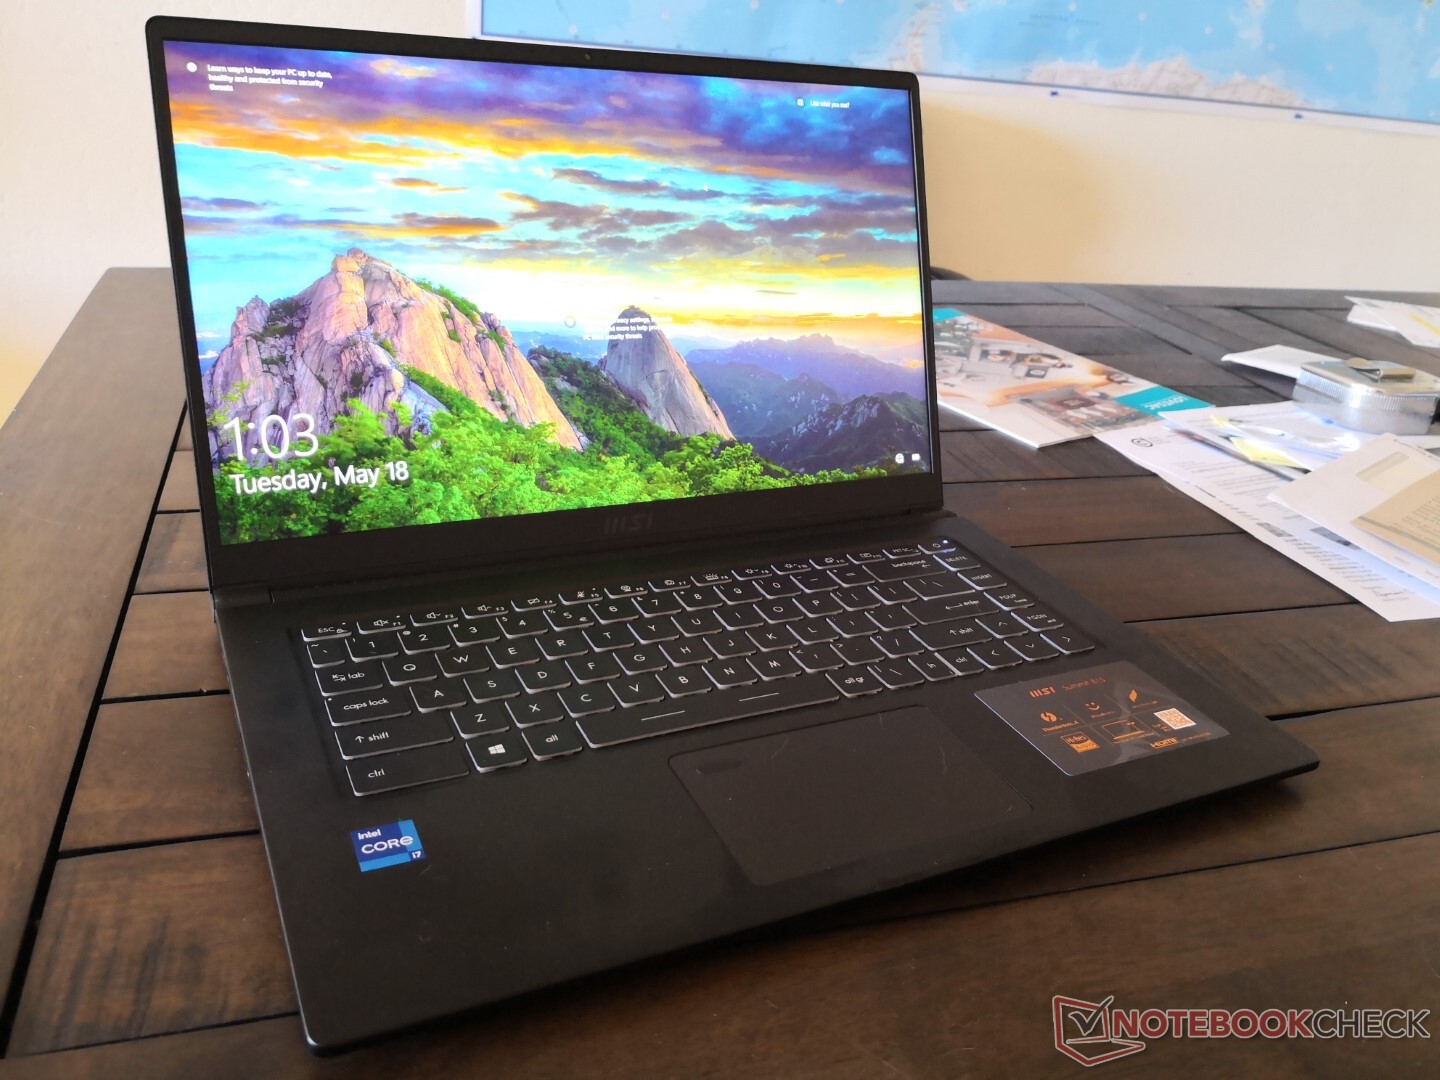
Se a Cúpula B15 parece familiar, então isso é porque é essencialmente uma marca rebranded 2020 Moderno 15 com um novo logotipo 'MSI' dourado na tampa externa. Seus chassis e características são quase idênticos aos 15 modernos, incluindo até mesmo a placa-mãe no interior. A MSI está atualmente em meio à remodelação de seu portfólio de laptops e, portanto, tanto as séries Modernas e Prestige envelhecidas acabarão se consolidando sob a nova série Summit num futuro próximo. A mudança deverá eventualmente facilitar aos clientes a distinção entre os diferentes laptops MSI, pois a empresa já tem um nome de modelo a mais para manter sob controle
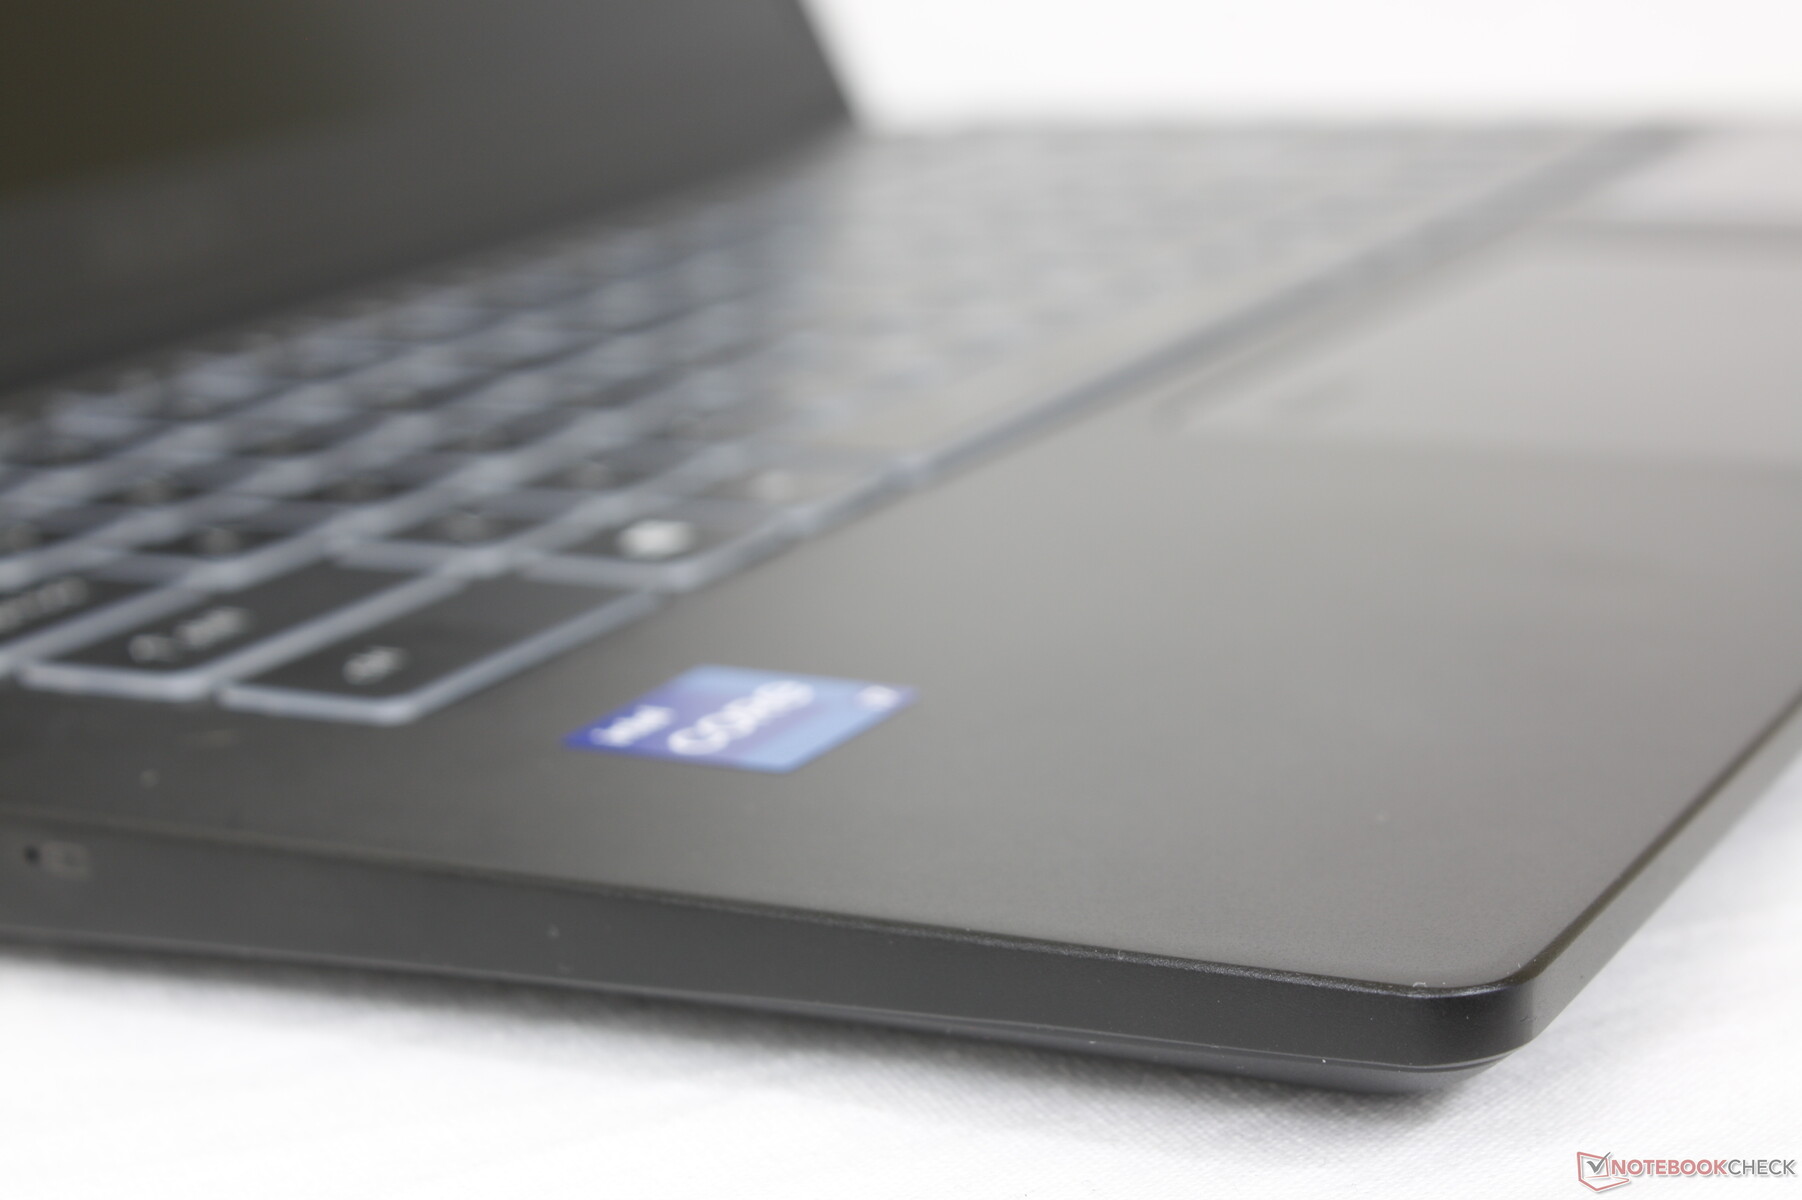
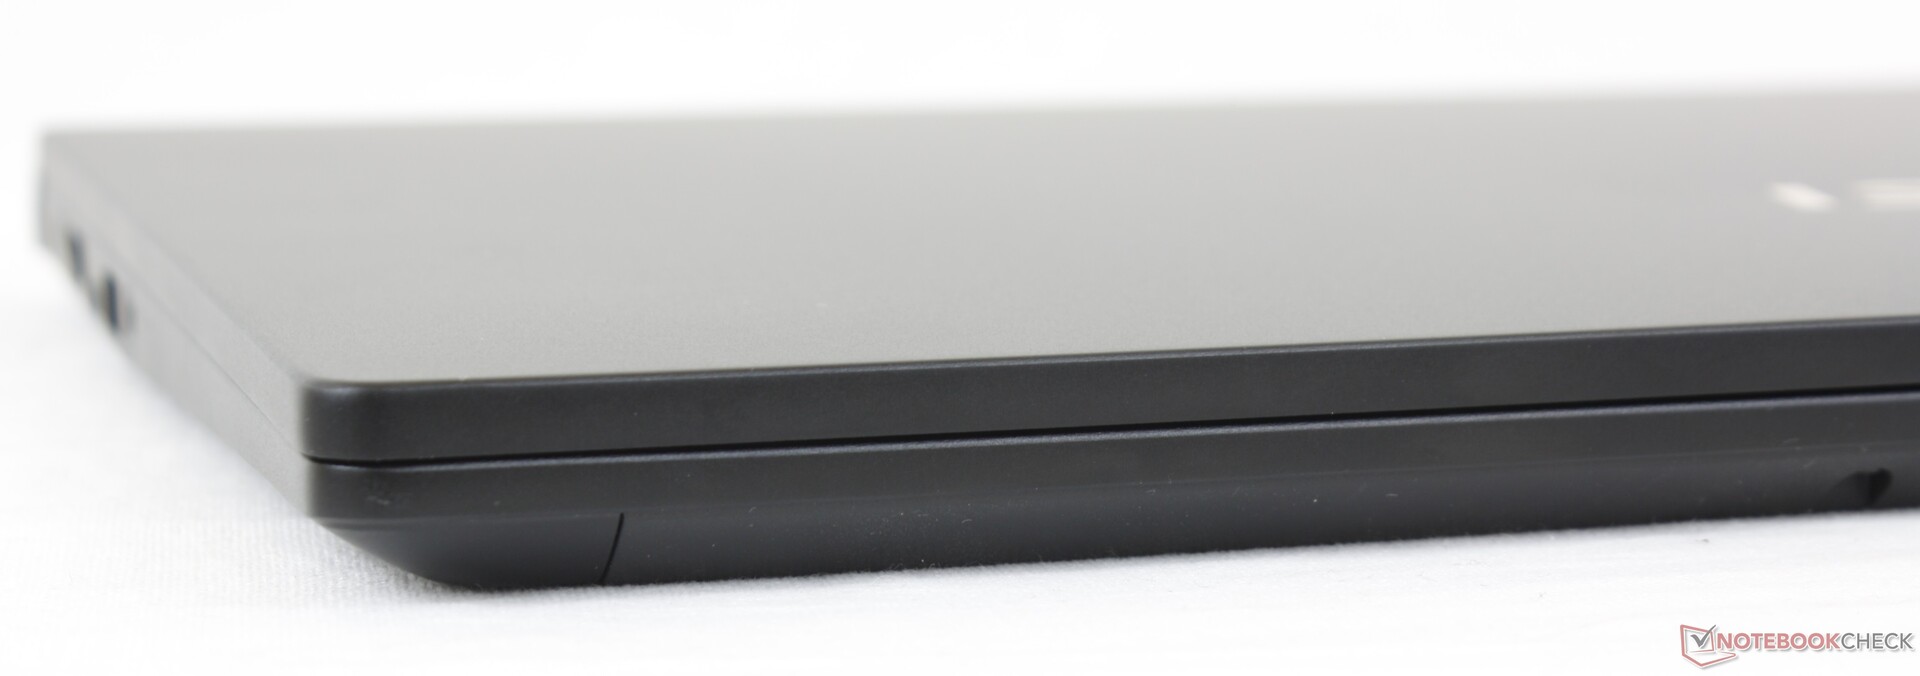
Nossas impressões originais sobre o Modern 15 do ano passado se aplicam aqui no Summit B15. A rigidez da base ainda é muito boa enquanto a tampa ainda flexiona um pouco mais do que gostaríamos. Laptops comerciais completos como o Dell Latitude, HP EliteBook, ou Lenovo ThinkPad são definitivamente mais caros, mas são de qualidade mais forte.
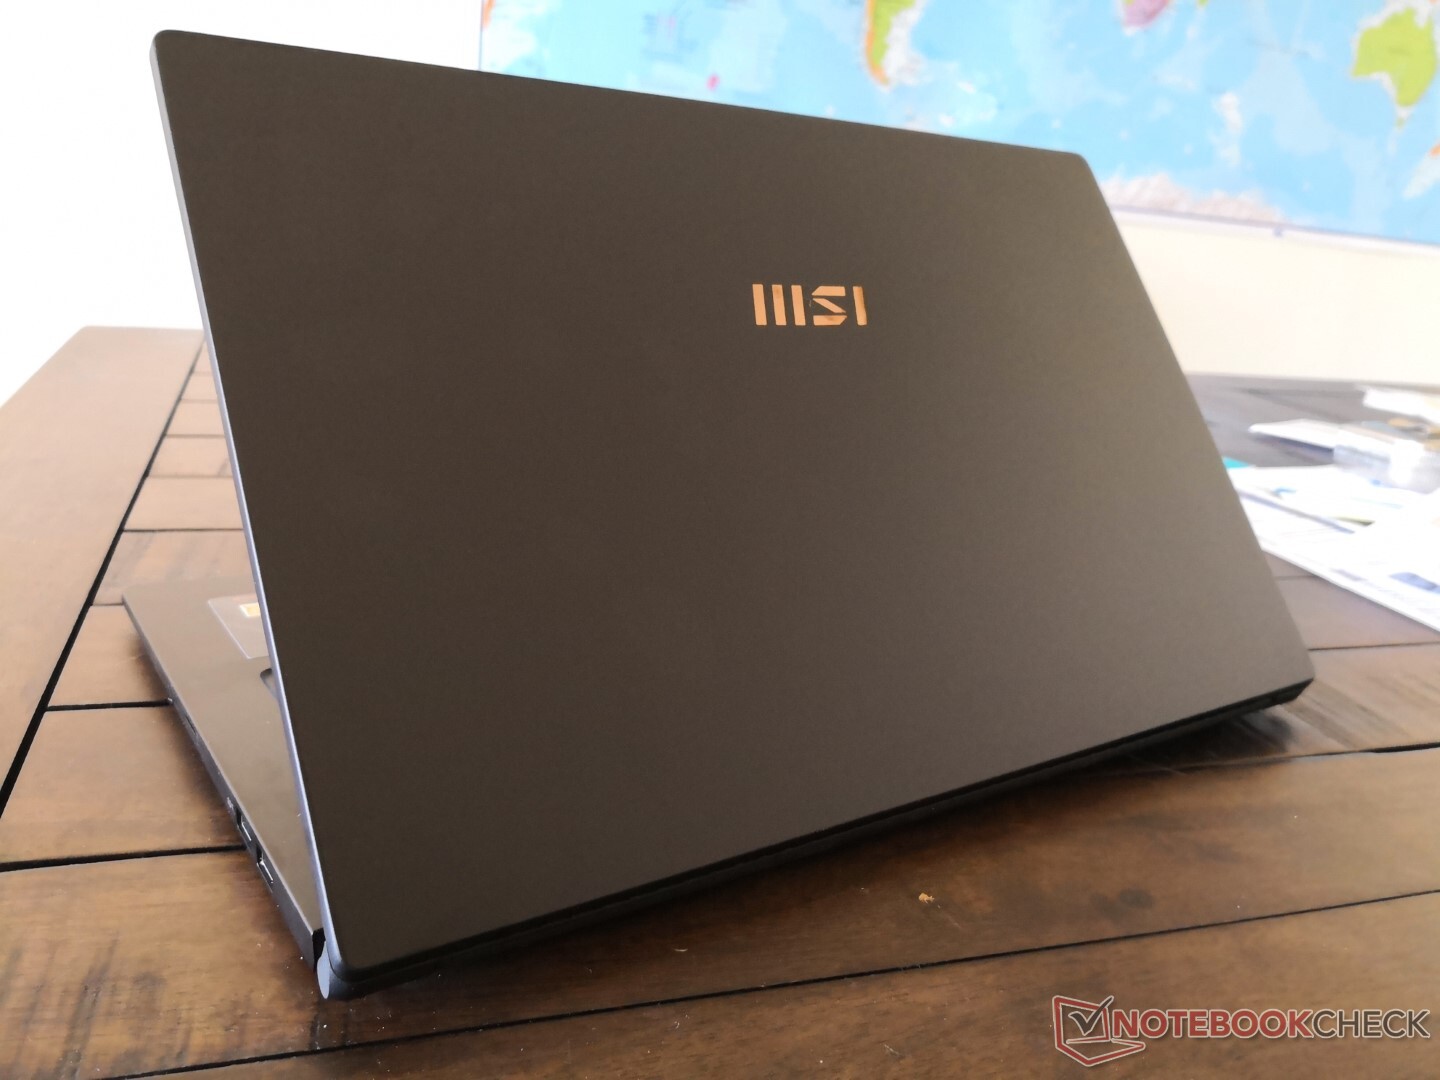
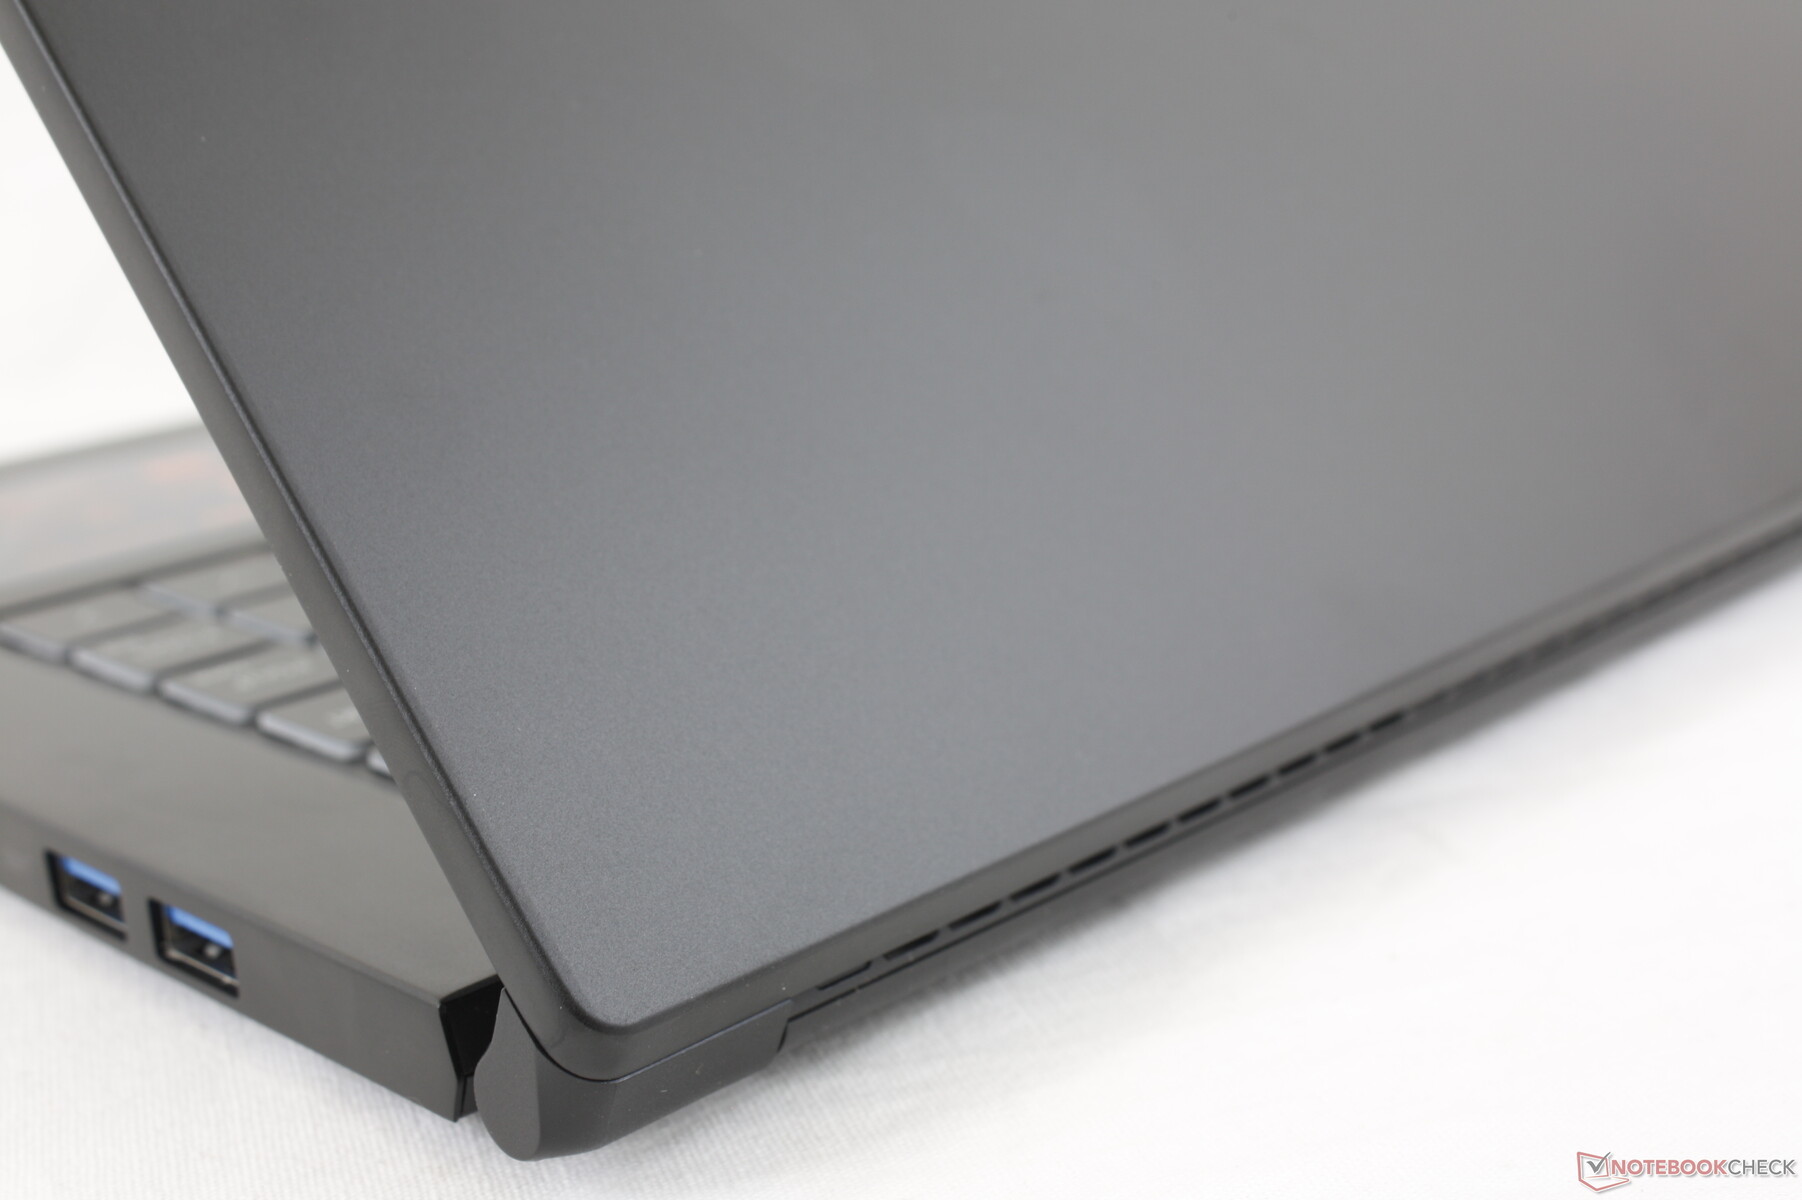
Uma razão chave para escolher a Cúpula B15 (ou Modern 15) em vez de alternativas da Dell, HP ou outras é seu peso muito leve de apenas 1,5 kg. Os concorrentes Lenovo ThinkBook 15 G2 ou ADATA XPG Xenia Xe são cada uma cerca de 200 gramas mais pesadas em comparação, ao mesmo tempo em que são quase idênticas em dimensões.
Conectividade
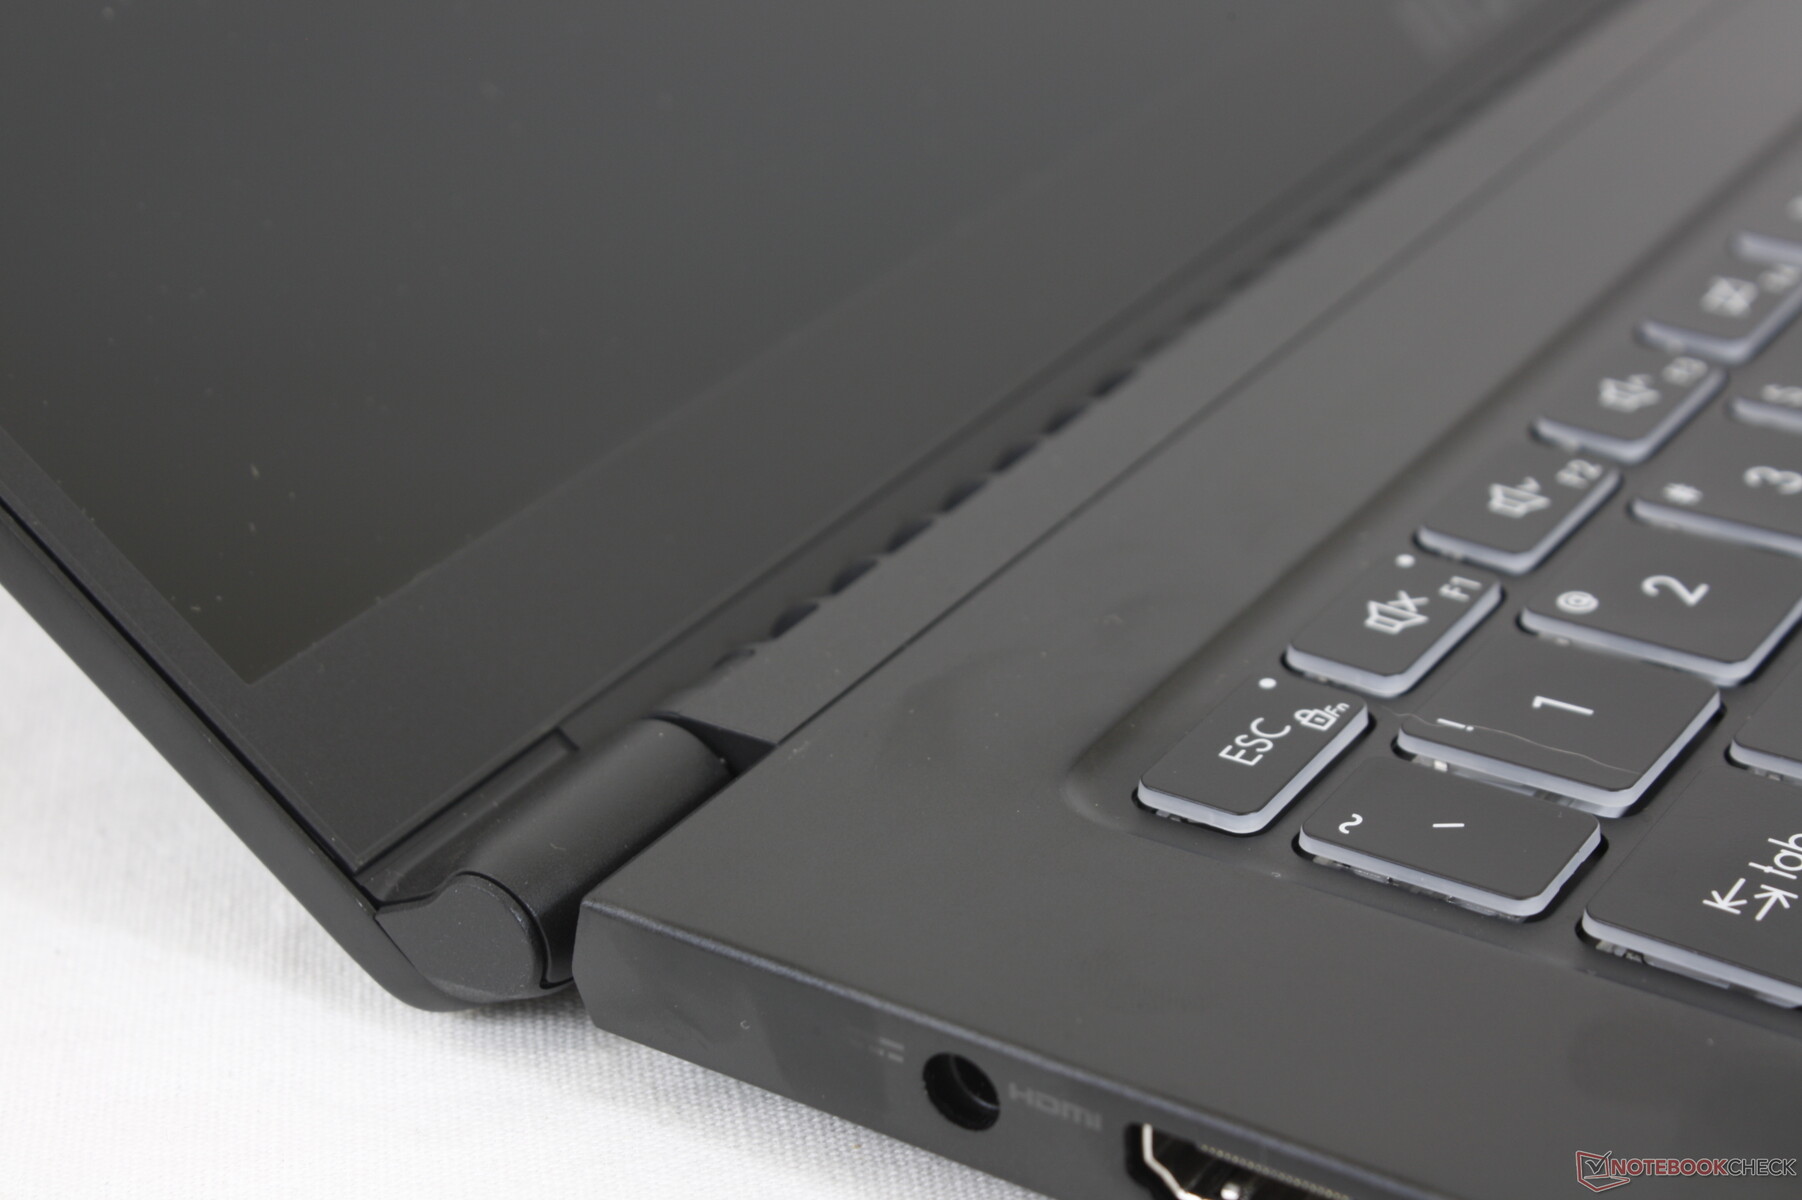
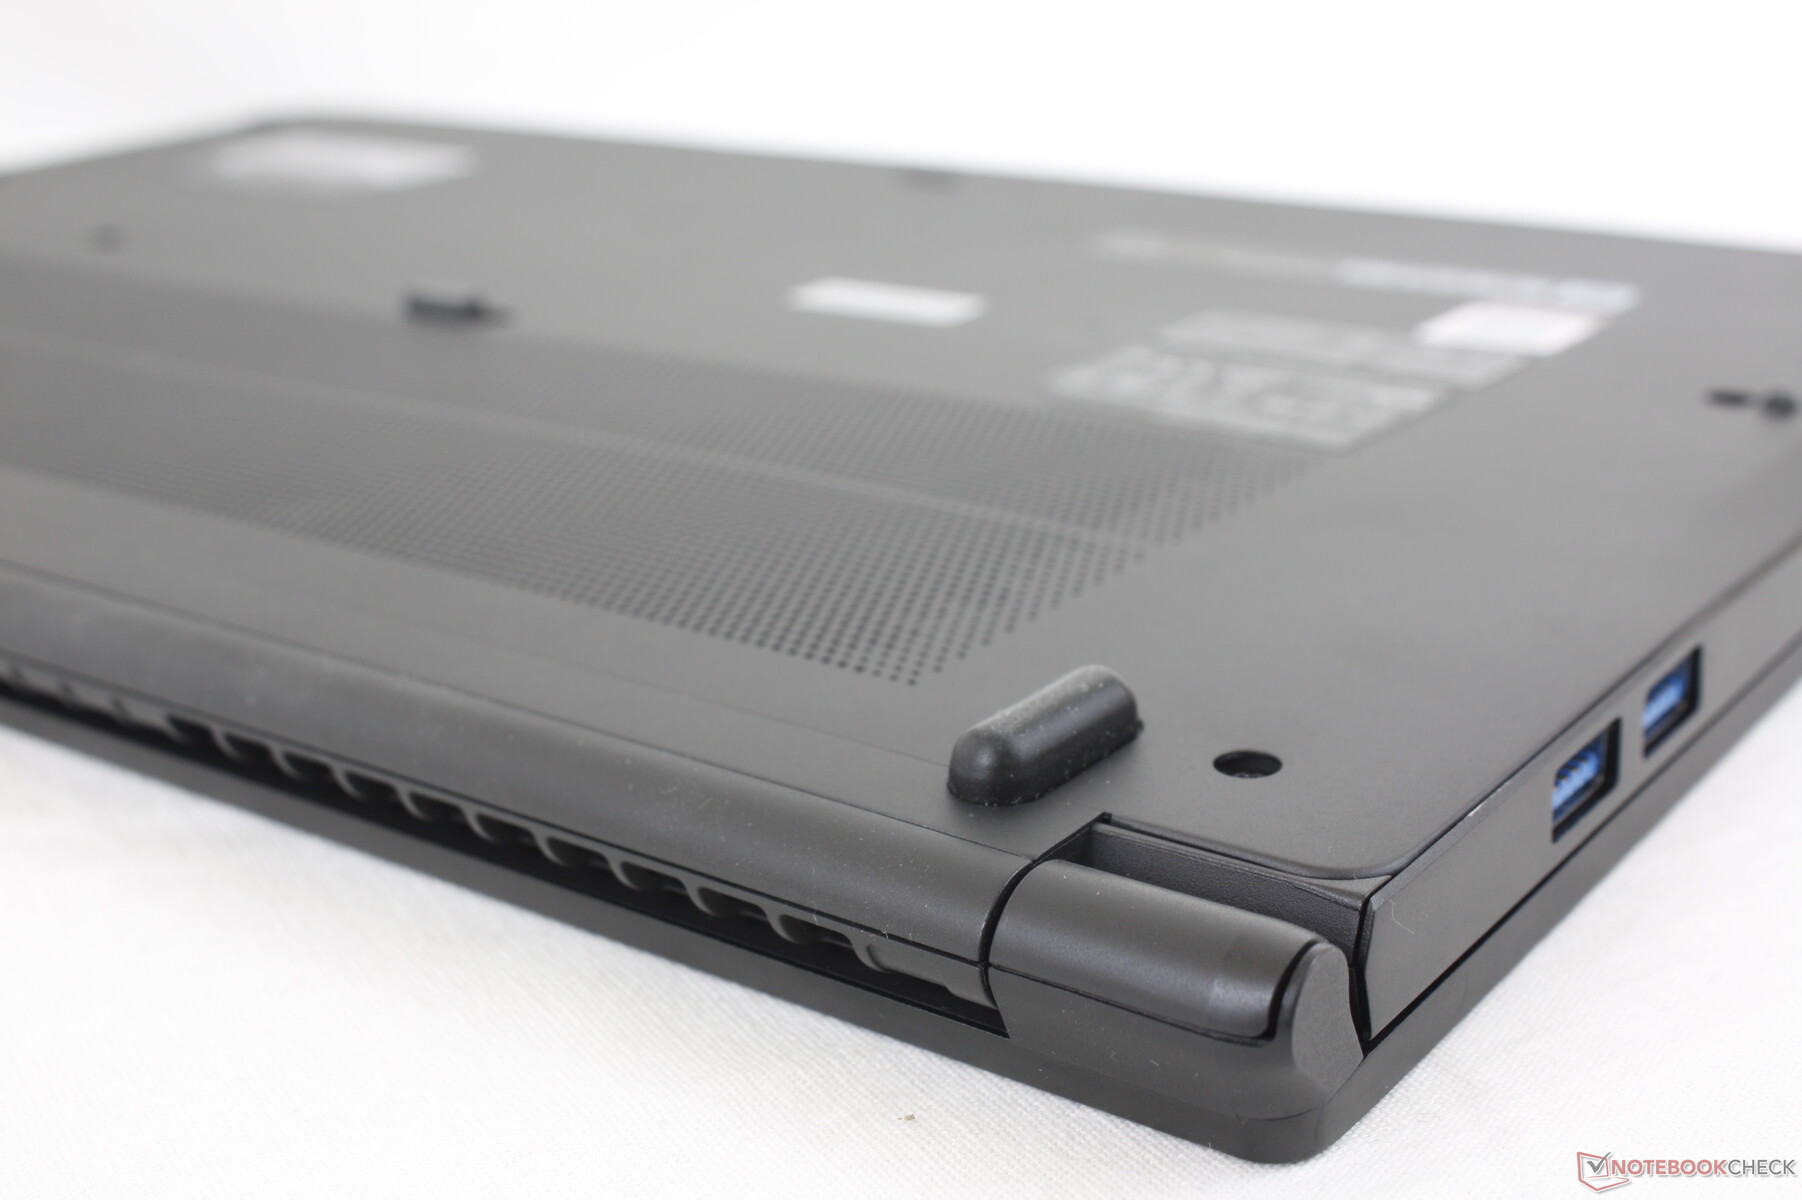
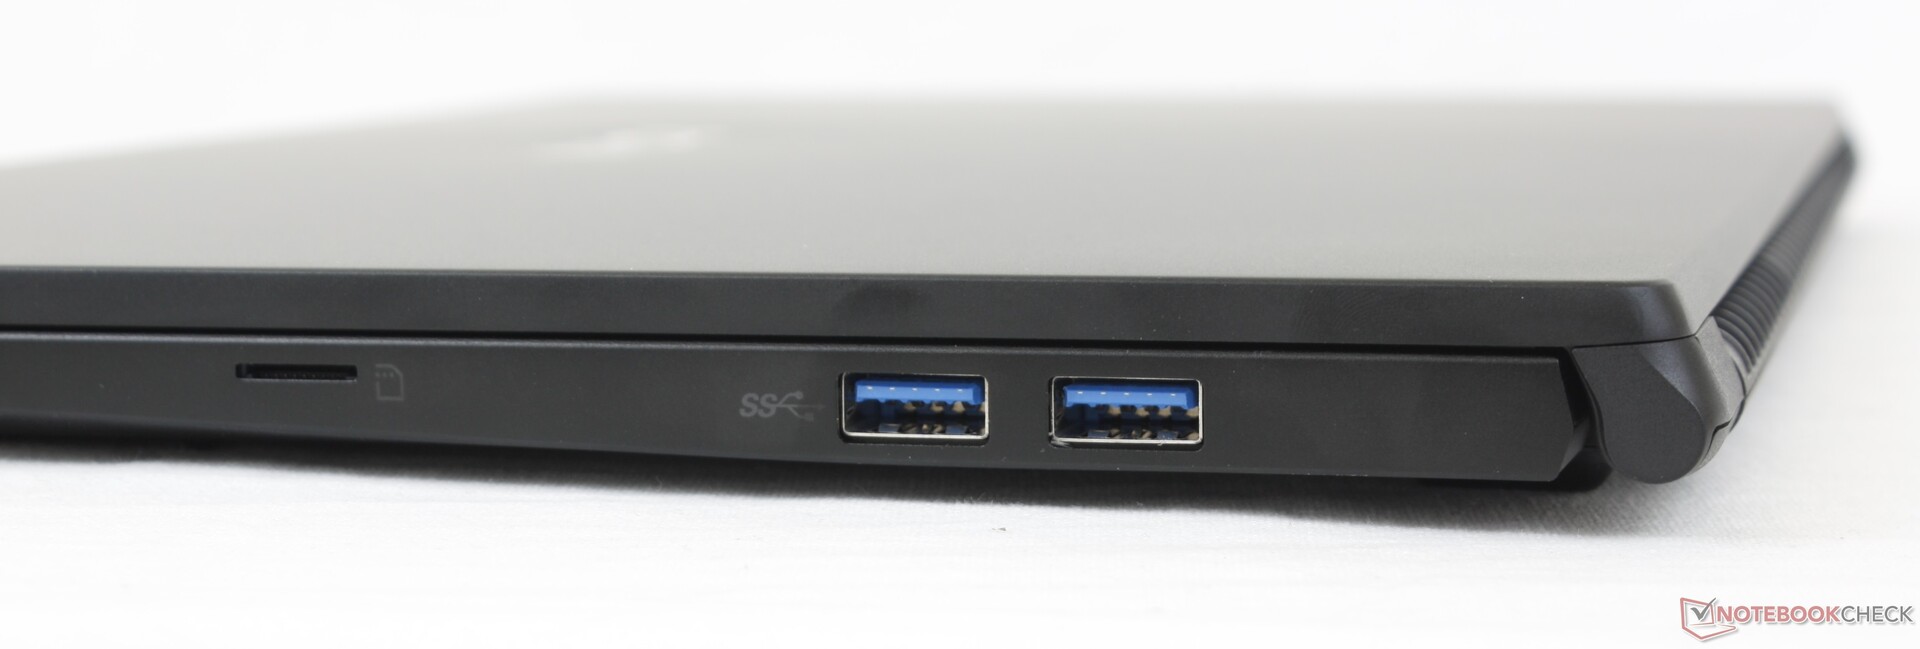
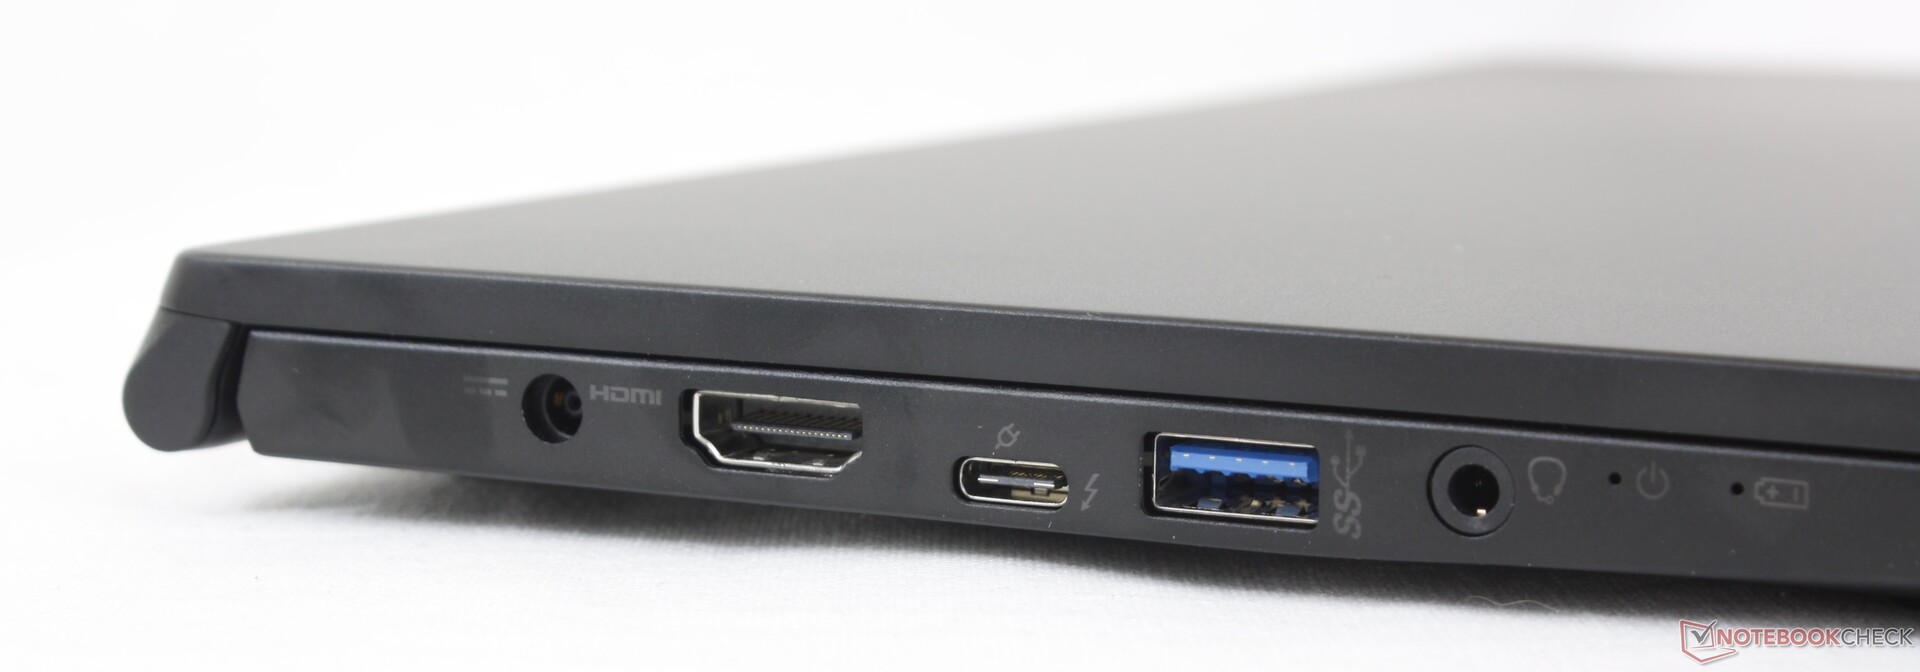
As opções de porta permanecem inalteradas em relação aos 15 modernos, exceto por duas grandes atualizações: a porta HDMI agora suporta saída 4K60 enquanto a porta USB-C agora é compatível com Thunderbolt 4. Os usuários podem conectar as docas gráficas externas ao Summit B15, enquanto isso era impossível no Modern 15
Leitor de cartões SD
A MSI atualizou o slot MicroSD para ser cerca de 6x mais rápido do que o mesmo slot MicroSD nos antigos 15 modernos. A mudança de 1 GB de fotos de nossa placa de teste UHS-II para a área de trabalho leva cerca de 7 segundos, em comparação com os 40 segundos do modelo do ano passado.
| SD Card Reader | |
| average JPG Copy Test (av. of 3 runs) | |
| Dell XPS 15 9500 Core i5 (Toshiba Exceria Pro SDXC 64 GB UHS-II) | |
| HP Spectre X360 15-5ZV31AV (Toshiba Exceria Pro M501 UHS-II) | |
| MSI Summit B15 A11M (AV PRO microSD 128 GB V60) | |
| MSI Summit E13 Flip Evo A11MT (AV PRO microSD 128 GB V60) | |
| MSI Modern 15 A10RB (Toshiba Exceria Pro M501 UHS-II) | |
| maximum AS SSD Seq Read Test (1GB) | |
| Dell XPS 15 9500 Core i5 (Toshiba Exceria Pro SDXC 64 GB UHS-II) | |
| MSI Summit B15 A11M (AV PRO microSD 128 GB V60) | |
| HP Spectre X360 15-5ZV31AV (Toshiba Exceria Pro M501 UHS-II) | |
| MSI Summit E13 Flip Evo A11MT (AV PRO microSD 128 GB V60) | |
| MSI Modern 15 A10RB (Toshiba Exceria Pro M501 UHS-II) | |
Comunicação
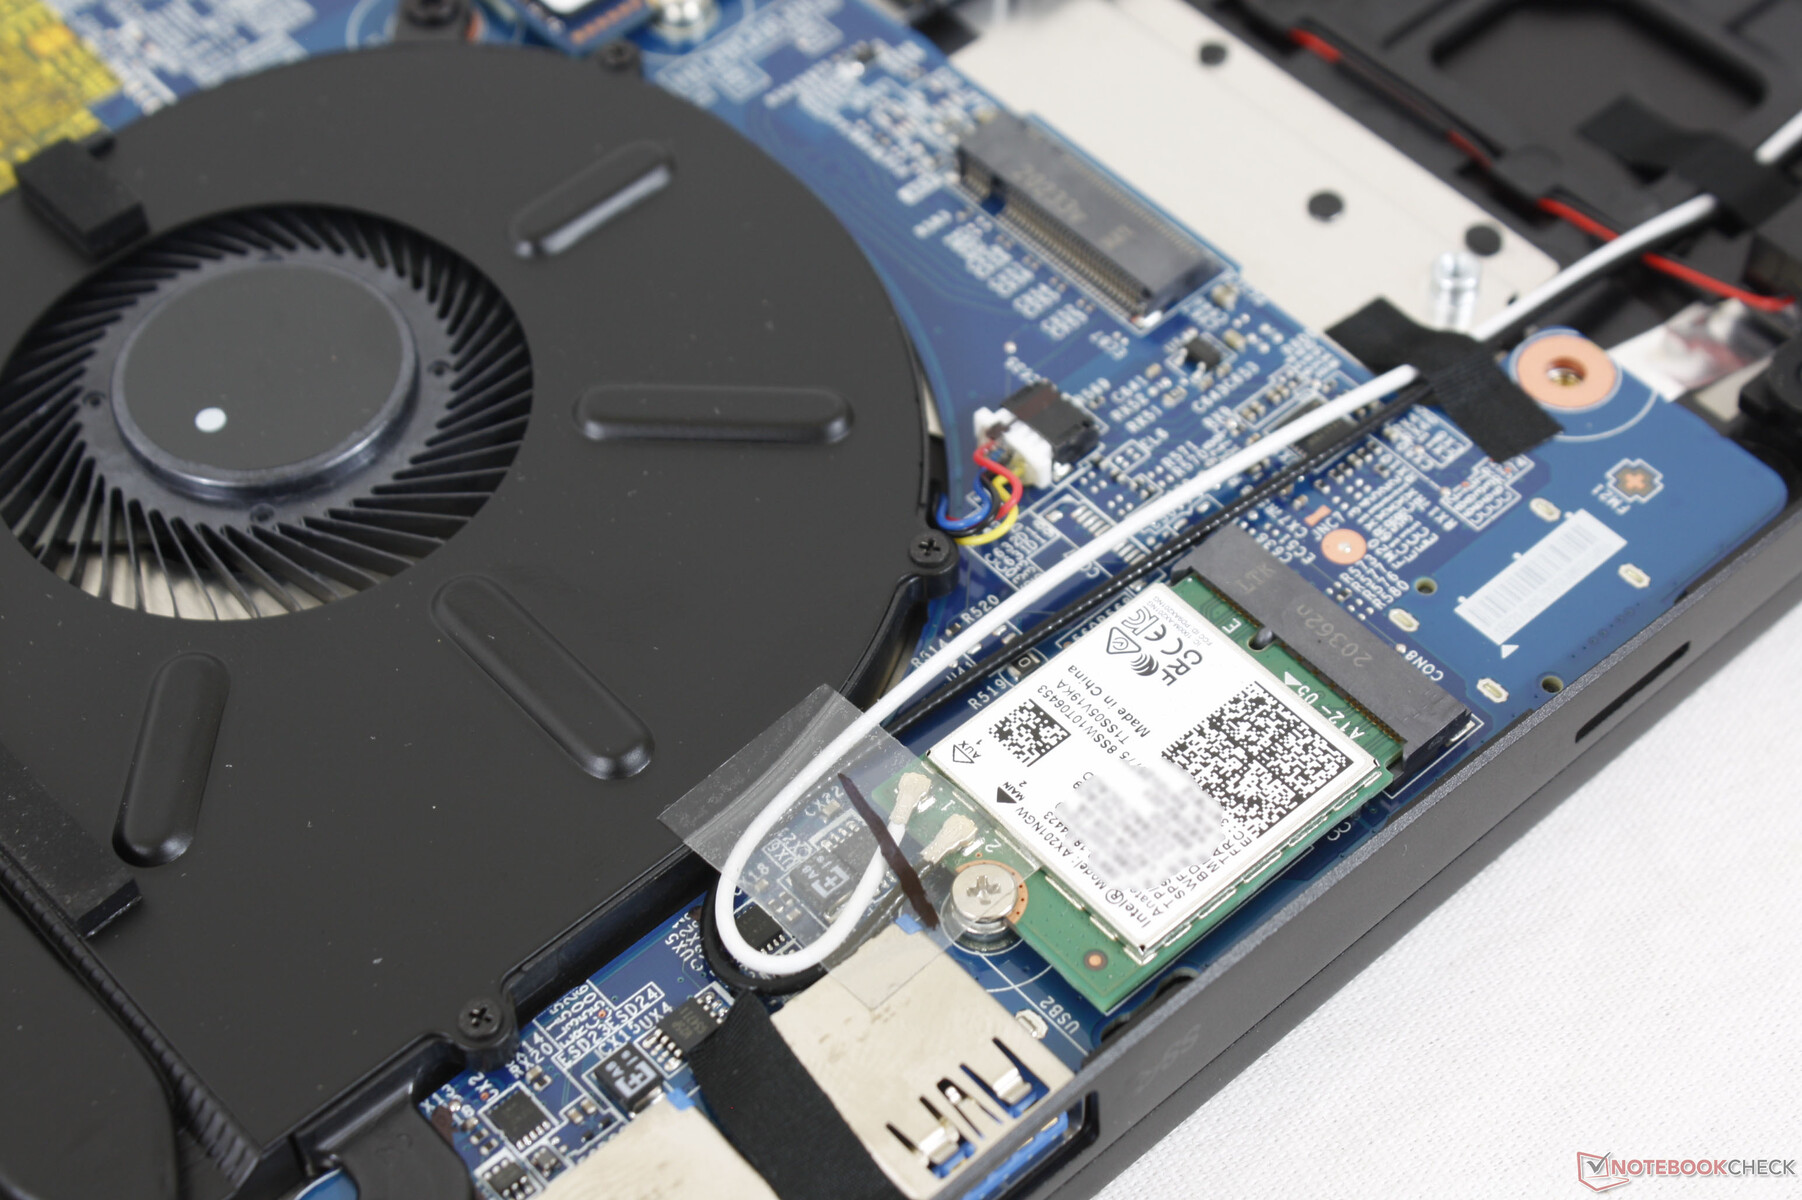
O Intel AX201 vem como padrão para conectividade Wi-Fi 6 e Bluetooth 5.1. Não tivemos nenhum problema quando acoplado ao nosso roteador Netgear RAX200.
Webcam


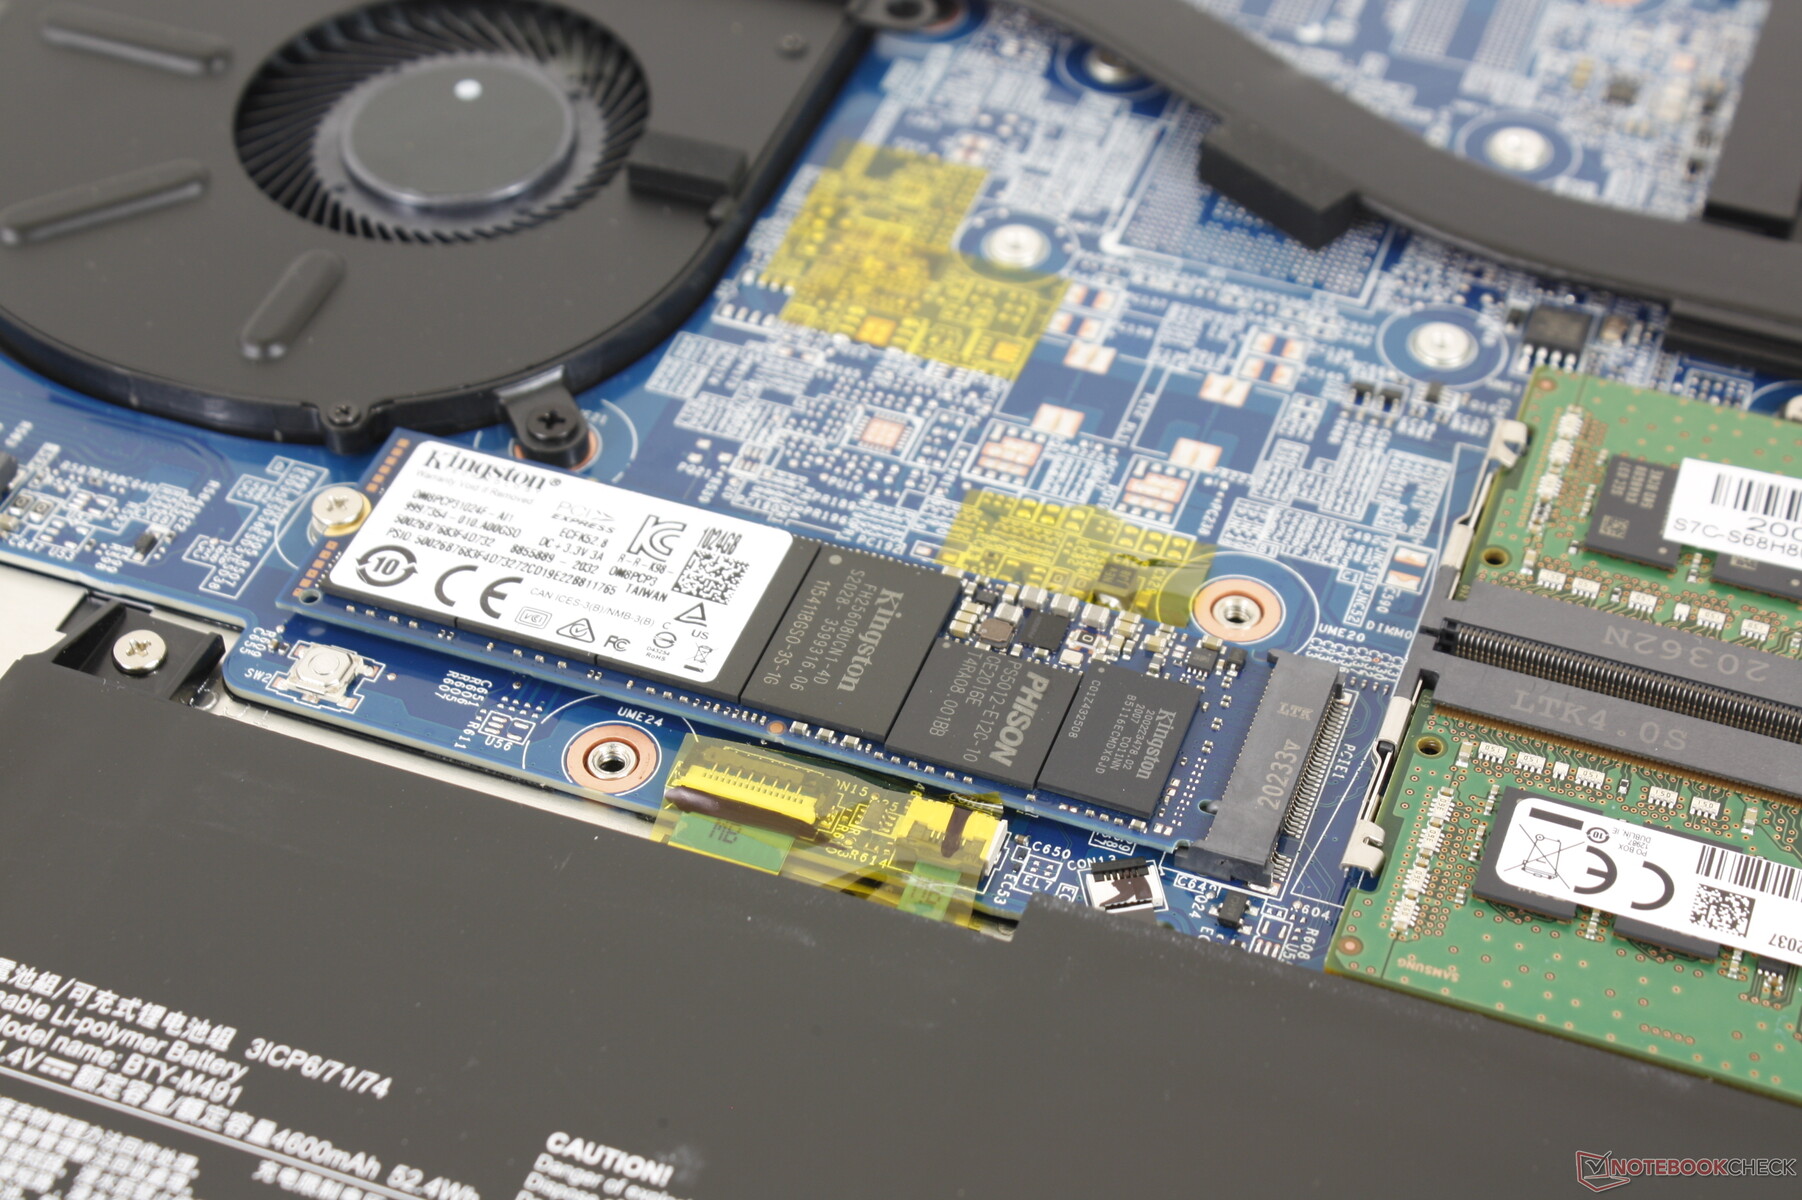
Manutenção
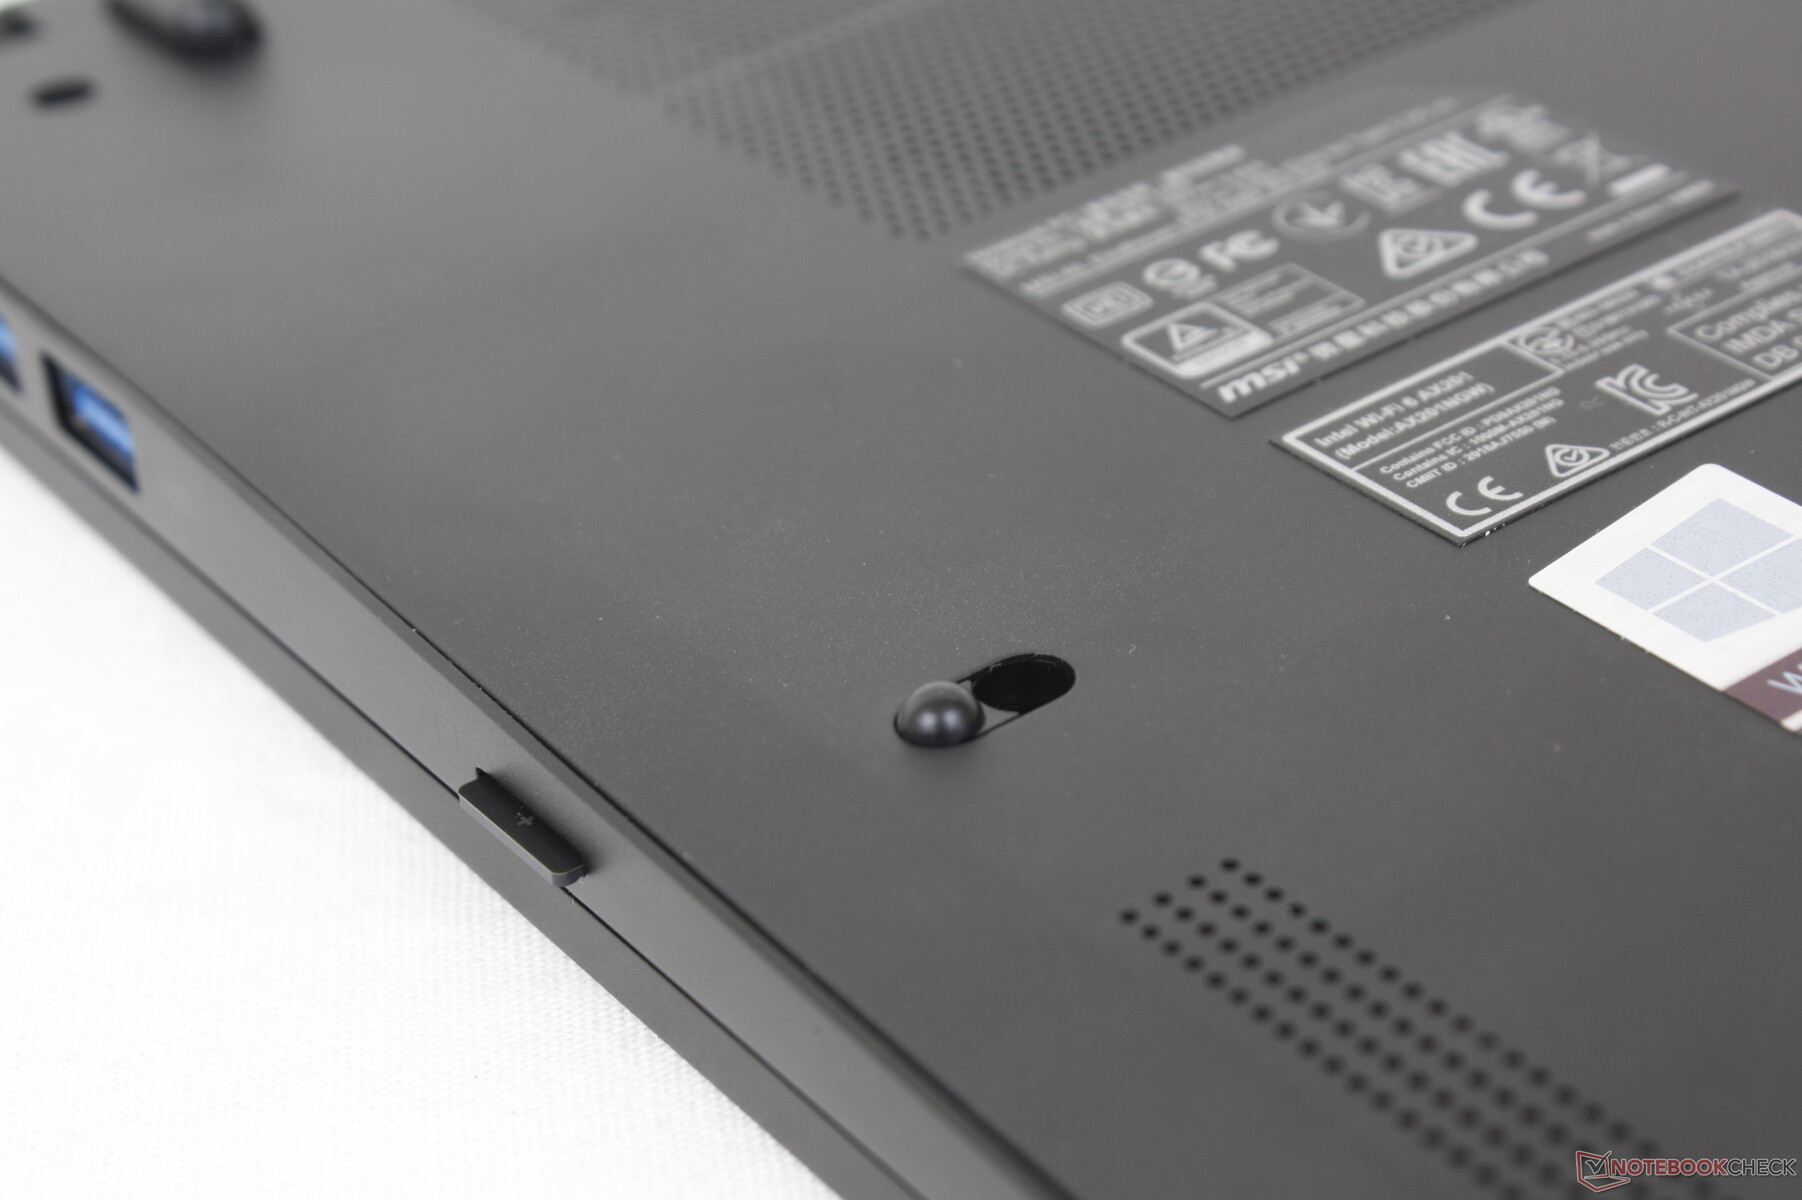
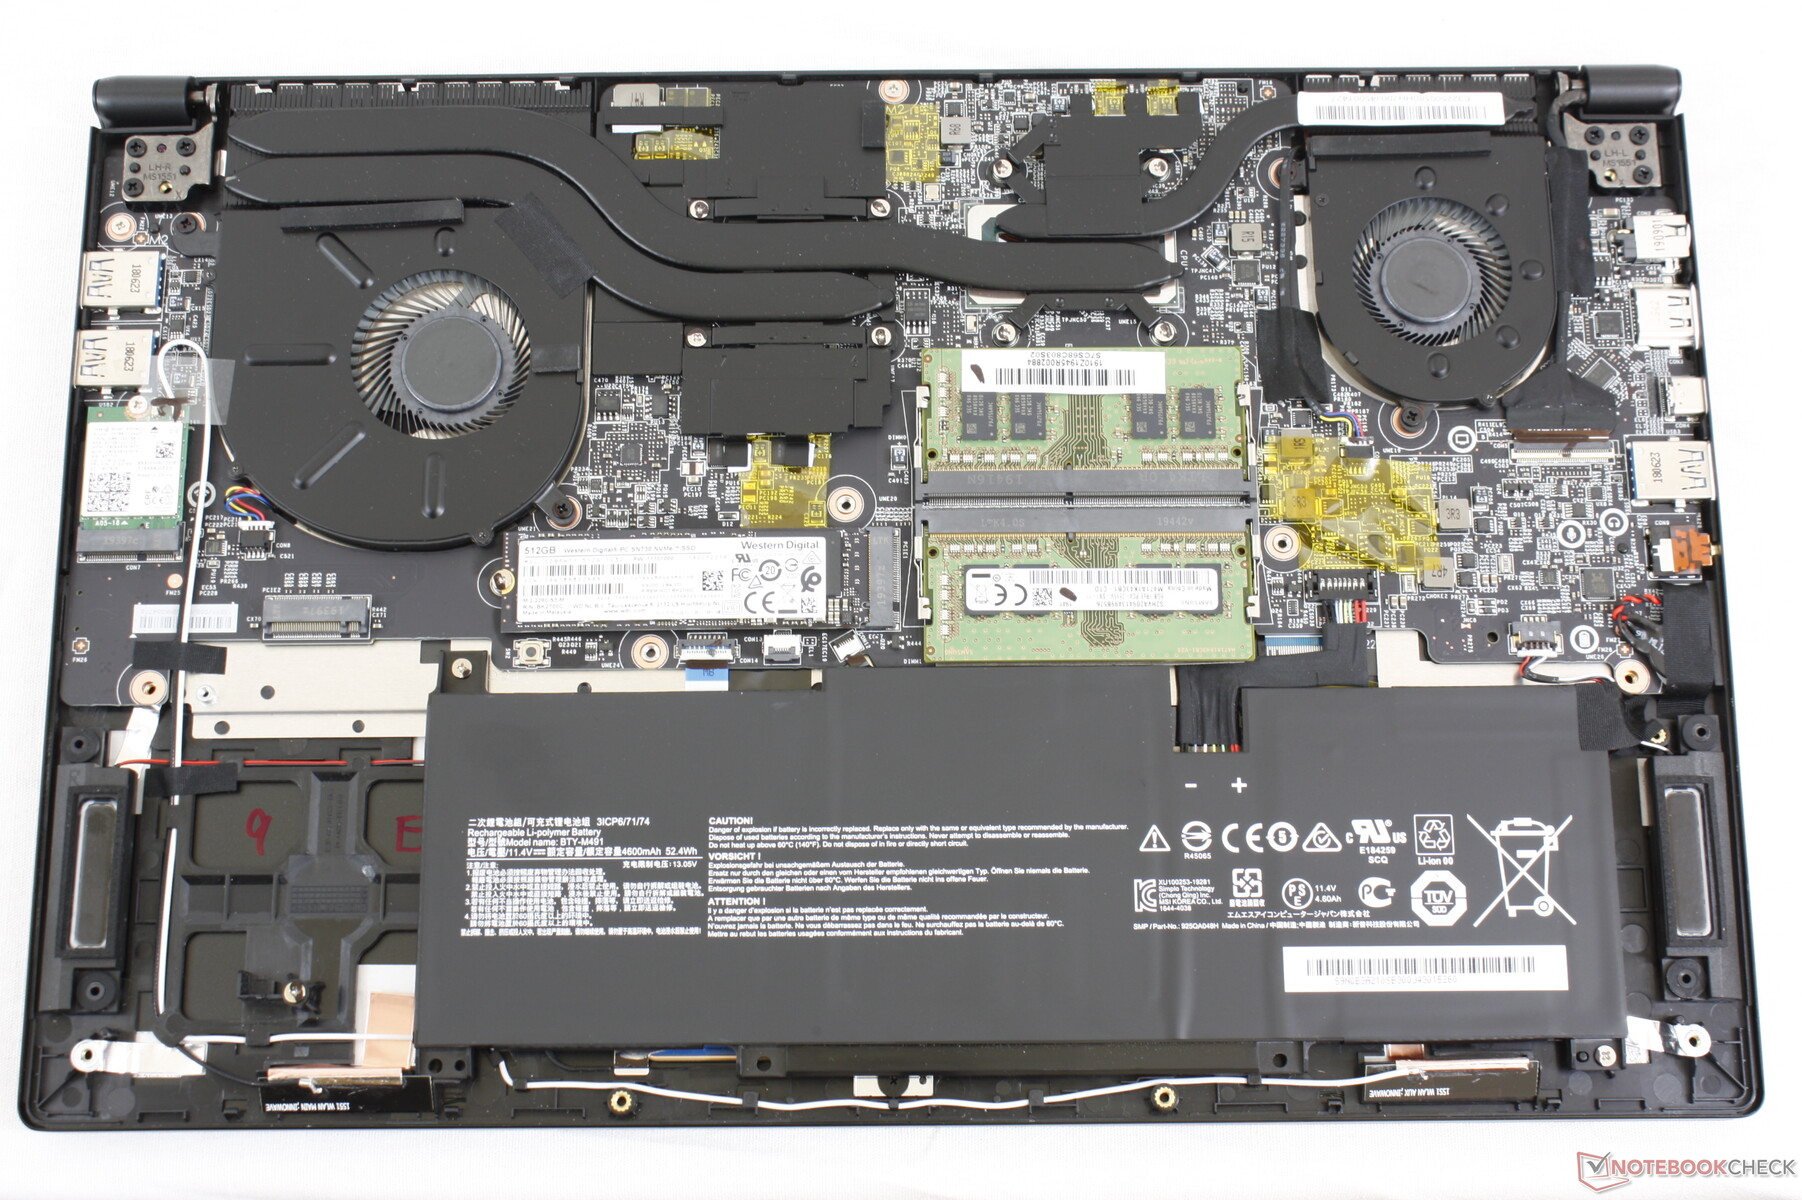
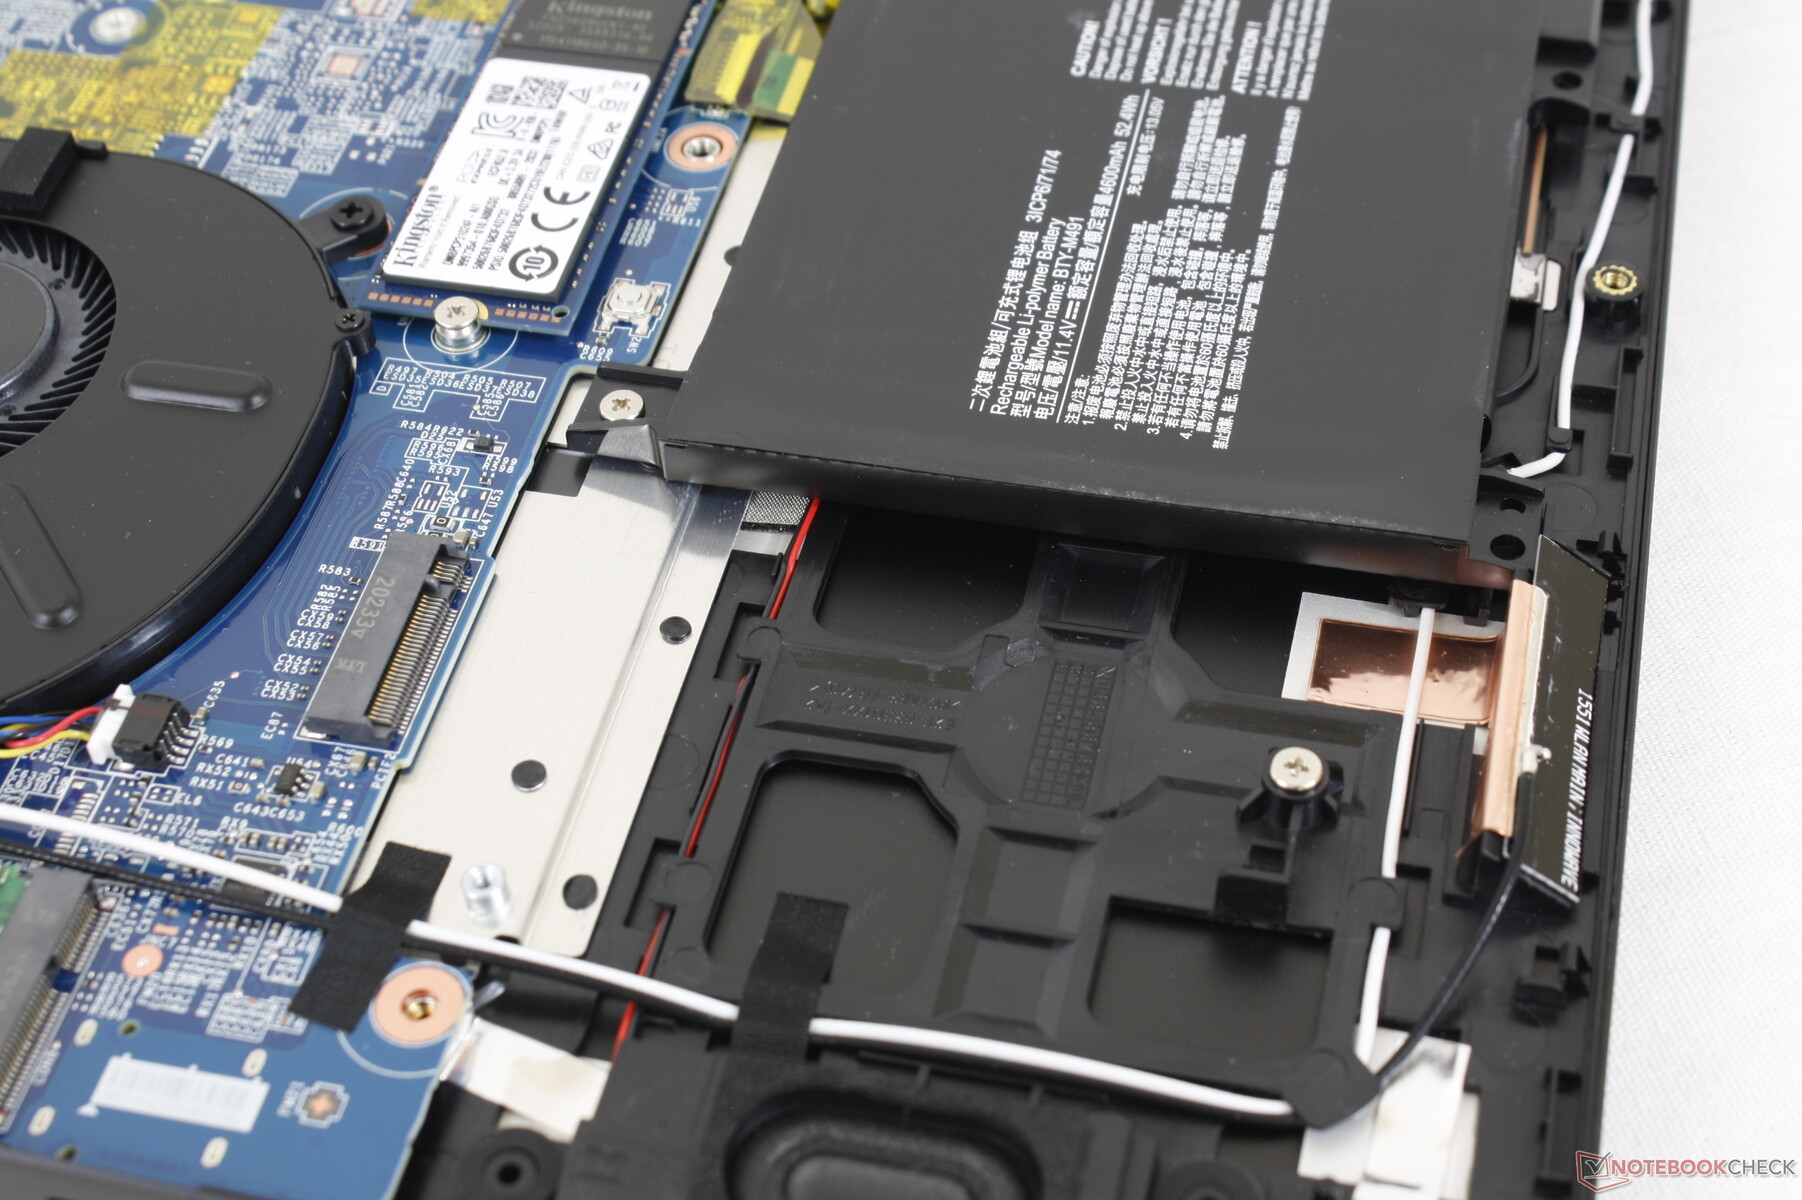
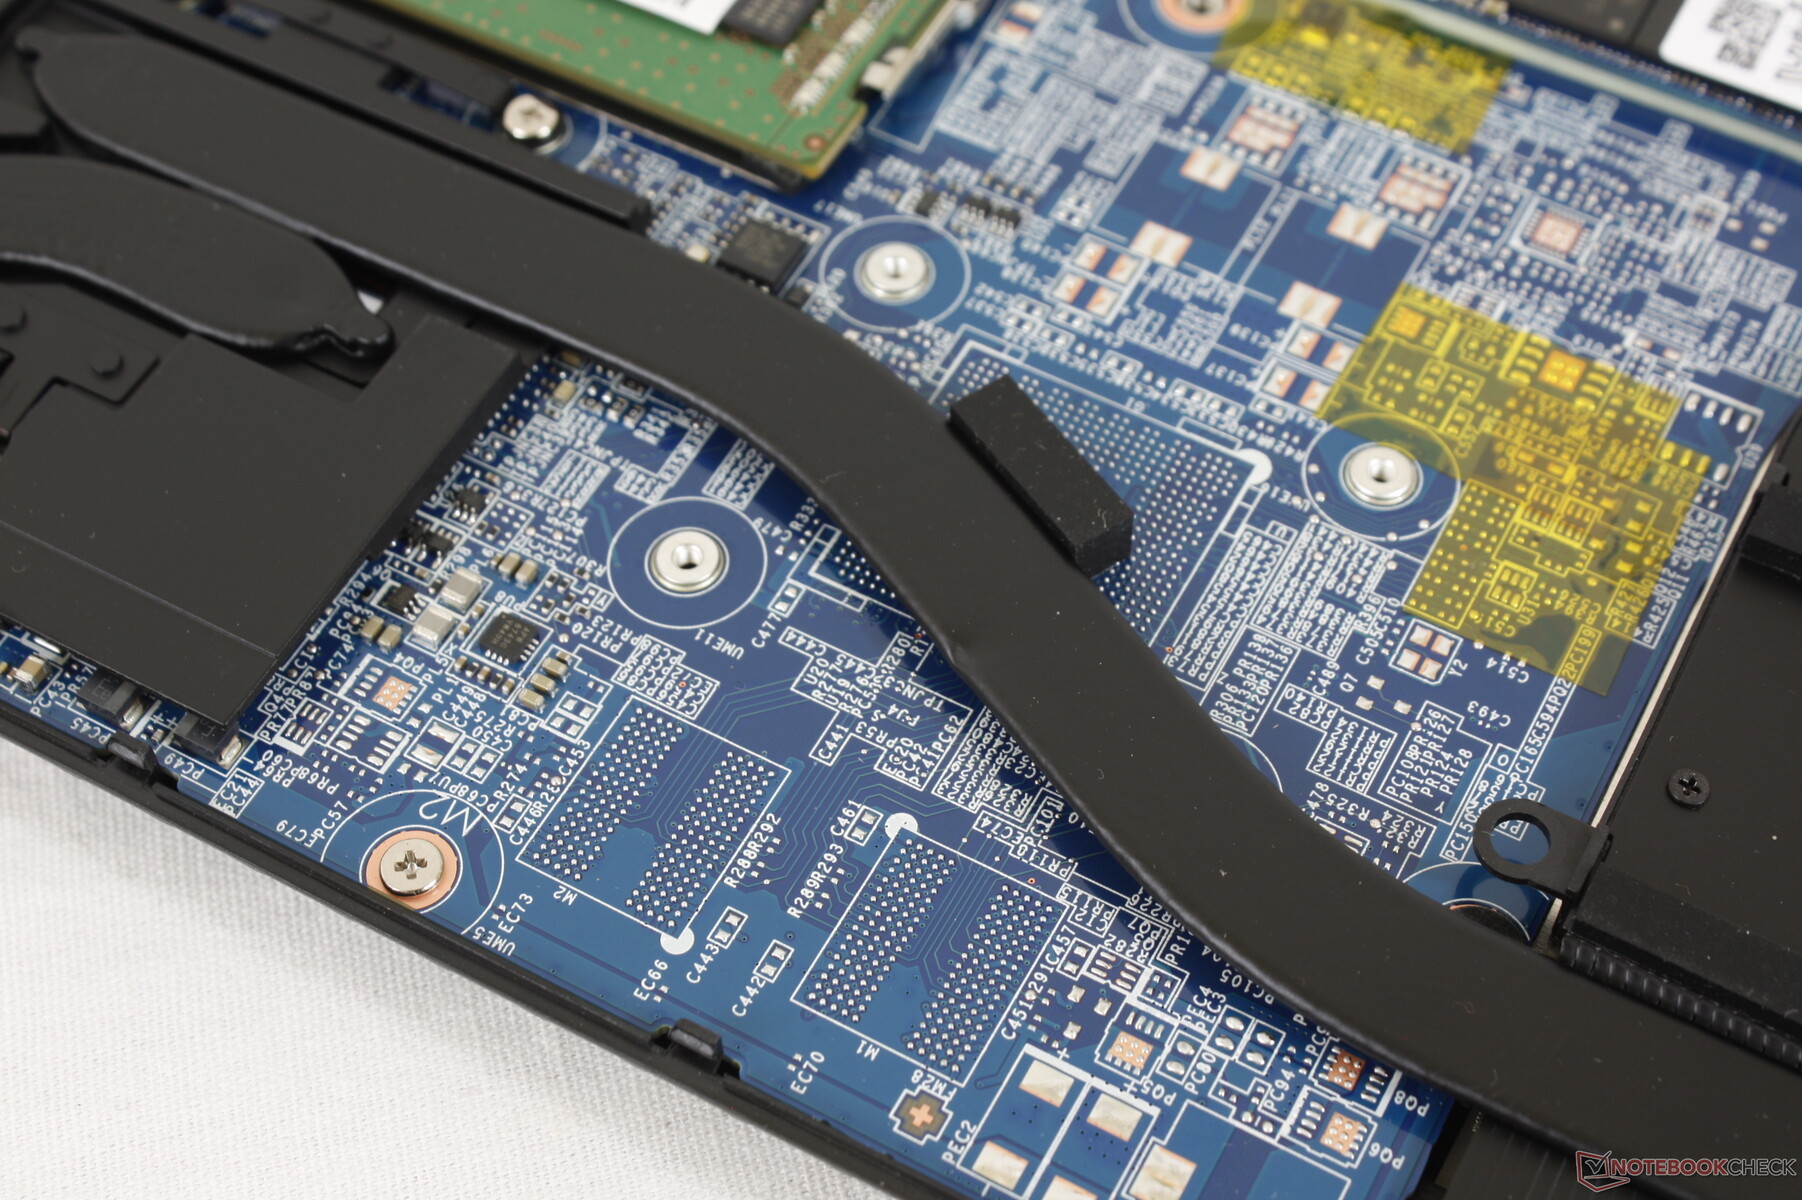
O painel inferior se solta com bastante facilidade com apenas uma chave de fenda Philips. Entretanto, tenha em mente que um adesivo de vedação de fábrica deve primeiro ser quebrado. Uma vez dentro, as semelhanças entre o Summit B15 e o Modern 15 do ano passado se tornam ainda mais óbvias, como mostram as imagens de comparação abaixo.
Acessórios e Garantia
A caixa de varejo inclui um adaptador USB-A para RJ-45 junto com a papelaria e um adaptador AC. A garantia padrão limitada de um ano aplica-se com opções de extensão se comprada no PC Xotic.
Dispositivos de entrada
Teclado
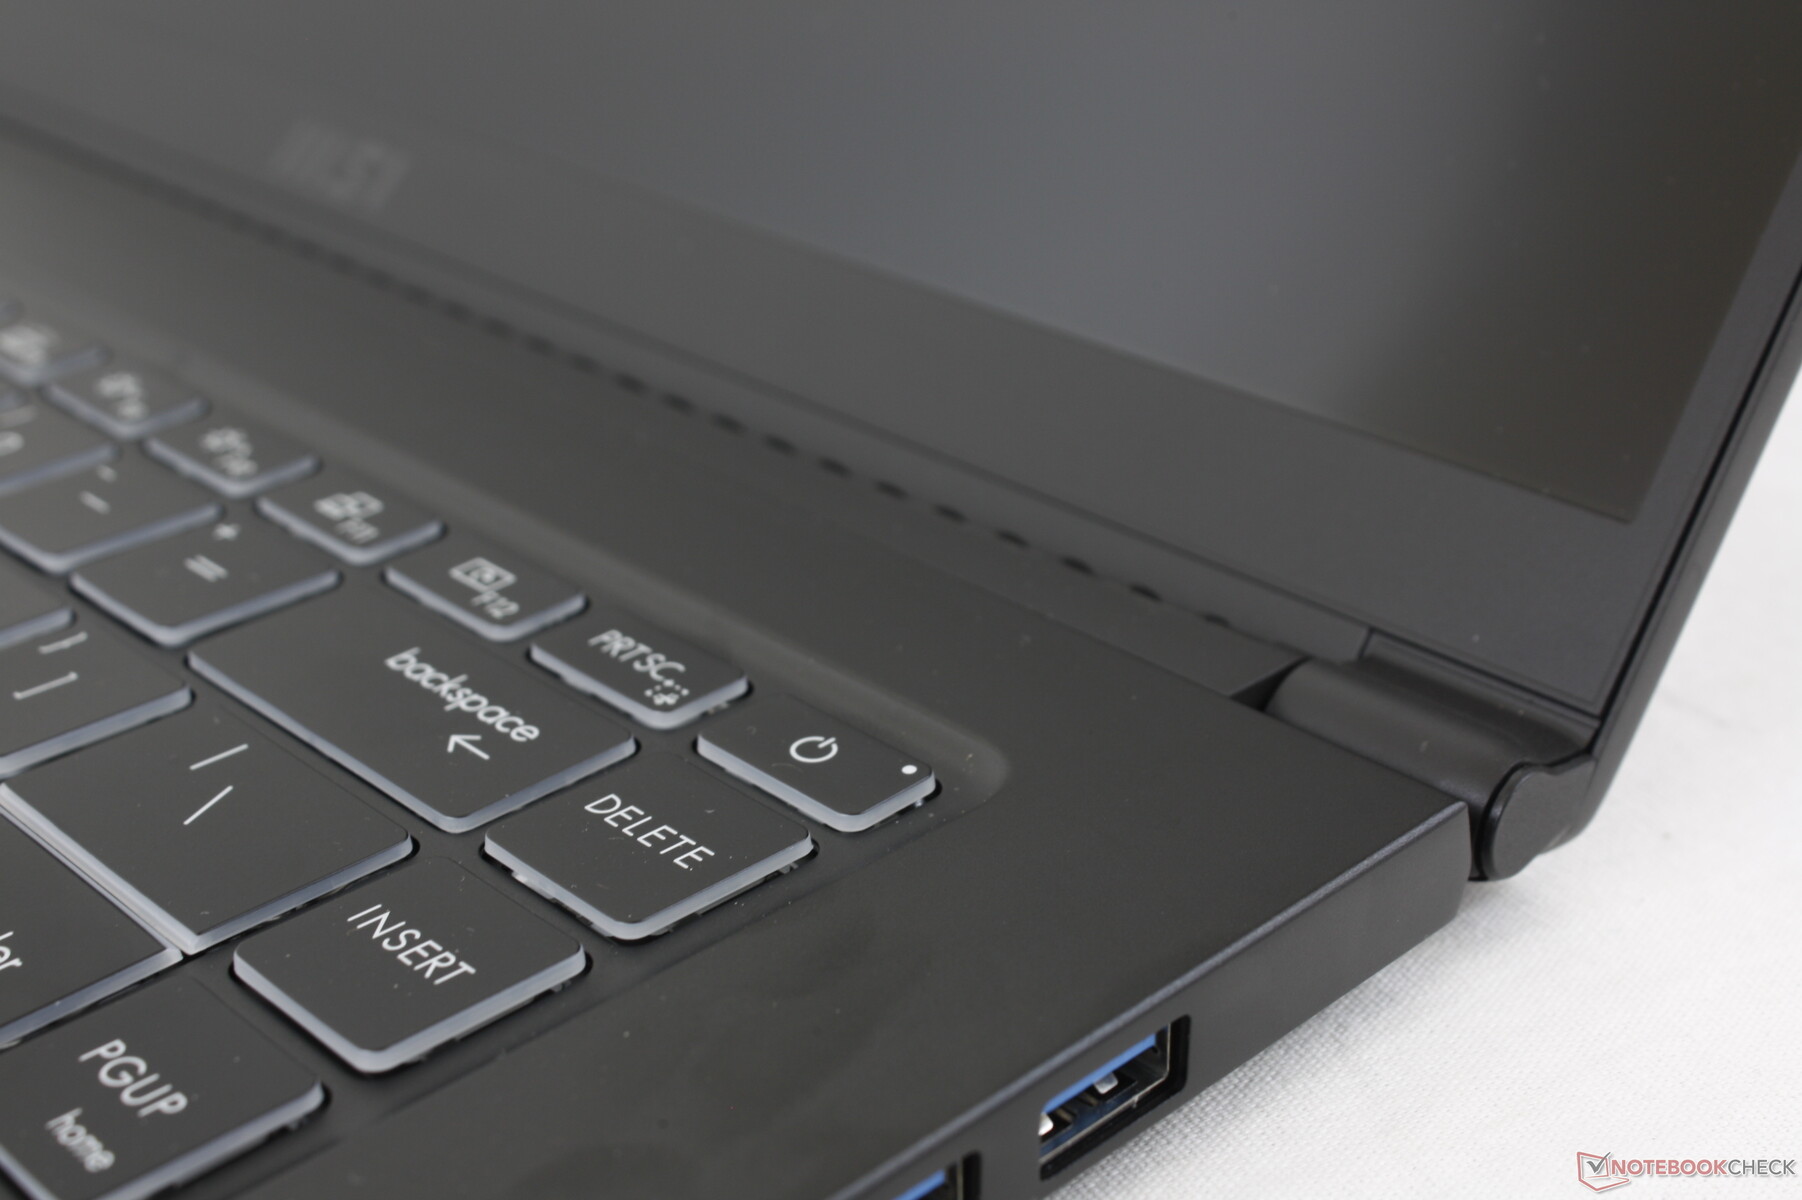
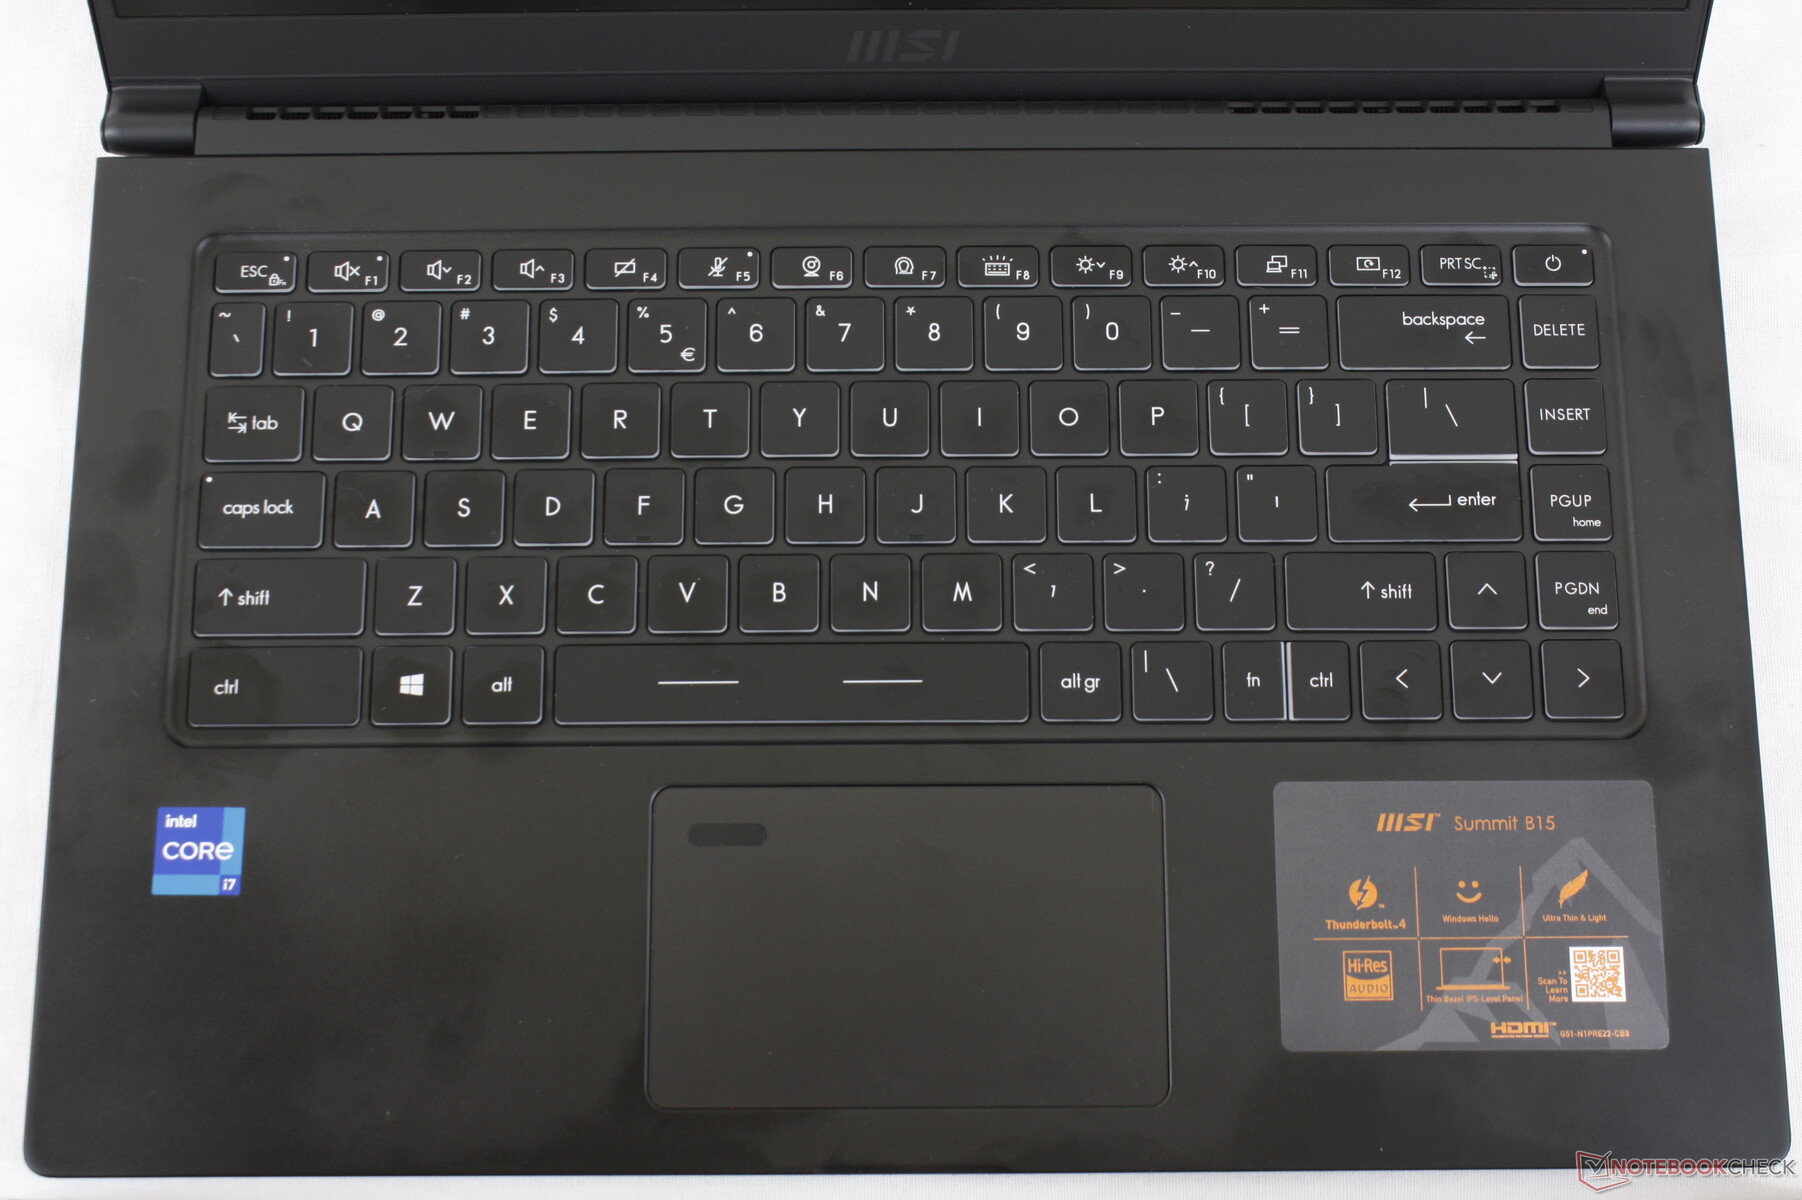
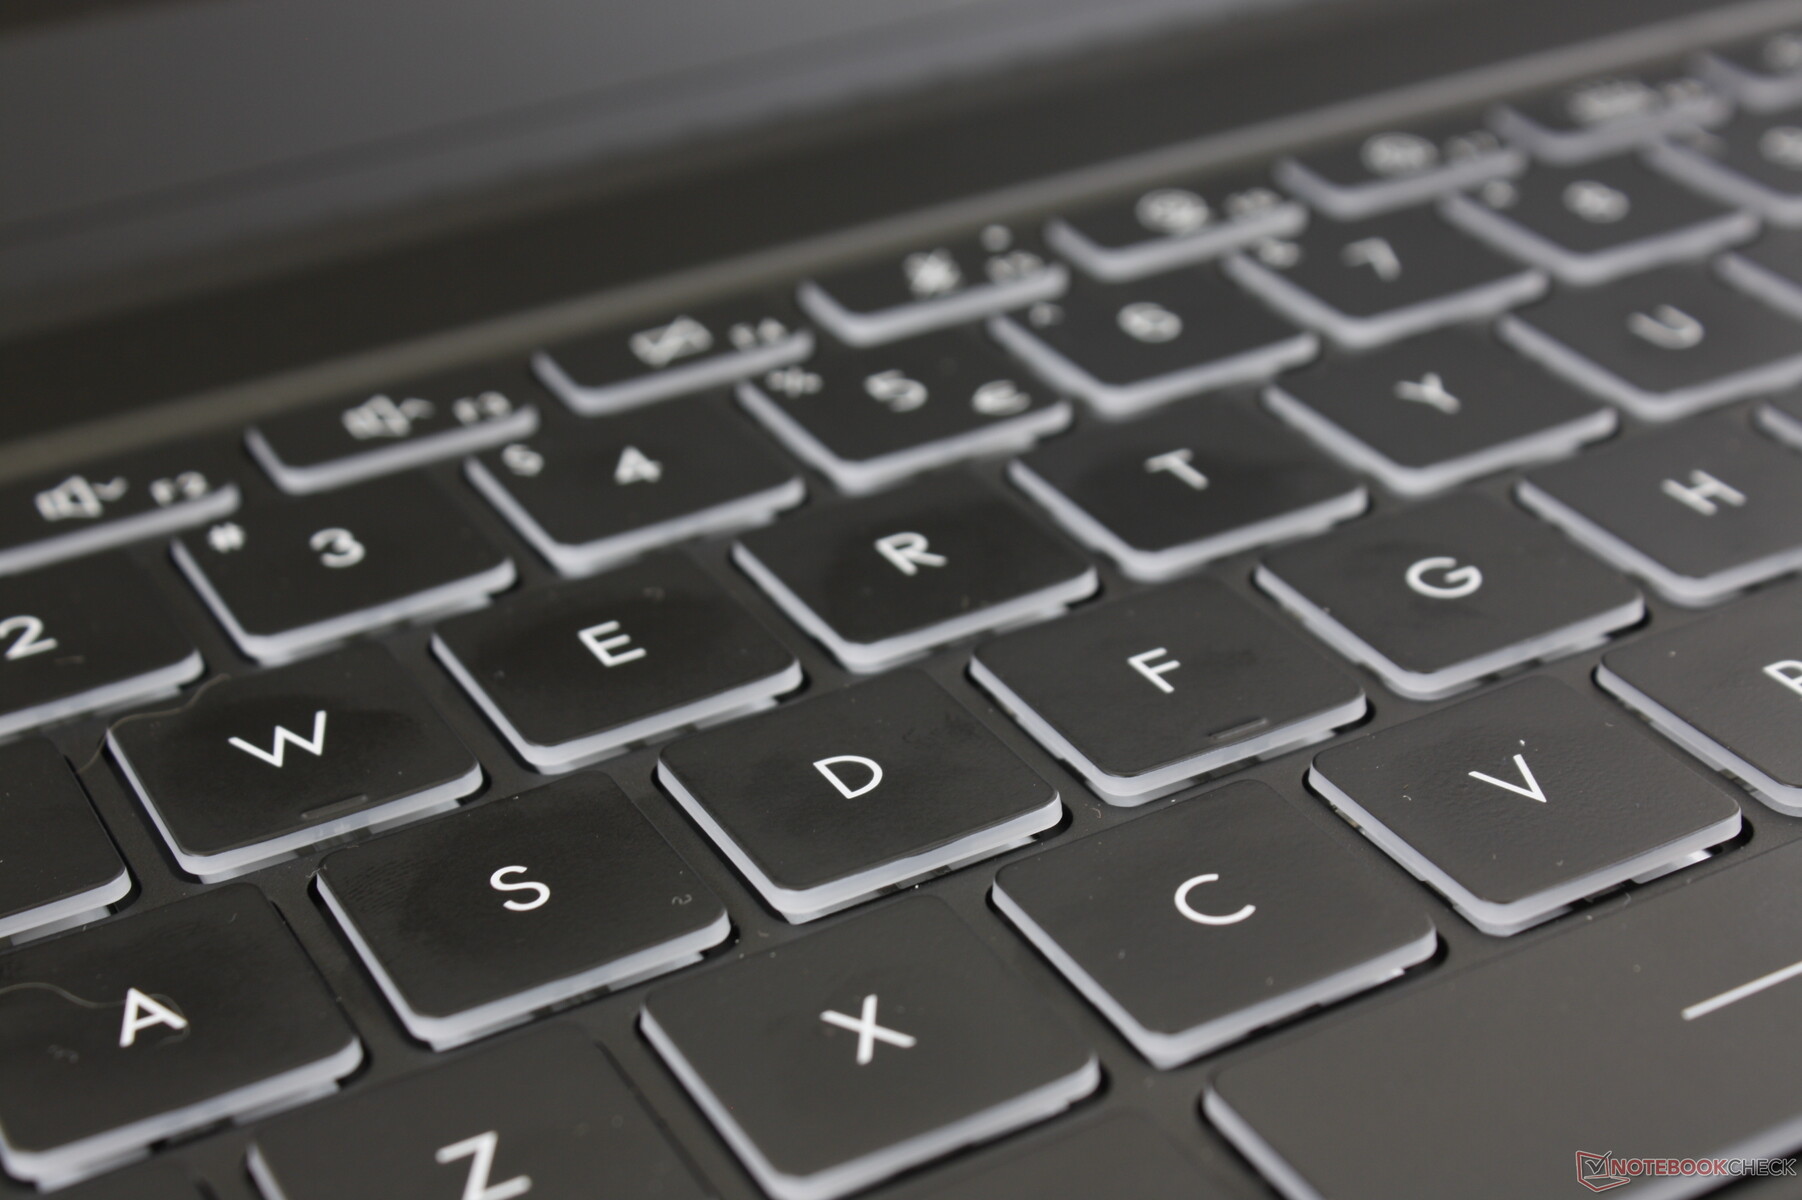
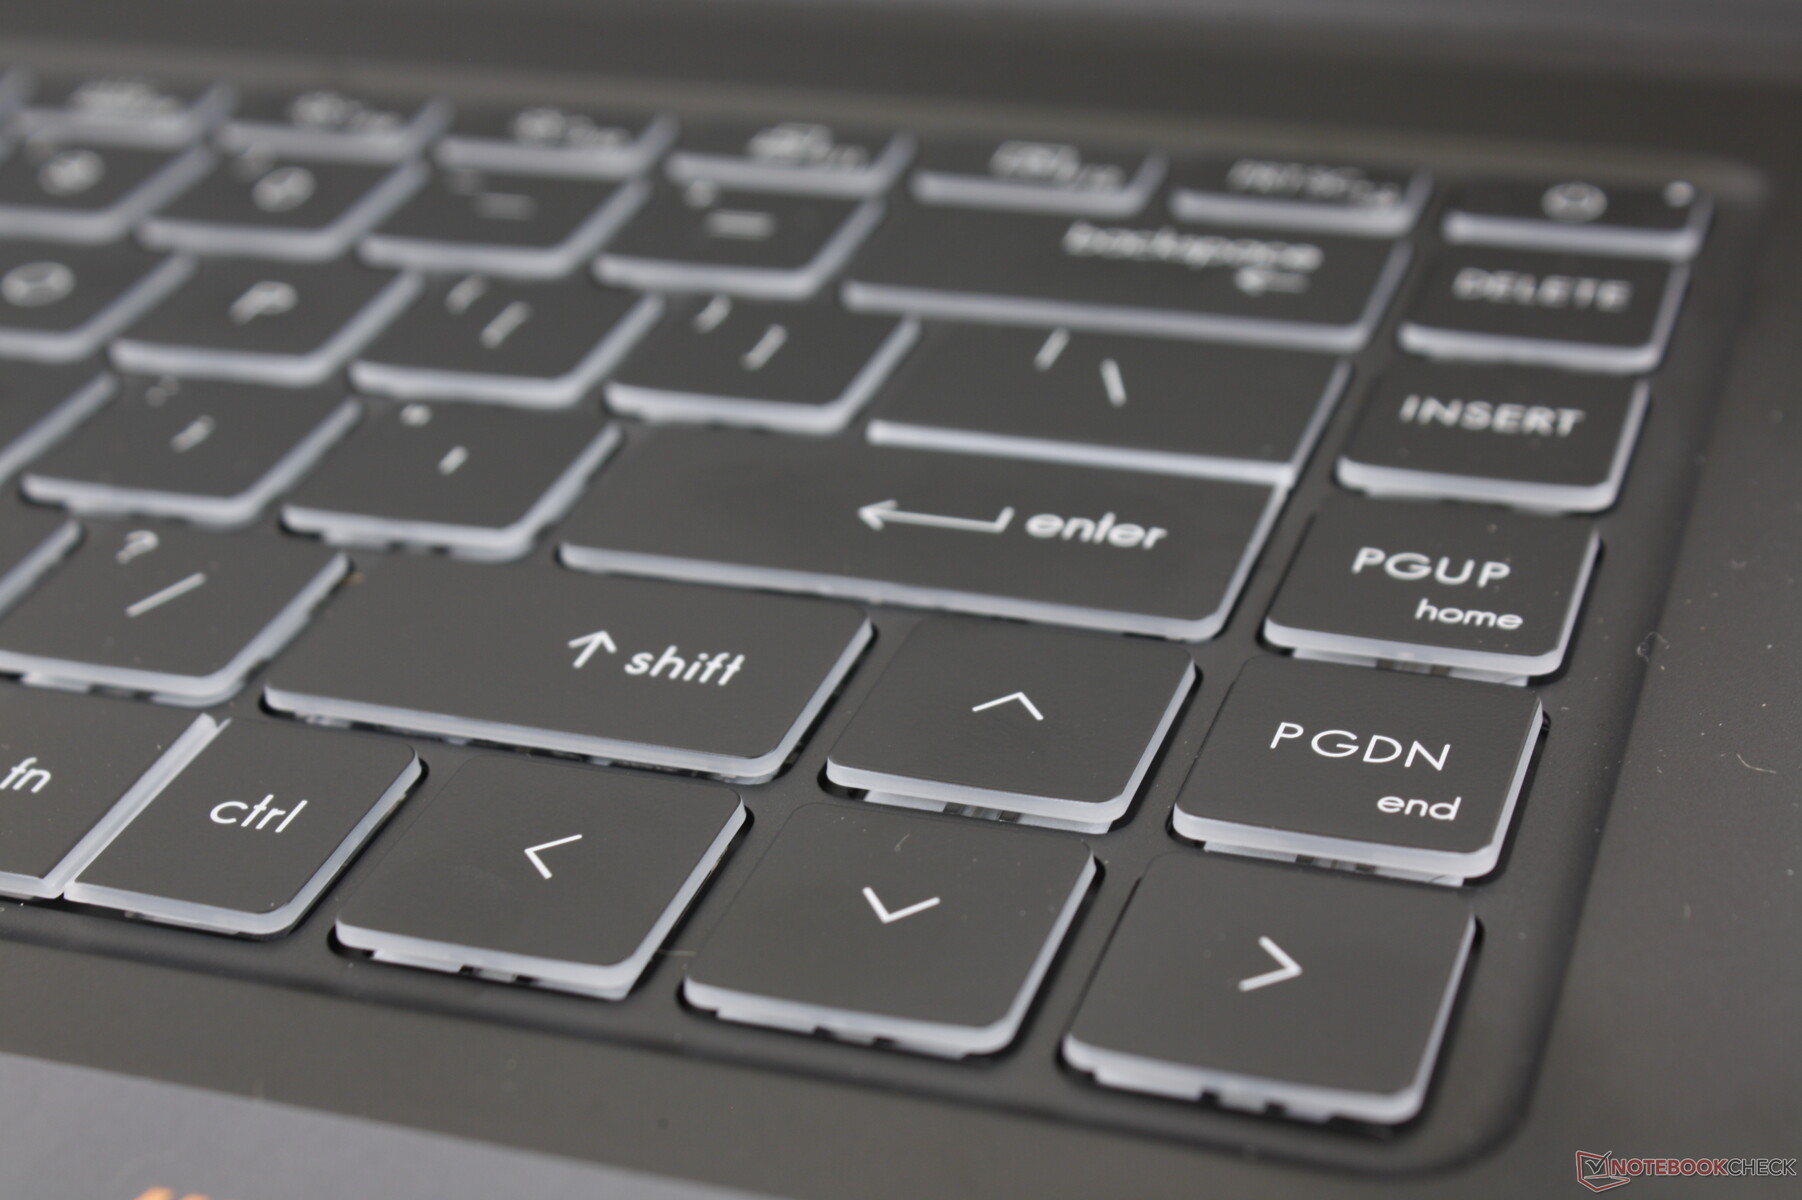
A fonte principal mudou dos 15 modernos para ser mais nítida e não tão ousada ou itálica. Caso contrário, o feedback e o layout das chaves permanecem exatamente os mesmos. As chaves parecem mais firmes e profundas do que no XPG Xenia Xe eDell XPS 15respectivamente, mas o barulho é um pouco mais alto como resultado. Apreciamos as teclas PgUp, PgDn, Delete e Setas em tamanho real, pois estas são frequentemente encolhidas na maioria dos outros laptops.
Touchpad
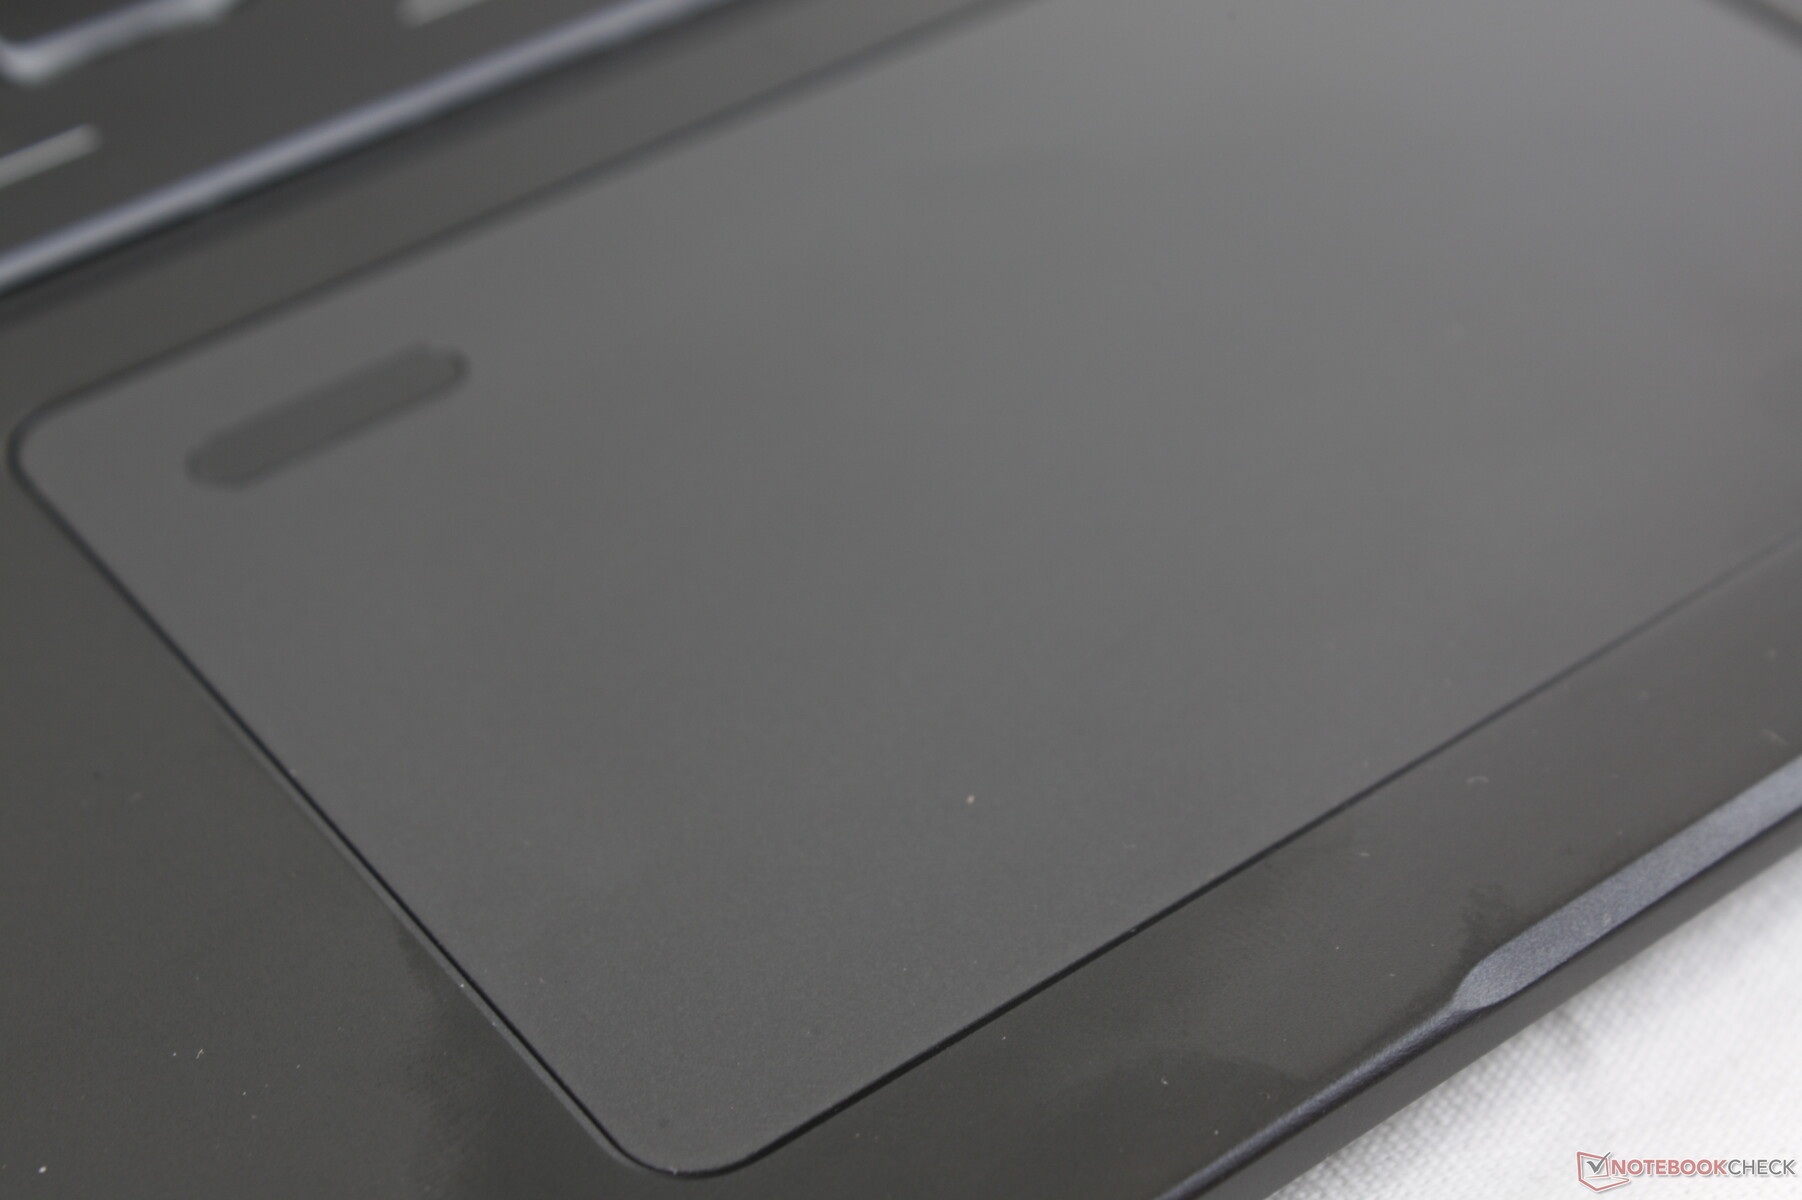
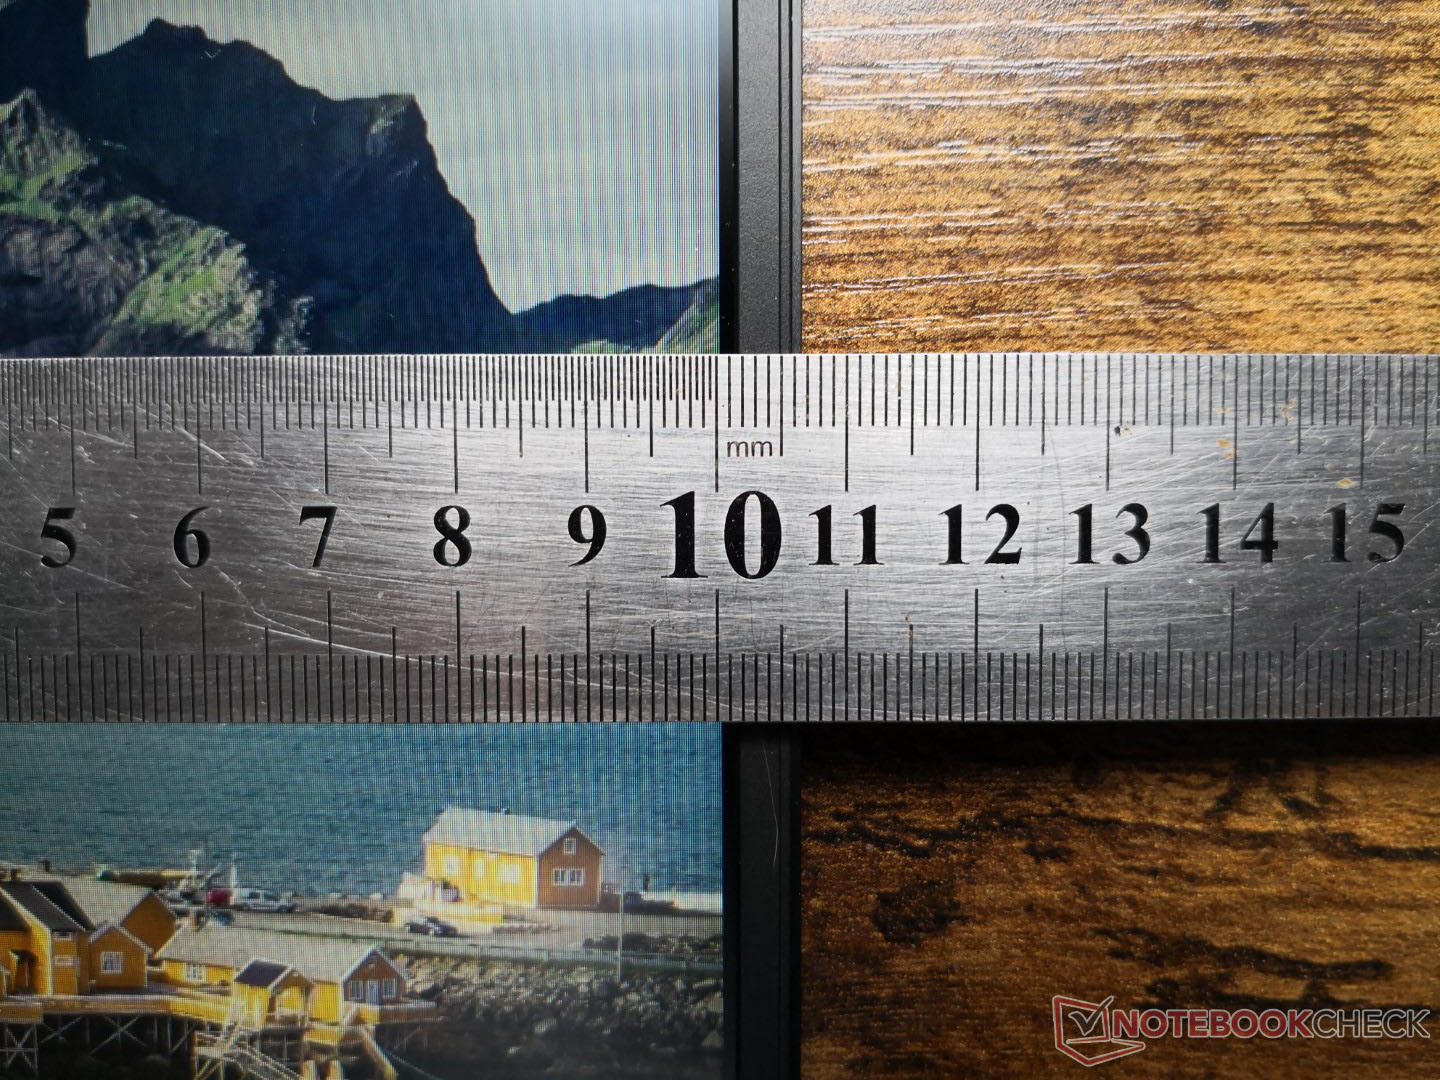
O clickpad tem o mesmo tamanho que o do moderno 15 (10,5 x 6,5 cm) com a mesma textura suave e feedback esponjoso. Não é tão macio quanto o clickpad do Xenia Xe, mas definitivamente poderia ter sido mais firme para um clique mais satisfatório.
Suspeitamos que a MSI eventualmente afastará o leitor de impressões digitais do clickpad muito parecido com o que já estamos vendo da Dell, HP, e outros.
Mostrar
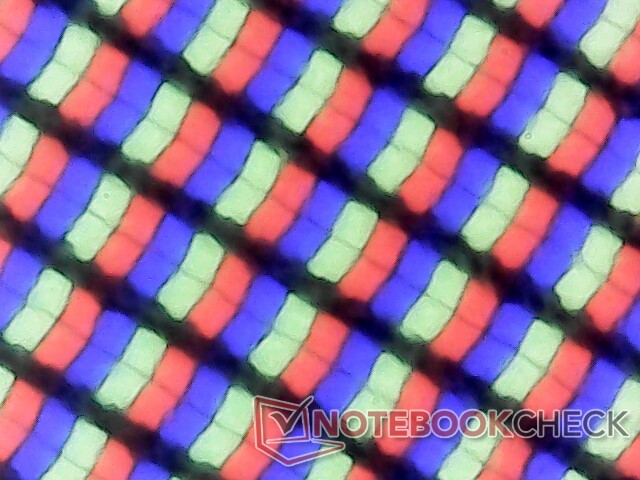
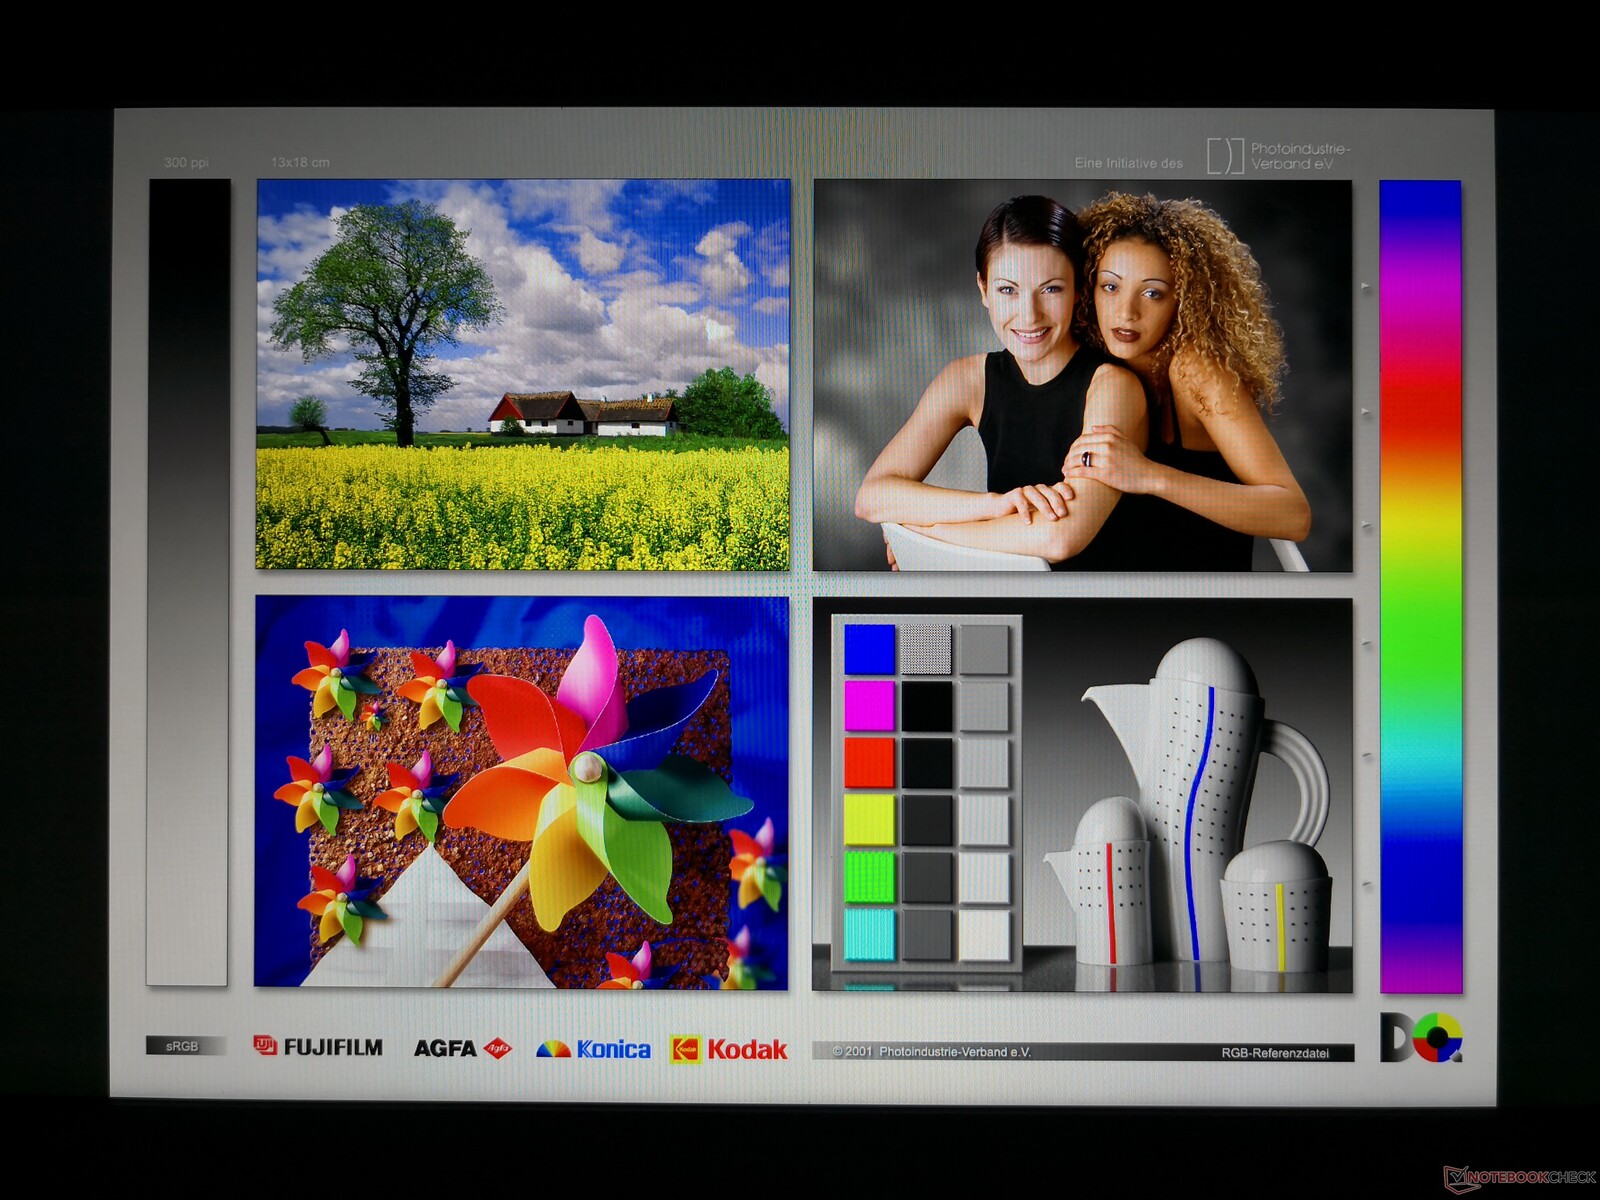
A Cúpula B15 usa o mesmo painel IPS IPS mate Chi Mei N156HCE-EN1 que se encontra no 2019 MSI PS63 Moderno. Na verdade, este painel é bastante comum em laptops de 15,6 polegadas, incluindo o PensePad P52ThinkPad X1 Extreme, Asus ZenBook Pro UX550e até mesmo a própria MSI Modern 15. A qualidade de imagem é portanto semelhante entre todos esses laptops, incluindo o tempo médio de resposta branco-preto e a relação de contraste decente. A modulação da largura de pulso com níveis de brilho mais baixos também está de volta.
| |||||||||||||||||||||||||
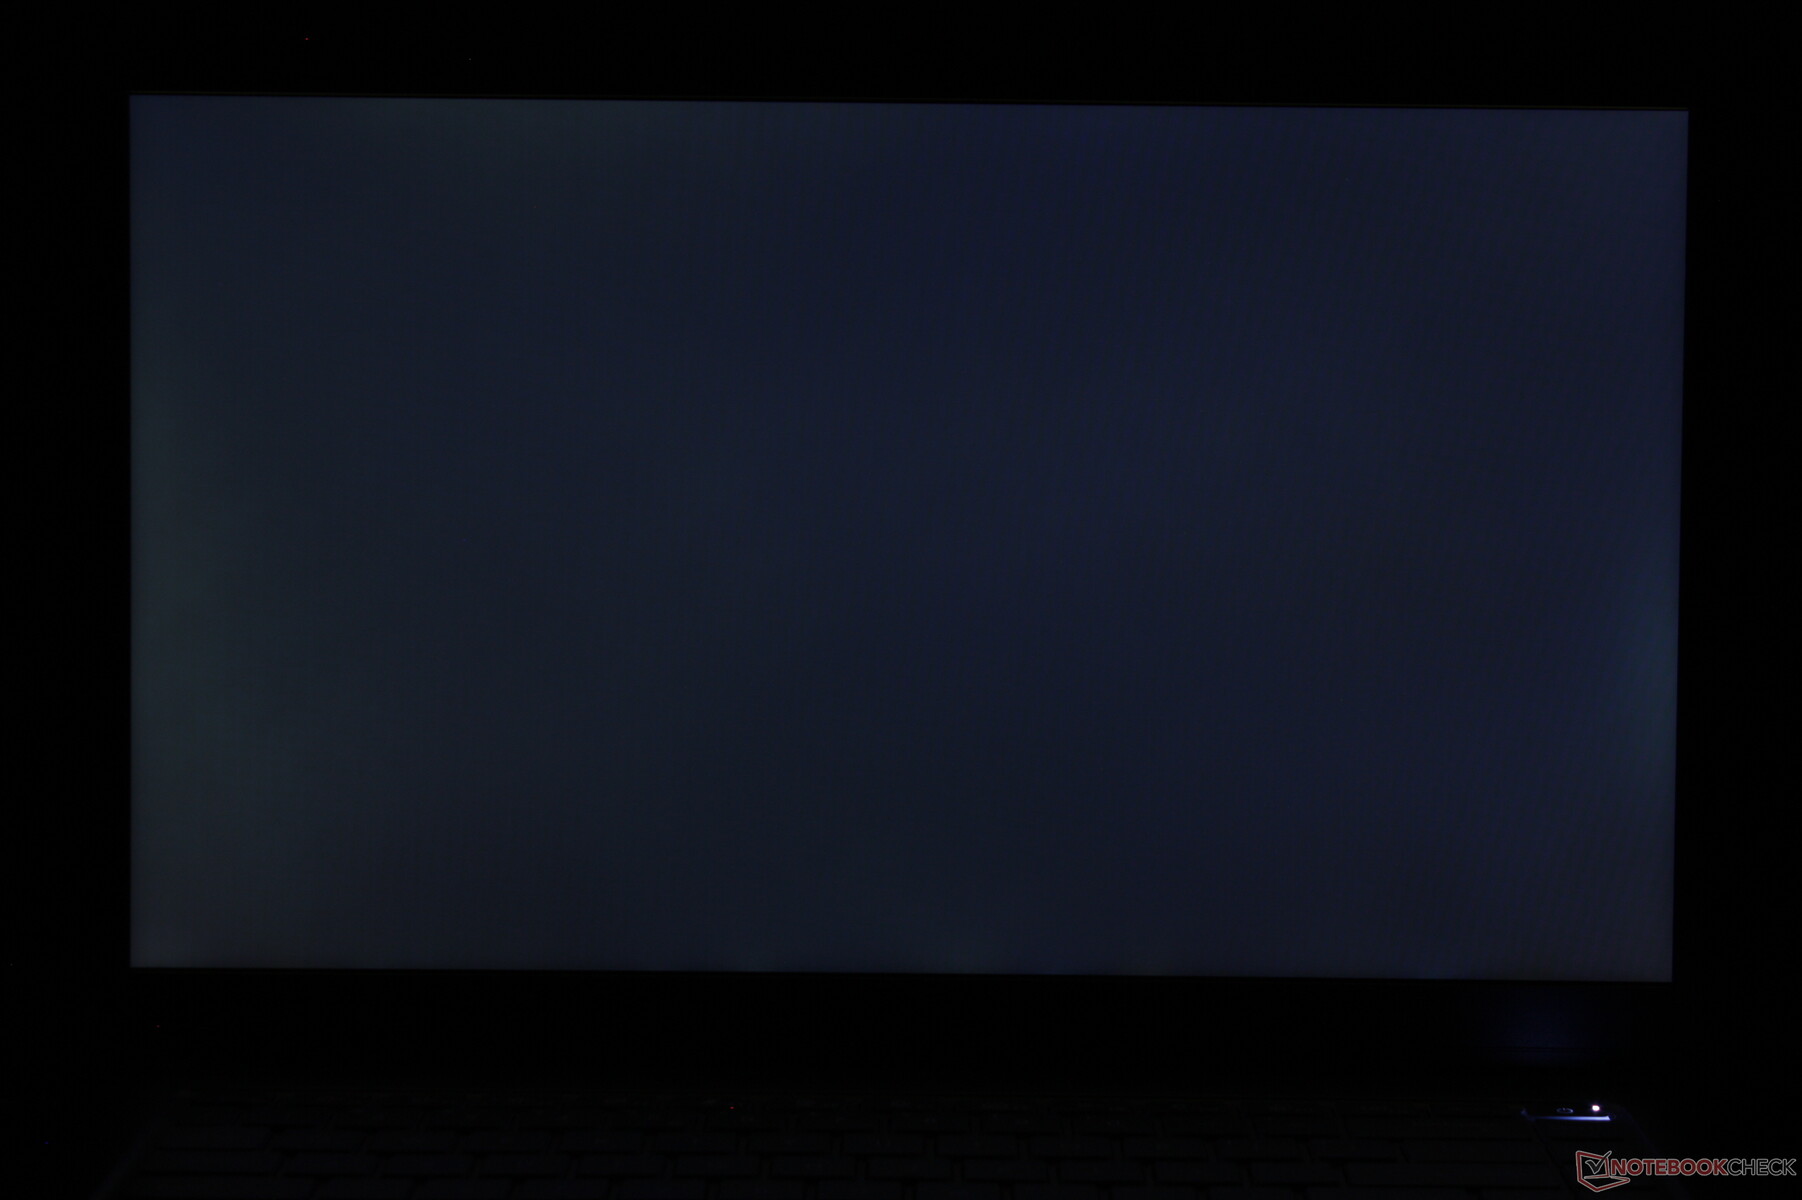
iluminação: 81 %
iluminação com acumulador: 341.3 cd/m²
Contraste: 758:1 (Preto: 0.45 cd/m²)
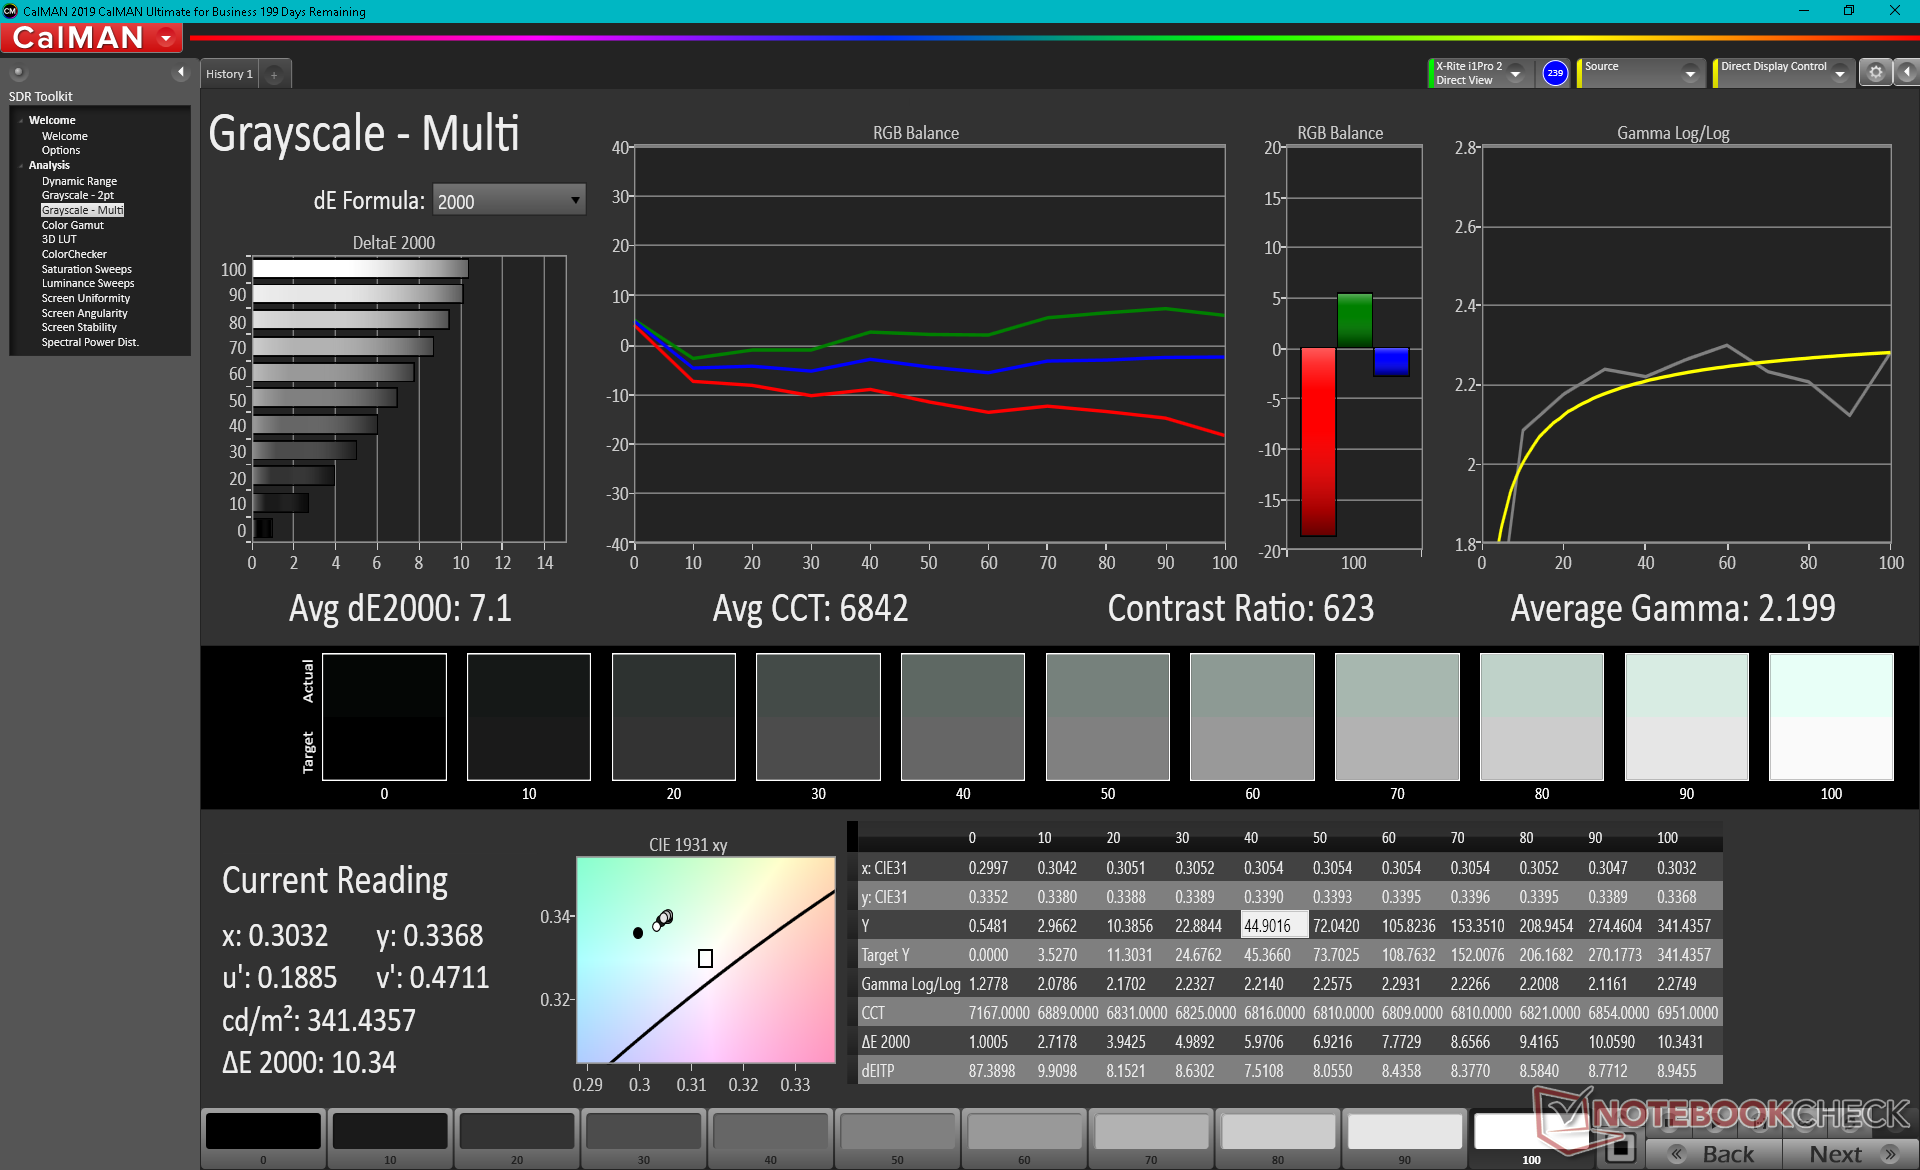
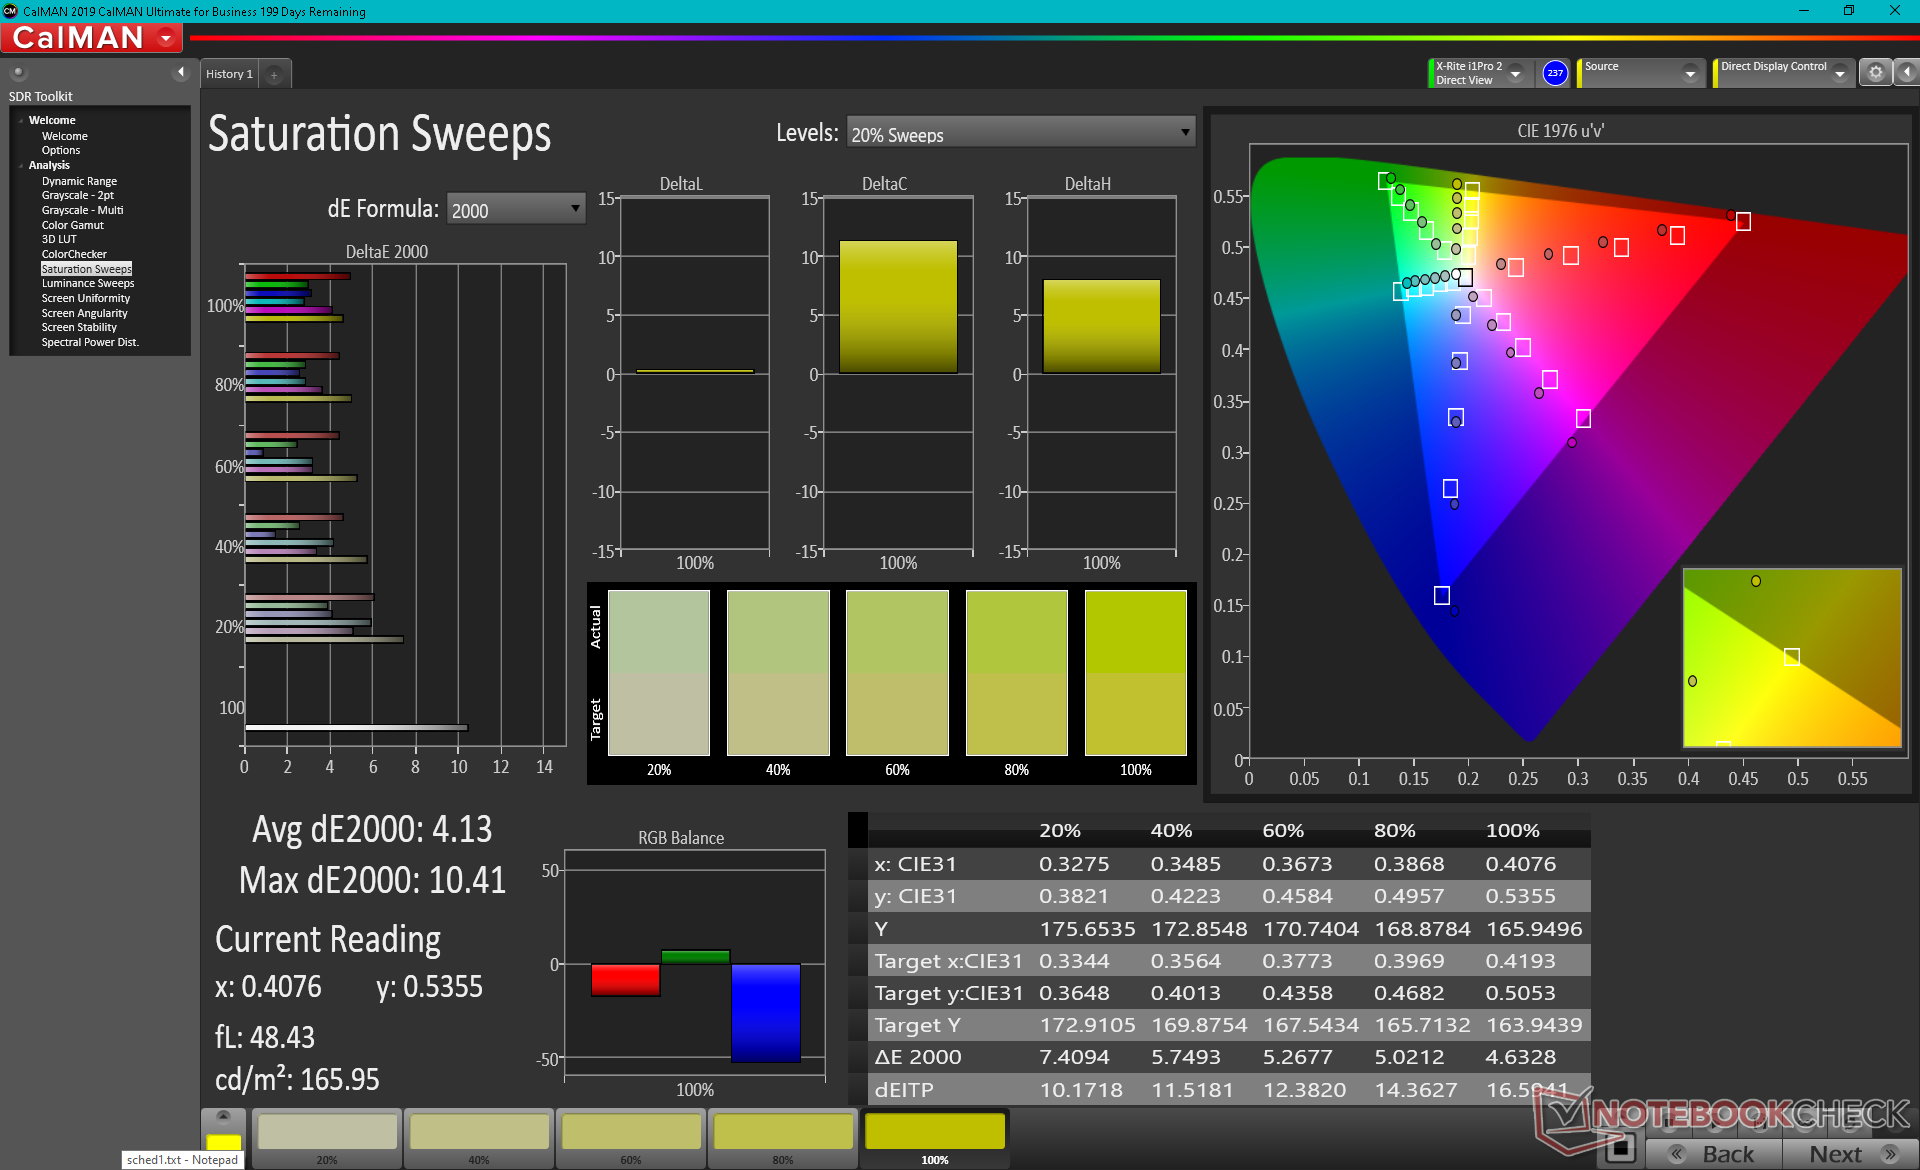
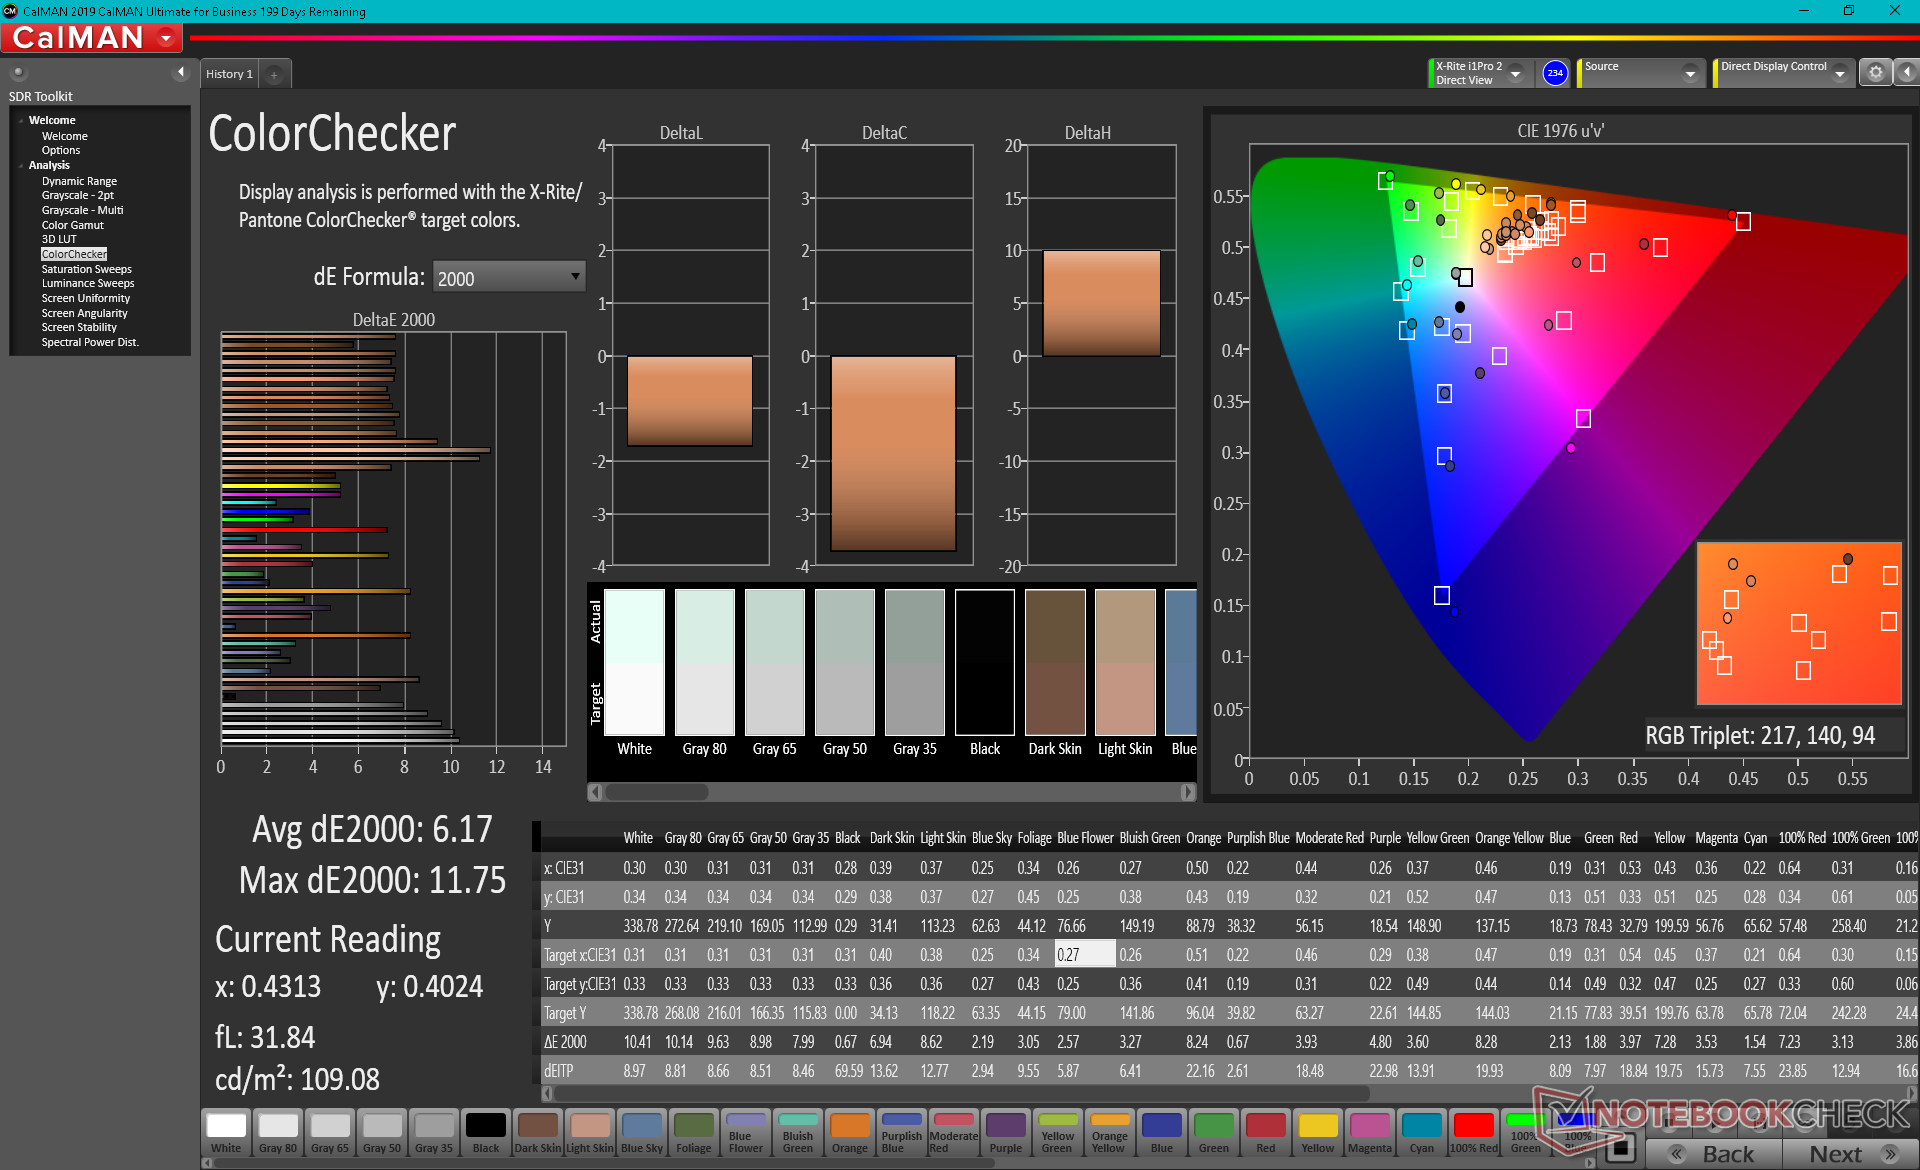
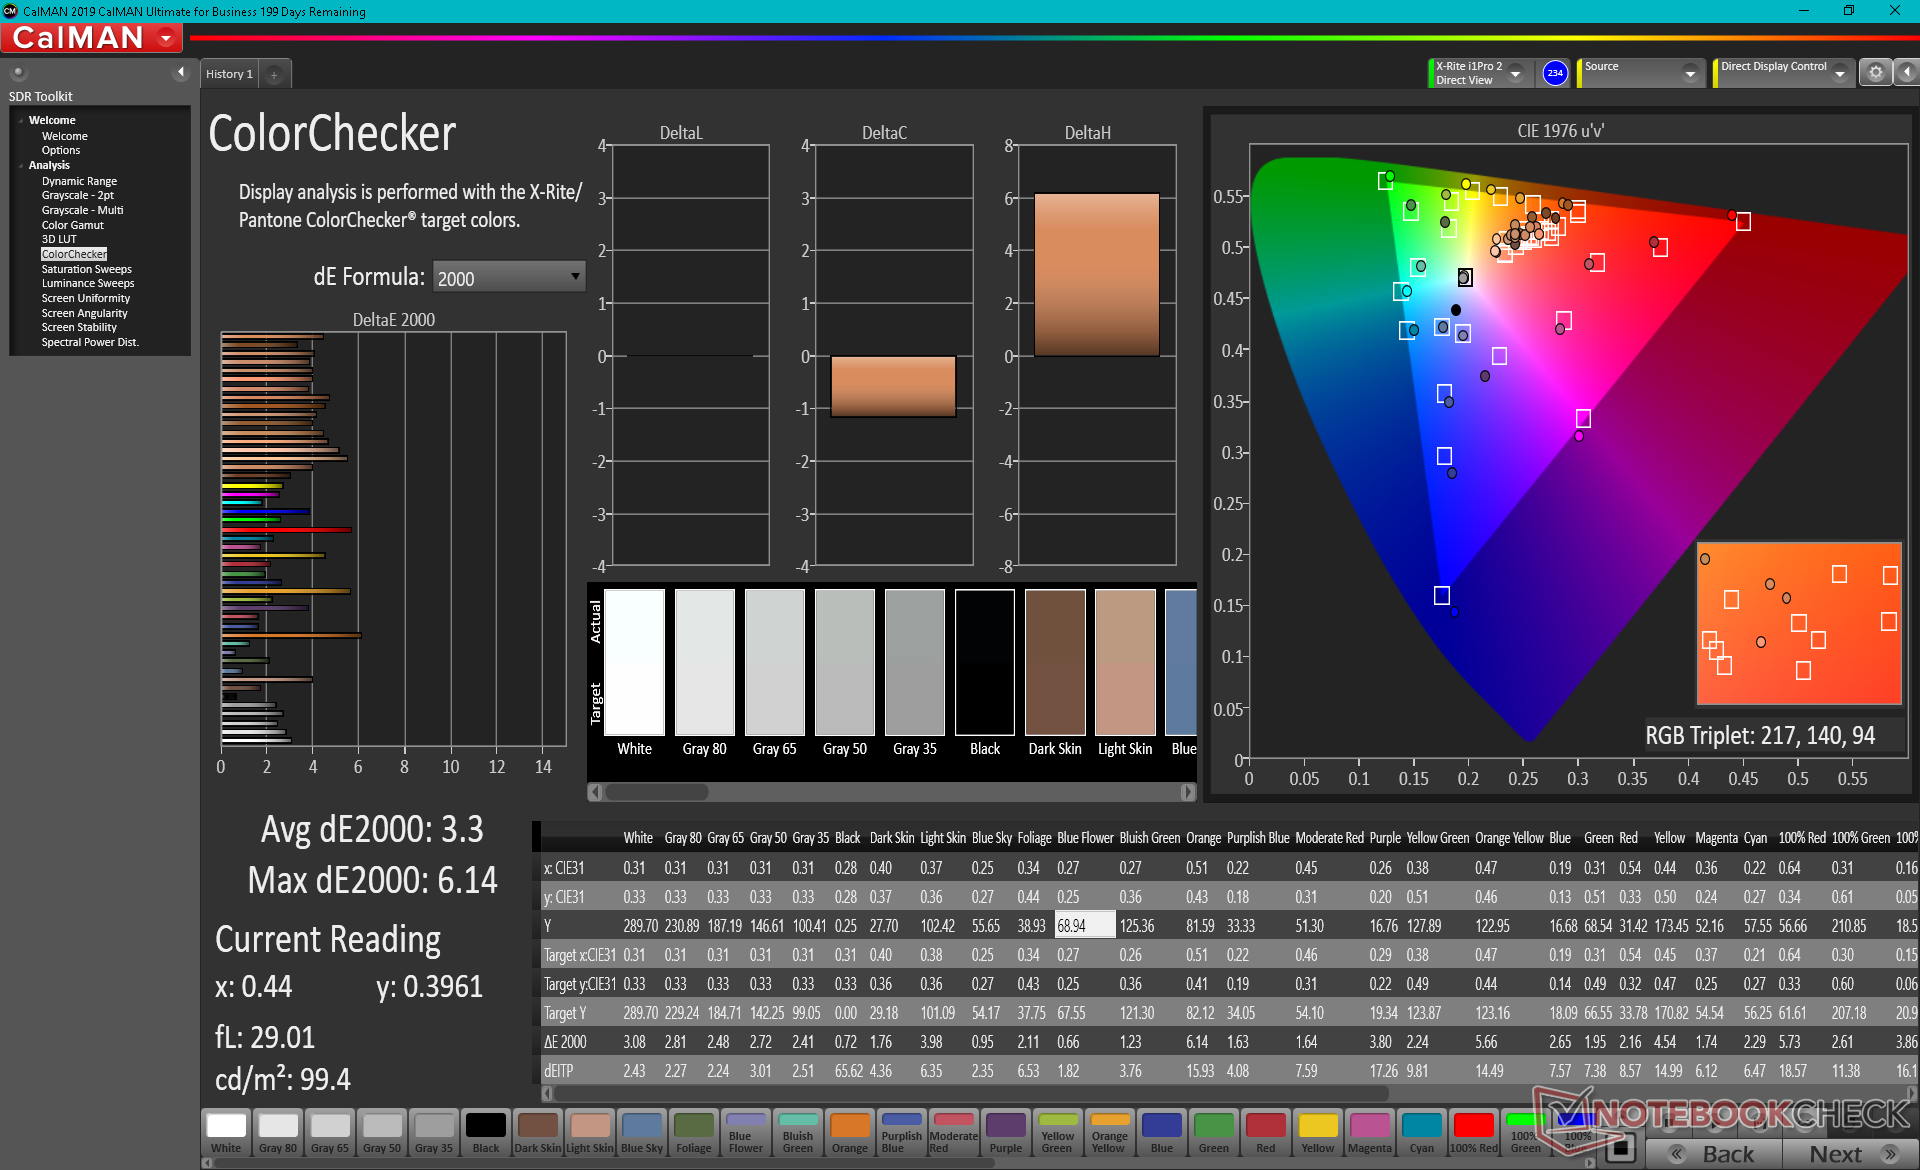
ΔE ColorChecker Calman: 6.17 | ∀{0.5-29.43 Ø4.71}
calibrated: 3.3
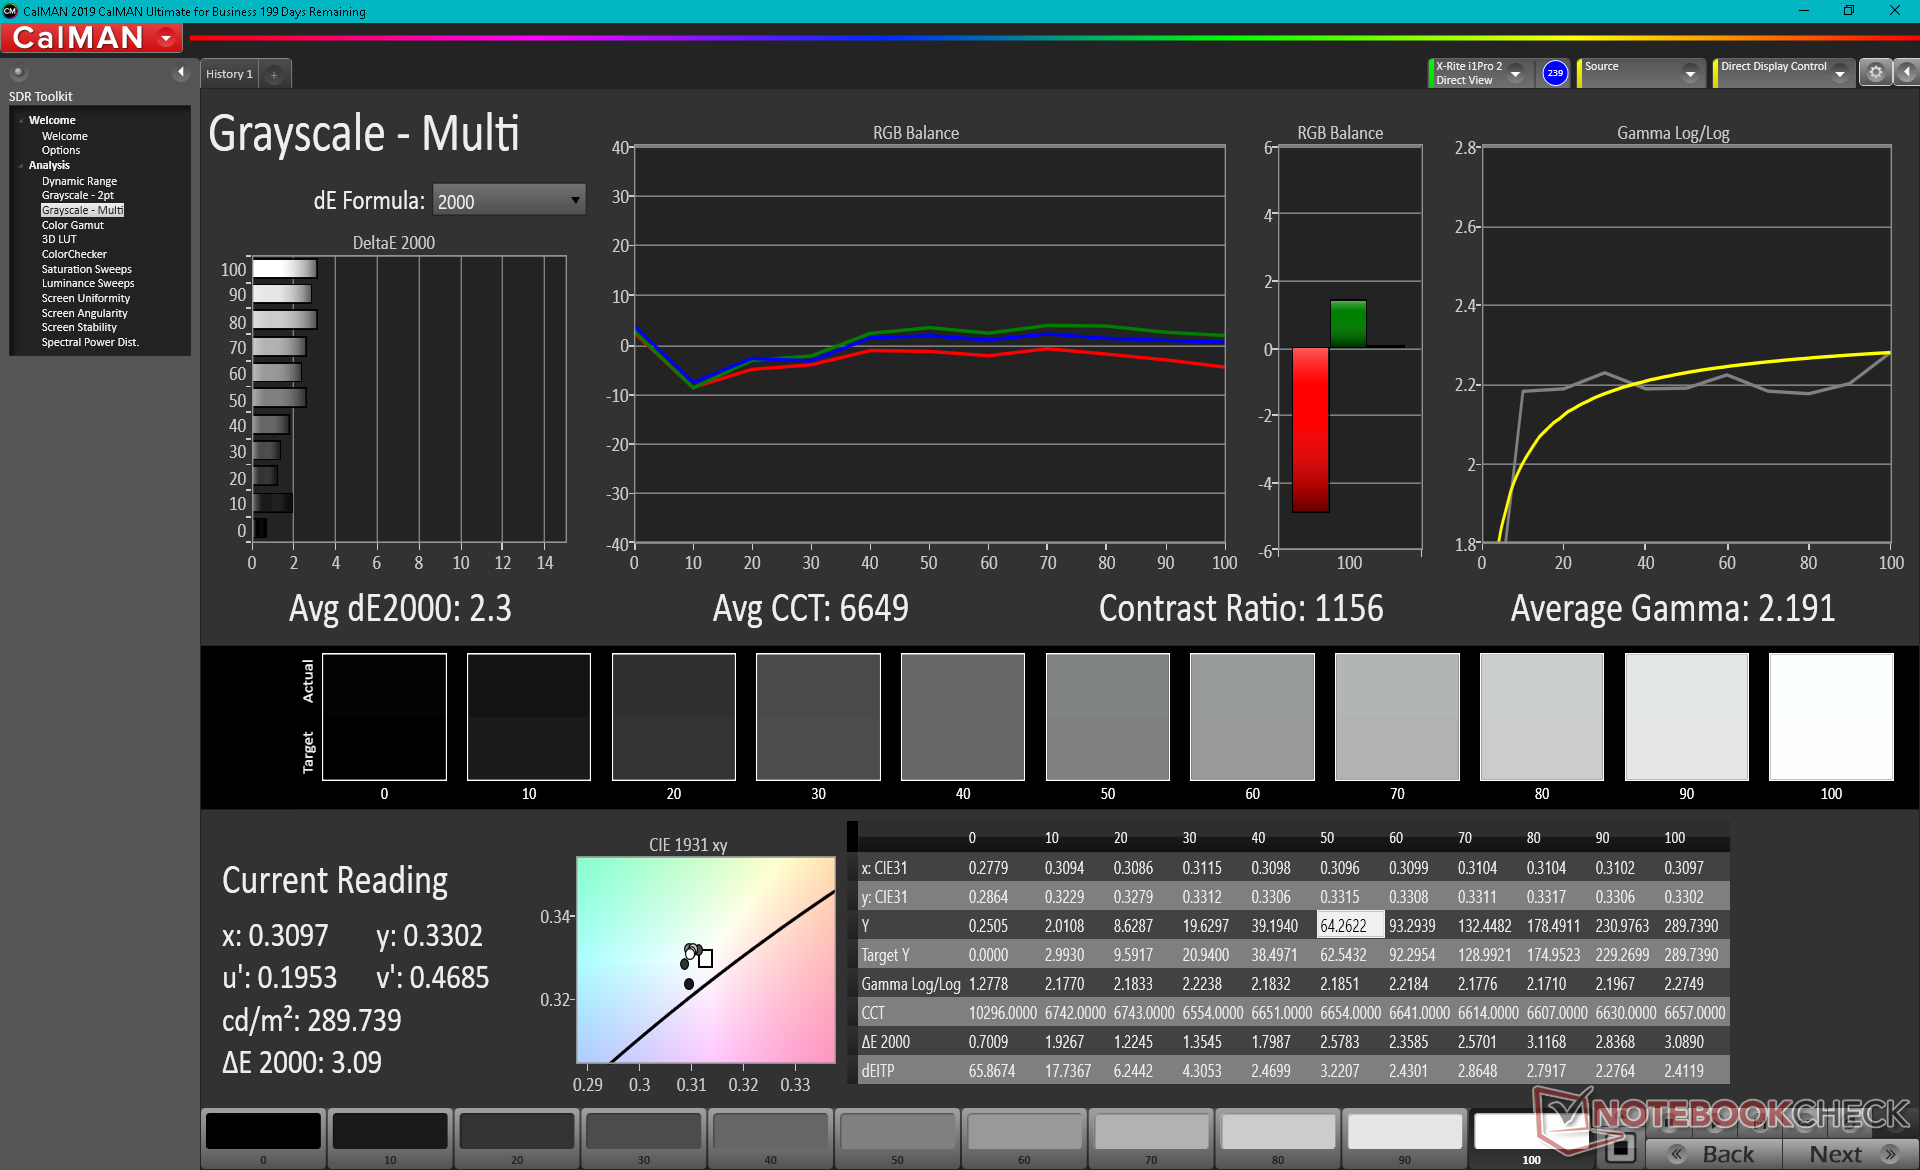
ΔE Greyscale Calman: 7.1 | ∀{0.09-98 Ø4.96}
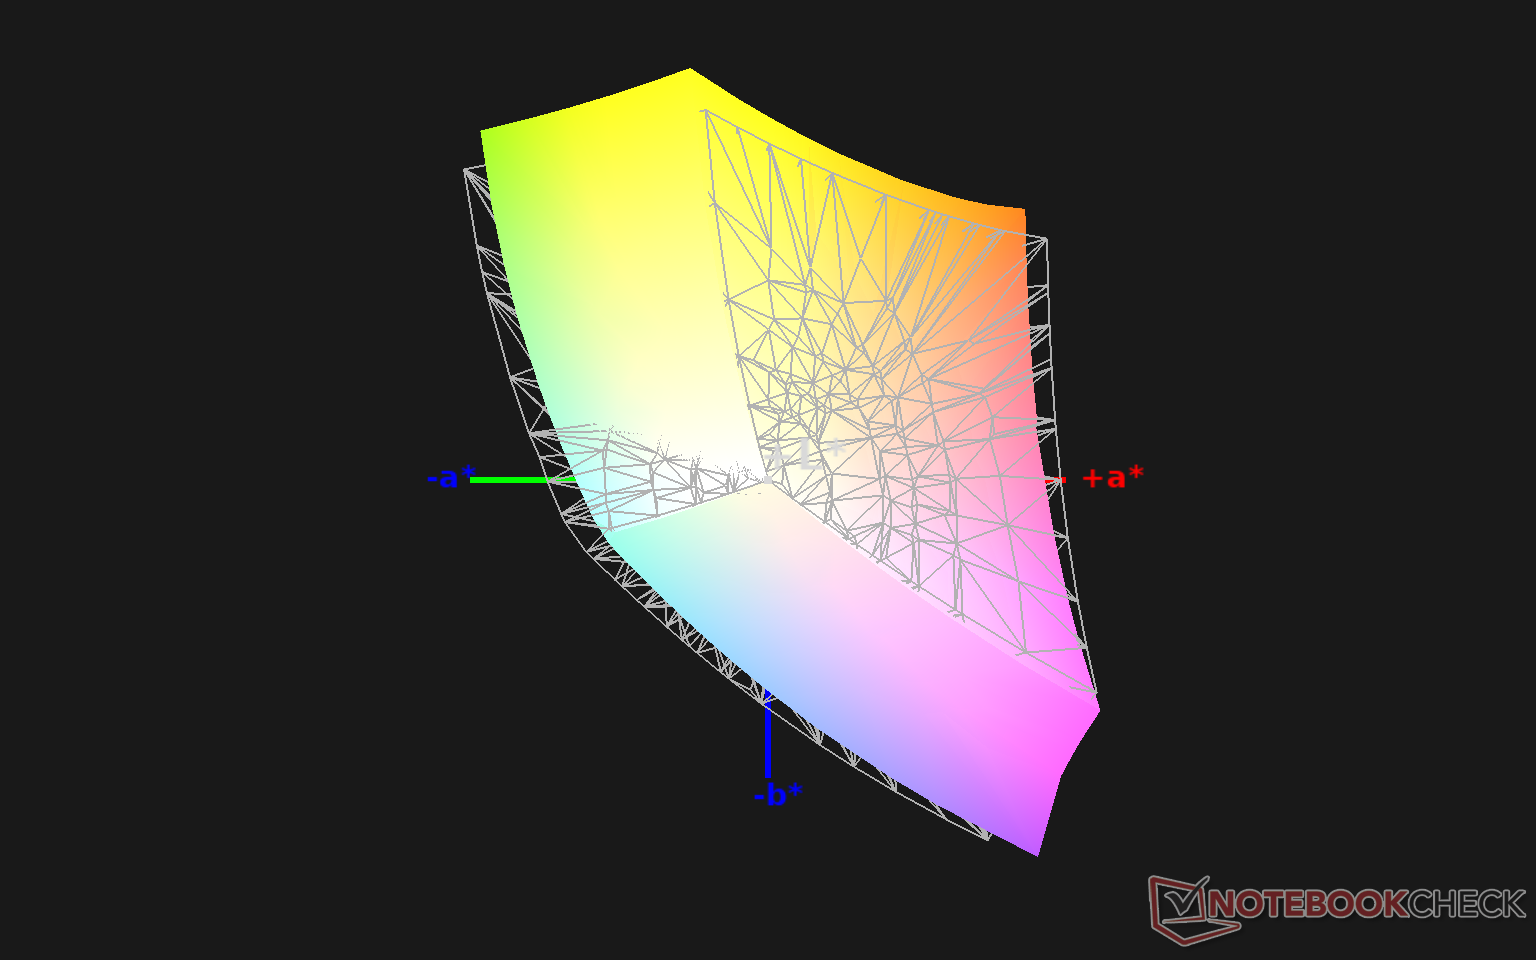
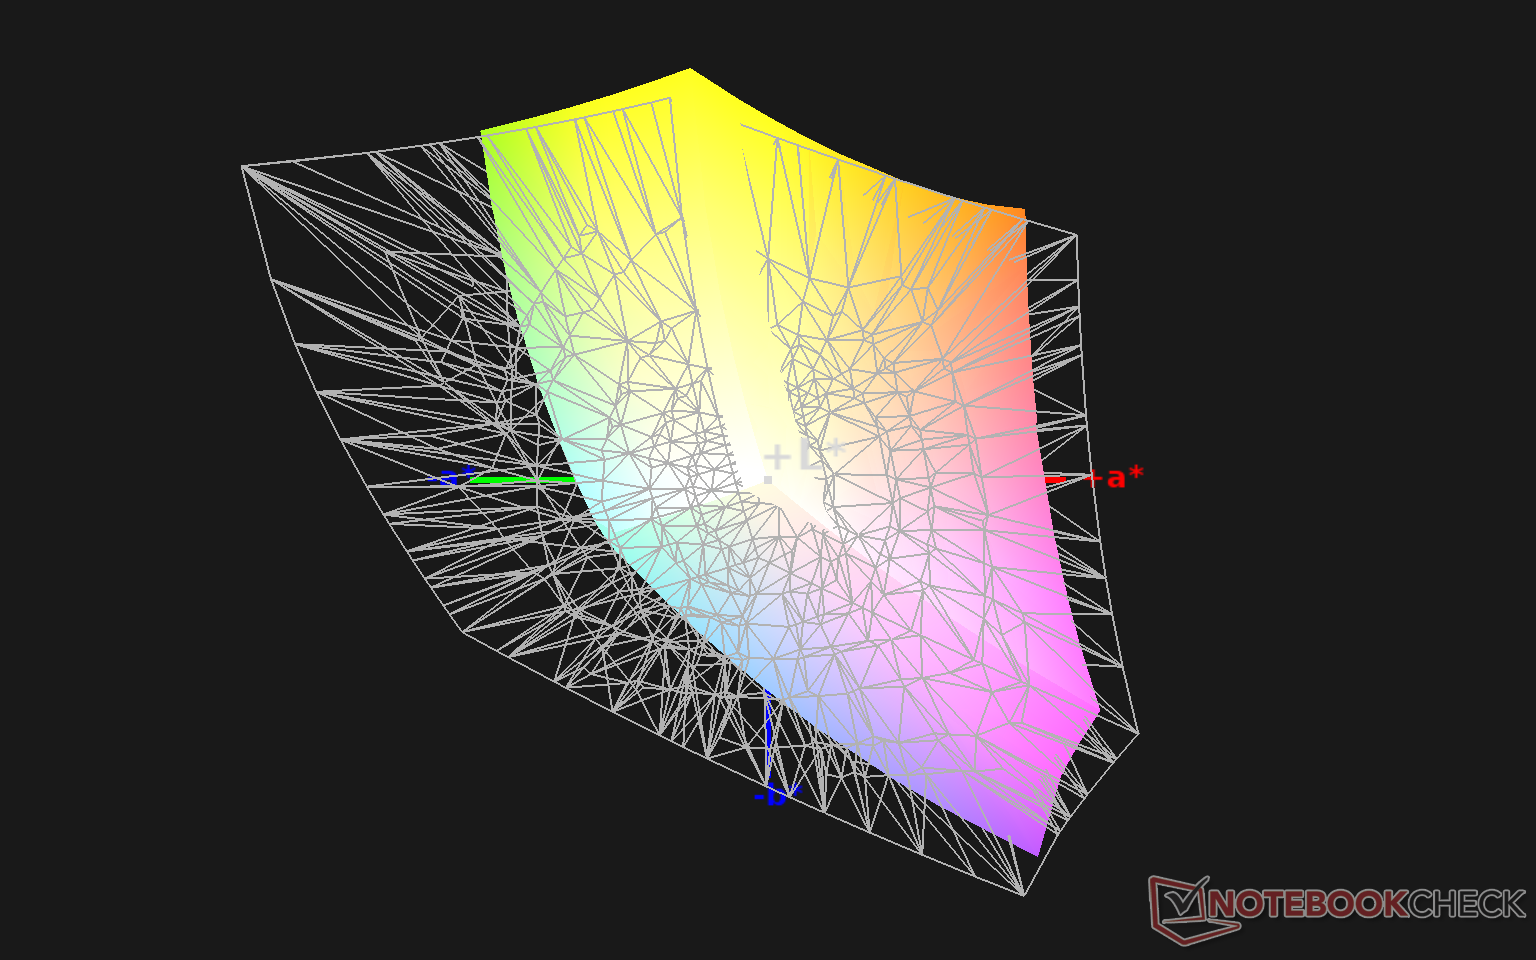
90.1% sRGB (Argyll 1.6.3 3D)
58.7% AdobeRGB 1998 (Argyll 1.6.3 3D)
66% AdobeRGB 1998 (Argyll 3D)
90.6% sRGB (Argyll 3D)
65.7% Display P3 (Argyll 3D)
Gamma: 2.2
CCT: 6842 K
| MSI Summit B15 A11M Chi Mei N156HCE-EN1, IPS, 15.6", 1920x1080 | MSI Summit E15 A11SCST AU Optronics B156HAB03.1, IPS, 15.6", 1920x1080 | Dell XPS 15 9500 Core i5 Sharp LQ156N1, IPS, 15.6", 1920x1200 | HP Spectre X360 15-5ZV31AV AU Optronics AUO30EB, IPS, 15.6", 3840x2160 | ADATA XPG Xenia Xe BOE08F5, IPS, 15.6", 1920x1080 | Asus ZenBook 15 UX534FTC-A8190T BOE CQ NV156FHM-N63, IPS, 15.6", 1920x1080 | |
|---|---|---|---|---|---|---|
| Display | -1% | 18% | 4% | 7% | -4% | |
| Display P3 Coverage (%) | 65.7 | 64.5 -2% | 81.5 24% | 68.3 4% | 70 7% | 65 -1% |
| sRGB Coverage (%) | 90.6 | 89.3 -1% | 100 10% | 94.3 4% | 95.2 5% | 86.2 -5% |
| AdobeRGB 1998 Coverage (%) | 66 | 65.3 -1% | 79.6 21% | 68.4 4% | 71.2 8% | 62.9 -5% |
| Response Times | -1% | 4% | -34% | -31% | -5% | |
| Response Time Grey 50% / Grey 80% * (ms) | 40.4 ? | 43.2 ? -7% | 42 ? -4% | 56.8 ? -41% | 56.8 ? -41% | 45 ? -11% |
| Response Time Black / White * (ms) | 32.4 ? | 30.8 ? 5% | 28.8 ? 11% | 40.8 ? -26% | 38.8 ? -20% | 32 ? 1% |
| PWM Frequency (Hz) | 25510 ? | |||||
| Screen | 20% | 41% | 22% | 39% | 22% | |
| Brightness middle (cd/m²) | 341.3 | 298 -13% | 592 73% | 284.6 -17% | 480.4 41% | 299 -12% |
| Brightness (cd/m²) | 310 | 280 -10% | 565 82% | 285 -8% | 451 45% | 280 -10% |
| Brightness Distribution (%) | 81 | 90 11% | 85 5% | 85 5% | 88 9% | 89 10% |
| Black Level * (cd/m²) | 0.45 | 0.22 51% | 0.46 -2% | 0.25 44% | 0.31 31% | 0.21 53% |
| Contrast (:1) | 758 | 1355 79% | 1287 70% | 1138 50% | 1550 104% | 1424 88% |
| Colorchecker dE 2000 * | 6.17 | 5.41 12% | 3.19 48% | 3.52 43% | 2.53 59% | 4.76 23% |
| Colorchecker dE 2000 max. * | 11.75 | 8.59 27% | 5.45 54% | 5.56 53% | 7.28 38% | 9 23% |
| Colorchecker dE 2000 calibrated * | 3.3 | 2.97 10% | 2.03 38% | 3 9% | 1.69 49% | |
| Greyscale dE 2000 * | 7.1 | 4.1 42% | 3.9 45% | 3.2 55% | 3.8 46% | 3.53 50% |
| Gamma | 2.2 100% | 2.334 94% | 2.25 98% | 2.28 96% | 2.15 102% | 2.3 96% |
| CCT | 6842 95% | 7025 93% | 6522 100% | 7070 92% | 6760 96% | 7228 90% |
| Color Space (Percent of AdobeRGB 1998) (%) | 58.7 | 65 11% | 71.6 22% | 61.1 4% | 63 7% | 56 -5% |
| Color Space (Percent of sRGB) (%) | 90.1 | 90 0% | 100 11% | 93.8 4% | 94.9 5% | 86 -5% |
| Média Total (Programa/Configurações) | 6% /
13% | 21% /
32% | -3% /
12% | 5% /
25% | 4% /
13% |
* ... menor é melhor
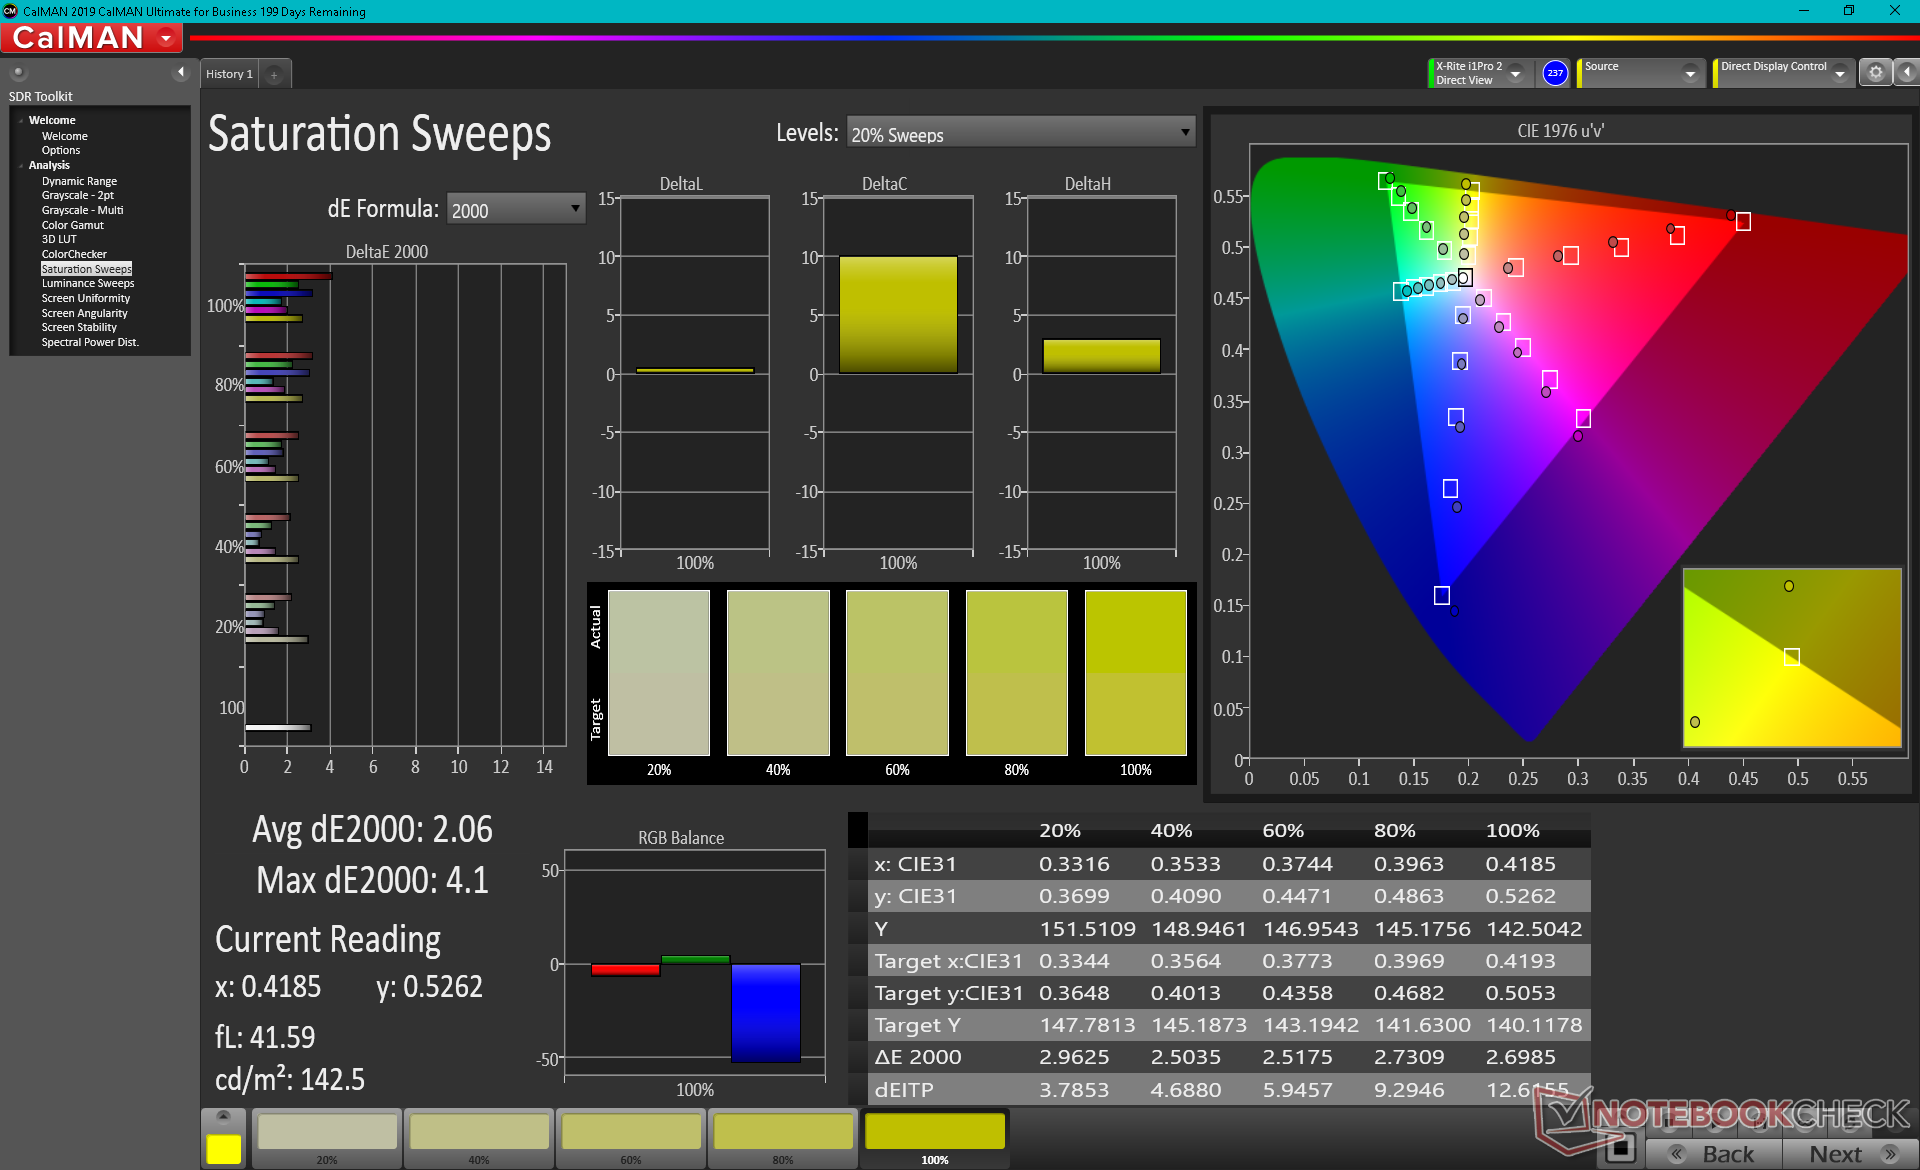
O espaço de cores cobre aproximadamente 90% do sRGB para ser bom o suficiente para o editor gráfico casual alvo. Você terá que gastar mais em modelos alternativos 4K ou OLED da Dell, HP, ou outros se a cobertura AdobeRGB for seu alvo.
As medições do colorímetro X-Rite revelam uma temperatura de cor fora da caixa excessivamente fria para uma fraca reprodução em escala de cinza e cor, apesar da cobertura relativamente alta de 90 por cento sRGB. Os dados fazem sentido porque a MSI não pré-calibra a série B15 da Summit na fábrica. As cores e a escala de cinza melhoram significativamente após a calibração com valores médios DeltaE muito mais baixos. Recomendamos aplicar nosso perfil de ICM calibrado para uma visualização mais precisa das cores.
Exibir tempos de resposta
| ↔ Tempo de resposta preto para branco | ||
|---|---|---|
| 32.4 ms ... ascensão ↗ e queda ↘ combinadas | ↗ 18.4 ms ascensão | 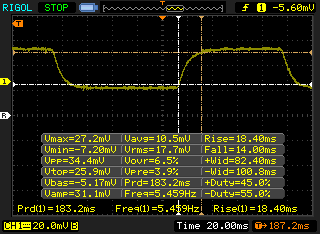 |
| ↘ 14 ms queda | ||
| A tela mostra taxas de resposta lentas em nossos testes e será insatisfatória para os jogadores. Em comparação, todos os dispositivos testados variam de 0.1 (mínimo) a 240 (máximo) ms. » 88 % de todos os dispositivos são melhores. Isso significa que o tempo de resposta medido é pior que a média de todos os dispositivos testados (19.8 ms). | ||
| ↔ Tempo de resposta 50% cinza a 80% cinza | ||
| 40.4 ms ... ascensão ↗ e queda ↘ combinadas | ↗ 20.4 ms ascensão | 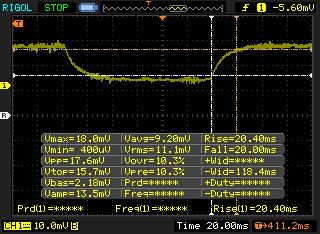 |
| ↘ 20 ms queda | ||
| A tela mostra taxas de resposta lentas em nossos testes e será insatisfatória para os jogadores. Em comparação, todos os dispositivos testados variam de 0.165 (mínimo) a 636 (máximo) ms. » 64 % de todos os dispositivos são melhores. Isso significa que o tempo de resposta medido é pior que a média de todos os dispositivos testados (30.9 ms). | ||
Cintilação da tela / PWM (modulação por largura de pulso)
| Tela tremeluzindo/PWM detectado | 25510 Hz | ≤ 25 % configuração de brilho | 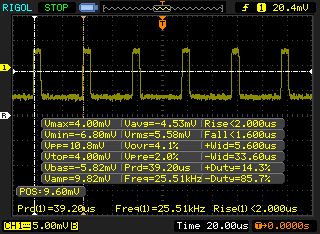 |
A luz de fundo da tela pisca em 25510 Hz (pior caso, por exemplo, utilizando PWM) Cintilação detectada em uma configuração de brilho de 25 % e abaixo. Não deve haver cintilação ou PWM acima desta configuração de brilho. A frequência de 25510 Hz é bastante alta, então a maioria dos usuários sensíveis ao PWM não deve notar nenhuma oscilação. [pwm_comparison] Em comparação: 52 % de todos os dispositivos testados não usam PWM para escurecer a tela. Se PWM foi detectado, uma média de 7748 (mínimo: 5 - máximo: 343500) Hz foi medida. | |||
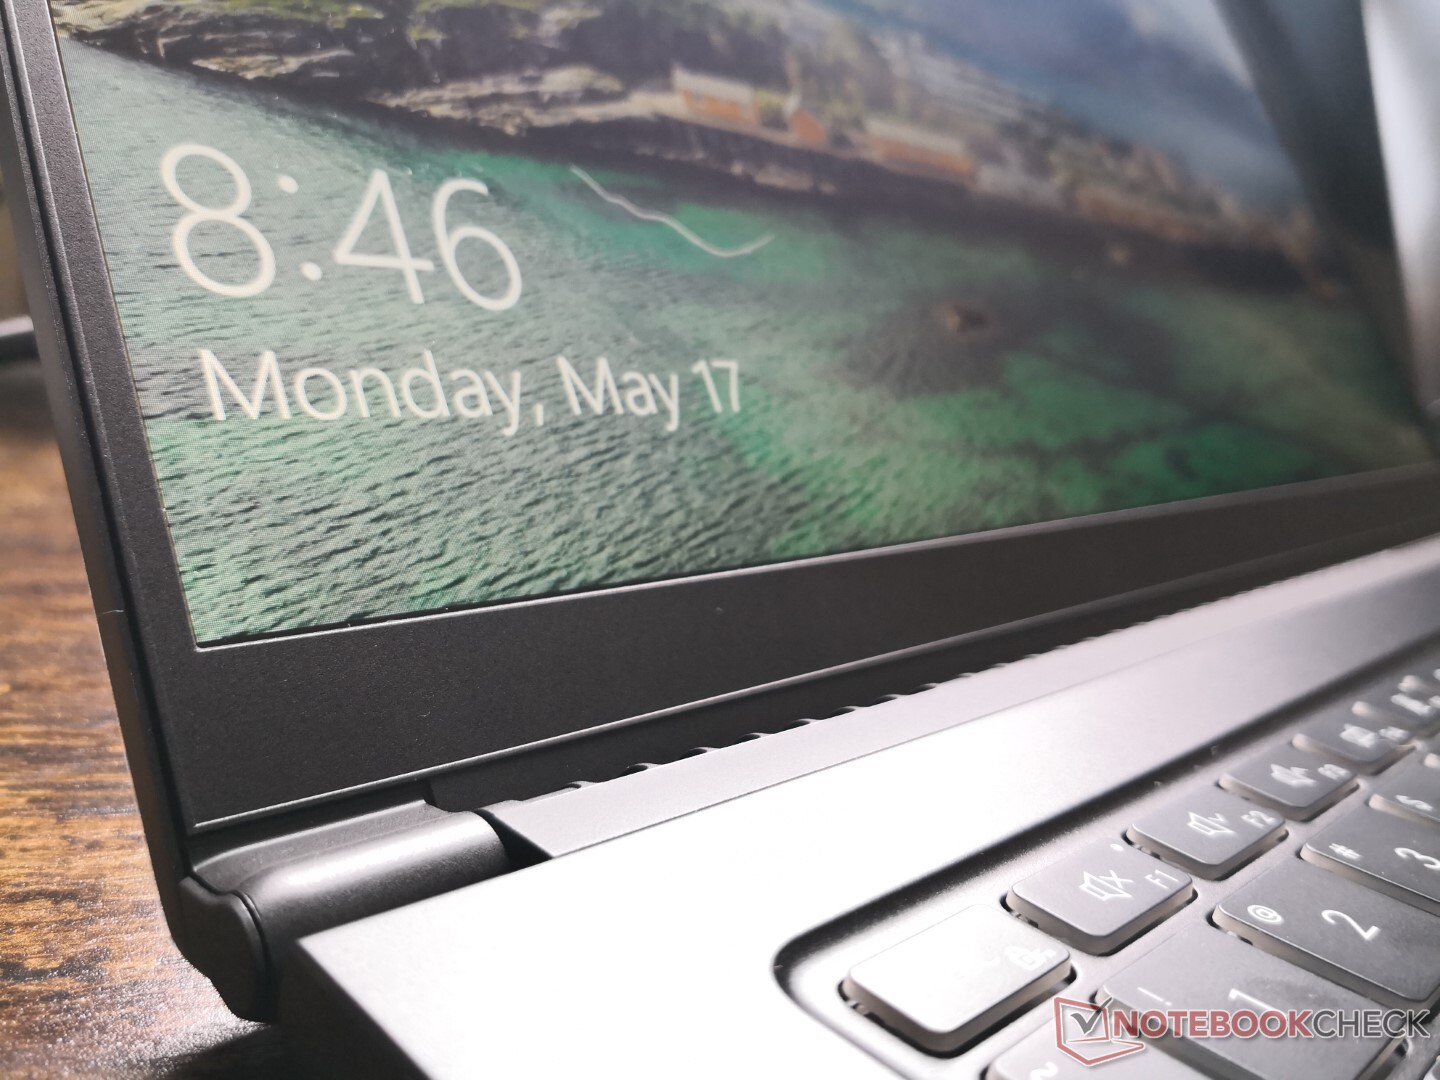
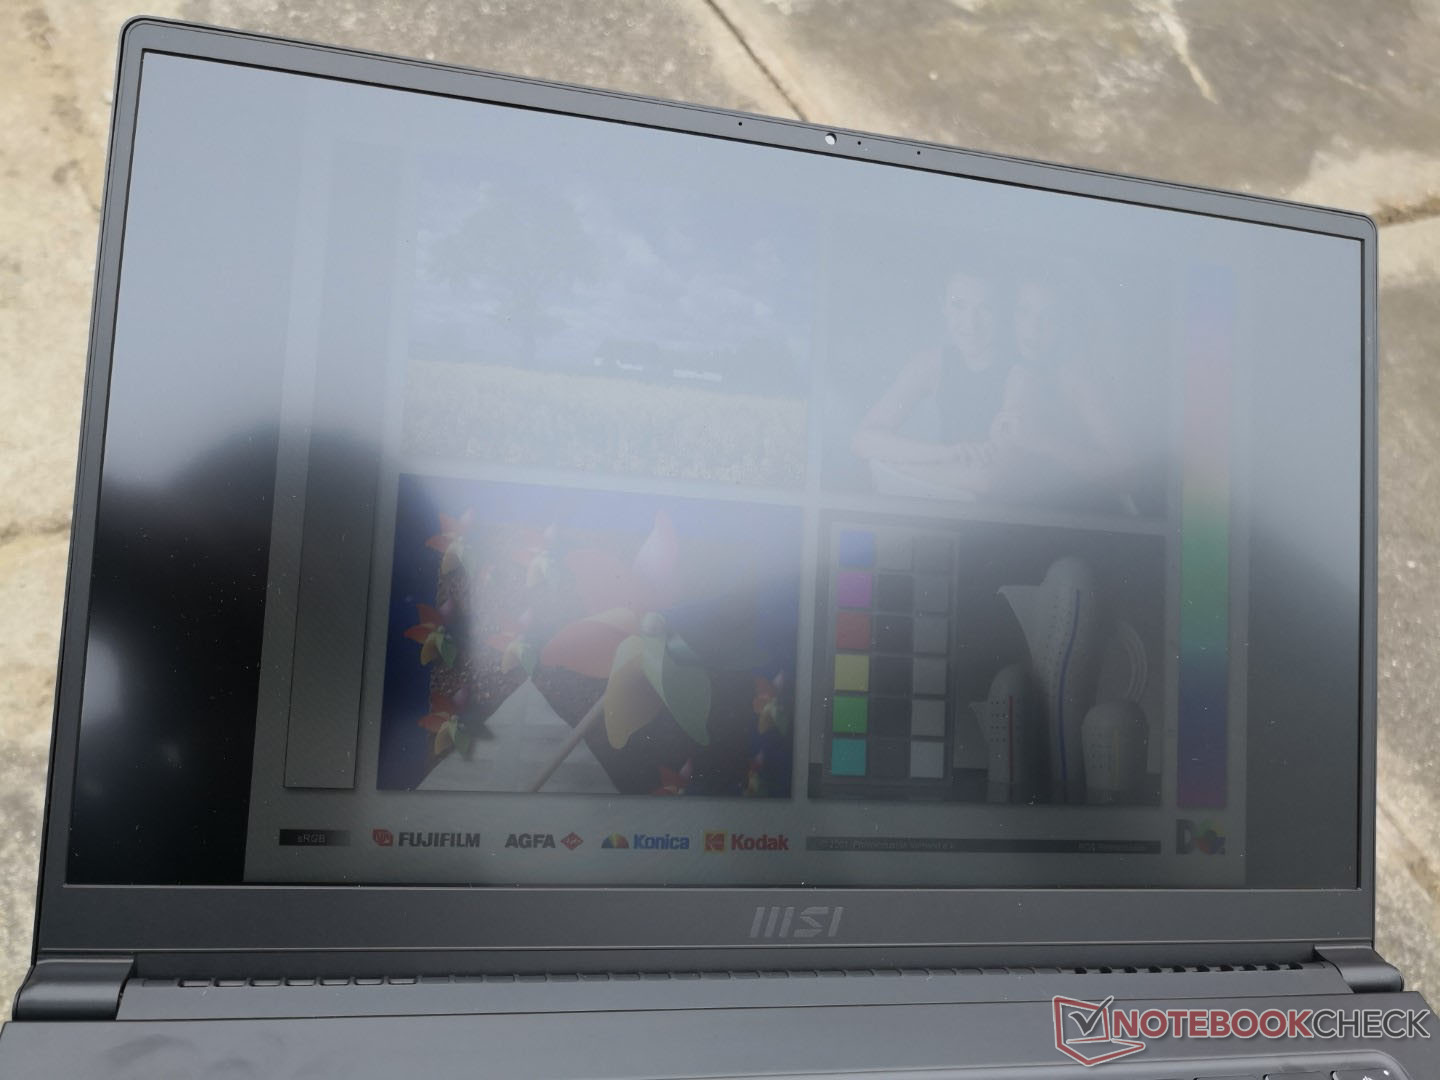
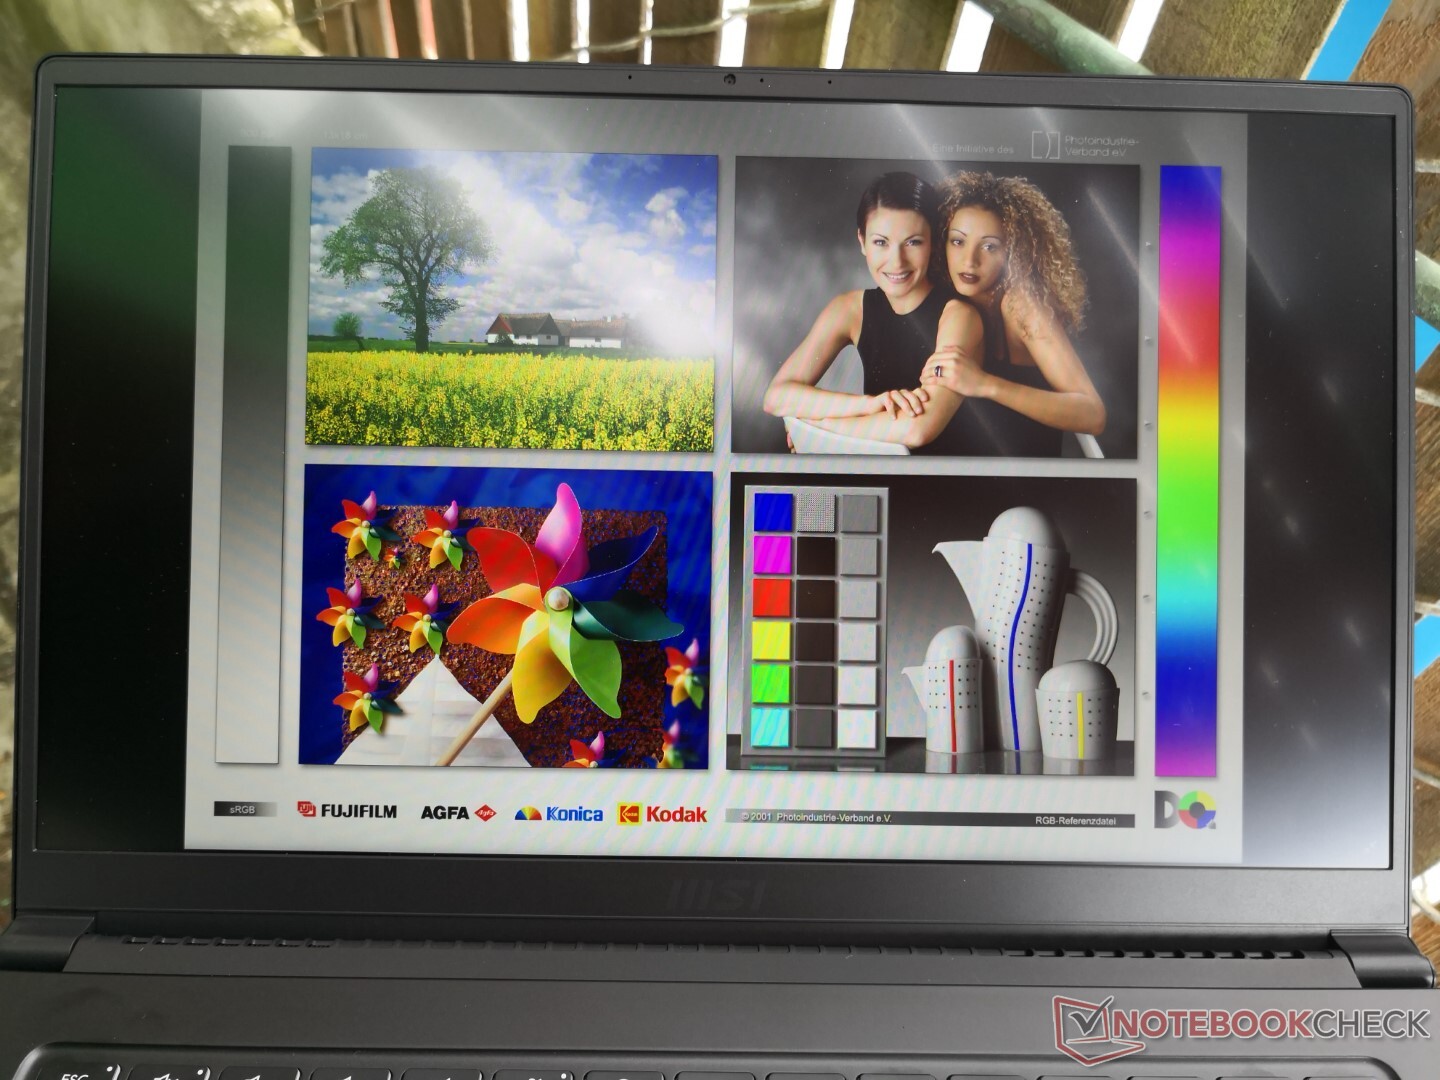
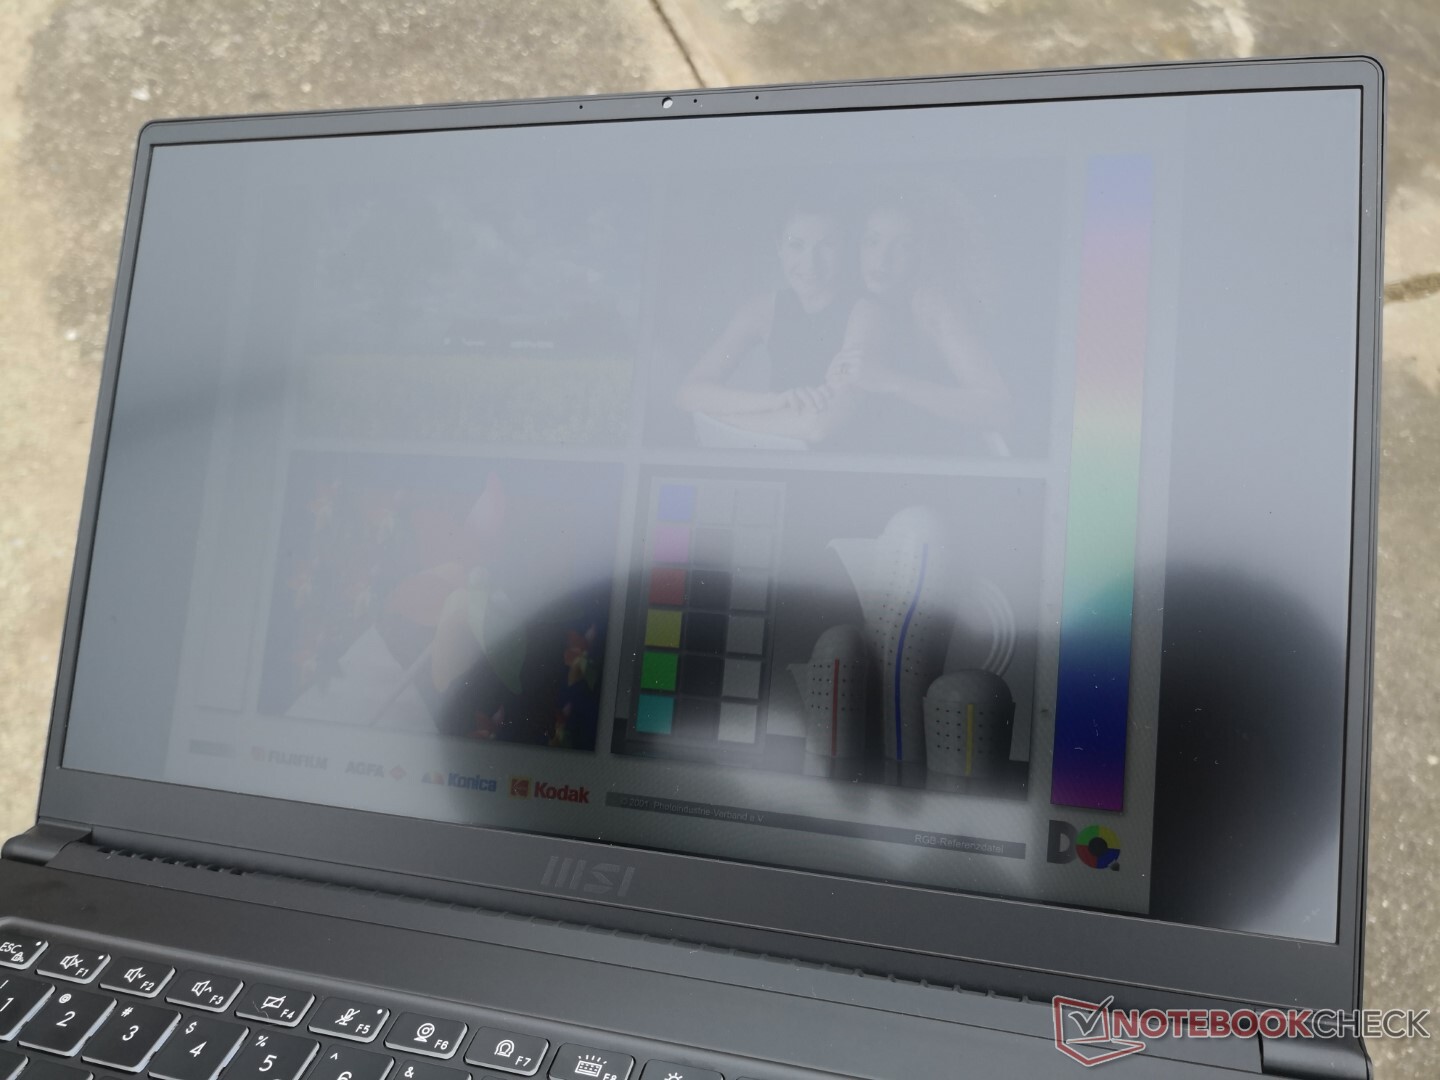
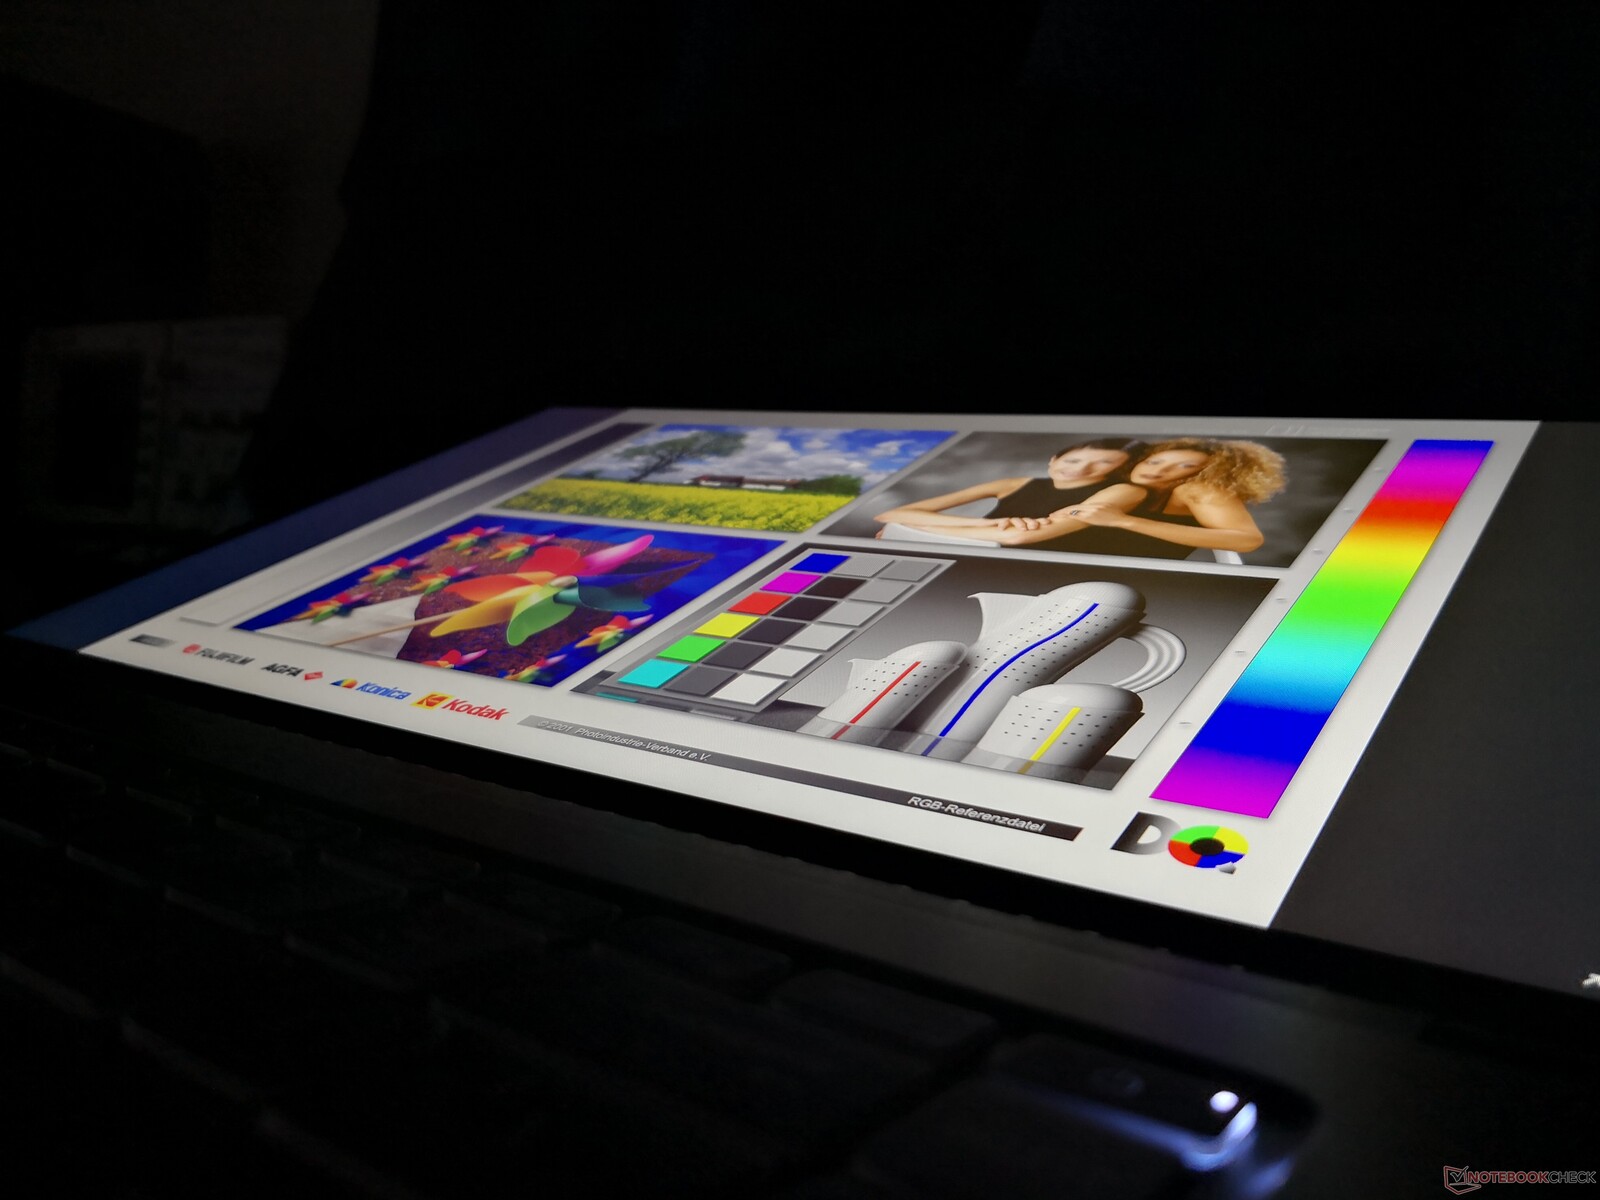
A visibilidade ao ar livre não é tão boa quanto o Dell XPS 15 ou MacBook Pro 15 ambos com visores visivelmente mais brilhantes. O brilho não é tão intenso no MSI devido a seu painel fosco, mas o visor ainda é difícil de ver confortavelmente na maioria dos cenários.
Desempenho
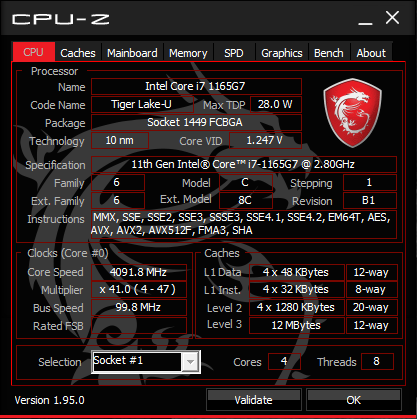
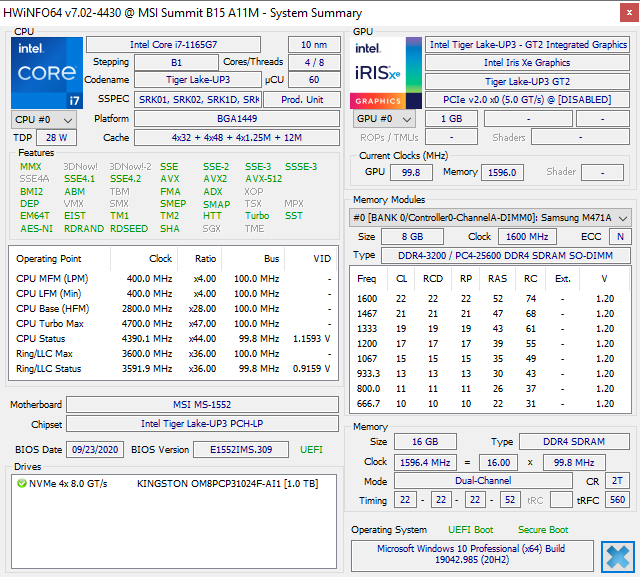
Somente dois SKUs estão disponíveis a partir desta escrita com o ULV Core i5-1135G7 ou Core i7-1165G7. Para opções mais rápidas do Core H, a MSI oferece a série Z16 do Criador.
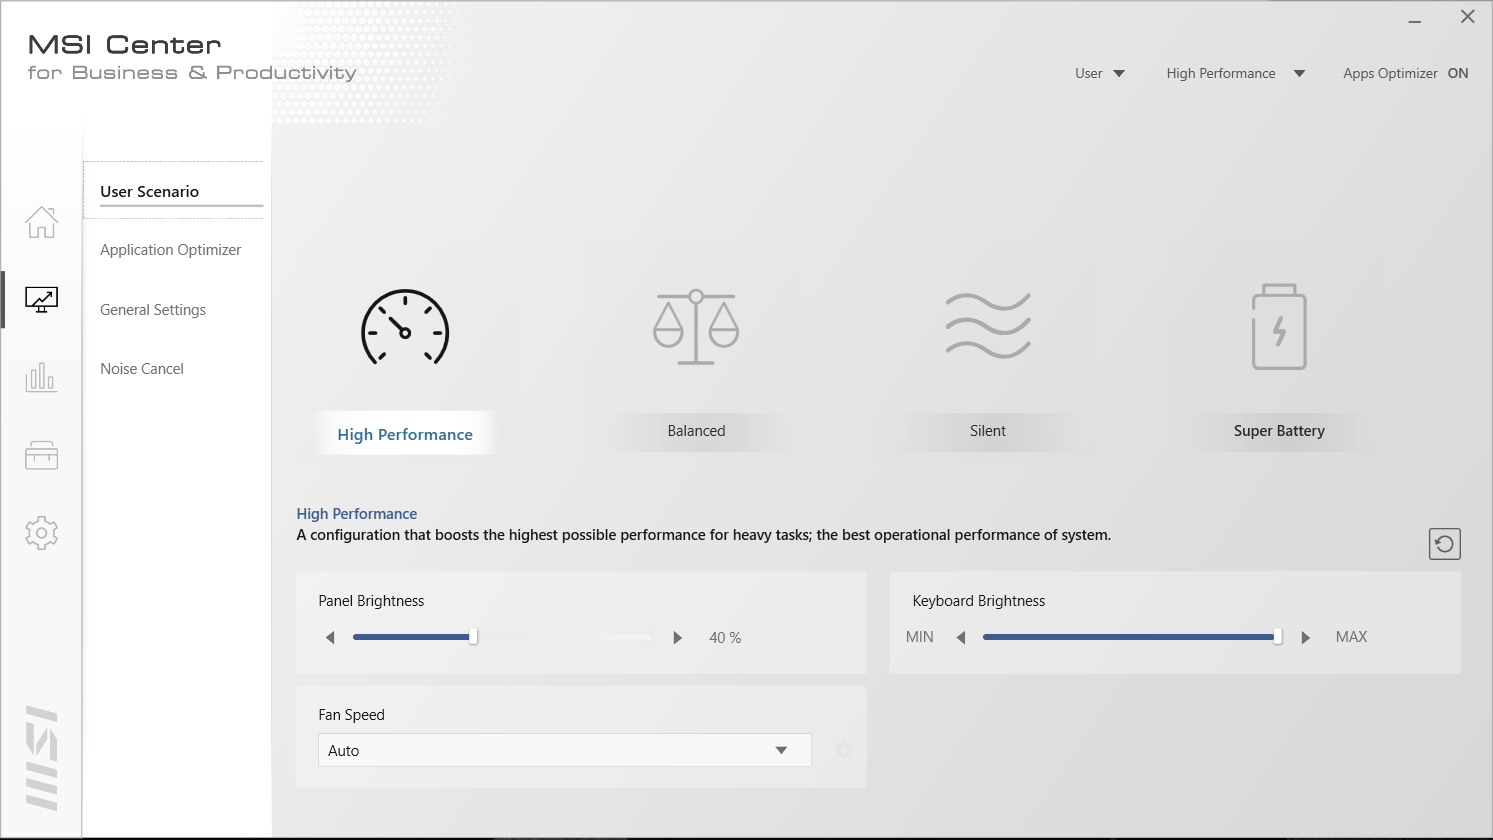
Nossa unidade foi configurada para o modo High Performance via MSI Center antes de executar quaisquer benchmarks de desempenho abaixo para obter as melhores pontuações possíveis. Recomendamos aos proprietários que se familiarizem com este software, pois as atualizações e características específicas da MSI são encontradas aqui.
Processador
O desempenho da CPU é excelente com pontuações CineBench R15 xT que são 12% mais rápidas do que a média do laptop em nosso banco de dados equipado com a mesma CPU. As pontuações do CineBench R20 e R23 são ainda melhores, com 23% acima da média, o que implica em sustentabilidade Turbo Boost superior à maioria dos outros laptops, uma vez que as pontuações R20 e R23 são significativamente mais longas que as do R15. O processador é capaz de superar de forma consistente o desempenho de ambos os 10º gen Núcleo i7-10510U e Núcleo i5-10300H no HP Spectre x360 15 e Dell XPS 15, respectivamente.
Indo para o mais barato Núcleo i5-1135G7 em vez do nosso Núcleo i7-1165G7 a configuração resultará em apenas uma leve redução de 7 a 10% no desempenho do processador com base em nossa experiência com outros laptops Core i5-1135G7.
Cinebench R23: Multi Core | Single Core
Cinebench R15: CPU Multi 64Bit | CPU Single 64Bit
Blender: v2.79 BMW27 CPU
7-Zip 18.03: 7z b 4 -mmt1 | 7z b 4
Geekbench 5.5: Single-Core | Multi-Core
HWBOT x265 Benchmark v2.2: 4k Preset
LibreOffice : 20 Documents To PDF
R Benchmark 2.5: Overall mean
| Cinebench R23 / Multi Core | |
| Lenovo IdeaPad Flex 5 14ALC05 82HU002YUS | |
| Lenovo Yoga Slim 7-14ARE | |
| MSI Summit B15 A11M | |
| MSI Summit E15 A11SCST | |
| Média Intel Core i7-1165G7 (2525 - 6862, n=64) | |
| Cinebench R23 / Single Core | |
| MSI Summit B15 A11M | |
| MSI Summit E15 A11SCST | |
| Média Intel Core i7-1165G7 (1110 - 1539, n=59) | |
| Lenovo IdeaPad Flex 5 14ALC05 82HU002YUS | |
| Lenovo Yoga Slim 7-14ARE | |
| HWBOT x265 Benchmark v2.2 / 4k Preset | |
| Lenovo Yoga Slim 7-14ARE | |
| Lenovo IdeaPad Flex 5 14ALC05 82HU002YUS | |
| Dell XPS 15 9500 Core i7 4K UHD | |
| Lenovo ThinkPad E15 Gen2-20T9S00K00 | |
| MSI Summit B15 A11M | |
| Dell XPS 15 9500 Core i5 | |
| Lenovo ThinkBook 15 Gen2 ITL | |
| MSI Summit E15 A11SCST | |
| Lenovo IdeaPad 5 15IIL05 | |
| Média Intel Core i7-1165G7 (1.39 - 8.47, n=80) | |
Cinebench R23: Multi Core | Single Core
Cinebench R15: CPU Multi 64Bit | CPU Single 64Bit
Blender: v2.79 BMW27 CPU
7-Zip 18.03: 7z b 4 -mmt1 | 7z b 4
Geekbench 5.5: Single-Core | Multi-Core
HWBOT x265 Benchmark v2.2: 4k Preset
LibreOffice : 20 Documents To PDF
R Benchmark 2.5: Overall mean
* ... menor é melhor
Desempenho do sistema
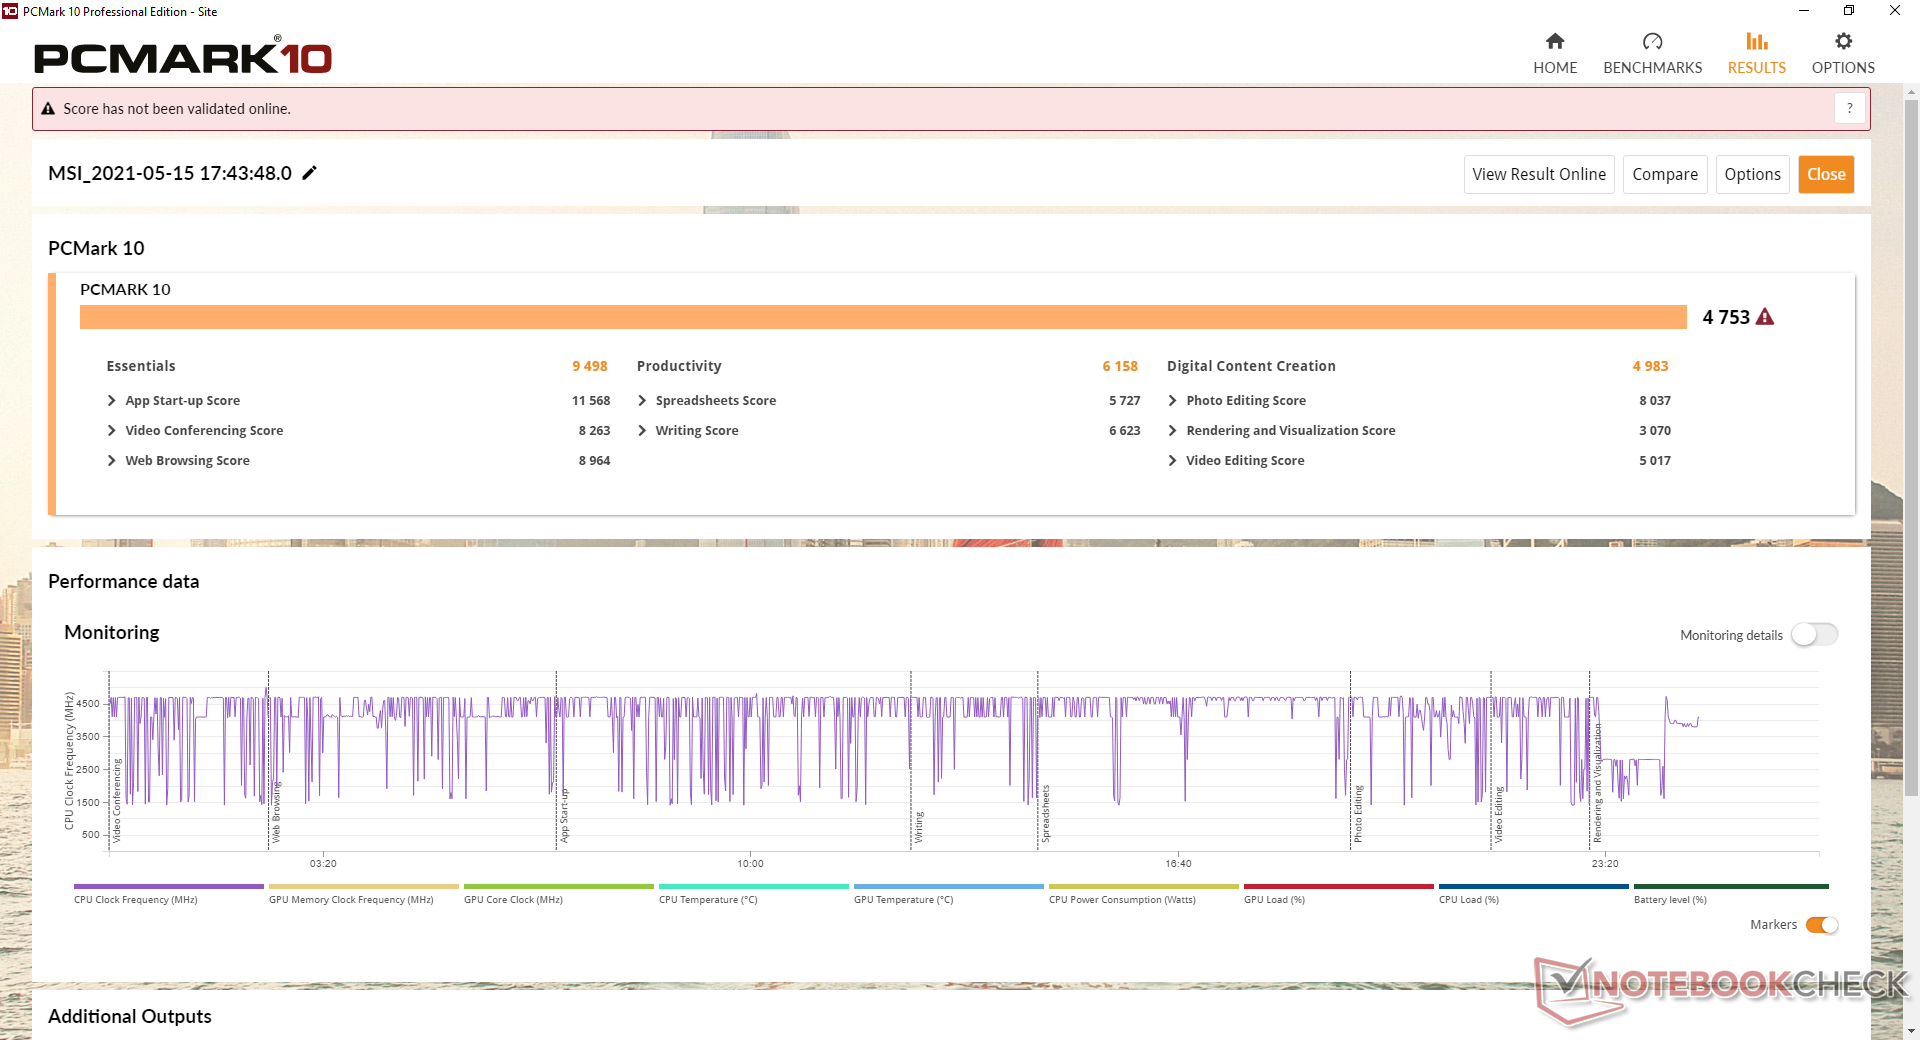
| PCMark 10 Score | 4753 pontos | |
Ajuda | ||
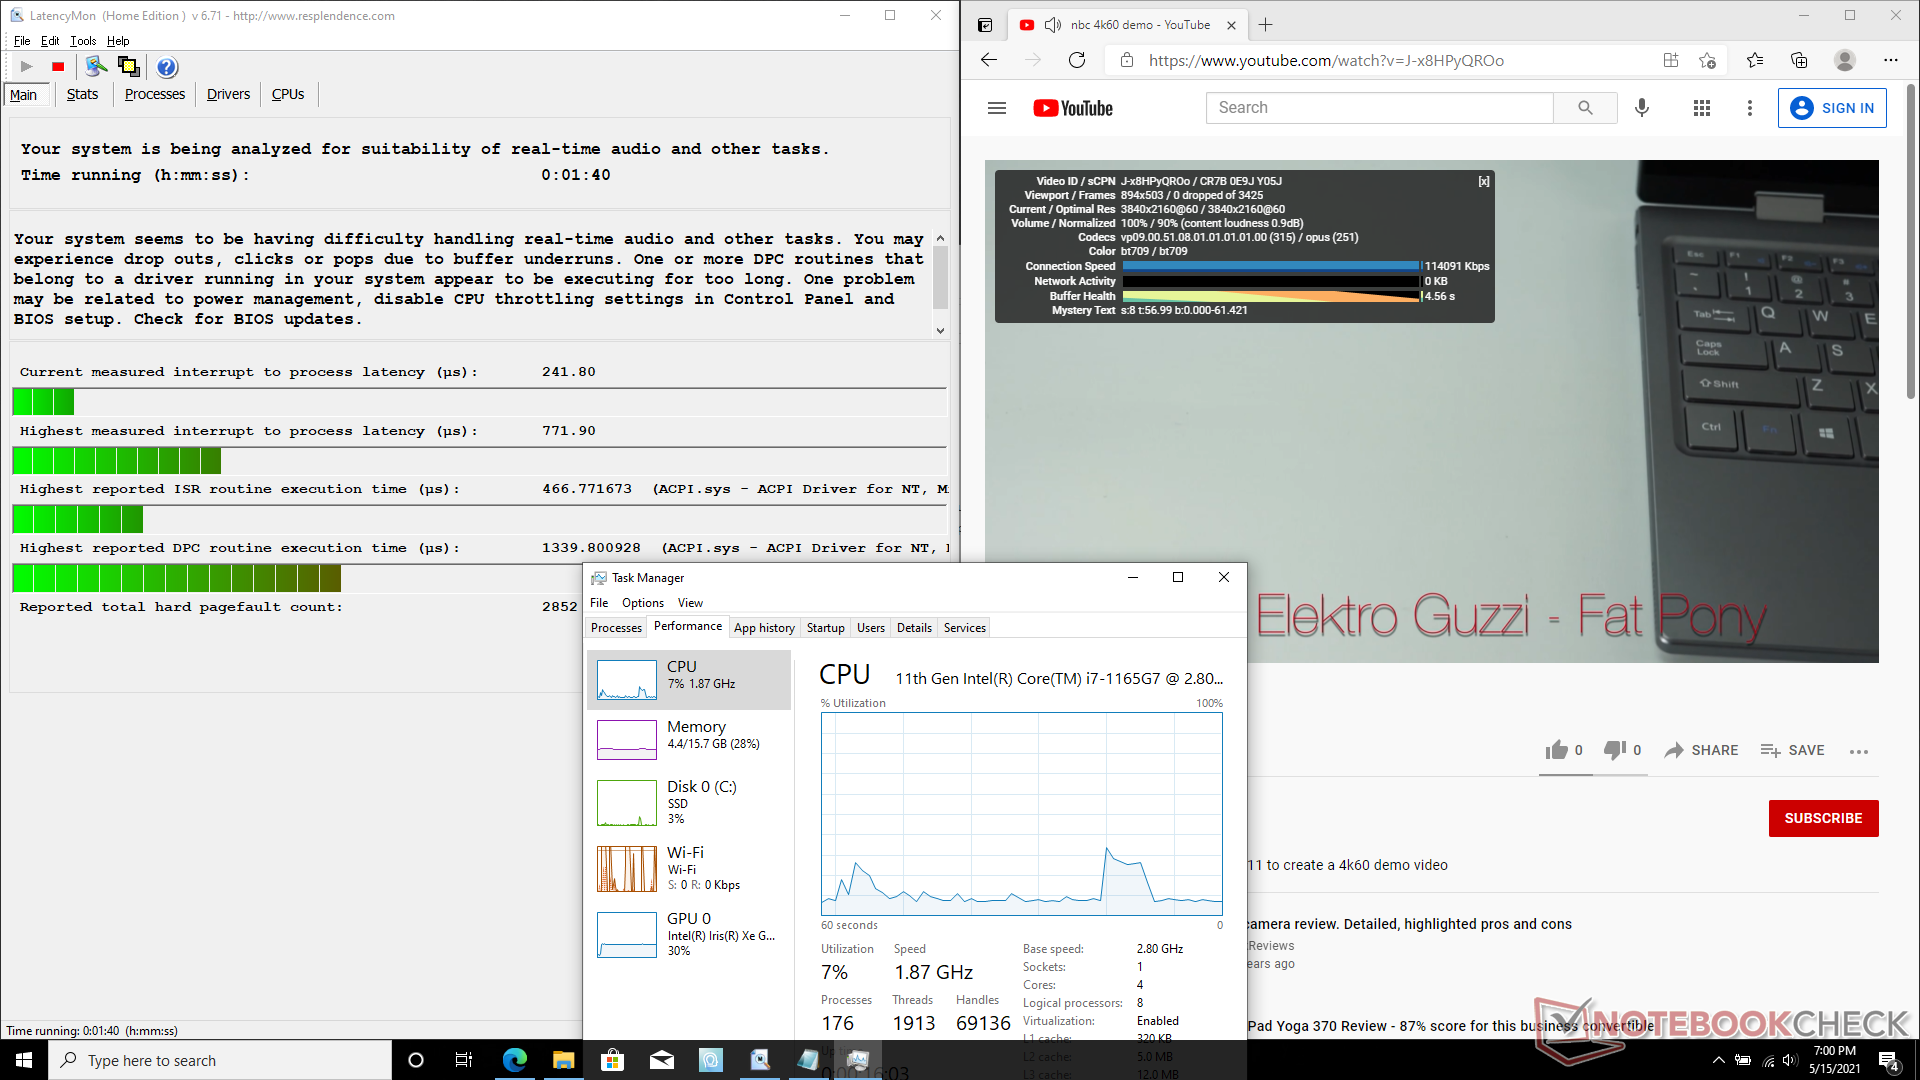
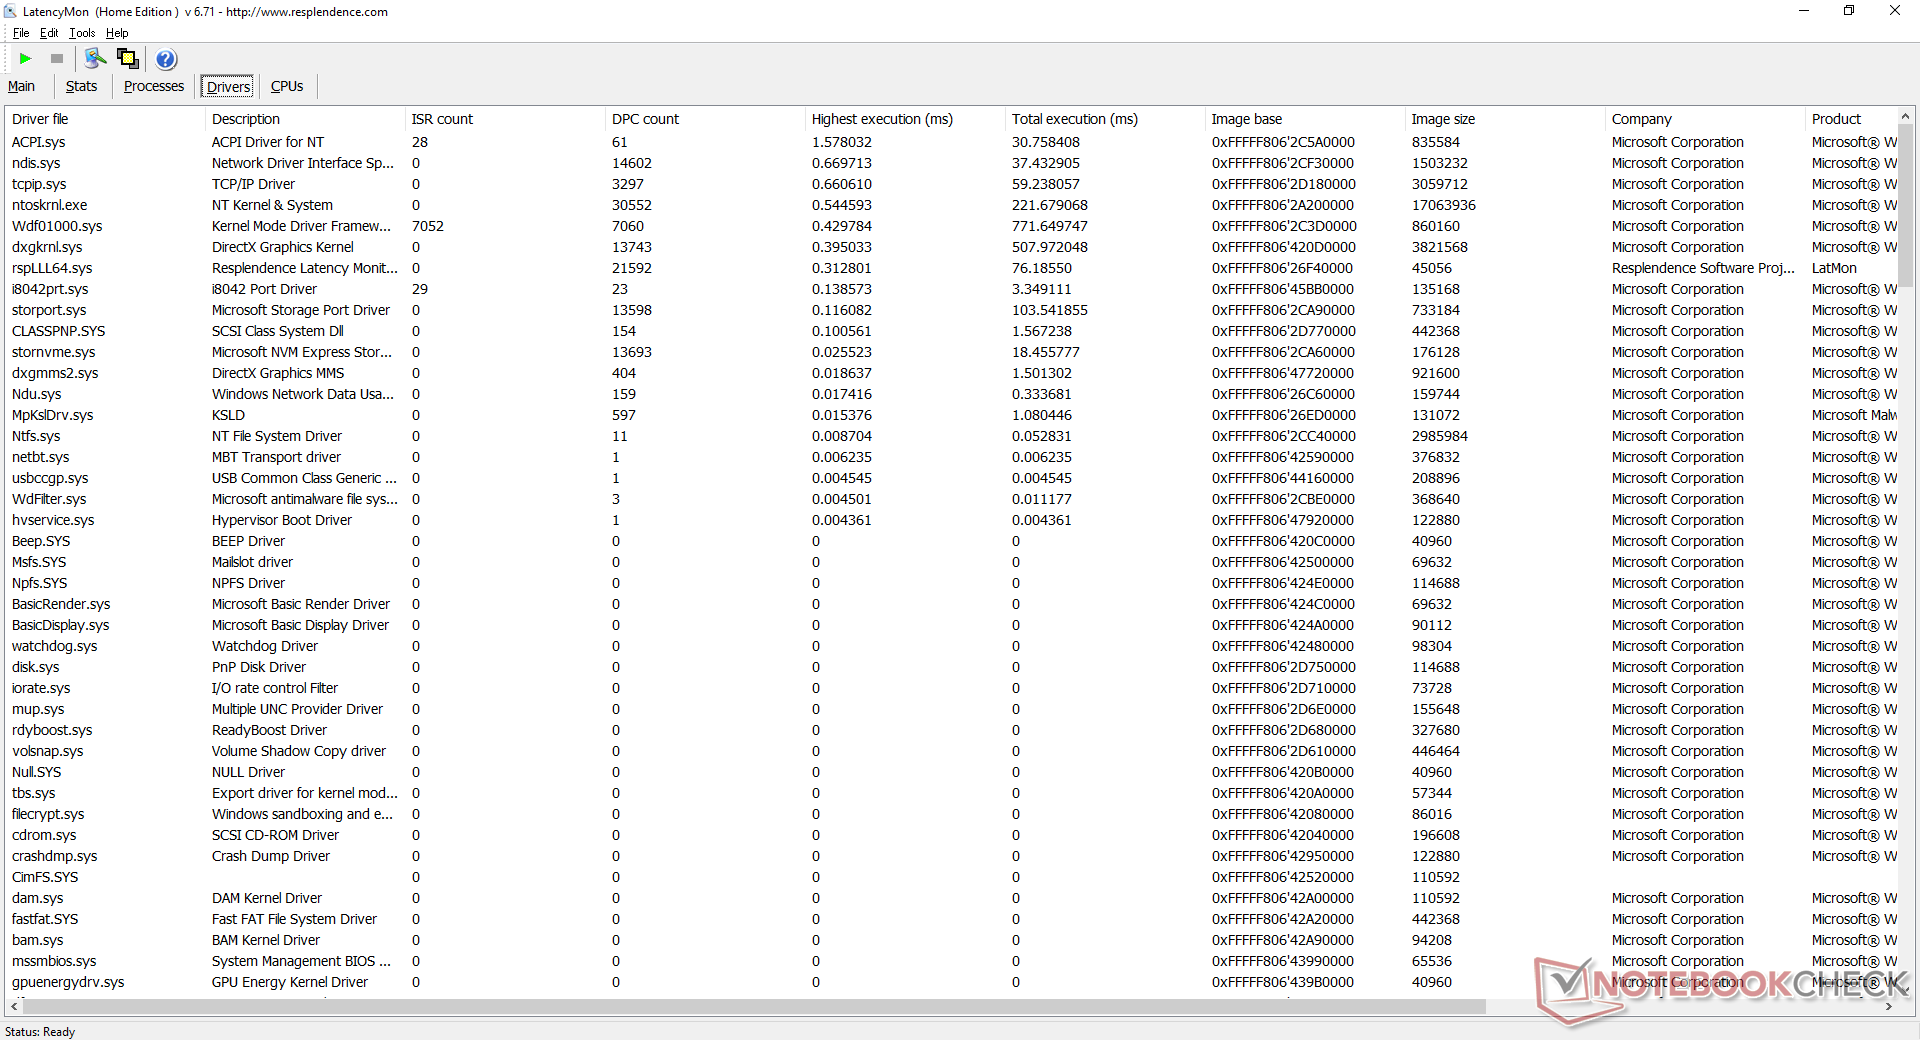
Latência do DPC
LatencyMon mostra pequenos problemas de latência do DPC ao abrir várias abas do navegador em nossa página inicial. A reprodução de vídeo de 4K a 60 FPS é de outra forma suave e sem queda de quadros.
| DPC Latencies / LatencyMon - interrupt to process latency (max), Web, Youtube, Prime95 | |
| ADATA XPG Xenia Xe | |
| Dell XPS 15 9500 Core i5 | |
| MSI Summit E15 A11SCST | |
| MSI Summit B15 A11M | |
* ... menor é melhor
Dispositivos de armazenamento
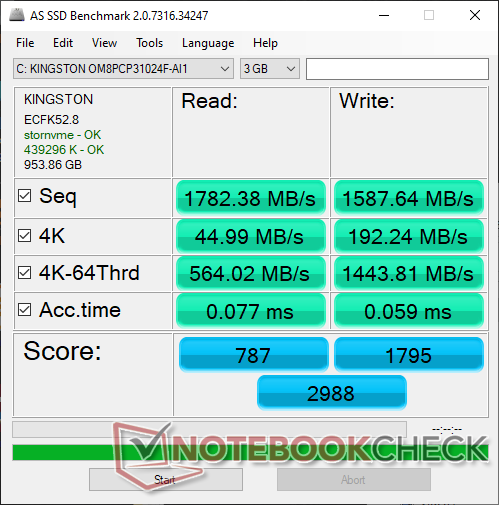
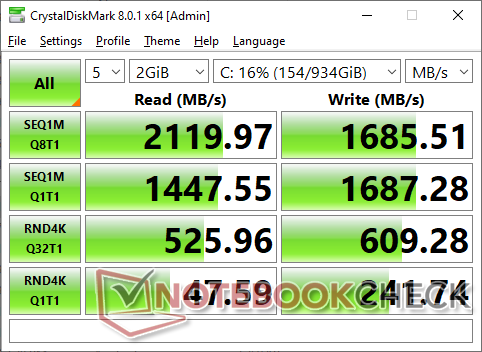
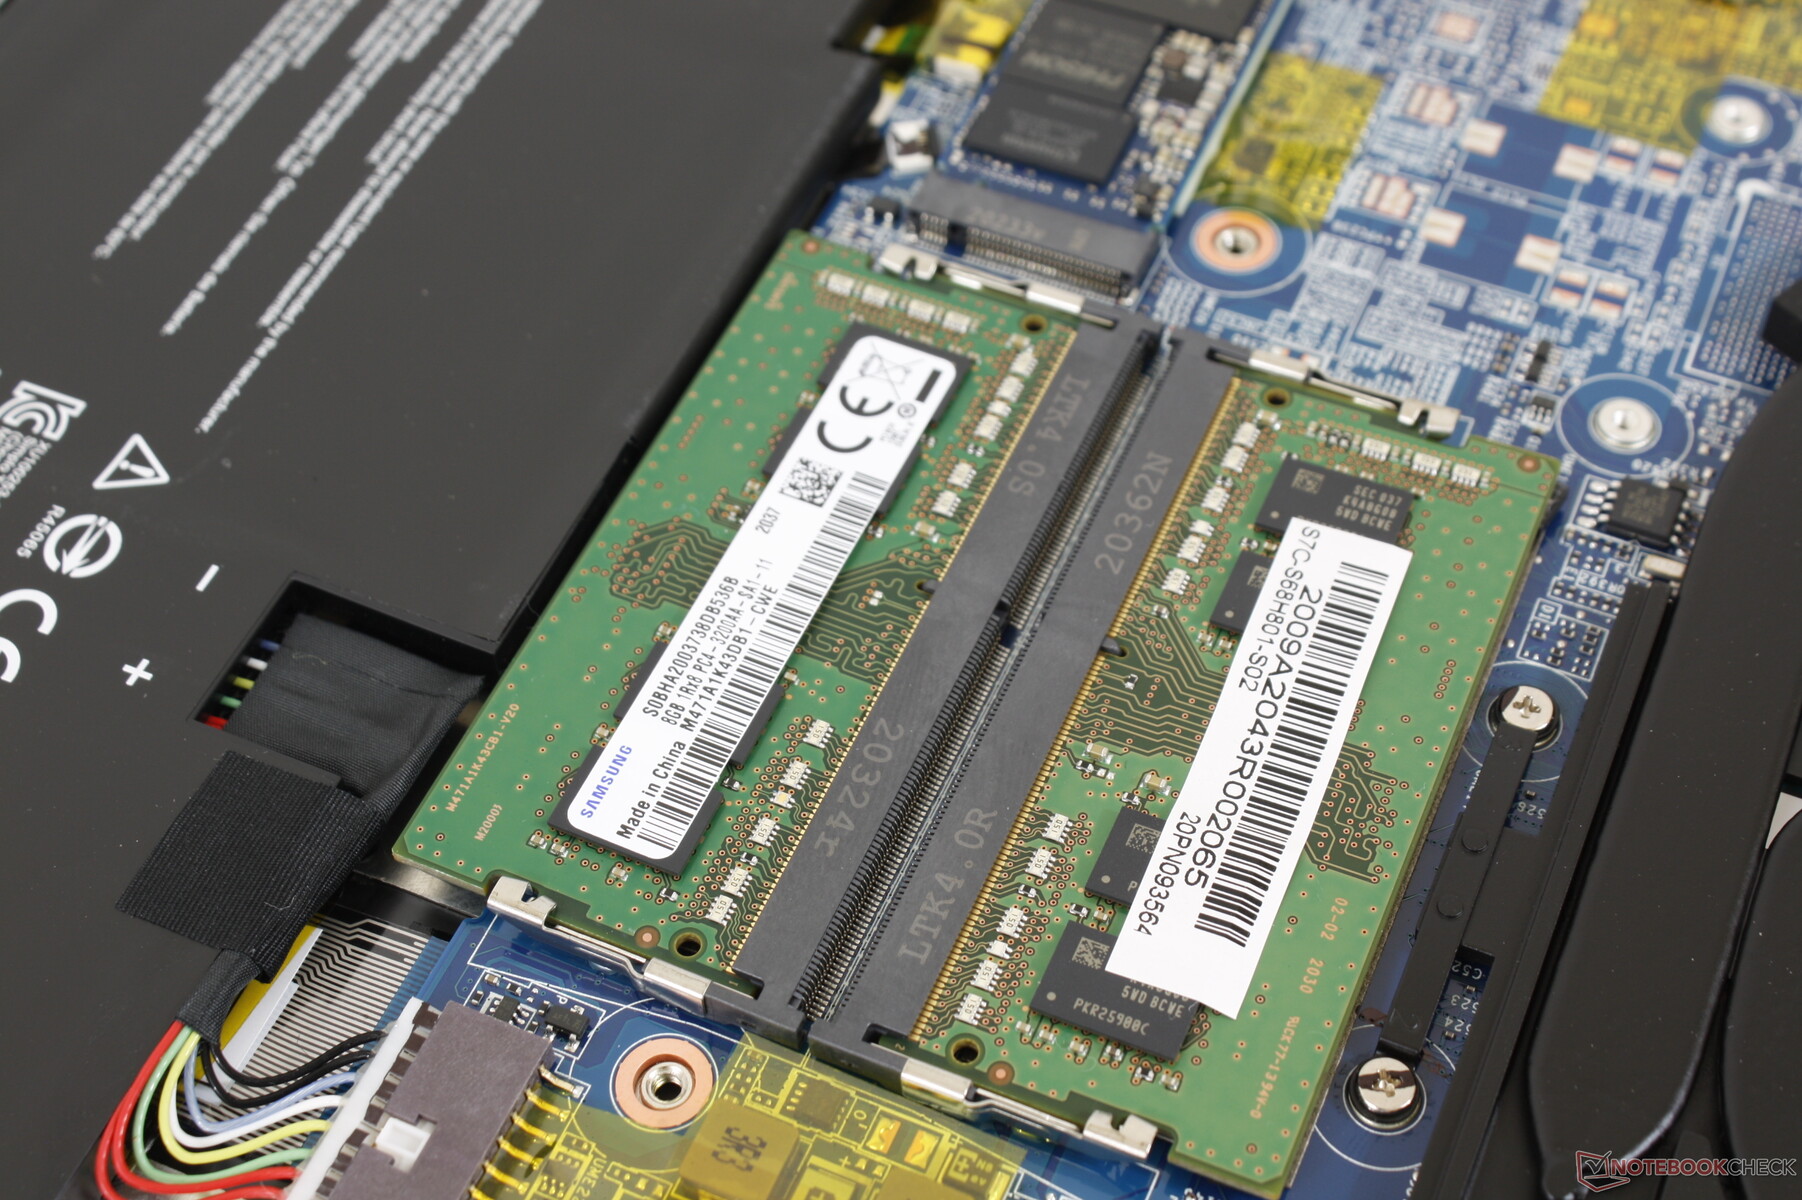
Até dois SSDs M.2 2280 internos são suportados, sendo um desses slots compatível com as velocidades PCIe 4.0. Nossa unidade de teste é fornecida com o Kingston OM8PCP31024F de 1 TB que é um SSD PCIe 3.0 NVMe bastante barato com taxas médias de transferência em torno de 2100 MB/s. Naturalmente, os usuários podem configurar SSDs mais rápidos antes de comprar ou instalar um eles mesmos.
| MSI Summit B15 A11M Kingston OM8PCP31024F | MSI Summit E15 A11SCST Phison 1TB SM2801T24GKBB4S-E162 | HP Spectre X360 15-5ZV31AV Intel SSD 660p 2TB SSDPEKNW020T8 | ADATA XPG Xenia Xe ADATA XPG Gammix S50 1TB | |
|---|---|---|---|---|
| AS SSD | 42% | -12% | 25% | |
| Seq Read (MB/s) | 1782 | 3597 102% | 1220 -32% | 3842 116% |
| Seq Write (MB/s) | 1588 | 2101 32% | 1152 -27% | 1601 1% |
| 4K Read (MB/s) | 44.99 | 62.5 39% | 52.3 16% | 51.2 14% |
| 4K Write (MB/s) | 192.2 | 208.9 9% | 146.6 -24% | 260.8 36% |
| 4K-64 Read (MB/s) | 564 | 1145 103% | 652 16% | 1222 117% |
| 4K-64 Write (MB/s) | 1444 | 1482 3% | 847 -41% | 1508 4% |
| Access Time Read * (ms) | 0.077 | 0.05 35% | 0.077 -0% | 0.065 16% |
| Access Time Write * (ms) | 0.059 | 0.019 68% | 0.106 -80% | 0.249 -322% |
| Score Read (Points) | 787 | 1567 99% | 826 5% | 1657 111% |
| Score Write (Points) | 1795 | 1901 6% | 1109 -38% | 1929 7% |
| Score Total (Points) | 2988 | 4207 41% | 2371 -21% | 4329 45% |
| Copy ISO MB/s (MB/s) | 1541 | 2209 43% | 2070 34% | 2166 41% |
| Copy Program MB/s (MB/s) | 641 | 455.2 -29% | 571 -11% | 995 55% |
| Copy Game MB/s (MB/s) | 908 | 1225 35% | 1219 34% | 1844 103% |
| CrystalDiskMark 5.2 / 6 | 42% | -6% | 47% | |
| Write 4K (MB/s) | 235.9 | 242.9 3% | 151.5 -36% | 159.6 -32% |
| Read 4K (MB/s) | 47.06 | 54.6 16% | 59.3 26% | 45.45 -3% |
| Write Seq (MB/s) | 1684 | 2420 44% | 1424 -15% | 2498 48% |
| Read Seq (MB/s) | 1333 | 2300 73% | 1609 21% | 2340 76% |
| Write 4K Q32T1 (MB/s) | 606 | 392.7 -35% | 393.6 -35% | 645 6% |
| Read 4K Q32T1 (MB/s) | 422.8 | 667 58% | 369.4 -13% | 439.4 4% |
| Write Seq Q32T1 (MB/s) | 1688 | 2424 44% | 1946 15% | 4057 140% |
| Read Seq Q32T1 (MB/s) | 2116 | 4944 134% | 1934 -9% | 4960 134% |
| Média Total (Programa/Configurações) | 42% /
42% | -9% /
-10% | 36% /
33% |
* ... menor é melhor

Disk Throttling: DiskSpd Read Loop, Queue Depth 8
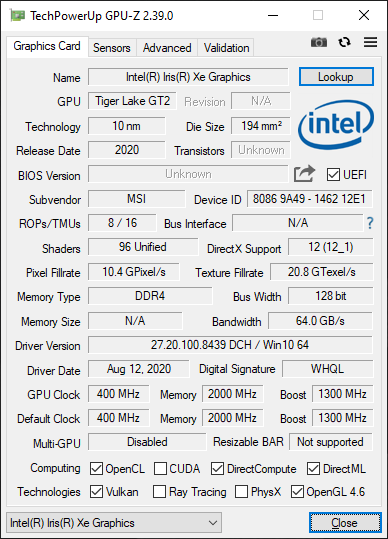
Desempenho da GPU
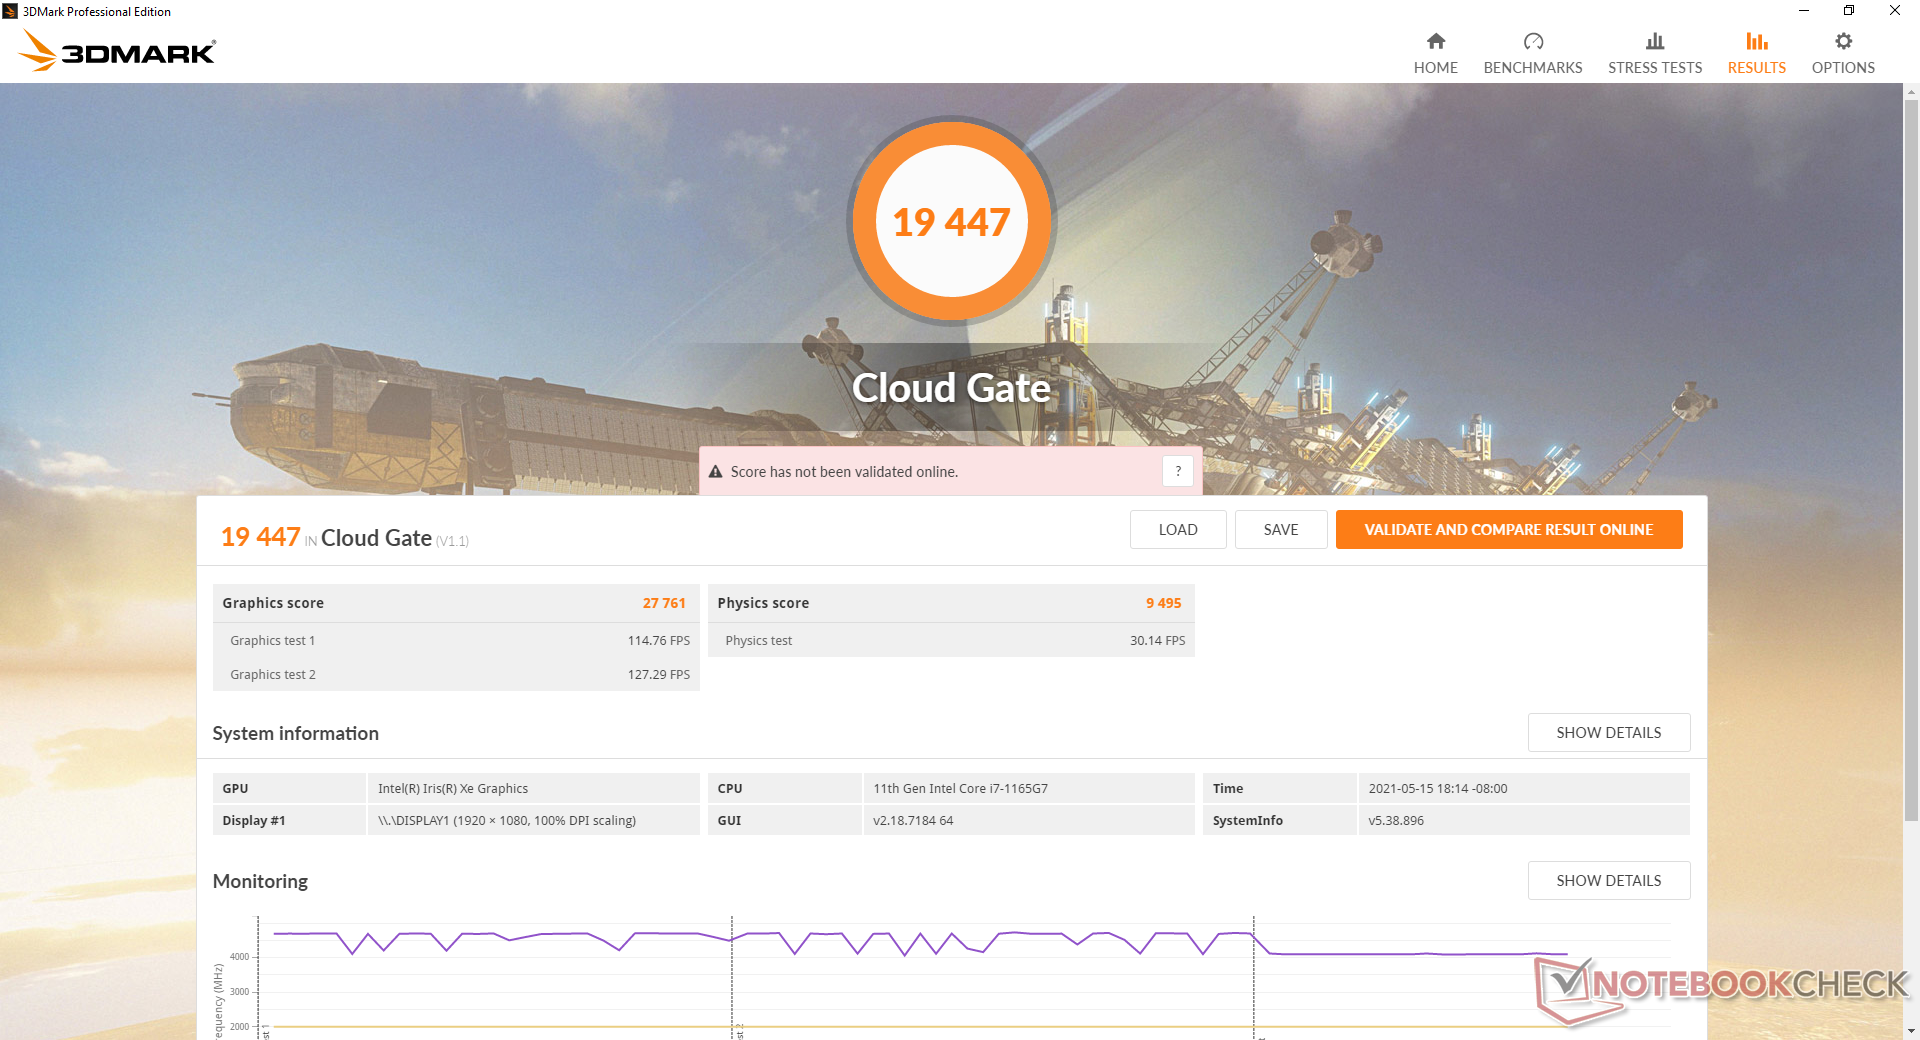
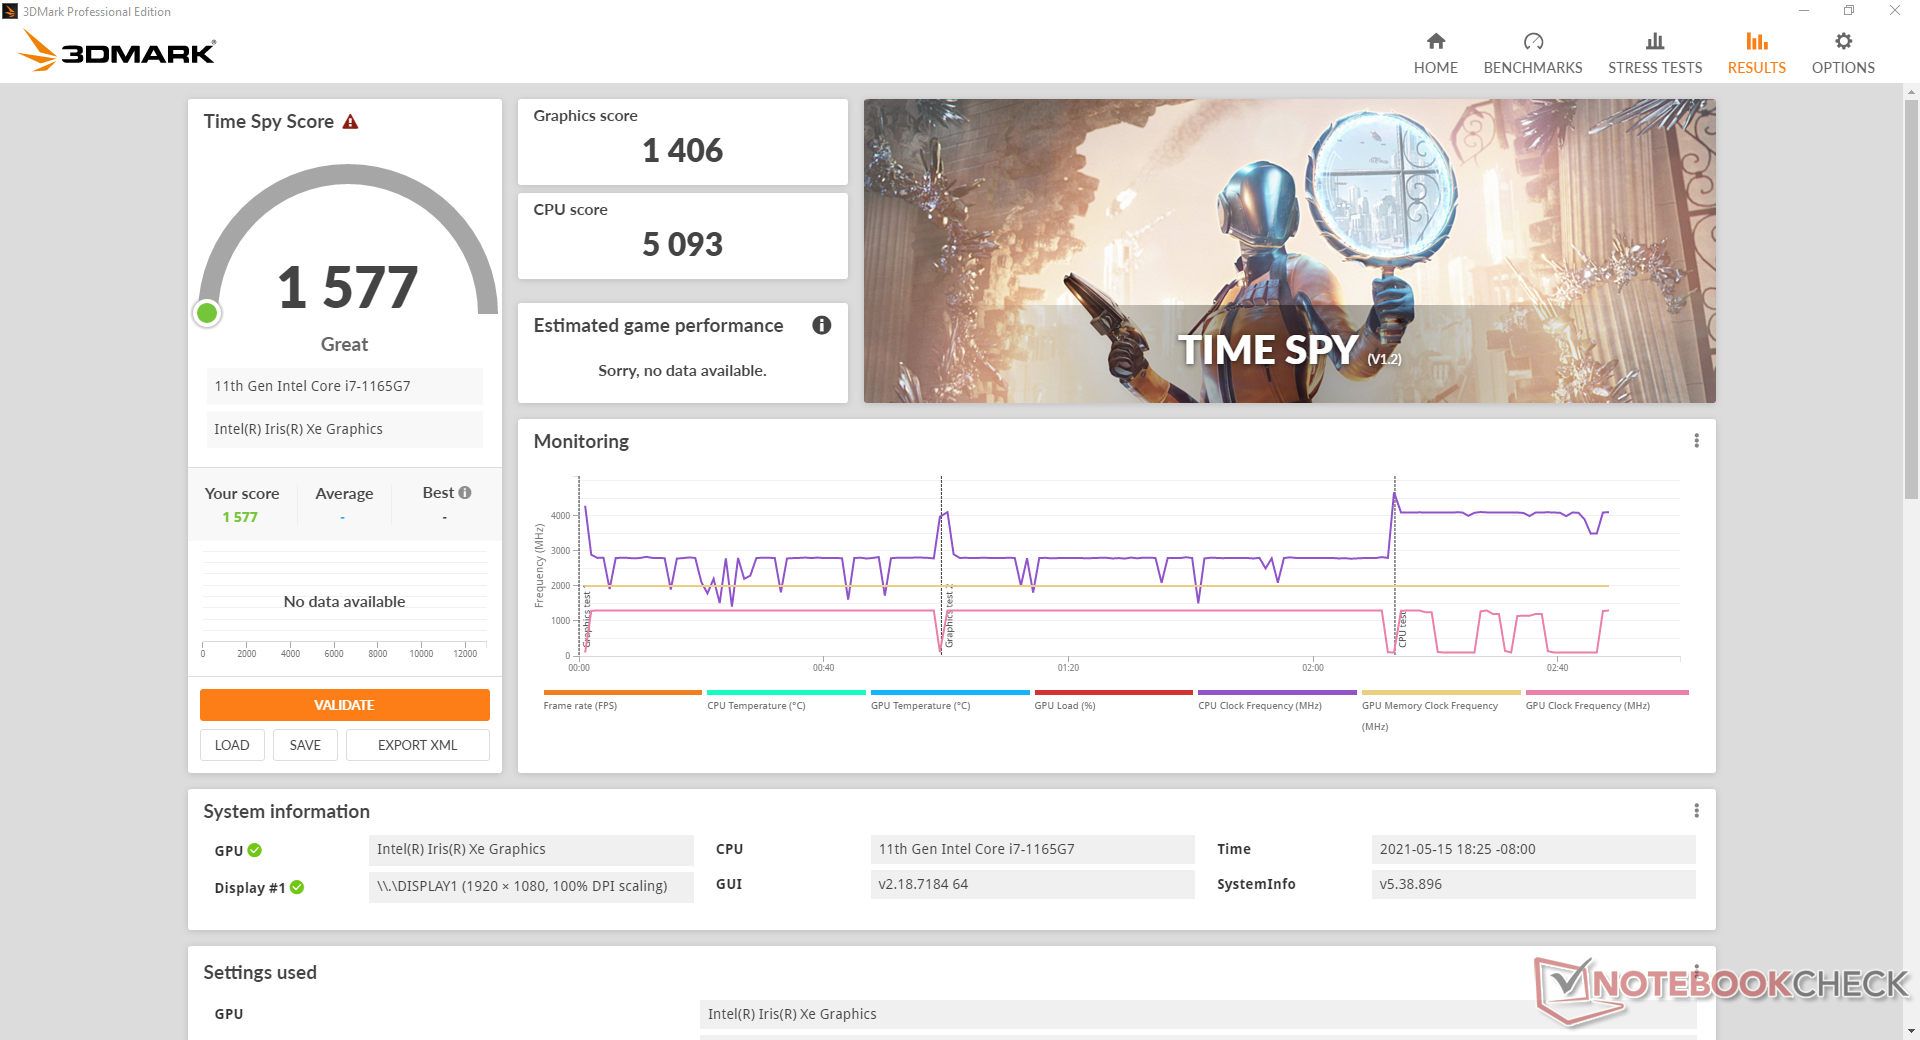
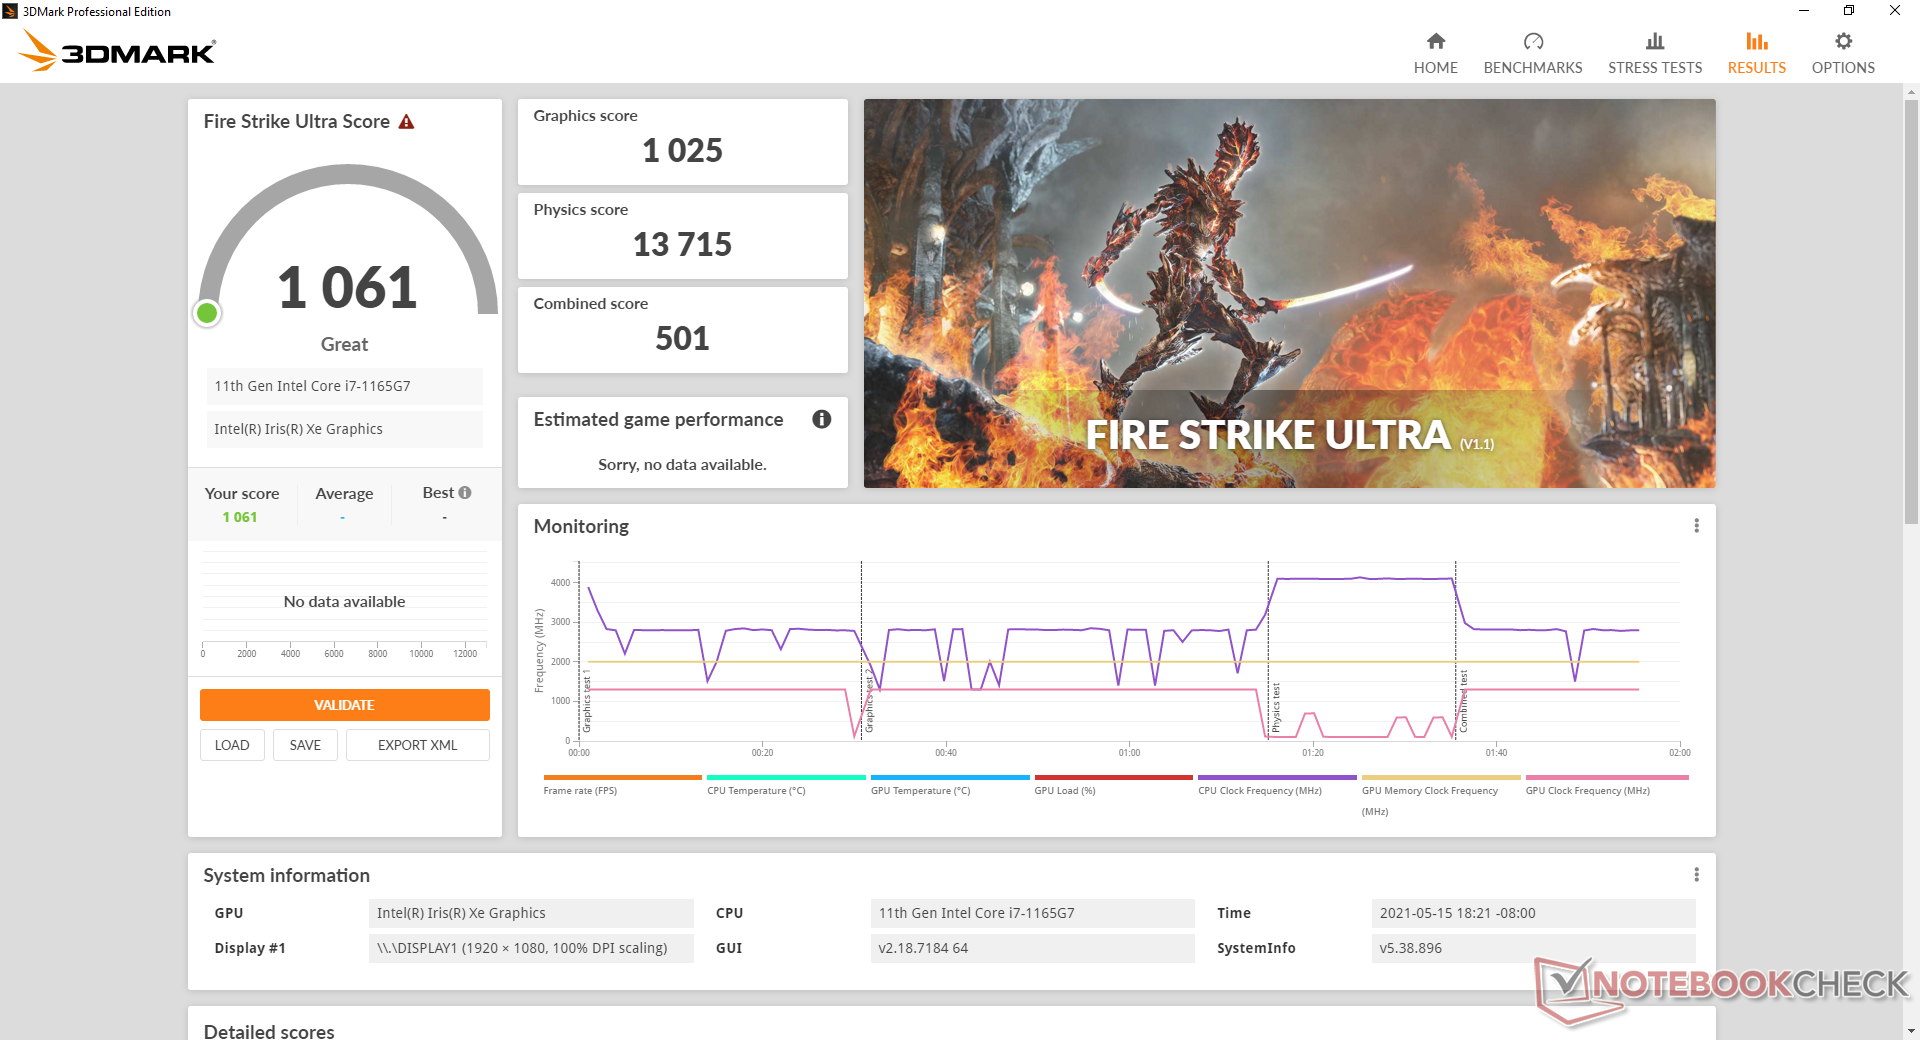
O desempenho gráfico está dentro de alguns pontos percentuais da média do laptop em nosso banco de dados equipado com o mesmo Iris Xe 96 EUs GPU. Embora o 3DMark mostre um desempenho superior ao da GeForce MX250/350/450 series, estas GPUs Nvidia ainda são a melhor aposta quando sob condições reais de jogo em grande parte devido aos drivers mais maduros da Nvidia e ao maior envelope de energia disponível para a CPU quando uma GPU discreta está presente. Quanto às GPUs integradas, no entanto, Iris Xe é a única a ser batida.
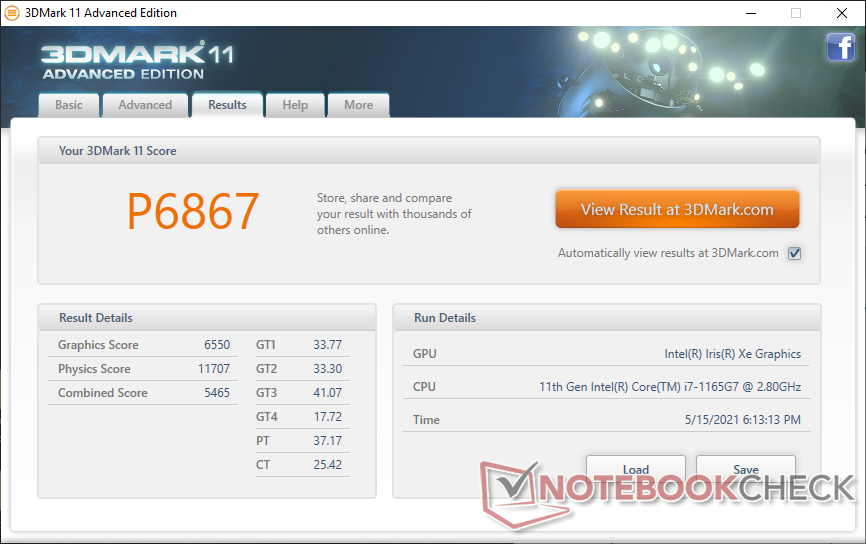
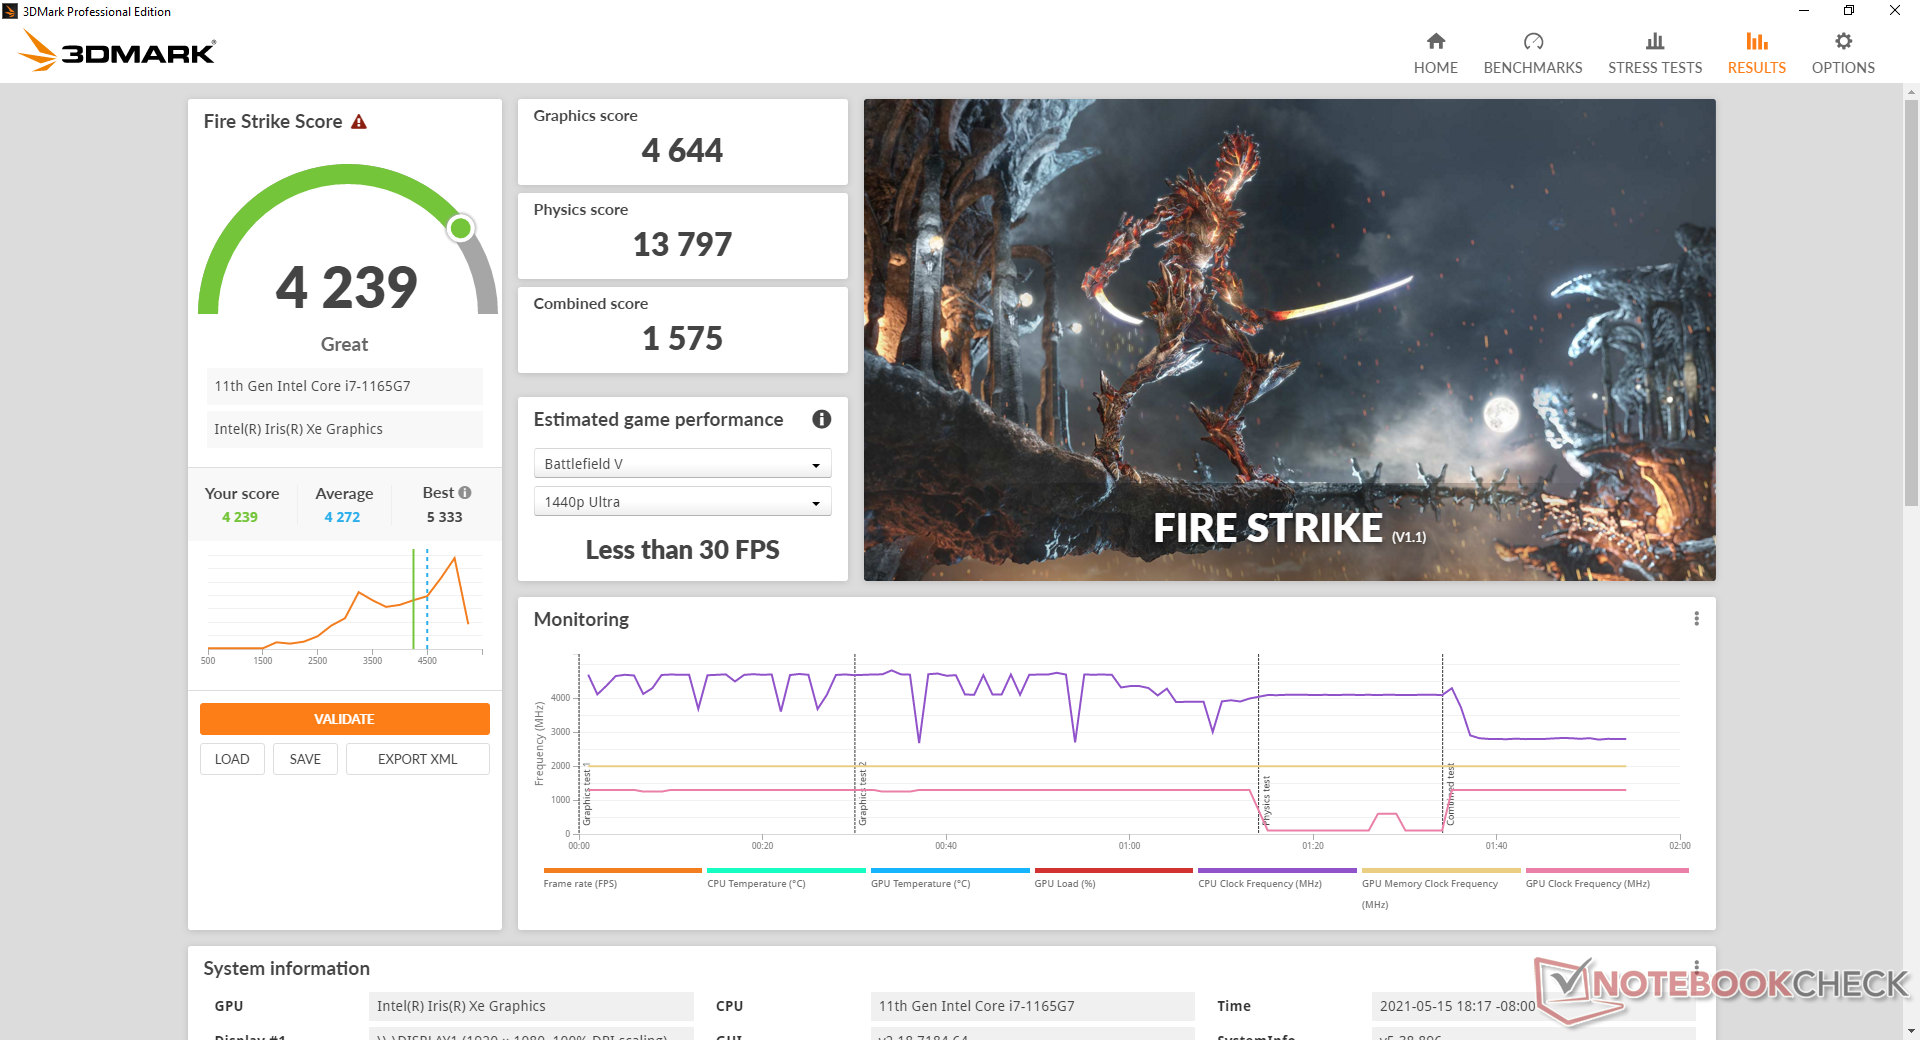
| 3DMark 11 Performance | 6867 pontos | |
| 3DMark Cloud Gate Standard Score | 19447 pontos | |
| 3DMark Fire Strike Score | 4239 pontos | |
| 3DMark Time Spy Score | 1577 pontos | |
Ajuda | ||
| baixo | média | alto | ultra | |
|---|---|---|---|---|
| The Witcher 3 (2015) | 95.3 | 56.3 | 30.8 | 14.5 |
| Dota 2 Reborn (2015) | 81.5 | 67.3 | 45.4 | 42.3 |
| Final Fantasy XV Benchmark (2018) | 39.1 | 20.4 | 15.8 | |
| X-Plane 11.11 (2018) | 59.3 | 42.3 | 38.5 |
Emissions
Ruído do sistema
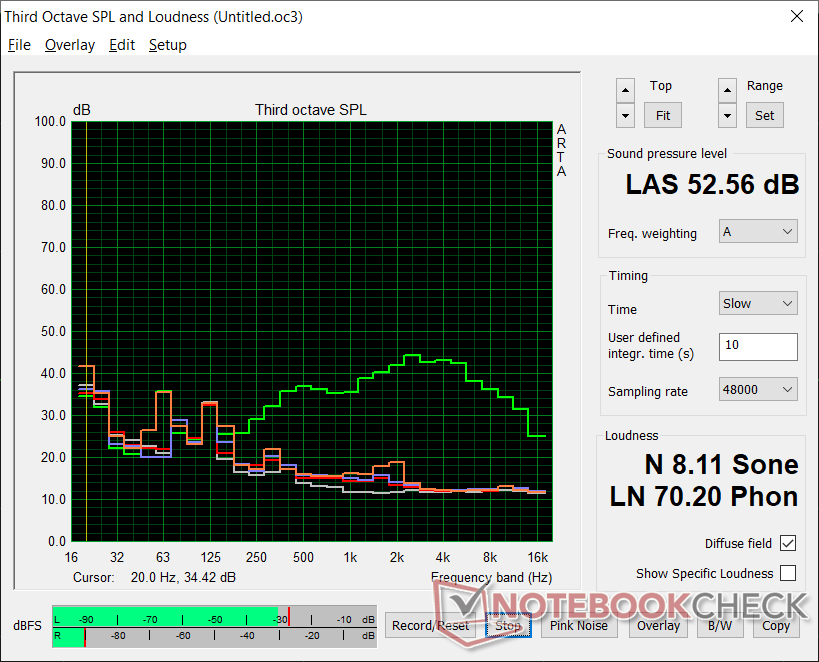
O ruído do ventilador nunca é verdadeiramente silencioso mesmo quando configurado para o modo "Silencioso" no MSI Center. Somos capazes de registrar um ruído muito leve do ventilador de 26,4 dB(A) contra um fundo de 25,2 dB(A), não importando a configuração do laptop.
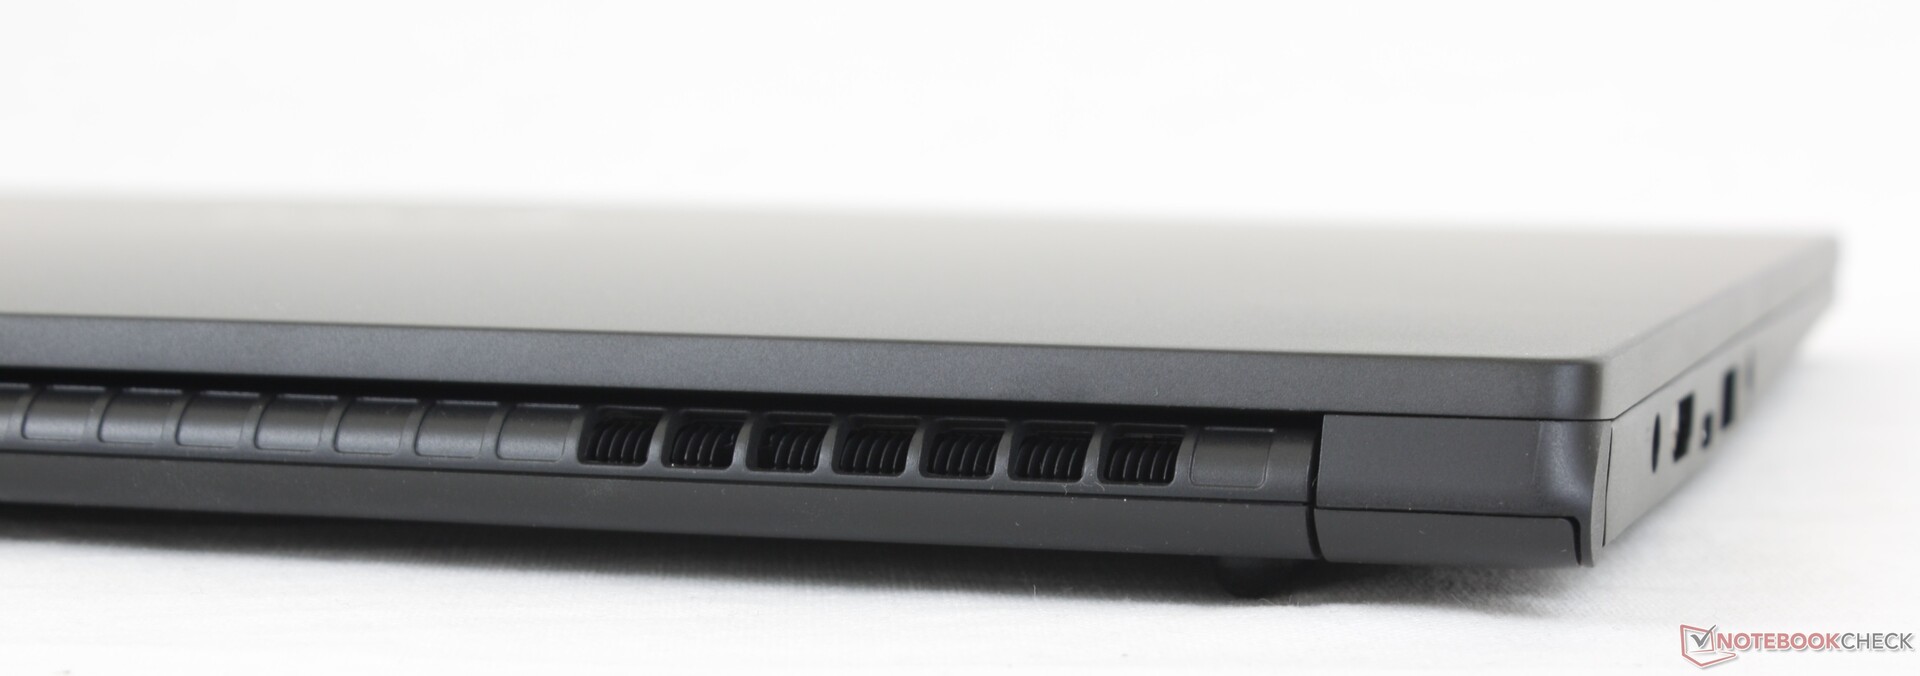
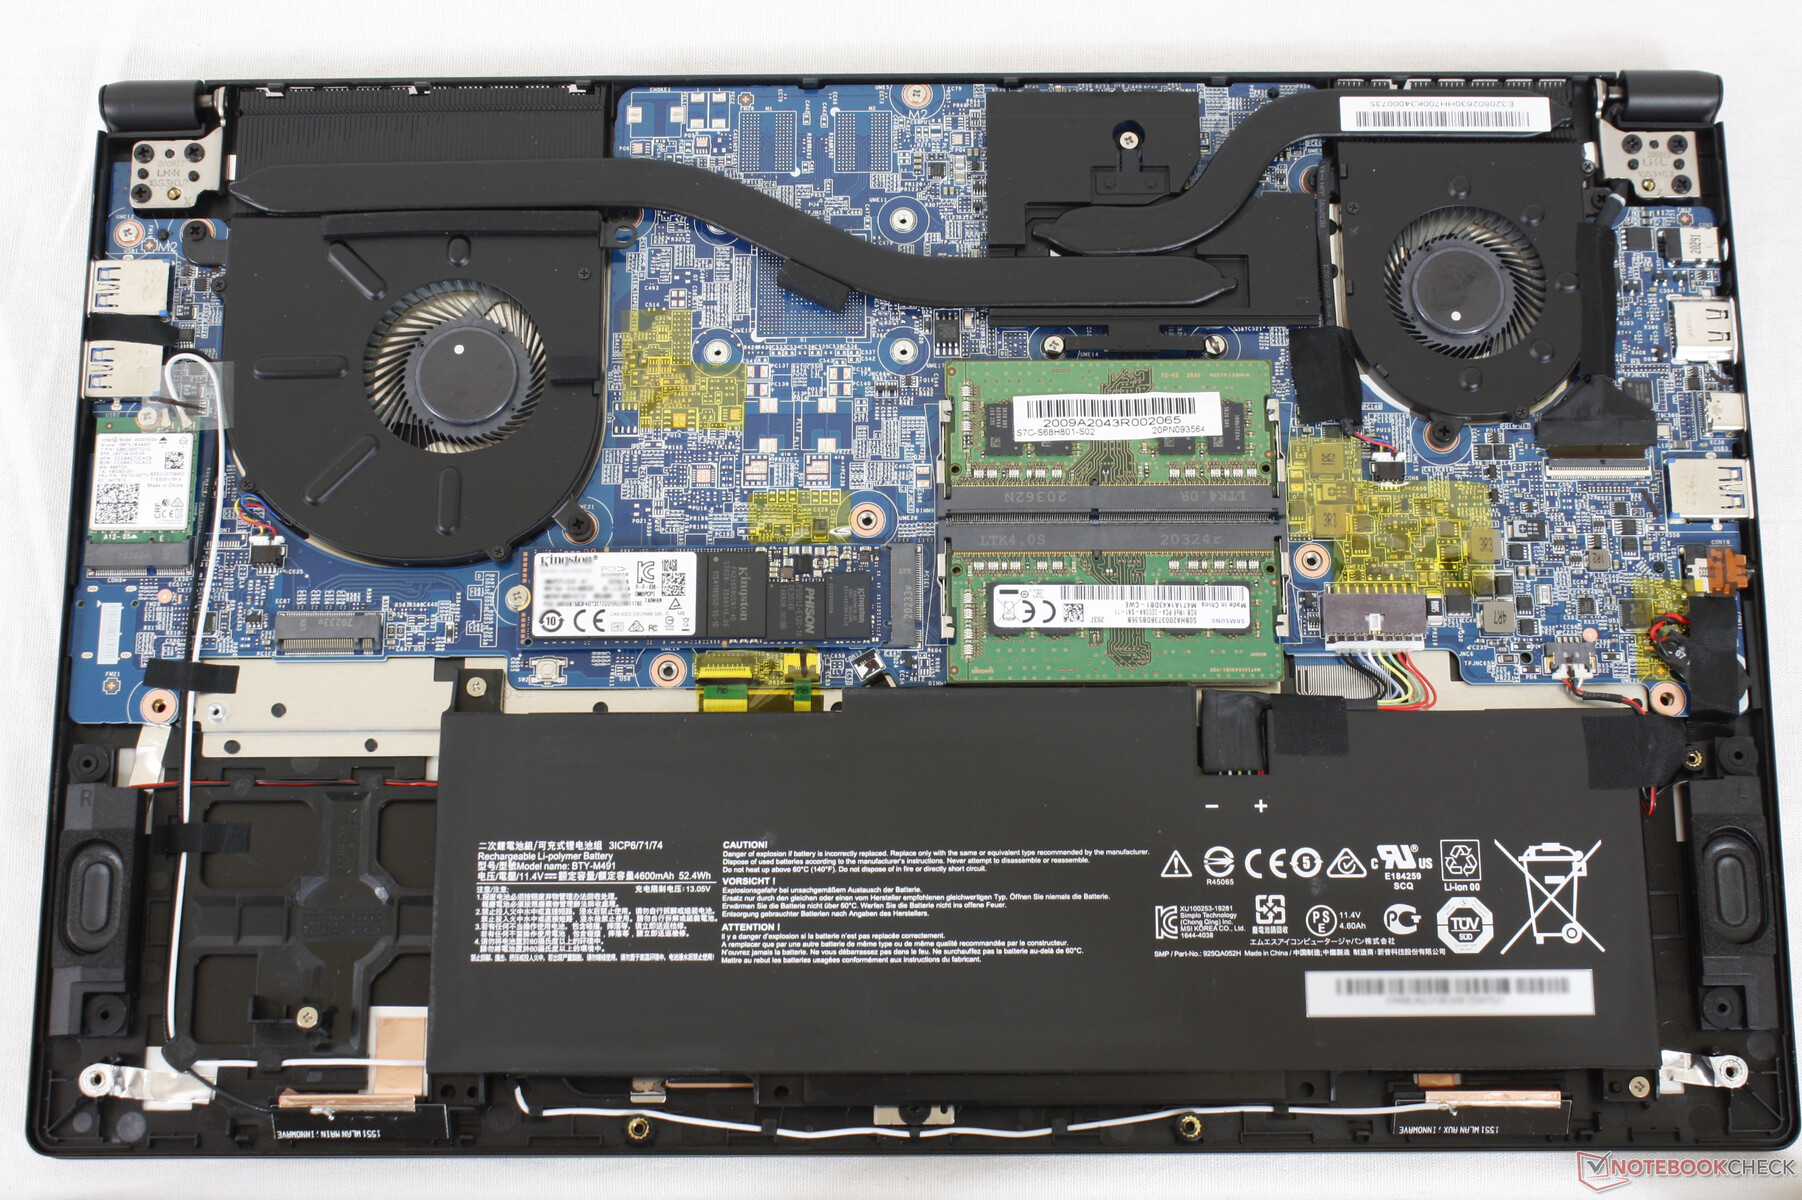
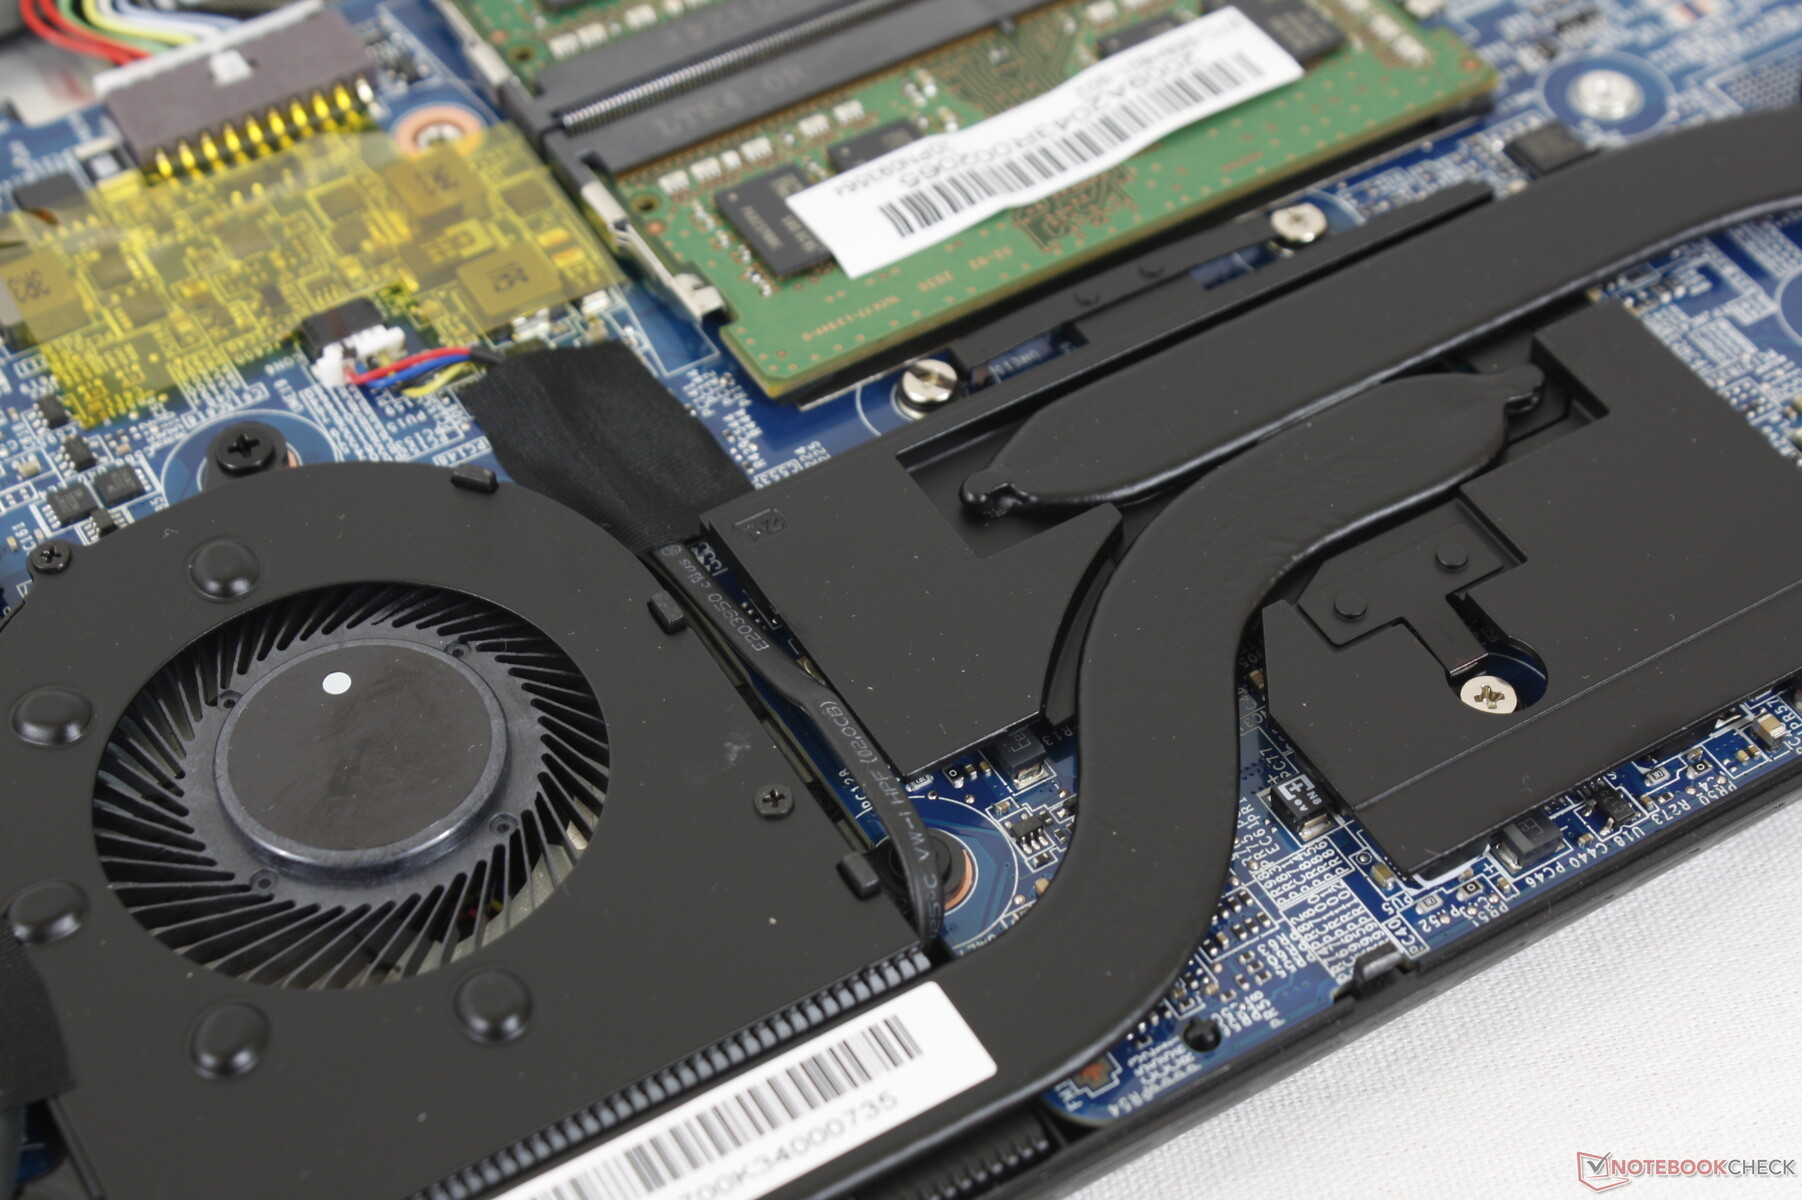
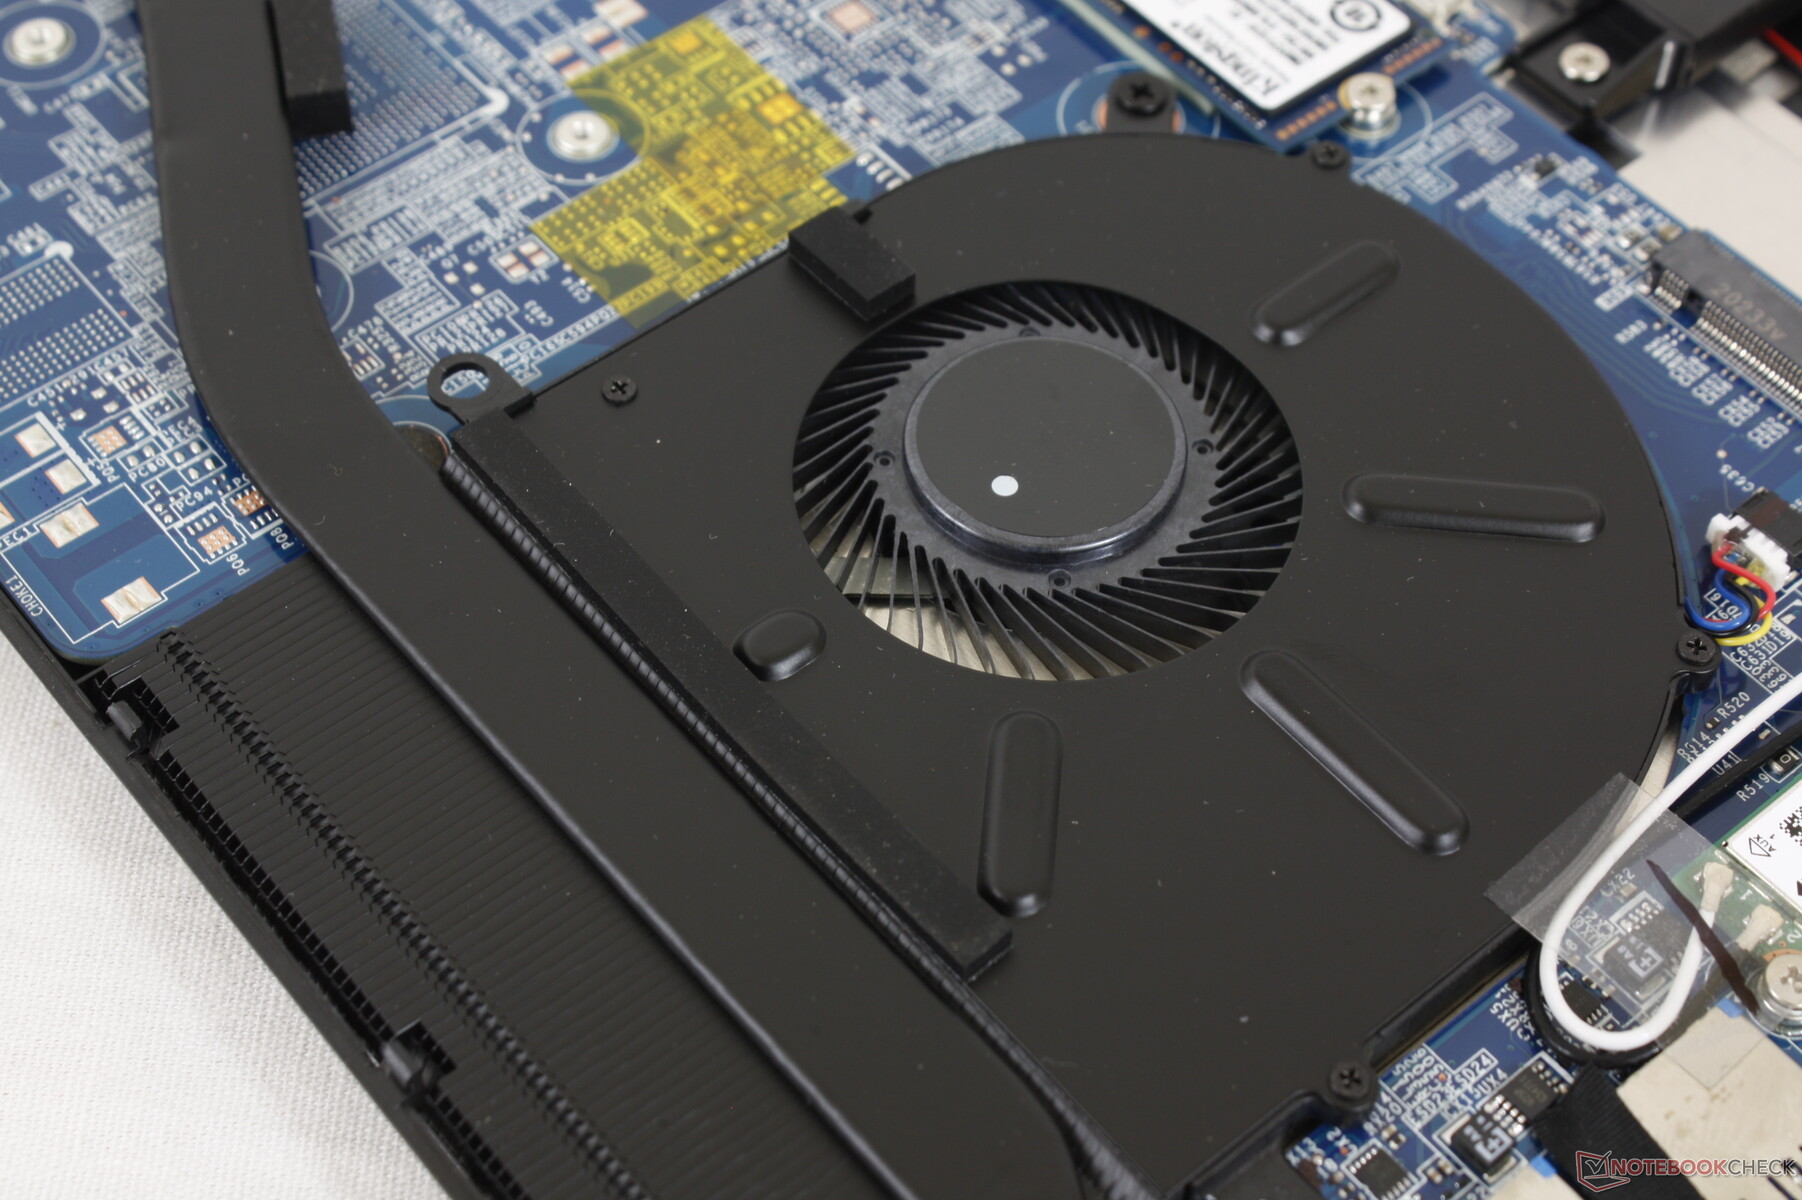
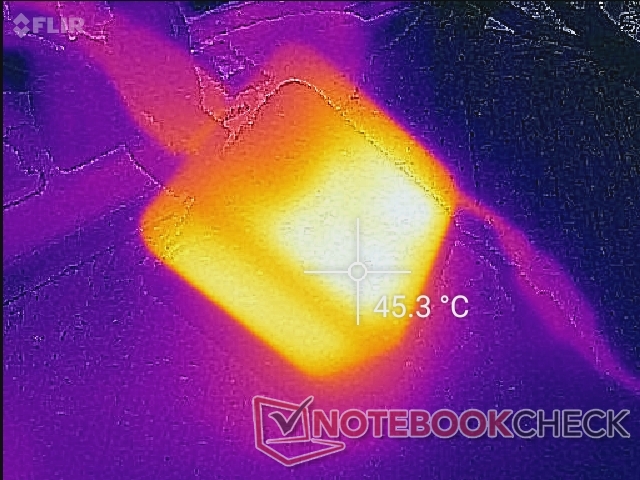
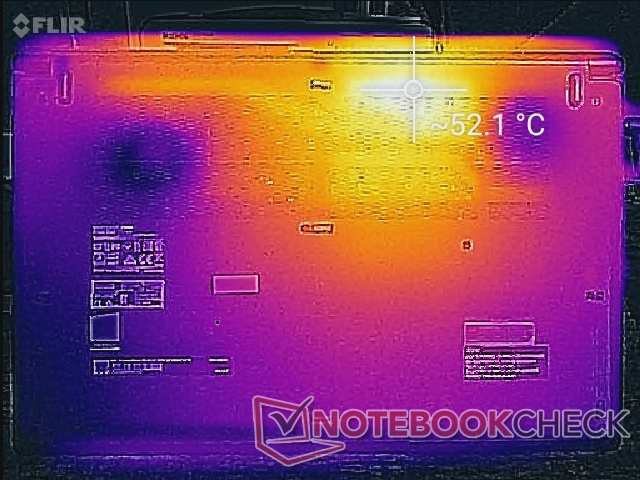
Felizmente, os ventiladores permanecem silenciosos a 26,4 dB(A) mesmo depois de rodar a primeira cena de referência do 3DMark 06. Isto porque a solução de resfriamento foi projetada para resfriar tanto uma CPU quanto uma GPU discreta, como mostram as imagens abaixo, apesar do fato de que nossa Summit B15 não tem GPU discreta. Assim, os dois ventiladores internos não precisam estar sempre ativos para manter o sistema tão frio.
É claro que o sistema ainda pode ficar muito barulhento ao rodar jogos a altas taxas de quadros, onde a CPU ficará estressada. Neste caso, o ruído do ventilador pode ser tão alto quanto 40 dB(A) ou 52,6 dB(A) quando o Cooler Boost é ligado ou desligado, respectivamente. Observe que o Cooler Boost é desnecessário para este laptop ULV, como mostrará nossa seção de Teste de Estresse abaixo.
O ruído do ventilador é muito baixo quando em funcionamento Witcher 3 em Ultra, uma vez que as taxas de quadros estão nos dígitos individuais. Quando ajustado para configurações gráficas baixas, o ruído do ventilador saltaria quase imediatamente para a faixa de 40 dB(A) devido ao aumento no desempenho da CPU.
| MSI Summit B15 A11M Iris Xe G7 96EUs, i7-1165G7, Kingston OM8PCP31024F | MSI Summit E15 A11SCST GeForce GTX 1650 Ti Max-Q, i7-1185G7, Phison 1TB SM2801T24GKBB4S-E162 | Dell XPS 15 9500 Core i5 UHD Graphics 630, i5-10300H, Toshiba KBG40ZNS256G NVMe | HP Spectre X360 15-5ZV31AV GeForce MX250, i7-10510U, Intel SSD 660p 2TB SSDPEKNW020T8 | ADATA XPG Xenia Xe Iris Xe G7 96EUs, i7-1165G7, ADATA XPG Gammix S50 1TB | |
|---|---|---|---|---|---|
| Noise | -17% | -2% | -14% | -7% | |
| desligado / ambiente * (dB) | 25.2 | 24 5% | 28 -11% | 30.1 -19% | 25.2 -0% |
| Idle Minimum * (dB) | 26.4 | 28 -6% | 28 -6% | 30.1 -14% | 25.2 5% |
| Idle Average * (dB) | 26.4 | 29 -10% | 28 -6% | 30.1 -14% | 25.2 5% |
| Idle Maximum * (dB) | 26.4 | 32 -21% | 28 -6% | 30.1 -14% | 25.2 5% |
| Load Average * (dB) | 26.8 | 43 -60% | 28 -4% | 30.1 -12% | 35.7 -33% |
| Witcher 3 ultra * (dB) | 28 | 41 -46% | 39.7 -42% | 39.7 -42% | |
| Load Maximum * (dB) | 52.6 | 44 16% | 41.9 20% | 42 20% | 45.3 14% |
* ... menor é melhor
Barulho
| Ocioso |
| 26.4 / 26.4 / 26.4 dB |
| Carga |
| 26.8 / 52.6 dB |
 | ||
30 dB silencioso 40 dB(A) audível 50 dB(A) ruidosamente alto |
||
min: | ||
Temperatura
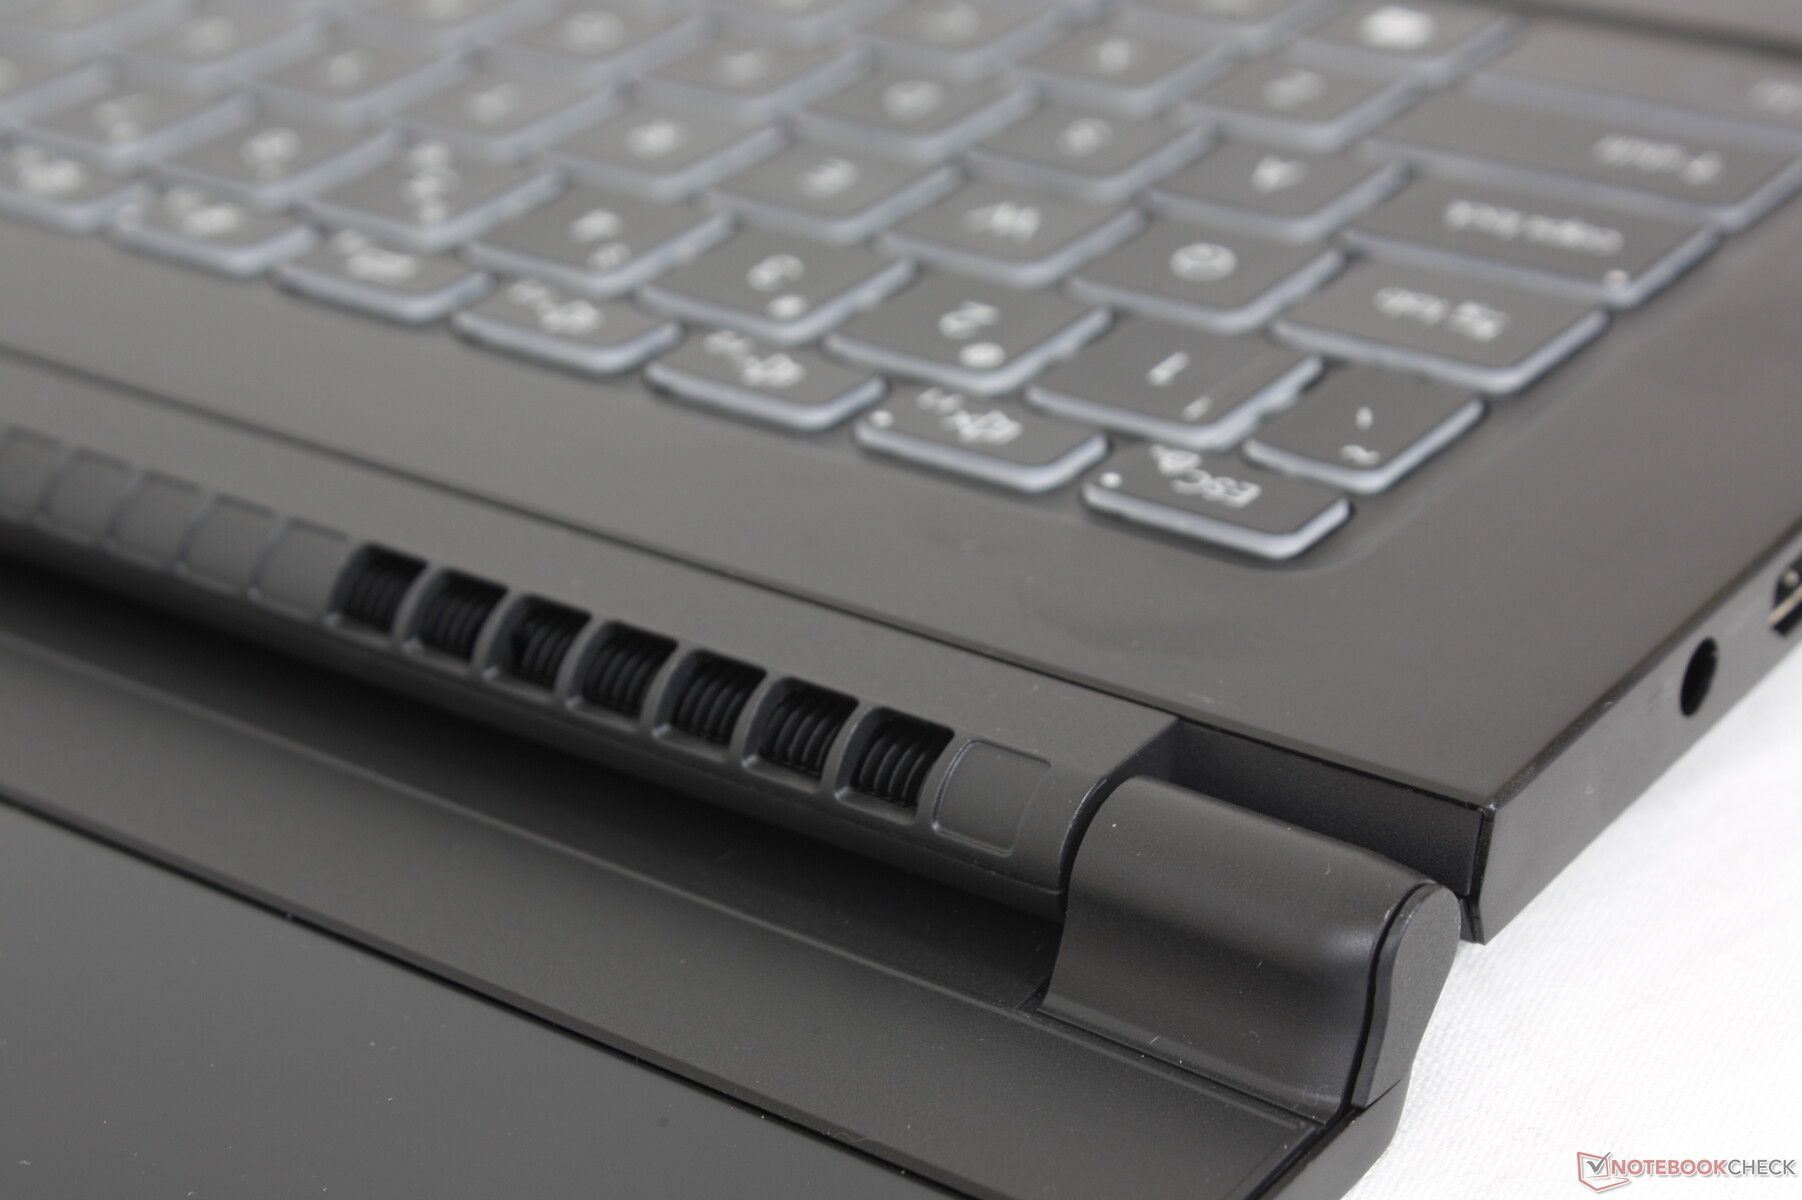
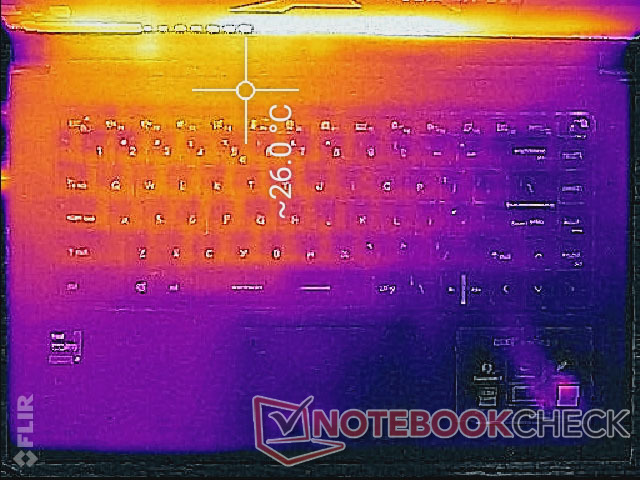
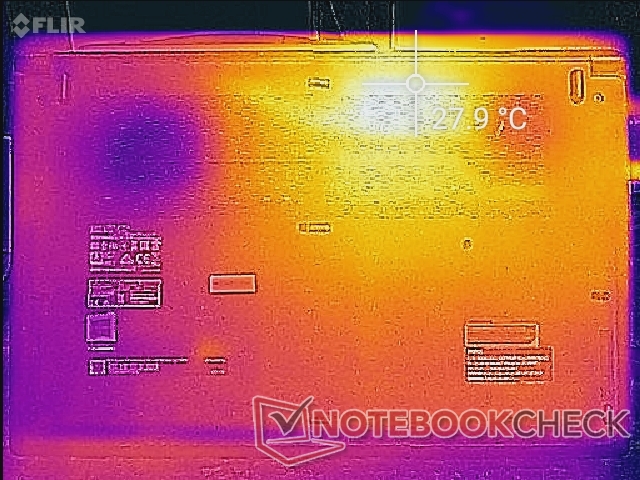
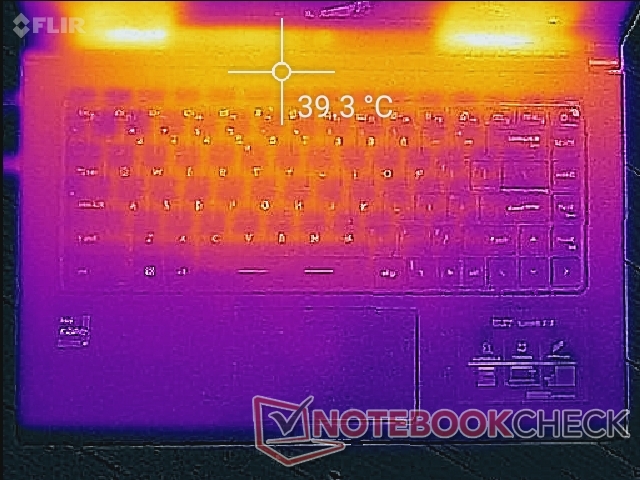
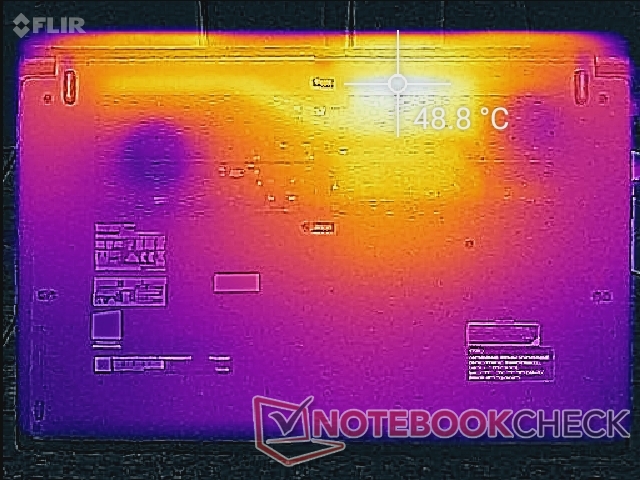
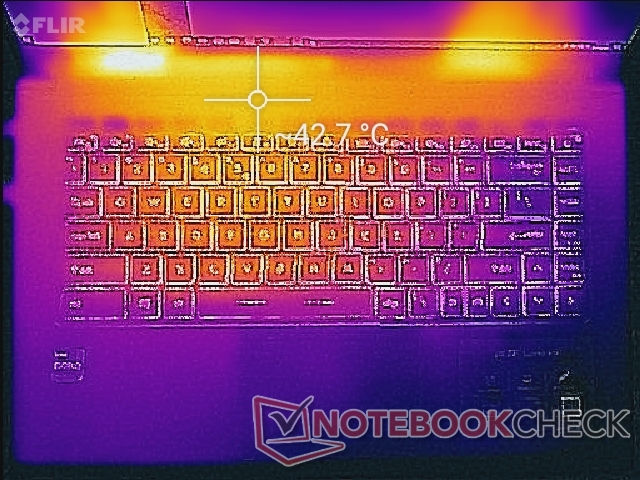
As temperaturas de superfície são visivelmente mais frias do que o que observamos no Modern 15, provavelmente porque nossa Cúpula B15 não vem com uma GPU discreta. Por exemplo, o centro do teclado se estabiliza em torno de 38 C quando executando cargas pesadas de processamento em comparação com 45 C na Moderno 15. Os pontos quentes no fundo também estão alguns graus mais frios desta vez. Mais da superfície do fundo é dedicada à ventilação ao contrário das pequenas grelhas no Razer Blade Stealth ou Lâmina 15 série.
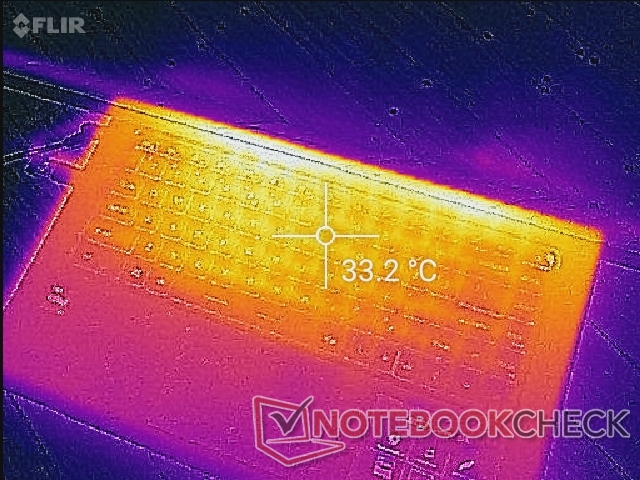
(±) A temperatura máxima no lado superior é 42.8 °C / 109 F, em comparação com a média de 34.3 °C / 94 F , variando de 21.2 a 62.5 °C para a classe Office.
(-) A parte inferior aquece até um máximo de 52.2 °C / 126 F, em comparação com a média de 36.8 °C / 98 F
(+) Em uso inativo, a temperatura média para o lado superior é 24.2 °C / 76 F, em comparação com a média do dispositivo de 29.5 °C / ### class_avg_f### F.
(+) Jogando The Witcher 3, a temperatura média para o lado superior é 31.9 °C / 89 F, em comparação com a média do dispositivo de 29.5 °C / ## #class_avg_f### F.
(+) Os apoios para as mãos e o touchpad são mais frios que a temperatura da pele, com um máximo de 29.2 °C / 84.6 F e, portanto, são frios ao toque.
(±) A temperatura média da área do apoio para as mãos de dispositivos semelhantes foi 27.6 °C / 81.7 F (-1.6 °C / -2.9 F).
Teste de estresse
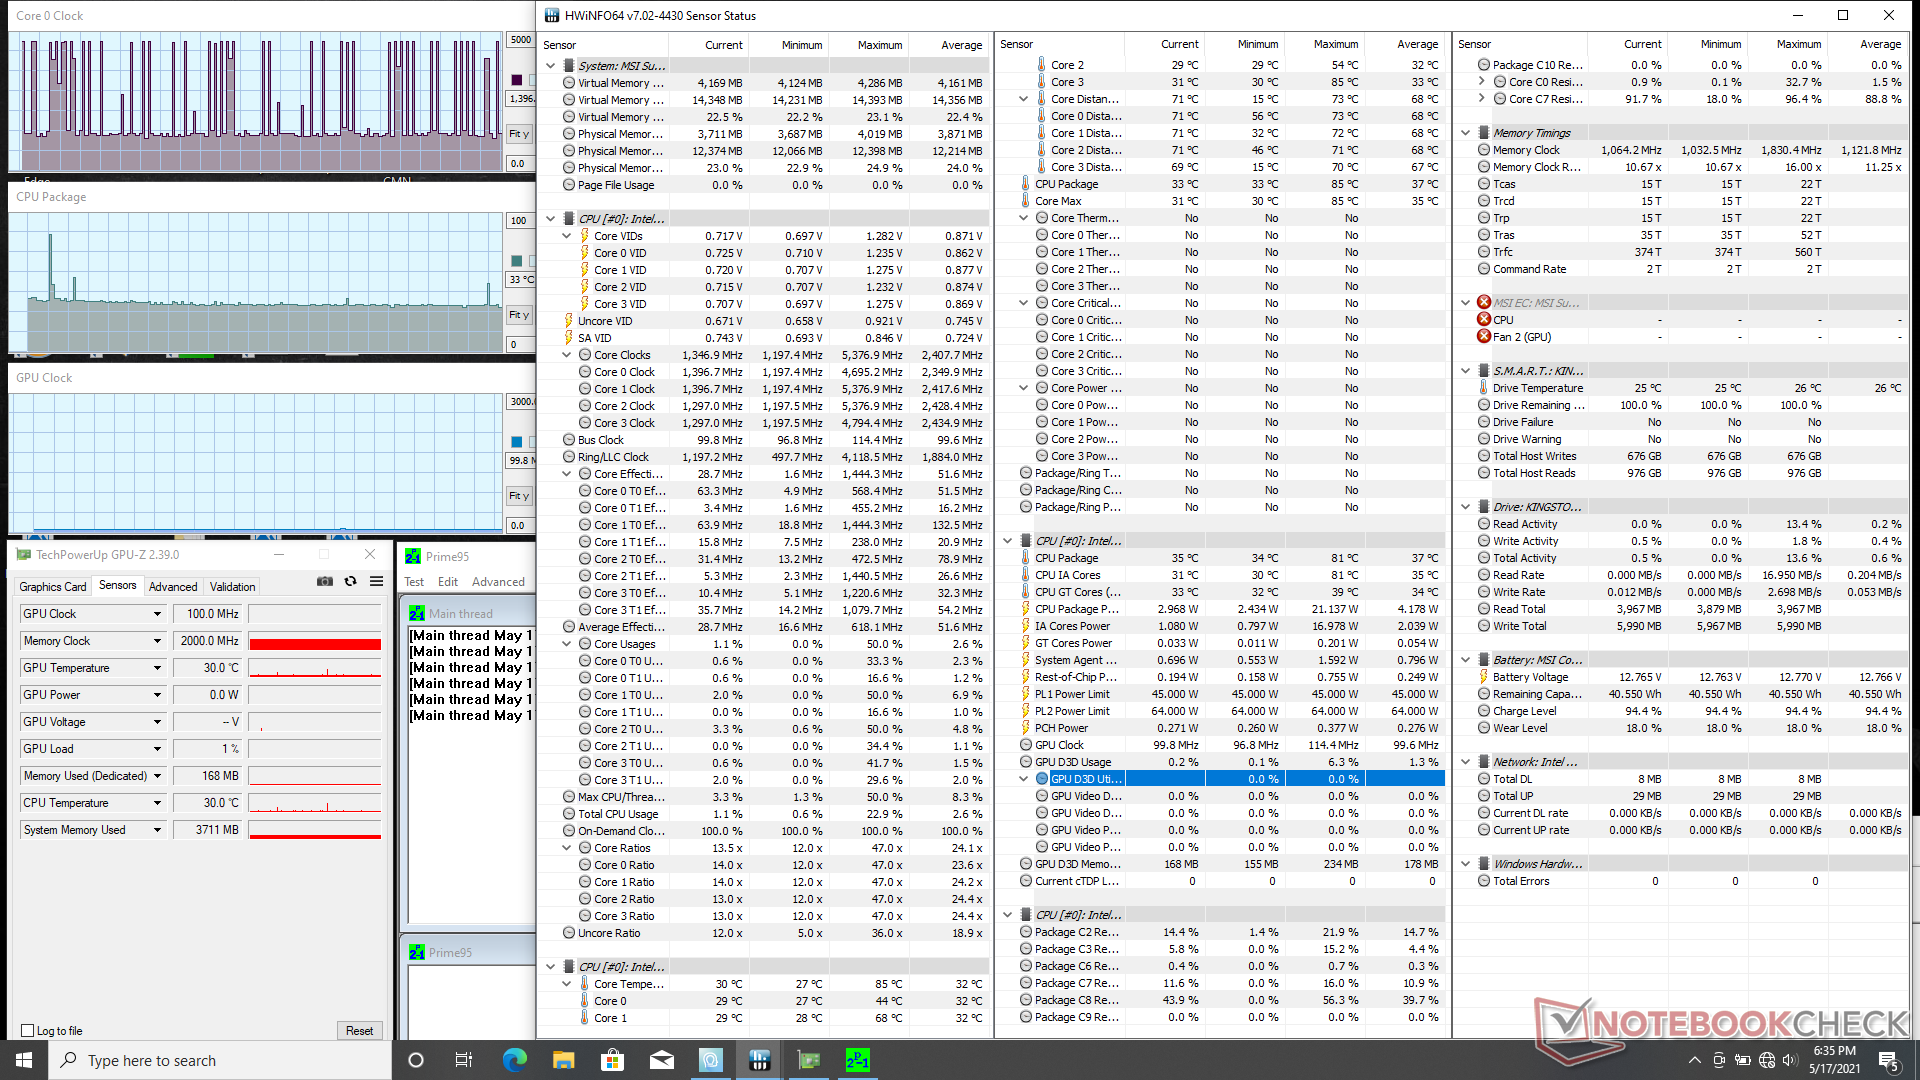
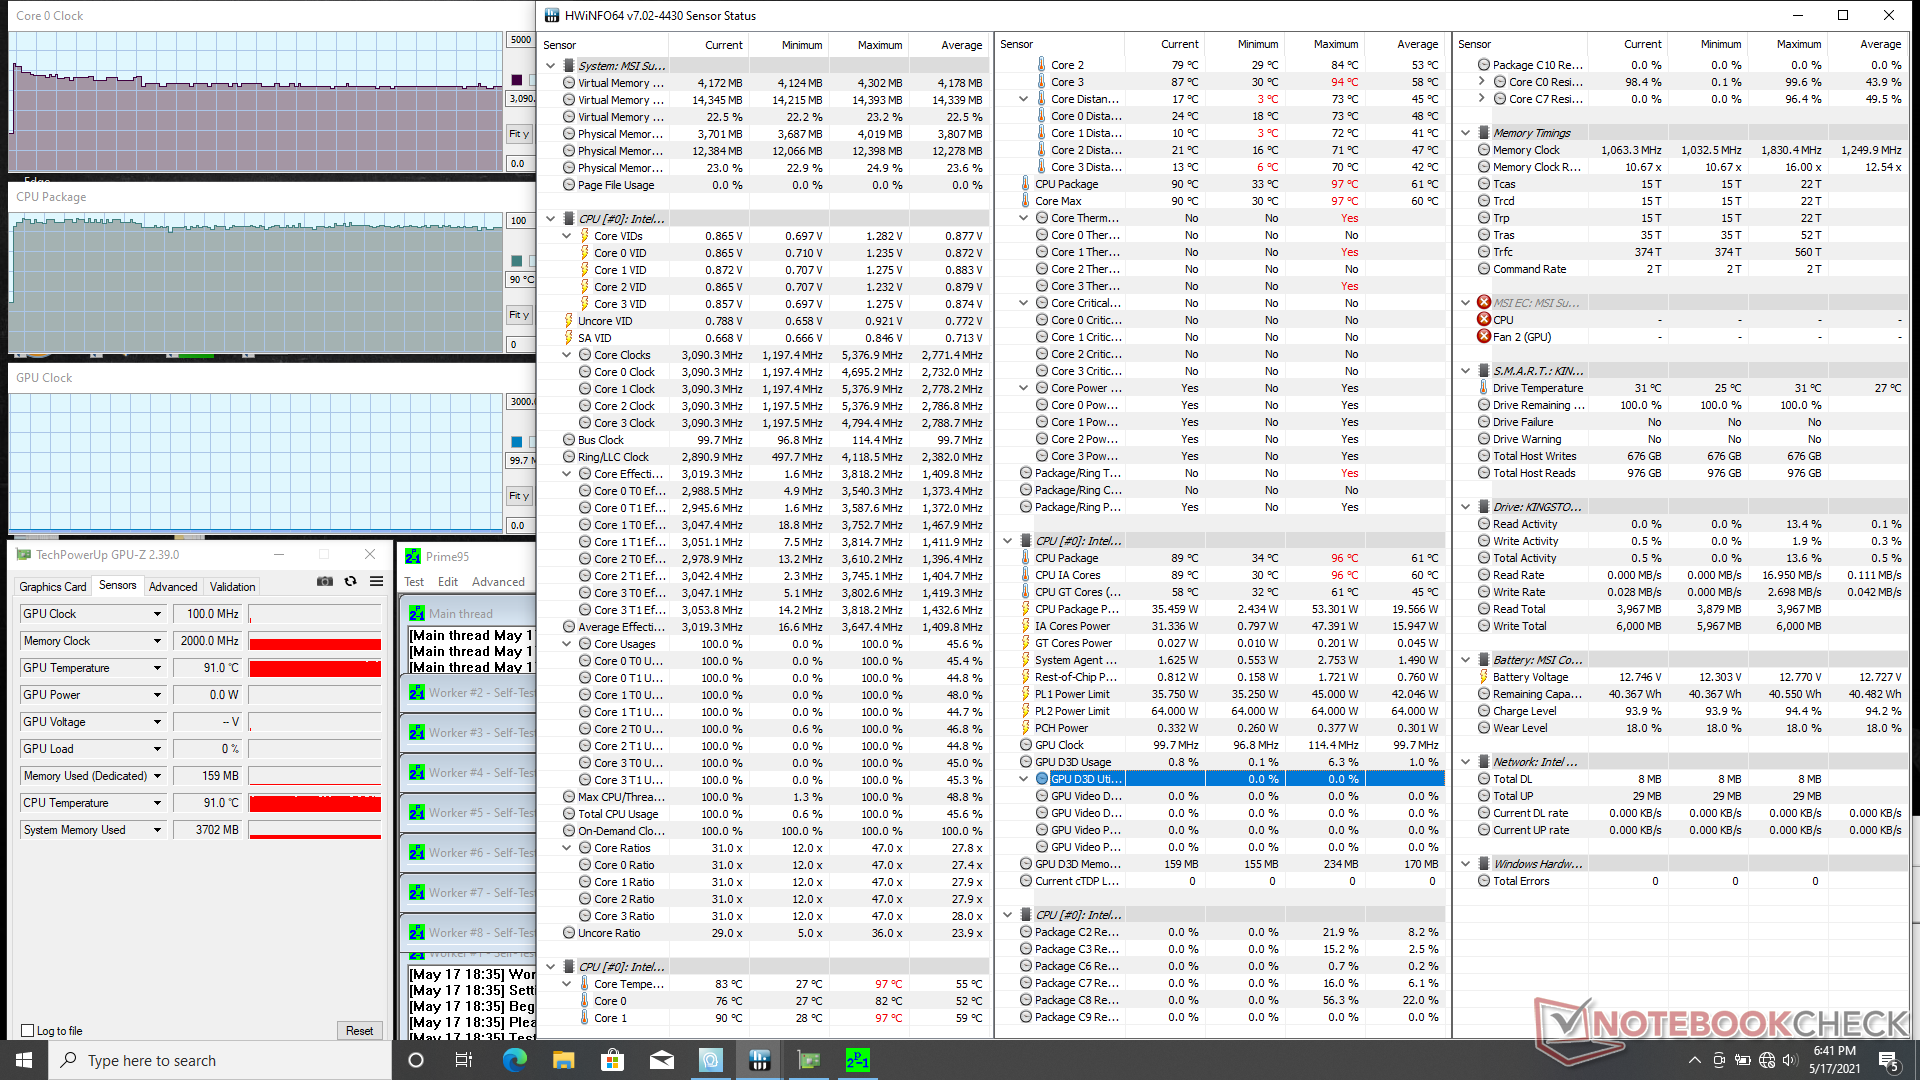
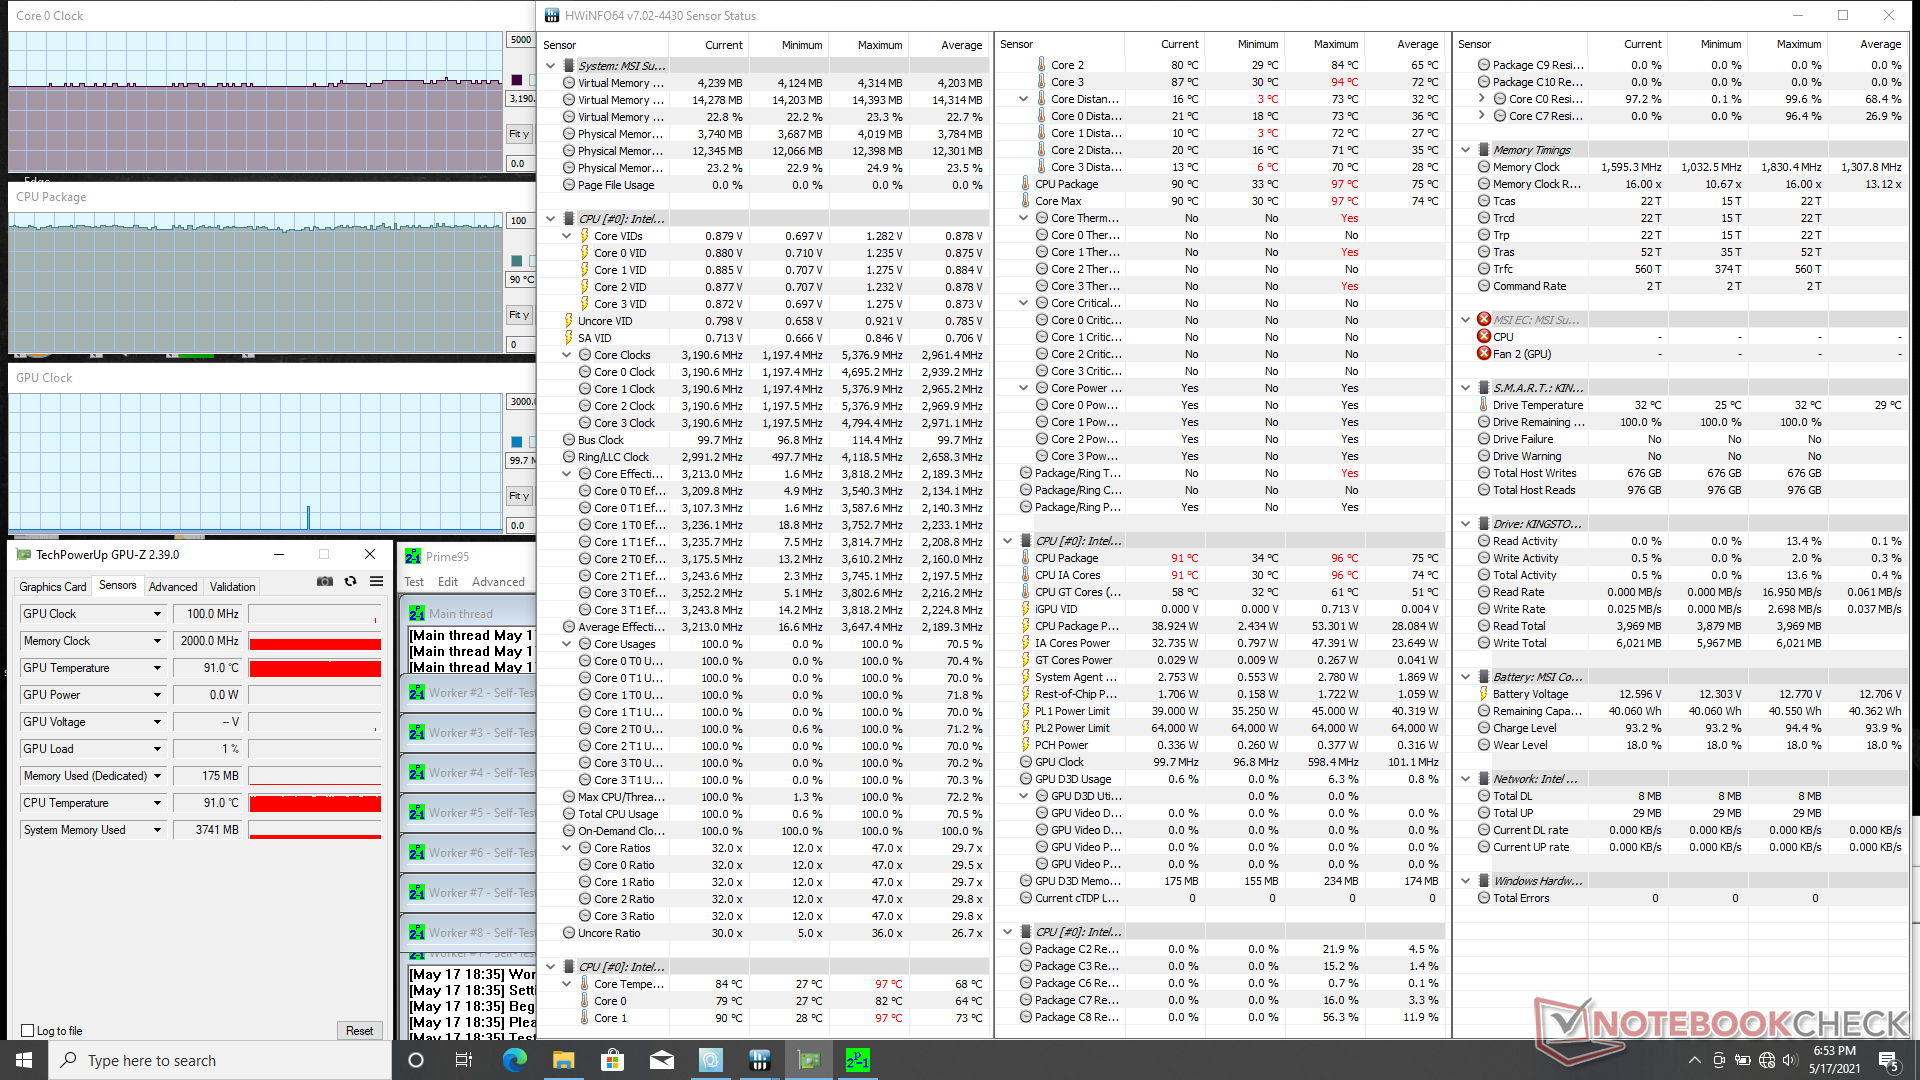
Quando estressada com Prime95, a CPU aumentaria para 3,8 GHz durante os primeiros segundos antes de cair constantemente e eventualmente se estabilizar na faixa de 3,0 a 3,1 GHz. A ativação do modo Cooler Boost (ou seja, modo de ventilador máximo) fará com que a CPU funcione um pouco mais rápido em 3,2 a 3,3 GHz enquanto a temperatura central permanece a mesma em 90 C. A temperatura da CPU no Modern 15 seria muito mais fria em 73 C quando sob cargas similares
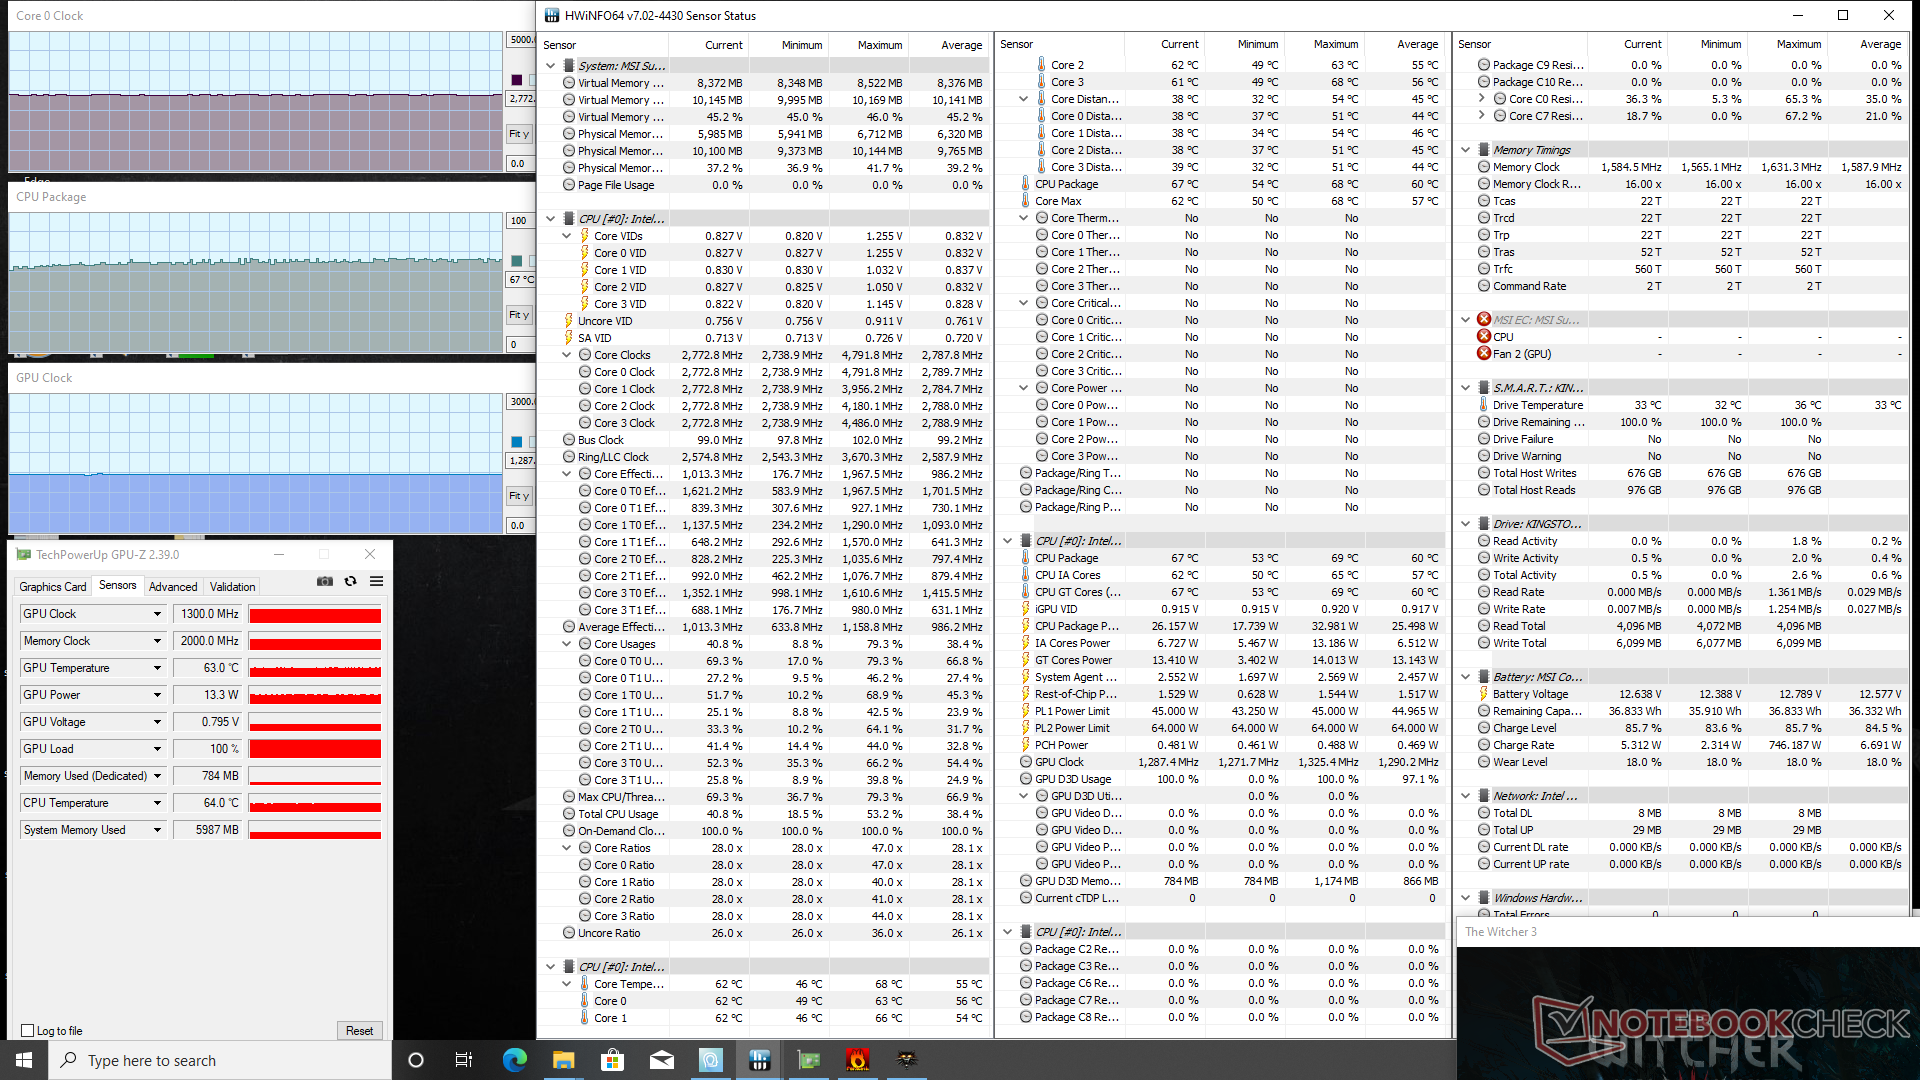
Quando em funcionamento Witcher 3 para representar cargas estressantes do mundo real, a CPU se estabilizaria em apenas 67 C ou mesmo 56 C se o Cooler Boost fosse ativado. O desempenho permanece o mesmo, não importa o ajuste do Cooler Boost, no entanto, o que significa que o recurso é principalmente para fins de temperatura
O funcionamento com baterias pode ter impacto no desempenho gráfico. Um teste 3DMark 11 na energia da bateria retornaria a mesma pontuação de Física que a energia do adaptador AC, mas com uma pontuação gráfica ligeiramente menor (6550 vs. 6232 pontos).
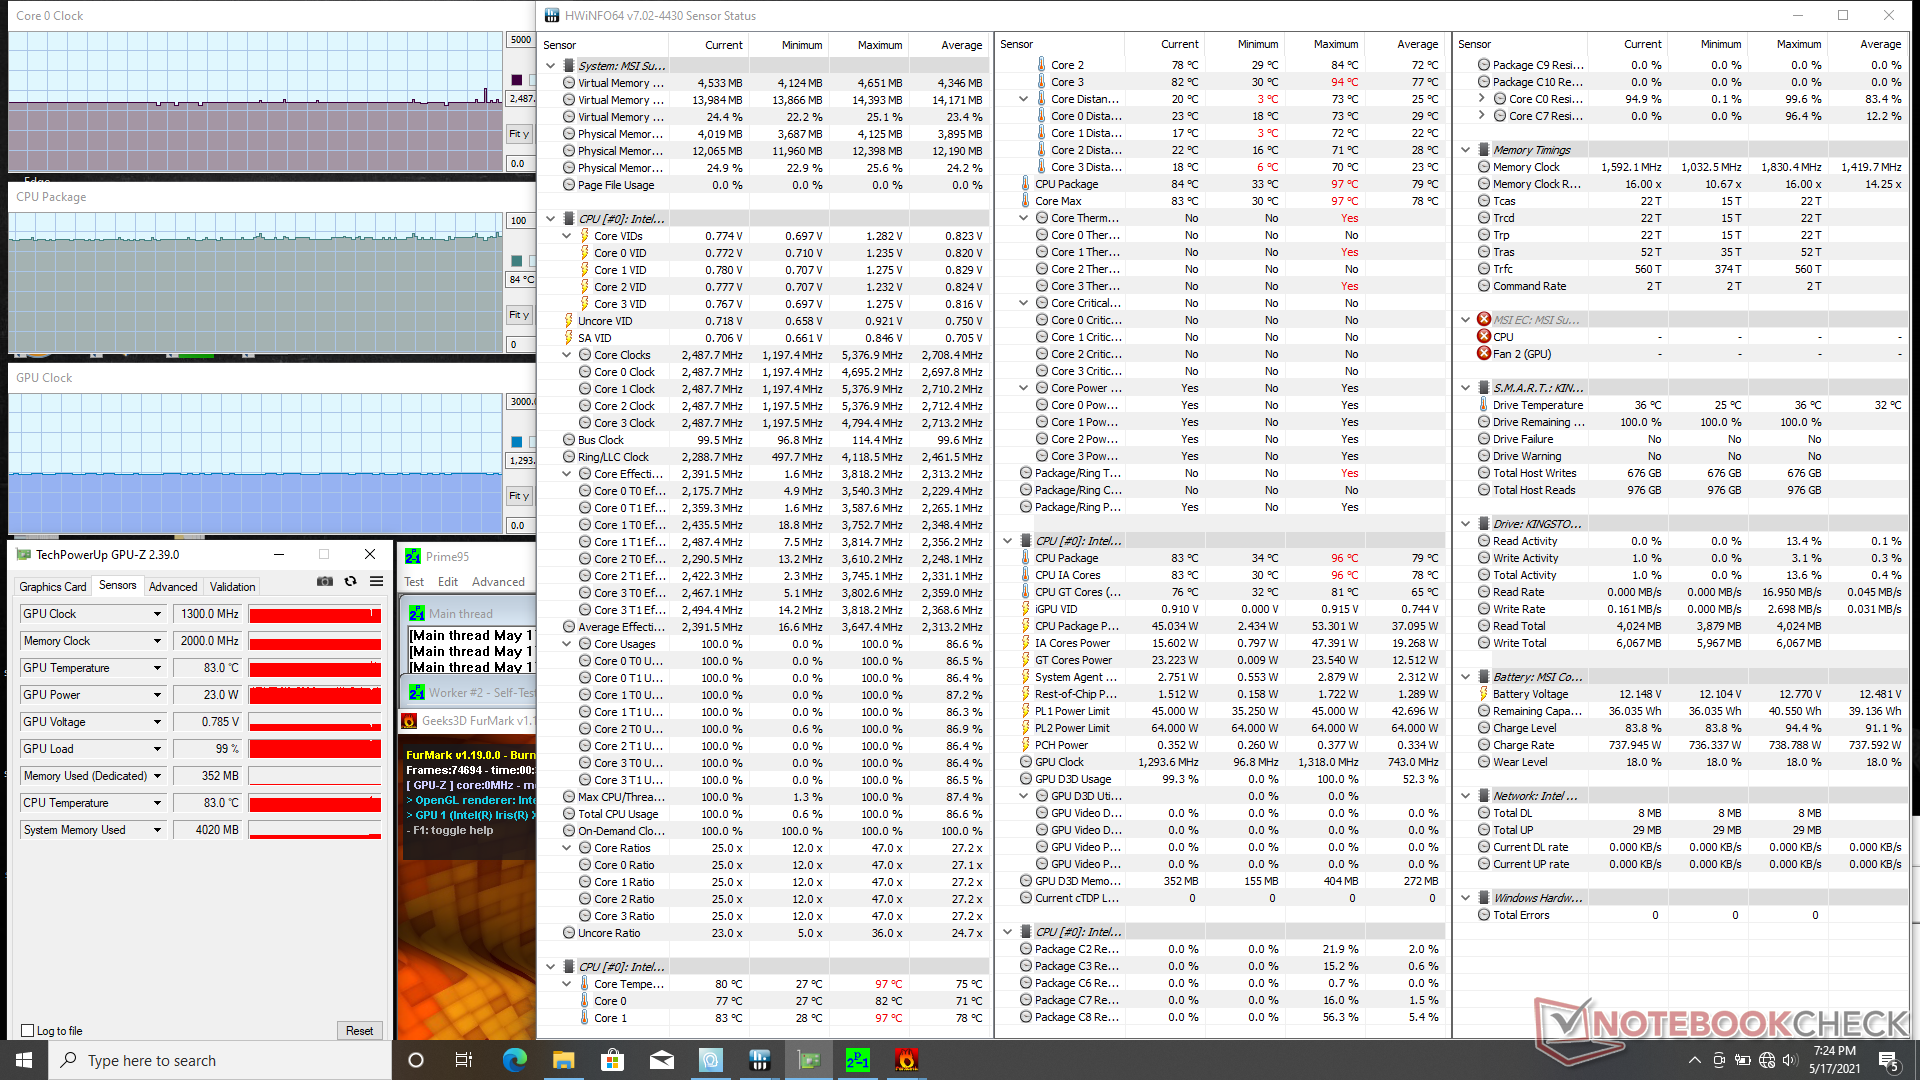

| RelógioCPU (GHz) | RelógioGPU (MHz) | Temperaturamédiada CPU (°C) | |
| System Idle | -- | --33 | |
| Prime95 + FurMark Stress (Cooler Boost on) | 2.5 | 1300 | 84 |
| Prime95 Stress (Cooler Boost off) | 3.0 - 3.1 | -90 | |
| Prime95 Stress (Cooler Boost on) | 3.2 - 3.3 | -90 | |
| Witcher 3 Stress (Cooler Boost off) | 2.8 | 1300 | 67 |
| Witcher 3 Stress (Cooler Boost on) | 2.8 | 1300 | 56 |
Oradores


MSI Summit B15 A11M análise de áudio
(+) | os alto-falantes podem tocar relativamente alto (###valor### dB)
Graves 100 - 315Hz
(-) | quase nenhum baixo - em média 18.2% menor que a mediana
(±) | a linearidade dos graves é média (12.2% delta para a frequência anterior)
Médios 400 - 2.000 Hz
(±) | médios mais altos - em média 9.5% maior que a mediana
(±) | a linearidade dos médios é média (9.3% delta para frequência anterior)
Altos 2 - 16 kHz
(±) | máximos mais altos - em média 7.5% maior que a mediana
(±) | a linearidade dos máximos é média (7.1% delta para frequência anterior)
Geral 100 - 16.000 Hz
(±) | a linearidade do som geral é média (25.6% diferença em relação à mediana)
Comparado com a mesma classe
» 78% de todos os dispositivos testados nesta classe foram melhores, 6% semelhantes, 16% piores
» O melhor teve um delta de 7%, a média foi 21%, o pior foi 53%
Comparado com todos os dispositivos testados
» 79% de todos os dispositivos testados foram melhores, 4% semelhantes, 17% piores
» O melhor teve um delta de 4%, a média foi 23%, o pior foi 134%
Apple MacBook 12 (Early 2016) 1.1 GHz análise de áudio
(+) | os alto-falantes podem tocar relativamente alto (###valor### dB)
Graves 100 - 315Hz
(±) | graves reduzidos - em média 11.3% menor que a mediana
(±) | a linearidade dos graves é média (14.2% delta para a frequência anterior)
Médios 400 - 2.000 Hz
(+) | médios equilibrados - apenas 2.4% longe da mediana
(+) | médios são lineares (5.5% delta para frequência anterior)
Altos 2 - 16 kHz
(+) | agudos equilibrados - apenas 2% longe da mediana
(+) | os máximos são lineares (4.5% delta da frequência anterior)
Geral 100 - 16.000 Hz
(+) | o som geral é linear (10.2% diferença em relação à mediana)
Comparado com a mesma classe
» 7% de todos os dispositivos testados nesta classe foram melhores, 2% semelhantes, 90% piores
» O melhor teve um delta de 5%, a média foi 18%, o pior foi 53%
Comparado com todos os dispositivos testados
» 5% de todos os dispositivos testados foram melhores, 1% semelhantes, 94% piores
» O melhor teve um delta de 4%, a média foi 23%, o pior foi 134%
Energy Management
Consumo de energia
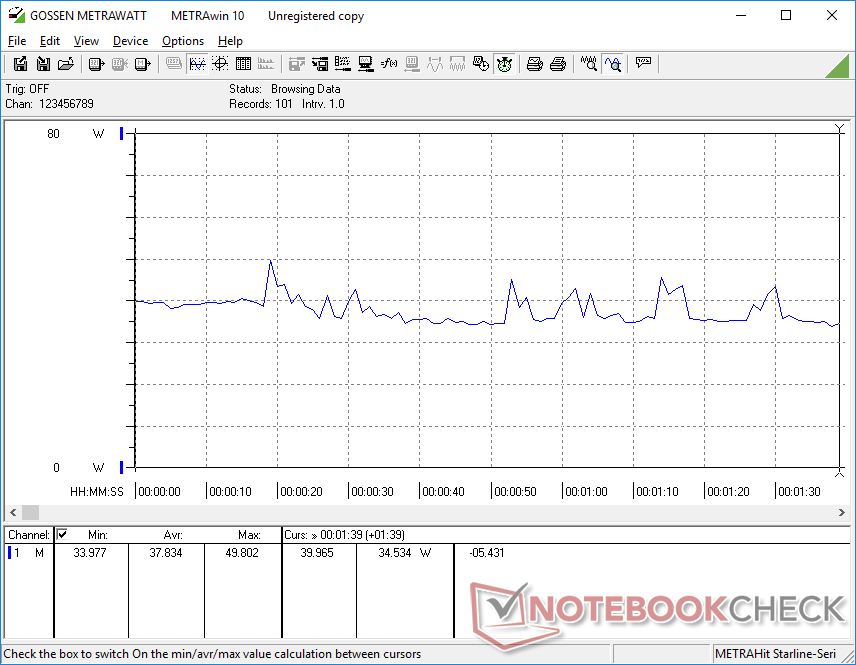
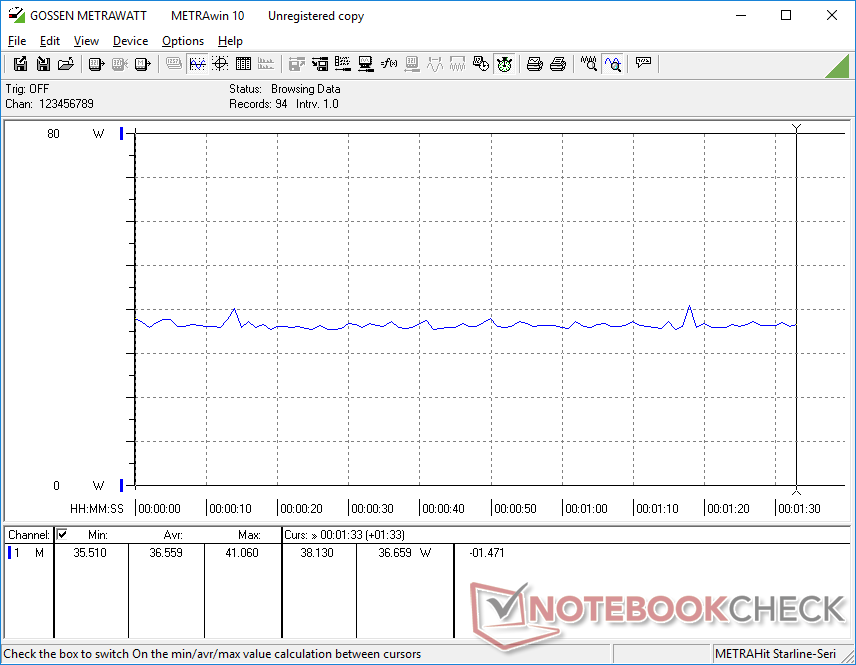
O consumo de energia é baixo, especialmente quando comparado ao do ano passado, Modern 15. O Idling no desktop consome entre 4 W e 9 W, dependendo do nível de brilho e do perfil de potência, enquanto o Modern 15 consumiria entre 6 W e 15 W. Os jogos de corrida também consumiriam apenas 38 W em nossa Summit B15 em comparação com 59 W a 83 W na Modern 15, apesar de nosso sistema de Summit poder superar a CPU do 10º gênero na Modern 15, estando aproximadamente no mesmo nível da CPU do GeForce MX250
Curiosamente, o XPG Xenia Xe com a mesma CPU Core i7-1165G7 e GPU Iris Xe consumiria um pouco mais de energia do que nossa Summit B15 quando jogando (44 W vs. 38 W). O sistema XPG, no entanto, também teria um desempenho superior ao de nossa Summit em GPU benchmarks e jogos
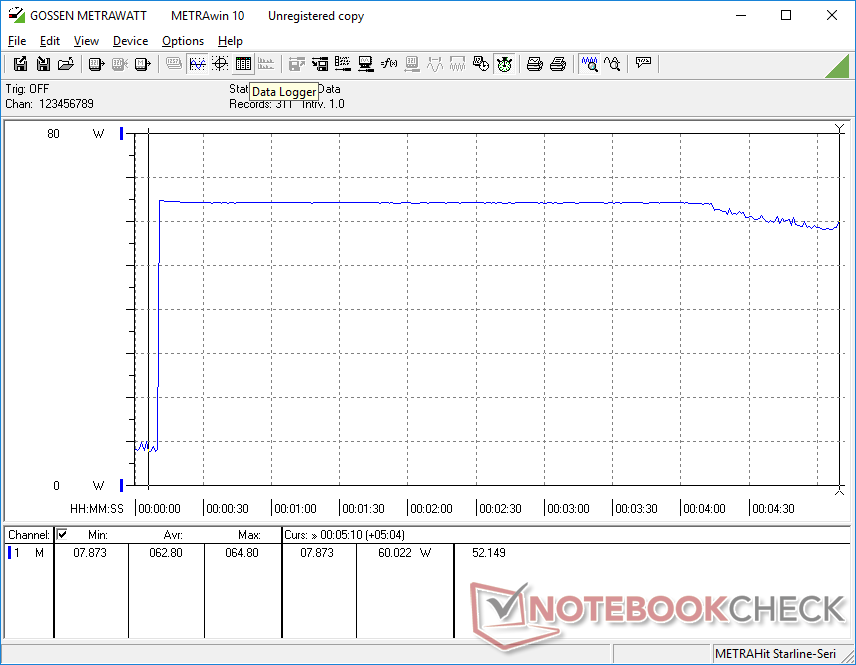
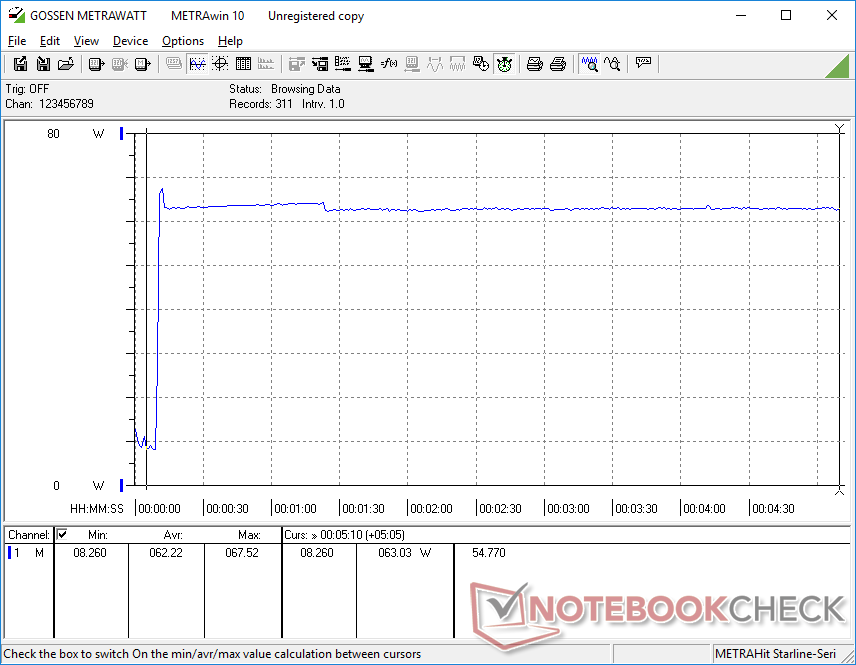
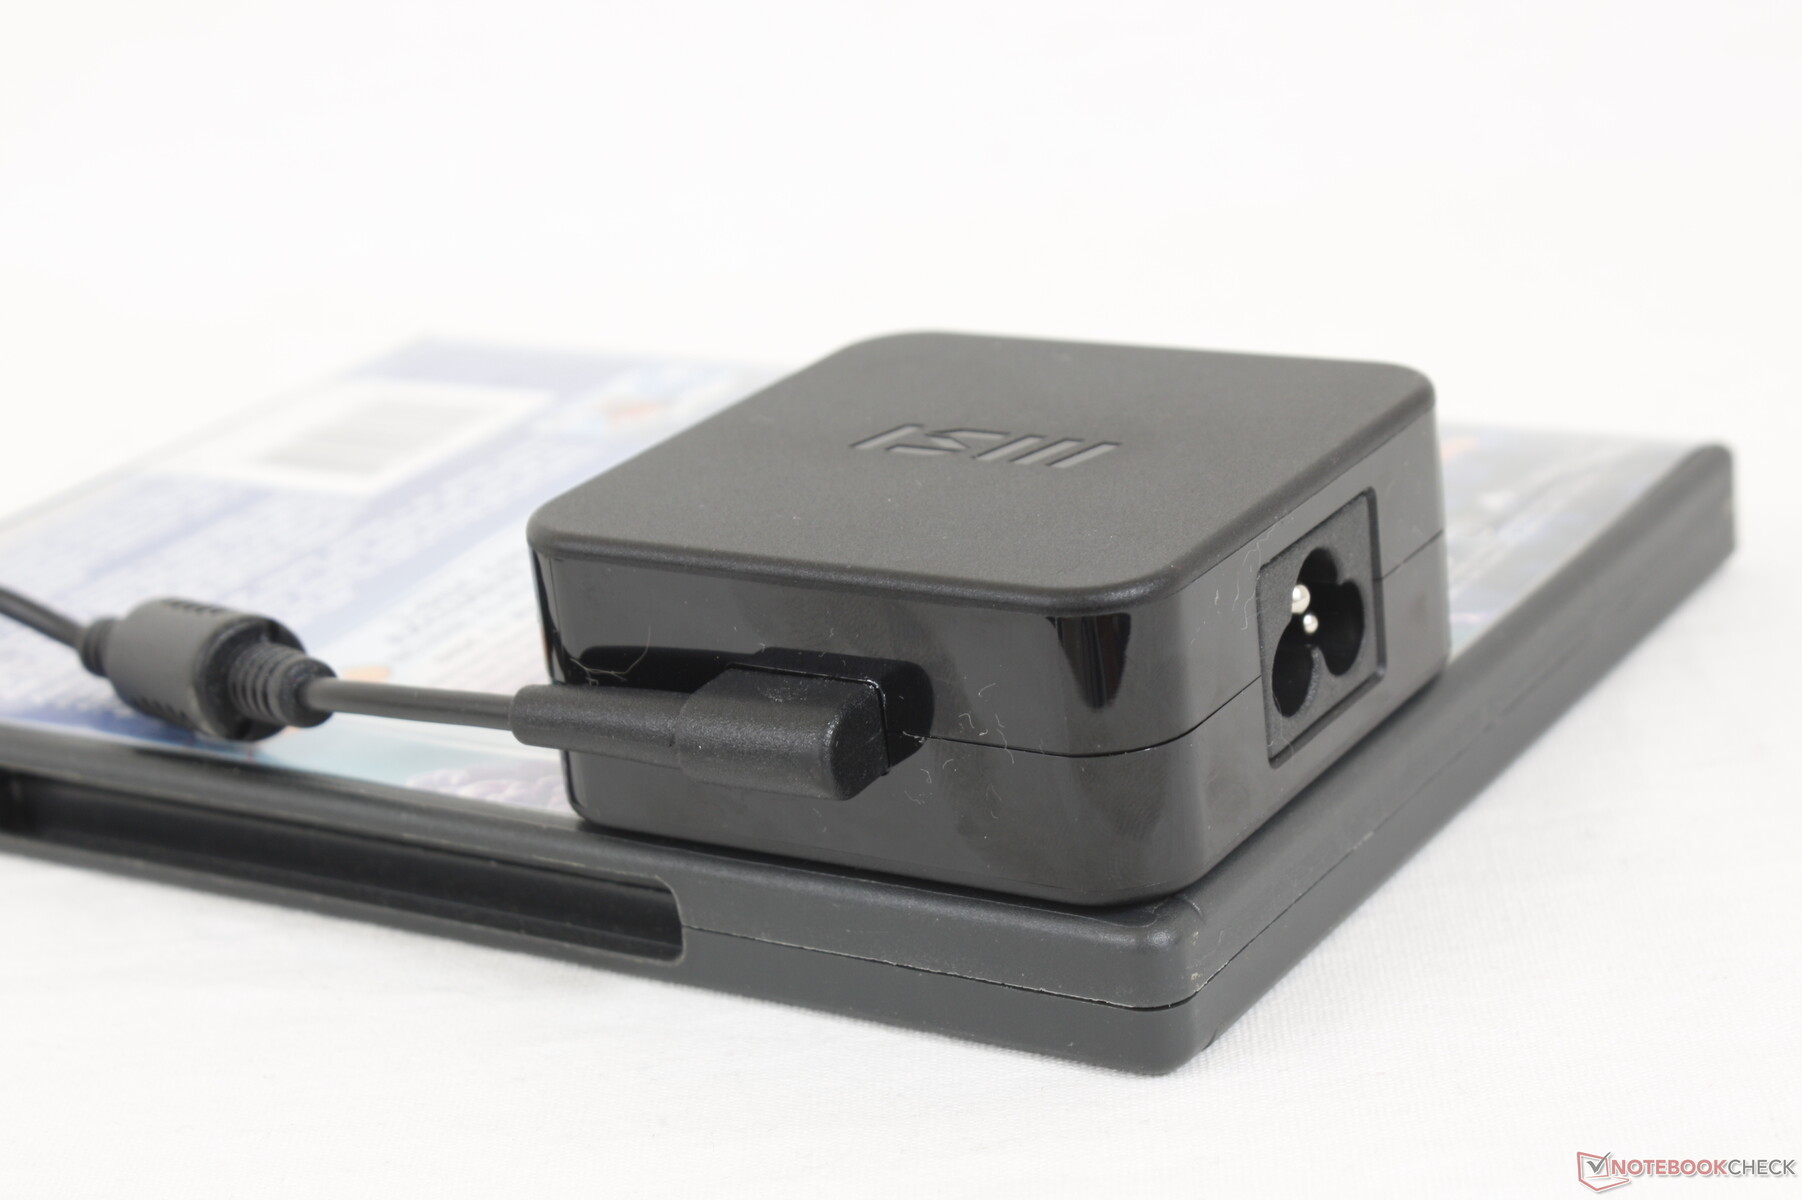
Somos capazes de registrar um máximo de 67,5 W de um pequeno (~6,5 x 6,5 x 2,8 cm) adaptador CA de 65 W. O sistema pode até manter um sorteio aproximado de 60 a 63 W por longos períodos quando sob extrema tensão de processamento para mostrar que um adaptador AC mais capaz poderia ter sido benéfico.
| desligado | |
| Ocioso | |
| Carga |
|
Key:
min: | |
| MSI Summit B15 A11M i7-1165G7, Iris Xe G7 96EUs, Kingston OM8PCP31024F, IPS, 1920x1080, 15.6" | MSI Summit E15 A11SCST i7-1185G7, GeForce GTX 1650 Ti Max-Q, Phison 1TB SM2801T24GKBB4S-E162, IPS, 1920x1080, 15.6" | Dell XPS 15 9500 Core i5 i5-10300H, UHD Graphics 630, Toshiba KBG40ZNS256G NVMe, IPS, 1920x1200, 15.6" | HP Spectre X360 15-5ZV31AV i7-10510U, GeForce MX250, Intel SSD 660p 2TB SSDPEKNW020T8, IPS, 3840x2160, 15.6" | ADATA XPG Xenia Xe i7-1165G7, Iris Xe G7 96EUs, ADATA XPG Gammix S50 1TB, IPS, 1920x1080, 15.6" | Asus ZenBook 15 UX534FTC-A8190T i7-10510U, GeForce GTX 1650 Max-Q, Samsung SSD PM981 MZVLB1T0HALR, IPS, 1920x1080, 15.6" | |
|---|---|---|---|---|---|---|
| Power Consumption | -68% | -3% | -34% | 8% | -29% | |
| Idle Minimum * (Watt) | 4.2 | 6 -43% | 2.9 31% | 5.2 -24% | 2.7 36% | 2.8 33% |
| Idle Average * (Watt) | 7.7 | 10 -30% | 7.6 1% | 8.5 -10% | 5.3 31% | 7.7 -0% |
| Idle Maximum * (Watt) | 8.4 | 16 -90% | 8 5% | 8.7 -4% | 7.3 13% | 9.4 -12% |
| Load Average * (Watt) | 37.8 | 84 -122% | 41.7 -10% | 65.6 -74% | 43.6 -15% | 57 -51% |
| Witcher 3 ultra * (Watt) | 36.6 | 69 -89% | 56.5 -54% | 43.5 -19% | 62 -69% | |
| Load Maximum * (Watt) | 67.5 | 90 -33% | 94.8 -40% | 92.4 -37% | 66.8 1% | 116 -72% |
* ... menor é melhor
Vida útil da bateria
Os tempos de execução são decentes em cerca de 6,5 horas de uso da WLAN no mundo real, sendo várias horas mais curtos do que o preço da Cúpula E15. A diferença pode ser atribuída à menor capacidade da bateria de apenas 52 W em comparação com os 80 W do modelo acima mencionado.
Carregar o sistema de capacidade vazia a plena com o adaptador de barril AC leva cerca de 2 horas. O sistema também pode ser recarregado através de adaptadores USB-C AC de terceiros. Suspeitamos que os futuros modelos deixarão a porta proprietária do barril de CA completamente aberta e mudarão para USB-C apenas para carregamento.
| MSI Summit B15 A11M i7-1165G7, Iris Xe G7 96EUs, 52 Wh | MSI Summit E15 A11SCST i7-1185G7, GeForce GTX 1650 Ti Max-Q, 80.25 Wh | Dell XPS 15 9500 Core i5 i5-10300H, UHD Graphics 630, 56 Wh | HP Spectre X360 15-5ZV31AV i7-10510U, GeForce MX250, 84 Wh | ADATA XPG Xenia Xe i7-1165G7, Iris Xe G7 96EUs, 73.41 Wh | Asus ZenBook 15 UX534FTC-A8190T i7-10510U, GeForce GTX 1650 Max-Q, 71 Wh | |
|---|---|---|---|---|---|---|
| Duração da bateria | 41% | 48% | 92% | 77% | 92% | |
| Reader / Idle (h) | 18.4 | 19.5 6% | 26.4 43% | 22.6 23% | 27.2 48% | |
| WiFi v1.3 (h) | 6.6 | 9.1 38% | 9.3 41% | 10.8 64% | 11.7 77% | 12.4 88% |
| Load (h) | 1 | 1.8 80% | 1.6 60% | 2.9 190% | 2.4 140% |
Pro
Contra
Veredicto

Vale a pena comprar o MSI Summit B15 sobre o mais antigo Moderno 15 apesar de ambos serem laptops muito parecidos? Se você valoriza o Thunderbolt 4, um processador mais rápido e geralmente mais silencioso, então o mais novo Summit B15 pode valer a pena considerar. Seu desempenho bruto é impressionante para um fator de forma tão leve de 15,6 polegadas e os usuários podem sempre conectar GPUs e monitores externos para gráficos mais rápidos e melhores cores, respectivamente.
Os viajantes vão adorar o peso superleve, os ventiladores silenciosos e o alto desempenho em relação aos populares Ultrabooks de 15,6 polegadas como o XPS 15, Spectre x360 15, ou Lenovo IdeaPad 15. Entretanto, por um laptop de >$1000 USD, a rigidez do chassi não é tão forte quanto gostaríamos.
Se suas cargas de trabalho consistem principalmente em navegação básica na web, streaming de vídeo, jogos leves ou edição mínima, então o Modern 15 com gráficos GeForce MX será mais do que suficiente e ao mesmo tempo custará centenas de dólares menos. Tenha em mente que os dois laptops proporcionarão a mesma experiência no que diz respeito à qualidade de exibição, teclado, clickpad e chassi. Você perderá, no entanto, a lucrativa capacidade de ancoragem do Thunderbolt.
Preço e disponibilidade
O MSI Summit B15 está agora amplamente disponível na maioria dos varejistas. Nossa configuração pode ser encontrada atualmente online por cerca de $1150 USD em Xotic PC, Amazônia, Newegg, Melhor compra, e Walmart
MSI Summit B15 A11M
- 05/20/2021 v7 (old)
Allen Ngo
Price comparison

