Veredicto - O ThinkPad P16v Gen 3 é uma boa estação de trabalho móvel
No teste, o ThinkPad P16v Gen 3 é bastante convincente como estação de trabalho móvel e recebe uma boa classificação geral. Além da longa duração da bateria, há um bom desempenho do sistema, muitas conexões e opções de manutenção muito boas. As teclas TouchPad e TrackPoint são de alta qualidade, mas o teclado é apenas mediano e definitivamente há espaço para melhorias aqui (especialmente em comparação com o ThinkPad P1 16 Gen 8).
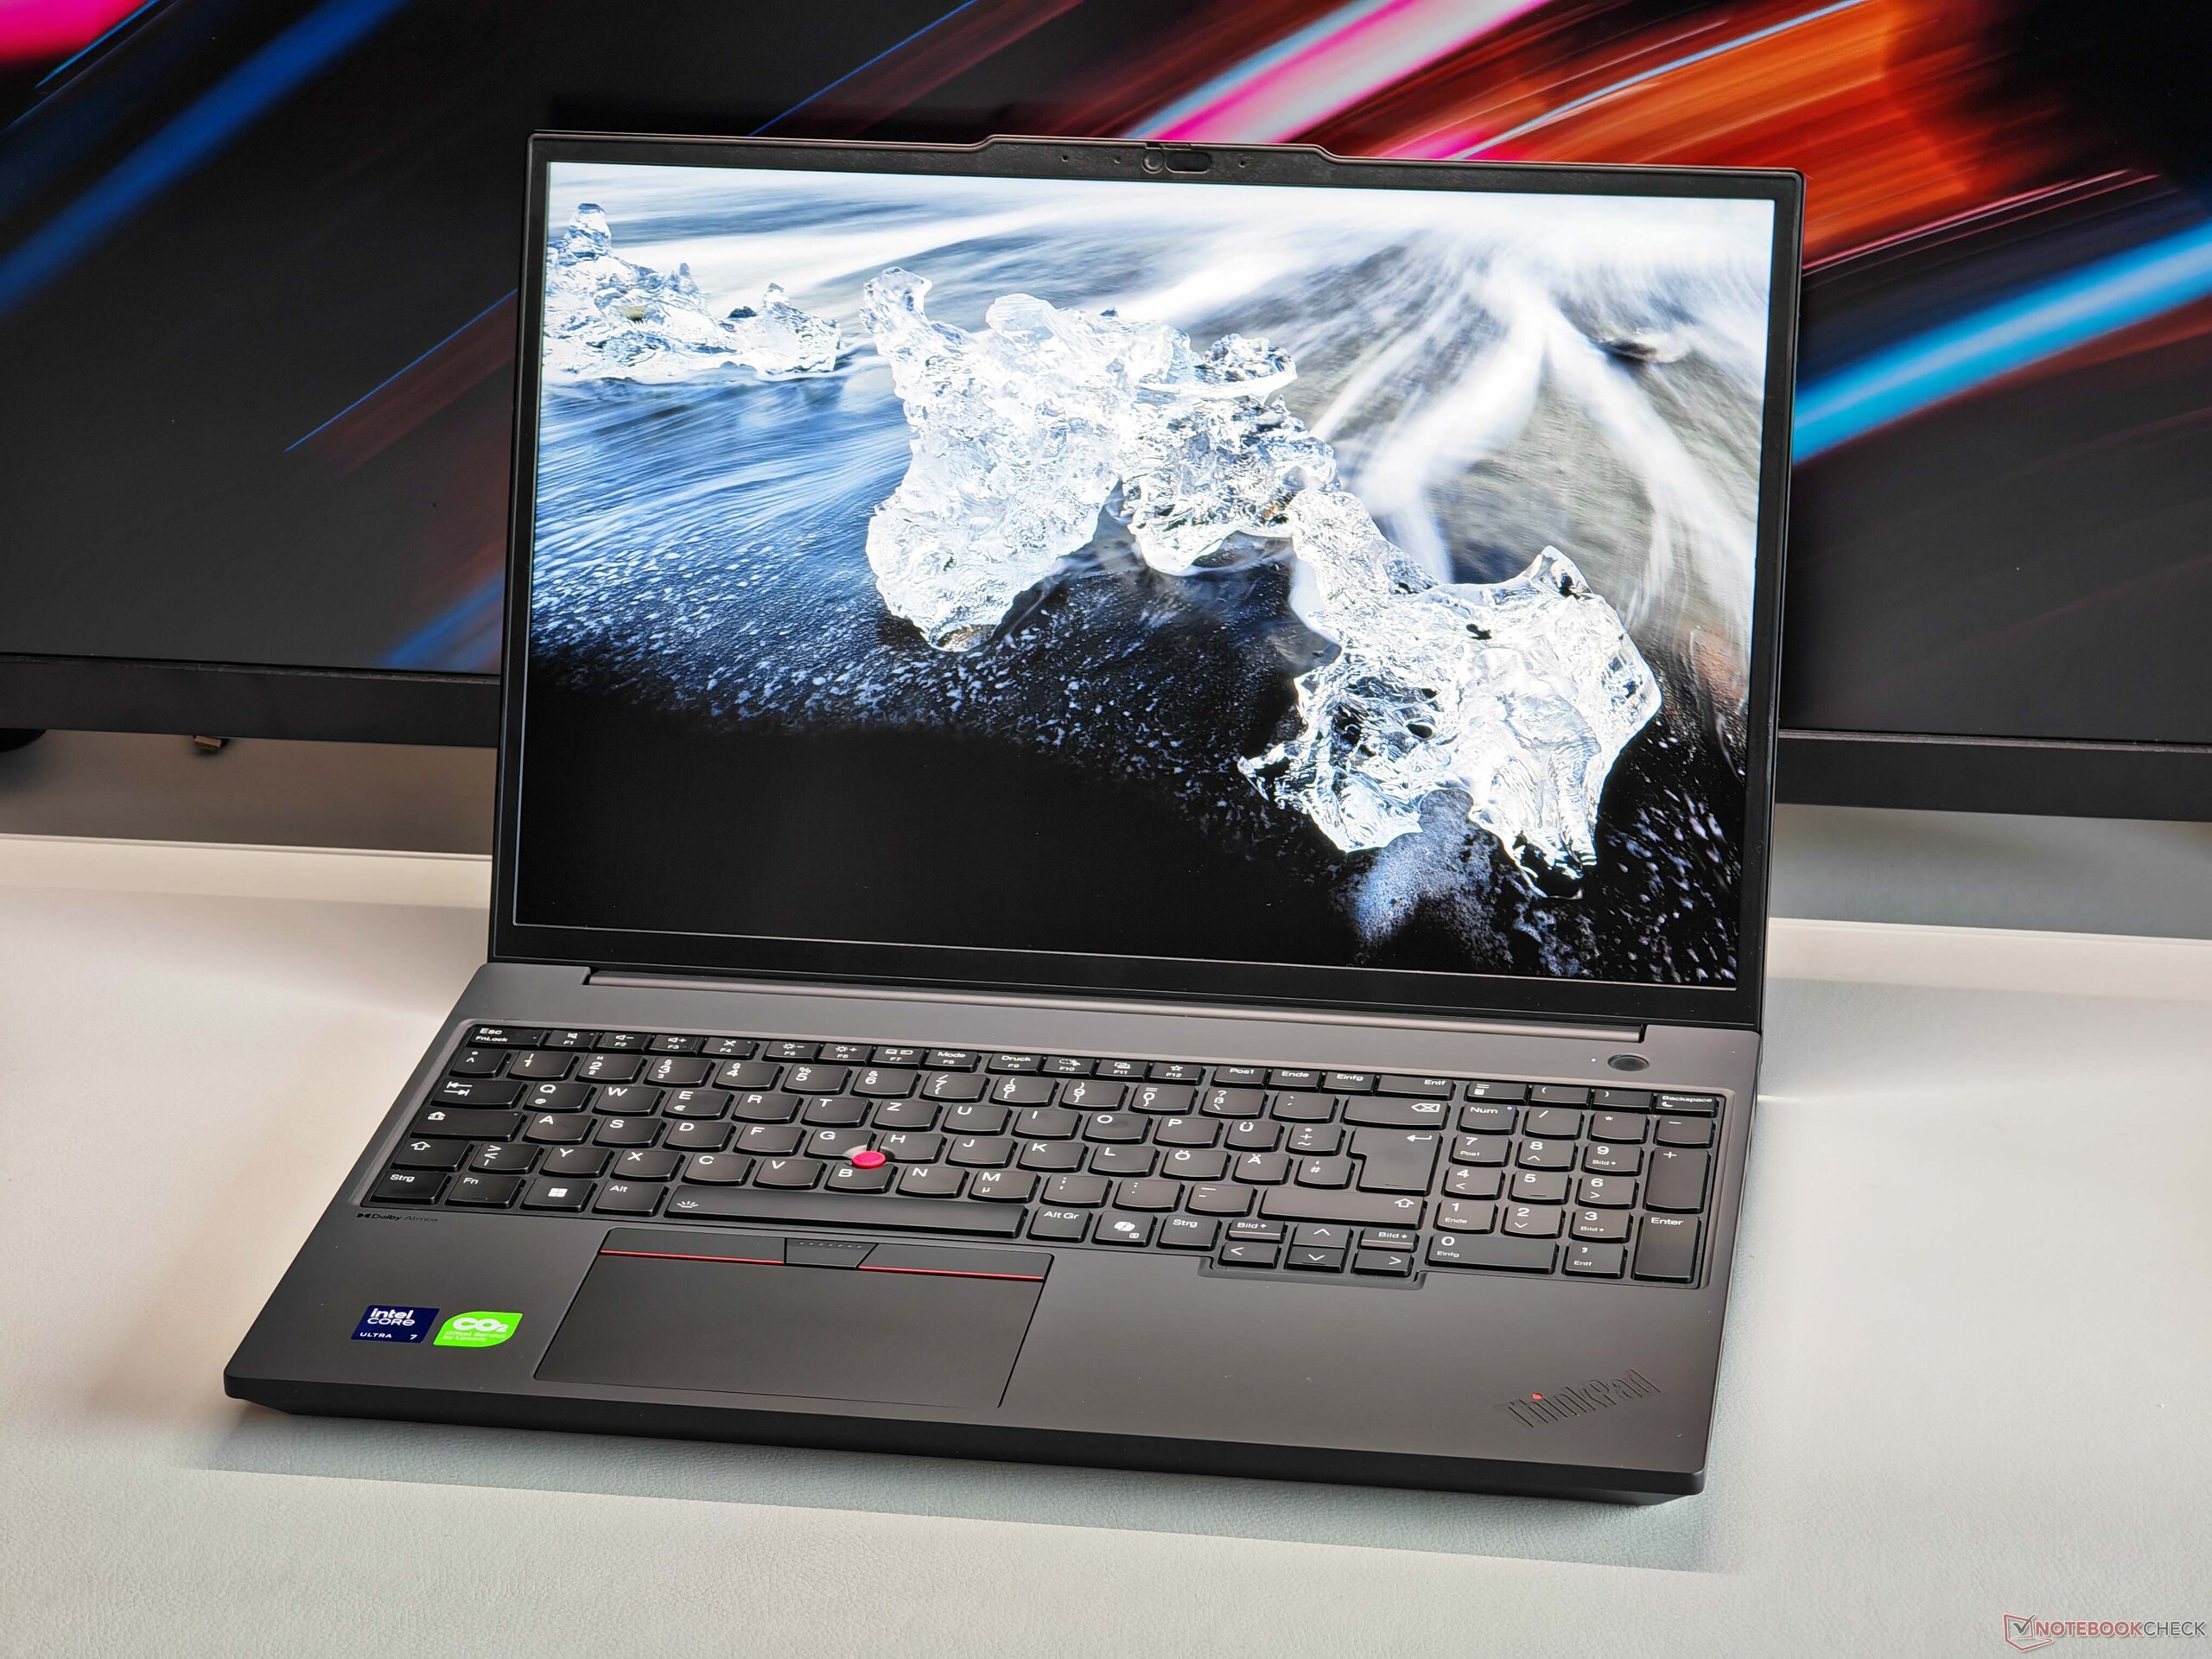
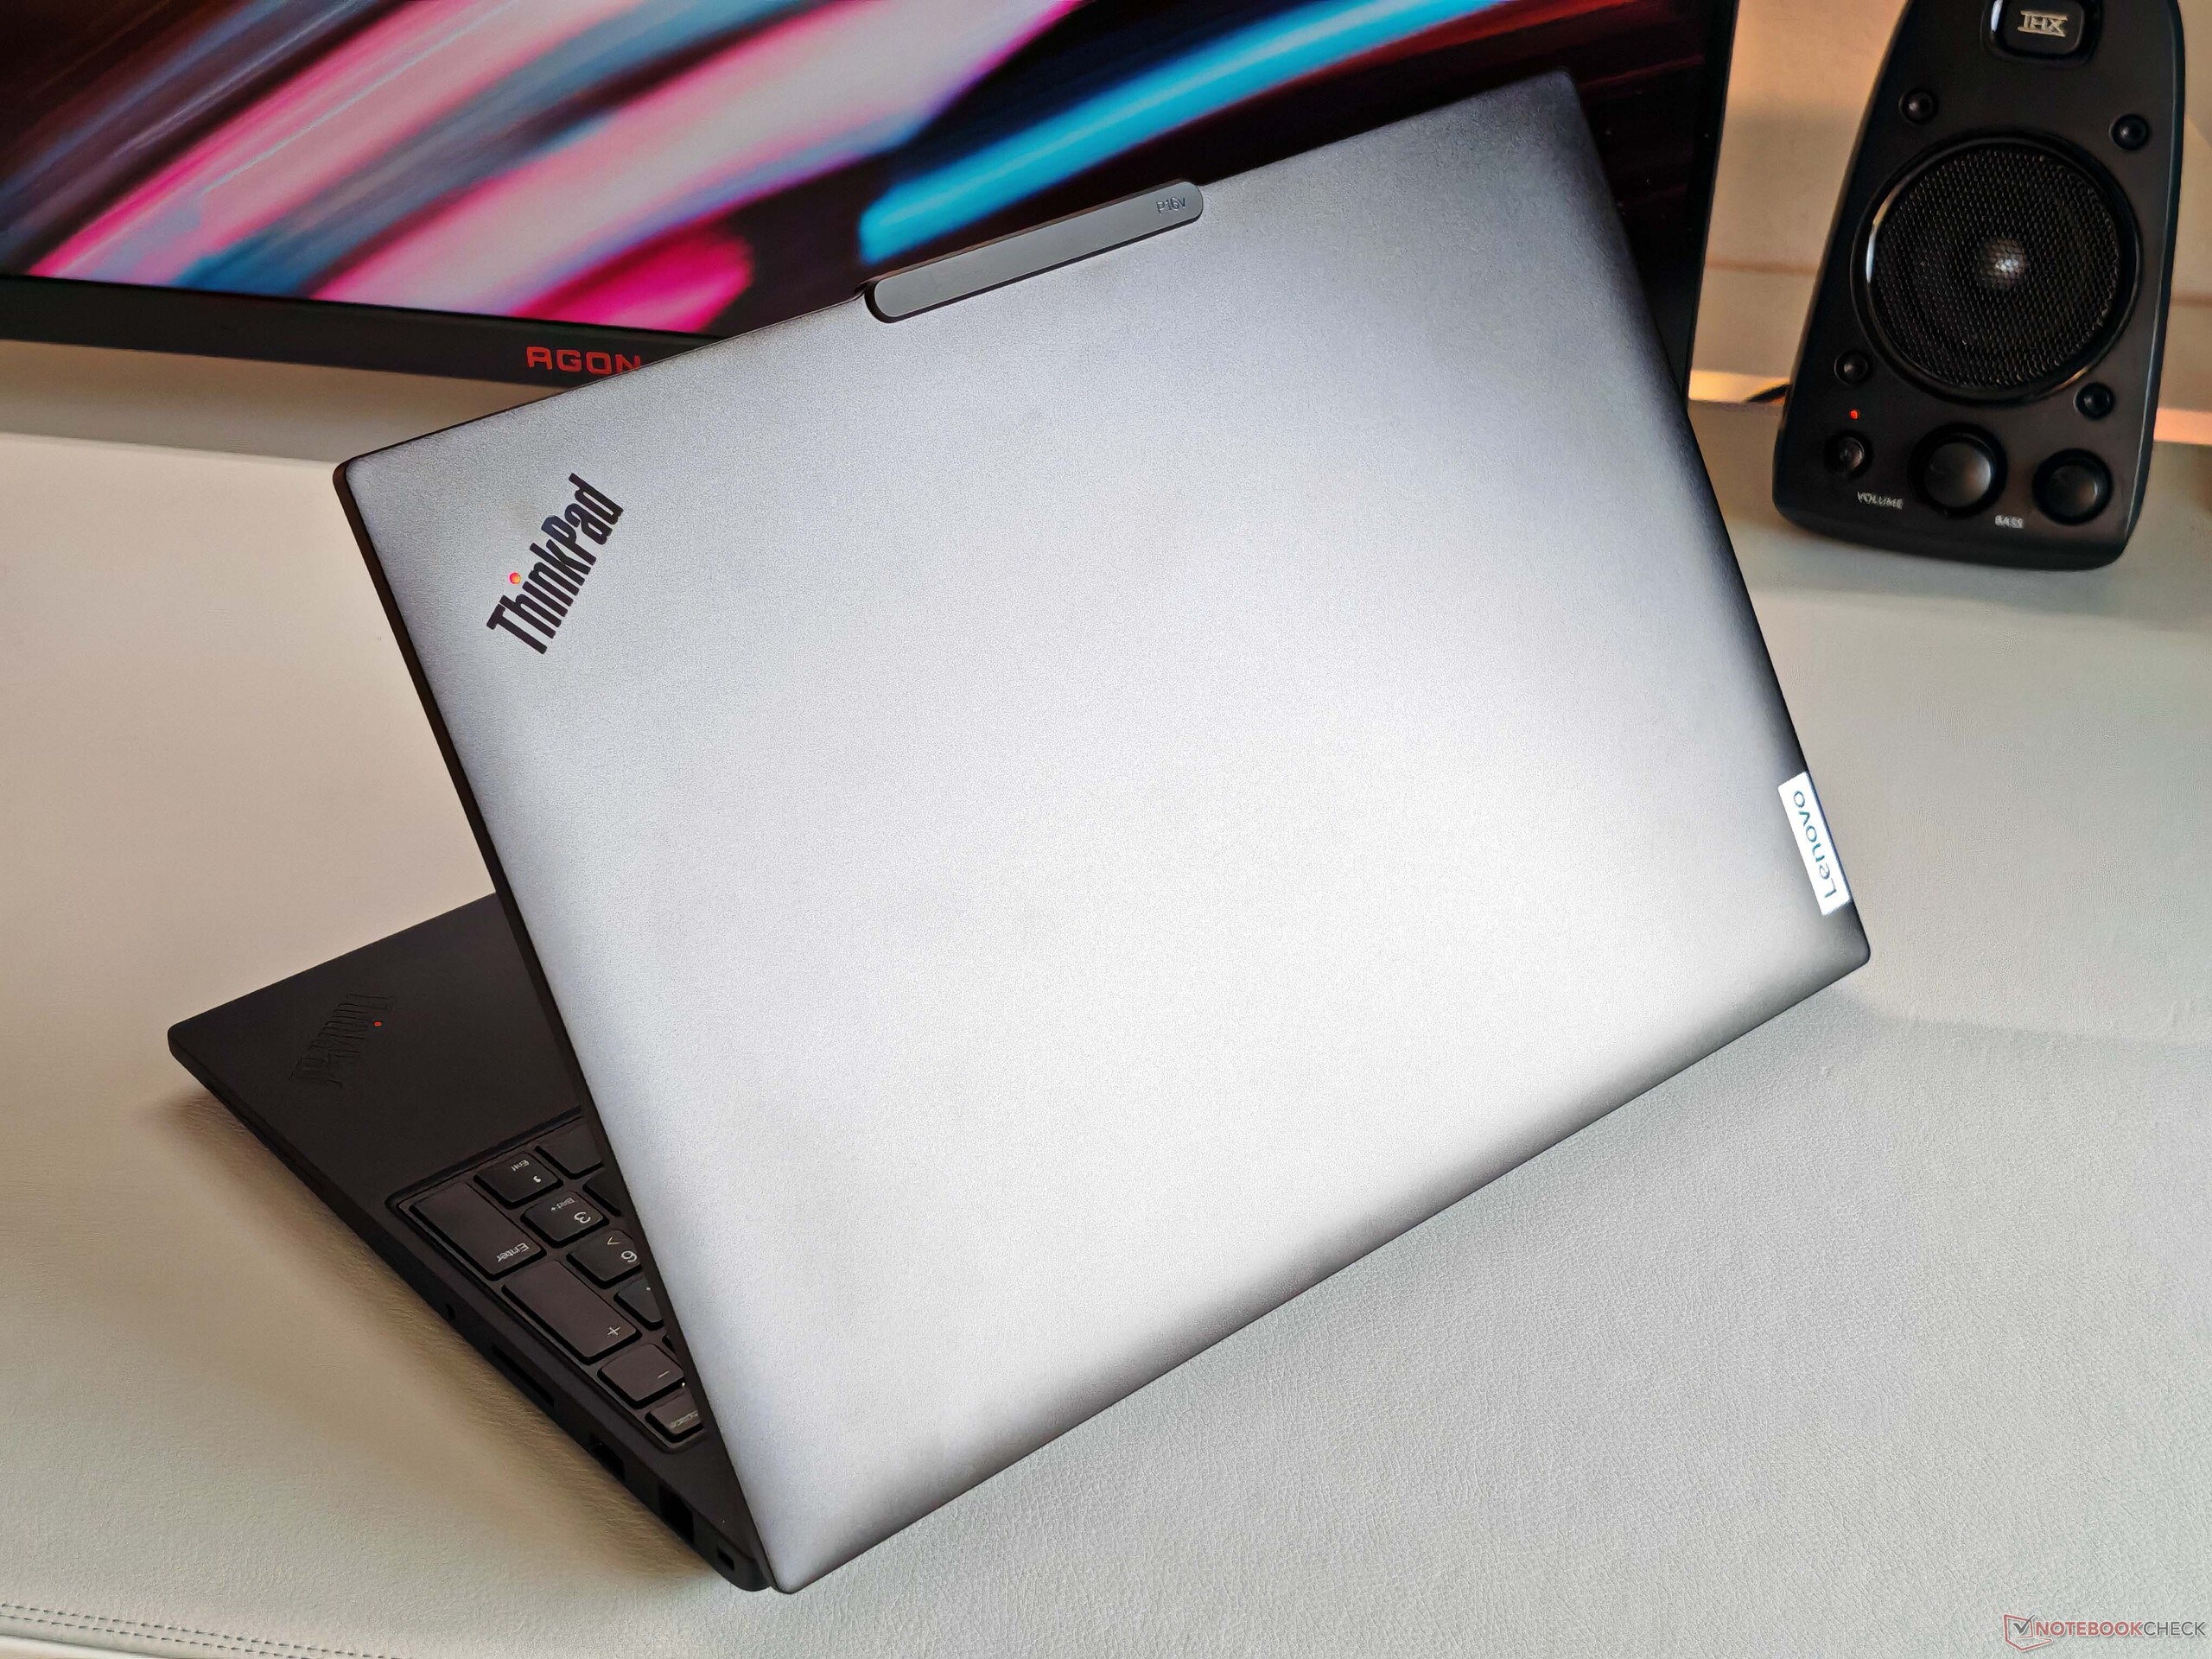
A classificação como uma estação de trabalho relativamente acessível pode ser vista acima de tudo na carcaça, já que apenas plástico é usado aqui e também há pontos de crítica em termos de estabilidade (especialmente na área do meio do teclado) e nas dobradiças (balanço perceptível). Somente os painéis de 60 Hz estão disponíveis para as telas (incluindo OLED), enquanto que o modelo IPS padrão faz um trabalho razoável com mais de 500 cd/m² de brilho, cores precisas e cobertura total sRGB.
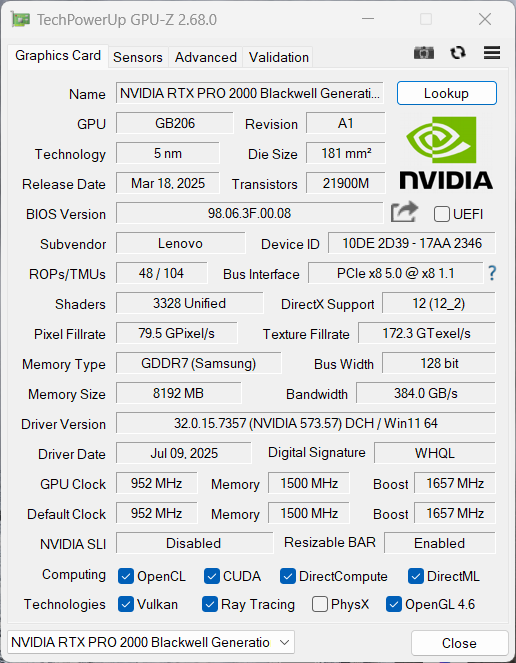
Teríamos gostado de um pouco mais de desempenho, especialmente da placa de vídeo. A Nvidia RTX PRO 2000 (Blackwell, comparável à GeForce RTX 5060) só funciona com um máximo de 60 watts e, portanto, está bem longe do máximo de 115 watts (que proporcionaria cerca de 30% a mais de desempenho). Em vista do gabinete grande de 16 polegadas, isso é relativamente fraco.
Pro
Contra
Preço e disponibilidade
O dispositivo de teste está disponível em nosso site de empréstimo Campuspoint por 2.825 euros (~$3277) (ou 2.529 euros/~$2933 no programa Campus) e o P16v G3 pode ser configurado na Lenovo a partir de 2.469 euros (~$2864).
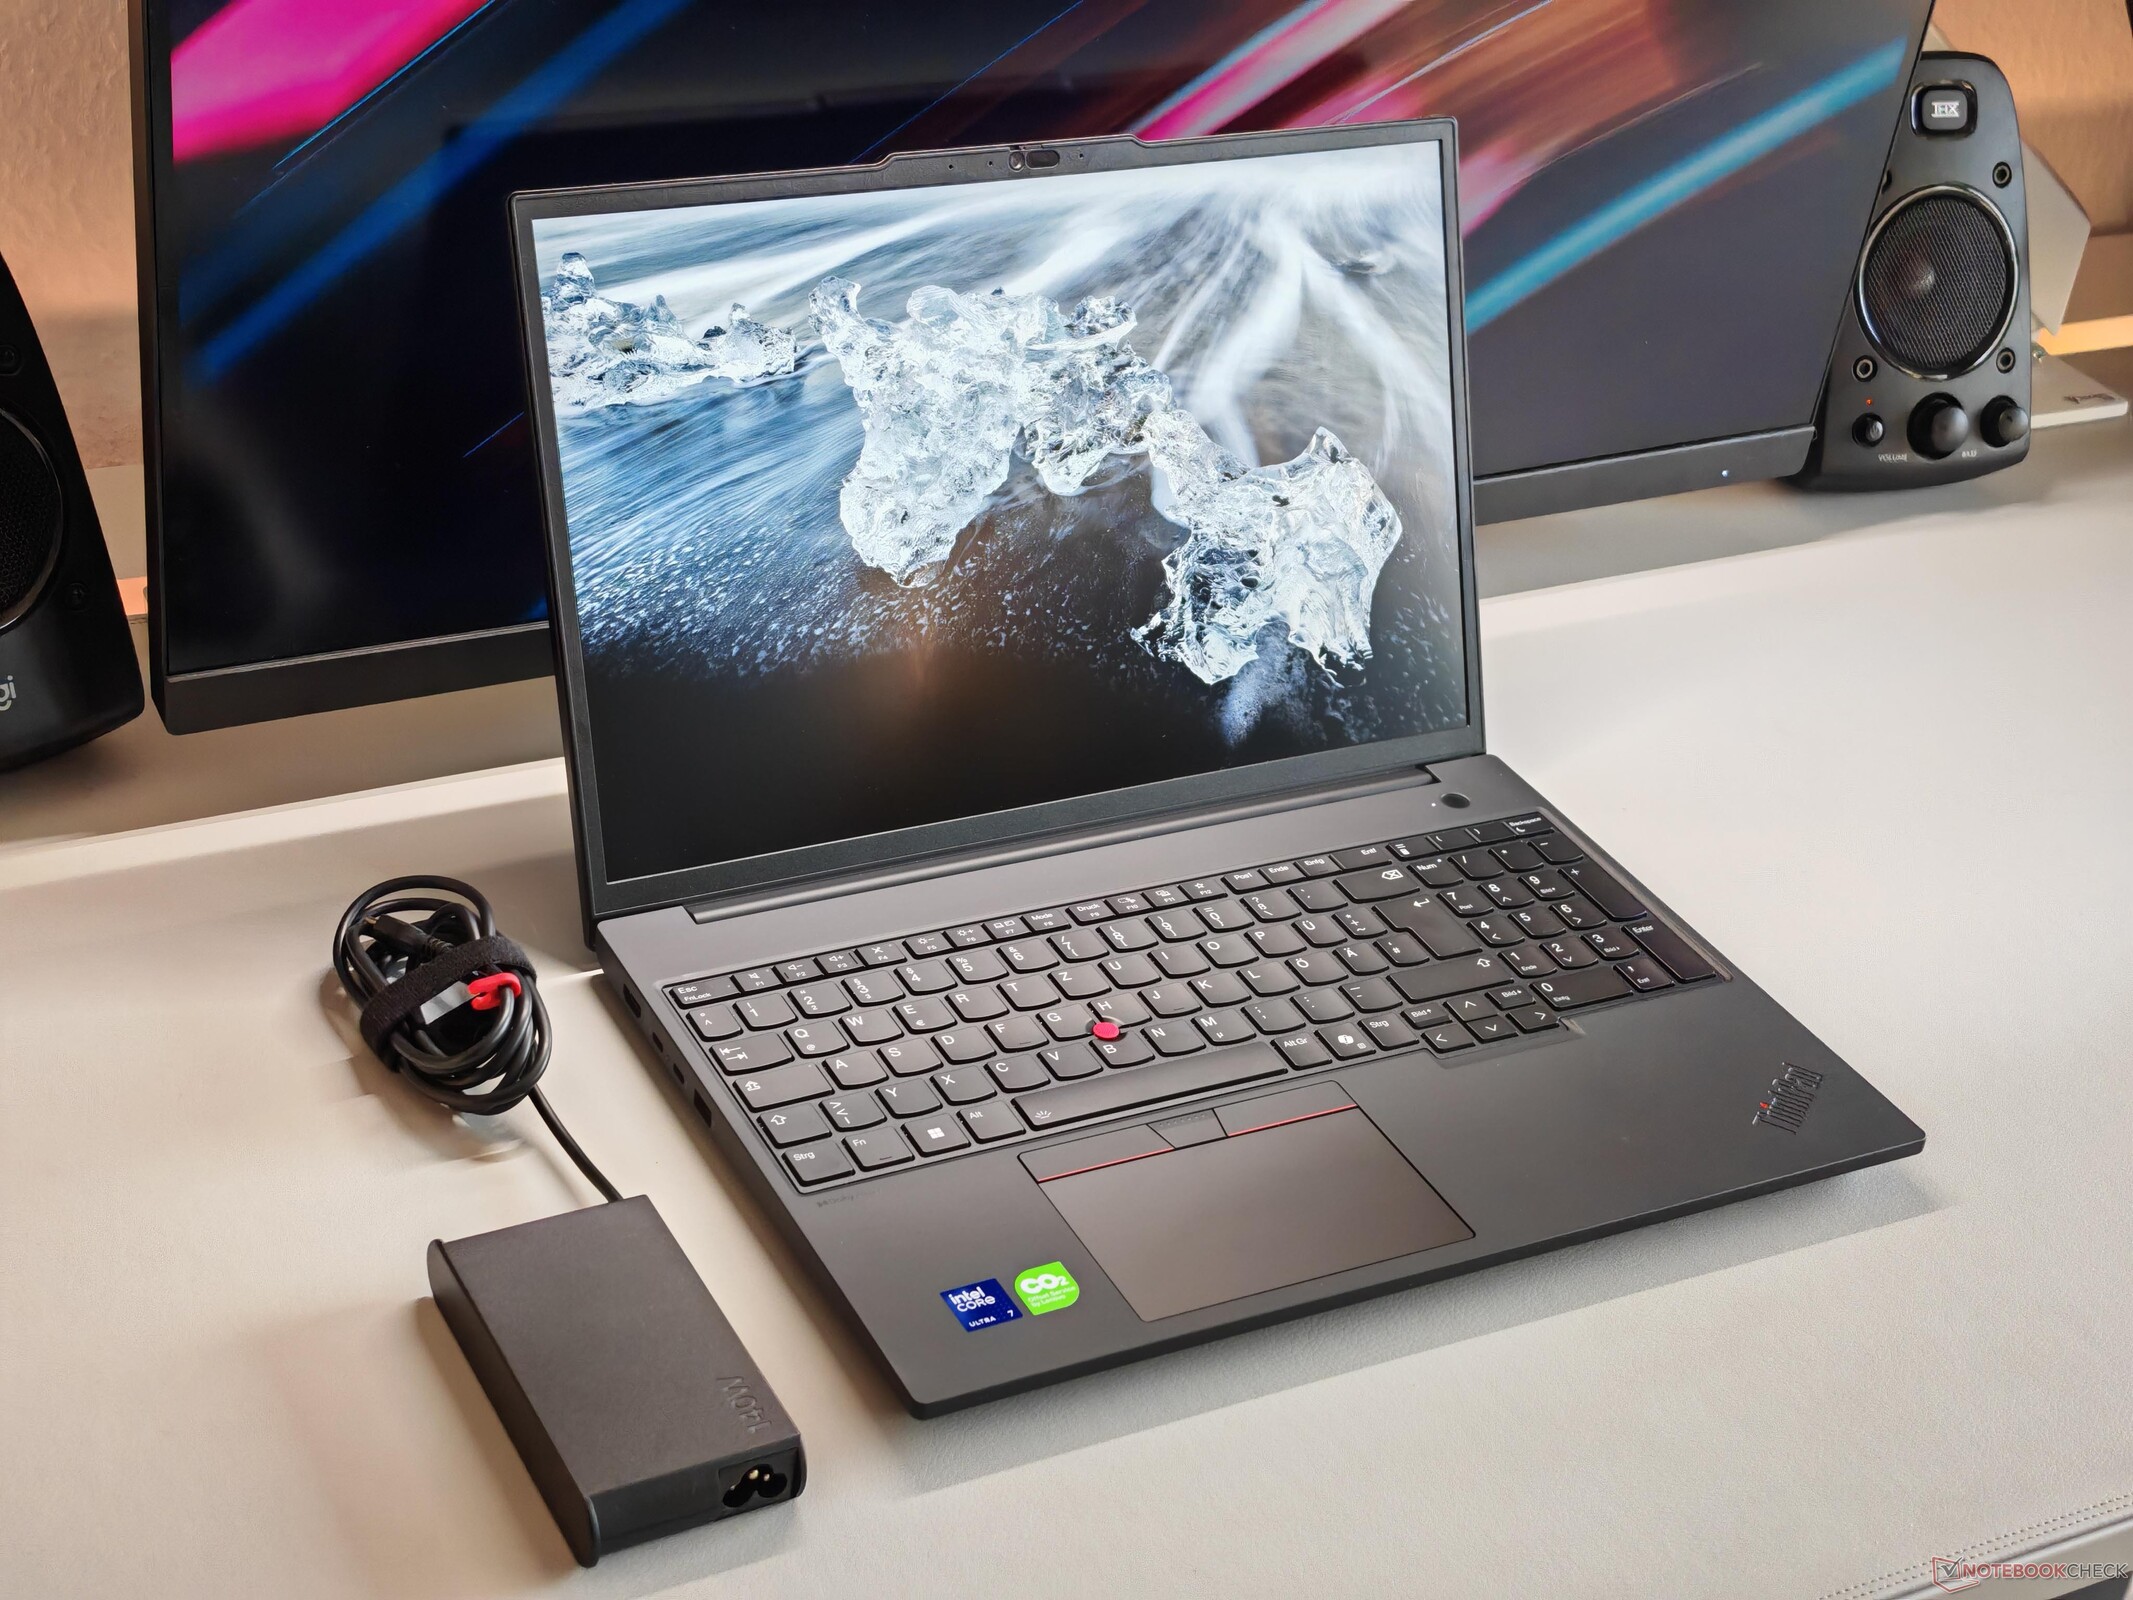
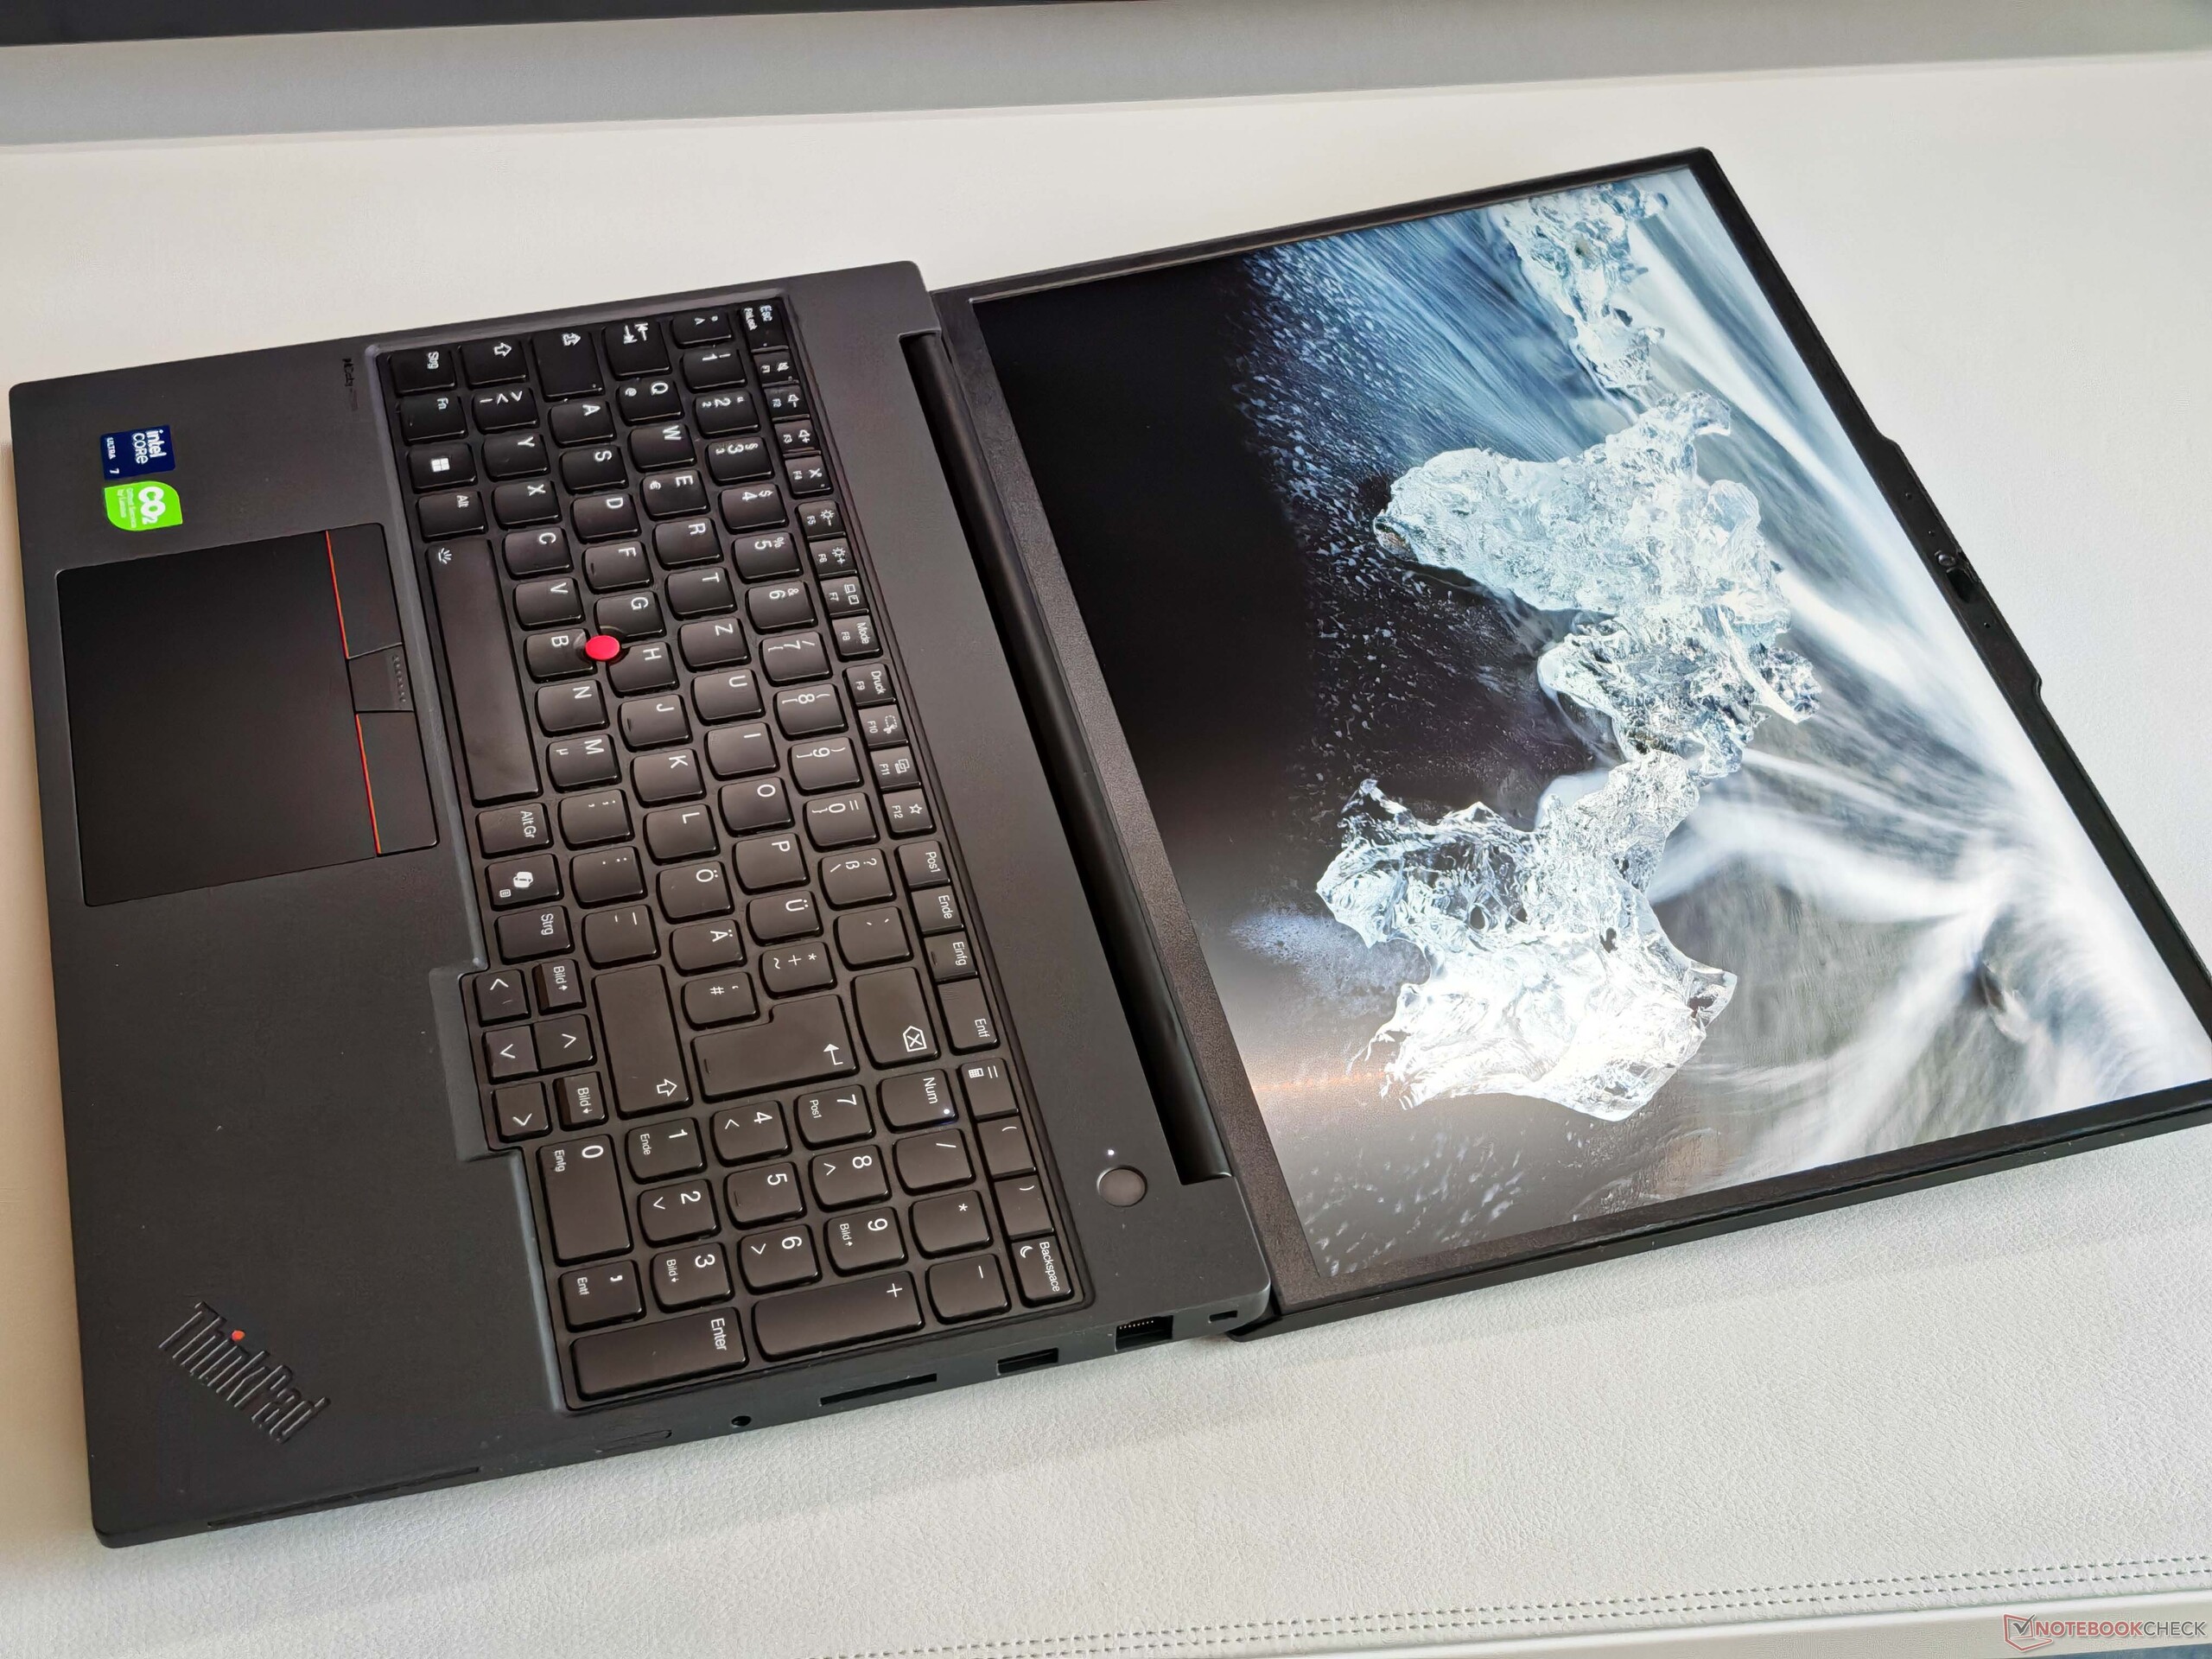
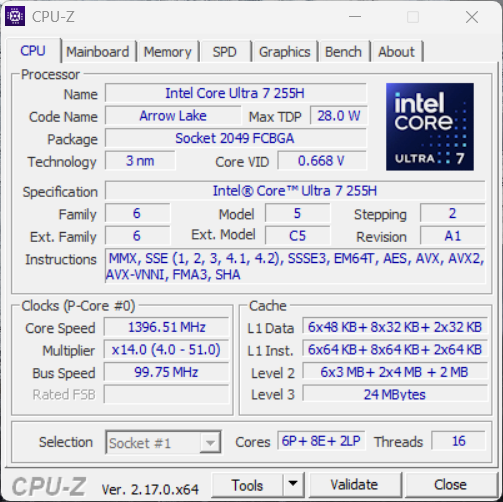
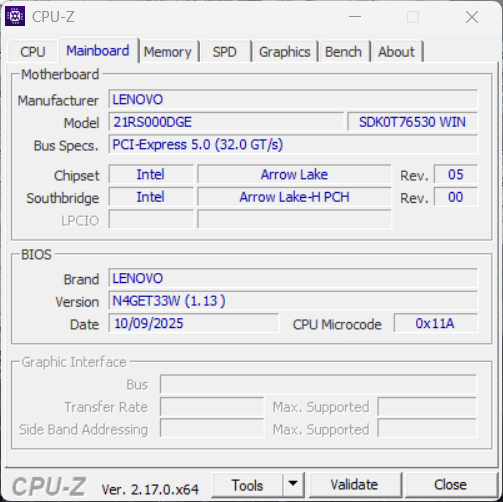
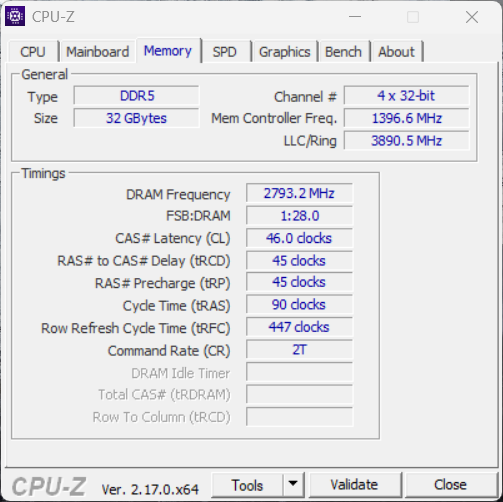
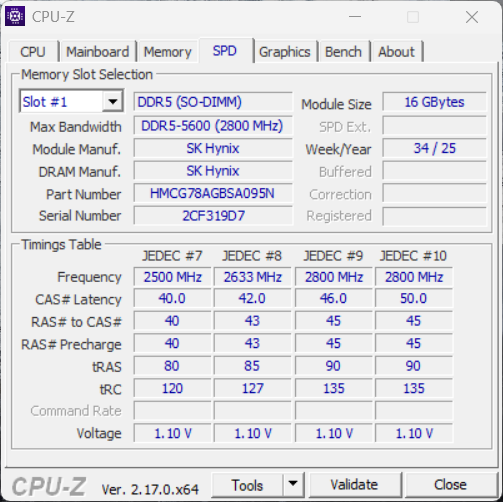
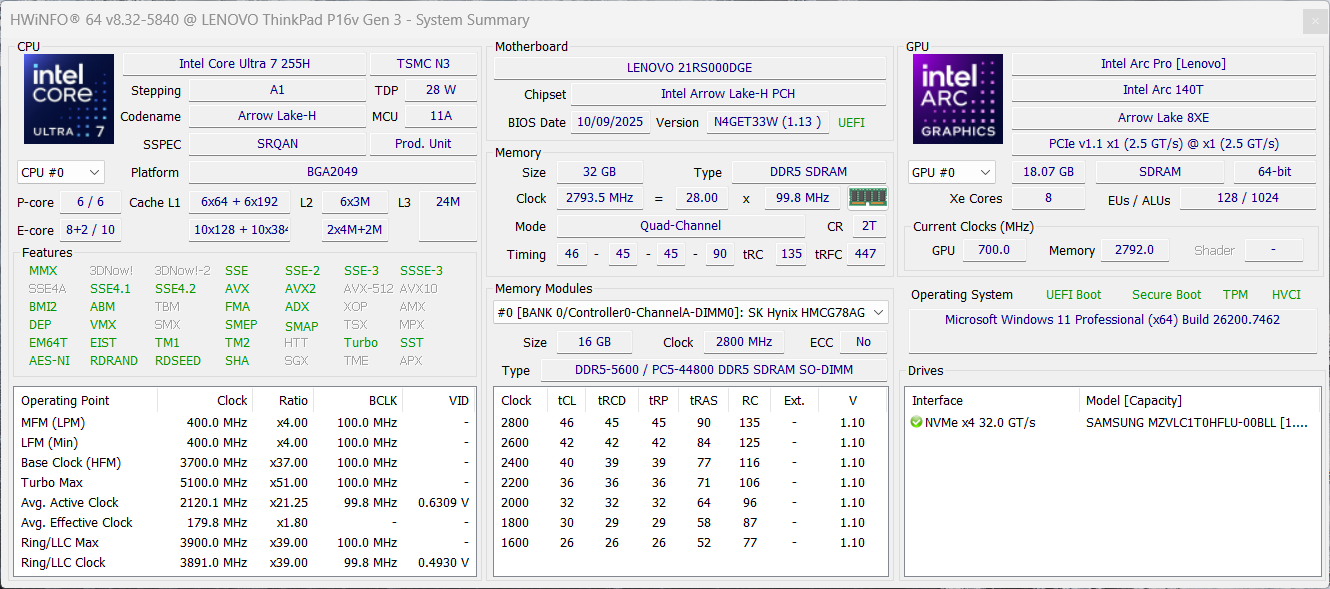
O ThinkPad P16v Gen3 é o atual modelo de nível básico da Lenovo quando se trata de estações de trabalho móveis completas. Testamos o modelo 21RS000DGE com o Core Ultra 7 255H32 GB de RAM, a Nvidia RTX PRO 2000um SSD de 1 TB e a tela Full HD com um brilho de 500 cd/m² por 2.825 euros (~$3277).
Especificações
Estojos e equipamentos
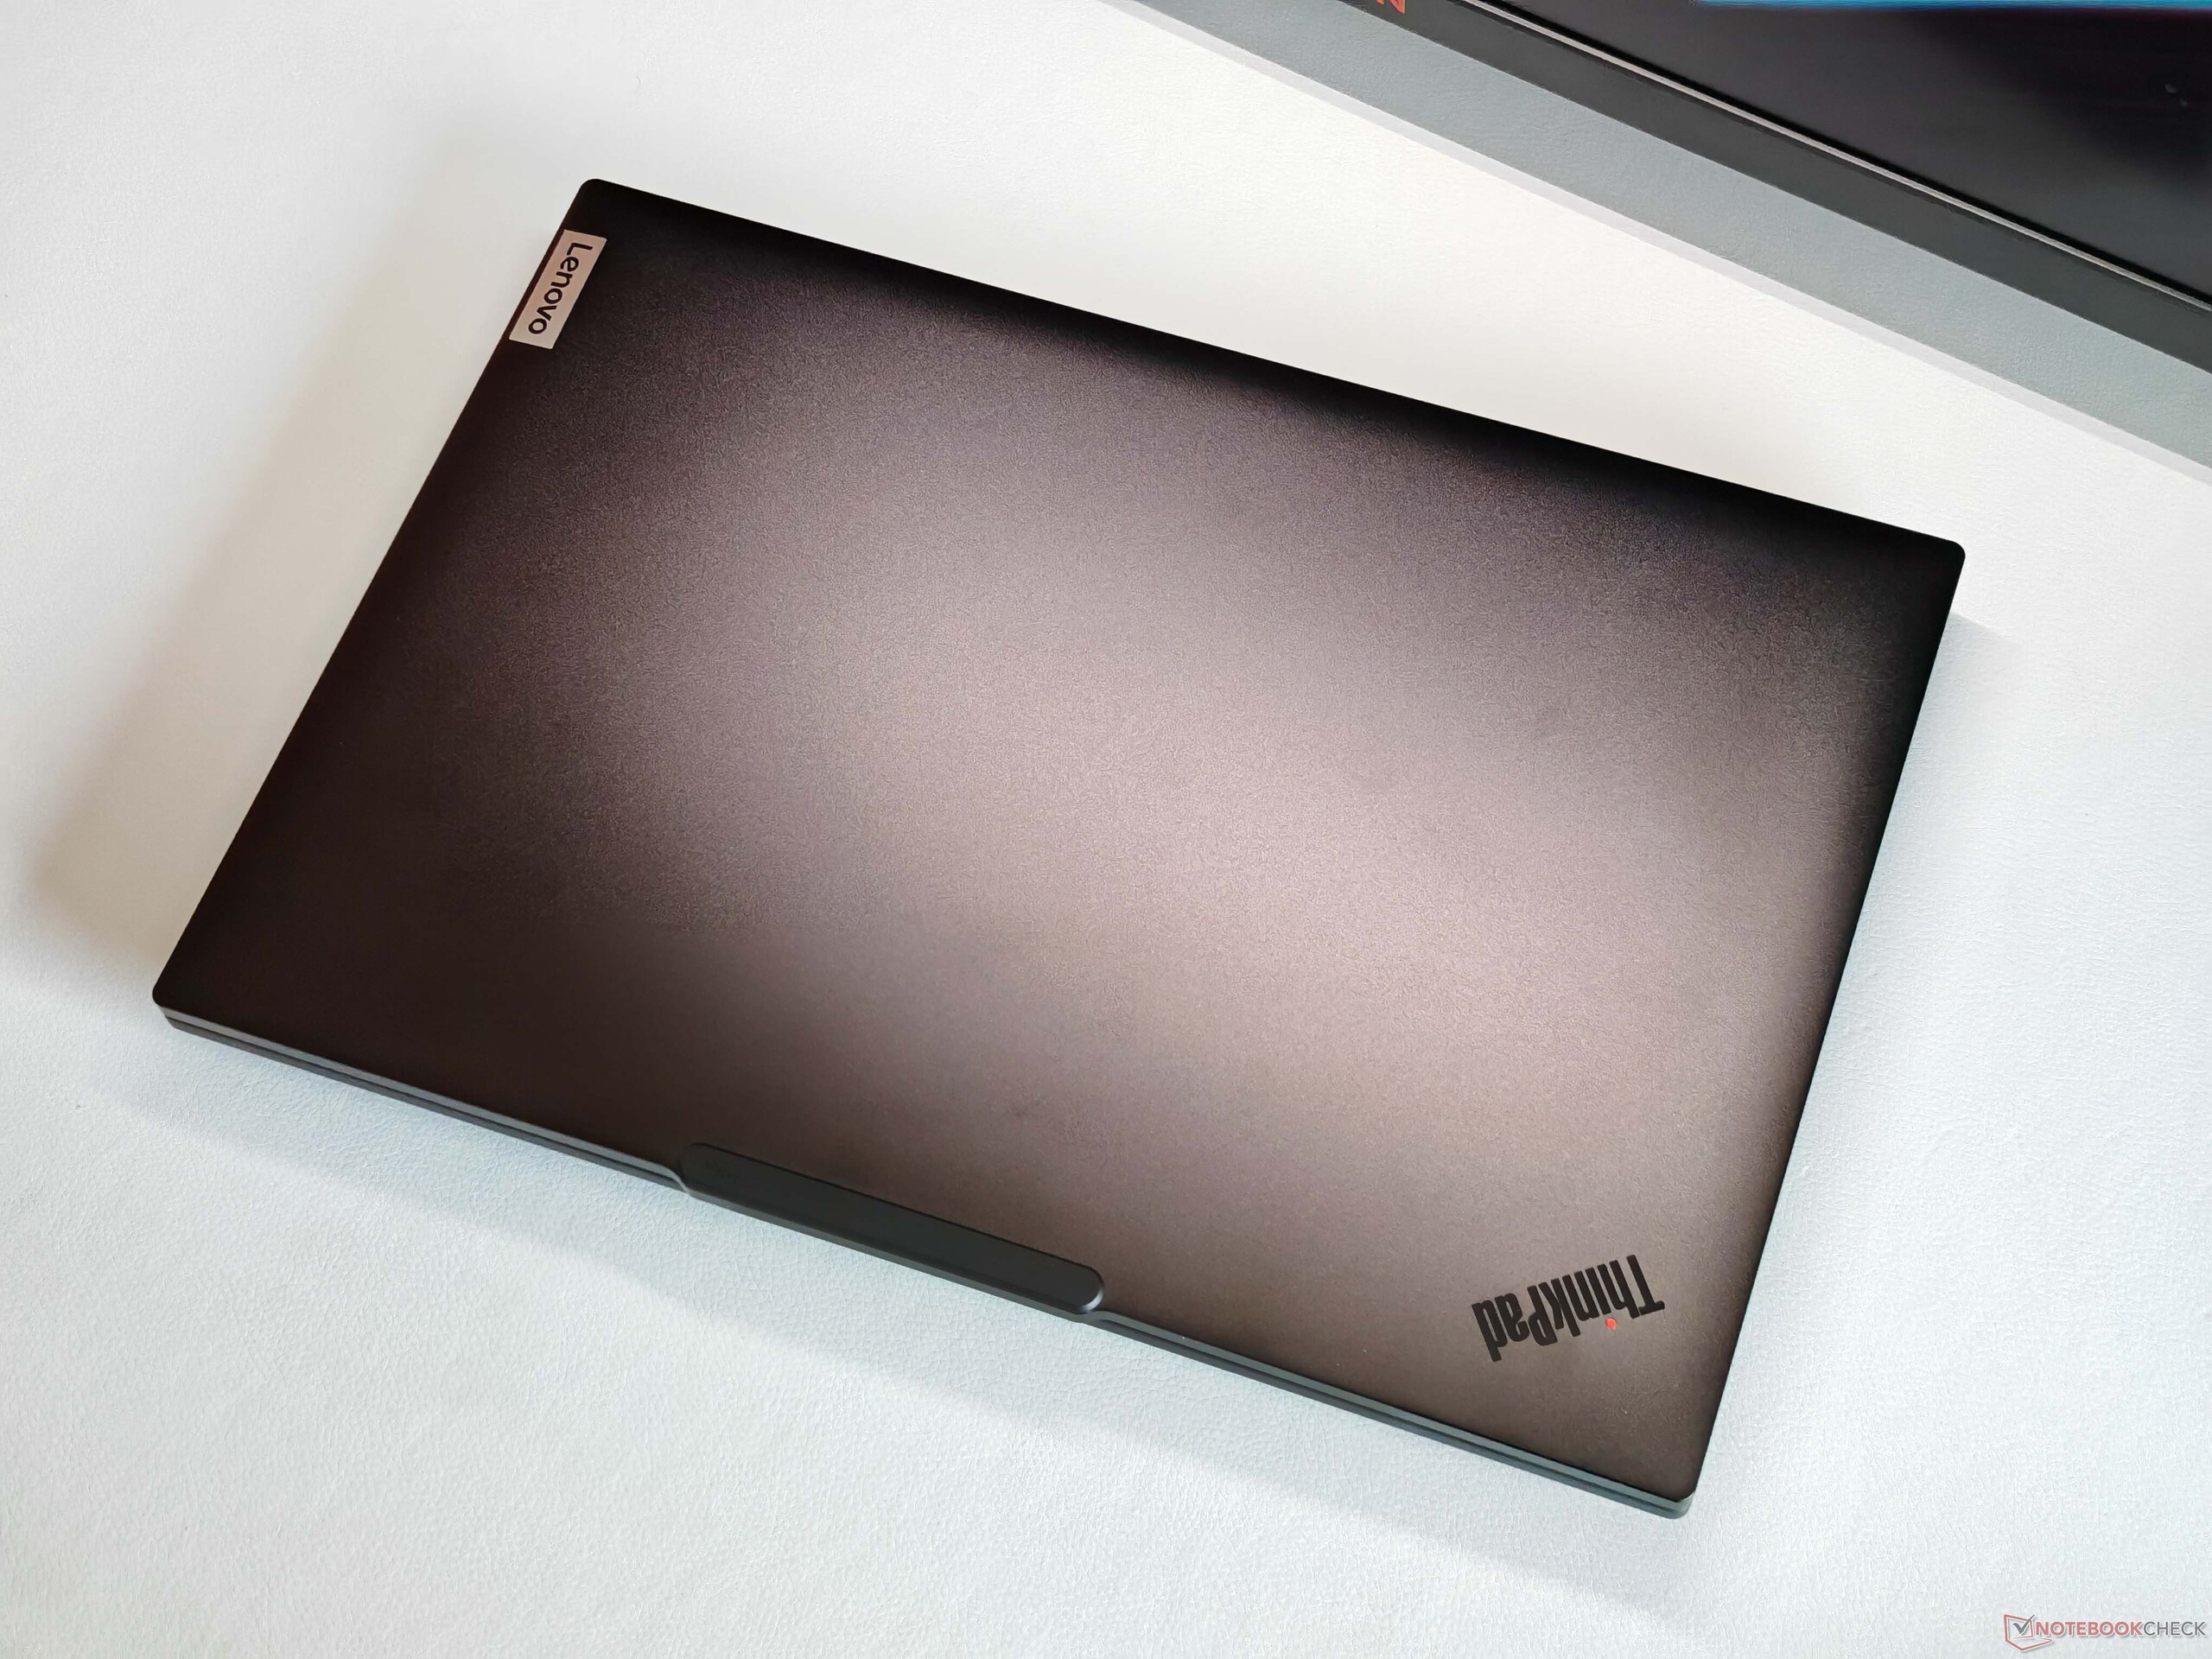
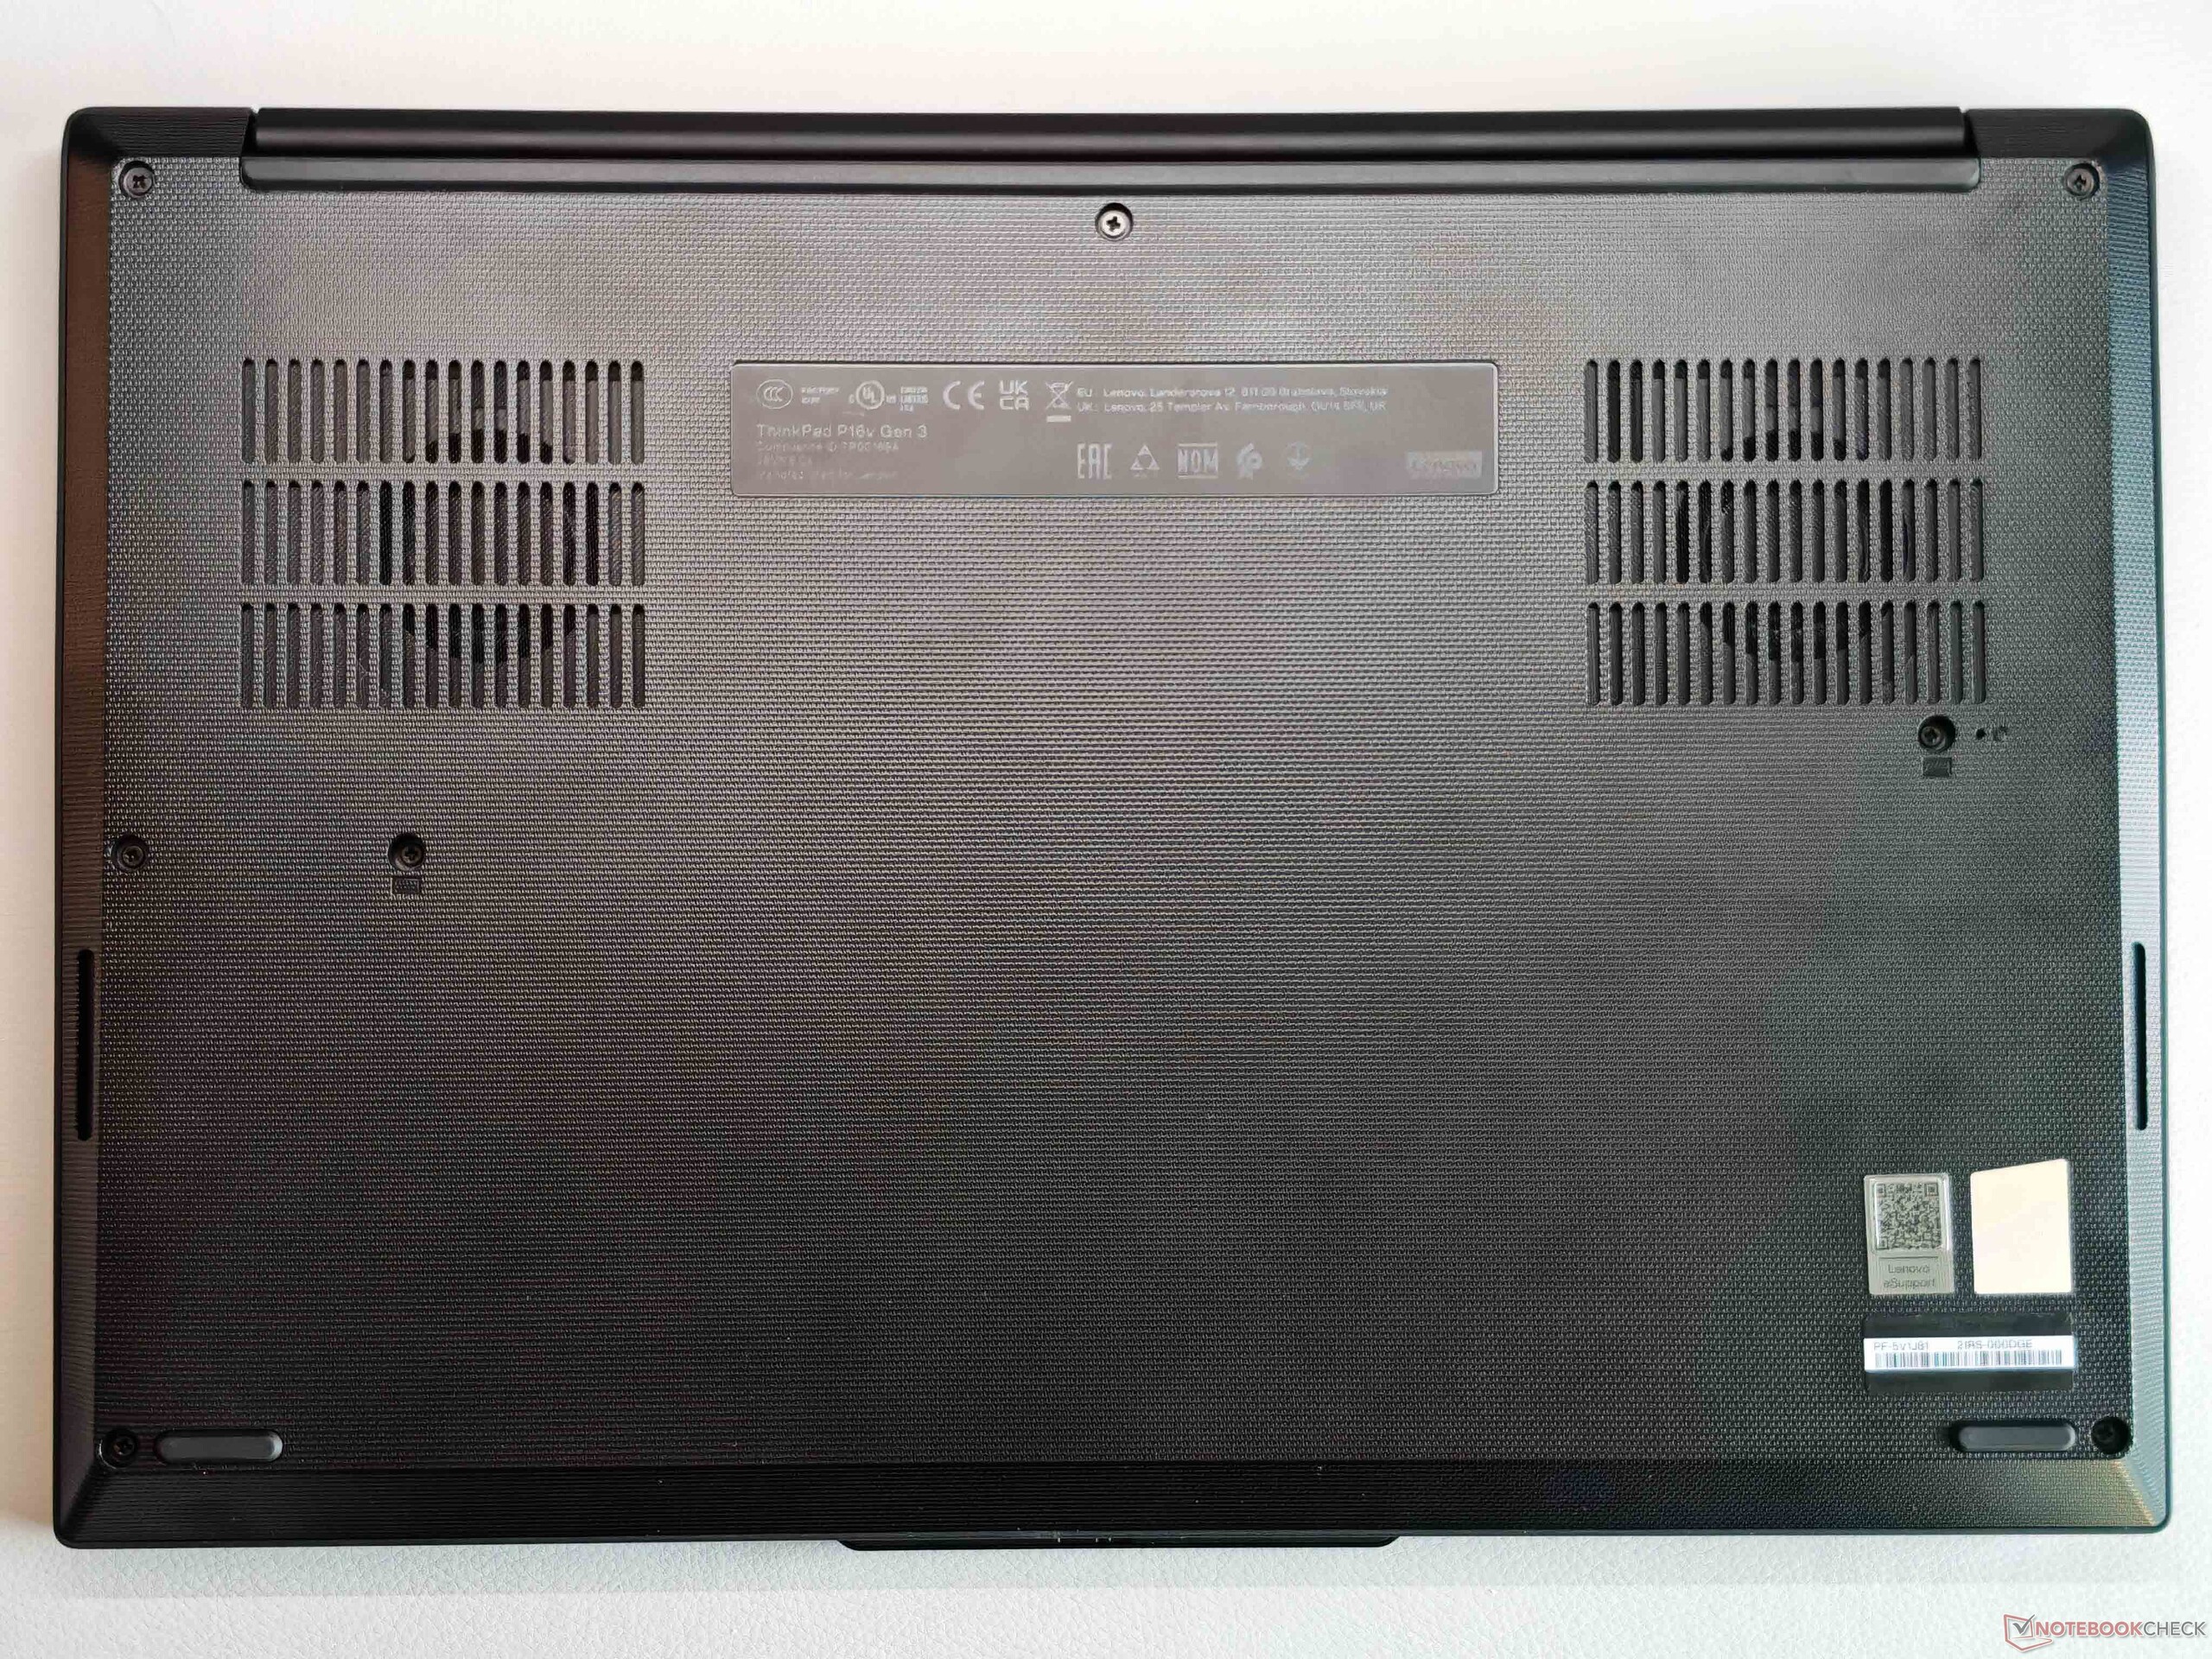
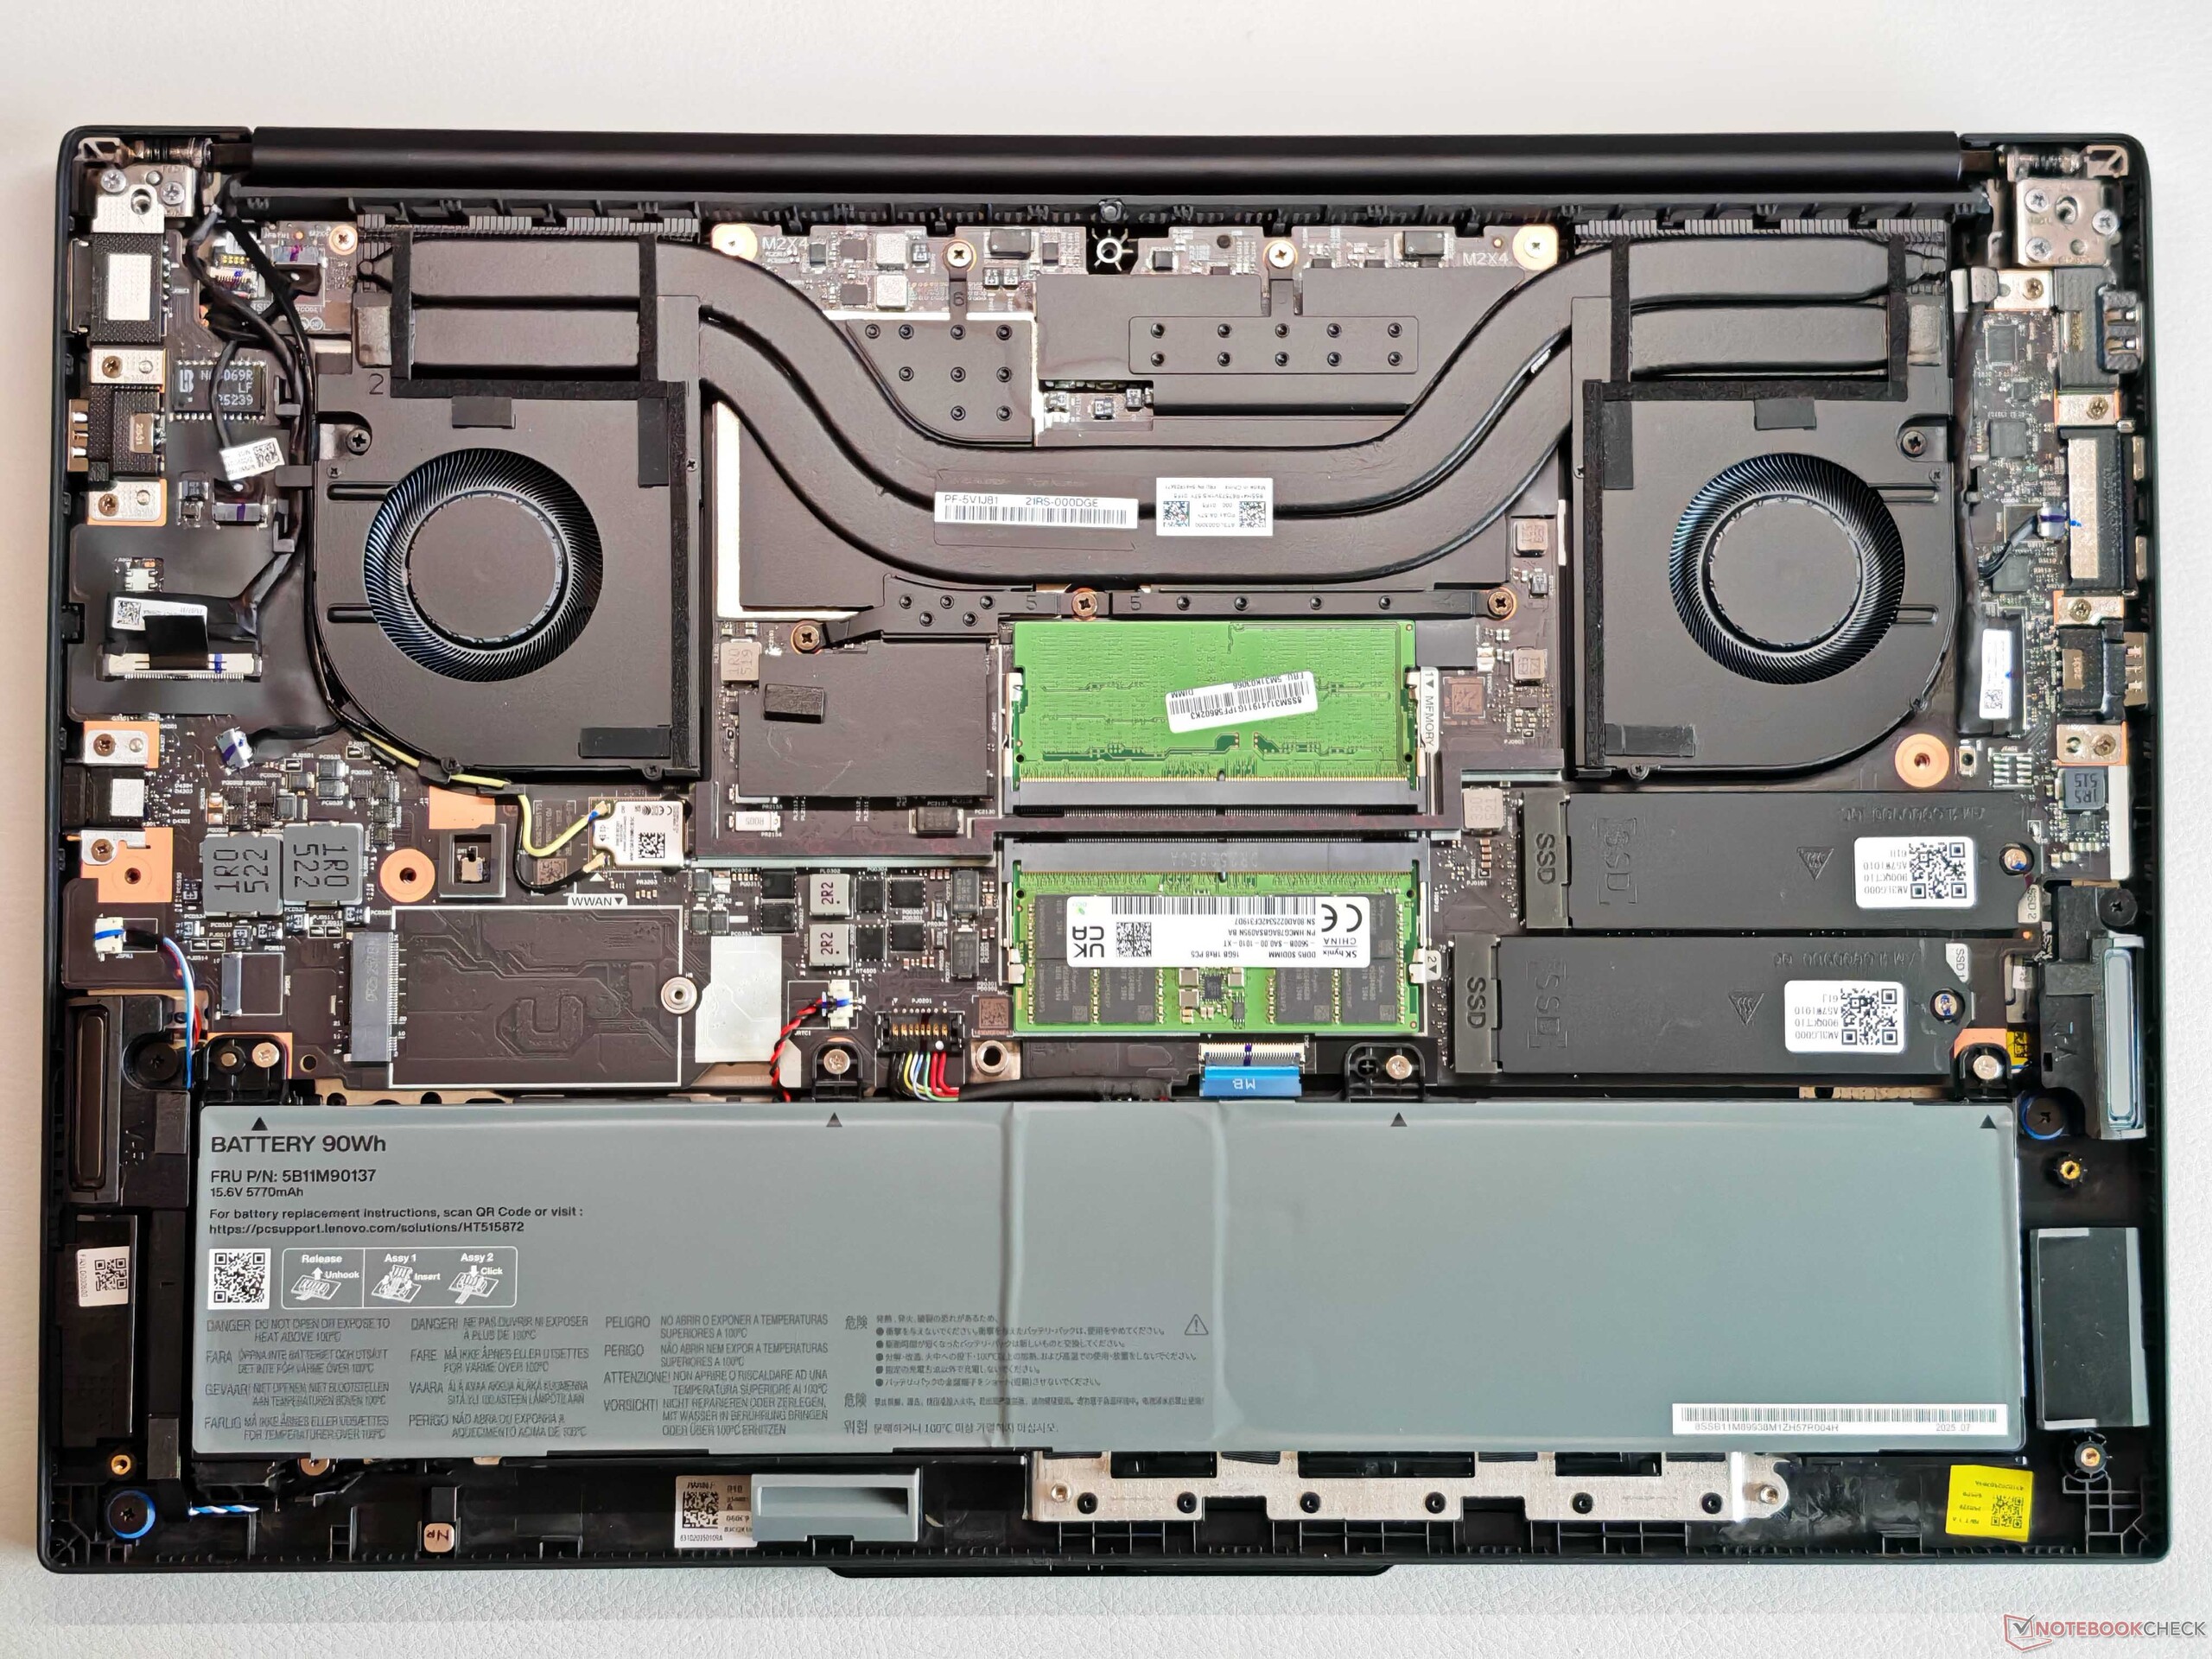
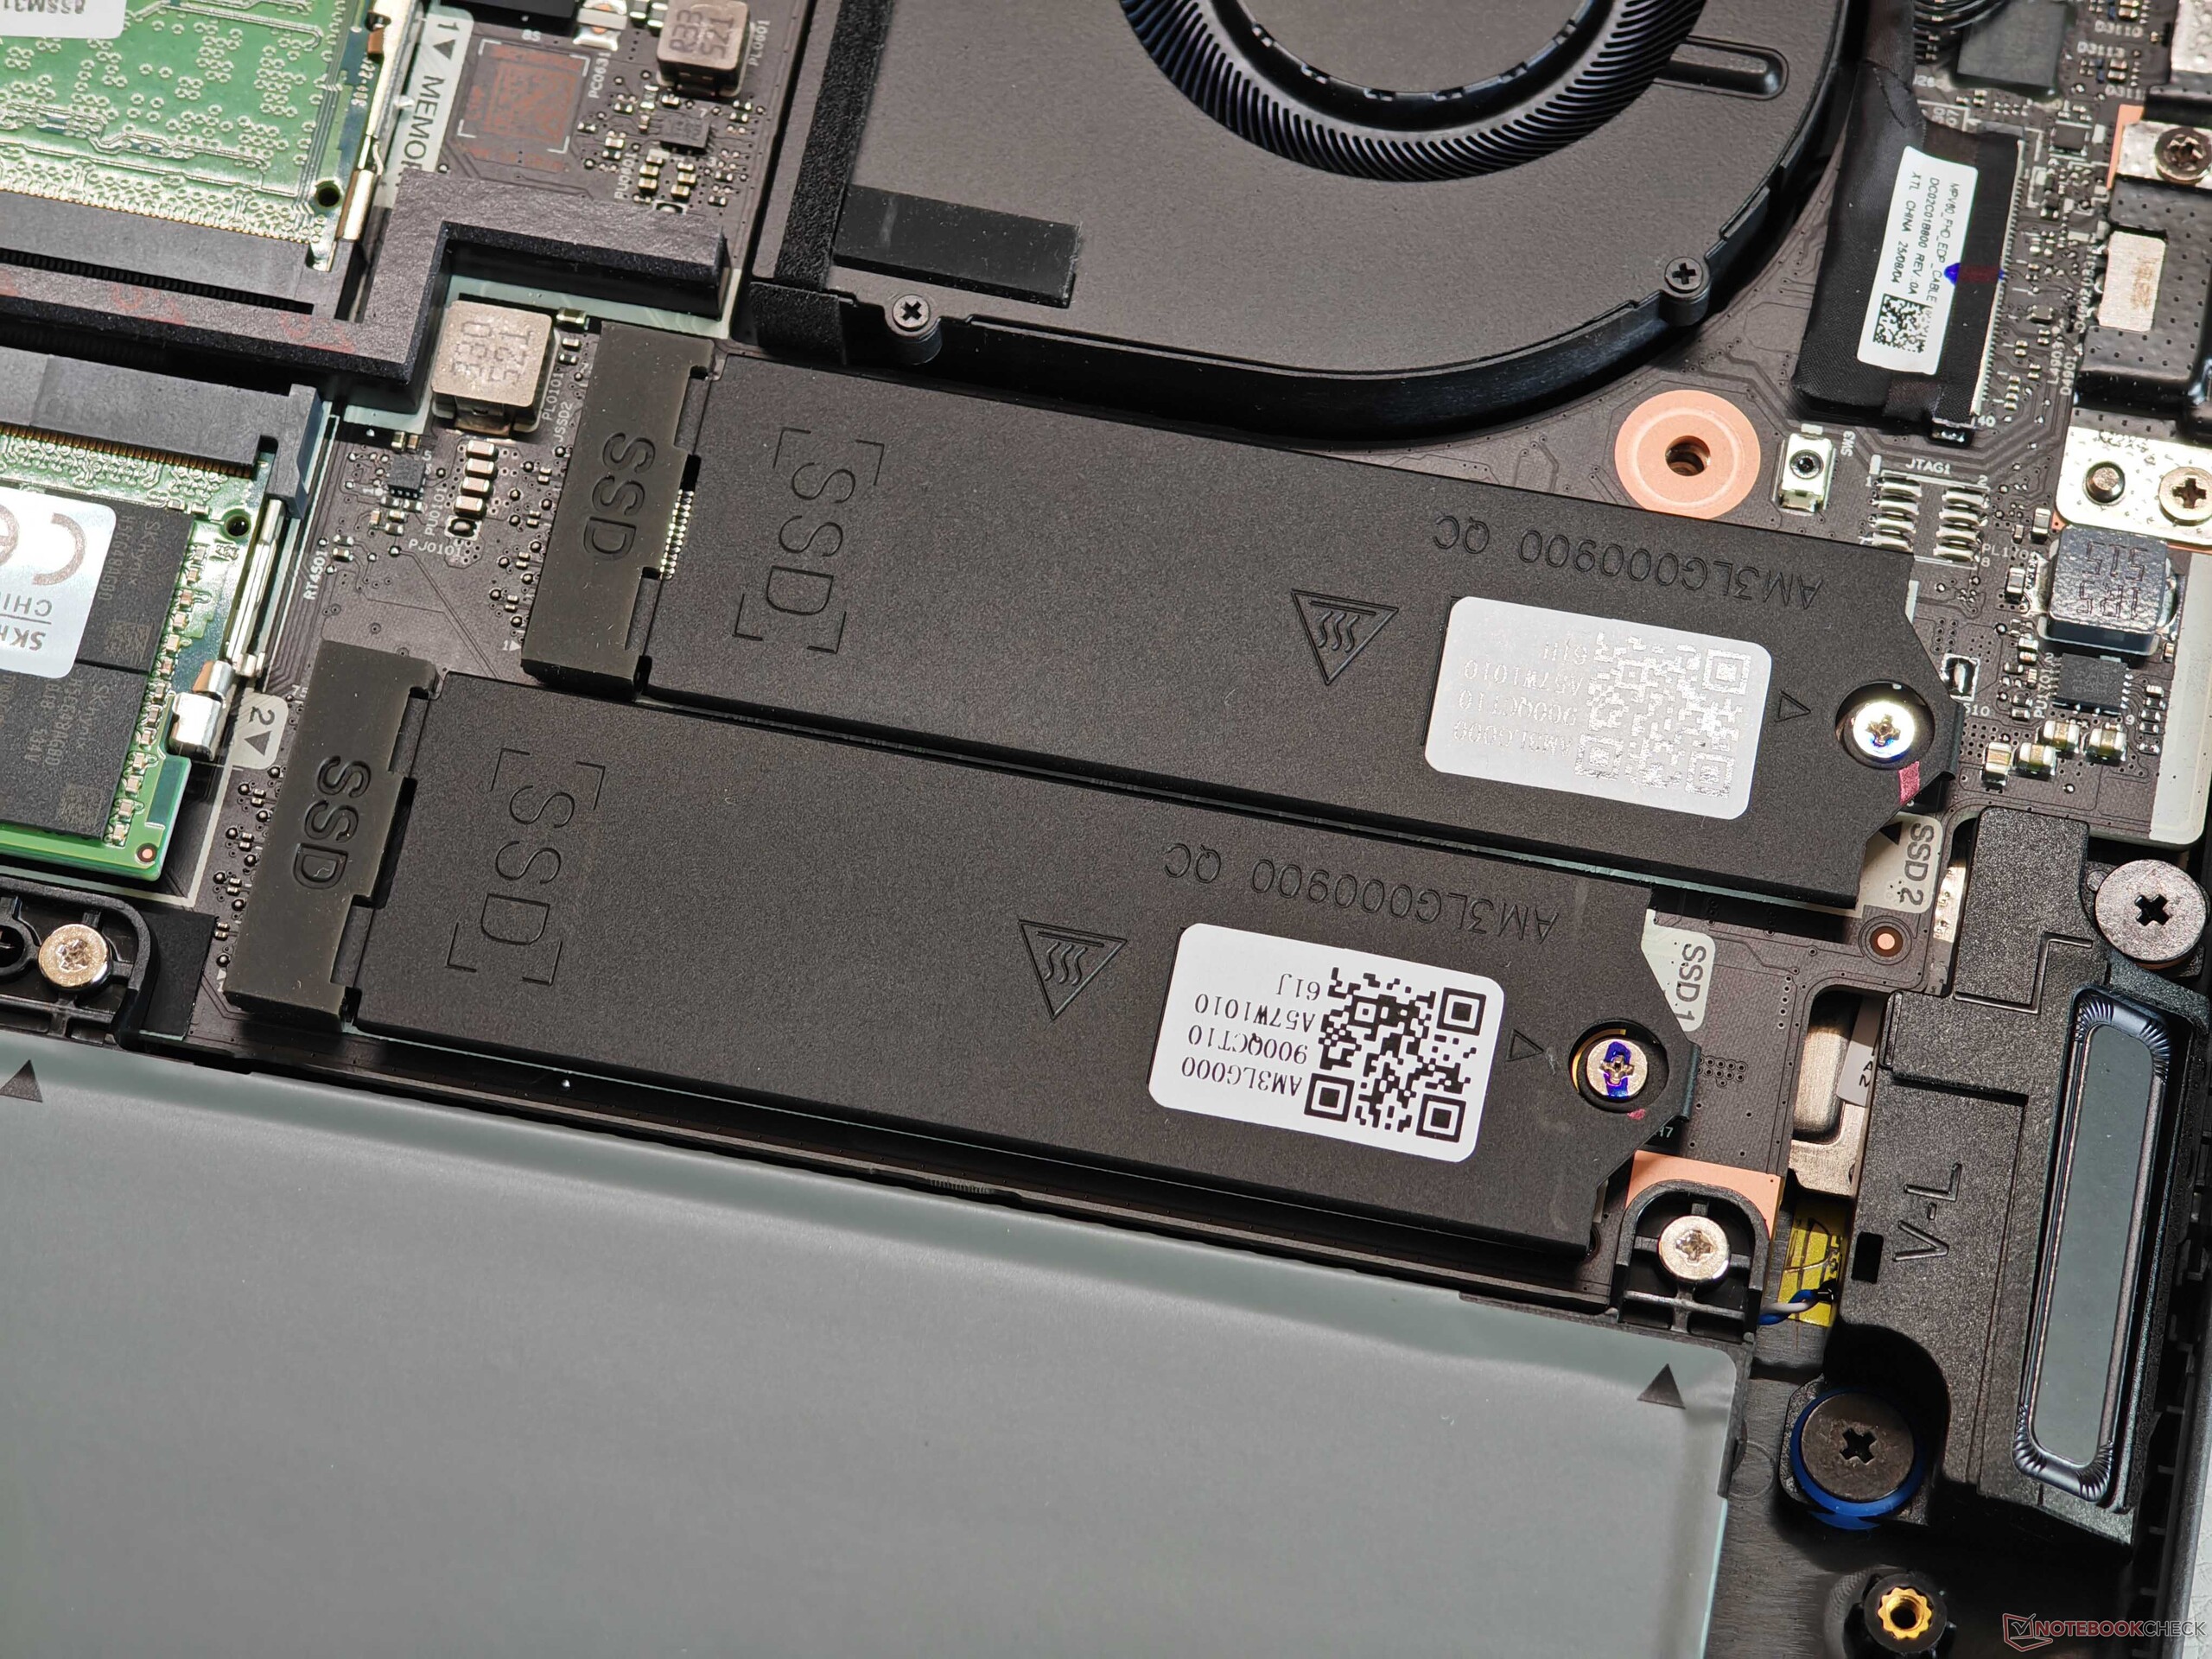
Apesar do alto preço, o senhor pode ver a classificação como uma estação de trabalho de nível básico na carcaça, já que somente plástico é usado aqui. O design é típico dos ThinkPads atuais, incluindo a desagradável saliência da câmera. O acabamento é basicamente bom, mas a estabilidade é decepcionante, especialmente considerando a unidade de base bastante espessa. A área central do teclado, em particular, pode ser visivelmente amassada, mas não conseguimos provocar nenhum ruído de rangido. A tampa da tela tem um desempenho melhor, mas as dobradiças balançam um pouco (ângulo máximo de abertura de 180 graus). A tampa lisa, em particular, é muito suscetível a impressões digitais e também é difícil de limpar. As opções de manutenção são muito boas no geral (2x RAM, 2x SSD).
Não há muito do que reclamar em termos de conexões, mas uma das duas portas Thunderbolt 4 está sempre ocupada pela unidade de fonte de alimentação. O módulo Wi-Fi 7 atinge taxas de transferência boas e estáveis, e há também uma porta Ethernet disponível. Também há espaço para um módulo WWAN, mas as antenas não são pré-roteadas (não estão prontas para WWAN). O leitor de cartões atinge taxas de transferência médias e a webcam de 5 MP (com obturador + IR) tira fotos úteis.


| SD Card Reader | |
| average JPG Copy Test (av. of 3 runs) | |
| HP ZBook X G1i 16 (Toshiba Exceria Pro SDXC 64 GB UHS-II) | |
| HP ZBook Power 16 G11 A (Toshiba Exceria Pro SDXC 64 GB UHS-II) | |
| Média da turma Workstation (49.6 - 681, n=14, últimos 2 anos) | |
| Lenovo ThinkPad P1 Gen 8 (Toshiba Exceria Pro SDXC 64 GB UHS-II) | |
| Lenovo ThinkPad P16v G3 21RS000DGE (Angelbird AV Pro V60) | |
| maximum AS SSD Seq Read Test (1GB) | |
| HP ZBook Power 16 G11 A (Toshiba Exceria Pro SDXC 64 GB UHS-II) | |
| HP ZBook X G1i 16 (Toshiba Exceria Pro SDXC 64 GB UHS-II) | |
| Média da turma Workstation (87.6 - 1455, n=14, últimos 2 anos) | |
| Lenovo ThinkPad P16v G3 21RS000DGE (Angelbird AV Pro V60) | |
| Lenovo ThinkPad P1 Gen 8 (Toshiba Exceria Pro SDXC 64 GB UHS-II) | |
| Networking | |
| Lenovo ThinkPad P16v G3 21RS000DGE | |
| iperf3 transmit AXE11000 | |
| iperf3 receive AXE11000 | |
| Lenovo ThinkPad P1 Gen 8 | |
| iperf3 transmit AXE11000 | |
| iperf3 receive AXE11000 | |
| iperf3 transmit AXE11000 6GHz | |
| iperf3 receive AXE11000 6GHz | |
| HP ZBook X G1i 16 | |
| iperf3 transmit AXE11000 | |
| iperf3 receive AXE11000 | |
| iperf3 transmit AXE11000 6GHz | |
| iperf3 receive AXE11000 6GHz | |
| HP ZBook Power 16 G11 A | |
| iperf3 transmit AXE11000 | |
| iperf3 receive AXE11000 | |
| iperf3 transmit AXE11000 6GHz | |
| iperf3 receive AXE11000 6GHz | |
| Lenovo ThinkPad P16s Gen 4 21RX000YGE | |
| iperf3 transmit AXE11000 | |
| iperf3 receive AXE11000 | |
| iperf3 transmit AXE11000 6GHz | |
| iperf3 receive AXE11000 6GHz | |


Sustentabilidade
A Lenovo fornece informações abrangentes sobre o balançode CO2 e o uso de materiais reciclados.


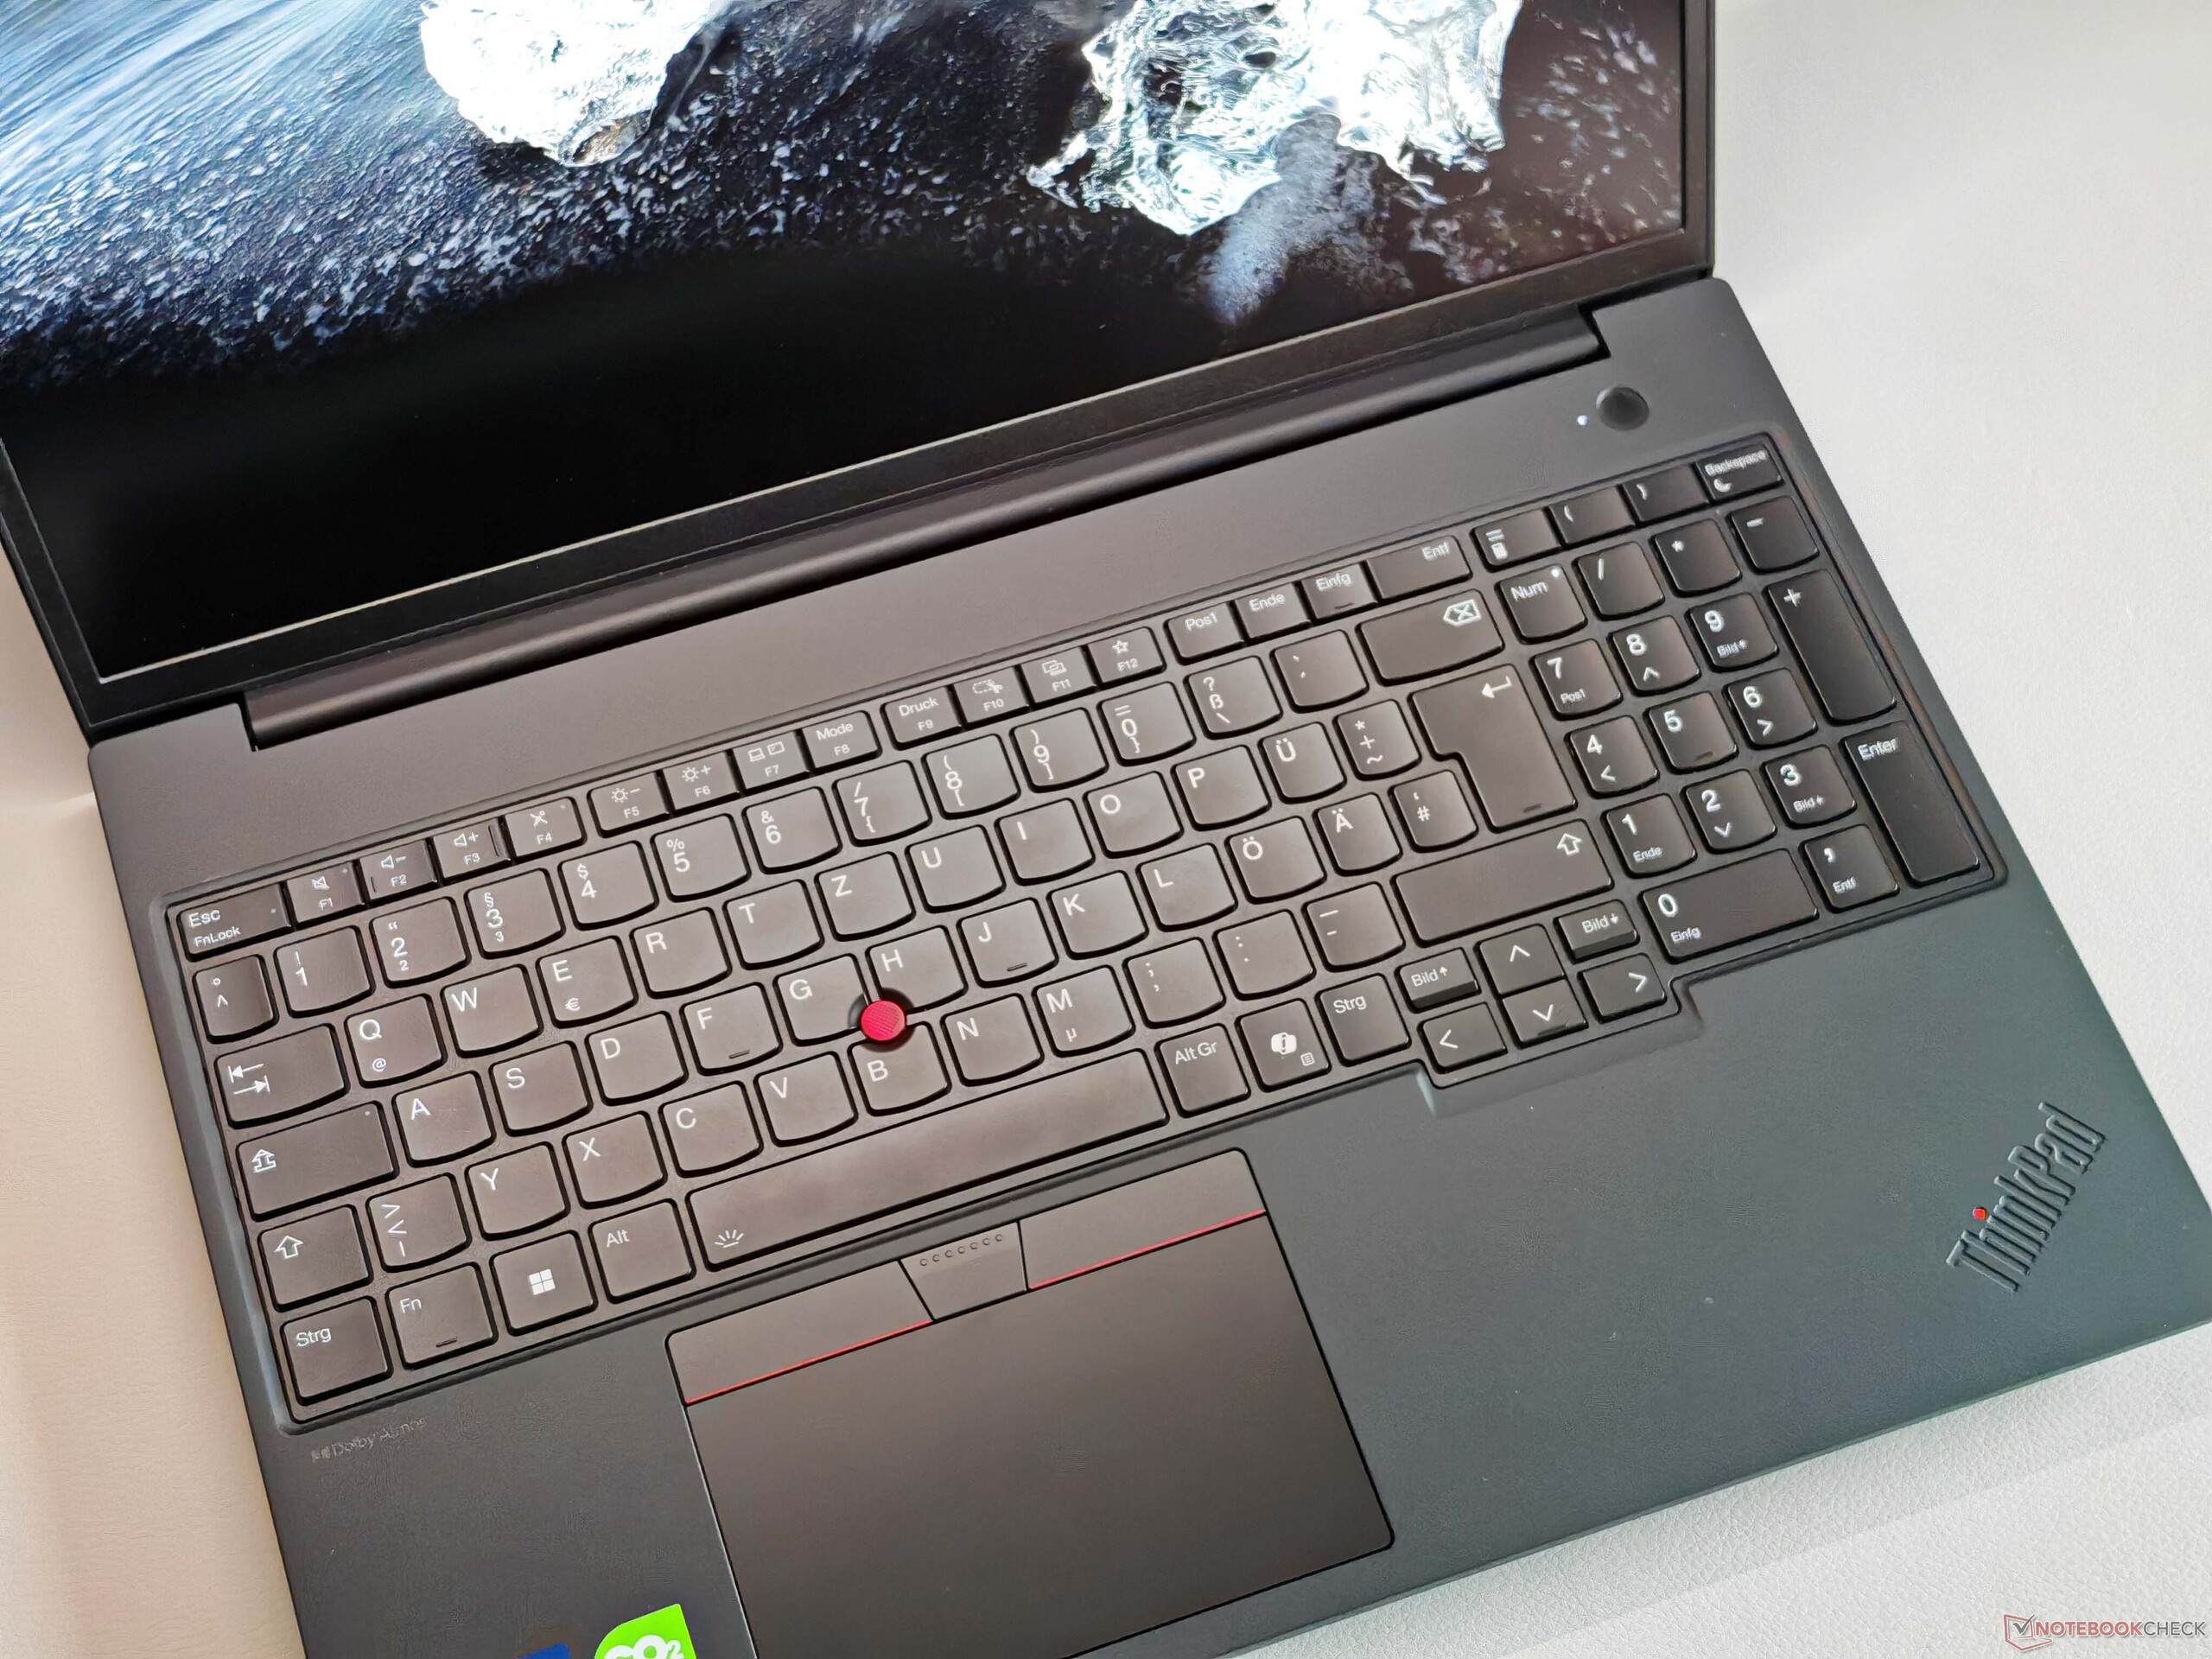
Dispositivos de entrada - Teclado médio
O teclado retroiluminado, incluindo o teclado numérico, também atende ao padrão atual do ThinkPad, embora existam modelos significativamente melhores na linha atual (por exemplo ThinkPad P1 16 G8). No geral, descreveríamos a sensação de digitação como confortável e precisa, mas a concorrência pode fazer isso pelo menos tão bem. O ClickPad (11,5 x 6,7 cm/~4,5 x ~2,6 polegadas) é bem pequeno para os padrões modernos devido aos botões TrackPoint dedicados, mas a operação é excelente e os cliques mecânicos na área inferior também são de altíssima qualidade. Isso também se aplica aos botões do TrackPoint.


Tela - IPS com 500 cd/m²

A Lenovo só oferece telas de 60 Hz (IPS e OLED) para o P16v Gen 3, o que é um pouco surpreendente considerando o alto preço. O modelo IPS Full HD padrão (1.920 x 1.200 pixels, 16:10) com uma superfície fosca está instalado em nosso dispositivo de teste. A impressão subjetiva da imagem é geralmente boa, mas as áreas claras parecem ligeiramente granuladas em uma inspeção mais detalhada. Não há cintilação de PWM e os tempos de resposta são geralmente normais.
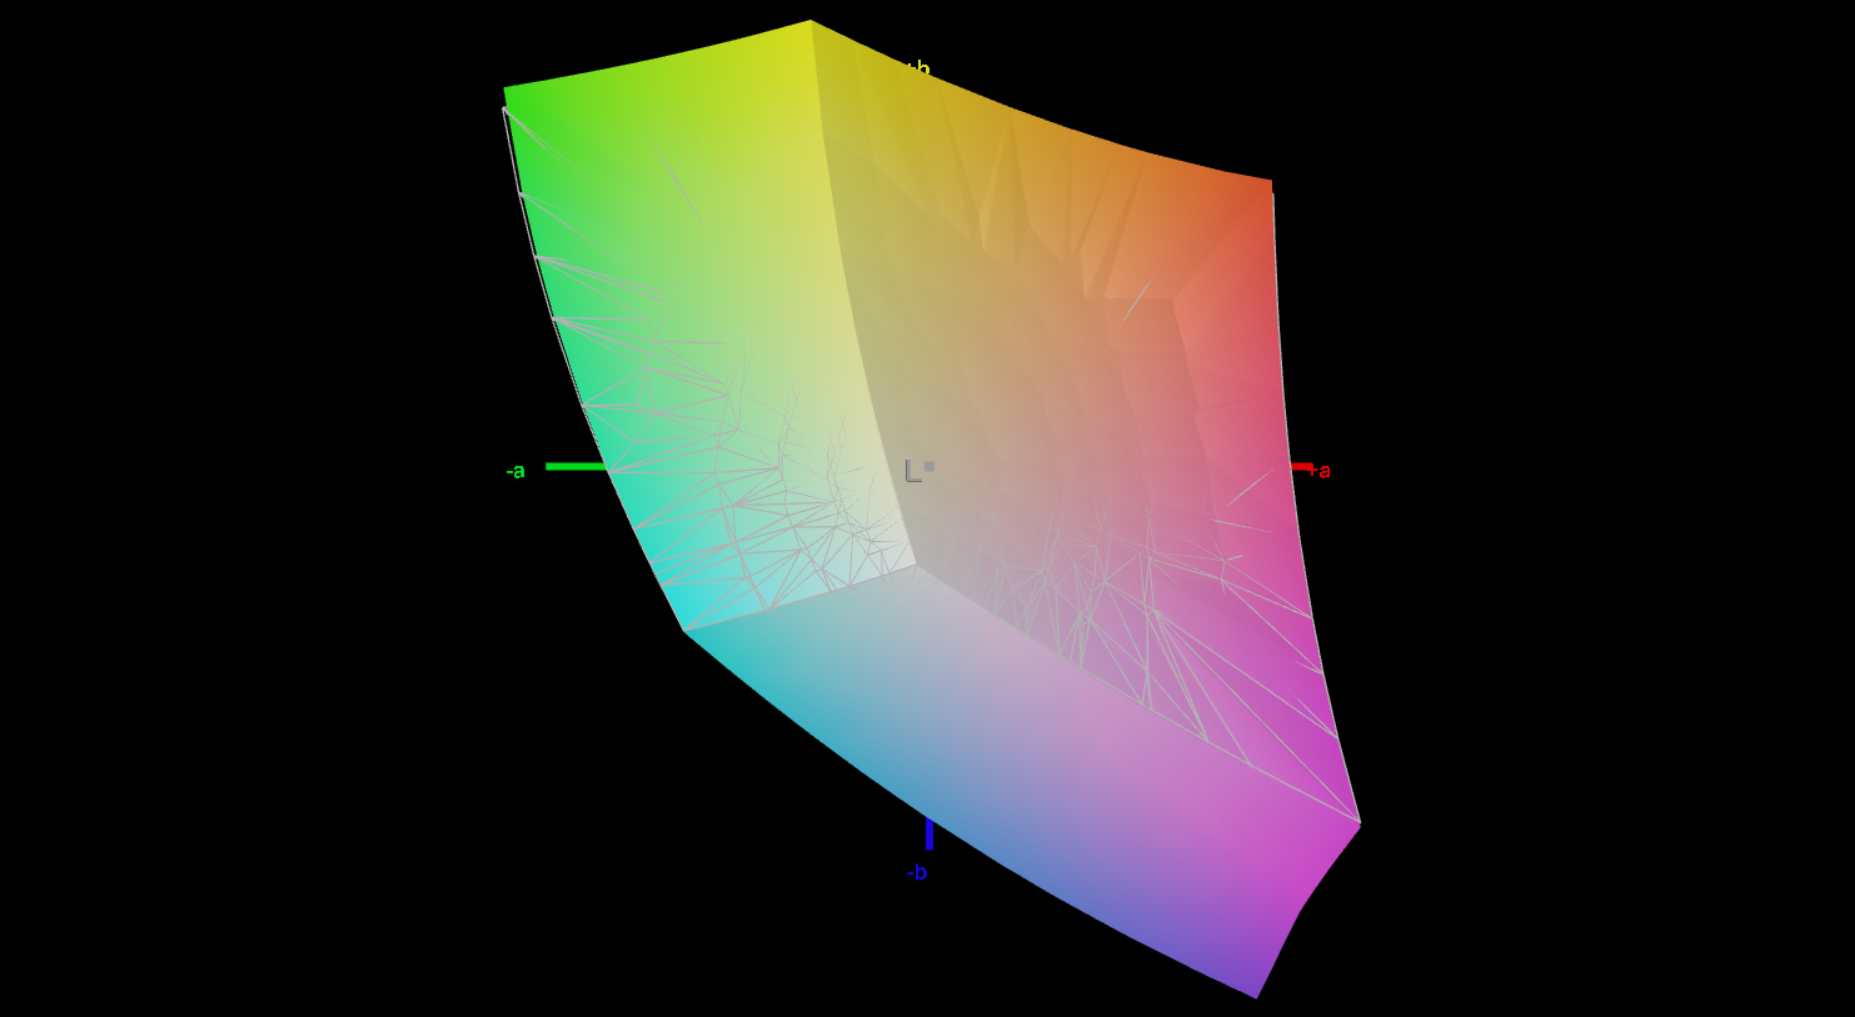
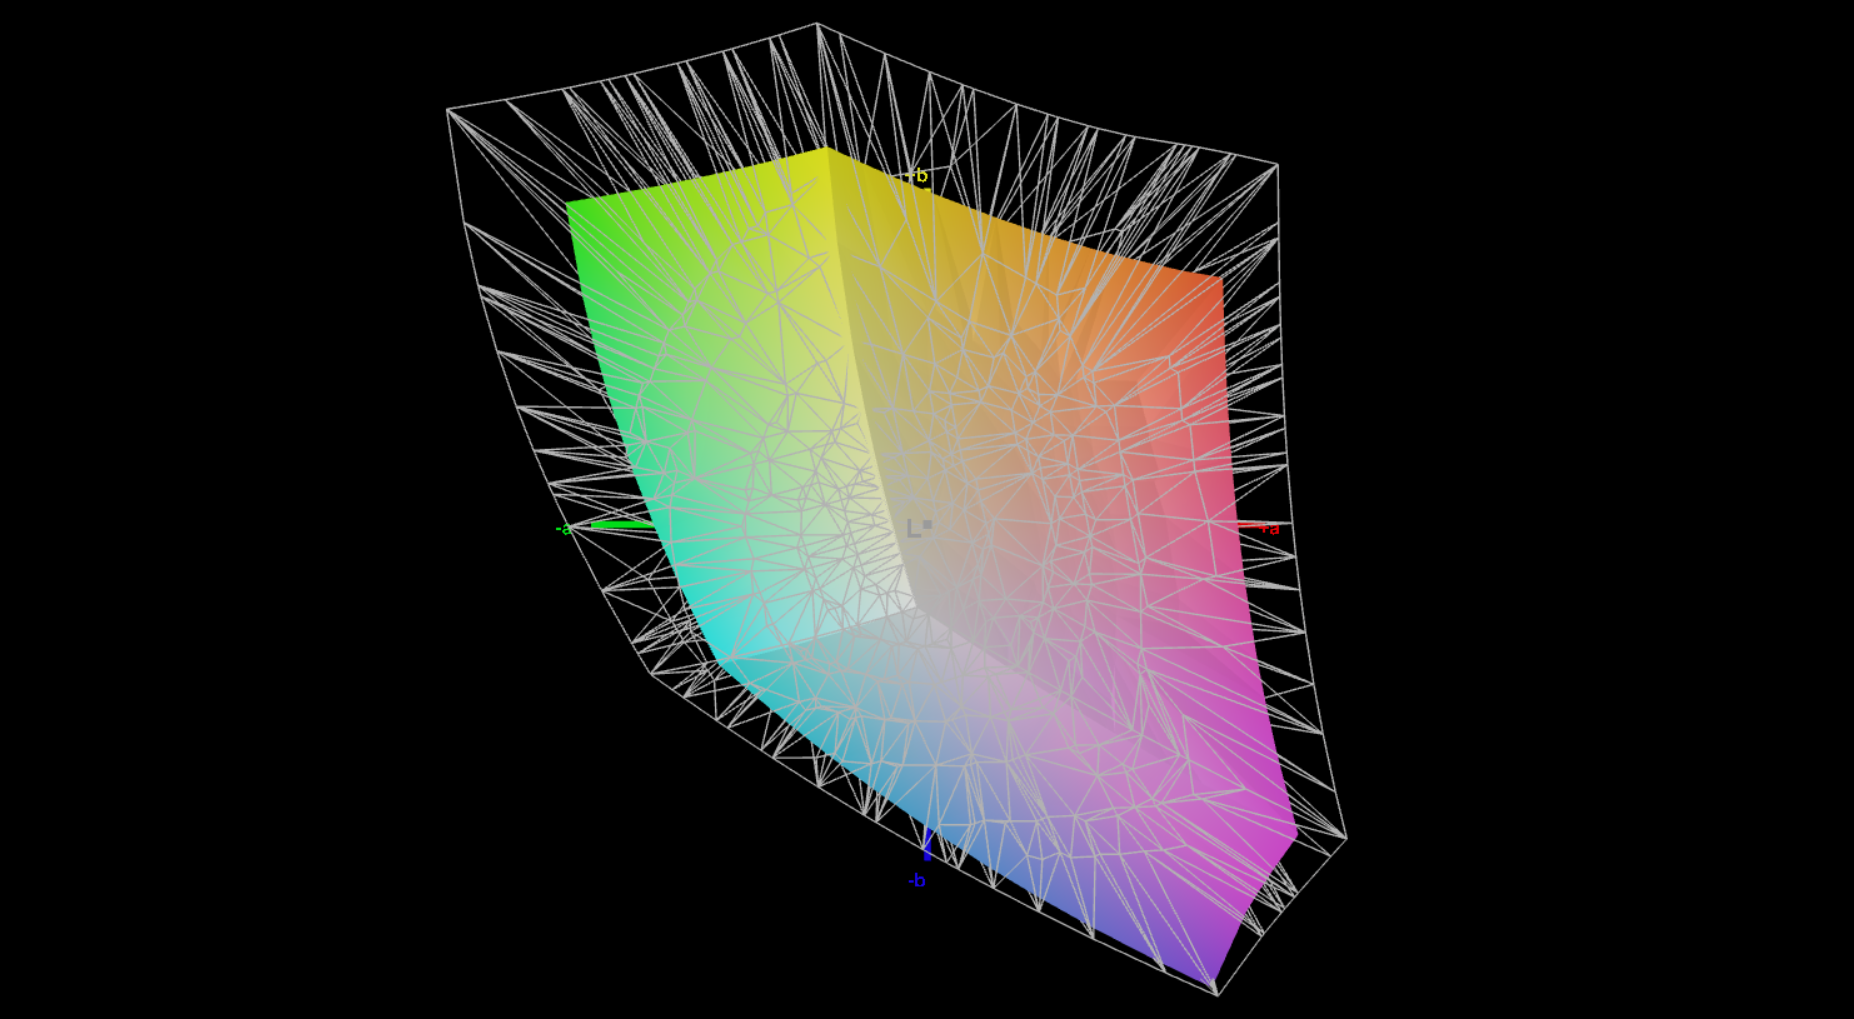
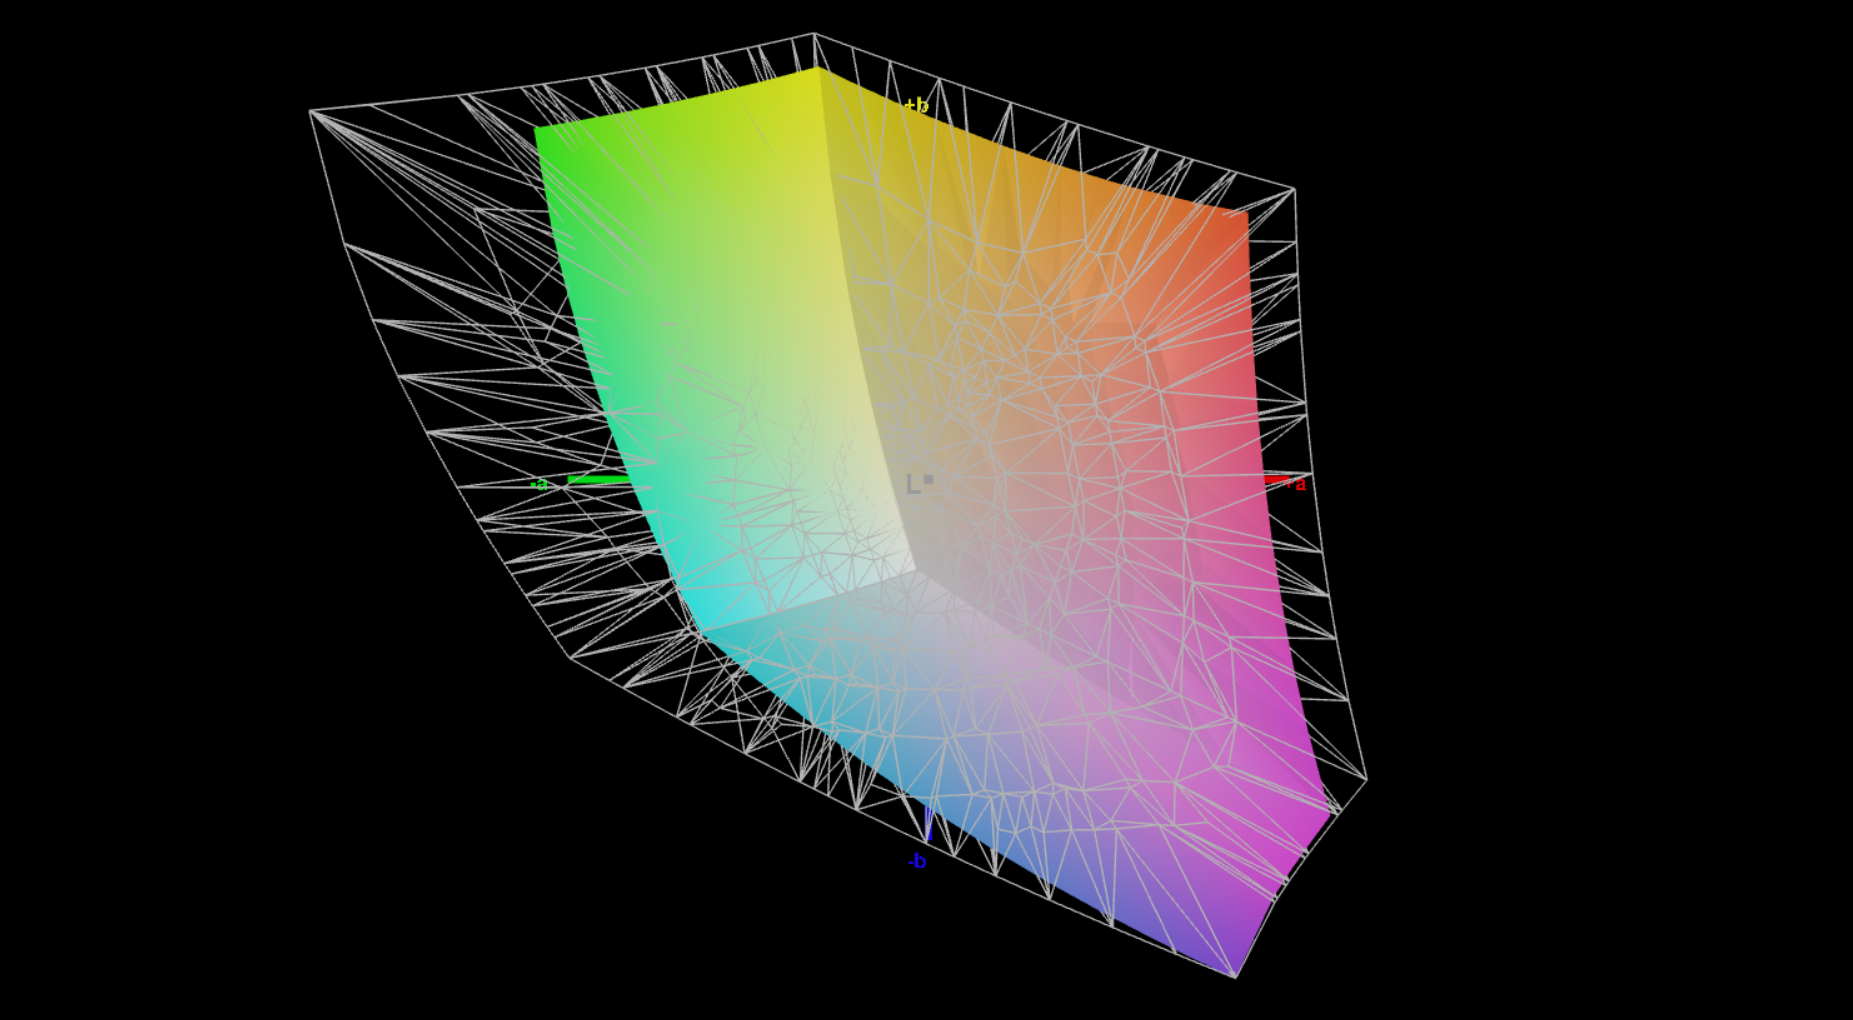
O brilho médio é muito bom, ~554 cd/m² e, em conjunto com o nível de preto de 0,33 cd/m², isso resulta em uma alta taxa de contraste (~1.700:1). O perfil de cores de fábrica já mostra um bom desempenho em nossa análise com o software profissional CalMAN, mas conseguimos melhorar ainda mais a tela com nossa própria calibração.
| |||||||||||||||||||||||||
iluminação: 90 %
iluminação com acumulador: 565 cd/m²
Contraste: 1712:1 (Preto: 0.33 cd/m²)
ΔE ColorChecker Calman: 1.8 | ∀{0.5-29.43 Ø4.72}
calibrated: 0.7
ΔE Greyscale Calman: 2.9 | ∀{0.09-98 Ø4.97}
70.6% AdobeRGB 1998 (Argyll 3D)
99.7% sRGB (Argyll 3D)
68.4% Display P3 (Argyll 3D)
Gamma: 2.23
CCT: 6534 K
| Lenovo ThinkPad P16v G3 21RS000DGE M160NW49 R0, IPS, 1920x1200, 16", 60 Hz | Lenovo ThinkPad P1 Gen 8 Samsung ATNA60KA02-0, Tandem OLED, 3200x2000, 16", 120 Hz | HP ZBook X G1i 16 LG Philips LGD07B3, IPS, 2560x1600, 16", 120 Hz | HP ZBook Power 16 G11 A AUOA0A9, IPS, 2560x1600, 16", 120 Hz | Lenovo ThinkPad P16s Gen 4 21RX000YGE N160JCA-GT1, IPS LED, 1920x1200, 16", 60 Hz | |
|---|---|---|---|---|---|
| Display | 27% | 28% | 0% | -4% | |
| Display P3 Coverage (%) | 68.4 | 98.8 44% | 97.2 42% | 69.1 1% | 65.8 -4% |
| sRGB Coverage (%) | 99.7 | 100 0% | 100 0% | 97.7 -2% | 96.8 -3% |
| AdobeRGB 1998 Coverage (%) | 70.6 | 97.5 38% | 99.9 42% | 71 1% | 67.8 -4% |
| Response Times | 97% | -51% | 53% | -17% | |
| Response Time Grey 50% / Grey 80% * (ms) | 39.2 ? | 0.57 ? 99% | 45.5 ? -16% | 13.6 ? 65% | 29.4 ? 25% |
| Response Time Black / White * (ms) | 14.1 ? | 0.73 ? 95% | 26.1 ? -85% | 8.4 ? 40% | 22.4 ? -59% |
| PWM Frequency (Hz) | 1199 | 26536 ? | |||
| PWM Amplitude * (%) | 18 | 47 | |||
| Screen | 15% | -41% | -35% | -27% | |
| Brightness middle (cd/m²) | 565 | 561.8 -1% | 461.8 -18% | 470.7 -17% | 540 -4% |
| Brightness (cd/m²) | 554 | 566 2% | 427 -23% | 431 -22% | 516 -7% |
| Brightness Distribution (%) | 90 | 99 10% | 88 -2% | 88 -2% | 93 3% |
| Black Level * (cd/m²) | 0.33 | 0.46 -39% | 0.57 -73% | 0.37 -12% | |
| Contrast (:1) | 1712 | 1004 -41% | 826 -52% | 1459 -15% | |
| Colorchecker dE 2000 * | 1.8 | 1.29 28% | 4.08 -127% | 2.16 -20% | 3.4 -89% |
| Colorchecker dE 2000 max. * | 4.2 | 2.96 30% | 8.1 -93% | 4.39 -5% | 5.6 -33% |
| Colorchecker dE 2000 calibrated * | 0.7 | 0.81 -16% | 0.75 -7% | 1.37 -96% | 0.9 -29% |
| Greyscale dE 2000 * | 2.9 | 1.4 52% | 3.5 -21% | 3.7 -28% | 4.5 -55% |
| Gamma | 2.23 99% | 2.23 99% | 2.15 102% | 2.38 92% | 2.51 88% |
| CCT | 6534 99% | 6319 103% | 6715 97% | 6765 96% | 6294 103% |
| Média Total (Programa/Configurações) | 46% /
32% | -21% /
-28% | 6% /
-15% | -16% /
-20% |
* ... menor é melhor


Exibir tempos de resposta
| ↔ Tempo de resposta preto para branco | ||
|---|---|---|
| 14.1 ms ... ascensão ↗ e queda ↘ combinadas | ↗ 4.6 ms ascensão | 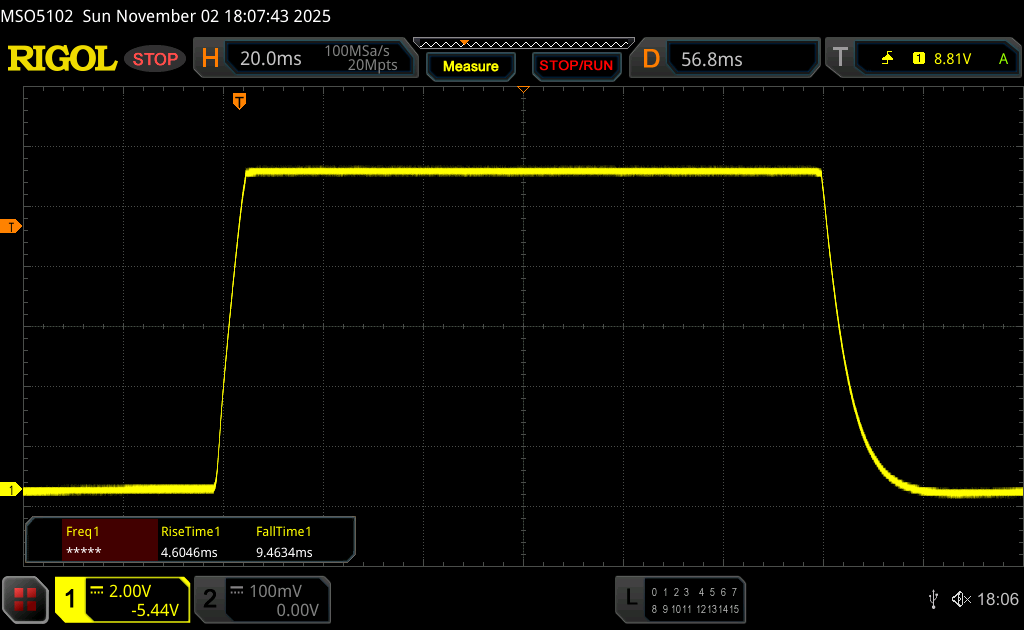 |
| ↘ 9.5 ms queda | ||
| A tela mostra boas taxas de resposta em nossos testes, mas pode ser muito lenta para jogadores competitivos. Em comparação, todos os dispositivos testados variam de 0.1 (mínimo) a 240 (máximo) ms. » 35 % de todos os dispositivos são melhores. Isso significa que o tempo de resposta medido é melhor que a média de todos os dispositivos testados (19.8 ms). | ||
| ↔ Tempo de resposta 50% cinza a 80% cinza | ||
| 39.2 ms ... ascensão ↗ e queda ↘ combinadas | ↗ 17.5 ms ascensão | 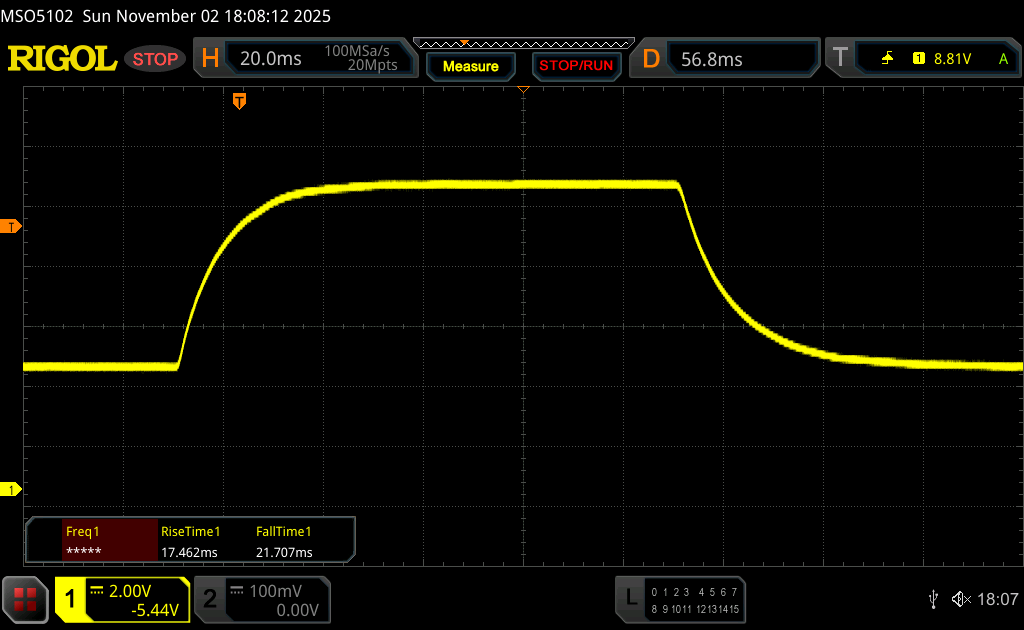 |
| ↘ 21.7 ms queda | ||
| A tela mostra taxas de resposta lentas em nossos testes e será insatisfatória para os jogadores. Em comparação, todos os dispositivos testados variam de 0.165 (mínimo) a 636 (máximo) ms. » 60 % de todos os dispositivos são melhores. Isso significa que o tempo de resposta medido é pior que a média de todos os dispositivos testados (31 ms). | ||
Cintilação da tela / PWM (modulação por largura de pulso)
| Tela tremeluzindo / PWM não detectado | 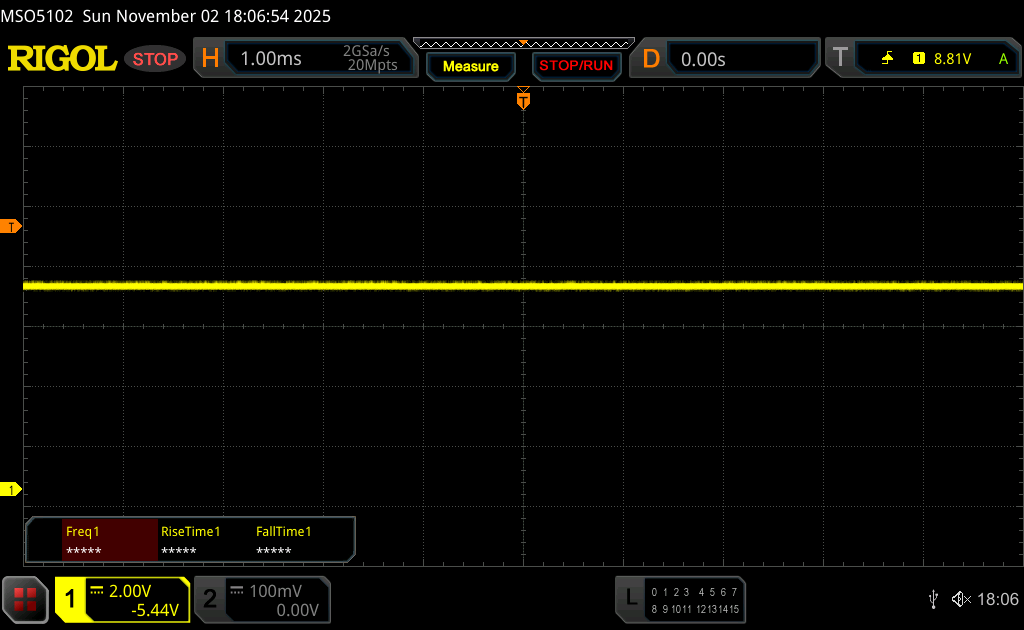 | ||
[pwm_comparison] Em comparação: 52 % de todos os dispositivos testados não usam PWM para escurecer a tela. Se PWM foi detectado, uma média de 7747 (mínimo: 5 - máximo: 343500) Hz foi medida. | |||


Desempenho - Arrow Lake e RTX PRO 2000
Condições de teste
Os perfis de energia da Lenovo estão diretamente ligados às configurações do Windows nos ThinkPads. Realizamos os benchmarks e as medições no modo Melhor Desempenho.
Processador
O dispositivo de teste contém o Intel Core Ultra 7 255H (Arrow Lake), que pode consumir até 115 watts por períodos curtos e 70 watts continuamente. O desempenho geral da CPU é bom, mesmo que alguns dos concorrentes sejam um pouco mais rápidos. No modo de bateria, o processador pode consumir no máximo 40 watts, e é por isso que o desempenho de vários núcleos é cerca de 14% menor aqui.
Cinebench R15 Teste de resistência múltipla
Cinebench R23: Multi Core | Single Core
Cinebench R20: CPU (Multi Core) | CPU (Single Core)
Cinebench R15: CPU Multi 64Bit | CPU Single 64Bit
Blender: v2.79 BMW27 CPU
7-Zip 18.03: 7z b 4 | 7z b 4 -mmt1
Geekbench 6.7: Multi-Core | Single-Core
Geekbench 5.5: Multi-Core | Single-Core
HWBOT x265 Benchmark v2.2: 4k Preset
LibreOffice : 20 Documents To PDF
R Benchmark 2.5: Overall mean
| CPU Performance rating | |
| Média da turma Workstation | |
| HP ZBook X G1i 16 | |
| Lenovo ThinkPad P16v G3 21RS000DGE | |
| Lenovo ThinkPad P1 Gen 8 | |
| Média Intel Core Ultra 7 255H | |
| Lenovo ThinkPad P16s Gen 4 21RX000YGE | |
| HP ZBook Power 16 G11 A | |
| Cinebench R23 / Multi Core | |
| Média da turma Workstation (14621 - 38520, n=23, últimos 2 anos) | |
| Lenovo ThinkPad P1 Gen 8 | |
| HP ZBook X G1i 16 | |
| Lenovo ThinkPad P16v G3 21RS000DGE | |
| Média Intel Core Ultra 7 255H (16105 - 22578, n=20) | |
| Lenovo ThinkPad P16s Gen 4 21RX000YGE | |
| HP ZBook Power 16 G11 A | |
| Cinebench R23 / Single Core | |
| Lenovo ThinkPad P16v G3 21RS000DGE | |
| Média Intel Core Ultra 7 255H (1874 - 2152, n=20) | |
| Média da turma Workstation (1712 - 2228, n=23, últimos 2 anos) | |
| HP ZBook X G1i 16 | |
| Lenovo ThinkPad P1 Gen 8 | |
| Lenovo ThinkPad P16s Gen 4 21RX000YGE | |
| HP ZBook Power 16 G11 A | |
| Cinebench R20 / CPU (Multi Core) | |
| Média da turma Workstation (5760 - 15043, n=23, últimos 2 anos) | |
| Lenovo ThinkPad P1 Gen 8 | |
| HP ZBook X G1i 16 | |
| Lenovo ThinkPad P16v G3 21RS000DGE | |
| Média Intel Core Ultra 7 255H (6356 - 8860, n=19) | |
| Lenovo ThinkPad P16s Gen 4 21RX000YGE | |
| HP ZBook Power 16 G11 A | |
| Cinebench R20 / CPU (Single Core) | |
| Lenovo ThinkPad P16v G3 21RS000DGE | |
| Lenovo ThinkPad P16s Gen 4 21RX000YGE | |
| Média Intel Core Ultra 7 255H (743 - 826, n=19) | |
| Média da turma Workstation (671 - 857, n=23, últimos 2 anos) | |
| HP ZBook X G1i 16 | |
| Lenovo ThinkPad P1 Gen 8 | |
| HP ZBook Power 16 G11 A | |
| Cinebench R15 / CPU Multi 64Bit | |
| Média da turma Workstation (2489 - 5810, n=23, últimos 2 anos) | |
| HP ZBook X G1i 16 | |
| Lenovo ThinkPad P1 Gen 8 | |
| Lenovo ThinkPad P16v G3 21RS000DGE | |
| Lenovo ThinkPad P16s Gen 4 21RX000YGE | |
| Média Intel Core Ultra 7 255H (2414 - 3444, n=19) | |
| HP ZBook Power 16 G11 A | |
| Cinebench R15 / CPU Single 64Bit | |
| Lenovo ThinkPad P16s Gen 4 21RX000YGE | |
| HP ZBook X G1i 16 | |
| Média Intel Core Ultra 7 255H (258 - 322, n=20) | |
| Lenovo ThinkPad P1 Gen 8 | |
| Lenovo ThinkPad P16v G3 21RS000DGE | |
| Média da turma Workstation (191.4 - 328, n=23, últimos 2 anos) | |
| HP ZBook Power 16 G11 A | |
| Blender / v2.79 BMW27 CPU | |
| HP ZBook Power 16 G11 A | |
| Média Intel Core Ultra 7 255H (156 - 293, n=19) | |
| Lenovo ThinkPad P16s Gen 4 21RX000YGE | |
| Lenovo ThinkPad P16v G3 21RS000DGE | |
| Lenovo ThinkPad P1 Gen 8 | |
| HP ZBook X G1i 16 | |
| Média da turma Workstation (91 - 222, n=23, últimos 2 anos) | |
| 7-Zip 18.03 / 7z b 4 | |
| Média da turma Workstation (60489 - 116969, n=23, últimos 2 anos) | |
| Lenovo ThinkPad P16s Gen 4 21RX000YGE | |
| HP ZBook X G1i 16 | |
| Lenovo ThinkPad P16v G3 21RS000DGE | |
| HP ZBook Power 16 G11 A | |
| Lenovo ThinkPad P1 Gen 8 | |
| Média Intel Core Ultra 7 255H (42155 - 70397, n=20) | |
| 7-Zip 18.03 / 7z b 4 -mmt1 | |
| HP ZBook Power 16 G11 A | |
| Lenovo ThinkPad P16s Gen 4 21RX000YGE | |
| Lenovo ThinkPad P16v G3 21RS000DGE | |
| Média da turma Workstation (5126 - 6960, n=23, últimos 2 anos) | |
| HP ZBook X G1i 16 | |
| Média Intel Core Ultra 7 255H (4589 - 6385, n=20) | |
| Lenovo ThinkPad P1 Gen 8 | |
| Geekbench 6.7 / Multi-Core | |
| HP ZBook X G1i 16 | |
| Lenovo ThinkPad P1 Gen 8 | |
| Lenovo ThinkPad P16v G3 21RS000DGE | |
| Média da turma Workstation (12721 - 20887, n=23, últimos 2 anos) | |
| Média Intel Core Ultra 7 255H (11979 - 17489, n=20) | |
| Lenovo ThinkPad P16s Gen 4 21RX000YGE | |
| HP ZBook Power 16 G11 A | |
| Geekbench 6.7 / Single-Core | |
| Lenovo ThinkPad P16s Gen 4 21RX000YGE | |
| Lenovo ThinkPad P16v G3 21RS000DGE | |
| HP ZBook X G1i 16 | |
| Média Intel Core Ultra 7 255H (2712 - 2939, n=20) | |
| Média da turma Workstation (2389 - 3065, n=23, últimos 2 anos) | |
| Lenovo ThinkPad P1 Gen 8 | |
| HP ZBook Power 16 G11 A | |
| Geekbench 5.5 / Multi-Core | |
| Média da turma Workstation (11542 - 25554, n=23, últimos 2 anos) | |
| Lenovo ThinkPad P1 Gen 8 | |
| HP ZBook X G1i 16 | |
| Lenovo ThinkPad P16v G3 21RS000DGE | |
| Lenovo ThinkPad P16s Gen 4 21RX000YGE | |
| Média Intel Core Ultra 7 255H (11348 - 17218, n=19) | |
| HP ZBook Power 16 G11 A | |
| Geekbench 5.5 / Single-Core | |
| Lenovo ThinkPad P16s Gen 4 21RX000YGE | |
| Lenovo ThinkPad P16v G3 21RS000DGE | |
| HP ZBook X G1i 16 | |
| Média Intel Core Ultra 7 255H (1938 - 2121, n=19) | |
| Média da turma Workstation (1783 - 2183, n=23, últimos 2 anos) | |
| Lenovo ThinkPad P1 Gen 8 | |
| HP ZBook Power 16 G11 A | |
| HWBOT x265 Benchmark v2.2 / 4k Preset | |
| Média da turma Workstation (17.8 - 40.5, n=23, últimos 2 anos) | |
| Lenovo ThinkPad P1 Gen 8 | |
| HP ZBook X G1i 16 | |
| Lenovo ThinkPad P16v G3 21RS000DGE | |
| Lenovo ThinkPad P16s Gen 4 21RX000YGE | |
| Média Intel Core Ultra 7 255H (13.7 - 26.5, n=19) | |
| HP ZBook Power 16 G11 A | |
| LibreOffice / 20 Documents To PDF | |
| Lenovo ThinkPad P16s Gen 4 21RX000YGE | |
| HP ZBook Power 16 G11 A | |
| Média Intel Core Ultra 7 255H (41.1 - 61.6, n=19) | |
| Média da turma Workstation (37.1 - 74.7, n=23, últimos 2 anos) | |
| HP ZBook X G1i 16 | |
| Lenovo ThinkPad P1 Gen 8 | |
| Lenovo ThinkPad P16v G3 21RS000DGE | |
| R Benchmark 2.5 / Overall mean | |
| Lenovo ThinkPad P16s Gen 4 21RX000YGE | |
| HP ZBook Power 16 G11 A | |
| Média Intel Core Ultra 7 255H (0.4233 - 0.515, n=19) | |
| Lenovo ThinkPad P16v G3 21RS000DGE | |
| Lenovo ThinkPad P1 Gen 8 | |
| Média da turma Workstation (0.3825 - 0.603, n=23, últimos 2 anos) | |
| HP ZBook X G1i 16 | |
* ... menor é melhor
AIDA64: FP32 Ray-Trace | FPU Julia | CPU SHA3 | CPU Queen | FPU SinJulia | FPU Mandel | CPU AES | CPU ZLib | FP64 Ray-Trace | CPU PhotoWorxx
| Performance rating | |
| Média da turma Workstation | |
| Lenovo ThinkPad P16s Gen 4 21RX000YGE | |
| HP ZBook Power 16 G11 A | |
| Lenovo ThinkPad P1 Gen 8 | |
| Lenovo ThinkPad P16v G3 21RS000DGE | |
| Média Intel Core Ultra 7 255H | |
| AIDA64 / FP32 Ray-Trace | |
| Lenovo ThinkPad P16s Gen 4 21RX000YGE | |
| Média da turma Workstation (16730 - 61611, n=23, últimos 2 anos) | |
| HP ZBook Power 16 G11 A | |
| Lenovo ThinkPad P1 Gen 8 | |
| Lenovo ThinkPad P16v G3 21RS000DGE | |
| Média Intel Core Ultra 7 255H (13863 - 24741, n=17) | |
| AIDA64 / FPU Julia | |
| Média da turma Workstation (89597 - 186971, n=23, últimos 2 anos) | |
| Lenovo ThinkPad P1 Gen 8 | |
| HP ZBook Power 16 G11 A | |
| Lenovo ThinkPad P16s Gen 4 21RX000YGE | |
| Lenovo ThinkPad P16v G3 21RS000DGE | |
| Média Intel Core Ultra 7 255H (71030 - 119222, n=17) | |
| AIDA64 / CPU SHA3 | |
| Média da turma Workstation (4178 - 8975, n=23, últimos 2 anos) | |
| Lenovo ThinkPad P1 Gen 8 | |
| Lenovo ThinkPad P16s Gen 4 21RX000YGE | |
| Lenovo ThinkPad P16v G3 21RS000DGE | |
| HP ZBook Power 16 G11 A | |
| Média Intel Core Ultra 7 255H (3408 - 5548, n=17) | |
| AIDA64 / CPU Queen | |
| HP ZBook Power 16 G11 A | |
| Média da turma Workstation (60778 - 144411, n=23, últimos 2 anos) | |
| Lenovo ThinkPad P16s Gen 4 21RX000YGE | |
| Lenovo ThinkPad P1 Gen 8 | |
| Lenovo ThinkPad P16v G3 21RS000DGE | |
| Média Intel Core Ultra 7 255H (59098 - 68460, n=16) | |
| AIDA64 / FPU SinJulia | |
| Lenovo ThinkPad P16s Gen 4 21RX000YGE | |
| HP ZBook Power 16 G11 A | |
| Média da turma Workstation (8165 - 29343, n=23, últimos 2 anos) | |
| Lenovo ThinkPad P1 Gen 8 | |
| Lenovo ThinkPad P16v G3 21RS000DGE | |
| Média Intel Core Ultra 7 255H (6716 - 9006, n=17) | |
| AIDA64 / FPU Mandel | |
| Média da turma Workstation (44497 - 98153, n=23, últimos 2 anos) | |
| Lenovo ThinkPad P1 Gen 8 | |
| Lenovo ThinkPad P16s Gen 4 21RX000YGE | |
| Lenovo ThinkPad P16v G3 21RS000DGE | |
| HP ZBook Power 16 G11 A | |
| Média Intel Core Ultra 7 255H (37031 - 63347, n=17) | |
| AIDA64 / CPU AES | |
| Média da turma Workstation (73133 - 187841, n=23, últimos 2 anos) | |
| Lenovo ThinkPad P16s Gen 4 21RX000YGE | |
| Lenovo ThinkPad P1 Gen 8 | |
| HP ZBook Power 16 G11 A | |
| Lenovo ThinkPad P16v G3 21RS000DGE | |
| Média Intel Core Ultra 7 255H (58402 - 83568, n=17) | |
| AIDA64 / CPU ZLib | |
| Média da turma Workstation (929 - 2148, n=23, últimos 2 anos) | |
| Lenovo ThinkPad P1 Gen 8 | |
| Lenovo ThinkPad P16s Gen 4 21RX000YGE | |
| Lenovo ThinkPad P16v G3 21RS000DGE | |
| Média Intel Core Ultra 7 255H (822 - 1316, n=17) | |
| HP ZBook Power 16 G11 A | |
| AIDA64 / FP64 Ray-Trace | |
| Lenovo ThinkPad P16s Gen 4 21RX000YGE | |
| Média da turma Workstation (8545 - 32891, n=23, últimos 2 anos) | |
| Lenovo ThinkPad P1 Gen 8 | |
| HP ZBook Power 16 G11 A | |
| Lenovo ThinkPad P16v G3 21RS000DGE | |
| Média Intel Core Ultra 7 255H (7384 - 13231, n=17) | |
| AIDA64 / CPU PhotoWorxx | |
| Lenovo ThinkPad P1 Gen 8 | |
| Média Intel Core Ultra 7 255H (23836 - 65787, n=17) | |
| Média da turma Workstation (37151 - 93684, n=23, últimos 2 anos) | |
| Lenovo ThinkPad P16s Gen 4 21RX000YGE | |
| Lenovo ThinkPad P16v G3 21RS000DGE | |
| HP ZBook Power 16 G11 A | |
Desempenho do sistema
No uso diário, o ThinkPad P16v Gen 3 é um computador muito ágil e os resultados de benchmark são muito bons. Não houve problemas de estabilidade durante o teste.
PCMark 10: Score | Essentials | Productivity | Digital Content Creation
CrossMark: Overall | Productivity | Creativity | Responsiveness
WebXPRT 3: Overall
WebXPRT 4: Overall
Mozilla Kraken 1.1: Total
| Performance rating | |
| Lenovo ThinkPad P16v G3 21RS000DGE | |
| Média Intel Core Ultra 7 255H, NVIDIA RTX PRO 2000 Blackwell Generation Laptop | |
| Lenovo ThinkPad P1 Gen 8 | |
| HP ZBook X G1i 16 -4! | |
| Média da turma Workstation | |
| HP ZBook Power 16 G11 A | |
| Lenovo ThinkPad P16s Gen 4 21RX000YGE | |
| PCMark 10 / Score | |
| Lenovo ThinkPad P16v G3 21RS000DGE | |
| Média Intel Core Ultra 7 255H, NVIDIA RTX PRO 2000 Blackwell Generation Laptop (9625 - 9723, n=2) | |
| Lenovo ThinkPad P1 Gen 8 | |
| Média da turma Workstation (6563 - 10409, n=19, últimos 2 anos) | |
| Lenovo ThinkPad P16s Gen 4 21RX000YGE | |
| HP ZBook Power 16 G11 A | |
| PCMark 10 / Essentials | |
| Lenovo ThinkPad P16v G3 21RS000DGE | |
| Média Intel Core Ultra 7 255H, NVIDIA RTX PRO 2000 Blackwell Generation Laptop (10650 - 10921, n=2) | |
| Lenovo ThinkPad P16s Gen 4 21RX000YGE | |
| Lenovo ThinkPad P1 Gen 8 | |
| Média da turma Workstation (9622 - 11157, n=19, últimos 2 anos) | |
| HP ZBook Power 16 G11 A | |
| PCMark 10 / Productivity | |
| Lenovo ThinkPad P1 Gen 8 | |
| Média Intel Core Ultra 7 255H, NVIDIA RTX PRO 2000 Blackwell Generation Laptop (18083 - 18261, n=2) | |
| Lenovo ThinkPad P16v G3 21RS000DGE | |
| Média da turma Workstation (8789 - 20616, n=19, últimos 2 anos) | |
| Lenovo ThinkPad P16s Gen 4 21RX000YGE | |
| HP ZBook Power 16 G11 A | |
| PCMark 10 / Digital Content Creation | |
| Lenovo ThinkPad P16v G3 21RS000DGE | |
| Média Intel Core Ultra 7 255H, NVIDIA RTX PRO 2000 Blackwell Generation Laptop (12443 - 12631, n=2) | |
| Média da turma Workstation (8108 - 15631, n=19, últimos 2 anos) | |
| Lenovo ThinkPad P1 Gen 8 | |
| HP ZBook Power 16 G11 A | |
| Lenovo ThinkPad P16s Gen 4 21RX000YGE | |
| CrossMark / Overall | |
| HP ZBook X G1i 16 | |
| Lenovo ThinkPad P1 Gen 8 | |
| Média Intel Core Ultra 7 255H, NVIDIA RTX PRO 2000 Blackwell Generation Laptop (1942 - 1953, n=2) | |
| Lenovo ThinkPad P16v G3 21RS000DGE | |
| Média da turma Workstation (1307 - 2267, n=22, últimos 2 anos) | |
| HP ZBook Power 16 G11 A | |
| Lenovo ThinkPad P16s Gen 4 21RX000YGE | |
| CrossMark / Productivity | |
| HP ZBook X G1i 16 | |
| Lenovo ThinkPad P1 Gen 8 | |
| Média Intel Core Ultra 7 255H, NVIDIA RTX PRO 2000 Blackwell Generation Laptop (1834 - 1836, n=2) | |
| Lenovo ThinkPad P16v G3 21RS000DGE | |
| Média da turma Workstation (1130 - 2122, n=22, últimos 2 anos) | |
| HP ZBook Power 16 G11 A | |
| Lenovo ThinkPad P16s Gen 4 21RX000YGE | |
| CrossMark / Creativity | |
| HP ZBook X G1i 16 | |
| Lenovo ThinkPad P16v G3 21RS000DGE | |
| Média Intel Core Ultra 7 255H, NVIDIA RTX PRO 2000 Blackwell Generation Laptop (2211 - 2232, n=2) | |
| Média da turma Workstation (1657 - 2725, n=22, últimos 2 anos) | |
| Lenovo ThinkPad P1 Gen 8 | |
| HP ZBook Power 16 G11 A | |
| Lenovo ThinkPad P16s Gen 4 21RX000YGE | |
| CrossMark / Responsiveness | |
| Lenovo ThinkPad P1 Gen 8 | |
| Média da turma Workstation (993 - 2096, n=22, últimos 2 anos) | |
| Média Intel Core Ultra 7 255H, NVIDIA RTX PRO 2000 Blackwell Generation Laptop (1520 - 1622, n=2) | |
| HP ZBook X G1i 16 | |
| Lenovo ThinkPad P16v G3 21RS000DGE | |
| HP ZBook Power 16 G11 A | |
| Lenovo ThinkPad P16s Gen 4 21RX000YGE | |
| WebXPRT 3 / Overall | |
| Lenovo ThinkPad P1 Gen 8 | |
| Média Intel Core Ultra 7 255H, NVIDIA RTX PRO 2000 Blackwell Generation Laptop (322 - 330, n=2) | |
| Lenovo ThinkPad P16v G3 21RS000DGE | |
| HP ZBook X G1i 16 | |
| Média da turma Workstation (260 - 360, n=23, últimos 2 anos) | |
| Lenovo ThinkPad P16s Gen 4 21RX000YGE | |
| HP ZBook Power 16 G11 A | |
| WebXPRT 4 / Overall | |
| Lenovo ThinkPad P16v G3 21RS000DGE | |
| Média Intel Core Ultra 7 255H, NVIDIA RTX PRO 2000 Blackwell Generation Laptop (298 - 307, n=2) | |
| HP ZBook X G1i 16 | |
| Lenovo ThinkPad P1 Gen 8 | |
| Média da turma Workstation (189.2 - 326, n=23, últimos 2 anos) | |
| HP ZBook Power 16 G11 A | |
| Lenovo ThinkPad P16s Gen 4 21RX000YGE | |
| Mozilla Kraken 1.1 / Total | |
| HP ZBook Power 16 G11 A | |
| Lenovo ThinkPad P16s Gen 4 21RX000YGE | |
| Lenovo ThinkPad P1 Gen 8 | |
| HP ZBook X G1i 16 | |
| Média da turma Workstation (411 - 538, n=23, últimos 2 anos) | |
| Média Intel Core Ultra 7 255H, NVIDIA RTX PRO 2000 Blackwell Generation Laptop (448 - 461, n=2) | |
| Lenovo ThinkPad P16v G3 21RS000DGE | |
* ... menor é melhor
| PCMark 10 Score | 9723 pontos | |
Ajuda | ||
| AIDA64 / Memory Copy | |
| Lenovo ThinkPad P1 Gen 8 | |
| Média Intel Core Ultra 7 255H (39188 - 110930, n=17) | |
| Média da turma Workstation (56003 - 164795, n=23, últimos 2 anos) | |
| Lenovo ThinkPad P16v G3 21RS000DGE | |
| Lenovo ThinkPad P16s Gen 4 21RX000YGE | |
| HP ZBook Power 16 G11 A | |
| AIDA64 / Memory Read | |
| Lenovo ThinkPad P16s Gen 4 21RX000YGE | |
| Lenovo ThinkPad P16v G3 21RS000DGE | |
| Média Intel Core Ultra 7 255H (43703 - 90552, n=17) | |
| Média da turma Workstation (55795 - 121563, n=23, últimos 2 anos) | |
| Lenovo ThinkPad P1 Gen 8 | |
| HP ZBook Power 16 G11 A | |
| AIDA64 / Memory Write | |
| Média da turma Workstation (55663 - 214520, n=23, últimos 2 anos) | |
| HP ZBook Power 16 G11 A | |
| Lenovo ThinkPad P16s Gen 4 21RX000YGE | |
| Lenovo ThinkPad P16v G3 21RS000DGE | |
| Média Intel Core Ultra 7 255H (36438 - 87199, n=17) | |
| Lenovo ThinkPad P1 Gen 8 | |
| AIDA64 / Memory Latency | |
| Lenovo ThinkPad P1 Gen 8 | |
| Média da turma Workstation (84.5 - 165.2, n=23, últimos 2 anos) | |
| Média Intel Core Ultra 7 255H (107.6 - 147.2, n=17) | |
| Lenovo ThinkPad P16v G3 21RS000DGE | |
| Lenovo ThinkPad P16s Gen 4 21RX000YGE | |
| HP ZBook Power 16 G11 A | |
* ... menor é melhor
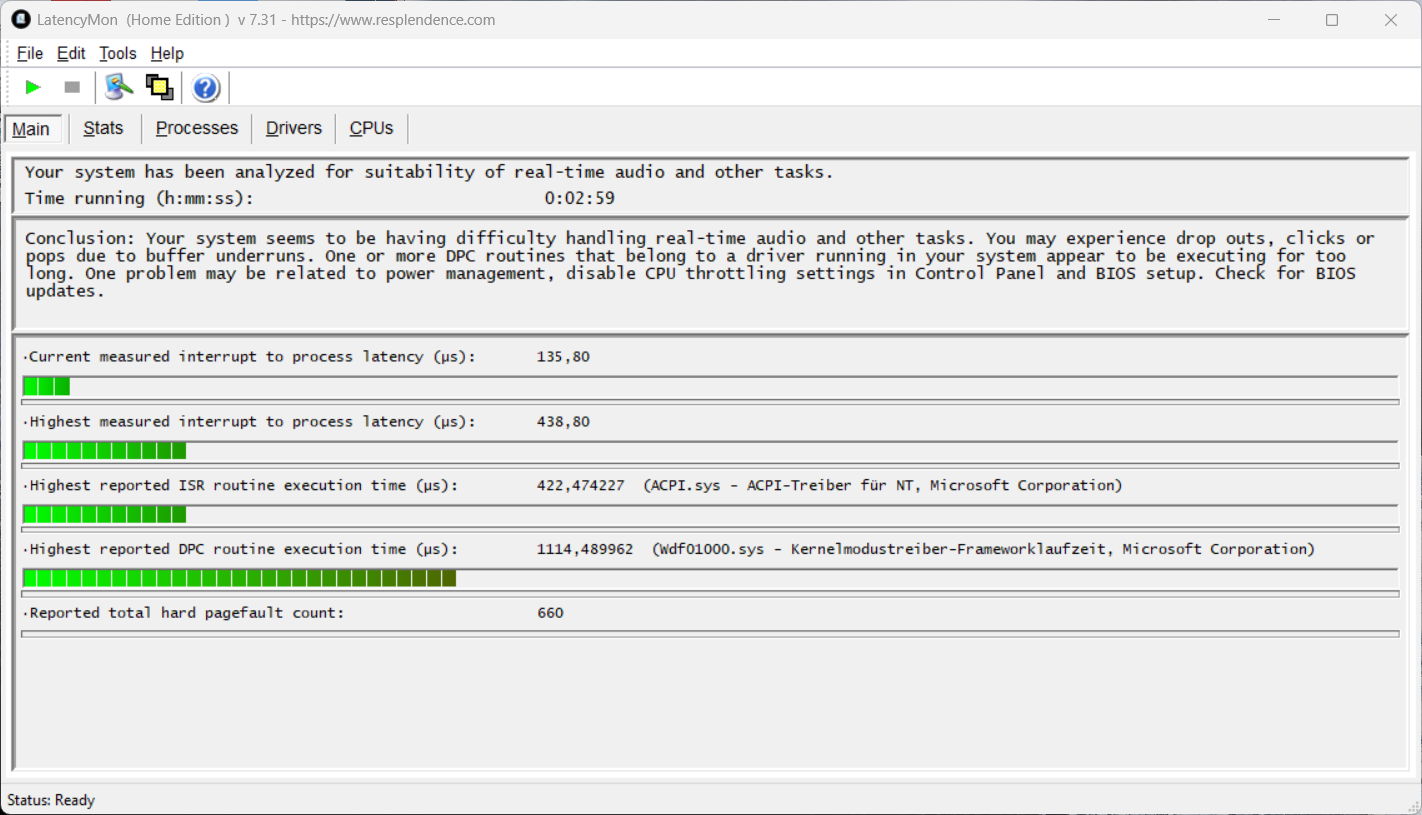
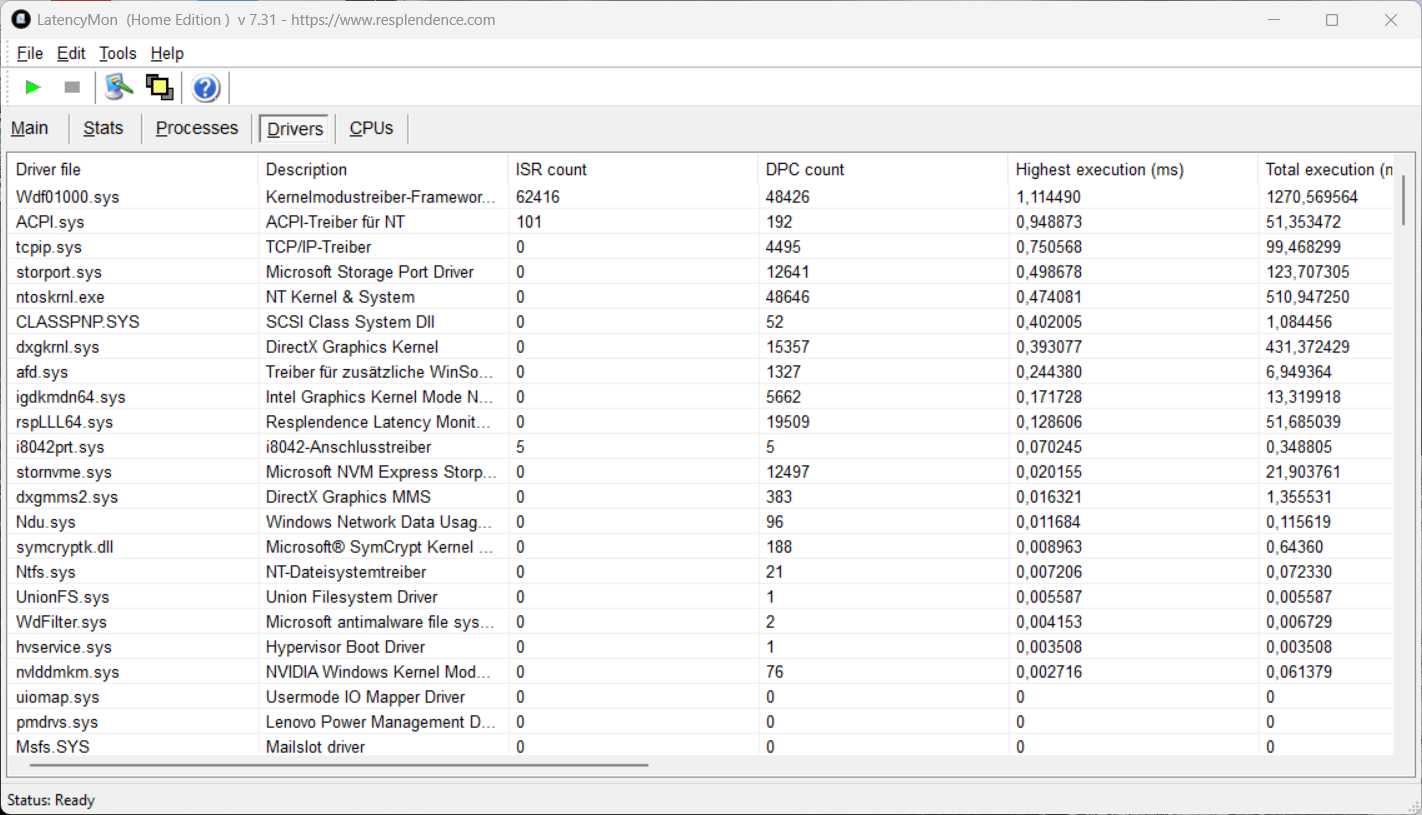
Latências de DPC
Em nosso teste de latência padronizado (navegação na Internet, reprodução de 4K no YouTube, carga da CPU), o dispositivo de teste com a versão atual do BIOS mostra pequenas limitações ao usar aplicativos de áudio em tempo real.
| DPC Latencies / LatencyMon - interrupt to process latency (max), Web, Youtube, Prime95 | |
| HP ZBook Power 16 G11 A | |
| Lenovo ThinkPad P1 Gen 8 | |
| Lenovo ThinkPad P16s Gen 4 21RX000YGE | |
| HP ZBook X G1i 16 | |
| Lenovo ThinkPad P16v G3 21RS000DGE | |
* ... menor é melhor
Dispositivos de armazenamento
O Samsung PM9E1 (1 TB, 879 GB livres), um SSD PCIe 5.0, já está instalado em nosso dispositivo de teste, mas os dois slots M.2-2280 são conectados somente via PCIe 4.0. Assim, as taxas de transferência também são, no máximo, de cerca de 7 GB/s em vez de 13-14 GB/s. Entretanto, o desempenho ainda é bom e permanece estável mesmo sob carga prolongada.

* ... menor é melhor
Desempenho contínuo de leitura: Loop de leitura do DiskSpd, profundidade da fila 8
Desempenho da GPU
A GPU é a profissional Nvidia RTX PRO 2000 (Blackwell, 8 GB VRAM), que é ativada por meio da tecnologia Optimus. O chip em si é idêntico ao GeForce RTX 5060mas, no caso do P16v Gen 3, apenas a versão de 60 watts está implementada (seria possível um máximo de 115 watts), o que é um pouco decepcionante, considerando a caixa grande. No entanto, isso é semelhante para as outras estações de trabalho móveis nesse segmento (máx. 75 watts), e é por isso que o desempenho gráfico aqui também é comparável. Também incluímos a versão de 115 watts do laptop RTX 5060 na comparação, que funciona 31% mais rápido. O desempenho gráfico permanece completamente estável sob carga contínua, mas a GPU pode consumir apenas 25 watts no modo de bateria (-56% de desempenho).
| 3DMark 11 Performance | 29308 pontos | |
| 3DMark Fire Strike Score | 23134 pontos | |
| 3DMark Time Spy Score | 9371 pontos | |
| 3DMark Steel Nomad Score | 1932 pontos | |
| 3DMark Steel Nomad Light Score | 9029 pontos | |
Ajuda | ||
| Blender / v3.3 Classroom OPTIX/RTX | |
| HP ZBook Power 16 G11 A | |
| HP ZBook X G1i 16 | |
| Média NVIDIA RTX PRO 2000 Blackwell Generation Laptop (22 - 25, n=3) | |
| Lenovo ThinkPad P1 Gen 8 | |
| Lenovo ThinkPad P16v G3 21RS000DGE | |
| Média da turma Workstation (10 - 43, n=17, últimos 2 anos) | |
| Blender / v3.3 Classroom CUDA | |
| HP ZBook Power 16 G11 A | |
| HP ZBook X G1i 16 | |
| Média NVIDIA RTX PRO 2000 Blackwell Generation Laptop (42 - 45, n=3) | |
| Lenovo ThinkPad P1 Gen 8 | |
| Lenovo ThinkPad P16v G3 21RS000DGE | |
| Média da turma Workstation (16 - 74, n=17, últimos 2 anos) | |
| Blender / v3.3 Classroom CPU | |
| HP ZBook Power 16 G11 A | |
| Lenovo ThinkPad P1 Gen 8 | |
| Lenovo ThinkPad P16v G3 21RS000DGE | |
| Média NVIDIA RTX PRO 2000 Blackwell Generation Laptop (266 - 273, n=3) | |
| Lenovo ThinkPad P16s Gen 4 21RX000YGE | |
| HP ZBook X G1i 16 | |
| Média da turma Workstation (148 - 364, n=23, últimos 2 anos) | |
* ... menor é melhor
| SPECviewperf 15 | |
| 3840x2160 Siemens NX 2406 (snx-05) | |
| Lenovo ThinkPad P16v G3 21RS000DGE | |
| 3840x2160 Unreal Engine 5.4.2 (unreal_engine-01) | |
| Lenovo ThinkPad P1 Gen 8 | |
| Lenovo ThinkPad P16v G3 21RS000DGE | |
| 3840x2160 Solidworks 2024 (solidworks-08) | |
| Lenovo ThinkPad P1 Gen 8 | |
| Lenovo ThinkPad P16v G3 21RS000DGE | |
| 3840x2160 Tuvok (medical-04) | |
| Lenovo ThinkPad P1 Gen 8 | |
| Lenovo ThinkPad P16v G3 21RS000DGE | |
| 3840x2160 Maya 2025 (maya-07) | |
| Lenovo ThinkPad P1 Gen 8 | |
| Lenovo ThinkPad P16v G3 21RS000DGE | |
| 3840x2160 Enscape 4.0 (enscape-01) | |
| Lenovo ThinkPad P1 Gen 8 | |
| Lenovo ThinkPad P16v G3 21RS000DGE | |
| 3840x2160 OpendTect (energy-04) | |
| Lenovo ThinkPad P1 Gen 8 | |
| Lenovo ThinkPad P16v G3 21RS000DGE | |
| 3840x2160 Creo 9 (creo-04) | |
| Lenovo ThinkPad P1 Gen 8 | |
| Lenovo ThinkPad P16v G3 21RS000DGE | |
| 3840x2160 Blender 3.6 (blender-01) | |
| Lenovo ThinkPad P1 Gen 8 | |
| Lenovo ThinkPad P16v G3 21RS000DGE | |
| 3840x2160 3ds Max 2023 (3dsmax-08) | |
| Lenovo ThinkPad P1 Gen 8 | |
| Lenovo ThinkPad P16v G3 21RS000DGE | |
Desempenho em jogos
O RTX PRO 2000 é perfeitamente capaz de lidar com jogos, e os drivers profissionais não foram problema algum. Em princípio, a maioria dos títulos modernos pode ser reproduzida na resolução nativa e com detalhes altos/máximos sem nenhum problema. Recentemente, escrevemos sobre as limitações de 8 GB de VRAM em um artigo separado.
| Performance rating - Percent | |
| Média da turma Workstation | |
| Lenovo ThinkPad P1 Gen 8 | |
| HP ZBook X G1i 16 | |
| Lenovo ThinkPad P16v G3 21RS000DGE | |
| HP ZBook Power 16 G11 A | |
| Lenovo ThinkPad P16s Gen 4 21RX000YGE -1! | |
| Cyberpunk 2077 - 1920x1080 Ultra Preset (FSR off) | |
| Média da turma Workstation (21.5 - 152.4, n=23, últimos 2 anos) | |
| Lenovo ThinkPad P1 Gen 8 | |
| HP ZBook X G1i 16 | |
| Lenovo ThinkPad P16v G3 21RS000DGE | |
| HP ZBook Power 16 G11 A | |
| Lenovo ThinkPad P16s Gen 4 21RX000YGE | |
| Baldur's Gate 3 - 1920x1080 Ultra Preset AA:T | |
| Lenovo ThinkPad P1 Gen 8 | |
| Média da turma Workstation (23.7 - 205, n=24, últimos 2 anos) | |
| HP ZBook X G1i 16 | |
| Lenovo ThinkPad P16v G3 21RS000DGE | |
| HP ZBook Power 16 G11 A | |
| Lenovo ThinkPad P16s Gen 4 21RX000YGE | |
| GTA V - 1920x1080 Highest AA:4xMSAA + FX AF:16x | |
| Lenovo ThinkPad P1 Gen 8 | |
| Lenovo ThinkPad P16v G3 21RS000DGE | |
| HP ZBook X G1i 16 | |
| Média da turma Workstation (18.1 - 156.1, n=23, últimos 2 anos) | |
| HP ZBook Power 16 G11 A | |
| Lenovo ThinkPad P16s Gen 4 21RX000YGE | |
| Final Fantasy XV Benchmark - 1920x1080 High Quality | |
| Lenovo ThinkPad P1 Gen 8 | |
| Média da turma Workstation (26.4 - 197.6, n=23, últimos 2 anos) | |
| HP ZBook X G1i 16 | |
| Lenovo ThinkPad P16v G3 21RS000DGE | |
| HP ZBook Power 16 G11 A | |
| Lenovo ThinkPad P16s Gen 4 21RX000YGE | |
| Strange Brigade - 1920x1080 ultra AA:ultra AF:16 | |
| Média da turma Workstation (93.2 - 418, n=17, últimos 2 anos) | |
| Lenovo ThinkPad P1 Gen 8 | |
| HP ZBook X G1i 16 | |
| Lenovo ThinkPad P16v G3 21RS000DGE | |
| HP ZBook Power 16 G11 A | |
| Dota 2 Reborn - 1920x1080 ultra (3/3) best looking | |
| Lenovo ThinkPad P16v G3 21RS000DGE | |
| HP ZBook X G1i 16 | |
| Média da turma Workstation (50.7 - 178.4, n=23, últimos 2 anos) | |
| Lenovo ThinkPad P1 Gen 8 | |
| HP ZBook Power 16 G11 A | |
| Lenovo ThinkPad P16s Gen 4 21RX000YGE | |
Gráfico de ultra FPS do Cyberpunk 2077
| baixo | média | alto | ultra | |
|---|---|---|---|---|
| GTA V (2015) | 174.7 | 117.7 | ||
| Dota 2 Reborn (2015) | 174.2 | 159.8 | 151.6 | 142.8 |
| Final Fantasy XV Benchmark (2018) | 199.5 | 127.3 | 98.1 | |
| X-Plane 11.11 (2018) | 105.4 | 95.2 | 78.8 | |
| Strange Brigade (2018) | 469 | 241 | 194.1 | 167.8 |
| Baldur's Gate 3 (2023) | 121.3 | 96 | 81.4 | 81.2 |
| Cyberpunk 2077 (2023) | 119.5 | 93.5 | 79.1 | 70.1 |
| F1 24 (2024) | 200 | 194.8 | 165.5 | 53.3 |
Emissões e energia
Emissões de ruído

A unidade de resfriamento permanece muito silenciosa durante as tarefas diárias (máx. 29,2 dB(A)), mas fica visivelmente mais barulhenta quando os componentes são submetidos a uma pressão maior. No modo Melhor Desempenho, medimos 47,1 dB(A) durante os jogos e o teste de estresse(Equilibrado: 43,2 dB(A), Melhor Eficiência Energética: 39,9 dB(A), bateria: 37 dB(A)).
Barulho
| Ocioso |
| 25.9 / 25.9 / 29.2 dB |
| Carga |
| 37.5 / 47.1 dB |
 | ||
30 dB silencioso 40 dB(A) audível 50 dB(A) ruidosamente alto |
||
min: | ||
| Lenovo ThinkPad P16v G3 21RS000DGE Ultra 7 255H, RTX PRO 2000 Blackwell Generation Laptop | Lenovo ThinkPad P1 Gen 8 Ultra 7 255H, RTX PRO 2000 Blackwell Generation Laptop | HP ZBook X G1i 16 Ultra 7 265H, RTX PRO 2000 Blackwell Generation Laptop | HP ZBook Power 16 G11 A R7 8845HS, RTX 2000 Ada Generation Laptop | Lenovo ThinkPad P16s Gen 4 21RX000YGE Ryzen AI 9 HX PRO 370, Radeon 890M | |
|---|---|---|---|---|---|
| Noise | 13% | 7% | 12% | -3% | |
| desligado / ambiente * (dB) | 25.9 | 23.1 11% | 23.7 8% | 23.5 9% | 25.9 -0% |
| Idle Minimum * (dB) | 25.9 | 23.1 11% | 23.7 8% | 23.8 8% | 25.9 -0% |
| Idle Average * (dB) | 25.9 | 23.1 11% | 23.7 8% | 24.2 7% | 25.9 -0% |
| Idle Maximum * (dB) | 29.2 | 23.1 21% | 23.7 19% | 24.2 17% | 28.5 2% |
| Load Average * (dB) | 37.5 | 27.3 27% | 32.7 13% | 25.4 32% | 42.9 -14% |
| Cyberpunk 2077 ultra * (dB) | 47.1 | 50.9 -8% | 43 9% | 48.7 -3% | |
| Load Maximum * (dB) | 47.1 | 47.9 -2% | 48 -2% | 45 4% | 48.5 -3% |
* ... menor é melhor
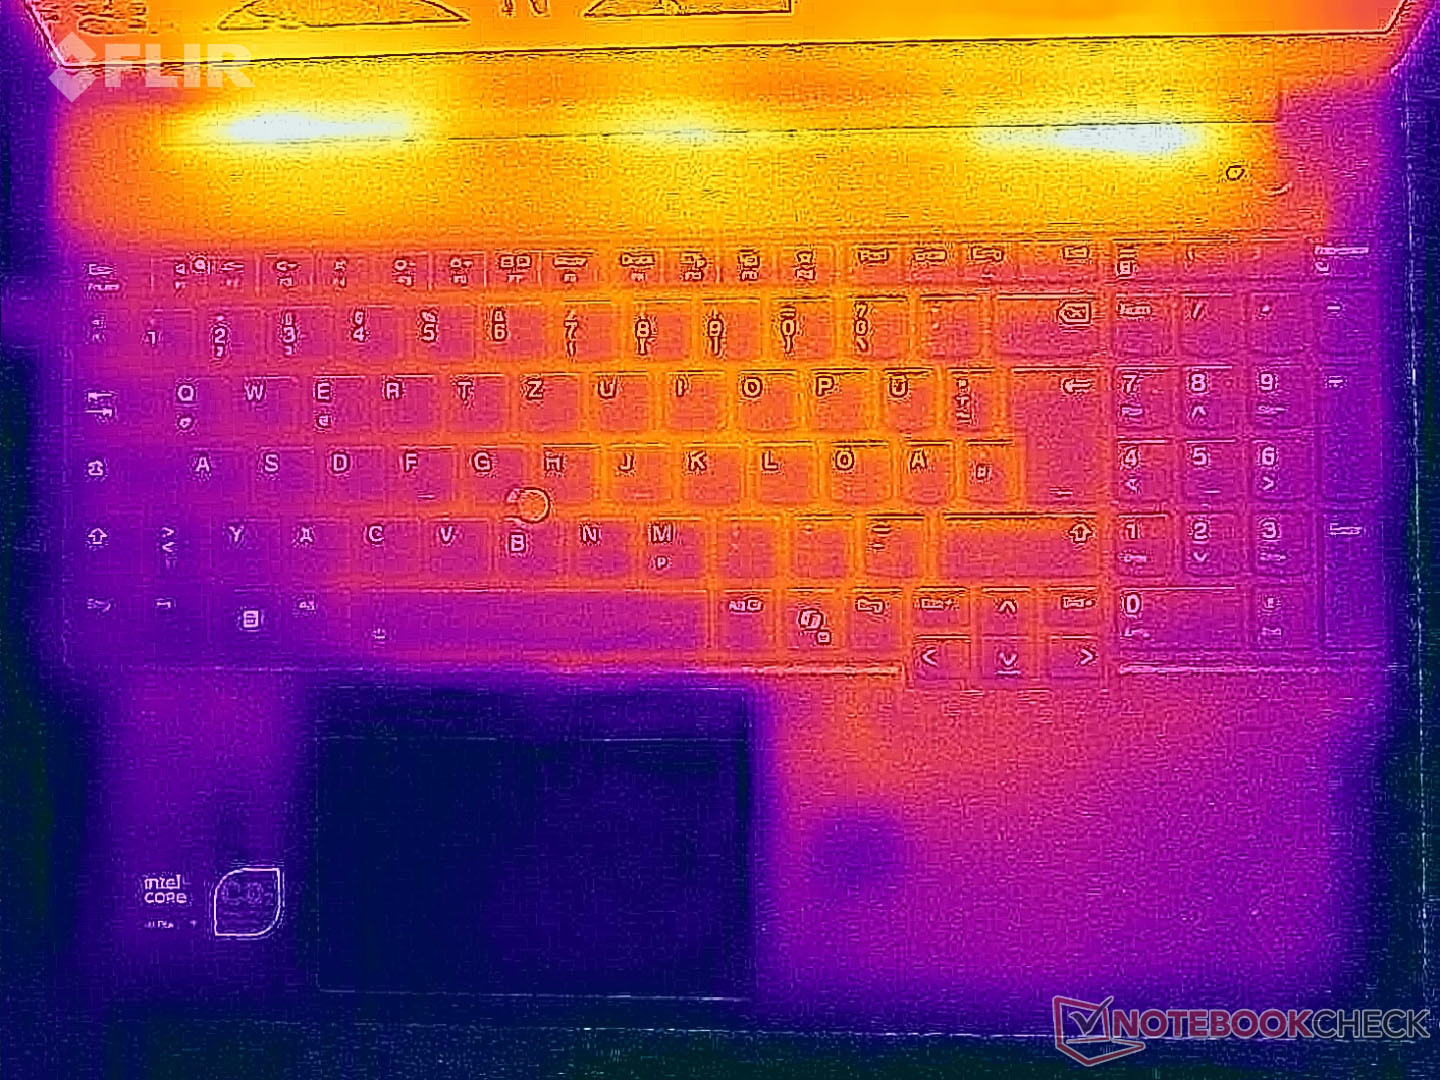
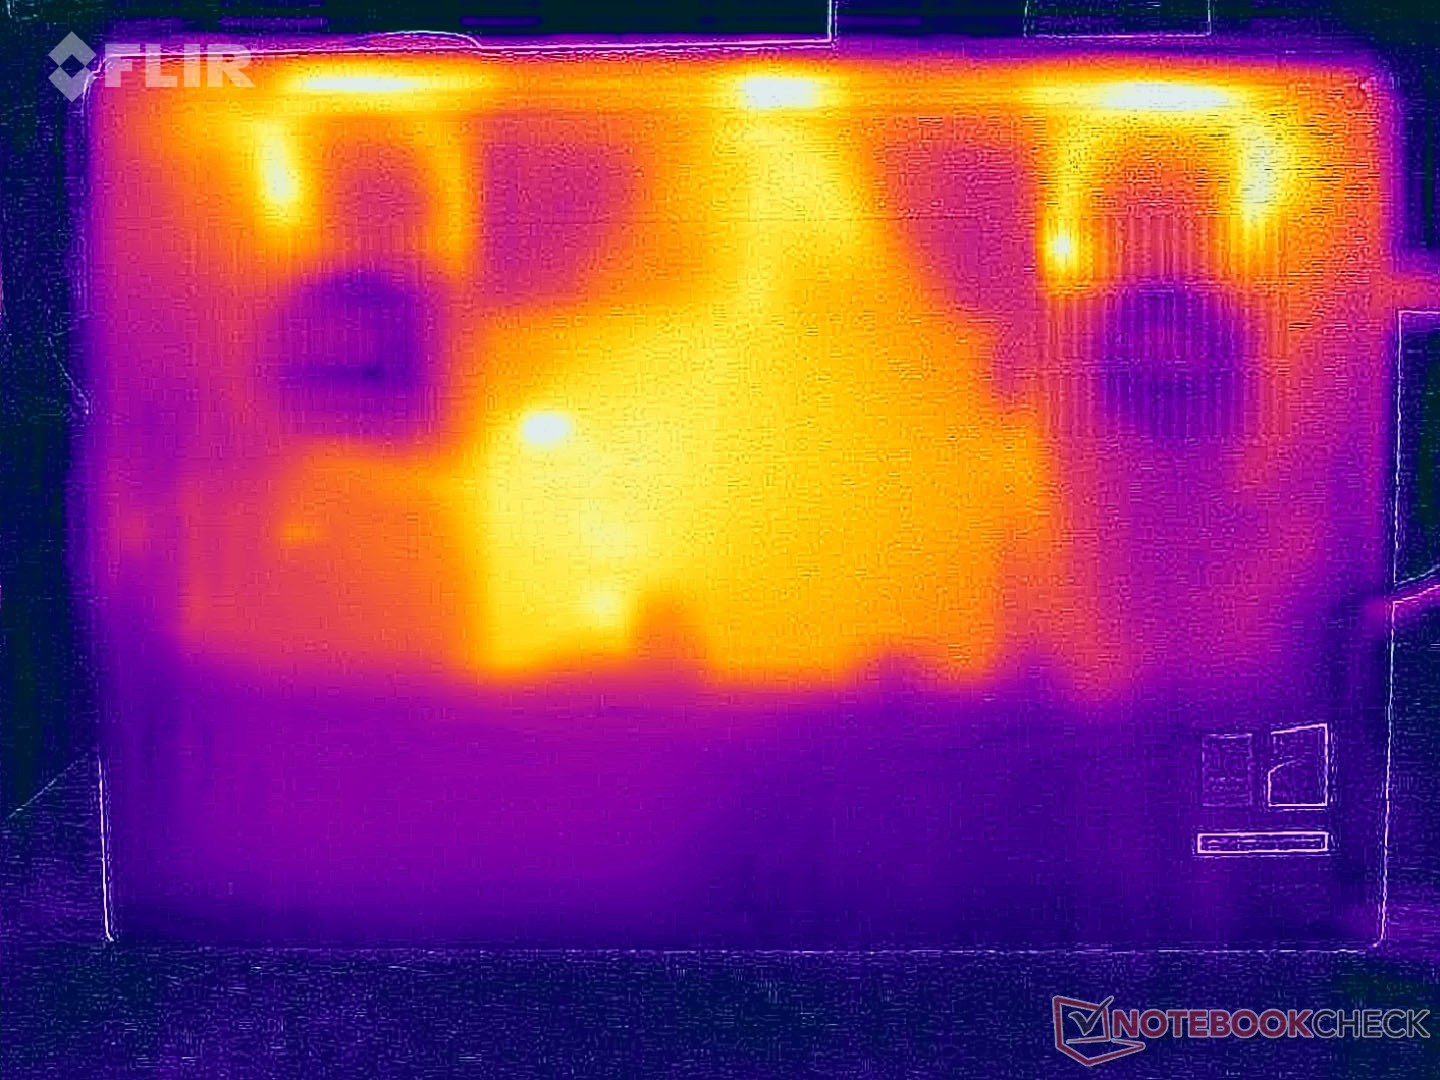
Temperatura
As temperaturas da superfície permanecem completamente inofensivas mesmo no teste de estresse, pois medimos apenas um pouco menos de 45 °C (113 °F) em um ponto na parte inferior; os outros pontos de medição permanecem visivelmente mais frios. No teste de estresse, o processador se estabilizou em ~34 watts (81 °C/177,8 °F) e a GPU em ~55 watts (76 °C/168,8 °F). Isso não é particularmente alto, considerando a caixa grande.

(+) A temperatura máxima no lado superior é 39.9 °C / 104 F, em comparação com a média de 38.2 °C / 101 F , variando de 22.2 a 69.8 °C para a classe Workstation.
(±) A parte inferior aquece até um máximo de 44.8 °C / 113 F, em comparação com a média de 41.1 °C / 106 F
(+) Em uso inativo, a temperatura média para o lado superior é 23.5 °C / 74 F, em comparação com a média do dispositivo de 32 °C / ### class_avg_f### F.
(±) 3: The average temperature for the upper side is 33 °C / 91 F, compared to the average of 32 °C / 90 F for the class Workstation.
(+) Os apoios para as mãos e o touchpad estão atingindo a temperatura máxima da pele (32.1 °C / 89.8 F) e, portanto, não estão quentes.
(-) A temperatura média da área do apoio para as mãos de dispositivos semelhantes foi 27.8 °C / 82 F (-4.3 °C / -7.8 F).
| Lenovo ThinkPad P16v G3 21RS000DGE Ultra 7 255H, RTX PRO 2000 Blackwell Generation Laptop | Lenovo ThinkPad P1 Gen 8 Ultra 7 255H, RTX PRO 2000 Blackwell Generation Laptop | HP ZBook X G1i 16 Ultra 7 265H, RTX PRO 2000 Blackwell Generation Laptop | HP ZBook Power 16 G11 A R7 8845HS, RTX 2000 Ada Generation Laptop | Lenovo ThinkPad P16s Gen 4 21RX000YGE Ryzen AI 9 HX PRO 370, Radeon 890M | |
|---|---|---|---|---|---|
| Heat | -10% | -8% | -2% | -37% | |
| Maximum Upper Side * (°C) | 39.9 | 45 -13% | 36 10% | 40.6 -2% | 50.6 -27% |
| Maximum Bottom * (°C) | 44.8 | 33 26% | 39.4 12% | 40.6 9% | 54.3 -21% |
| Idle Upper Side * (°C) | 24 | 30.6 -28% | 30.4 -27% | 26 -8% | 35.3 -47% |
| Idle Bottom * (°C) | 25 | 31.6 -26% | 31.8 -27% | 26.6 -6% | 38.5 -54% |
* ... menor é melhor
Alto-falantes
Os alto-falantes estéreo são pouco convincentes; o ThinkPad P1 16 G8 tem uma clara vantagem.
Lenovo ThinkPad P16v G3 21RS000DGE análise de áudio
(±) | o volume do alto-falante é médio, mas bom (###valor### dB)
Graves 100 - 315Hz
(±) | graves reduzidos - em média 10.7% menor que a mediana
(±) | a linearidade dos graves é média (10% delta para a frequência anterior)
Médios 400 - 2.000 Hz
(±) | médios mais altos - em média 7.2% maior que a mediana
(+) | médios são lineares (5.3% delta para frequência anterior)
Altos 2 - 16 kHz
(+) | agudos equilibrados - apenas 1.3% longe da mediana
(+) | os máximos são lineares (3.8% delta da frequência anterior)
Geral 100 - 16.000 Hz
(±) | a linearidade do som geral é média (15.6% diferença em relação à mediana)
Comparado com a mesma classe
» 35% de todos os dispositivos testados nesta classe foram melhores, 11% semelhantes, 54% piores
» O melhor teve um delta de 7%, a média foi 17%, o pior foi 35%
Comparado com todos os dispositivos testados
» 23% de todos os dispositivos testados foram melhores, 5% semelhantes, 72% piores
» O melhor teve um delta de 4%, a média foi 23%, o pior foi 134%
Lenovo ThinkPad P1 Gen 8 análise de áudio
(+) | os alto-falantes podem tocar relativamente alto (###valor### dB)
Graves 100 - 315Hz
(±) | graves reduzidos - em média 9.8% menor que a mediana
(±) | a linearidade dos graves é média (11.2% delta para a frequência anterior)
Médios 400 - 2.000 Hz
(+) | médios equilibrados - apenas 2.9% longe da mediana
(+) | médios são lineares (2.8% delta para frequência anterior)
Altos 2 - 16 kHz
(+) | agudos equilibrados - apenas 3% longe da mediana
(+) | os máximos são lineares (4.7% delta da frequência anterior)
Geral 100 - 16.000 Hz
(+) | o som geral é linear (8.3% diferença em relação à mediana)
Comparado com a mesma classe
» 1% de todos os dispositivos testados nesta classe foram melhores, 1% semelhantes, 97% piores
» O melhor teve um delta de 7%, a média foi 17%, o pior foi 35%
Comparado com todos os dispositivos testados
» 2% de todos os dispositivos testados foram melhores, 1% semelhantes, 97% piores
» O melhor teve um delta de 4%, a média foi 23%, o pior foi 134%
HP ZBook X G1i 16 análise de áudio
(+) | os alto-falantes podem tocar relativamente alto (###valor### dB)
Graves 100 - 315Hz
(-) | quase nenhum baixo - em média 28% menor que a mediana
(±) | a linearidade dos graves é média (8.8% delta para a frequência anterior)
Médios 400 - 2.000 Hz
(+) | médios equilibrados - apenas 1.9% longe da mediana
(+) | médios são lineares (6.1% delta para frequência anterior)
Altos 2 - 16 kHz
(+) | agudos equilibrados - apenas 2.9% longe da mediana
(+) | os máximos são lineares (5.1% delta da frequência anterior)
Geral 100 - 16.000 Hz
(±) | a linearidade do som geral é média (15.6% diferença em relação à mediana)
Comparado com a mesma classe
» 35% de todos os dispositivos testados nesta classe foram melhores, 11% semelhantes, 54% piores
» O melhor teve um delta de 7%, a média foi 17%, o pior foi 35%
Comparado com todos os dispositivos testados
» 23% de todos os dispositivos testados foram melhores, 5% semelhantes, 72% piores
» O melhor teve um delta de 4%, a média foi 23%, o pior foi 134%
HP ZBook Power 16 G11 A análise de áudio
(+) | os alto-falantes podem tocar relativamente alto (###valor### dB)
Graves 100 - 315Hz
(-) | quase nenhum baixo - em média 28.1% menor que a mediana
(±) | a linearidade dos graves é média (9% delta para a frequência anterior)
Médios 400 - 2.000 Hz
(+) | médios equilibrados - apenas 1.9% longe da mediana
(+) | médios são lineares (4.8% delta para frequência anterior)
Altos 2 - 16 kHz
(+) | agudos equilibrados - apenas 3.6% longe da mediana
(+) | os máximos são lineares (2.4% delta da frequência anterior)
Geral 100 - 16.000 Hz
(±) | a linearidade do som geral é média (15.1% diferença em relação à mediana)
Comparado com a mesma classe
» 33% de todos os dispositivos testados nesta classe foram melhores, 7% semelhantes, 60% piores
» O melhor teve um delta de 7%, a média foi 17%, o pior foi 35%
Comparado com todos os dispositivos testados
» 21% de todos os dispositivos testados foram melhores, 4% semelhantes, 75% piores
» O melhor teve um delta de 4%, a média foi 23%, o pior foi 134%
Lenovo ThinkPad P16s Gen 4 21RX000YGE análise de áudio
(±) | o volume do alto-falante é médio, mas bom (###valor### dB)
Graves 100 - 315Hz
(-) | quase nenhum baixo - em média 15.7% menor que a mediana
(±) | a linearidade dos graves é média (11.9% delta para a frequência anterior)
Médios 400 - 2.000 Hz
(±) | médios mais altos - em média 5.8% maior que a mediana
(+) | médios são lineares (5.9% delta para frequência anterior)
Altos 2 - 16 kHz
(+) | agudos equilibrados - apenas 1.5% longe da mediana
(+) | os máximos são lineares (4.6% delta da frequência anterior)
Geral 100 - 16.000 Hz
(±) | a linearidade do som geral é média (16.2% diferença em relação à mediana)
Comparado com a mesma classe
» 43% de todos os dispositivos testados nesta classe foram melhores, 7% semelhantes, 50% piores
» O melhor teve um delta de 7%, a média foi 17%, o pior foi 35%
Comparado com todos os dispositivos testados
» 26% de todos os dispositivos testados foram melhores, 6% semelhantes, 68% piores
» O melhor teve um delta de 4%, a média foi 23%, o pior foi 134%
Consumo de energia

O consumo máximo no modo inativo é de 12,7 watts, o que é relativamente alto considerando a baixa resolução da tela. Medimos brevemente ~140 watts no teste de estresse, mas isso rapidamente se estabilizou em ~120 watts. A fonte de alimentação de 140 watts é, portanto, suficientemente dimensionada.
| desligado | |
| Ocioso | |
| Carga |
|
Key:
min: | |
| Lenovo ThinkPad P16v G3 21RS000DGE Ultra 7 255H, RTX PRO 2000 Blackwell Generation Laptop, Samsung PM9E1 1 TB MZVLC1T0HFLU, IPS, 1920x1200, 16" | Lenovo ThinkPad P1 Gen 8 Ultra 7 255H, RTX PRO 2000 Blackwell Generation Laptop, Samsung PM9E1 1 TB MZVLC1T0HFLU, Tandem OLED, 3200x2000, 16" | HP ZBook X G1i 16 Ultra 7 265H, RTX PRO 2000 Blackwell Generation Laptop, Samsung PM9A1 MZVL22T0HBLB, IPS, 2560x1600, 16" | HP ZBook Power 16 G11 A R7 8845HS, RTX 2000 Ada Generation Laptop, Samsung PM9A1 MZVL22T0HBLB, IPS, 2560x1600, 16" | Lenovo ThinkPad P16s Gen 4 21RX000YGE Ryzen AI 9 HX PRO 370, Radeon 890M, Micron 3500 1TB MTFDKBA1T0TGD, IPS LED, 1920x1200, 16" | Média NVIDIA RTX PRO 2000 Blackwell Generation Laptop | Média da turma Workstation | |
|---|---|---|---|---|---|---|---|
| Power Consumption | -50% | 12% | 14% | 41% | -18% | -36% | |
| Idle Minimum * (Watt) | 4.8 | 15.4 -221% | 4.1 15% | 4.6 4% | 3.9 19% | 8.1 ? -69% | 9.11 ? -90% |
| Idle Average * (Watt) | 12.3 | 16.5 -34% | 9 27% | 10 19% | 8.3 33% | 12.6 ? -2% | 13.8 ? -12% |
| Idle Maximum * (Watt) | 12.7 | 23.1 -82% | 9.4 26% | 10.6 17% | 8.7 31% | 15.1 ? -19% | 17.9 ? -41% |
| Load Average * (Watt) | 89.6 | 86.6 3% | 86.7 3% | 60.9 32% | 51.6 42% | 87.6 ? 2% | 96 ? -7% |
| Cyberpunk 2077 ultra external monitor * (Watt) | 115.8 | 121.8 -5% | 102 12% | 92.8 20% | 54.6 53% | ||
| Cyberpunk 2077 ultra * (Watt) | 115.1 | 123.1 -7% | 106.1 8% | 96.8 16% | 55.4 52% | ||
| Load Maximum * (Watt) | 139.5 | 143.6 -3% | 152.9 -10% | 154.8 -11% | 63.7 54% | 145.3 ? -4% | 180.3 ? -29% |
* ... menor é melhor
Consumo de energia Cyberpunk / Teste de estresse
Consumo de energia com monitor externo
Duração da bateria
Com a bateria de 90 Wh, medimos 14:11 horas (150 cd/m²) e 8:51 horas (brilho total) no teste WLAN, o que são bons resultados.

| Lenovo ThinkPad P16v G3 21RS000DGE Ultra 7 255H, RTX PRO 2000 Blackwell Generation Laptop, 90 Wh | Lenovo ThinkPad P1 Gen 8 Ultra 7 255H, RTX PRO 2000 Blackwell Generation Laptop, 90 Wh | HP ZBook X G1i 16 Ultra 7 265H, RTX PRO 2000 Blackwell Generation Laptop, 83 Wh | HP ZBook Power 16 G11 A R7 8845HS, RTX 2000 Ada Generation Laptop, 83 Wh | Lenovo ThinkPad P16s Gen 4 21RX000YGE Ryzen AI 9 HX PRO 370, Radeon 890M, 86 Wh | Média da turma Workstation | |
|---|---|---|---|---|---|---|
| Battery Runtime | -61% | -12% | -32% | -2% | -30% | |
| WiFi Websurfing (h) | 14.2 | 5.5 -61% | 12.5 -12% | 9.7 -32% | 13.9 -2% | 8.55 ? -40% |
| WiFi Websurfing max. Brightness (h) | 8.9 | 7.17 ? -19% |
Avaliação geral do Notebookcheck
Lenovo ThinkPad P16v G3 21RS000DGE
- 01/14/2026 v8
Andreas Osthoff
 Total Sustainability Score:
 Possíveis alternativas em comparação
Imagem | Modelo / Análises | Preço | Peso | Altura | Tela |
|---|---|---|---|---|---|
1. 87.3%  | Lenovo ThinkPad P16v G3 21RS000DGE Intel Core Ultra 7 255H ⎘ NVIDIA RTX PRO 2000 Blackwell Generation Laptop ⎘ 32 GB Memória, 1024 GB SSD | Amazon: Preço de tabela: 2825€ | 2.2 kg | 19.6 mm | 16.00" 1920x1200 IPS |
2. 91.6%  | Lenovo ThinkPad P1 Gen 8 Intel Core Ultra 7 255H ⎘ NVIDIA RTX PRO 2000 Blackwell Generation Laptop ⎘ 32 GB Memória, 1024 GB SSD | Amazon: Preço de tabela: 2000 USD | 1.9 kg | 20.6 mm | 16.00" 3200x2000 236 PPI Tandem OLED |
3. 87.4%  | HP ZBook X G1i 16 Intel Core Ultra 7 265H ⎘ NVIDIA RTX PRO 2000 Blackwell Generation Laptop ⎘ 64 GB Memória, 2048 GB SSD | Amazon: Preço de tabela: 2700 USD | 2.2 kg | 23 mm | 16.00" 2560x1600 189 PPI IPS |
4. 85.4%  | HP ZBook Power 16 G11 A AMD Ryzen 7 8845HS ⎘ NVIDIA RTX 2000 Ada Generation Laptop ⎘ 64 GB Memória, 2048 GB SSD | Amazon: Preço de tabela: 2100 USD | 2.2 kg | 22.9 mm | 16.00" 2560x1600 189 PPI IPS |
5. 82%  | Lenovo ThinkPad P16s Gen 4 21RX000YGE AMD Ryzen AI 9 HX PRO 370 ⎘ AMD Radeon 890M ⎘ 64 GB Memória, 1024 GB SSD | Amazon: Preço de tabela: 2440 Euro | 2 kg | 23 mm | 16.00" 1920x1200 142 PPI IPS LED |
Transparência
A seleção dos dispositivos a serem analisados é feita pela nossa equipe editorial. A amostra de teste foi fornecida ao autor como empréstimo pelo fabricante ou varejista para fins desta revisão. O credor não teve influência nesta revisão, nem o fabricante recebeu uma cópia desta revisão antes da publicação. Não houve obrigação de publicar esta revisão. Como empresa de mídia independente, a Notebookcheck não está sujeita à autoridade de fabricantes, varejistas ou editores.
É assim que o Notebookcheck está testando
Todos os anos, o Notebookcheck analisa de forma independente centenas de laptops e smartphones usando procedimentos padronizados para garantir que todos os resultados sejam comparáveis. Desenvolvemos continuamente nossos métodos de teste há cerca de 20 anos e definimos padrões da indústria no processo. Em nossos laboratórios de teste, equipamentos de medição de alta qualidade são utilizados por técnicos e editores experientes. Esses testes envolvem um processo de validação em vários estágios. Nosso complexo sistema de classificação é baseado em centenas de medições e benchmarks bem fundamentados, o que mantém a objetividade.