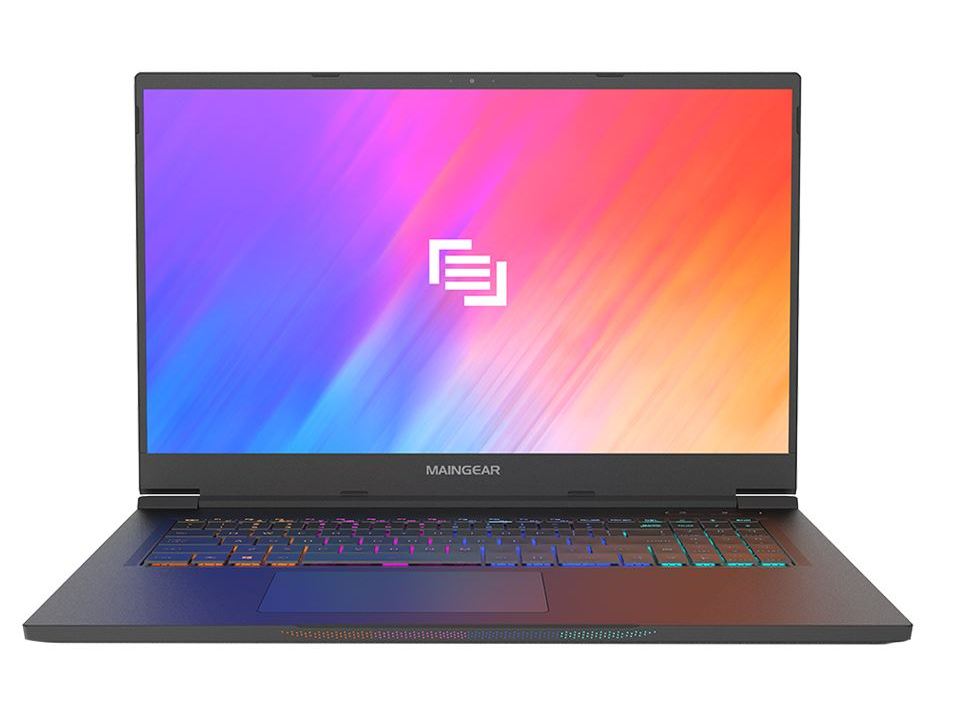
Revisão do laptop Maingear Vector Pro MG-VCP17: 165 W GeForce RTX 3080 para tamanho ultraleve
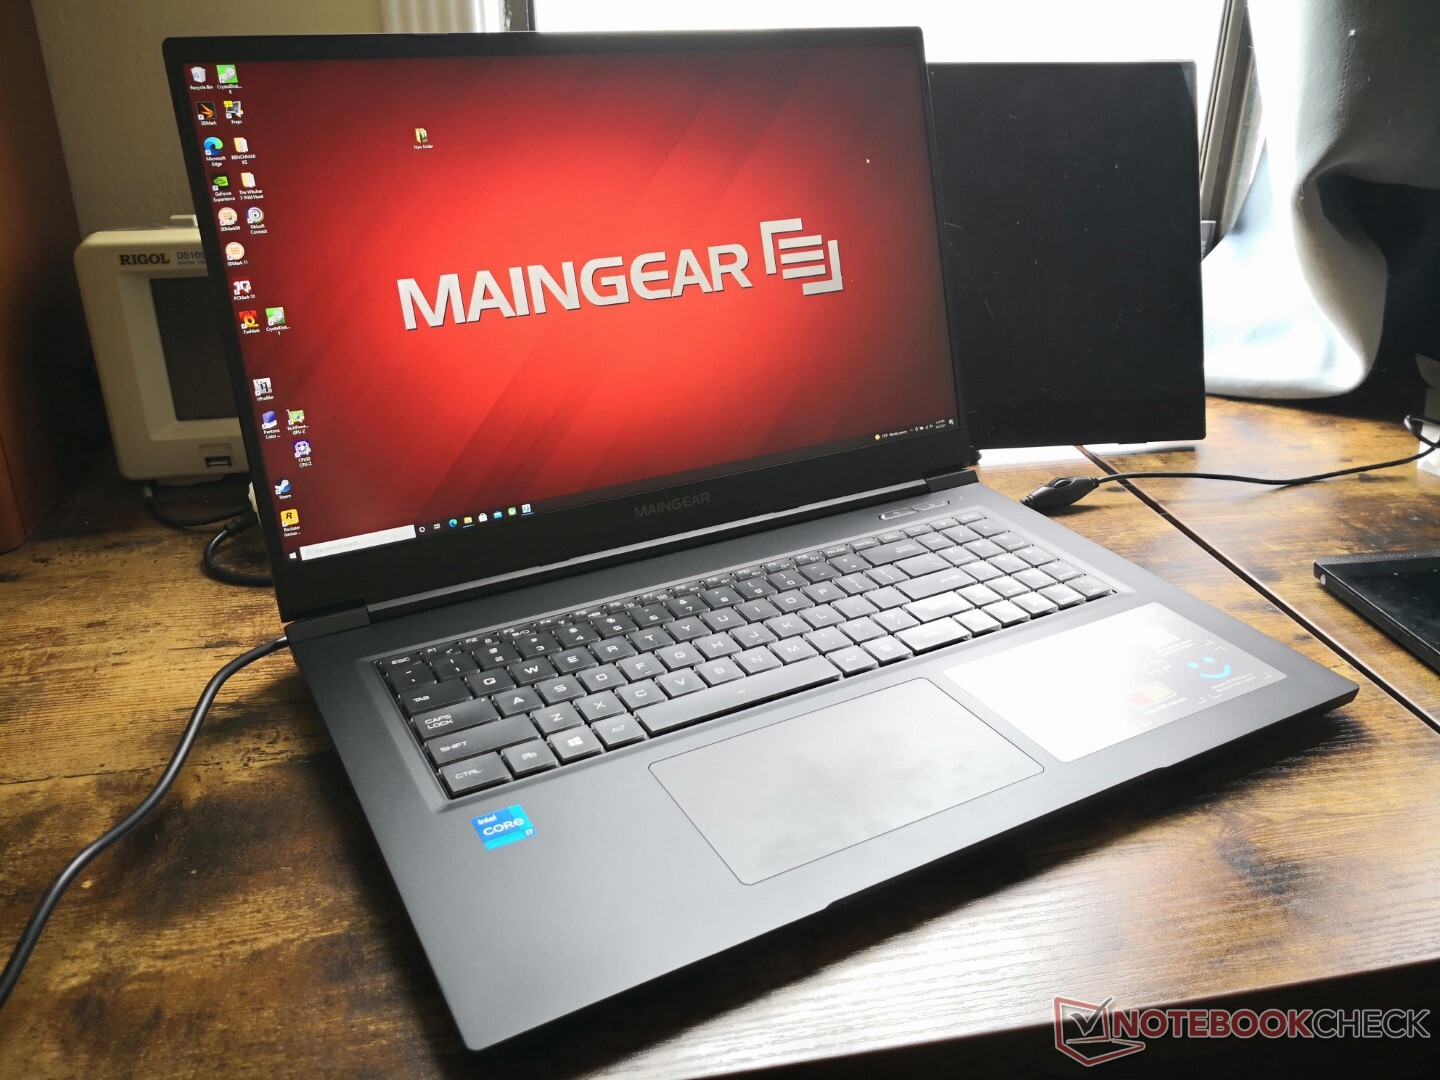
O Vector Pro é um laptop para jogos ultra-fino de 17,3 polegadas do construtor de PCs Maingear personalizado. É um sistema ultra-fino de alto desempenho na mesma veia que o MSI GS75, Razer Blade Pro, Asus Zephyrus S17, ou Dell Alienware série x17.
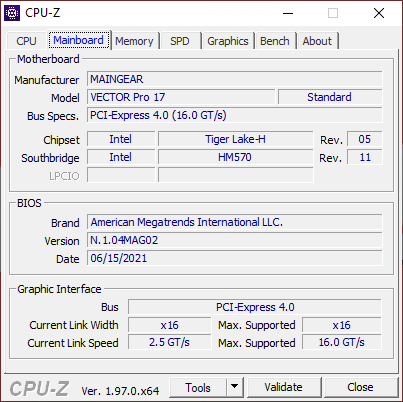
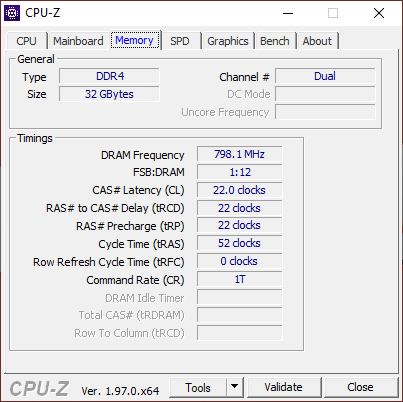
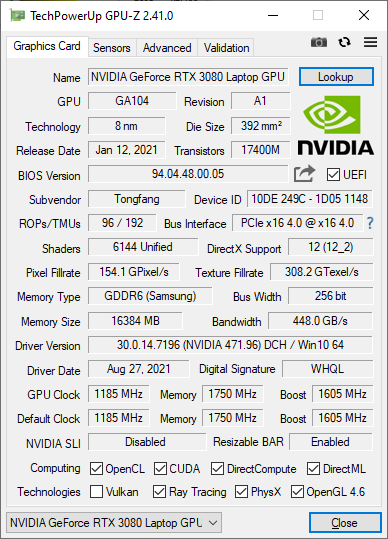
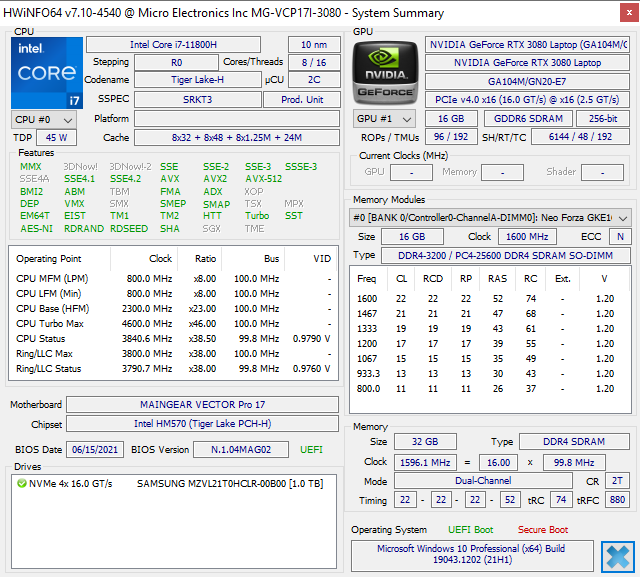
Nossa unidade de teste foi totalmente configurada com o processador Core i7-11800H da 11ª geração, 165 W GeForce RTX 3080 GPU, e 165 Hz 1440p IPS display por aproximadamente $2500 USD no varejo. SKUs menores a serem disponibilizadas com o RTX 3070 para preços iniciais mais baixos
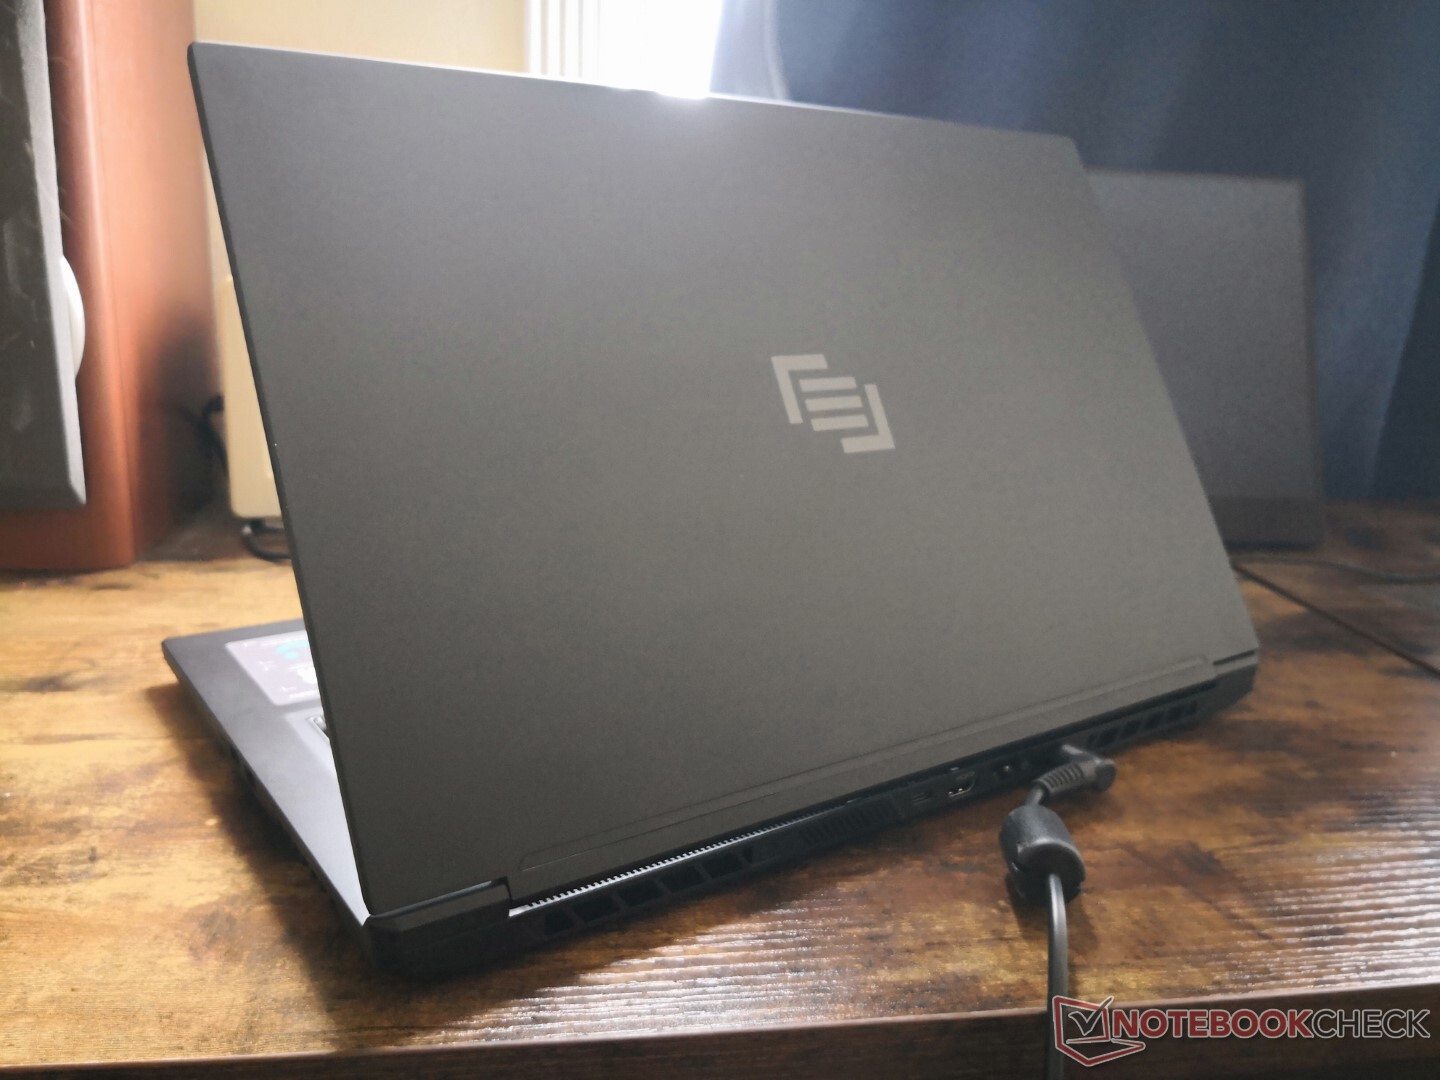
Vale ressaltar que o Vector Pro utiliza um chassi Tongfang com etiqueta branca. Assim, os usuários podem encontrar designs e características muito similares de outros revendedores, como o Schenker XMG Neo 17 ouXMG Core 17.
potential competitors in comparison
Avaliação | Data | Modelo | Peso | Altura | Size | Resolução | Preço |
|---|---|---|---|---|---|---|---|
| 87.8 % v7 (old) | 09/2021 | Maingear Vector Pro MG-VCP17 i7-11800H, GeForce RTX 3080 Laptop GPU | 2.3 kg | 19.81 mm | 17.30" | 2560x1440 | |
| 90.1 % v7 (old) | 07/2021 | Asus ROG Zephyrus S17 GX703HSD i9-11900H, GeForce RTX 3080 Laptop GPU | 2.8 kg | 19.9 mm | 17.30" | 2560x1440 | |
| 83.9 % v7 (old) | 06/2021 | Schenker XMG Core 17 (Early 2021) i7-10870H, GeForce RTX 3060 Laptop GPU | 2.5 kg | 30.05 mm | 17.30" | 2560x1440 | |
| 85.1 % v7 (old) | 01/2021 | Schenker XMG Neo 17 (Early 2021, RTX 3070, 5800H) R7 5800H, GeForce RTX 3070 Laptop GPU | 2.5 kg | 27 mm | 17.30" | 2560x1440 | |
| 84 % v7 (old) | 12/2020 | Schenker Compact 17 i7-10875H, GeForce RTX 2070 Super Mobile | 2.9 kg | 29.9 mm | 17.30" | 3840x2160 | |
| 83.7 % v7 (old) | 08/2020 | MSI GS75 10SF-609US i7-10875H, GeForce RTX 2070 Max-Q | 2.3 kg | 18.9 mm | 17.30" | 1920x1080 |
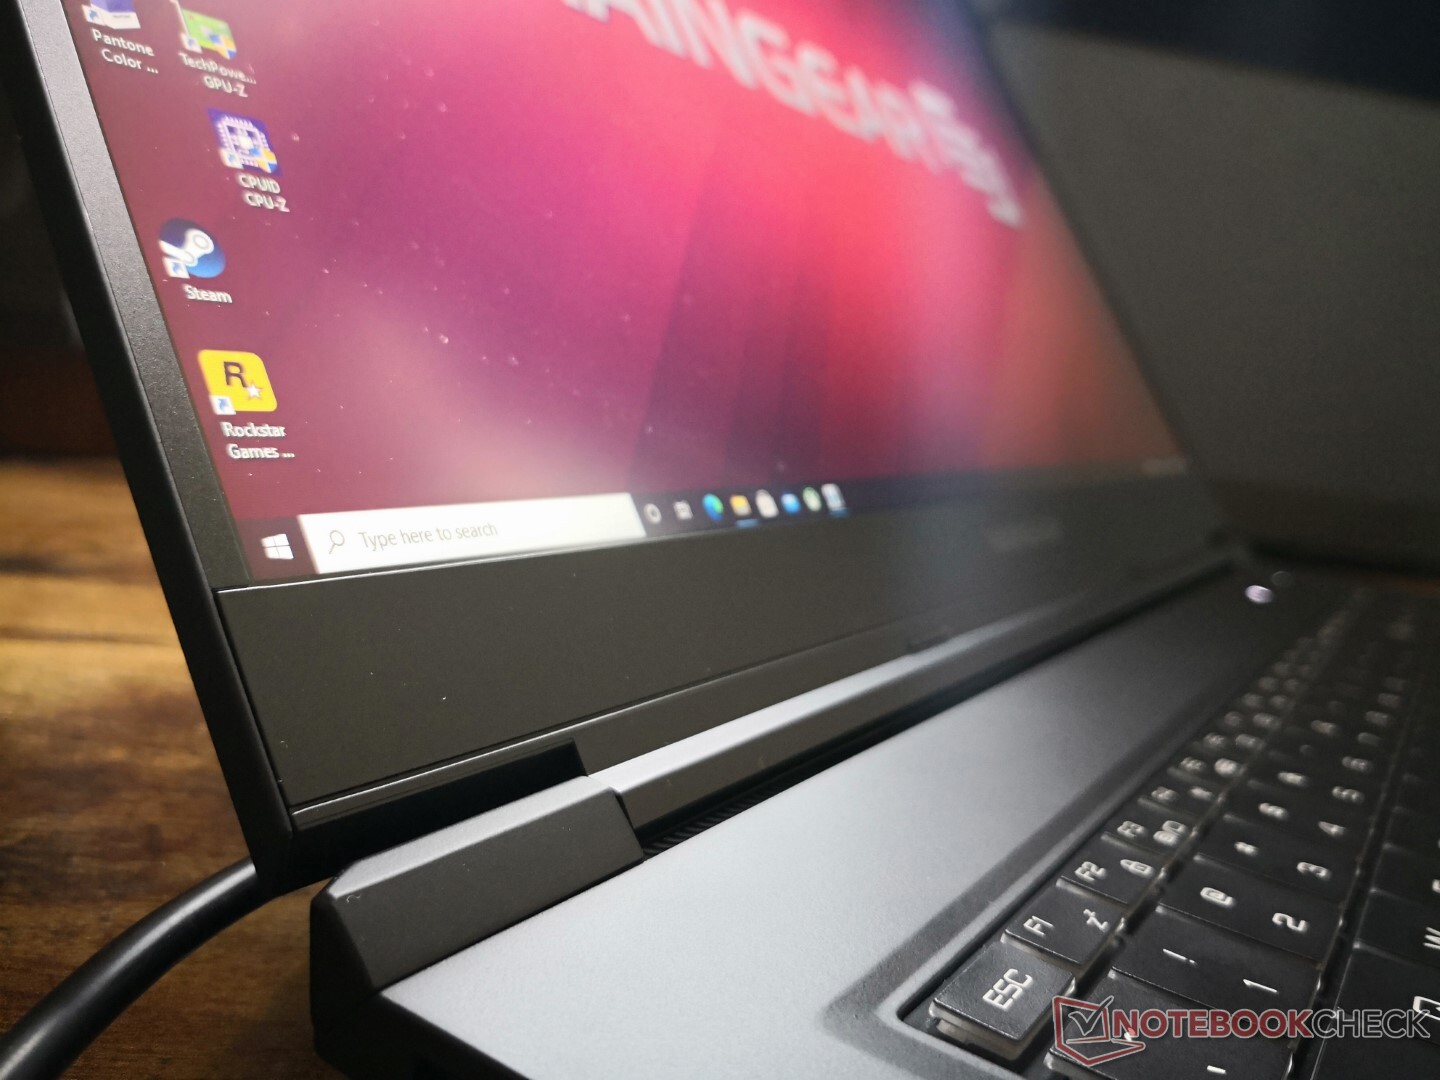
Caso
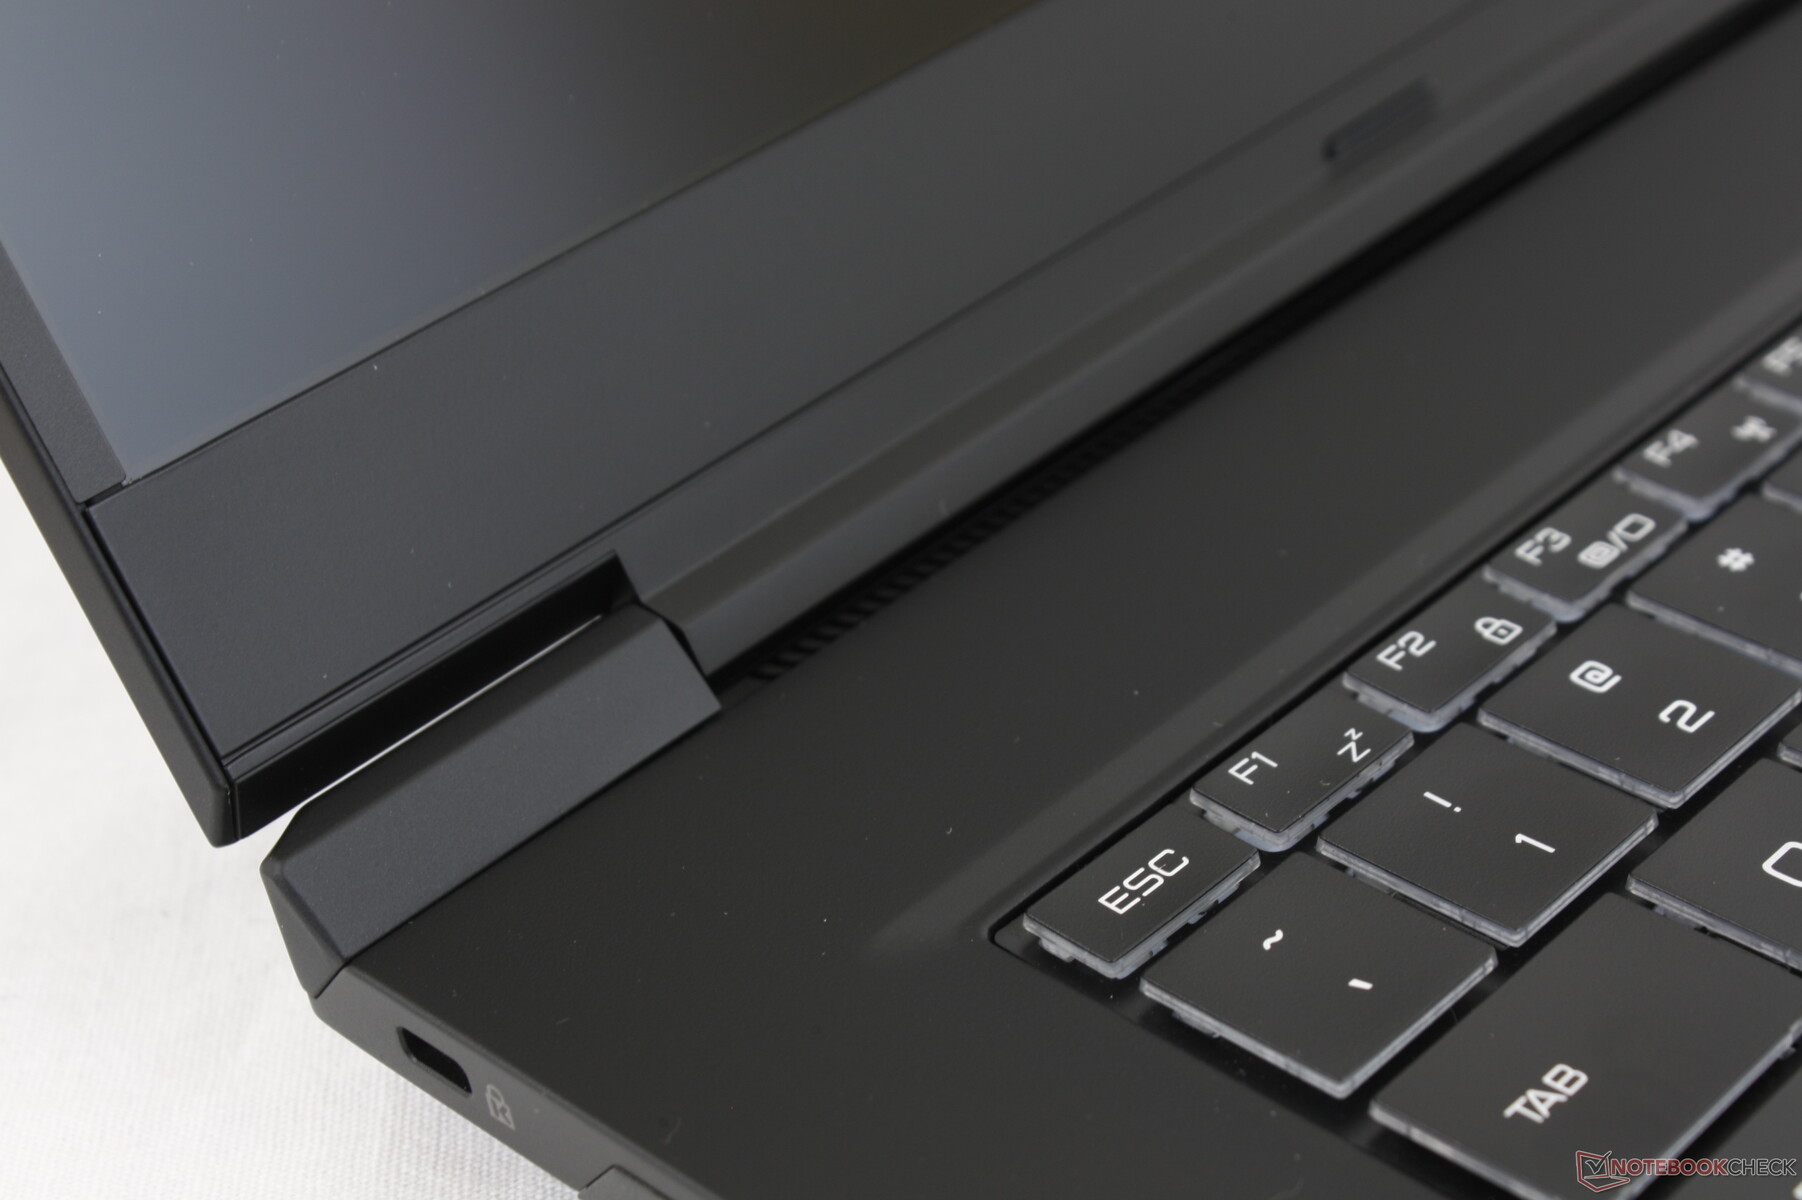
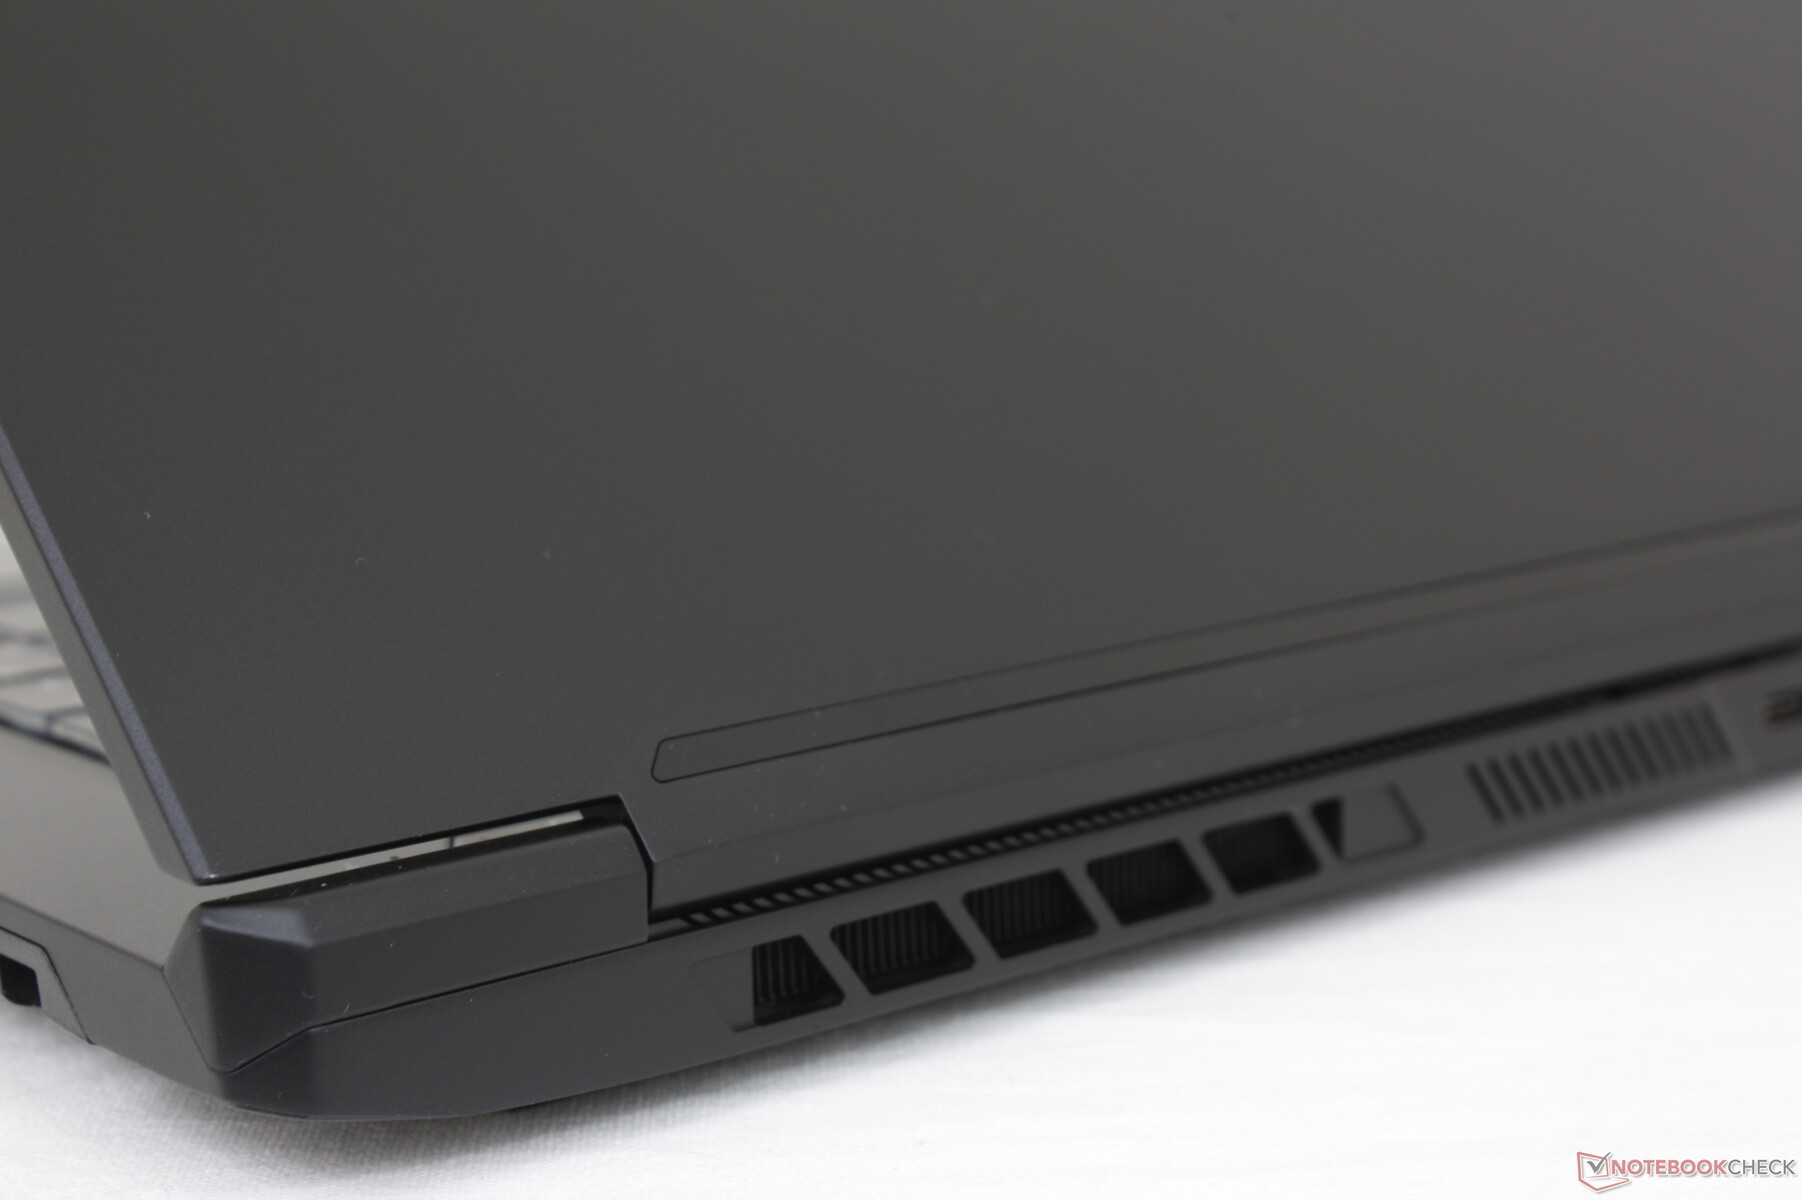
O chassi pode não ser tão chamativo como um Asus Zephyrus S ou MSI GS75, mas certamente se sente mais forte e mais rígido. A base não cede ou ranger quando se tenta torcer os cantos para obter primeiras impressões fortes. A tampa e as dobradiças, no entanto, poderiam ter sido mais rígidas para reduzir o têmpera ao ajustar os ângulos. Quanto mais espessos, mais Asus ROG Strix os laptops têm dobradiças maiores para uma melhor sensação de longevidade.
As dimensões são quase idênticas às da Razer Blade Pro. O peso, entretanto, é quase meio quilograma mais leve em favor do Razer Blade Pro. A falta de um resfriador de câmara de vapor no Maingear é provavelmente responsável pelo peso mais leve.
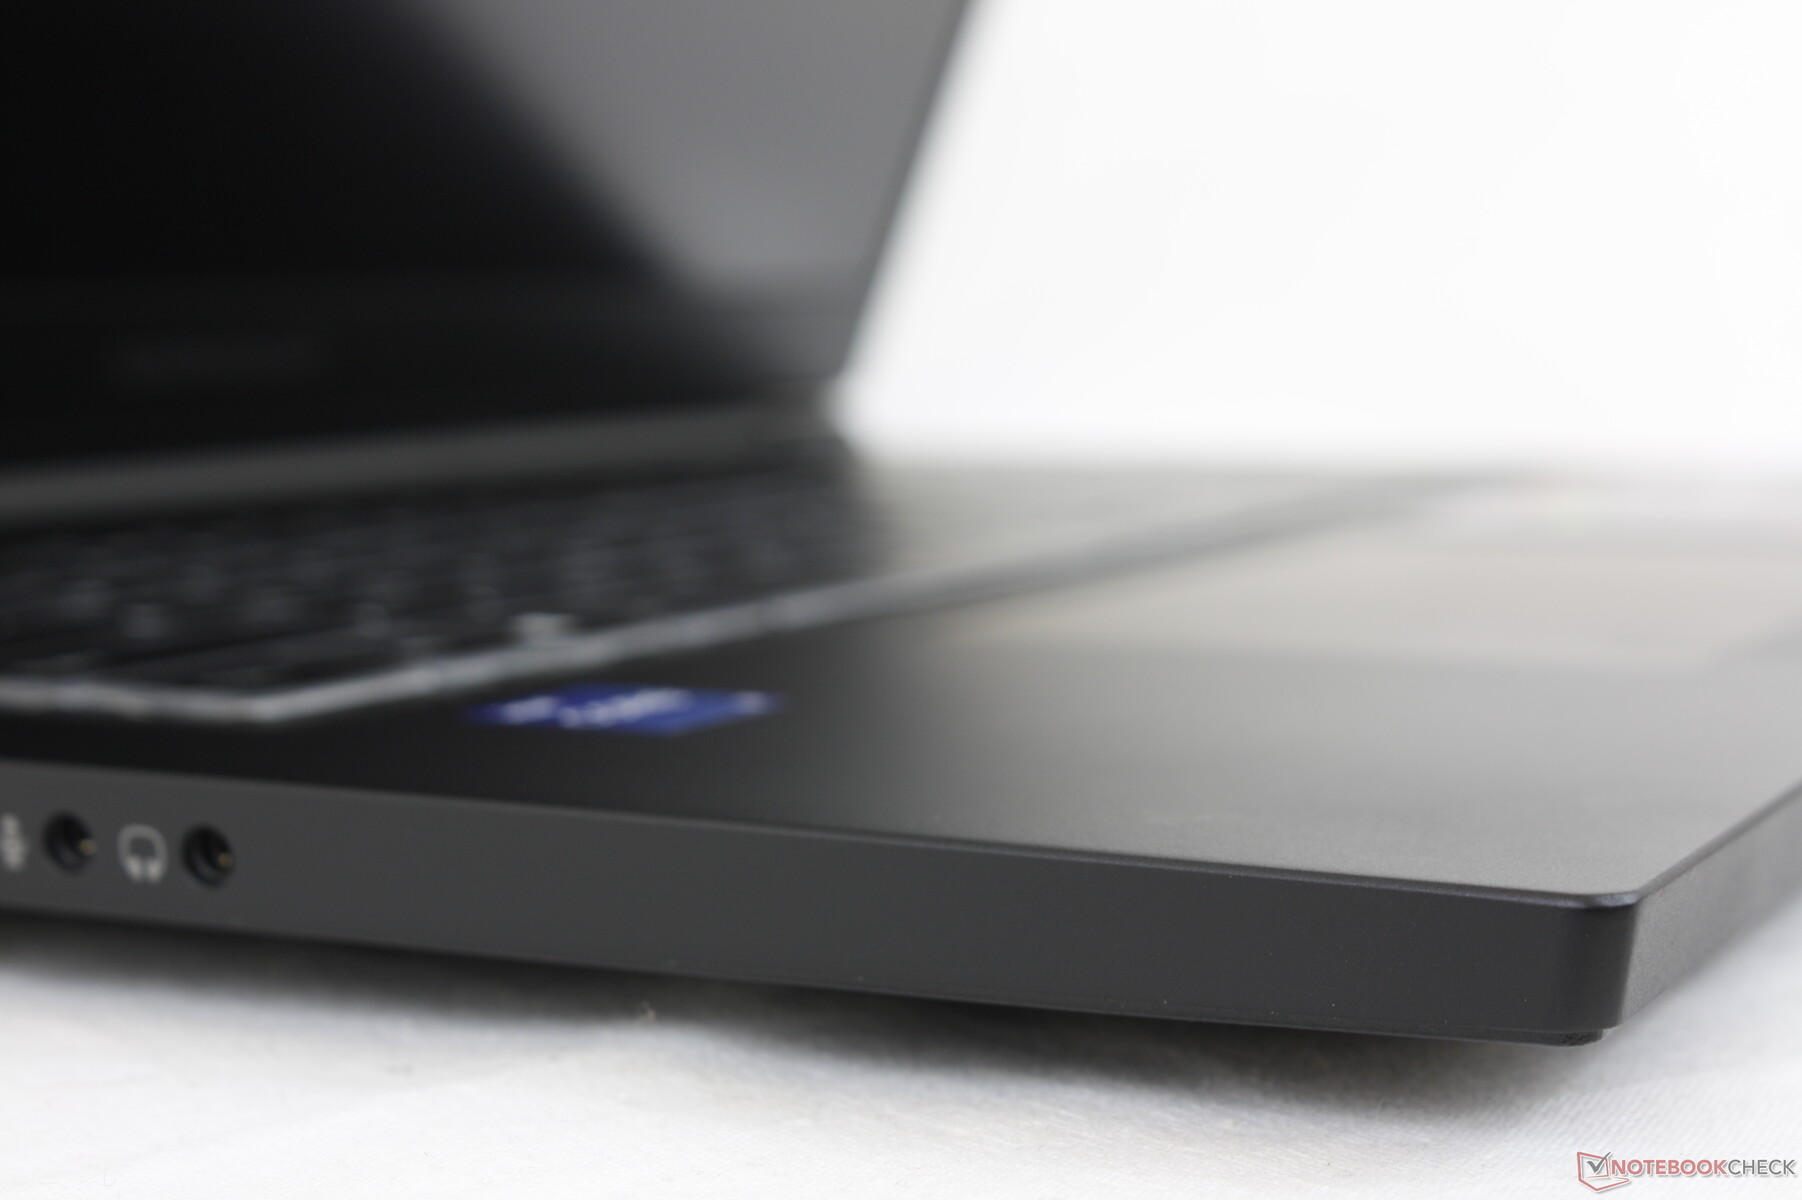
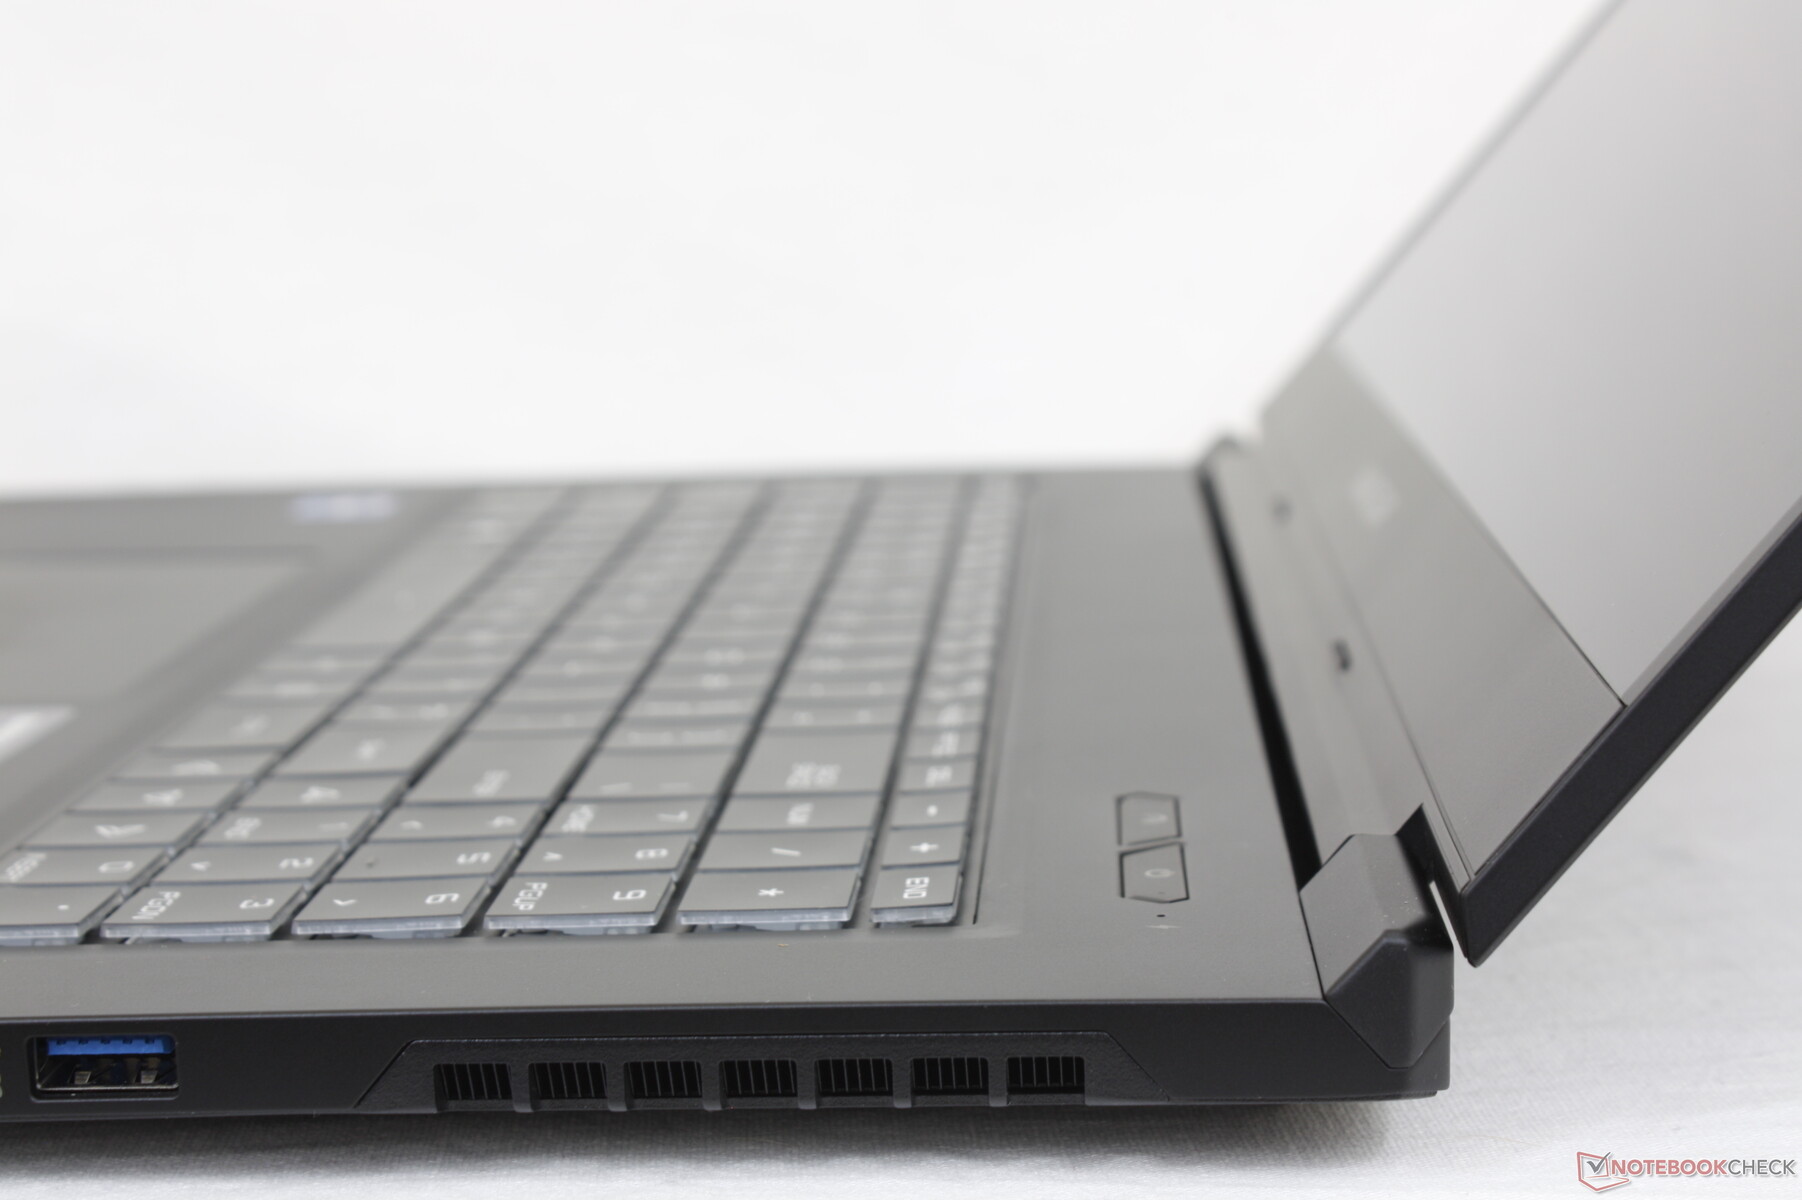
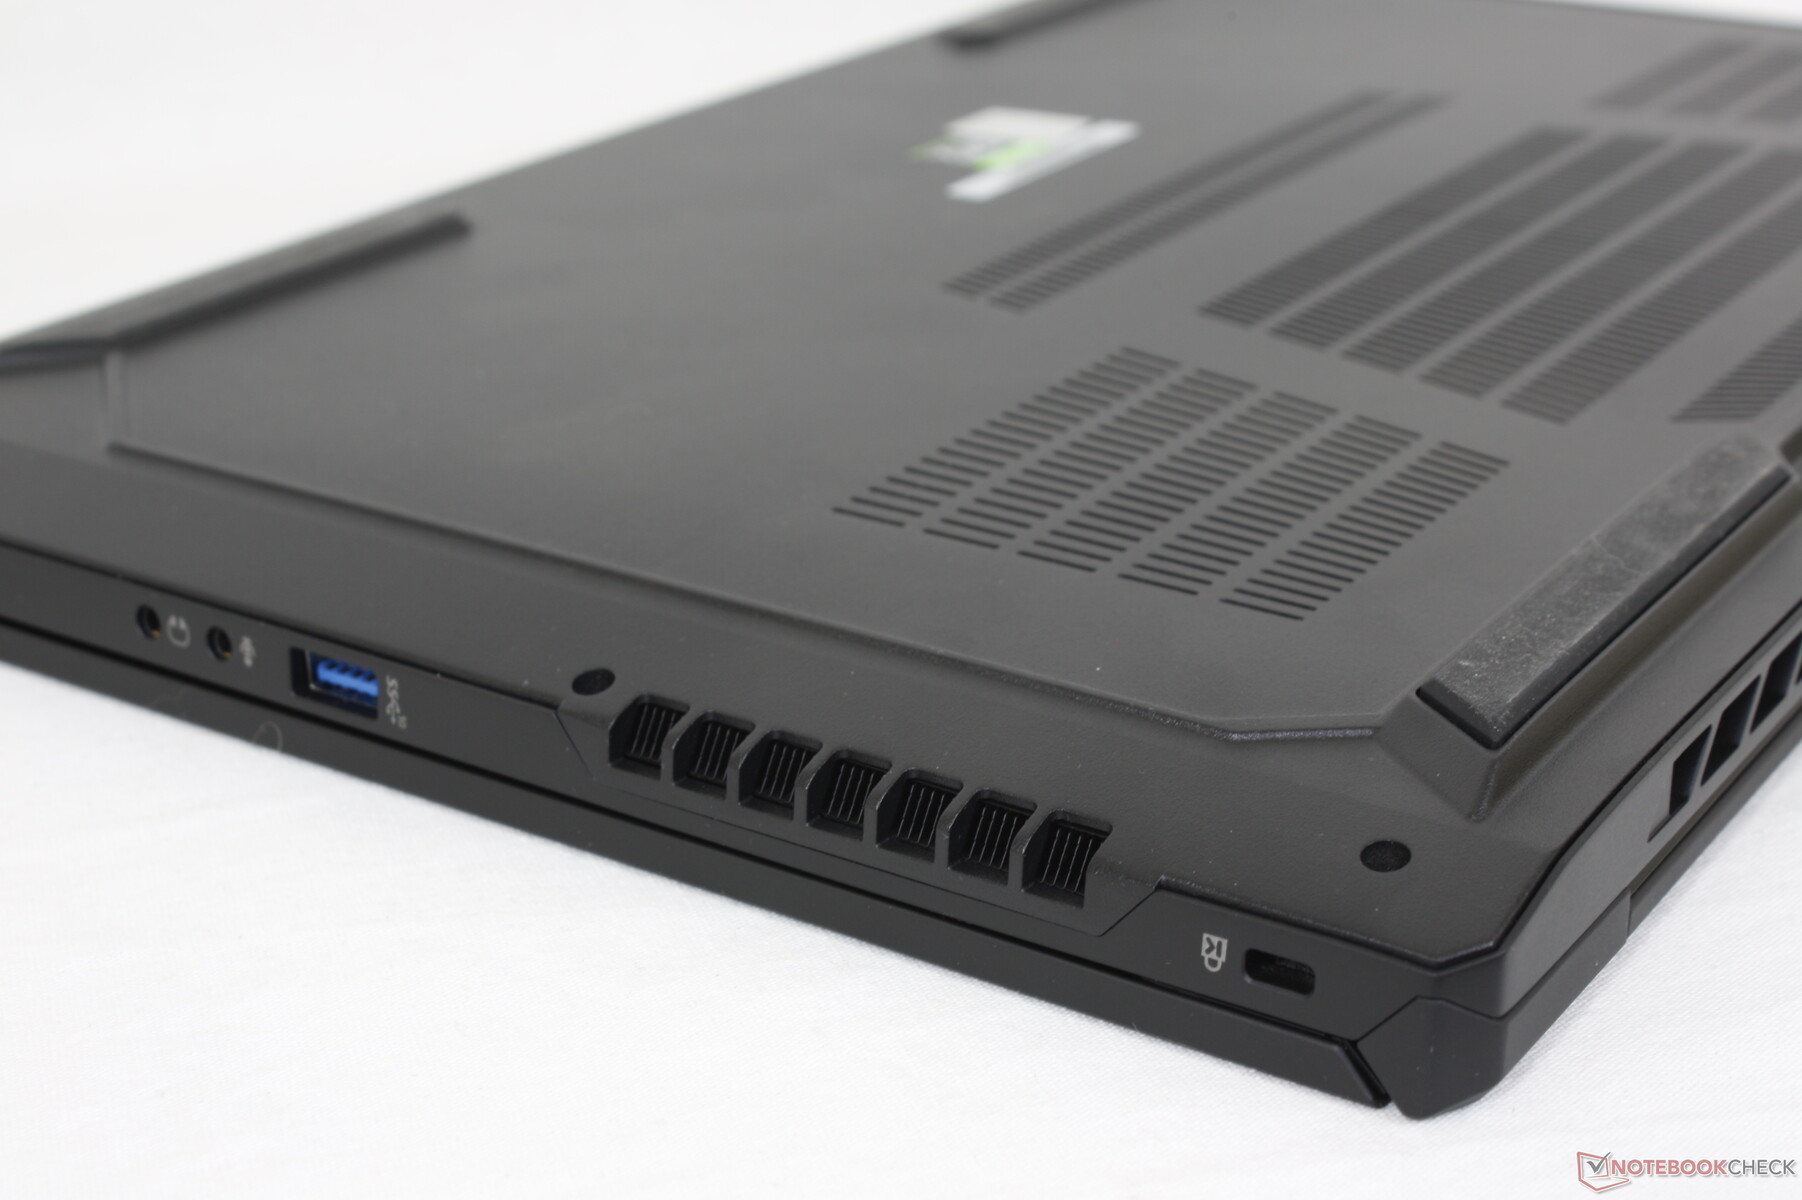
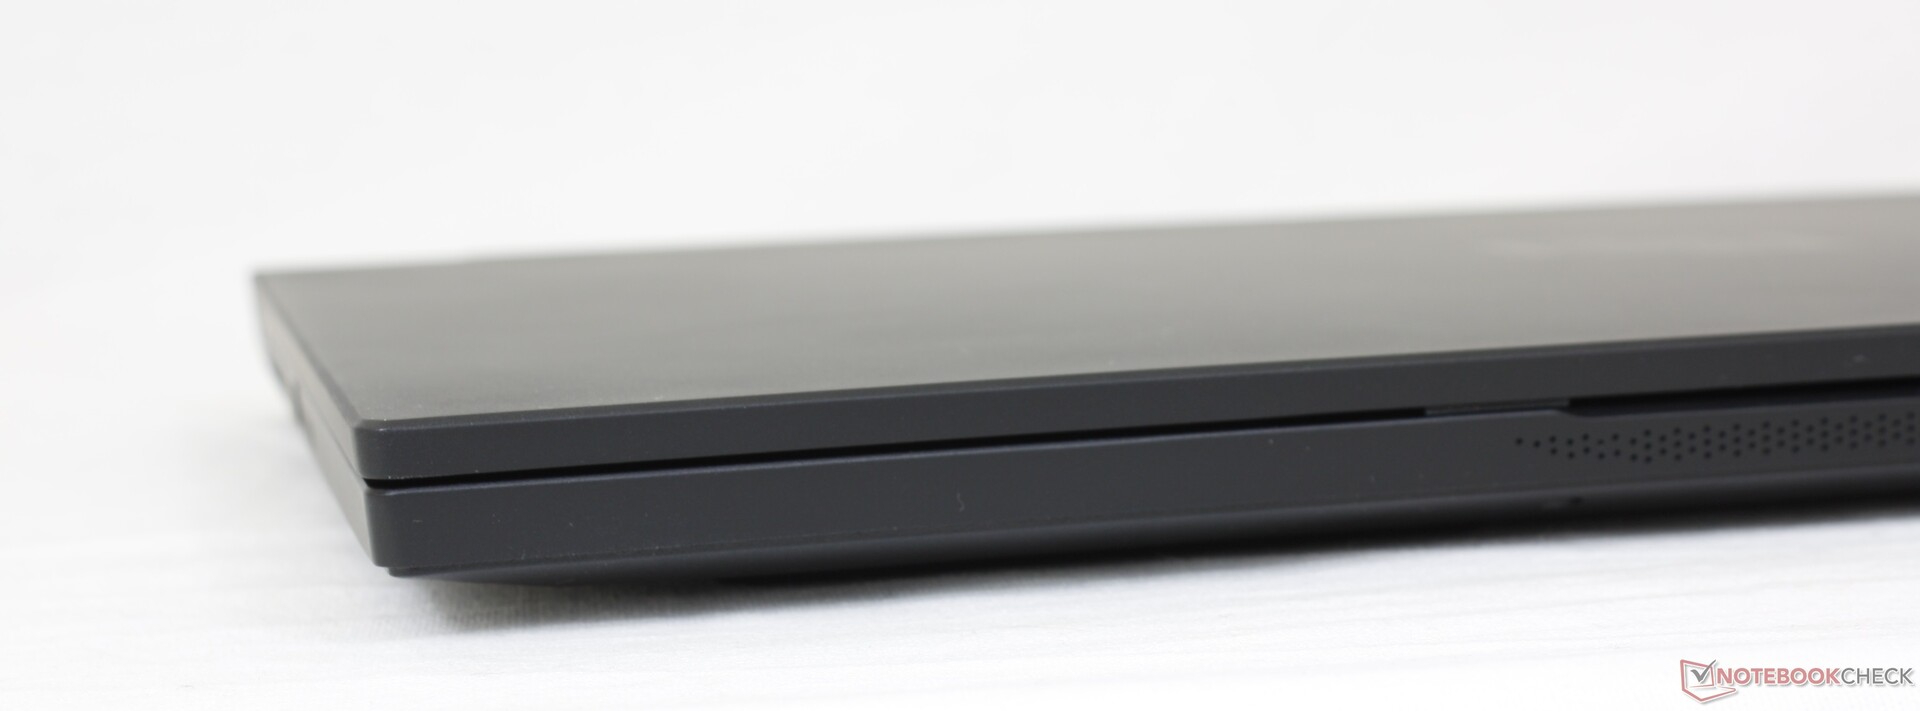
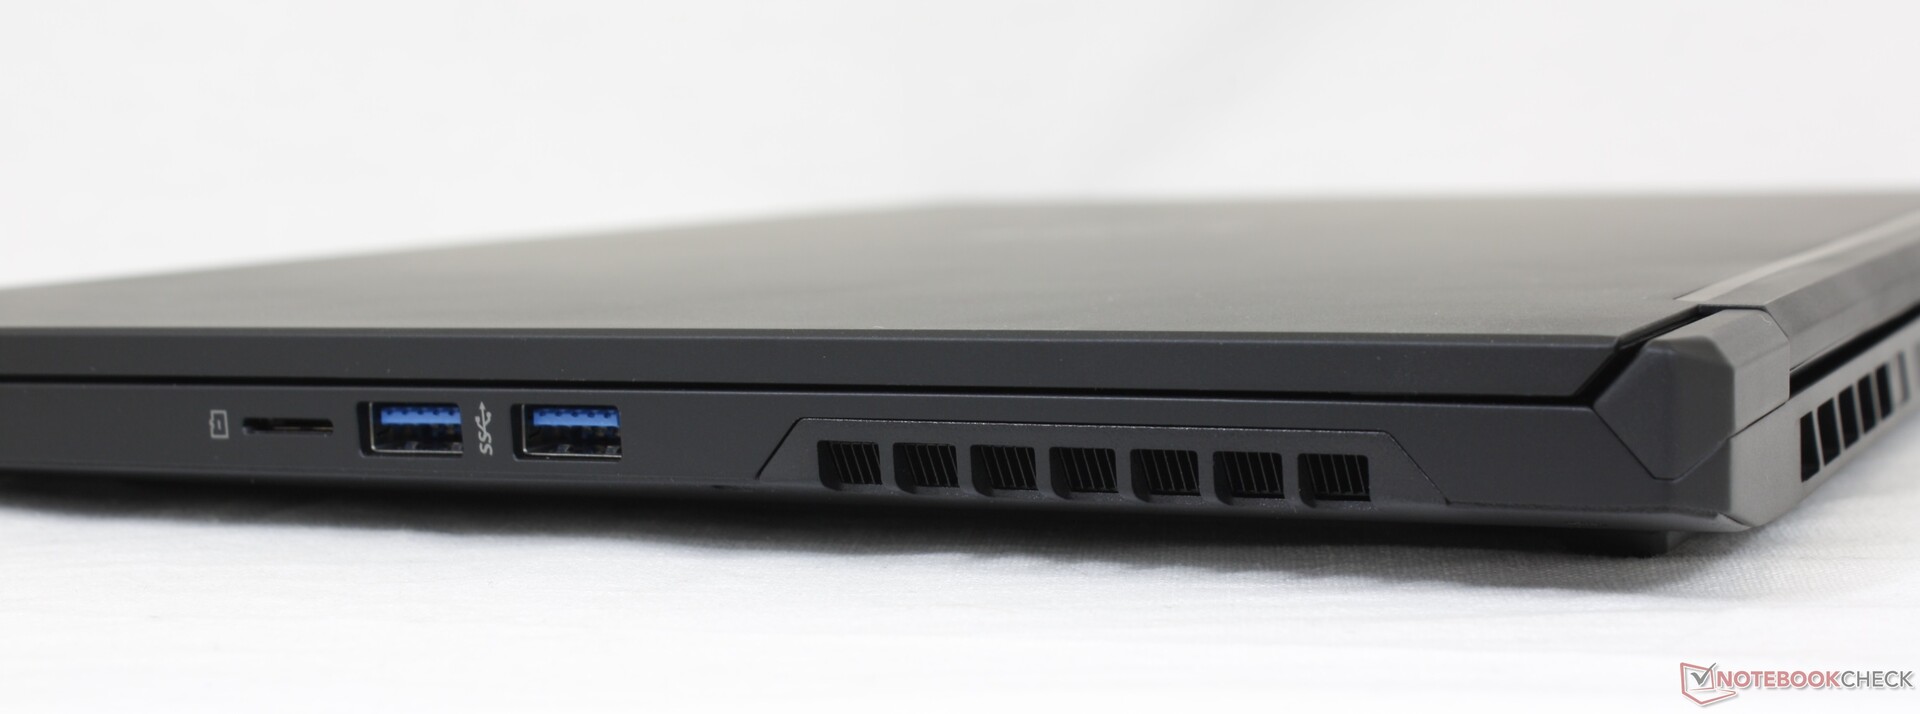
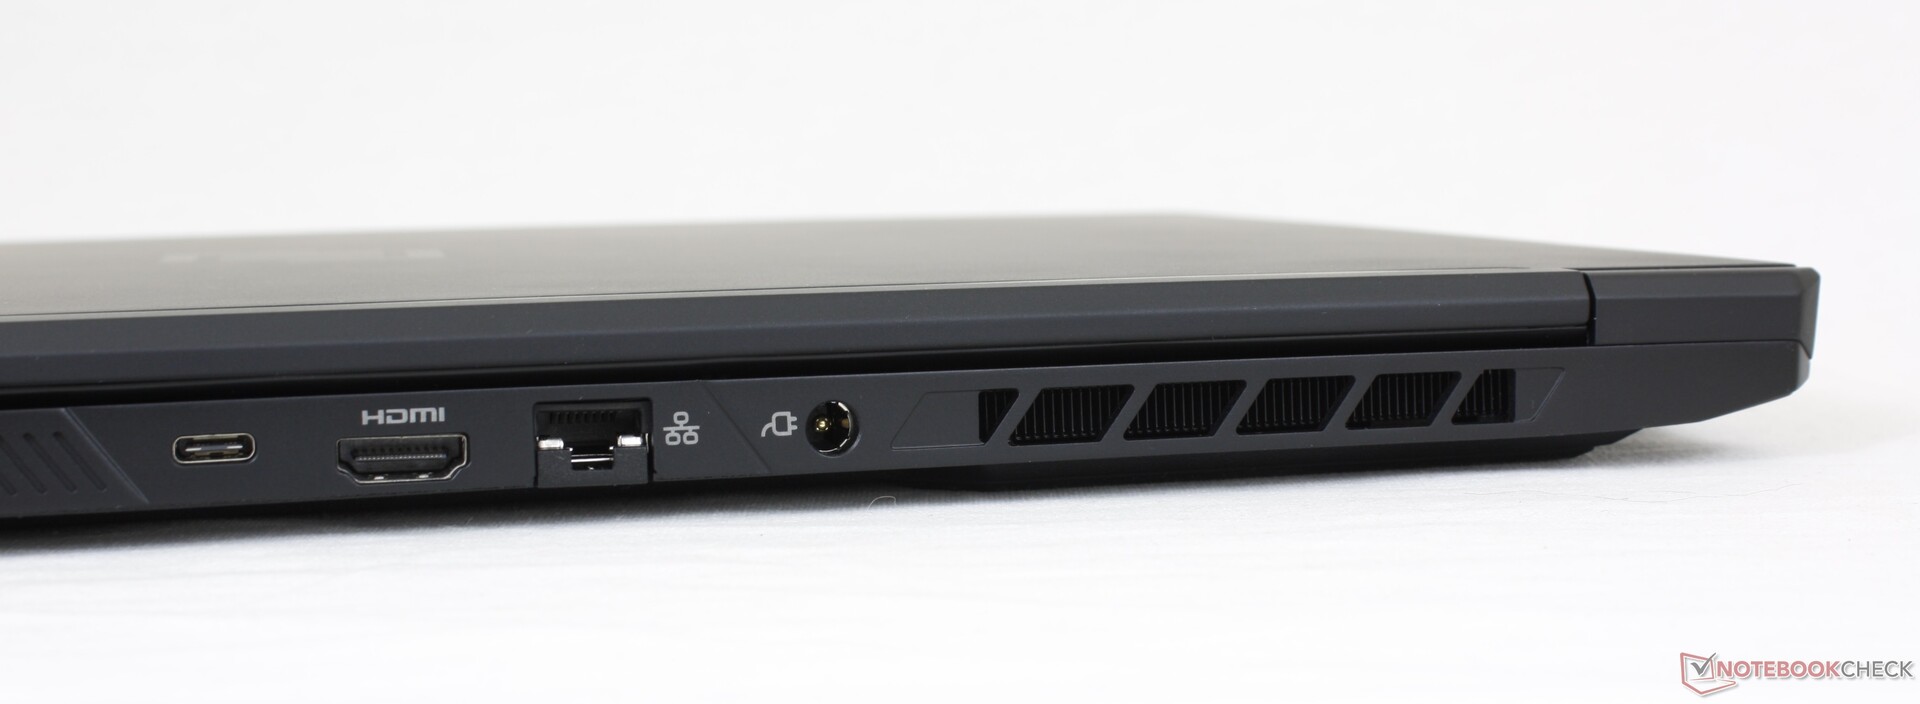
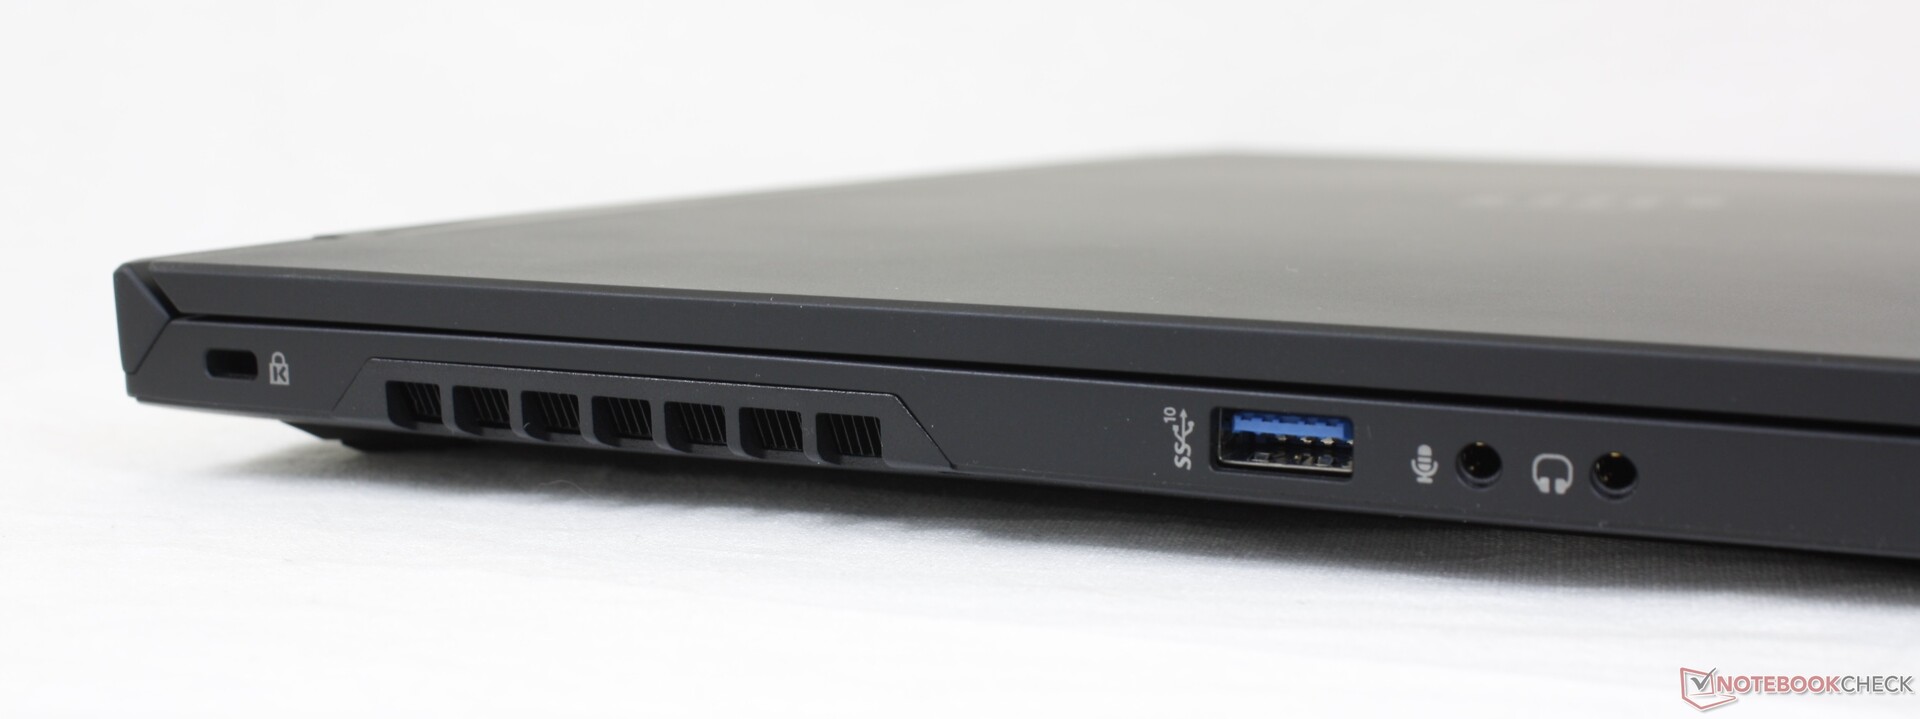
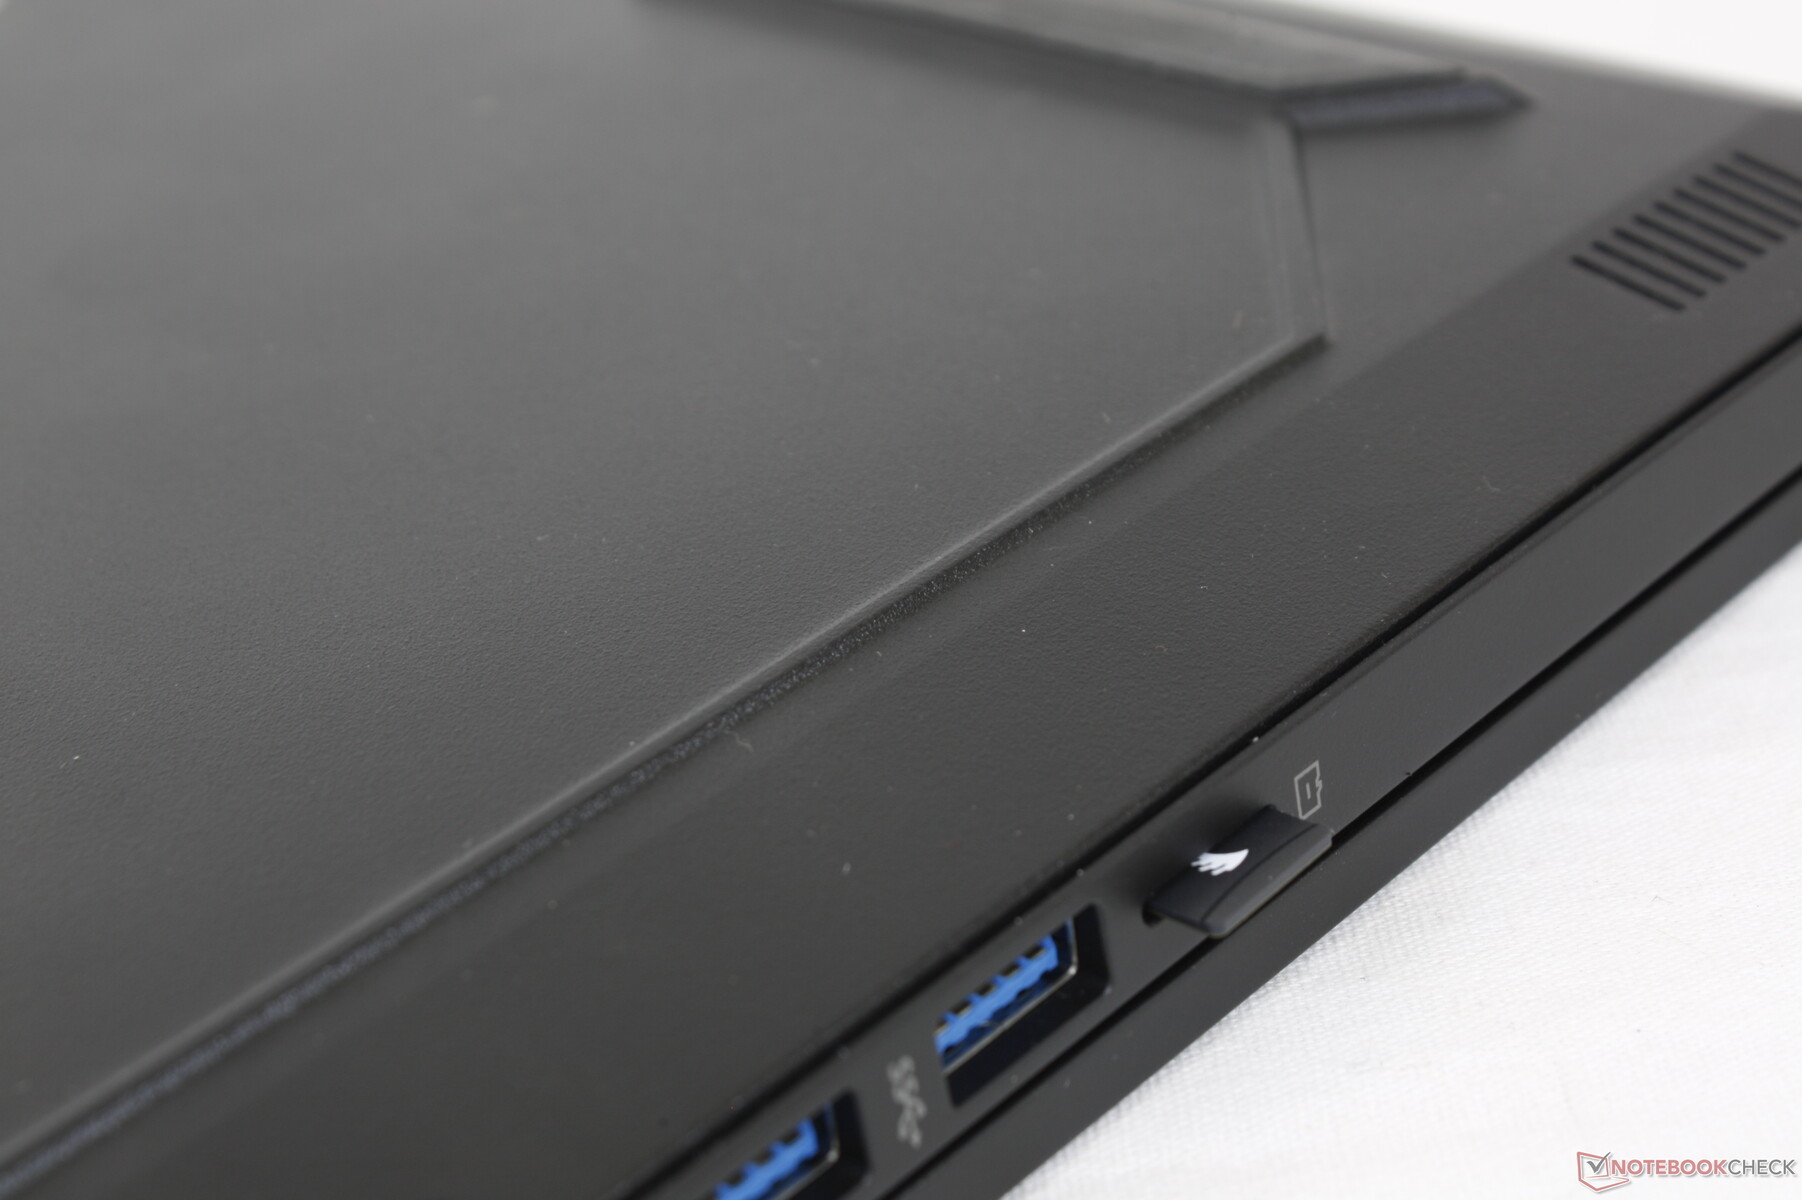
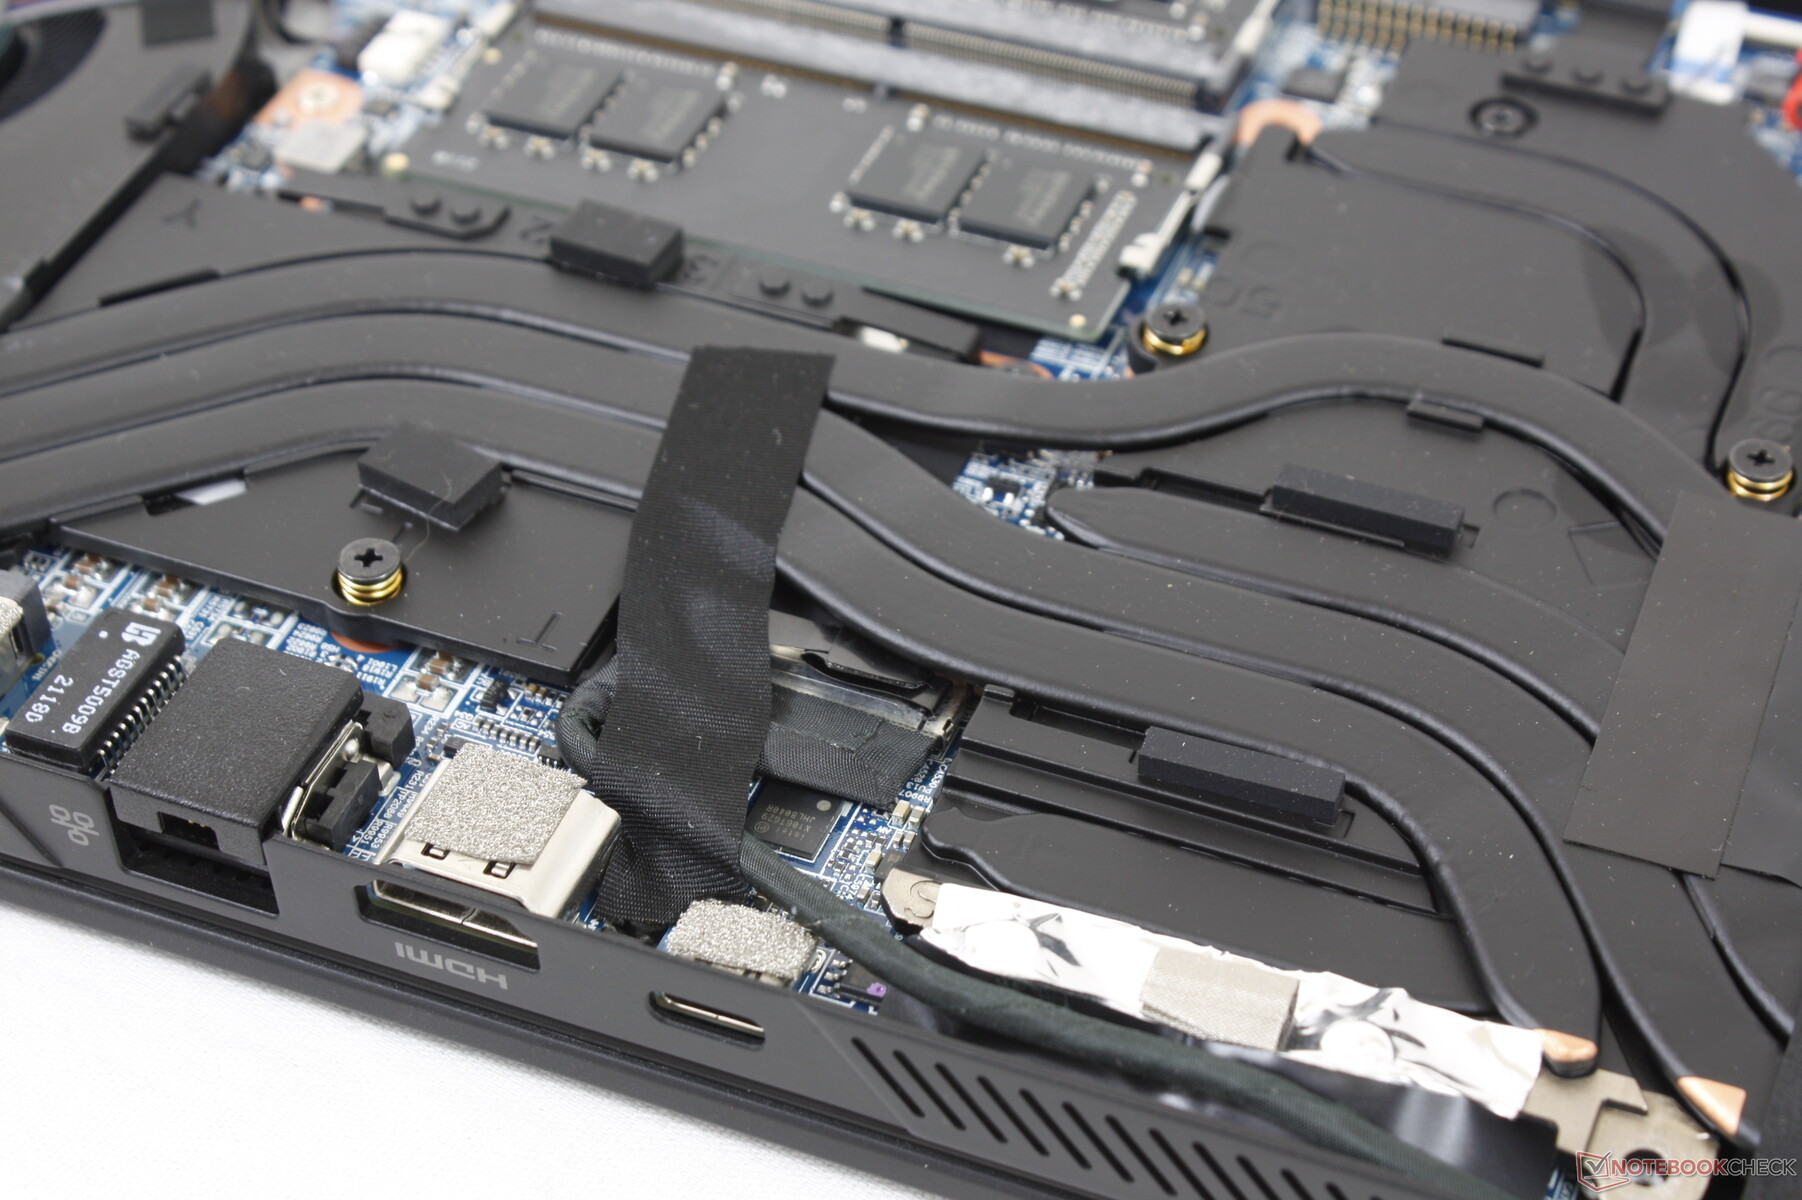
Conectividade
As opções de porta são quase idênticas ao Tongfang GM7ZG7S ou GM7MG0R, mas com uma notável exceção: nosso chassi Maingear integra um leitor MicroSD em vez de um de tamanho completo. O Thunderbolt 4 é suportado nativamente através do chipset Intel, ao contrário do que acontece com os laptops acionados por AMD
Infelizmente, o laptop não pode ser recarregado via USB-C mesmo depois de testar vários adaptadores USB-C.
Leitor de cartões SD
As taxas de transferência são médias a partir do leitor MicroSD integrado. A transferência de 1 GB de fotos de nossa placa de teste UHS-II para a área de trabalho leva cerca de 14 segundos, em comparação com menos da metade do que no MSI GS75.
| SD Card Reader | |
| average JPG Copy Test (av. of 3 runs) | |
| MSI GS75 10SF-609US (Toshiba Exceria Pro M501 UHS-II) | |
| Asus ROG Zephyrus S17 GX703HSD | |
| Schenker Compact 17 (Toshiba Exceria Pro SDXC 64 GB UHS-II) | |
| Schenker XMG Neo 17 (Early 2021, RTX 3070, 5800H) (Toshiba Exceria Pro SDXC 64 GB UHS-II) | |
| Maingear Vector Pro MG-VCP17 (AV Pro V60) | |
| Schenker XMG Core 17 (Early 2021) (AV PRO microSD 128 GB V60) | |
| maximum AS SSD Seq Read Test (1GB) | |
| Asus ROG Zephyrus S17 GX703HSD | |
| MSI GS75 10SF-609US (Toshiba Exceria Pro M501 UHS-II) | |
| Schenker Compact 17 (Toshiba Exceria Pro SDXC 64 GB UHS-II) | |
| Schenker XMG Neo 17 (Early 2021, RTX 3070, 5800H) (Toshiba Exceria Pro SDXC 64 GB UHS-II) | |
| Maingear Vector Pro MG-VCP17 (AV Pro V60) | |
| Schenker XMG Core 17 (Early 2021) (AV PRO microSD 128 GB V60) | |
Comunicação
Webcam
Embora haja compatibilidade com o IR para Windows Olá, a webcam 720p não integra nenhum obturador de privacidade.


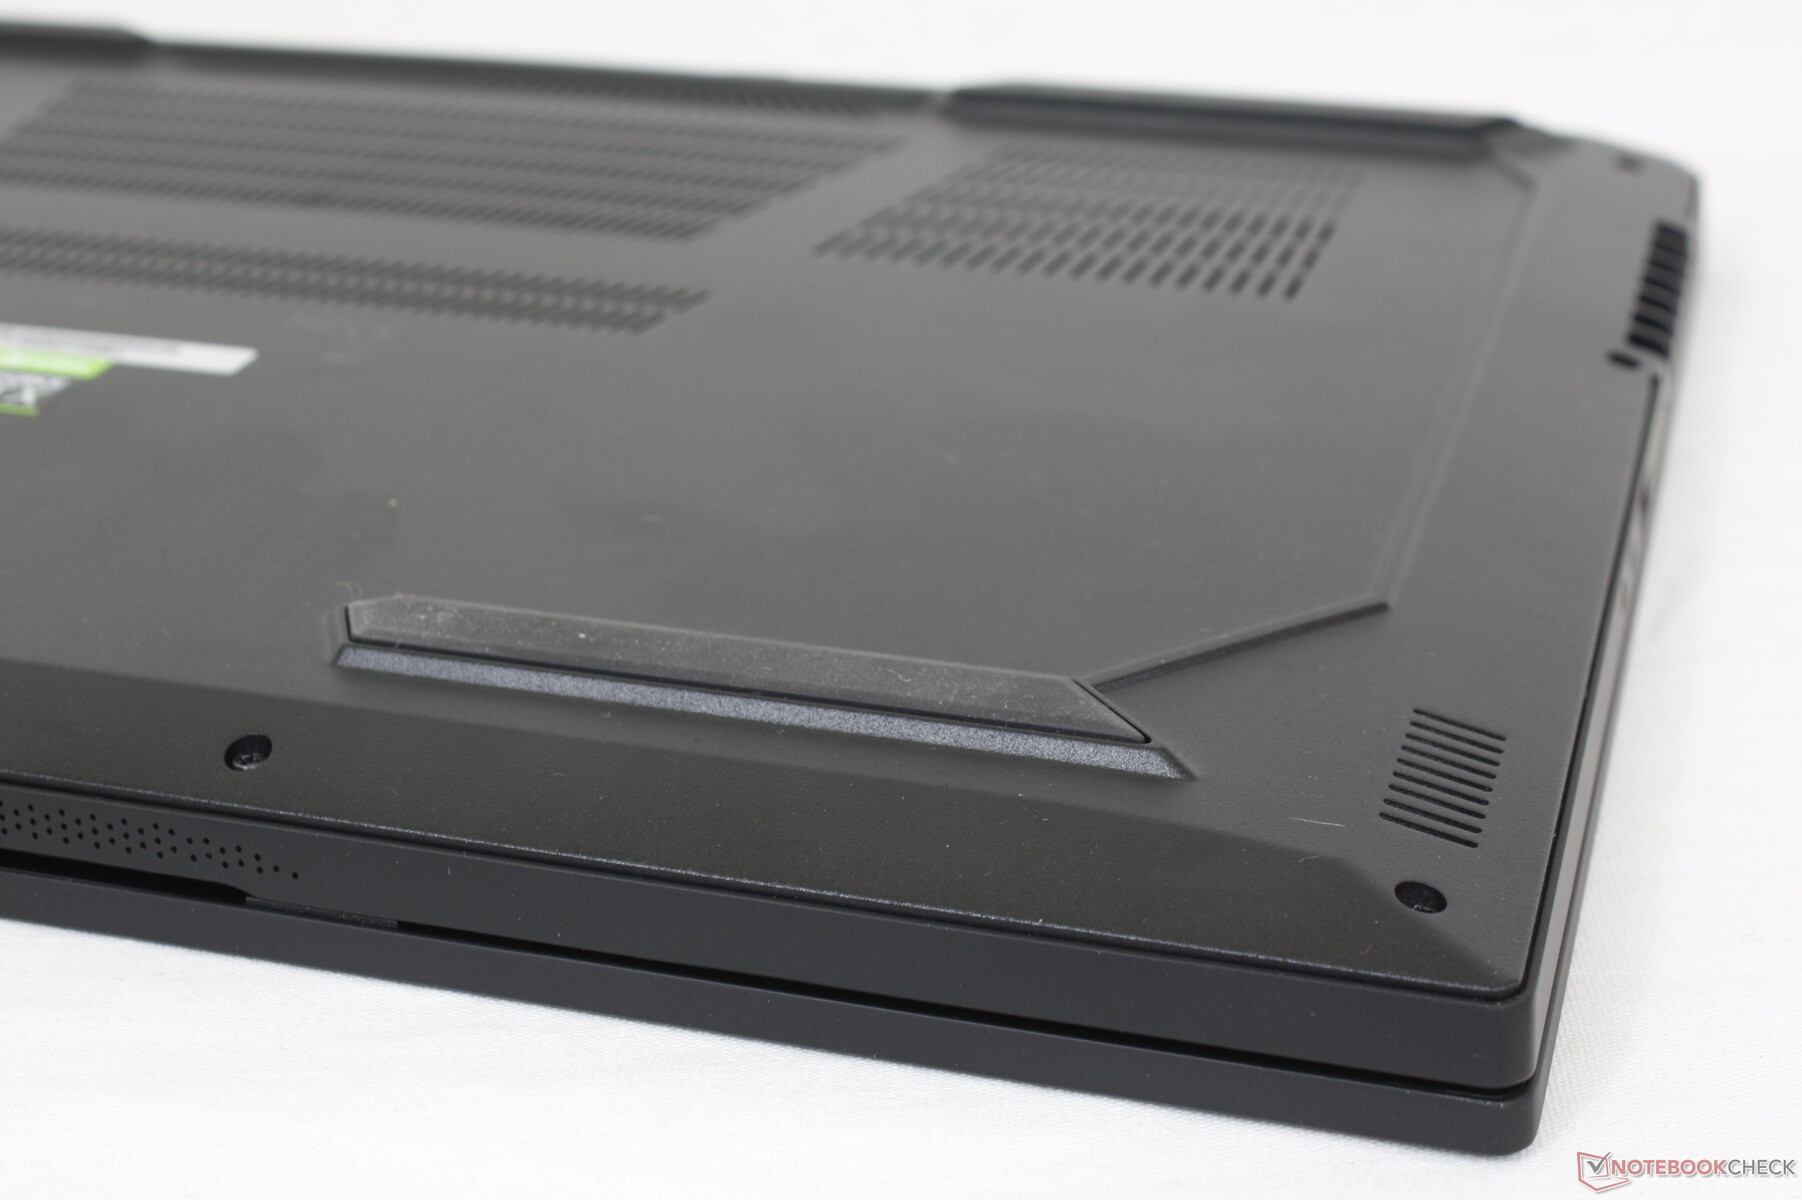
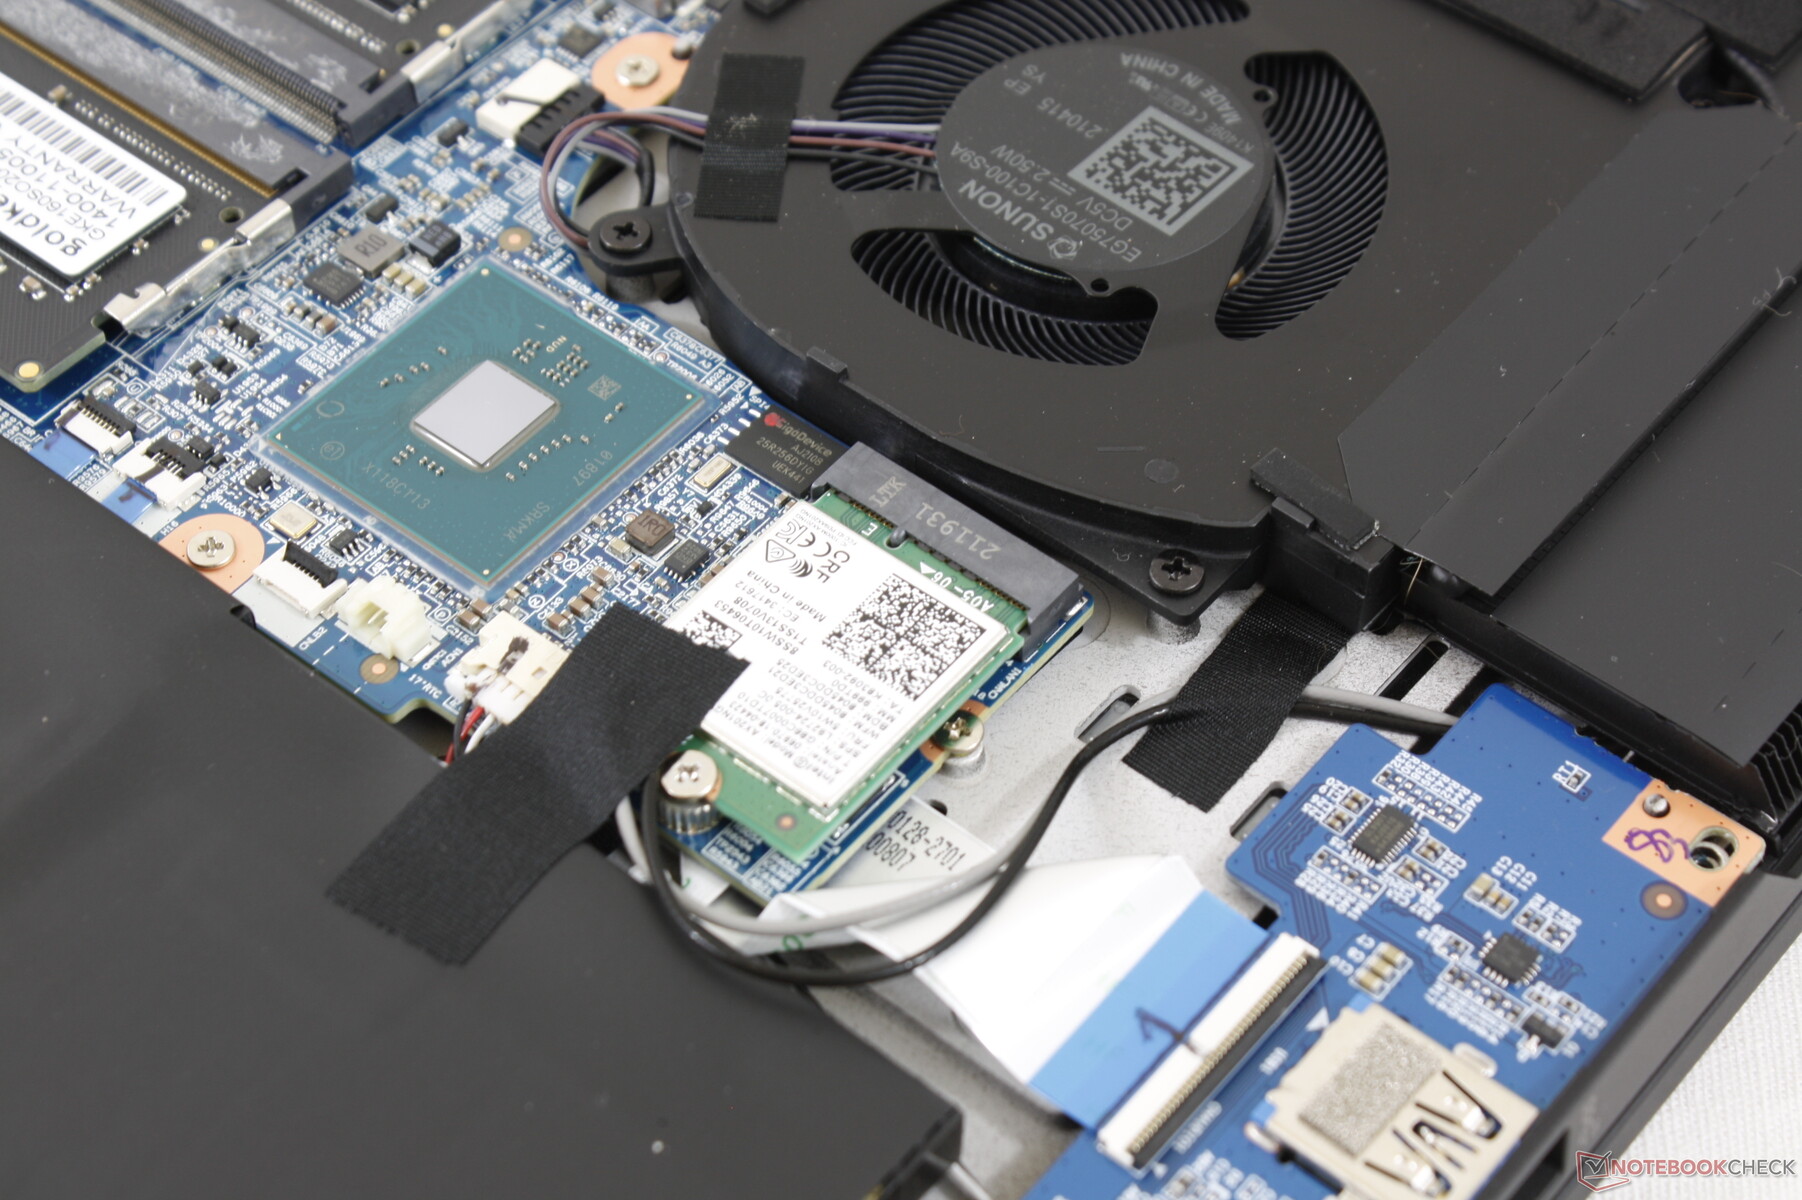
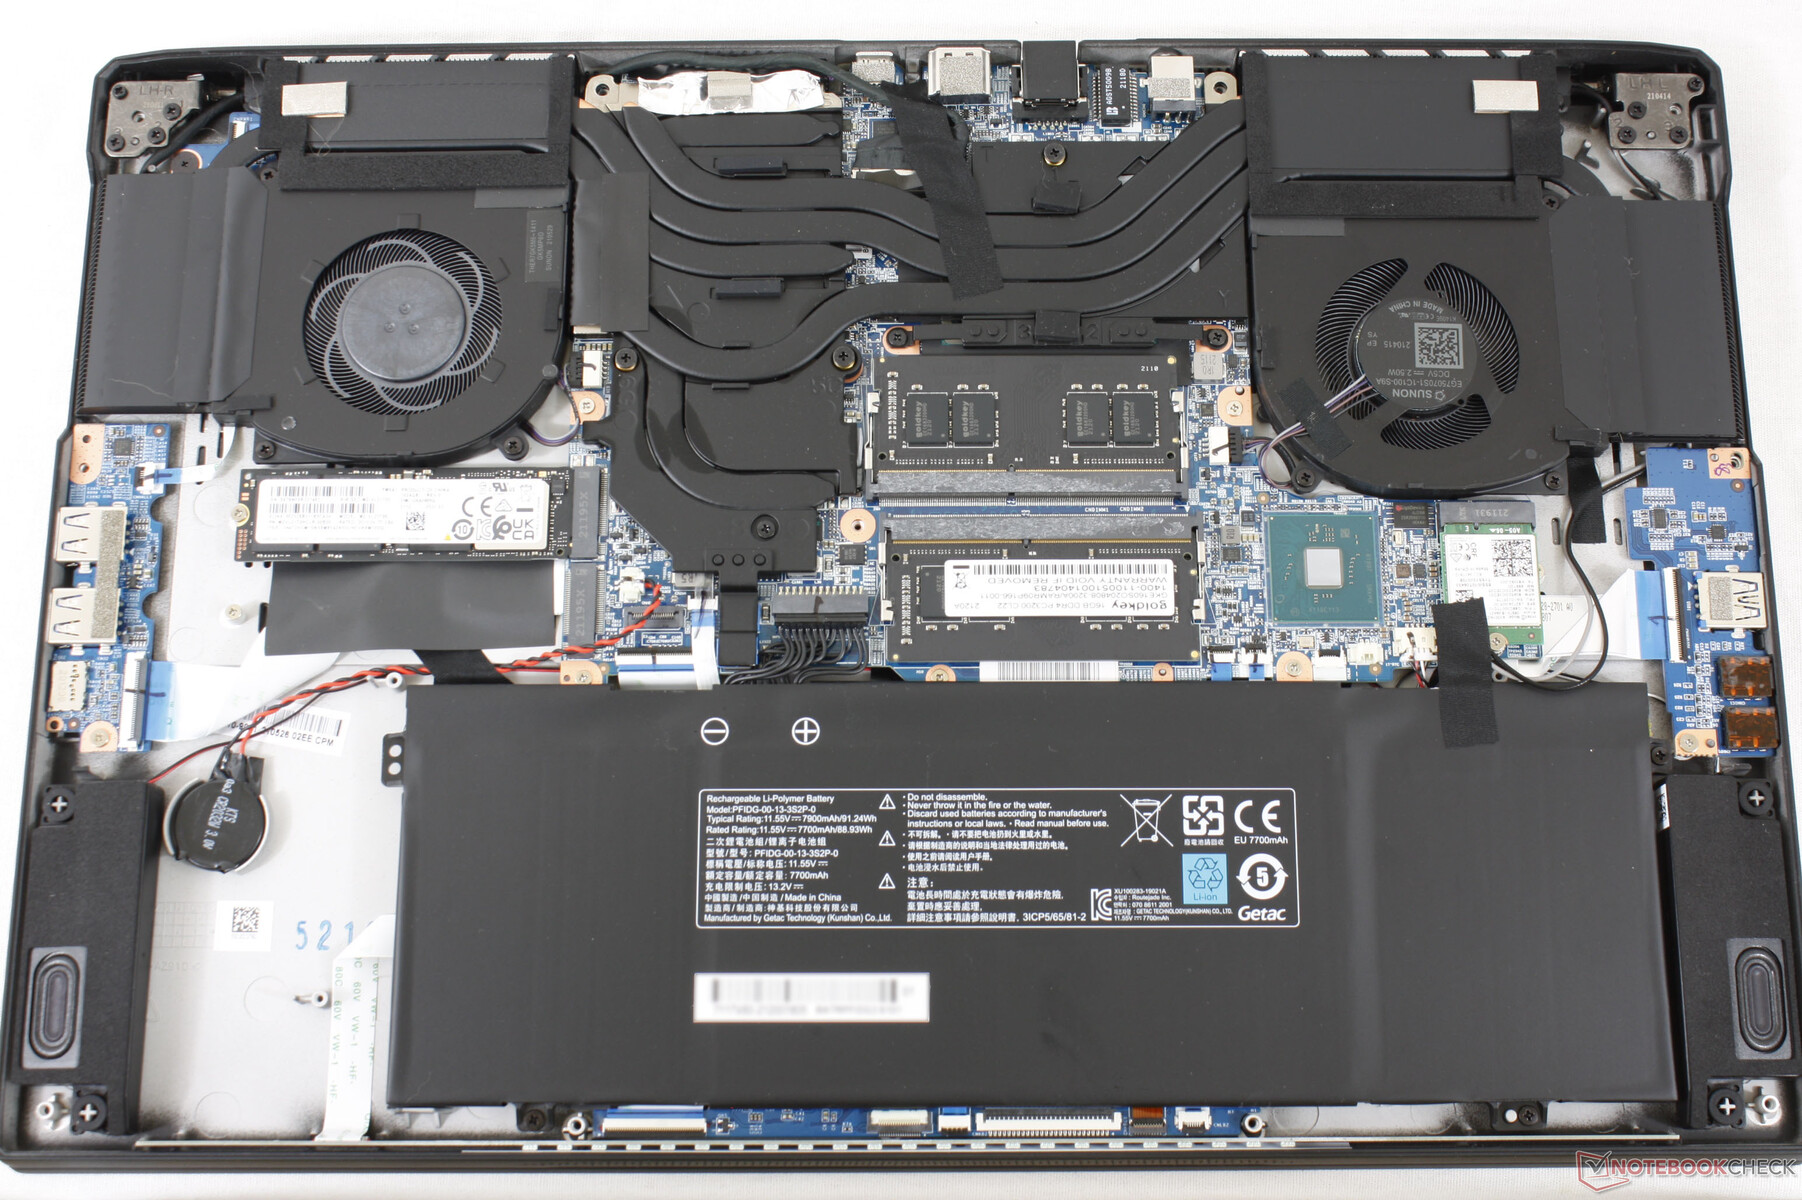
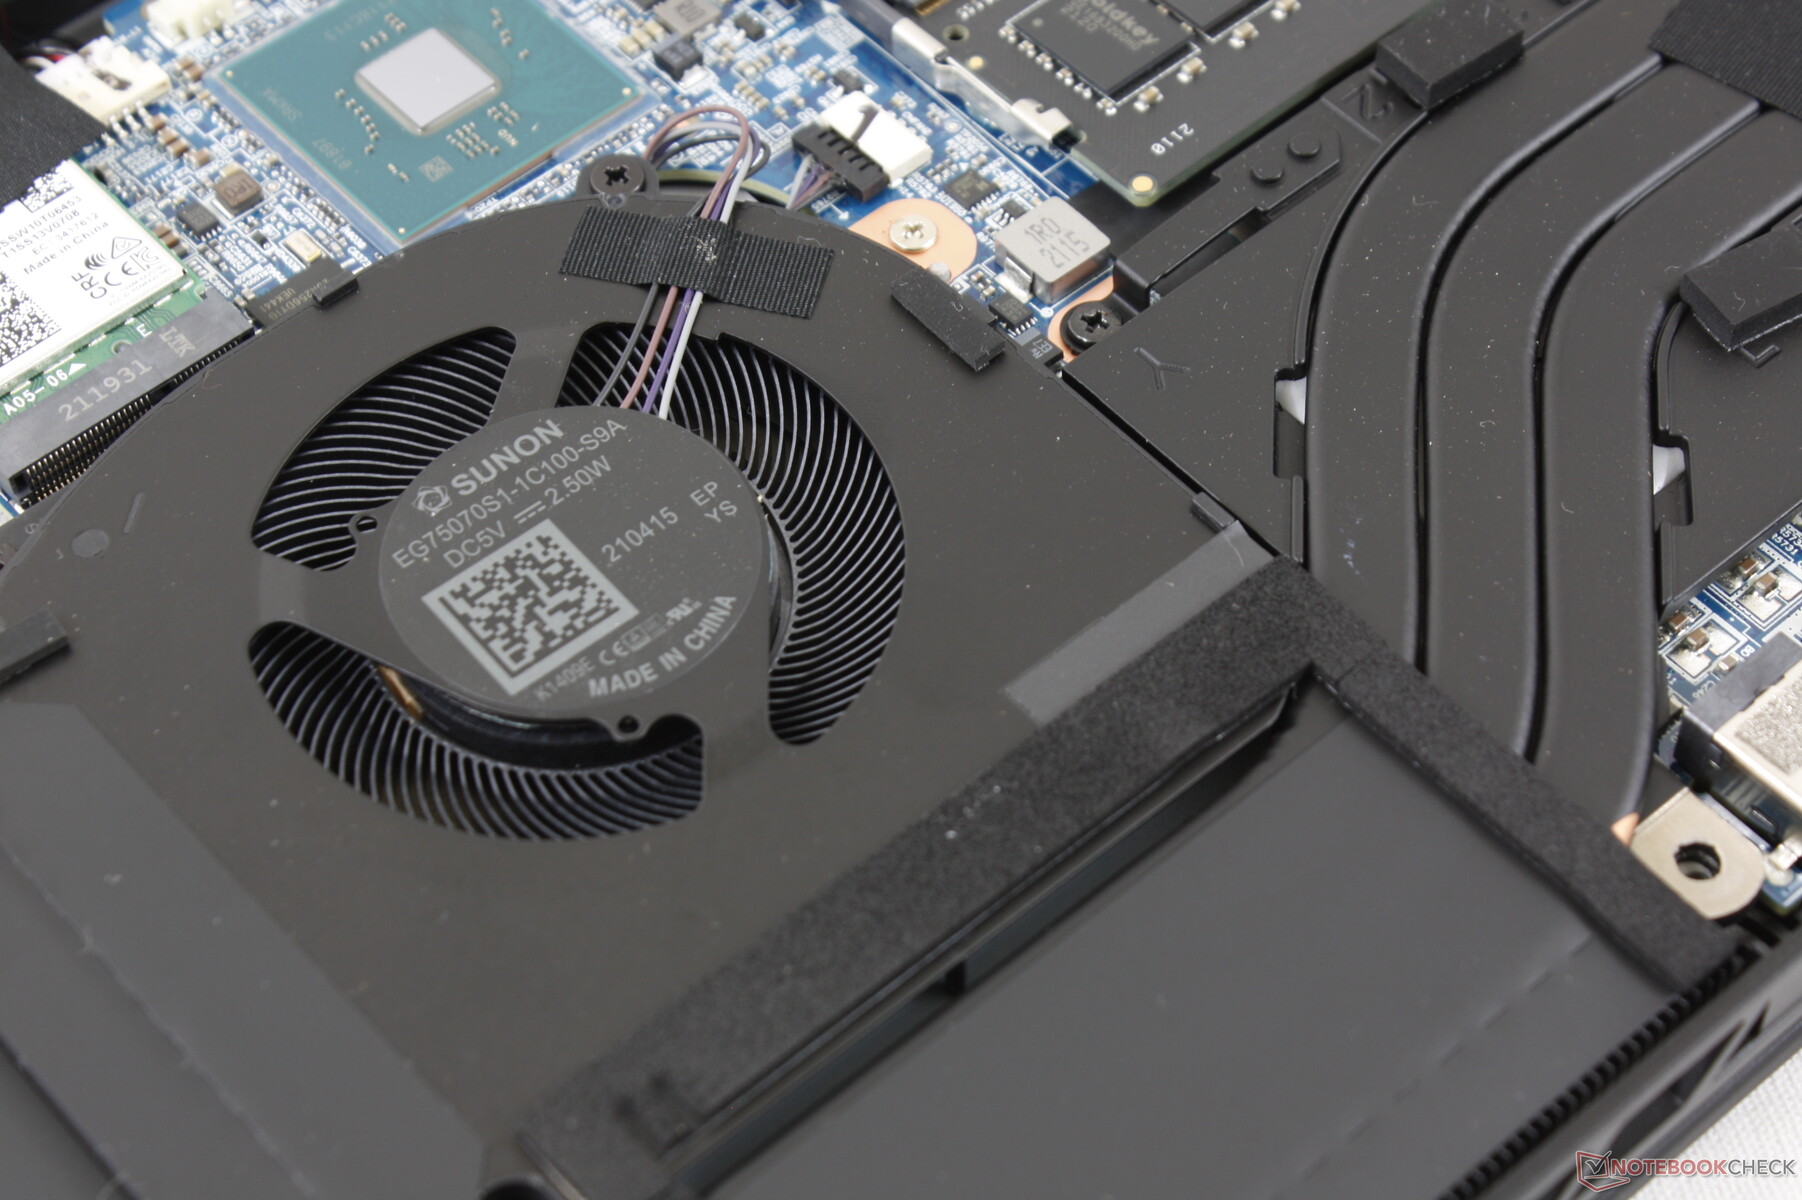
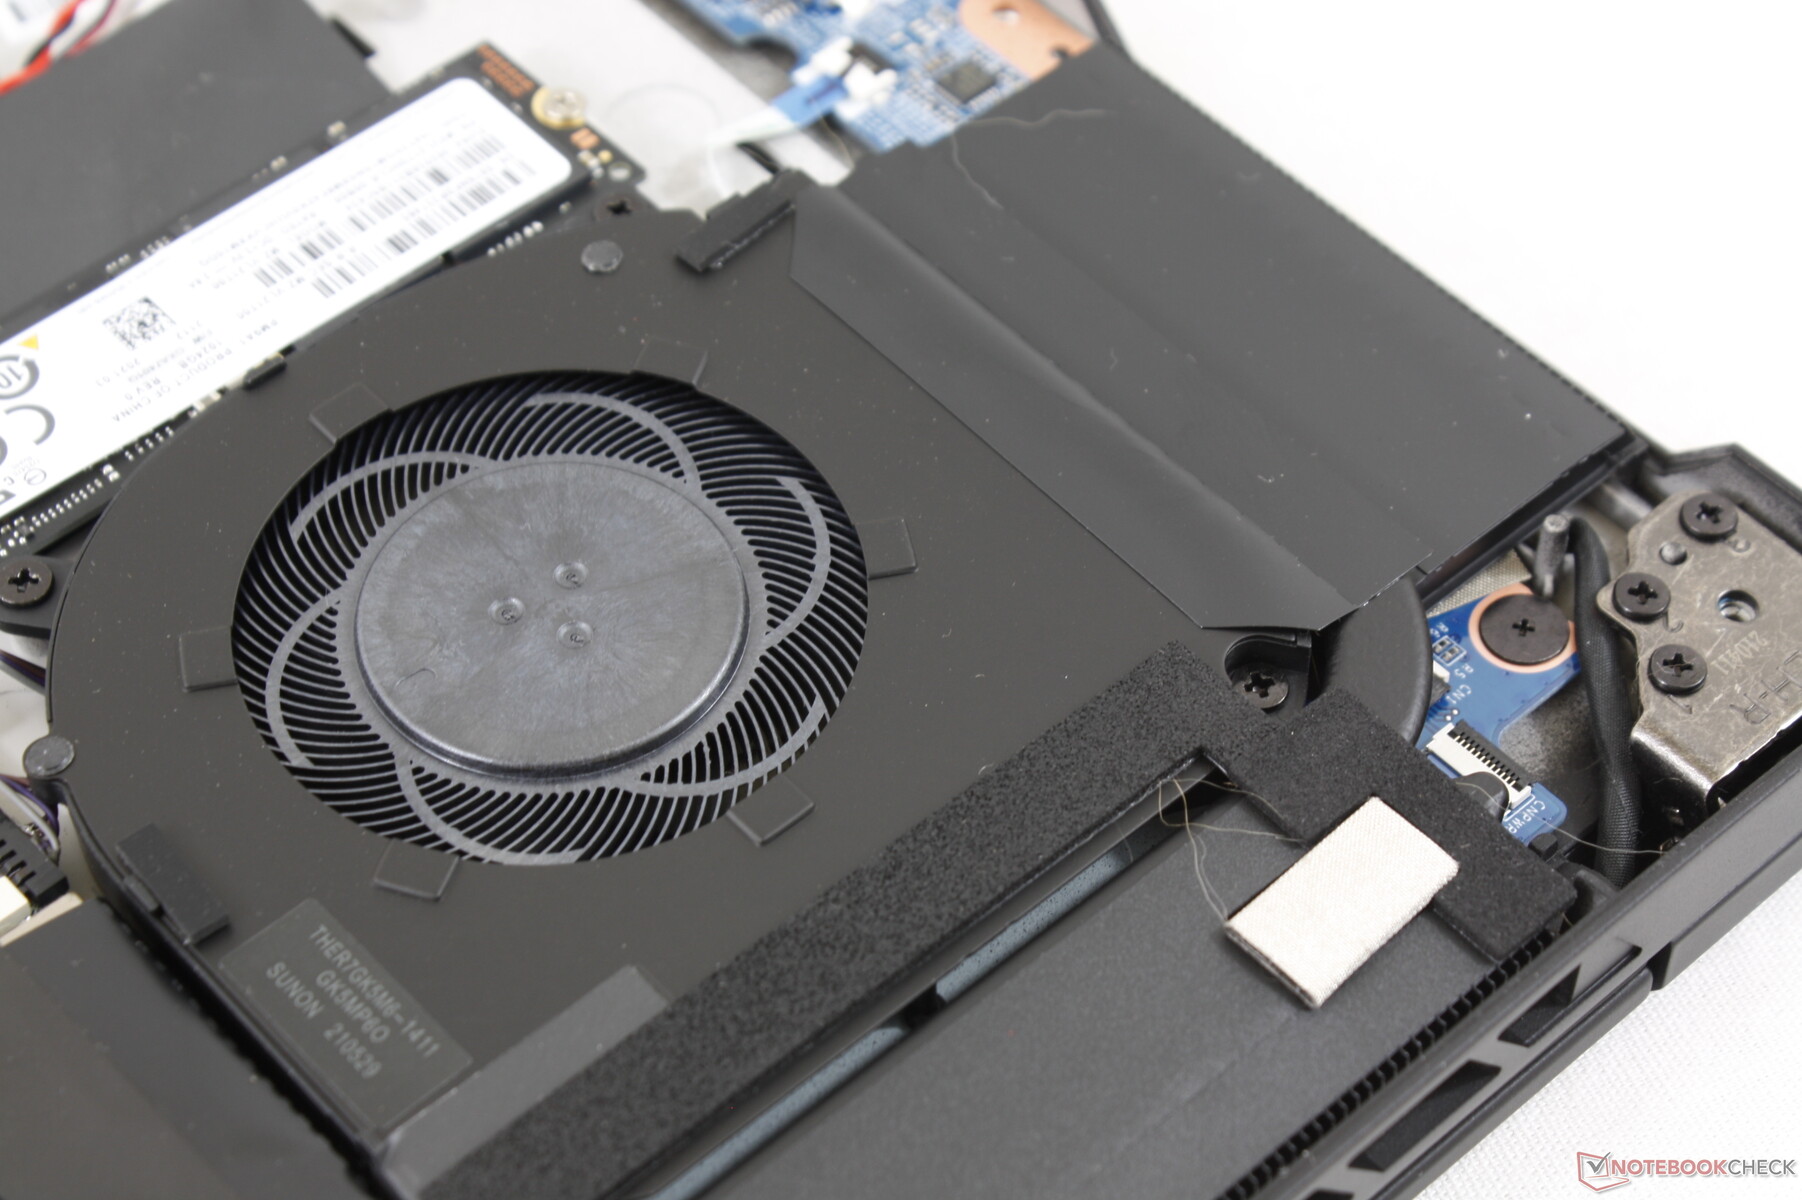
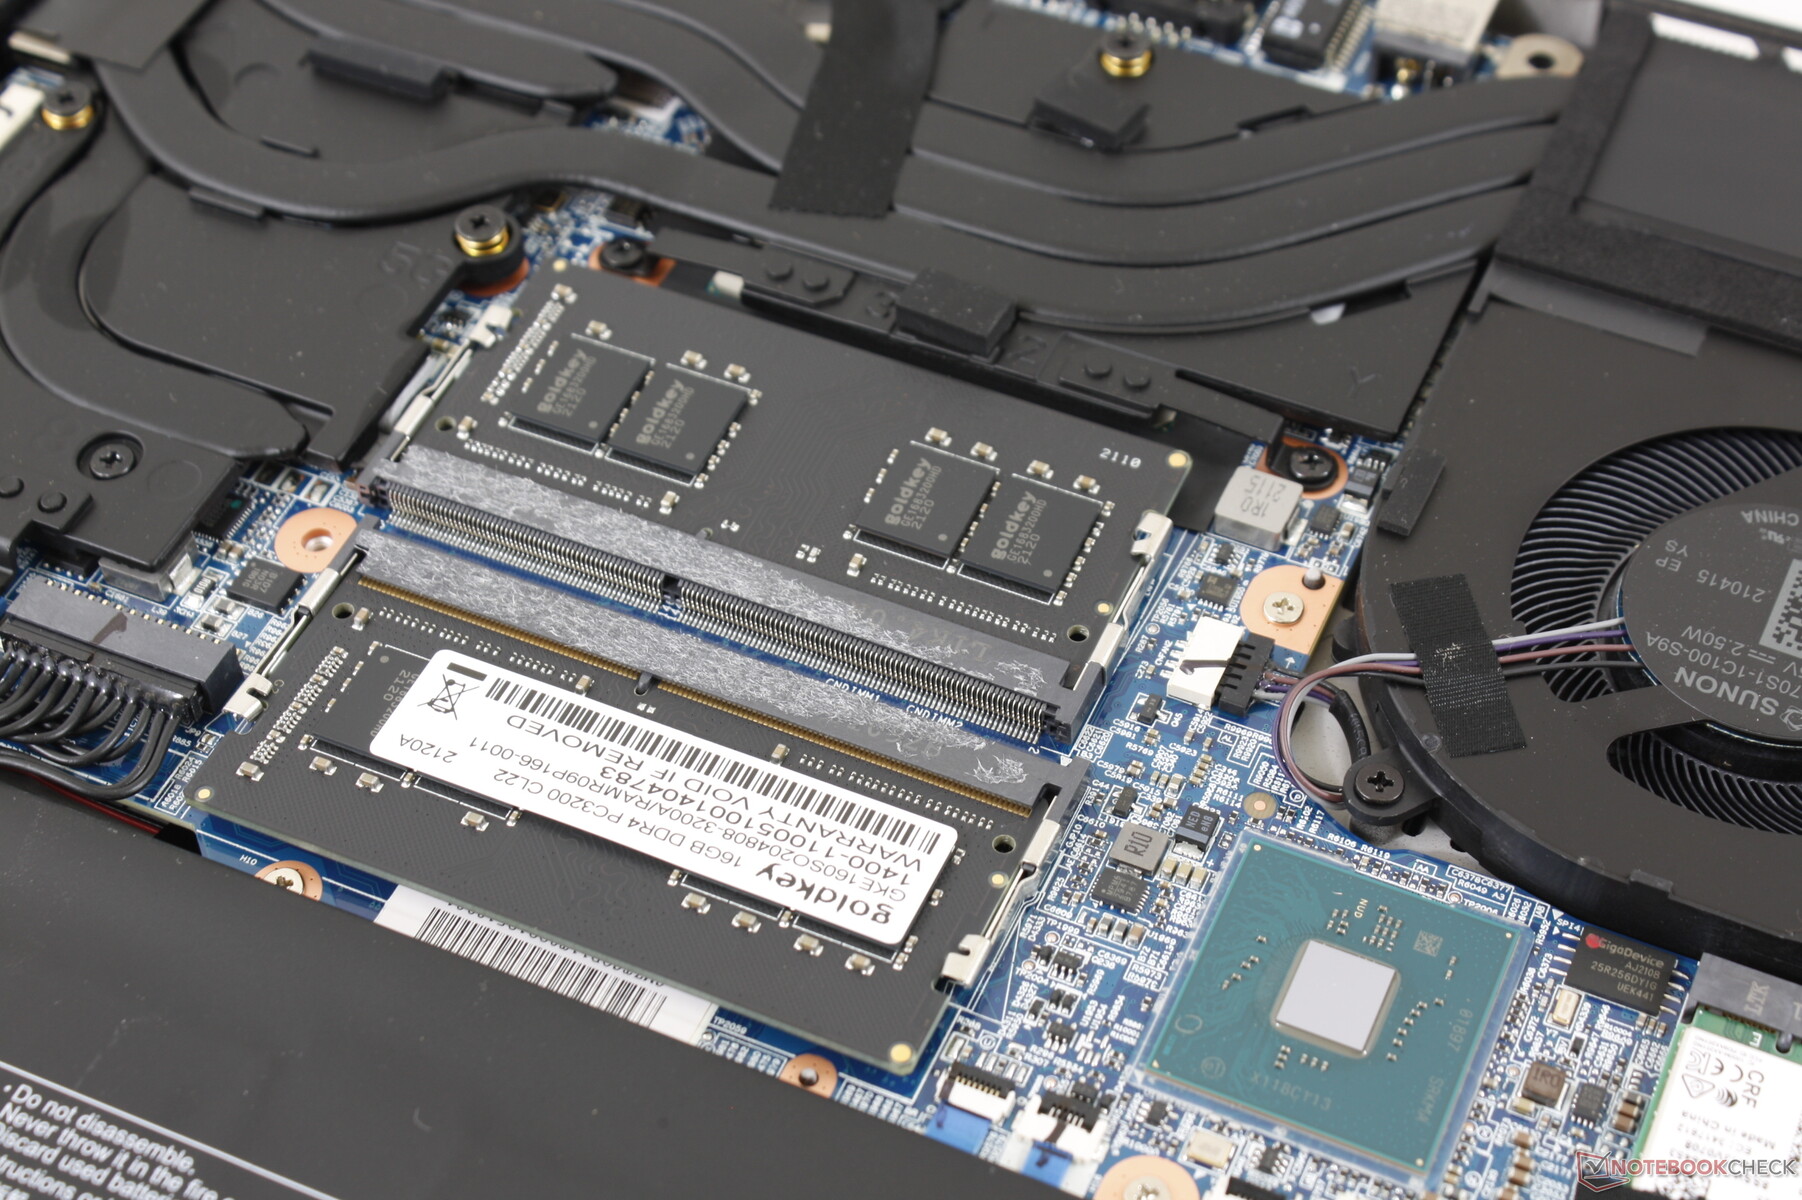
Manutenção
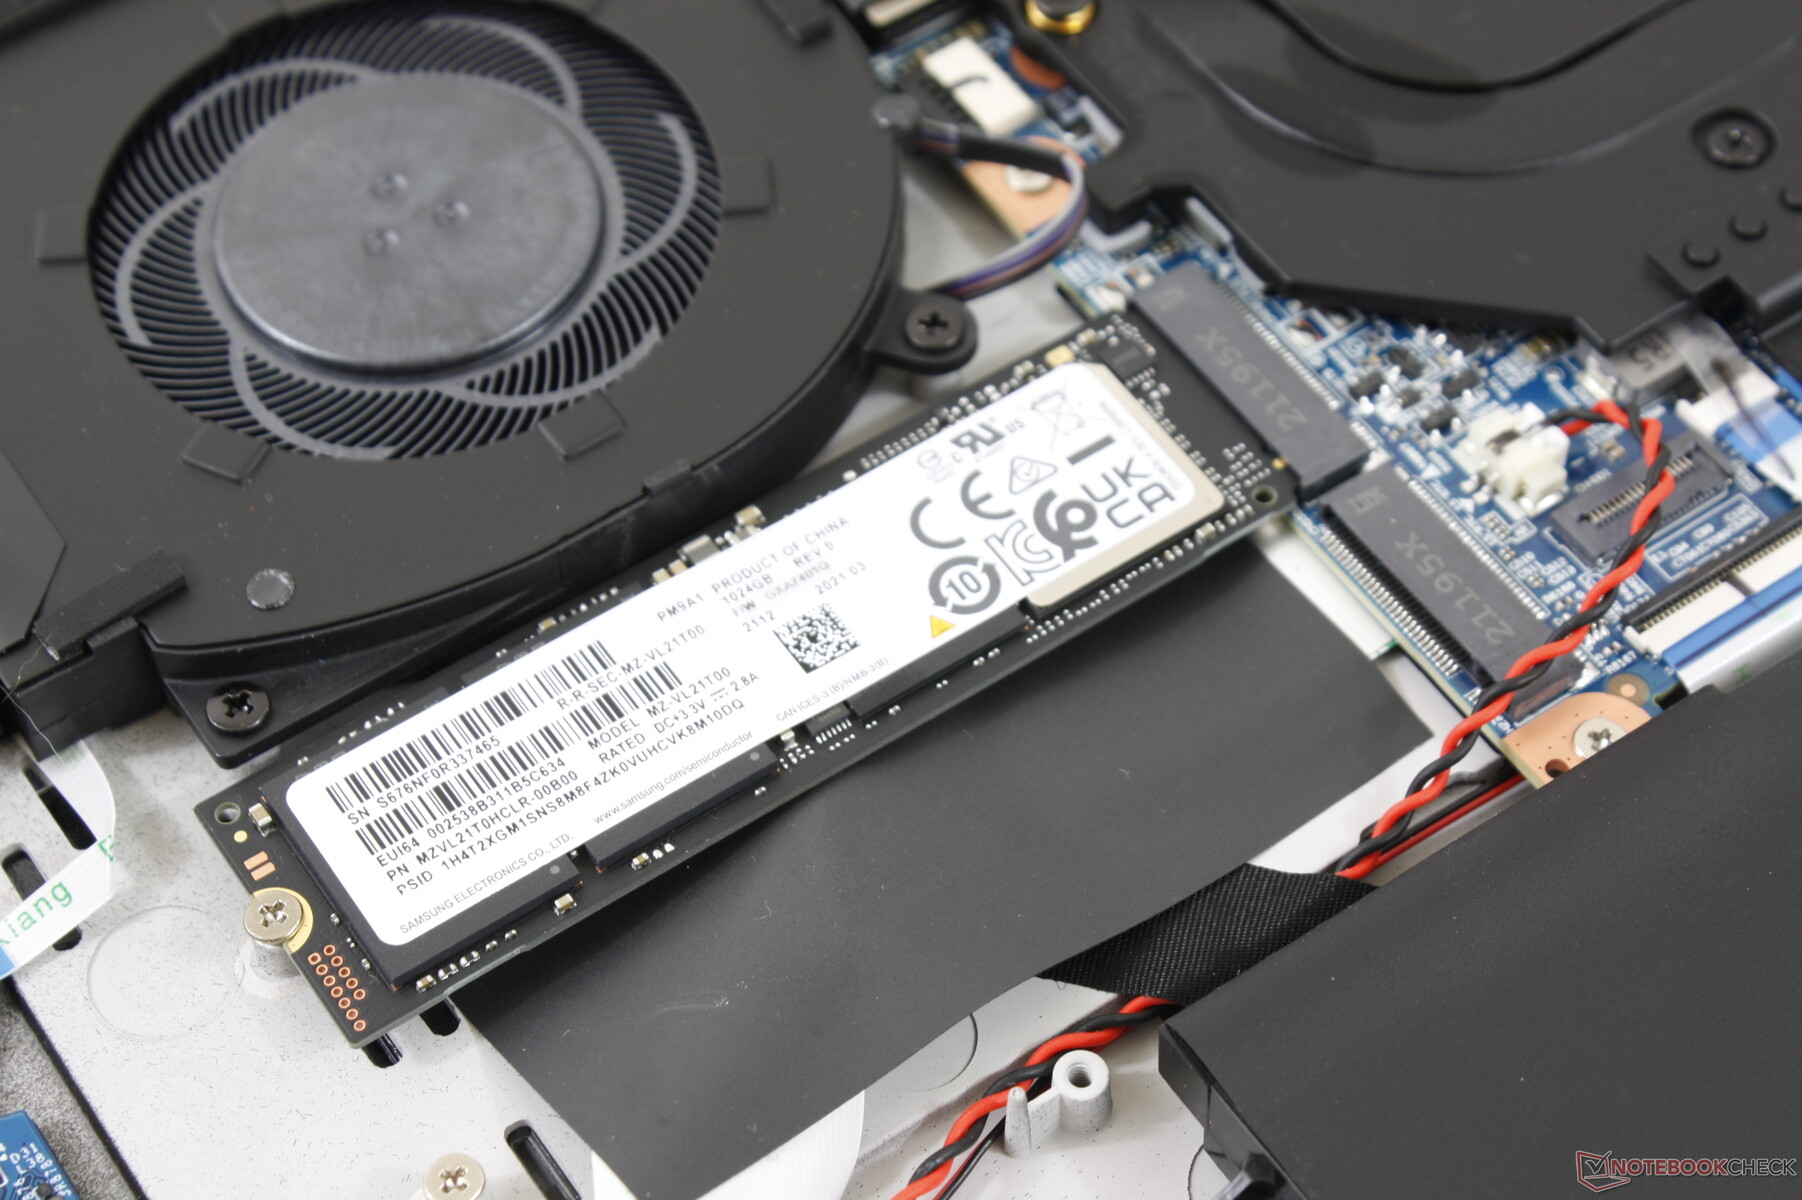
O painel inferior se solta com bastante facilidade após a remoção dos dez parafusos Philips que se encontram embaixo. Os proprietários têm acesso direto à bateria, ambos os slots M.2 2280, ambos os slots de RAM, e o módulo WLAN.
Acessórios e Garantia
Não há extras na caixa de varejo além do adaptador AC, papelada e um par de adesivos com o logotipo Maingear. A garantia padrão limitada de um ano aplica-se com opções de extensão da Maingear.
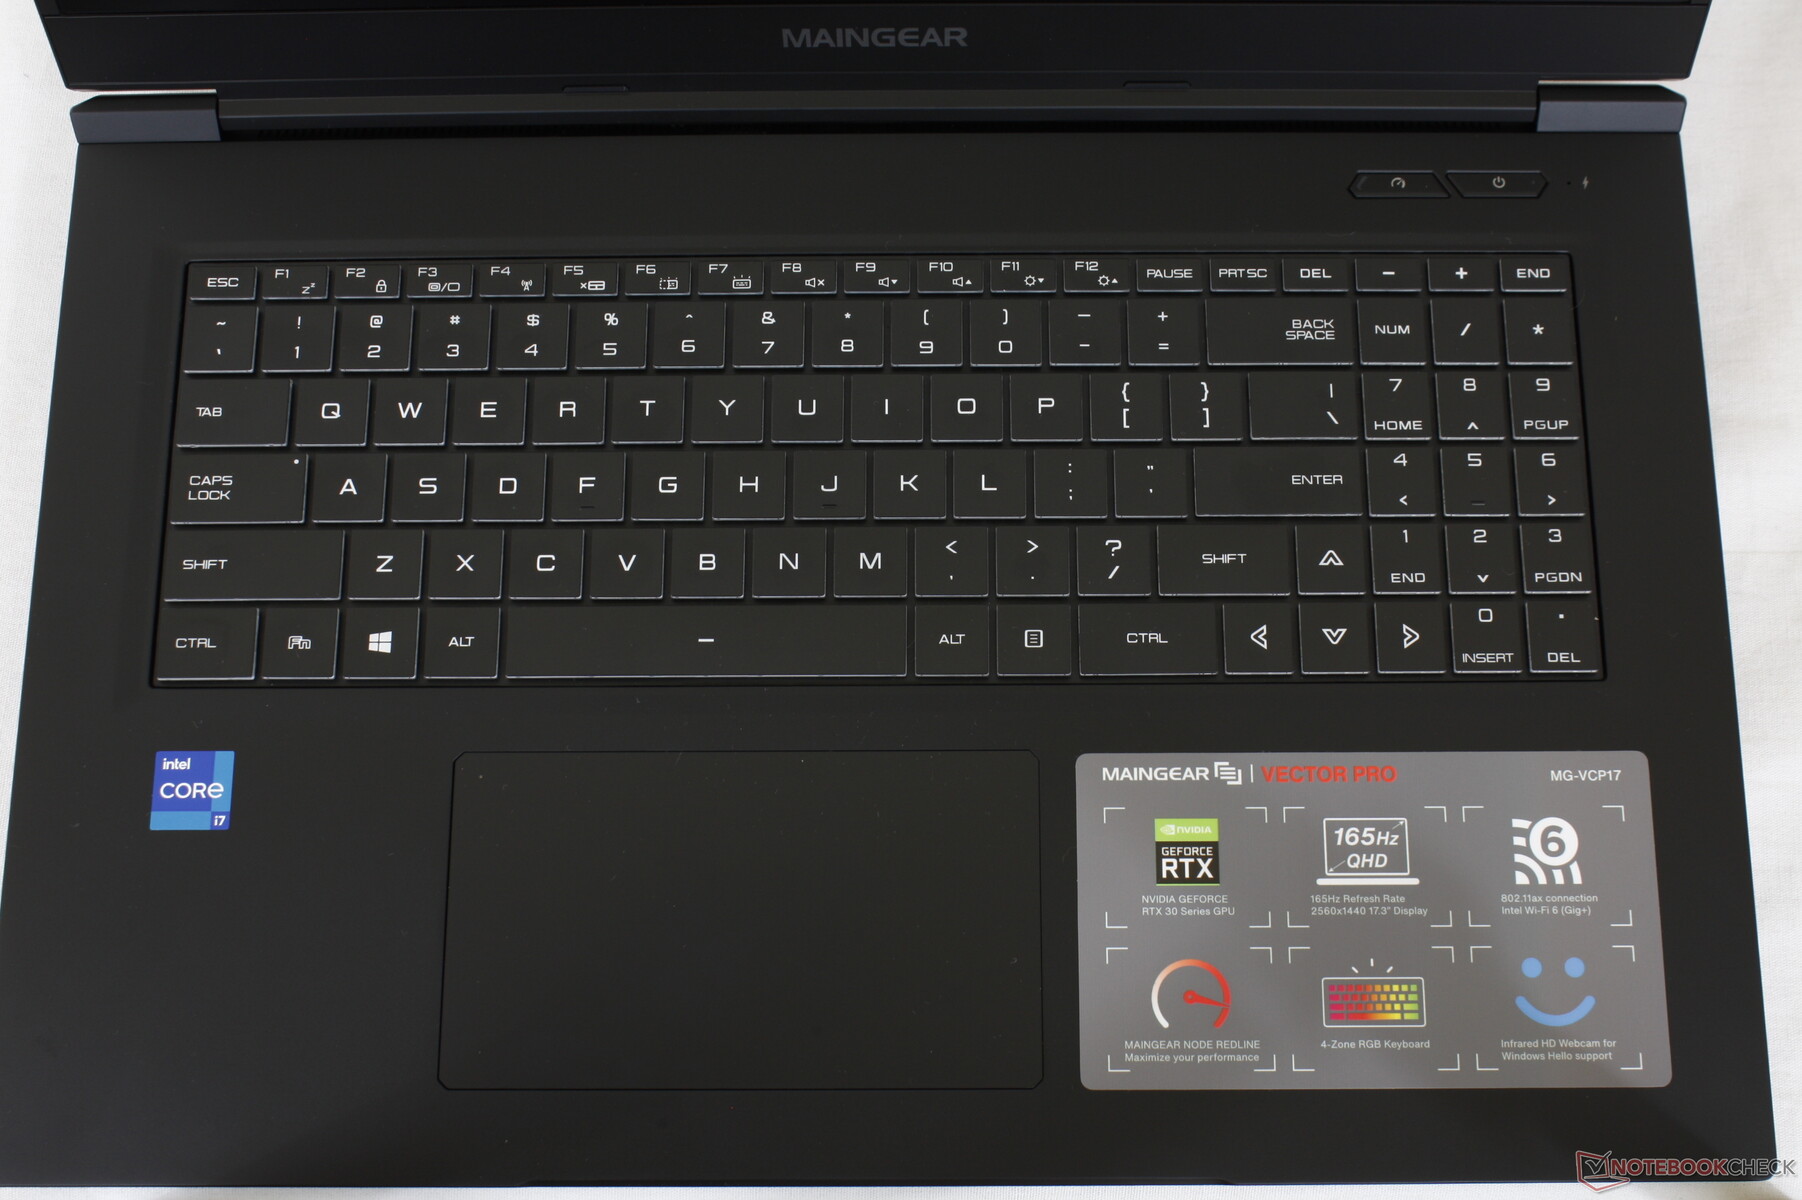
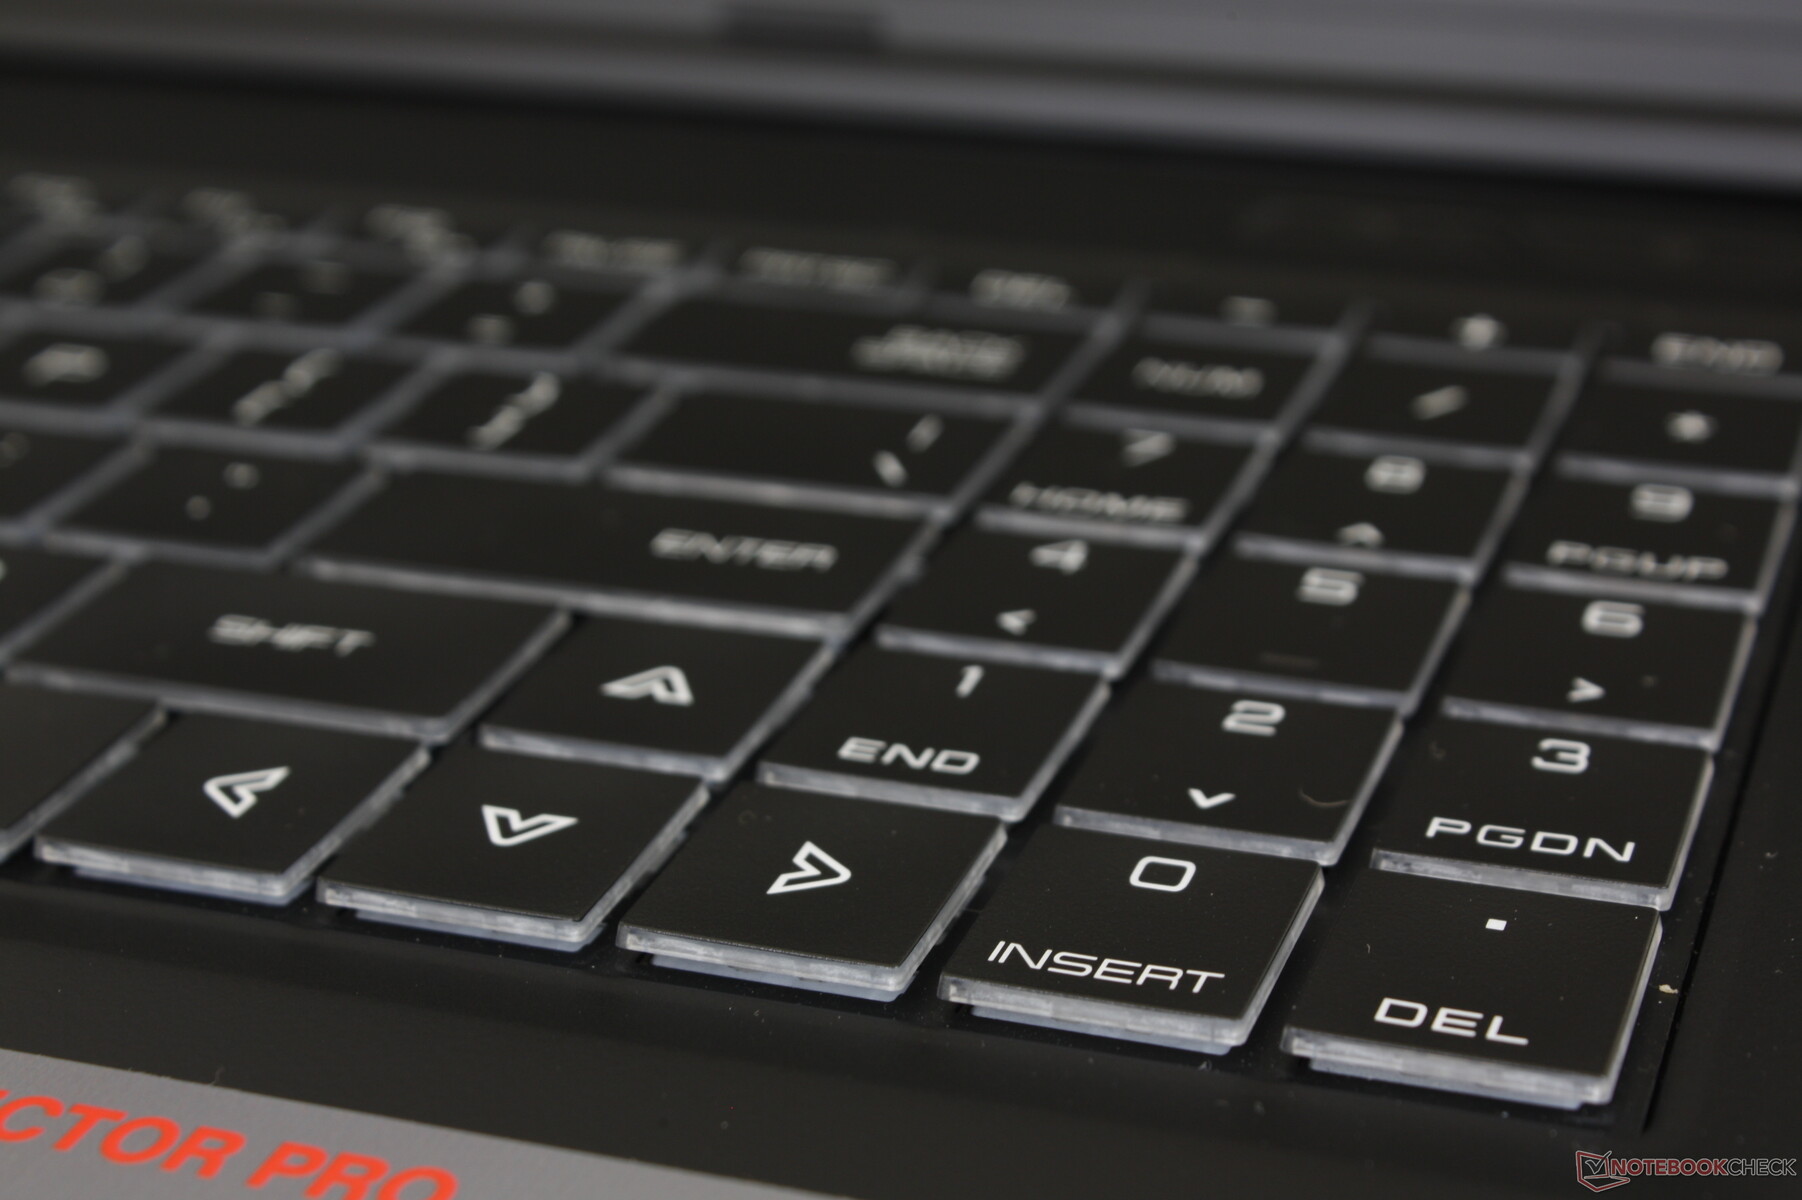
Dispositivos de entrada
Teclado
O feedback chave e as viagens poderiam ter sido mais firmes e mais profundas, especialmente para um laptop para jogos. Embora não tão leve ou rasa como um Asus VivoBook barato, mais dar nas teclas poderia ter melhorado a experiência de jogos e datilografia. O feedback é mais comparável a um Asus Zephyrus do que em um modelo MSI GT ou GS.
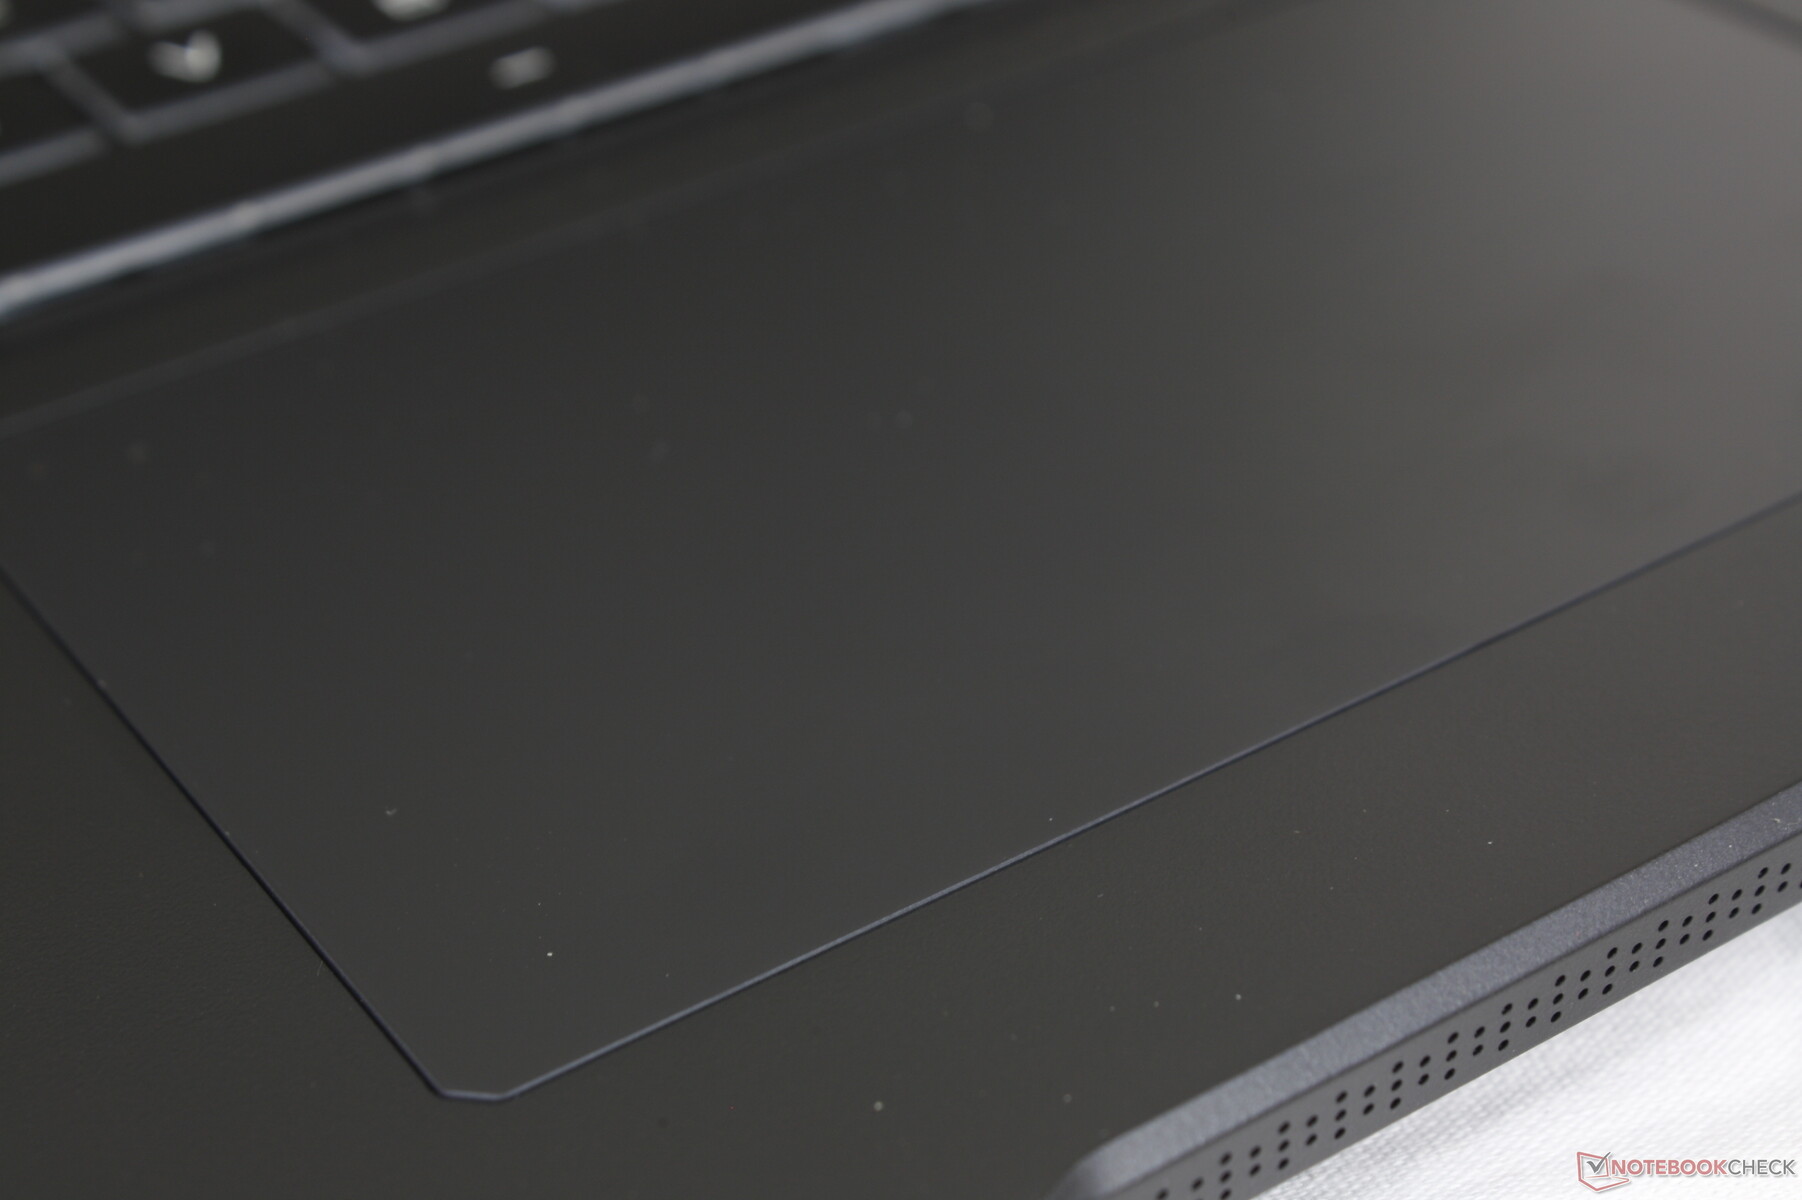
Touchpad
O clickpad é um pouco menor que o do Razer Blade Pro (13,3 x 7,5 cm vs. 13 x 8 cm). O feedback, entretanto, é mais forte e não é tão esponjoso no Maingear.

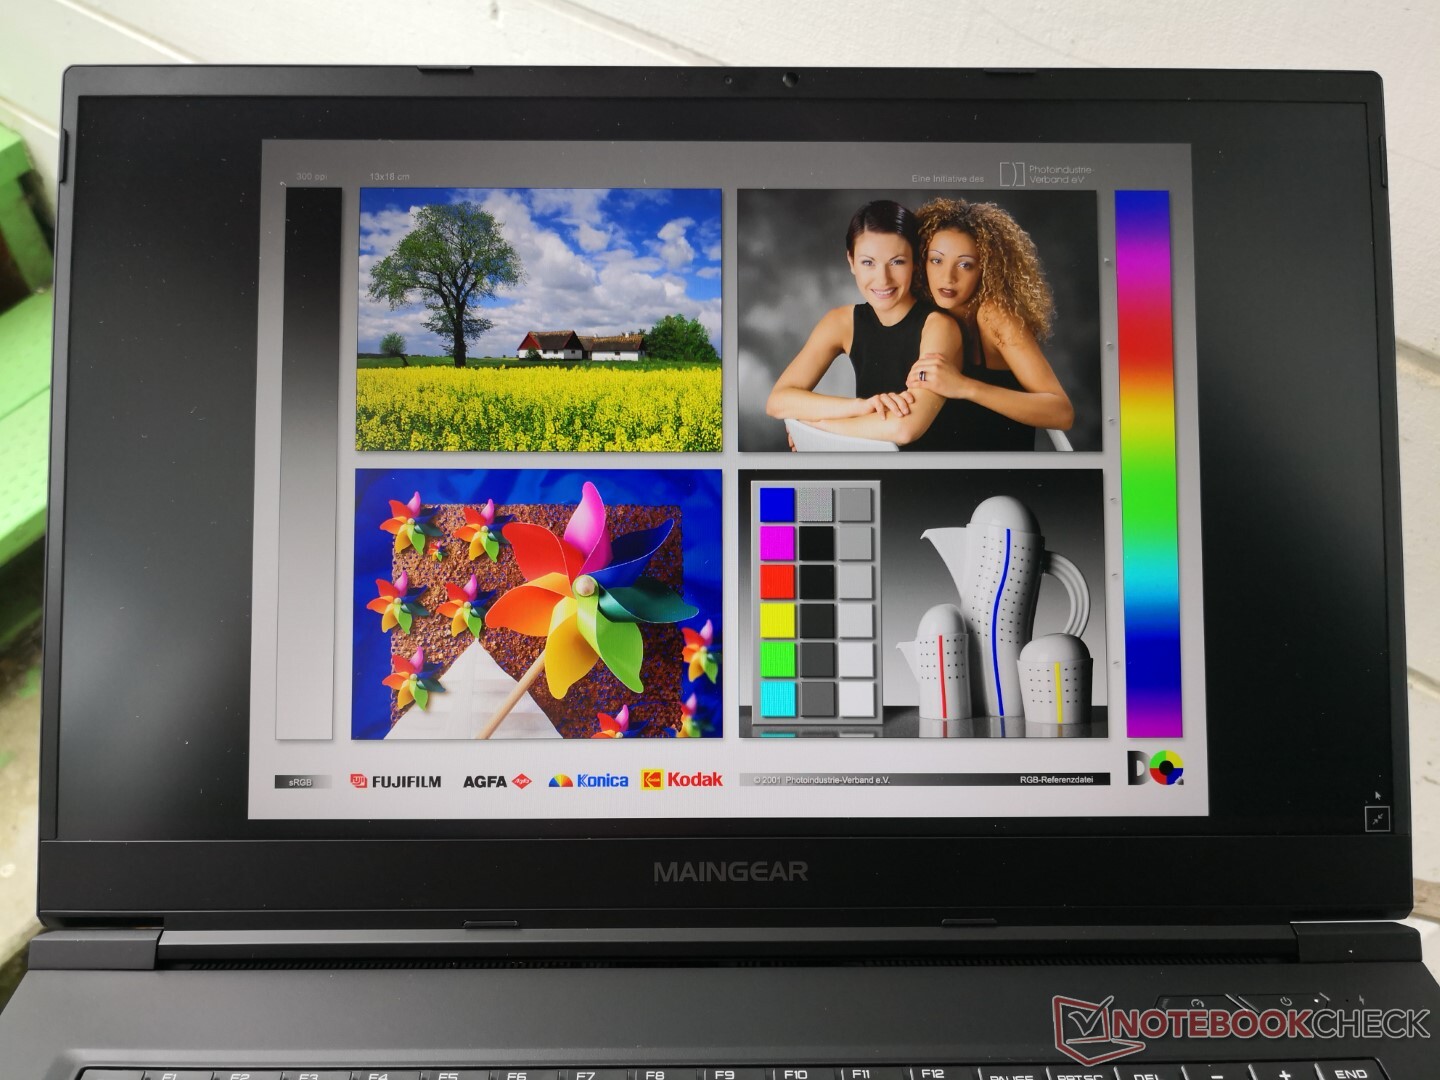
Mostrar
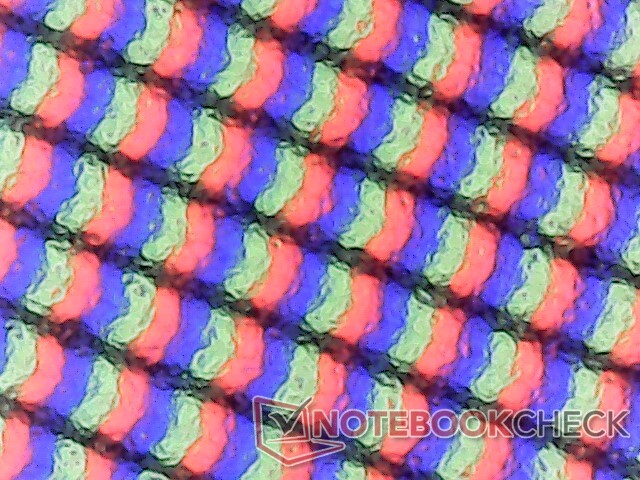
Nosso Vector Pro usa o mesmo painel IPS NE173QHM-NY2 da BOE como encontrado no Schenker XMG Core 17, o que significa que ambos os laptops compartilham atributos de exibição similares. Os tempos de resposta são rápidos com bom brilho, níveis de contraste e taxas de atualização para representar um painel de alta qualidade de 1440p projetado para jogos. BOE tem um painel NE173QHM-NY3 mais novo com tempos de resposta ainda mais rápidos e melhores cores, como encontrado noAsus ROG Zephyrus S17 GX703 e por isso é um pouco decepcionante que nosso Maingear esteja usando uma versão mais antiga
| |||||||||||||||||||||||||
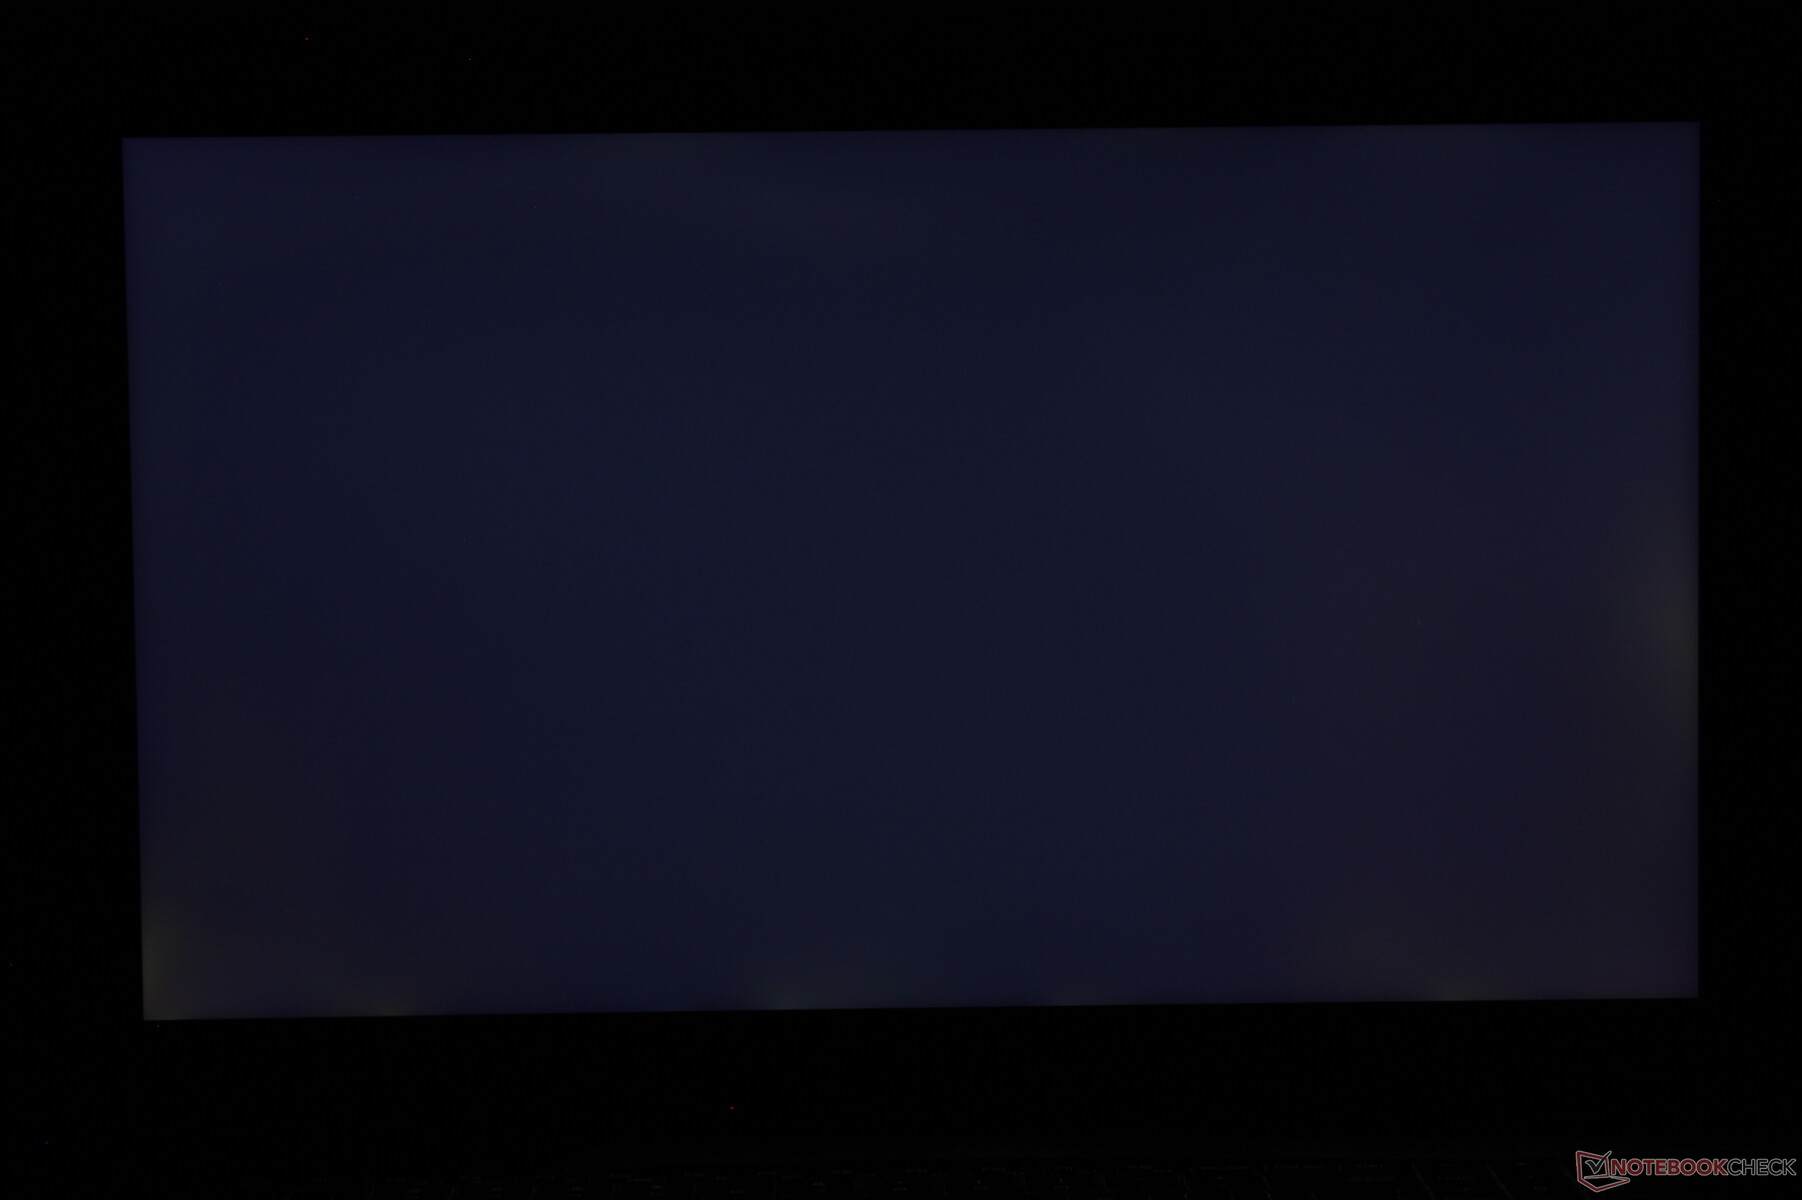
iluminação: 84 %
iluminação com acumulador: 389.7 cd/m²
Contraste: 829:1 (Preto: 0.47 cd/m²)
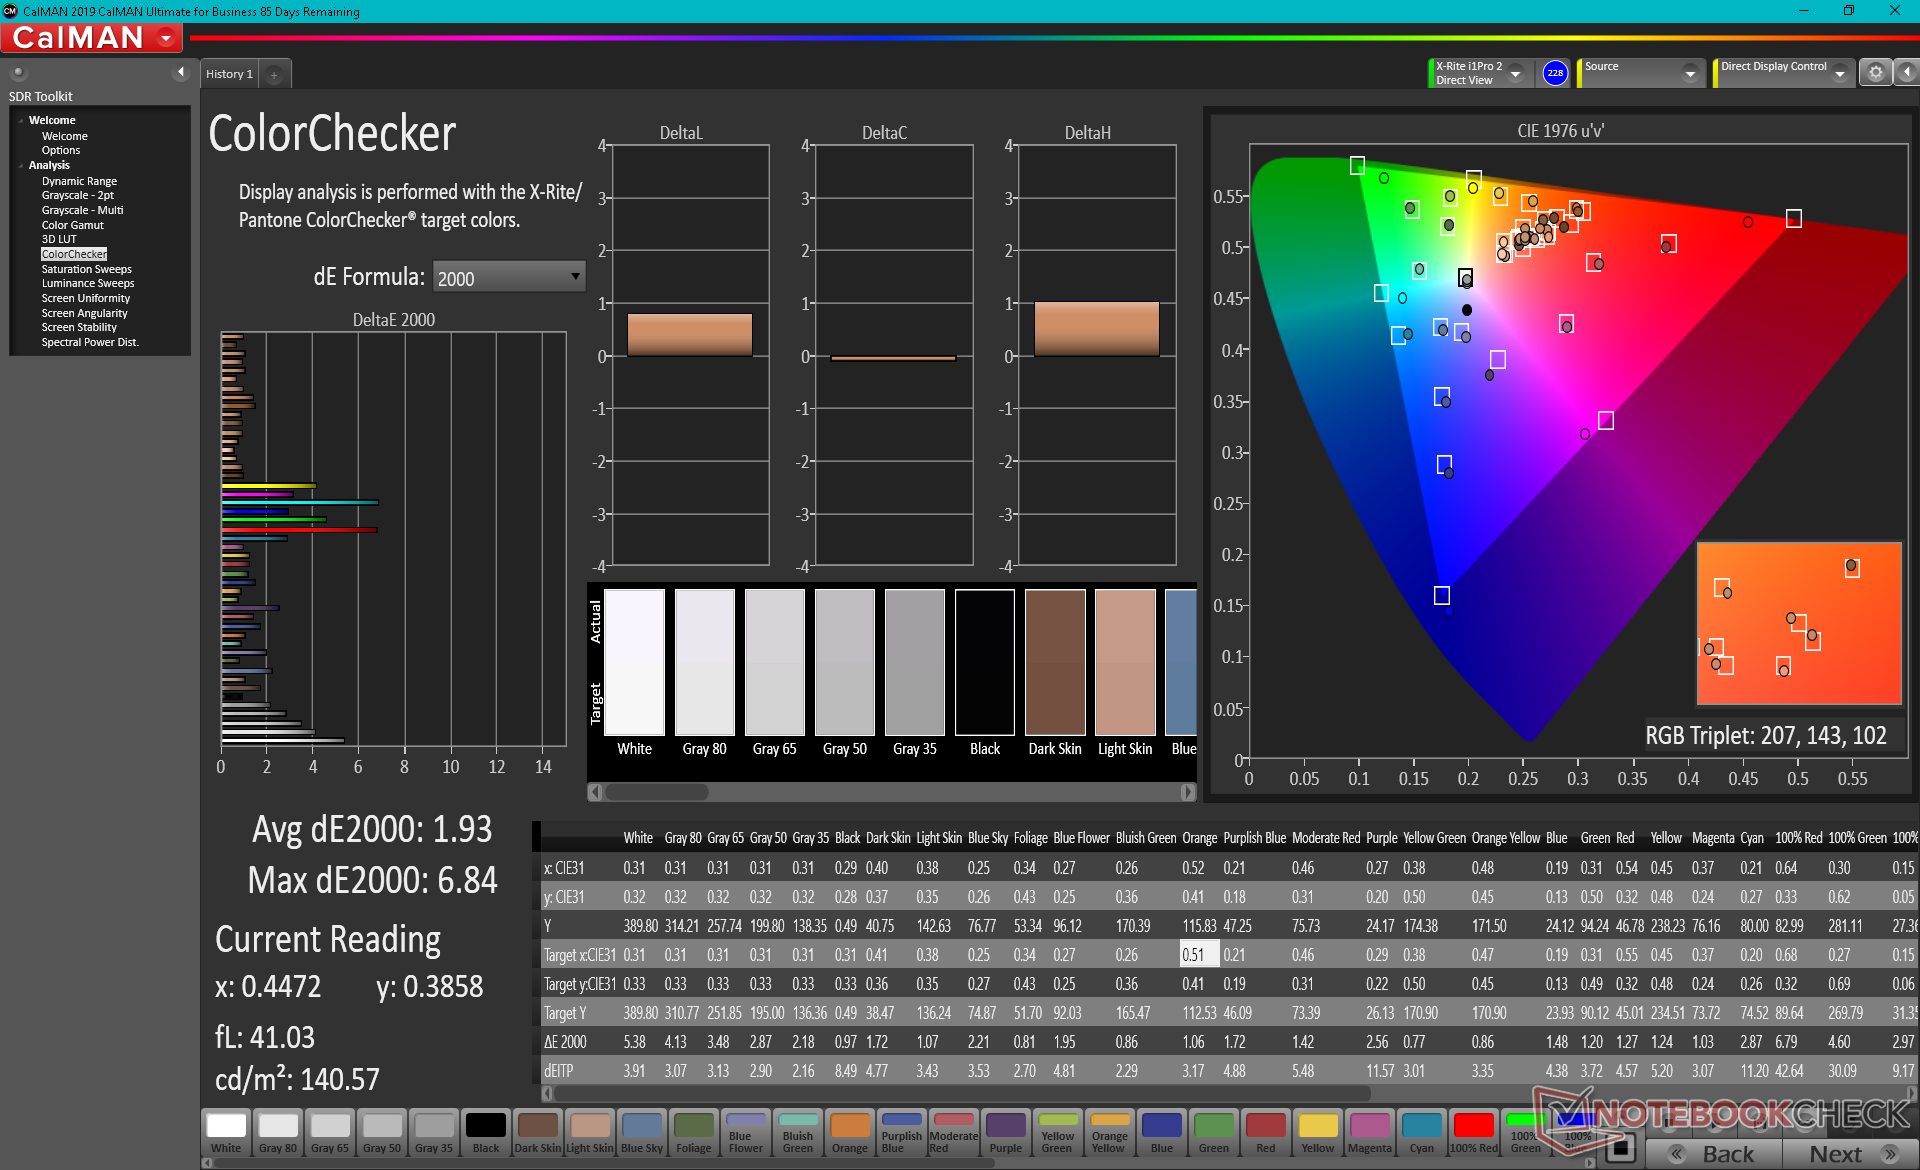
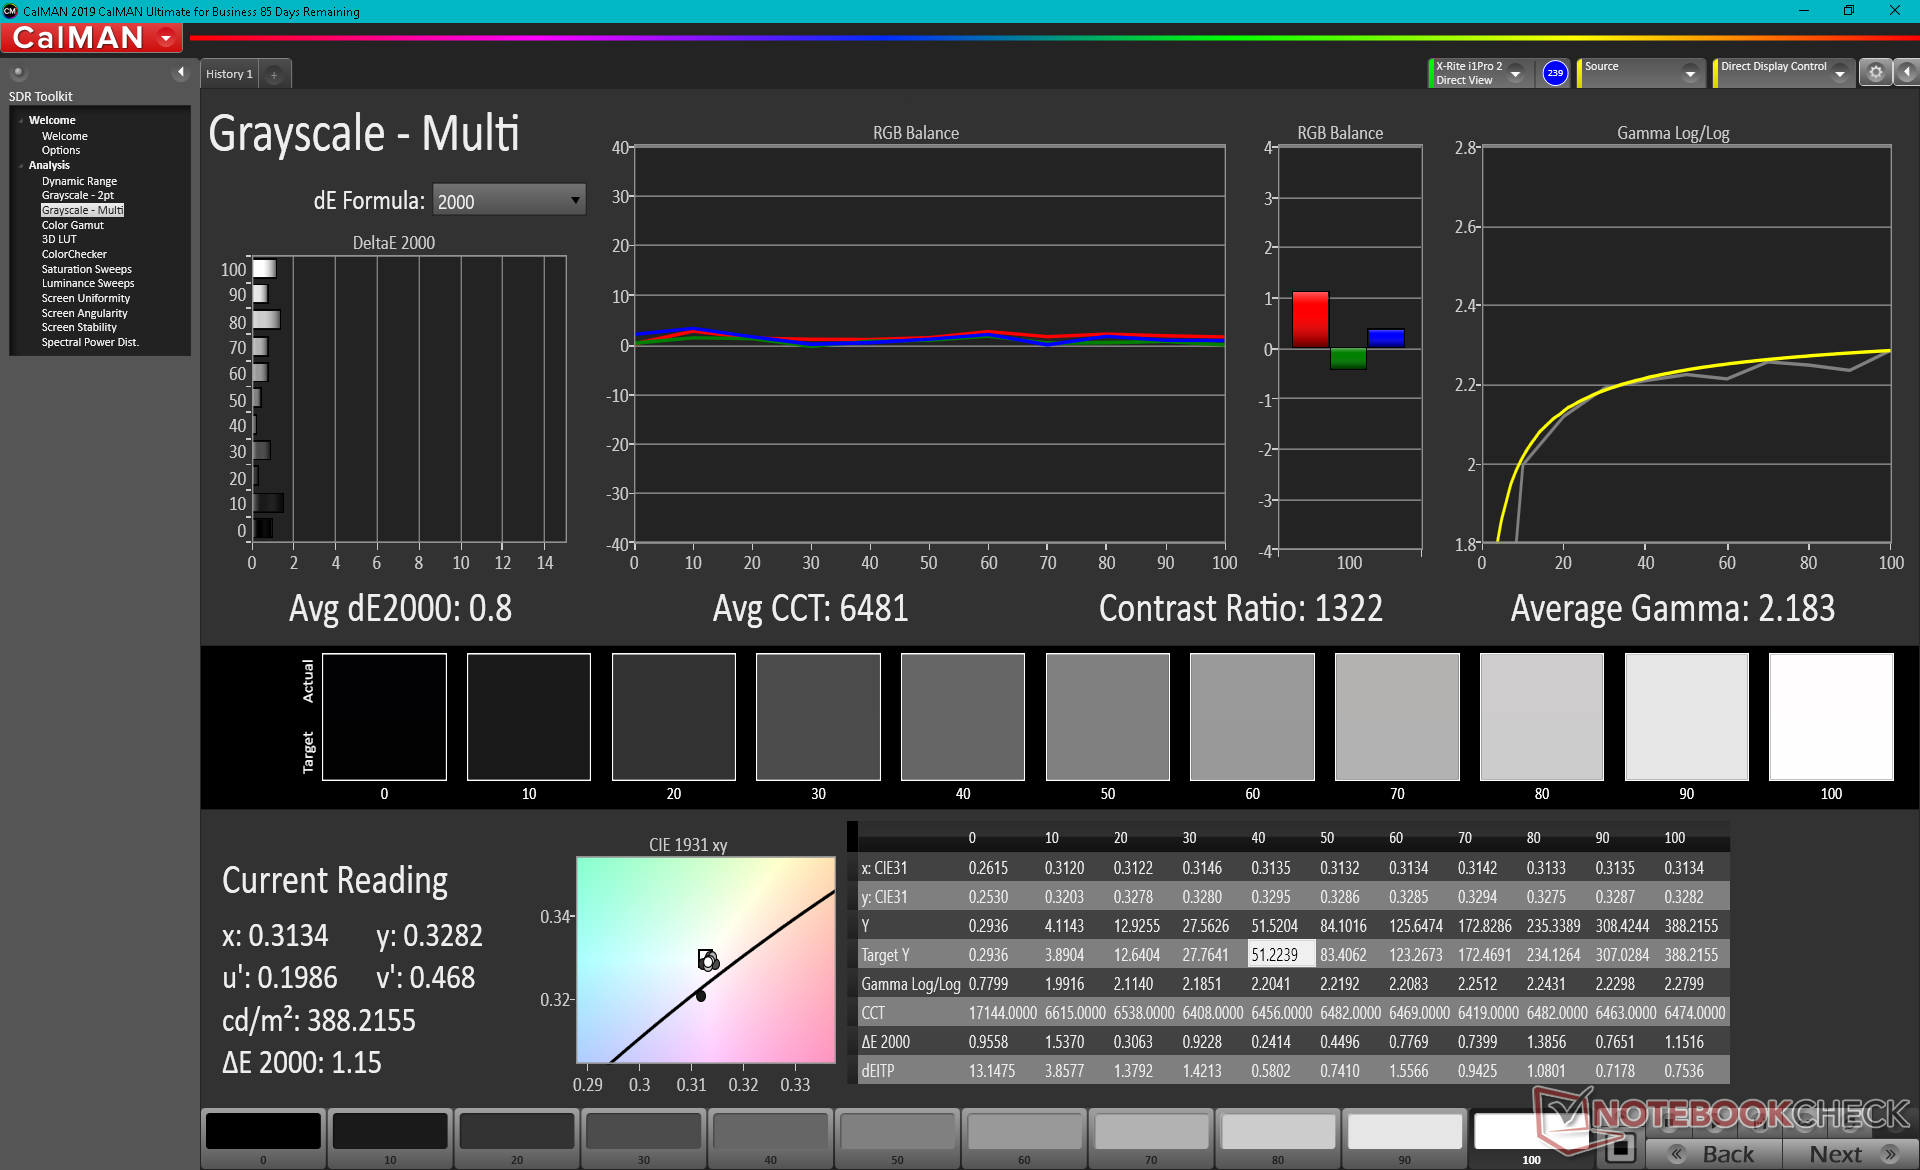
ΔE ColorChecker Calman: 1.93 | ∀{0.5-29.43 Ø4.71}
calibrated: 1.31
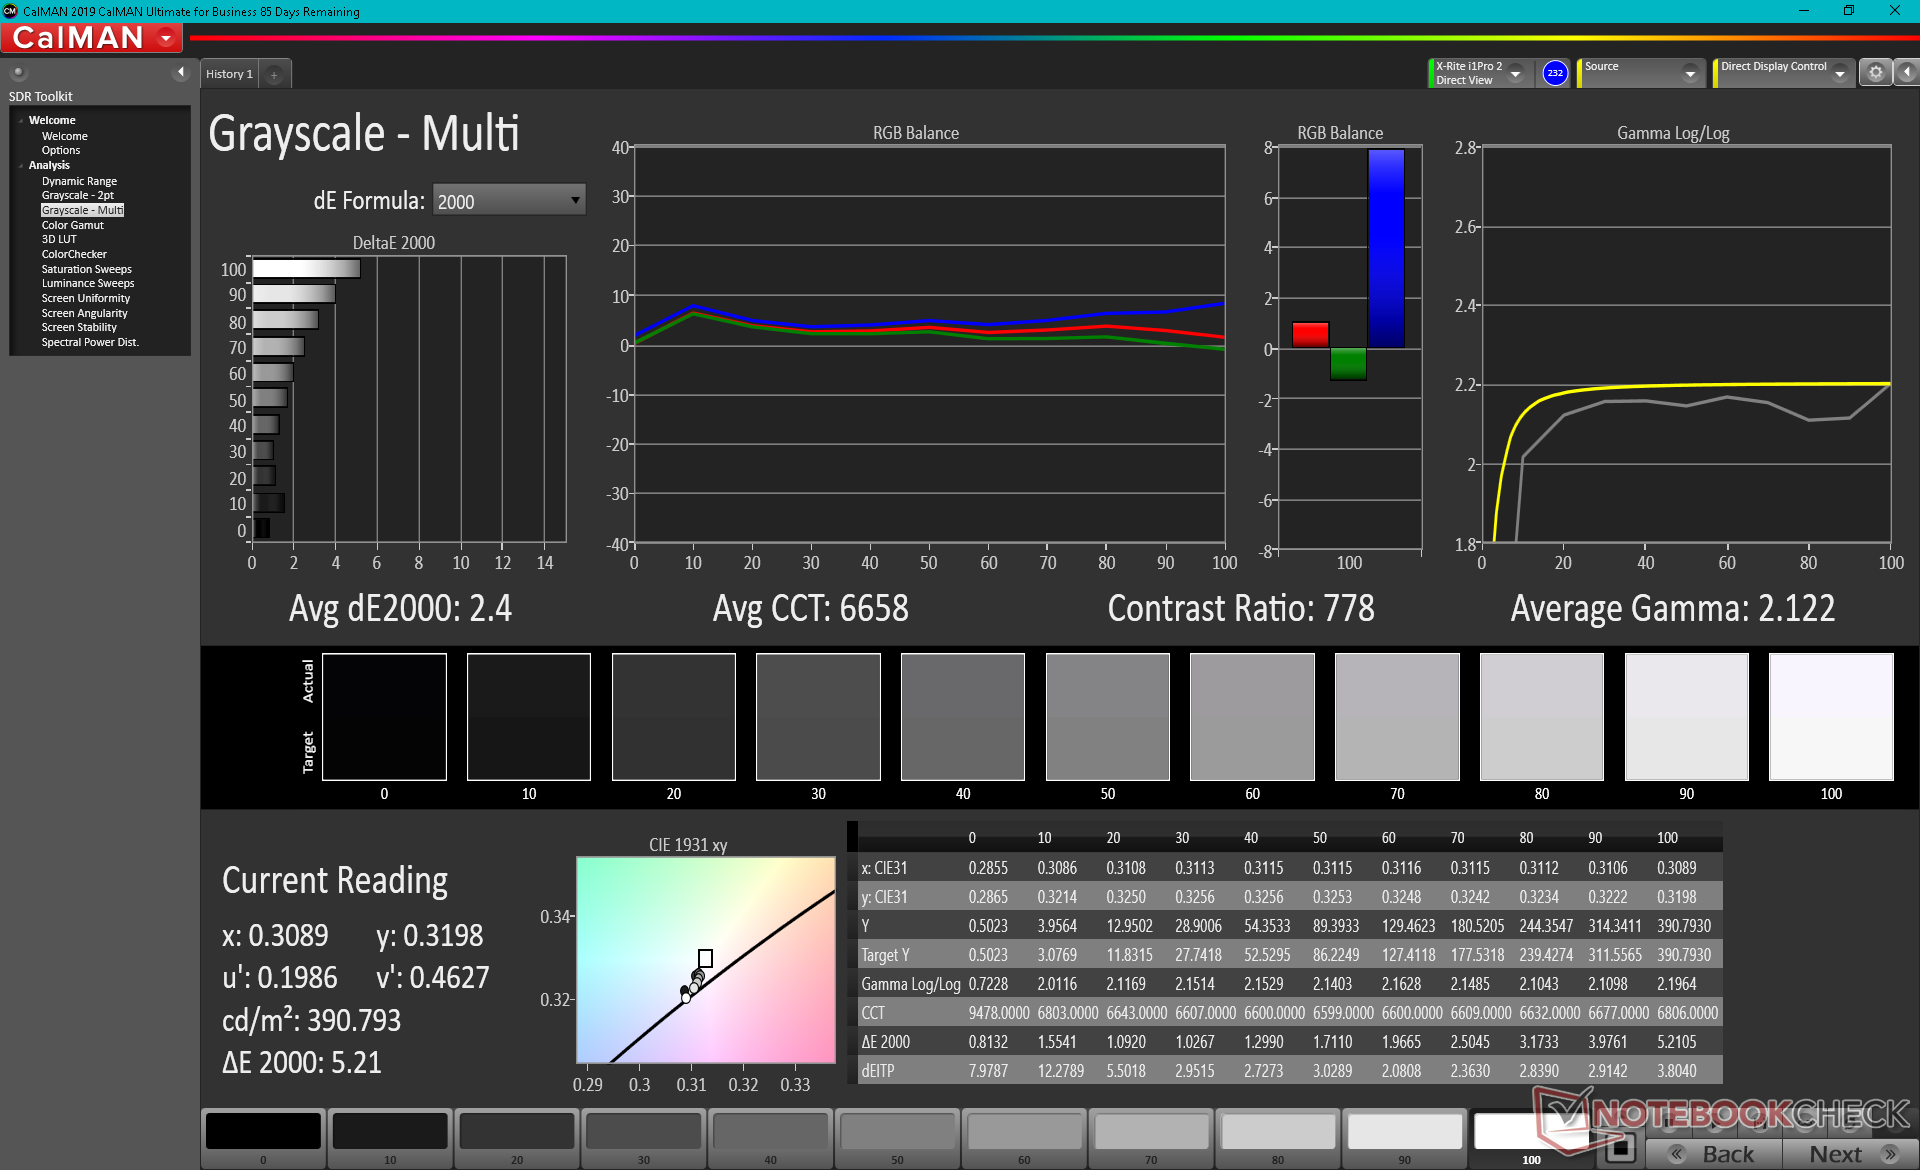
ΔE Greyscale Calman: 2.4 | ∀{0.09-98 Ø4.96}
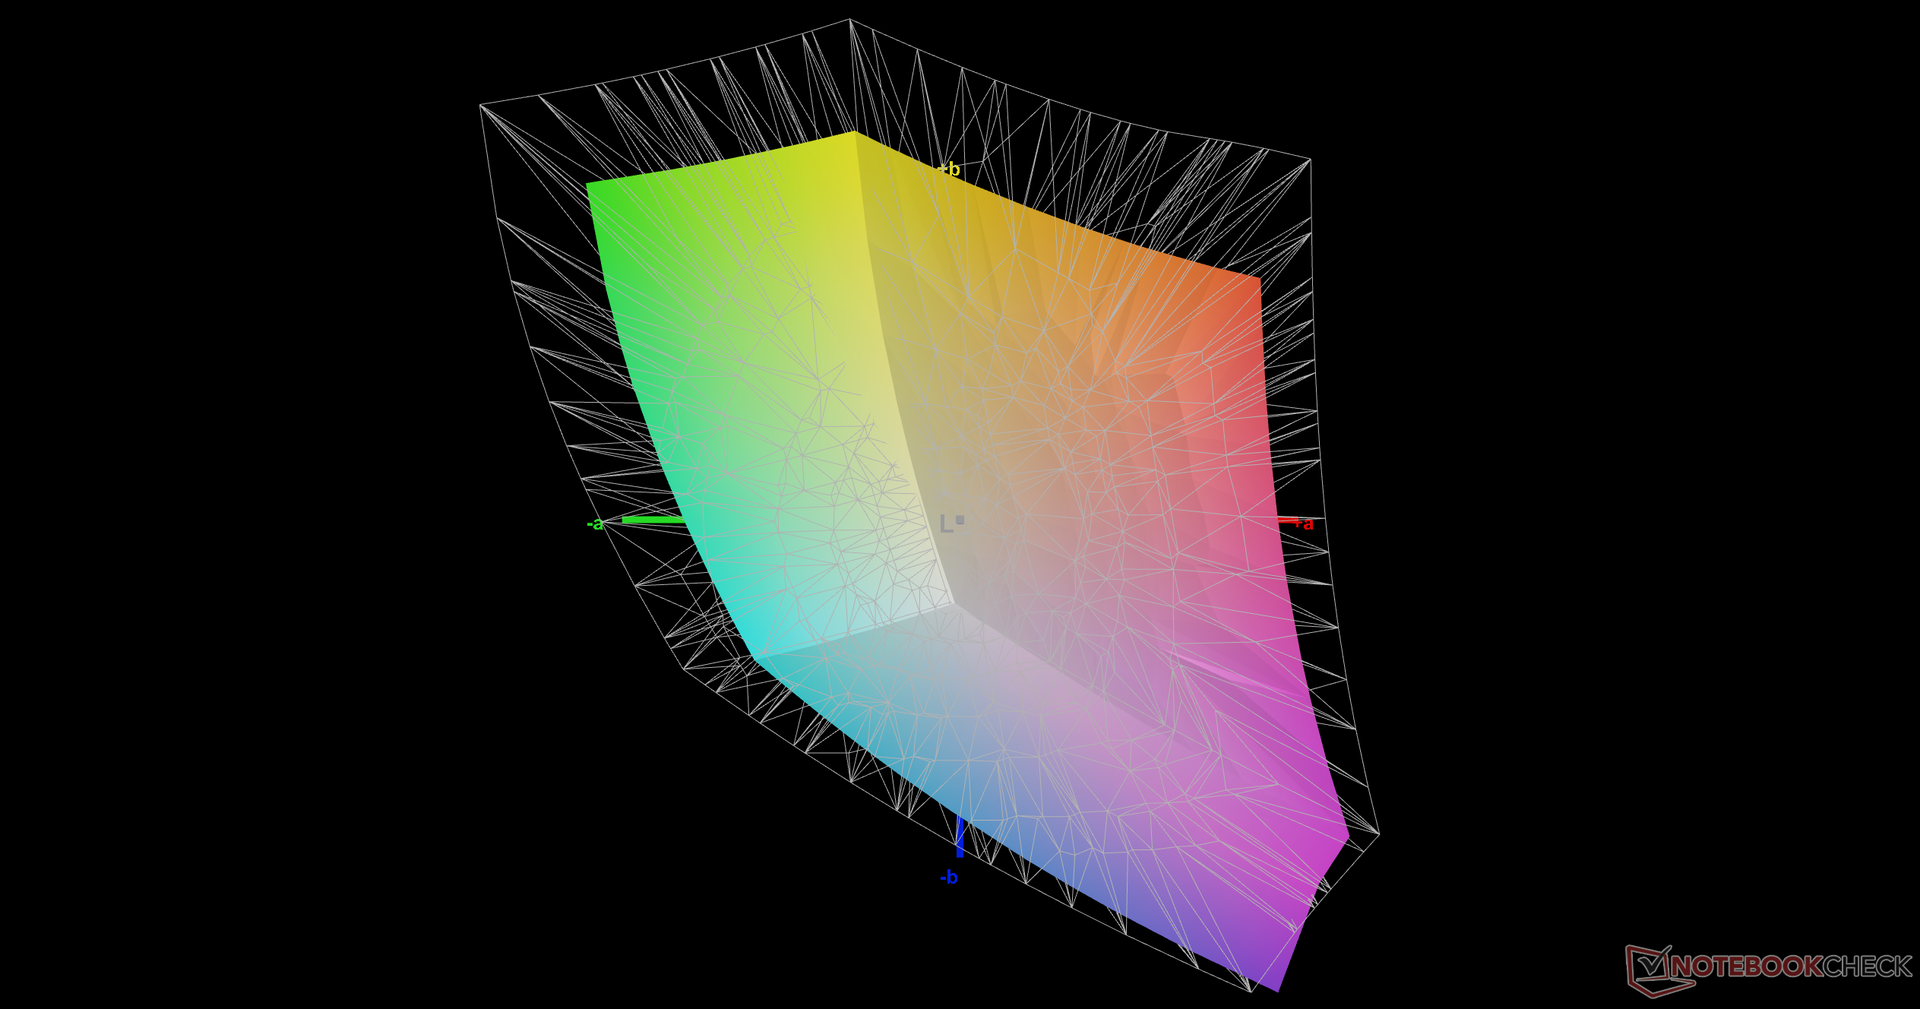
71.7% AdobeRGB 1998 (Argyll 3D)
99.4% sRGB (Argyll 3D)
70.7% Display P3 (Argyll 3D)
Gamma: 2.12
CCT: 6658 K
| Maingear Vector Pro MG-VCP17 BOE NE173QHM-NY2, IPS, 17.3", 2560x1440 | Asus ROG Zephyrus S17 GX703HSD BOE099D (BOE CQ NE173QHM-NY3), IPS, 17.3", 2560x1440 | Schenker XMG Core 17 (Early 2021) BOE CQ NE173QHM-NY2, IPS, 17.3", 2560x1440 | Schenker XMG Neo 17 (Early 2021, RTX 3070, 5800H) BOE NE173QHM-NY2 (BOE0977), IPS, 17.3", 2560x1440 | Schenker Compact 17 AU Optronics B173ZAN03.0, IPS, 17.3", 3840x2160 | MSI GS75 10SF-609US Sharp LQ173M1JW05, IPS, 17.3", 1920x1080 | |
|---|---|---|---|---|---|---|
| Display | 17% | -3% | 0% | 19% | 4% | |
| Display P3 Coverage (%) | 70.7 | 94.2 33% | 68.1 -4% | 70.5 0% | 84.4 19% | 75.6 7% |
| sRGB Coverage (%) | 99.4 | 98.7 -1% | 98.5 -1% | 99.5 0% | 99.9 1% | 99.8 0% |
| AdobeRGB 1998 Coverage (%) | 71.7 | 84.4 18% | 69.3 -3% | 71.8 0% | 98 37% | 75.1 5% |
| Response Times | 51% | 5% | 5% | -197% | 57% | |
| Response Time Grey 50% / Grey 80% * (ms) | 15.6 ? | 4.8 69% | 16.8 ? -8% | 16.8 ? -8% | 51 ? -227% | 5 ? 68% |
| Response Time Black / White * (ms) | 12 ? | 8 33% | 10 ? 17% | 10 ? 17% | 32 ? -167% | 6.6 ? 45% |
| PWM Frequency (Hz) | ||||||
| Screen | -11% | -7% | 4% | -40% | 3% | |
| Brightness middle (cd/m²) | 389.7 | 322 -17% | 370 -5% | 410 5% | 437 12% | 299.4 -23% |
| Brightness (cd/m²) | 363 | 288 -21% | 333 -8% | 381 5% | 413 14% | 299 -18% |
| Brightness Distribution (%) | 84 | 72 -14% | 84 0% | 88 5% | 88 5% | 84 0% |
| Black Level * (cd/m²) | 0.47 | 0.3 36% | 0.38 19% | 0.37 21% | 0.6 -28% | 0.31 34% |
| Contrast (:1) | 829 | 1073 29% | 974 17% | 1108 34% | 728 -12% | 966 17% |
| Colorchecker dE 2000 * | 1.93 | 3.05 -58% | 2.41 -25% | 2.55 -32% | 4.28 -122% | 1.82 6% |
| Colorchecker dE 2000 max. * | 6.84 | 5.23 24% | 7.32 -7% | 4.33 37% | 7.65 -12% | 3.91 43% |
| Colorchecker dE 2000 calibrated * | 1.31 | 1.92 -47% | 1.19 9% | 1.28 2% | 3.41 -160% | 1.59 -21% |
| Greyscale dE 2000 * | 2.4 | 3.11 -30% | 3.9 -63% | 3.4 -42% | 3.8 -58% | 2.7 -13% |
| Gamma | 2.12 104% | 2.13 103% | 2.287 96% | 2.275 97% | 2.49 88% | 2.18 101% |
| CCT | 6658 98% | 6553 99% | 7302 89% | 6637 98% | 7363 88% | 6837 95% |
| Color Space (Percent of AdobeRGB 1998) (%) | 84 | 69 | 72 | 87 | 67.1 | |
| Color Space (Percent of sRGB) (%) | 99 | 93 | 95 | 100 | 99.8 | |
| Média Total (Programa/Configurações) | 19% /
4% | -2% /
-4% | 3% /
3% | -73% /
-50% | 21% /
11% |
* ... menor é melhor
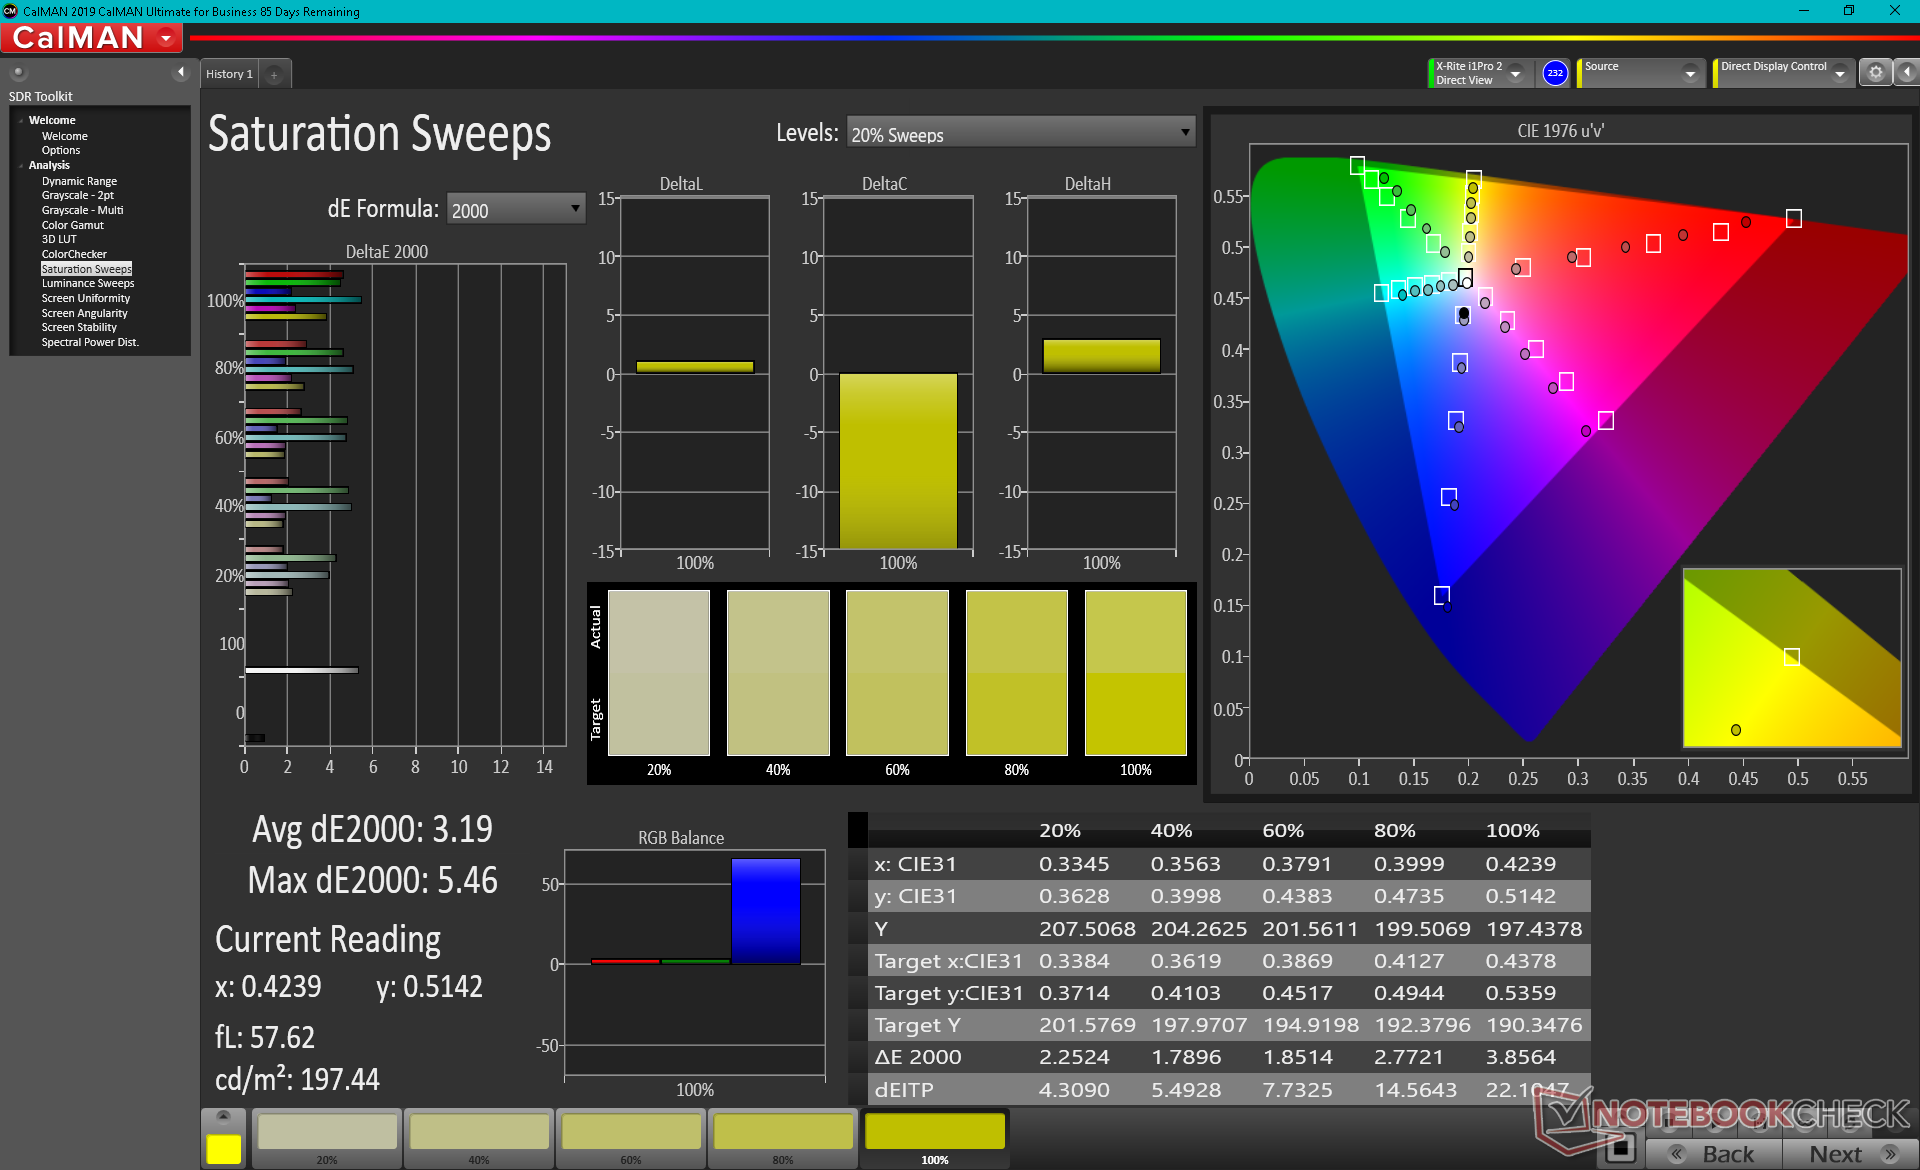
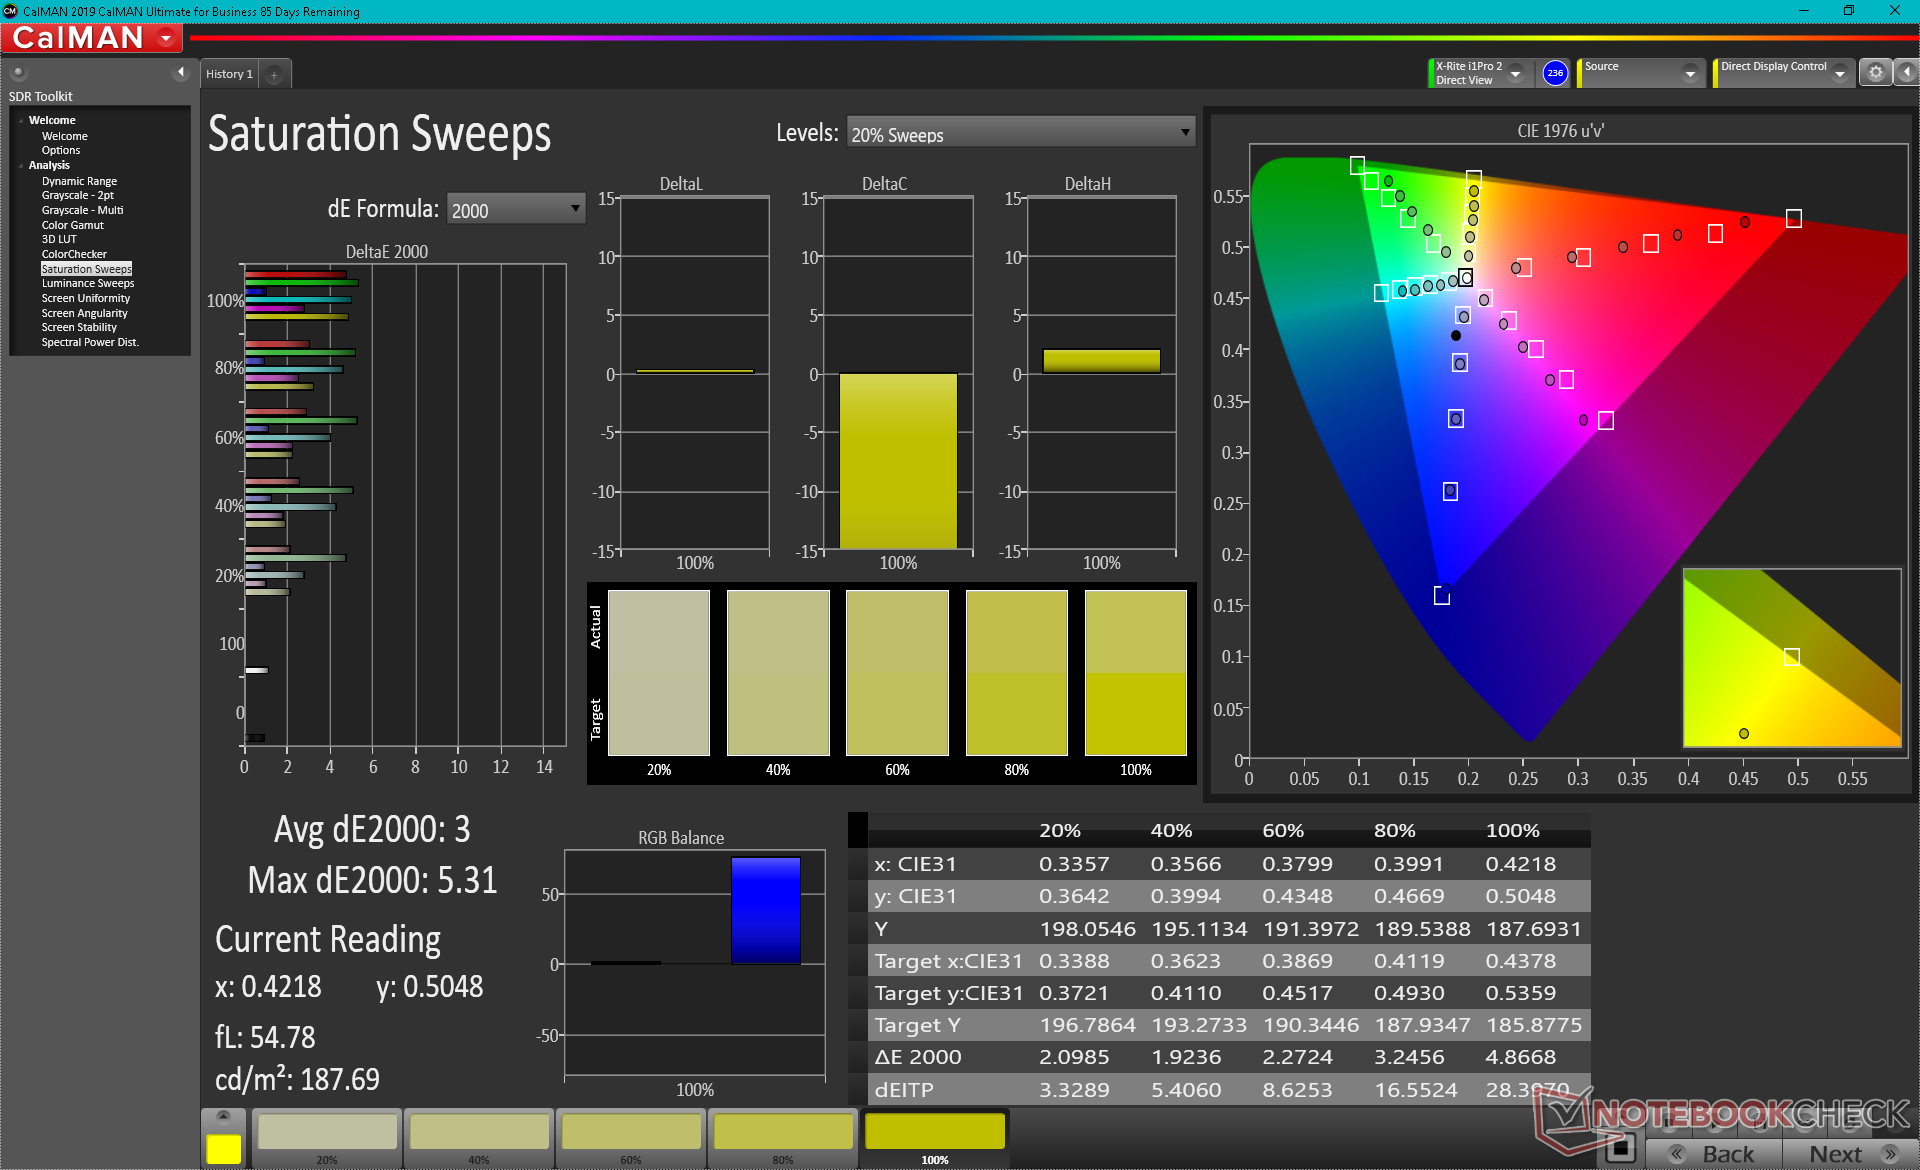
O espaço de cores cobre sRGB inteiramente e aproximadamente 72% do AdobeRGB. Os painéis IPS 4K de resolução mais alta tendem a oferecer cores mais profundas, embora ao custo de taxas de atualização e tempos de resposta mais lentos.
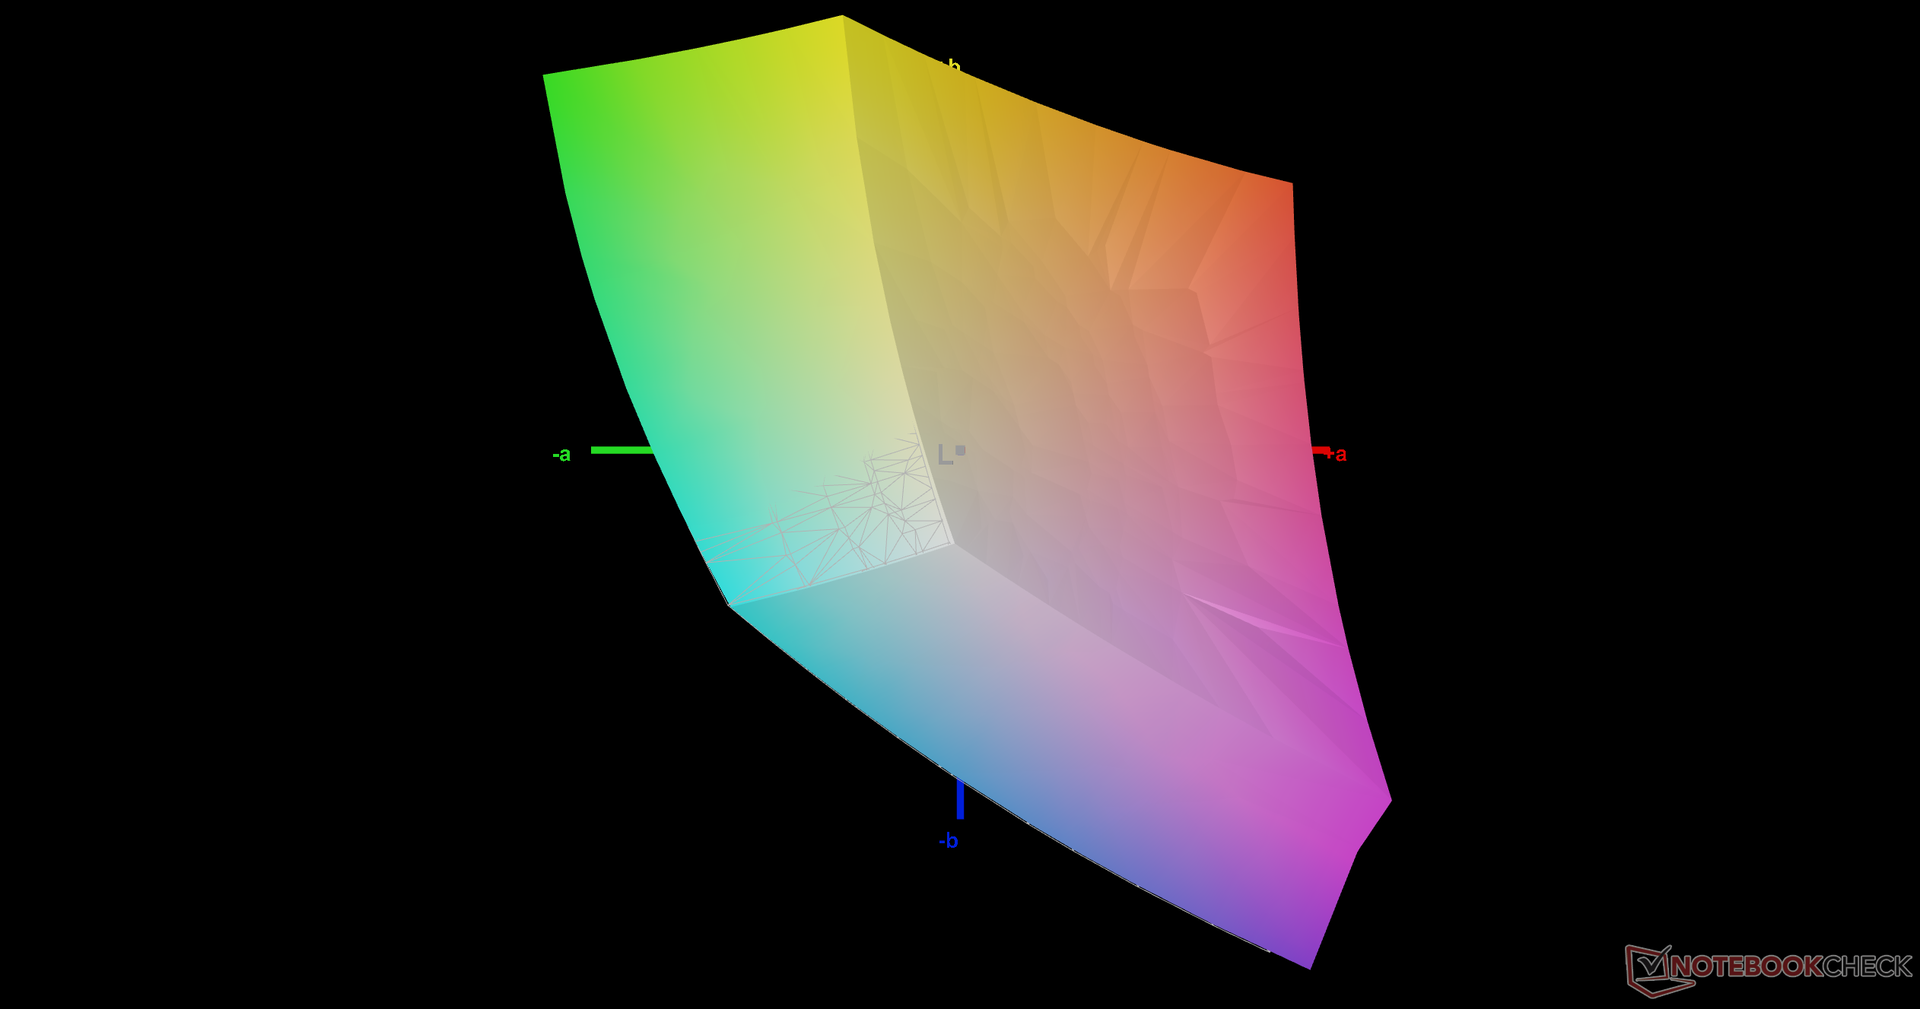
As cores e a escala de cinza são bastante exatas fora da caixa, sugerindo que não é realmente necessário mexer no usuário final. No entanto, nossa própria calibração com um colorímetro X-Rite melhoraria os valores médios da escala de cinza apenas ligeiramente em toda a linha.

Exibir tempos de resposta
| ↔ Tempo de resposta preto para branco | ||
|---|---|---|
| 12 ms ... ascensão ↗ e queda ↘ combinadas | ↗ 6.8 ms ascensão | 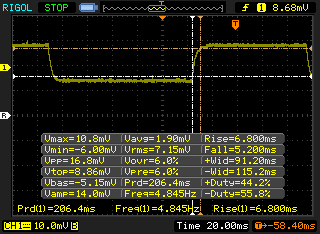 |
| ↘ 5.2 ms queda | ||
| A tela mostra boas taxas de resposta em nossos testes, mas pode ser muito lenta para jogadores competitivos. Em comparação, todos os dispositivos testados variam de 0.1 (mínimo) a 240 (máximo) ms. » 32 % de todos os dispositivos são melhores. Isso significa que o tempo de resposta medido é melhor que a média de todos os dispositivos testados (19.8 ms). | ||
| ↔ Tempo de resposta 50% cinza a 80% cinza | ||
| 15.6 ms ... ascensão ↗ e queda ↘ combinadas | ↗ 8.4 ms ascensão | 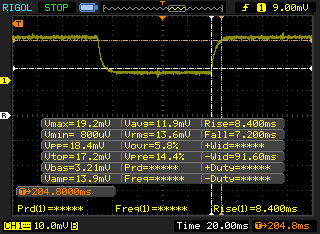 |
| ↘ 7.2 ms queda | ||
| A tela mostra boas taxas de resposta em nossos testes, mas pode ser muito lenta para jogadores competitivos. Em comparação, todos os dispositivos testados variam de 0.165 (mínimo) a 636 (máximo) ms. » 30 % de todos os dispositivos são melhores. Isso significa que o tempo de resposta medido é melhor que a média de todos os dispositivos testados (31 ms). | ||
Cintilação da tela / PWM (modulação por largura de pulso)
| Tela tremeluzindo / PWM não detectado | 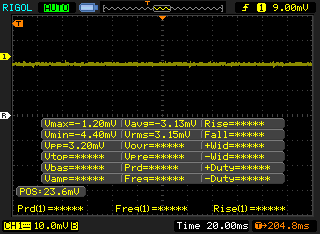 | ||
[pwm_comparison] Em comparação: 52 % de todos os dispositivos testados não usam PWM para escurecer a tela. Se PWM foi detectado, uma média de 7754 (mínimo: 5 - máximo: 343500) Hz foi medida. | |||
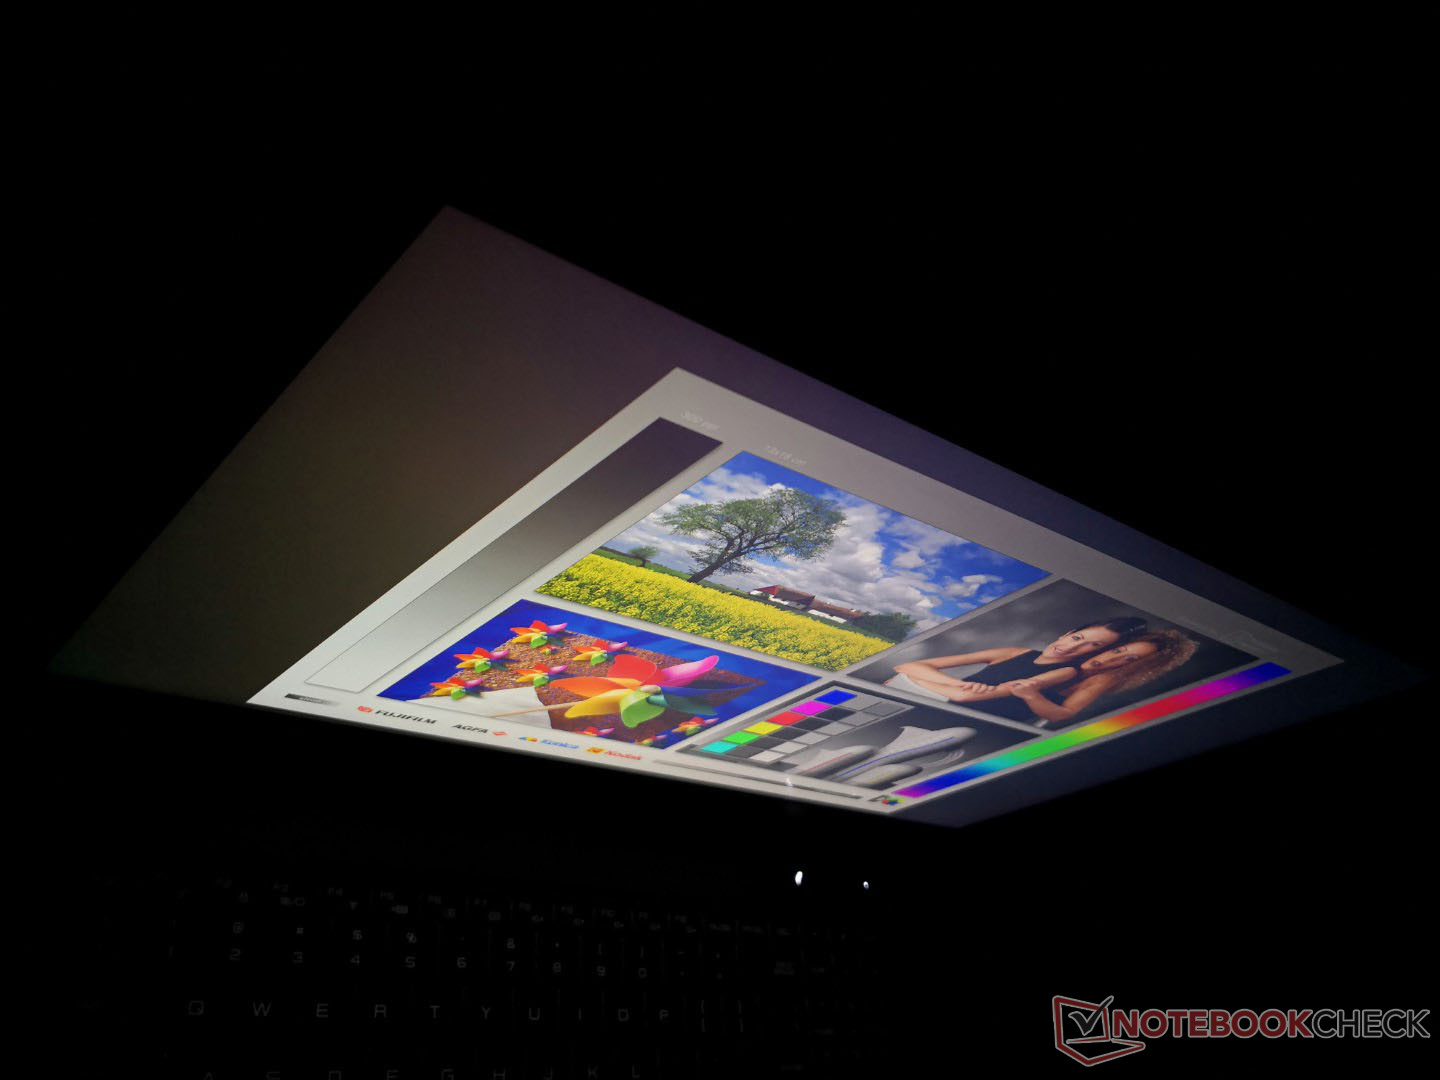
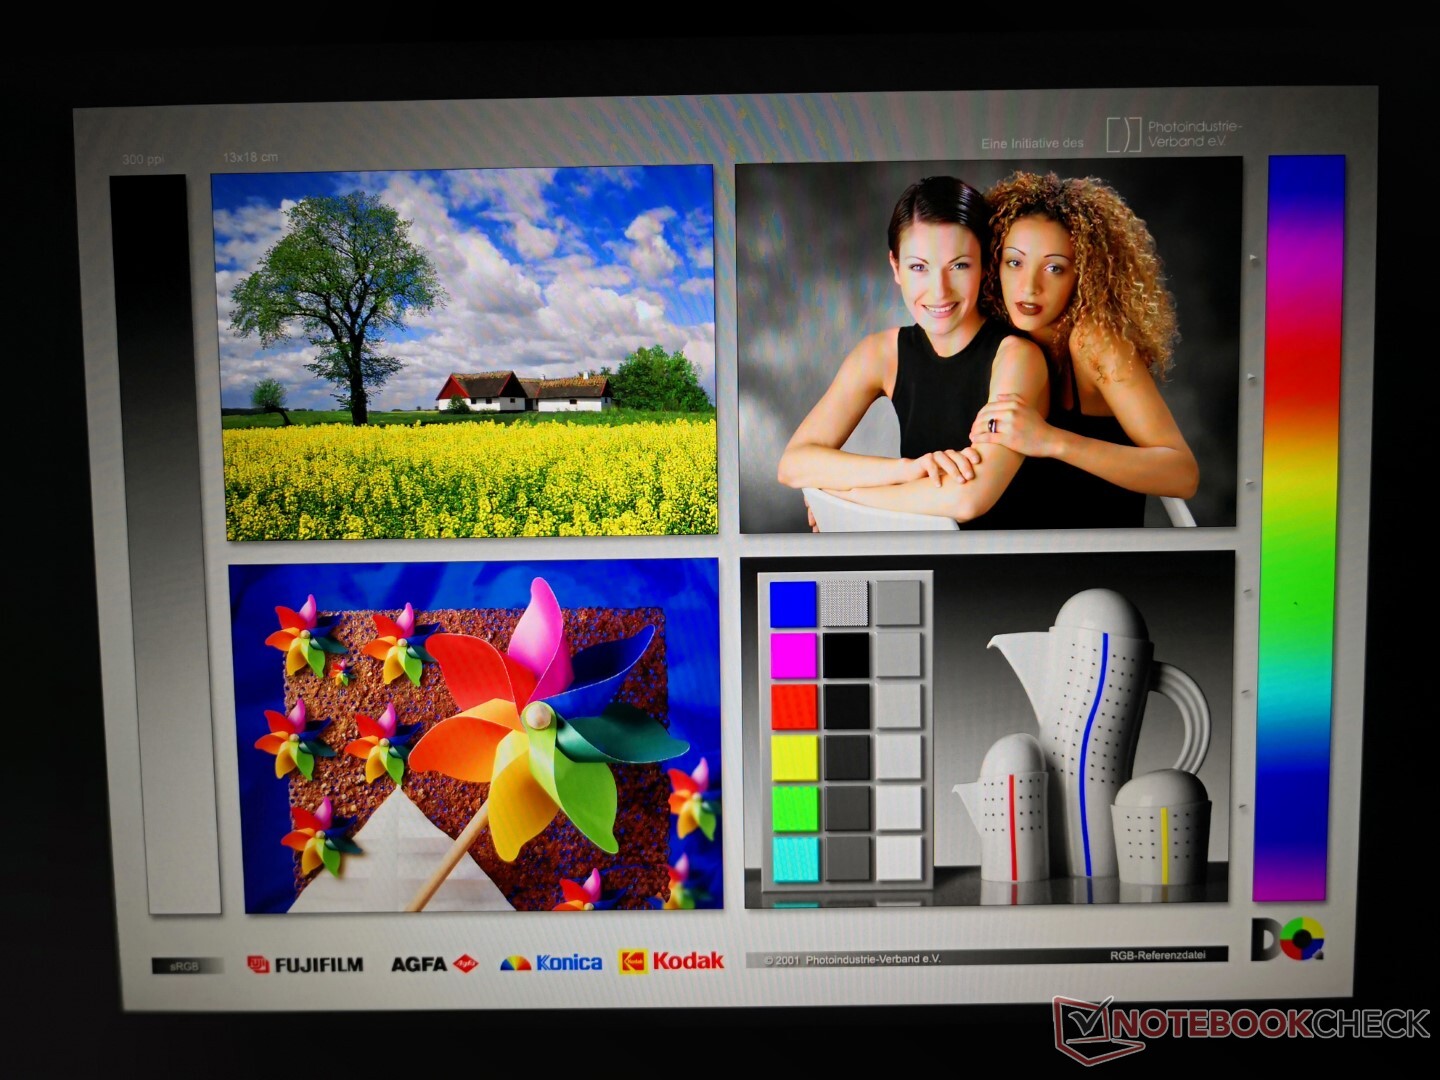
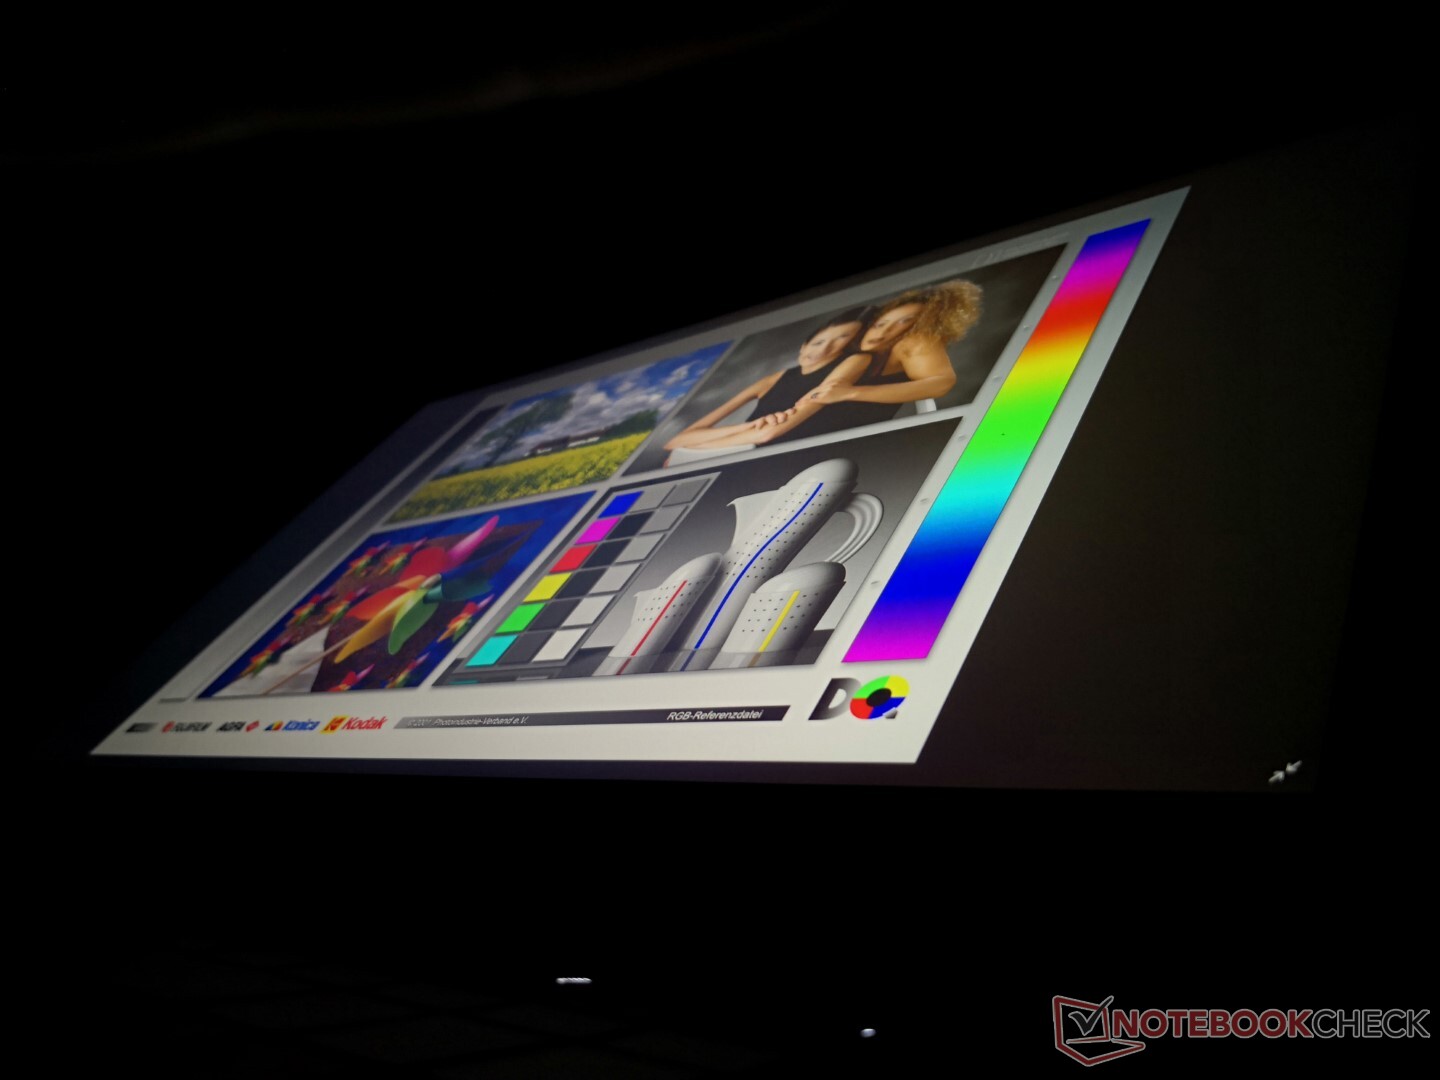
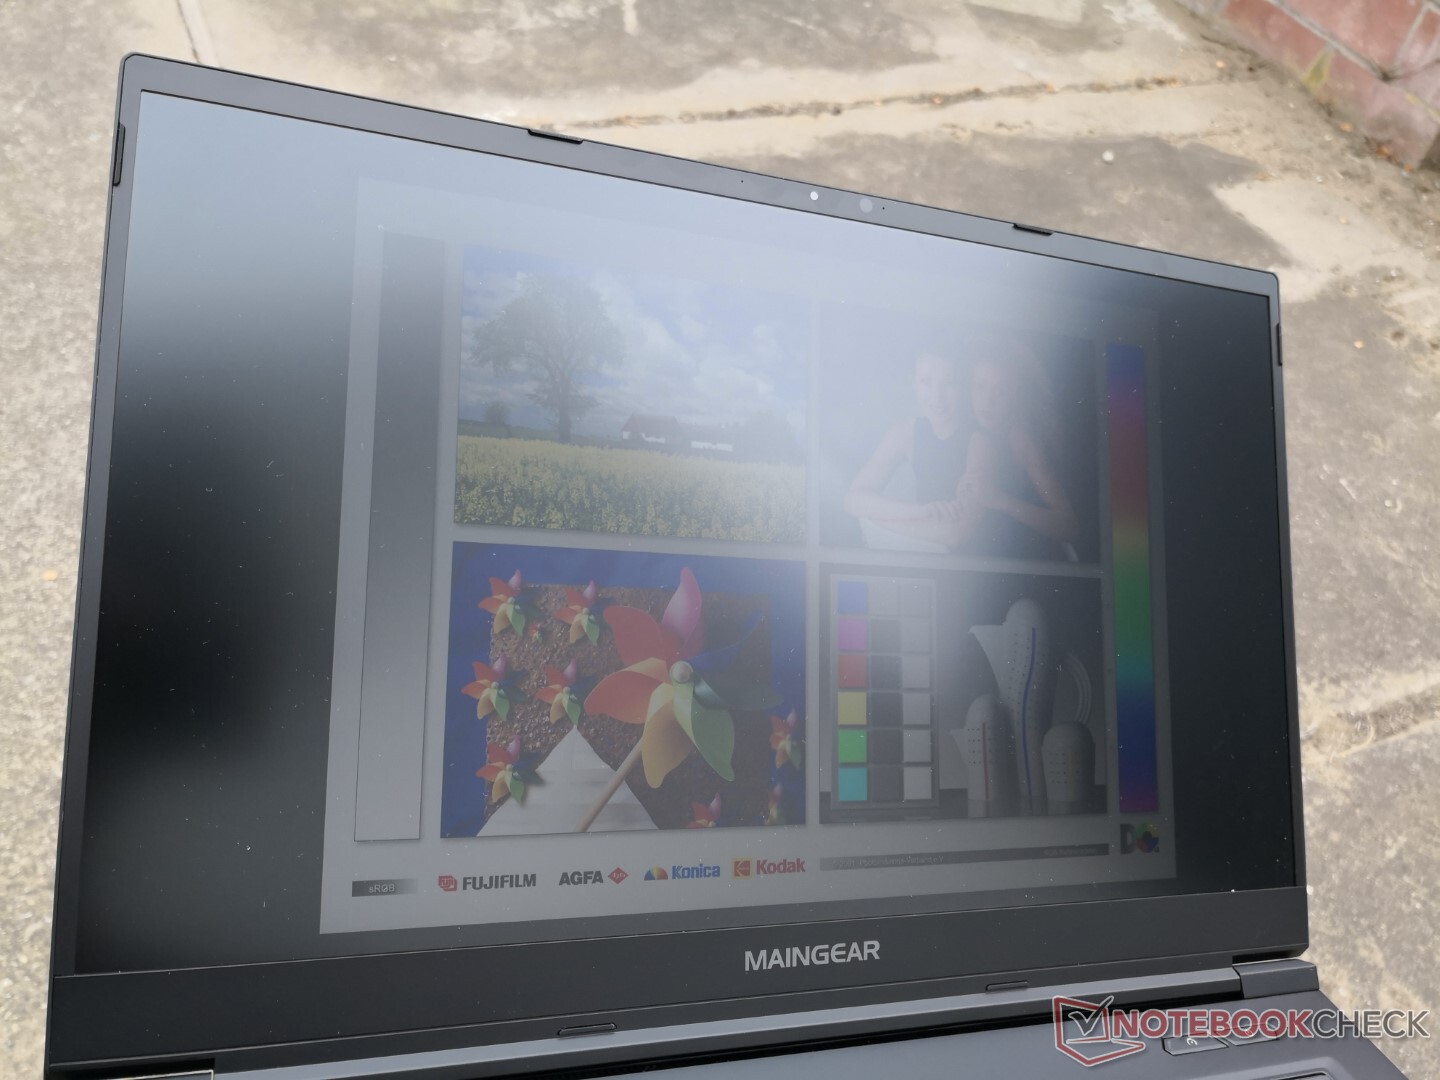
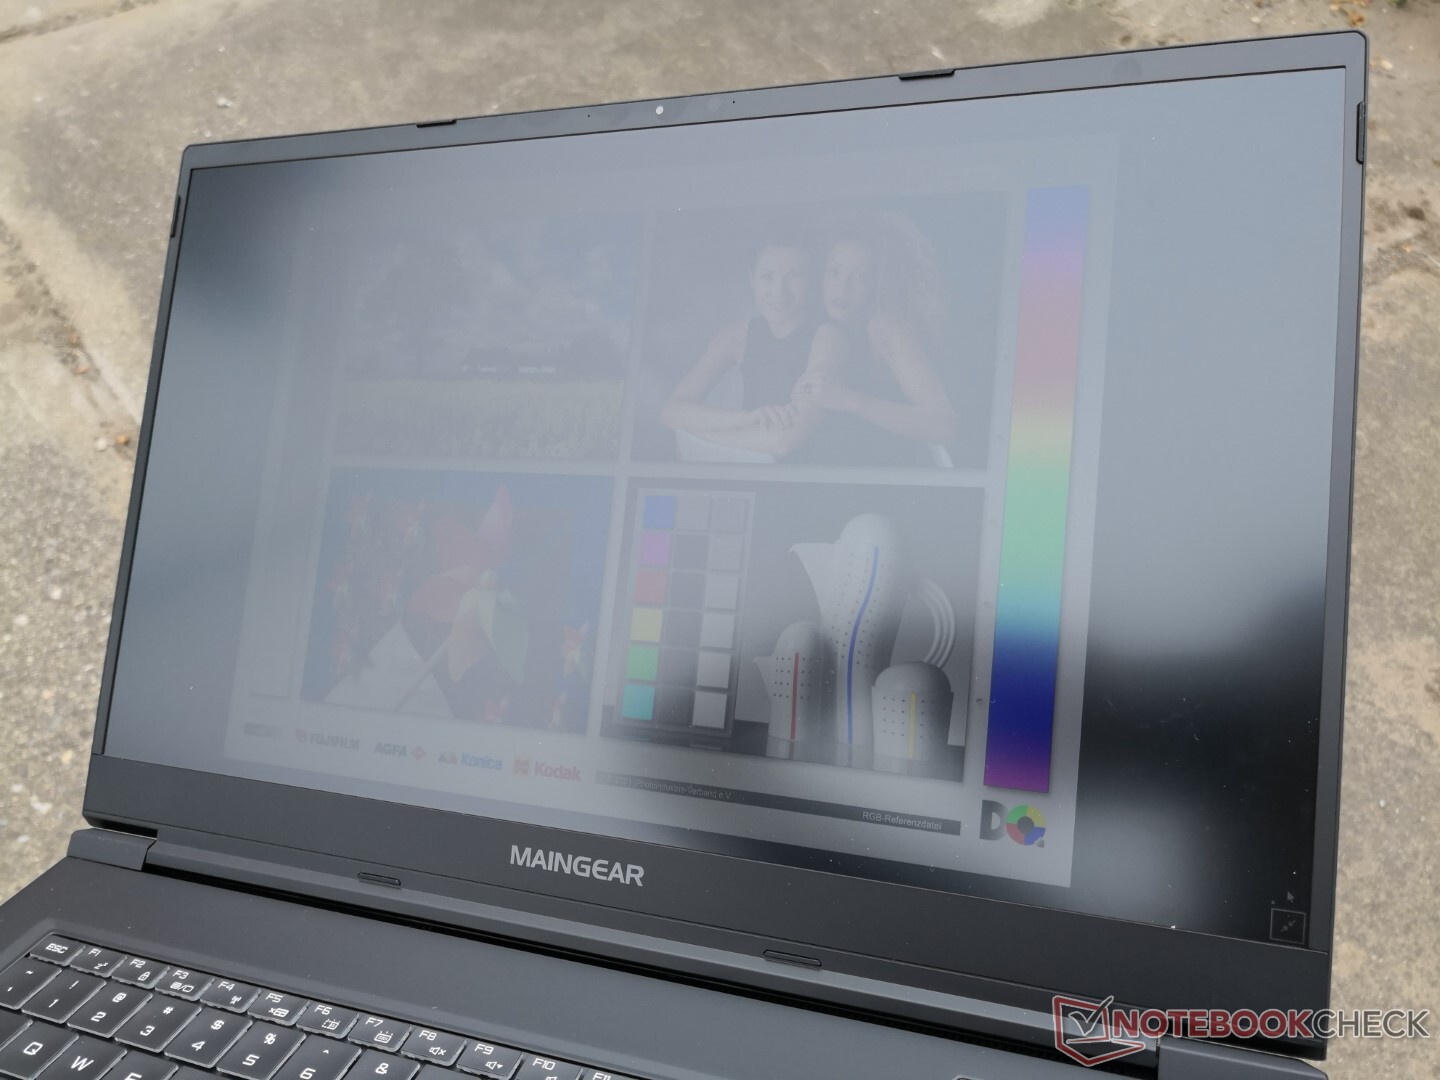
A visibilidade externa é melhor do que na maioria dos laptops para jogos de 17,3 polegadas, pois o brilho máximo está mais próximo de 400 lêndeas em vez das usuais 300 lêndeas. No entanto, você ainda vai querer evitar a luz direta do sol, caso contrário, a tela se apagará.
Desempenho
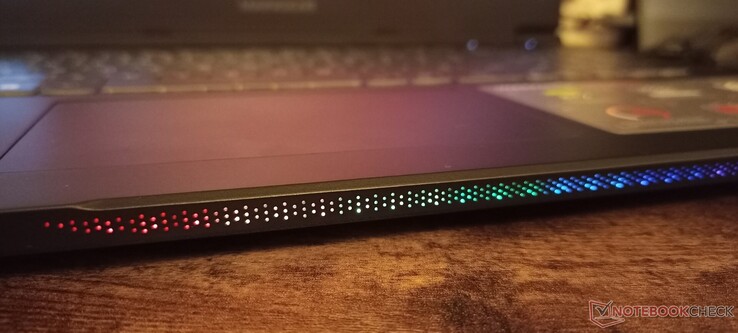
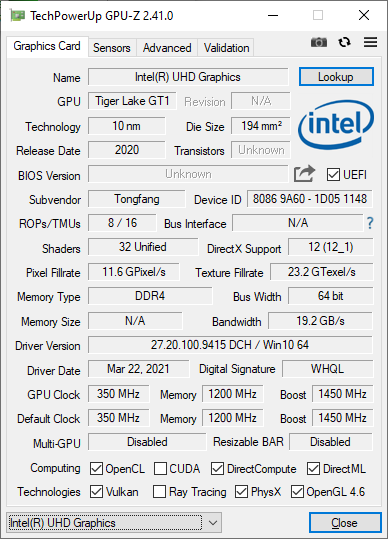
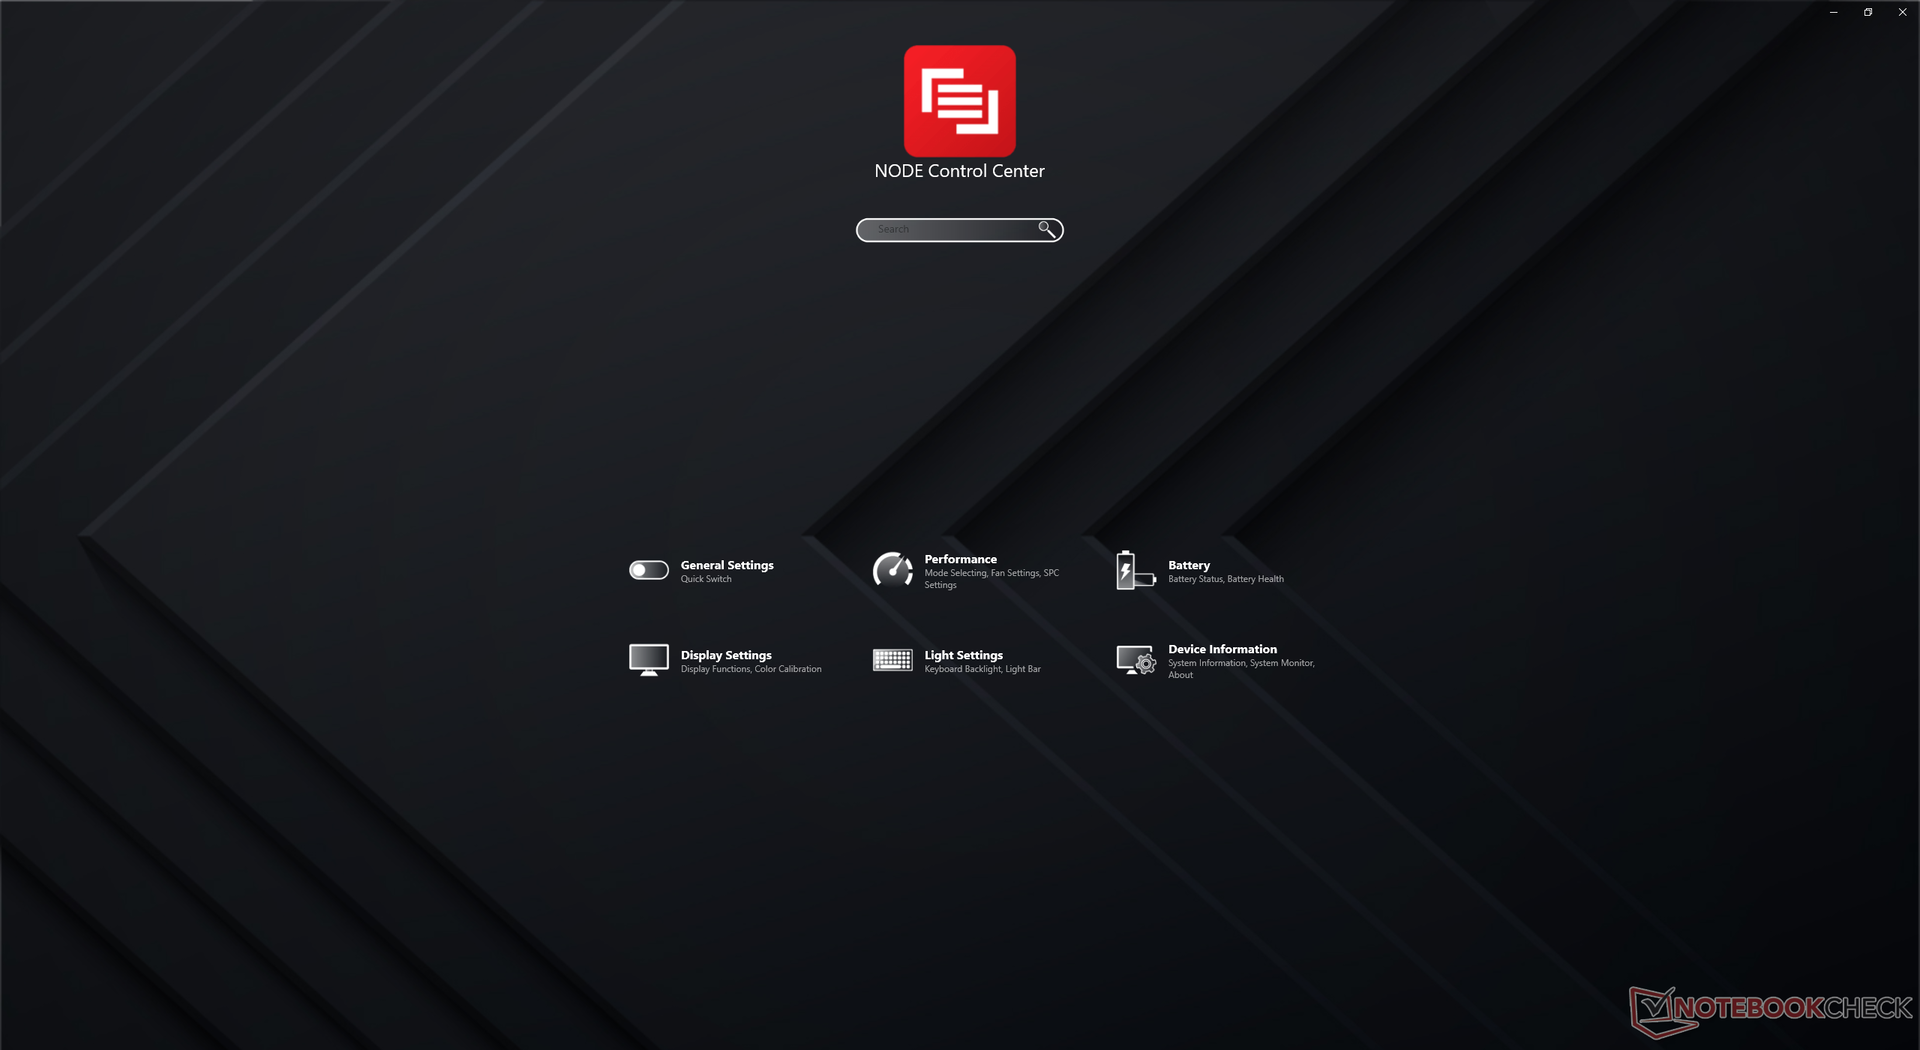
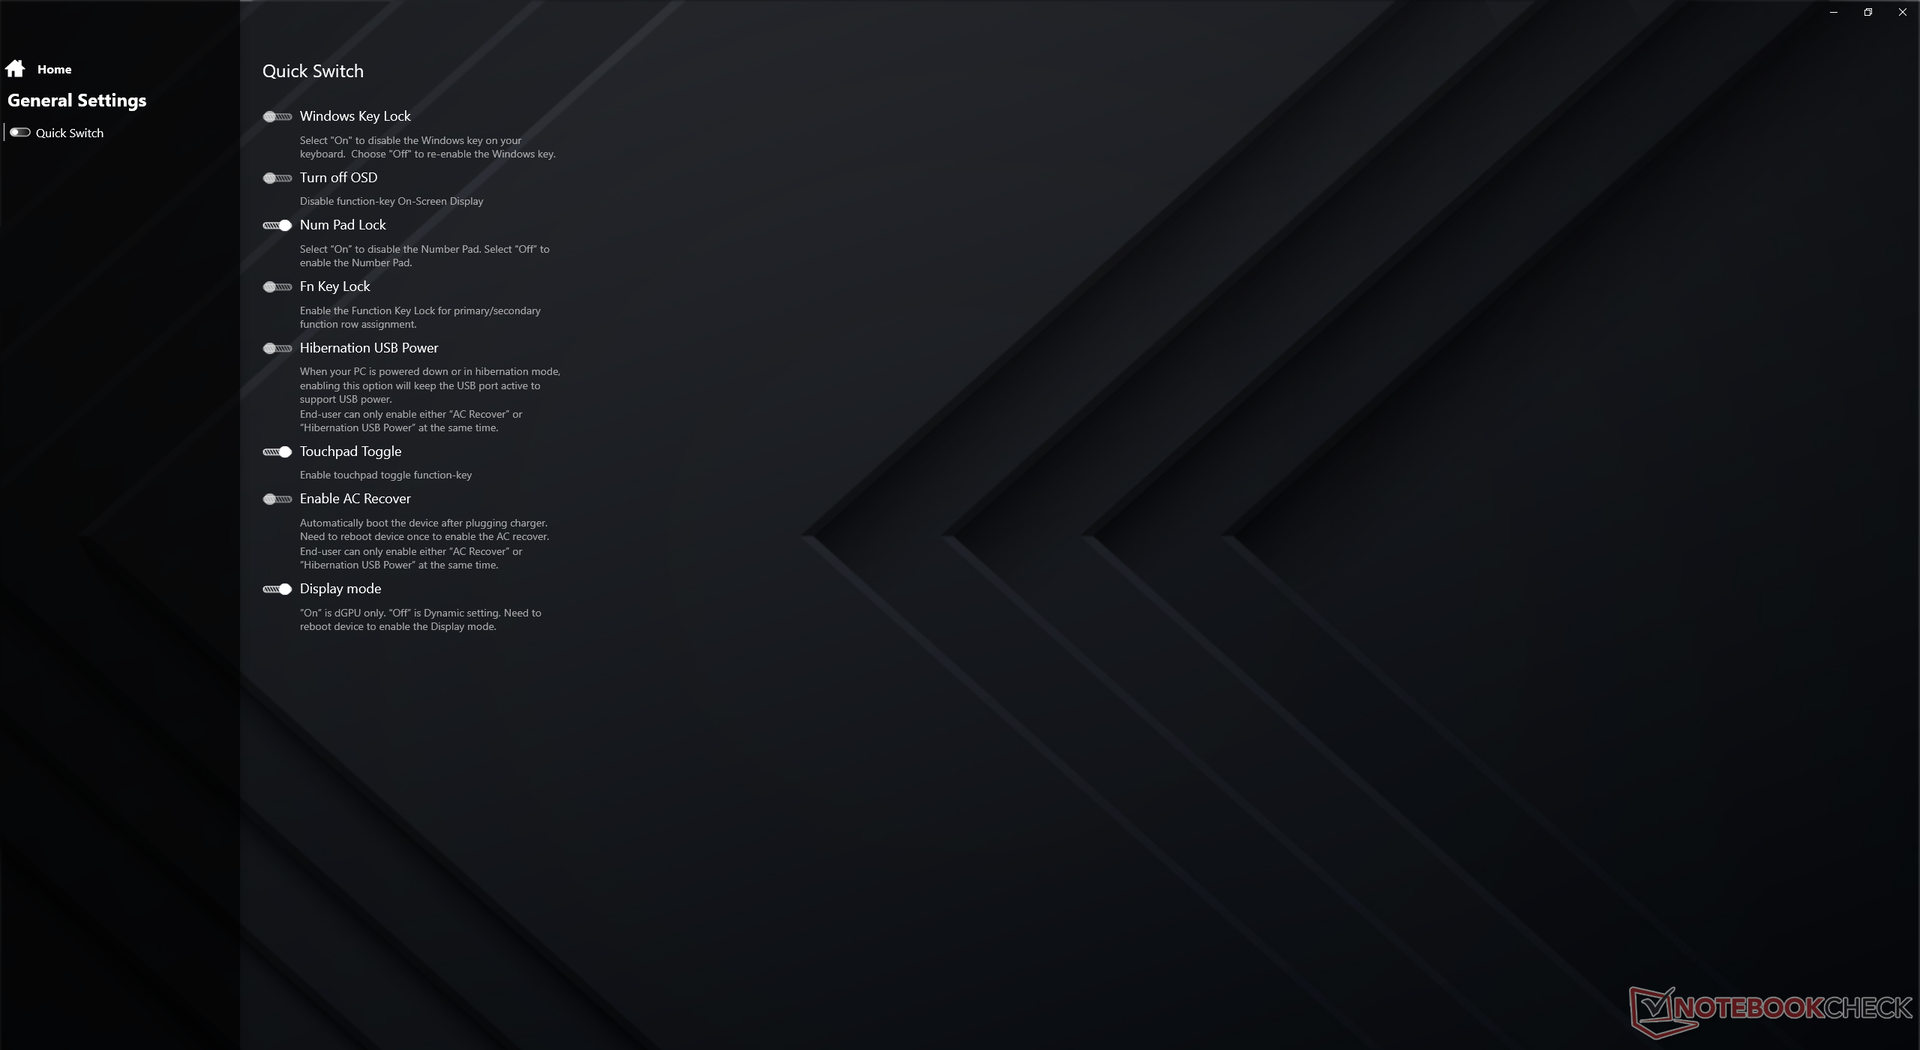
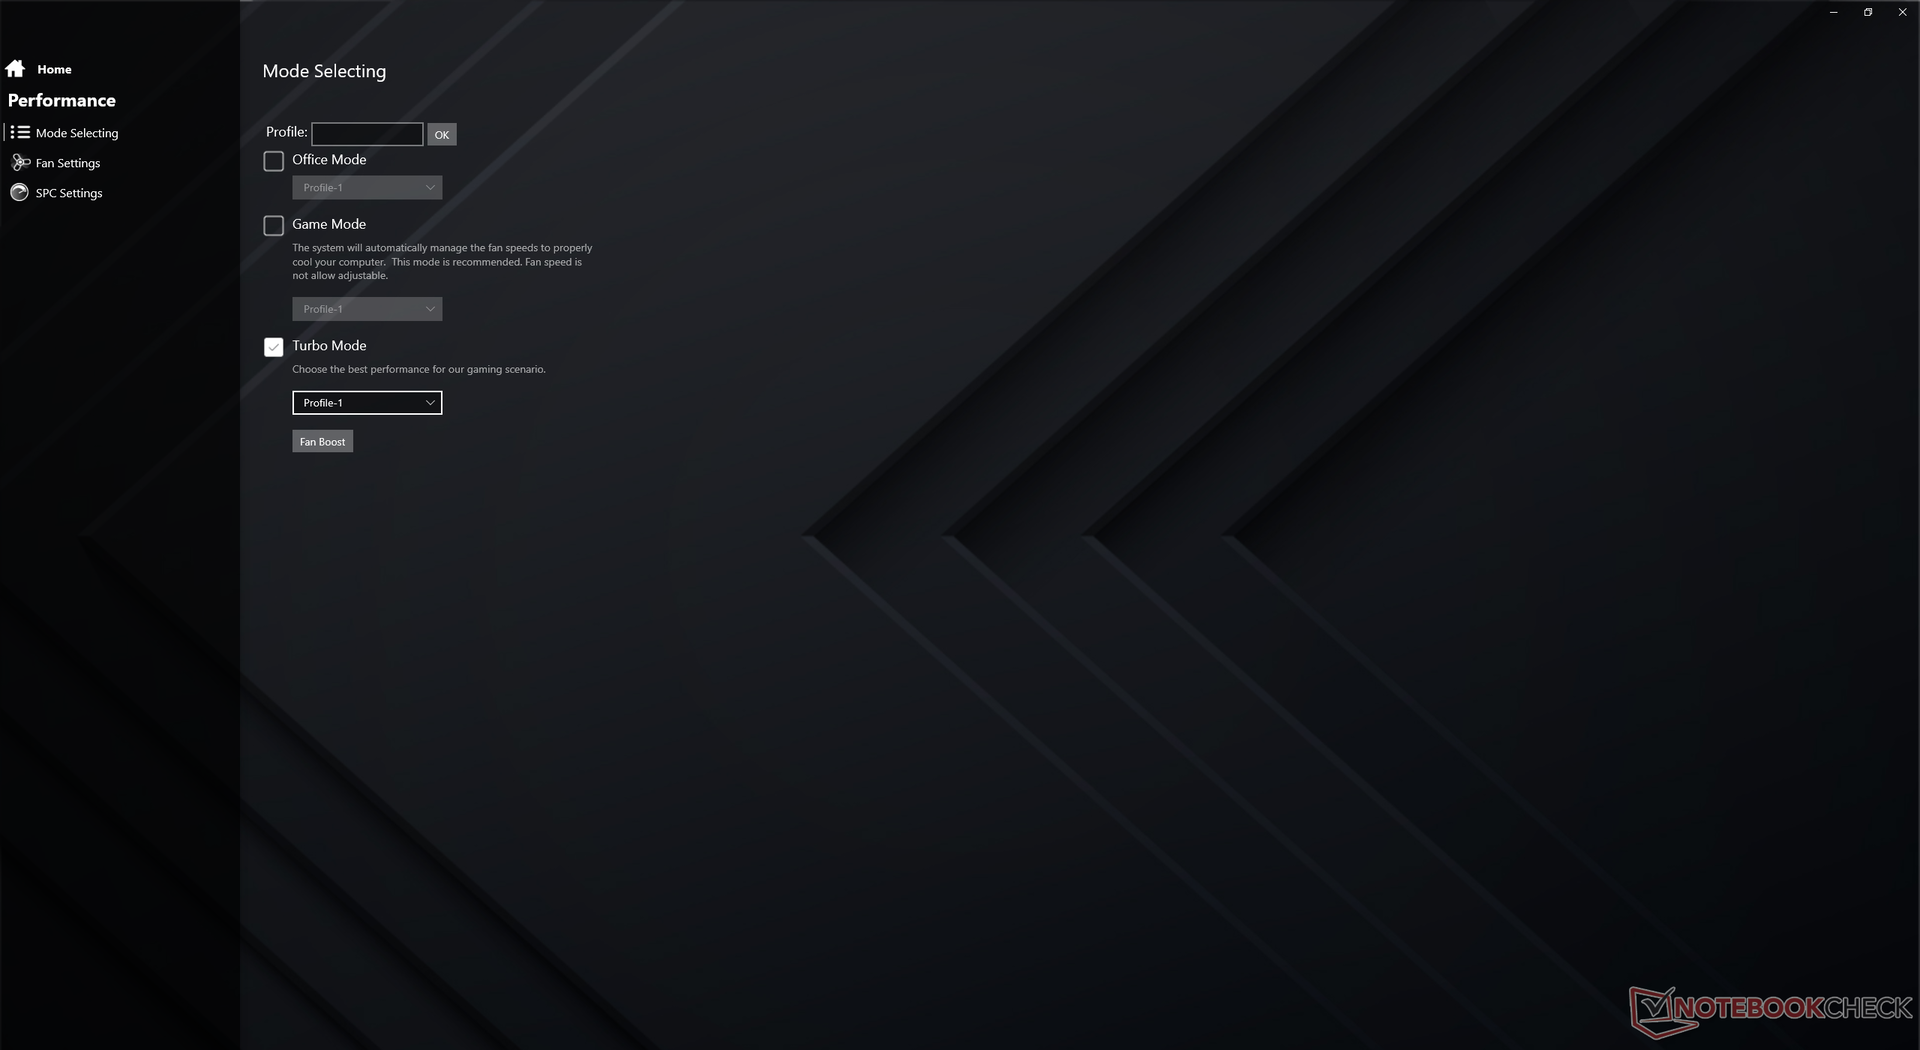
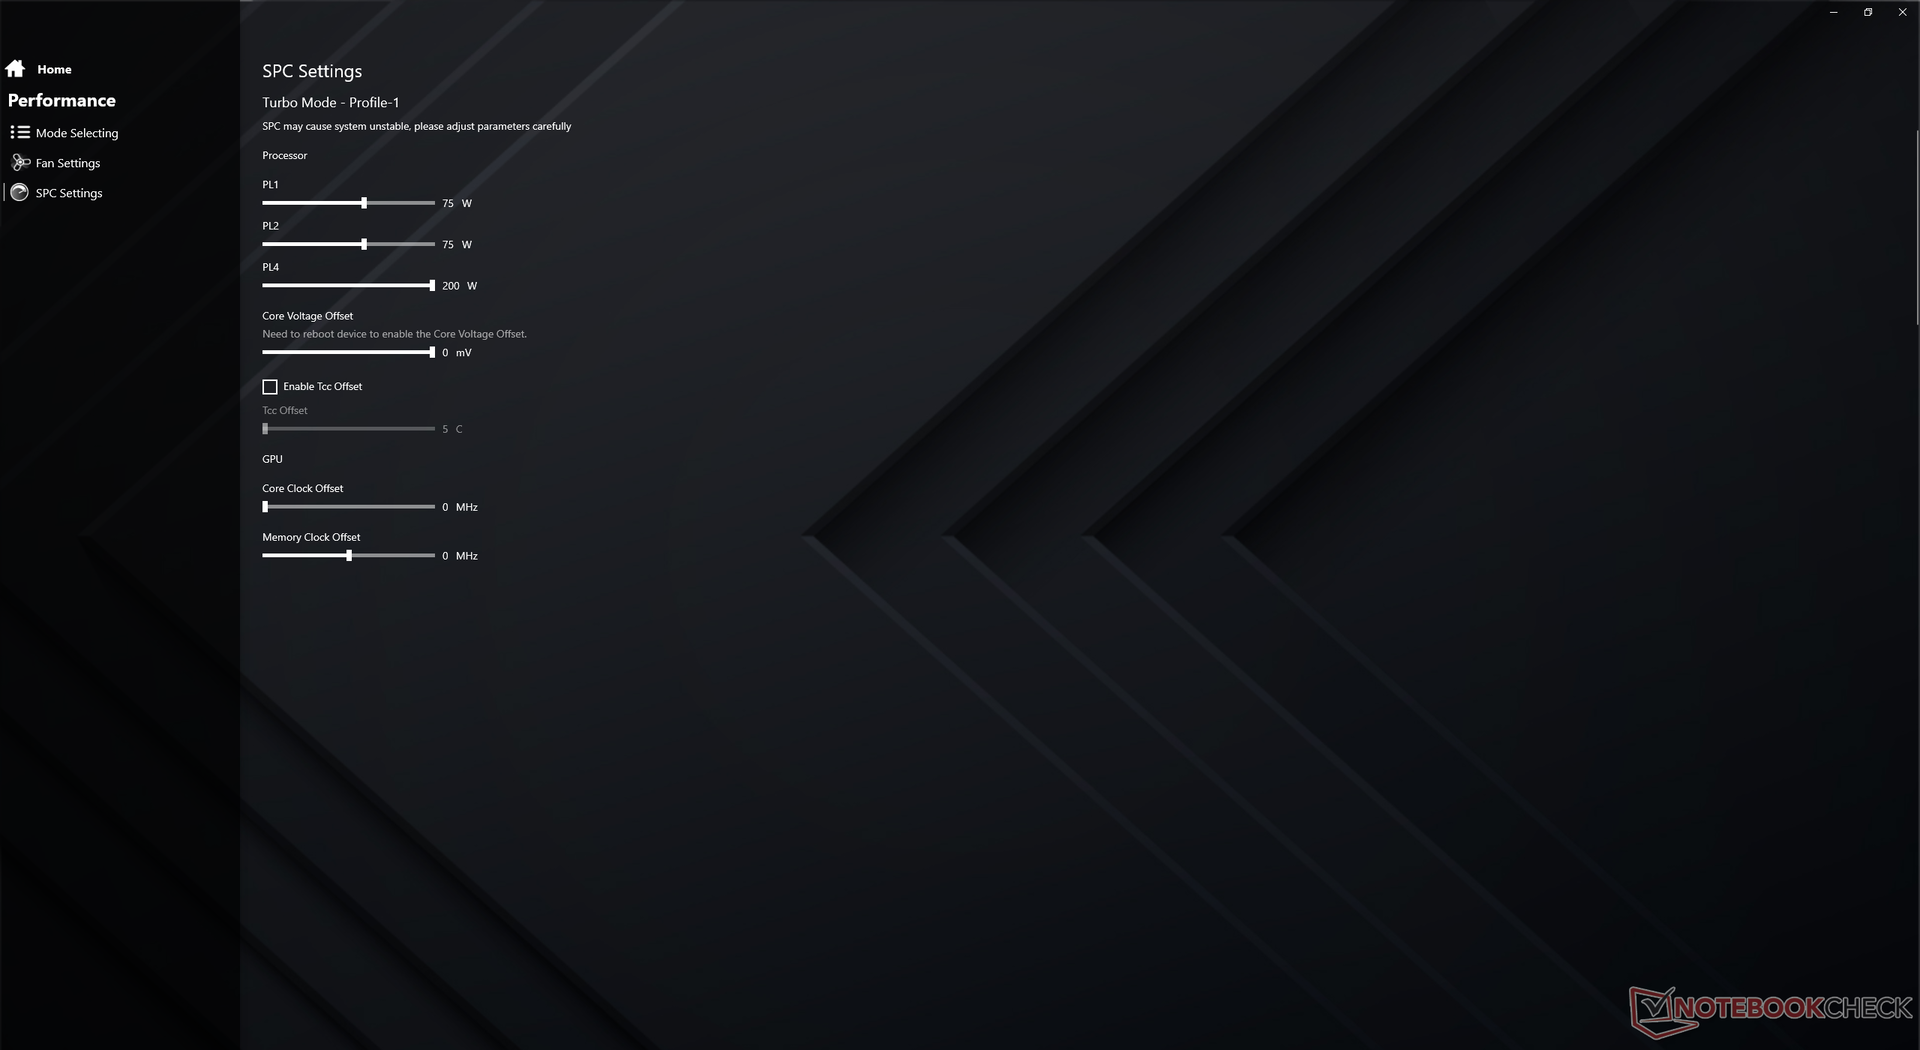
O Maingear aperta em um GPU de 165 W GeForce RTX 3080 apesar de seu design compacto para ser similar ao GPU encontrado no espessoSchenker XMG Ultra 17 em termos de TGP alvo. Barra redimensionável, Dynamic Boost 2.0, e WhisperMode 2.0 são todos suportados enquanto Advanced Optimus e G-Sync interno não são. Assim, uma chave manual está disponível através do software Maingear NODE Control Center para alternar entre o modo dGPU (ou seja, modo de desempenho GPU completo) ou o modo Optimus. Recomendamos aos usuários que se familiarizem com este software, já que muitas configurações específicas do sistema e recursos de LED são alternados aqui
Nosso sistema foi configurado para modo Turbo e modo dGPU antes de executar qualquer parâmetro de desempenho abaixo para obter as maiores pontuações possíveis.
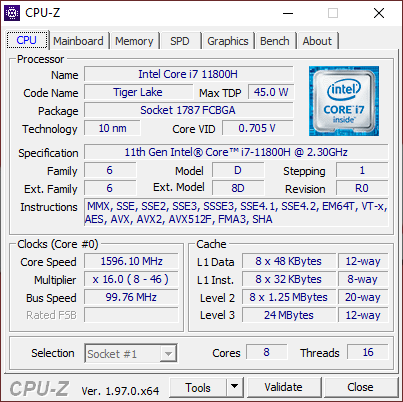
Processador
O desempenho da CPU é excelente e onde esperamos que seja relativo a outros laptops equipados com o mesmo processador. Usuários atualizando de um processador mais antigoNúcleo i7-10750H ou Núcleo i7-10875H laptop terá um aumento de desempenho de cerca de 40% e 20%, respectivamente. Os concorrentes Ryzen 7 5800H é ligeiramente mais rápido em cargas com múltiplas roscas e, ao mesmo tempo, ligeiramente mais lento em cargas com uma rosca do que nosso Núcleo i7-11800H
Cinebench R15 Multi Loop
Cinebench R23: Multi Core | Single Core
Cinebench R15: CPU Multi 64Bit | CPU Single 64Bit
Blender: v2.79 BMW27 CPU
7-Zip 18.03: 7z b 4 -mmt1 | 7z b 4
Geekbench 5.5: Single-Core | Multi-Core
HWBOT x265 Benchmark v2.2: 4k Preset
LibreOffice : 20 Documents To PDF
R Benchmark 2.5: Overall mean
| Cinebench R20 / CPU (Multi Core) | |
| Schenker XMG Ultra 17 Rocket Lake | |
| Asus ROG Zephyrus S17 GX703HSD | |
| Asus ROG Strix G17 G713QE-RB74 | |
| Medion Erazer Beast X25 | |
| Eluktronics RP-17 | |
| Média Intel Core i7-11800H (2498 - 5408, n=50) | |
| Maingear Vector Pro MG-VCP17 | |
| Razer Blade Pro 17 2021 (QHD Touch) | |
| Medion Erazer Beast X20 | |
| Schenker XMG Core 17 Comet Lake | |
| Schenker XMG Pro 17 PB71RD-G | |
| Lenovo Legion 5 17IMH05 | |
| Cinebench R20 / CPU (Single Core) | |
| Schenker XMG Ultra 17 Rocket Lake | |
| Asus ROG Zephyrus S17 GX703HSD | |
| Medion Erazer Beast X25 | |
| Maingear Vector Pro MG-VCP17 | |
| Média Intel Core i7-11800H (520 - 586, n=47) | |
| Asus ROG Strix G17 G713QE-RB74 | |
| Schenker XMG Core 17 Comet Lake | |
| Razer Blade Pro 17 2021 (QHD Touch) | |
| Eluktronics RP-17 | |
| Medion Erazer Beast X20 | |
| Schenker XMG Pro 17 PB71RD-G | |
| Lenovo Legion 5 17IMH05 | |
| Cinebench R15 / CPU Multi 64Bit | |
| Schenker XMG Ultra 17 Rocket Lake | |
| Asus ROG Zephyrus S17 GX703HSD | |
| Asus ROG Strix G17 G713QE-RB74 | |
| Medion Erazer Beast X25 | |
| Eluktronics RP-17 | |
| Média Intel Core i7-11800H (1342 - 2173, n=50) | |
| Maingear Vector Pro MG-VCP17 | |
| Razer Blade Pro 17 2021 (QHD Touch) | |
| Medion Erazer Beast X20 | |
| Schenker XMG Core 17 Comet Lake | |
| Schenker XMG Pro 17 PB71RD-G | |
| Lenovo Legion 5 17IMH05 | |
| Cinebench R15 / CPU Single 64Bit | |
| Schenker XMG Ultra 17 Rocket Lake | |
| Asus ROG Zephyrus S17 GX703HSD | |
| Medion Erazer Beast X25 | |
| Asus ROG Strix G17 G713QE-RB74 | |
| Maingear Vector Pro MG-VCP17 | |
| Média Intel Core i7-11800H (201 - 231, n=46) | |
| Schenker XMG Core 17 Comet Lake | |
| Razer Blade Pro 17 2021 (QHD Touch) | |
| Medion Erazer Beast X20 | |
| Eluktronics RP-17 | |
| Schenker XMG Pro 17 PB71RD-G | |
| Lenovo Legion 5 17IMH05 | |
| Geekbench 5.5 / Single-Core | |
| Schenker XMG Ultra 17 Rocket Lake | |
| Asus ROG Zephyrus S17 GX703HSD | |
| Média Intel Core i7-11800H (1429 - 1625, n=40) | |
| Medion Erazer Beast X25 | |
| Schenker XMG Core 17 Comet Lake | |
| Razer Blade Pro 17 2021 (QHD Touch) | |
| Medion Erazer Beast X20 | |
| Eluktronics RP-17 | |
| Schenker XMG Pro 17 PB71RD-G | |
| Lenovo Legion 5 17IMH05 | |
| Geekbench 5.5 / Multi-Core | |
| Schenker XMG Ultra 17 Rocket Lake | |
| Asus ROG Zephyrus S17 GX703HSD | |
| Medion Erazer Beast X25 | |
| Média Intel Core i7-11800H (4655 - 9851, n=40) | |
| Razer Blade Pro 17 2021 (QHD Touch) | |
| Eluktronics RP-17 | |
| Medion Erazer Beast X20 | |
| Schenker XMG Core 17 Comet Lake | |
| Schenker XMG Pro 17 PB71RD-G | |
| Lenovo Legion 5 17IMH05 | |
| HWBOT x265 Benchmark v2.2 / 4k Preset | |
| Schenker XMG Ultra 17 Rocket Lake | |
| Asus ROG Zephyrus S17 GX703HSD | |
| Medion Erazer Beast X25 | |
| Asus ROG Strix G17 G713QE-RB74 | |
| Média Intel Core i7-11800H (7.38 - 17.4, n=46) | |
| Maingear Vector Pro MG-VCP17 | |
| Eluktronics RP-17 | |
| Razer Blade Pro 17 2021 (QHD Touch) | |
| Medion Erazer Beast X20 | |
| Schenker XMG Core 17 Comet Lake | |
| Schenker XMG Pro 17 PB71RD-G | |
| Lenovo Legion 5 17IMH05 | |
| LibreOffice / 20 Documents To PDF | |
| Lenovo Legion 5 17IMH05 | |
| Eluktronics RP-17 | |
| Schenker XMG Core 17 Comet Lake | |
| Asus ROG Strix G17 G713QE-RB74 | |
| Medion Erazer Beast X20 | |
| Medion Erazer Beast X25 | |
| Média Intel Core i7-11800H (38.6 - 59.9, n=45) | |
| Maingear Vector Pro MG-VCP17 | |
| Razer Blade Pro 17 2021 (QHD Touch) | |
| Asus ROG Zephyrus S17 GX703HSD | |
| Schenker XMG Ultra 17 Rocket Lake | |
| R Benchmark 2.5 / Overall mean | |
| Lenovo Legion 5 17IMH05 | |
| Schenker XMG Pro 17 PB71RD-G | |
| Medion Erazer Beast X20 | |
| Razer Blade Pro 17 2021 (QHD Touch) | |
| Eluktronics RP-17 | |
| Schenker XMG Core 17 Comet Lake | |
| Maingear Vector Pro MG-VCP17 | |
| Média Intel Core i7-11800H (0.548 - 0.615, n=46) | |
| Asus ROG Zephyrus S17 GX703HSD | |
| Asus ROG Strix G17 G713QE-RB74 | |
| Schenker XMG Ultra 17 Rocket Lake | |
| Medion Erazer Beast X25 | |
* ... menor é melhor
Desempenho do sistema
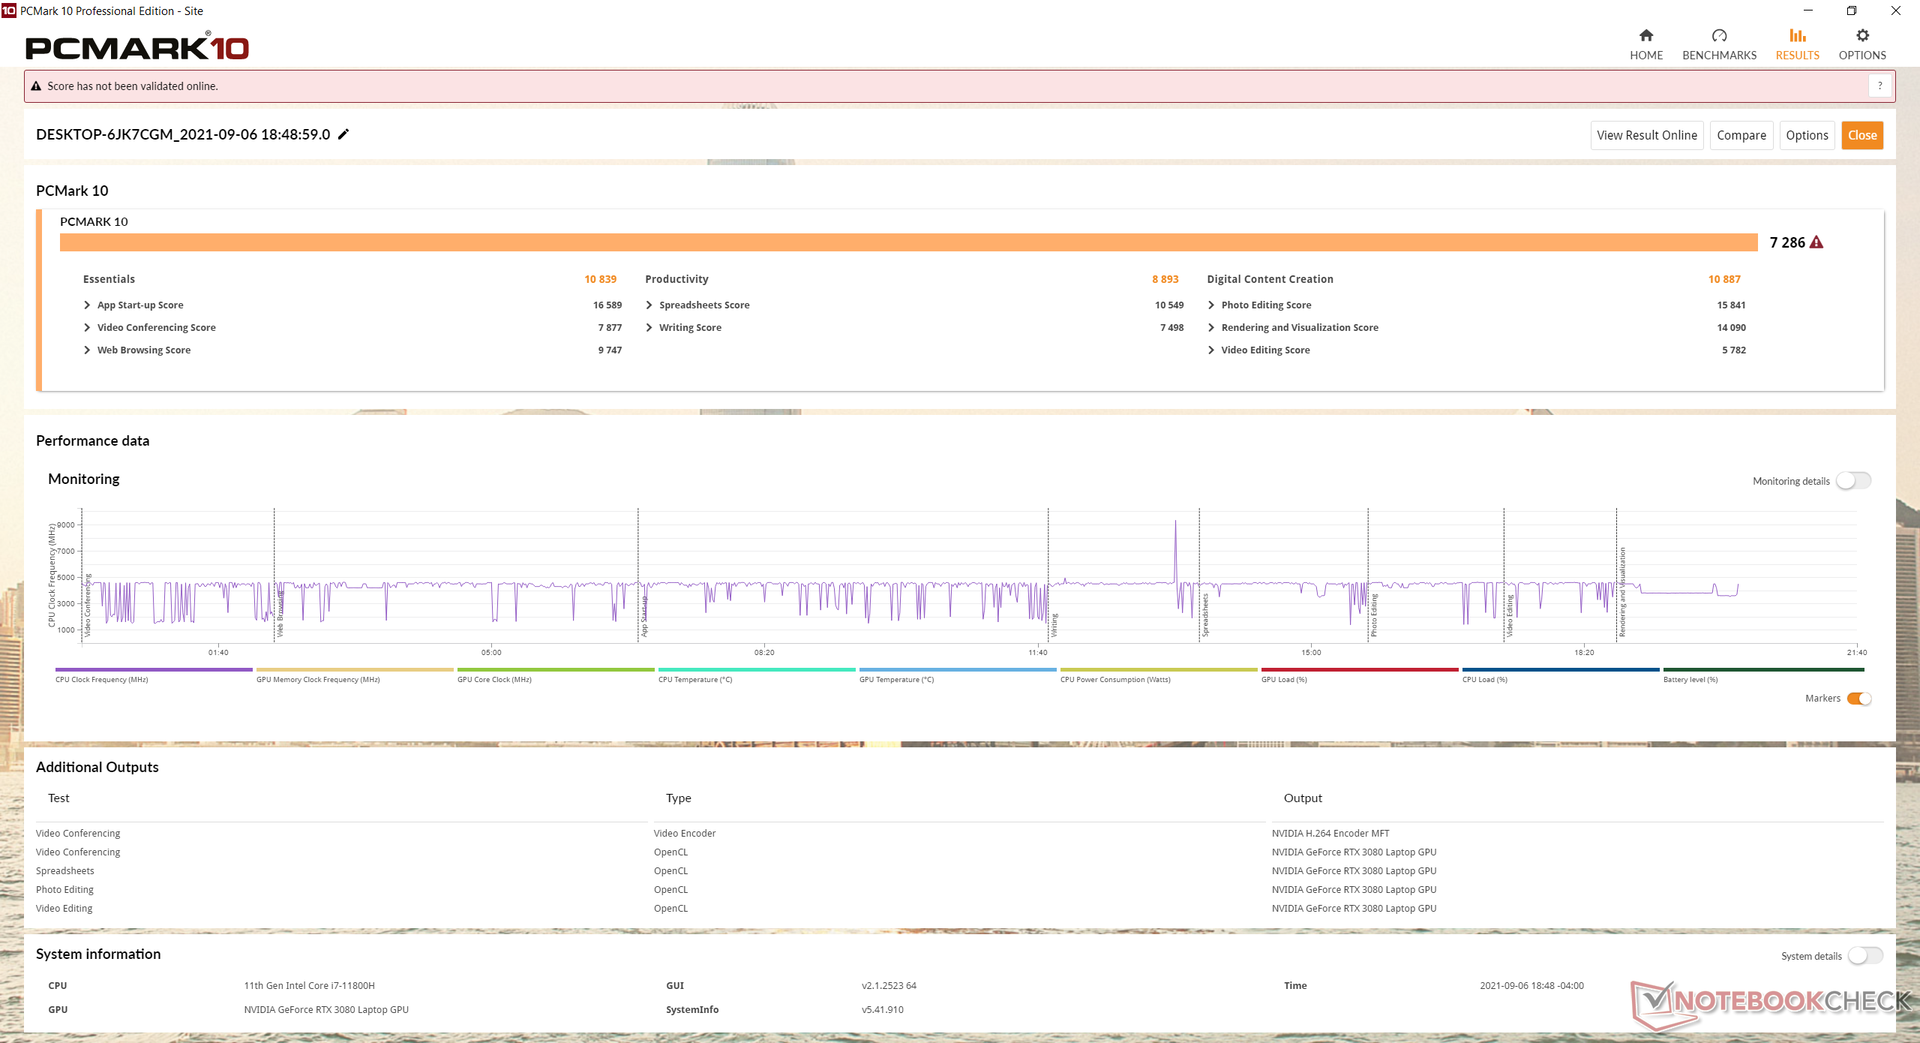
| PCMark 10 / Score | |
| Maingear Vector Pro MG-VCP17 | |
| Asus ROG Zephyrus S17 GX703HSD | |
| Média Intel Core i7-11800H, NVIDIA GeForce RTX 3080 Laptop GPU (6673 - 7470, n=11) | |
| Schenker XMG Neo 17 (Early 2021, RTX 3070, 5800H) | |
| MSI GS75 10SF-609US | |
| Schenker Compact 17 | |
| Schenker XMG Core 17 (Early 2021) | |
| PCMark 10 / Essentials | |
| Maingear Vector Pro MG-VCP17 | |
| Asus ROG Zephyrus S17 GX703HSD | |
| Média Intel Core i7-11800H, NVIDIA GeForce RTX 3080 Laptop GPU (9862 - 11064, n=11) | |
| MSI GS75 10SF-609US | |
| Schenker XMG Neo 17 (Early 2021, RTX 3070, 5800H) | |
| Schenker Compact 17 | |
| Schenker XMG Core 17 (Early 2021) | |
| PCMark 10 / Productivity | |
| Asus ROG Zephyrus S17 GX703HSD | |
| Média Intel Core i7-11800H, NVIDIA GeForce RTX 3080 Laptop GPU (8278 - 9803, n=11) | |
| Maingear Vector Pro MG-VCP17 | |
| Schenker XMG Neo 17 (Early 2021, RTX 3070, 5800H) | |
| Schenker Compact 17 | |
| MSI GS75 10SF-609US | |
| Schenker XMG Core 17 (Early 2021) | |
| PCMark 10 / Digital Content Creation | |
| Maingear Vector Pro MG-VCP17 | |
| Asus ROG Zephyrus S17 GX703HSD | |
| Média Intel Core i7-11800H, NVIDIA GeForce RTX 3080 Laptop GPU (9881 - 11323, n=11) | |
| Schenker XMG Neo 17 (Early 2021, RTX 3070, 5800H) | |
| MSI GS75 10SF-609US | |
| Schenker Compact 17 | |
| Schenker XMG Core 17 (Early 2021) | |
| PCMark 10 Score | 7286 pontos | |
Ajuda | ||
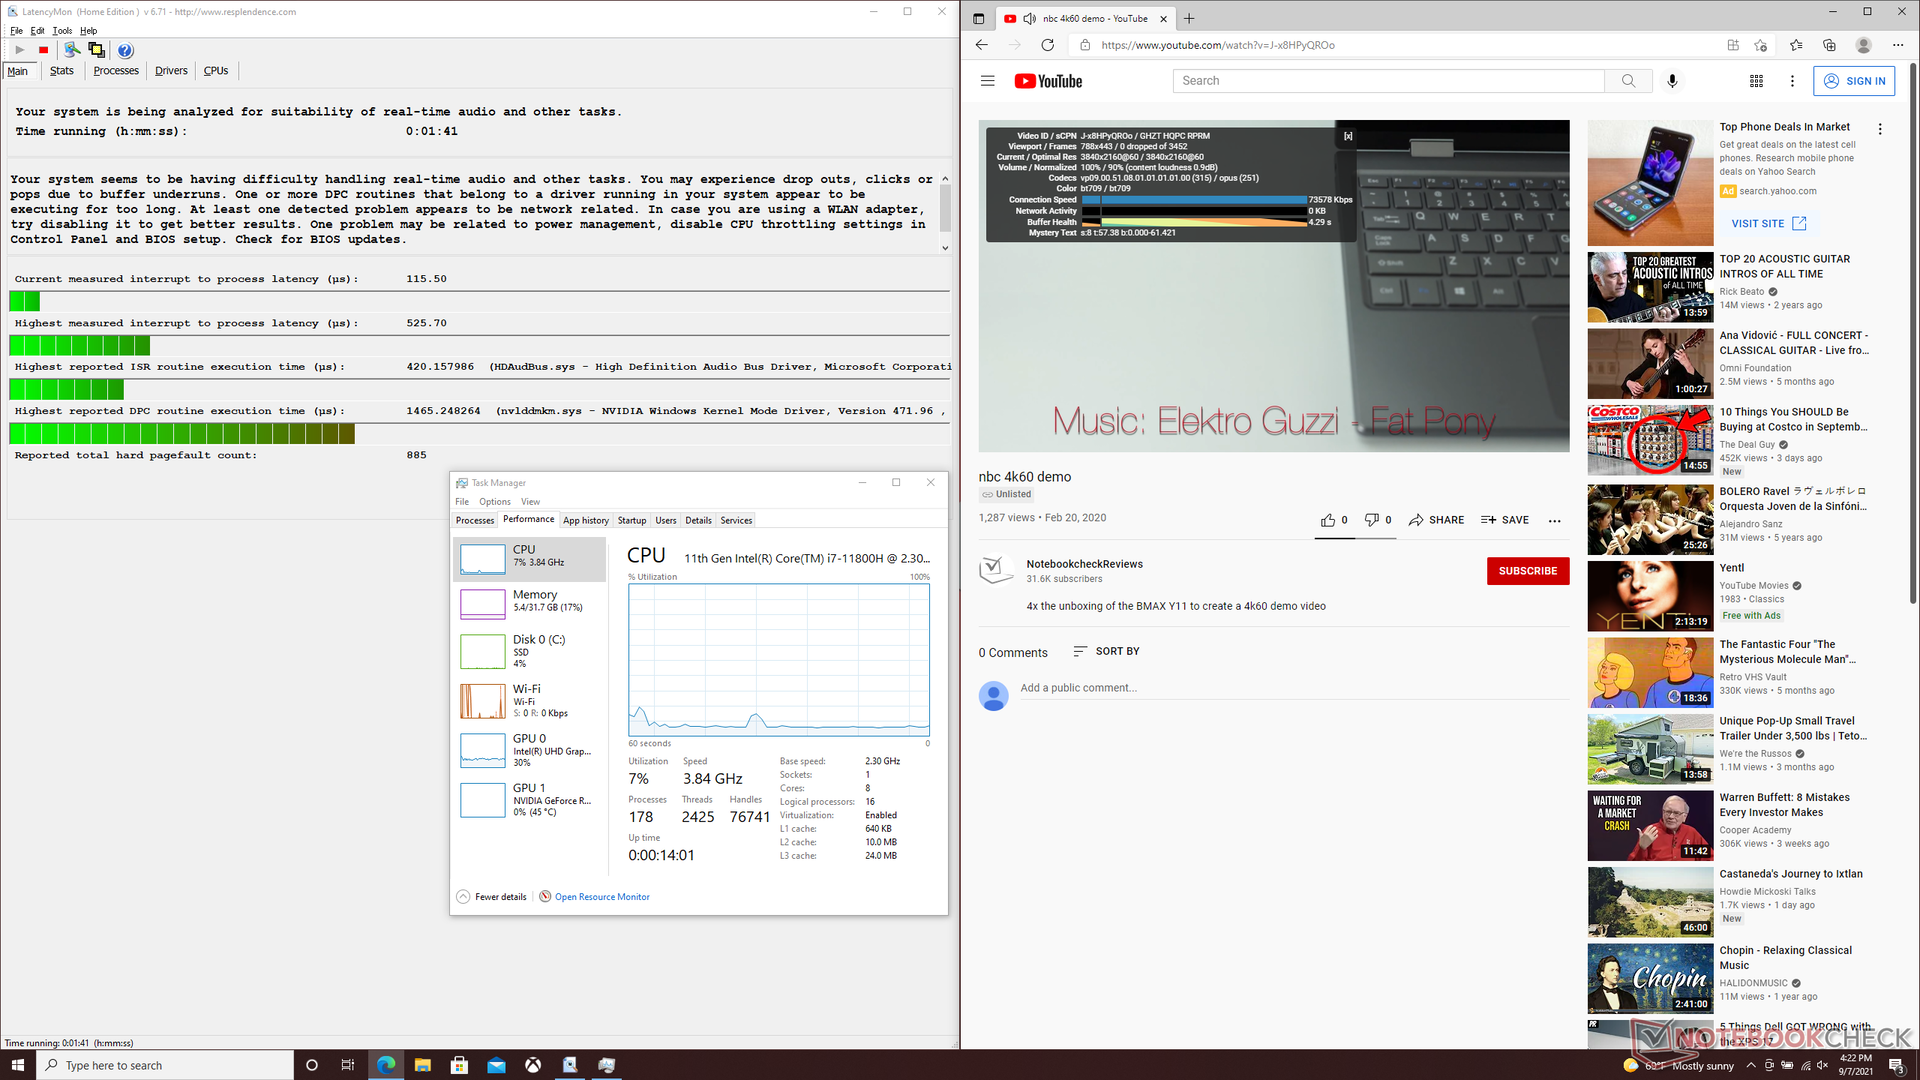
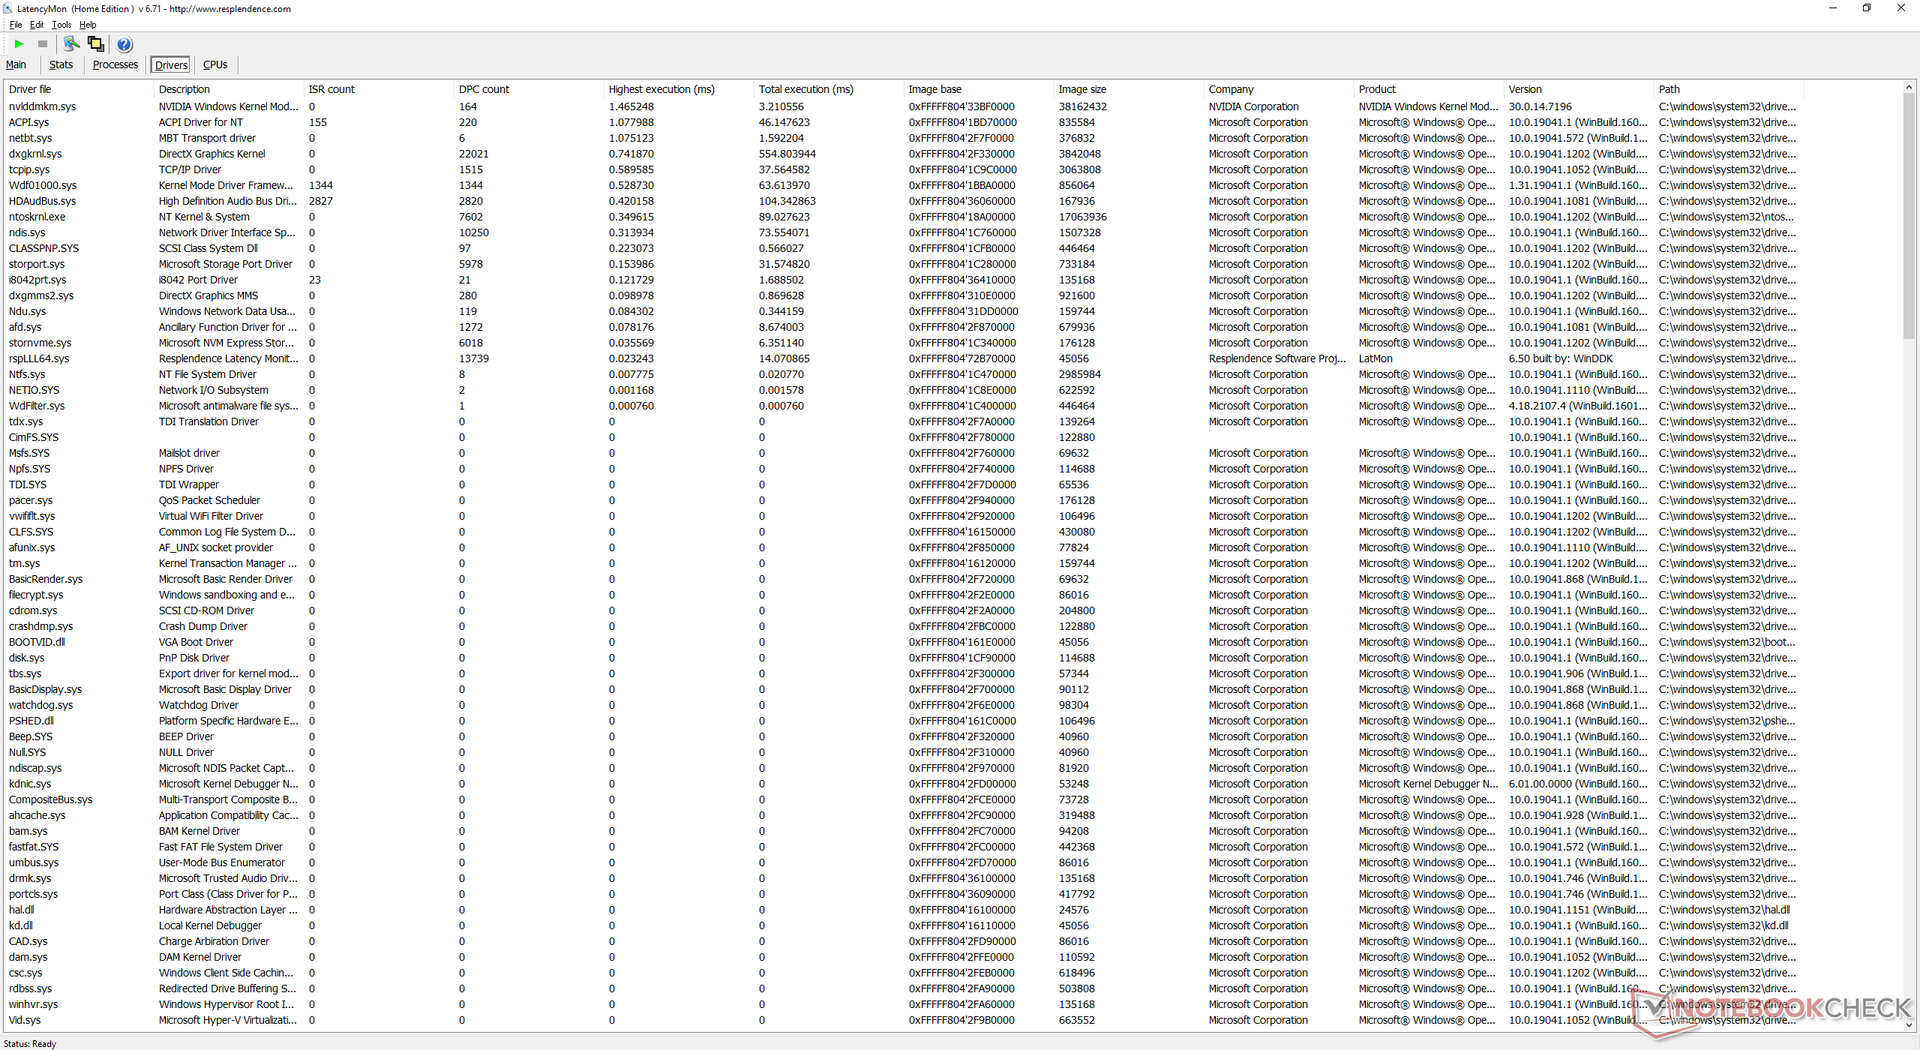
Latência do DPC
LatencyMon mostra pequenos problemas de latência do DPC ao abrir várias abas do navegador em nossa página inicial. A reprodução de vídeo de 4K a 60 FPS é de outra forma suave e sem queda de quadros.
| DPC Latencies / LatencyMon - interrupt to process latency (max), Web, Youtube, Prime95 | |
| Schenker XMG Neo 17 (Early 2021, RTX 3070, 5800H) | |
| Asus ROG Zephyrus S17 GX703HSD | |
| Schenker XMG Core 17 (Early 2021) | |
| Schenker Compact 17 | |
| Maingear Vector Pro MG-VCP17 | |
| MSI GS75 10SF-609US | |
* ... menor é melhor
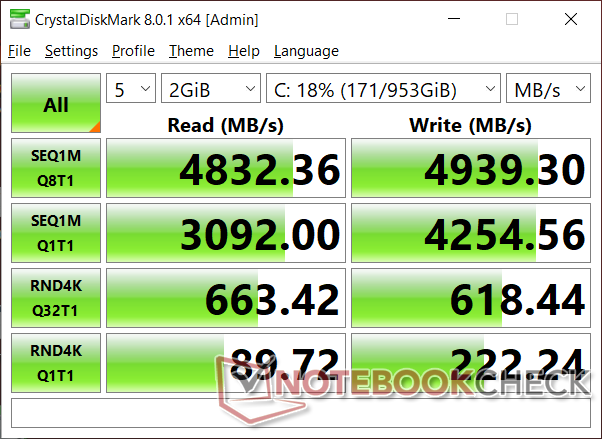
Dispositivos de armazenamento
Nossa unidade de teste vem com uma Samsung PM9A1 que é a primeira PCIe Gen4 NVMe SSD do fabricante para consumidores. As taxas seqüenciais de leitura e escrita aproximam-se de 7000 MB/s e 5200 MB/s, respectivamente, para ser cerca de 2x mais rápido do que no Samsung PM981a comumente encontradas em laptops de geração anterior.
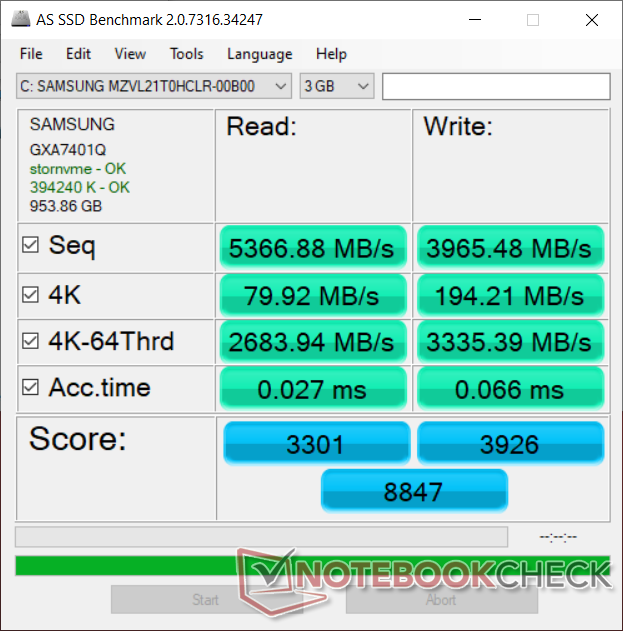
| Maingear Vector Pro MG-VCP17 Samsung PM9A1 MZVL21T0HCLR | Asus ROG Zephyrus S17 GX703HSD Samsung PM9A1 MZVL22T0HBLB | Schenker XMG Core 17 (Early 2021) Samsung SSD 970 EVO Plus 1TB | Schenker XMG Neo 17 (Early 2021, RTX 3070, 5800H) Samsung SSD 970 EVO Plus 500GB | Schenker Compact 17 Samsung SSD 970 EVO Plus 1TB | MSI GS75 10SF-609US WDC PC SN730 SDBPNTY-512G | |
|---|---|---|---|---|---|---|
| AS SSD | 7% | -38% | -28% | -28% | -50% | |
| Seq Read (MB/s) | 5367 | 5085 -5% | 2876 -46% | 3020 -44% | 2879 -46% | 2327 -57% |
| Seq Write (MB/s) | 3965 | 4434 12% | 2803 -29% | 2631 -34% | 2842 -28% | 2479 -37% |
| 4K Read (MB/s) | 79.9 | 80.3 1% | 55.3 -31% | 60.3 -25% | 51.6 -35% | 45.46 -43% |
| 4K Write (MB/s) | 194.2 | 214.7 11% | 106.9 -45% | 171.6 -12% | 142.5 -27% | 157.4 -19% |
| 4K-64 Read (MB/s) | 2684 | 2573 -4% | 1662 -38% | 1410 -47% | 1672 -38% | 1050 -61% |
| 4K-64 Write (MB/s) | 3335 | 2972 -11% | 2101 -37% | 2324 -30% | 2293 -31% | 938 -72% |
| Access Time Read * (ms) | 0.027 | 0.018 33% | 0.067 -148% | 0.045 -67% | 0.034 -26% | 0.076 -181% |
| Access Time Write * (ms) | 0.066 | 0.02 70% | 0.037 44% | 0.024 64% | 0.027 59% | 0.071 -8% |
| Score Read (Points) | 3301 | 3161 -4% | 2005 -39% | 1773 -46% | 2012 -39% | 1328 -60% |
| Score Write (Points) | 3926 | 3631 -8% | 2488 -37% | 2759 -30% | 2719 -31% | 1343 -66% |
| Score Total (Points) | 8847 | 8380 -5% | 5520 -38% | 5429 -39% | 5760 -35% | 3366 -62% |
| Copy ISO MB/s (MB/s) | 2579 | 3239 26% | 2029 -21% | 2383 -8% | 3092 20% | |
| Copy Program MB/s (MB/s) | 1133 | 899 -21% | 691 -39% | 603 -47% | 733 -35% | |
| Copy Game MB/s (MB/s) | 2161 | 2171 0% | 1513 -30% | 873 -60% | 1683 -22% | |
| CrystalDiskMark 5.2 / 6 | 1% | -32% | -28% | -31% | -37% | |
| Write 4K (MB/s) | 227.2 | 244.2 7% | 145.7 -36% | 206.1 -9% | 167.8 -26% | 177.9 -22% |
| Read 4K (MB/s) | 89 | 89.8 1% | 51.3 -42% | 53 -40% | 53.5 -40% | 47.42 -47% |
| Write Seq (MB/s) | 4256 | 3036 -29% | 3018 -29% | 3073 -28% | 2707 -36% | |
| Read Seq (MB/s) | 4364 | 2837 -35% | 2575 -41% | 2488 -43% | 2369 -46% | |
| Write 4K Q32T1 (MB/s) | 614 | 607 -1% | 511 -17% | 535 -13% | 524 -15% | 427.8 -30% |
| Read 4K Q32T1 (MB/s) | 659 | 658 0% | 582 -12% | 608 -8% | 595 -10% | 543 -18% |
| Write Seq Q32T1 (MB/s) | 5216 | 5270 1% | 3294 -37% | 3242 -38% | 3324 -36% | 2703 -48% |
| Read Seq Q32T1 (MB/s) | 7073 | 7091 0% | 3522 -50% | 3617 -49% | 3564 -50% | 3387 -52% |
| Write 4K Q8T8 (MB/s) | 2270 | |||||
| Read 4K Q8T8 (MB/s) | 2490 | |||||
| Média Total (Programa/Configurações) | 4% /
5% | -35% /
-36% | -28% /
-28% | -30% /
-29% | -44% /
-46% |
* ... menor é melhor

Disk Throttling: DiskSpd Read Loop, Queue Depth 8
Desempenho da GPU
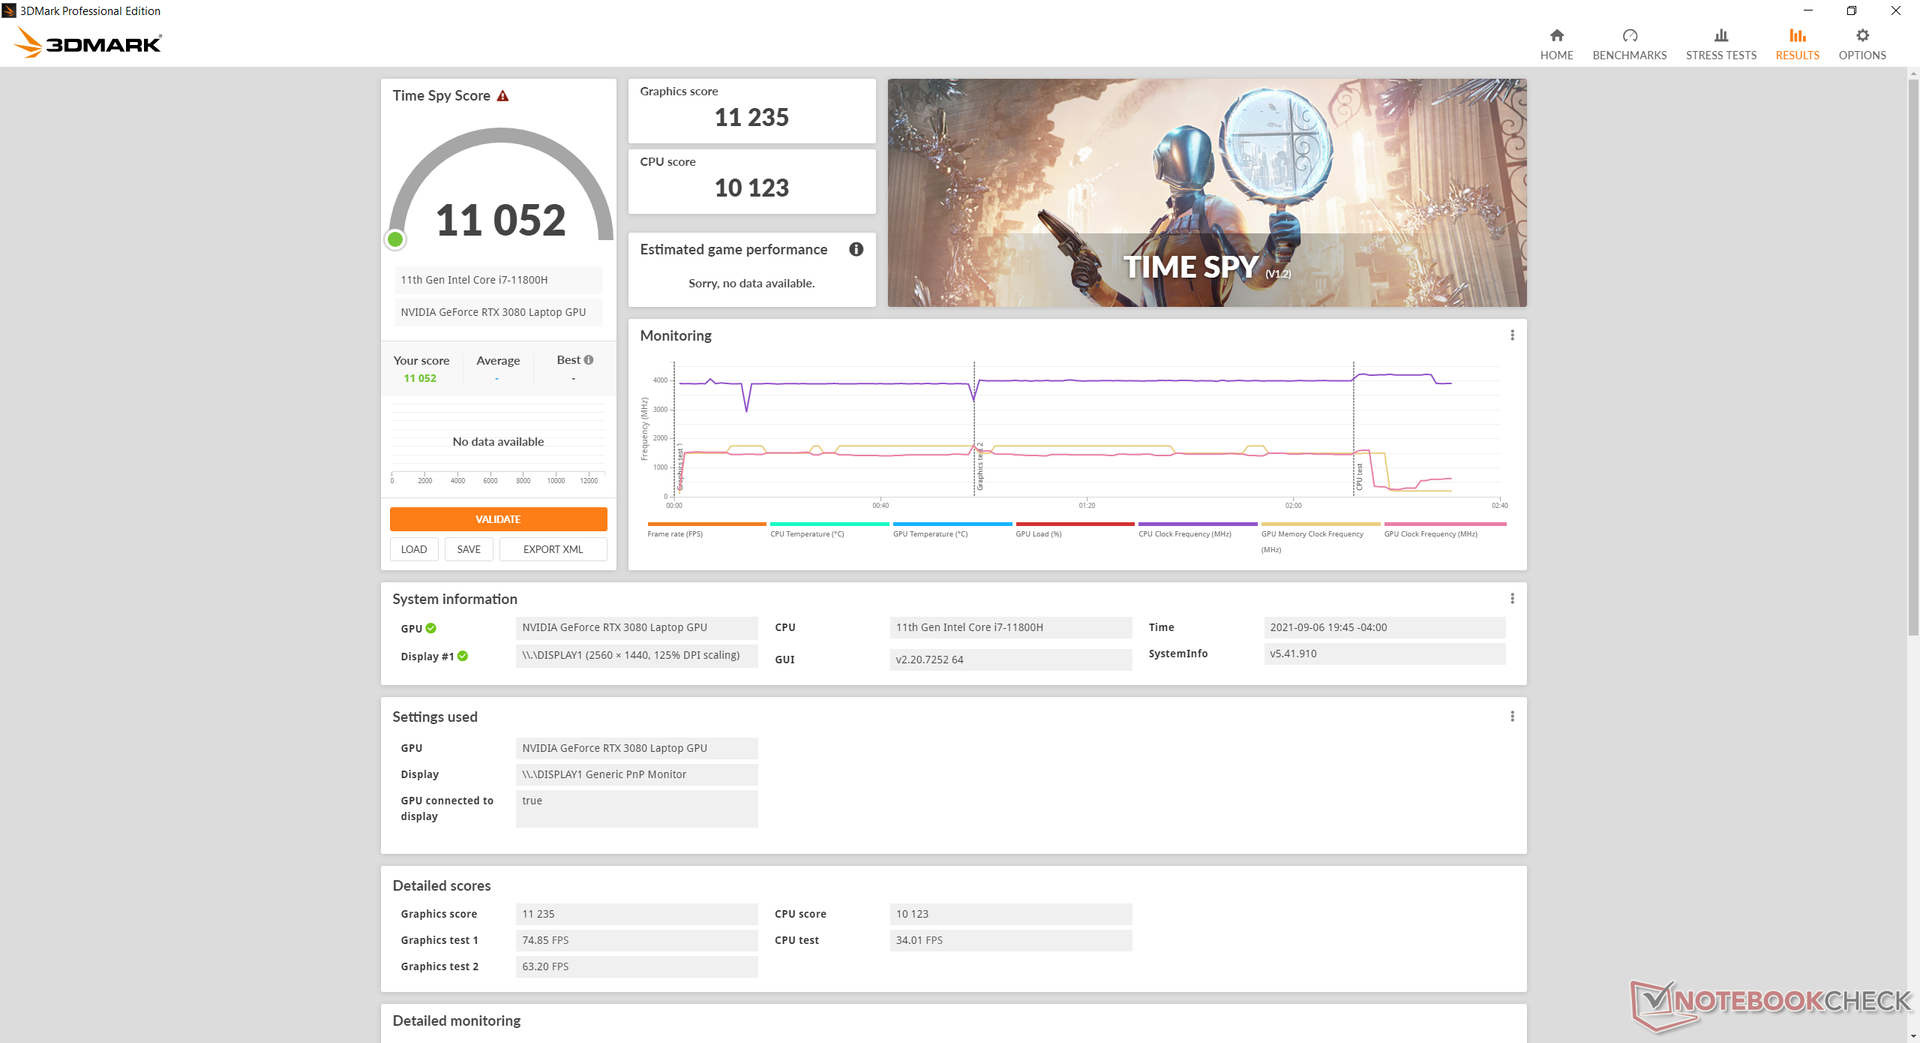
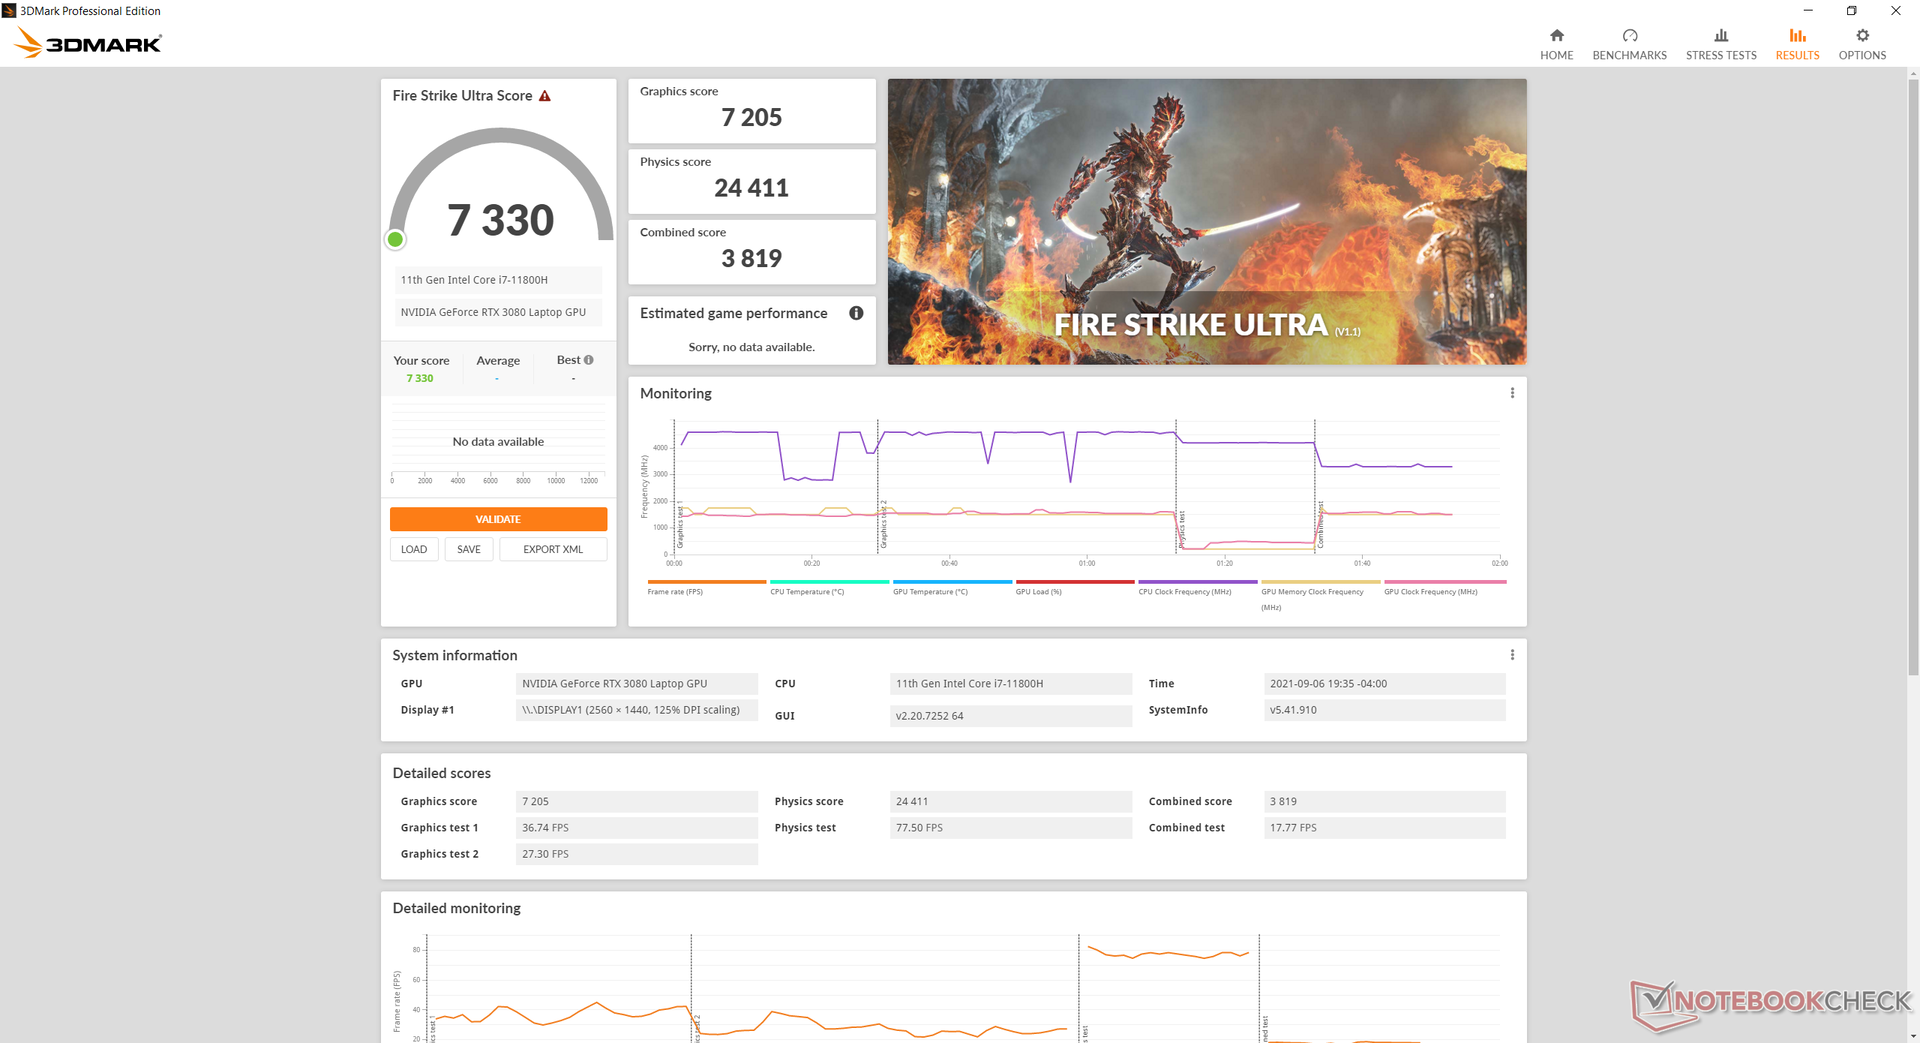
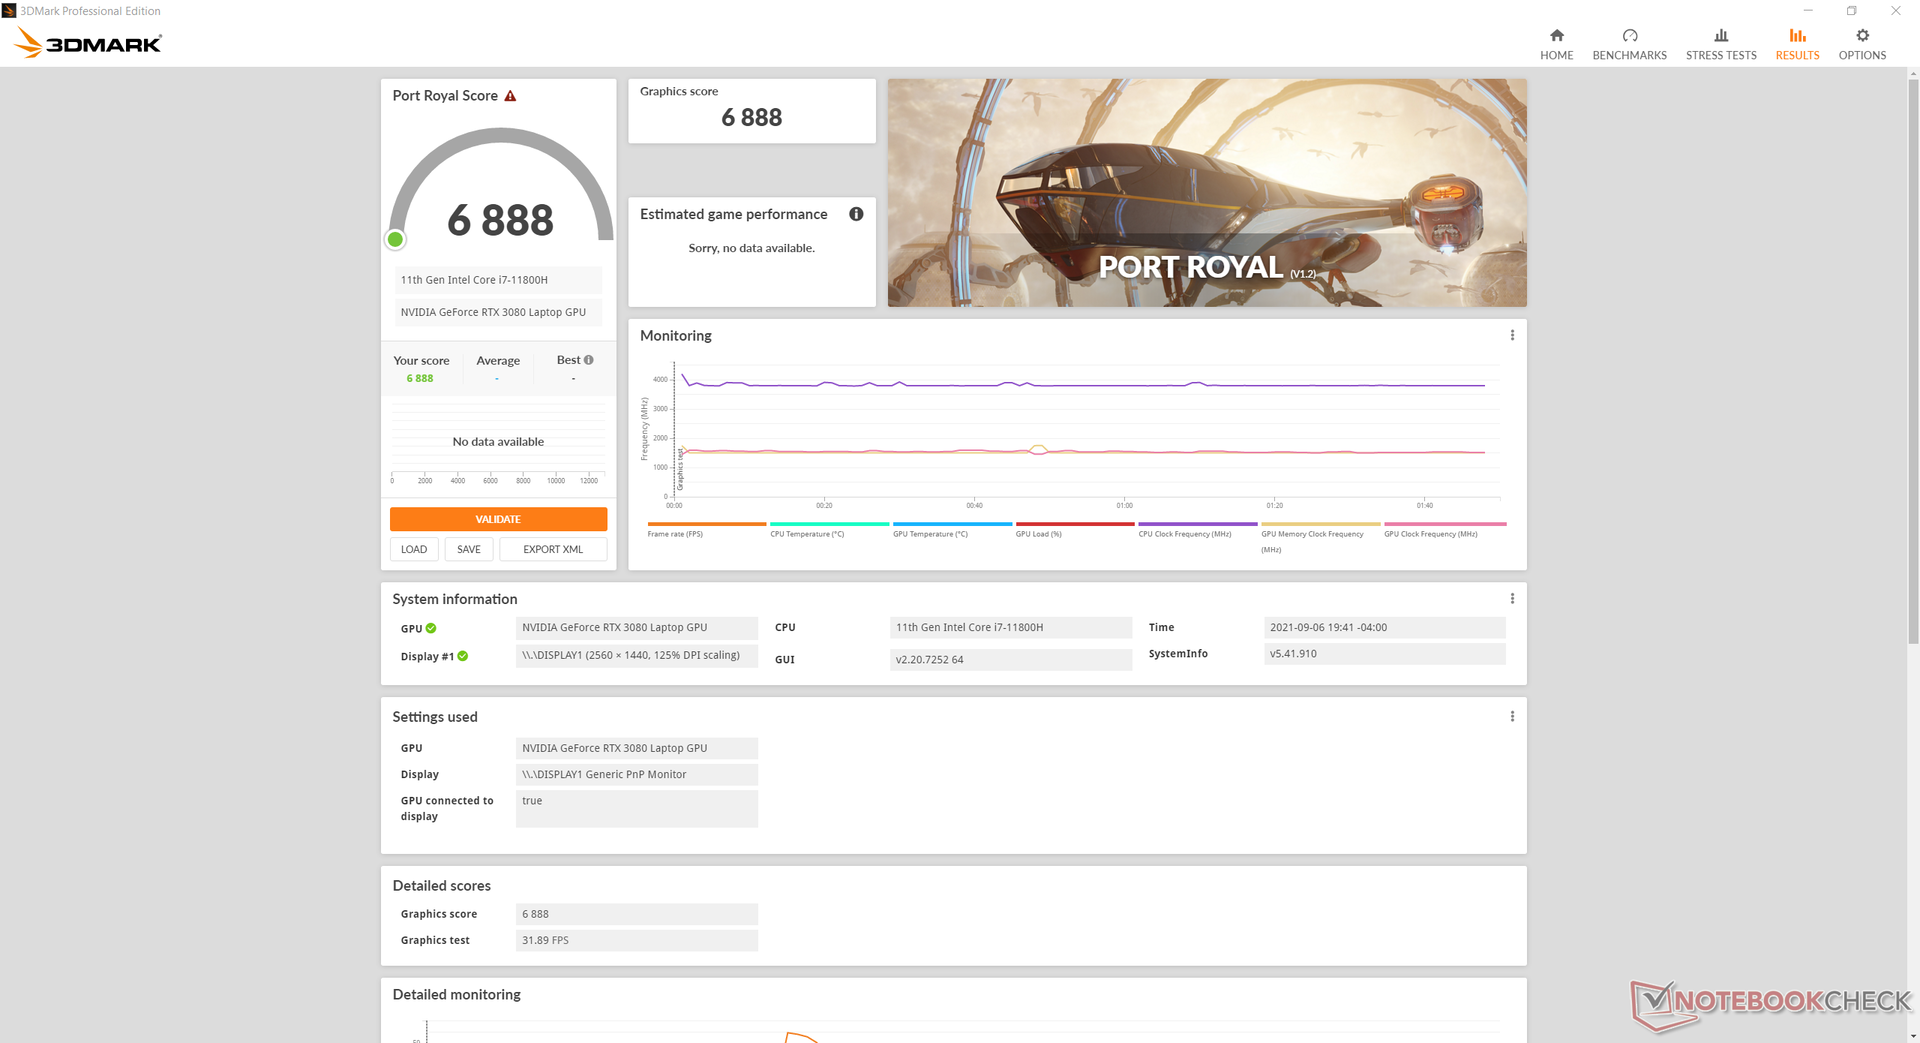
O desempenho gráfico é inferior em cerca de 15% quando comparado com o Schenker Ultra 17, embora cada sistema venha com um TGP de 165 W GeForce RTX 3080. Um "próprio" desktop RTX 3080 pode funcionar em qualquer lugar entre 40 a 60 por cento mais rápido do que nossa versão móvel. Mesmo assim, nossa GPU está mais ou menos onde esperamos que esteja depois de testar mais de 30 Computadores portáteis RTX 3080 até o momento.
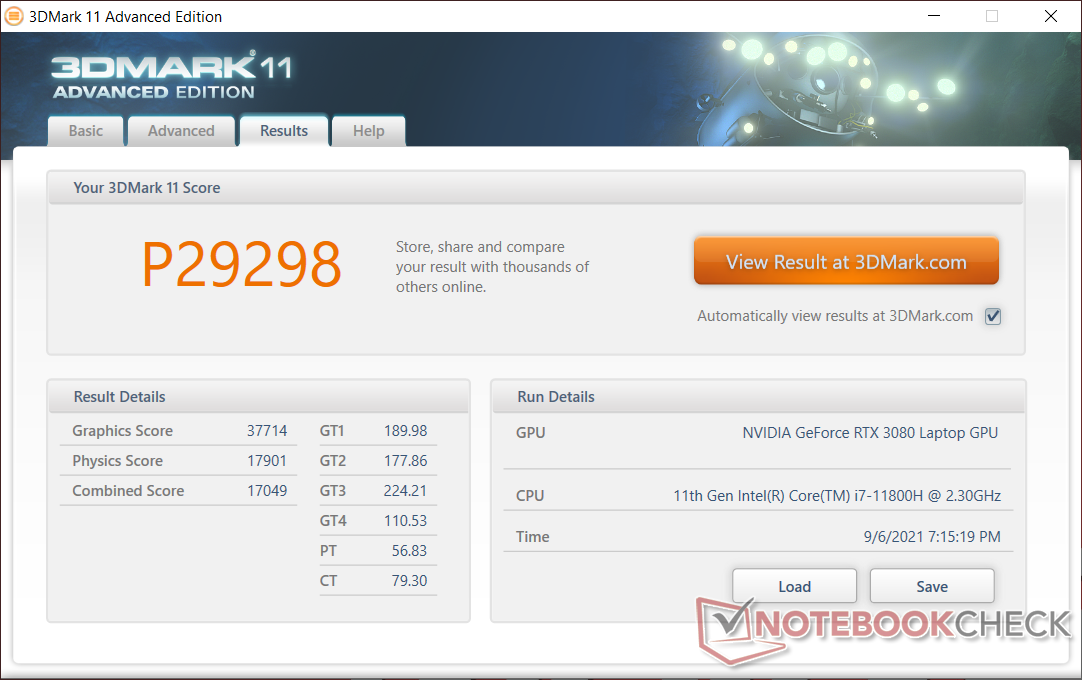
| 3DMark 11 Performance | 29298 pontos | |
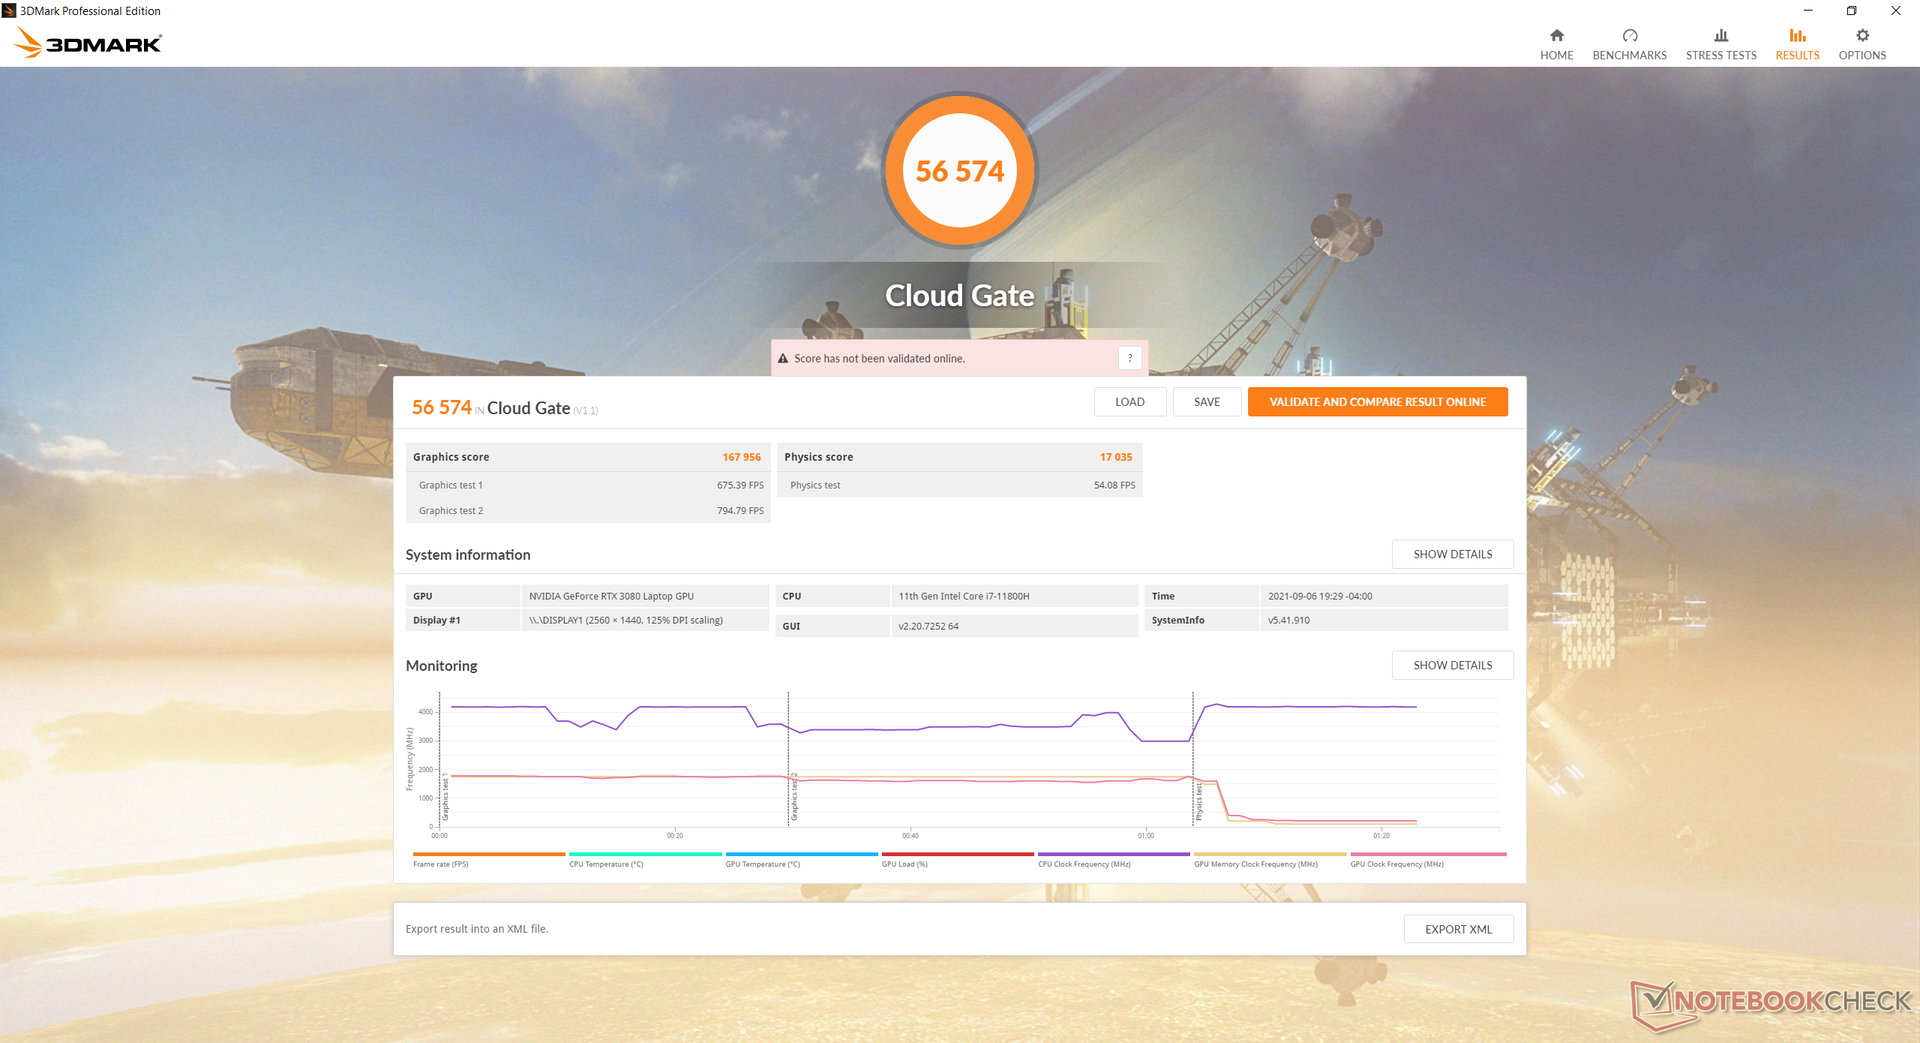
| 3DMark Cloud Gate Standard Score | 56574 pontos | |
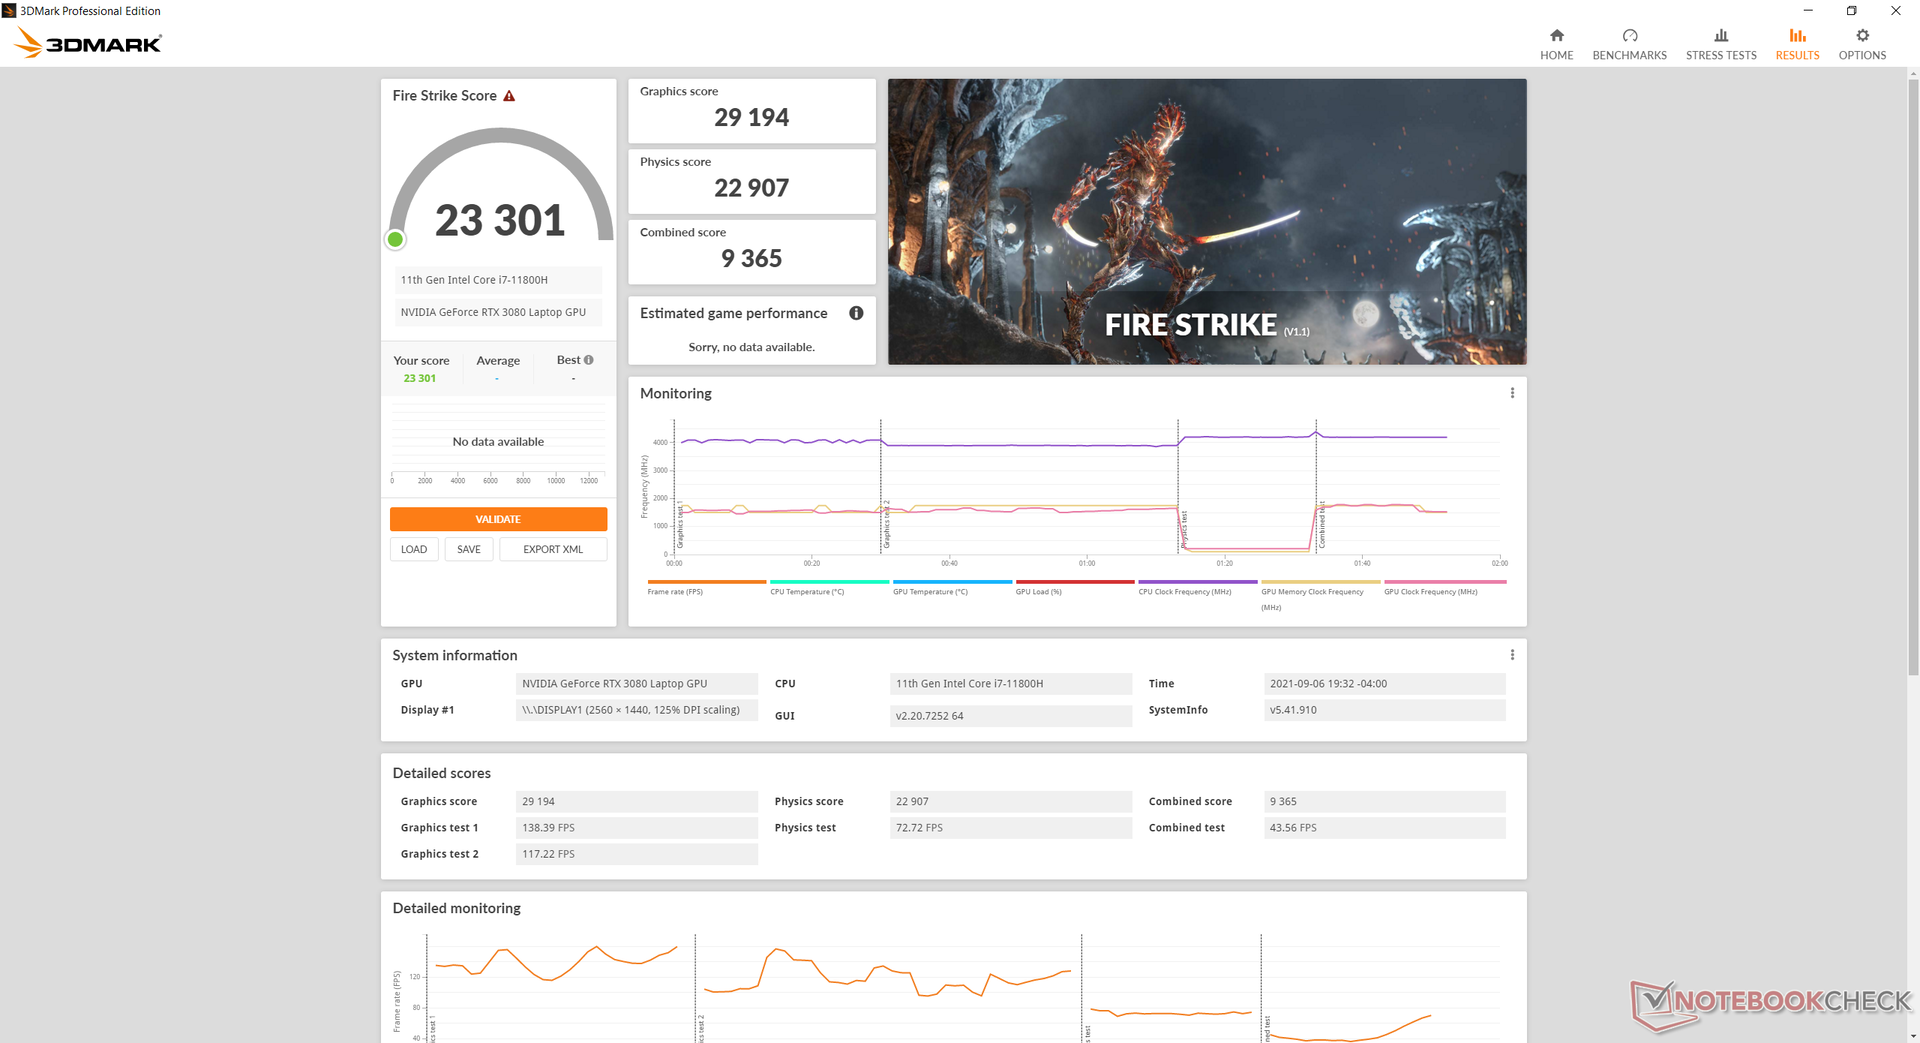
| 3DMark Fire Strike Score | 23301 pontos | |
| 3DMark Time Spy Score | 11052 pontos | |
Ajuda | ||
Witcher 3 FPS Chart
| baixo | média | alto | ultra | QHD | |
|---|---|---|---|---|---|
| GTA V (2015) | 184 | 179 | 173 | 109 | 99.1 |
| The Witcher 3 (2015) | 439.6 | 321.2 | 212.9 | 108.6 | |
| Dota 2 Reborn (2015) | 164 | 145 | 142 | 127 | |
| Final Fantasy XV Benchmark (2018) | 184 | 144 | 108 | 83.5 | |
| X-Plane 11.11 (2018) | 126 | 114 | 85.7 | ||
| Far Cry 5 (2018) | 162 | 140 | 134 | 124 | 110 |
| Strange Brigade (2018) | 521 | 289 | 233 | 204 | 151 |
Emissions
Ruído do sistema
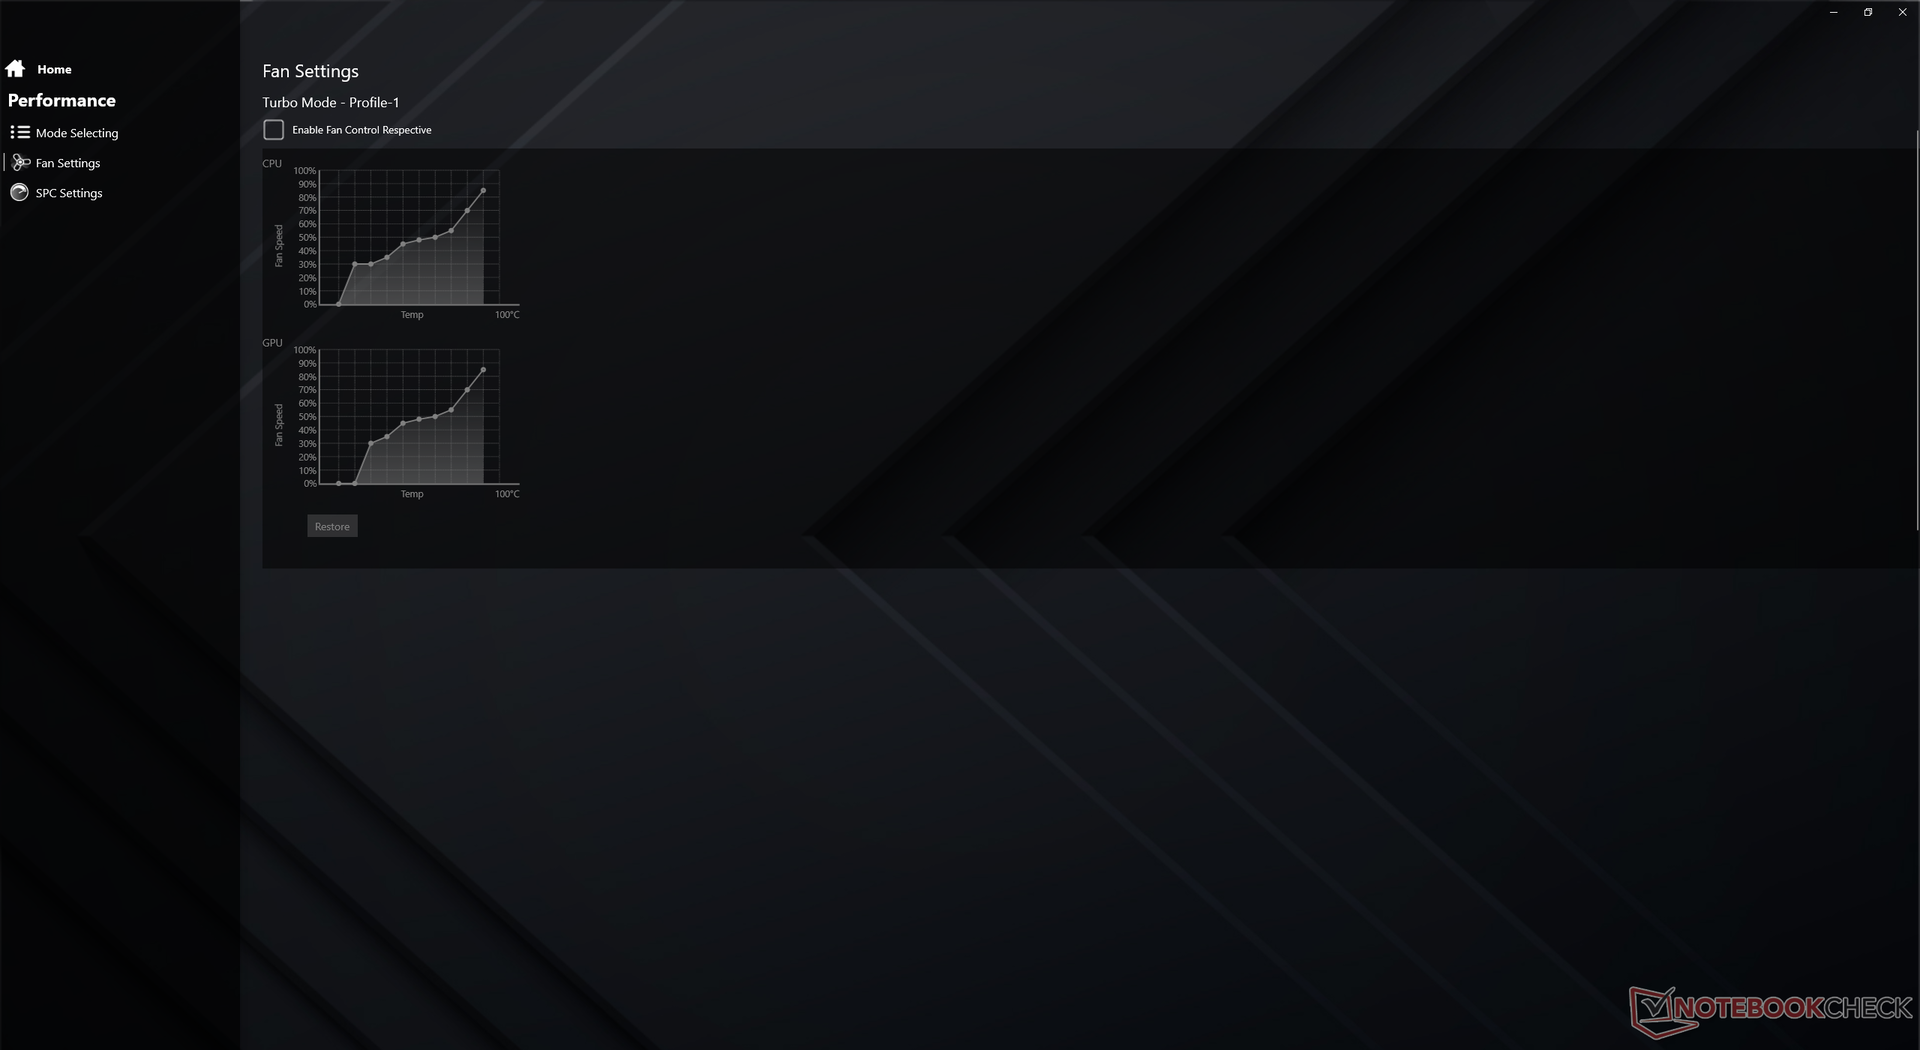
O ruído dos ventiladores é um saco misto. Quando ocioso na área de trabalho ou na navegação na web, o ruído do ventilador geralmente é silencioso, atingindo apenas 28,7 dB(A) contra um fundo silencioso de 23,8 dB(A). Ao executar a primeira cena de referência do 3DMark 06, no entanto, o ruído do ventilador aumentaria para 38 dB(A) no meio da cena antes de cair para 28,7 dB(A) no final. É recomendado rodar no modo Office ao invés do modo Turbo para evitar que os ventiladores pulsem com a mesma freqüência.
O ruído dos ventiladores quando o jogo é muito alto a quase 56 dB(A) para distrair se não estiver usando fones de ouvido. A ativação do Fan Boost irá ajustar os ventiladores para seu máximo de 56 dB(A) independentemente da carga de processamento, mas os usuários alcançarão este teto de qualquer forma quando estiverem jogando, independentemente da configuração do Fan Boost.
| Maingear Vector Pro MG-VCP17 GeForce RTX 3080 Laptop GPU, i7-11800H, Samsung PM9A1 MZVL21T0HCLR | Asus ROG Zephyrus S17 GX703HSD GeForce RTX 3080 Laptop GPU, i9-11900H, Samsung PM9A1 MZVL22T0HBLB | Schenker XMG Core 17 (Early 2021) GeForce RTX 3060 Laptop GPU, i7-10870H, Samsung SSD 970 EVO Plus 1TB | Schenker XMG Neo 17 (Early 2021, RTX 3070, 5800H) GeForce RTX 3070 Laptop GPU, R7 5800H, Samsung SSD 970 EVO Plus 500GB | Schenker Compact 17 GeForce RTX 2070 Super Mobile, i7-10875H, Samsung SSD 970 EVO Plus 1TB | MSI GS75 10SF-609US GeForce RTX 2070 Max-Q, i7-10875H, WDC PC SN730 SDBPNTY-512G | |
|---|---|---|---|---|---|---|
| Noise | 5% | -20% | -20% | -21% | -21% | |
| desligado / ambiente * (dB) | 23.8 | 23 3% | 25 -5% | 24 -1% | 25.4 -7% | 26.2 -10% |
| Idle Minimum * (dB) | 23.9 | 23 4% | 30 -26% | 29 -21% | 25.4 -6% | 31.2 -31% |
| Idle Average * (dB) | 23.9 | 23 4% | 32 -34% | 32 -34% | 25.4 -6% | 31.4 -31% |
| Idle Maximum * (dB) | 23.9 | 23 4% | 36 -51% | 38 -59% | 40 -67% | 34 -42% |
| Load Average * (dB) | 38 | 41 -8% | 53 -39% | 49 -29% | 54.6 -44% | 49.5 -30% |
| Witcher 3 ultra * (dB) | 55.9 | 45 19% | 51 9% | 53 5% | 50.6 9% | |
| Load Maximum * (dB) | 55.9 | 52 7% | 54 3% | 55 2% | 54.6 2% | 60.7 -9% |
* ... menor é melhor
Barulho
| Ocioso |
| 23.9 / 23.9 / 23.9 dB |
| Carga |
| 38 / 55.9 dB |
 | ||
30 dB silencioso 40 dB(A) audível 50 dB(A) ruidosamente alto |
||
min: | ||
Temperatura
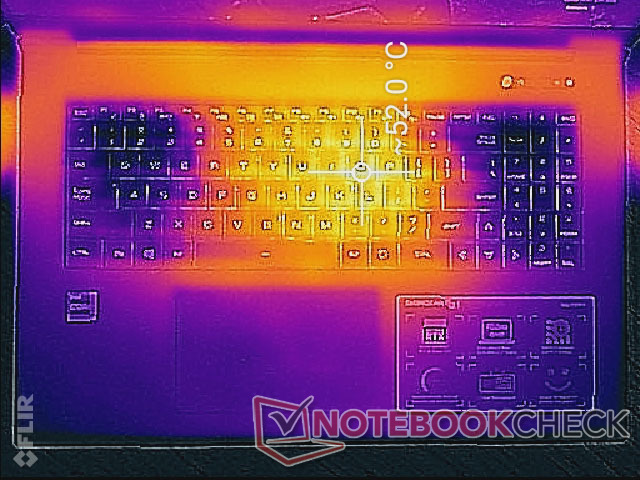
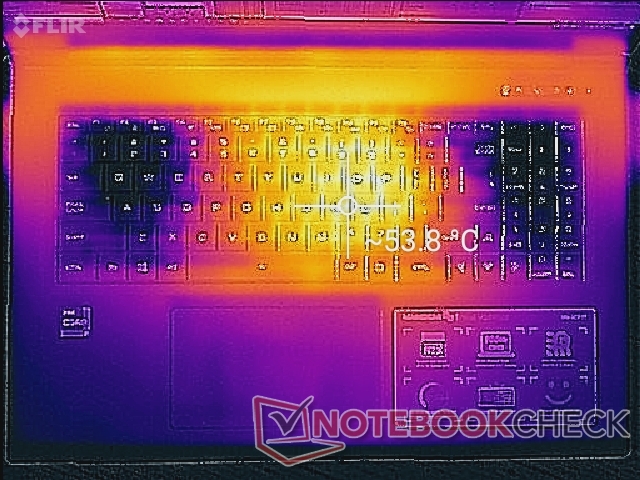
As temperaturas superficiais são mais quentes em direção ao centro do teclado, ao mesmo tempo em que são muito mais frias nas teclas WASD, no teclado numérico e no descanso para as mãos. Tal distribuição é desejável quando se joga, uma vez que é mais provável que os dedos e as palmas das mãos descansem nestas áreas mais frias do que em qualquer lugar do centro do teclado. Somos capazes de medir um ponto quente de mais de 53 C na tecla "J" quando se joga, em comparação com apenas 26 C na tecla "W" onde o ar frio está sendo puxado.
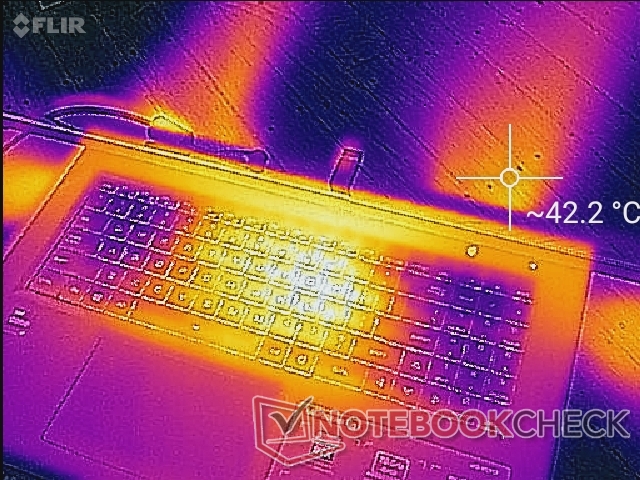
(-) A temperatura máxima no lado superior é 54.2 °C / 130 F, em comparação com a média de 40.4 °C / 105 F , variando de 21.2 a 68.8 °C para a classe Gaming.
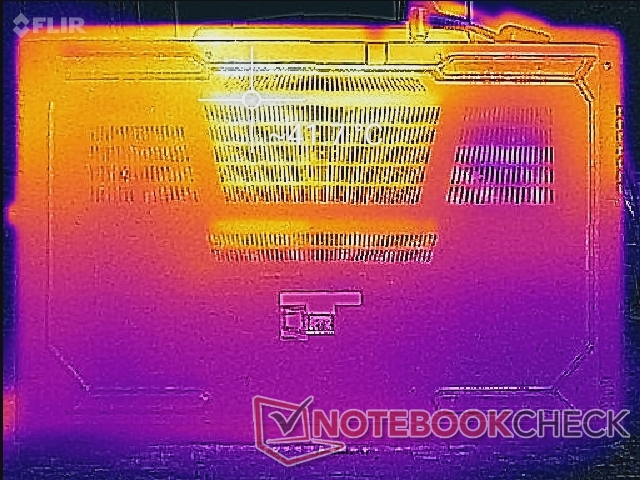
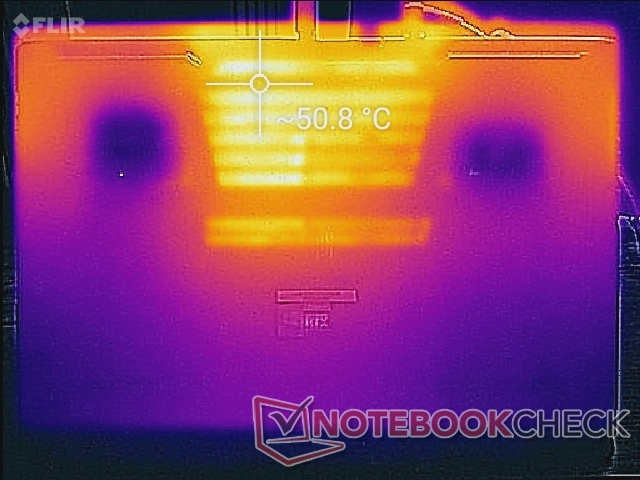
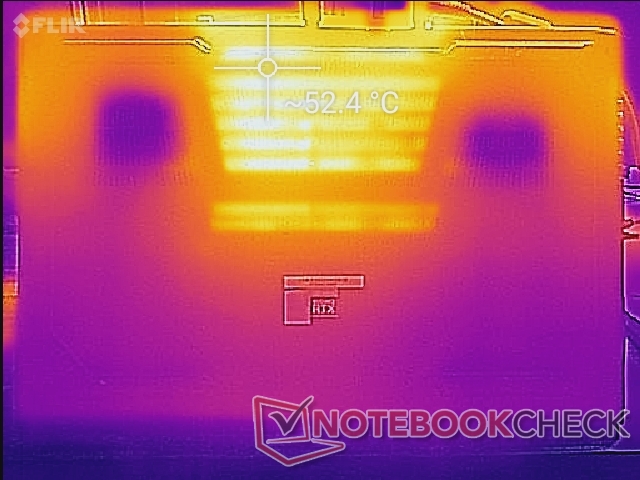
(-) A parte inferior aquece até um máximo de 52.2 °C / 126 F, em comparação com a média de 43.2 °C / 110 F
(+) Em uso inativo, a temperatura média para o lado superior é 31.5 °C / 89 F, em comparação com a média do dispositivo de 33.9 °C / ### class_avg_f### F.
(±) Jogando The Witcher 3, a temperatura média para o lado superior é 36.1 °C / 97 F, em comparação com a média do dispositivo de 33.9 °C / ## #class_avg_f### F.
(+) Os apoios para as mãos e o touchpad estão atingindo a temperatura máxima da pele (32.6 °C / 90.7 F) e, portanto, não estão quentes.
(-) A temperatura média da área do apoio para as mãos de dispositivos semelhantes foi 28.8 °C / 83.8 F (-3.8 °C / -6.9 F).

Teste de estresse
Quando estressada com Prime95, a CPU aumentaria para 4,1 GHz nos primeiros segundos antes de cair e eventualmente flutuar na faixa de 3,2 GHz a 3,8 GHz. A temperatura central alcançaria pouco mais de 90 C em comparação com apenas 76 C no Ryzen 7-powered Asus ROG Strix G17 G713QE quando em condições semelhantes.
Rodando Witcher 3 é mais representativa do estresse dos jogos do mundo real. Nossa CPU e GPU se estabilizariam a 80 C cada uma com um draw TGP estável de 130 W em vez da meta de 165 W. Este déficit poderia explicar porque nosso Maingear está por trás do Schenker Ultra 17, embora ambos estejam equipados com GPUs RTX 3080 de 165 W. A ativação do modo Fan Boost não parece melhorar em nada o desempenho gráfico ou as temperaturas, já que o modo simplesmente ajusta a RPM do ventilador ao máximo, independentemente da carga de processamento.
Funcionando com energia da bateria limitará severamente o desempenho mesmo quando configurado para o modo Turbo. Um teste Fire Strike nas baterias retornaria resultados de Física e Gráficos de apenas 6513 e 2345 pontos, respectivamente, em comparação com 22907 e 29194 pontos quando em rede elétrica.
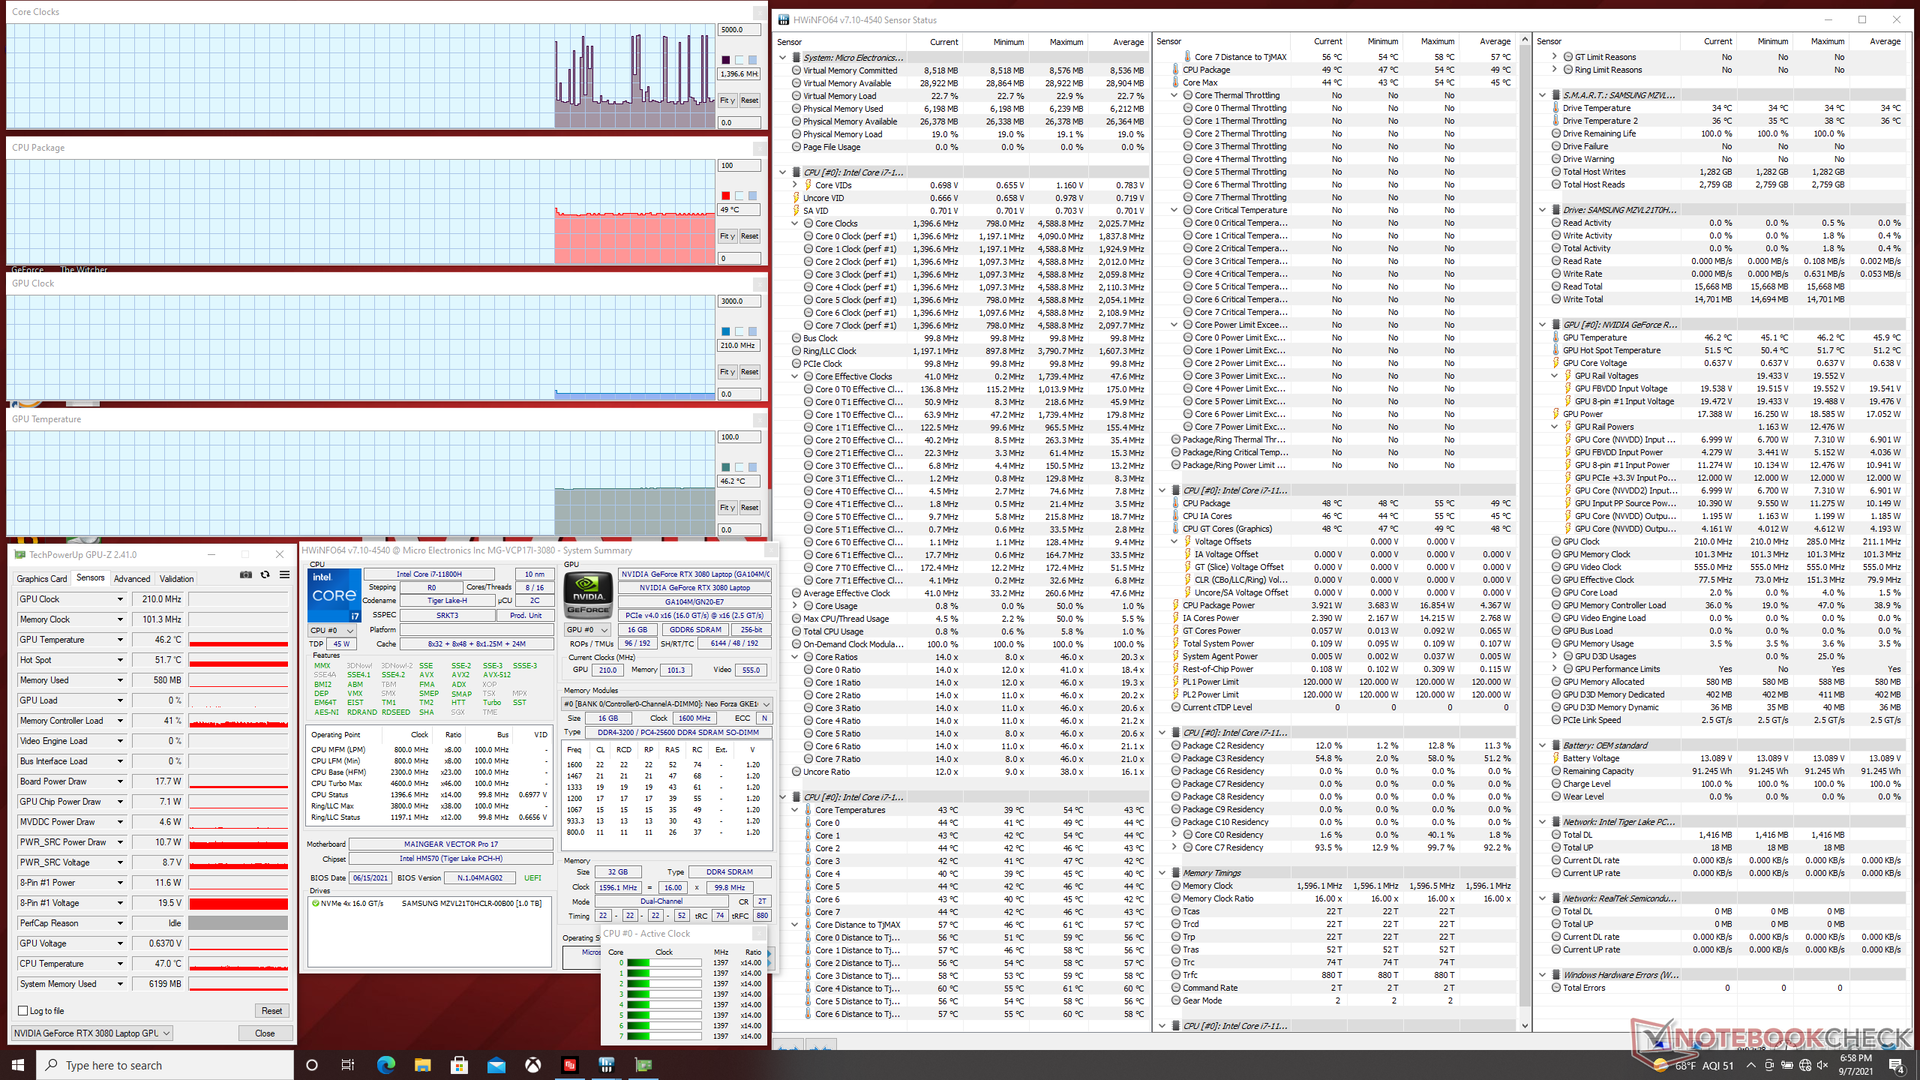
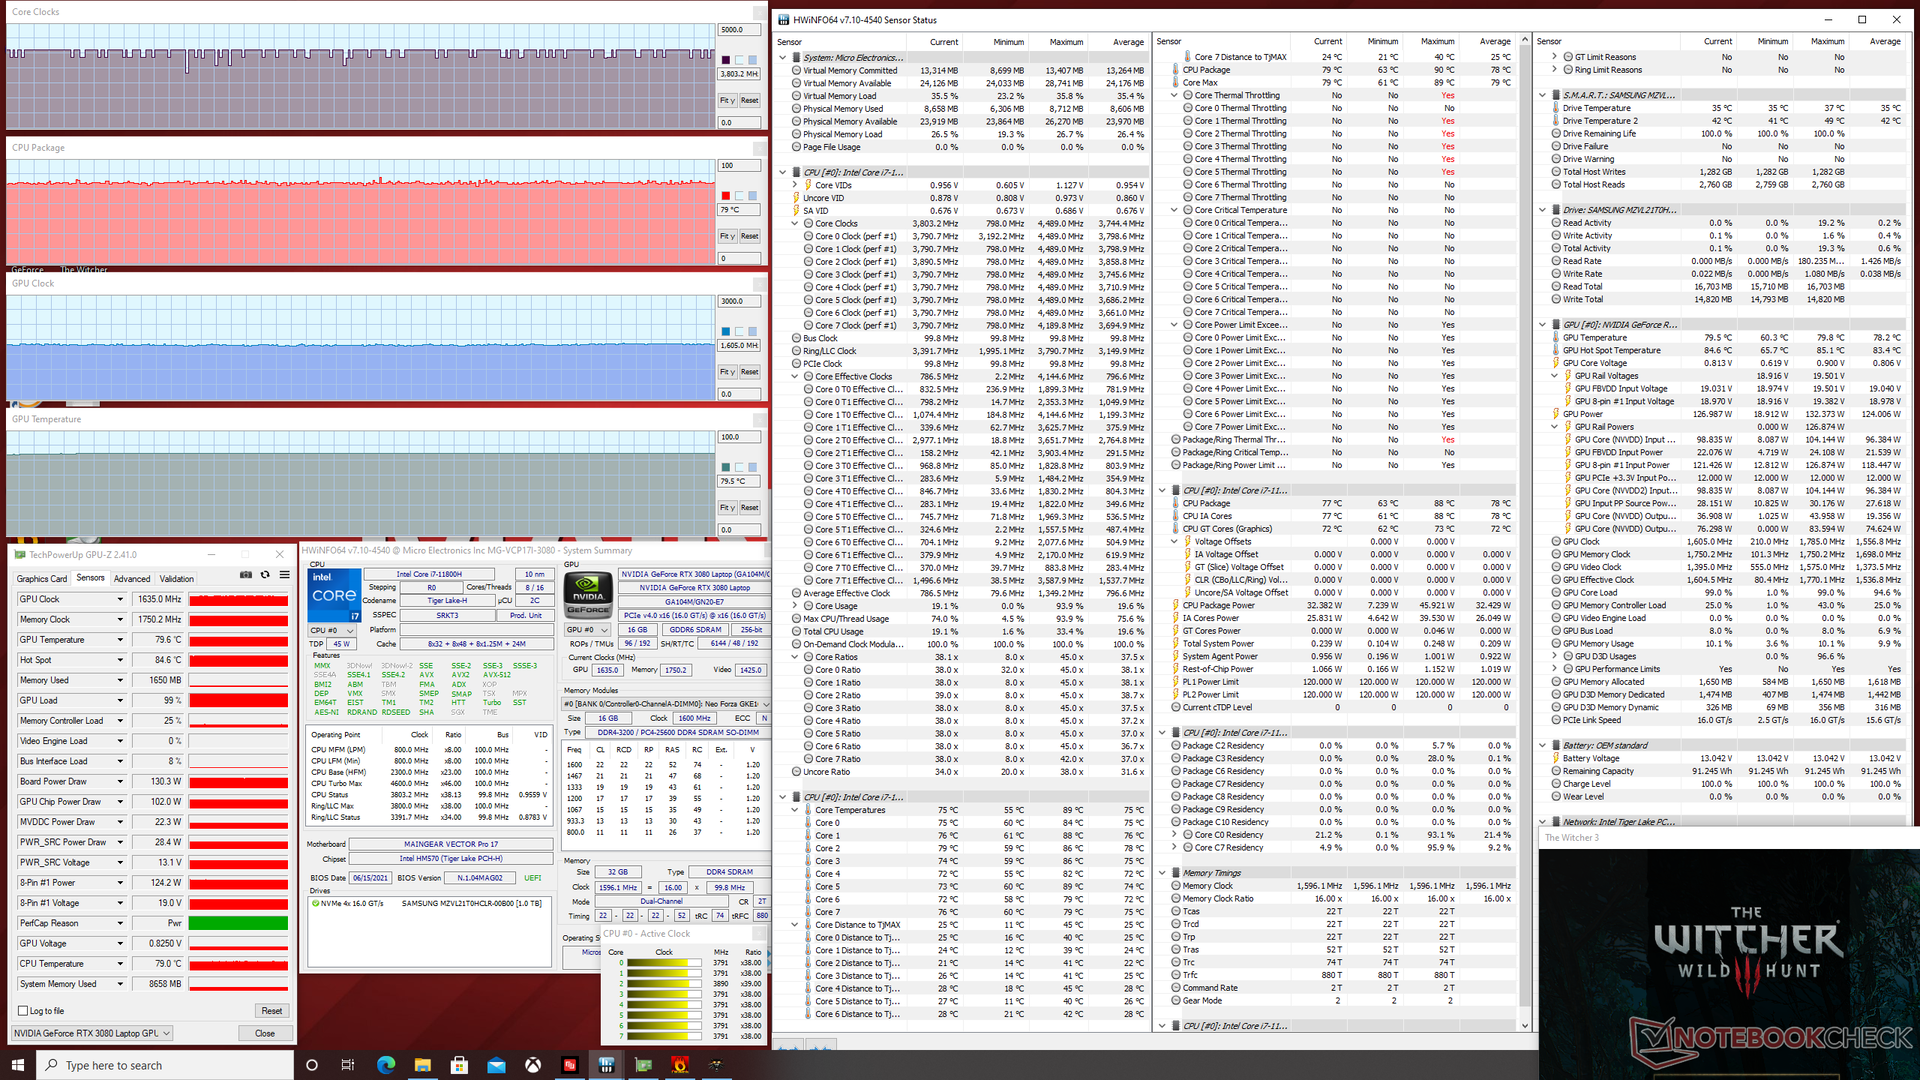
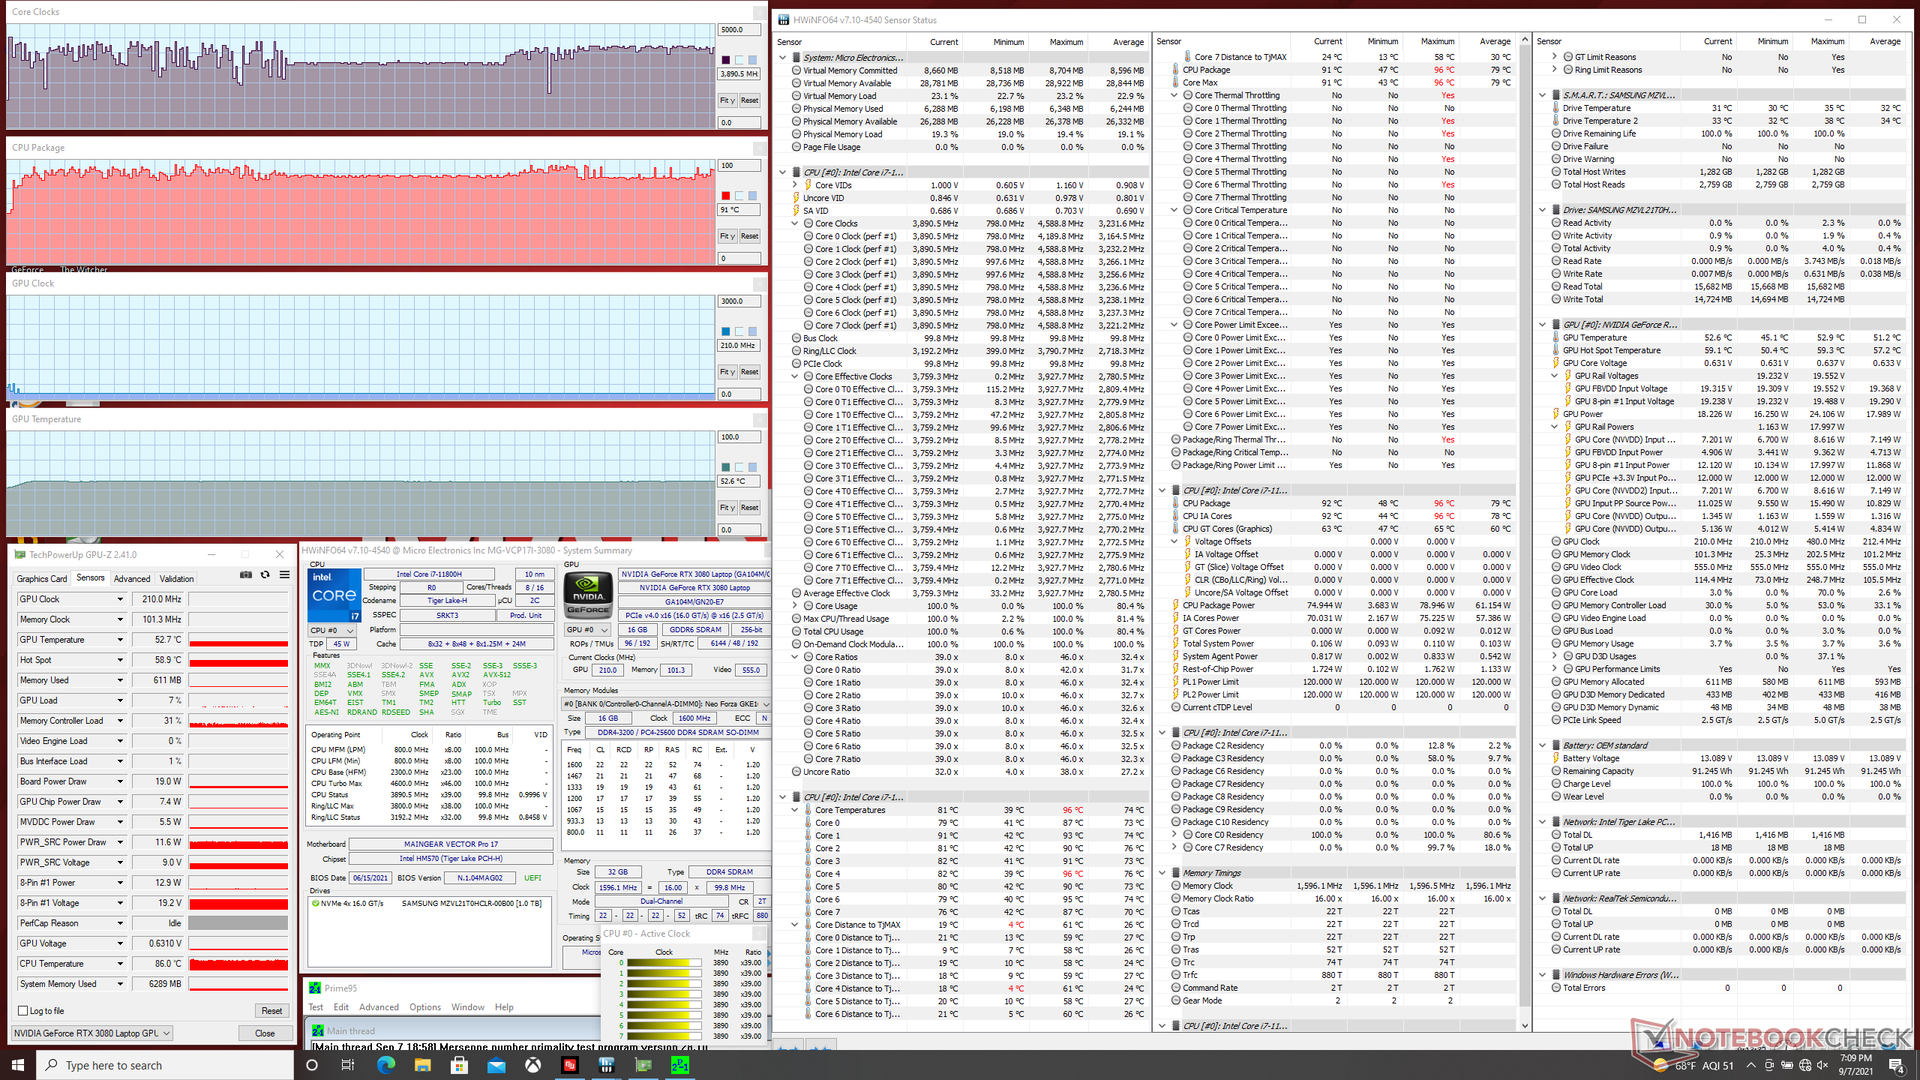
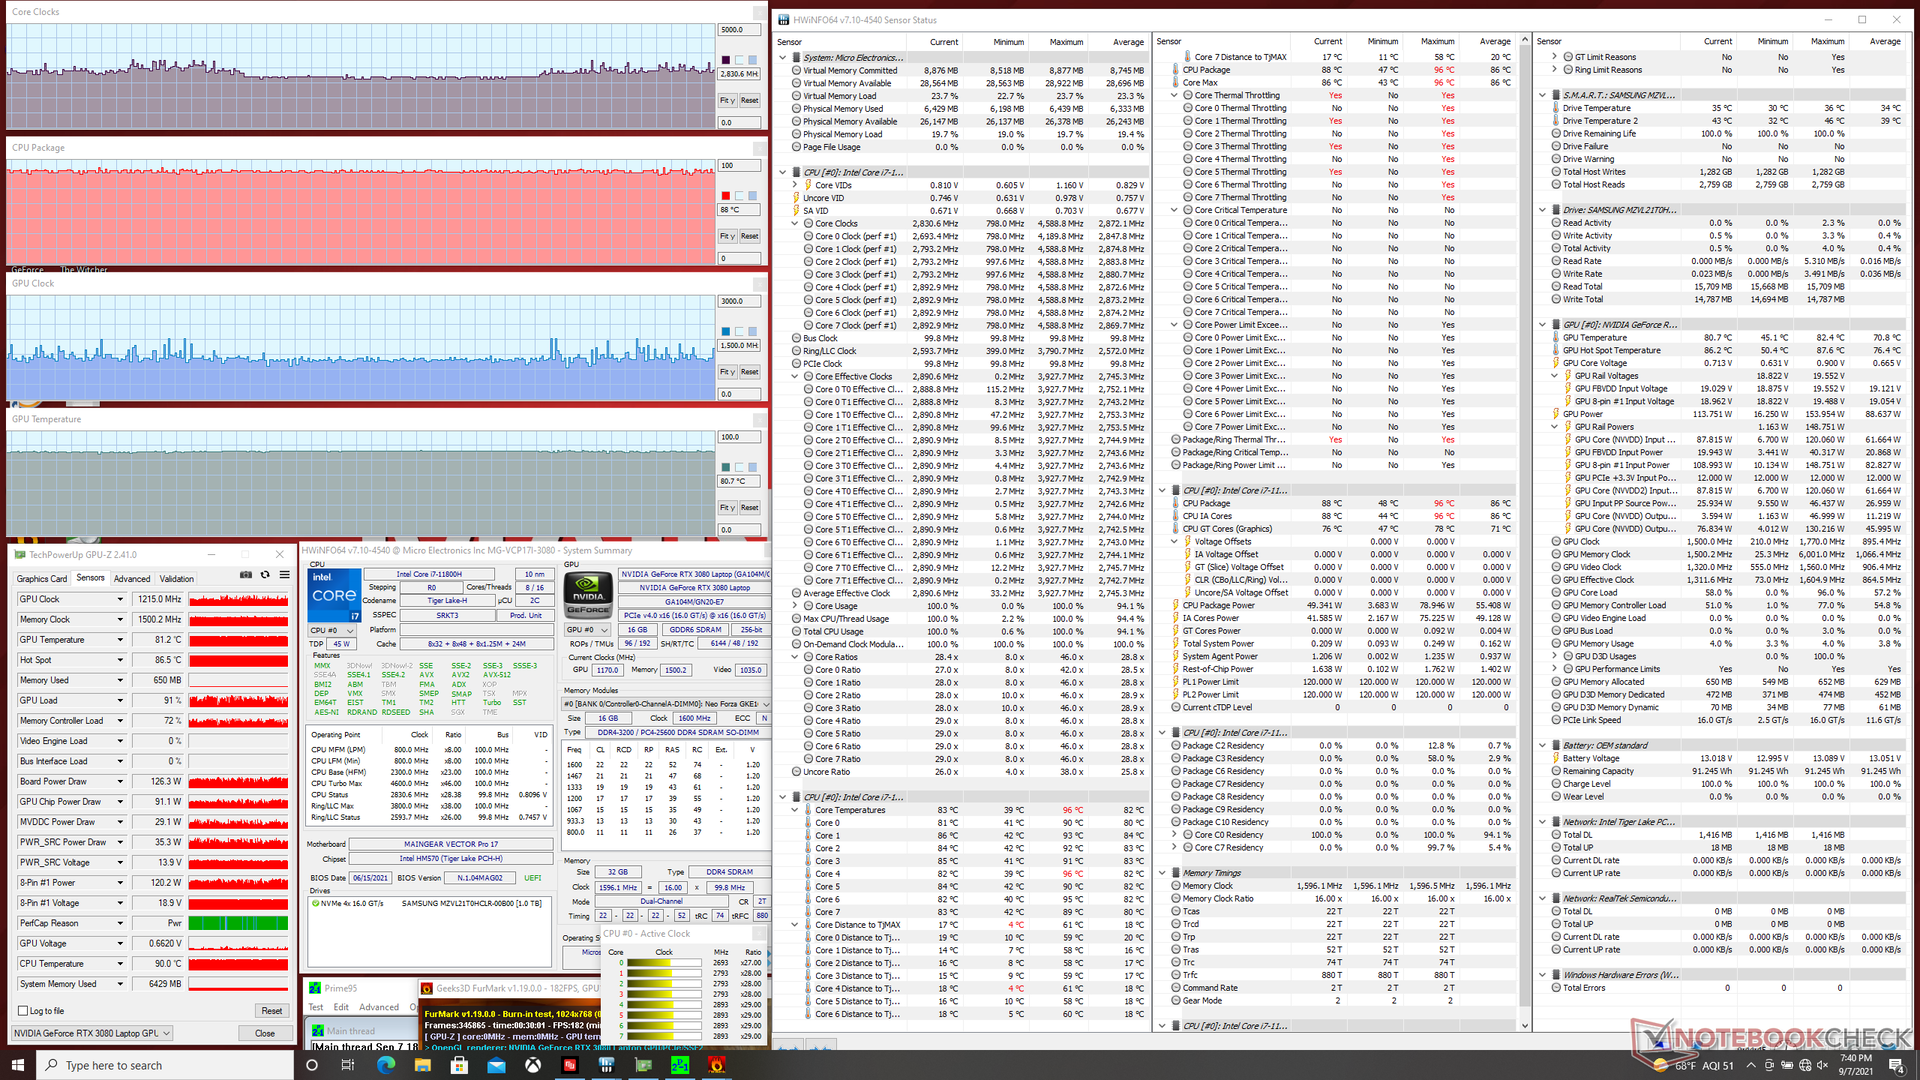
| RelógioCPU (GHz) | RelógioGPU (MHz) | Temperaturamédiada CPU (°C) | Temperaturamédiada GPU (°C) | |
| System Idle | -- | --49 | 46 | |
| Prime95 Stress | 3.2 - 3.8 | -- | 91 | 53 |
| Prime95 + FurMark Stress | 2.8 - 3.2 | 1100 - 1770 | 88 | 81 |
| Witcher 3 Stress | 3.4 - 3.8 | 1635 | 79 | 80 |
Oradores


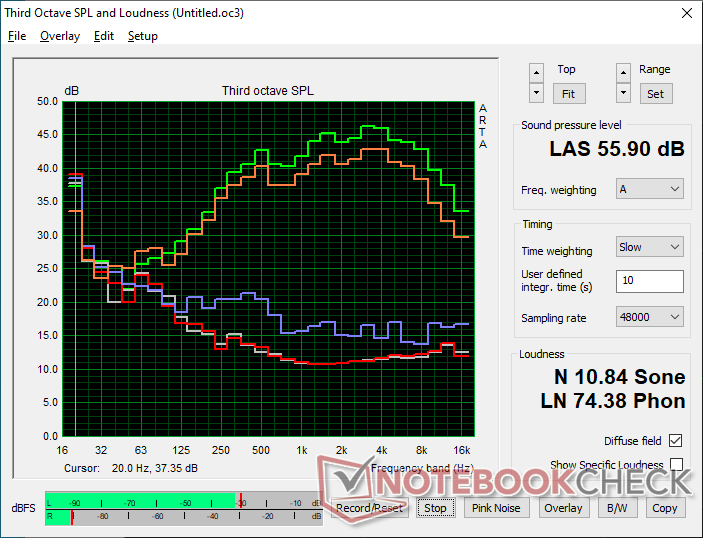
Maingear Vector Pro MG-VCP17 análise de áudio
(±) | o volume do alto-falante é médio, mas bom (###valor### dB)
Graves 100 - 315Hz
(-) | quase nenhum baixo - em média 19.3% menor que a mediana
(±) | a linearidade dos graves é média (11.7% delta para a frequência anterior)
Médios 400 - 2.000 Hz
(+) | médios equilibrados - apenas 2.1% longe da mediana
(+) | médios são lineares (4.5% delta para frequência anterior)
Altos 2 - 16 kHz
(+) | agudos equilibrados - apenas 3.4% longe da mediana
(+) | os máximos são lineares (6.6% delta da frequência anterior)
Geral 100 - 16.000 Hz
(±) | a linearidade do som geral é média (17.5% diferença em relação à mediana)
Comparado com a mesma classe
» 49% de todos os dispositivos testados nesta classe foram melhores, 12% semelhantes, 39% piores
» O melhor teve um delta de 6%, a média foi 18%, o pior foi 132%
Comparado com todos os dispositivos testados
» 34% de todos os dispositivos testados foram melhores, 8% semelhantes, 58% piores
» O melhor teve um delta de 4%, a média foi 23%, o pior foi 134%
Apple MacBook 12 (Early 2016) 1.1 GHz análise de áudio
(+) | os alto-falantes podem tocar relativamente alto (###valor### dB)
Graves 100 - 315Hz
(±) | graves reduzidos - em média 11.3% menor que a mediana
(±) | a linearidade dos graves é média (14.2% delta para a frequência anterior)
Médios 400 - 2.000 Hz
(+) | médios equilibrados - apenas 2.4% longe da mediana
(+) | médios são lineares (5.5% delta para frequência anterior)
Altos 2 - 16 kHz
(+) | agudos equilibrados - apenas 2% longe da mediana
(+) | os máximos são lineares (4.5% delta da frequência anterior)
Geral 100 - 16.000 Hz
(+) | o som geral é linear (10.2% diferença em relação à mediana)
Comparado com a mesma classe
» 7% de todos os dispositivos testados nesta classe foram melhores, 2% semelhantes, 90% piores
» O melhor teve um delta de 5%, a média foi 18%, o pior foi 53%
Comparado com todos os dispositivos testados
» 5% de todos os dispositivos testados foram melhores, 1% semelhantes, 94% piores
» O melhor teve um delta de 4%, a média foi 23%, o pior foi 134%
Energy Management
Consumo de energia
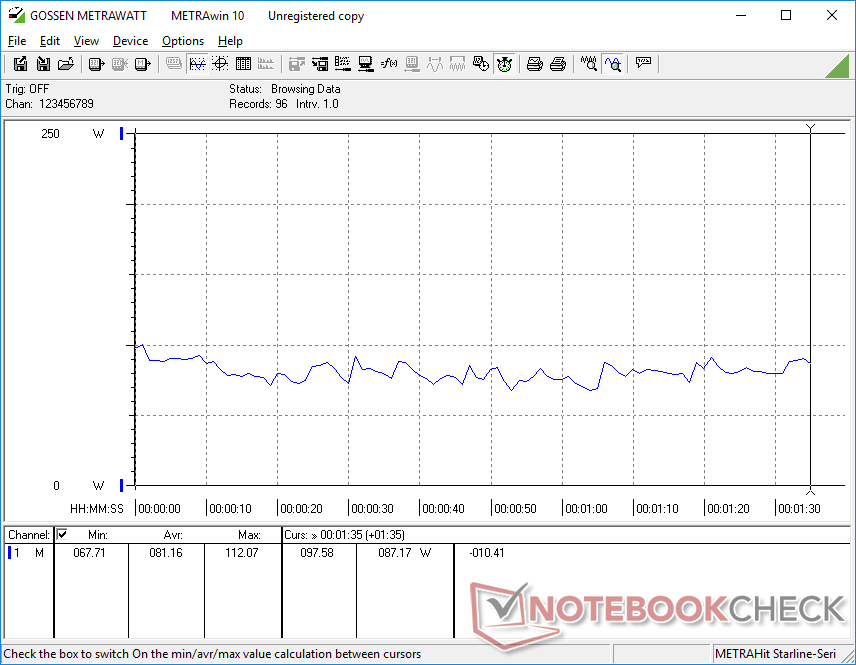
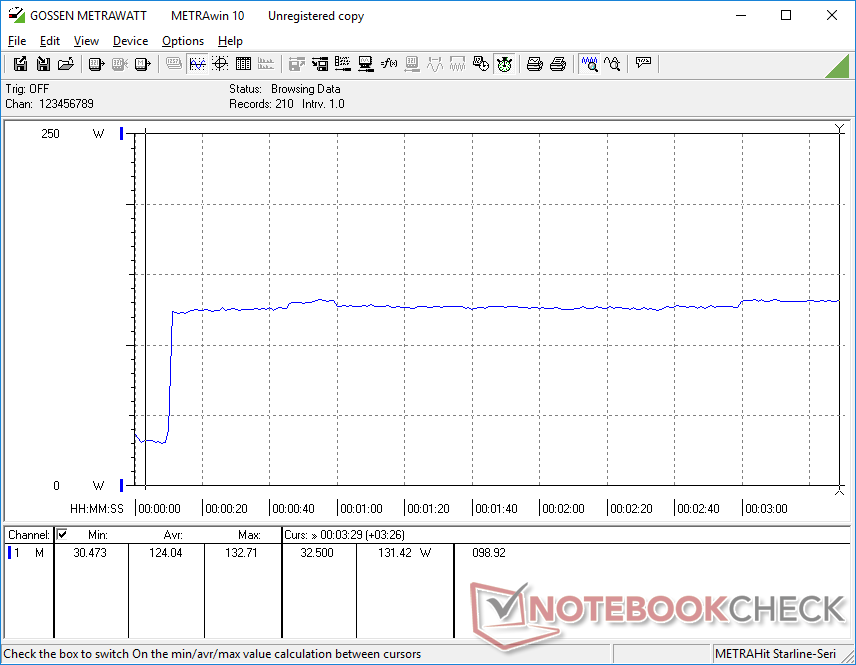
A manipulação no modo Turbo e com o dGPU ativo pode consumir até 34 W em comparação com apenas 16 W quando no modo Optimus. Portanto, vale a pena baixar o nível de desempenho se a energia extra não for necessária.
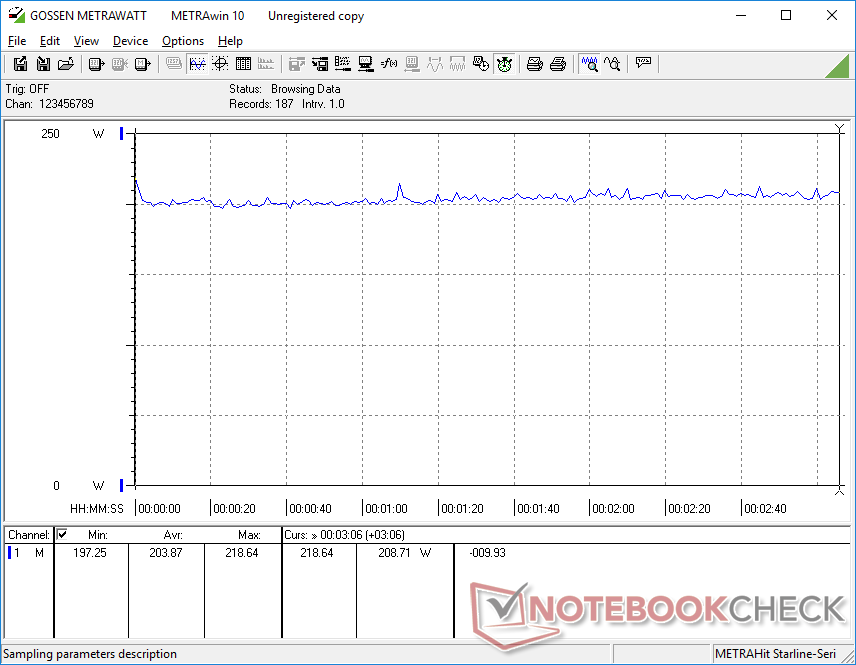
Em funcionamento Witcher 3 consome um pouco mais de energia do que na maioria dos outros computadores portáteis de 17,3 polegadas GeForce RTX para se correlacionar com o desempenho gráfico mais rápido de nosso maingear RTX 3080-powered. O Schenker XMG Core 17 com gráficos RTX 3060, por exemplo, consome cerca de 15% menos energia enquanto oferece 25% de desempenho gráfico mais lento do que nosso RTX 3080.
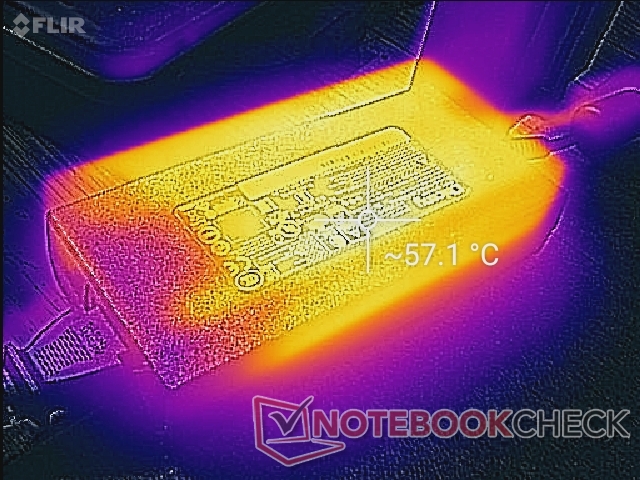
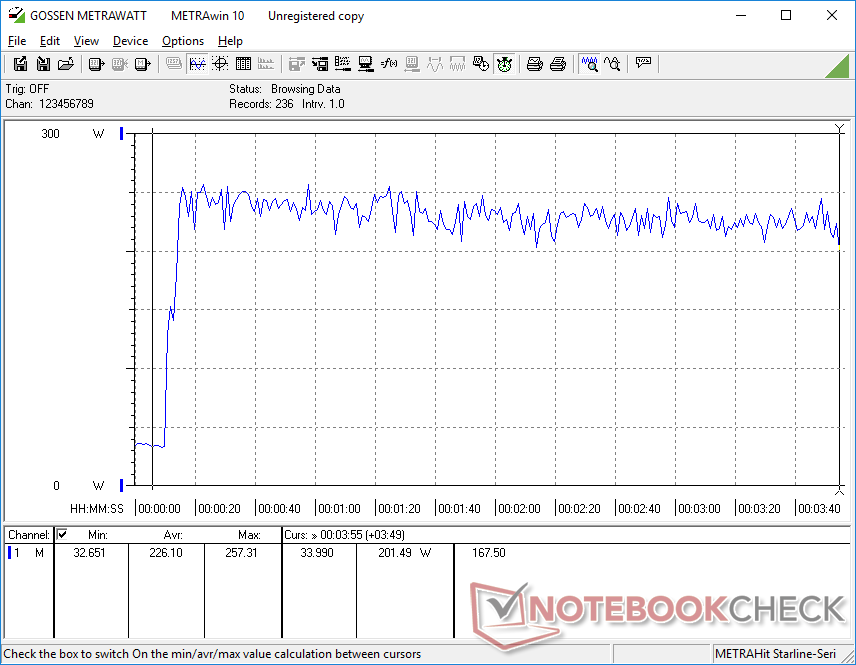
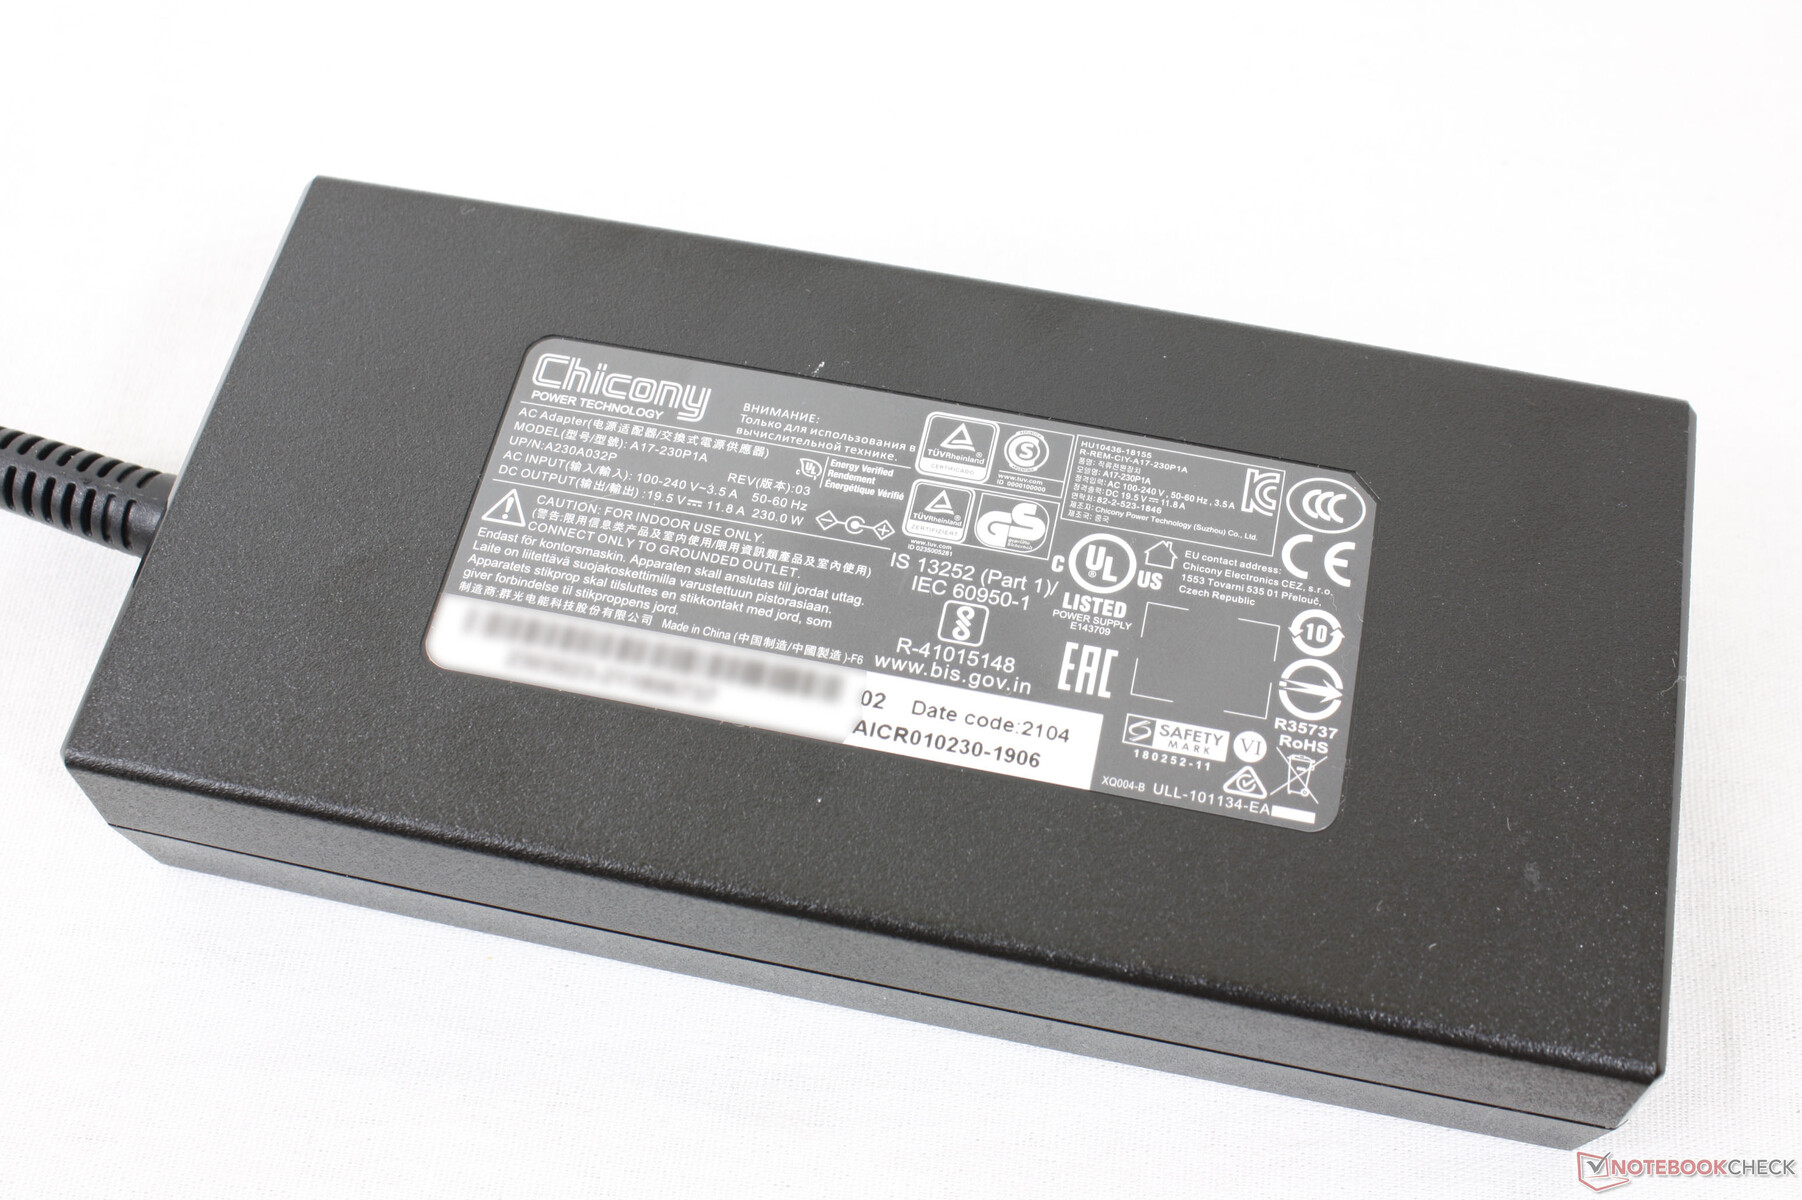
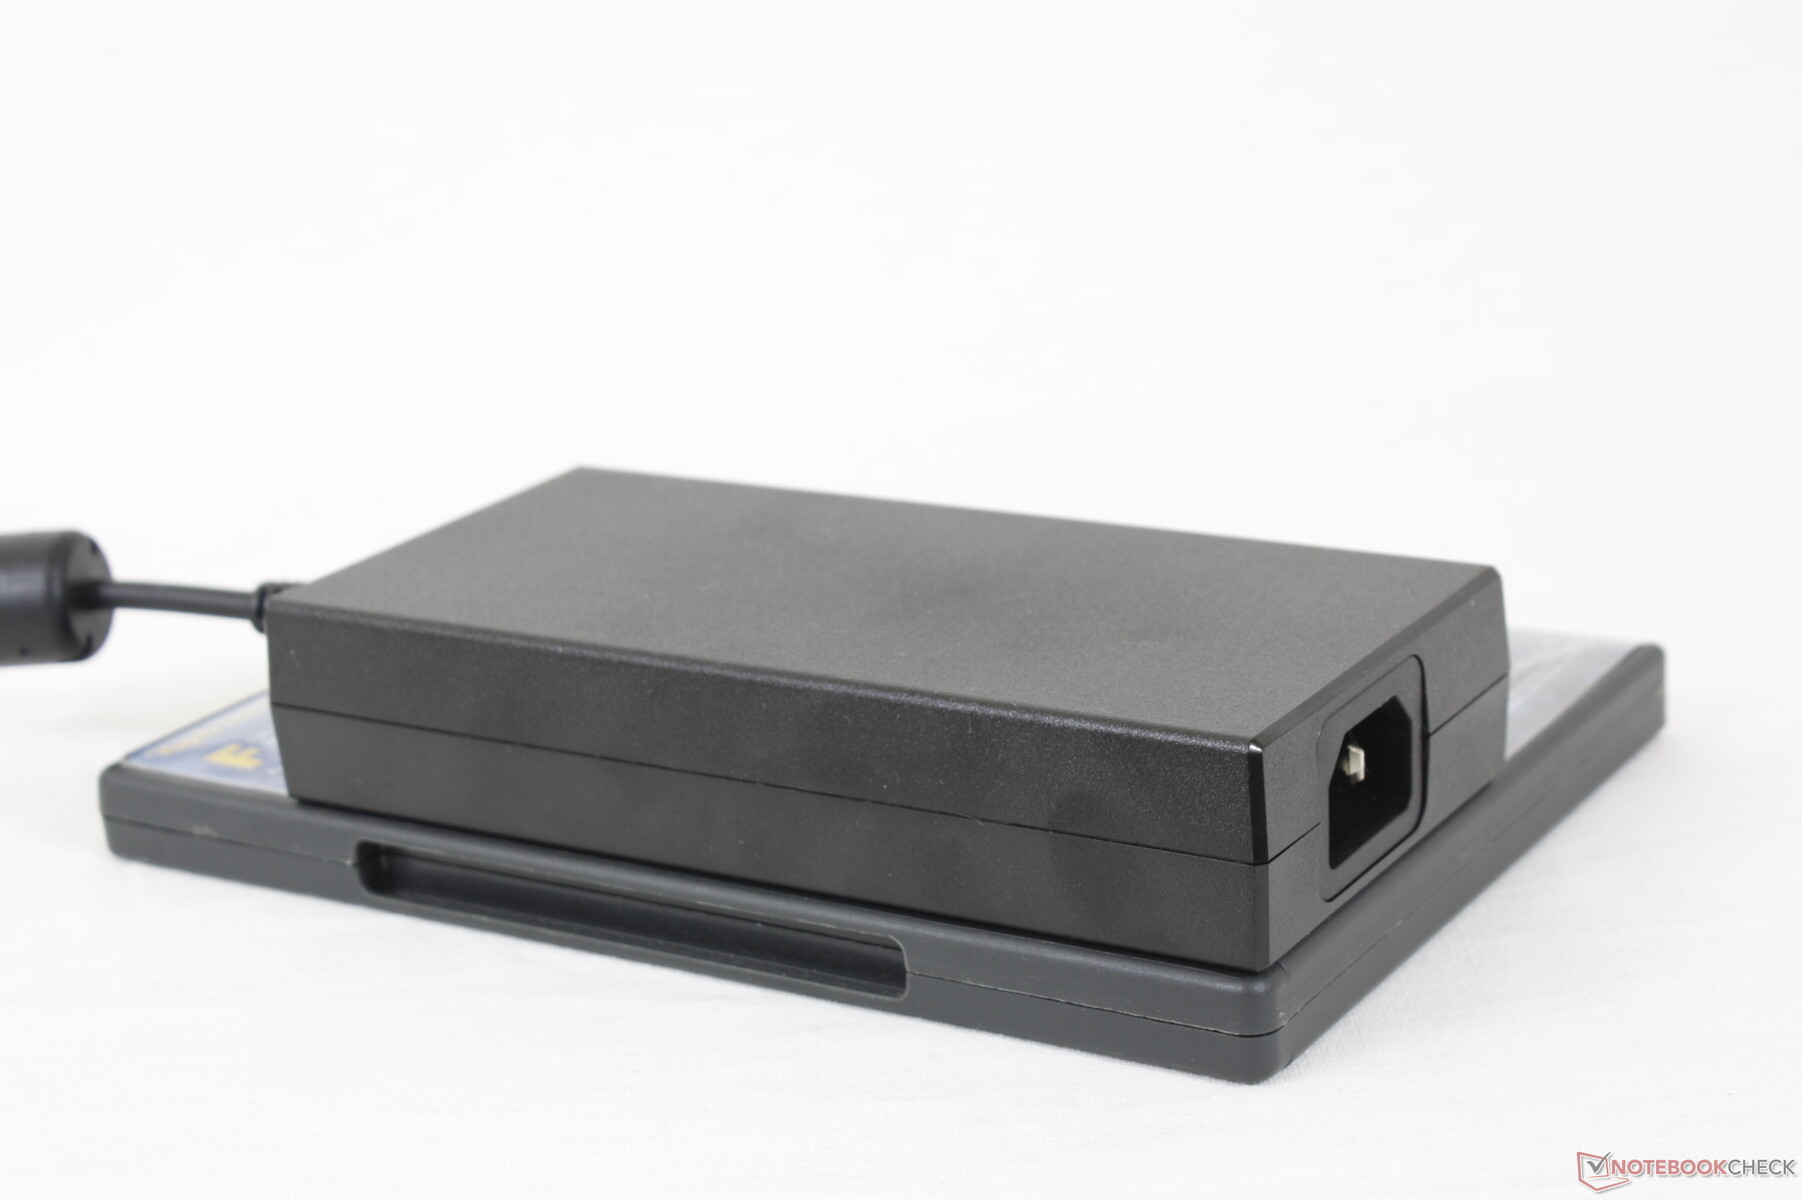
Somos capazes de registrar um consumo máximo de 257 W a partir do adaptador AC de tamanho médio (~15,3 x 7,4 x 3 cm) 240 W ao executar simultaneamente Prime95 e FurMark. Assim, o sistema poderia ter se beneficiado potencialmente de um adaptador CA maior com uma potência mais elevada. Felizmente, os jogos em execução não irão drenar a bateria quando conectado a uma tomada ao contrário de alguns dos primeiros modelos Dell XPS 17.
| desligado | |
| Ocioso | |
| Carga |
|
Key:
min: | |
| Maingear Vector Pro MG-VCP17 i7-11800H, GeForce RTX 3080 Laptop GPU, Samsung PM9A1 MZVL21T0HCLR, IPS, 2560x1440, 17.3" | Asus ROG Zephyrus S17 GX703HSD i9-11900H, GeForce RTX 3080 Laptop GPU, Samsung PM9A1 MZVL22T0HBLB, IPS, 2560x1440, 17.3" | Schenker XMG Core 17 (Early 2021) i7-10870H, GeForce RTX 3060 Laptop GPU, Samsung SSD 970 EVO Plus 1TB, IPS, 2560x1440, 17.3" | Schenker XMG Neo 17 (Early 2021, RTX 3070, 5800H) R7 5800H, GeForce RTX 3070 Laptop GPU, Samsung SSD 970 EVO Plus 500GB, IPS, 2560x1440, 17.3" | Schenker Compact 17 i7-10875H, GeForce RTX 2070 Super Mobile, Samsung SSD 970 EVO Plus 1TB, IPS, 3840x2160, 17.3" | MSI GS75 10SF-609US i7-10875H, GeForce RTX 2070 Max-Q, WDC PC SN730 SDBPNTY-512G, IPS, 1920x1080, 17.3" | |
|---|---|---|---|---|---|---|
| Power Consumption | -30% | 1% | -7% | -9% | -21% | |
| Idle Minimum * (Watt) | 11 | 21.7 -97% | 13 -18% | 13 -18% | 13.6 -24% | 19.2 -75% |
| Idle Average * (Watt) | 15.6 | 27 -73% | 16 -3% | 16 -3% | 19.8 -27% | 22.4 -44% |
| Idle Maximum * (Watt) | 34 | 33 3% | 29 15% | 26 24% | 23.5 31% | 34.7 -2% |
| Load Average * (Watt) | 81.2 | 108 -33% | 100 -23% | 125 -54% | 105 -29% | 106.7 -31% |
| Witcher 3 ultra * (Watt) | 204 | 195 4% | 173 15% | 187 8% | 160.5 21% | |
| Load Maximum * (Watt) | 257.3 | 210 18% | 213 17% | 259 -1% | 243 6% | 248.7 3% |
* ... menor é melhor
Power Consumption Witcher 3 / Stresstest
Vida útil da bateria
A capacidade da bateria é grande a 91 Wh apesar do design do chassi fino. Somos capazes de espremer quase 7 horas de uso da WLAN no mundo real com carga total quando o sistema é configurado para o modo iGPU.
A carga de vazio a plena capacidade leva pouco menos de 2 horas.
| Maingear Vector Pro MG-VCP17 i7-11800H, GeForce RTX 3080 Laptop GPU, 91 Wh | Asus ROG Zephyrus S17 GX703HSD i9-11900H, GeForce RTX 3080 Laptop GPU, 90 Wh | Schenker XMG Core 17 (Early 2021) i7-10870H, GeForce RTX 3060 Laptop GPU, 62 Wh | Schenker XMG Neo 17 (Early 2021, RTX 3070, 5800H) R7 5800H, GeForce RTX 3070 Laptop GPU, 62 Wh | Schenker Compact 17 i7-10875H, GeForce RTX 2070 Super Mobile, 62 Wh | MSI GS75 10SF-609US i7-10875H, GeForce RTX 2070 Max-Q, 80.25 Wh | |
|---|---|---|---|---|---|---|
| Duração da bateria | 9% | -29% | -49% | -32% | -29% | |
| WiFi v1.3 (h) | 6.9 | 7.5 9% | 4.9 -29% | 3.5 -49% | 4.7 -32% | 4.9 -29% |
| Witcher 3 ultra (h) | 1 | |||||
| Load (h) | 2.7 | 1.3 | 0.7 | 4.1 | ||
| Reader / Idle (h) | 7.7 | 4.7 | 8.6 |
Pro
Contra
Veredicto - Excelente equilíbrio de peso e desempenho
Você pode realmente operar uma GPU TGP de 165 W em um chassi do tamanho de um Razer Blade Pro enquanto pesa 500 gramas a menos? Nossos testes mostram que a GPU no Maingear irá oscilar em torno de 130 W quando se joga, o que é mais ou menos a média quando se leva em conta outros laptops RTX 3080 atualmente no mercado. Se você quiser maximizar o desempenho do RTX 3080, então você ainda terá que considerar os laptops mais volumosos como o Schenker XMG Ultra 17
O sistema Maingear também poderia utilizar algumas melhorias em relação à rigidez das dobradiças. Enquanto sua base parece mais robusta que um Asus Zephyrus S, suas dobradiças poderiam ter sido mais rígidas para uma melhor sensação de longevidade e qualidade. Os ventiladores também são muito barulhentos quando se joga, mas essa é uma característica compartilhada entre outros laptops ultra-rápidos para jogos e, portanto, não podemos culpar exclusivamente o Vector Pro por seu ruído
Poderoso e surpreendentemente leve para o tamanho. Algumas características menores foram omitidas, mas o sistema central, a tela, o desempenho e a capacidade de expansão são sólidos.
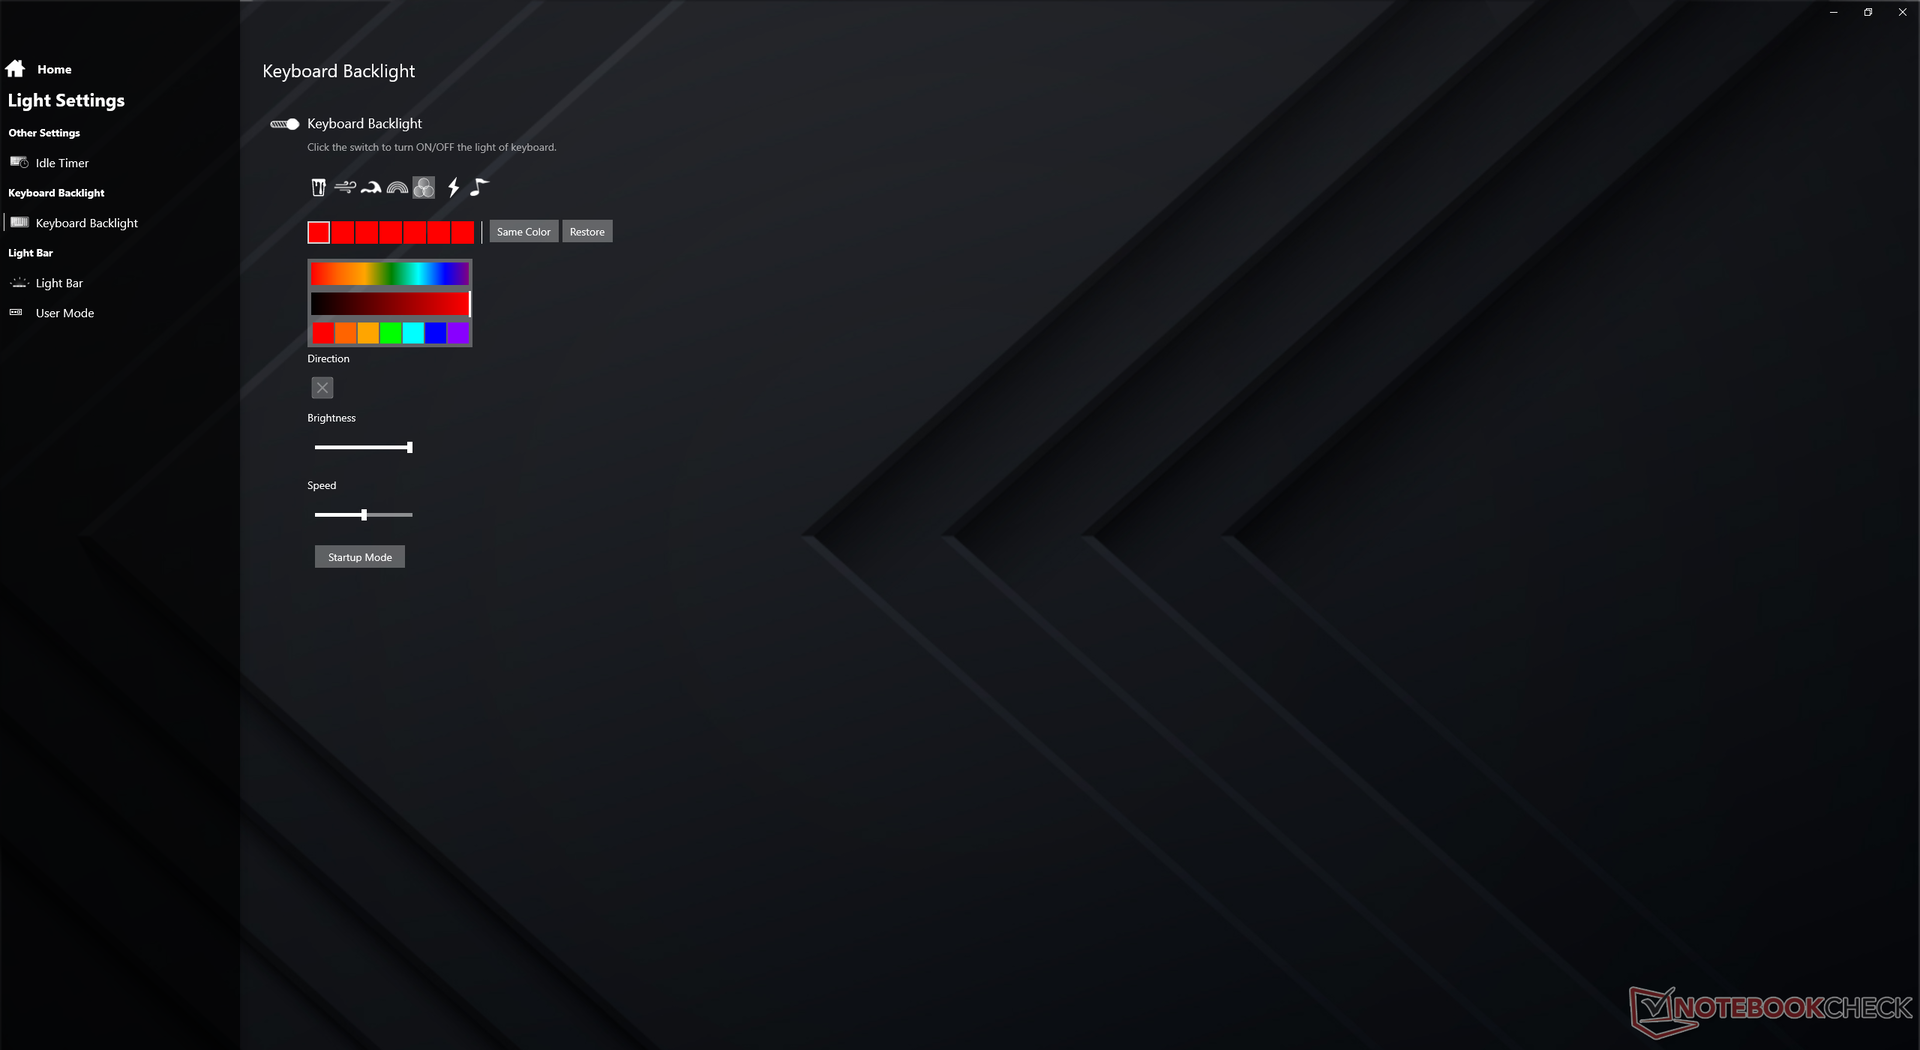
A longa vida útil da bateria e as atualizações fáceis são menções dignas de nota para um laptop de jogos ultramoderno. Para modelos futuros, adoraríamos ver iluminação RGB por tecla, USB-C PD, alto-falantes mais altos e um obturador de webcam, tudo isso está se tornando padrão em modelos mais sofisticados.
Preço e disponibilidade
Nossa configuração exata pode ser atualmente encontrado na Amazônia por $2499 USD enquanto o menor SKU RTX 3070 SKU é varejo por $2099.
Maingear Vector Pro MG-VCP17
- 09/10/2021 v7 (old)
Allen Ngo
Price comparison

