Veredicto - Rápido, mas poderia ser mais rápido
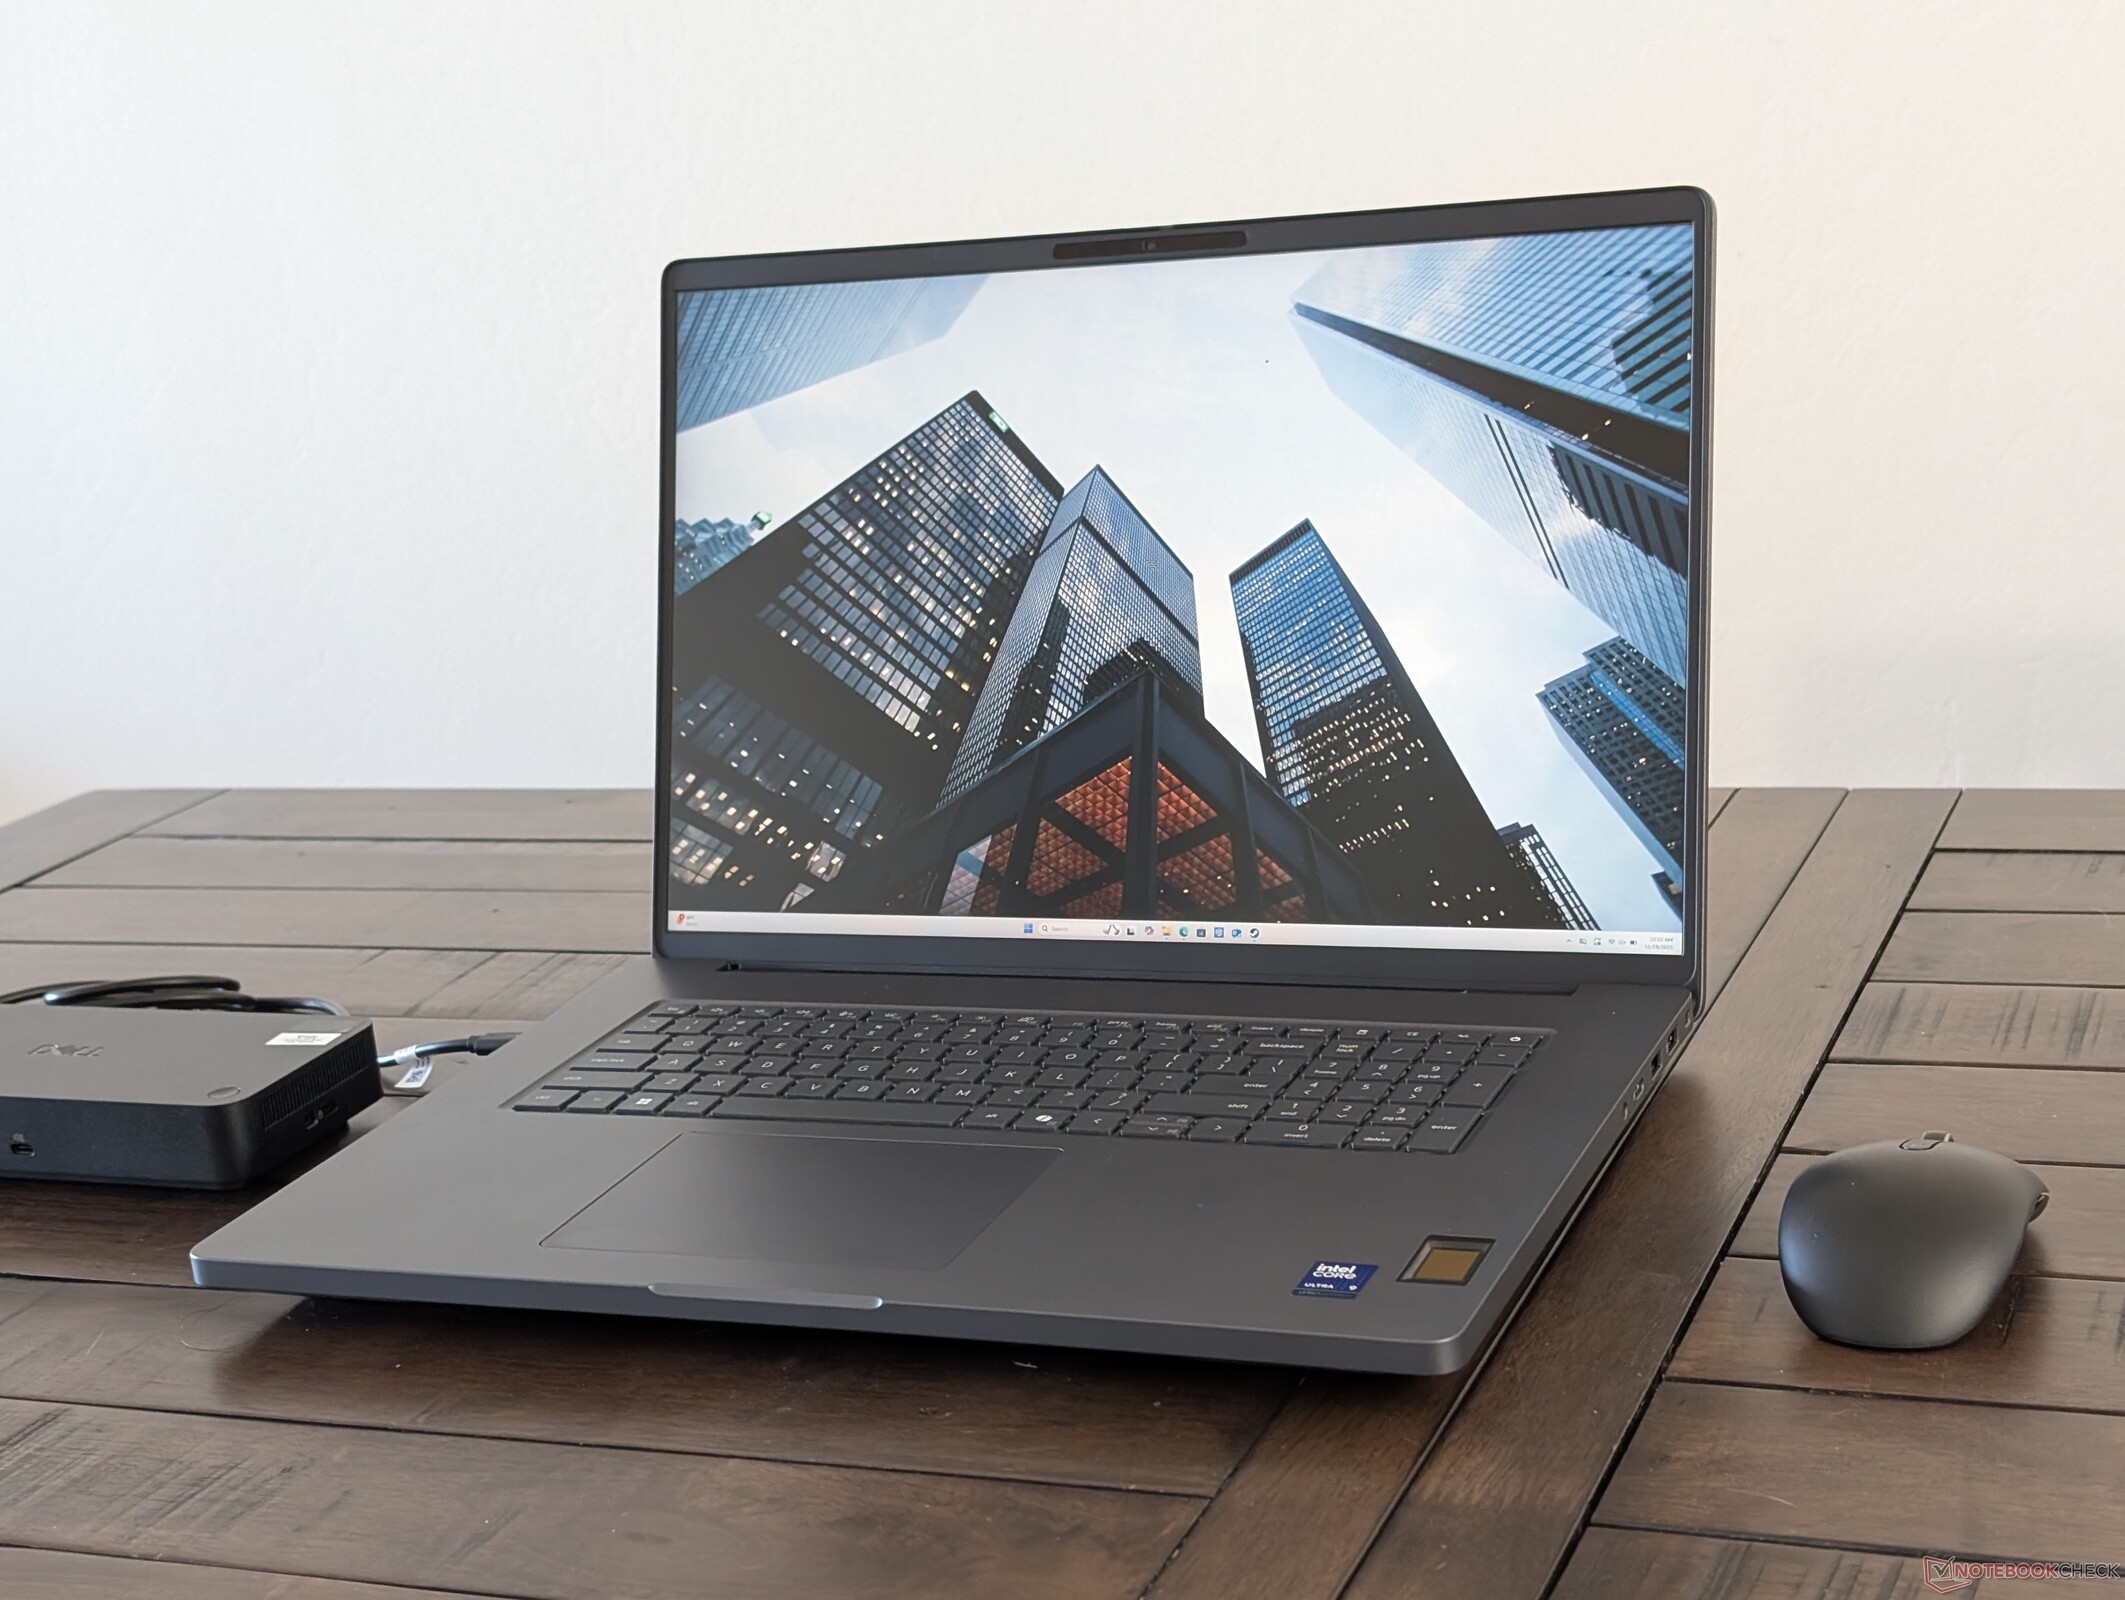
O Dell Pro Max 18 Plus é uma peça de hardware impressionante e bem construída que reflete seus preços iniciais de quatro dígitos. Seus componentes exclusivos, como CAMM2, DGFF e portas USB-C modulares para maior capacidade de reparo, ajudam a distinguir o modelo da concorrência. Este não é um laptop para jogos que virou estação de trabalho, mas um laptop otimizado desde o início especificamente para cargas de trabalho profissionais. Em termos de desempenho, a Dell é facilmente uma das estações de trabalho móveis mais rápidas com sua CPU Arrow Lake-HX, GPU Nvidia Pro RTX 5000 Blackwell de 175 W e espaçosos 128 a 256 GB de RAM que os aplicativos de IA podem utilizar. Todo o sistema é alimentado por um adaptador CA universal 280 USB-C, que é outro recurso digno de nota que ainda não vimos nos principais concorrentes.
Por mais incríveis que sejam a qualidade de construção e o hardware, o desempenho ainda poderia ser um pouco melhor. A CPU fica muito quente, em torno de 100 °C, quando está sob tensão, o que afeta o desempenho do Turbo Boost. Recursos como a solução de resfriamento, o teclado e as opções de portas permanecem essencialmente os mesmos do menor Dell Pro Max 16 Plus apesar de suas diferenças de tamanho. A falta de opções de tela, em particular, pode decepcionar os usuários, especialmente porque o modelo de 16 polegadas vem com pelo menos três painéis para escolher, incluindo 4K OLED.
Outras desvantagens incluem a falta de iluminação RGB por tecla ou botões dedicados do mouse, ambos disponíveis na HP ZBook Fury G1i 18, mas esses são pontos relativamente pequenos em uma estação de trabalho DTR sólida.
Pro
Contra
Preço e disponibilidade
O Dell Pro Max 18 Plus está sendo enviado diretamente pelo fabricante a partir de US$ 3790 para a configuração básica até mais de US$ 6000.
- $1,799.95Dell Pro 16 Plus PB16250 (Replaces Latitude 5550) AI Business Notebook 16" FHD+ Intel Ultra 7-265U, 32GB DDR5 RAM, 512GB SSD PCIe, Wi-Fi 6E, BT, Backlit Keyboard, HD Webcam, RJ-45, Win 11 Pro - Silver
- $1,599.95Dell Pro 16 Plus PB16250 Business Laptop 16" FHD+ Intel Ultra 7-265U, Oemgenuine Customized Laptop, 16GB / 32GB / 64GB RAM, 512GB / 1TB / 2TB SSD, Wi-Fi 6E, Backlit Keyboard, Webcam, RJ-45, Win 11 Pro
- $54.99165W USB-C Gan Laptop Charger Compatible with Dell Pro Max 16 18 Plus MB16250 MB18250, Pro Max 16 Premium MA16250, Precision 5680 5690 Laptop Type C AC Adapter Power Cord
O Dell Pro Max 18 Plus sucede a geração mais antiga da série Precision de estações de trabalho móveis. Embora seja um dos modelos mais rápidos e maiores da linha da Dell, ele foi desenvolvido na mesma plataforma que o modelo menor de 16 polegadas Dell Pro Max 16 Plus de 16 polegadas e, portanto, os dois modelos compartilham muitos recursos físicos. A maioria dos nossos comentários sobre o Dell Pro Max 16 Plus se aplica posteriormente ao modelo de 18 polegadas.
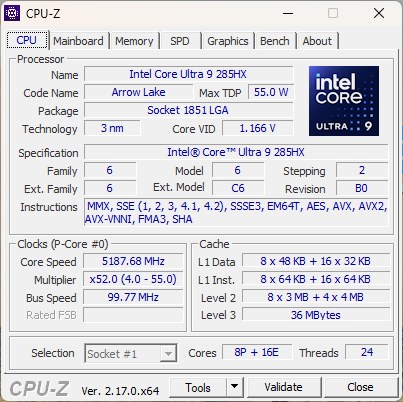
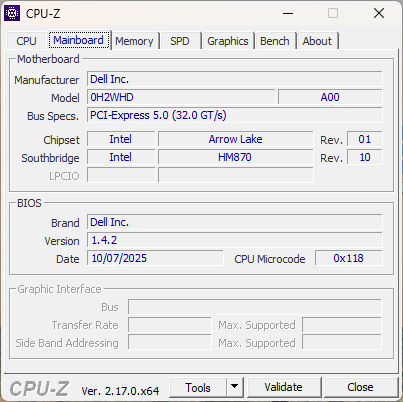
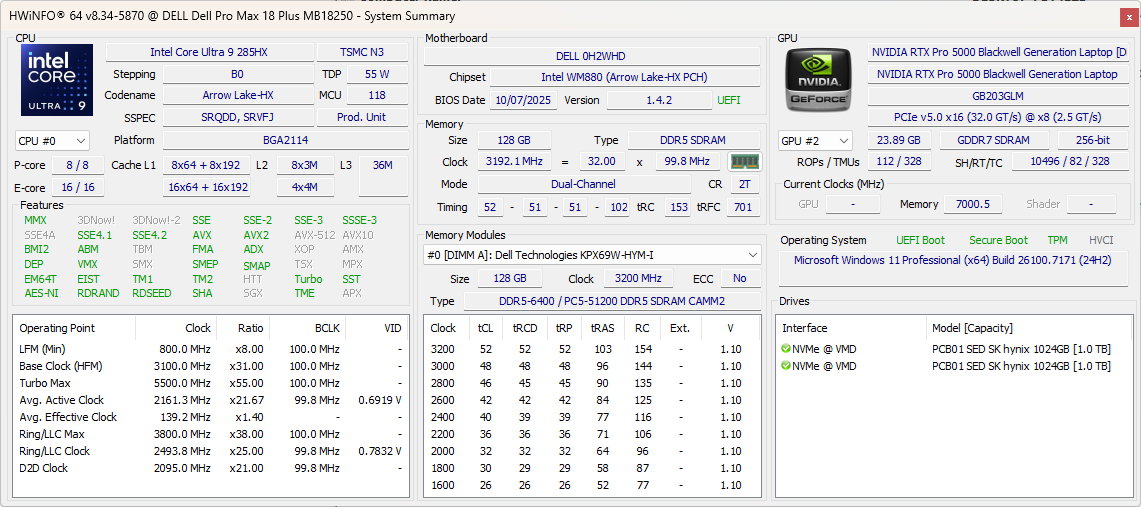
Nossa unidade de teste é uma configuração de ponta com a CPU Arrow Lake-HX Core Ultra 9 285HX vPro, GPU Nvidia RTX Pro 5000 Blackwell de 175 W e dois SSDs PCIe5 em RAID 0 por bem mais de US$ 6.000. Todas as opções são fornecidas com a mesma tela QHD+ 1600p sem toque.
As alternativas são raras, pois as estações de trabalho DTR de 18 polegadas são incomuns. A HP ZBook Fury G1i 18 é uma das principais concorrentes.
Mais análises da Dell:
Especificações
Estojo - Aprovado pela MIL-STD
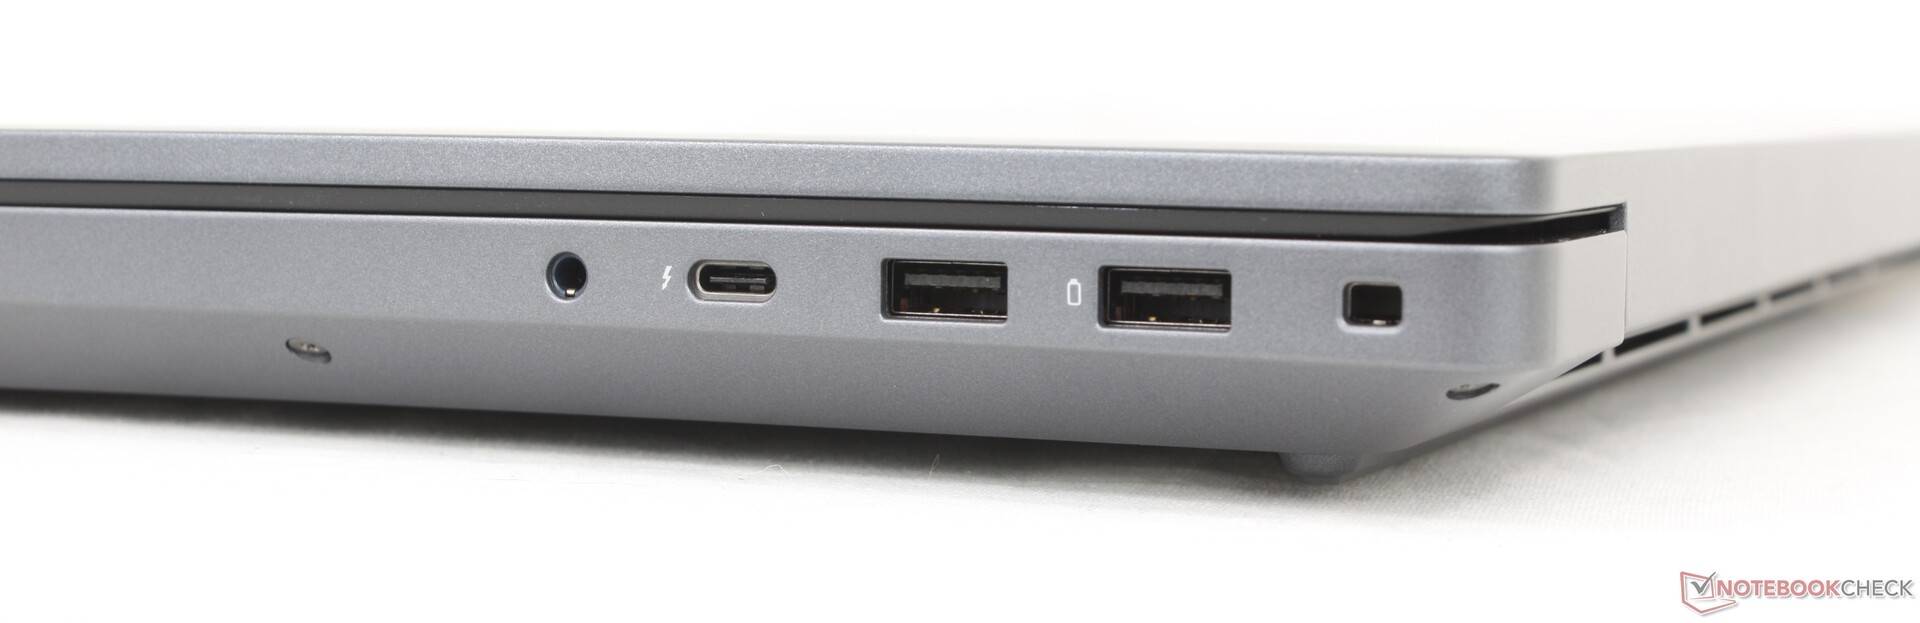
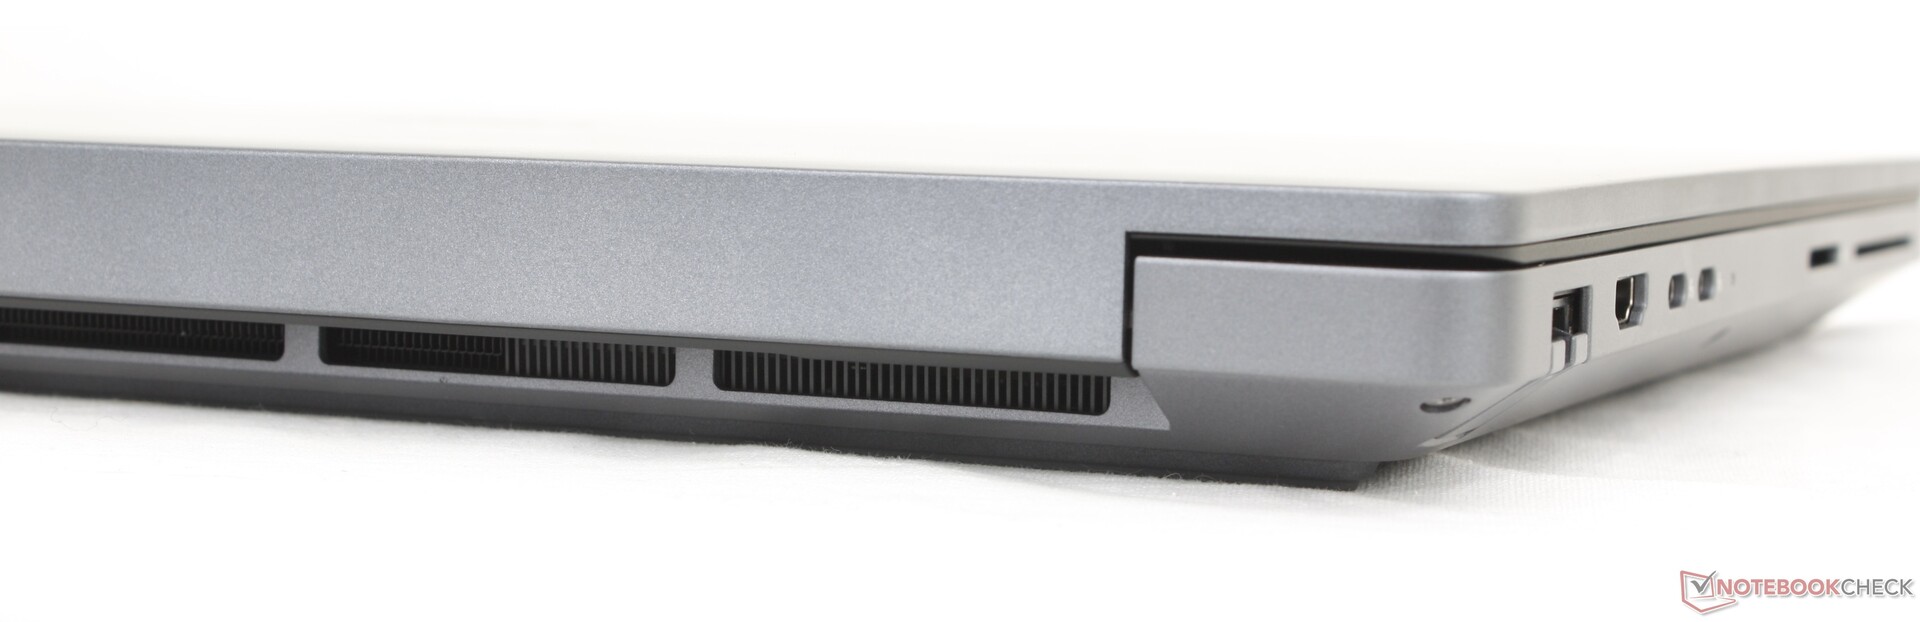
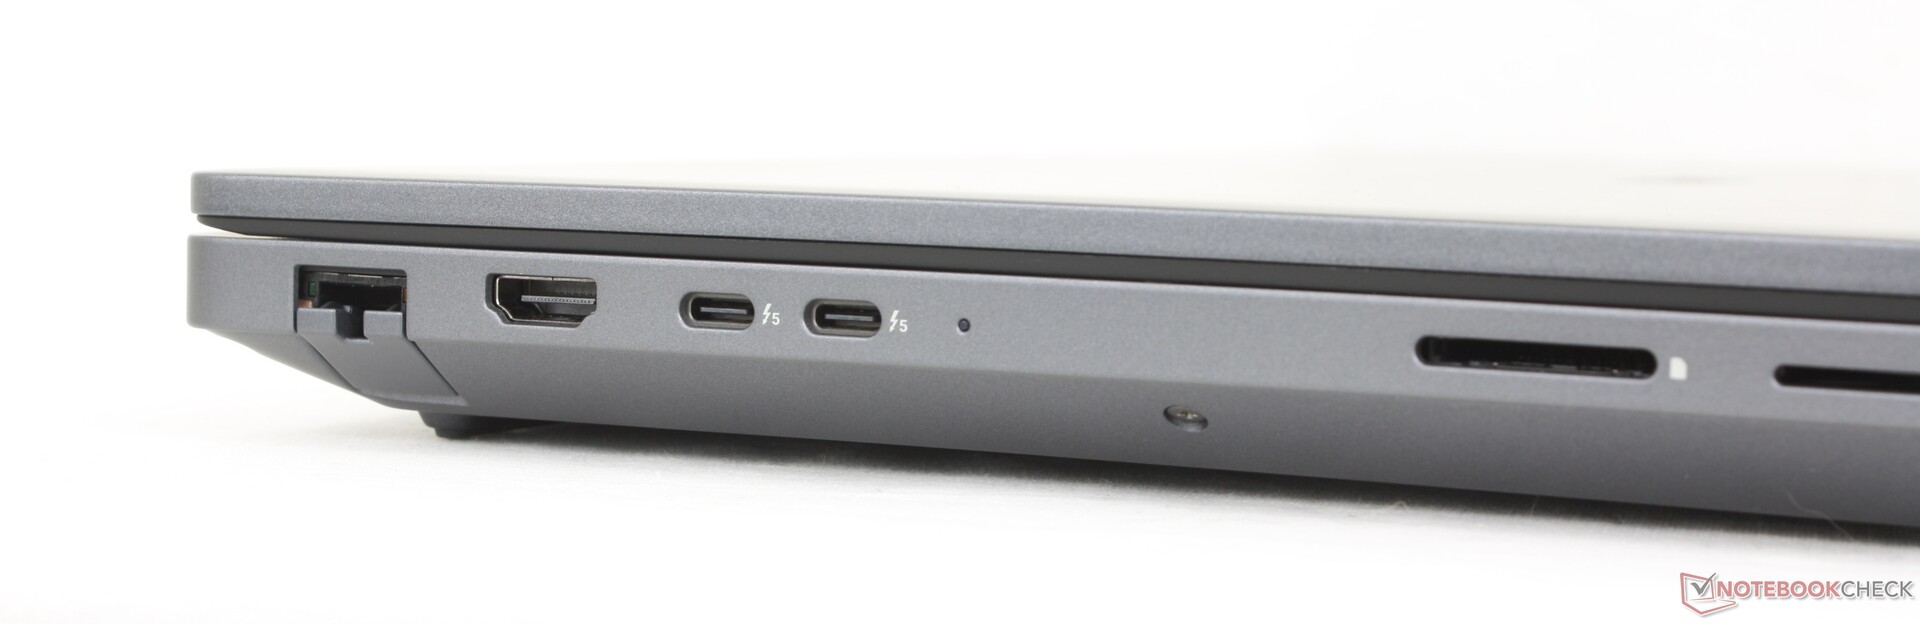
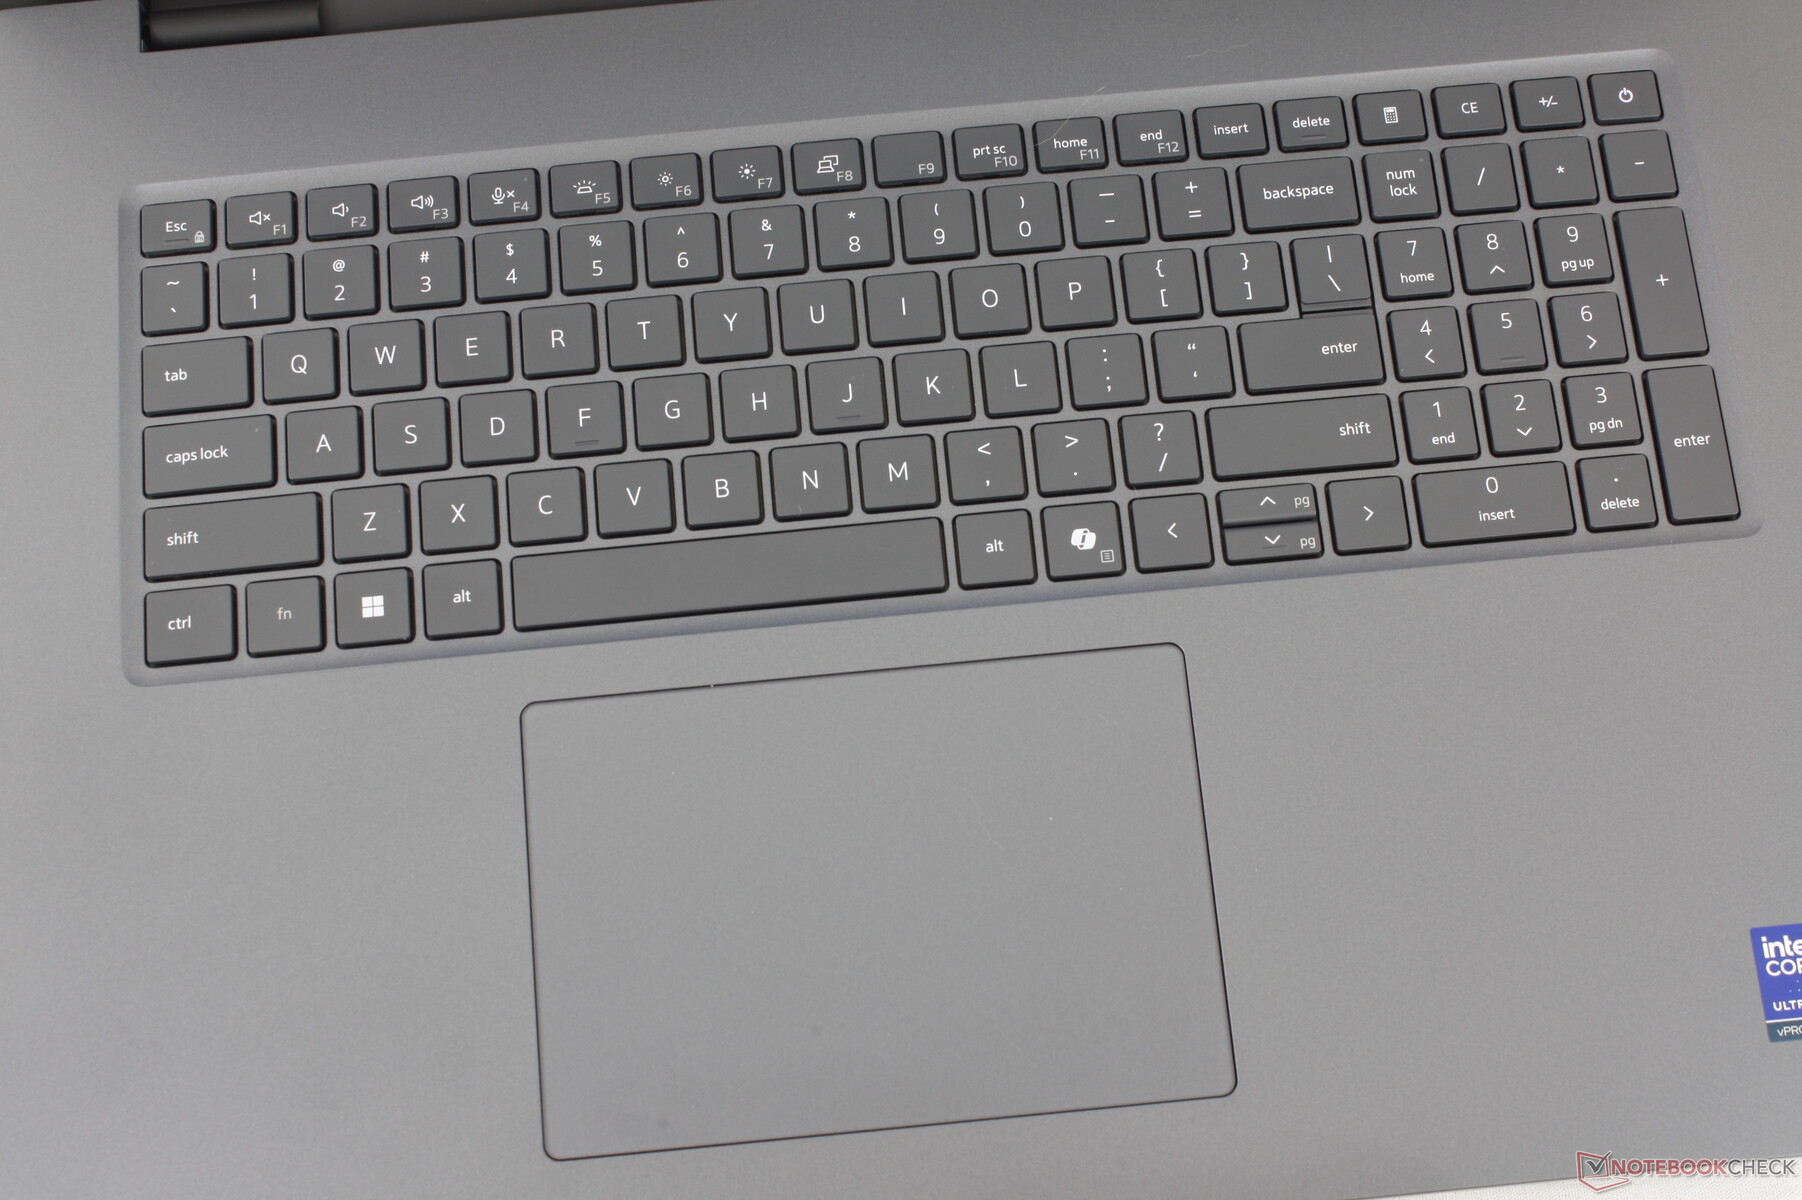
O chassi é essencialmente uma versão ampliada do Dell Pro Max 16 Plus de 16 polegadas, com um aumento de quase 30% no peso. A maioria dos recursos físicos, como o teclado, o clickpad e até mesmo as portas, permanecem idênticos, com apenas pequenas diferenças na placa-mãe.

Conectividade
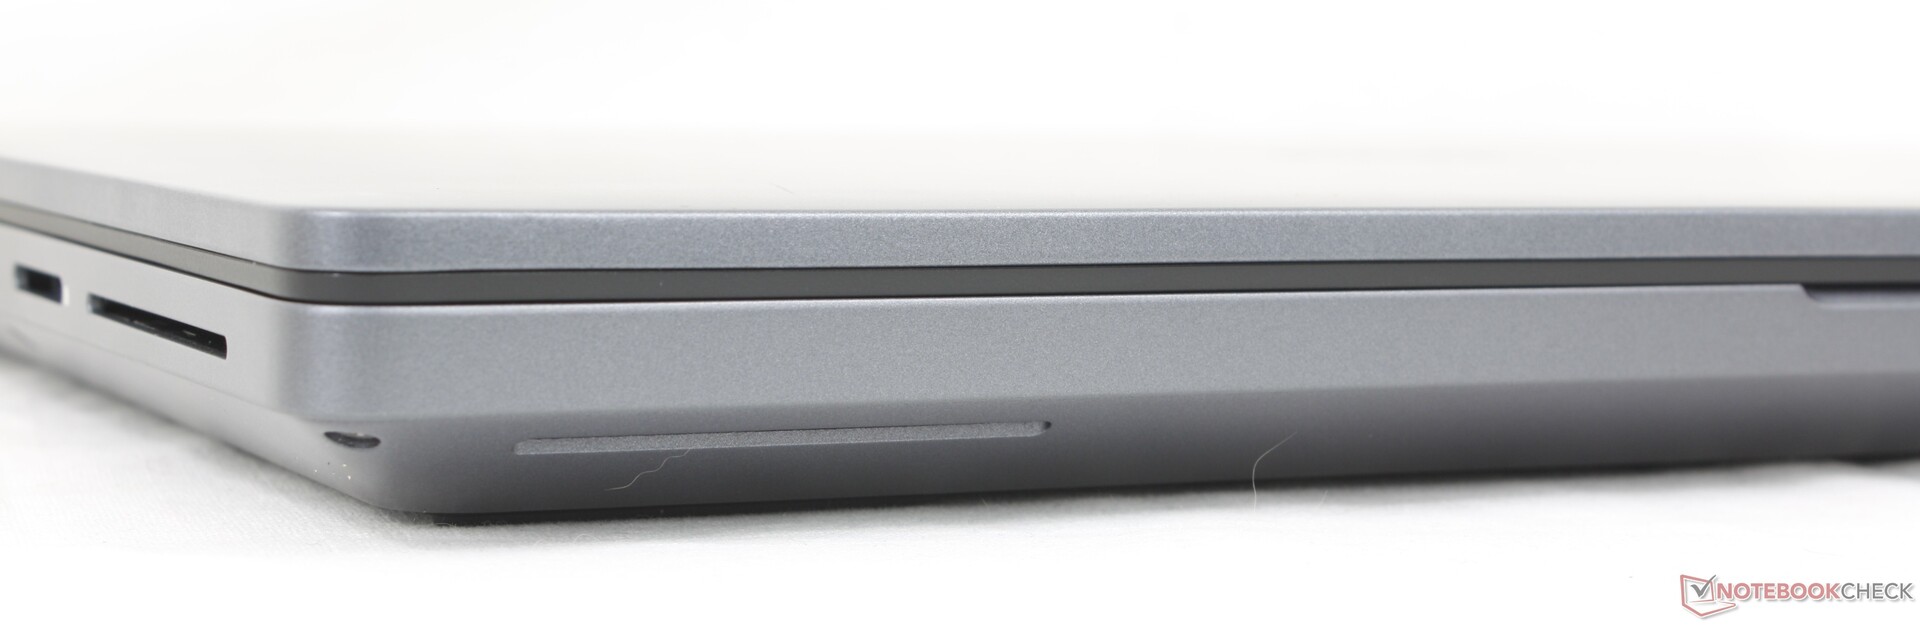
Leitor de cartão SD
| SD Card Reader | |
| average JPG Copy Test (av. of 3 runs) | |
| HP ZBook X G1i 16 (Toshiba Exceria Pro SDXC 64 GB UHS-II) | |
| Dell Pro Max 18 Plus MB18250 (Toshiba Exceria Pro SDXC 64 GB UHS-II) | |
| Schenker Key 18 Pro M25 RTX 5090 (Angelbird AV Pro V60) | |
| Dell Pro Max 16 Plus (Toshiba Exceria Pro SDXC 64 GB UHS-II) | |
| maximum AS SSD Seq Read Test (1GB) | |
| HP ZBook X G1i 16 (Toshiba Exceria Pro SDXC 64 GB UHS-II) | |
| Dell Pro Max 18 Plus MB18250 (Toshiba Exceria Pro SDXC 64 GB UHS-II) | |
| Dell Pro Max 16 Plus (Toshiba Exceria Pro SDXC 64 GB UHS-II) | |
| Schenker Key 18 Pro M25 RTX 5090 (Angelbird AV Pro V60) | |
Comunicação
Webcam
A webcam IR de 8 MP é uma atualização opcional em relação à webcam básica de 2 MP.


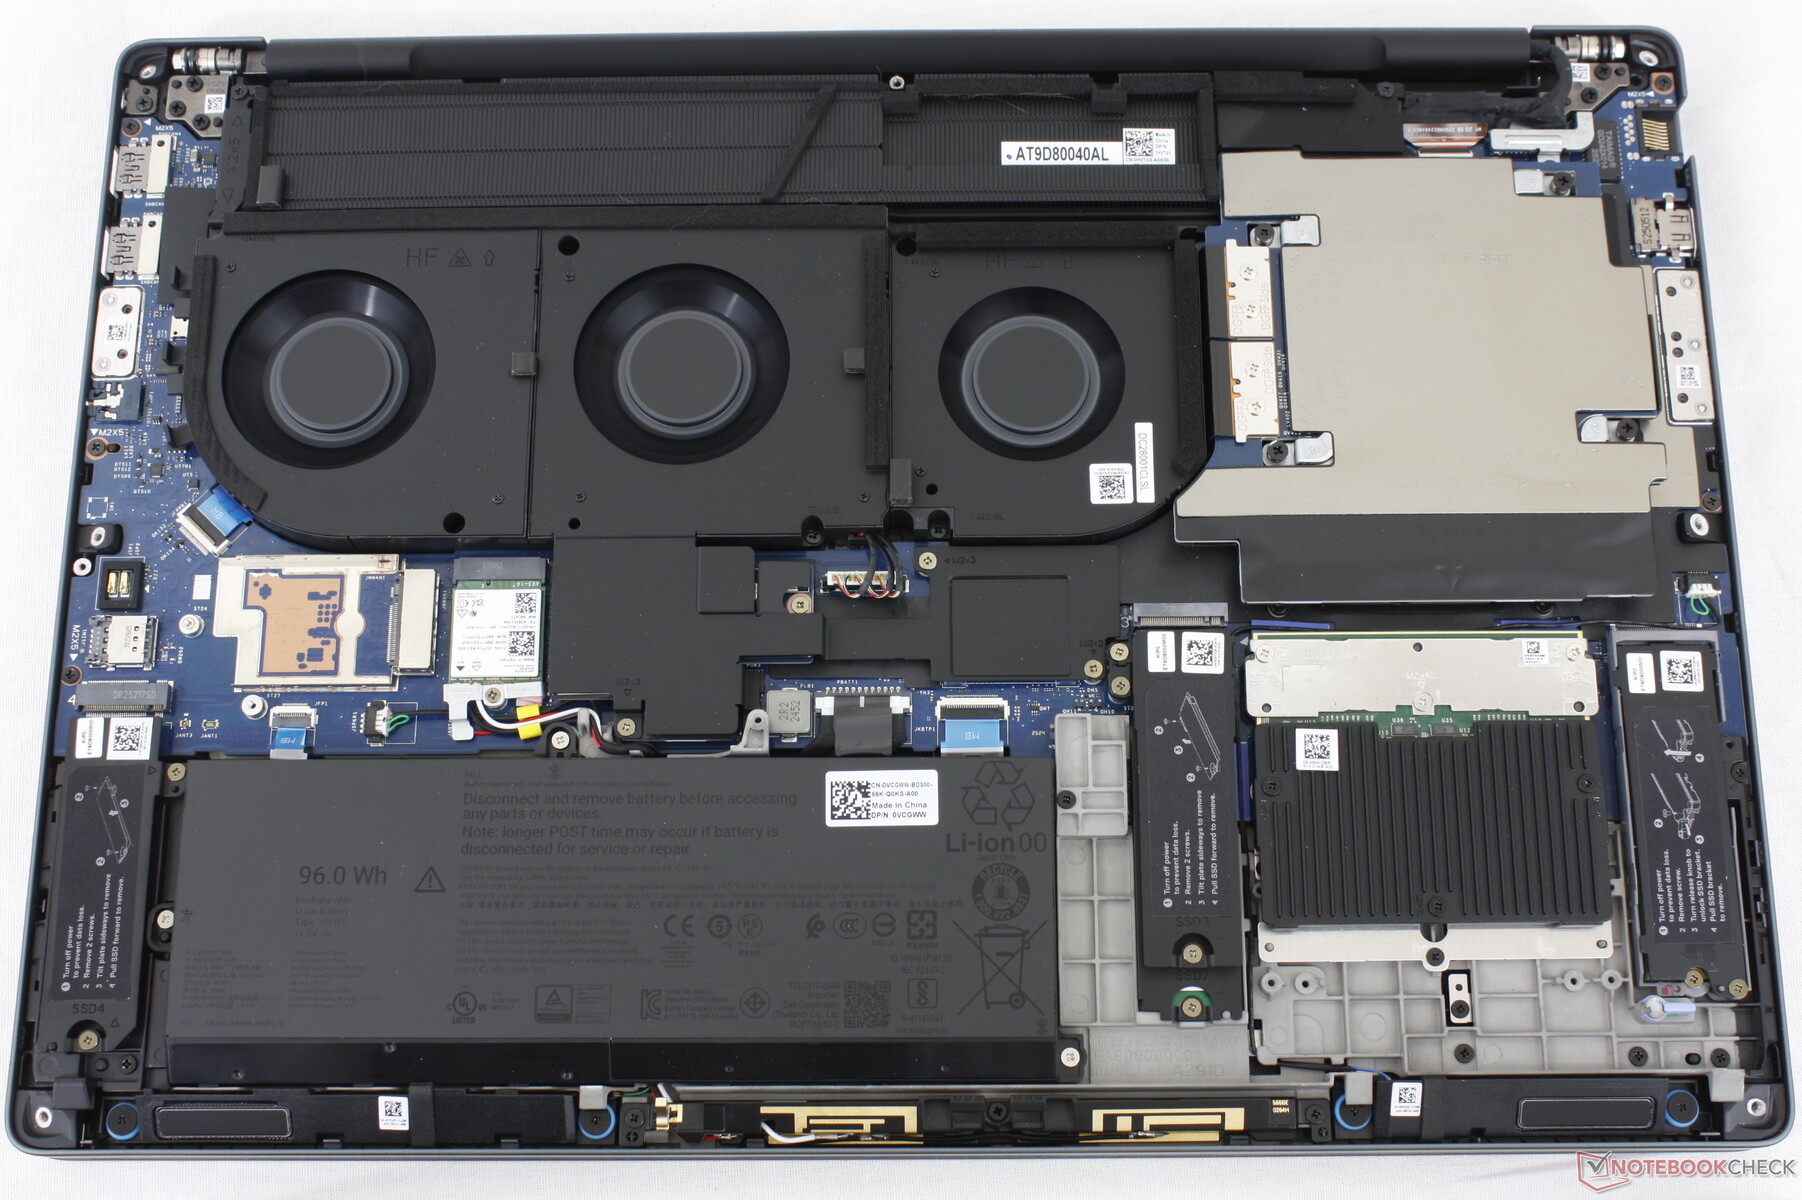
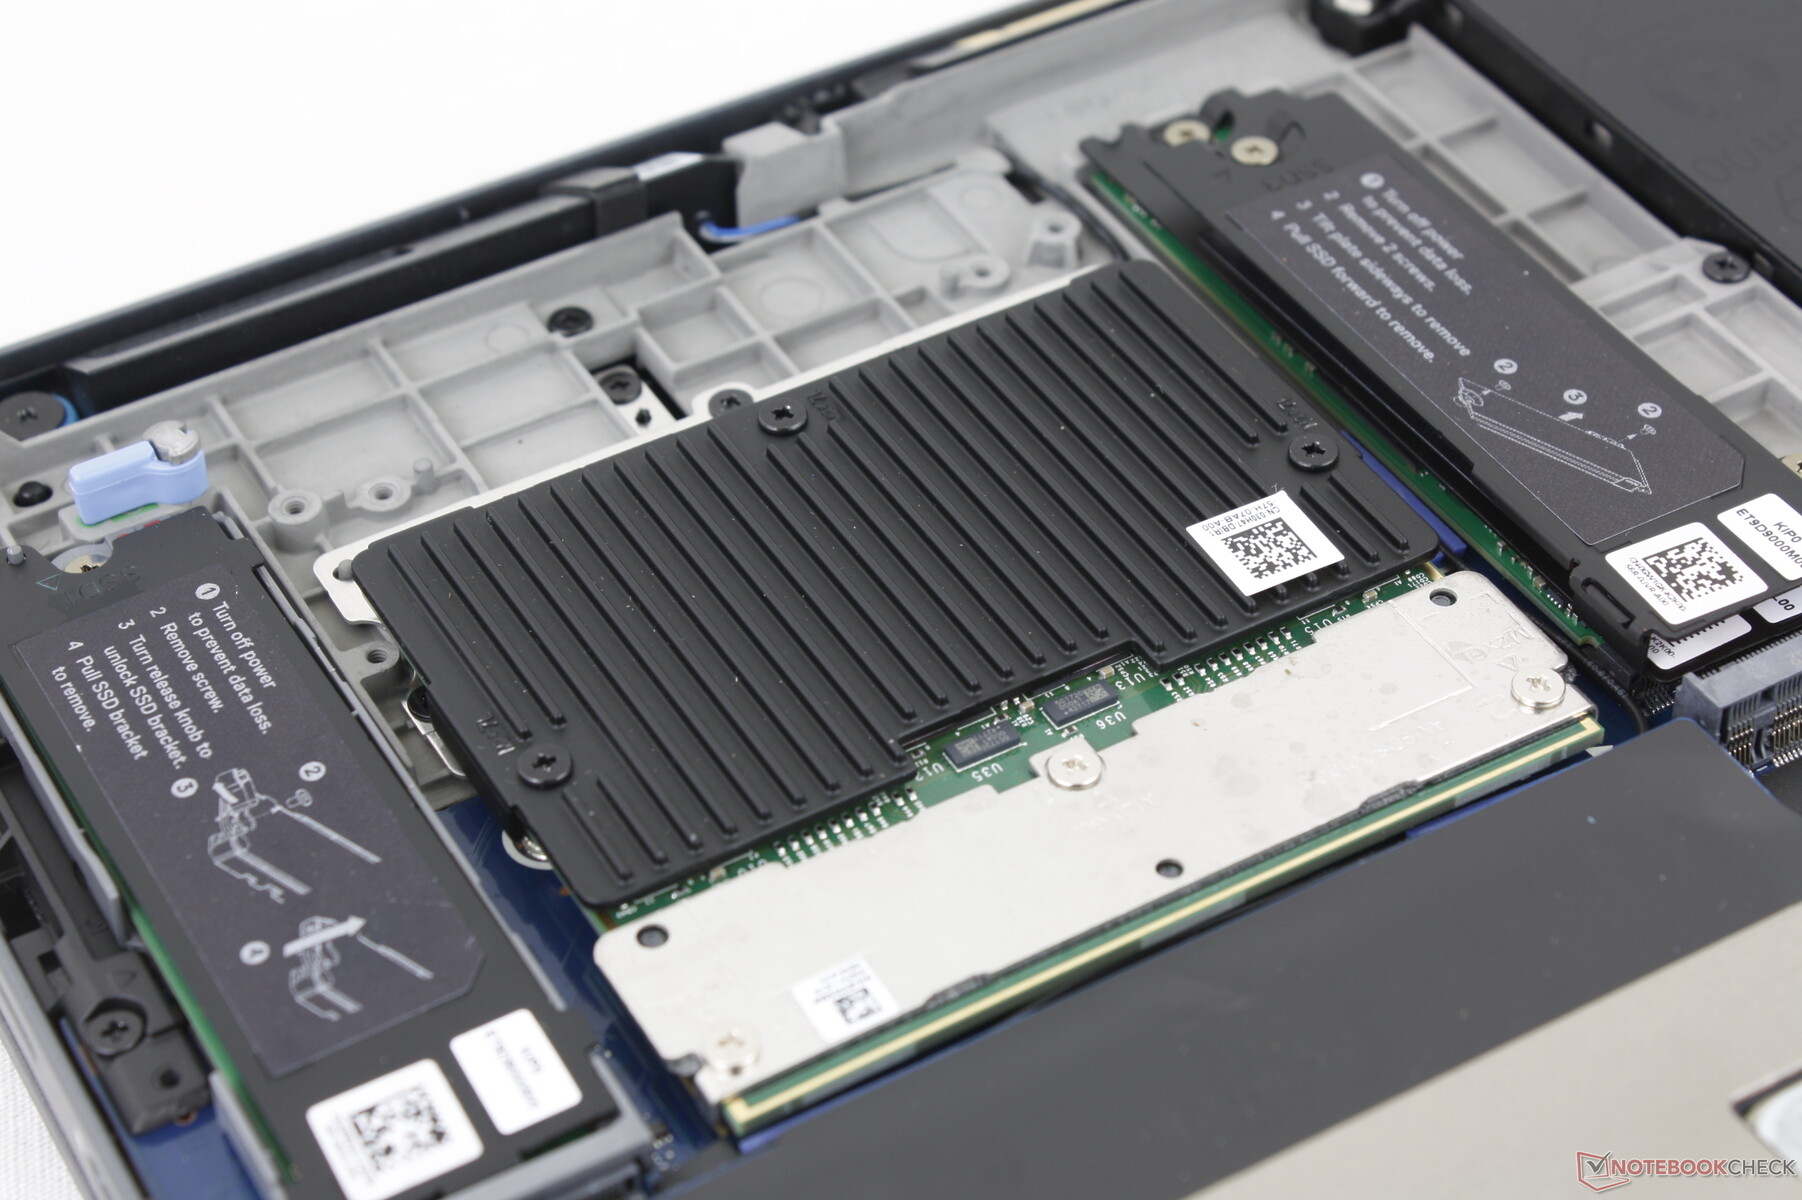
Manutenção
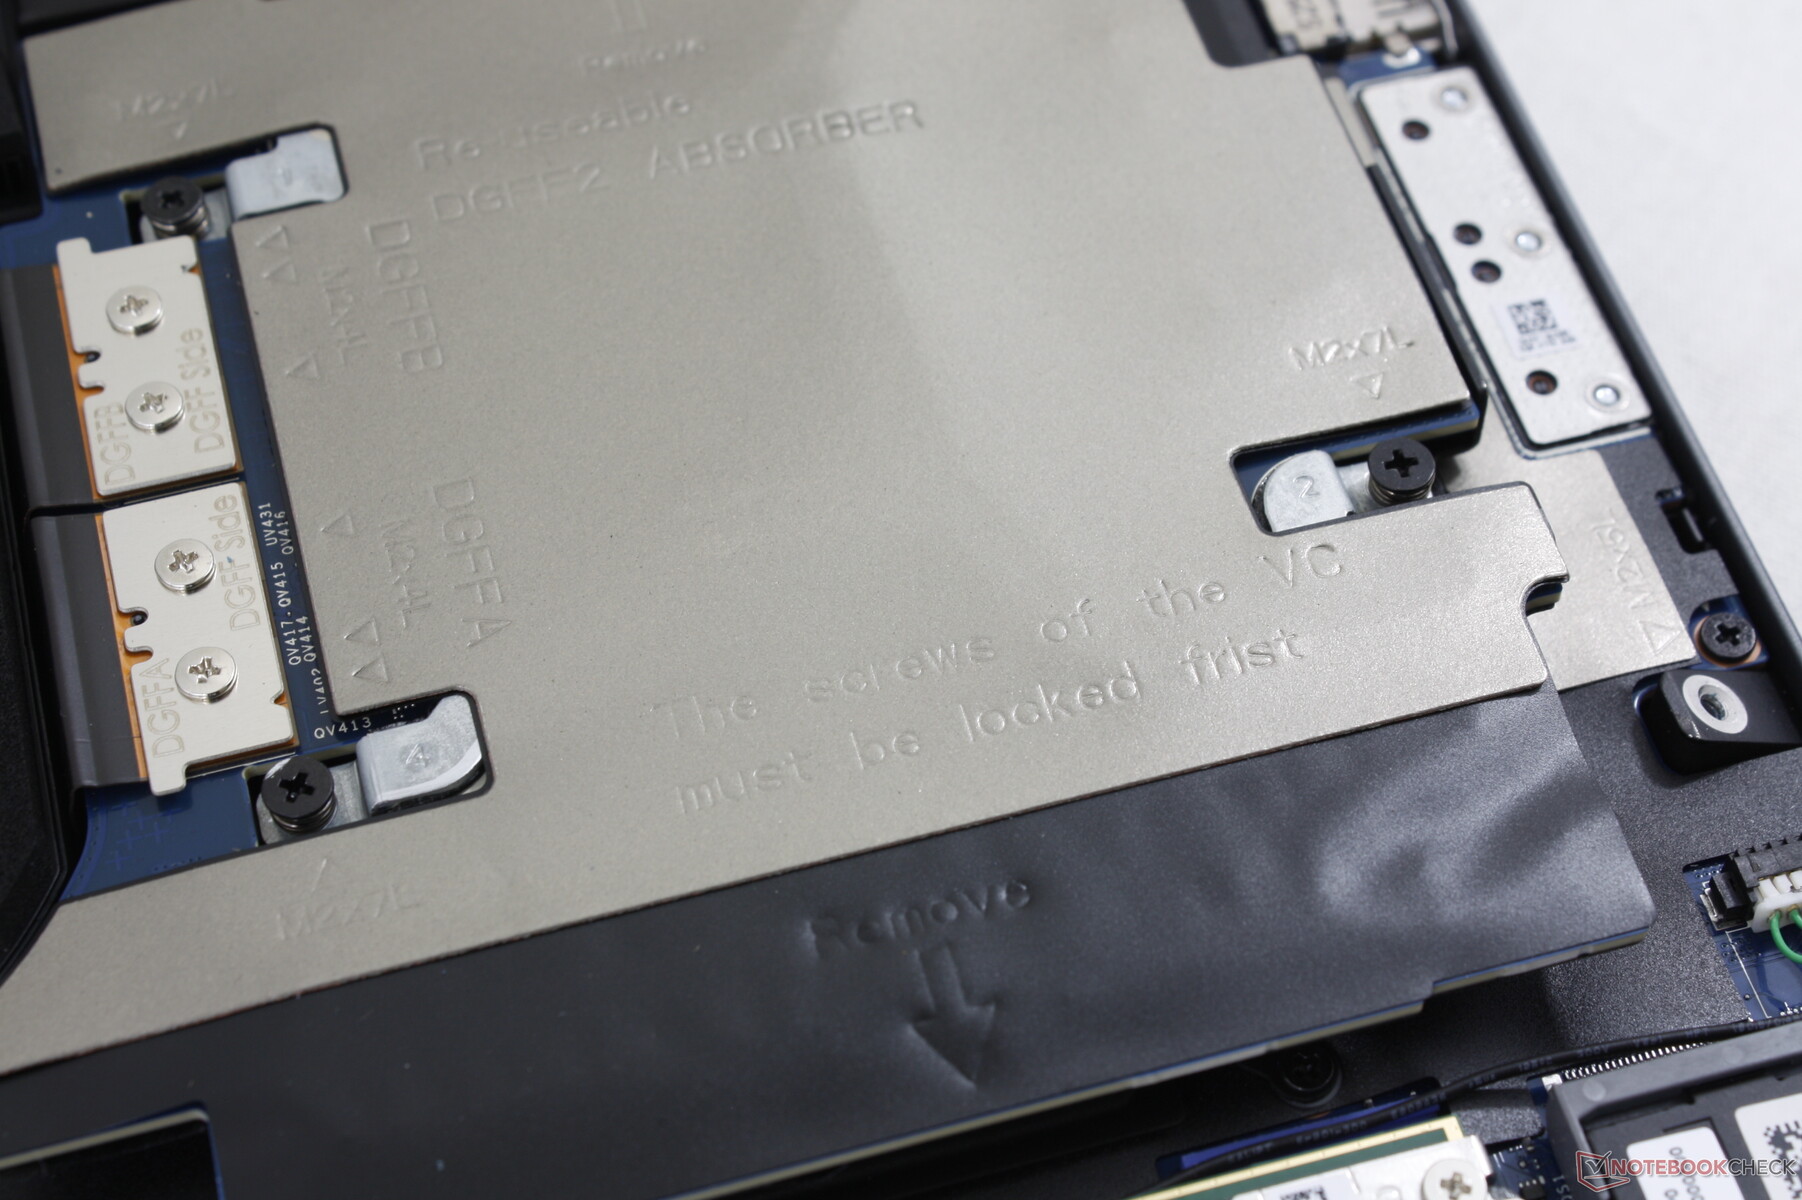
A remoção do painel inferior revela dois slots SSD M.2 2280 PCIe5 x4, o slot CAMM2 RAM, o módulo WLAN removível, a GPU DGFF e o slot WAN. Um adaptador CAMM2 para SODIMM está disponível caso os usuários prefiram o padrão mais antigo.
Sustentabilidade
Aproximadamente 90% de magnésio reciclado foi usado nas tampas superior e inferior, 30% a 50% de plástico reciclado nos apoios para as mãos e nos para-choques inferiores e 50% de cobalto reciclado na bateria. A embalagem é toda de papel e reciclável.
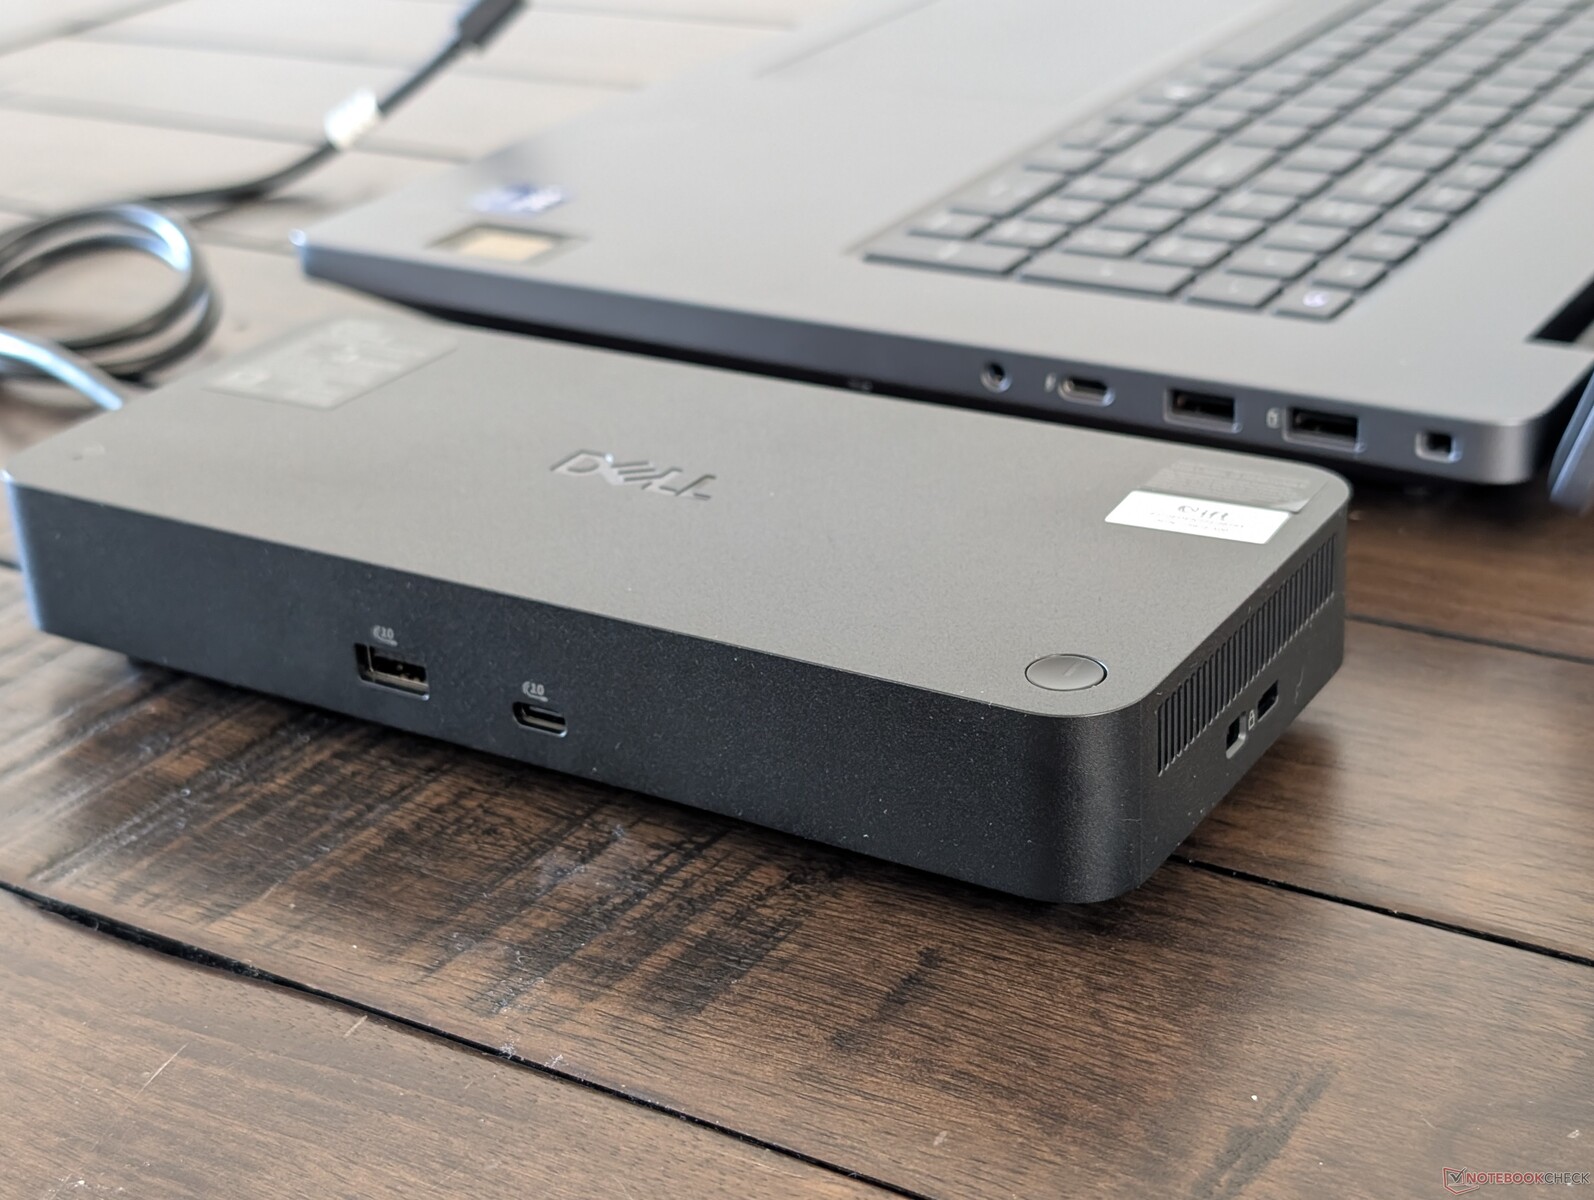
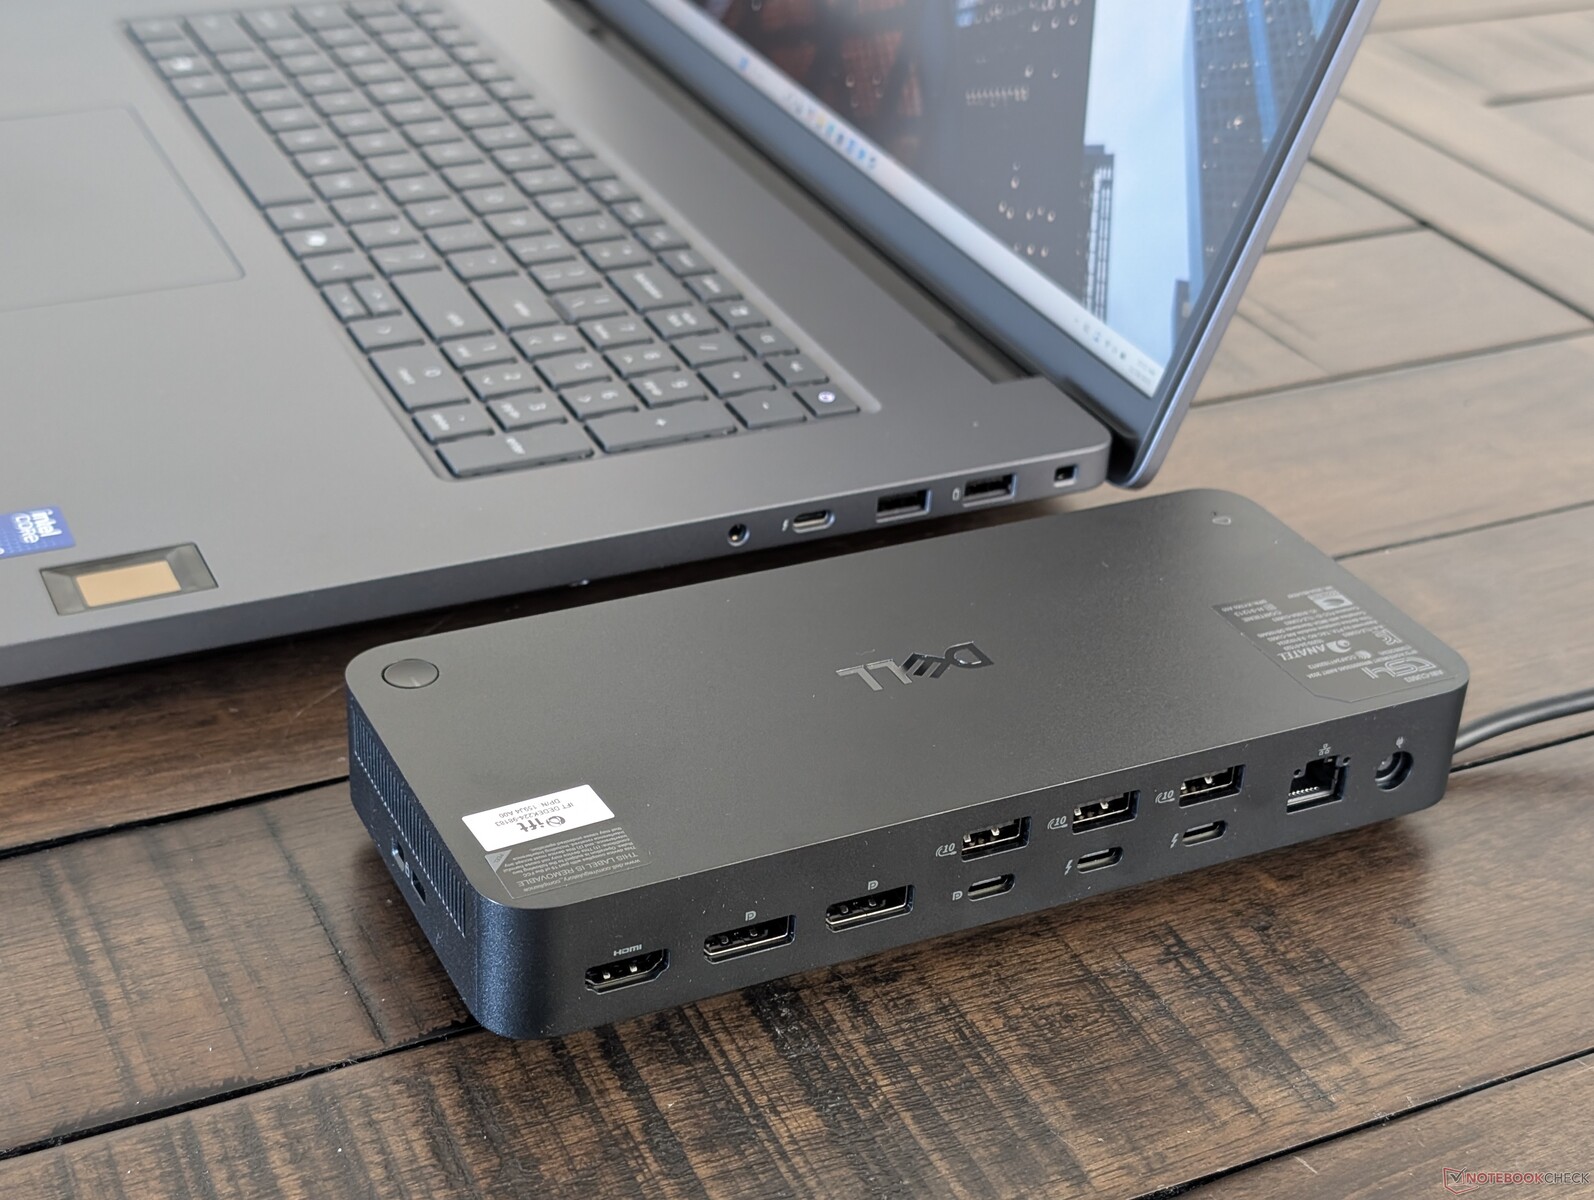
Acessórios e garantia
Os extras opcionais incluem o Dell Pro Thunderbolt 5 Smart Dock conforme mostrado abaixo. A estação de acoplamento é uma solução de um cabo que fornece passagem de energia (até 300 W) e portas adicionais para o laptop. No entanto, ela vem com seu próprio adaptador CA, que é tão grande quanto a própria estação de acoplamento.
Uma garantia limitada de três anos do fabricante é padrão para o laptop e a estação de acoplamento opcional.
Dispositivos de entrada
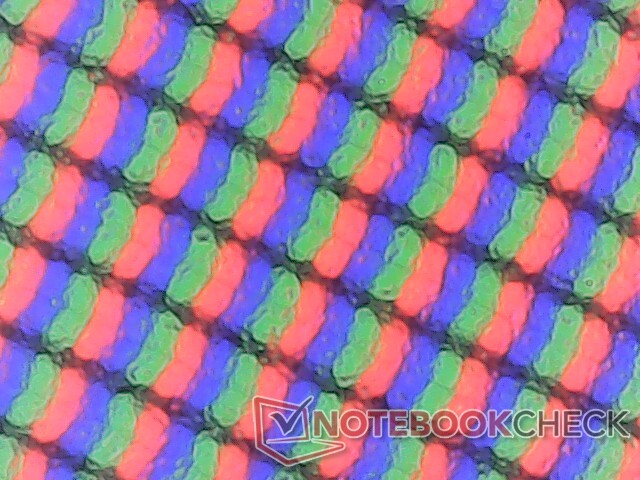
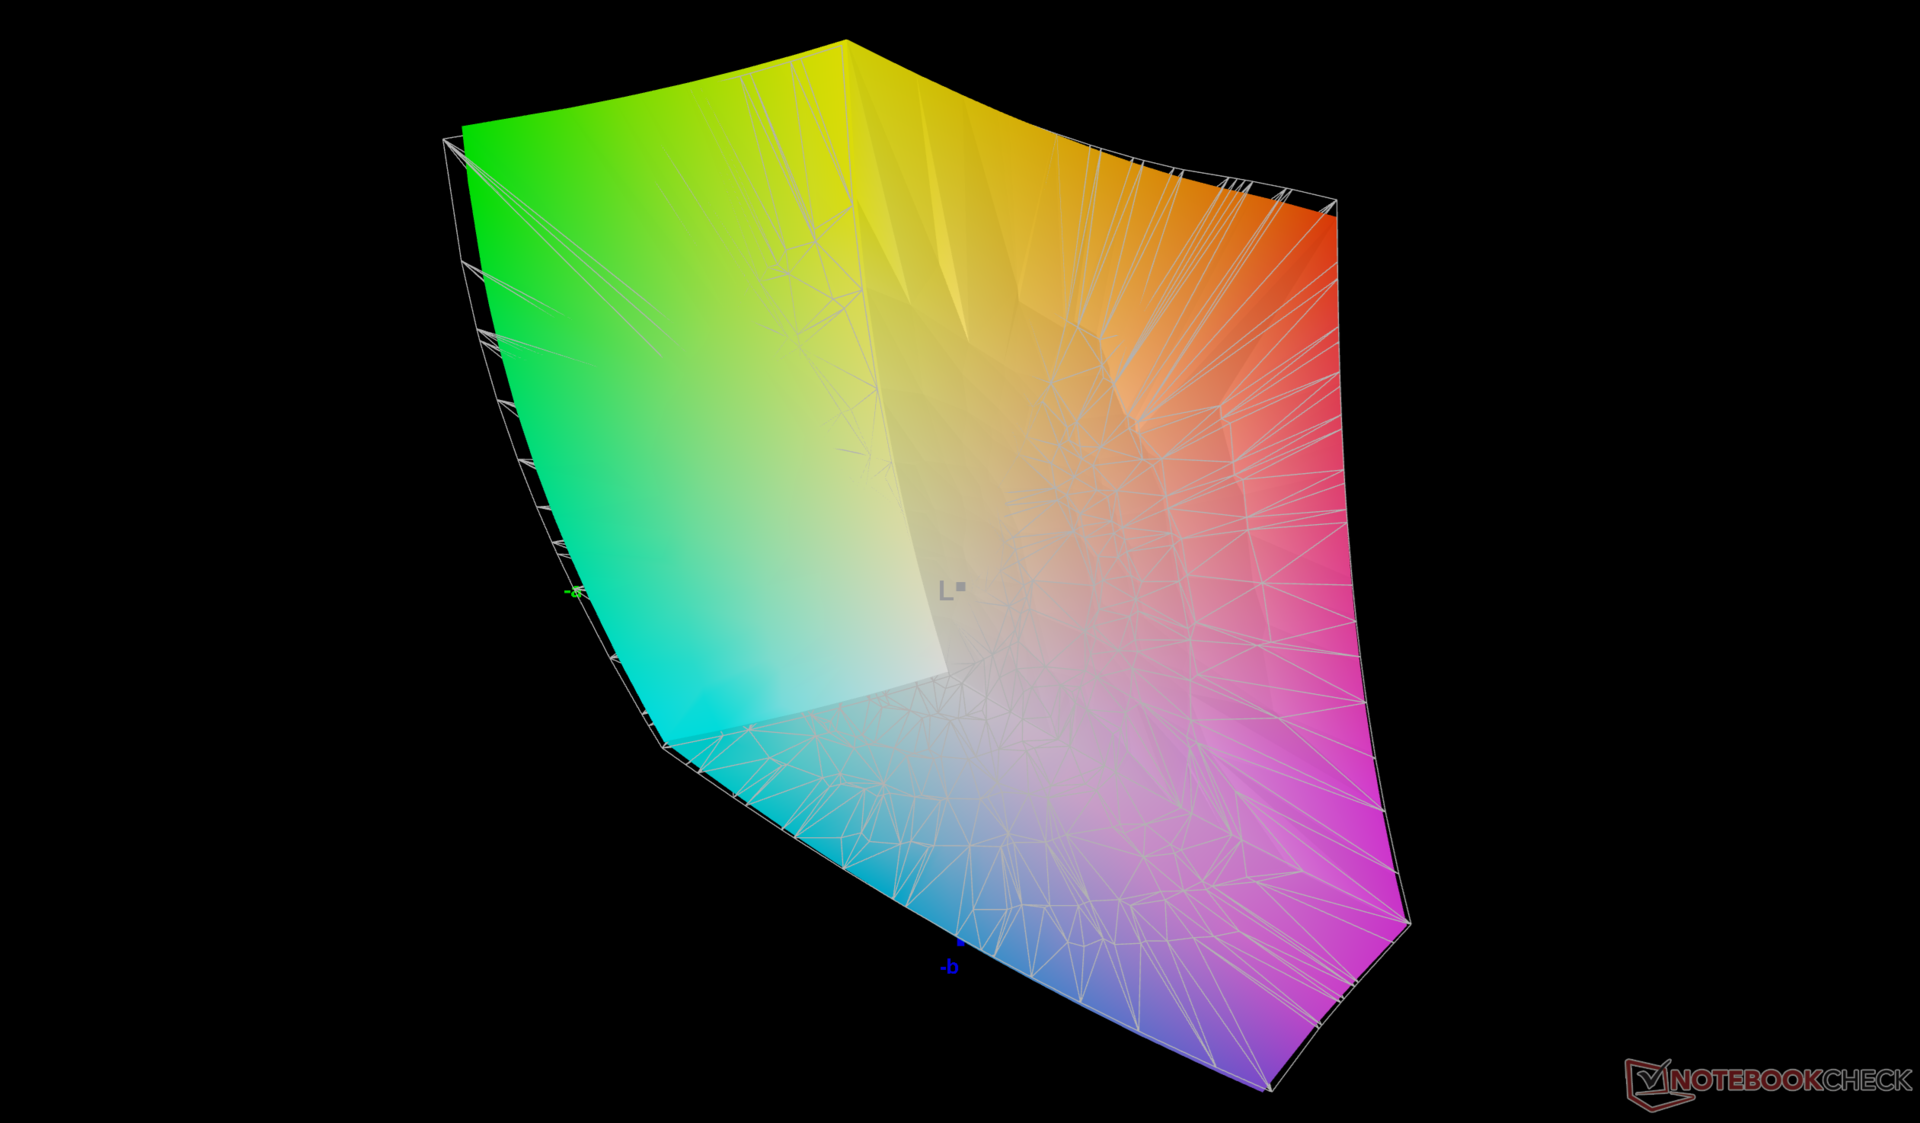
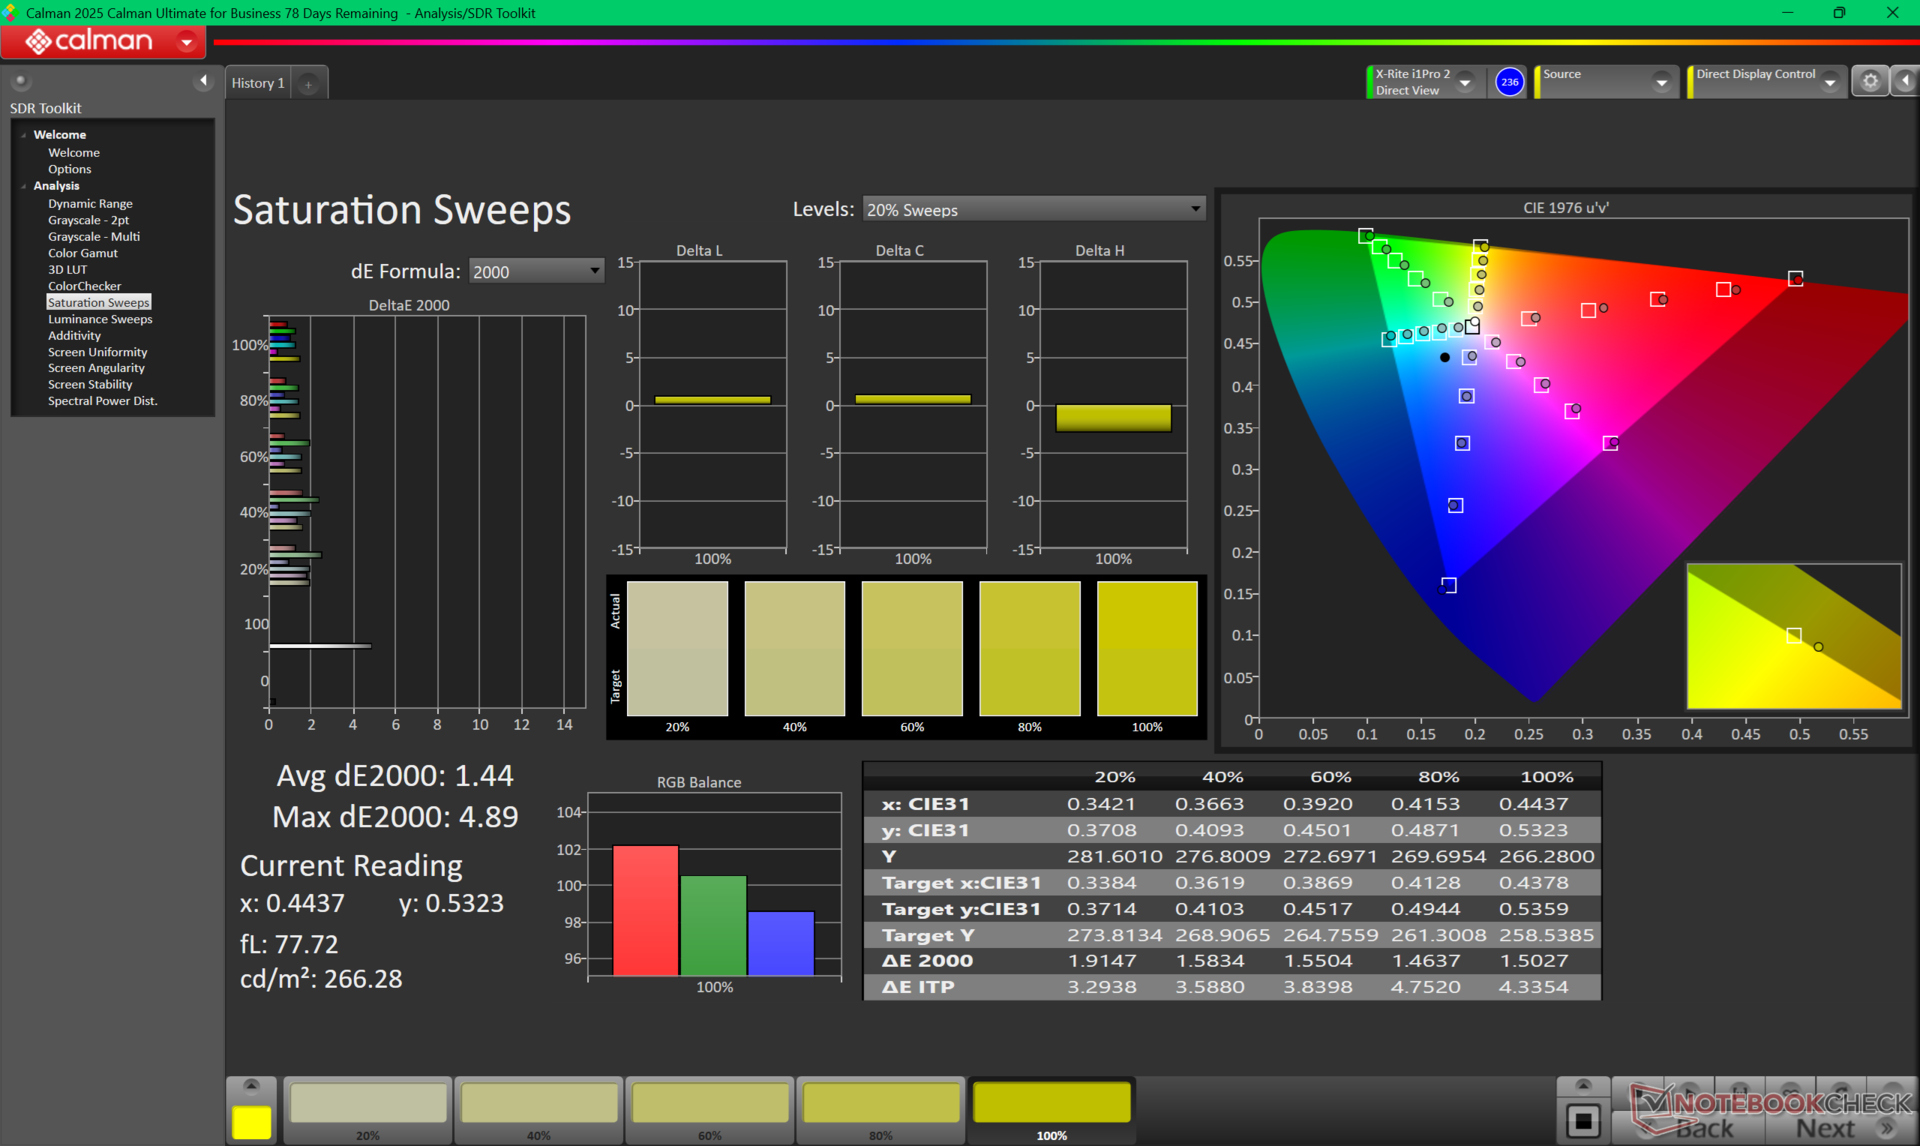
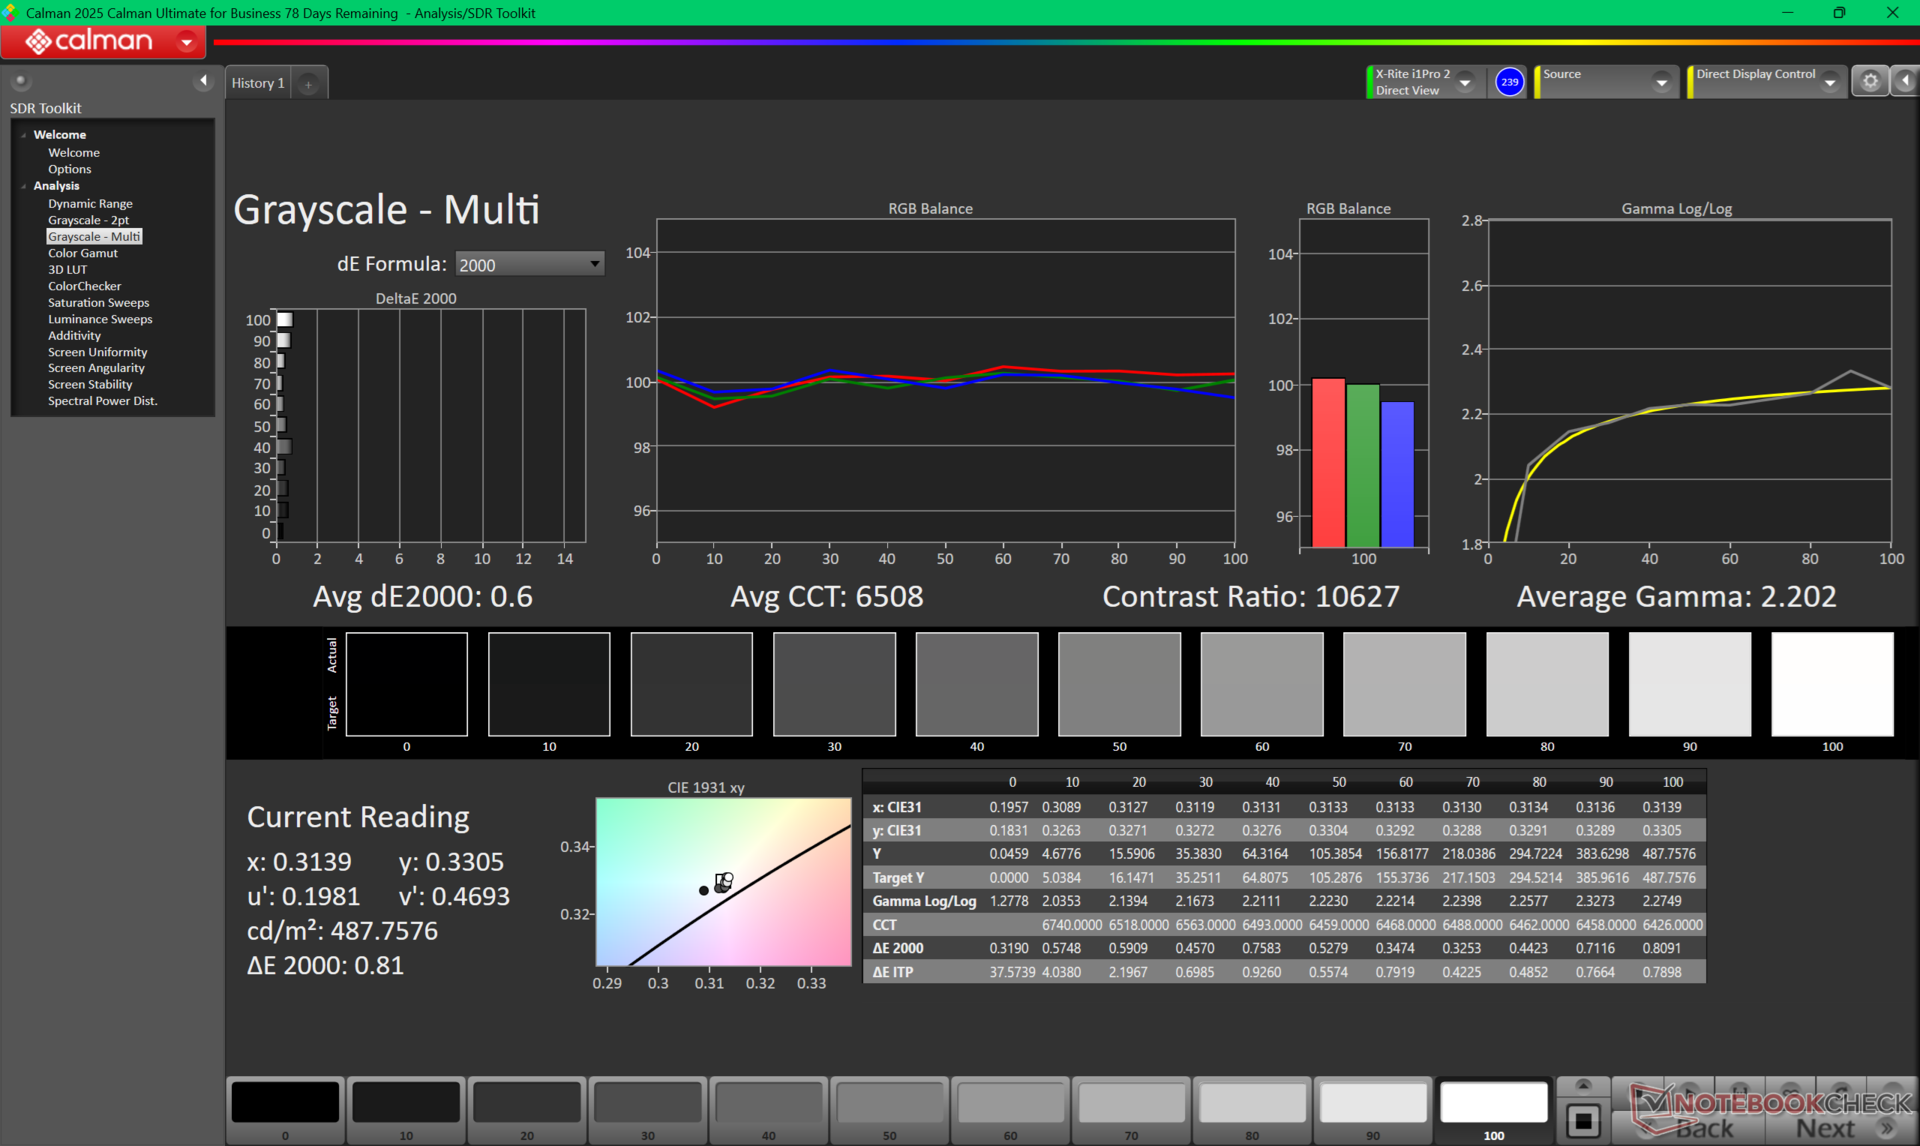
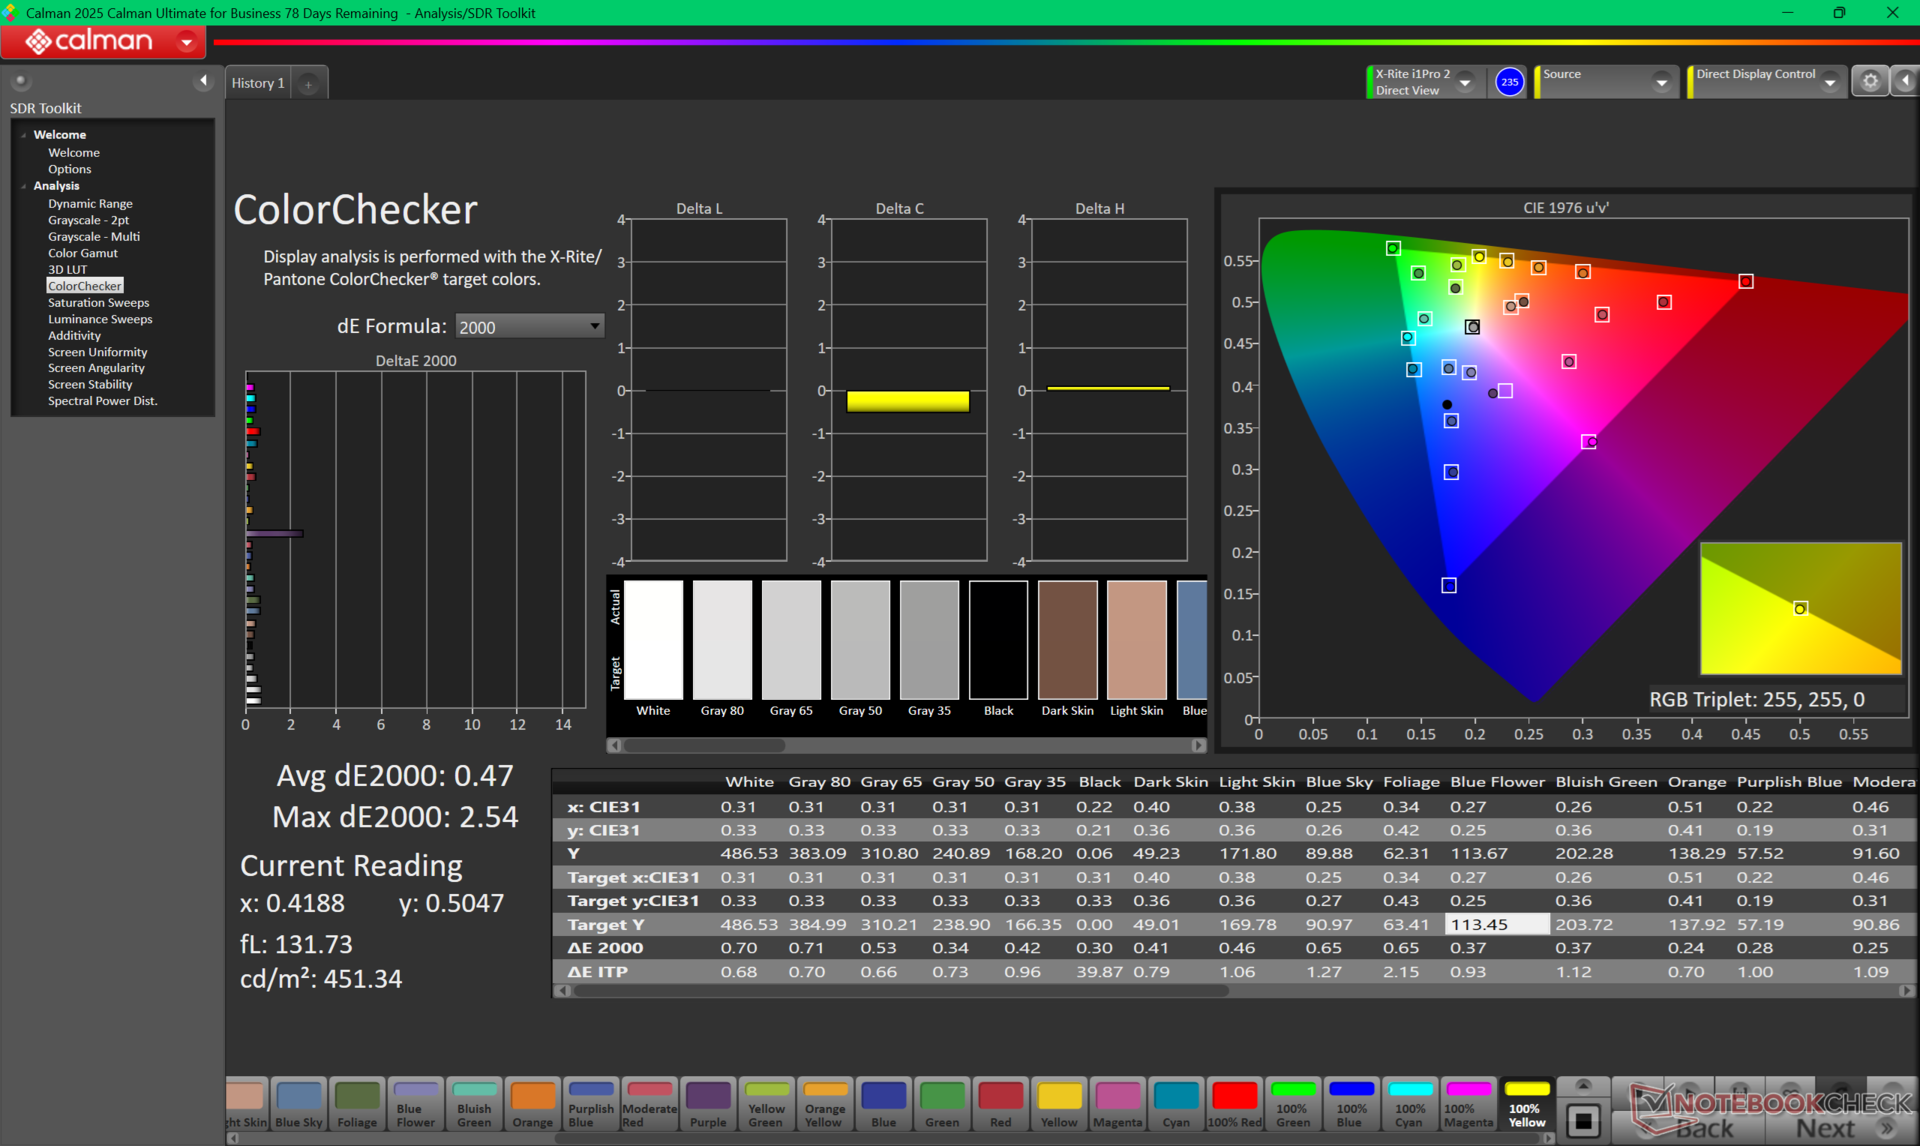
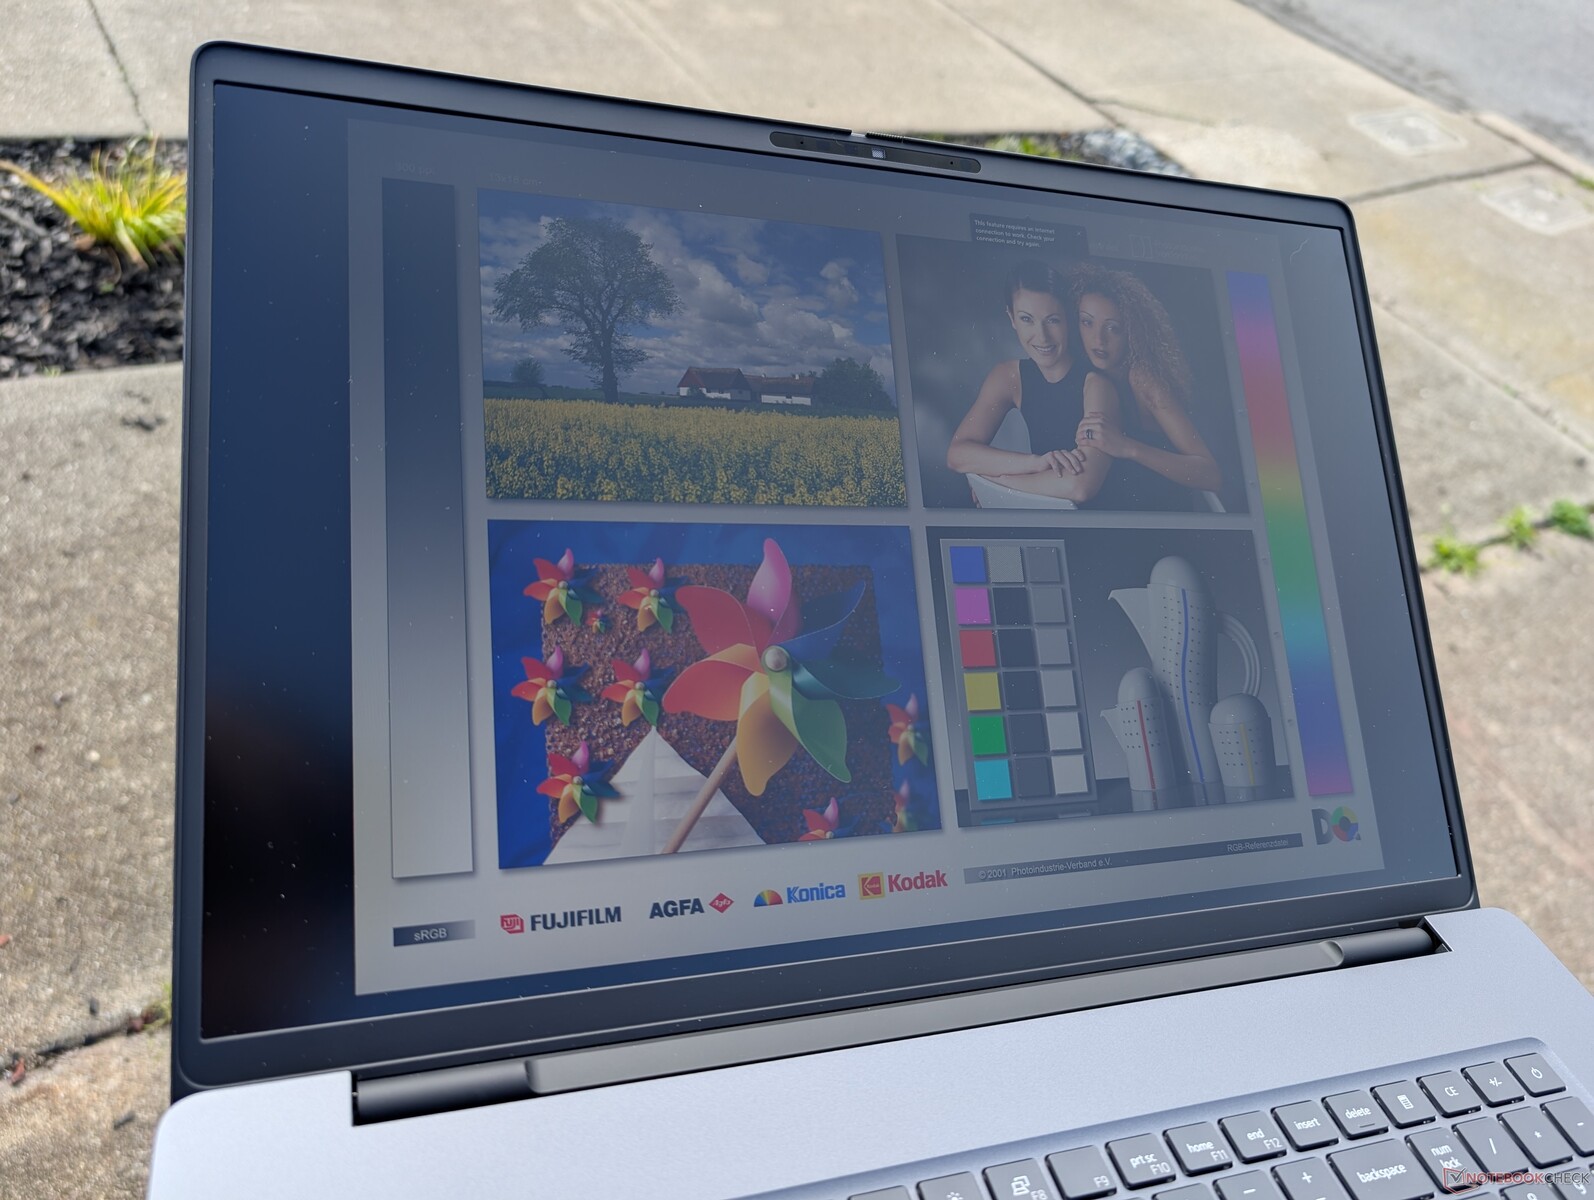
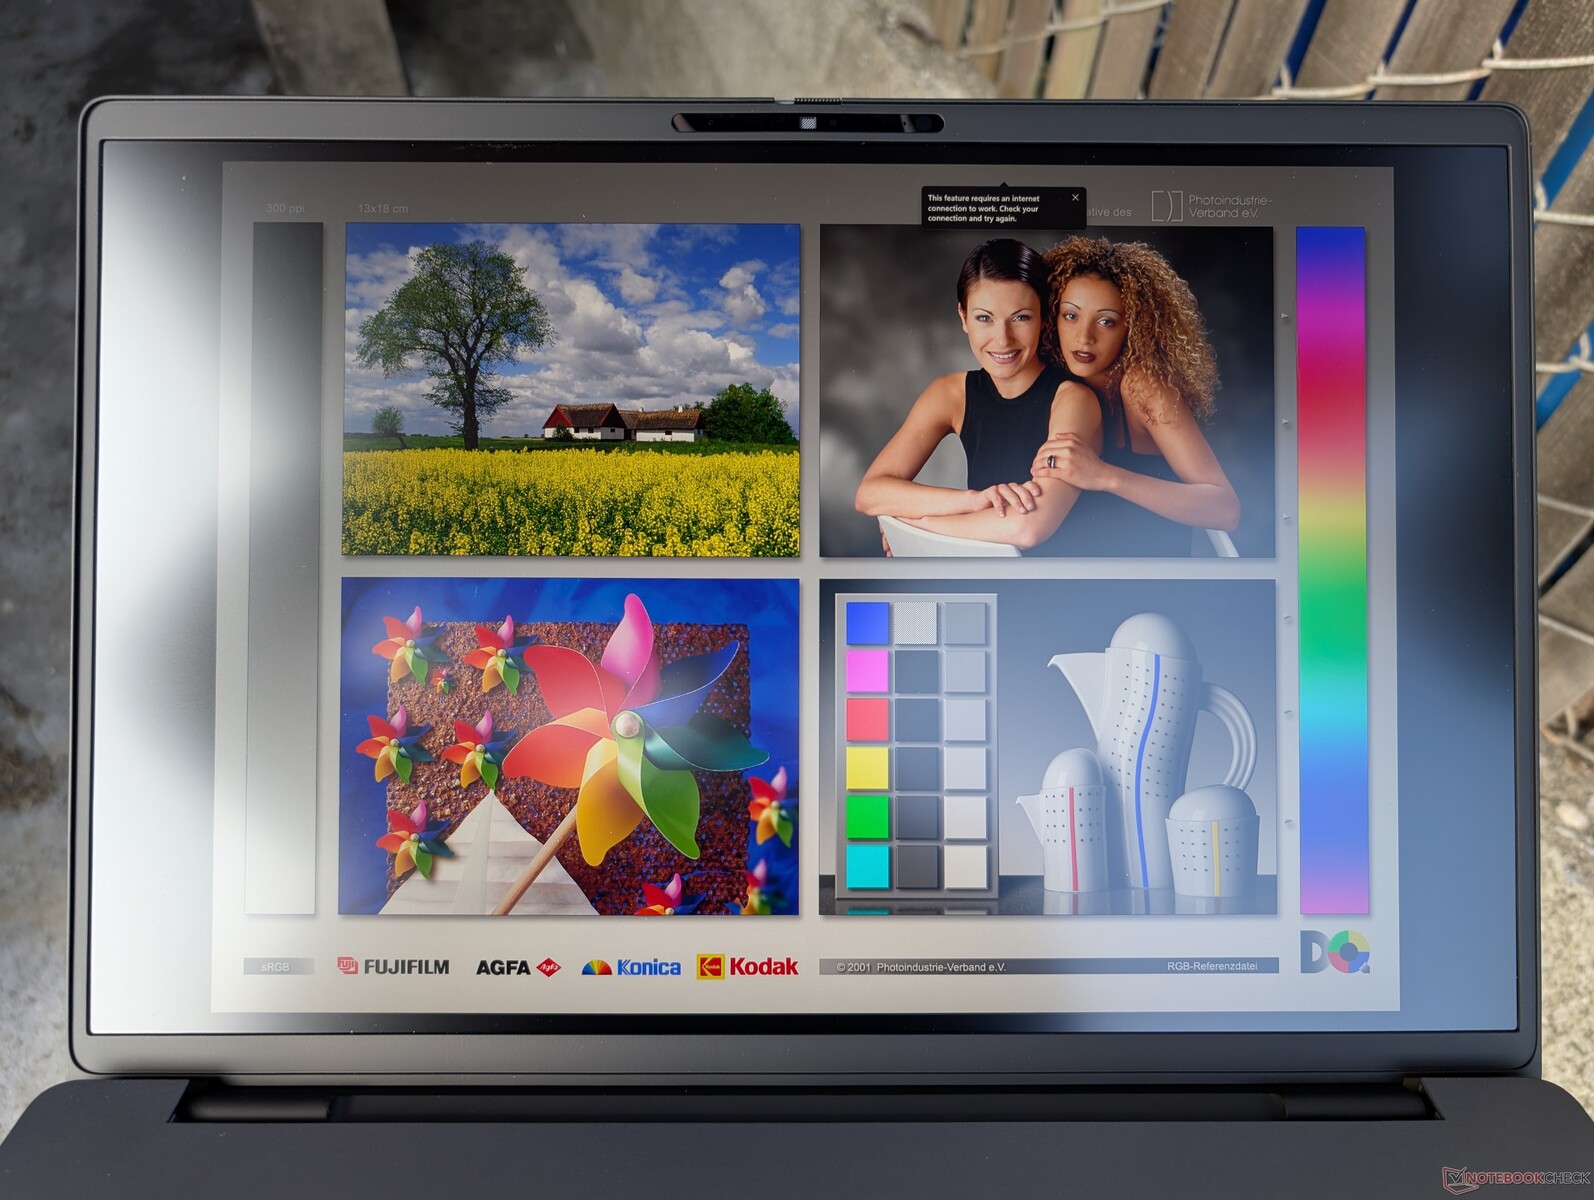
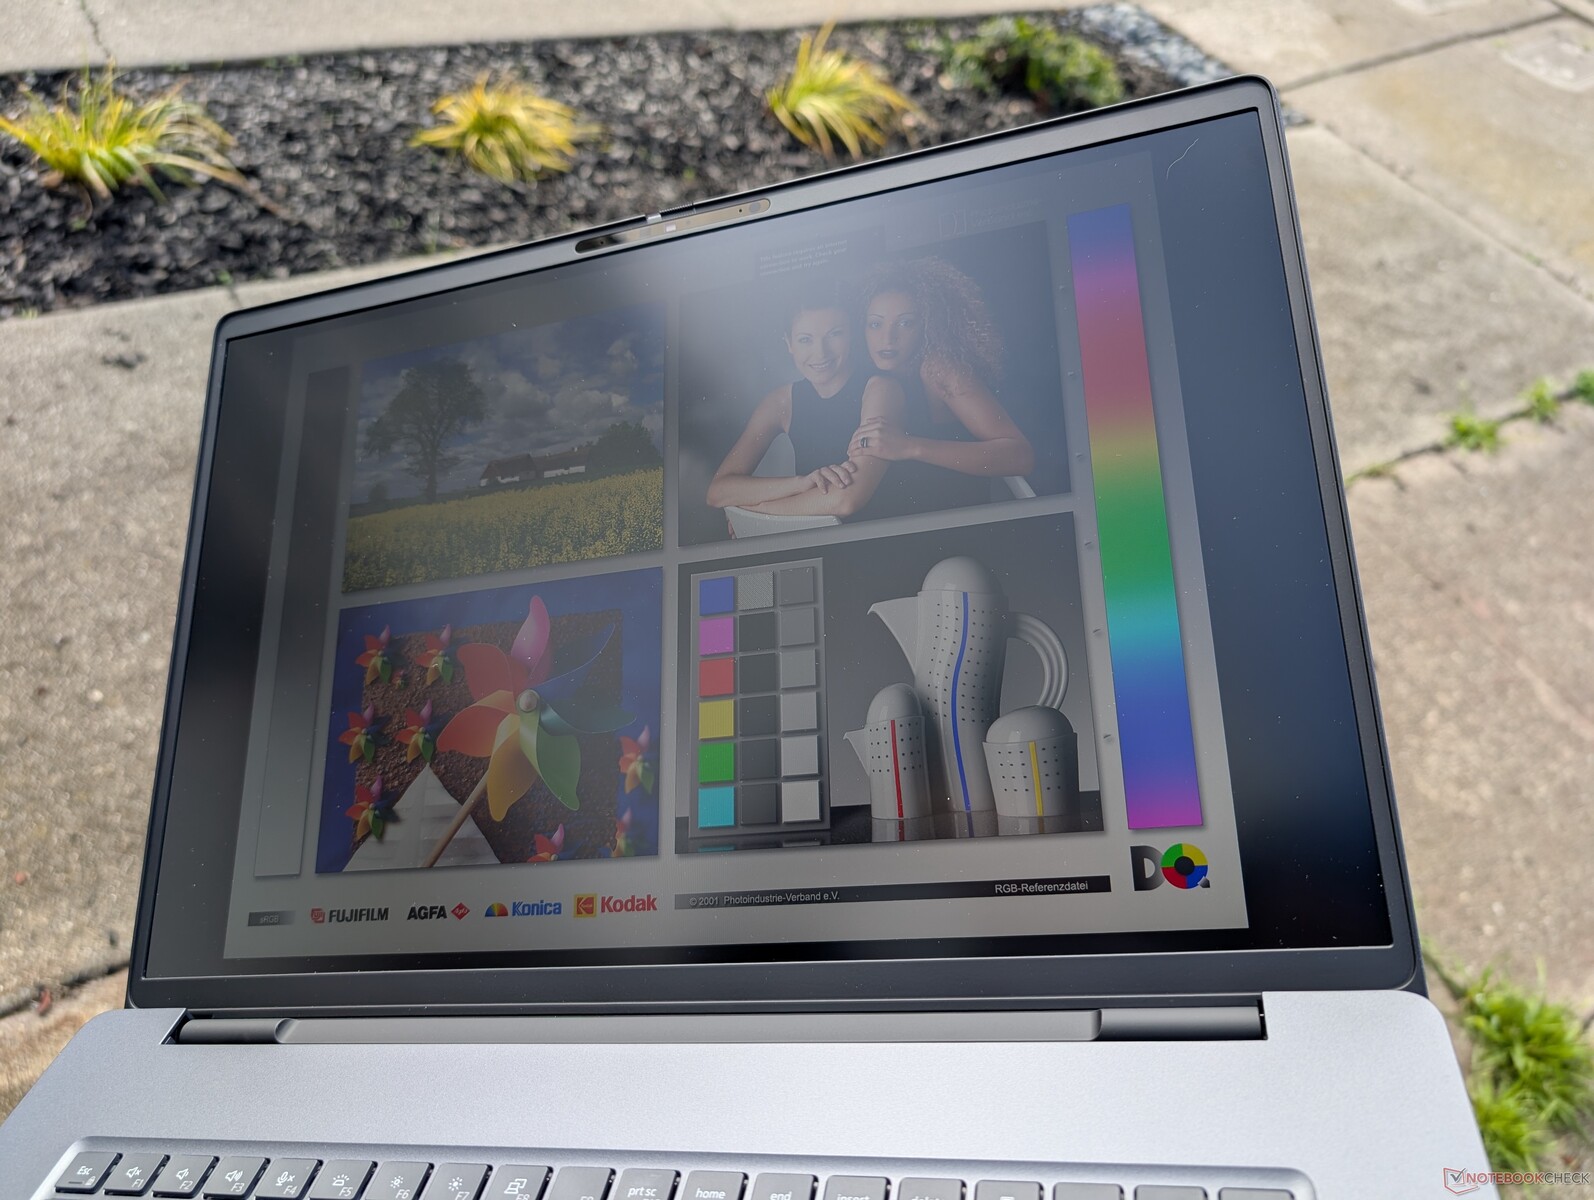
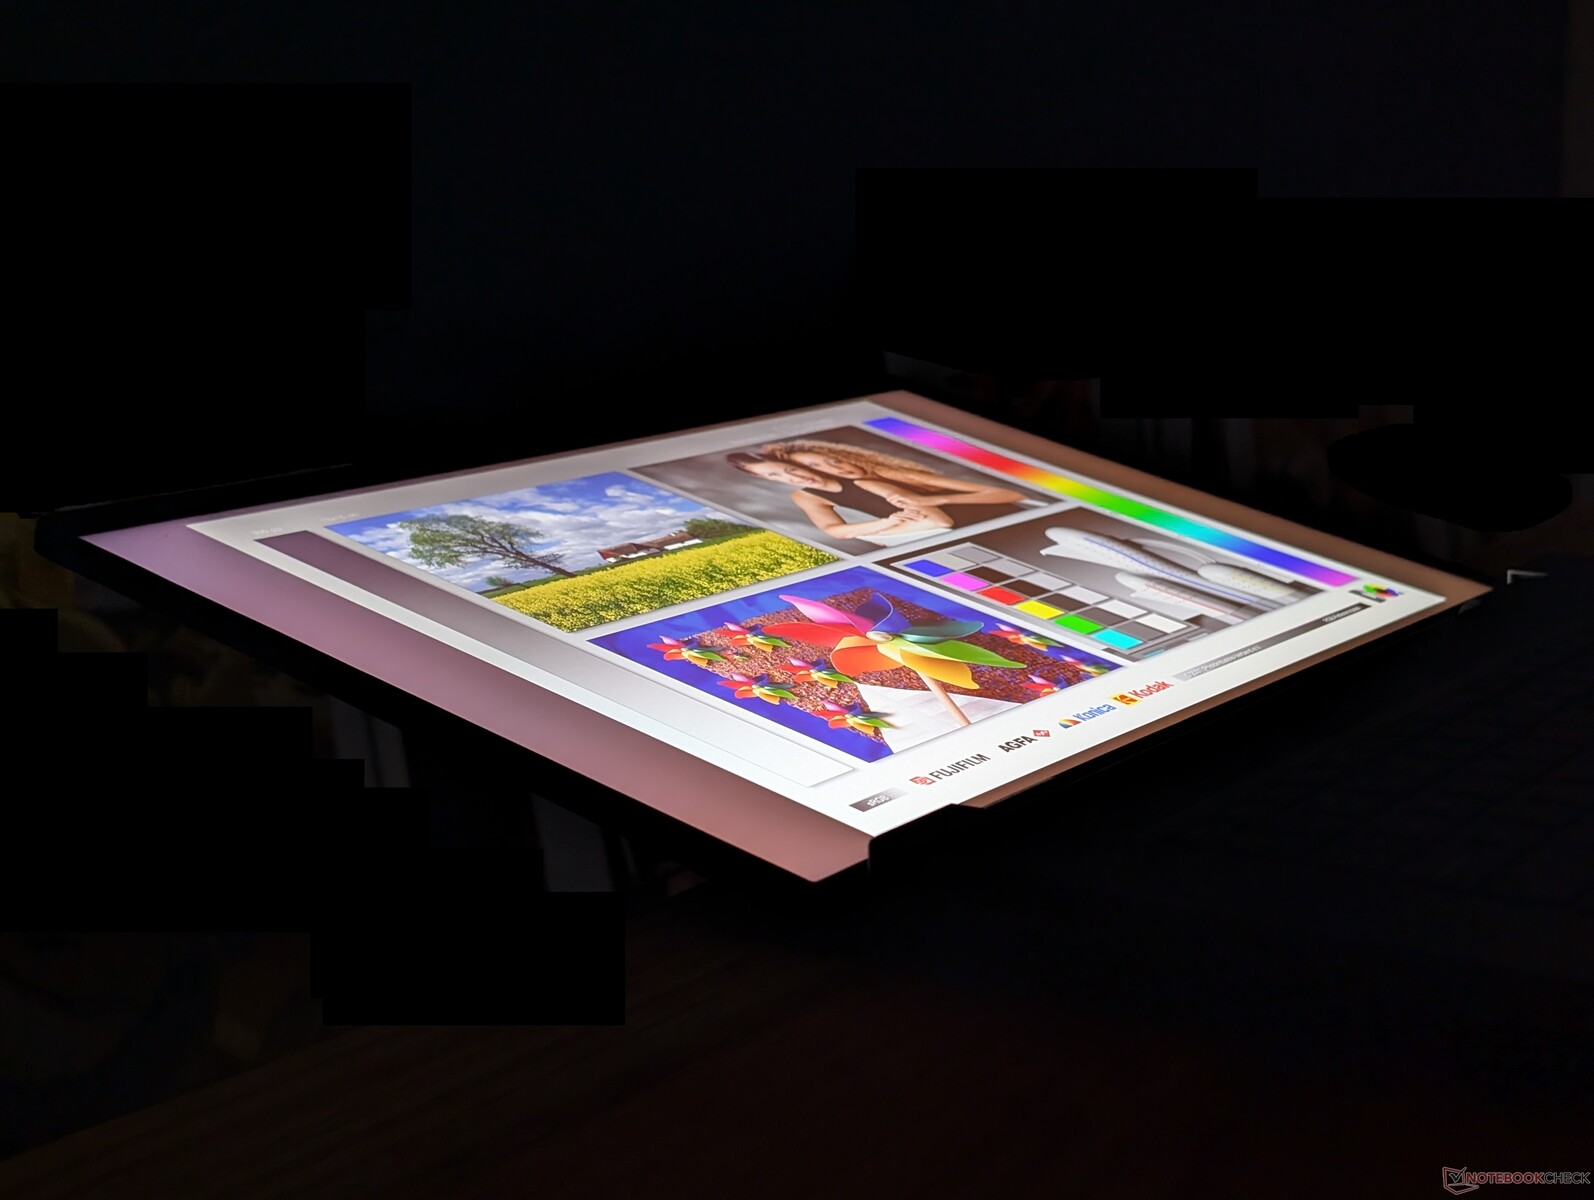
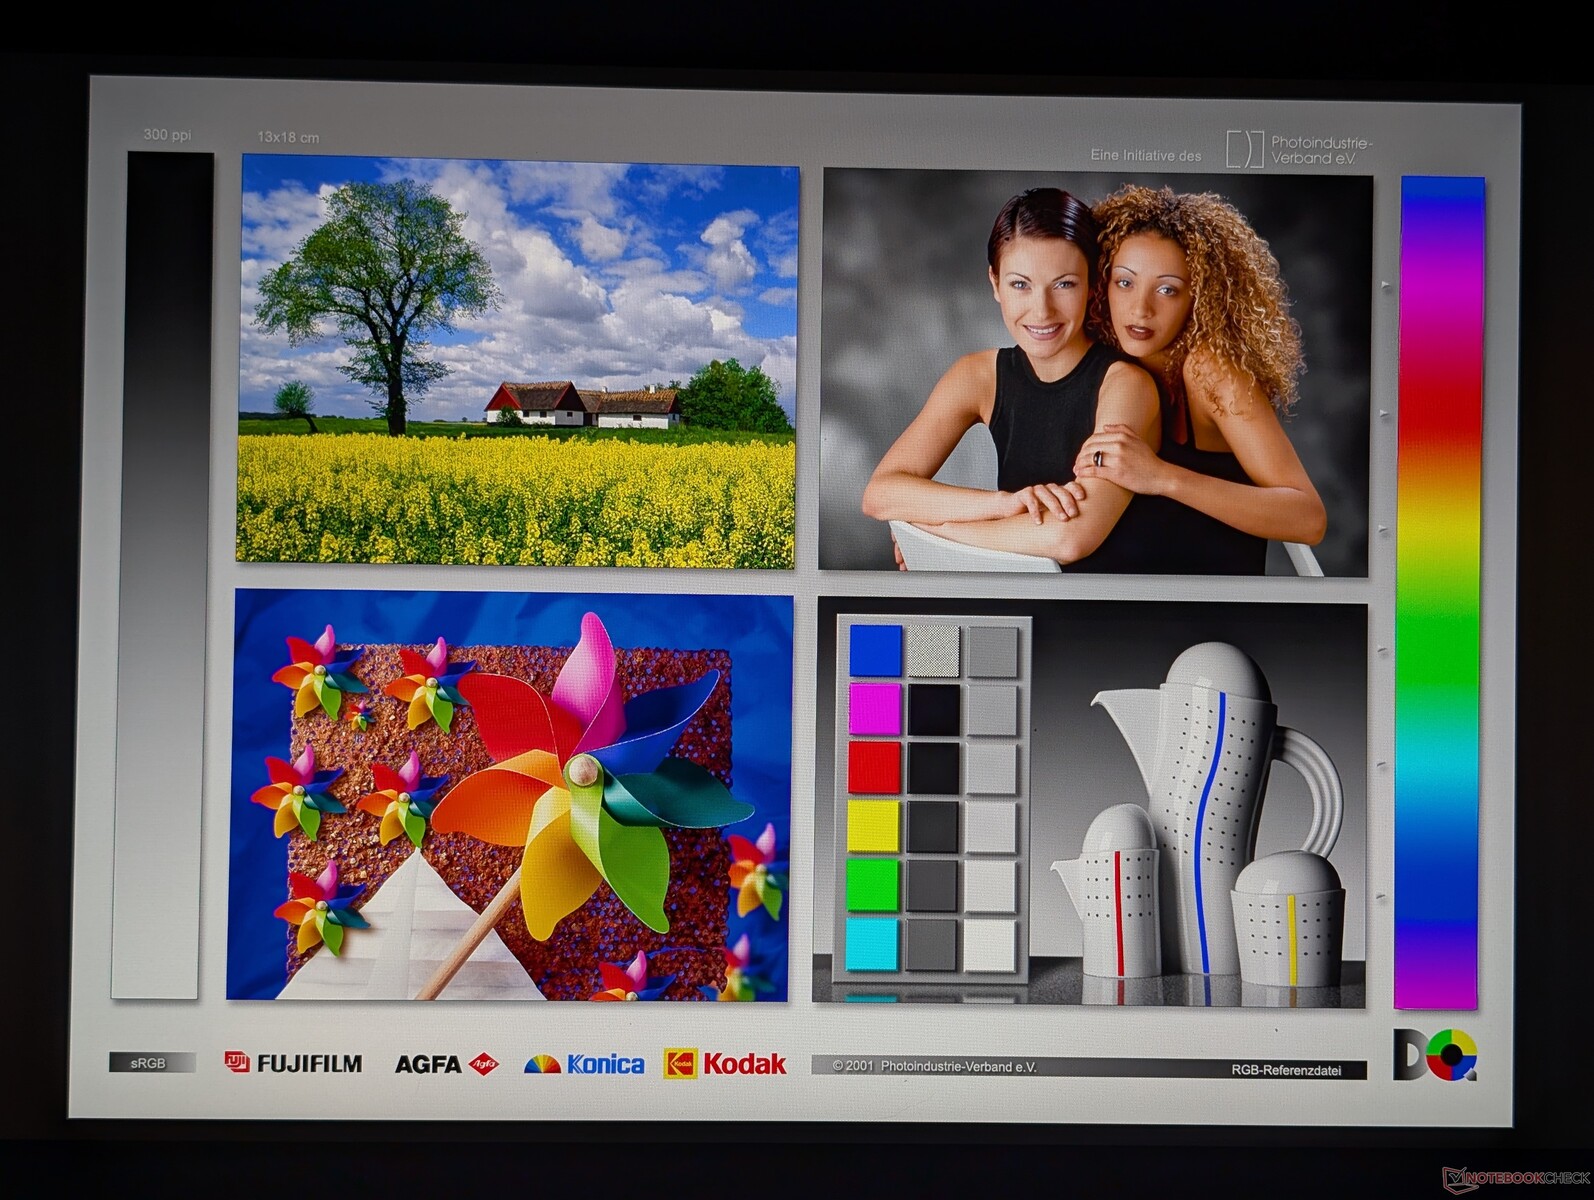
Tela - P3 Colors e 120 Hz com IPS
No momento, a Dell oferece apenas uma única opção de painel em todas as configurações, enquanto outros notebooks de 18 polegadas, como o Schenker Key 18 Pro podem oferecer opções de resolução 4K mais alta. A tela aqui é excelente e uma das melhores telas IPS que já vimos em qualquer laptop de 18 polegadas em termos de cobertura de cores, taxa de contraste e brilho. No entanto, recursos como suporte a HDR e tempos de resposta não se comparam às ofertas atuais de OLED.
| |||||||||||||||||||||||||
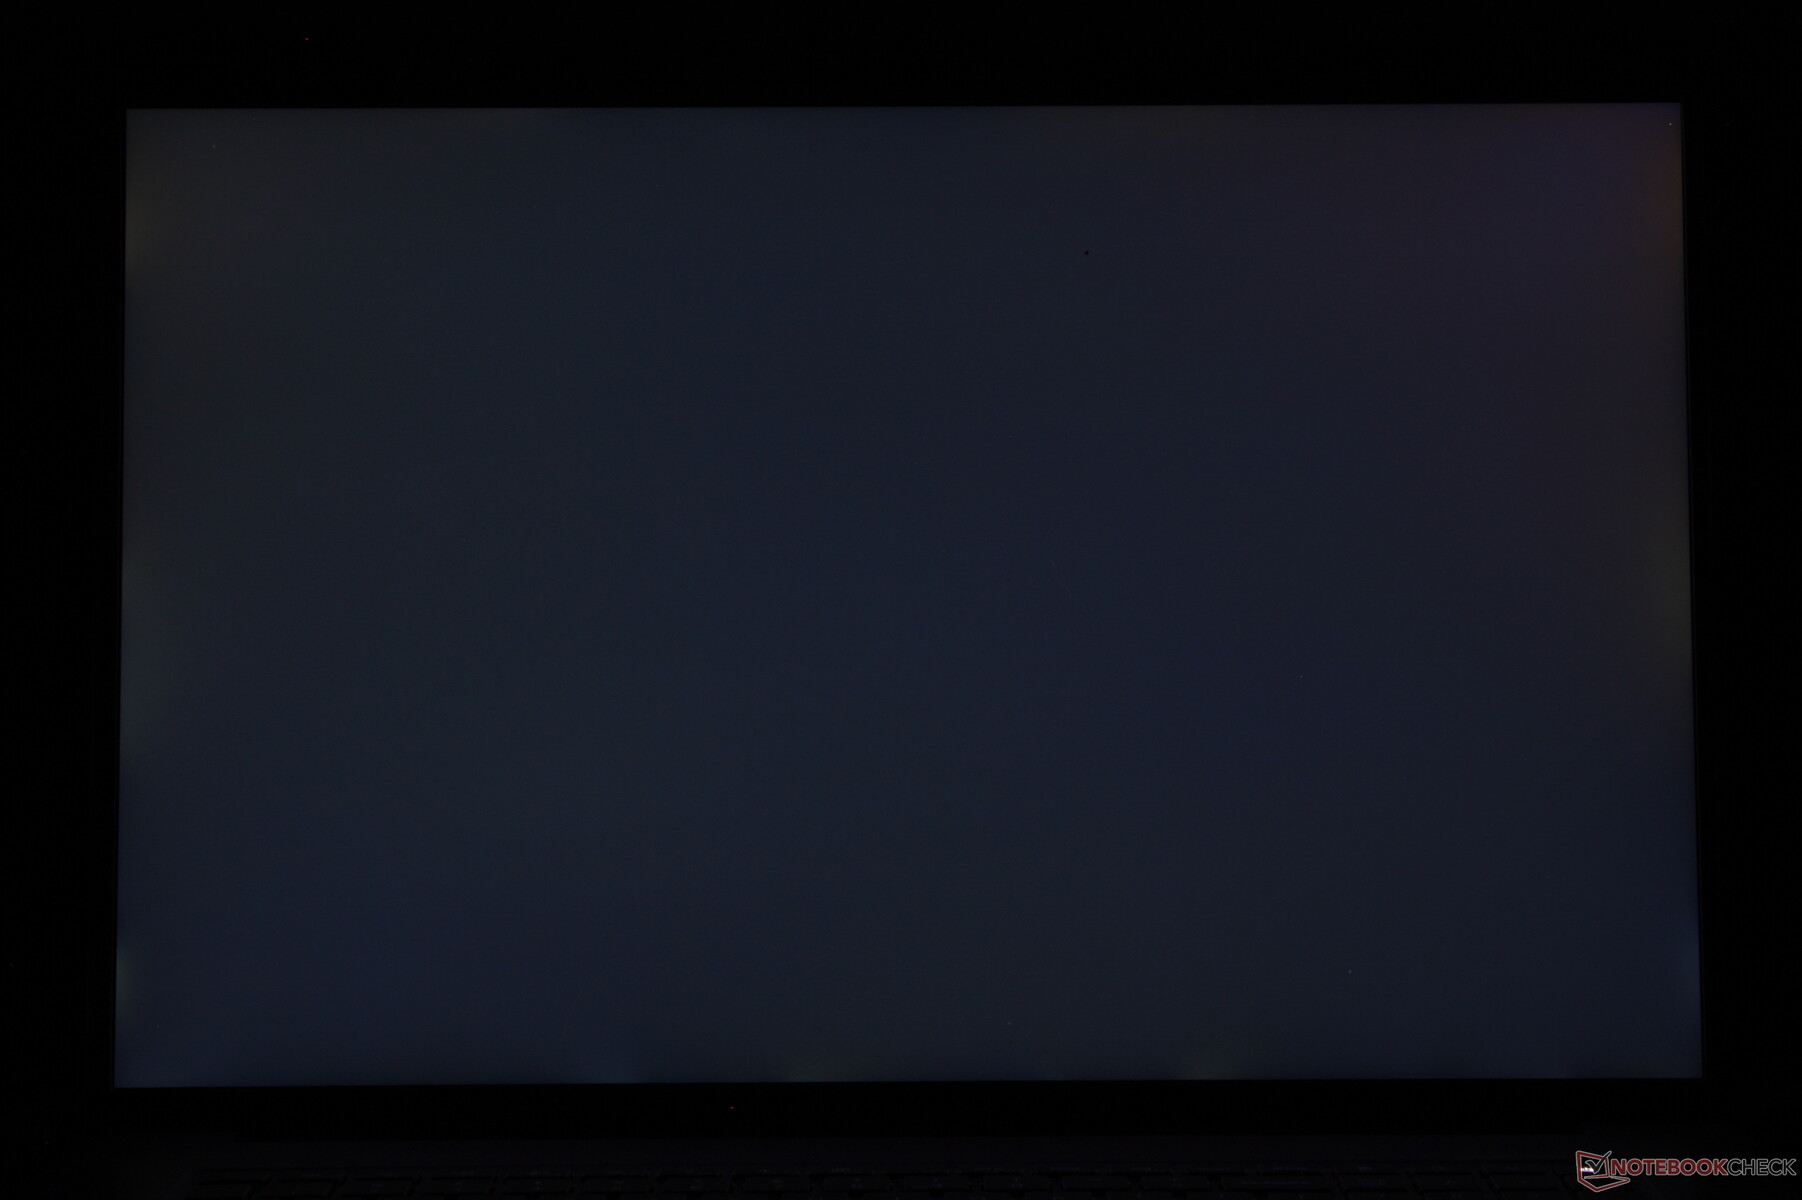
iluminação: 91 %
iluminação com acumulador: 528.8 cd/m²
Contraste: 2404:1 (Preto: 0.22 cd/m²)
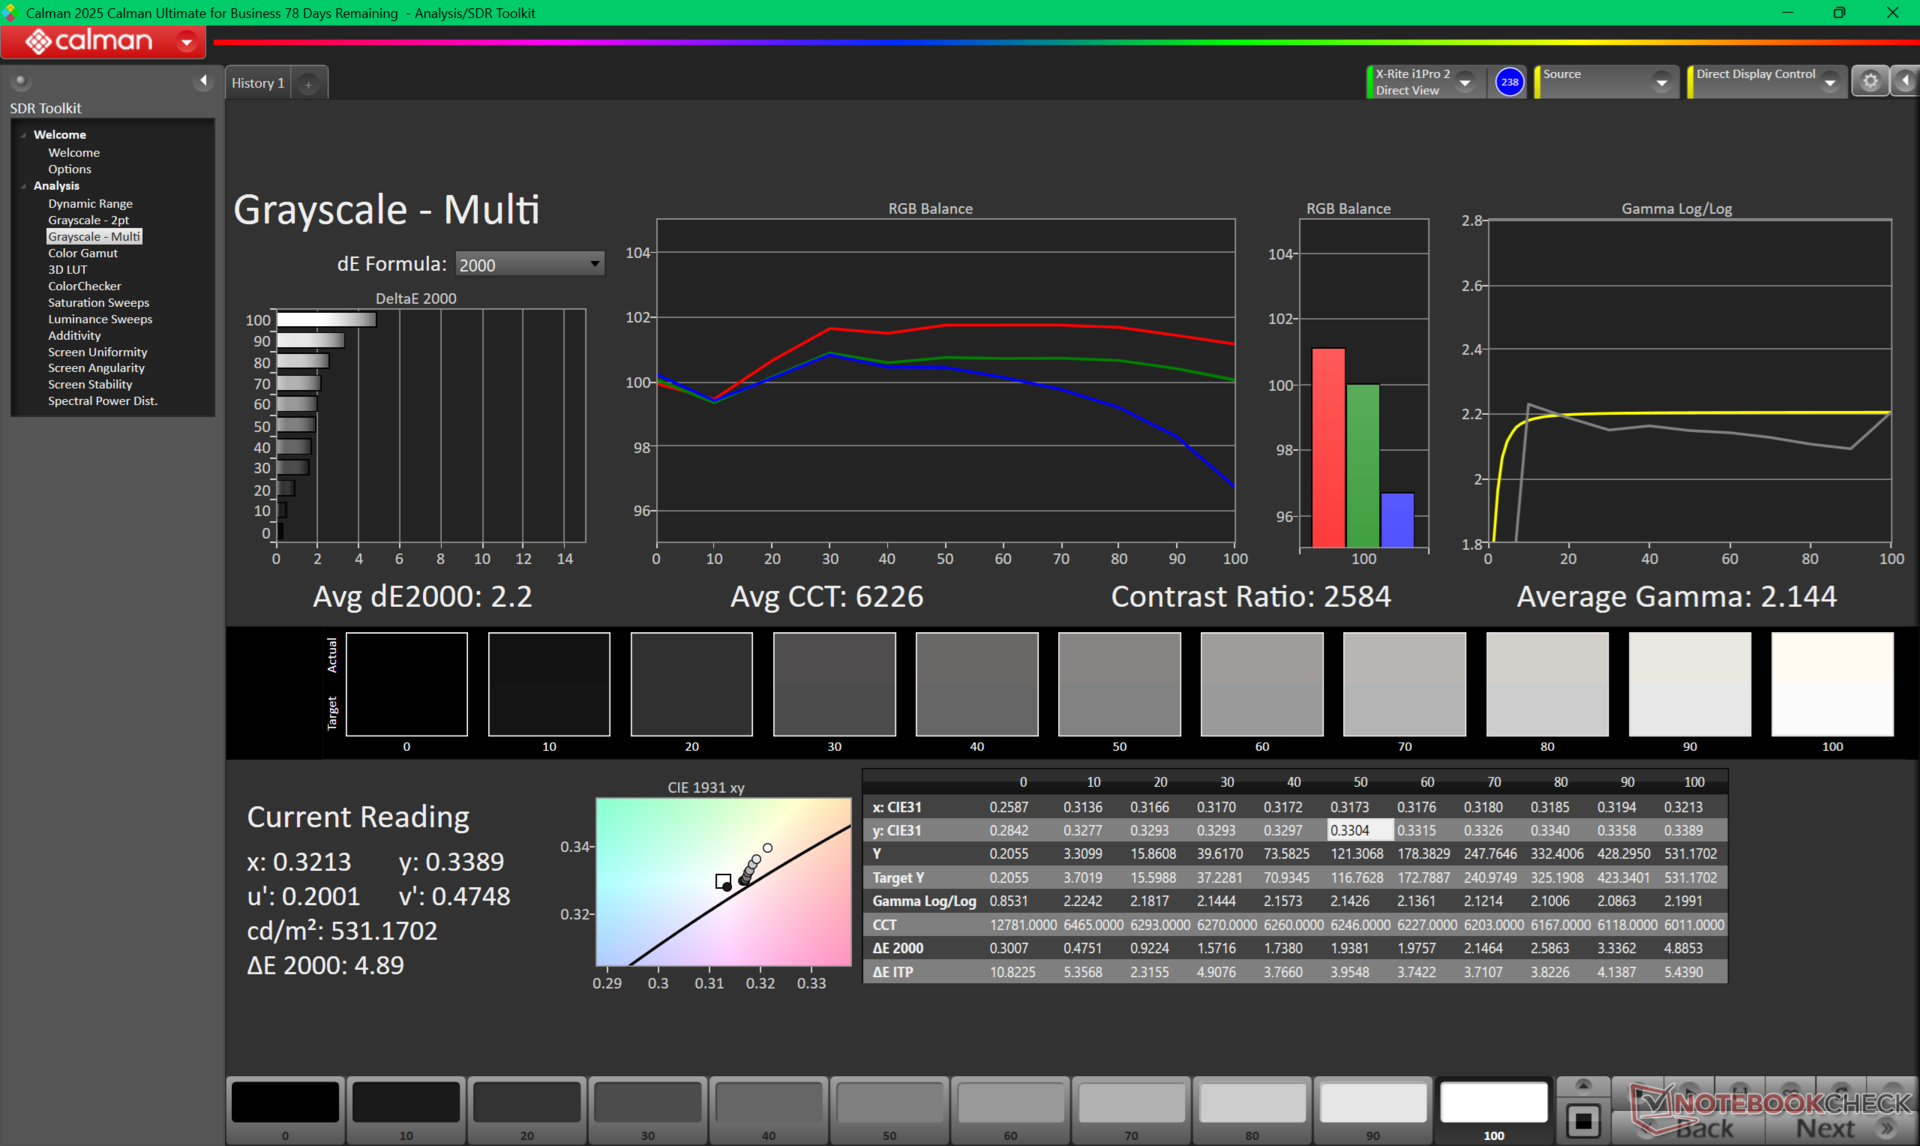
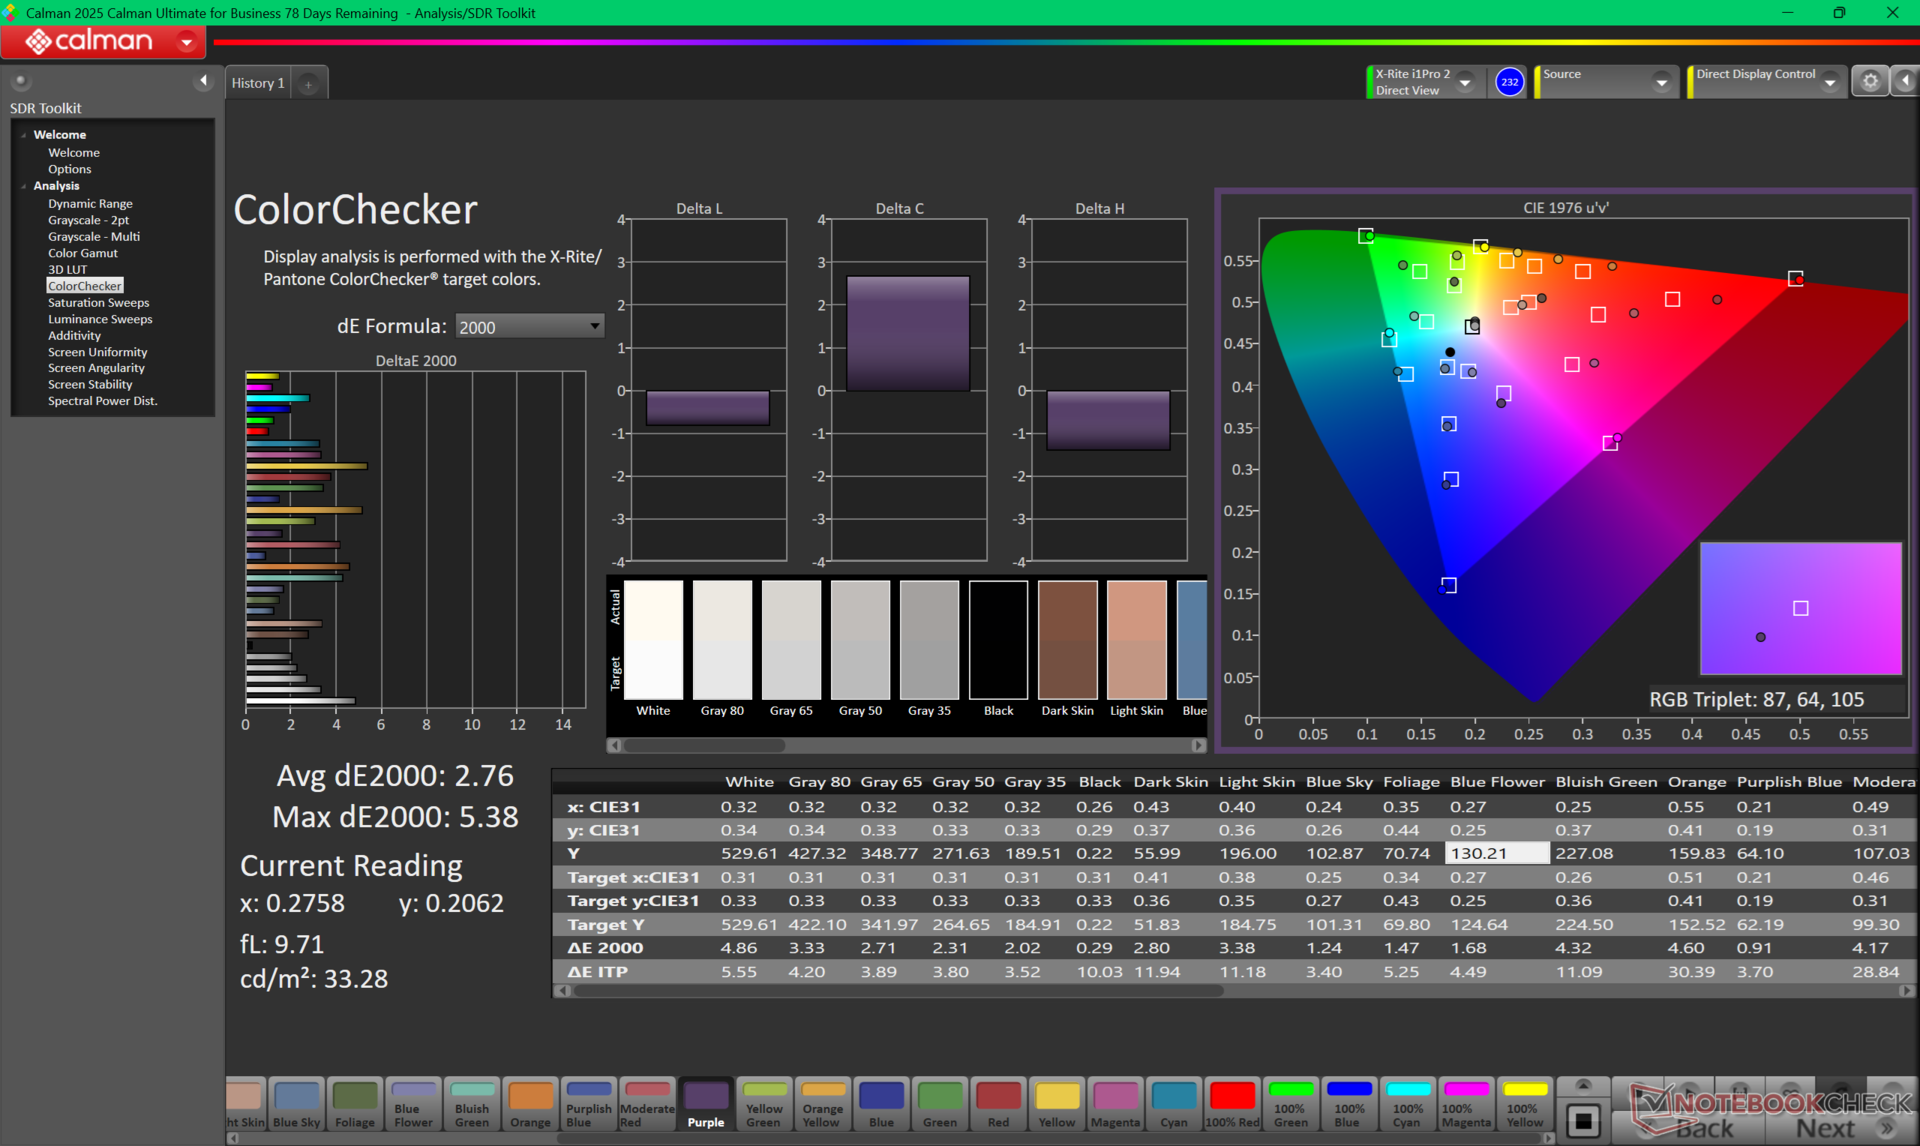
ΔE ColorChecker Calman: 2.76 | ∀{0.5-29.43 Ø4.72}
calibrated: 0.47
ΔE Greyscale Calman: 2.2 | ∀{0.09-98 Ø4.97}
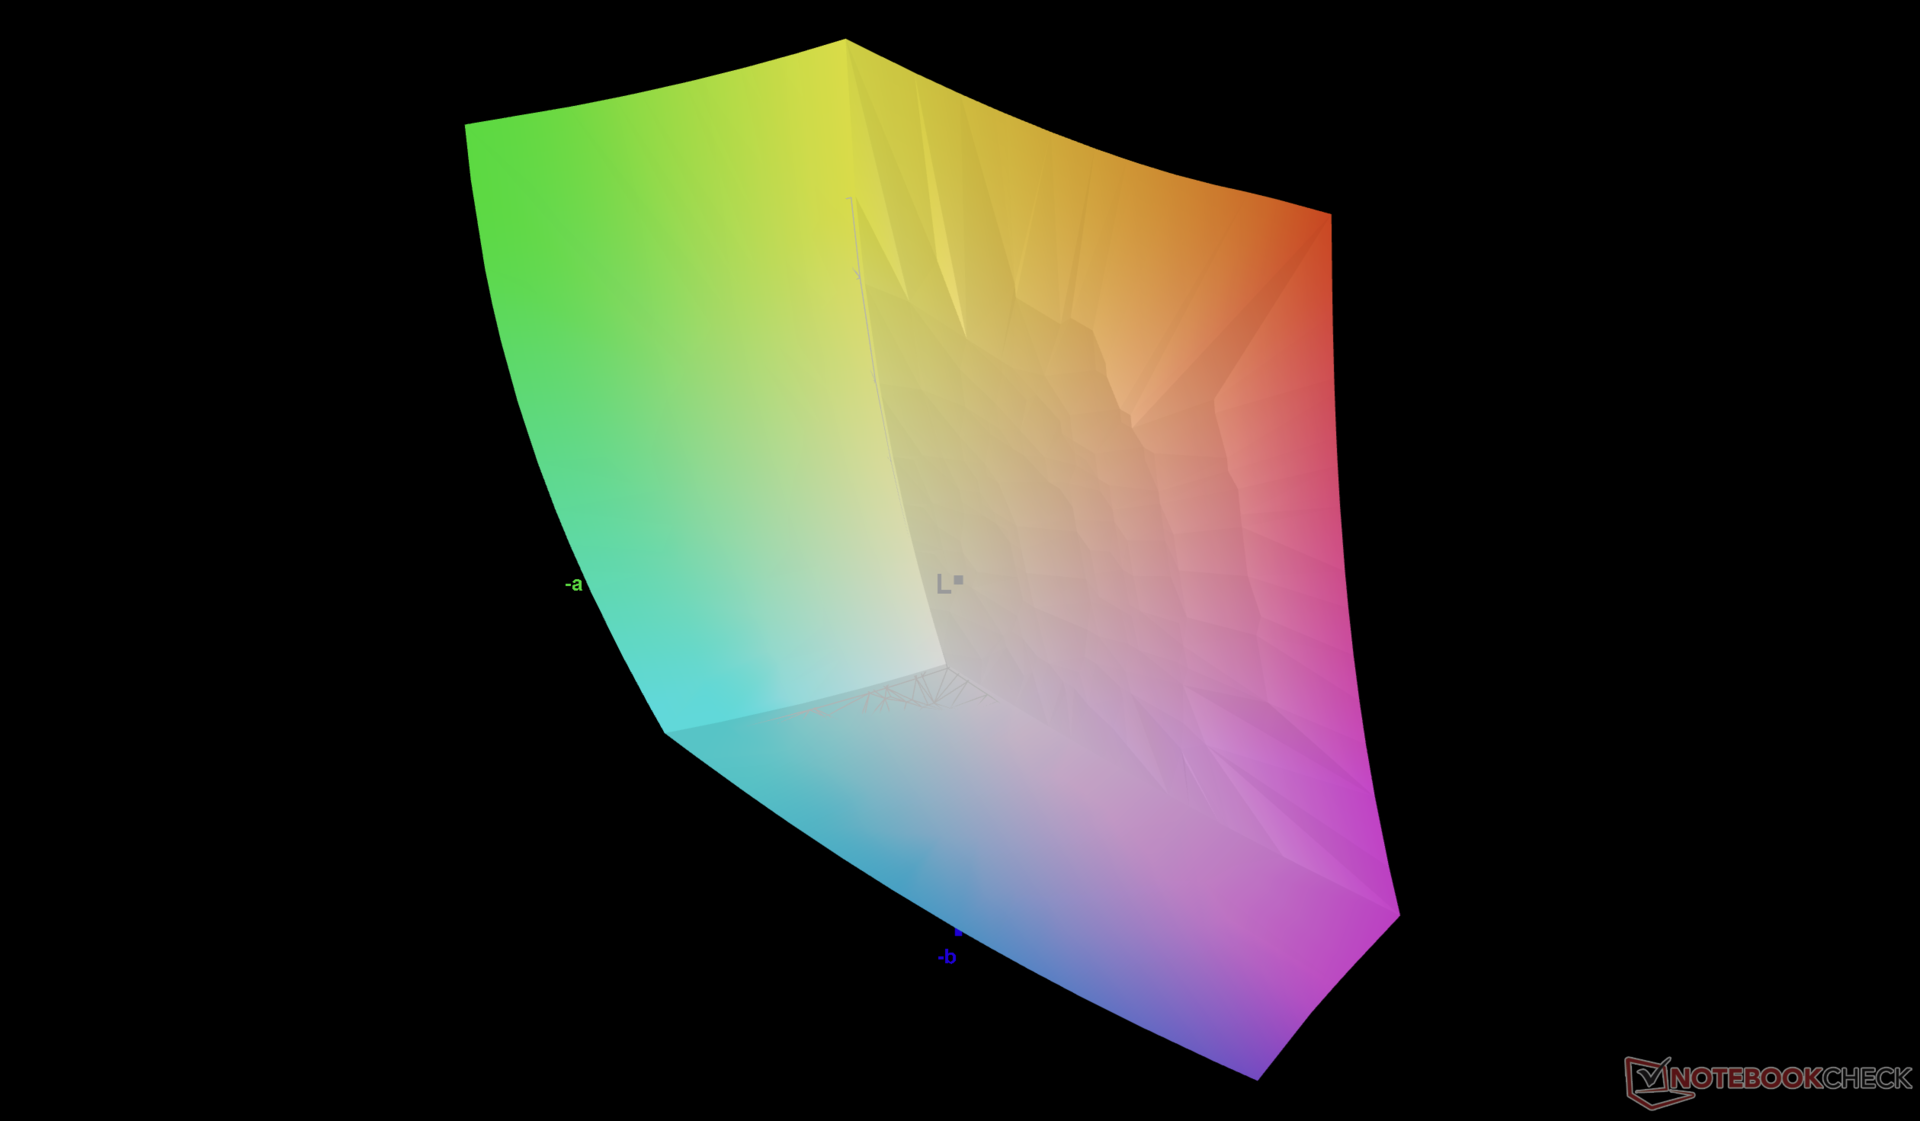
85.9% AdobeRGB 1998 (Argyll 3D)
99.9% sRGB (Argyll 3D)
97.7% Display P3 (Argyll 3D)
Gamma: 2.14
CCT: 2584 K
| Dell Pro Max 18 Plus MB18250 BOE NE18NZ7, IPS, 2560x1600, 18", 120 Hz | Schenker Key 18 Pro M25 RTX 5090 LQ180D1JW01, IPS, 3840x2400, 18", 200 Hz | HP ZBook X G1i 16 LG Philips LGD07B3, IPS, 2560x1600, 16", 120 Hz | HP ZBook Studio 16 G11 AUO87A8, IPS, 3840x2400, 16", 120 Hz | Lenovo ThinkPad P16s Gen 4 21RX000YGE N160JCA-GT1, IPS LED, 1920x1200, 16", 60 Hz | Dell Pro Max 16 Plus Samsung 160HC01, OLED, 3840x2400, 16", 120 Hz | |
|---|---|---|---|---|---|---|
| Display | -2% | 5% | 0% | -19% | 1% | |
| Display P3 Coverage (%) | 97.7 | 90.5 -7% | 97.2 -1% | 97.7 0% | 65.8 -33% | 97.3 0% |
| sRGB Coverage (%) | 99.9 | 100 0% | 100 0% | 99.9 0% | 96.8 -3% | 100 0% |
| AdobeRGB 1998 Coverage (%) | 85.9 | 87.4 2% | 99.9 16% | 85.7 0% | 67.8 -21% | 88.8 3% |
| Response Times | 86% | -2% | 64% | 25% | 98% | |
| Response Time Grey 50% / Grey 80% * (ms) | 39.9 ? | 5.2 ? 87% | 45.5 ? -14% | 14.2 ? 64% | 29.4 ? 26% | 0.63 ? 98% |
| Response Time Black / White * (ms) | 29.4 ? | 4.3 ? 85% | 26.1 ? 11% | 10.6 ? 64% | 22.4 ? 24% | 0.89 ? 97% |
| PWM Frequency (Hz) | 26536 ? | 479.9 ? | ||||
| PWM Amplitude * (%) | 47 | 28 | ||||
| Screen | -34% | -46% | -33% | -36% | 4% | |
| Brightness middle (cd/m²) | 528.8 | 529 0% | 461.8 -13% | 404.3 -24% | 540 2% | 530.9 0% |
| Brightness (cd/m²) | 515 | 513 0% | 427 -17% | 405 -21% | 516 0% | 540 5% |
| Brightness Distribution (%) | 91 | 95 4% | 88 -3% | 92 1% | 93 2% | 95 4% |
| Black Level * (cd/m²) | 0.22 | 0.31 -41% | 0.46 -109% | 0.28 -27% | 0.37 -68% | |
| Contrast (:1) | 2404 | 1706 -29% | 1004 -58% | 1444 -40% | 1459 -39% | |
| Colorchecker dE 2000 * | 2.76 | 2.7 2% | 4.08 -48% | 2.63 5% | 3.4 -23% | 2.42 12% |
| Colorchecker dE 2000 max. * | 5.38 | 7.8 -45% | 8.1 -51% | 4.48 17% | 5.6 -4% | 5.76 -7% |
| Colorchecker dE 2000 calibrated * | 0.47 | 0.8 -70% | 0.75 -60% | 1.46 -211% | 0.9 -91% | 0.7 -49% |
| Greyscale dE 2000 * | 2.2 | 4.9 -123% | 3.5 -59% | 2.1 5% | 4.5 -105% | 0.8 64% |
| Gamma | 2.14 103% | 2.23 99% | 2.15 102% | 2.3 96% | 2.51 88% | 2.23 99% |
| CCT | 2584 252% | 6997 93% | 6715 97% | 6810 95% | 6294 103% | 6488 100% |
| Média Total (Programa/Configurações) | 17% /
-10% | -14% /
-29% | 10% /
-12% | -10% /
-24% | 34% /
19% |
* ... menor é melhor

Exibir tempos de resposta
| ↔ Tempo de resposta preto para branco | ||
|---|---|---|
| 29.4 ms ... ascensão ↗ e queda ↘ combinadas | ↗ 13.9 ms ascensão | 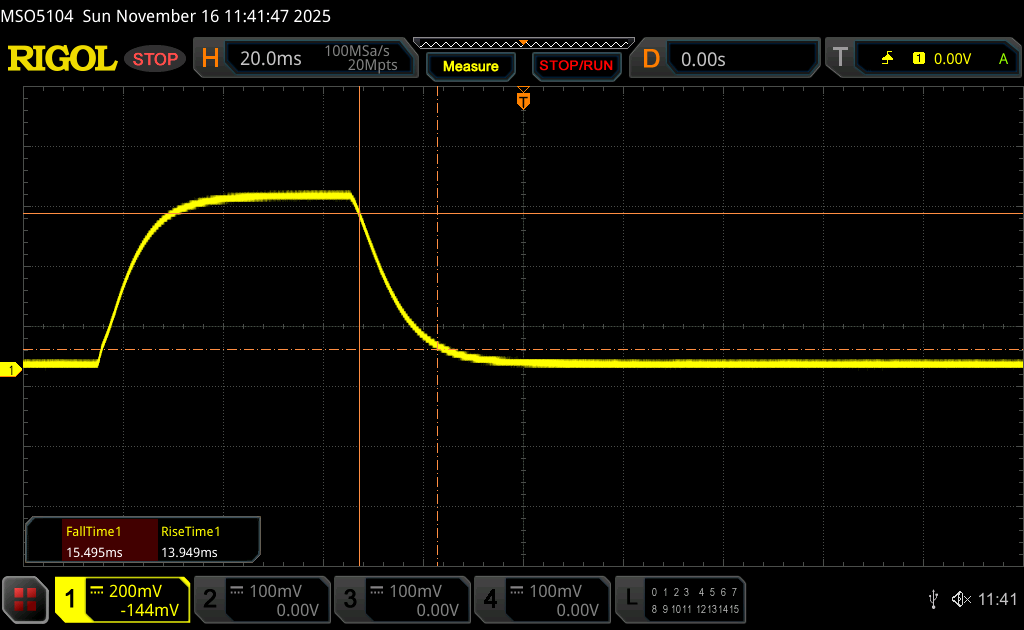 |
| ↘ 15.5 ms queda | ||
| A tela mostra taxas de resposta relativamente lentas em nossos testes e pode ser muito lenta para os jogadores. Em comparação, todos os dispositivos testados variam de 0.1 (mínimo) a 240 (máximo) ms. » 79 % de todos os dispositivos são melhores. Isso significa que o tempo de resposta medido é pior que a média de todos os dispositivos testados (19.8 ms). | ||
| ↔ Tempo de resposta 50% cinza a 80% cinza | ||
| 39.9 ms ... ascensão ↗ e queda ↘ combinadas | ↗ 17.7 ms ascensão | 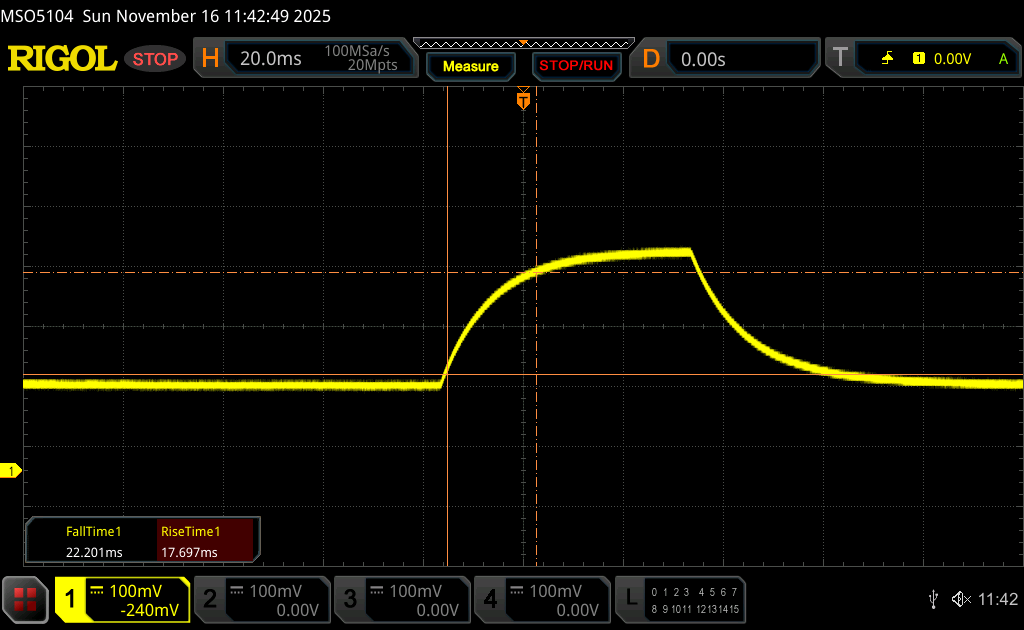 |
| ↘ 22.2 ms queda | ||
| A tela mostra taxas de resposta lentas em nossos testes e será insatisfatória para os jogadores. Em comparação, todos os dispositivos testados variam de 0.165 (mínimo) a 636 (máximo) ms. » 61 % de todos os dispositivos são melhores. Isso significa que o tempo de resposta medido é pior que a média de todos os dispositivos testados (31 ms). | ||
Cintilação da tela / PWM (modulação por largura de pulso)
| Tela tremeluzindo / PWM não detectado | 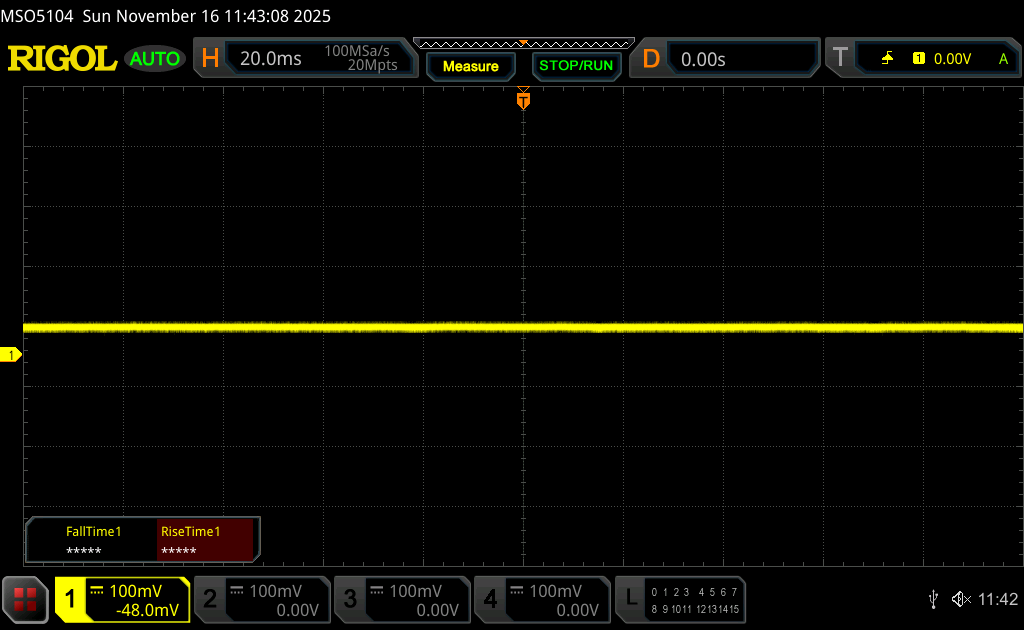 | ||
[pwm_comparison] Em comparação: 52 % de todos os dispositivos testados não usam PWM para escurecer a tela. Se PWM foi detectado, uma média de 7781 (mínimo: 5 - máximo: 343500) Hz foi medida. | |||

Desempenho
Condições de teste
Definimos o Dell Optimizer e o Nvidia Control Panel para o modo de desempenho e o modo de gráficos discretos, respectivamente, antes de executar os benchmarks abaixo. O Advanced Optimus tem suporte para alternar entre os modos iGPU e dGPU sem reinicializar.
Processador
O desempenho da CPU é excelente, mas imperfeito. Ao executar o CineBench R15 xT em um loop, por exemplo, nosso Core Ultra 9 285HX diminuiria em cerca de 15% ao longo do tempo, como mostra o gráfico abaixo, devido à sustentabilidade limitada do Turbo Boost.
Cinebench R15 Multi Loop
Cinebench R23: Multi Core | Single Core
Cinebench R20: CPU (Multi Core) | CPU (Single Core)
Cinebench R15: CPU Multi 64Bit | CPU Single 64Bit
Blender: v2.79 BMW27 CPU
7-Zip 18.03: 7z b 4 | 7z b 4 -mmt1
Geekbench 6.7: Multi-Core | Single-Core
Geekbench 5.5: Multi-Core | Single-Core
HWBOT x265 Benchmark v2.2: 4k Preset
LibreOffice : 20 Documents To PDF
R Benchmark 2.5: Overall mean
| Cinebench R20 / CPU (Multi Core) | |
| Dell Pro Max 18 Plus MB18250 | |
| Média Intel Core Ultra 9 285HX (13152 - 15751, n=6) | |
| Schenker Key 18 Pro M25 RTX 5090 | |
| Dell Pro Max 16 Plus | |
| Lenovo ThinkPad P16 Gen 2 | |
| HP ZBook Fury 16 G10 | |
| HP ZBook X G1i 16 | |
| Lenovo ThinkPad P16s Gen 4 21RX000YGE | |
| HP ZBook Studio 16 G11 | |
| Dell Precision 7000 7670 Performance | |
| Cinebench R20 / CPU (Single Core) | |
| Schenker Key 18 Pro M25 RTX 5090 | |
| Média Intel Core Ultra 9 285HX (799 - 884, n=6) | |
| Dell Pro Max 18 Plus MB18250 | |
| HP ZBook Fury 16 G10 | |
| Dell Pro Max 16 Plus | |
| Lenovo ThinkPad P16s Gen 4 21RX000YGE | |
| Lenovo ThinkPad P16 Gen 2 | |
| HP ZBook X G1i 16 | |
| Dell Precision 7000 7670 Performance | |
| HP ZBook Studio 16 G11 | |
| Cinebench R15 / CPU Multi 64Bit | |
| Dell Pro Max 18 Plus MB18250 | |
| Média Intel Core Ultra 9 285HX (5427 - 6232, n=6) | |
| Schenker Key 18 Pro M25 RTX 5090 | |
| Dell Pro Max 16 Plus | |
| Lenovo ThinkPad P16 Gen 2 | |
| HP ZBook Fury 16 G10 | |
| HP ZBook X G1i 16 | |
| Lenovo ThinkPad P16s Gen 4 21RX000YGE | |
| HP ZBook Studio 16 G11 | |
| Dell Precision 7000 7670 Performance | |
| Cinebench R15 / CPU Single 64Bit | |
| Schenker Key 18 Pro M25 RTX 5090 | |
| Média Intel Core Ultra 9 285HX (307 - 340, n=6) | |
| Dell Pro Max 18 Plus MB18250 | |
| Lenovo ThinkPad P16s Gen 4 21RX000YGE | |
| Dell Pro Max 16 Plus | |
| HP ZBook X G1i 16 | |
| HP ZBook Fury 16 G10 | |
| Lenovo ThinkPad P16 Gen 2 | |
| Dell Precision 7000 7670 Performance | |
| HP ZBook Studio 16 G11 | |
| Geekbench 6.7 / Multi-Core | |
| Dell Pro Max 18 Plus MB18250 | |
| Dell Pro Max 16 Plus | |
| Média Intel Core Ultra 9 285HX (18212 - 22104, n=6) | |
| HP ZBook X G1i 16 | |
| Schenker Key 18 Pro M25 RTX 5090 | |
| Lenovo ThinkPad P16 Gen 2 | |
| HP ZBook Fury 16 G10 | |
| Lenovo ThinkPad P16s Gen 4 21RX000YGE | |
| HP ZBook Studio 16 G11 | |
| Geekbench 6.7 / Single-Core | |
| Dell Pro Max 18 Plus MB18250 | |
| Média Intel Core Ultra 9 285HX (2907 - 3088, n=6) | |
| HP ZBook Fury 16 G10 | |
| Lenovo ThinkPad P16s Gen 4 21RX000YGE | |
| HP ZBook X G1i 16 | |
| Dell Pro Max 16 Plus | |
| Lenovo ThinkPad P16 Gen 2 | |
| Schenker Key 18 Pro M25 RTX 5090 | |
| HP ZBook Studio 16 G11 | |
| HWBOT x265 Benchmark v2.2 / 4k Preset | |
| Dell Pro Max 18 Plus MB18250 | |
| Média Intel Core Ultra 9 285HX (35.3 - 44.3, n=6) | |
| Schenker Key 18 Pro M25 RTX 5090 | |
| Dell Pro Max 16 Plus | |
| HP ZBook Fury 16 G10 | |
| HP ZBook X G1i 16 | |
| Lenovo ThinkPad P16 Gen 2 | |
| Lenovo ThinkPad P16s Gen 4 21RX000YGE | |
| HP ZBook Studio 16 G11 | |
| Dell Precision 7000 7670 Performance | |
| LibreOffice / 20 Documents To PDF | |
| Lenovo ThinkPad P16s Gen 4 21RX000YGE | |
| Lenovo ThinkPad P16 Gen 2 | |
| HP ZBook Studio 16 G11 | |
| Dell Precision 7000 7670 Performance | |
| HP ZBook Fury 16 G10 | |
| Média Intel Core Ultra 9 285HX (38 - 49.1, n=6) | |
| Dell Pro Max 16 Plus | |
| HP ZBook X G1i 16 | |
| Dell Pro Max 18 Plus MB18250 | |
| Schenker Key 18 Pro M25 RTX 5090 | |
* ... menor é melhor
AIDA64: FP32 Ray-Trace | FPU Julia | CPU SHA3 | CPU Queen | FPU SinJulia | FPU Mandel | CPU AES | CPU ZLib | FP64 Ray-Trace | CPU PhotoWorxx
| Performance rating | |
| Dell Pro Max 18 Plus MB18250 | |
| Schenker Key 18 Pro M25 RTX 5090 | |
| Média Intel Core Ultra 9 285HX | |
| Dell Pro Max 16 Plus | |
| Lenovo ThinkPad P16s Gen 4 21RX000YGE | |
| HP ZBook Studio 16 G11 | |
| AIDA64 / FP32 Ray-Trace | |
| Schenker Key 18 Pro M25 RTX 5090 | |
| Dell Pro Max 18 Plus MB18250 | |
| Média Intel Core Ultra 9 285HX (29076 - 42341, n=6) | |
| Dell Pro Max 16 Plus | |
| Lenovo ThinkPad P16s Gen 4 21RX000YGE | |
| HP ZBook Studio 16 G11 | |
| AIDA64 / FPU Julia | |
| Schenker Key 18 Pro M25 RTX 5090 | |
| Média Intel Core Ultra 9 285HX (161276 - 210885, n=6) | |
| Dell Pro Max 18 Plus MB18250 | |
| Dell Pro Max 16 Plus | |
| Lenovo ThinkPad P16s Gen 4 21RX000YGE | |
| HP ZBook Studio 16 G11 | |
| AIDA64 / CPU SHA3 | |
| Schenker Key 18 Pro M25 RTX 5090 | |
| Dell Pro Max 18 Plus MB18250 | |
| Média Intel Core Ultra 9 285HX (7757 - 9815, n=6) | |
| Dell Pro Max 16 Plus | |
| Lenovo ThinkPad P16s Gen 4 21RX000YGE | |
| HP ZBook Studio 16 G11 | |
| AIDA64 / CPU Queen | |
| Média Intel Core Ultra 9 285HX (134345 - 141681, n=6) | |
| Dell Pro Max 18 Plus MB18250 | |
| Dell Pro Max 16 Plus | |
| Schenker Key 18 Pro M25 RTX 5090 | |
| Lenovo ThinkPad P16s Gen 4 21RX000YGE | |
| HP ZBook Studio 16 G11 | |
| AIDA64 / FPU SinJulia | |
| Lenovo ThinkPad P16s Gen 4 21RX000YGE | |
| Schenker Key 18 Pro M25 RTX 5090 | |
| Dell Pro Max 18 Plus MB18250 | |
| Média Intel Core Ultra 9 285HX (12559 - 14431, n=6) | |
| Dell Pro Max 16 Plus | |
| HP ZBook Studio 16 G11 | |
| AIDA64 / FPU Mandel | |
| Schenker Key 18 Pro M25 RTX 5090 | |
| Média Intel Core Ultra 9 285HX (84053 - 108922, n=6) | |
| Dell Pro Max 18 Plus MB18250 | |
| Dell Pro Max 16 Plus | |
| Lenovo ThinkPad P16s Gen 4 21RX000YGE | |
| HP ZBook Studio 16 G11 | |
| AIDA64 / CPU AES | |
| Schenker Key 18 Pro M25 RTX 5090 | |
| Dell Pro Max 18 Plus MB18250 | |
| Média Intel Core Ultra 9 285HX (119553 - 134195, n=6) | |
| Dell Pro Max 16 Plus | |
| Lenovo ThinkPad P16s Gen 4 21RX000YGE | |
| HP ZBook Studio 16 G11 | |
| AIDA64 / CPU ZLib | |
| Dell Pro Max 18 Plus MB18250 | |
| Schenker Key 18 Pro M25 RTX 5090 | |
| Média Intel Core Ultra 9 285HX (1886 - 2267, n=6) | |
| Dell Pro Max 16 Plus | |
| Lenovo ThinkPad P16s Gen 4 21RX000YGE | |
| HP ZBook Studio 16 G11 | |
| AIDA64 / FP64 Ray-Trace | |
| Schenker Key 18 Pro M25 RTX 5090 | |
| Média Intel Core Ultra 9 285HX (15059 - 22312, n=6) | |
| Dell Pro Max 18 Plus MB18250 | |
| Dell Pro Max 16 Plus | |
| Lenovo ThinkPad P16s Gen 4 21RX000YGE | |
| HP ZBook Studio 16 G11 | |
| AIDA64 / CPU PhotoWorxx | |
| Dell Pro Max 16 Plus | |
| Dell Pro Max 18 Plus MB18250 | |
| HP ZBook Studio 16 G11 | |
| Média Intel Core Ultra 9 285HX (39232 - 62611, n=6) | |
| Lenovo ThinkPad P16s Gen 4 21RX000YGE | |
| Schenker Key 18 Pro M25 RTX 5090 | |
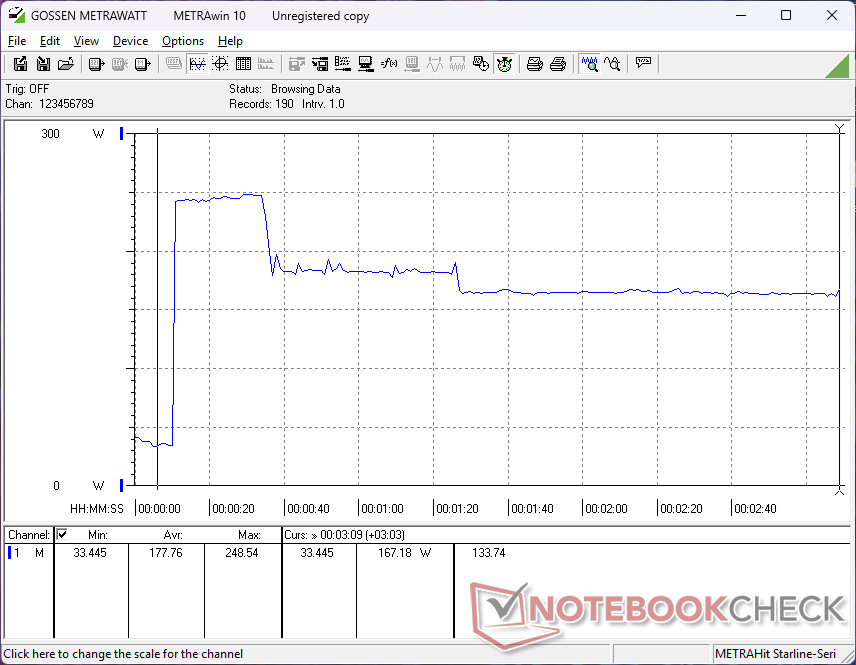
Teste de estresse
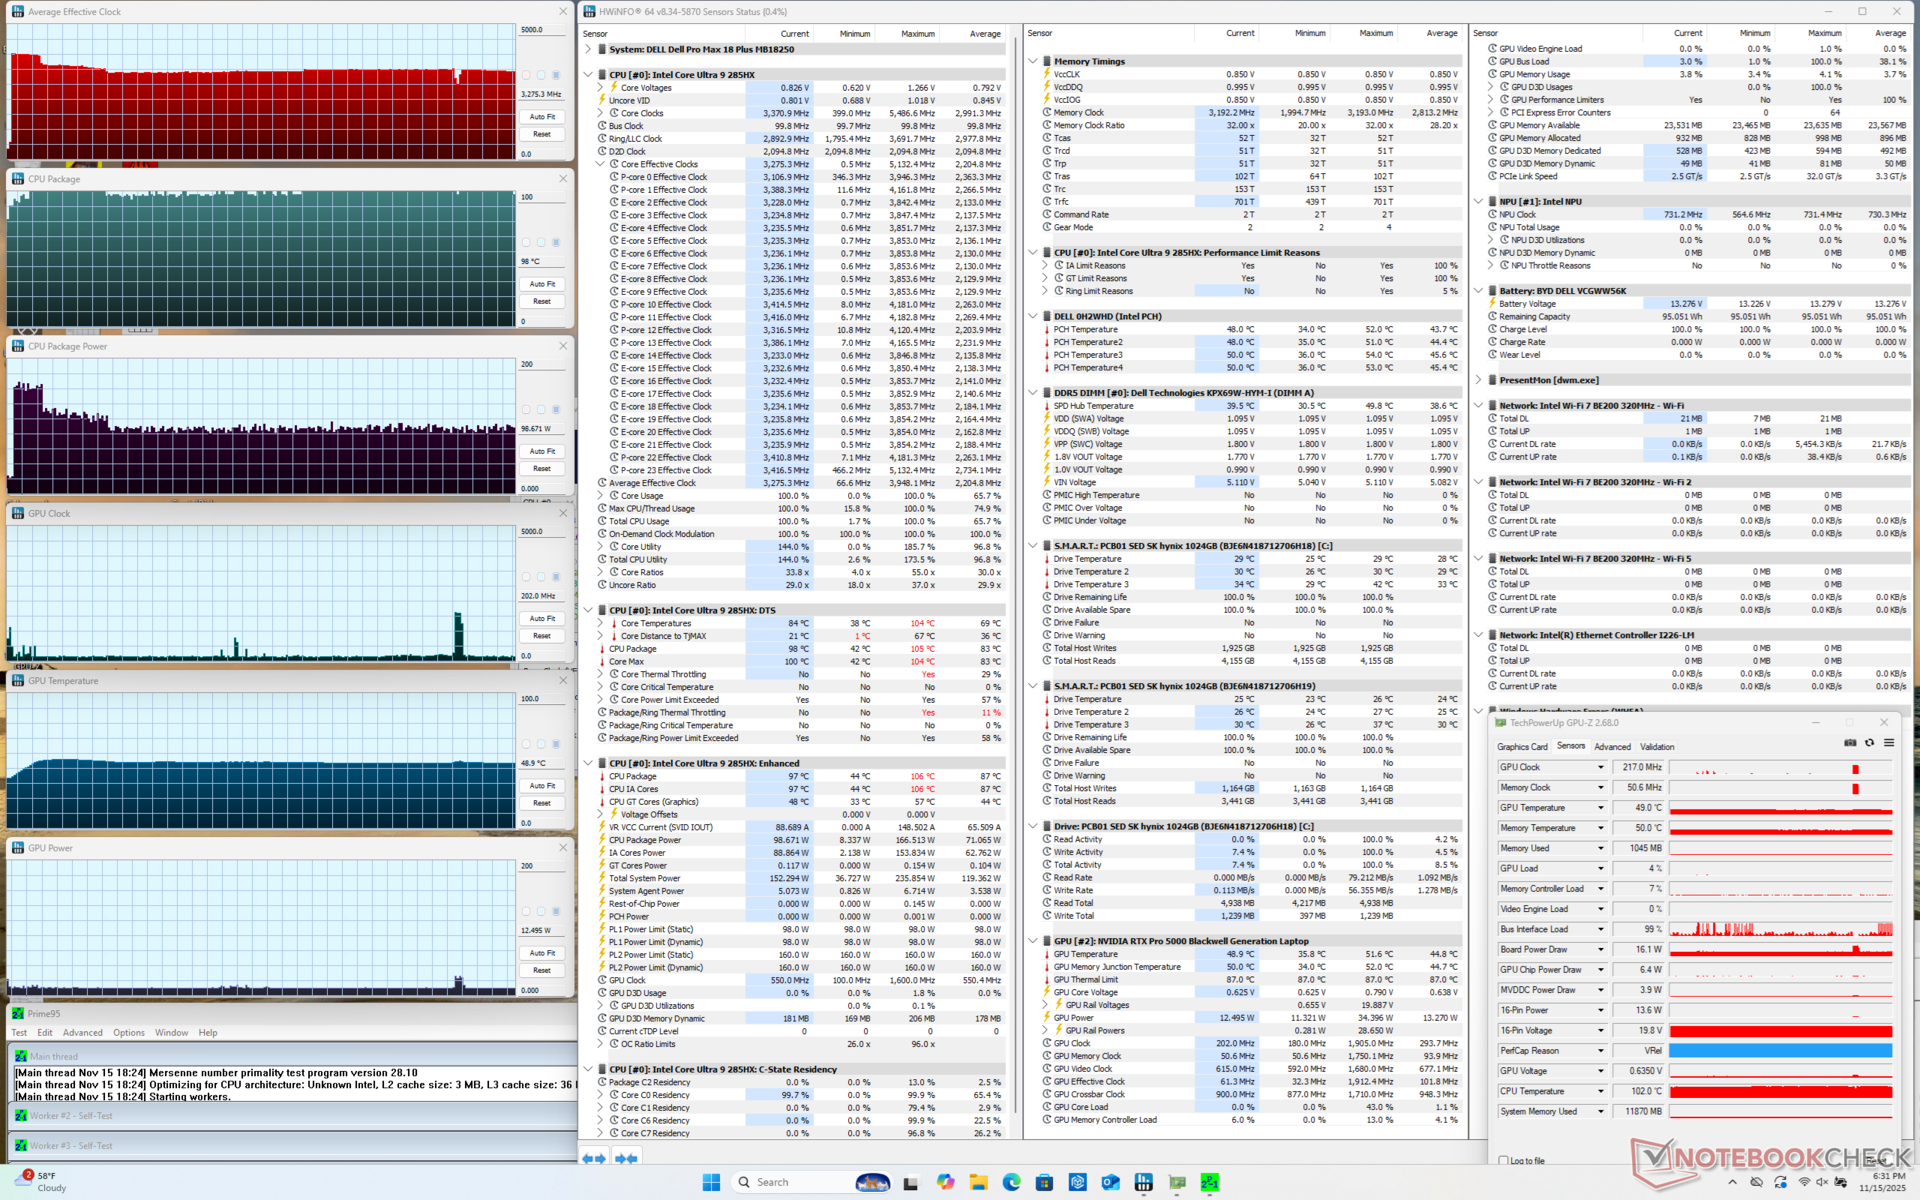
Ao executar o estresse do Prime95, a CPU aumentava para 4 GHz, 160 W e pouco mais de 100 C (!) antes de cair e se estabilizar em 3,2 GHz, 99 W e 98 C. O Turbo Boost de curta duração complementa nossas observações de loop do CineBench R15 xT mencionadas acima.
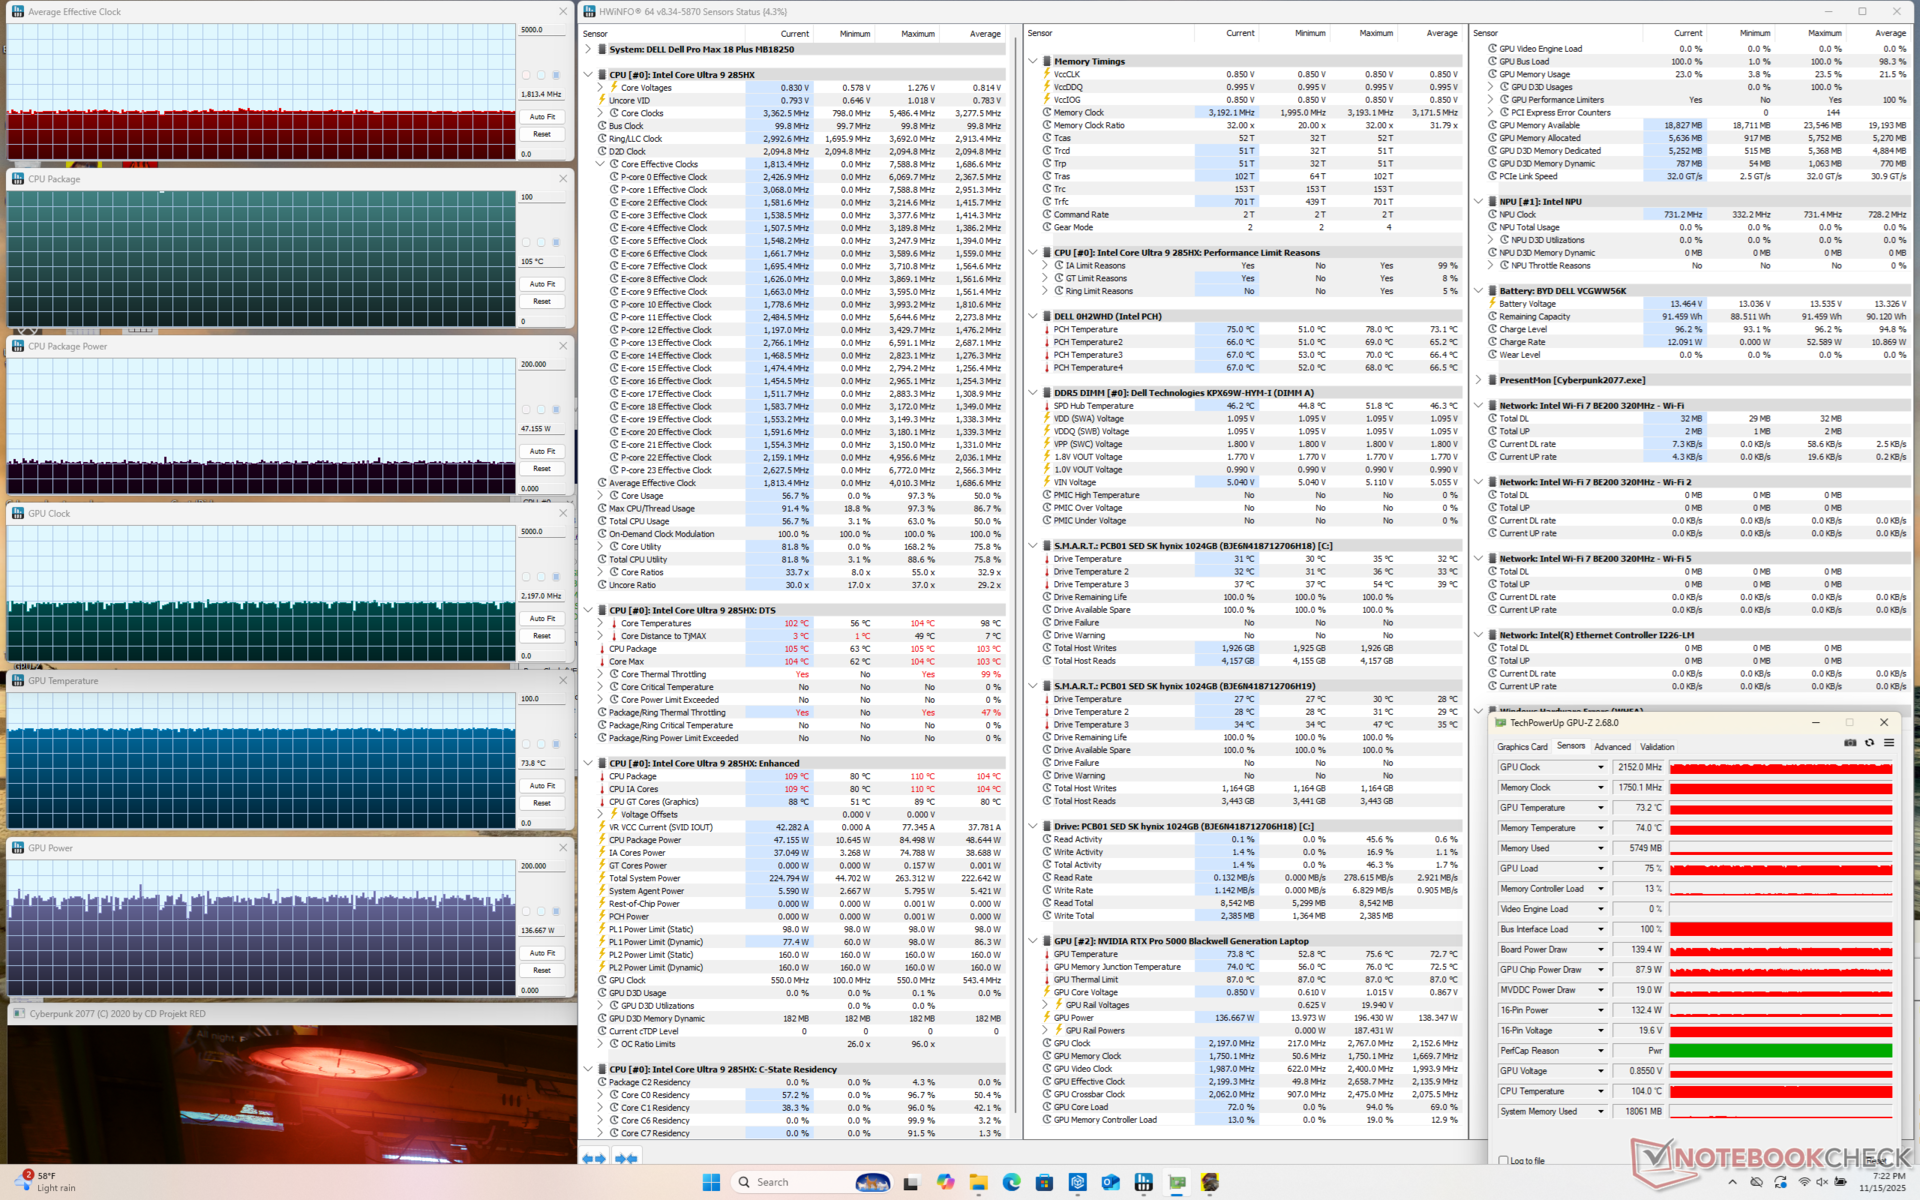
As temperaturas da CPU permaneceriam muito altas, em torno de 100 C, ao executar outras cargas exigentes, como jogos, em comparação com apenas 77 C no antigo Desempenho do Dell Precision 7670.
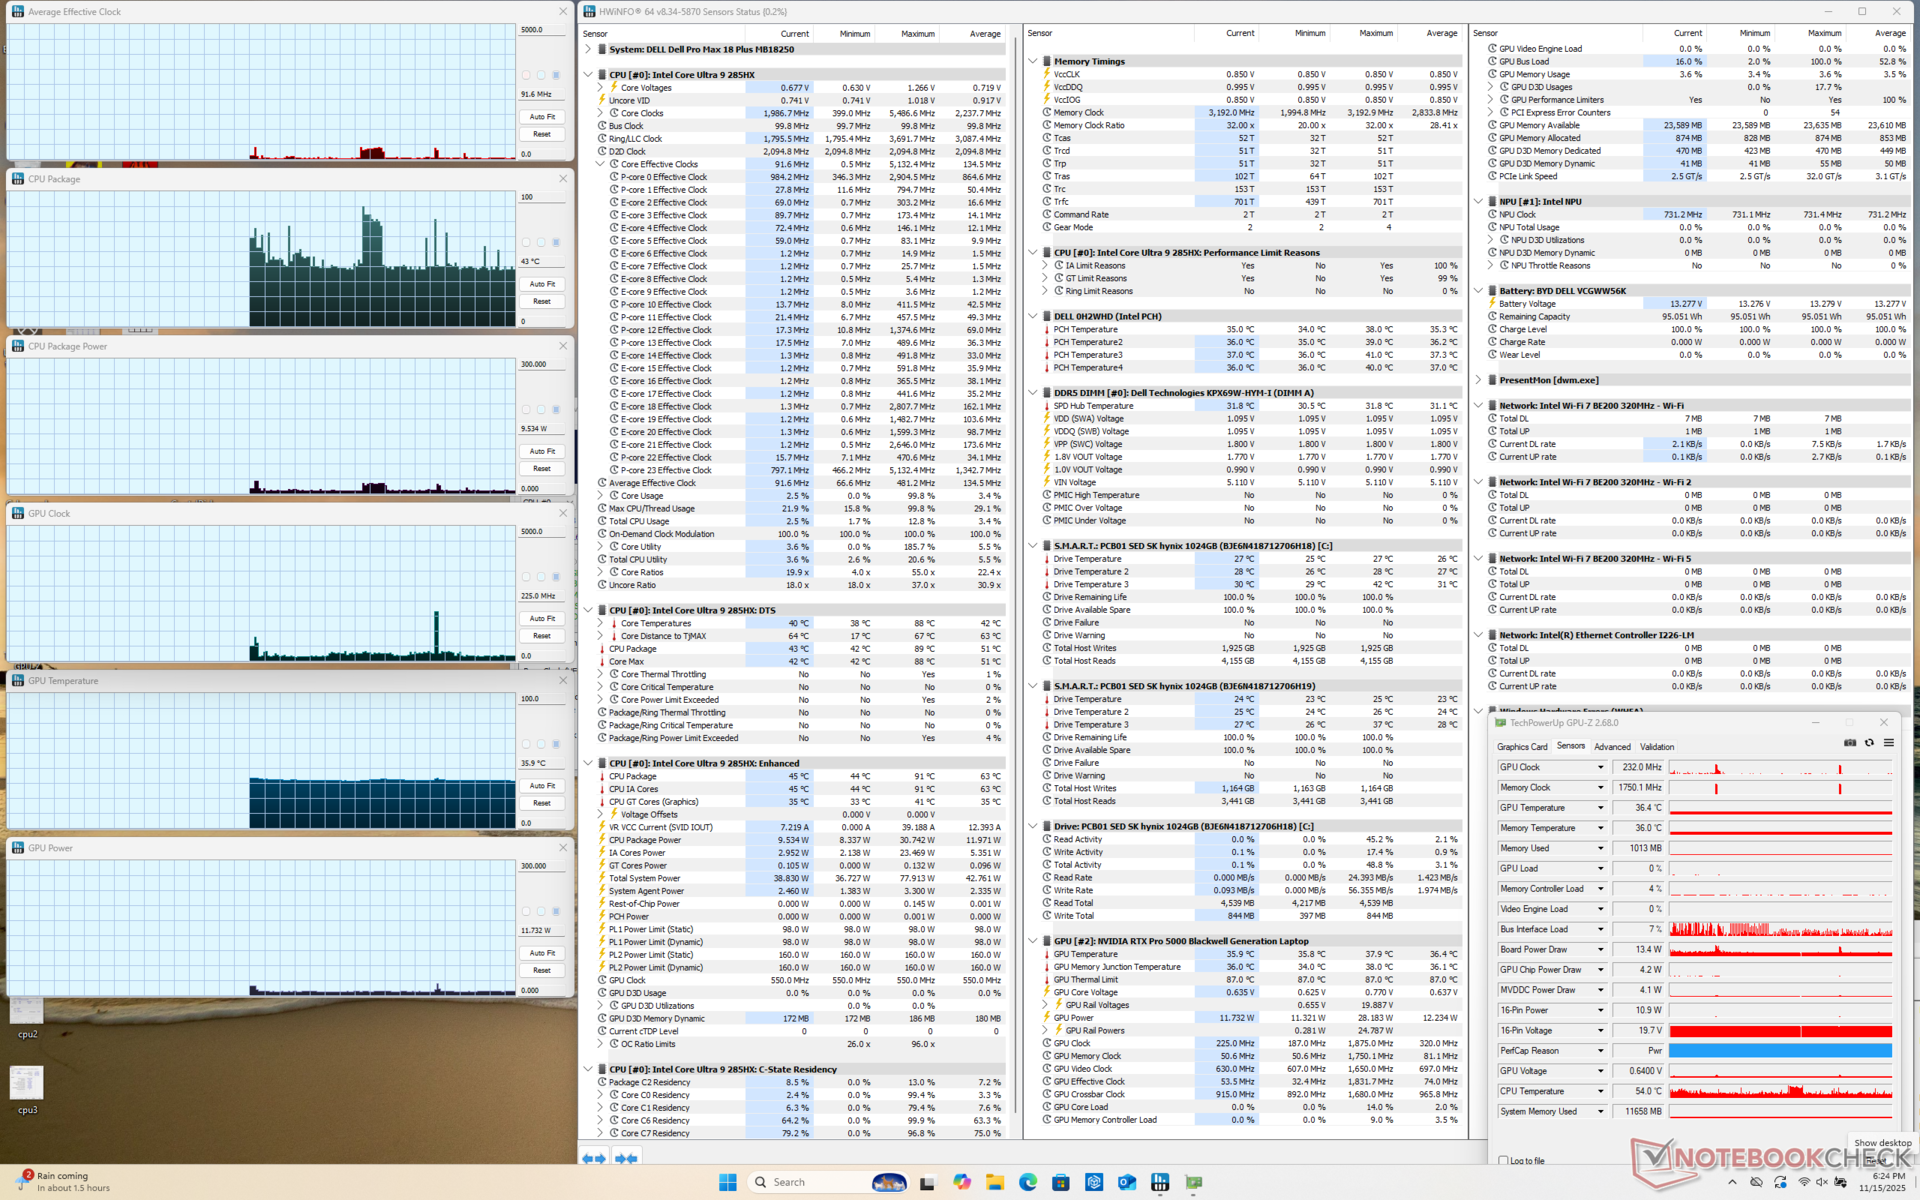
Observe que o consumo de energia da placa da GPU e as taxas de clock caem um pouco ao executar o modo Balanced em vez do modo Performance, conforme mostrado nas capturas de tela abaixo.
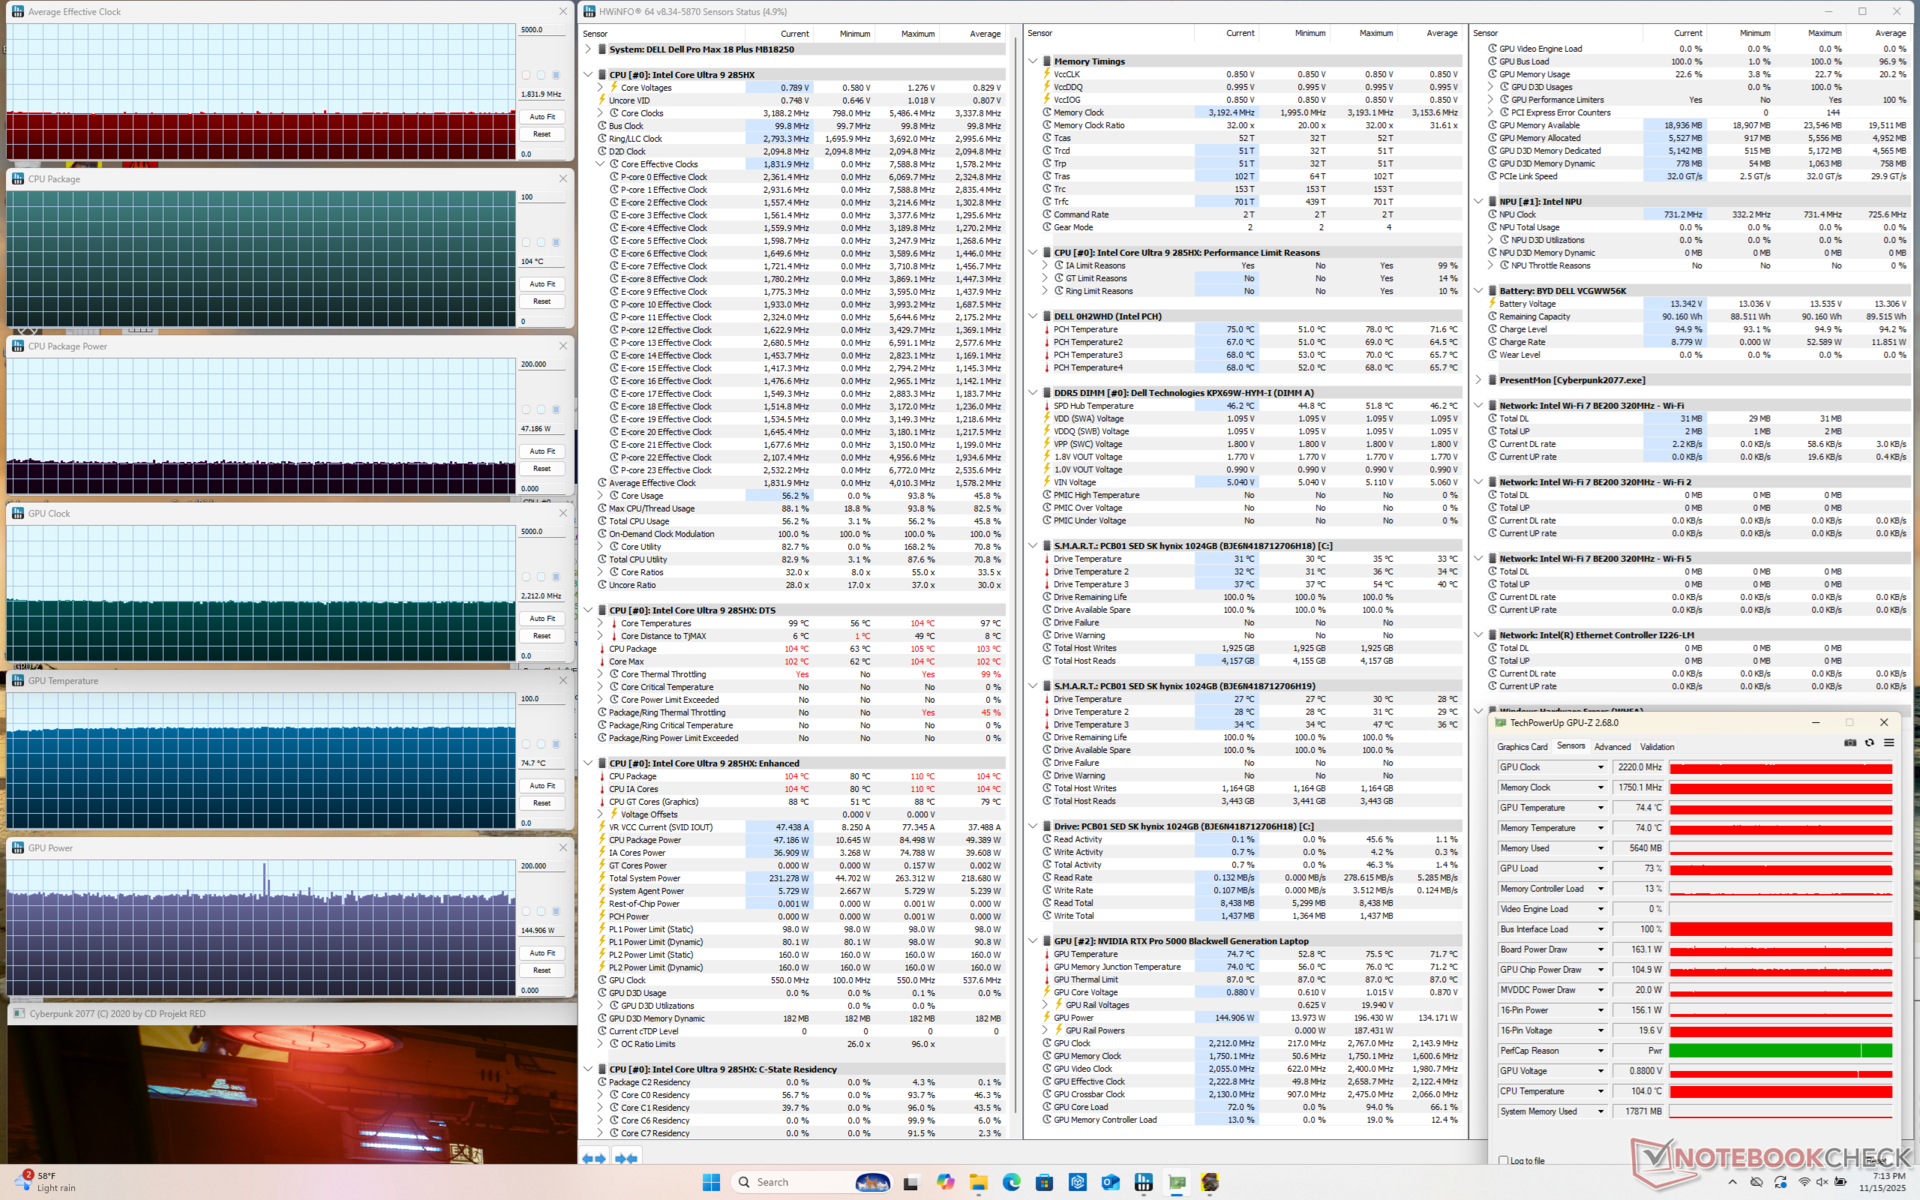
| Clock médio da CPU (GHz) | Clock da GPU (MHz) | Temperatura média da CPU (°C) | Temperatura média da GPU (°C) | |
| Sistema ocioso | -- | 225 | 43 | 36 |
| Estresse do Prime95 | 3.3 | -- | 99 | 49 |
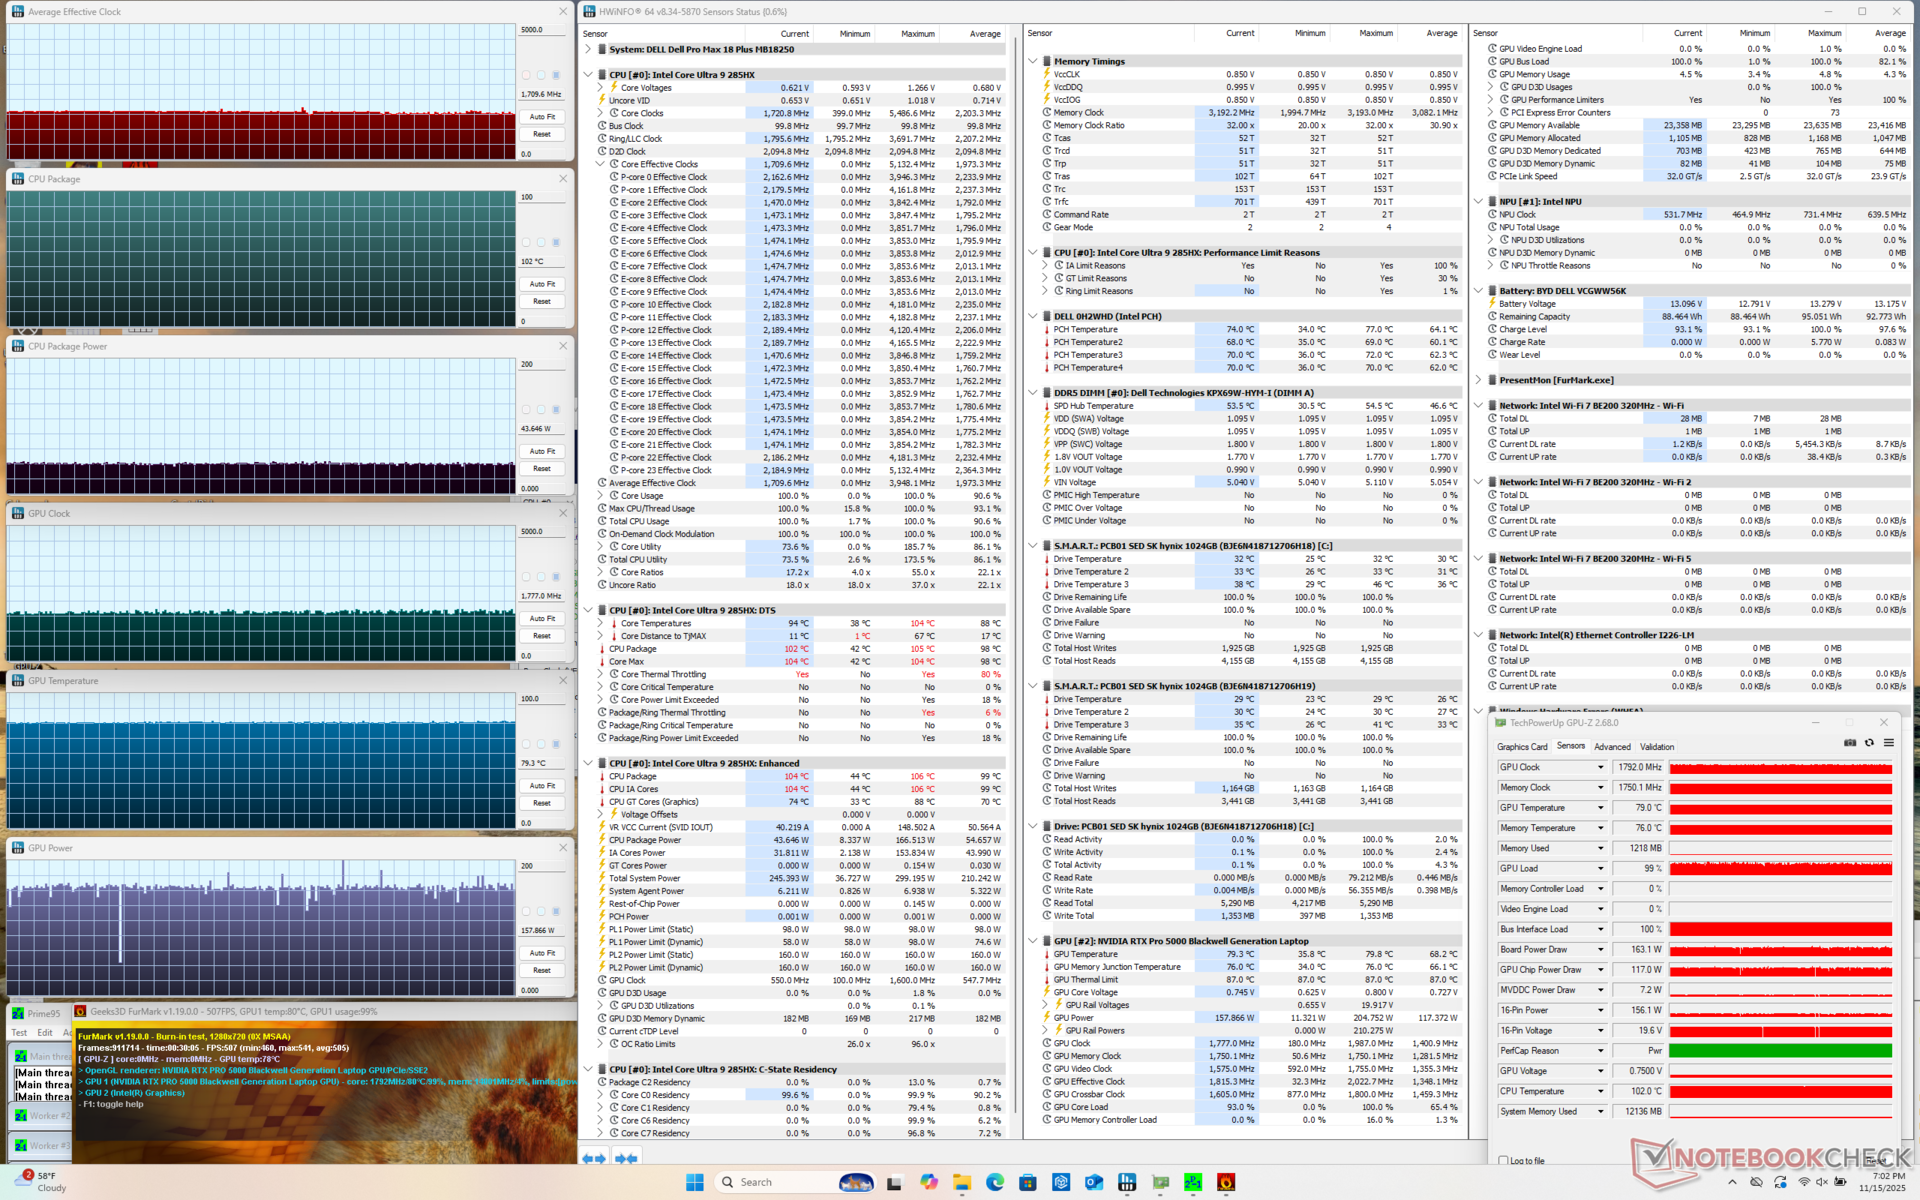
| Estresse Prime95 + FurMark | 1.7 | 1777 | 102 | 79 |
| Estresse do Cyberpunk 2077 (modo balanceado) | 1.8 | 2197 | 105 | 74 |
| Estresse do Cyberpunk 2077 (Modo de desempenho) | 1.8 | 2212 | 104 | 75 |
Desempenho do sistema
O PCMark 10 não foi concluído, independentemente das configurações da GPU e, portanto, suas pontuações não estão listadas abaixo.
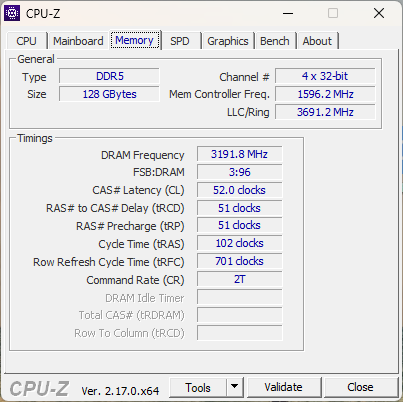
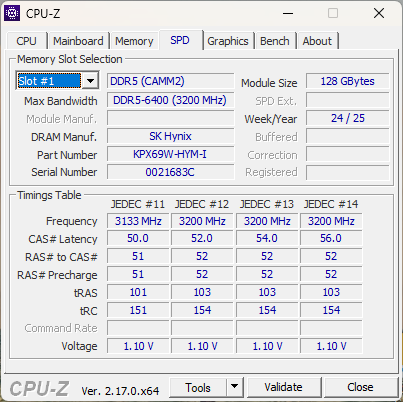
As pontuações de memória do AIDA64 são muito altas, especialmente para um notebook com 128 GB de RAM, devido ao fator de forma CAMM2. O novo padrão foi projetado para superar muitas das limitações do antigo conector SODIMM.
CrossMark: Overall | Productivity | Creativity | Responsiveness
WebXPRT 3: Overall
WebXPRT 4: Overall
Mozilla Kraken 1.1: Total
| Performance rating | |
| Dell Pro Max 18 Plus MB18250 | |
| Média Intel Core Ultra 9 285HX, NVIDIA RTX PRO 5000 Blackwell Generation Laptop | |
| Dell Pro Max 16 Plus | |
| Schenker Key 18 Pro M25 RTX 5090 | |
| HP ZBook X G1i 16 | |
| HP ZBook Studio 16 G11 | |
| Lenovo ThinkPad P16s Gen 4 21RX000YGE | |
| CrossMark / Overall | |
| Dell Pro Max 18 Plus MB18250 | |
| Dell Pro Max 16 Plus | |
| Média Intel Core Ultra 9 285HX, NVIDIA RTX PRO 5000 Blackwell Generation Laptop (2142 - 2267, n=3) | |
| Schenker Key 18 Pro M25 RTX 5090 | |
| HP ZBook X G1i 16 | |
| HP ZBook Studio 16 G11 | |
| Lenovo ThinkPad P16s Gen 4 21RX000YGE | |
| CrossMark / Productivity | |
| Média Intel Core Ultra 9 285HX, NVIDIA RTX PRO 5000 Blackwell Generation Laptop (2016 - 2028, n=3) | |
| Dell Pro Max 16 Plus | |
| Dell Pro Max 18 Plus MB18250 | |
| Schenker Key 18 Pro M25 RTX 5090 | |
| HP ZBook X G1i 16 | |
| HP ZBook Studio 16 G11 | |
| Lenovo ThinkPad P16s Gen 4 21RX000YGE | |
| CrossMark / Creativity | |
| Dell Pro Max 18 Plus MB18250 | |
| Dell Pro Max 16 Plus | |
| Média Intel Core Ultra 9 285HX, NVIDIA RTX PRO 5000 Blackwell Generation Laptop (2395 - 2725, n=3) | |
| HP ZBook X G1i 16 | |
| Schenker Key 18 Pro M25 RTX 5090 | |
| HP ZBook Studio 16 G11 | |
| Lenovo ThinkPad P16s Gen 4 21RX000YGE | |
| CrossMark / Responsiveness | |
| Schenker Key 18 Pro M25 RTX 5090 | |
| Dell Pro Max 18 Plus MB18250 | |
| Média Intel Core Ultra 9 285HX, NVIDIA RTX PRO 5000 Blackwell Generation Laptop (1806 - 1858, n=3) | |
| Dell Pro Max 16 Plus | |
| HP ZBook X G1i 16 | |
| HP ZBook Studio 16 G11 | |
| Lenovo ThinkPad P16s Gen 4 21RX000YGE | |
| WebXPRT 3 / Overall | |
| Dell Pro Max 18 Plus MB18250 | |
| Média Intel Core Ultra 9 285HX, NVIDIA RTX PRO 5000 Blackwell Generation Laptop (327 - 360, n=3) | |
| Schenker Key 18 Pro M25 RTX 5090 | |
| Dell Pro Max 16 Plus | |
| HP ZBook X G1i 16 | |
| Lenovo ThinkPad P16s Gen 4 21RX000YGE | |
| HP ZBook Studio 16 G11 | |
| WebXPRT 4 / Overall | |
| Schenker Key 18 Pro M25 RTX 5090 | |
| Média Intel Core Ultra 9 285HX, NVIDIA RTX PRO 5000 Blackwell Generation Laptop (306 - 323, n=3) | |
| Dell Pro Max 16 Plus | |
| Dell Pro Max 18 Plus MB18250 | |
| HP ZBook X G1i 16 | |
| HP ZBook Studio 16 G11 | |
| Lenovo ThinkPad P16s Gen 4 21RX000YGE | |
| Mozilla Kraken 1.1 / Total | |
| HP ZBook Studio 16 G11 | |
| Lenovo ThinkPad P16s Gen 4 21RX000YGE | |
| HP ZBook X G1i 16 | |
| Dell Pro Max 18 Plus MB18250 | |
| Dell Pro Max 16 Plus | |
| Média Intel Core Ultra 9 285HX, NVIDIA RTX PRO 5000 Blackwell Generation Laptop (411 - 439, n=3) | |
| Schenker Key 18 Pro M25 RTX 5090 | |
* ... menor é melhor
| AIDA64 / Memory Copy | |
| Dell Pro Max 16 Plus | |
| Dell Pro Max 18 Plus MB18250 | |
| Média Intel Core Ultra 9 285HX (63431 - 93933, n=6) | |
| HP ZBook Studio 16 G11 | |
| Lenovo ThinkPad P16s Gen 4 21RX000YGE | |
| Schenker Key 18 Pro M25 RTX 5090 | |
| AIDA64 / Memory Read | |
| Dell Pro Max 16 Plus | |
| Dell Pro Max 18 Plus MB18250 | |
| Lenovo ThinkPad P16s Gen 4 21RX000YGE | |
| Média Intel Core Ultra 9 285HX (67084 - 97565, n=6) | |
| HP ZBook Studio 16 G11 | |
| Schenker Key 18 Pro M25 RTX 5090 | |
| AIDA64 / Memory Write | |
| Dell Pro Max 18 Plus MB18250 | |
| Dell Pro Max 16 Plus | |
| Lenovo ThinkPad P16s Gen 4 21RX000YGE | |
| Média Intel Core Ultra 9 285HX (64112 - 89691, n=6) | |
| HP ZBook Studio 16 G11 | |
| Schenker Key 18 Pro M25 RTX 5090 | |
| AIDA64 / Memory Latency | |
| Schenker Key 18 Pro M25 RTX 5090 | |
| Média Intel Core Ultra 9 285HX (104.8 - 151.7, n=6) | |
| HP ZBook Studio 16 G11 | |
| Dell Pro Max 16 Plus | |
| Dell Pro Max 18 Plus MB18250 | |
| Lenovo ThinkPad P16s Gen 4 21RX000YGE | |
* ... menor é melhor
Latência DPC
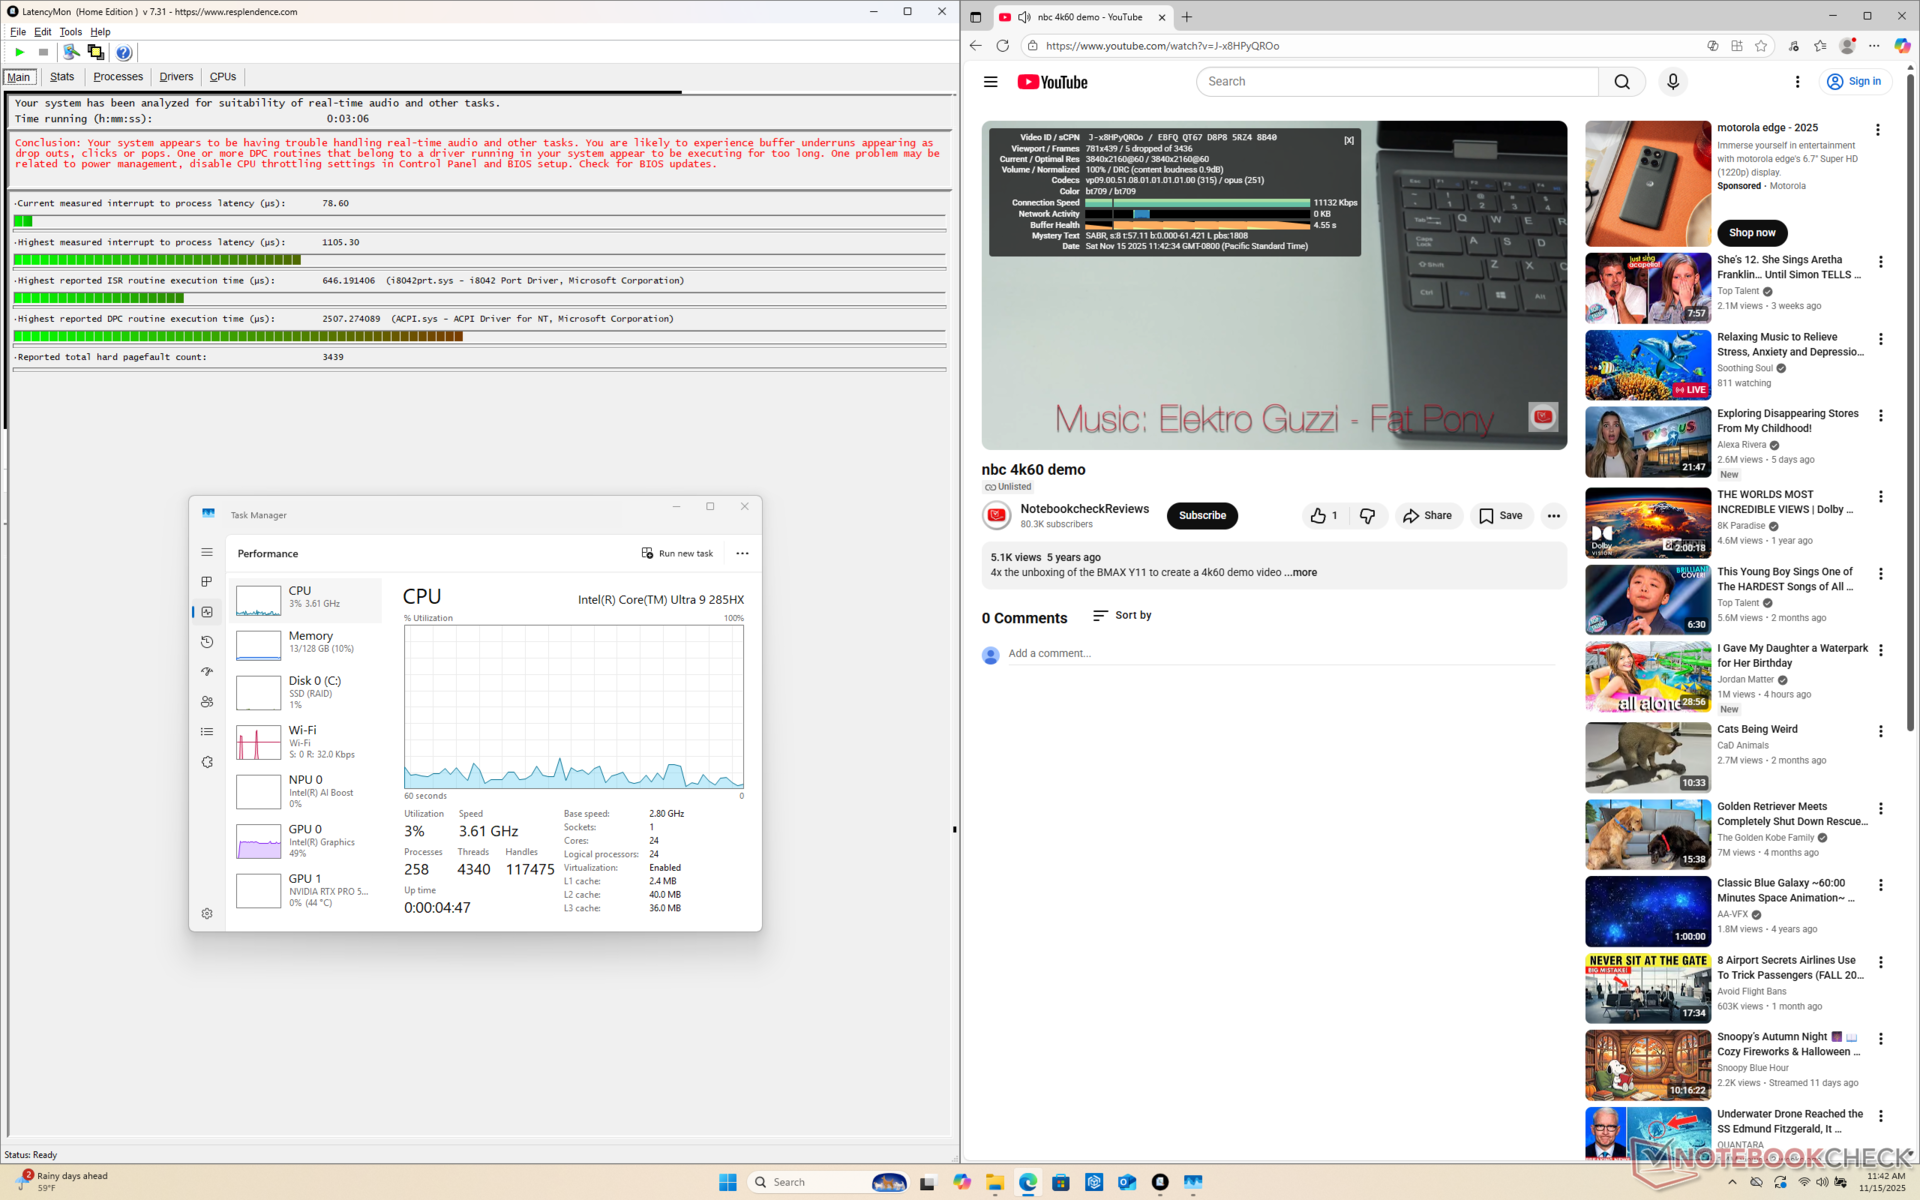
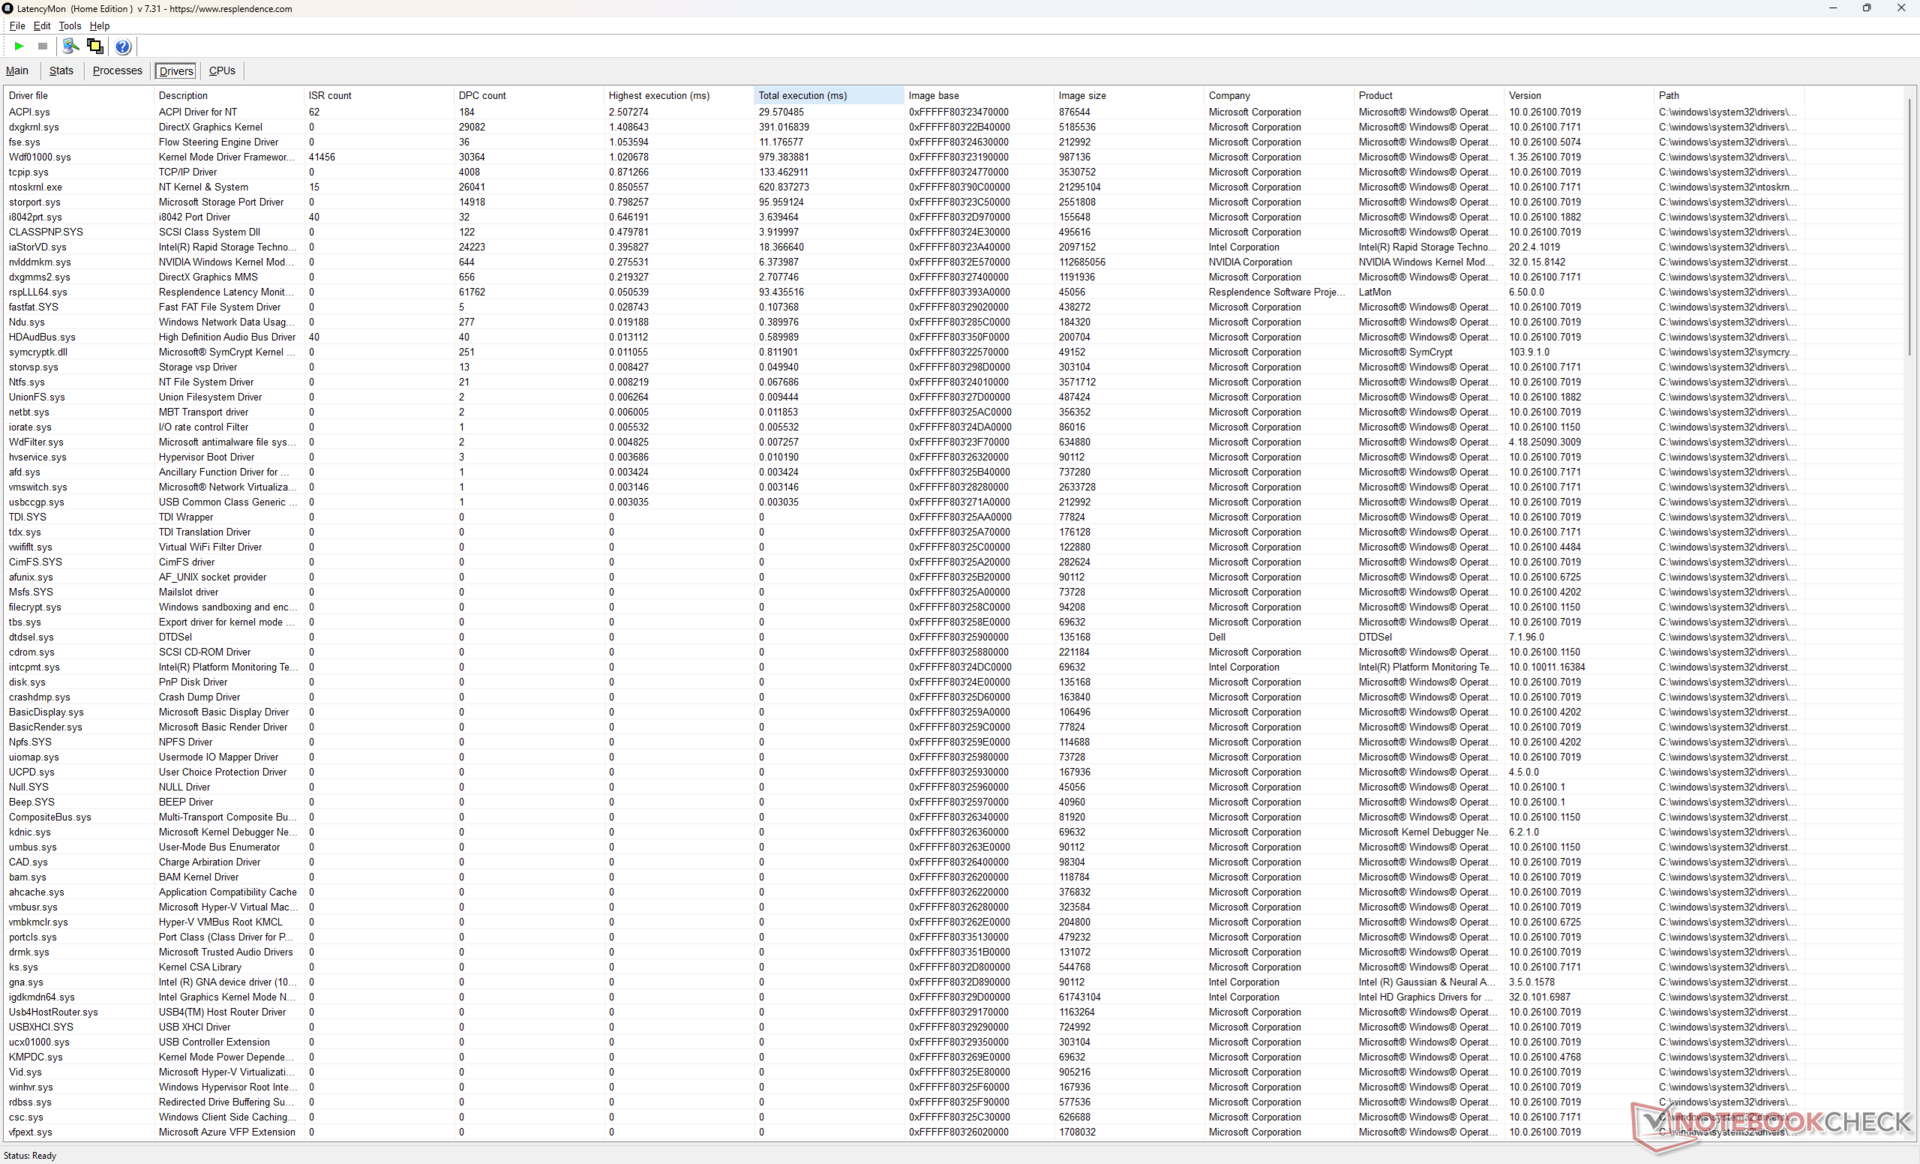
| DPC Latencies / LatencyMon - interrupt to process latency (max), Web, Youtube, Prime95 | |
| Schenker Key 18 Pro M25 RTX 5090 | |
| Dell Pro Max 16 Plus | |
| HP ZBook Studio 16 G11 | |
| Dell Pro Max 18 Plus MB18250 | |
| Lenovo ThinkPad P16s Gen 4 21RX000YGE | |
| HP ZBook X G1i 16 | |
* ... menor é melhor
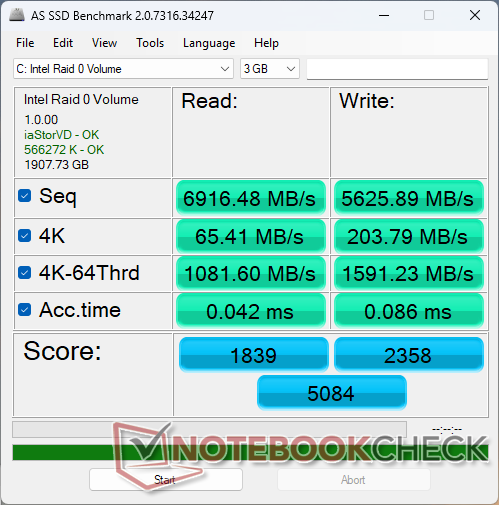
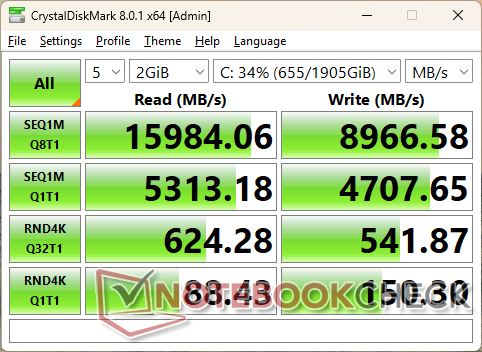
Dispositivos de armazenamento
Nossa unidade de teste funciona com dois SK hynix PCB01 PCIe5 da SK hynix em configuração RAID 0. Uma única unidade pode atingir taxas de transferência de aproximadamente 16.000 MB/s, embora apenas por alguns minutos de cada vez, de acordo com os resultados do teste de loop do DiskSpd abaixo.

| Drive Performance rating - Percent | |
| Schenker Key 18 Pro M25 RTX 5090 | |
| HP ZBook X G1i 16 | |
| Dell Pro Max 16 Plus | |
| Dell Pro Max 18 Plus MB18250 | |
| Lenovo ThinkPad P16s Gen 4 21RX000YGE | |
| HP ZBook Studio 16 G11 | |
* ... menor é melhor
Limitação de disco: Loop de leitura do DiskSpd, profundidade da fila 8
Desempenho da GPU
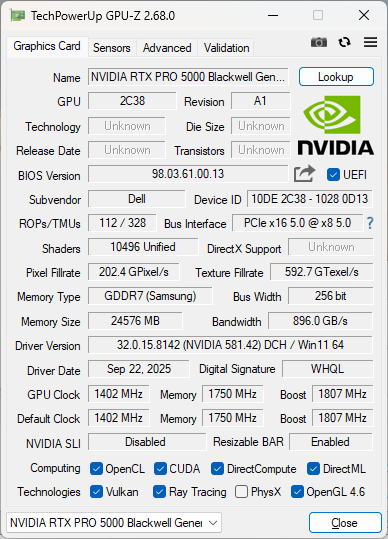
O desempenho gráfico é ligeiramente mais rápido, em apenas alguns pontos percentuais, do que no Dell Pro Max 16 Plus equipado com a mesma GPU. O consumo de energia da placa da GPU é, em média, de 163 W no modo Performance, o que está próximo do máximo de 175 W.
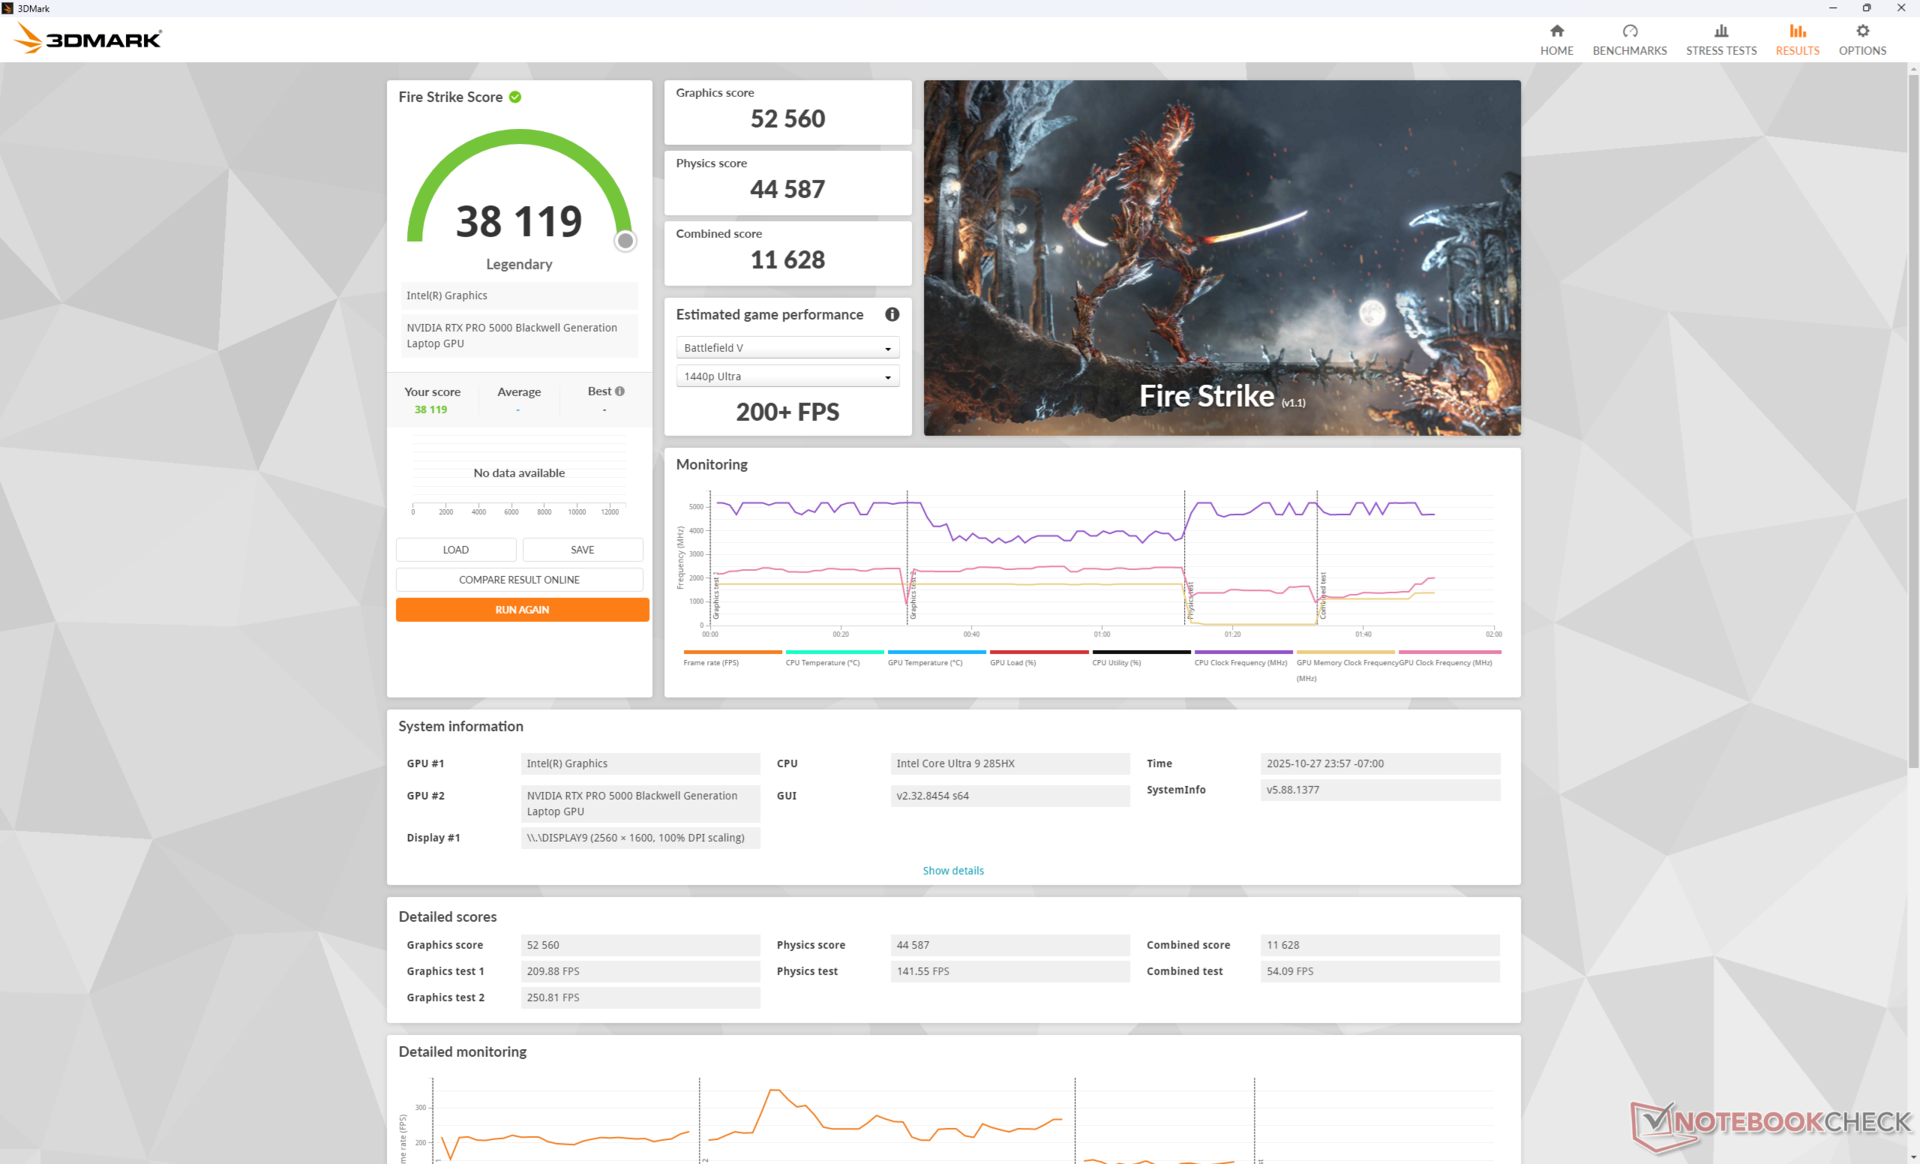
| Perfil de energia | Pontuação de gráficos | Pontuação de física | Pontuação combinada |
| Modo de desempenho | 52560 | 44587 | 11628 |
| Modo equilibrado | 47593 (-10%) | 47039 (+6%) | 11029 (-5%) |
| Energia da bateria | 22941 (-56%) | 32131 (-28%) | 6944 (-40%) |
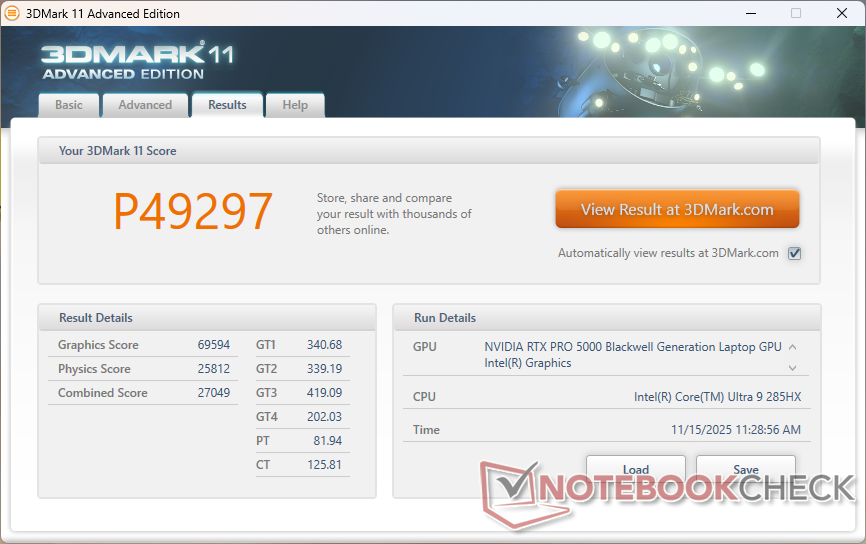
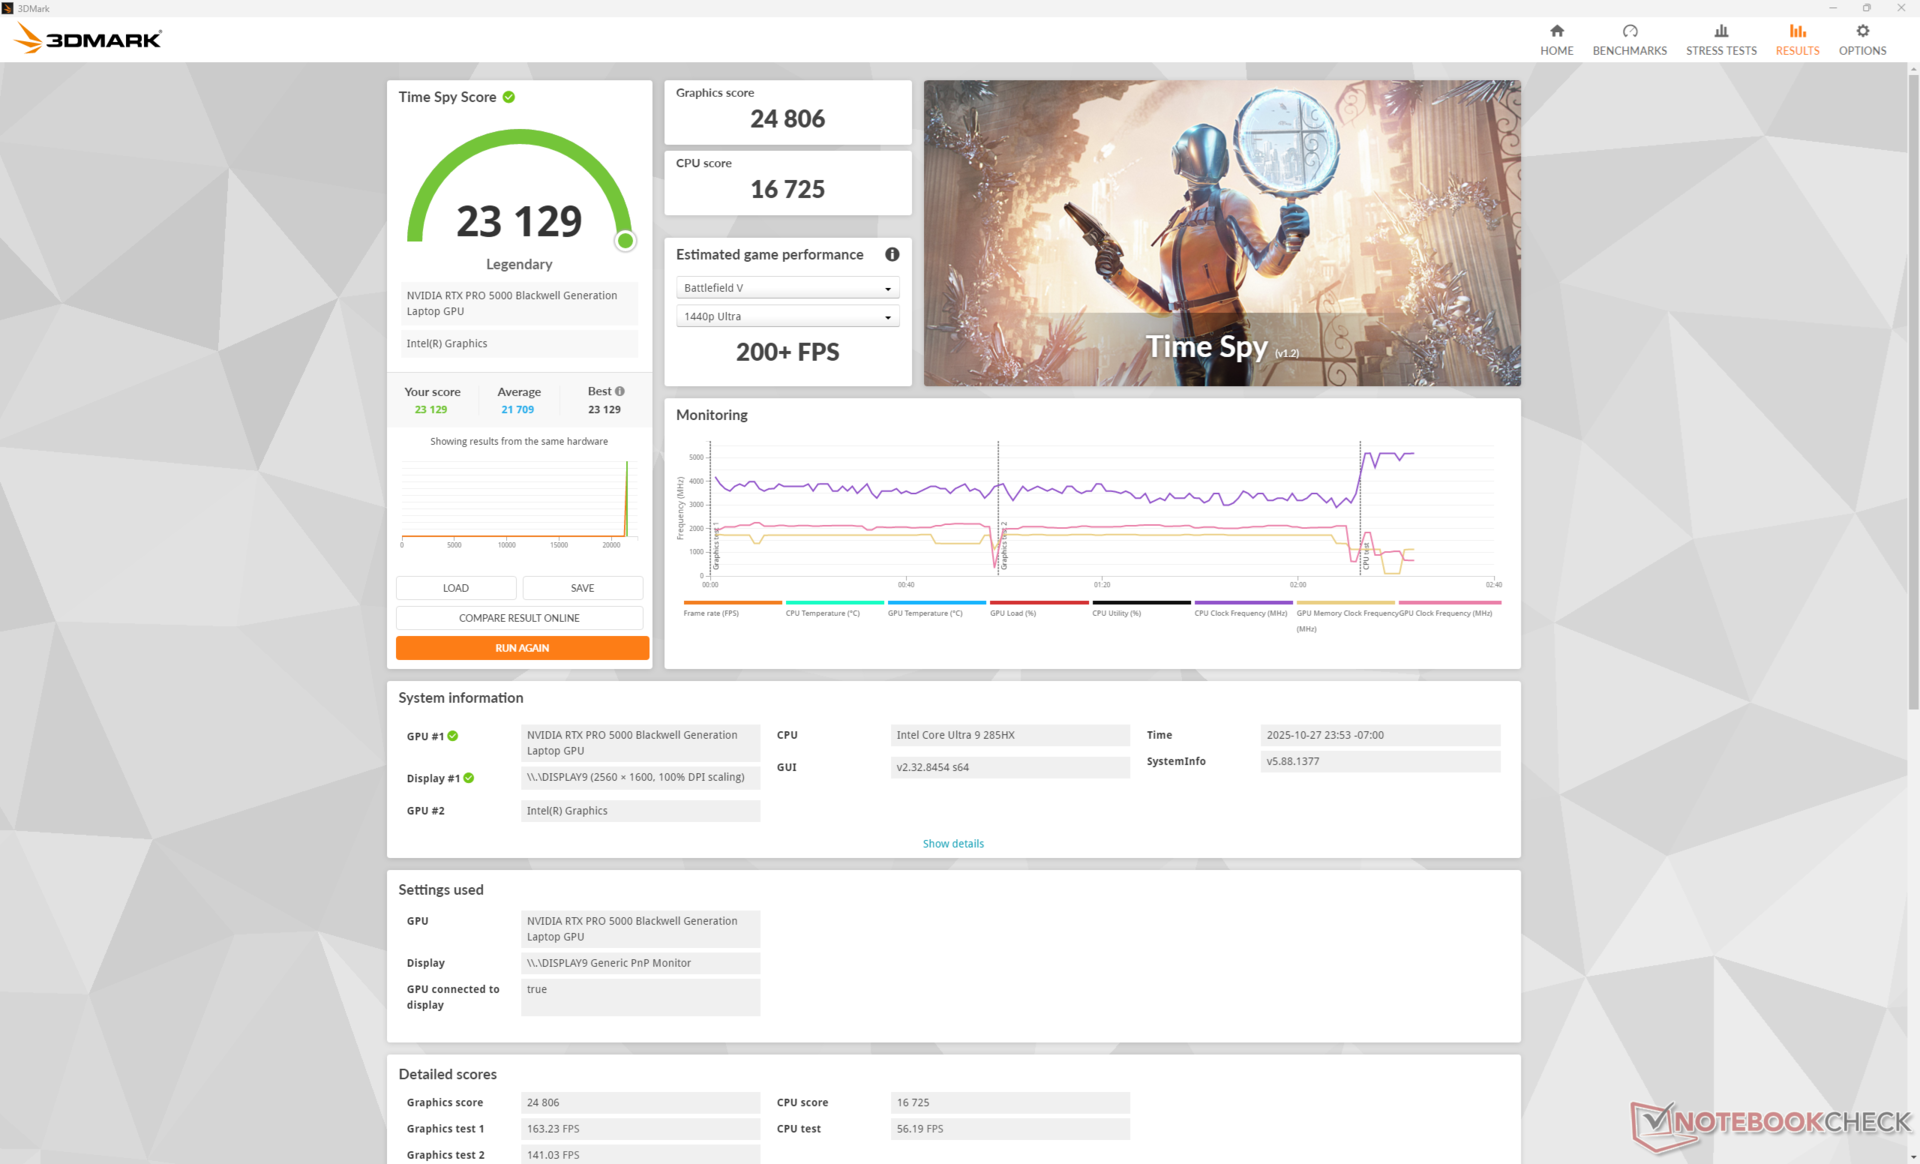
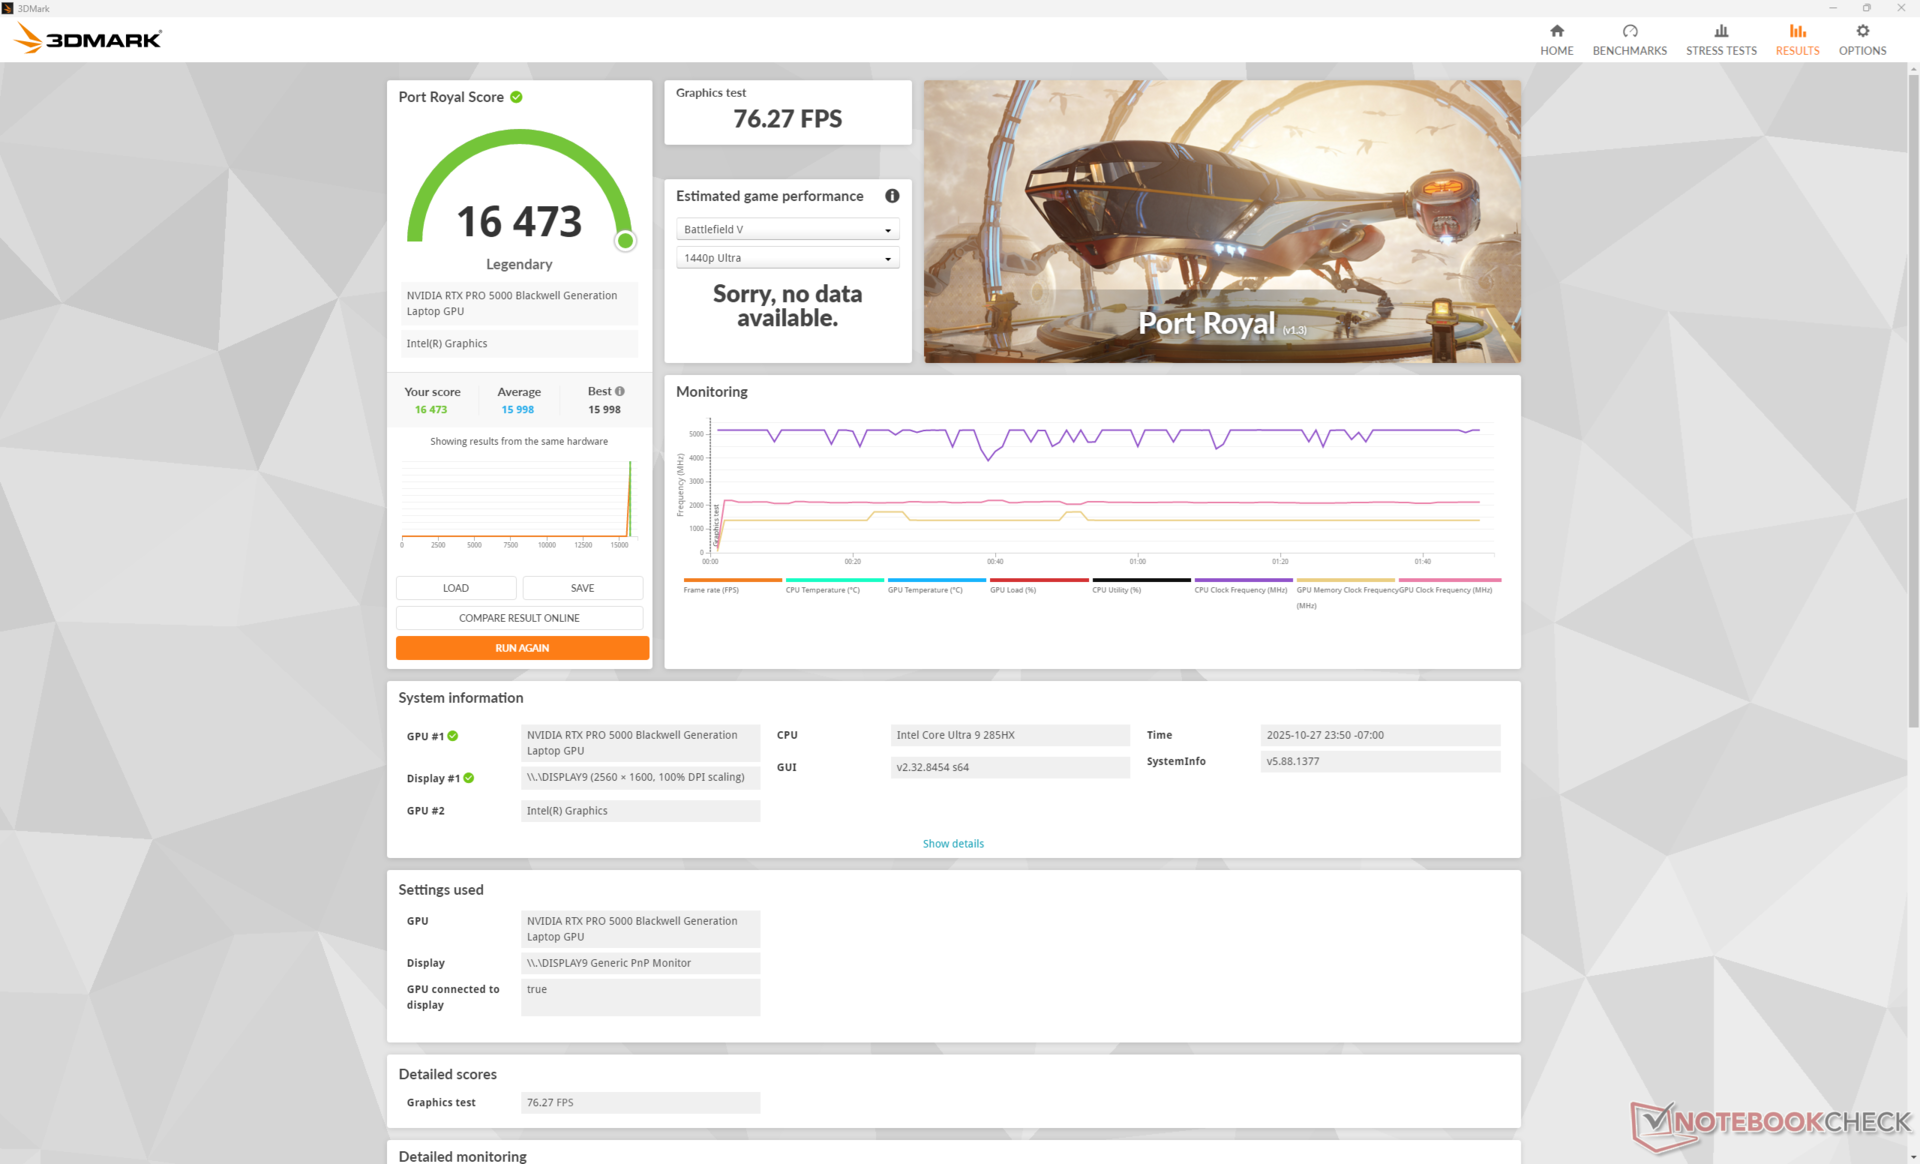
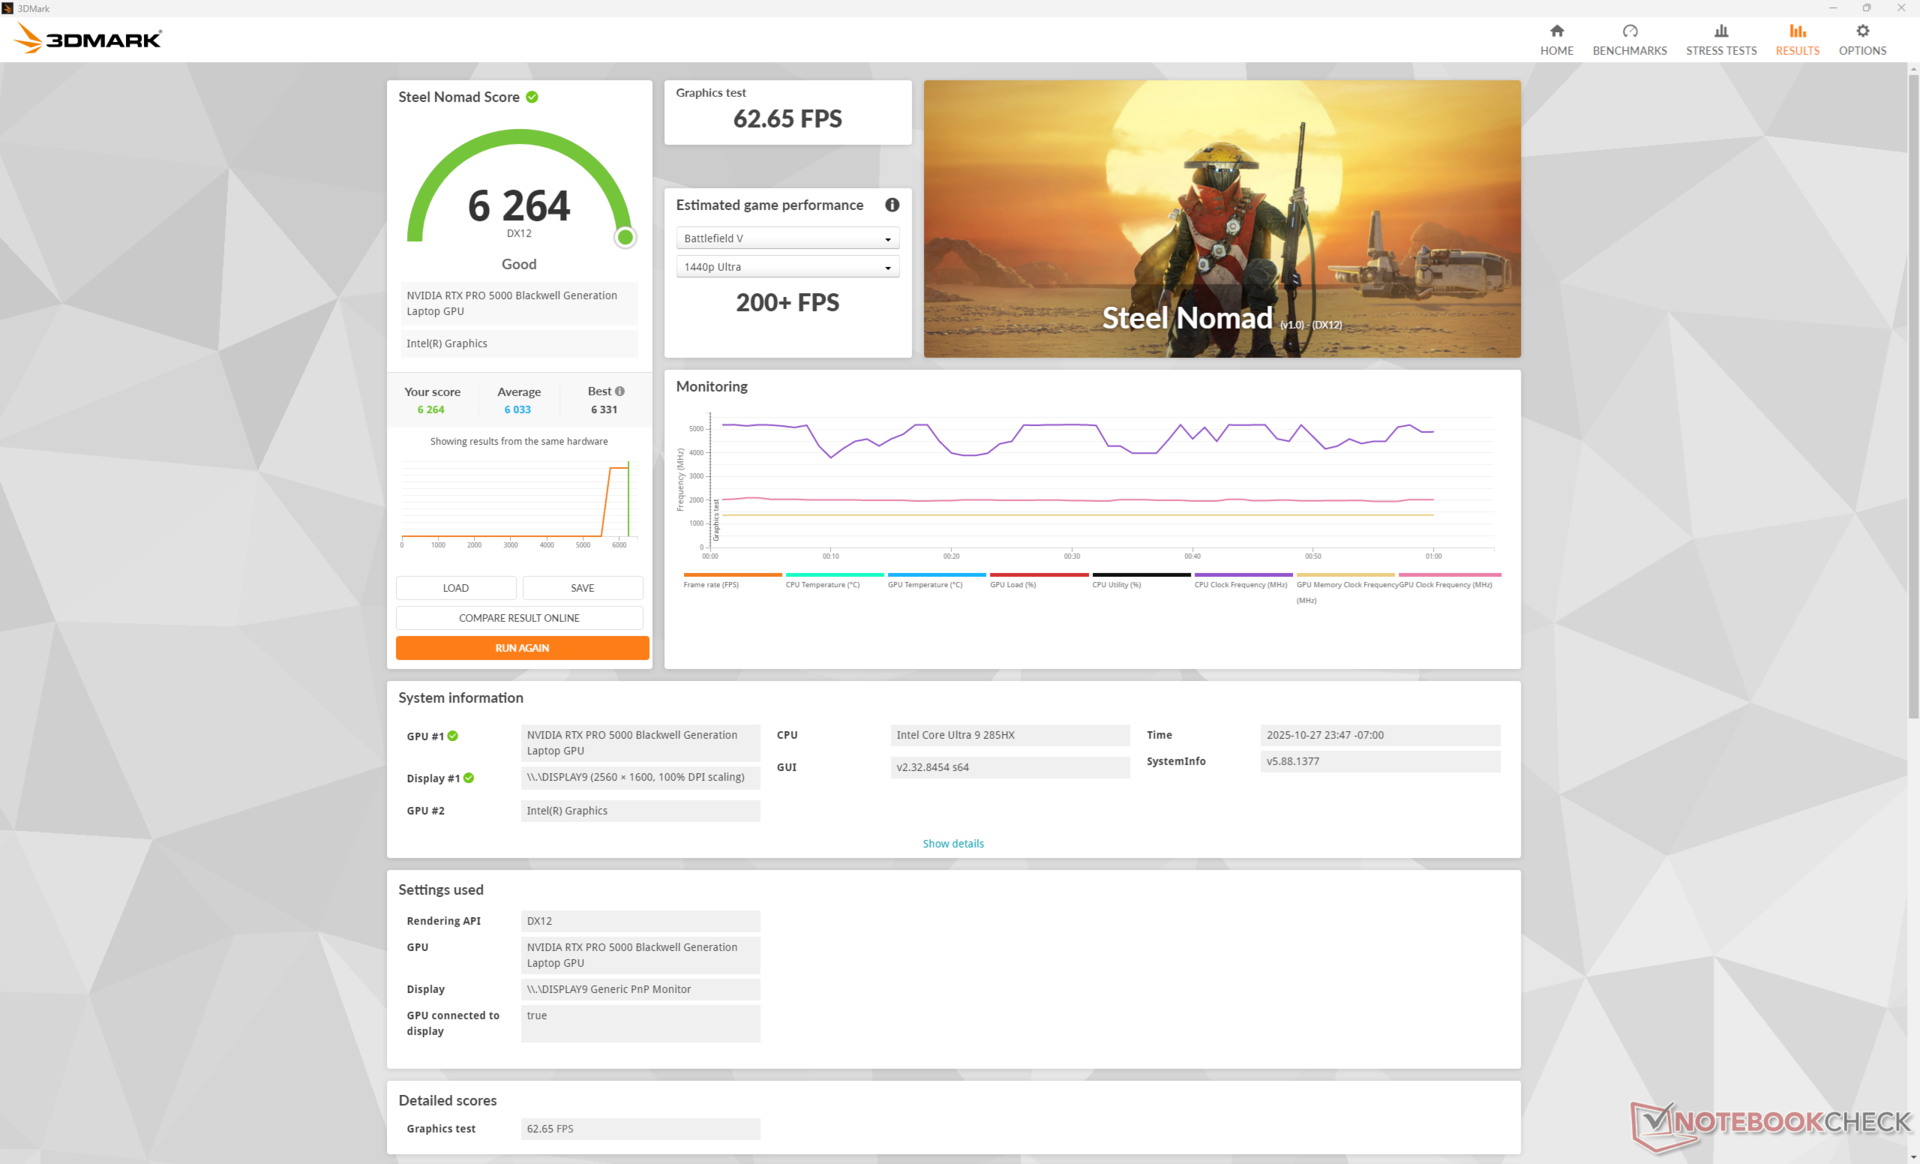
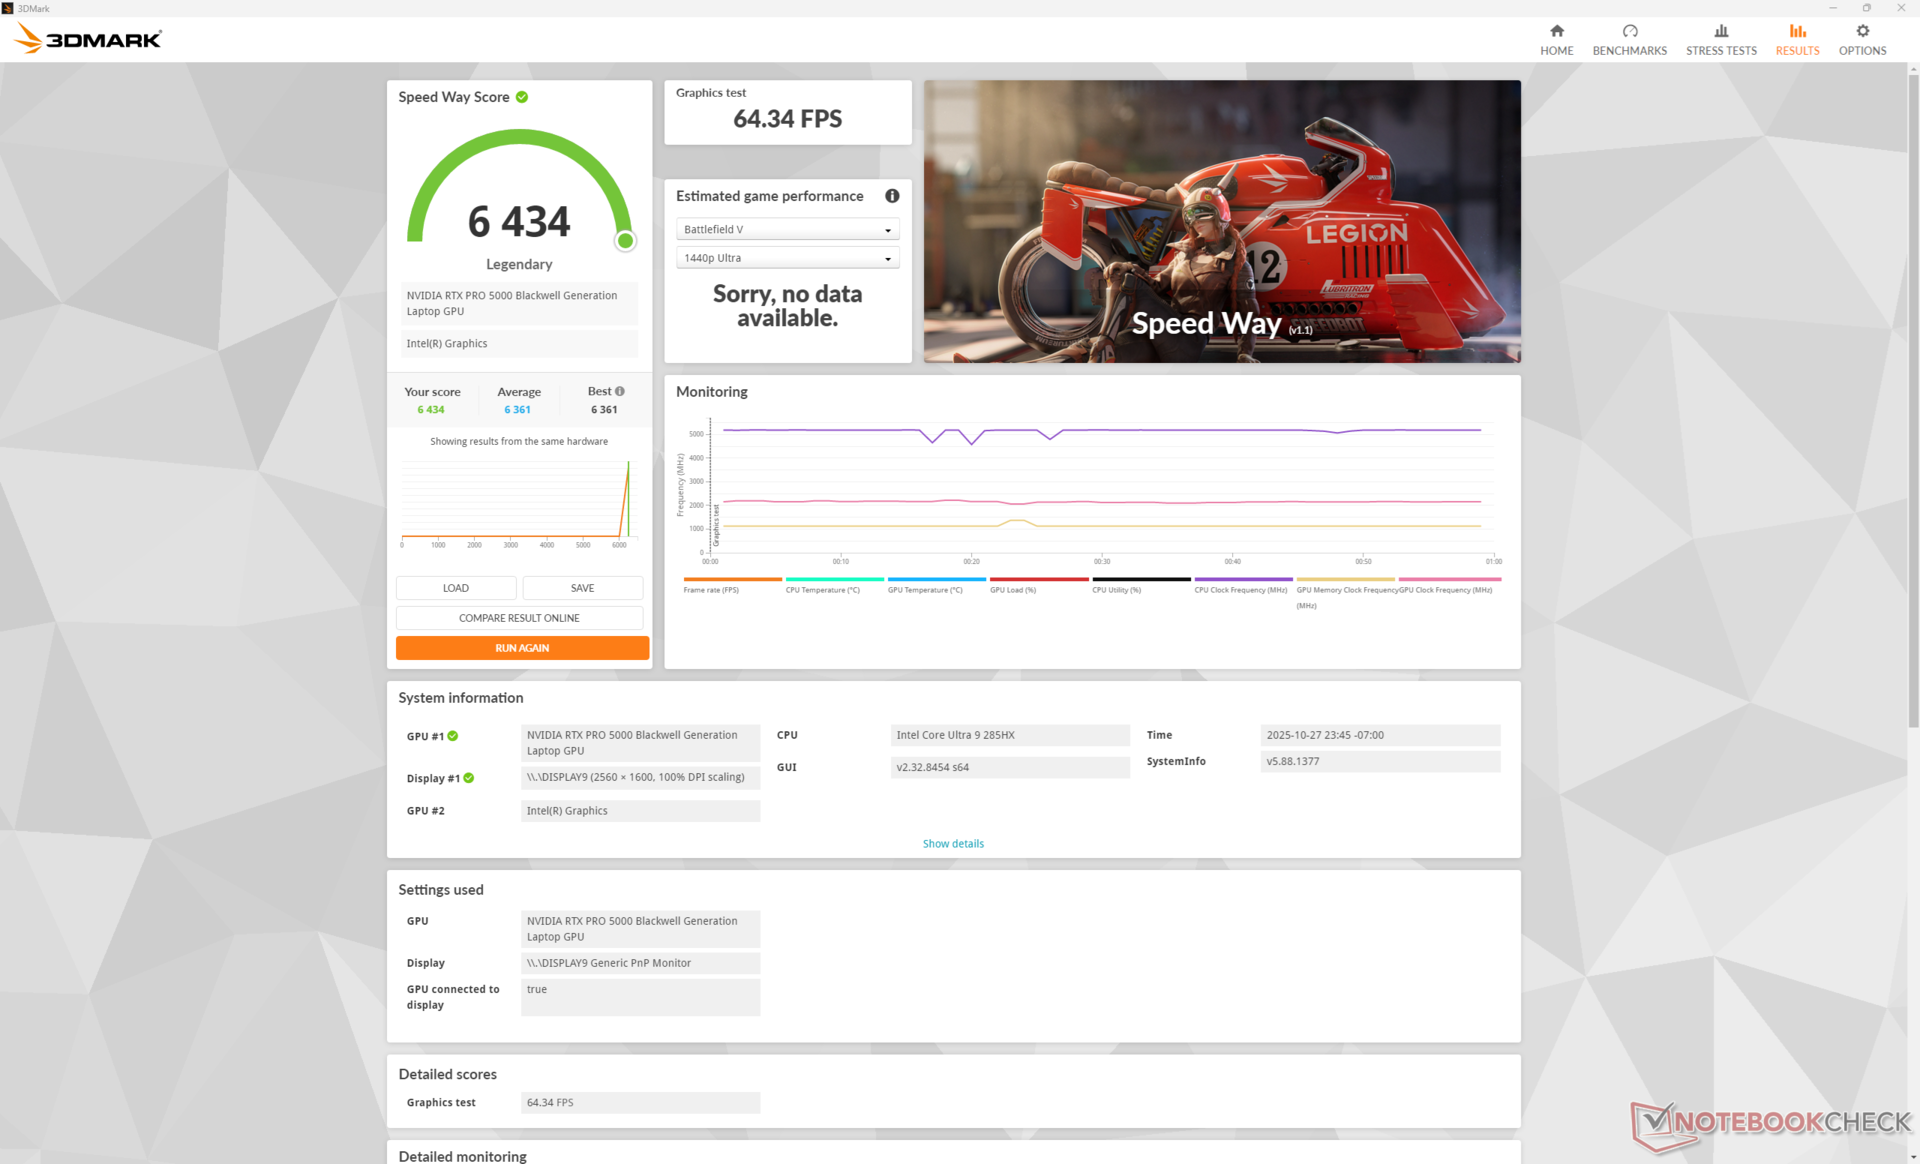
| 3DMark 11 Performance | 49297 pontos | |
| 3DMark Cloud Gate Standard Score | 67936 pontos | |
| 3DMark Fire Strike Score | 38119 pontos | |
| 3DMark Time Spy Score | 23129 pontos | |
| 3DMark Steel Nomad Score | 6264 pontos | |
Ajuda | ||
* ... menor é melhor
| Performance rating - Percent | |
| Dell Pro Max 18 Plus MB18250 | |
| Schenker Key 18 Pro M25 RTX 5090 | |
| Dell Pro Max 16 Plus | |
| HP ZBook X G1i 16 | |
| HP ZBook Studio 16 G11 | |
| Lenovo ThinkPad P16s Gen 4 21RX000YGE -1! | |
| Cyberpunk 2077 - 1920x1080 Ultra Preset (FSR off) | |
| Dell Pro Max 18 Plus MB18250 | |
| Schenker Key 18 Pro M25 RTX 5090 | |
| Dell Pro Max 16 Plus | |
| HP ZBook X G1i 16 | |
| HP ZBook Studio 16 G11 | |
| Lenovo ThinkPad P16s Gen 4 21RX000YGE | |
| Baldur's Gate 3 - 1920x1080 Ultra Preset AA:T | |
| Dell Pro Max 18 Plus MB18250 | |
| Dell Pro Max 16 Plus | |
| Schenker Key 18 Pro M25 RTX 5090 | |
| HP ZBook Studio 16 G11 | |
| HP ZBook X G1i 16 | |
| Lenovo ThinkPad P16s Gen 4 21RX000YGE | |
| GTA V - 1920x1080 Highest AA:4xMSAA + FX AF:16x | |
| Dell Pro Max 18 Plus MB18250 | |
| Schenker Key 18 Pro M25 RTX 5090 | |
| Dell Pro Max 16 Plus | |
| HP ZBook X G1i 16 | |
| HP ZBook Studio 16 G11 | |
| Lenovo ThinkPad P16s Gen 4 21RX000YGE | |
| Final Fantasy XV Benchmark - 1920x1080 High Quality | |
| Dell Pro Max 18 Plus MB18250 | |
| Dell Pro Max 16 Plus | |
| Schenker Key 18 Pro M25 RTX 5090 | |
| HP ZBook X G1i 16 | |
| HP ZBook Studio 16 G11 | |
| Lenovo ThinkPad P16s Gen 4 21RX000YGE | |
| Strange Brigade - 1920x1080 ultra AA:ultra AF:16 | |
| Dell Pro Max 18 Plus MB18250 | |
| Schenker Key 18 Pro M25 RTX 5090 | |
| Dell Pro Max 16 Plus | |
| HP ZBook Studio 16 G11 | |
| HP ZBook X G1i 16 | |
| Dota 2 Reborn - 1920x1080 ultra (3/3) best looking | |
| Dell Pro Max 16 Plus | |
| Dell Pro Max 18 Plus MB18250 | |
| Schenker Key 18 Pro M25 RTX 5090 | |
| HP ZBook Studio 16 G11 | |
| HP ZBook X G1i 16 | |
| Lenovo ThinkPad P16s Gen 4 21RX000YGE | |
| X-Plane 11.11 - 1920x1080 high (fps_test=3) | |
| Dell Pro Max 18 Plus MB18250 | |
| Dell Pro Max 16 Plus | |
| Schenker Key 18 Pro M25 RTX 5090 | |
| HP ZBook Studio 16 G11 | |
| HP ZBook X G1i 16 | |
| Lenovo ThinkPad P16s Gen 4 21RX000YGE | |
| Dota 2 Reborn - 3840x2160 ultra (3/3) best looking | |
| HP ZBook Fury 16 G10 | |
| Schenker Key 18 Pro M25 RTX 5090 | |
| Dell Pro Max 18 Plus MB18250 | |
| Média NVIDIA RTX PRO 5000 Blackwell Generation Laptop (143.9 - 149.4, n=3) | |
| Dell Pro Max 16 Plus | |
| Dell Precision 7000 7670 Performance | |
Gráfico de ultra FPS do Cyberpunk 2077
| baixo | média | alto | ultra | QHD DLSS | QHD | 4K DLSS | 4K FSR | 4K | |
|---|---|---|---|---|---|---|---|---|---|
| GTA V (2015) | 186.7 | 185.8 | 178.3 | 156.1 | 152.6 | ||||
| Dota 2 Reborn (2015) | 219 | 179.8 | 182 | 163.9 | 149.4 | ||||
| Final Fantasy XV Benchmark (2018) | 233 | 232 | 197.6 | 156.9 | 101.5 | ||||
| X-Plane 11.11 (2018) | 154.4 | 133.2 | 104.2 | 94.4 | |||||
| Strange Brigade (2018) | 548 | 442 | 426 | 418 | 351 | 188.7 | |||
| Baldur's Gate 3 (2023) | 253 | 238 | 212 | 205 | 198.2 | 150.3 | 126.3 | 85.9 | |
| Cyberpunk 2077 (2023) | 176 | 174.3 | 161.4 | 152.4 | 130.3 | 116.7 | |||
| F1 24 (2024) | 338 | 322 | 322 | 147.7 | 148.6 | 101.8 | 85.7 | 83.6 | 50.2 |
Emissões
Ruído do sistema
As três ventoinhas internas estão quase sempre ativas e, portanto, o sistema nunca é realmente silencioso na maioria dos casos. Mesmo assim, elas são quase inaudíveis em um escritório típico durante a maioria das cargas de trabalho baixas ou médias e não se tornam perceptíveis até que cargas muito mais altas sejam introduzidas. Conseguimos atingir quase 54 dB(A) ao executar jogos ou cargas semelhantes no modo Balanced ou no modo Performance.
Talvez não por acaso, o comportamento e as medições da ventoinha são muito semelhantes aos que registramos no Dell Pro Max 16 Plus.
Barulho
| Ocioso |
| 27.1 / 27.1 / 27.1 dB |
| Carga |
| 38 / 53.8 dB |
 | ||
30 dB silencioso 40 dB(A) audível 50 dB(A) ruidosamente alto |
||
min: | ||
| Dell Pro Max 18 Plus MB18250 Ultra 9 285HX, RTX PRO 5000 Blackwell Generation Laptop | Schenker Key 18 Pro M25 RTX 5090 Ultra 9 275HX, GeForce RTX 5090 Laptop | HP ZBook X G1i 16 Ultra 7 265H, RTX PRO 2000 Blackwell Generation Laptop | HP ZBook Studio 16 G11 Ultra 9 185H, RTX 3000 Ada Generation Laptop | Lenovo ThinkPad P16s Gen 4 21RX000YGE Ryzen AI 9 HX PRO 370, Radeon 890M | Dell Pro Max 16 Plus Ultra 9 285HX, RTX PRO 5000 Blackwell Generation Laptop | |
|---|---|---|---|---|---|---|
| Noise | -3% | 9% | 6% | -0% | -6% | |
| desligado / ambiente * (dB) | 23.1 | 23.9 -3% | 23.7 -3% | 23.8 -3% | 25.9 -12% | 23.2 -0% |
| Idle Minimum * (dB) | 27.1 | 25.2 7% | 23.7 13% | 23.8 12% | 25.9 4% | 26.7 1% |
| Idle Average * (dB) | 27.1 | 25.2 7% | 23.7 13% | 26.4 3% | 25.9 4% | 30.5 -13% |
| Idle Maximum * (dB) | 27.1 | 25.2 7% | 23.7 13% | 26.4 3% | 28.5 -5% | 34 -25% |
| Load Average * (dB) | 38 | 47.8 -26% | 32.7 14% | 33.7 11% | 42.9 -13% | 39.8 -5% |
| Cyberpunk 2077 ultra * (dB) | 53.8 | 54.4 -1% | 50.9 5% | 46.1 14% | 48.7 9% | 54.3 -1% |
| Load Maximum * (dB) | 53.8 | 58.6 -9% | 48 11% | 53.2 1% | 48.5 10% | 54.3 -1% |
* ... menor é melhor
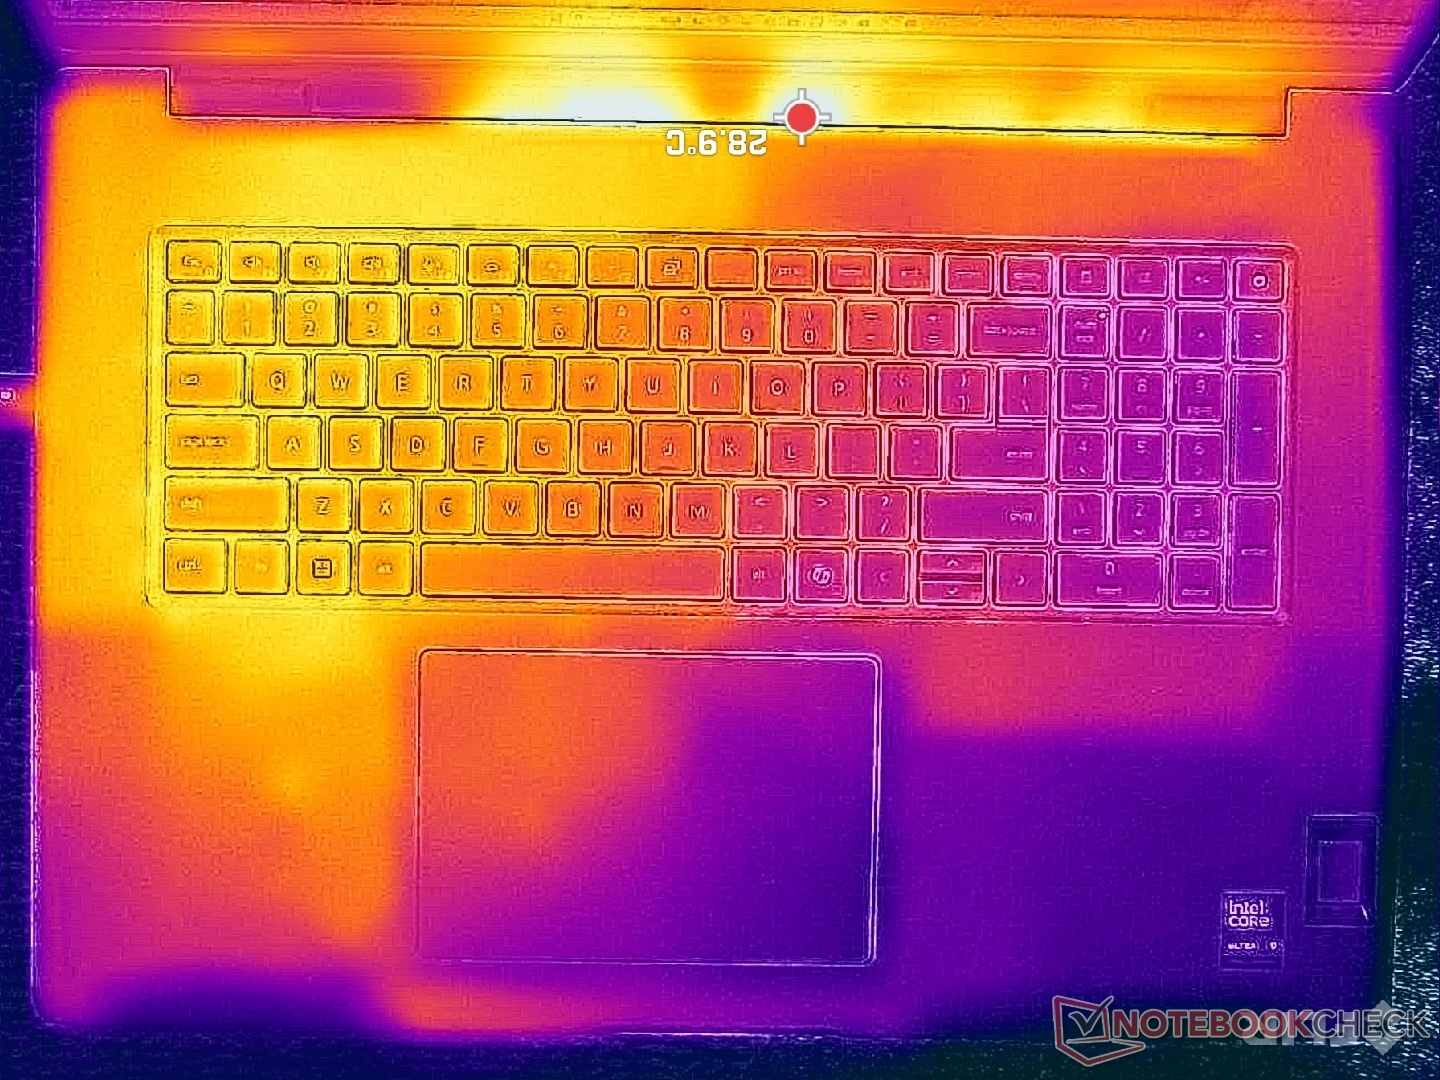
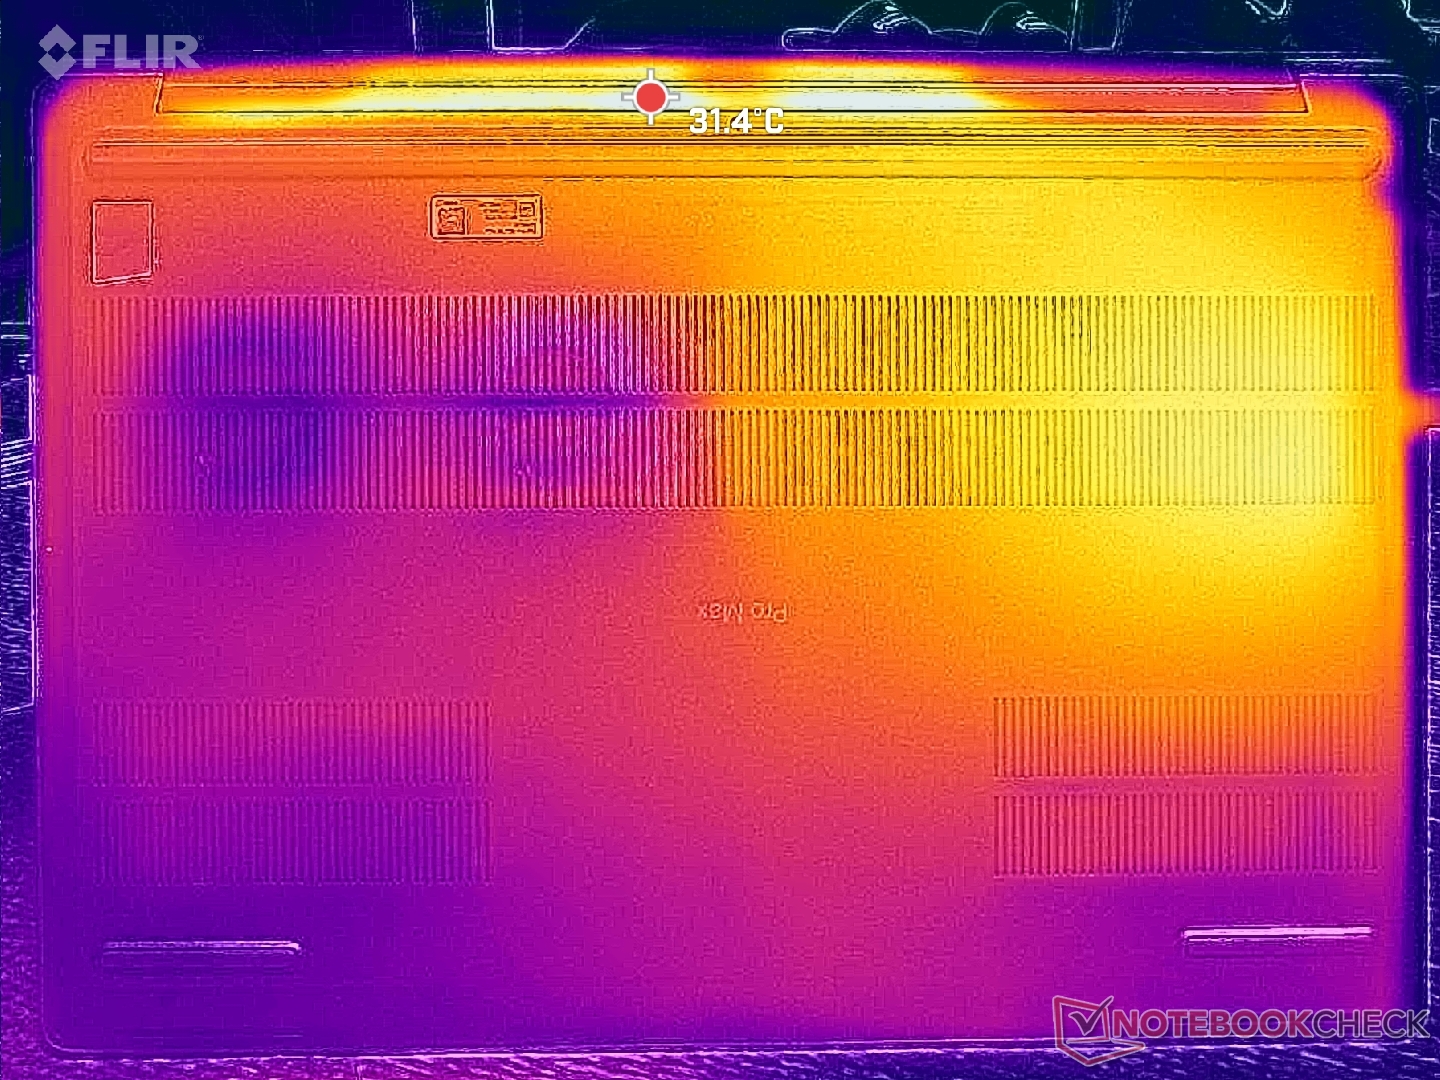
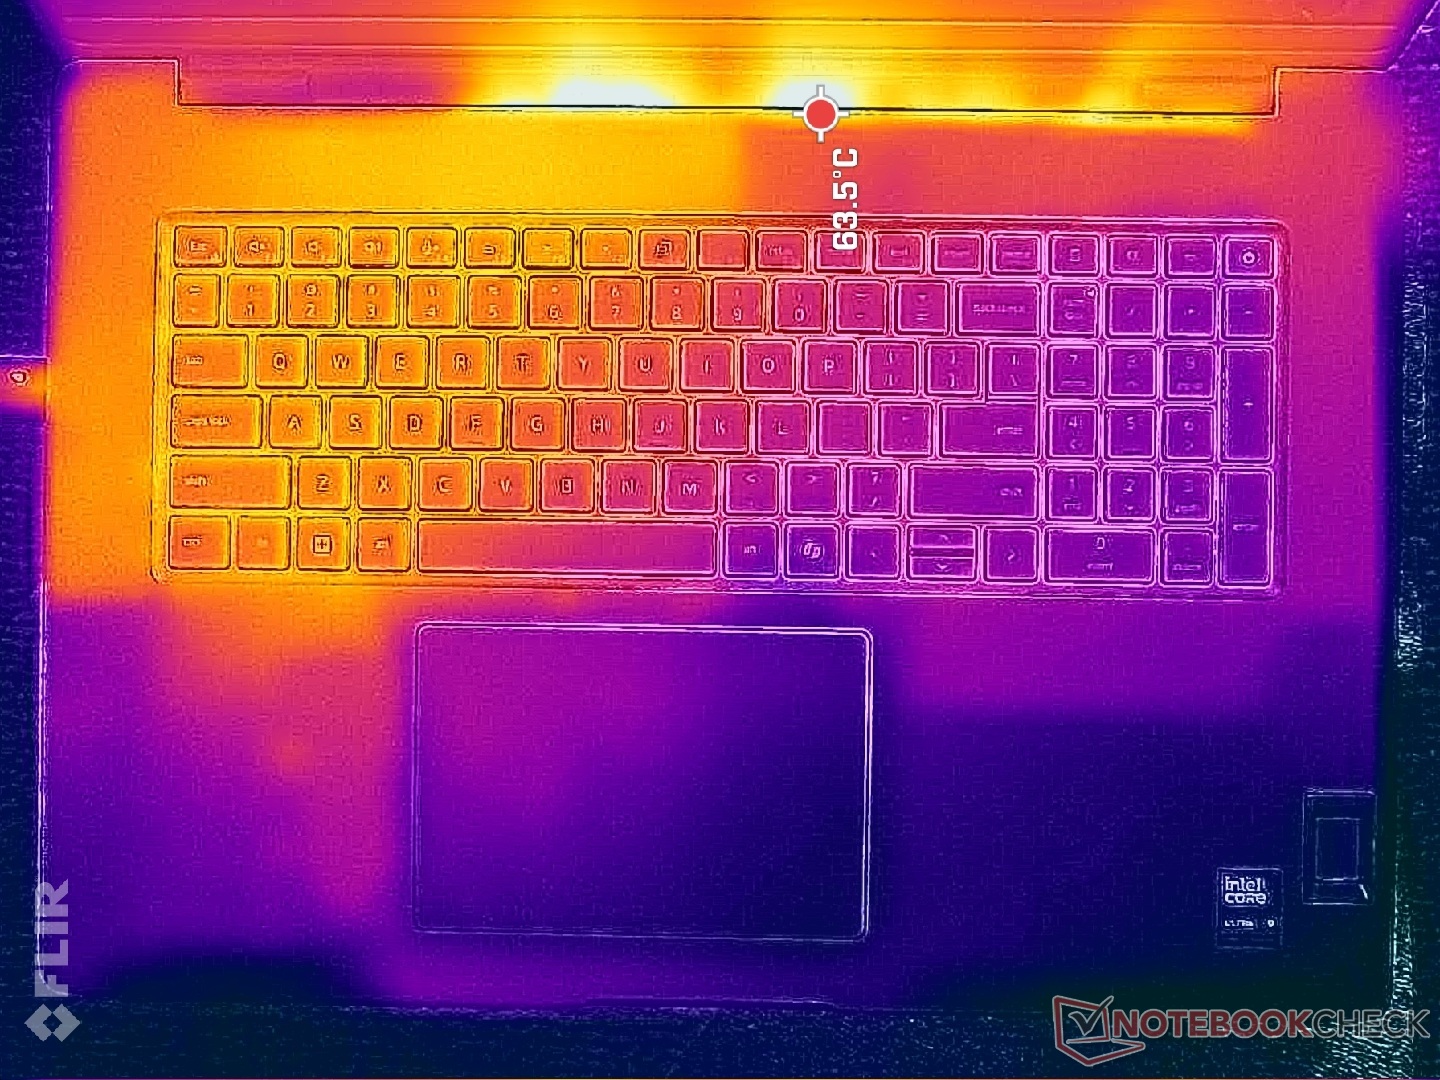
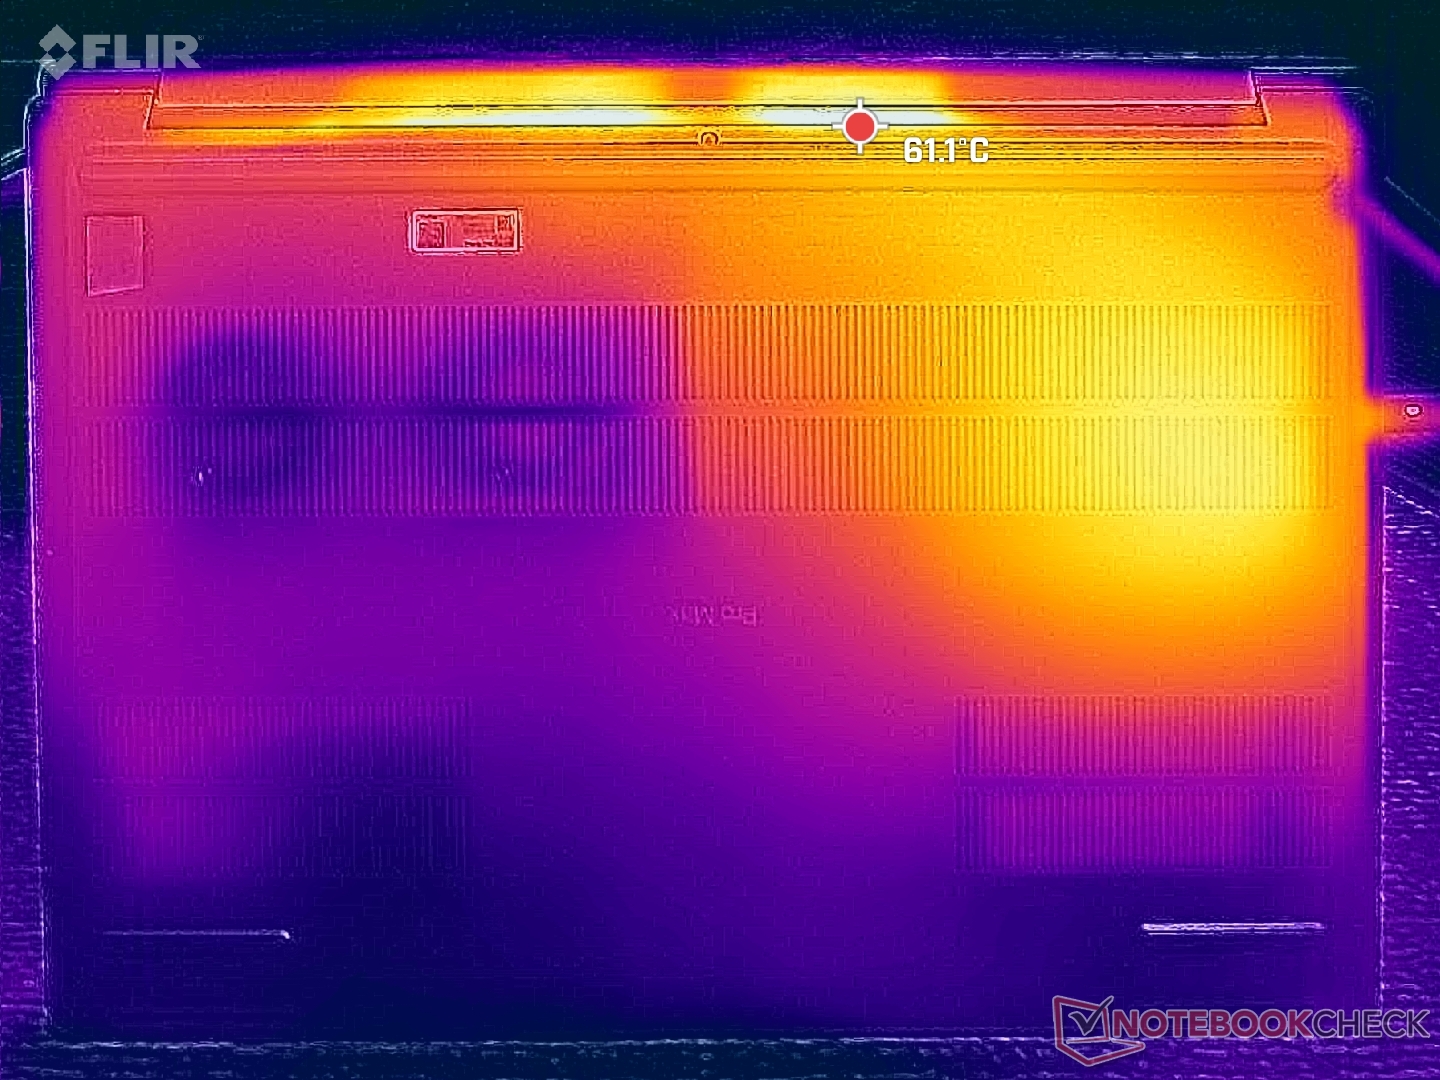
Temperatura
As temperaturas da superfície são mais quentes na metade esquerda do sistema do que na direita, onde os pontos quentes podem chegar a 43 C a 47 C quando sob carga.
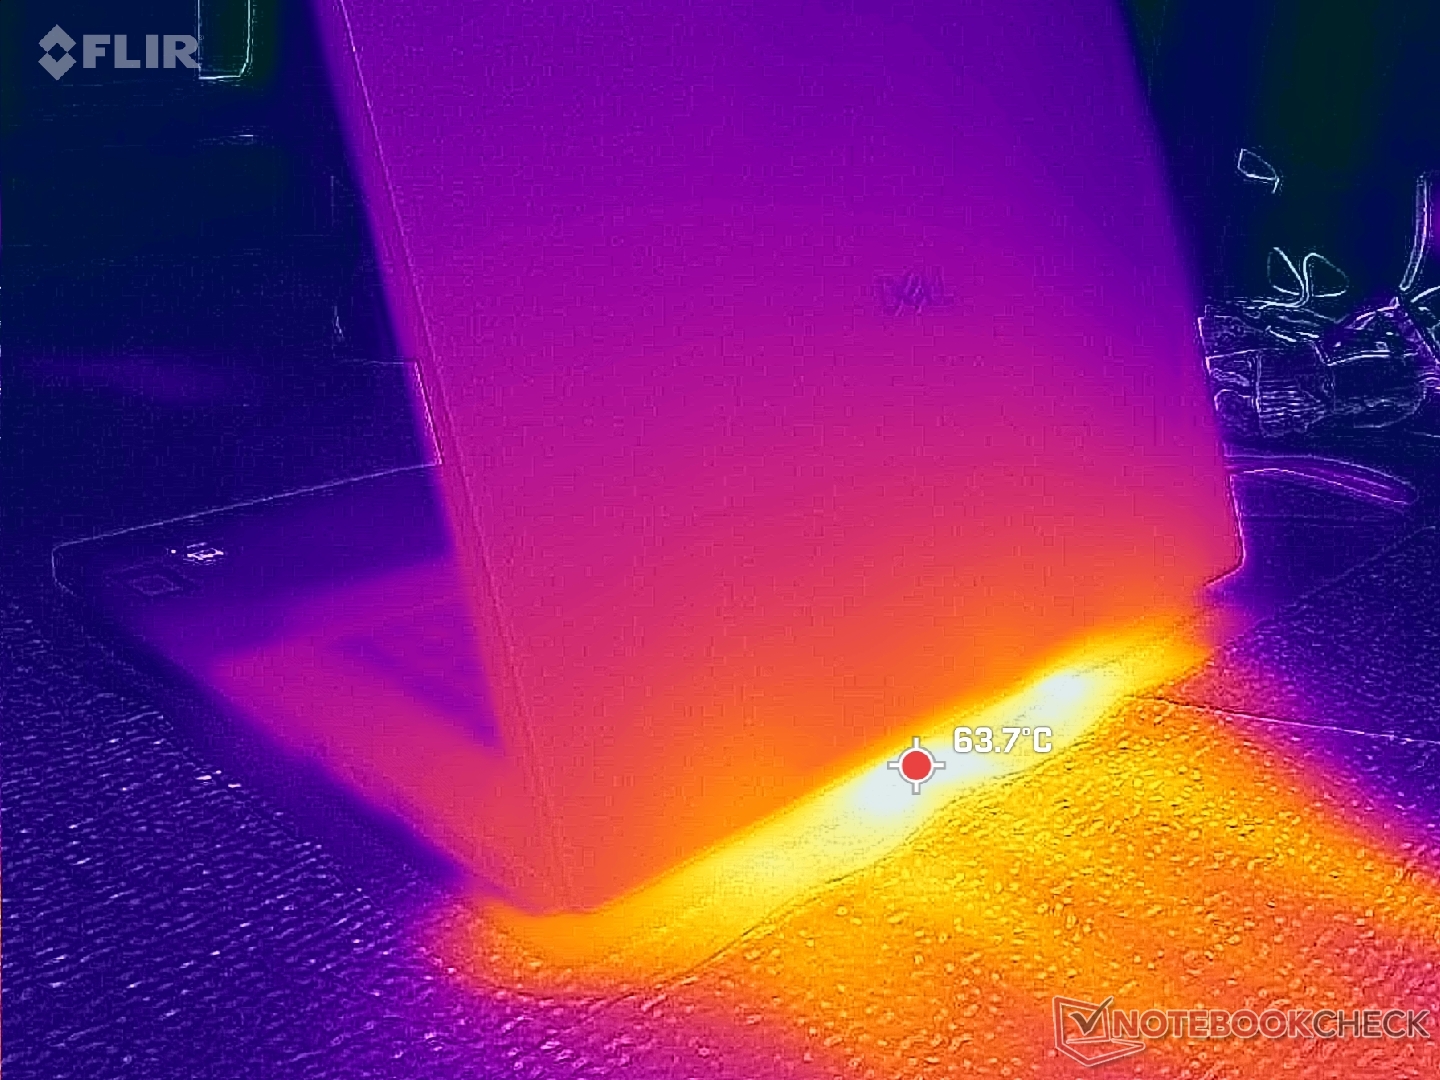
(±) A temperatura máxima no lado superior é 44.8 °C / 113 F, em comparação com a média de 38.2 °C / 101 F , variando de 22.2 a 69.8 °C para a classe Workstation.
(-) A parte inferior aquece até um máximo de 47 °C / 117 F, em comparação com a média de 41.1 °C / 106 F
(+) Em uso inativo, a temperatura média para o lado superior é 29.3 °C / 85 F, em comparação com a média do dispositivo de 32 °C / ### class_avg_f### F.
(+) Os apoios para as mãos e o touchpad estão atingindo a temperatura máxima da pele (32.8 °C / 91 F) e, portanto, não estão quentes.
(-) A temperatura média da área do apoio para as mãos de dispositivos semelhantes foi 27.8 °C / 82 F (-5 °C / -9 F).
| Dell Pro Max 18 Plus MB18250 Ultra 9 285HX, RTX PRO 5000 Blackwell Generation Laptop | Schenker Key 18 Pro M25 RTX 5090 Ultra 9 275HX, GeForce RTX 5090 Laptop | HP ZBook X G1i 16 Ultra 7 265H, RTX PRO 2000 Blackwell Generation Laptop | HP ZBook Studio 16 G11 Ultra 9 185H, RTX 3000 Ada Generation Laptop | Lenovo ThinkPad P16s Gen 4 21RX000YGE Ryzen AI 9 HX PRO 370, Radeon 890M | Dell Pro Max 16 Plus Ultra 9 285HX, RTX PRO 5000 Blackwell Generation Laptop | |
|---|---|---|---|---|---|---|
| Heat | -1% | 10% | 1% | -16% | 1% | |
| Maximum Upper Side * (°C) | 44.8 | 47.5 -6% | 36 20% | 36.6 18% | 50.6 -13% | 40.4 10% |
| Maximum Bottom * (°C) | 47 | 52.8 -12% | 39.4 16% | 47.8 -2% | 54.3 -16% | 45.6 3% |
| Idle Upper Side * (°C) | 31.8 | 28.5 10% | 30.4 4% | 31.4 1% | 35.3 -11% | 32.8 -3% |
| Idle Bottom * (°C) | 31.4 | 30.1 4% | 31.8 -1% | 35.6 -13% | 38.5 -23% | 33 -5% |
* ... menor é melhor
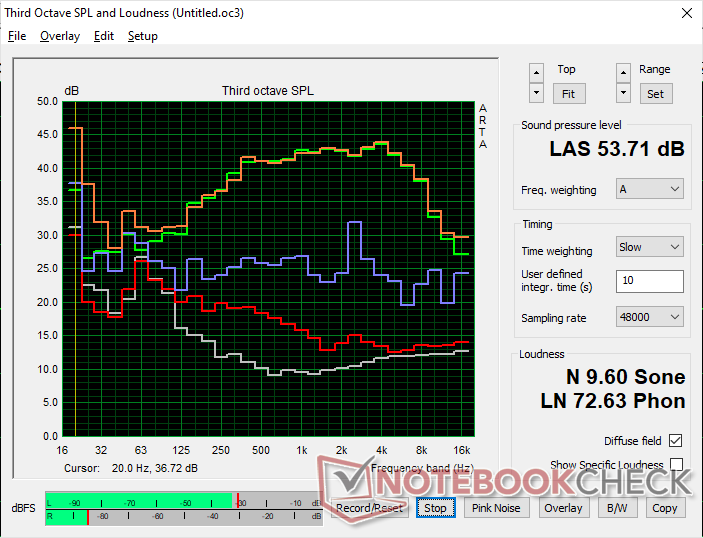
Alto-falantes
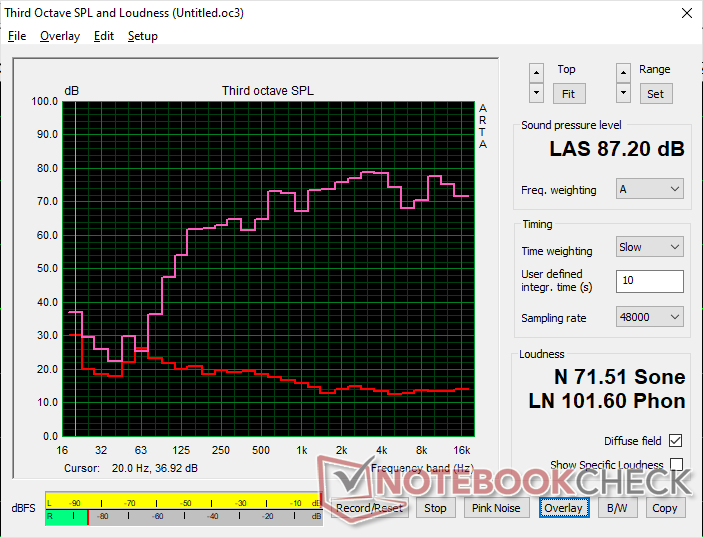
Dell Pro Max 18 Plus MB18250 análise de áudio
(+) | os alto-falantes podem tocar relativamente alto (###valor### dB)
Graves 100 - 315Hz
(±) | graves reduzidos - em média 12.8% menor que a mediana
(±) | a linearidade dos graves é média (8.4% delta para a frequência anterior)
Médios 400 - 2.000 Hz
(+) | médios equilibrados - apenas 4% longe da mediana
(+) | médios são lineares (6.6% delta para frequência anterior)
Altos 2 - 16 kHz
(+) | agudos equilibrados - apenas 4.7% longe da mediana
(+) | os máximos são lineares (5.9% delta da frequência anterior)
Geral 100 - 16.000 Hz
(+) | o som geral é linear (11.4% diferença em relação à mediana)
Comparado com a mesma classe
» 13% de todos os dispositivos testados nesta classe foram melhores, 4% semelhantes, 83% piores
» O melhor teve um delta de 7%, a média foi 17%, o pior foi 35%
Comparado com todos os dispositivos testados
» 7% de todos os dispositivos testados foram melhores, 2% semelhantes, 91% piores
» O melhor teve um delta de 4%, a média foi 24%, o pior foi 134%
Apple MacBook Pro 16 2021 M1 Pro análise de áudio
(+) | os alto-falantes podem tocar relativamente alto (###valor### dB)
Graves 100 - 315Hz
(+) | bons graves - apenas 3.8% longe da mediana
(+) | o baixo é linear (5.2% delta para a frequência anterior)
Médios 400 - 2.000 Hz
(+) | médios equilibrados - apenas 1.3% longe da mediana
(+) | médios são lineares (2.1% delta para frequência anterior)
Altos 2 - 16 kHz
(+) | agudos equilibrados - apenas 1.9% longe da mediana
(+) | os máximos são lineares (2.7% delta da frequência anterior)
Geral 100 - 16.000 Hz
(+) | o som geral é linear (4.6% diferença em relação à mediana)
Comparado com a mesma classe
» 0% de todos os dispositivos testados nesta classe foram melhores, 0% semelhantes, 100% piores
» O melhor teve um delta de 5%, a média foi 17%, o pior foi 45%
Comparado com todos os dispositivos testados
» 0% de todos os dispositivos testados foram melhores, 0% semelhantes, 100% piores
» O melhor teve um delta de 4%, a média foi 24%, o pior foi 134%
Gerenciamento de energia
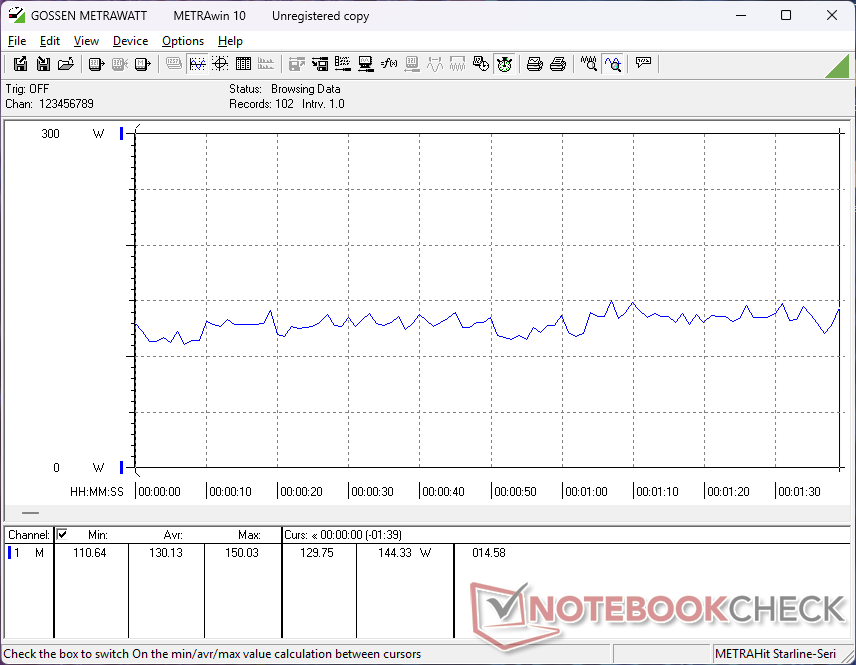
Consumo de energia
A marcha lenta pode consumir de 6 W a 32 W se estiver na configuração de brilho máximo com a GPU discreta ativa. Esse mínimo é menor do que a maioria dos outros notebooks de 18 polegadas, o que explica a duração relativamente longa da bateria na próxima seção.
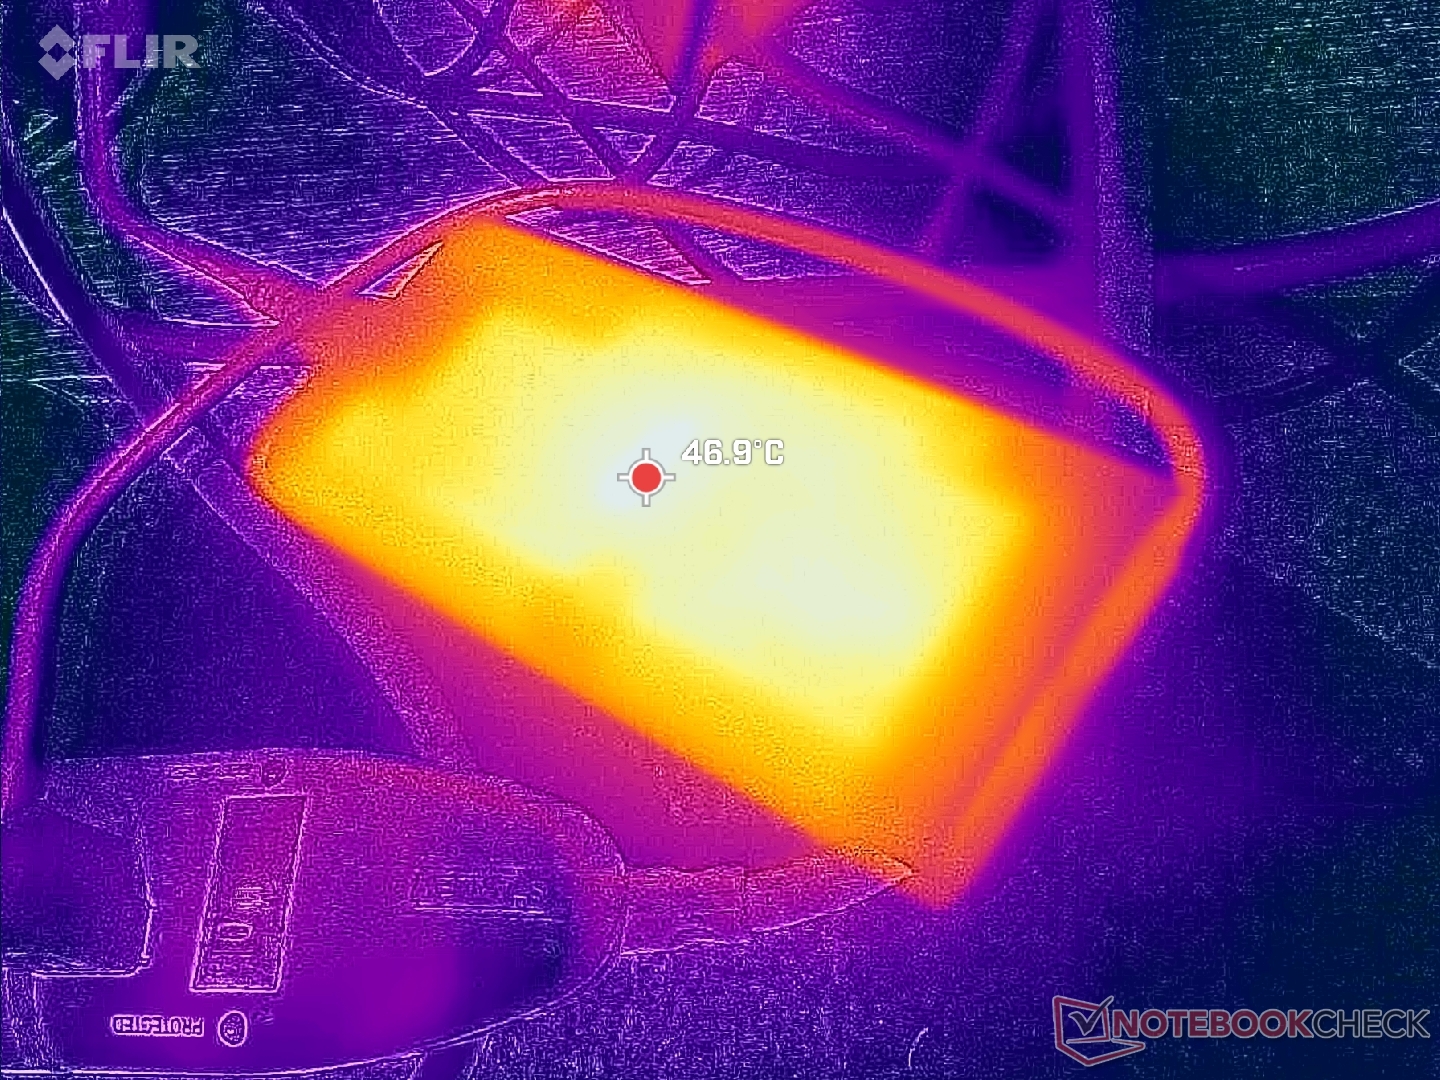
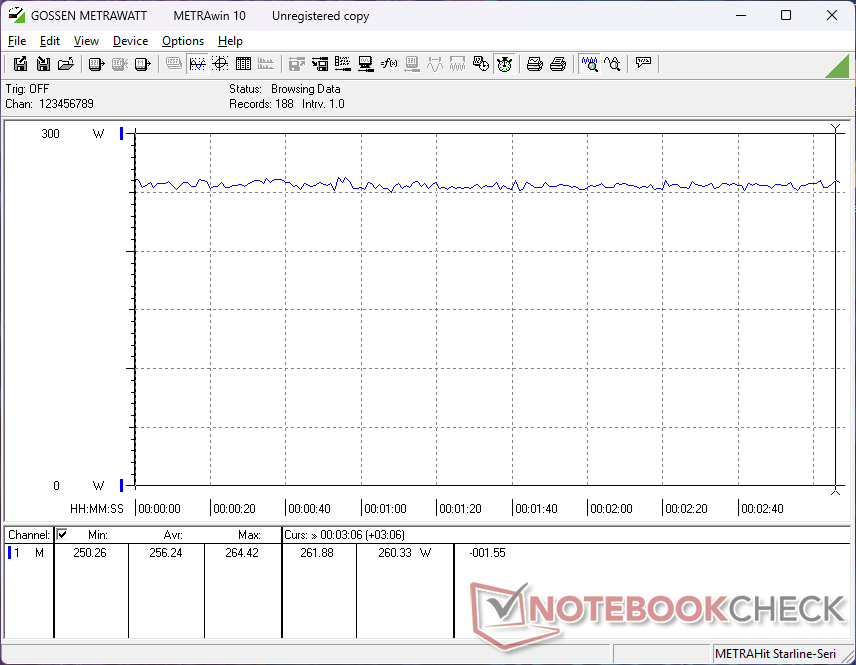
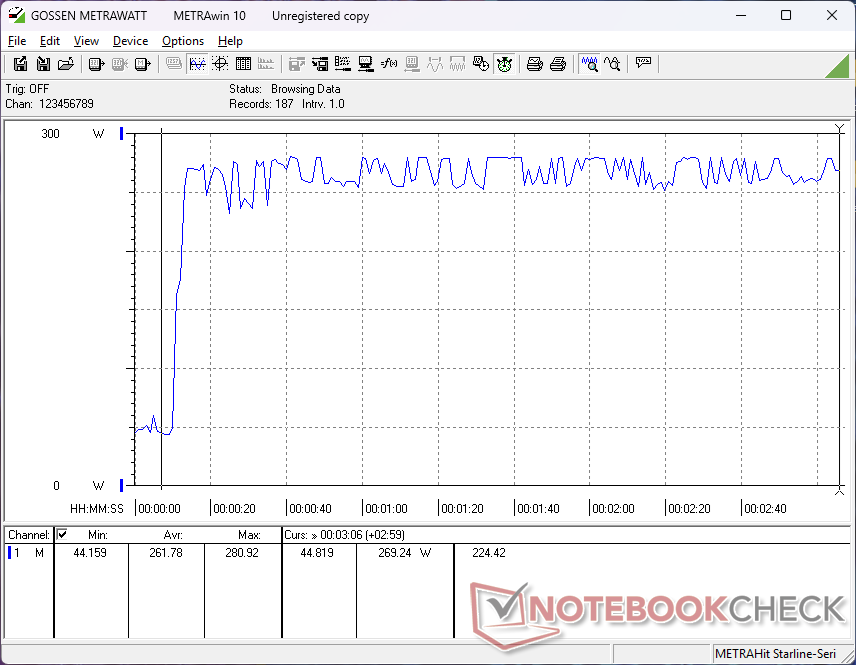
A execução de cargas exigentes, como o Cyberpunk 2077, demanda quase 260 W do adaptador CA USB-C de 280 W (~16,2 x 7,8 x 2,3 cm). As taxas de carregamento devem ser muito lentas se o usuário estiver executando cargas exigentes simultaneamente. Em comparação, a HP ZBook Fury G1i 18 é fornecida com um adaptador CA de 330 W mais volumoso para máximos de desempenho potencialmente mais altos e taxas de carregamento mais rápidas.
| desligado | |
| Ocioso | |
| Carga |
|
Key:
min: | |
| Dell Pro Max 18 Plus MB18250 Ultra 9 285HX, RTX PRO 5000 Blackwell Generation Laptop, , IPS, 2560x1600, 18" | Schenker Key 18 Pro M25 RTX 5090 Ultra 9 275HX, GeForce RTX 5090 Laptop, Samsung 9100 Pro 4 TB, IPS, 3840x2400, 18" | HP ZBook X G1i 16 Ultra 7 265H, RTX PRO 2000 Blackwell Generation Laptop, Samsung PM9A1 MZVL22T0HBLB, IPS, 2560x1600, 16" | HP ZBook Studio 16 G11 Ultra 9 185H, RTX 3000 Ada Generation Laptop, Kioxia XG8 KXG80ZNV1T02, IPS, 3840x2400, 16" | Lenovo ThinkPad P16 Gen 2 i7-14700HX, RTX 4000 Ada Generation Laptop, SK hynix PC801 HFS001TEJ9X162N, IPS, 2560x1600, 16" | Dell Pro Max 16 Plus Ultra 9 285HX, RTX PRO 5000 Blackwell Generation Laptop, SK hynix PCB01 HFS001TFM9X186N, OLED, 3840x2400, 16" | |
|---|---|---|---|---|---|---|
| Power Consumption | -38% | 49% | 4% | 7% | -97% | |
| Idle Minimum * (Watt) | 6.1 | 14 -130% | 4.1 33% | 14 -130% | 7.9 -30% | 35.1 -475% |
| Idle Average * (Watt) | 15.2 | 21.9 -44% | 9 41% | 22.4 -47% | 13.1 14% | 39.2 -158% |
| Idle Maximum * (Watt) | 32.4 | 22.3 31% | 9.4 71% | 25.7 21% | 24.2 25% | 56 -73% |
| Load Average * (Watt) | 130.1 | 149.5 -15% | 86.7 33% | 90.2 31% | 127.4 2% | 130.2 -0% |
| Cyberpunk 2077 ultra external monitor * (Watt) | 252 | 336 -33% | 102 60% | 120.3 52% | 219 13% | 213 15% |
| Cyberpunk 2077 ultra * (Watt) | 256 | 333 -30% | 106.1 59% | 125.4 51% | 225 12% | 229 11% |
| Load Maximum * (Watt) | 280.9 | 415.4 -48% | 152.9 46% | 142 49% | 248.5 12% | 285.2 -2% |
* ... menor é melhor
Consumo de energia Cyberpunk / Teste de estresse
Consumo de energia do monitor externo
Duração da bateria
Os tempos de execução são surpreendentemente longos ao navegar na Web no modo de gráficos integrados e no perfil de energia equilibrado. Conseguimos obter mais de 9 horas de uso no mundo real, o que é horas a mais do que o registrado no Lenovo ThinkPad P16 ou no HP ZBook Studio 16 G11.
| Dell Pro Max 18 Plus MB18250 Ultra 9 285HX, RTX PRO 5000 Blackwell Generation Laptop, 96 Wh | Schenker Key 18 Pro M25 RTX 5090 Ultra 9 275HX, GeForce RTX 5090 Laptop, 98 Wh | HP ZBook X G1i 16 Ultra 7 265H, RTX PRO 2000 Blackwell Generation Laptop, 83 Wh | HP ZBook Studio 16 G11 Ultra 9 185H, RTX 3000 Ada Generation Laptop, 86 Wh | Lenovo ThinkPad P16 Gen 2 i7-14700HX, RTX 4000 Ada Generation Laptop, 94 Wh | Dell Pro Max 16 Plus Ultra 9 285HX, RTX PRO 5000 Blackwell Generation Laptop, 96 Wh | |
|---|---|---|---|---|---|---|
| Duração da bateria | ||||||
| WiFi v1.3 (h) | 9.3 | 5.8 -38% | 12.5 34% | 4.8 -48% | 2.5 -73% | 3.6 -61% |
Classificação do Notebookcheck
A maior estação de trabalho móvel da Dell até o momento é também uma das melhores e mais rápidas, mas curiosamente tem menos opções de tela do que a versão menor de 16 polegadas.
Dell Pro Max 18 Plus MB18250
- 11/19/2025 v8
Allen Ngo
 Total Sustainability Score:
 Concorrentes potenciais em comparação
Imagem | Modelo / Análises | Preço | Peso | Altura | Tela |
|---|---|---|---|---|---|
1. 88.9%  | Dell Pro Max 18 Plus MB18250 Intel Core Ultra 9 285HX ⎘ NVIDIA RTX PRO 5000 Blackwell Generation Laptop ⎘ 128 GB Memória | Amazon: Preço de tabela: 6000 USD | 3.6 kg | 30.2 mm | 18.00" 2560x1600 168 PPI IPS |
2. 84.6%  | Schenker Key 18 Pro M25 RTX 5090 Intel Core Ultra 9 275HX ⎘ NVIDIA GeForce RTX 5090 Laptop ⎘ 256 GB Memória, 4096 GB SSD | Amazon: Preço de tabela: 6400€ | 4.1 kg | 29.5 mm | 18.00" 3840x2400 252 PPI IPS |
3. 87.4%  | HP ZBook X G1i 16 Intel Core Ultra 7 265H ⎘ NVIDIA RTX PRO 2000 Blackwell Generation Laptop ⎘ 64 GB Memória, 2048 GB SSD | Amazon: Preço de tabela: 2700 USD | 2.2 kg | 23 mm | 16.00" 2560x1600 189 PPI IPS |
4. 84.2%  | HP ZBook Studio 16 G11 Intel Core Ultra 9 185H ⎘ NVIDIA RTX 3000 Ada Generation Laptop ⎘ 64 GB Memória, 1024 GB SSD | Amazon: Preço de tabela: 4300 USD | 1.8 kg | 19 mm | 16.00" 3840x2400 283 PPI IPS |
5. 82%  | Lenovo ThinkPad P16s Gen 4 21RX000YGE AMD Ryzen AI 9 HX PRO 370 ⎘ AMD Radeon 890M ⎘ 64 GB Memória, 1024 GB SSD | Amazon: Preço de tabela: 2440 Euro | 2 kg | 23 mm | 16.00" 1920x1200 142 PPI IPS LED |
6. 88.4%  | Dell Pro Max 16 Plus Intel Core Ultra 9 285HX ⎘ NVIDIA RTX PRO 5000 Blackwell Generation Laptop ⎘ 128 GB Memória, SSD | Amazon: Preço de tabela: 5000 USD | 2.8 kg | 30.9 mm | 16.00" 3840x2400 283 PPI OLED |
Transparência
A seleção dos dispositivos a serem analisados é feita pela nossa equipe editorial. A amostra de teste foi fornecida ao autor como empréstimo pelo fabricante ou varejista para fins desta revisão. O credor não teve influência nesta revisão, nem o fabricante recebeu uma cópia desta revisão antes da publicação. Não houve obrigação de publicar esta revisão. Como empresa de mídia independente, a Notebookcheck não está sujeita à autoridade de fabricantes, varejistas ou editores.
É assim que o Notebookcheck está testando
Todos os anos, o Notebookcheck analisa de forma independente centenas de laptops e smartphones usando procedimentos padronizados para garantir que todos os resultados sejam comparáveis. Desenvolvemos continuamente nossos métodos de teste há cerca de 20 anos e definimos padrões da indústria no processo. Em nossos laboratórios de teste, equipamentos de medição de alta qualidade são utilizados por técnicos e editores experientes. Esses testes envolvem um processo de validação em vários estágios. Nosso complexo sistema de classificação é baseado em centenas de medições e benchmarks bem fundamentados, o que mantém a objetividade.
