Veredicto - Ultrapassando os limites do desempenho
Sem novas GPUs GeForce este ano, a Arrow Lake Core Ultra 9 290HX Plus e a tela OLED de 1600p são as duas únicas novidades até o momento para o Alienware 16 Area-51 de 2026. A nova CPU é, de fato, até 25% mais rápida do que a opção anterior topo de linha Core Ultra 9 275HX, mas o consumo de energia é igualmente até 25% mais exigente como resultado].
Quanto à tela, a atualização de IPS para OLED é, sem dúvida, muito mais perceptível do que a atualização do Core Ultra 9 para o Core Ultra 9 Plus. O painel OLED oferece contraste significativamente maior, tempos de resposta mais rápidos e HDR superior, tudo isso mantendo o suporte para Advanced Optimus, resolução nativa QHD+ e uma taxa de atualização rápida de 240 Hz. Os jogos e a multimídia serão especialmente beneficiados por essas vantagens. Infelizmente, as novas opções de CPU OLED e Core Ultra 9 Plus são agrupadas e não podem ser separadas, o que leva a preços muito altos para essa configuração.
Como o chassi não foi alterado, a maioria de nossas reclamações sobre o modelo 2025 permanecem as mesmas para o modelo 2026. As temperaturas do núcleo, que já eram altas, estão ainda piores desta vez, chegando a 100 °C se configurado com o Core Ultra 9 Plus. Enquanto isso, a duração da bateria ainda é bastante curta, mesmo para um laptop para jogos. A mentalidade de "desempenho a todo custo" está mais forte do que nunca para estar alinhada com o que a marca Alienware é conhecida.
Pro
Contra
Preço e disponibilidade
A Dell agora está enviando o Alienware 16 Area-51 2026 a partir de US$ 1.950 para a configuração básica Core Ultra 7 e RTX 5060 até US$ 3.900 ou mais para nossa configuração Core Ultra 9 Plus e RTX 5080.
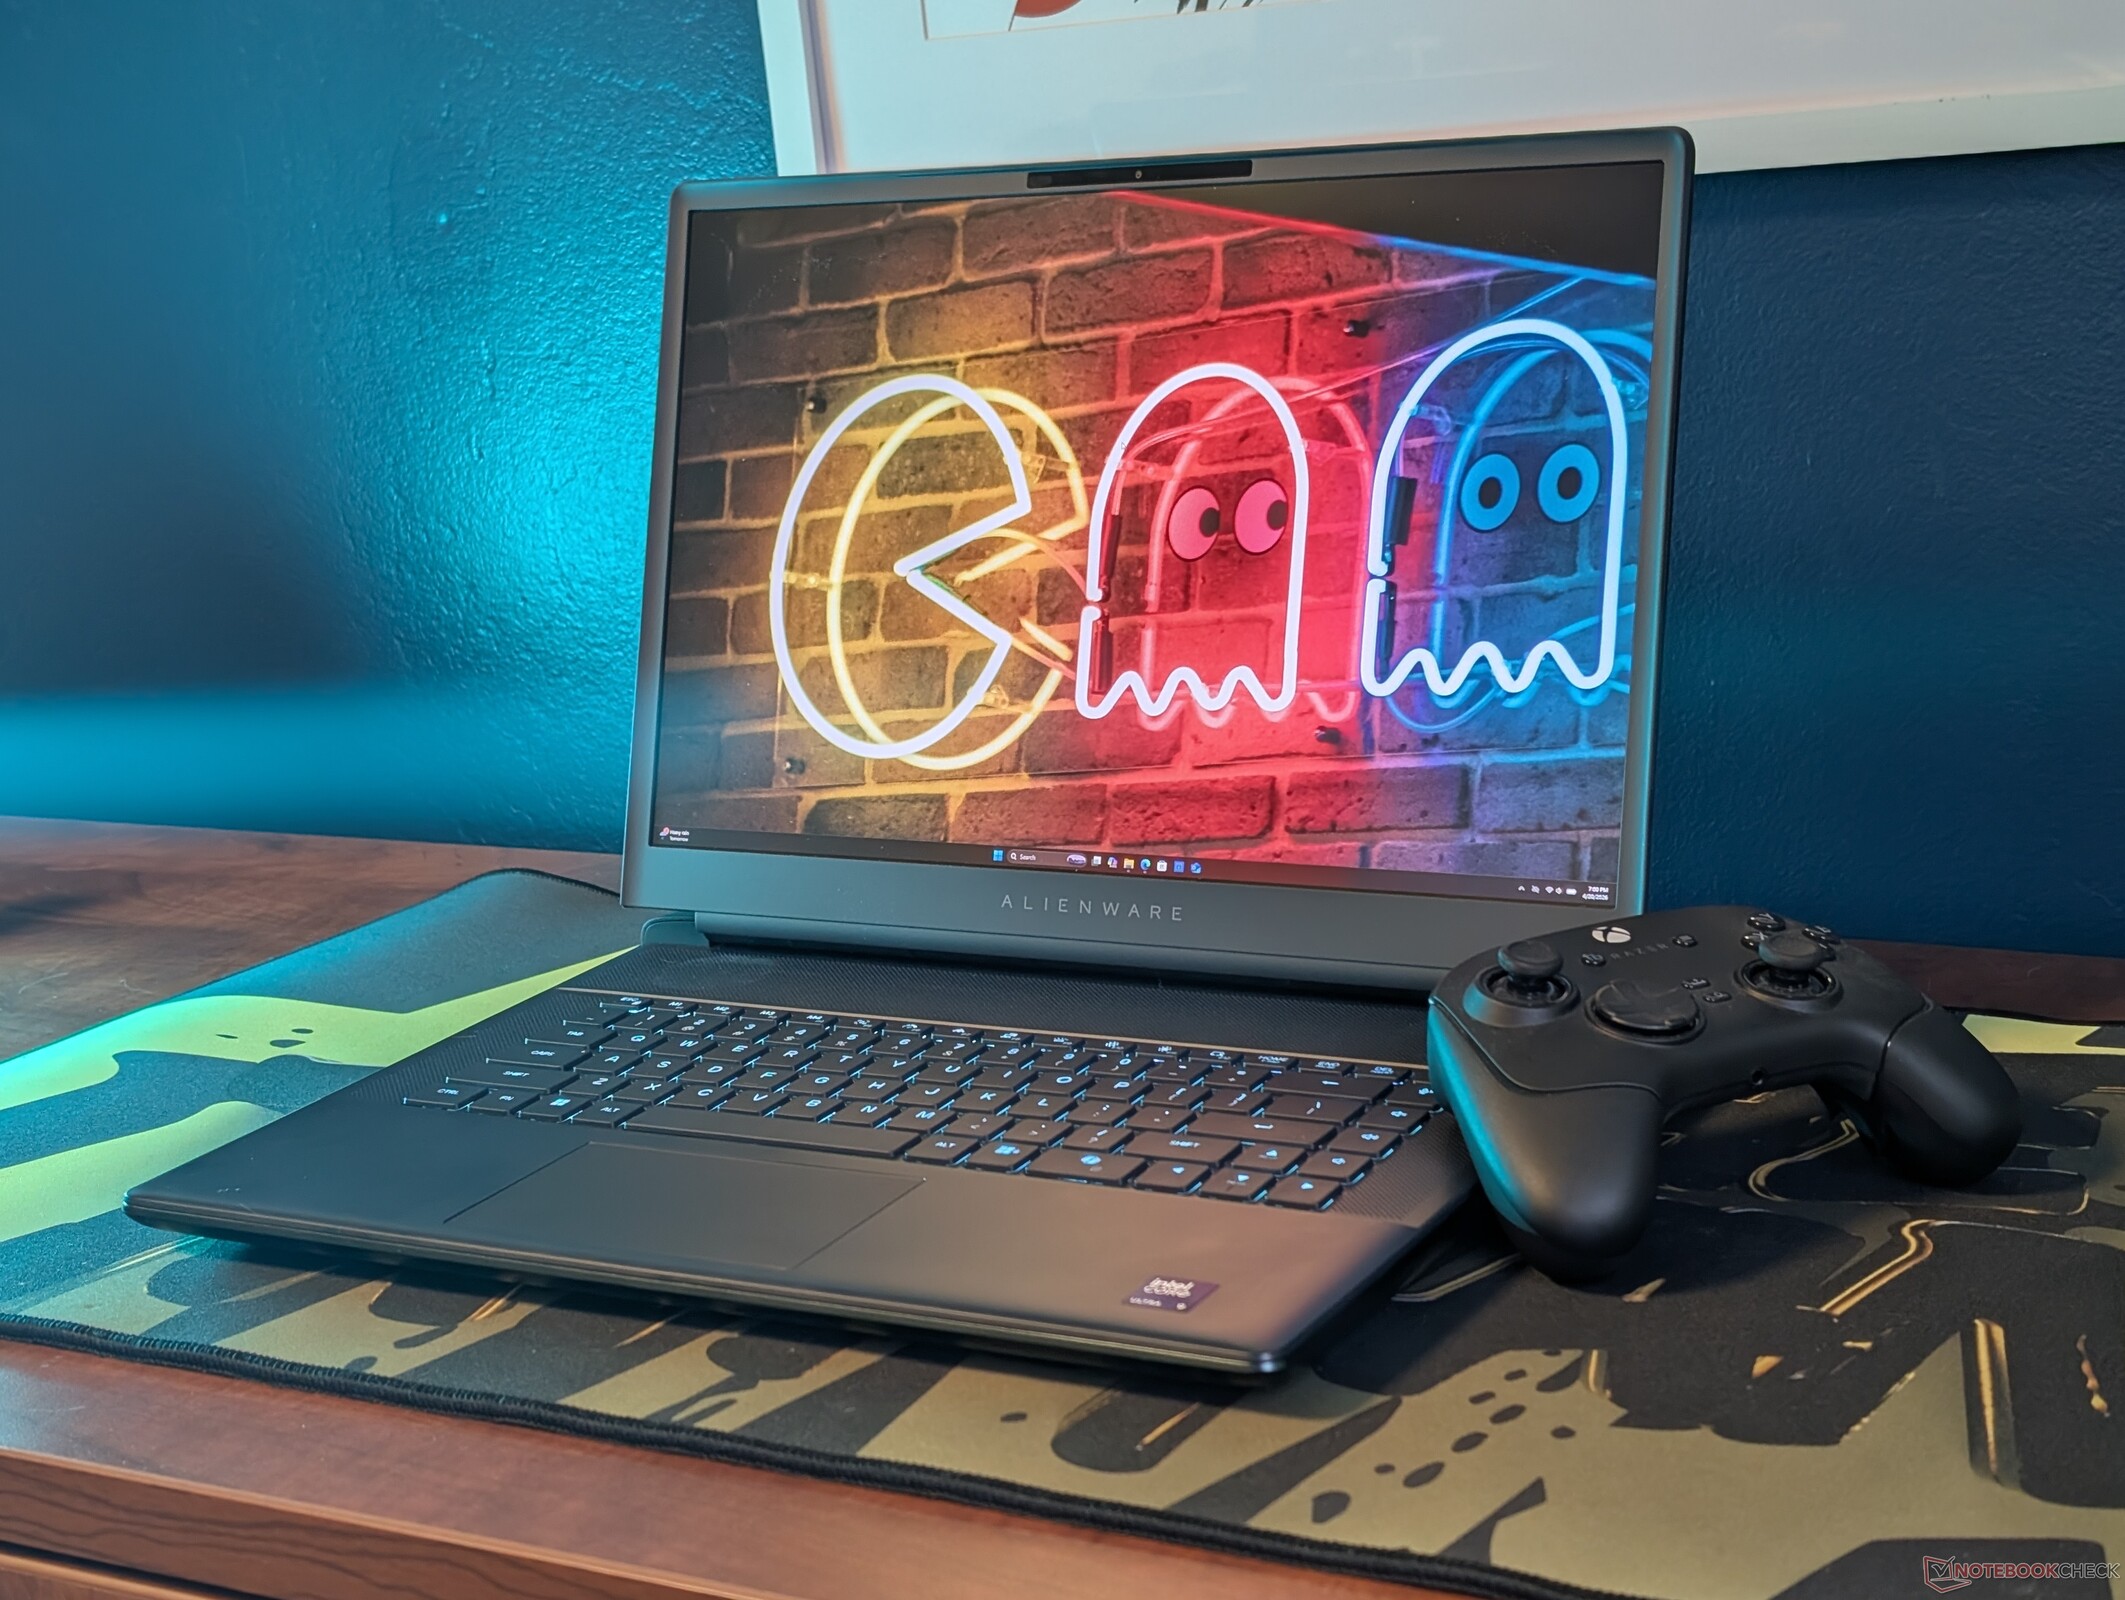
O Alienware 16 Area-51 fez sua estreia no ano passado e, sem dúvida, se tornou um dos melhores notebooks da Alienware de longe. Para 2026, o modelo está recebendo apenas pequenas atualizações relacionadas à CPU e à tela, já que a série GeForce RTX 50 ainda não foi lançada.
Nossa unidade de teste vem equipada com novas opções não disponíveis na versão 2025, incluindo a CPU Core Ultra 9 290HX Plus e o painel OLED fosco de 240 Hz 1600p com G-Sync por pouco menos de US$ 4000. Essas mudanças melhoram a experiência do usuário ou justificam o novo preço?
Recomendamos conferir nossa análise do Alienware 16 Area-51 2025 para saber mais sobre os recursos físicos do laptop. As alternativas ao modelo da Dell incluem outros notebooks para jogos de 16 polegadas de última geração, como o Asus ROG Zephyrus G16 ou o Lenovo Legion Pro 7i 16 Gen 10.
Mais análises da Alienware:
Especificações
Caso

Conectividade


Leitor de cartão SD
| SD Card Reader | |
| average JPG Copy Test (av. of 3 runs) | |
| Alienware 16 Area-51 Core Ultra 9 290HX Plus (Toshiba Exceria Pro SDXC 64 GB UHS-II) | |
| Alienware 16 Area-51 (Toshiba Exceria Pro SDXC 64 GB UHS-II) | |
| Asus ROG Zephyrus G16 GU605CW (AV Pro SD microSD 128 GB V60) | |
| MSI Vector 16 HX AI A2XWHG (AV PRO microSD 128 GB V60) | |
| maximum AS SSD Seq Read Test (1GB) | |
| Alienware 16 Area-51 Core Ultra 9 290HX Plus (Toshiba Exceria Pro SDXC 64 GB UHS-II) | |
| Alienware 16 Area-51 (Toshiba Exceria Pro SDXC 64 GB UHS-II) | |
| MSI Vector 16 HX AI A2XWHG (AV PRO microSD 128 GB V60) | |
| Asus ROG Zephyrus G16 GU605CW (AV Pro SD microSD 128 GB V60) | |
Comunicação
Webcam


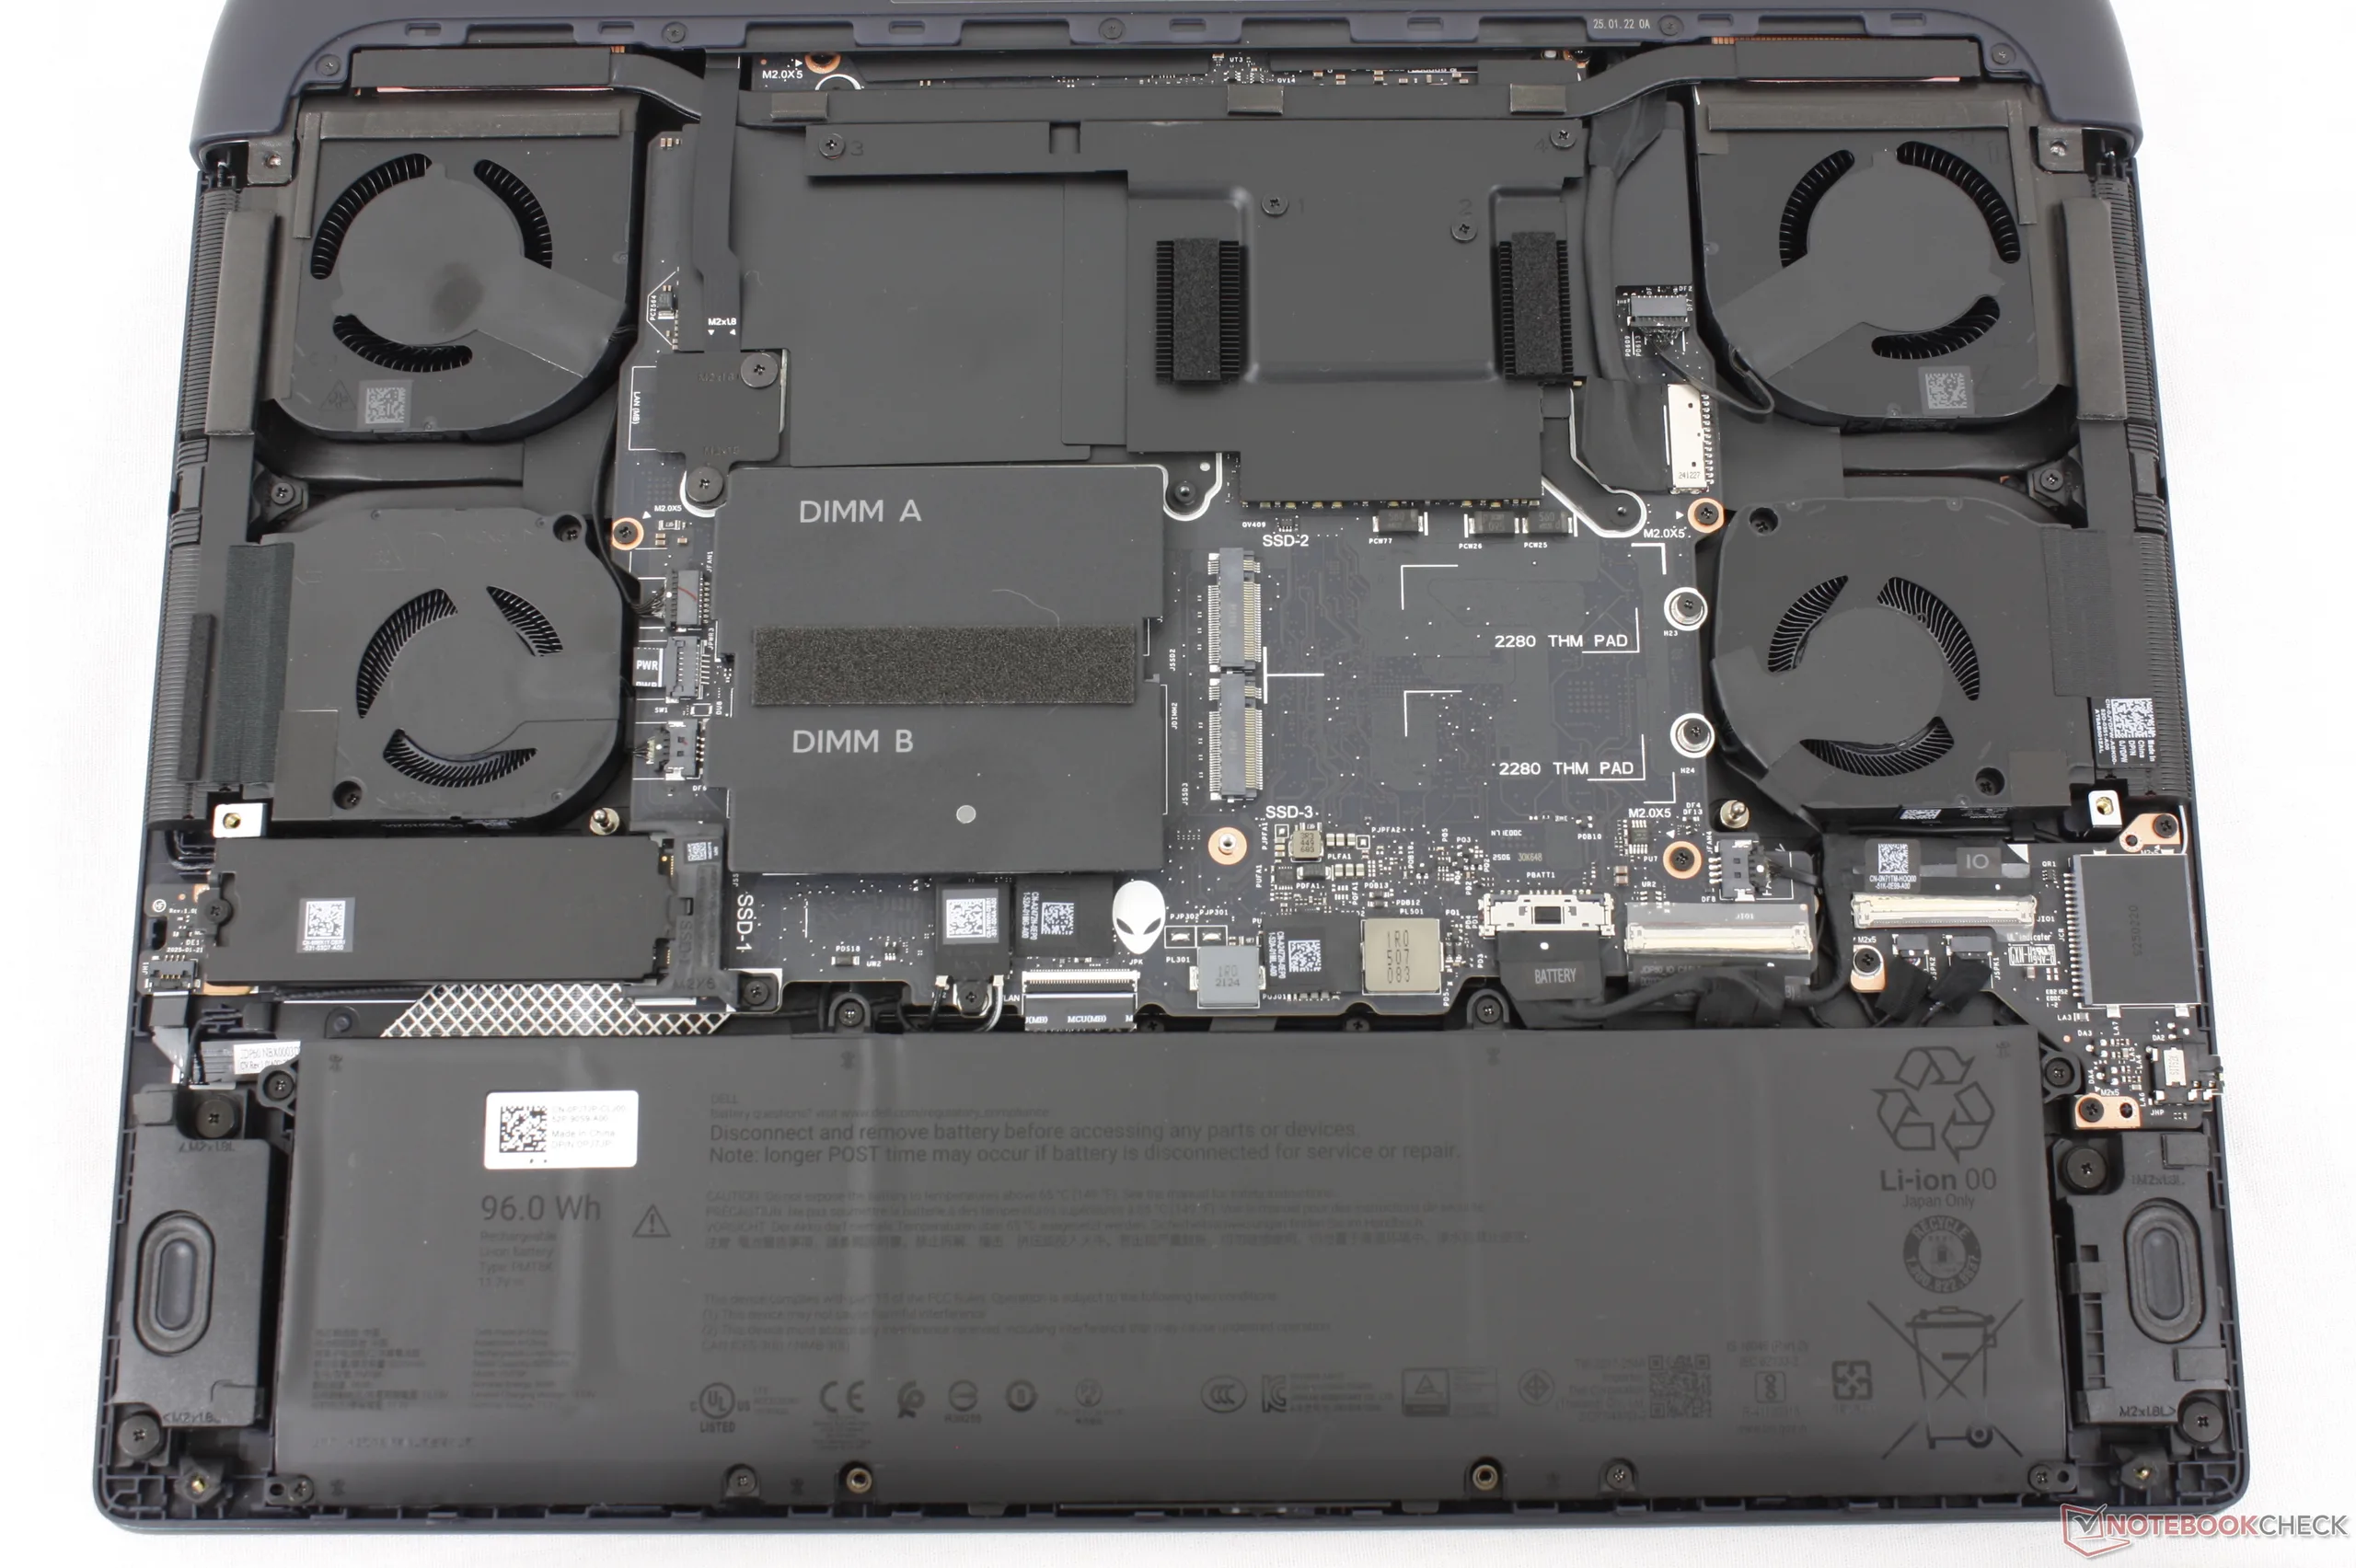
Manutenção

Dispositivos de entrada

Tela
Agora há duas opções de tela disponíveis, cada uma com suporte a G-sync e taxa de atualização nativa de 240 Hz:
- 2560 x 1600, 100% DCI-P3, IPS, 500 nits, fosco
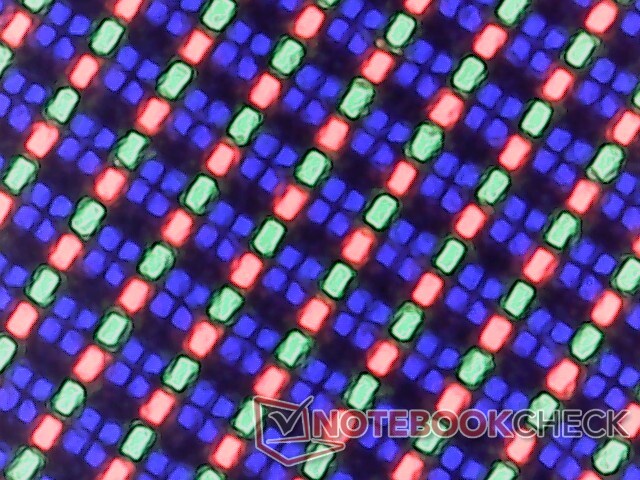
- 2560 x 1600, 120% DCI-P3, OLED, 620 nits (em HDR), fosco
O painel IPS básico é o mesmo do modelo 2025, enquanto o OLED é uma nova opção. Ao contrário da maioria dos outros laptops OLED, o painel OLED do Alienware é fosco com suporte a G-Sync em vez de brilhante. No entanto, a sobreposição fosca resulta em textos e imagens um pouco mais granulados.
| |||||||||||||||||||||||||
iluminação: 97 %
iluminação com acumulador: 383.3 cd/m²
Contraste: ∞:1 (Preto: 0 cd/m²)
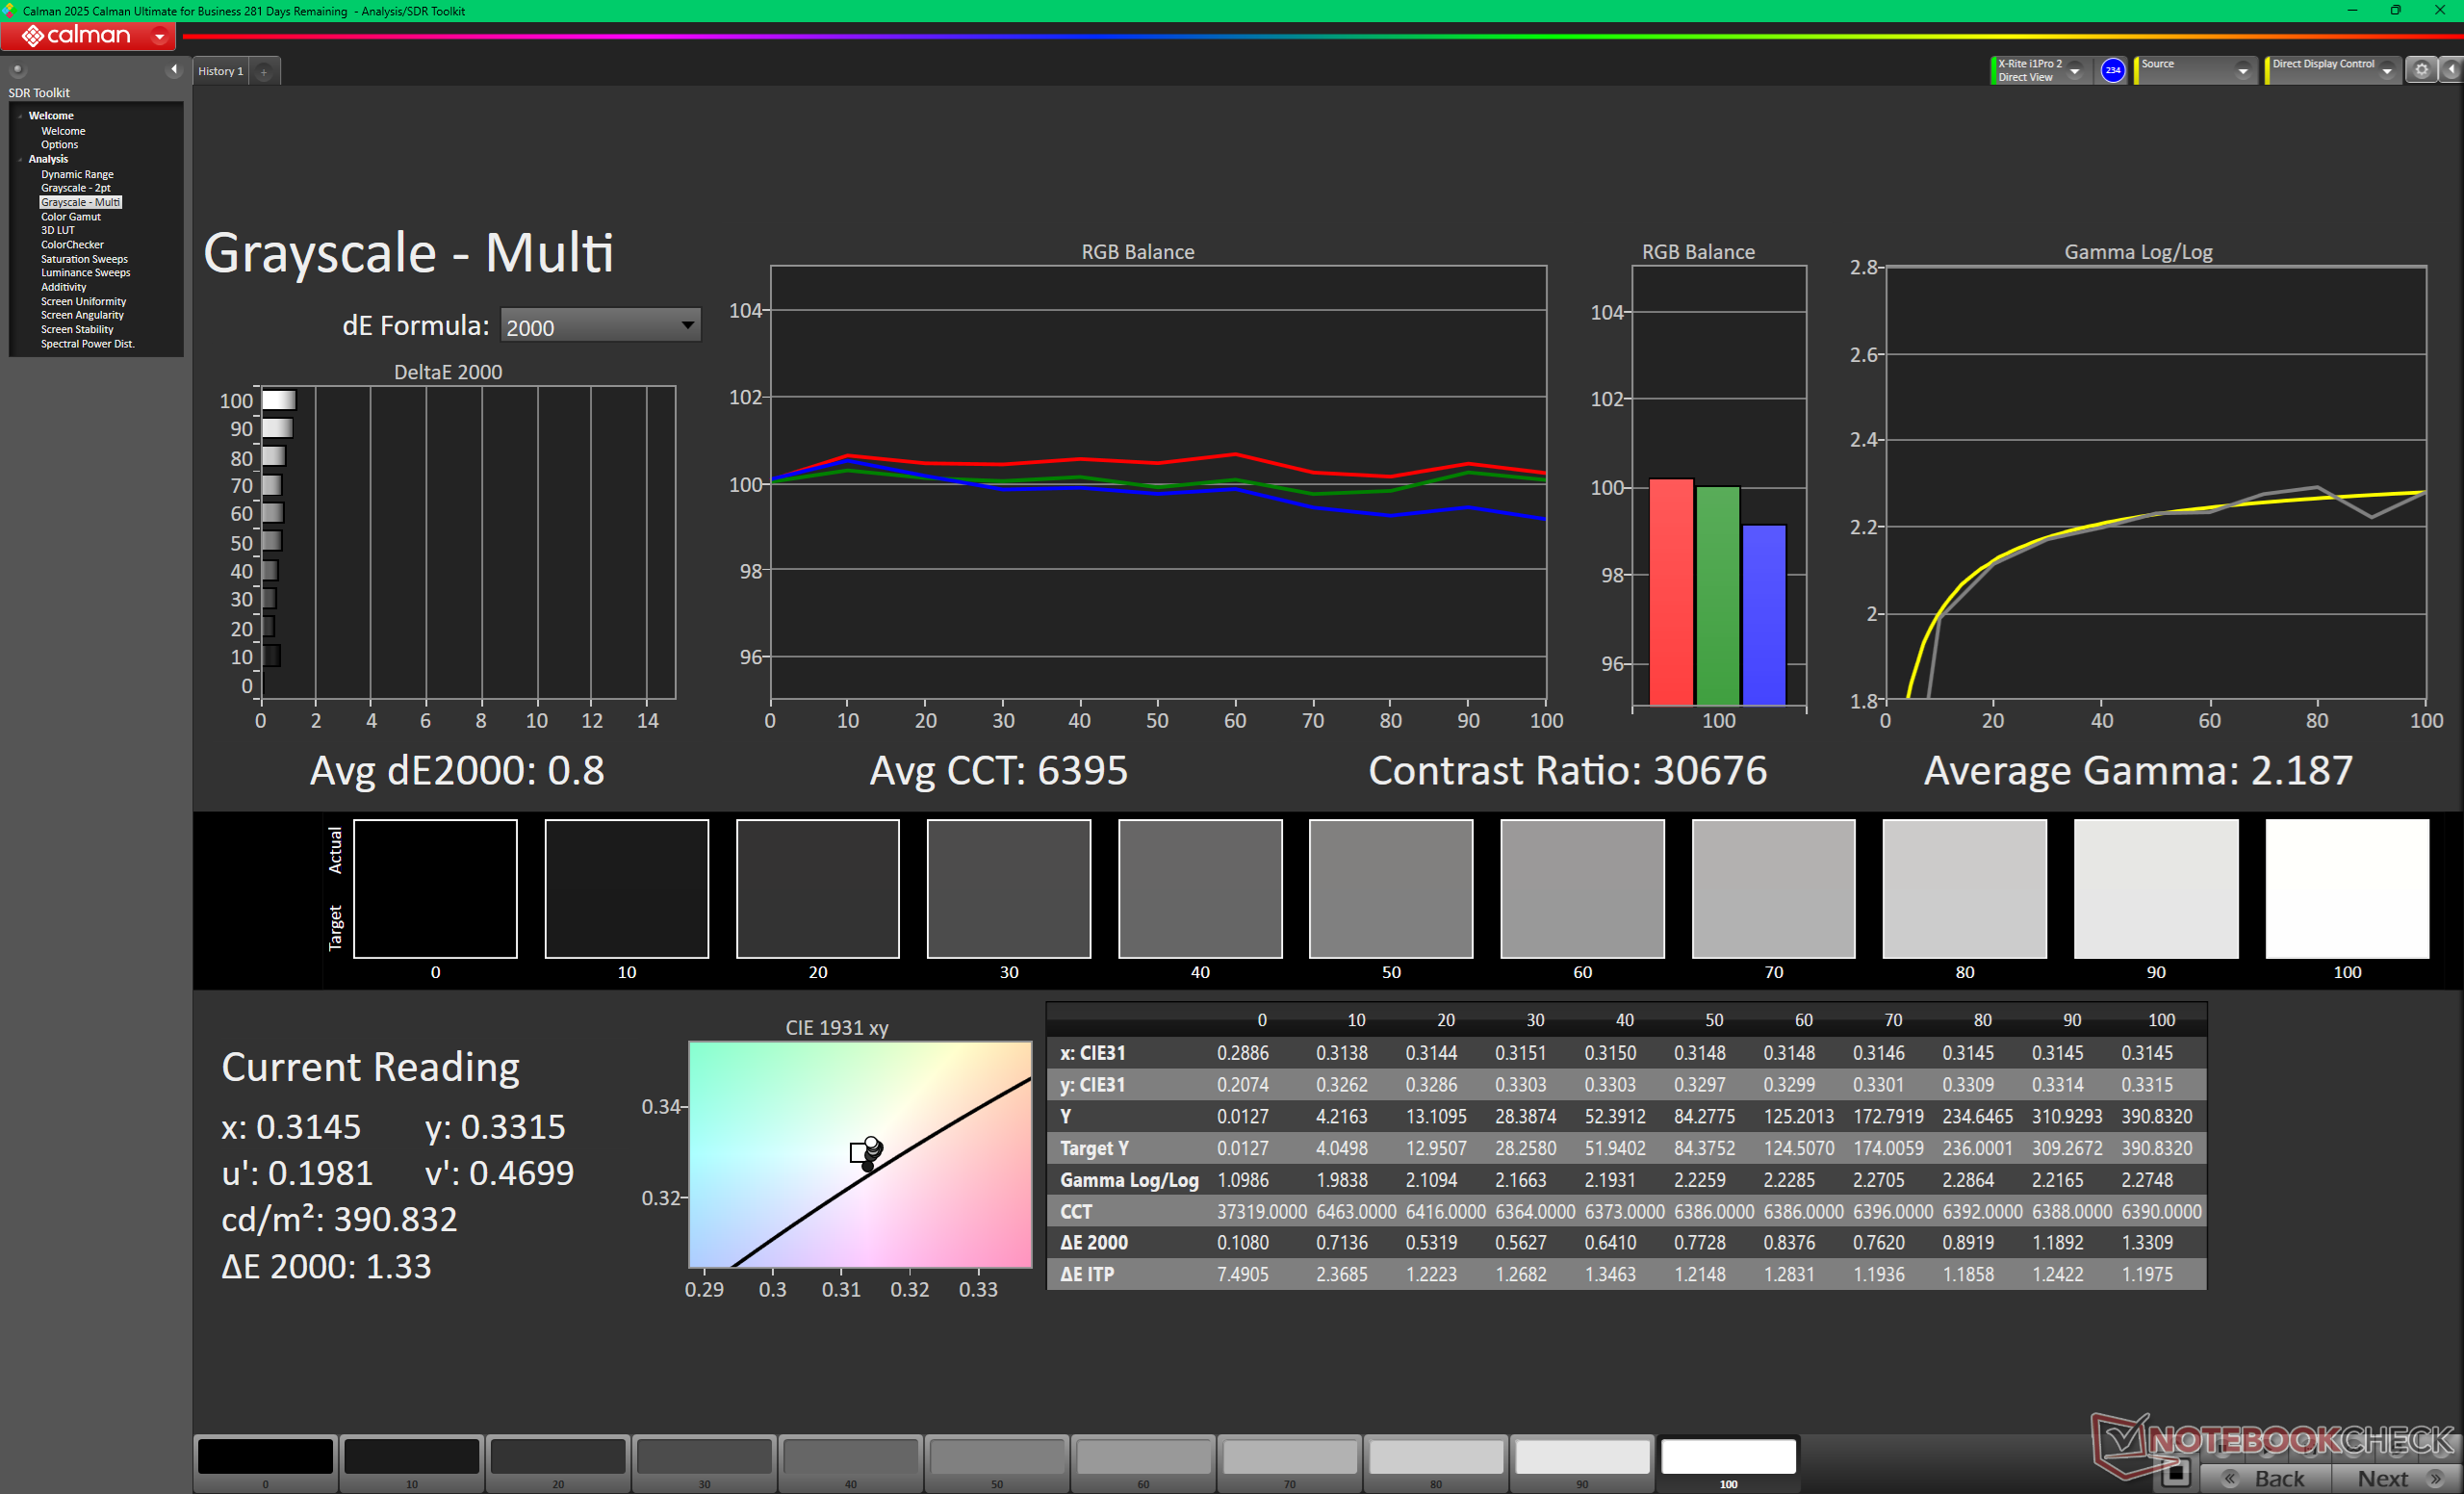
ΔE ColorChecker Calman: 0.87 | ∀{0.5-29.43 Ø4.72}
calibrated: 0.61
ΔE Greyscale Calman: 0.8 | ∀{0.09-98 Ø4.97}
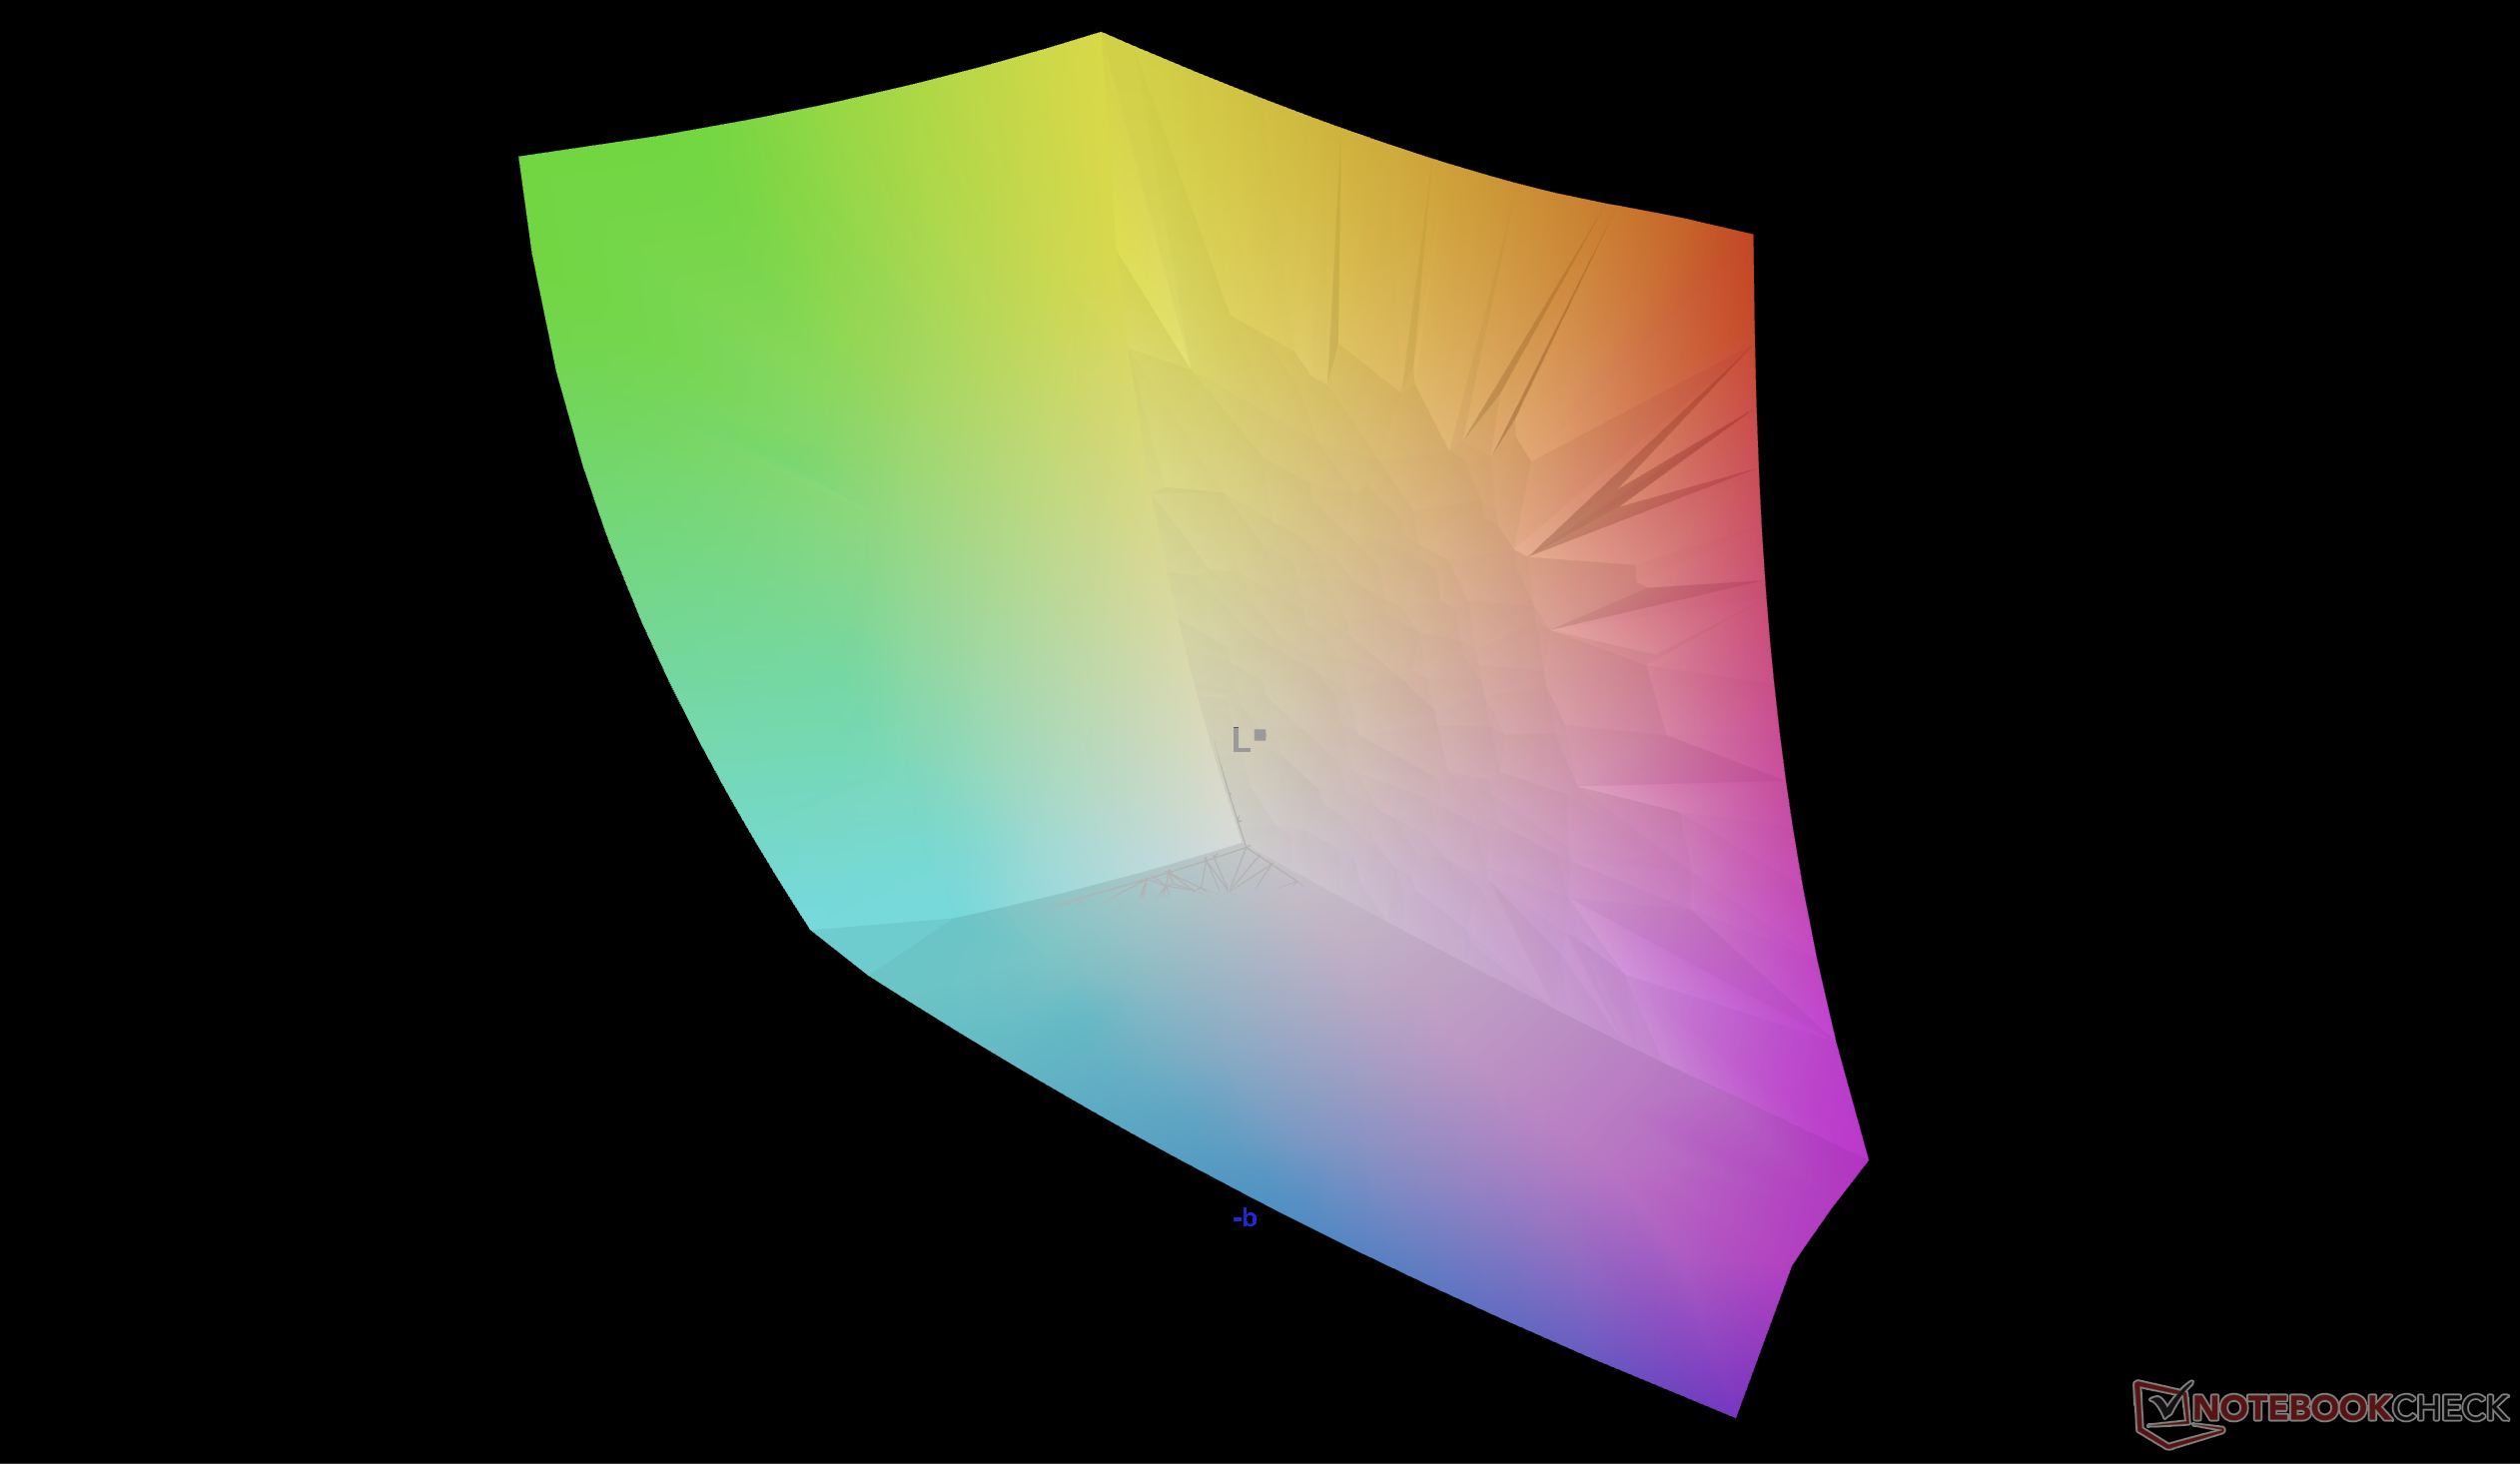
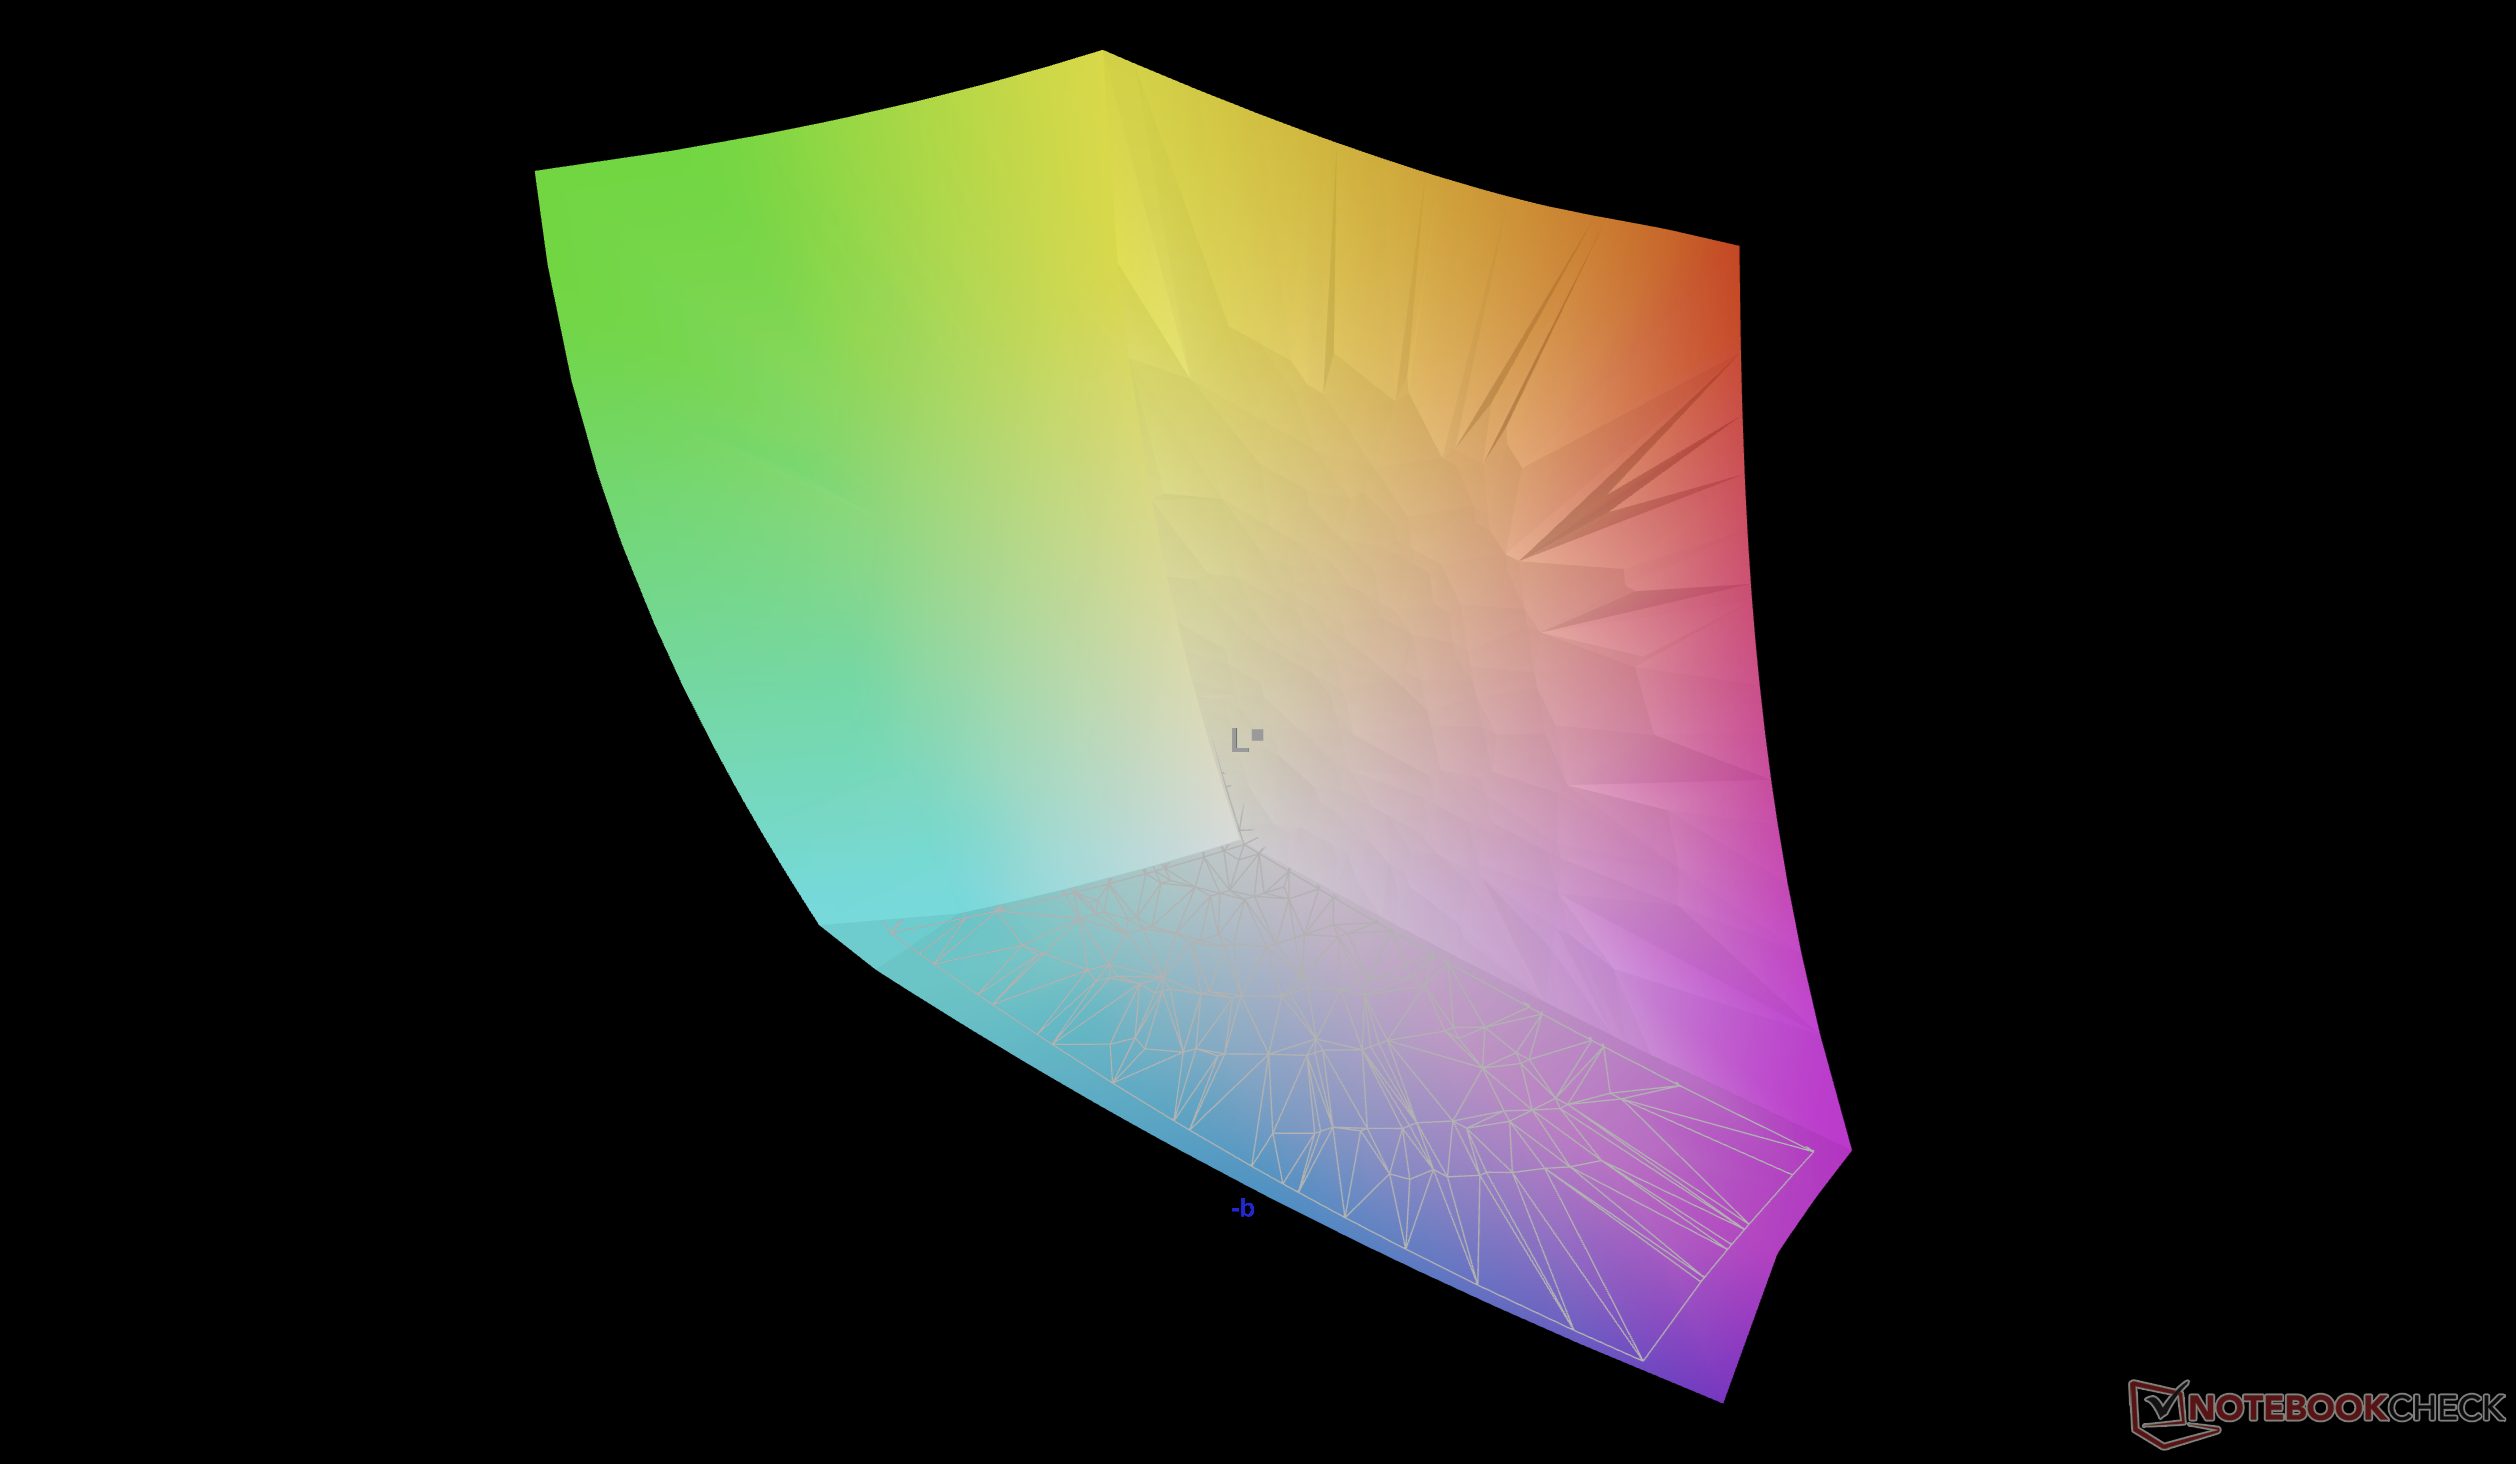
95.6% AdobeRGB 1998 (Argyll 3D)
100% sRGB (Argyll 3D)
99.6% Display P3 (Argyll 3D)
Gamma: 2.19
CCT: 6395 K
| Alienware 16 Area-51 Core Ultra 9 290HX Plus Samsung 160HU05, OLED, 2560x1600, 16", 240 Hz | Alienware 16 Area-51 AU Optronics B160QAN, IPS, 2560x1600, 16", 240 Hz | Lenovo Legion Pro 7i 16 Gen 10 Samsung ATNA60HU01-0, OLED, 2560x1600, 16", 240 Hz | HP Omen Max 16 ah000 Samsung ATNA60DL02-0, OLED, 2560x1600, 16", 240 Hz | MSI Vector 16 HX AI A2XWHG B160QAN02.3 (AUO7DB2), IPS, 2560x1600, 16", 240 Hz | Asus ROG Zephyrus G16 GU605CW Samsung ATNA60DL01-0, OLED, 2560x1600, 16", 240 Hz | |
|---|---|---|---|---|---|---|
| Display | -4% | -0% | 1% | -5% | -2% | |
| APL18 Peak Brightness (cd/m²) | 609 | |||||
| HDR Peak Brightness (cd/m²) | 609 | |||||
| Display P3 Coverage (%) | 99.6 | 96 -4% | 99.5 0% | 99.7 0% | 96.6 -3% | 96.5 -3% |
| sRGB Coverage (%) | 100 | 100 0% | 100 0% | 100 0% | 99.8 0% | 99.2 -1% |
| AdobeRGB 1998 Coverage (%) | 95.6 | 89.2 -7% | 94.4 -1% | 98.2 3% | 84.4 -12% | 94.5 -1% |
| Response Times | -1606% | 0% | -6% | -1373% | -447% | |
| Response Time Grey 50% / Grey 80% * (ms) | 0.29 ? | 4.8 ? -1555% | 0.28 ? 3% | 0.29 ? -0% | 4.3 ? -1383% | 0.32 ? -10% |
| Response Time Black / White * (ms) | 0.41 ? | 7.2 ? -1656% | 0.43 ? -5% | 0.47 ? -15% | 6 ? -1363% | 6 ? -1363% |
| PWM Frequency (Hz) | 1440 ? | 1438 ? | 960 ? | 960 | ||
| PWM Amplitude * (%) | 30 | 29 3% | 31 -3% | 20 33% | ||
| Screen | -131% | -64% | -92% | -131% | -82% | |
| Brightness middle (cd/m²) | 383.3 | 554 45% | 490.4 28% | 376.5 -2% | 473 23% | 394 3% |
| Brightness (cd/m²) | 387 | 532 37% | 498 29% | 382 -1% | 426 10% | 398 3% |
| Brightness Distribution (%) | 97 | 88 -9% | 97 0% | 96 -1% | 85 -12% | 98 1% |
| Black Level * (cd/m²) | 0.52 | 0.42 | 0.0084 | |||
| Colorchecker dE 2000 * | 0.87 | 2.81 -223% | 3.2 -268% | 3.67 -322% | 3.47 -299% | 2.41 -177% |
| Colorchecker dE 2000 max. * | 2.23 | 8.32 -273% | 6.04 -171% | 7.24 -225% | 7.24 -225% | 3.82 -71% |
| Colorchecker dE 2000 calibrated * | 0.61 | 0.65 -7% | 0.84 -38% | 0.94 -54% | 1.36 -123% | 1.41 -131% |
| Greyscale dE 2000 * | 0.8 | 4.7 -488% | 1 -25% | 1.1 -38% | 3.1 -288% | 2.4 -200% |
| Gamma | 2.19 100% | 2.3 96% | 2.24 98% | 2.25 98% | 2.486 88% | 2.16 102% |
| CCT | 6395 102% | 6476 100% | 6373 102% | 6319 103% | 6832 95% | 6544 99% |
| Contrast (:1) | 1065 | 1126 | 46905 | |||
| Média Total (Programa/Configurações) | -580% /
-345% | -21% /
-34% | -32% /
-51% | -503% /
-306% | -177% /
-147% |
* ... menor é melhor
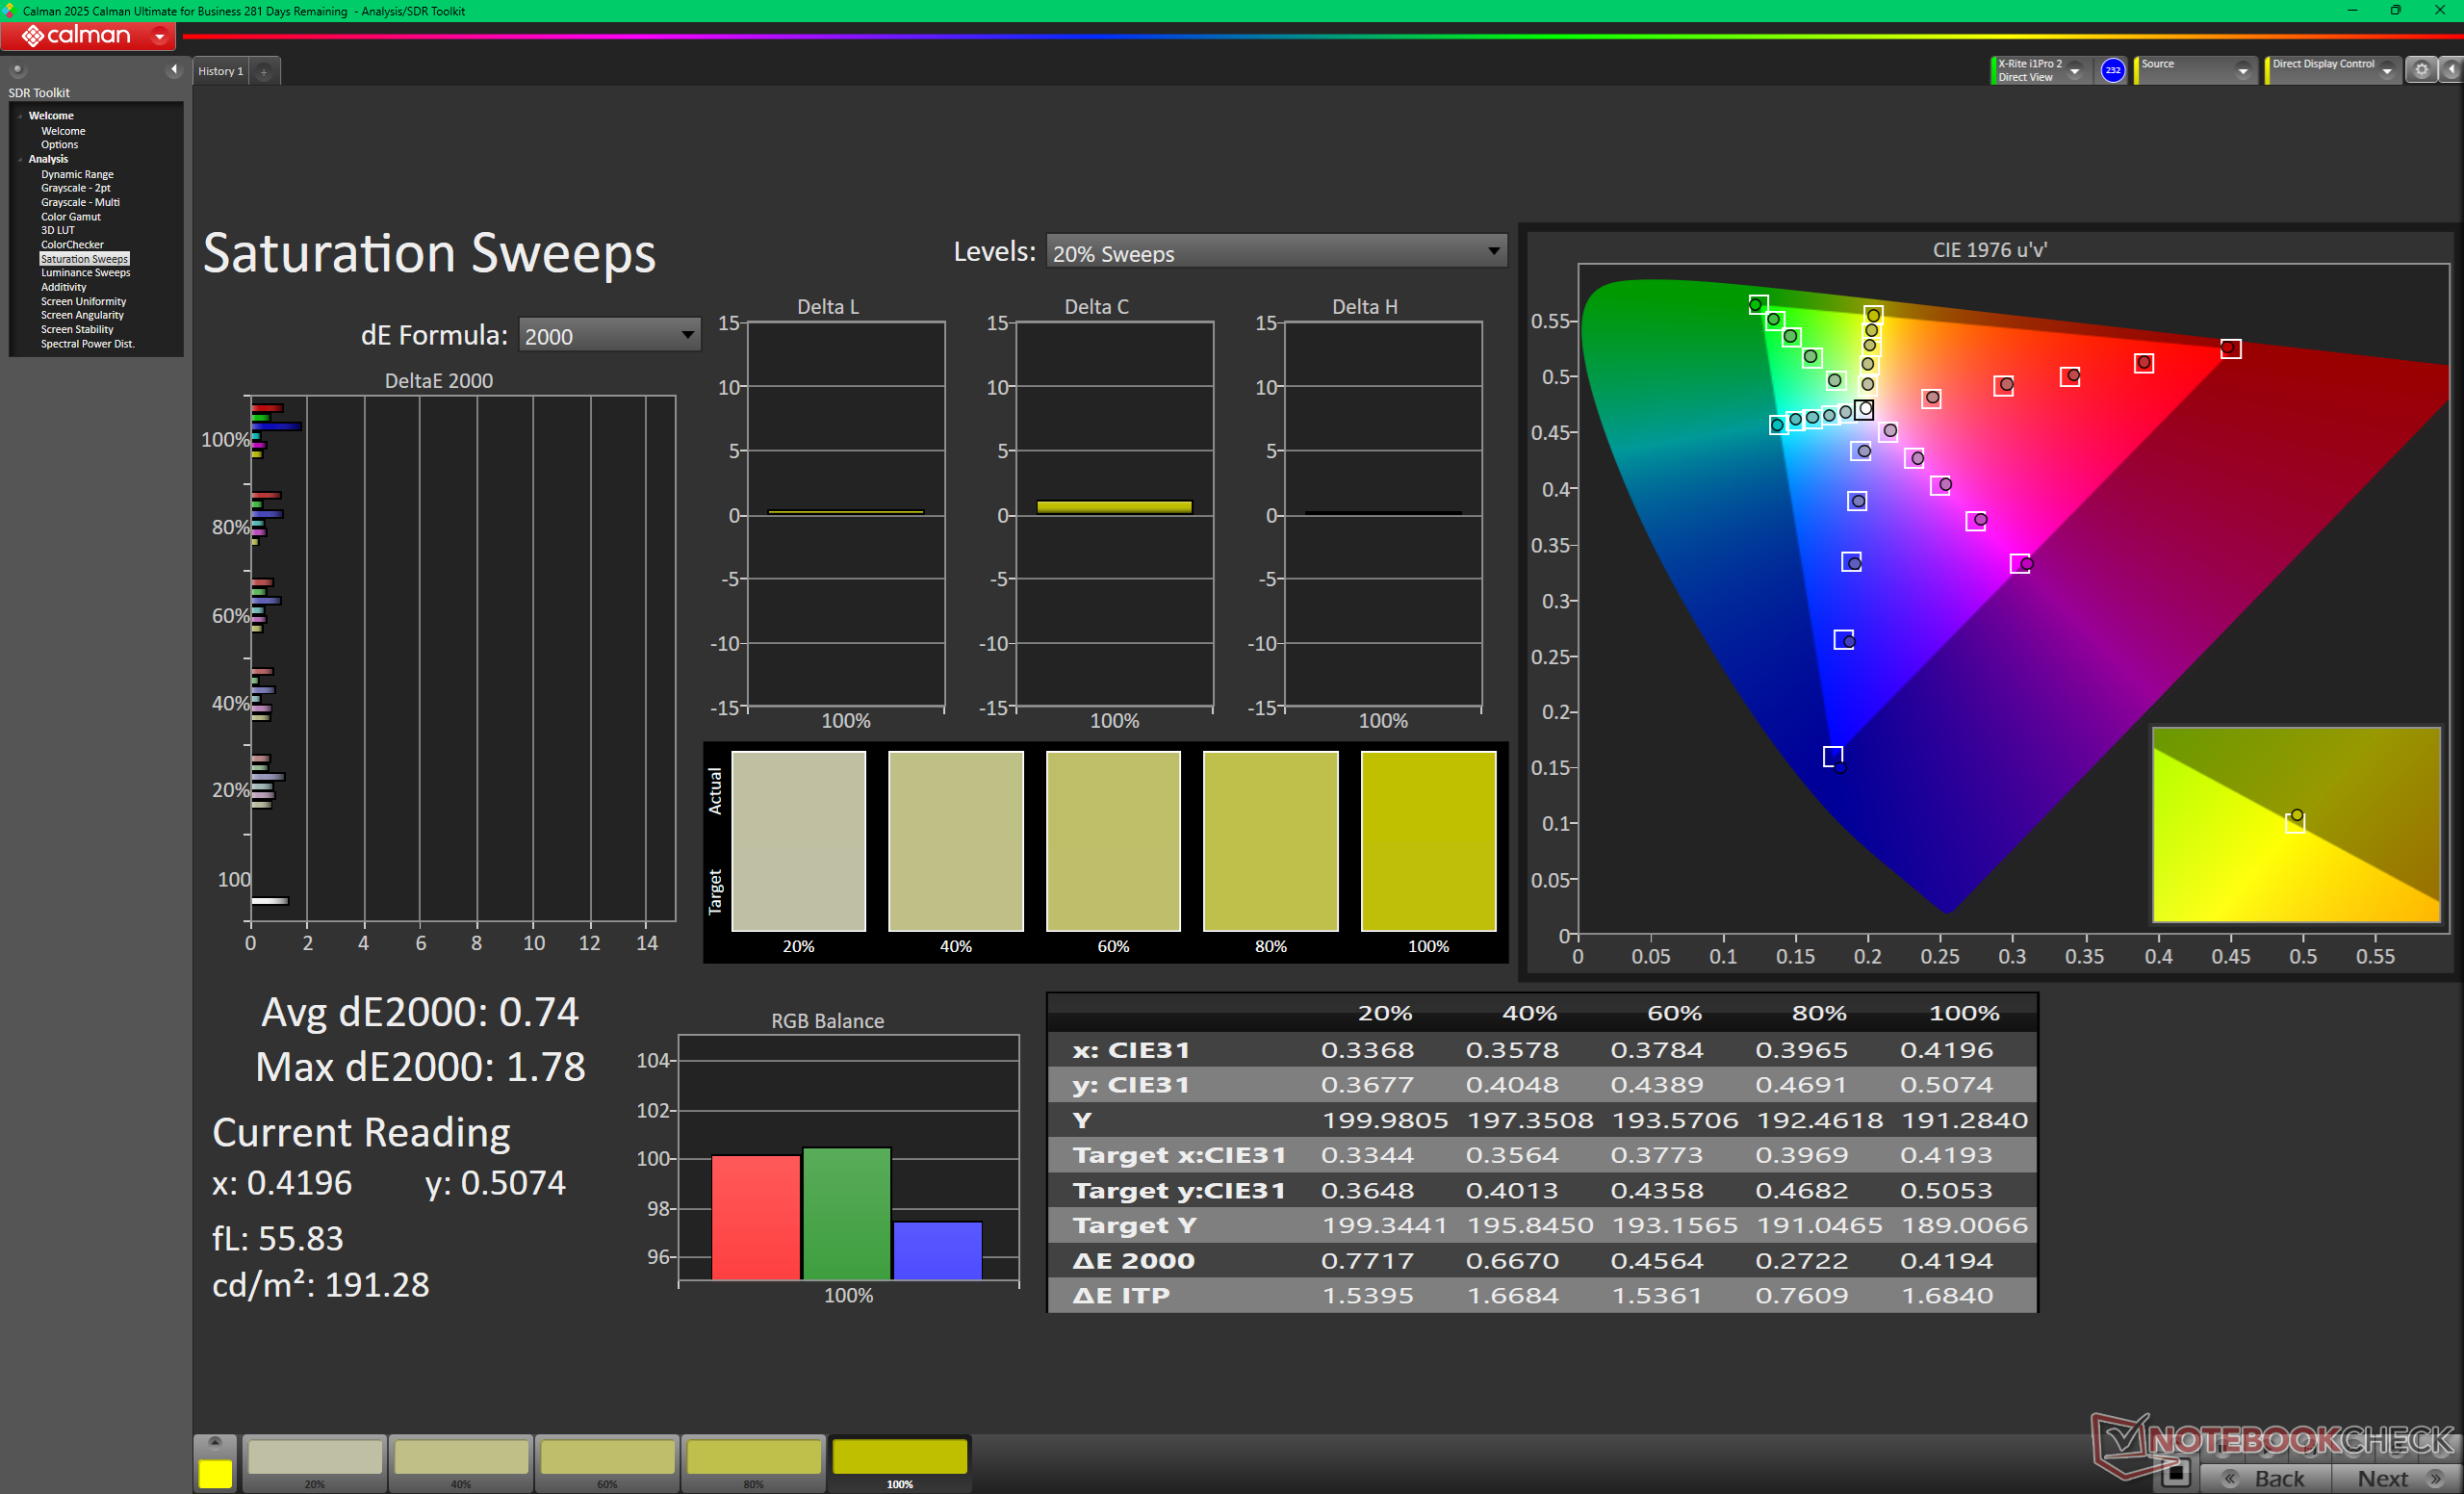
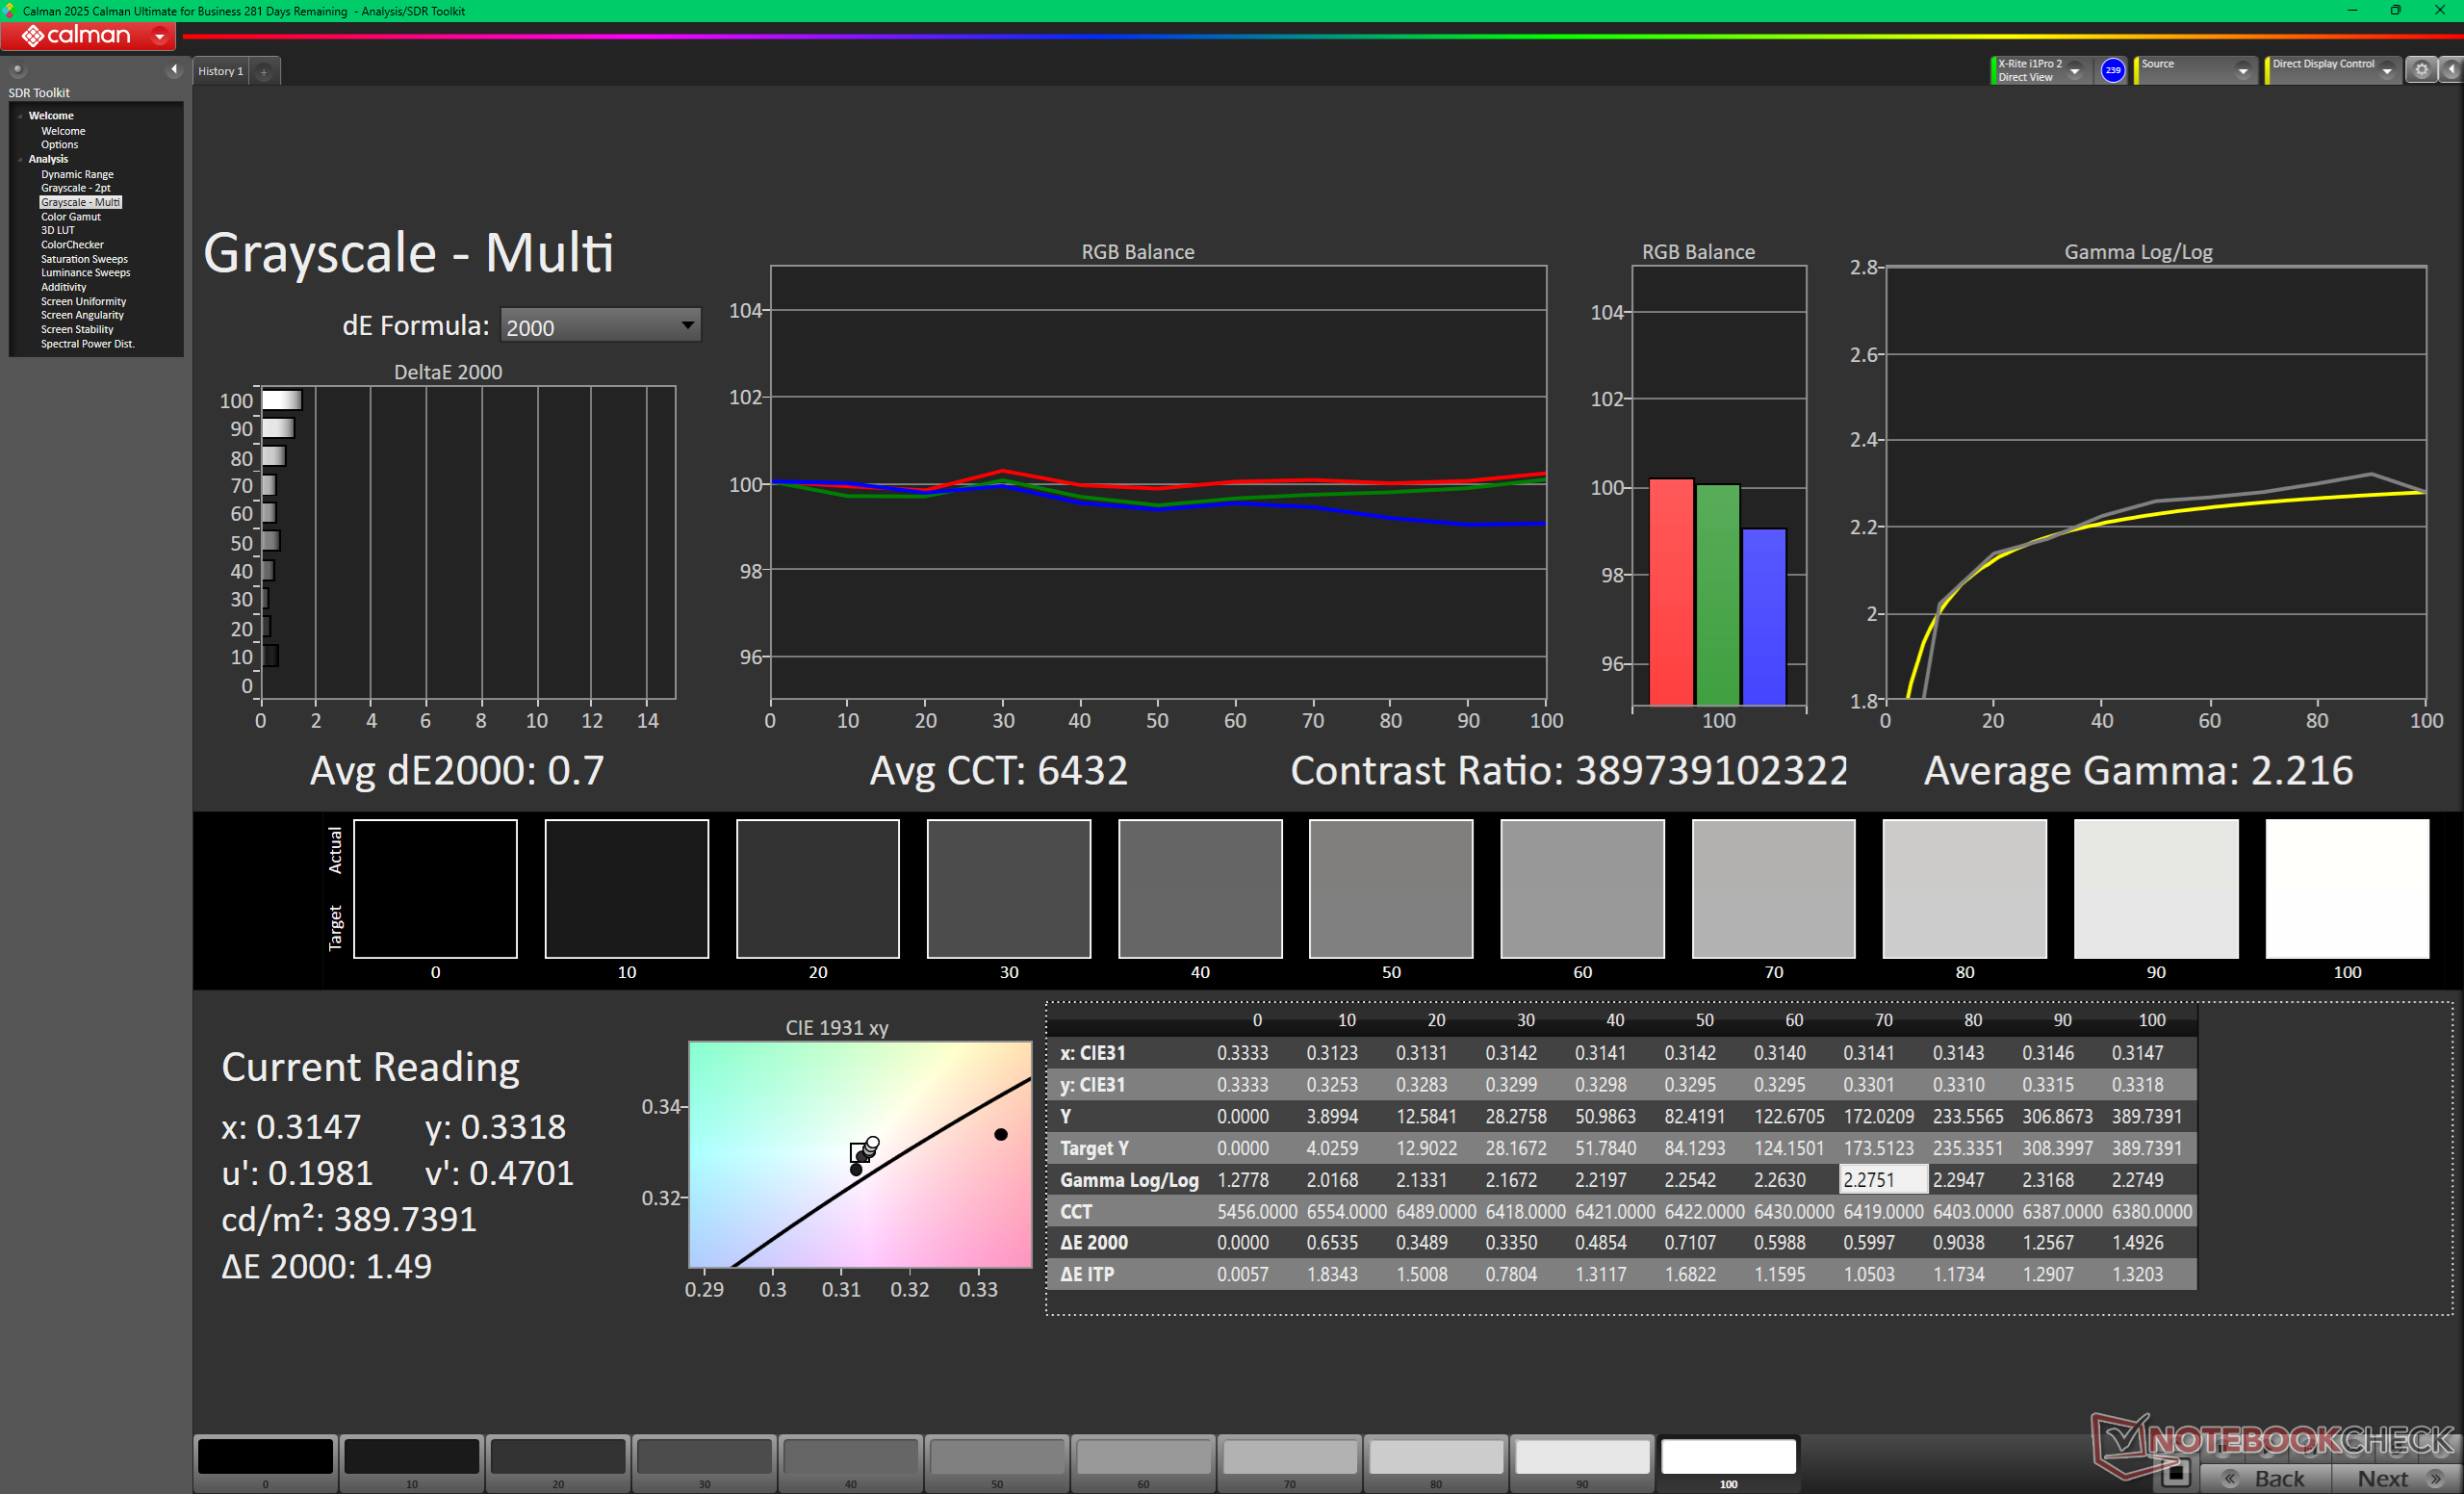
A tela vem bem calibrada e pronta para uso, com valores médios de deltaE bem abaixo de 2. A calibração do usuário final não deve ser necessária para a maioria dos casos.


Exibir tempos de resposta
| ↔ Tempo de resposta preto para branco | ||
|---|---|---|
| 0.41 ms ... ascensão ↗ e queda ↘ combinadas | ↗ 0.2 ms ascensão | 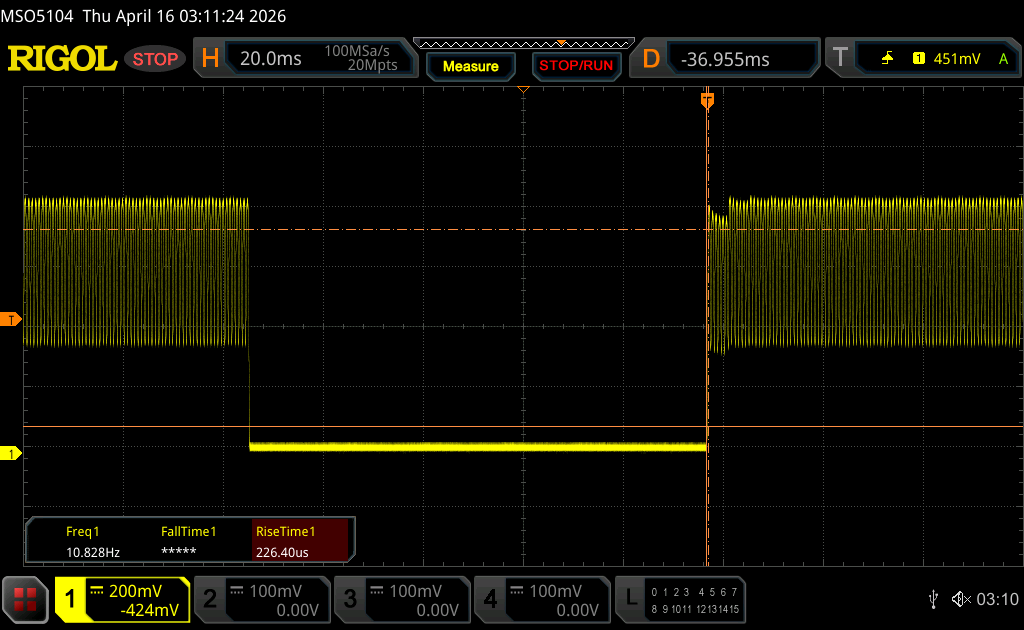 |
| ↘ 0.21 ms queda | ||
| A tela mostra taxas de resposta muito rápidas em nossos testes e deve ser muito adequada para jogos em ritmo acelerado. Em comparação, todos os dispositivos testados variam de 0.1 (mínimo) a 240 (máximo) ms. » 0 % de todos os dispositivos são melhores. Isso significa que o tempo de resposta medido é melhor que a média de todos os dispositivos testados (19.8 ms). | ||
| ↔ Tempo de resposta 50% cinza a 80% cinza | ||
| 0.29 ms ... ascensão ↗ e queda ↘ combinadas | ↗ 0.15 ms ascensão | 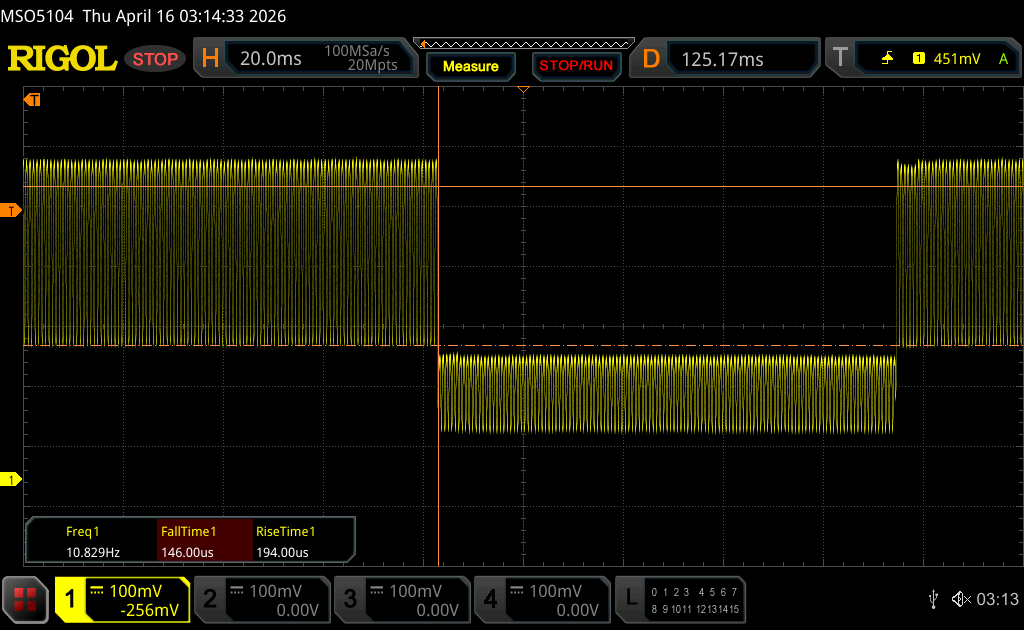 |
| ↘ 0.14 ms queda | ||
| A tela mostra taxas de resposta muito rápidas em nossos testes e deve ser muito adequada para jogos em ritmo acelerado. Em comparação, todos os dispositivos testados variam de 0.165 (mínimo) a 636 (máximo) ms. » 0 % de todos os dispositivos são melhores. Isso significa que o tempo de resposta medido é melhor que a média de todos os dispositivos testados (31 ms). | ||
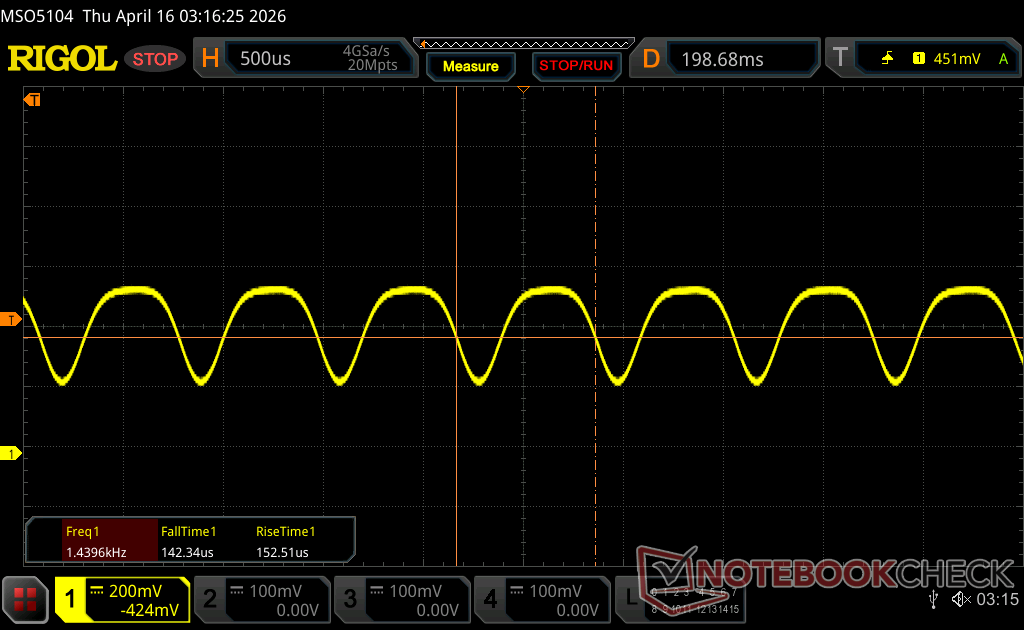
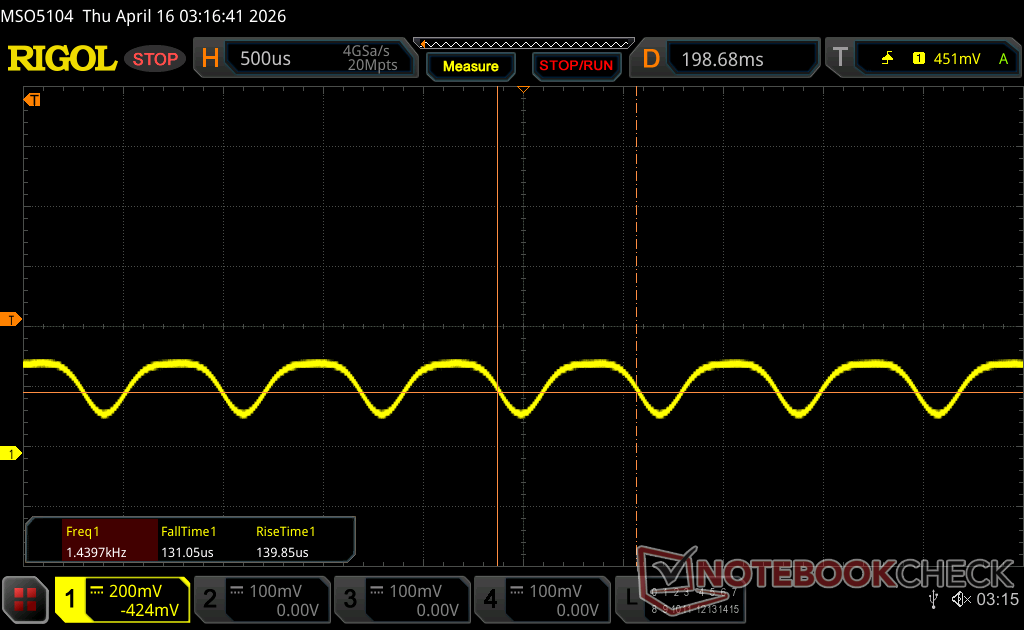
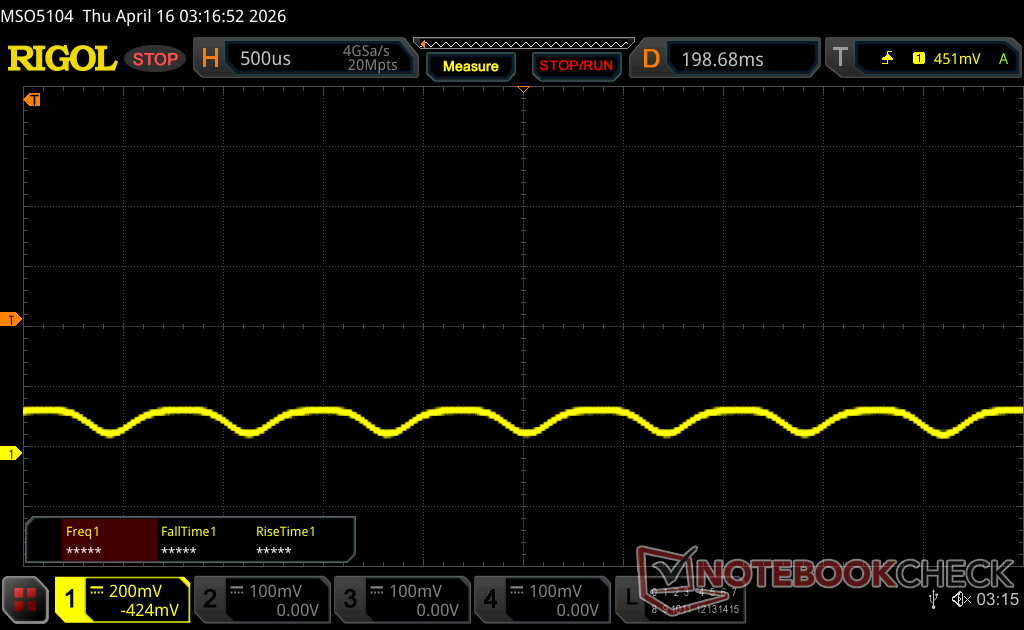
Cintilação da tela / PWM (modulação por largura de pulso)
| Tela tremeluzindo/PWM detectado | 1440 Hz Amplitude: 30 % | ≤ 100 % configuração de brilho | 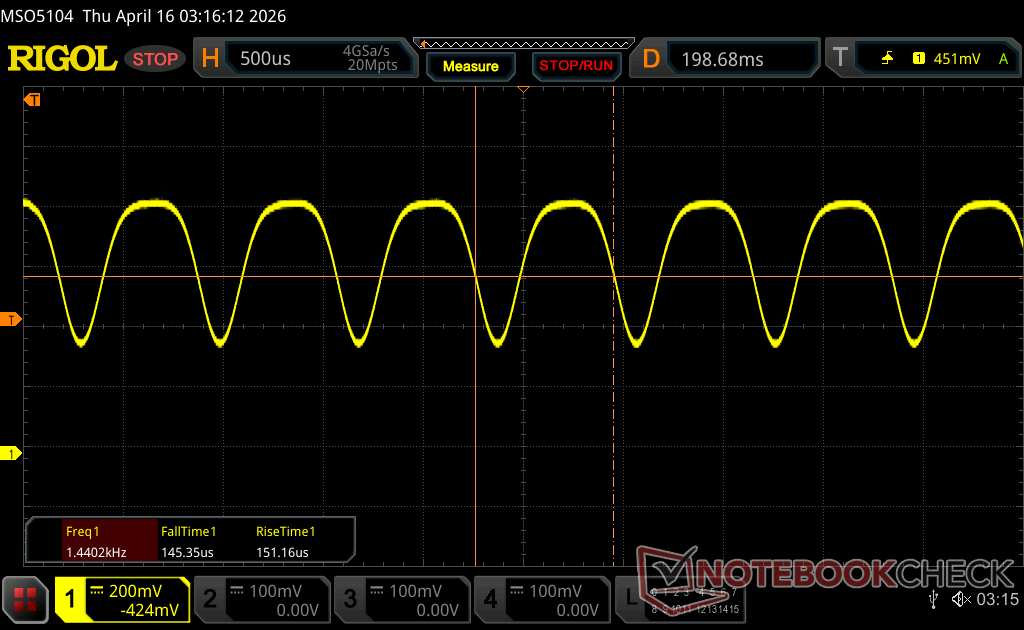 |
A luz de fundo da tela pisca em 1440 Hz (pior caso, por exemplo, utilizando PWM) Cintilação detectada em uma configuração de brilho de 100 % e abaixo. Não deve haver cintilação ou PWM acima desta configuração de brilho. A frequência de 1440 Hz é bastante alta, então a maioria dos usuários sensíveis ao PWM não deve notar nenhuma oscilação. [pwm_comparison] Em comparação: 52 % de todos os dispositivos testados não usam PWM para escurecer a tela. Se PWM foi detectado, uma média de 7747 (mínimo: 5 - máximo: 343500) Hz foi medida. | |||


Desempenho
Condições de teste
Colocamos o Windows no modo Performance e o Alienware Command Center no modo Overdrive antes de executar os benchmarks abaixo. O modo Overdrive é necessário para obter o máximo desempenho gráfico.
Processador
O Core Ultra 9 290HX Plus oferece desempenho single-thread e multi-thread até 15% e 25% mais rápido, respectivamente, em relação ao Core Ultra 9 275HX no Alienware 16 Area-51 do ano passado. Esse aumento coloca a CPU Arrow Lake em pé de igualdade com o concorrente Ryzen 9 9955HX3D.
Cinebench R15 Multi Loop
Cinebench R23: Multi Core | Single Core
Cinebench R20: CPU (Multi Core) | CPU (Single Core)
Cinebench R15: CPU Multi 64Bit | CPU Single 64Bit
Blender: v2.79 BMW27 CPU
7-Zip 18.03: 7z b 4 | 7z b 4 -mmt1
Geekbench 6.7: Multi-Core | Single-Core
Geekbench 5.5: Multi-Core | Single-Core
HWBOT x265 Benchmark v2.2: 4k Preset
LibreOffice : 20 Documents To PDF
R Benchmark 2.5: Overall mean
* ... menor é melhor
AIDA64: FP32 Ray-Trace | FPU Julia | CPU SHA3 | CPU Queen | FPU SinJulia | FPU Mandel | CPU AES | CPU ZLib | FP64 Ray-Trace | CPU PhotoWorxx | CPU CheckMate
| Performance rating | |
| Alienware 16 Area-51 Core Ultra 9 290HX Plus -1! | |
| Média Intel Core Ultra 9 290HX Plus -1! | |
| Lenovo Legion Pro 7i 16 Gen 10 -1! | |
| Alienware 16 Area-51 -1! | |
| HP Omen Max 16 ah000 -1! | |
| MSI Vector 16 HX AI A2XWHG -1! | |
| Asus ROG Zephyrus G16 GU605CW -1! | |
| AIDA64 / FP32 Ray-Trace | |
| Alienware 16 Area-51 Core Ultra 9 290HX Plus (v8.20.8100) | |
| Média Intel Core Ultra 9 290HX Plus (34761 - 40761, n=4) | |
| Lenovo Legion Pro 7i 16 Gen 10 (v6.92.6600) | |
| Alienware 16 Area-51 (v6.92.6600) | |
| HP Omen Max 16 ah000 (v6.92.6600) | |
| MSI Vector 16 HX AI A2XWHG (v6.92.6600) | |
| Asus ROG Zephyrus G16 GU605CW (v6.92.6600) | |
| AIDA64 / FPU Julia | |
| Alienware 16 Area-51 Core Ultra 9 290HX Plus (v8.20.8100) | |
| Média Intel Core Ultra 9 290HX Plus (174665 - 208083, n=4) | |
| Lenovo Legion Pro 7i 16 Gen 10 (v6.92.6600) | |
| HP Omen Max 16 ah000 (v6.92.6600) | |
| Alienware 16 Area-51 (v6.92.6600) | |
| MSI Vector 16 HX AI A2XWHG (v6.92.6600) | |
| Asus ROG Zephyrus G16 GU605CW (v6.92.6600) | |
| AIDA64 / CPU SHA3 | |
| Alienware 16 Area-51 Core Ultra 9 290HX Plus (v8.20.8100) | |
| Média Intel Core Ultra 9 290HX Plus (8352 - 9784, n=4) | |
| Lenovo Legion Pro 7i 16 Gen 10 (v6.92.6600) | |
| Alienware 16 Area-51 (v6.92.6600) | |
| HP Omen Max 16 ah000 (v6.92.6600) | |
| MSI Vector 16 HX AI A2XWHG (v6.92.6600) | |
| Asus ROG Zephyrus G16 GU605CW (v6.92.6600) | |
| AIDA64 / CPU Queen | |
| Lenovo Legion Pro 7i 16 Gen 10 (v6.92.6600) | |
| Alienware 16 Area-51 (v6.92.6600) | |
| HP Omen Max 16 ah000 (v6.92.6600) | |
| MSI Vector 16 HX AI A2XWHG (v6.92.6600) | |
| Asus ROG Zephyrus G16 GU605CW (v6.92.6600) | |
| AIDA64 / FPU SinJulia | |
| Lenovo Legion Pro 7i 16 Gen 10 (v6.92.6600) | |
| Média Intel Core Ultra 9 290HX Plus (13612 - 14461, n=4) | |
| Alienware 16 Area-51 Core Ultra 9 290HX Plus (v8.20.8100) | |
| Alienware 16 Area-51 (v6.92.6600) | |
| HP Omen Max 16 ah000 (v6.92.6600) | |
| MSI Vector 16 HX AI A2XWHG (v6.92.6600) | |
| Asus ROG Zephyrus G16 GU605CW (v6.92.6600) | |
| AIDA64 / FPU Mandel | |
| Alienware 16 Area-51 Core Ultra 9 290HX Plus (v8.20.8100) | |
| Média Intel Core Ultra 9 290HX Plus (91215 - 108275, n=4) | |
| Lenovo Legion Pro 7i 16 Gen 10 (v6.92.6600) | |
| HP Omen Max 16 ah000 (v6.92.6600) | |
| Alienware 16 Area-51 (v6.92.6600) | |
| MSI Vector 16 HX AI A2XWHG (v6.92.6600) | |
| Asus ROG Zephyrus G16 GU605CW (v6.92.6600) | |
| AIDA64 / CPU AES | |
| Lenovo Legion Pro 7i 16 Gen 10 (v6.92.6600) | |
| Média Intel Core Ultra 9 290HX Plus (127585 - 136781, n=4) | |
| Alienware 16 Area-51 Core Ultra 9 290HX Plus (v8.20.8100) | |
| Alienware 16 Area-51 (v6.92.6600) | |
| HP Omen Max 16 ah000 (v6.92.6600) | |
| MSI Vector 16 HX AI A2XWHG (v6.92.6600) | |
| Asus ROG Zephyrus G16 GU605CW (v6.92.6600) | |
| AIDA64 / CPU ZLib | |
| Alienware 16 Area-51 Core Ultra 9 290HX Plus (v8.20.8100) | |
| Média Intel Core Ultra 9 290HX Plus (1967 - 2206, n=4) | |
| Lenovo Legion Pro 7i 16 Gen 10 (v6.92.6600) | |
| Alienware 16 Area-51 (v6.92.6600) | |
| HP Omen Max 16 ah000 (v6.92.6600) | |
| MSI Vector 16 HX AI A2XWHG (v6.92.6600) | |
| Asus ROG Zephyrus G16 GU605CW (v6.92.6600) | |
| AIDA64 / FP64 Ray-Trace | |
| Alienware 16 Area-51 Core Ultra 9 290HX Plus (v8.20.8100) | |
| Média Intel Core Ultra 9 290HX Plus (18611 - 21949, n=4) | |
| Lenovo Legion Pro 7i 16 Gen 10 (v6.92.6600) | |
| Alienware 16 Area-51 (v6.92.6600) | |
| HP Omen Max 16 ah000 (v6.92.6600) | |
| MSI Vector 16 HX AI A2XWHG (v6.92.6600) | |
| Asus ROG Zephyrus G16 GU605CW (v6.92.6600) | |
| AIDA64 / CPU PhotoWorxx | |
| Asus ROG Zephyrus G16 GU605CW (v6.92.6600) | |
| Alienware 16 Area-51 Core Ultra 9 290HX Plus (v8.20.8100) | |
| Lenovo Legion Pro 7i 16 Gen 10 (v6.92.6600) | |
| Alienware 16 Area-51 (v6.92.6600) | |
| Média Intel Core Ultra 9 290HX Plus (51134 - 55731, n=4) | |
| HP Omen Max 16 ah000 (v6.92.6600) | |
| MSI Vector 16 HX AI A2XWHG (v6.92.6600) | |
| AIDA64 / CPU CheckMate | |
| Alienware 16 Area-51 Core Ultra 9 290HX Plus (v8.20.8100) | |
| Média Intel Core Ultra 9 290HX Plus (7624 - 8322, n=4) | |
Desempenho do sistema
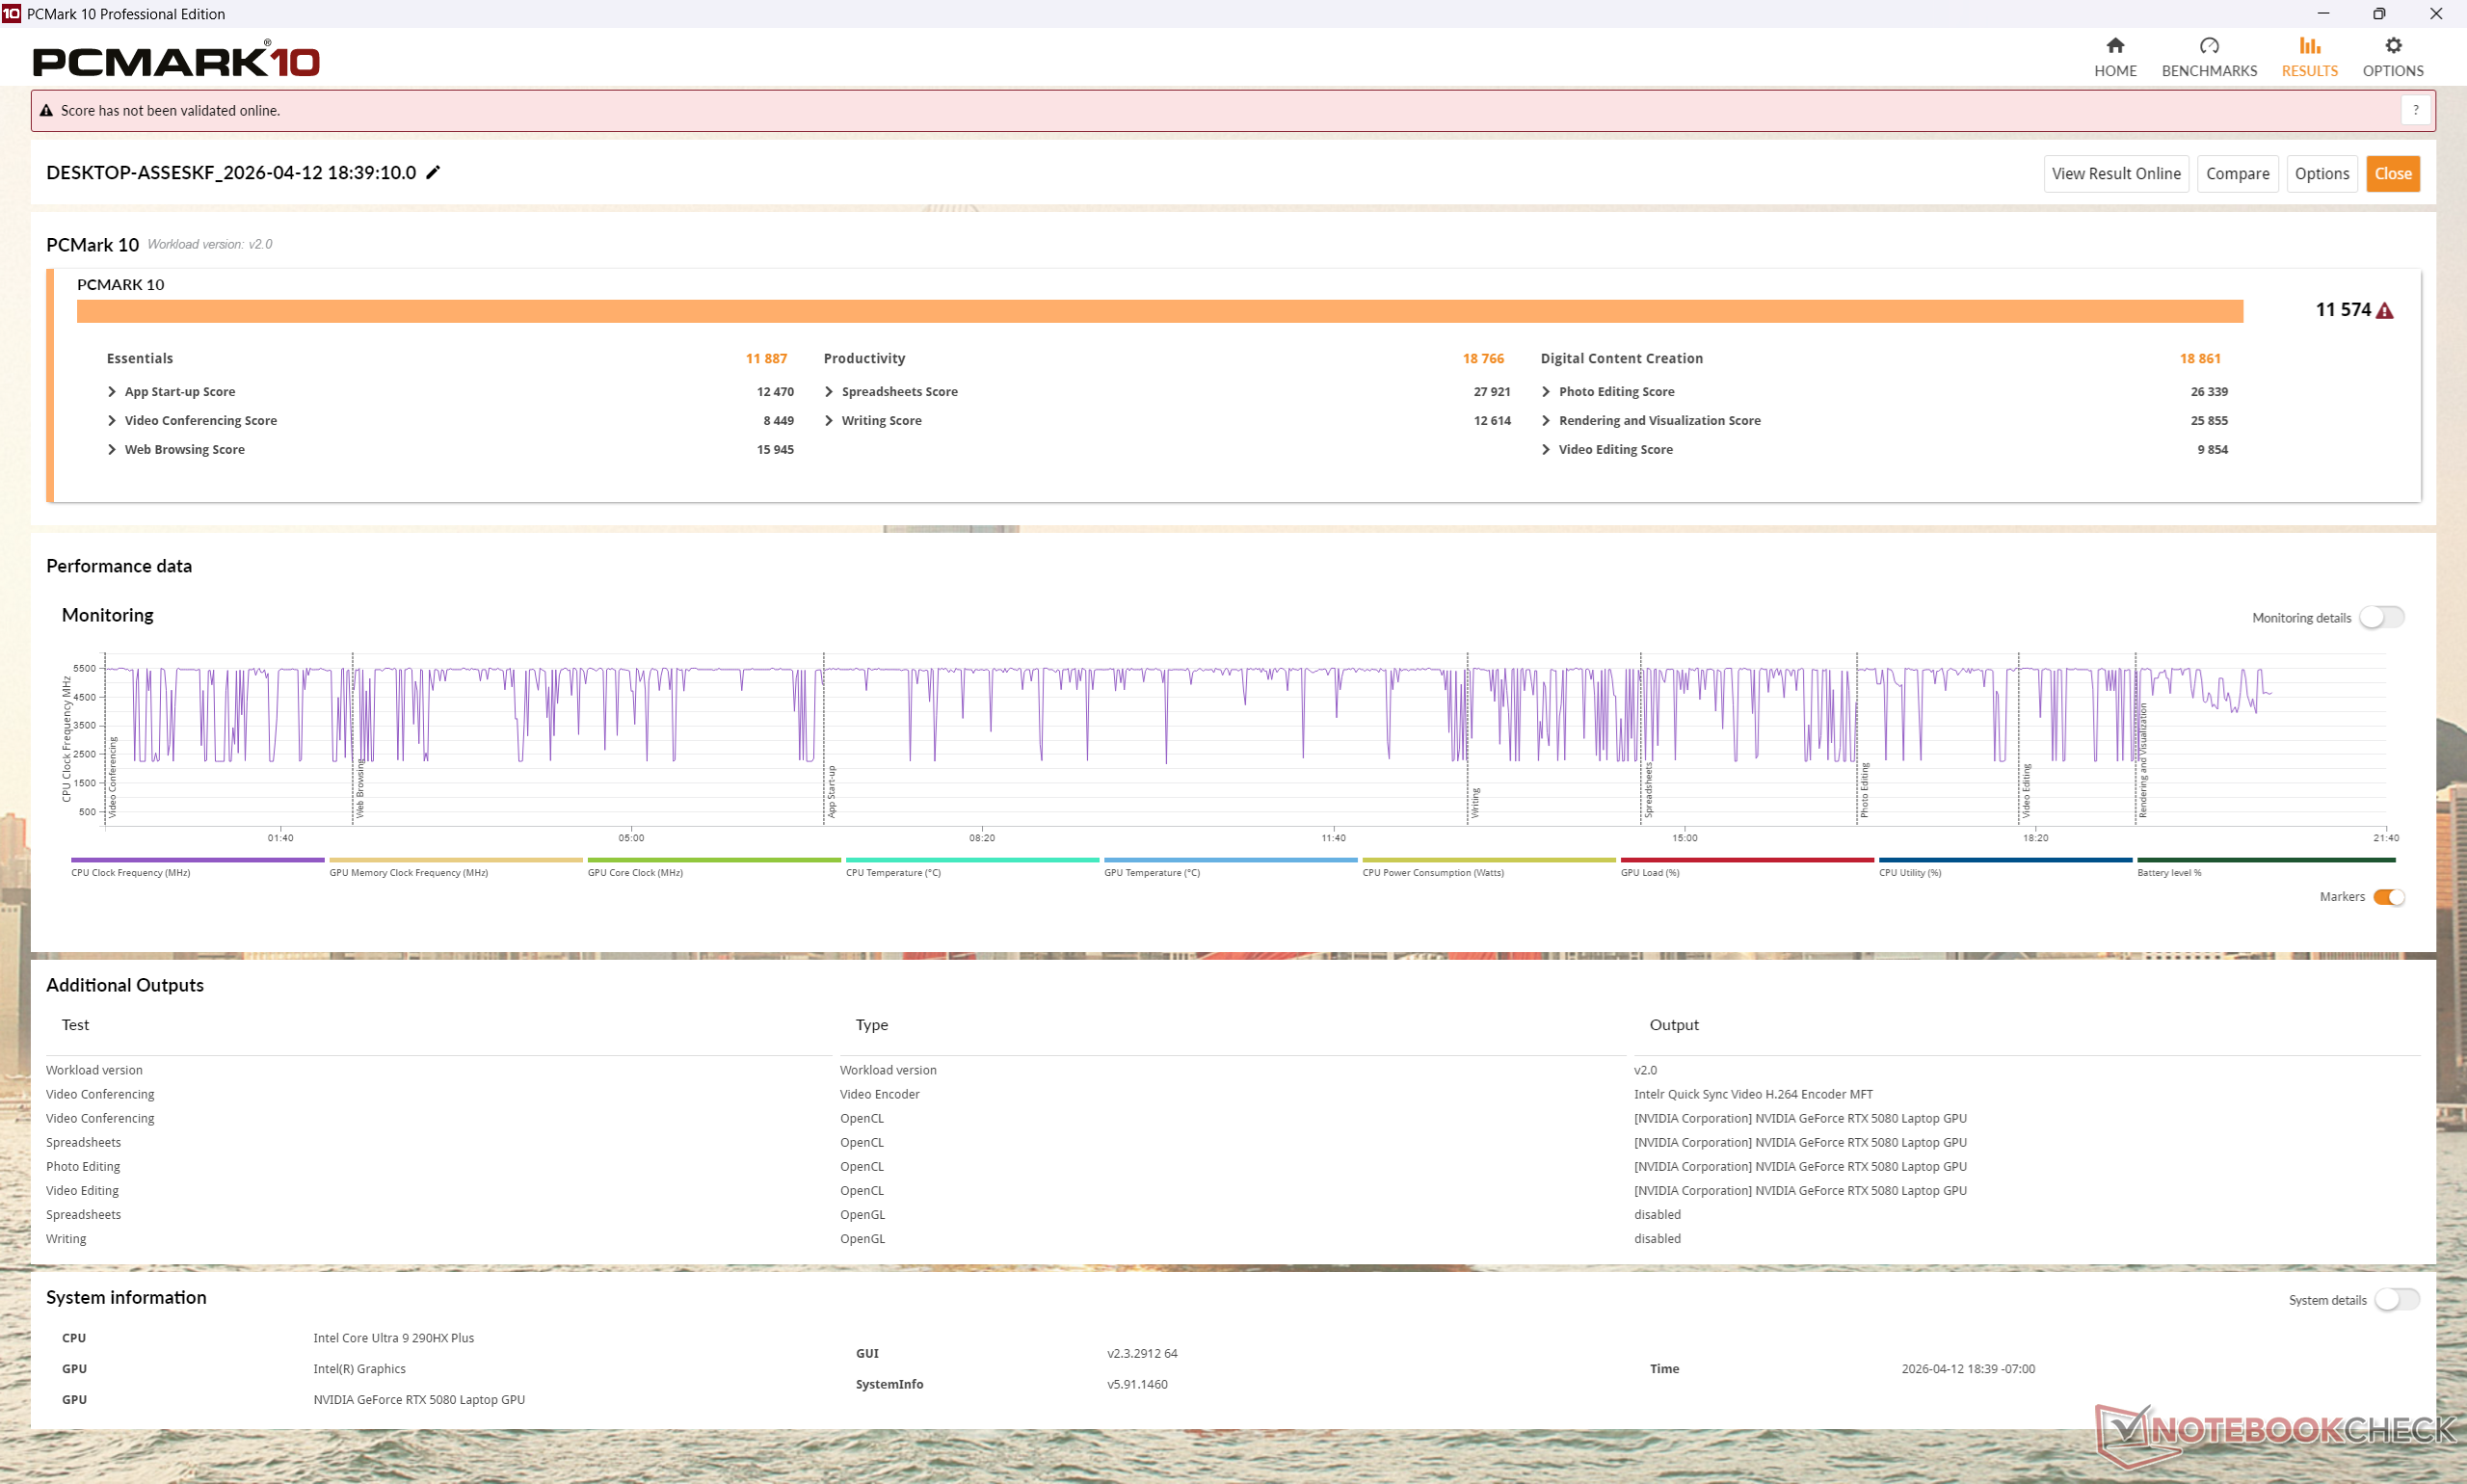
PCMark 10: Score | Essentials | Productivity | Digital Content Creation
CrossMark: Overall | Productivity | Creativity | Responsiveness
WebXPRT 3: Overall
WebXPRT 4: Overall
Mozilla Kraken 1.1: Total
| Performance rating | |
| Alienware 16 Area-51 Core Ultra 9 290HX Plus | |
| Média Intel Core Ultra 9 290HX Plus, NVIDIA GeForce RTX 5080 Laptop | |
| Alienware 16 Area-51 | |
| Lenovo Legion Pro 7i 16 Gen 10 | |
| HP Omen Max 16 ah000 -1! | |
| MSI Vector 16 HX AI A2XWHG | |
| Asus ROG Zephyrus G16 GU605CW | |
| PCMark 10 / Score | |
| Alienware 16 Area-51 Core Ultra 9 290HX Plus | |
| Média Intel Core Ultra 9 290HX Plus, NVIDIA GeForce RTX 5080 Laptop (n=1) | |
| Lenovo Legion Pro 7i 16 Gen 10 | |
| HP Omen Max 16 ah000 | |
| Alienware 16 Area-51 | |
| MSI Vector 16 HX AI A2XWHG | |
| Asus ROG Zephyrus G16 GU605CW | |
| PCMark 10 / Essentials | |
| Alienware 16 Area-51 Core Ultra 9 290HX Plus | |
| Média Intel Core Ultra 9 290HX Plus, NVIDIA GeForce RTX 5080 Laptop (n=1) | |
| Lenovo Legion Pro 7i 16 Gen 10 | |
| Alienware 16 Area-51 | |
| HP Omen Max 16 ah000 | |
| MSI Vector 16 HX AI A2XWHG | |
| Asus ROG Zephyrus G16 GU605CW | |
| PCMark 10 / Productivity | |
| Alienware 16 Area-51 Core Ultra 9 290HX Plus | |
| Média Intel Core Ultra 9 290HX Plus, NVIDIA GeForce RTX 5080 Laptop (n=1) | |
| Lenovo Legion Pro 7i 16 Gen 10 | |
| MSI Vector 16 HX AI A2XWHG | |
| Alienware 16 Area-51 | |
| HP Omen Max 16 ah000 | |
| Asus ROG Zephyrus G16 GU605CW | |
| PCMark 10 / Digital Content Creation | |
| Lenovo Legion Pro 7i 16 Gen 10 | |
| Alienware 16 Area-51 Core Ultra 9 290HX Plus | |
| Média Intel Core Ultra 9 290HX Plus, NVIDIA GeForce RTX 5080 Laptop (n=1) | |
| HP Omen Max 16 ah000 | |
| Alienware 16 Area-51 | |
| Asus ROG Zephyrus G16 GU605CW | |
| MSI Vector 16 HX AI A2XWHG | |
| CrossMark / Overall | |
| Alienware 16 Area-51 Core Ultra 9 290HX Plus | |
| Média Intel Core Ultra 9 290HX Plus, NVIDIA GeForce RTX 5080 Laptop (n=1) | |
| Alienware 16 Area-51 | |
| Lenovo Legion Pro 7i 16 Gen 10 | |
| HP Omen Max 16 ah000 | |
| MSI Vector 16 HX AI A2XWHG | |
| Asus ROG Zephyrus G16 GU605CW | |
| CrossMark / Productivity | |
| Alienware 16 Area-51 Core Ultra 9 290HX Plus | |
| Média Intel Core Ultra 9 290HX Plus, NVIDIA GeForce RTX 5080 Laptop (n=1) | |
| Alienware 16 Area-51 | |
| Lenovo Legion Pro 7i 16 Gen 10 | |
| HP Omen Max 16 ah000 | |
| MSI Vector 16 HX AI A2XWHG | |
| Asus ROG Zephyrus G16 GU605CW | |
| CrossMark / Creativity | |
| Alienware 16 Area-51 Core Ultra 9 290HX Plus | |
| Média Intel Core Ultra 9 290HX Plus, NVIDIA GeForce RTX 5080 Laptop (n=1) | |
| Alienware 16 Area-51 | |
| Lenovo Legion Pro 7i 16 Gen 10 | |
| HP Omen Max 16 ah000 | |
| MSI Vector 16 HX AI A2XWHG | |
| Asus ROG Zephyrus G16 GU605CW | |
| CrossMark / Responsiveness | |
| Alienware 16 Area-51 Core Ultra 9 290HX Plus | |
| Média Intel Core Ultra 9 290HX Plus, NVIDIA GeForce RTX 5080 Laptop (n=1) | |
| Alienware 16 Area-51 | |
| HP Omen Max 16 ah000 | |
| Lenovo Legion Pro 7i 16 Gen 10 | |
| MSI Vector 16 HX AI A2XWHG | |
| Asus ROG Zephyrus G16 GU605CW | |
| WebXPRT 3 / Overall | |
| Alienware 16 Area-51 Core Ultra 9 290HX Plus | |
| Média Intel Core Ultra 9 290HX Plus, NVIDIA GeForce RTX 5080 Laptop (n=1) | |
| HP Omen Max 16 ah000 | |
| Lenovo Legion Pro 7i 16 Gen 10 | |
| Alienware 16 Area-51 | |
| MSI Vector 16 HX AI A2XWHG | |
| Asus ROG Zephyrus G16 GU605CW | |
| WebXPRT 4 / Overall | |
| Alienware 16 Area-51 Core Ultra 9 290HX Plus | |
| Média Intel Core Ultra 9 290HX Plus, NVIDIA GeForce RTX 5080 Laptop (n=1) | |
| Lenovo Legion Pro 7i 16 Gen 10 | |
| Alienware 16 Area-51 | |
| MSI Vector 16 HX AI A2XWHG | |
| Asus ROG Zephyrus G16 GU605CW | |
| Mozilla Kraken 1.1 / Total | |
| Asus ROG Zephyrus G16 GU605CW | |
| MSI Vector 16 HX AI A2XWHG | |
| HP Omen Max 16 ah000 | |
| Alienware 16 Area-51 | |
| Lenovo Legion Pro 7i 16 Gen 10 | |
| Alienware 16 Area-51 Core Ultra 9 290HX Plus | |
| Média Intel Core Ultra 9 290HX Plus, NVIDIA GeForce RTX 5080 Laptop (n=1) | |
* ... menor é melhor
| PCMark 10 Score | 11574 pontos | |
Ajuda | ||
| AIDA64 / Memory Copy | |
| Asus ROG Zephyrus G16 GU605CW | |
| Alienware 16 Area-51 Core Ultra 9 290HX Plus | |
| Alienware 16 Area-51 | |
| Lenovo Legion Pro 7i 16 Gen 10 | |
| Média Intel Core Ultra 9 290HX Plus (76912 - 86055, n=4) | |
| HP Omen Max 16 ah000 | |
| MSI Vector 16 HX AI A2XWHG | |
| AIDA64 / Memory Read | |
| Lenovo Legion Pro 7i 16 Gen 10 | |
| Alienware 16 Area-51 Core Ultra 9 290HX Plus | |
| Alienware 16 Area-51 | |
| Média Intel Core Ultra 9 290HX Plus (84638 - 96309, n=4) | |
| HP Omen Max 16 ah000 | |
| MSI Vector 16 HX AI A2XWHG | |
| Asus ROG Zephyrus G16 GU605CW | |
| AIDA64 / Memory Write | |
| Lenovo Legion Pro 7i 16 Gen 10 | |
| Alienware 16 Area-51 | |
| Alienware 16 Area-51 Core Ultra 9 290HX Plus | |
| Média Intel Core Ultra 9 290HX Plus (76094 - 85001, n=4) | |
| HP Omen Max 16 ah000 | |
| Asus ROG Zephyrus G16 GU605CW | |
| MSI Vector 16 HX AI A2XWHG | |
| AIDA64 / Memory Latency | |
| Asus ROG Zephyrus G16 GU605CW | |
| Alienware 16 Area-51 | |
| HP Omen Max 16 ah000 | |
| Lenovo Legion Pro 7i 16 Gen 10 | |
| MSI Vector 16 HX AI A2XWHG | |
| Alienware 16 Area-51 Core Ultra 9 290HX Plus | |
| Média Intel Core Ultra 9 290HX Plus (100.7 - 108.4, n=4) | |
* ... menor é melhor
Latência DPC
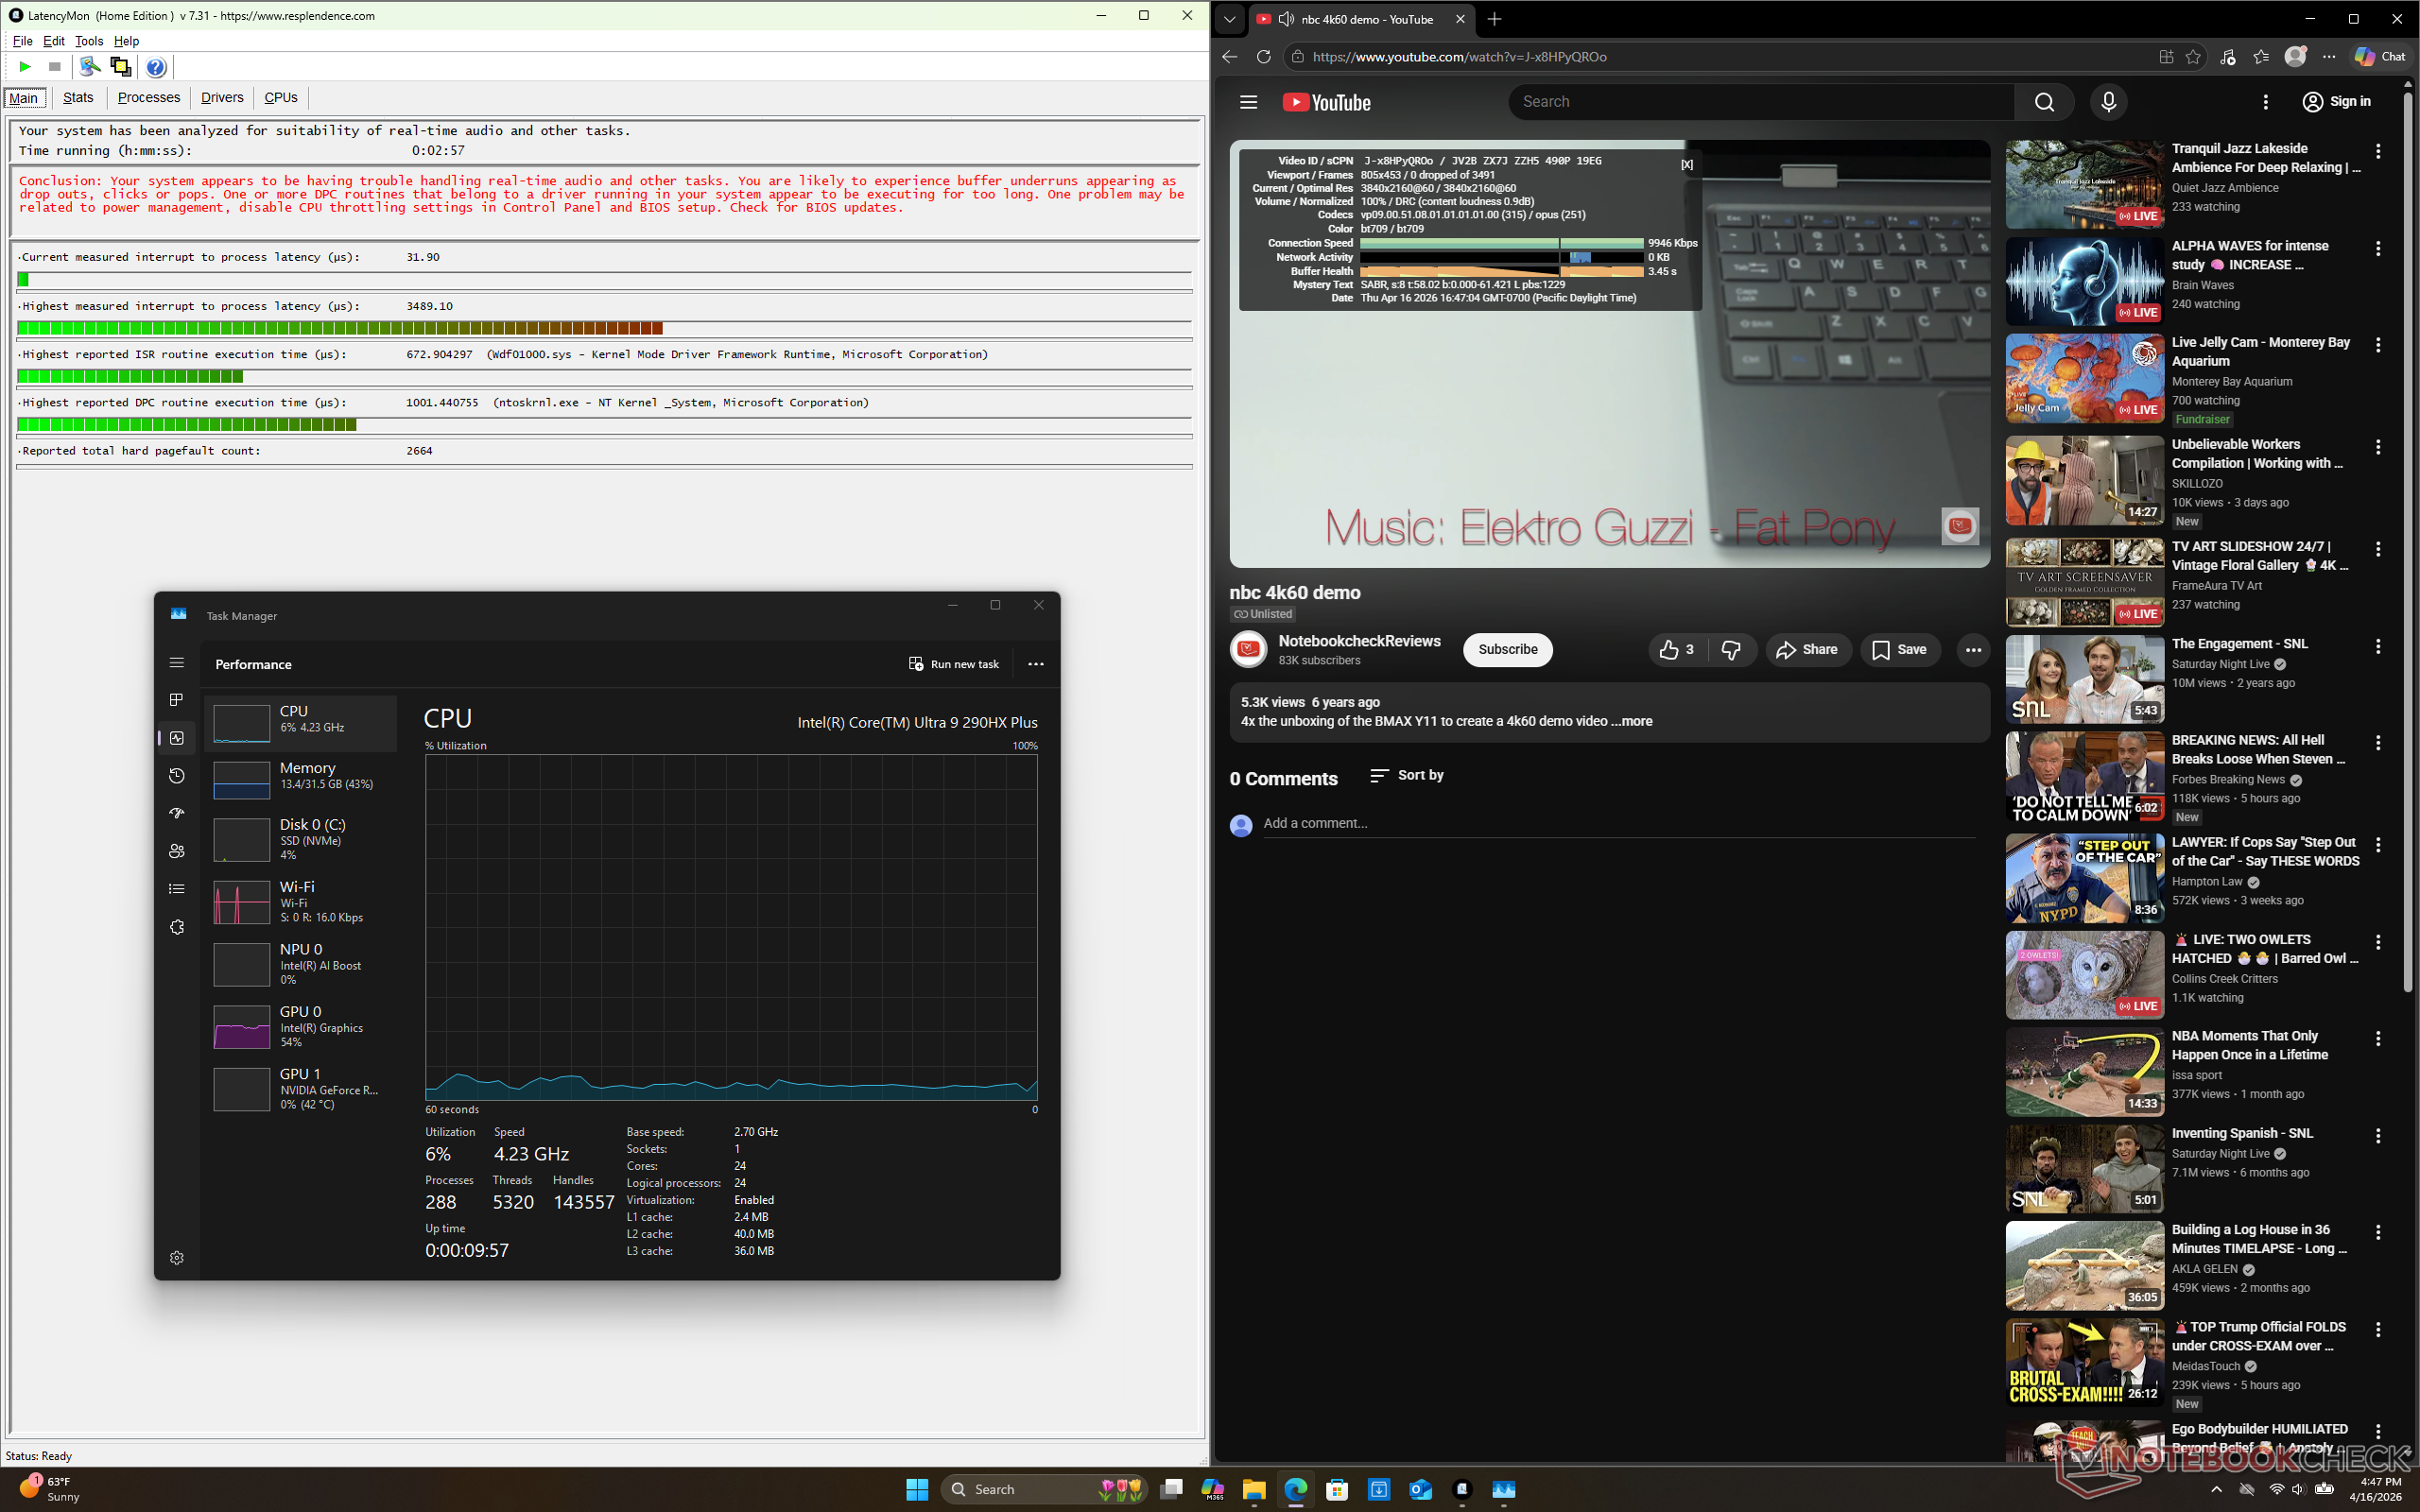
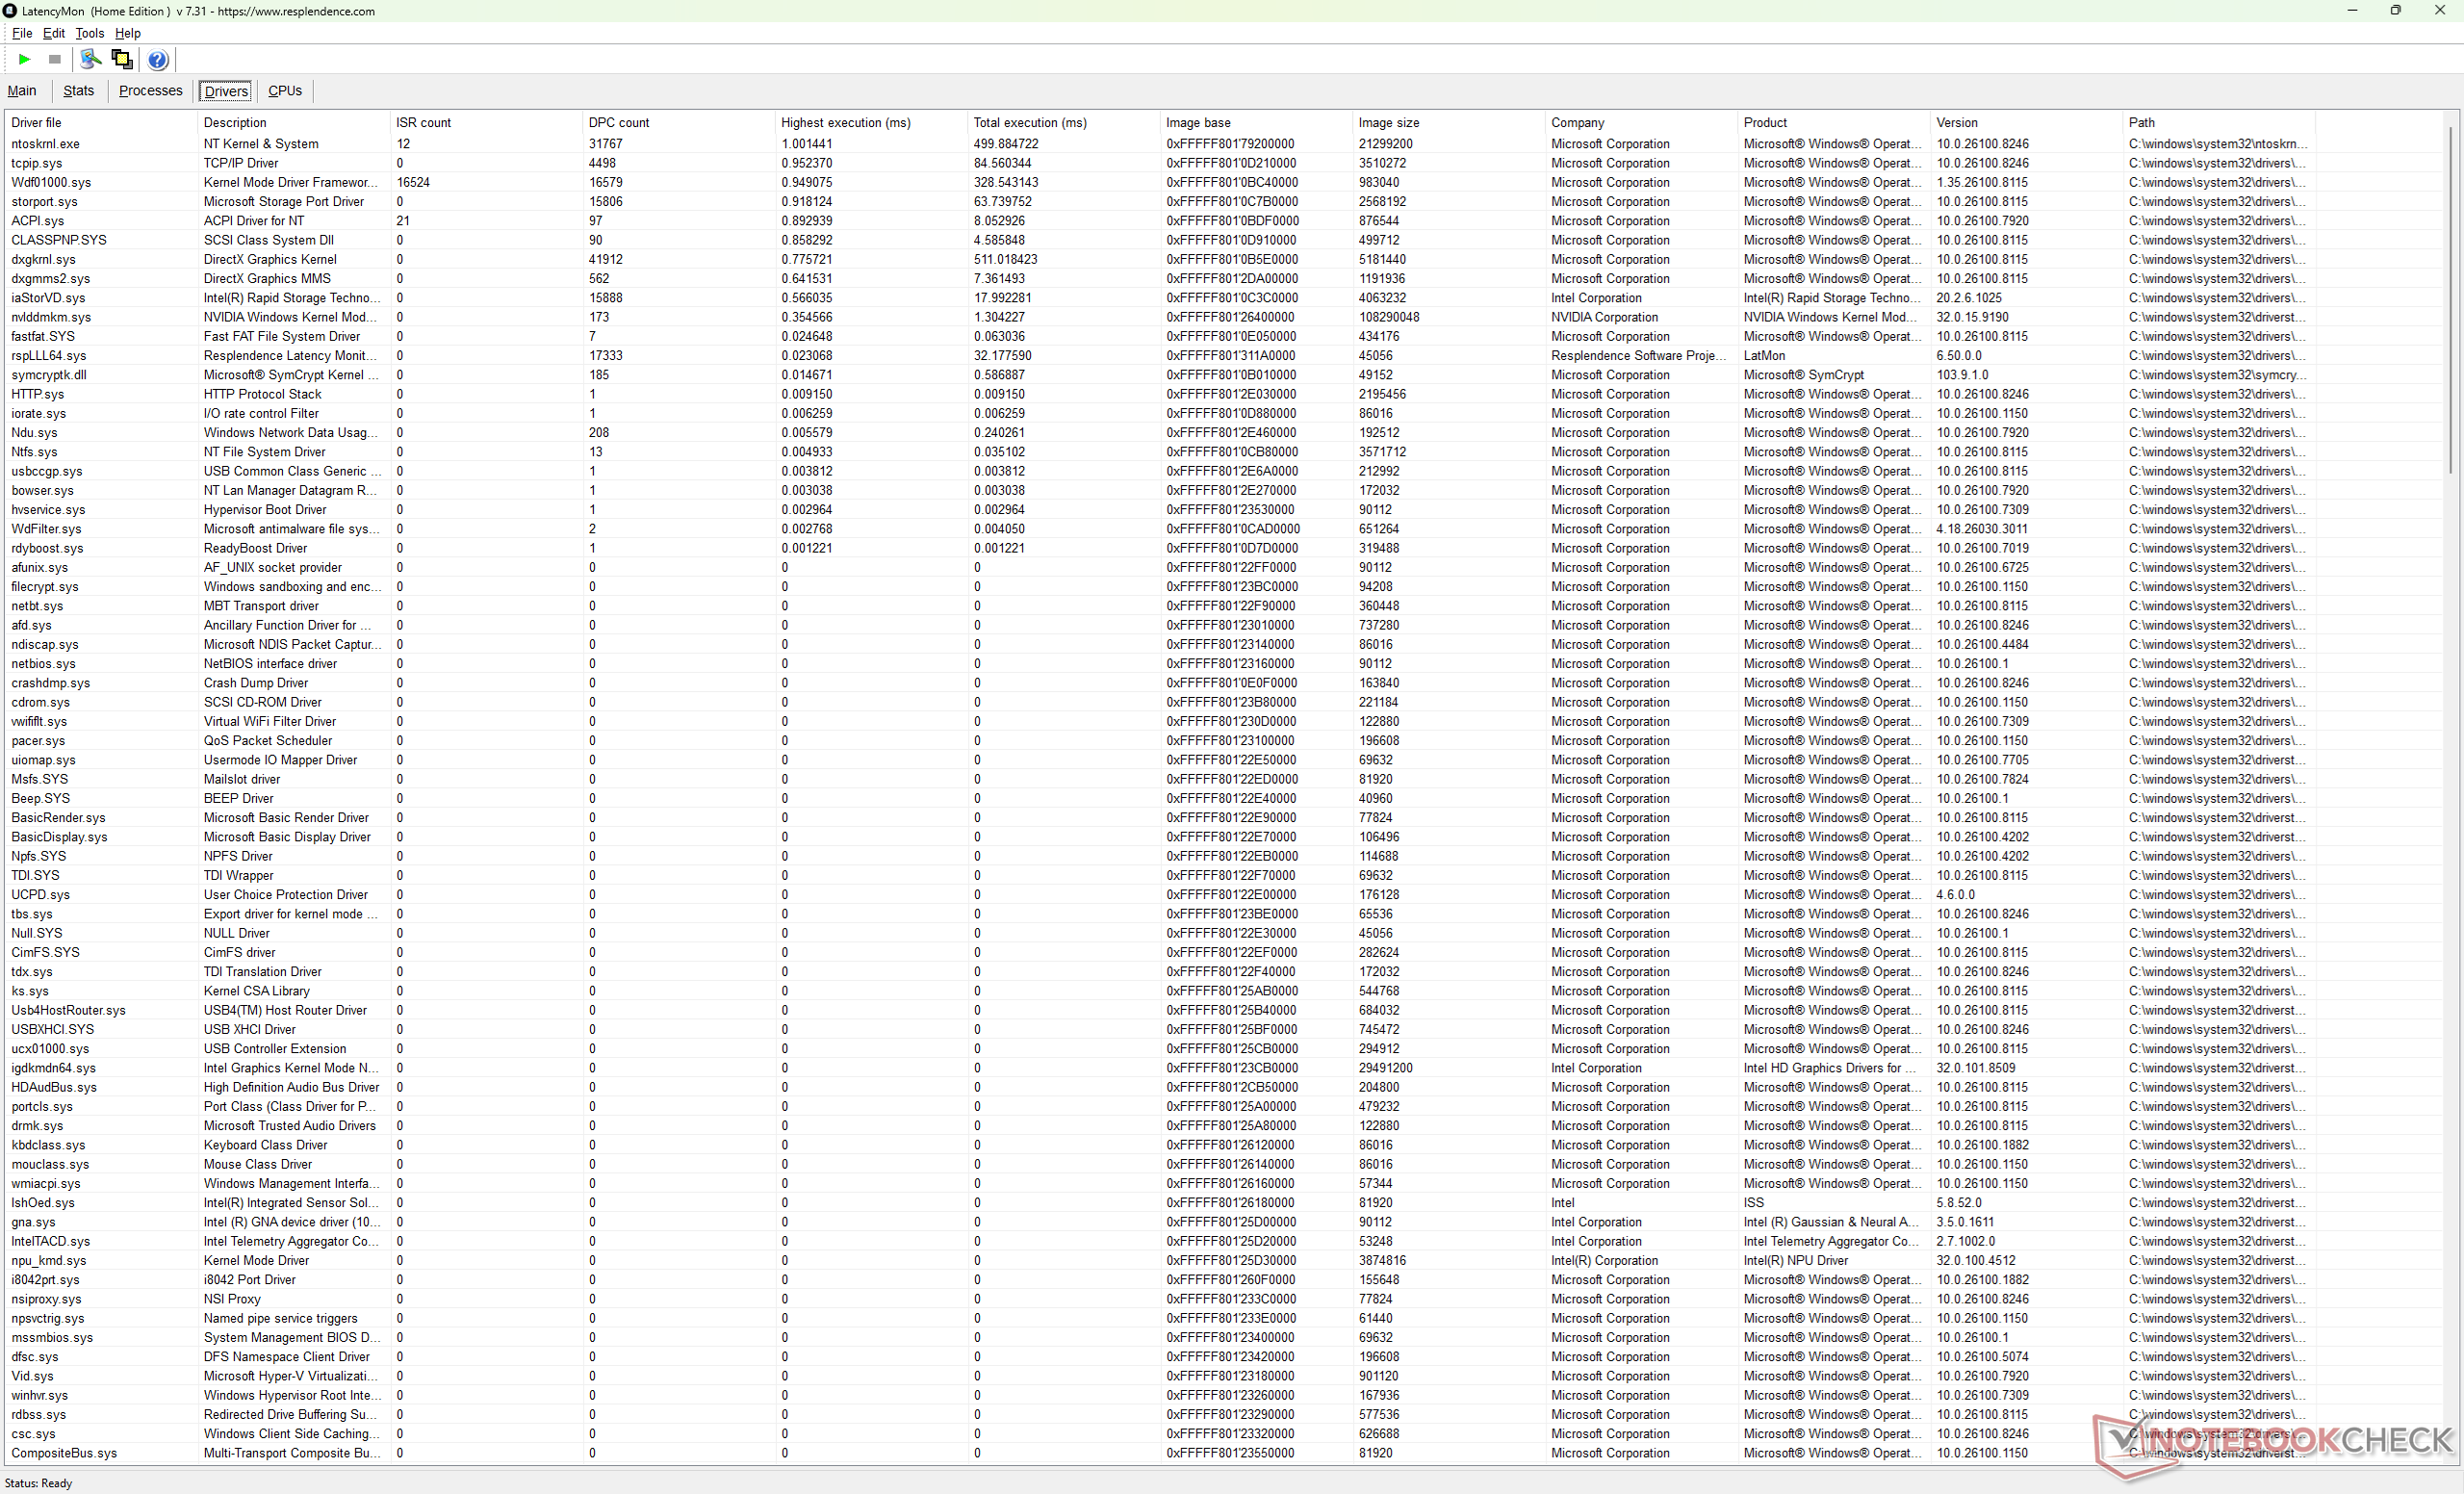
| DPC Latencies / LatencyMon - interrupt to process latency (max), Web, Youtube, Prime95 | |
| MSI Vector 16 HX AI A2XWHG | |
| Alienware 16 Area-51 Core Ultra 9 290HX Plus | |
| Alienware 16 Area-51 | |
| HP Omen Max 16 ah000 | |
| Asus ROG Zephyrus G16 GU605CW | |
| Lenovo Legion Pro 7i 16 Gen 10 | |
* ... menor é melhor
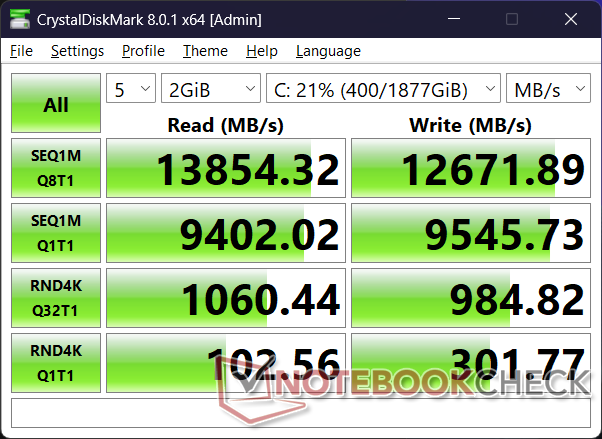
Dispositivos de armazenamento
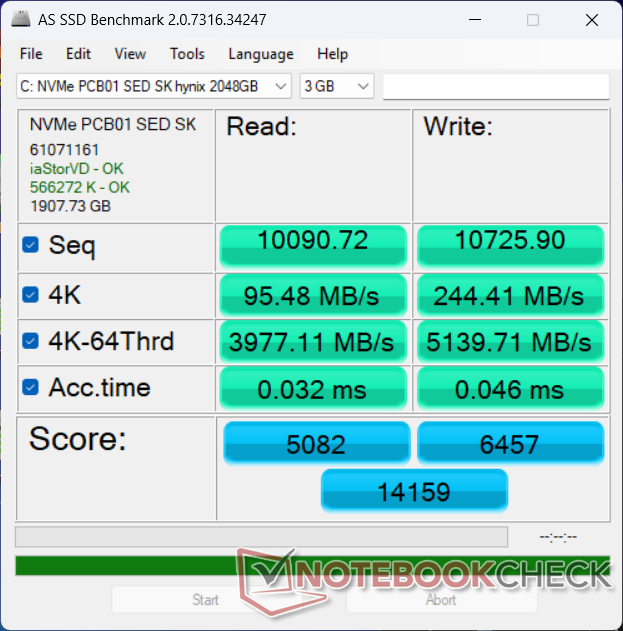
Impressionantemente, o SK Hynix PCB01 PCIe5 x4 NVMe da SKynix é capaz de sustentar taxas de transferência de quase 14.000 MB/s sem qualquer limitação.

* ... menor é melhor
Limitação de disco: Loop de leitura do DiskSpd, profundidade da fila 8
Desempenho da GPU
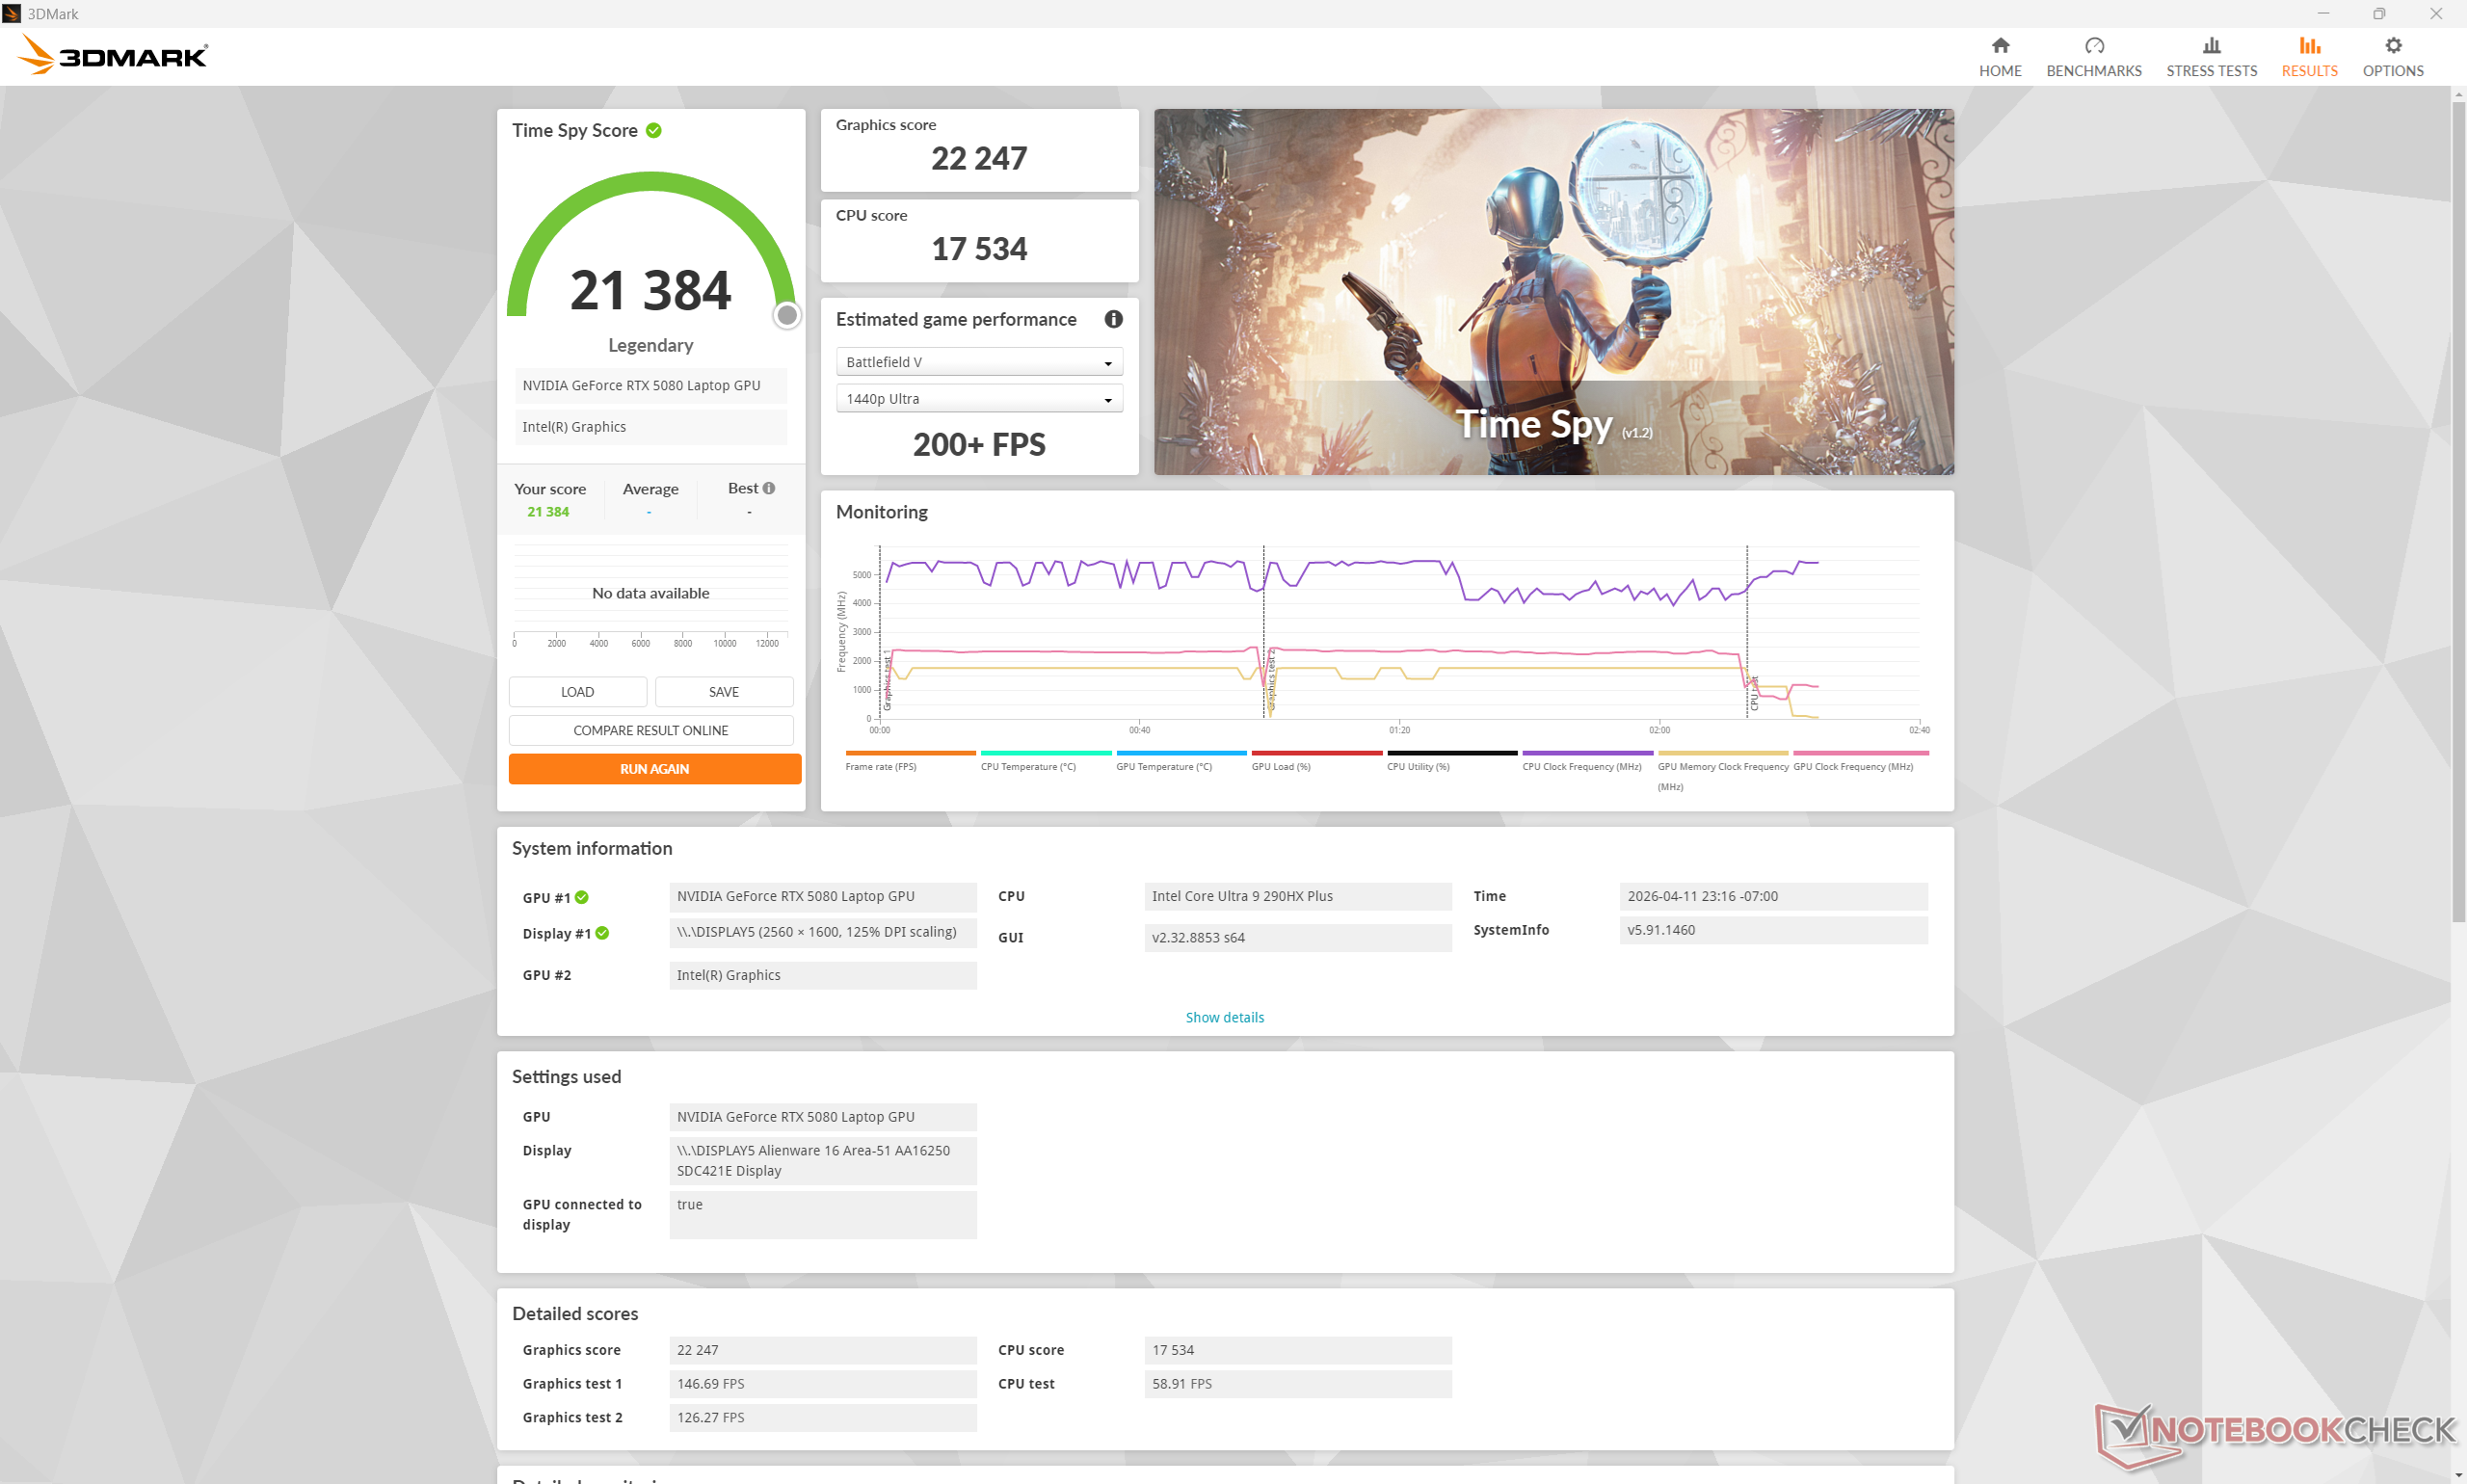
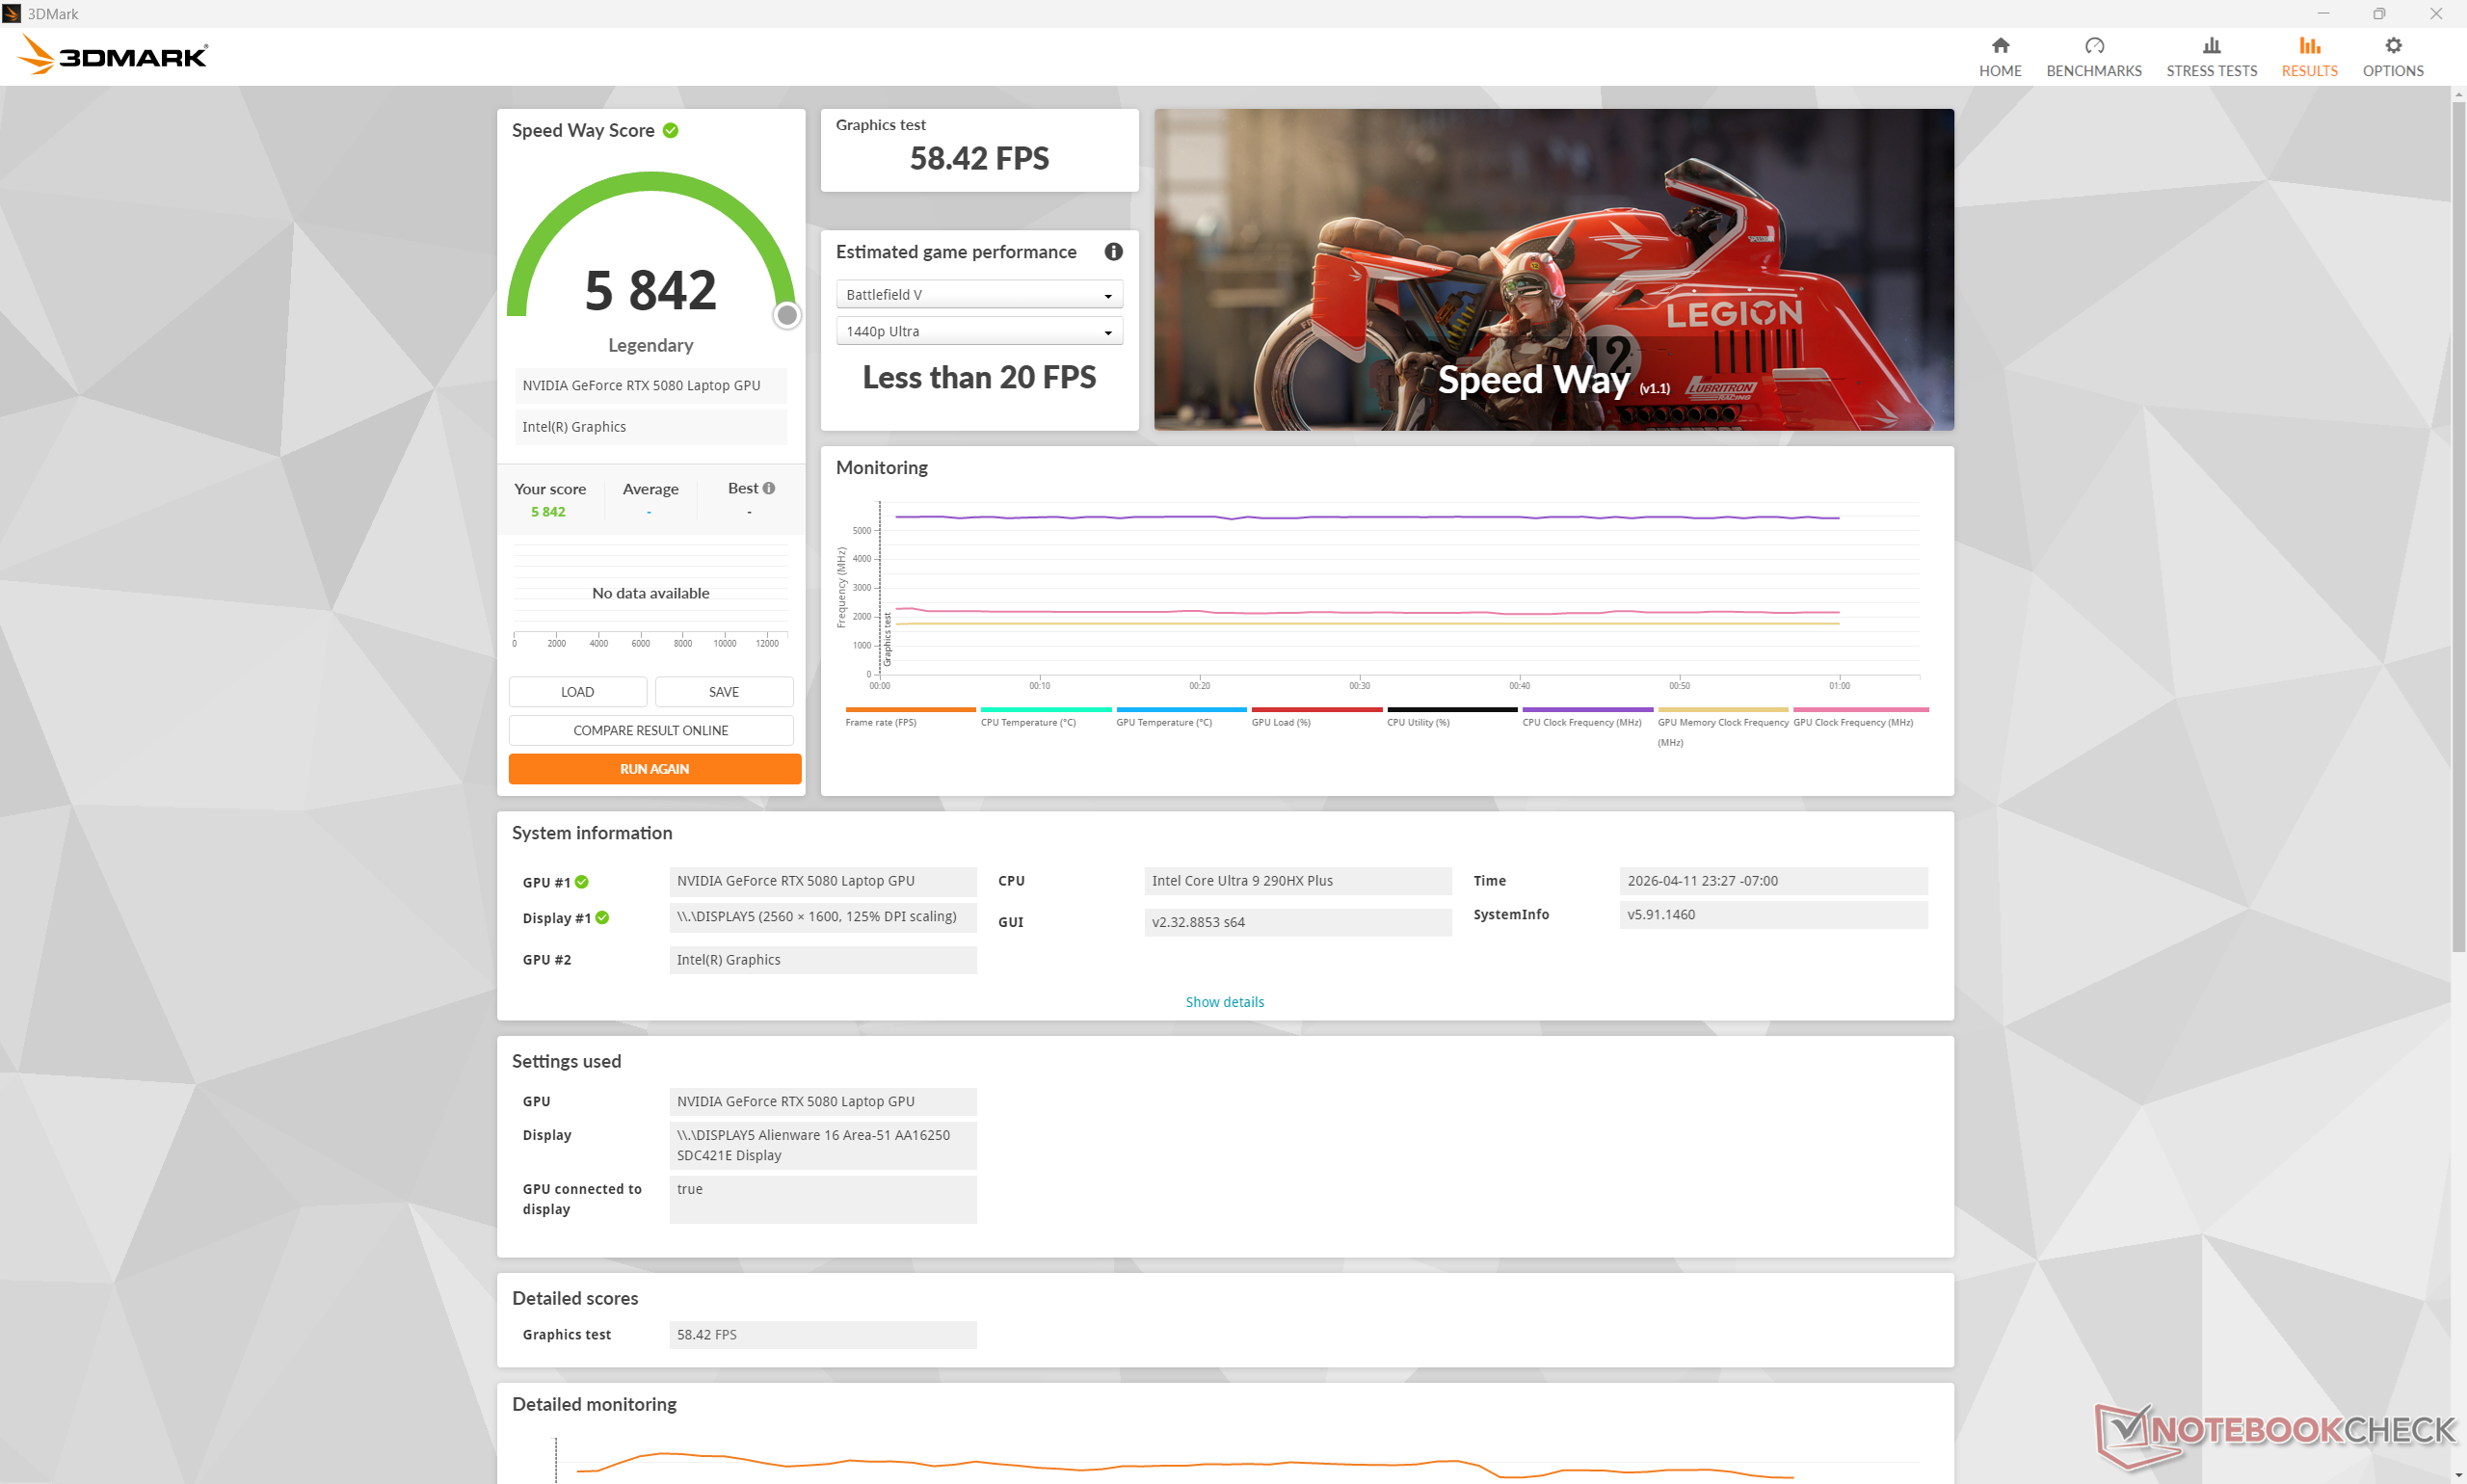
GeForce RTX 5080 e 5090 As opções de GPU permanecem as mesmas de antes, sem alterações na meta de 175 W TGP. No entanto, os resultados do 3DMark são alguns pontos percentuais mais altos em nosso modelo 2026 mais recente. Espera-se que o upgrade da RTX 5080 para a RTX 5090 aumente o desempenho dos jogos em apenas 10 a 15%.
Mais notavelmente, a execução no modo Performance ou no modo Balanced em vez do modo Overdrive reduziria o desempenho gráfico em apenas 3% e 6%, respectivamente, de acordo com a tabela de resultados do site Time Spy abaixo. Os déficits de desempenho são menores do que o esperado quando comparados à maioria dos outros notebooks para jogos.
| Perfil de energia | Pontuação de gráficos | Pontuação de física | Pontuação combinada |
| Modo Overdrive | 22247 | 17534 | 21384 |
| Modo de desempenho | 21478 (-3%) | 17530 (-0%) | 20776 (-3%) |
| Modo equilibrado | 20815 (-6%) | 17251 (-2%) | 20189 (-6%) |
| Energia da bateria | 13861 (-38%) | 13580 (-23%) | 13818 (-35%) |
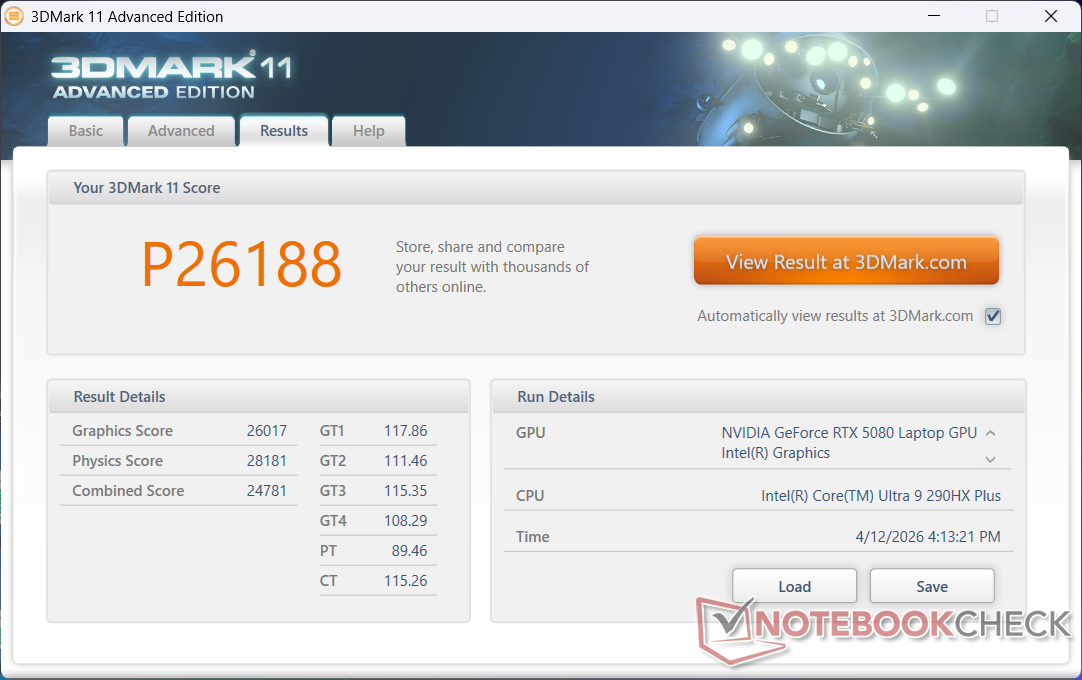

| 3DMark 11 Performance | 26188 pontos | |
| 3DMark Cloud Gate Standard Score | 74132 pontos | |
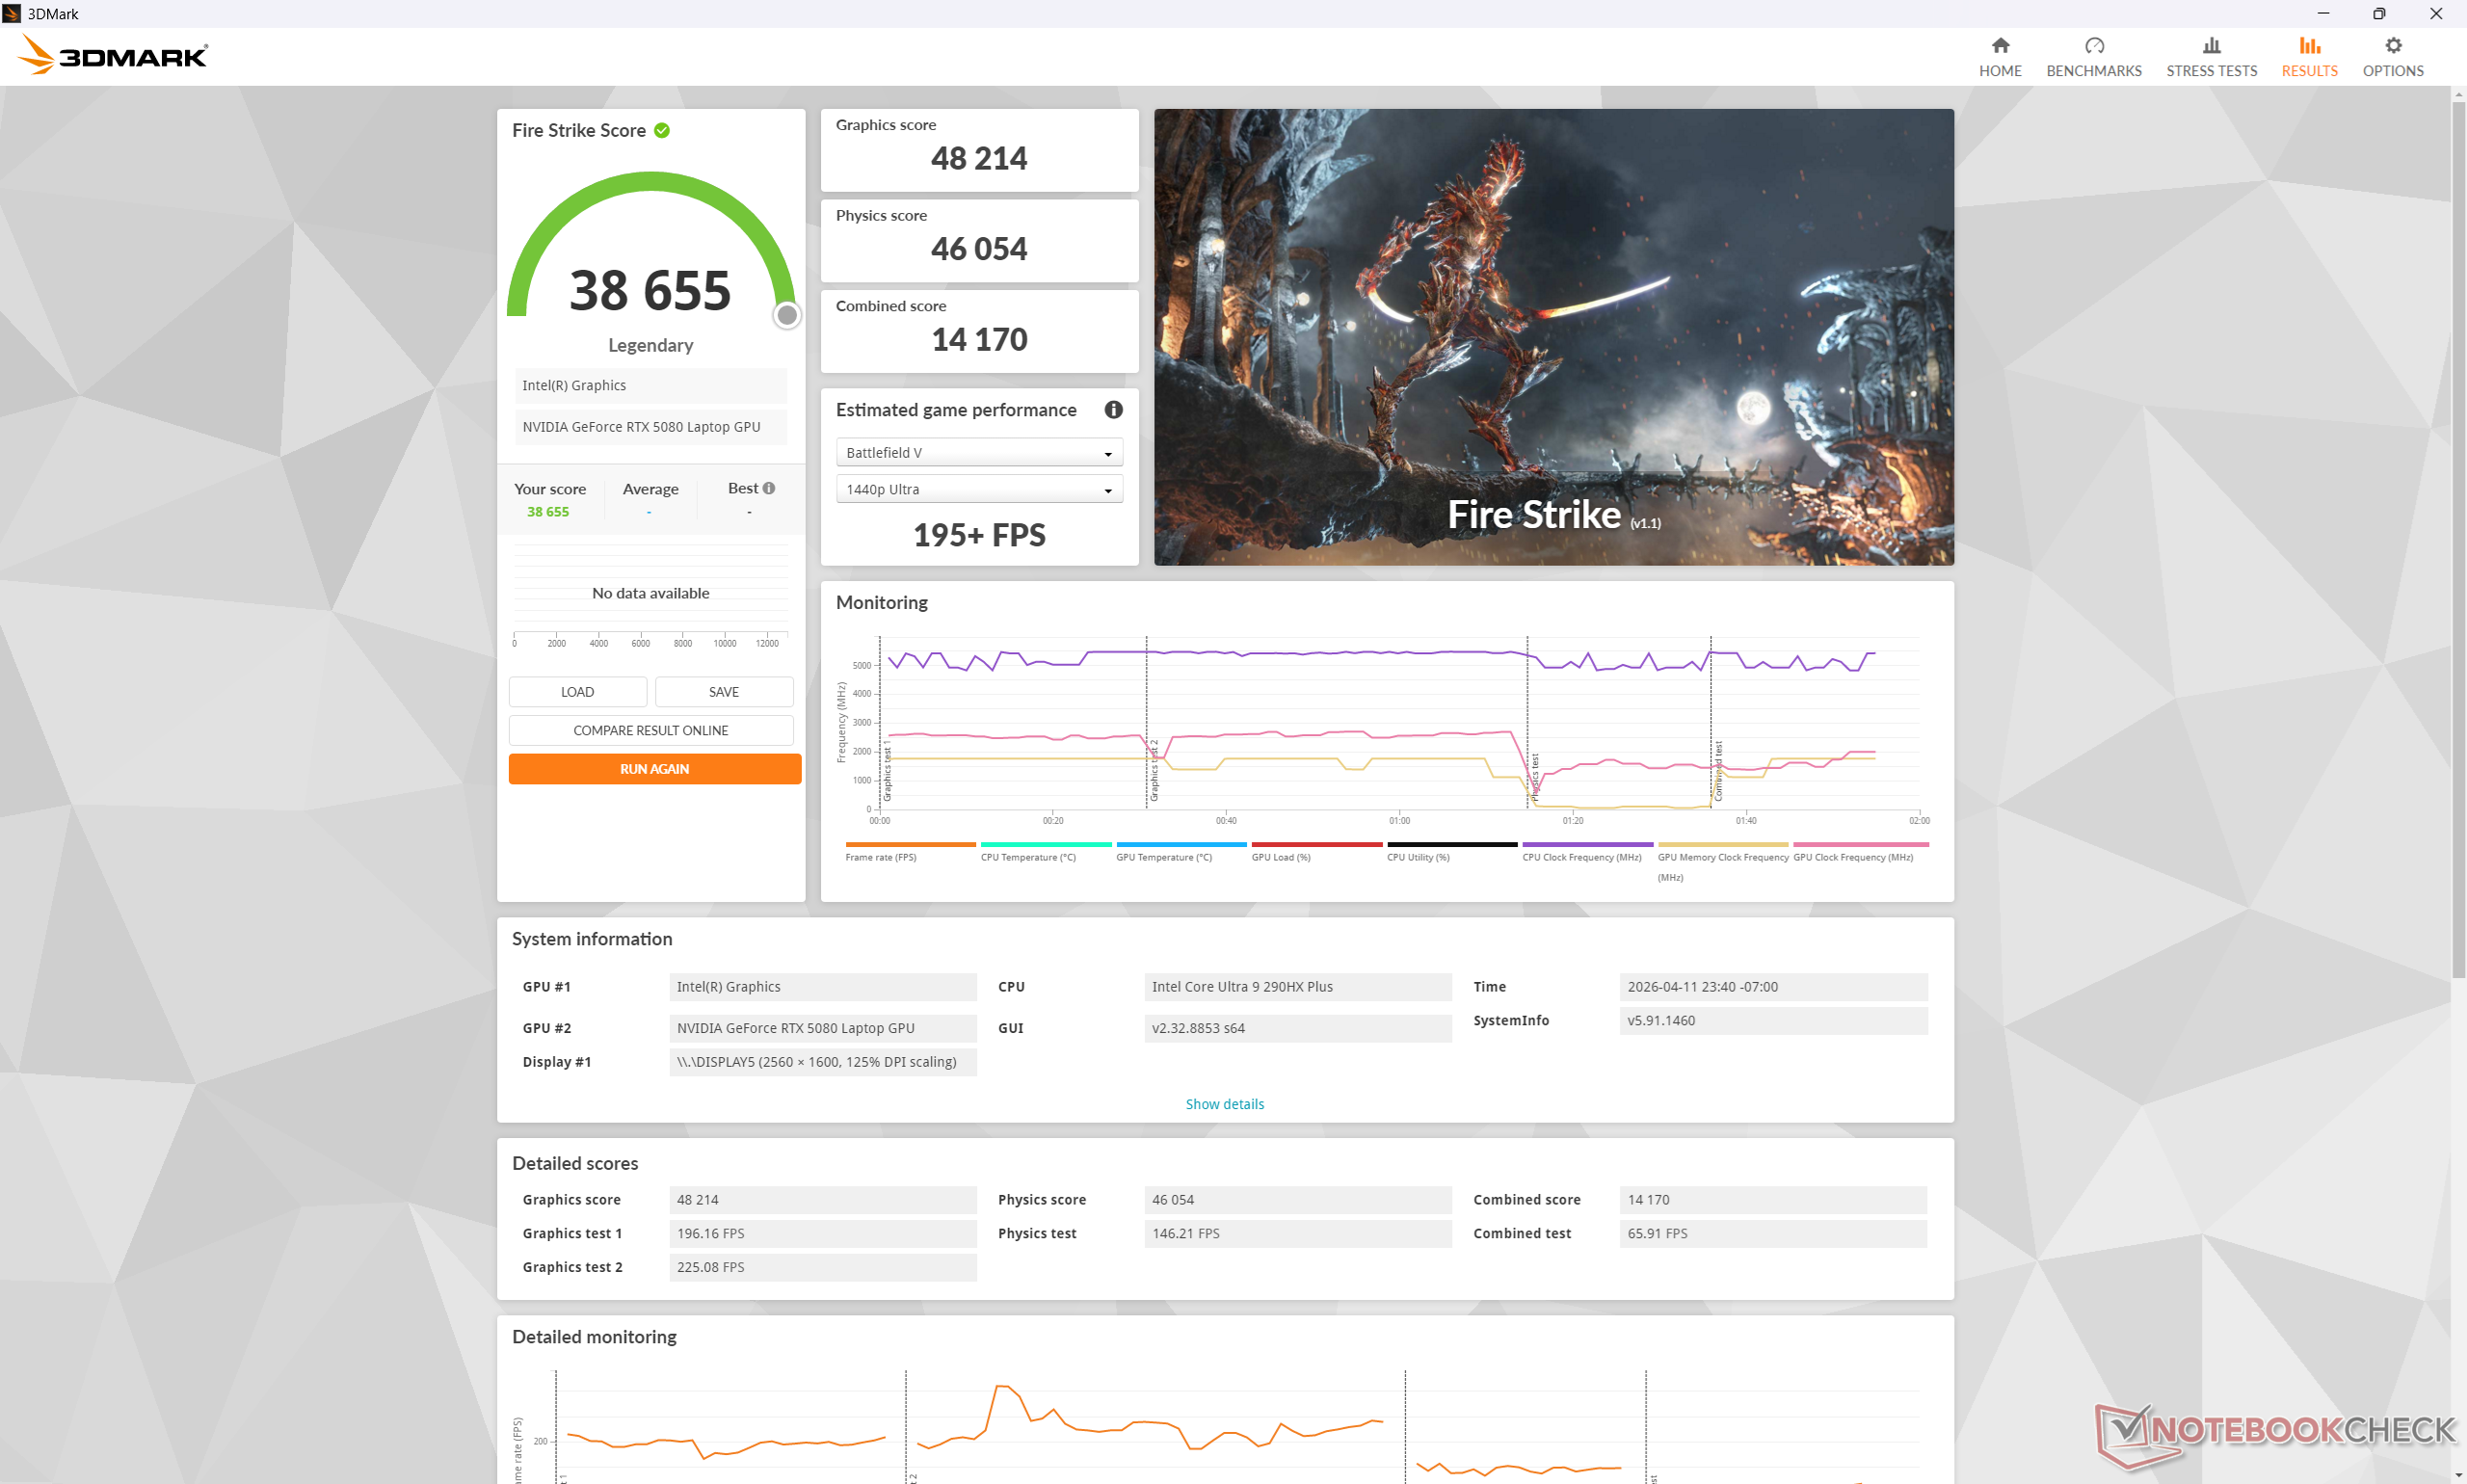
| 3DMark Fire Strike Score | 38655 pontos | |
| 3DMark Time Spy Score | 21384 pontos | |
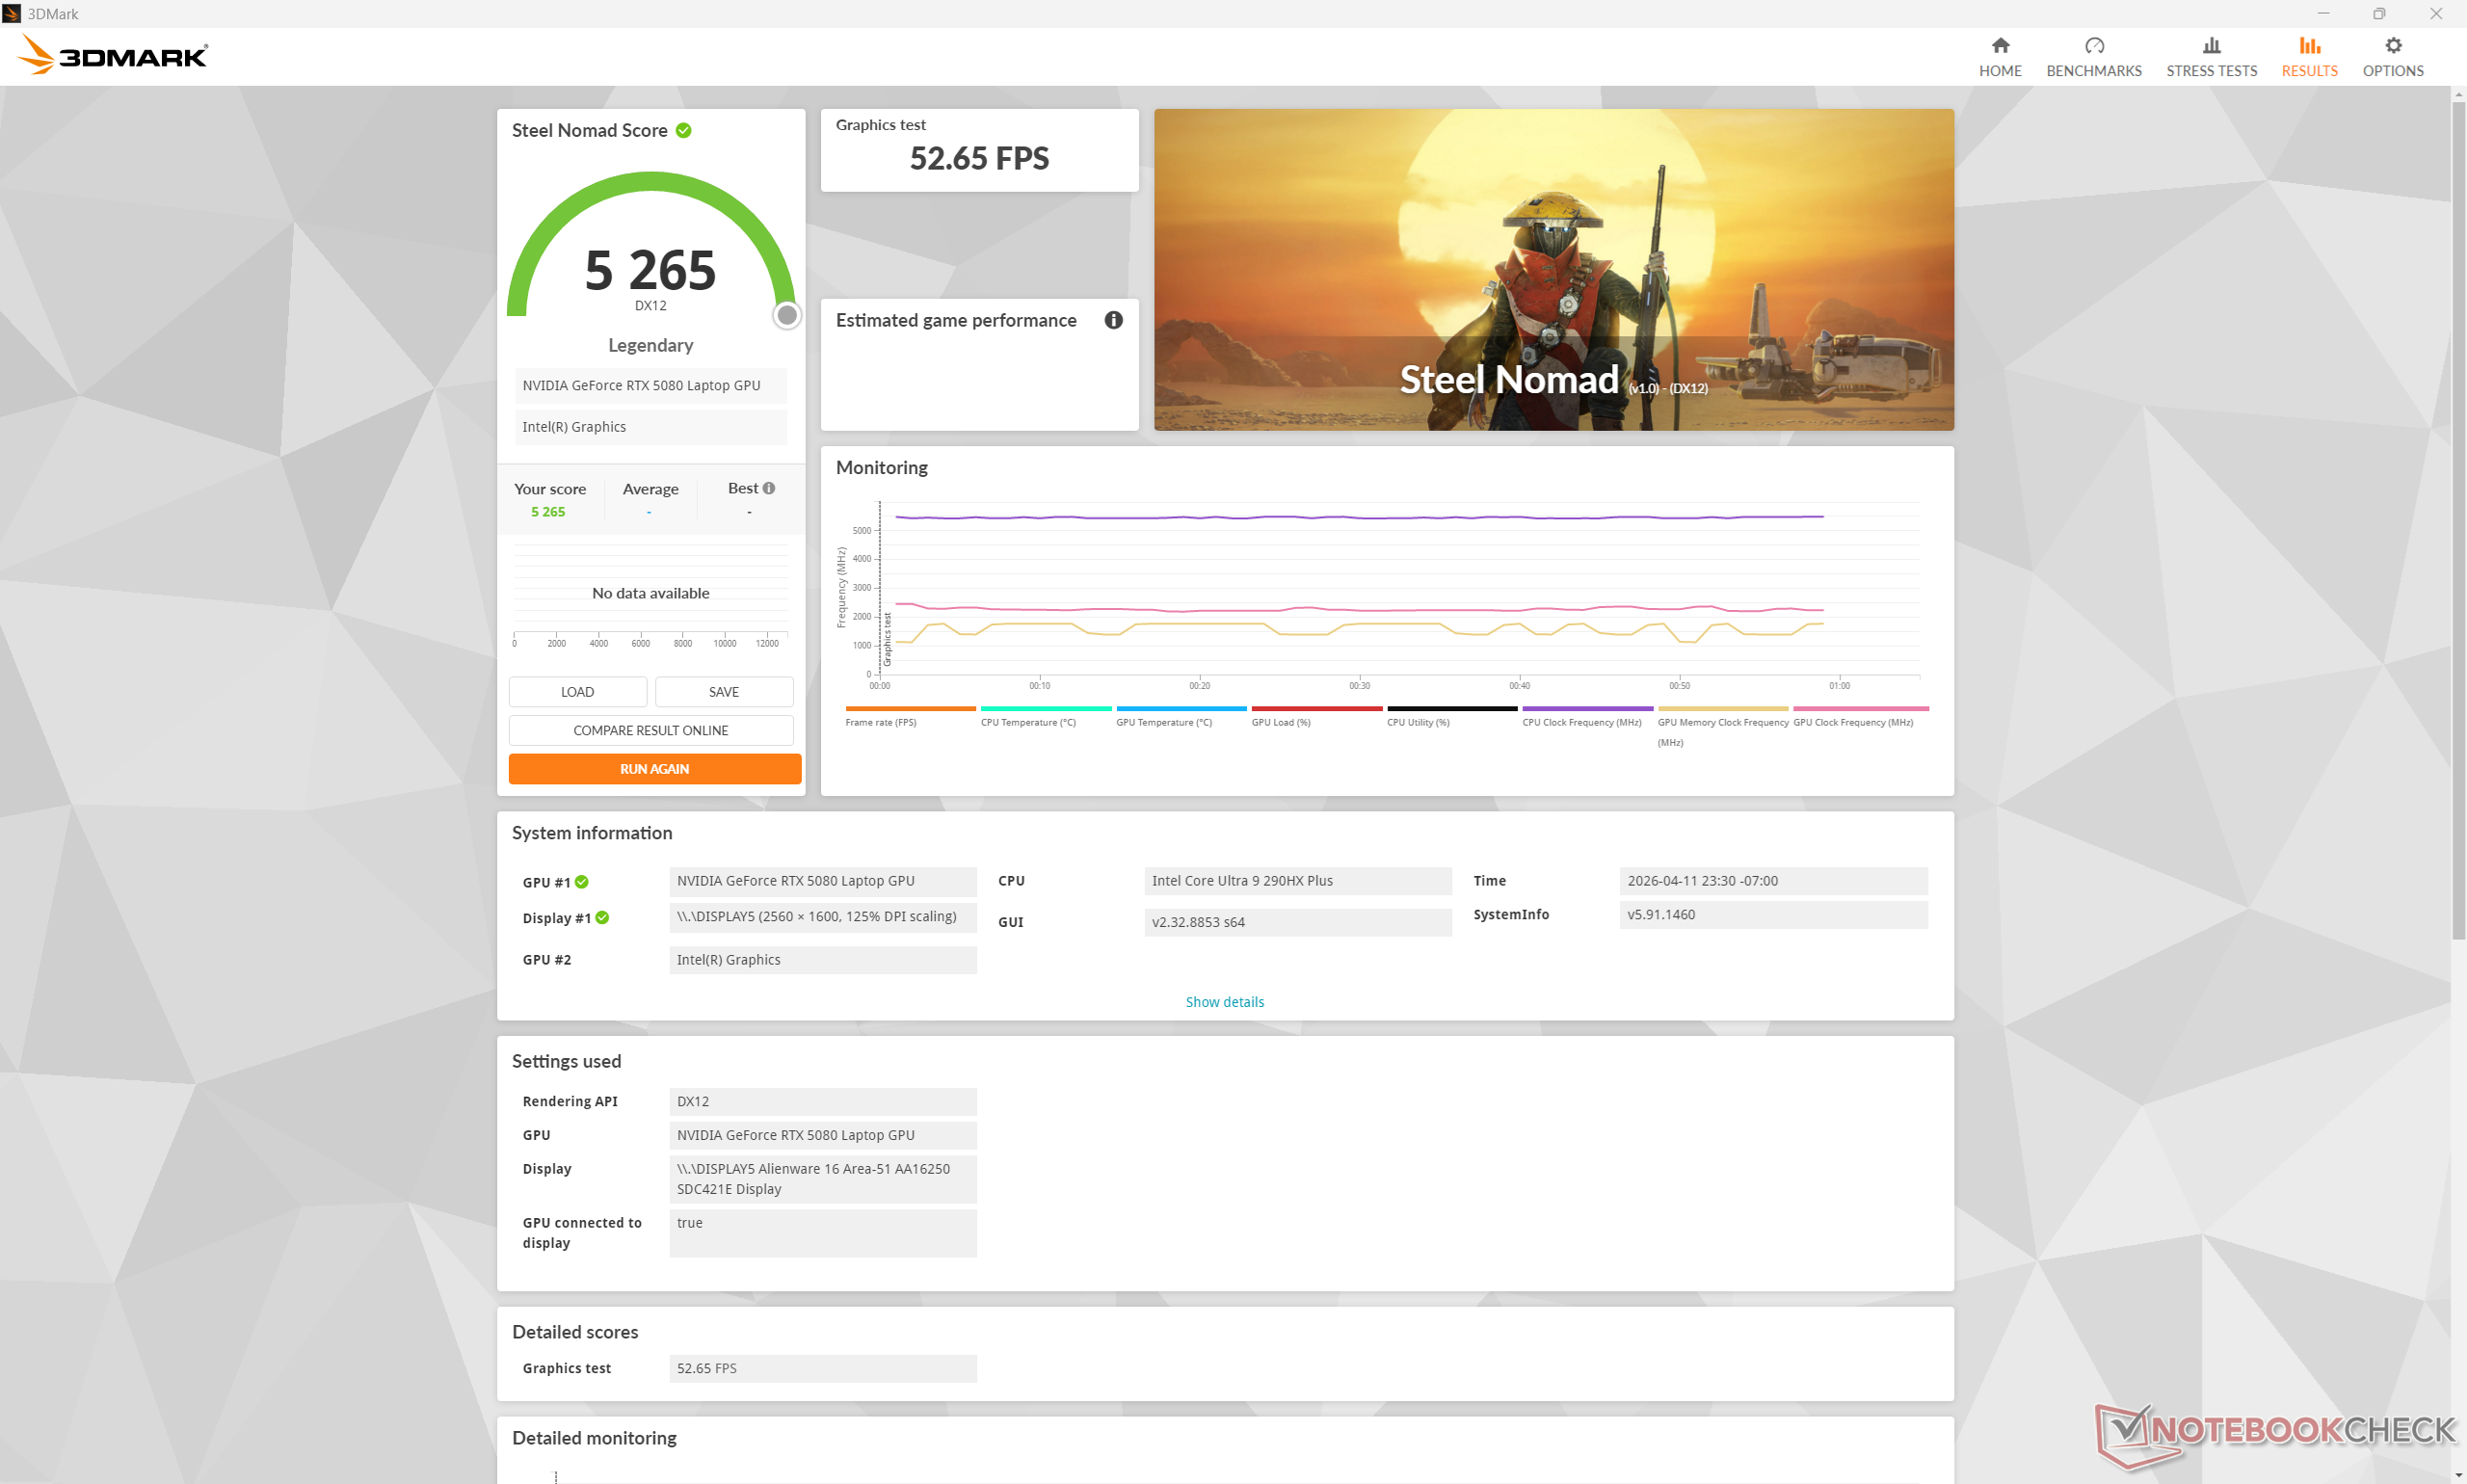
| 3DMark Steel Nomad Score | 5265 pontos | |
Ajuda | ||
* ... menor é melhor
| Performance rating - Percent | |
| Lenovo Legion Pro 7i 16 Gen 10 -1! | |
| Alienware 16 Area-51 Core Ultra 9 290HX Plus -1! | |
| HP Omen Max 16 ah000 -2! | |
| Alienware 16 Area-51 -1! | |
| MSI Vector 16 HX AI A2XWHG -1! | |
| Asus ROG Zephyrus G16 GU605CW | |
| Cyberpunk 2077 - 1920x1080 Ultra Preset (FSR off) | |
| Lenovo Legion Pro 7i 16 Gen 10 | |
| Alienware 16 Area-51 Core Ultra 9 290HX Plus | |
| HP Omen Max 16 ah000 | |
| Alienware 16 Area-51 | |
| MSI Vector 16 HX AI A2XWHG | |
| Asus ROG Zephyrus G16 GU605CW | |
| Baldur's Gate 3 - 1920x1080 Ultra Preset AA:T | |
| Lenovo Legion Pro 7i 16 Gen 10 | |
| Alienware 16 Area-51 | |
| MSI Vector 16 HX AI A2XWHG | |
| Asus ROG Zephyrus G16 GU605CW | |
| GTA V - 1920x1080 Highest AA:4xMSAA + FX AF:16x | |
| Alienware 16 Area-51 Core Ultra 9 290HX Plus | |
| MSI Vector 16 HX AI A2XWHG | |
| Asus ROG Zephyrus G16 GU605CW | |
| Final Fantasy XV Benchmark - 1920x1080 High Quality | |
| Lenovo Legion Pro 7i 16 Gen 10 | |
| HP Omen Max 16 ah000 | |
| Alienware 16 Area-51 Core Ultra 9 290HX Plus | |
| Alienware 16 Area-51 | |
| MSI Vector 16 HX AI A2XWHG | |
| Asus ROG Zephyrus G16 GU605CW | |
| Strange Brigade - 1920x1080 ultra AA:ultra AF:16 | |
| Lenovo Legion Pro 7i 16 Gen 10 | |
| Alienware 16 Area-51 Core Ultra 9 290HX Plus | |
| Alienware 16 Area-51 | |
| HP Omen Max 16 ah000 | |
| Asus ROG Zephyrus G16 GU605CW | |
| Dota 2 Reborn - 1920x1080 ultra (3/3) best looking | |
| Lenovo Legion Pro 7i 16 Gen 10 | |
| Alienware 16 Area-51 Core Ultra 9 290HX Plus | |
| MSI Vector 16 HX AI A2XWHG | |
| HP Omen Max 16 ah000 | |
| Alienware 16 Area-51 | |
| Asus ROG Zephyrus G16 GU605CW | |
Gráfico de ultra FPS do Cyberpunk 2077
| baixo | média | alto | ultra | QHD DLSS | QHD FSR | QHD | 4K DLSS | 4K | |
|---|---|---|---|---|---|---|---|---|---|
| GTA V (2015) | 187.9 | 187.6 | 186.2 | 168.1 | 167.2 | 183.9 | |||
| Dota 2 Reborn (2015) | 216 | 191 | 184.3 | 170.9 | 165.9 | ||||
| Final Fantasy XV Benchmark (2018) | 234 | 232 | 201 | 157.5 | 93.6 | ||||
| X-Plane 11.11 (2018) | 171.5 | 154.6 | 129.5 | 101.3 | |||||
| Strange Brigade (2018) | 624 | 489 | 448 | 413 | 300 | 161.1 | |||
| Cyberpunk 2077 (2023) | 195.9 | 191.5 | 171.9 | 153.3 | 119.1 | 101.7 | 57.8 | 46.4 | |
| F1 24 (2024) | 341 | 375 | 351 | 136.9 | 141.2 | 136.2 | 89.2 | 76.5 | 44.8 |
| Black Myth: Wukong (2024) | 55 | 61 | 42 | 42 | 24 | ||||
| Monster Hunter Wilds (2025) | 85.5 | 82.5 | 69 | 58.7 | 43 | ||||
| Assassin's Creed Shadows (2025) | 59 | 59 | 51 | 49 | 37 |
Emissões
Ruído do sistema
Os níveis de ruído e o comportamento do ventilador são quase idênticos aos que registramos no Alienware 16 de 2025, apesar do aumento de desempenho nessa última iteração. Observe que o ruído da ventoinha se estabilizaria em 48 dB(A), 49 dB(A) e 57 dB(A) ao executar o Cyberpunk 2077 no modo Balanced, no modo Performance e no modo Overdrive, respectivamente. O ruído é significativamente reduzido ao passar do modo Overdrive para o modo Performance, com uma perda de apenas <5% nos gráficos.
Barulho
| Ocioso |
| 23.2 / 28.2 / 28.3 dB |
| Carga |
| 28.8 / 57.1 dB |
 | ||
30 dB silencioso 40 dB(A) audível 50 dB(A) ruidosamente alto |
||
min: | ||
| Alienware 16 Area-51 Core Ultra 9 290HX Plus Ultra 9 290HX Plus, GeForce RTX 5080 Laptop | Alienware 16 Area-51 Ultra 9 275HX, GeForce RTX 5080 Laptop | Lenovo Legion Pro 7i 16 Gen 10 Ultra 9 275HX, GeForce RTX 5080 Laptop | HP Omen Max 16 ah000 Ultra 9 275HX, GeForce RTX 5090 Laptop | MSI Vector 16 HX AI A2XWHG Ultra 7 255HX, GeForce RTX 5070 Ti Laptop | Asus ROG Zephyrus G16 GU605CW Ultra 9 285H, GeForce RTX 5080 Laptop | |
|---|---|---|---|---|---|---|
| Noise | -2% | 4% | -16% | -21% | -20% | |
| desligado / ambiente * (dB) | 23.1 | 23.6 -2% | 22.9 1% | 22.8 1% | 25 -8% | 25.56 -11% |
| Idle Minimum * (dB) | 23.2 | 25.4 -9% | 22.9 1% | 29 -25% | 33 -42% | 30 -29% |
| Idle Average * (dB) | 28.2 | 27.8 1% | 22.9 19% | 29 -3% | 34 -21% | 30 -6% |
| Idle Maximum * (dB) | 28.3 | 28.1 1% | 26.3 7% | 29 -2% | 38 -34% | 30 -6% |
| Load Average * (dB) | 28.8 | 28.8 -0% | 27.8 3% | 47.7 -66% | 46 -60% | 53.55 -86% |
| Cyberpunk 2077 ultra * (dB) | 49 | 50.4 -3% | 54.2 -11% | 54.8 -12% | 47 4% | 53.5 -9% |
| Load Maximum * (dB) | 57.1 | 56.4 1% | 53.9 6% | 61.1 -7% | 49 14% | 54.02 5% |
* ... menor é melhor
Temperatura
Os pontos quentes durante os jogos atingiam a faixa de 40 °C, o que é semelhante ao que observamos no Alienware 16 Area-51 de 2025. A temperatura média é um pouco mais quente do que no concorrente Lenovo Legion Pro 7i 16 Gen 10 já que os apoios para as mãos do Alienware não permanecem tão frios.


(-) A temperatura máxima no lado superior é 45.2 °C / 113 F, em comparação com a média de 40.4 °C / 105 F , variando de 21.2 a 68.8 °C para a classe Gaming.
(+) A parte inferior aquece até um máximo de 37.4 °C / 99 F, em comparação com a média de 43.2 °C / 110 F
(+) Em uso inativo, a temperatura média para o lado superior é 27.6 °C / 82 F, em comparação com a média do dispositivo de 33.9 °C / ### class_avg_f### F.
(±) 3: The average temperature for the upper side is 36.4 °C / 98 F, compared to the average of 33.9 °C / 93 F for the class Gaming.
(+) Os apoios para as mãos e o touchpad são mais frios que a temperatura da pele, com um máximo de 29.8 °C / 85.6 F e, portanto, são frios ao toque.
(±) A temperatura média da área do apoio para as mãos de dispositivos semelhantes foi 28.8 °C / 83.8 F (-1 °C / -1.8 F).


| Alienware 16 Area-51 Core Ultra 9 290HX Plus Ultra 9 290HX Plus, GeForce RTX 5080 Laptop | Alienware 16 Area-51 Ultra 9 275HX, GeForce RTX 5080 Laptop | Lenovo Legion Pro 7i 16 Gen 10 Ultra 9 275HX, GeForce RTX 5080 Laptop | HP Omen Max 16 ah000 Ultra 9 275HX, GeForce RTX 5090 Laptop | MSI Vector 16 HX AI A2XWHG Ultra 7 255HX, GeForce RTX 5070 Ti Laptop | Asus ROG Zephyrus G16 GU605CW Ultra 9 285H, GeForce RTX 5080 Laptop | |
|---|---|---|---|---|---|---|
| Heat | -9% | -4% | -1% | -14% | -21% | |
| Maximum Upper Side * (°C) | 45.2 | 43.8 3% | 42.6 6% | 42.8 5% | 53 -17% | 49.2 -9% |
| Maximum Bottom * (°C) | 37.4 | 40 -7% | 41.2 -10% | 50.2 -34% | 52 -39% | 50.2 -34% |
| Idle Upper Side * (°C) | 31.6 | 35.8 -13% | 32.6 -3% | 27.6 13% | 33 -4% | 37.2 -18% |
| Idle Bottom * (°C) | 30.2 | 35.2 -17% | 32.4 -7% | 26.2 13% | 29 4% | 37.4 -24% |
* ... menor é melhor
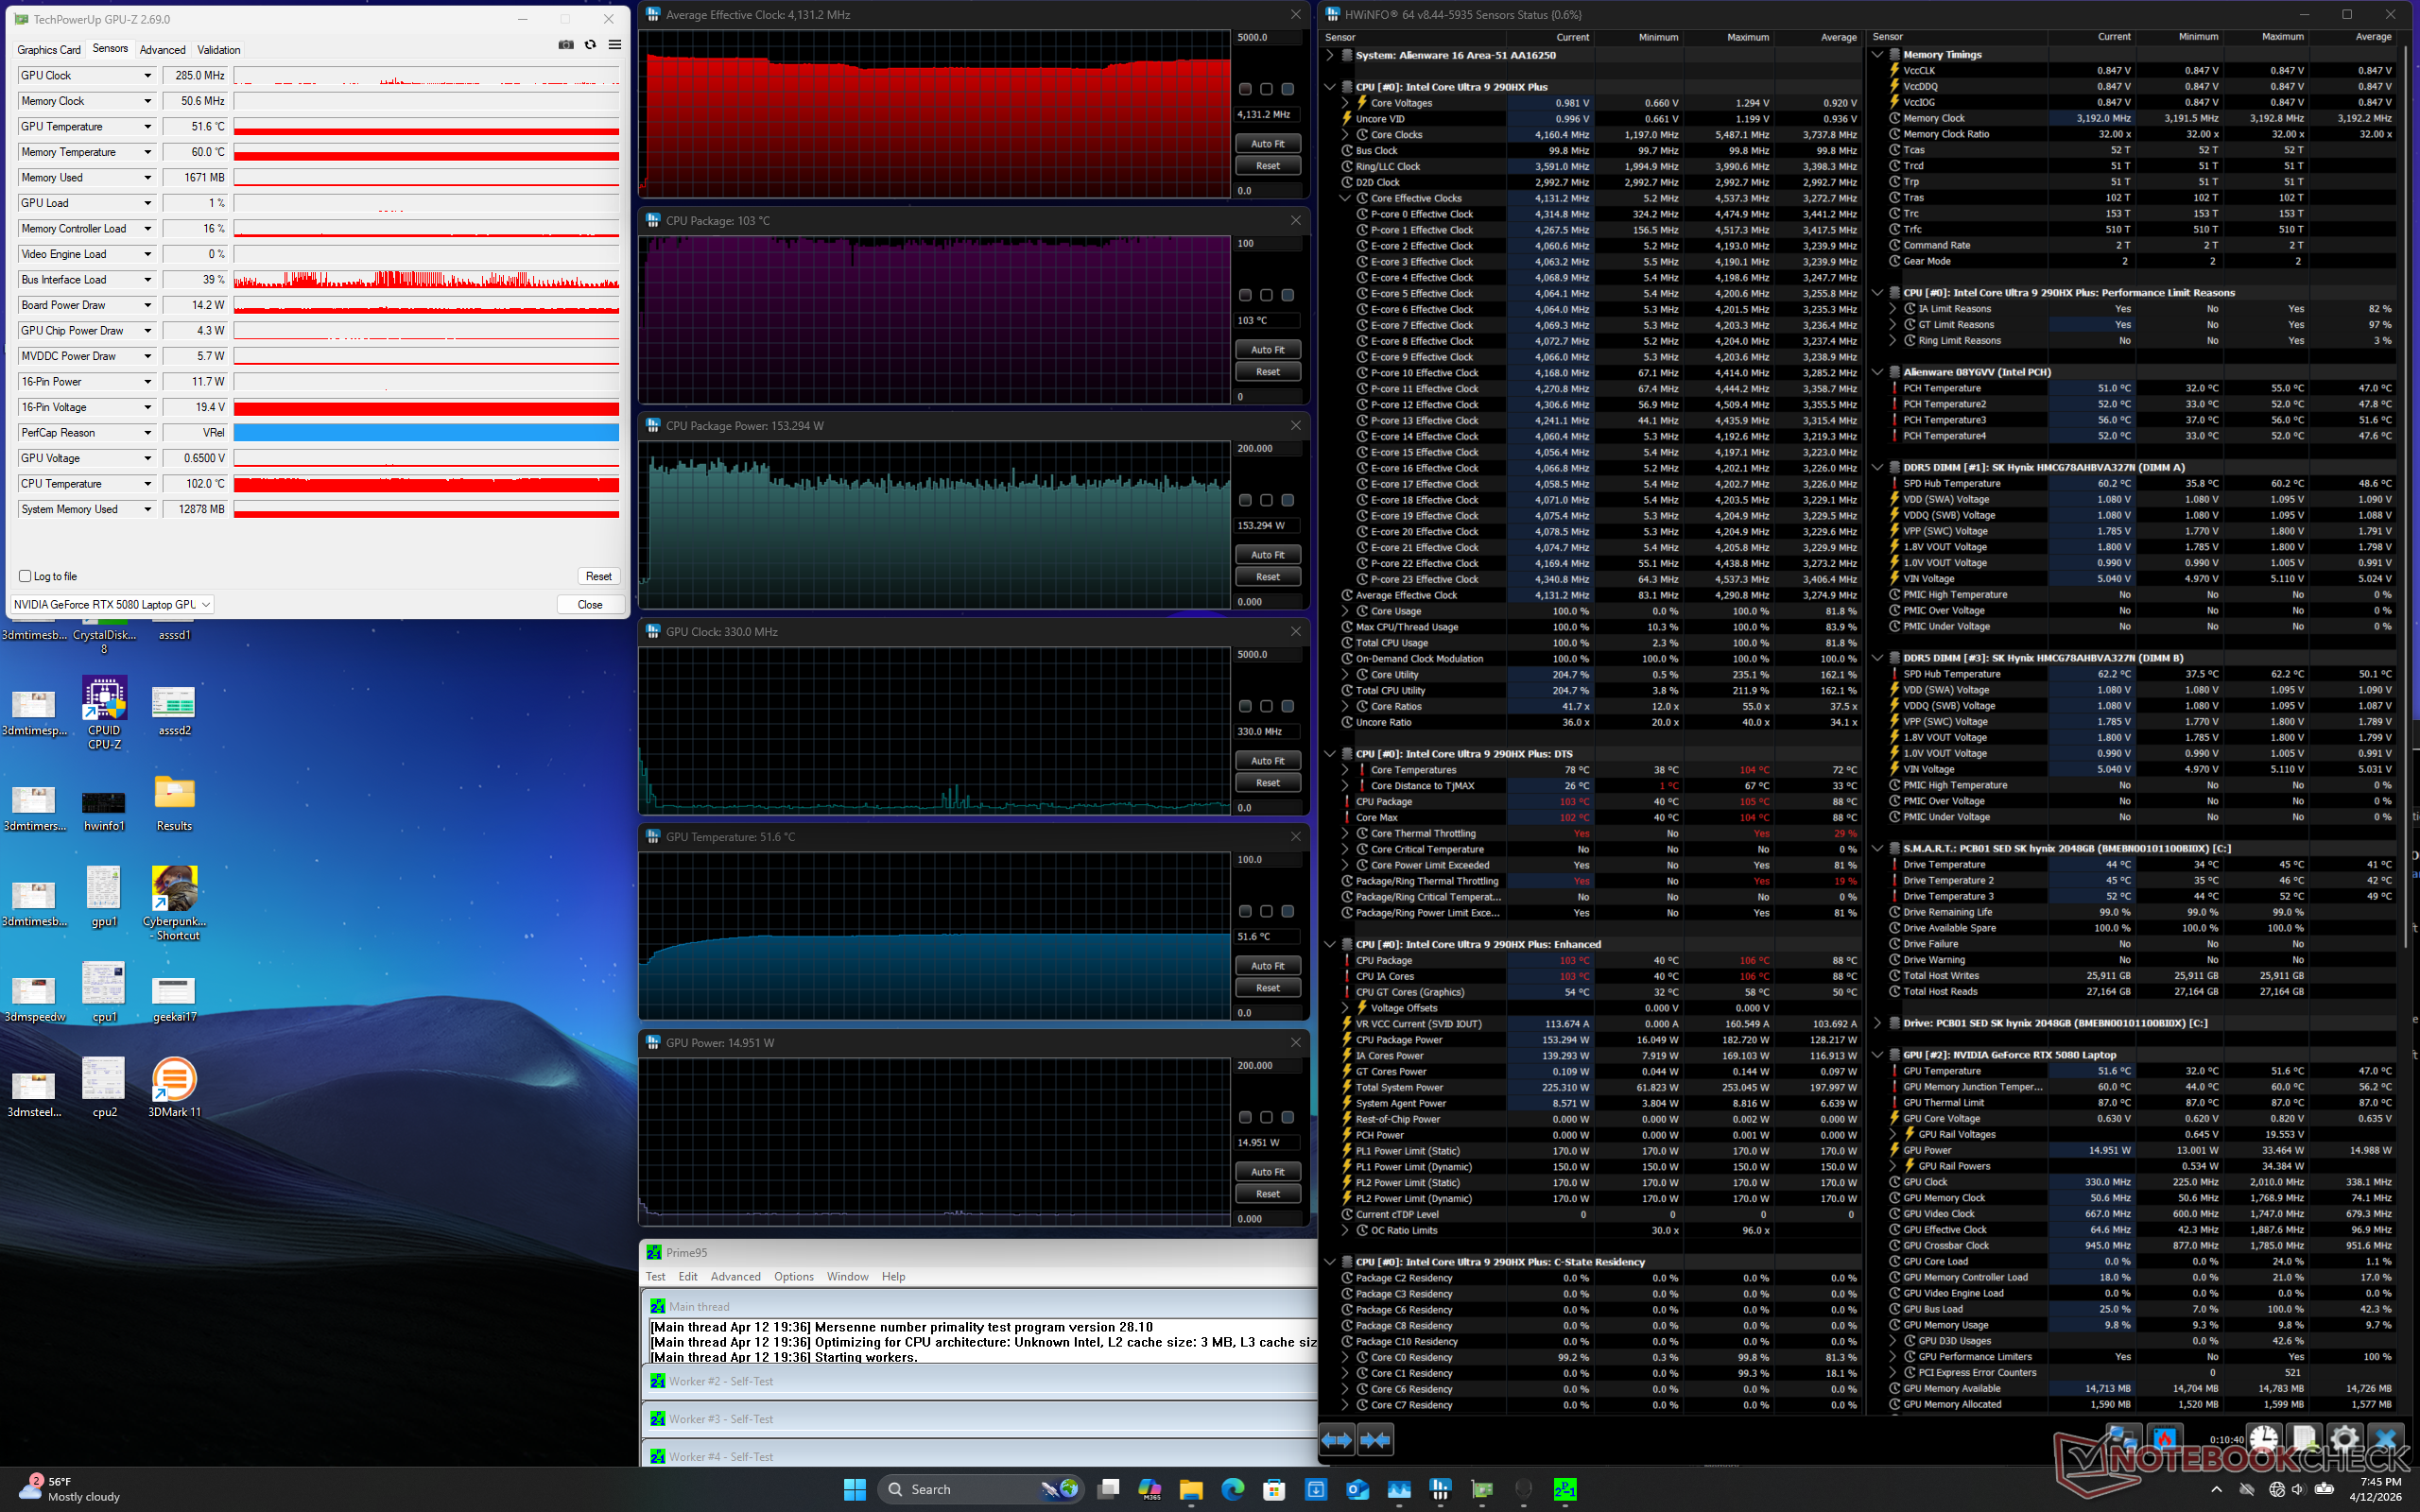
Teste de estresse
Ao executar o estresse do Prime95 no modo Overdrive (ou seja, modo de ventilador máximo), a CPU aumentaria para 4,3 GHz, 182 W e 105 C (!) antes de cair um pouco para a faixa de 3,9 a 4,1 GHz a fim de manter uma temperatura central um pouco mais fria de 95 C a 100 C. Em comparação, a execução desse mesmo teste no Alienware 16 de 2025 resultaria em uma taxa de clock e temperatura média da CPU mais baixas de 3,6 GHz e 92 C, respectivamente. Está claro que o Core Ultra 9 290HX Plus está levando a solução de resfriamento existente do Alienware 16 aos seus limites absolutos.
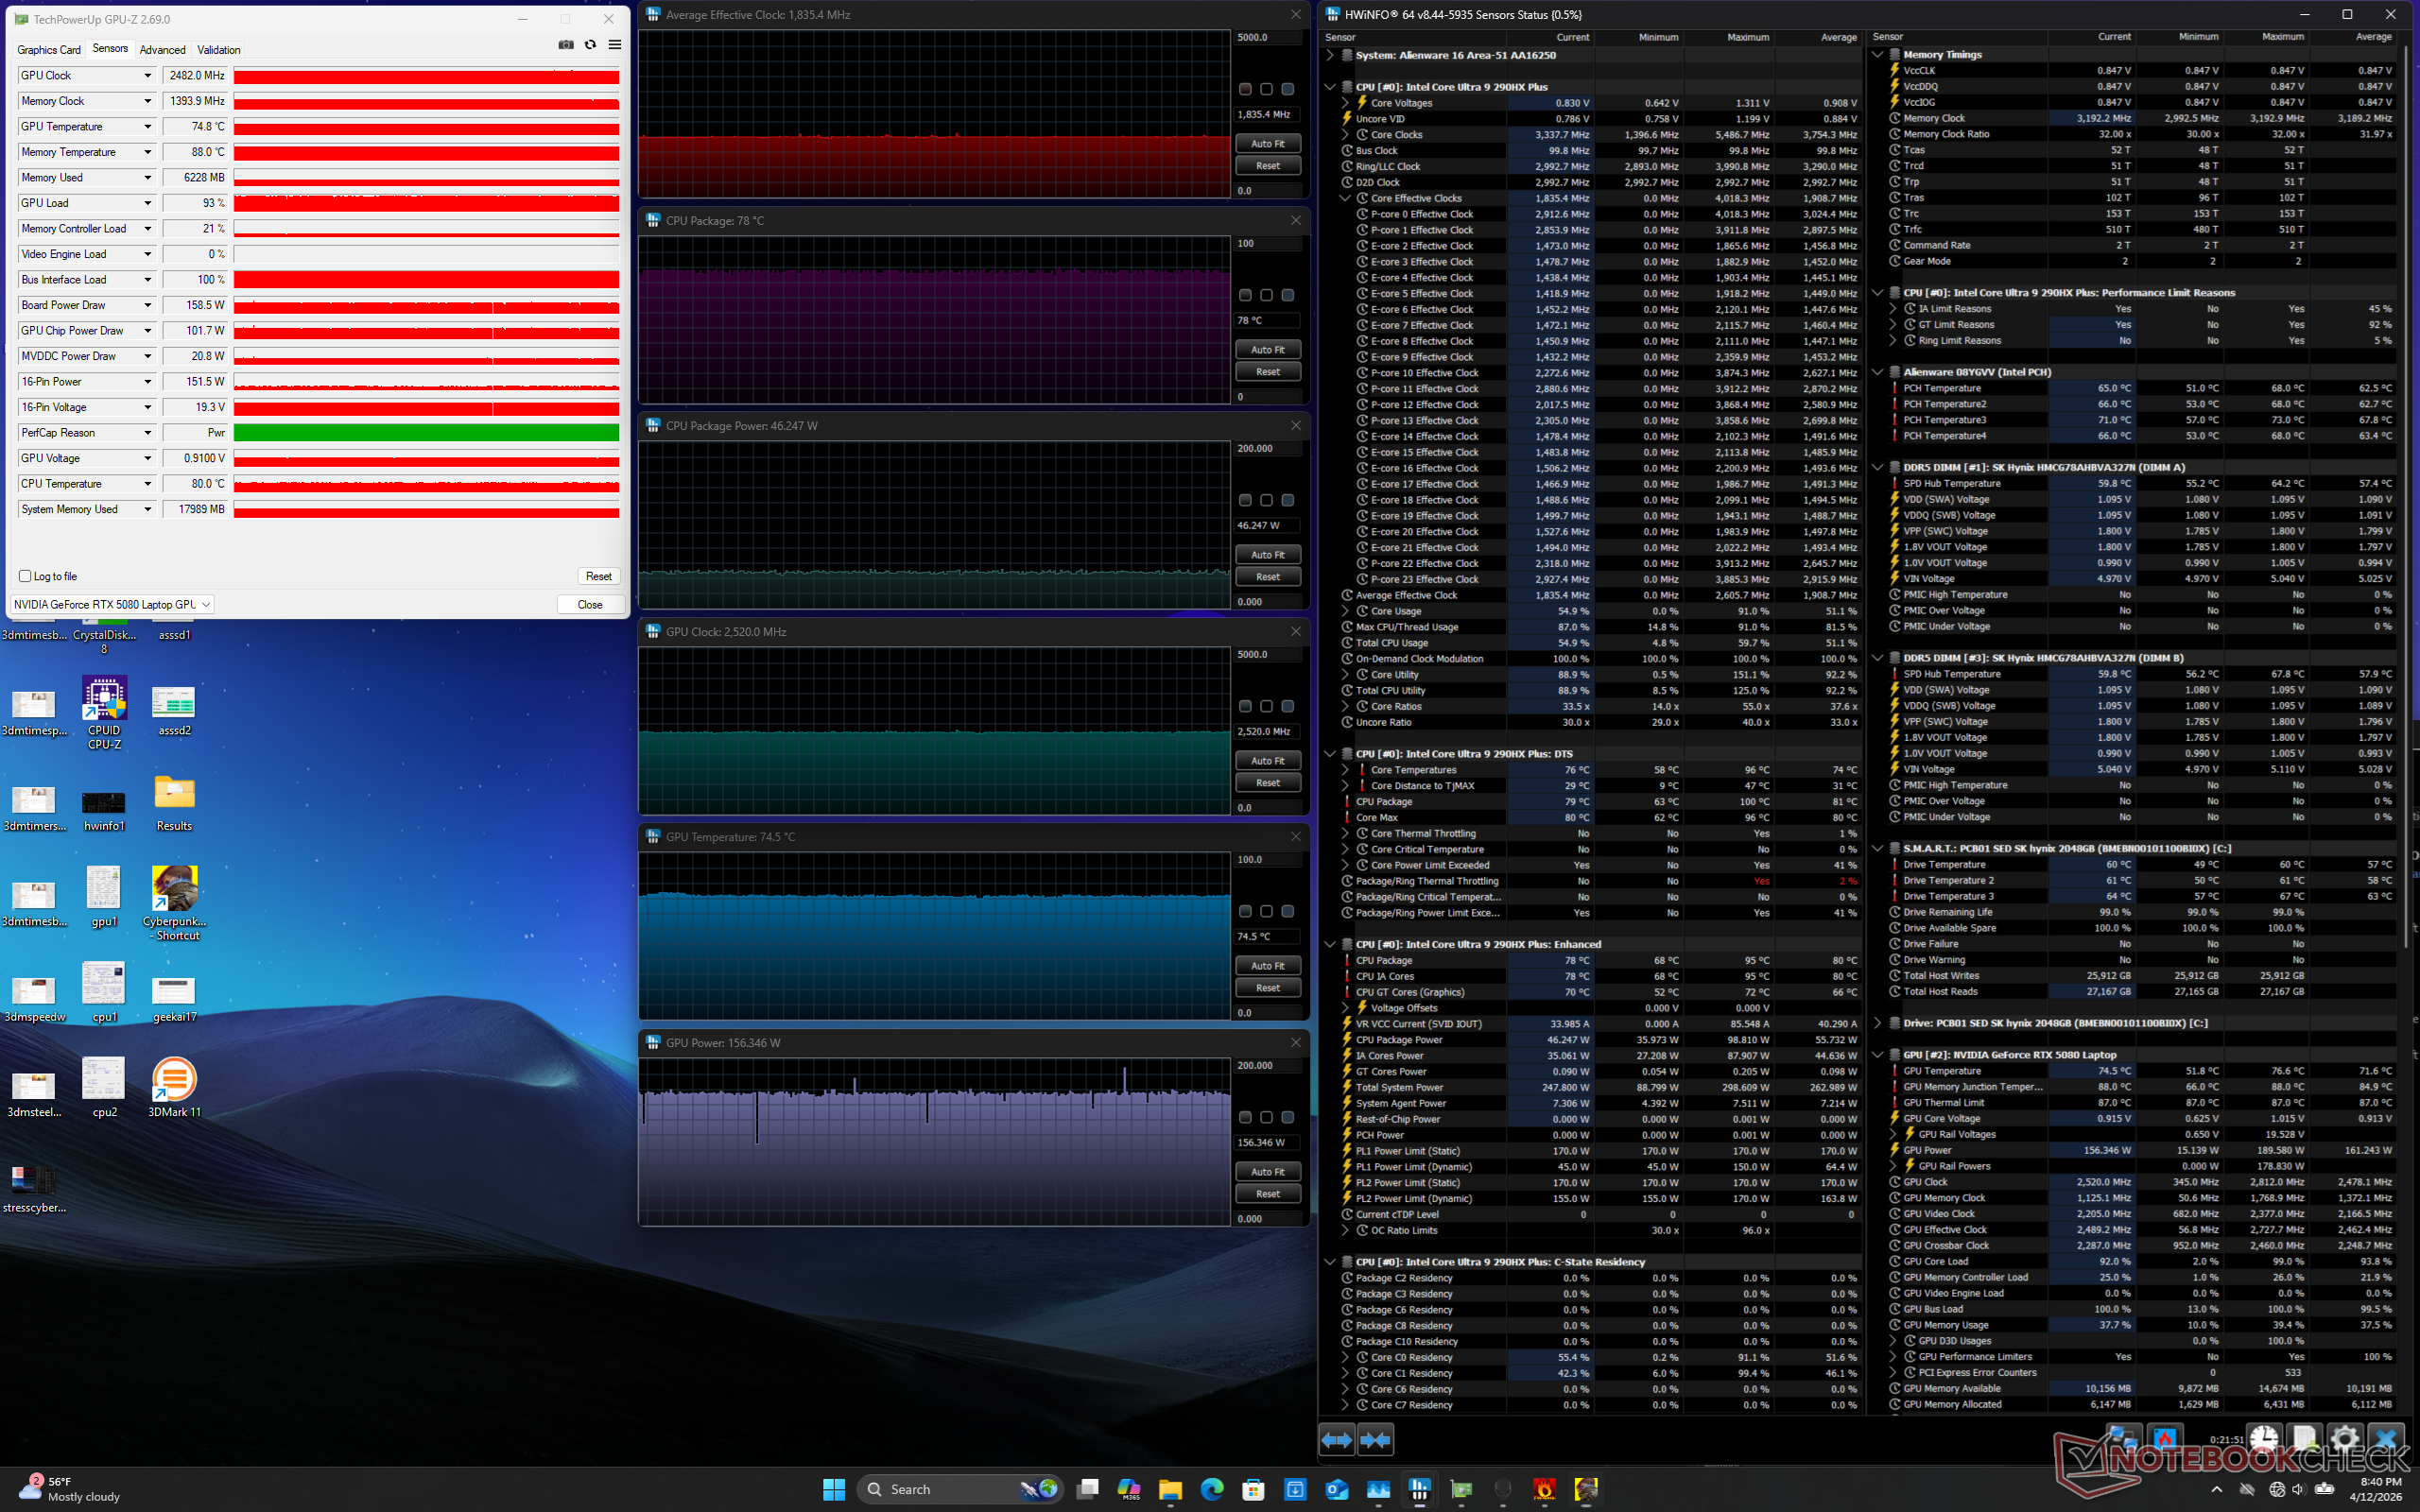
A temperatura da GPU permaneceria praticamente a mesma do modelo 2025 ao executar o Cyberpunk 2077. A temperatura da CPU, no entanto, seria mais quente em alguns graus C, chegando a 82 C.
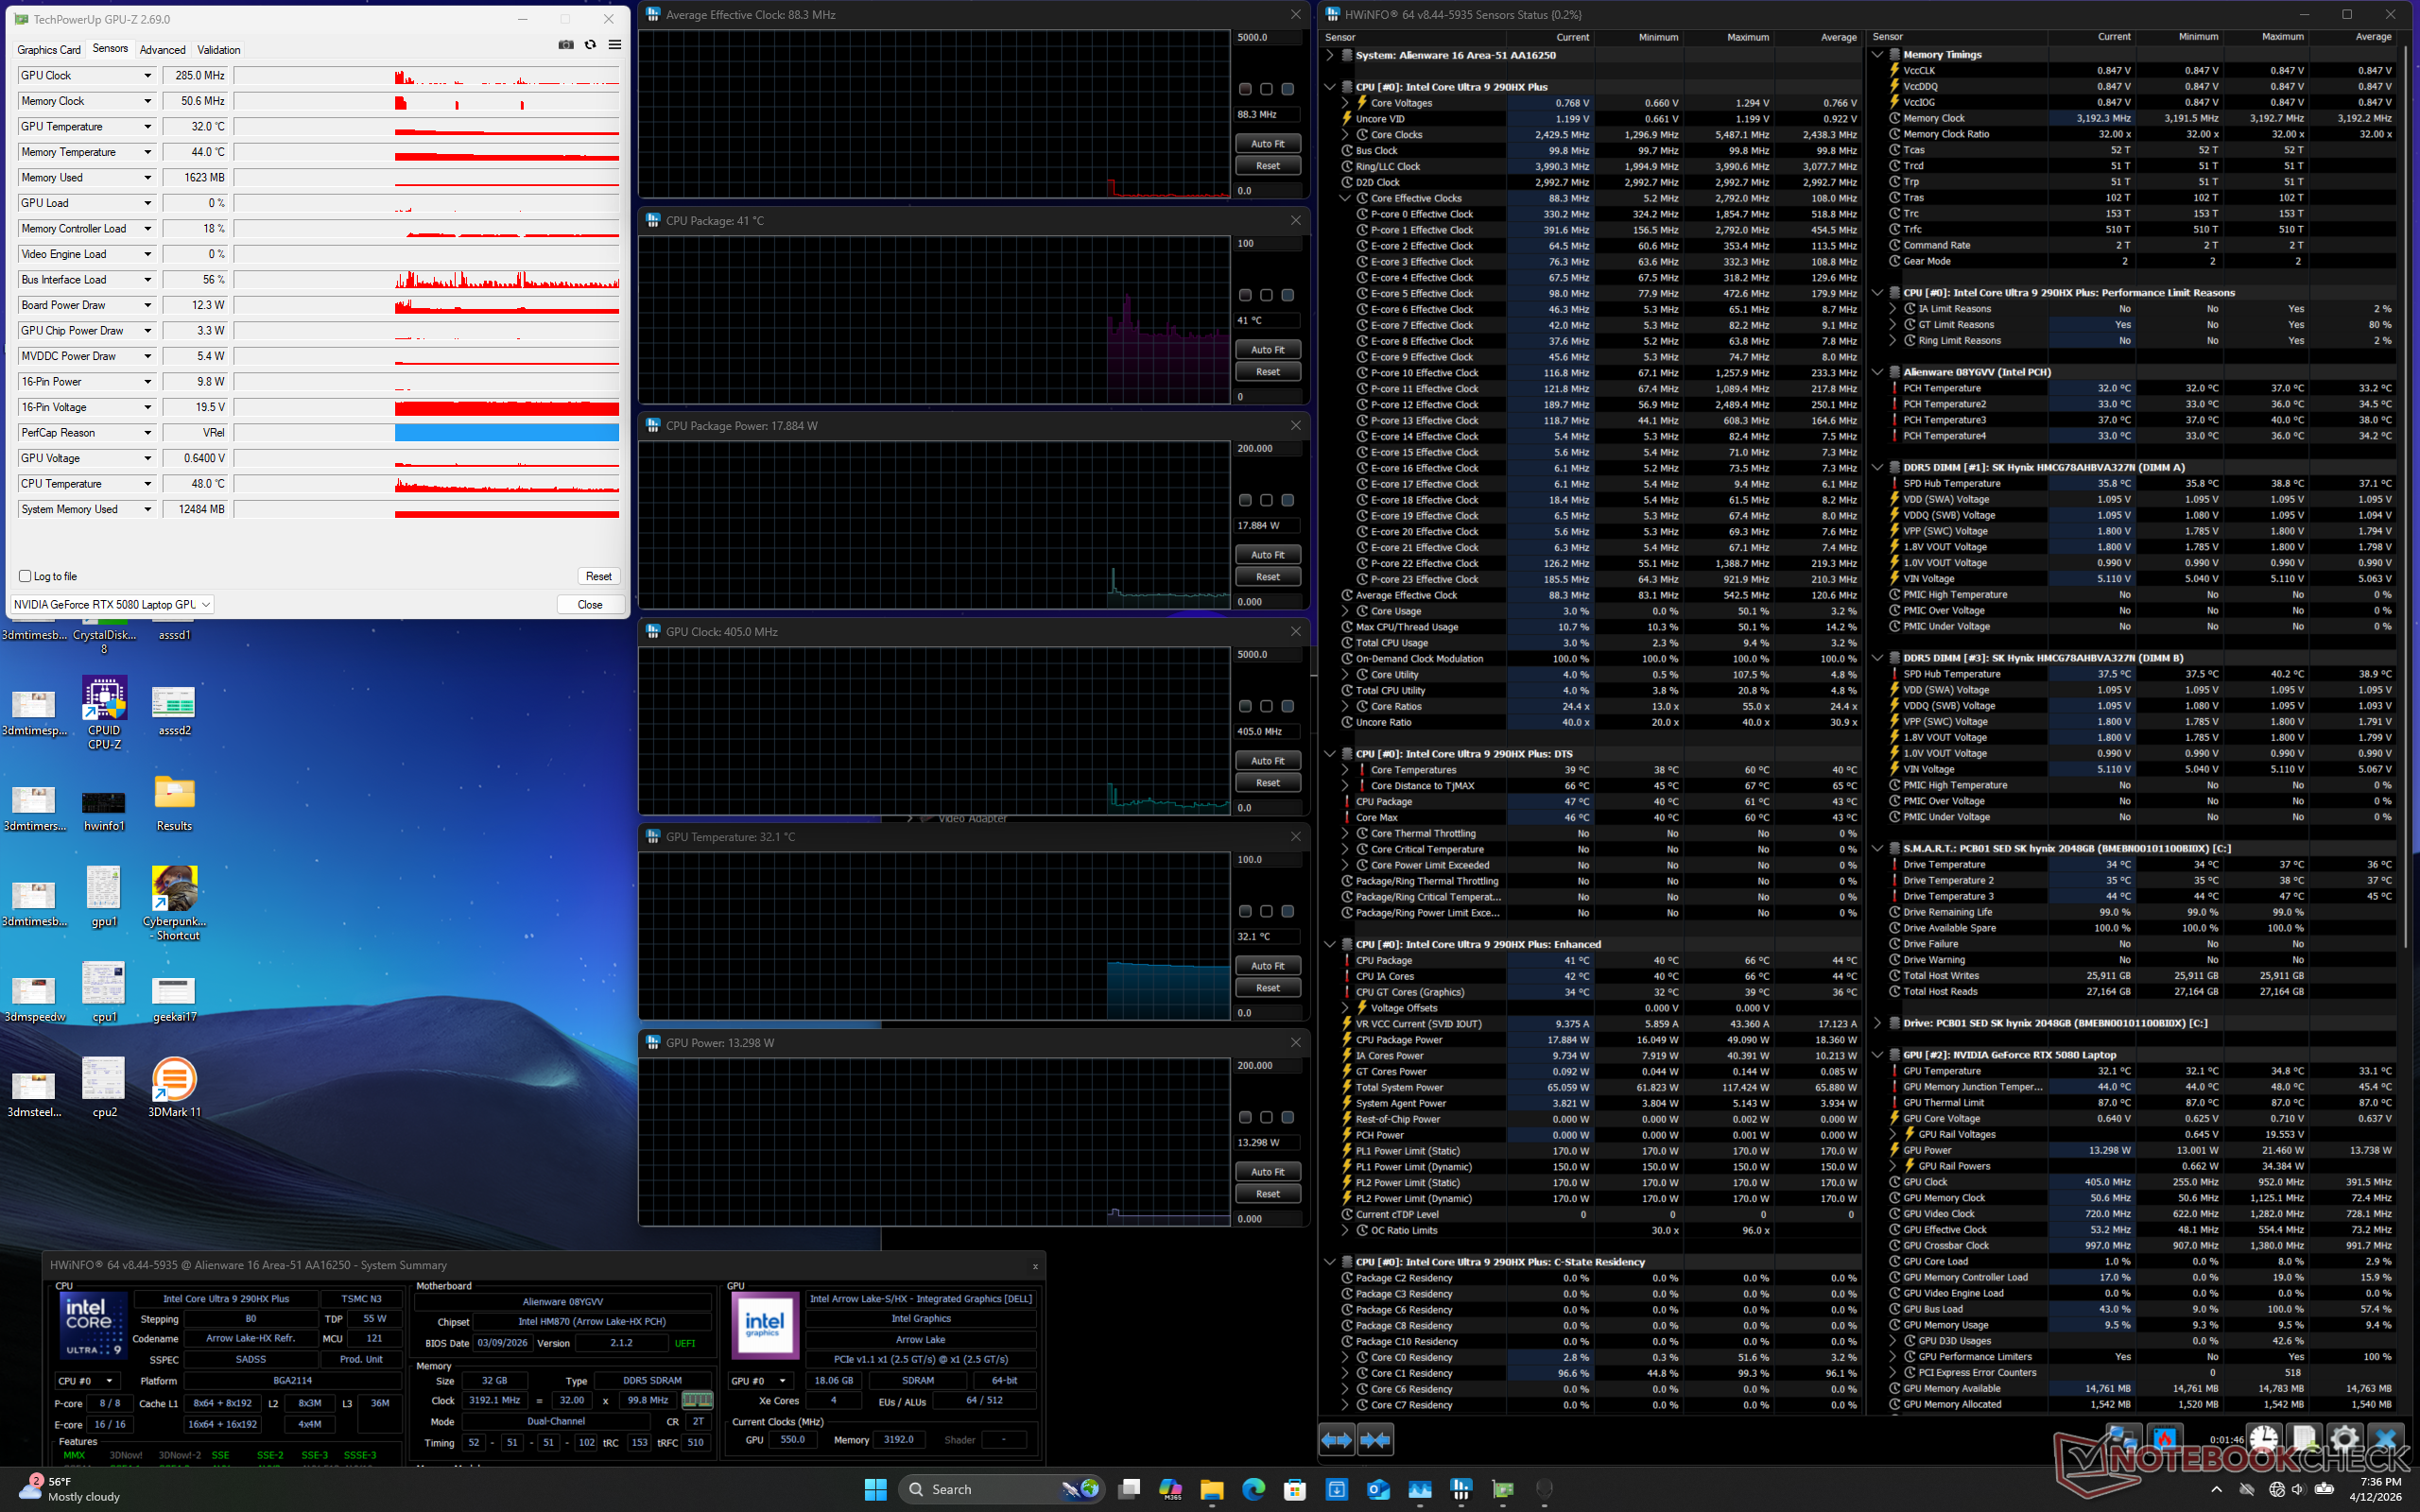
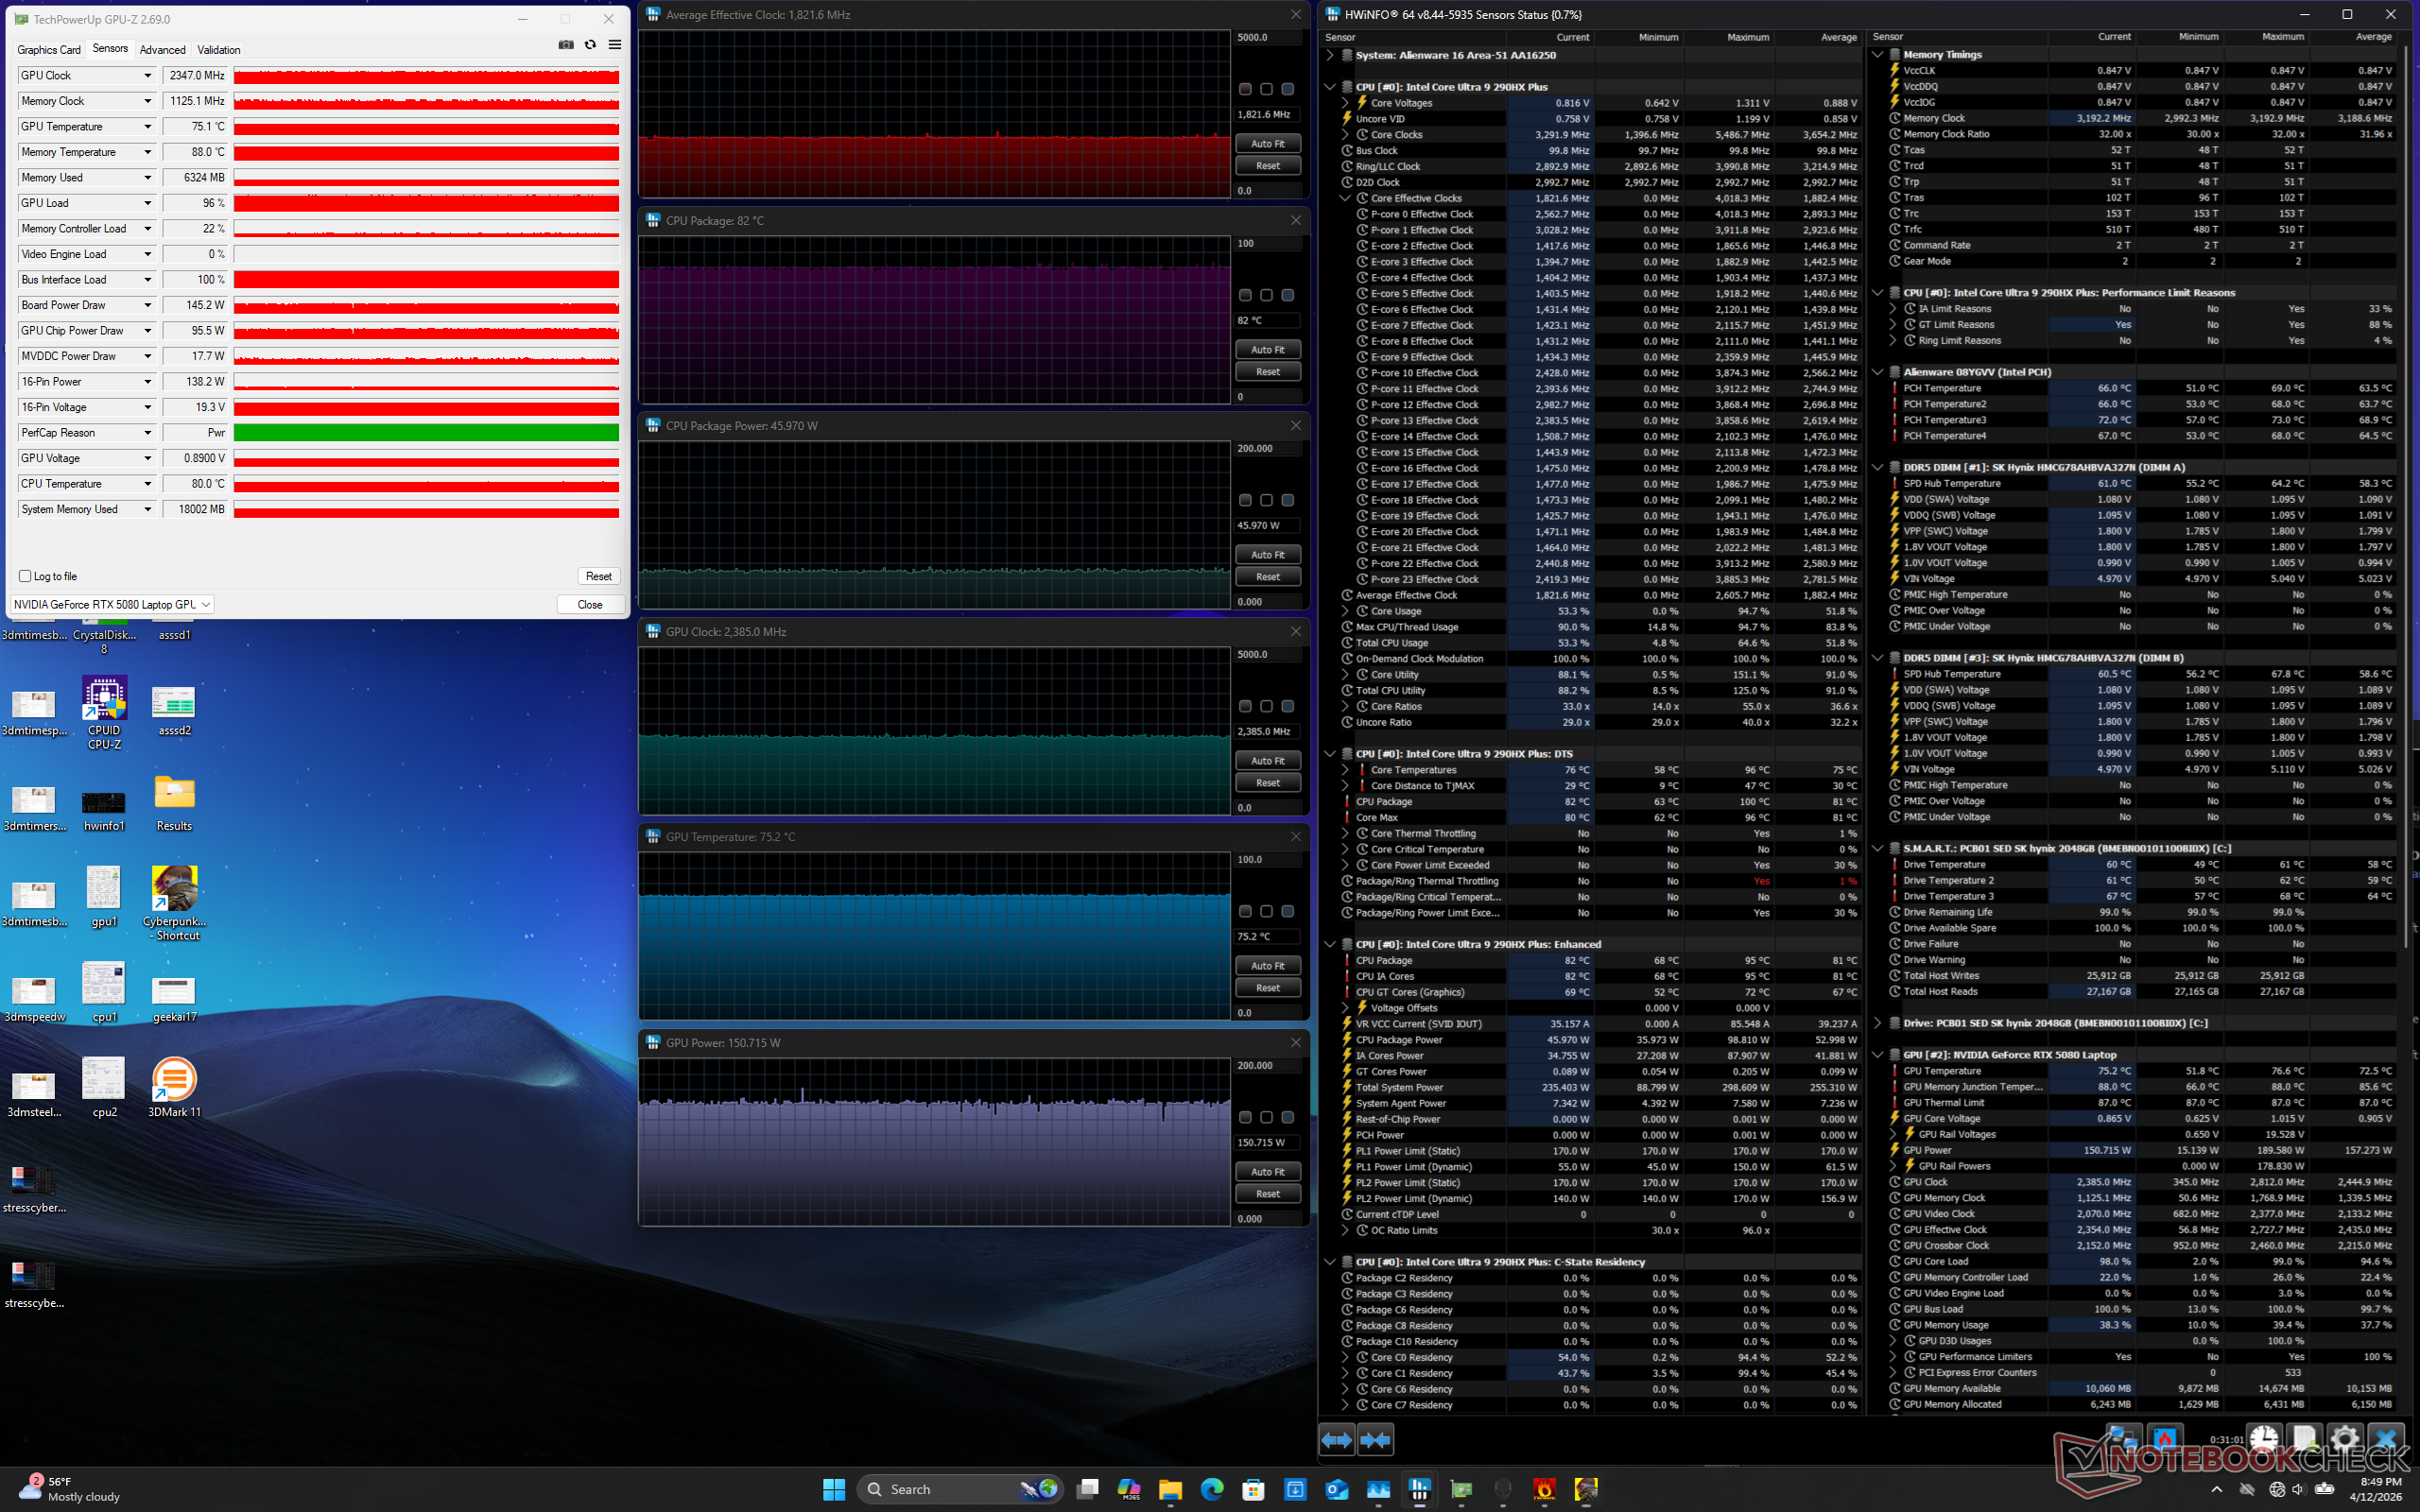
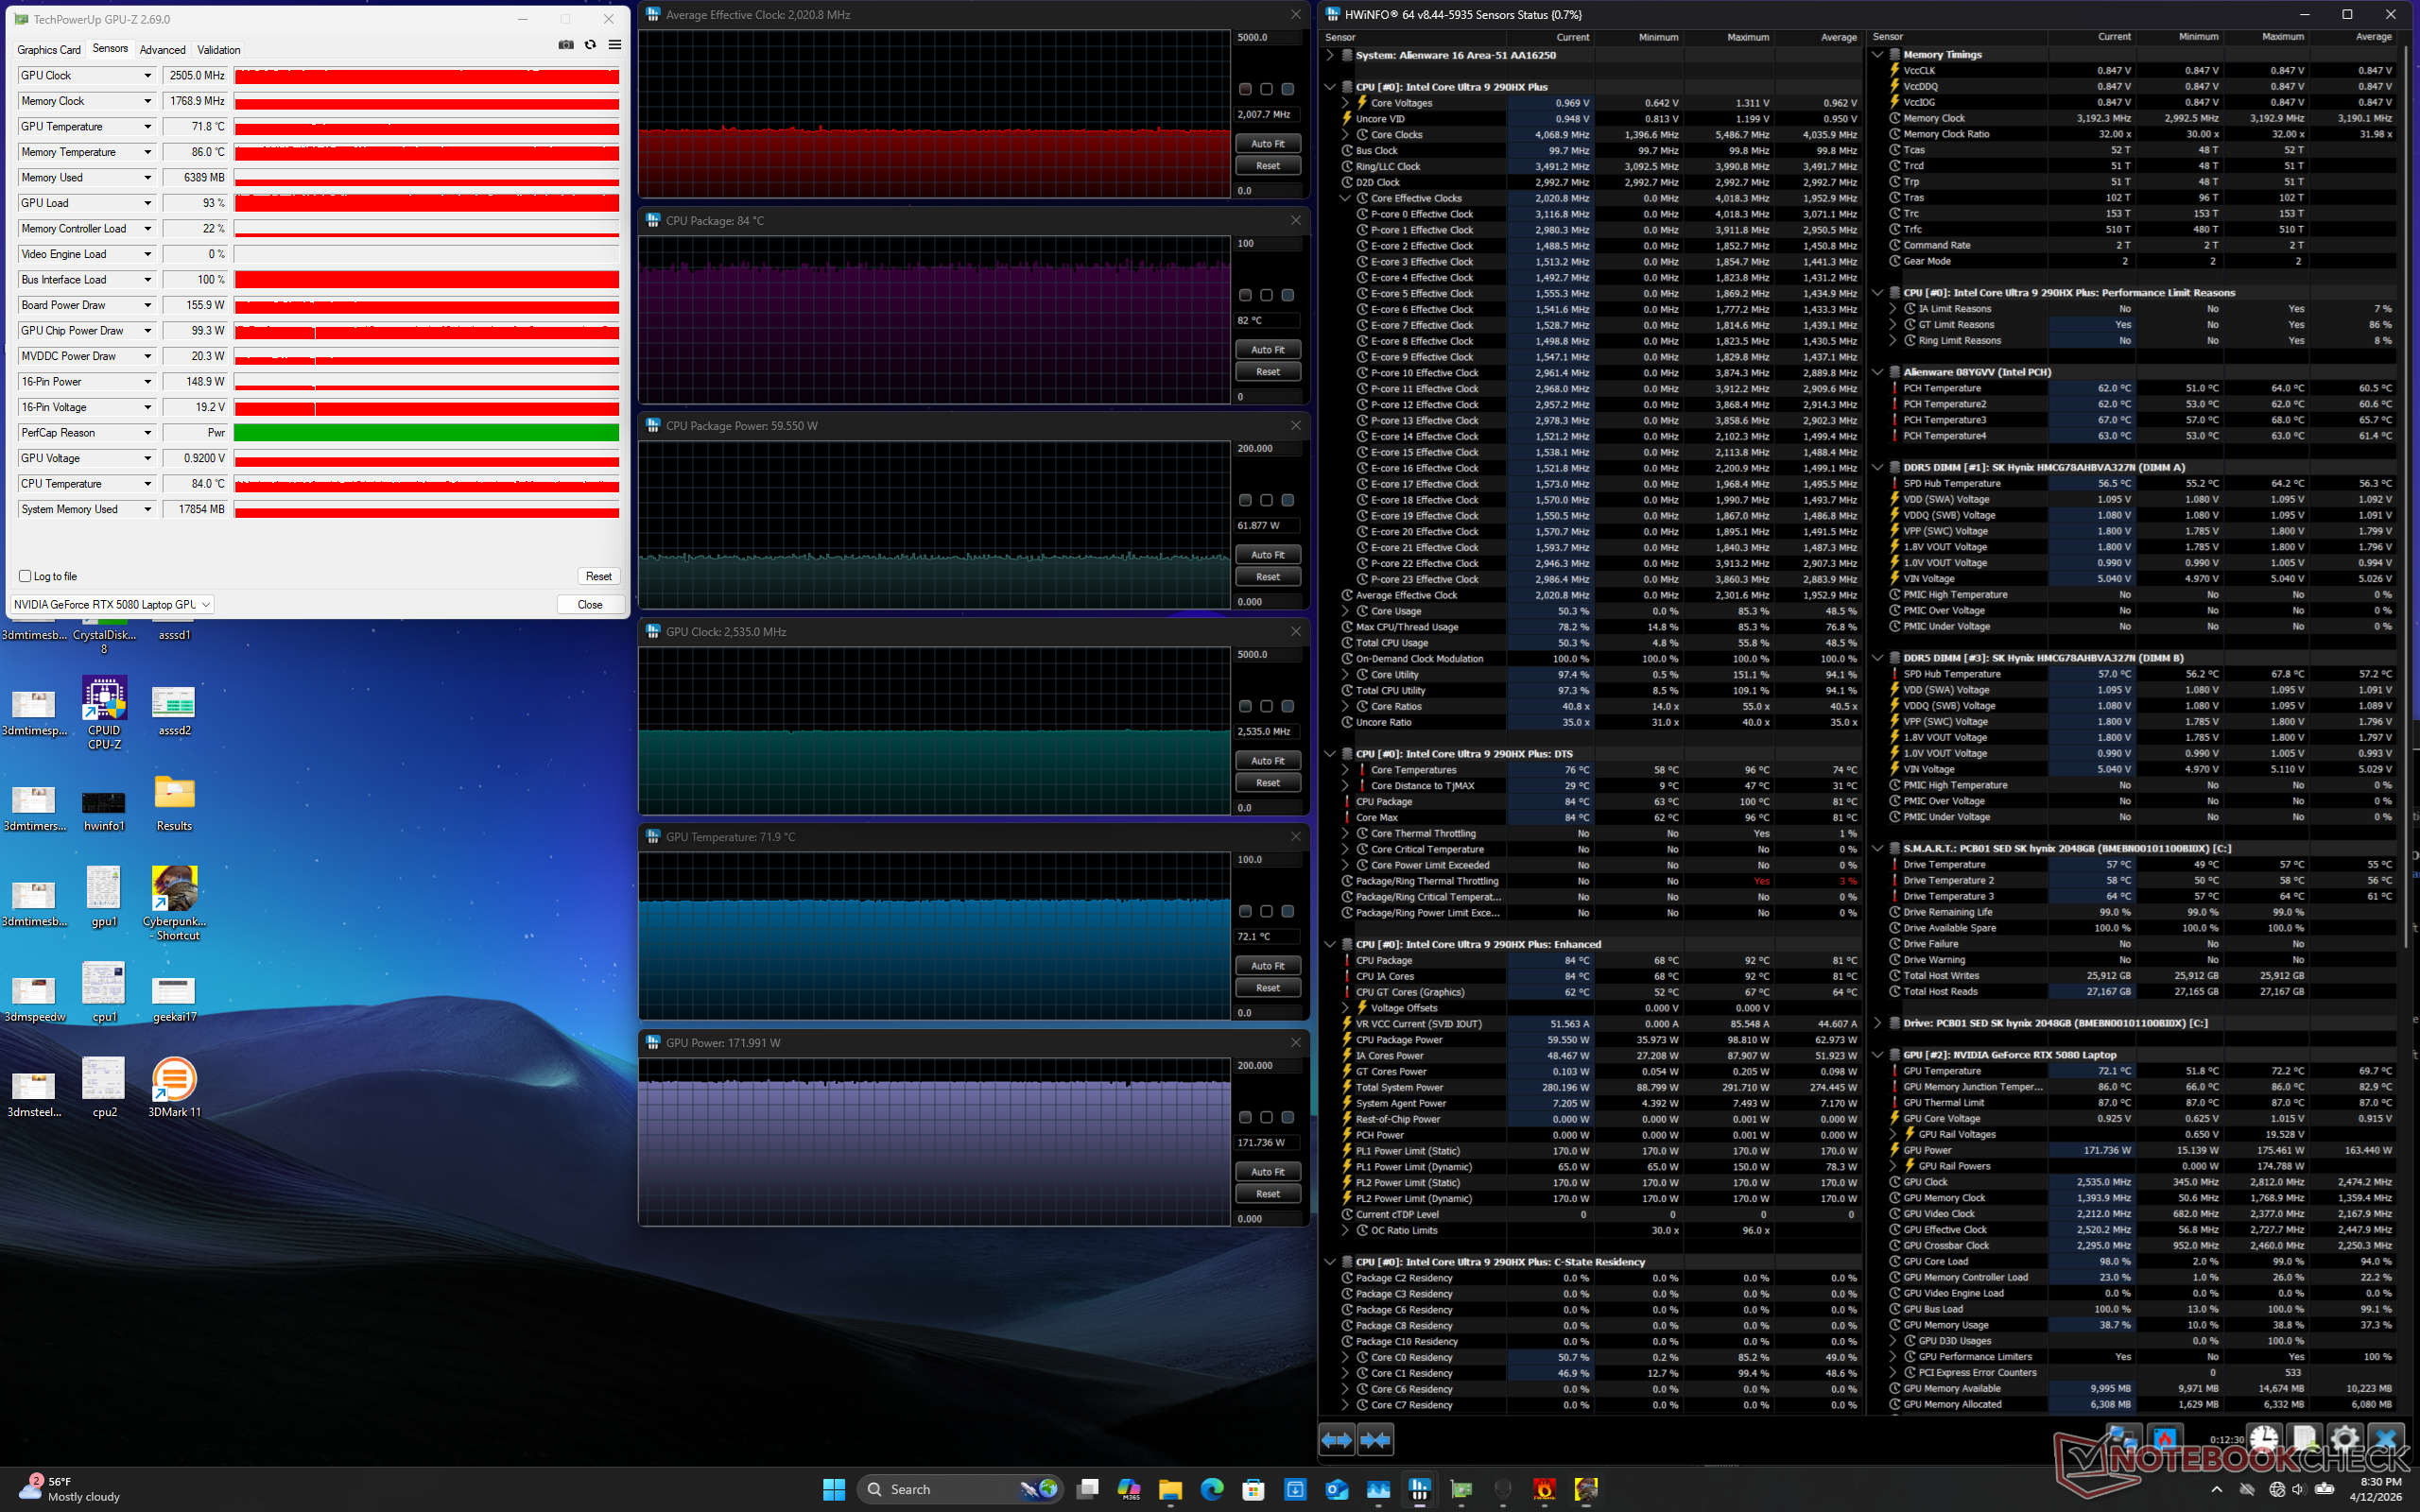
| Clock médio da CPU (GHz) | Clock da GPU (MHz) | Temperatura média da CPU (°C) | Temperatura média da GPU (°C) | |
| Sistema ocioso | -- | -- | 41 | 32 |
| Estresse do Prime95 | 4.1 | -- | 103 | 52 |
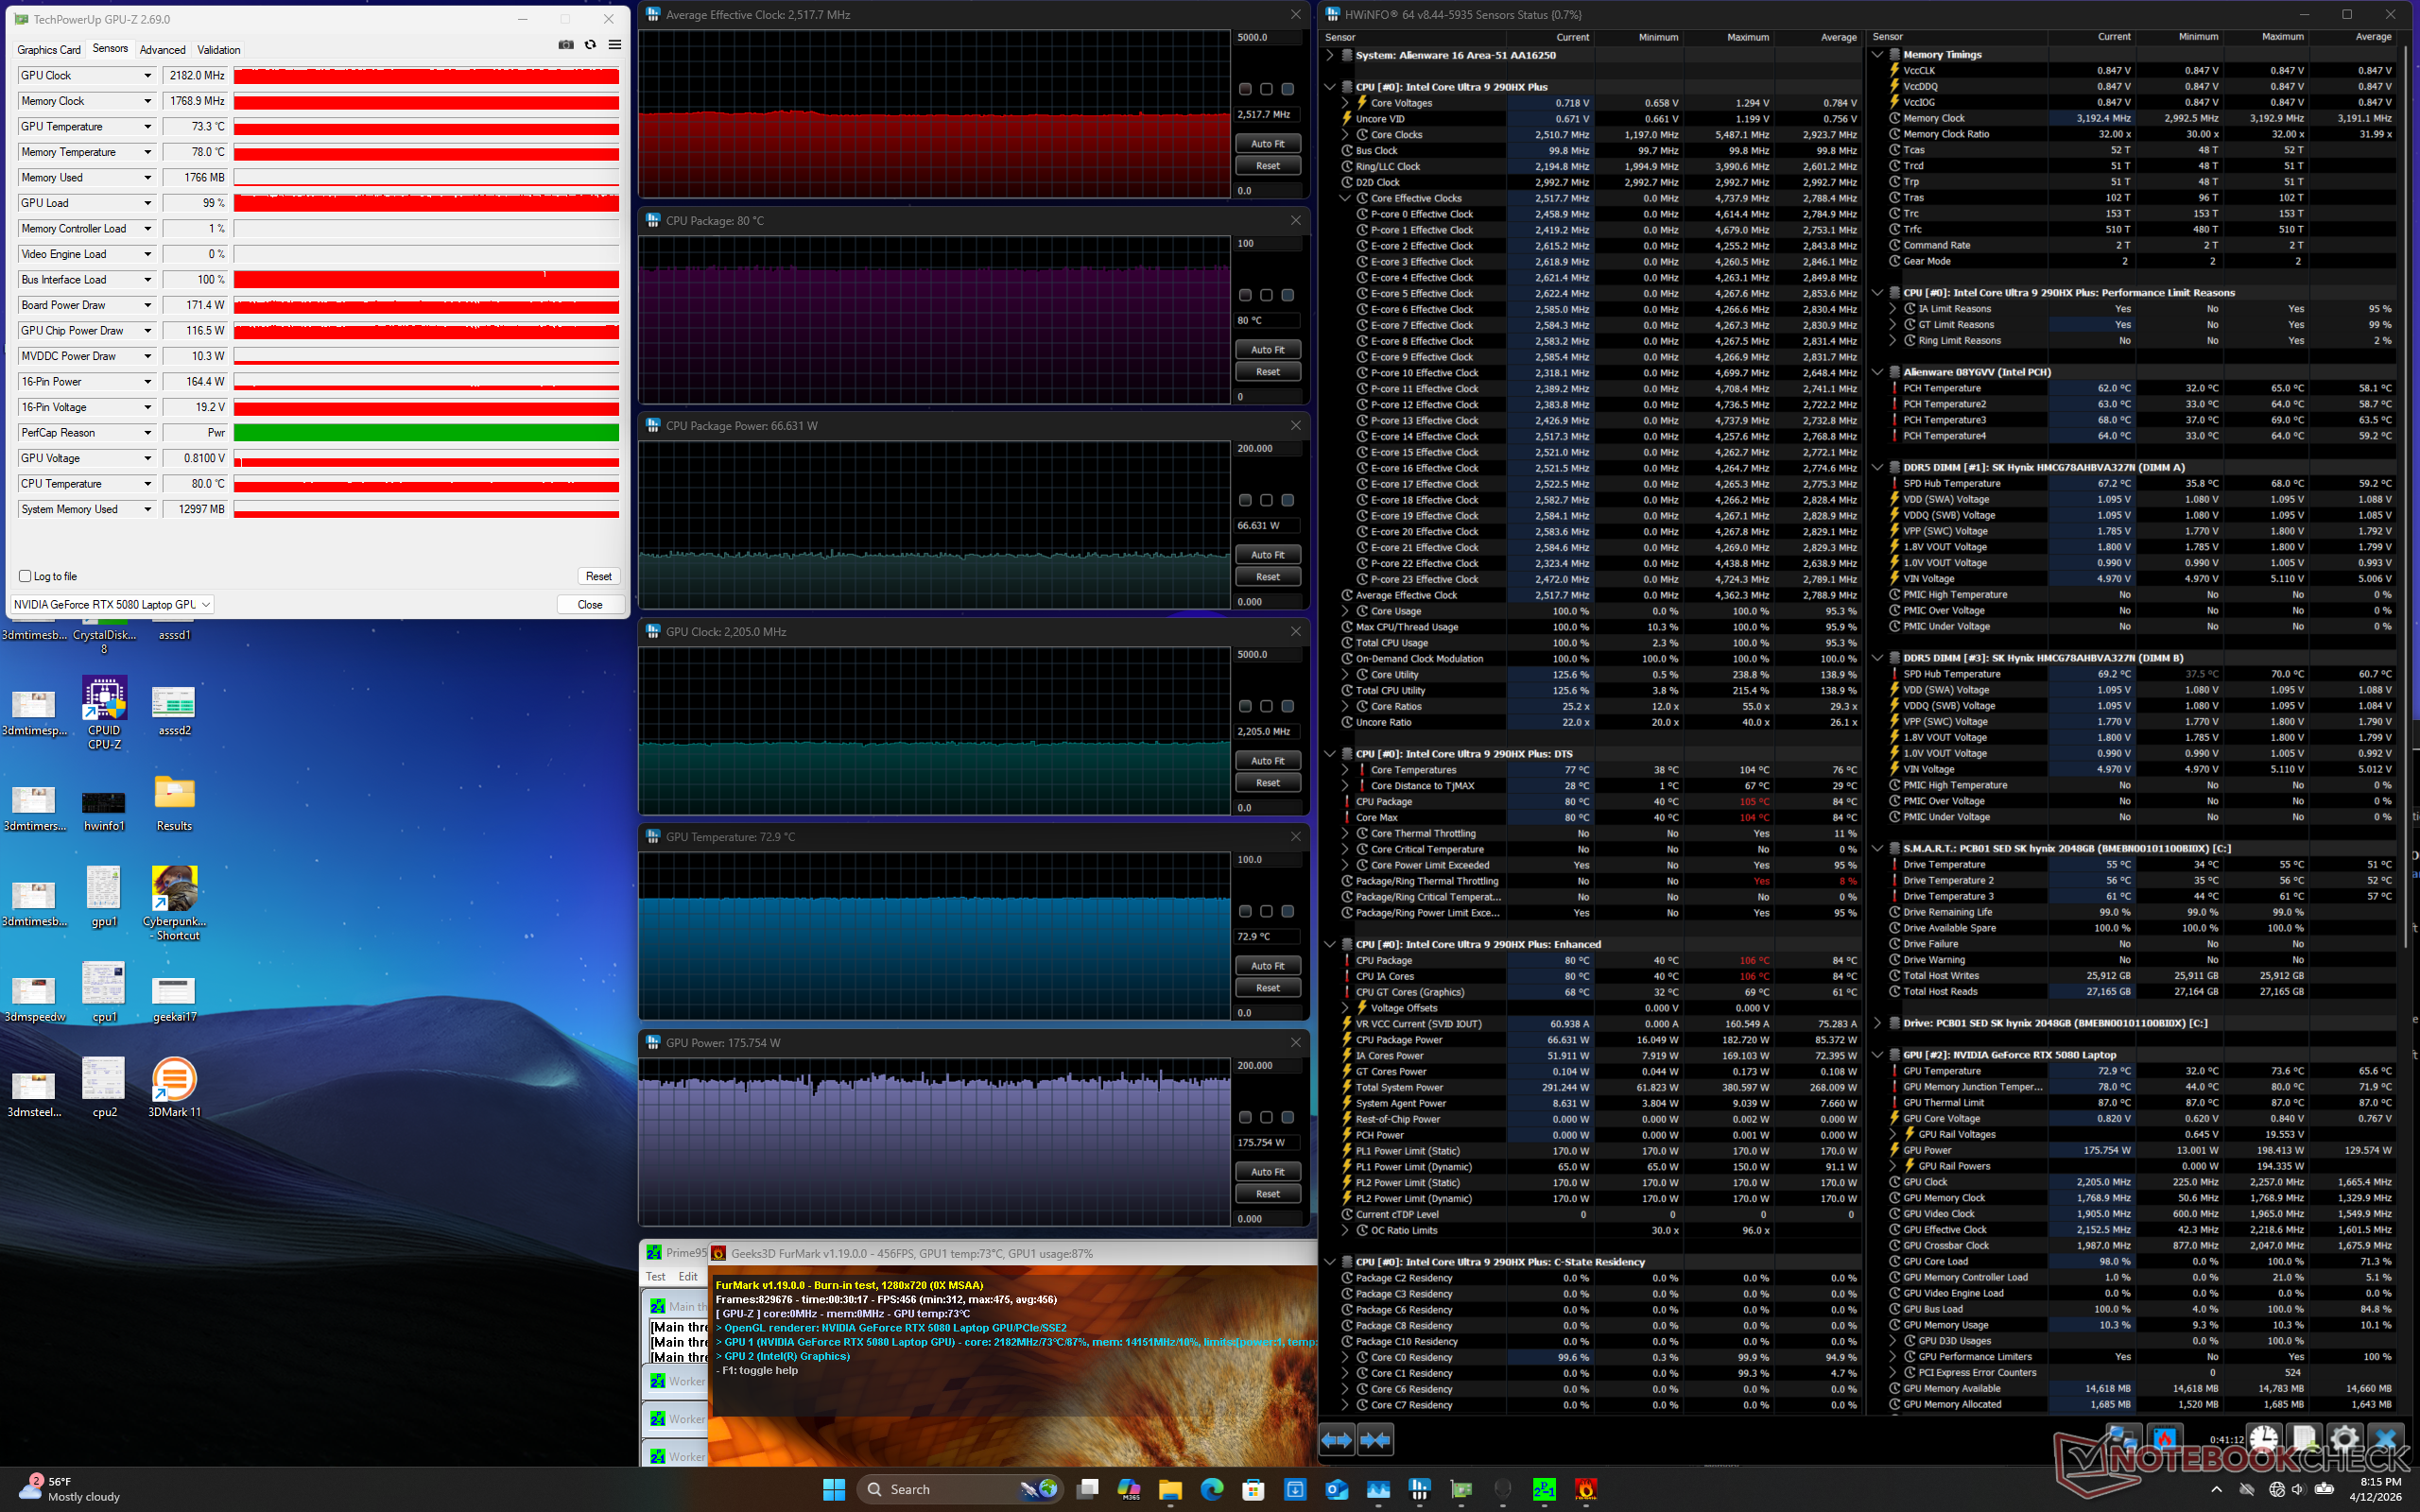
| Prime95 + FurMark Stress | 2.5 | 2182 | 80 | 73 |
| Estresse do Cyberpunk 2077 (modo balanceado) | 1.8 | 2347 | 82 | 75 |
| Cyberpunk 2077 Stress (Modo de desempenho) | 1.8 | 2482 | 78 | 75 |
| Cyberpunk 2077 Stress (Modo Overdrive) | 2.1 | 2505 | 82 | 72 |
Alto-falantes
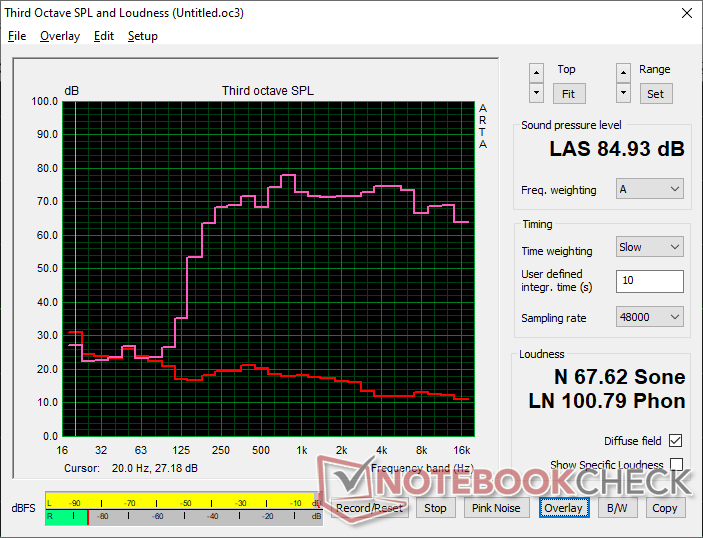
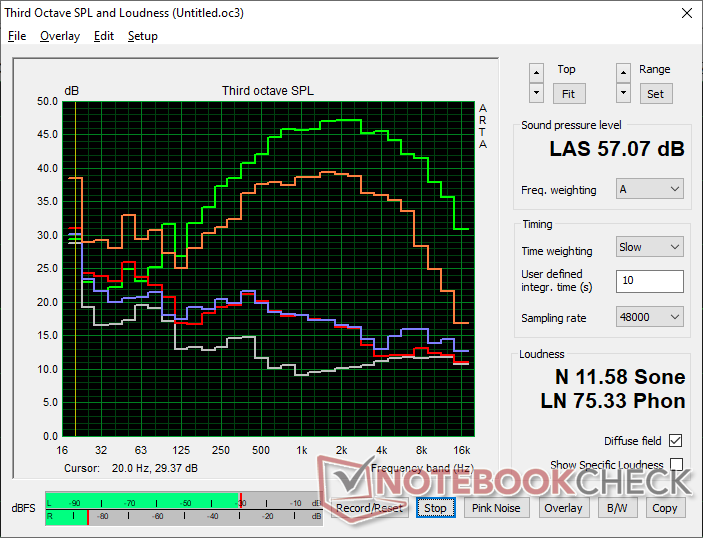
Alienware 16 Area-51 Core Ultra 9 290HX Plus análise de áudio
(+) | os alto-falantes podem tocar relativamente alto (###valor### dB)
Graves 100 - 315Hz
(-) | quase nenhum baixo - em média 18.7% menor que a mediana
(±) | a linearidade dos graves é média (13.9% delta para a frequência anterior)
Médios 400 - 2.000 Hz
(+) | médios equilibrados - apenas 1.8% longe da mediana
(+) | médios são lineares (5.1% delta para frequência anterior)
Altos 2 - 16 kHz
(+) | agudos equilibrados - apenas 2.5% longe da mediana
(+) | os máximos são lineares (3.4% delta da frequência anterior)
Geral 100 - 16.000 Hz
(+) | o som geral é linear (12.6% diferença em relação à mediana)
Comparado com a mesma classe
» 16% de todos os dispositivos testados nesta classe foram melhores, 4% semelhantes, 81% piores
» O melhor teve um delta de 6%, a média foi 18%, o pior foi 132%
Comparado com todos os dispositivos testados
» 11% de todos os dispositivos testados foram melhores, 3% semelhantes, 86% piores
» O melhor teve um delta de 4%, a média foi 23%, o pior foi 134%
Apple MacBook Pro 16 2021 M1 Pro análise de áudio
(+) | os alto-falantes podem tocar relativamente alto (###valor### dB)
Graves 100 - 315Hz
(+) | bons graves - apenas 3.8% longe da mediana
(+) | o baixo é linear (5.2% delta para a frequência anterior)
Médios 400 - 2.000 Hz
(+) | médios equilibrados - apenas 1.3% longe da mediana
(+) | médios são lineares (2.1% delta para frequência anterior)
Altos 2 - 16 kHz
(+) | agudos equilibrados - apenas 1.9% longe da mediana
(+) | os máximos são lineares (2.7% delta da frequência anterior)
Geral 100 - 16.000 Hz
(+) | o som geral é linear (4.6% diferença em relação à mediana)
Comparado com a mesma classe
» 0% de todos os dispositivos testados nesta classe foram melhores, 0% semelhantes, 100% piores
» O melhor teve um delta de 5%, a média foi 17%, o pior foi 45%
Comparado com todos os dispositivos testados
» 0% de todos os dispositivos testados foram melhores, 0% semelhantes, 100% piores
» O melhor teve um delta de 4%, a média foi 23%, o pior foi 134%
Gerenciamento de energia
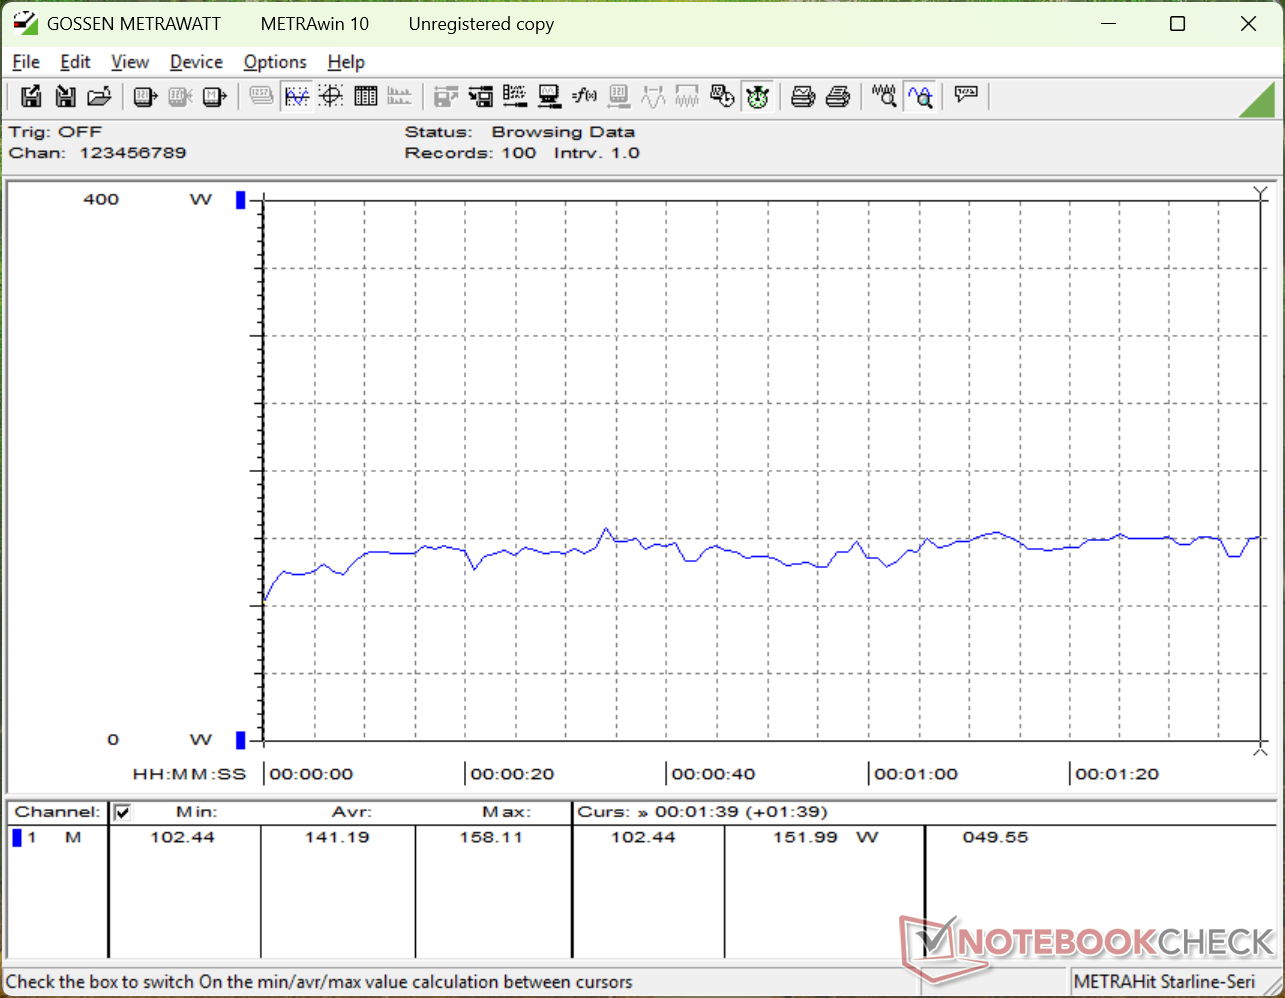
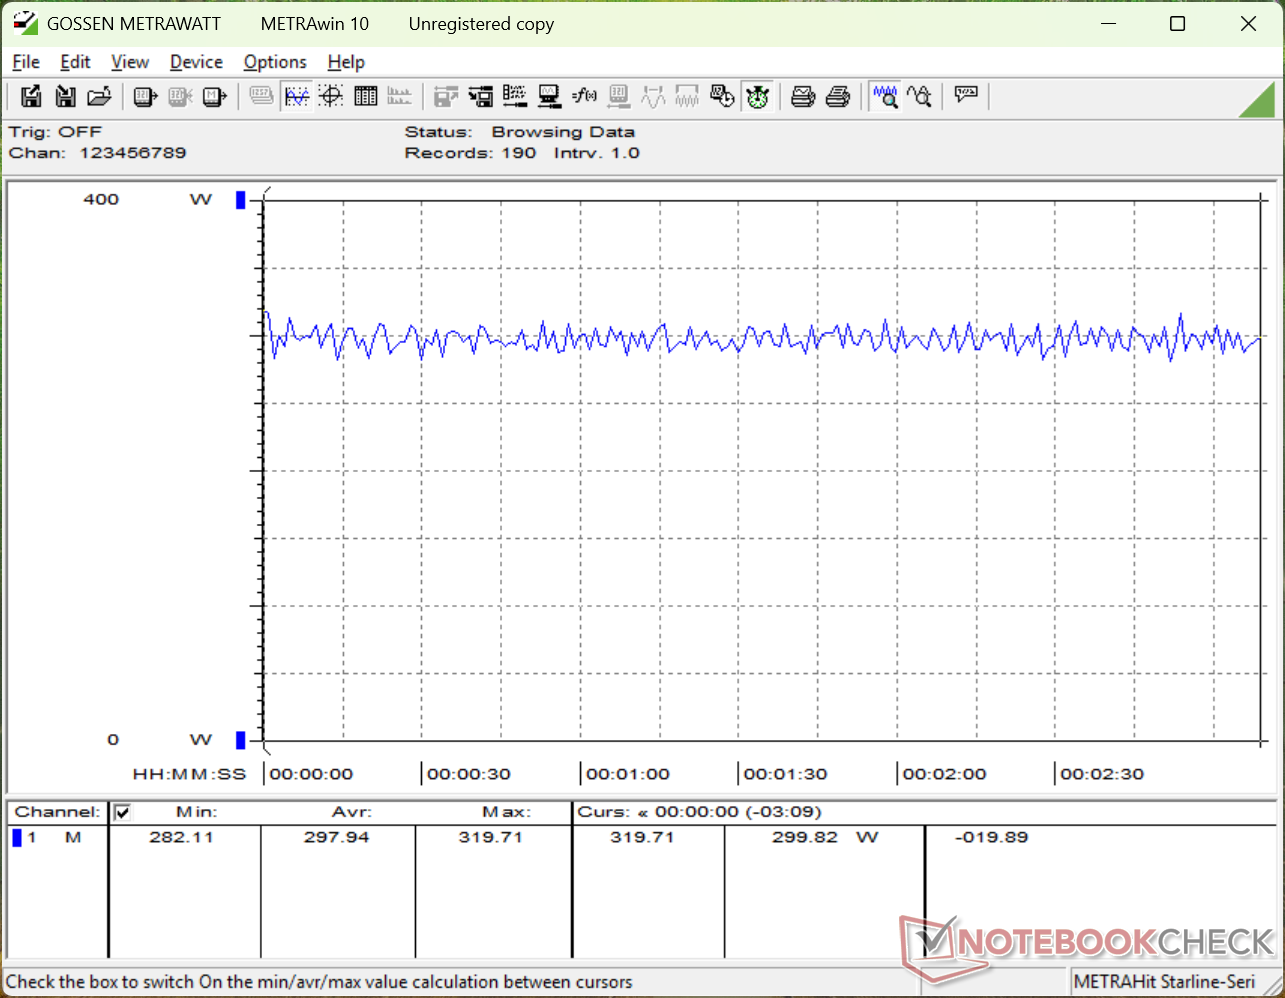
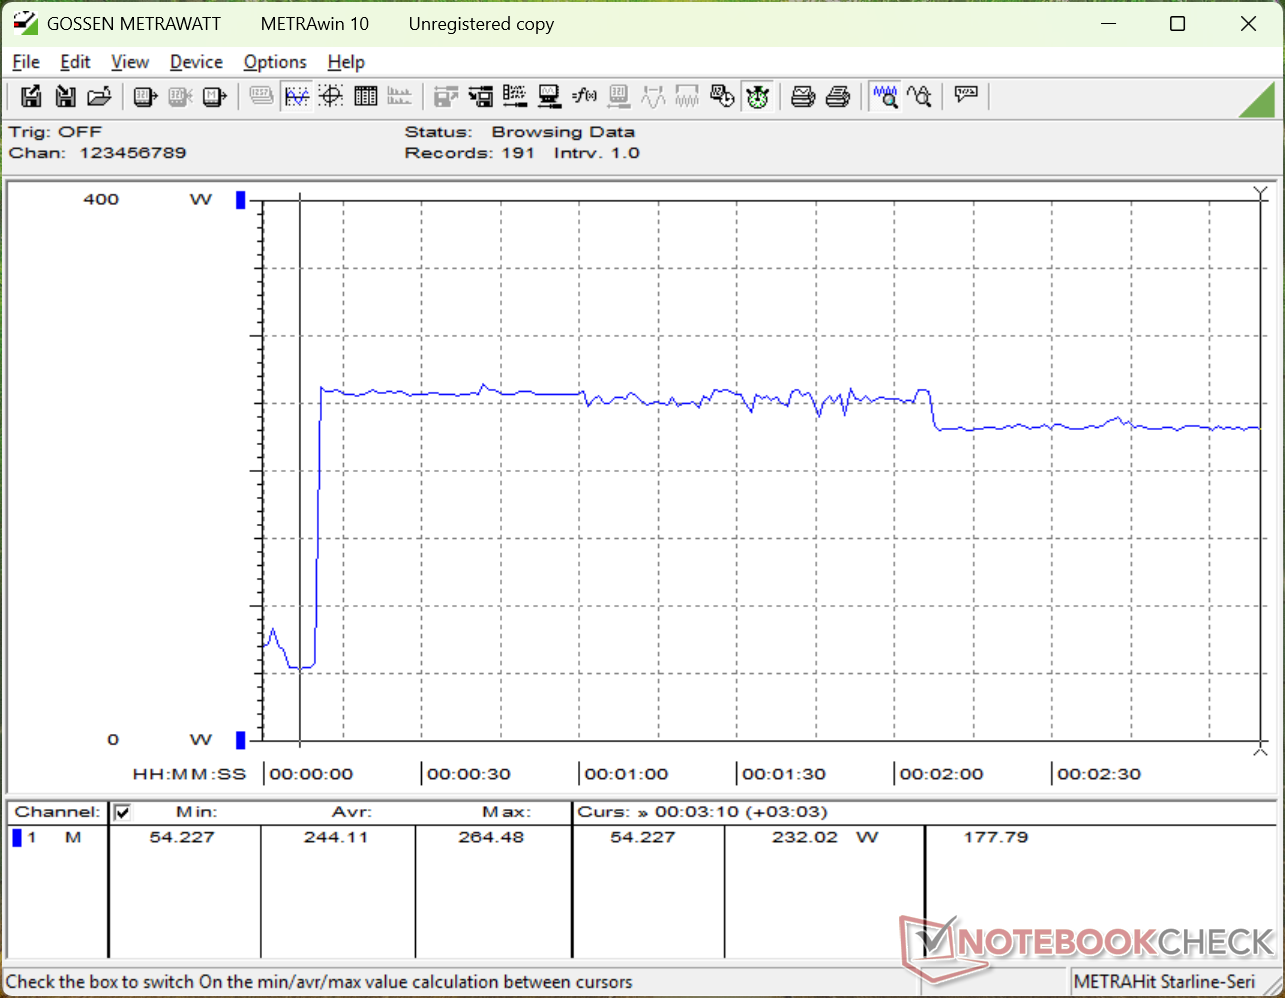
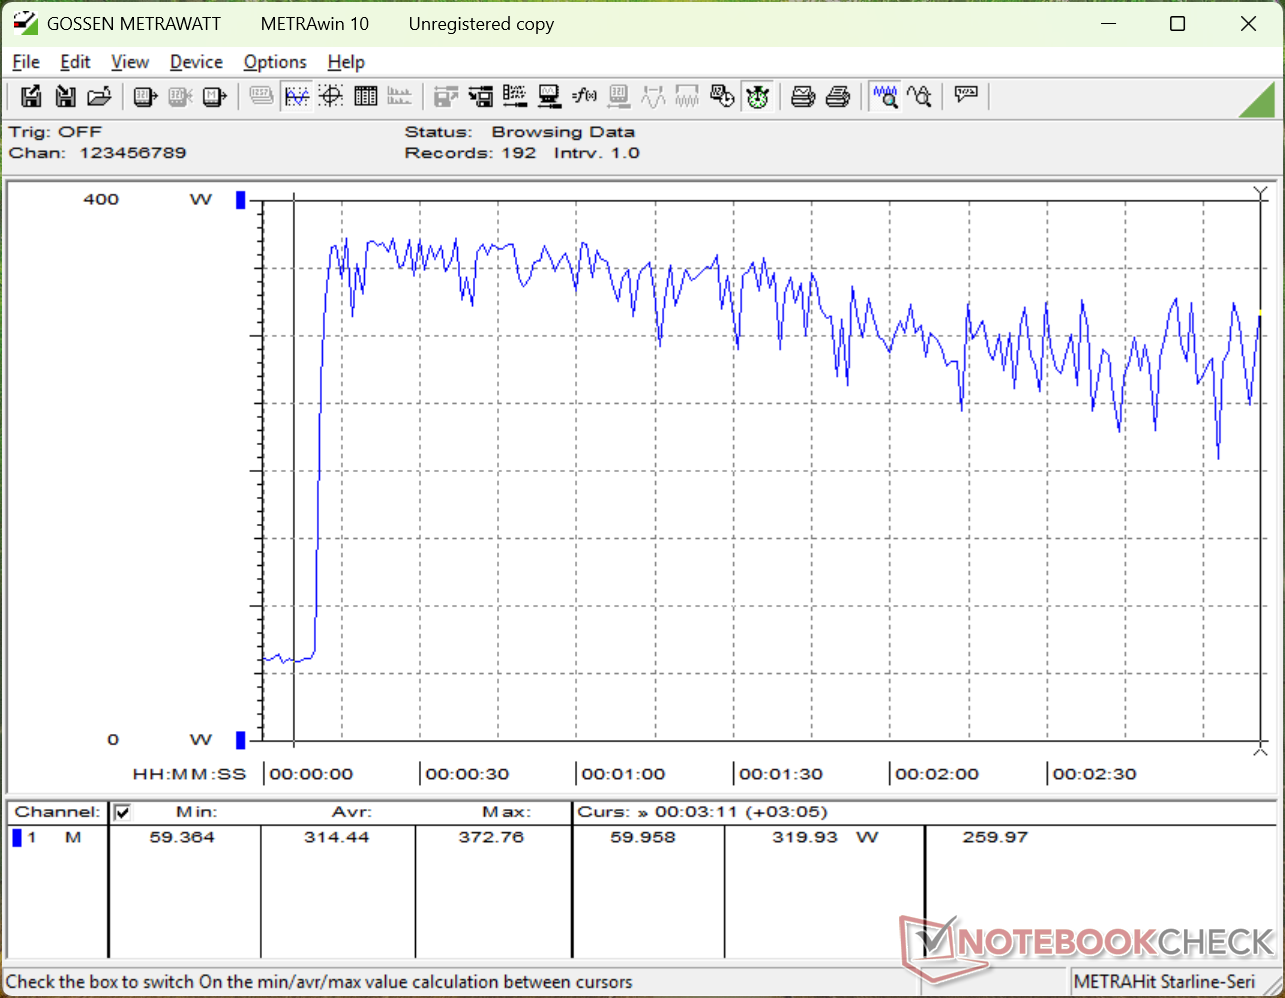
Consumo de energia
O Core Ultra 9 290HX Plus é de 15% a 25% mais rápido do que o Core Ultra 9 275HX anterior, conforme mencionado acima. Não por acaso, nosso Alienware 16 2026 é de 15% a 25% mais exigente do que o Alienware 16 2025 quando a CPU está sob estresse. A execução do Prime95 no modelo mais recente do Alienware consome cerca de 255 W quando o Turbo Boost é mais eficaz ou 230 W quando o Turbo Boost atingiu o platô, em comparação com apenas 200 W no modelo do ano passado. Mesmo quando não está jogando, o modelo mais novo é geralmente mais exigente, com pelo menos alguns watts a mais.
O fino adaptador CA GaN de 360 W não sofreu alterações em relação ao modelo de 2025.
| desligado | |
| Ocioso | |
| Carga |
|
Key:
min: | |
| Alienware 16 Area-51 Core Ultra 9 290HX Plus Ultra 9 290HX Plus, GeForce RTX 5080 Laptop, SK hynix PCB01 HFS001TFM9X186N, OLED, 2560x1600, 16" | Alienware 16 Area-51 Ultra 9 275HX, GeForce RTX 5080 Laptop, Samsung PM9C1a MZ9L81T0HDLB, IPS, 2560x1600, 16" | Lenovo Legion Pro 7i 16 Gen 10 Ultra 9 275HX, GeForce RTX 5080 Laptop, SK Hynix HFS001TEJ9X115N, OLED, 2560x1600, 16" | HP Omen Max 16 ah000 Ultra 9 275HX, GeForce RTX 5090 Laptop, WDC PC SN810 2TB, OLED, 2560x1600, 16" | MSI Vector 16 HX AI A2XWHG Ultra 7 255HX, GeForce RTX 5070 Ti Laptop, Micron 2400 MTFDKBA512QFM, IPS, 2560x1600, 16" | Asus ROG Zephyrus G16 GU605CW Ultra 9 285H, GeForce RTX 5080 Laptop, Micron 2500 2TB MTFDKBA2T0QGN-1BN1AABGA, OLED, 2560x1600, 16" | |
|---|---|---|---|---|---|---|
| Power Consumption | 2% | -11% | 18% | 32% | 46% | |
| Idle Minimum * (Watt) | 23.9 | 27 -13% | 28.5 -19% | 9.9 59% | 7.1 70% | 12.6 47% |
| Idle Average * (Watt) | 25.2 | 33.5 -33% | 38.8 -54% | 28.6 -13% | 15.9 37% | 13.4 47% |
| Idle Maximum * (Watt) | 49.6 | 41.4 17% | 45.6 8% | 47.1 5% | 29.5 41% | 15.1 70% |
| Load Average * (Watt) | 141.2 | 124.7 12% | 132.2 6% | 141.8 -0% | 124 12% | 116.3 18% |
| Cyberpunk 2077 ultra external monitor * (Watt) | 297 | 249 16% | 319 -7% | 230 23% | 217 27% | 157.9 47% |
| Cyberpunk 2077 ultra * (Watt) | 298 | 256 14% | 318 -7% | 253 15% | 222 26% | 156.4 48% |
| Load Maximum * (Watt) | 372.8 | 367.2 2% | 384 -3% | 233 37% | 336 10% | 199 47% |
* ... menor é melhor
Consumo de energia Cyberpunk / Teste de estresse
Consumo de energia do monitor externo
Duração da bateria
O tempo de execução da WLAN é praticamente o mesmo de antes, se não for um pouco mais longo, apenas meia hora, mesmo com o VRR e o Optimus ativados e os LEDs desativados. Ainda assim, 3 horas não é muito tempo, não importa como o senhor olhe para isso.
| Alienware 16 Area-51 Core Ultra 9 290HX Plus Ultra 9 290HX Plus, GeForce RTX 5080 Laptop, 96 Wh | Alienware 16 Area-51 Ultra 9 275HX, GeForce RTX 5080 Laptop, 96 Wh | Lenovo Legion Pro 7i 16 Gen 10 Ultra 9 275HX, GeForce RTX 5080 Laptop, 99 Wh | HP Omen Max 16 ah000 Ultra 9 275HX, GeForce RTX 5090 Laptop, 83 Wh | MSI Vector 16 HX AI A2XWHG Ultra 7 255HX, GeForce RTX 5070 Ti Laptop, 90 Wh | Asus ROG Zephyrus G16 GU605CW Ultra 9 285H, GeForce RTX 5080 Laptop, 90 Wh | |
|---|---|---|---|---|---|---|
| Duração da bateria | -13% | 69% | 81% | 119% | ||
| WiFi v1.3 (h) | 3.2 | 2.8 -13% | 5.4 69% | 5.8 81% | 7 119% | |
| Reader / Idle (h) | 3.1 | 8.7 | ||||
| Load (h) | 0.8 | 1.2 |
Classificação do Notebookcheck
O Alienware 16 Area-51 com Core Ultra 9 290HX Plus é a versão mais rápida do modelo disponível. Para a grande maioria dos jogadores, no entanto, a potência extra da CPU fará apenas uma pequena diferença, na melhor das hipóteses.
Alienware 16 Area-51 Core Ultra 9 290HX Plus
- 04/22/2026 v8
Allen Ngo
 Total Sustainability Score:
 Concorrentes potenciais em comparação
Imagem | Modelo / Análises | Preço | Peso | Altura | Tela |
|---|---|---|---|---|---|
1. 88.1%  | Alienware 16 Area-51 Core Ultra 9 290HX Plus Intel Core Ultra 9 290HX Plus ⎘ NVIDIA GeForce RTX 5080 Laptop ⎘ 32 GB Memória, SSD | Amazon: Preço de tabela: 4000 USD | 3.3 kg | 28.5 mm | 16.00" 2560x1600 189 PPI OLED |
2. 85.7%  | Alienware 16 Area-51 Intel Core Ultra 9 275HX ⎘ NVIDIA GeForce RTX 5080 Laptop ⎘ 32 GB Memória, 1024 GB SSD | Amazon: 1. $2,463.19 Alienware 16 Area-51 Gaming ... 2. $3,899.99 Alienware 16 Area-51 Gaming ... 3. $3,799.99 Alienware 16 Area-51 Gaming ... Preço de tabela: 3500 USD | 3.3 kg | 28.5 mm | 16.00" 2560x1600 189 PPI IPS |
3. 87.5%  | Lenovo Legion Pro 7i 16 Gen 10 Intel Core Ultra 9 275HX ⎘ NVIDIA GeForce RTX 5080 Laptop ⎘ 32 GB Memória, 1024 GB SSD | Amazon: Preço de tabela: 4200 USD | 2.6 kg | 26.65 mm | 16.00" 2560x1600 189 PPI OLED |
4. 81.9%  | HP Omen Max 16 ah000 Intel Core Ultra 9 275HX ⎘ NVIDIA GeForce RTX 5090 Laptop ⎘ 32 GB Memória, 2048 GB SSD | Amazon: Preço de tabela: 3800 USD | 2.8 kg | 24.9 mm | 16.00" 2560x1600 189 PPI OLED |
5. 84%  | MSI Vector 16 HX AI A2XWHG Intel Core Ultra 7 255HX ⎘ NVIDIA GeForce RTX 5070 Ti Laptop ⎘ 16 GB Memória, 512 GB SSD | Amazon: Preço de tabela: 2000 EUR | 2.6 kg | 28.6 mm | 16.00" 2560x1600 189 PPI IPS |
6.  | Asus ROG Zephyrus G16 GU605CW Intel Core Ultra 9 285H ⎘ NVIDIA GeForce RTX 5080 Laptop ⎘ 32 GB Memória, 2048 GB SSD | Amazon: Preço de tabela: 3800€ | 2 kg | 14.9 mm | 16.00" 2560x1600 189 PPI OLED |
Transparência
A seleção dos dispositivos a serem analisados é feita pela nossa equipe editorial. A amostra de teste foi fornecida ao autor como empréstimo pelo fabricante ou varejista para fins desta revisão. O credor não teve influência nesta revisão, nem o fabricante recebeu uma cópia desta revisão antes da publicação. Não houve obrigação de publicar esta revisão. Como empresa de mídia independente, a Notebookcheck não está sujeita à autoridade de fabricantes, varejistas ou editores.
É assim que o Notebookcheck está testando
Todos os anos, o Notebookcheck analisa de forma independente centenas de laptops e smartphones usando procedimentos padronizados para garantir que todos os resultados sejam comparáveis. Desenvolvemos continuamente nossos métodos de teste há cerca de 20 anos e definimos padrões da indústria no processo. Em nossos laboratórios de teste, equipamentos de medição de alta qualidade são utilizados por técnicos e editores experientes. Esses testes envolvem um processo de validação em vários estágios. Nosso complexo sistema de classificação é baseado em centenas de medições e benchmarks bem fundamentados, o que mantém a objetividade.
