Análise da estação de trabalho HP ZBook Fury 16 G9: Dell Precision 7670 e alternativa ao ThinkPad P16 G1

A série ZBook Fury é o lar das estações de trabalho móveis de mais alto desempenho da HP, em contraste com a série de médio porte Série ZBook Studio e a ultrafina Série ZBook Firefly.
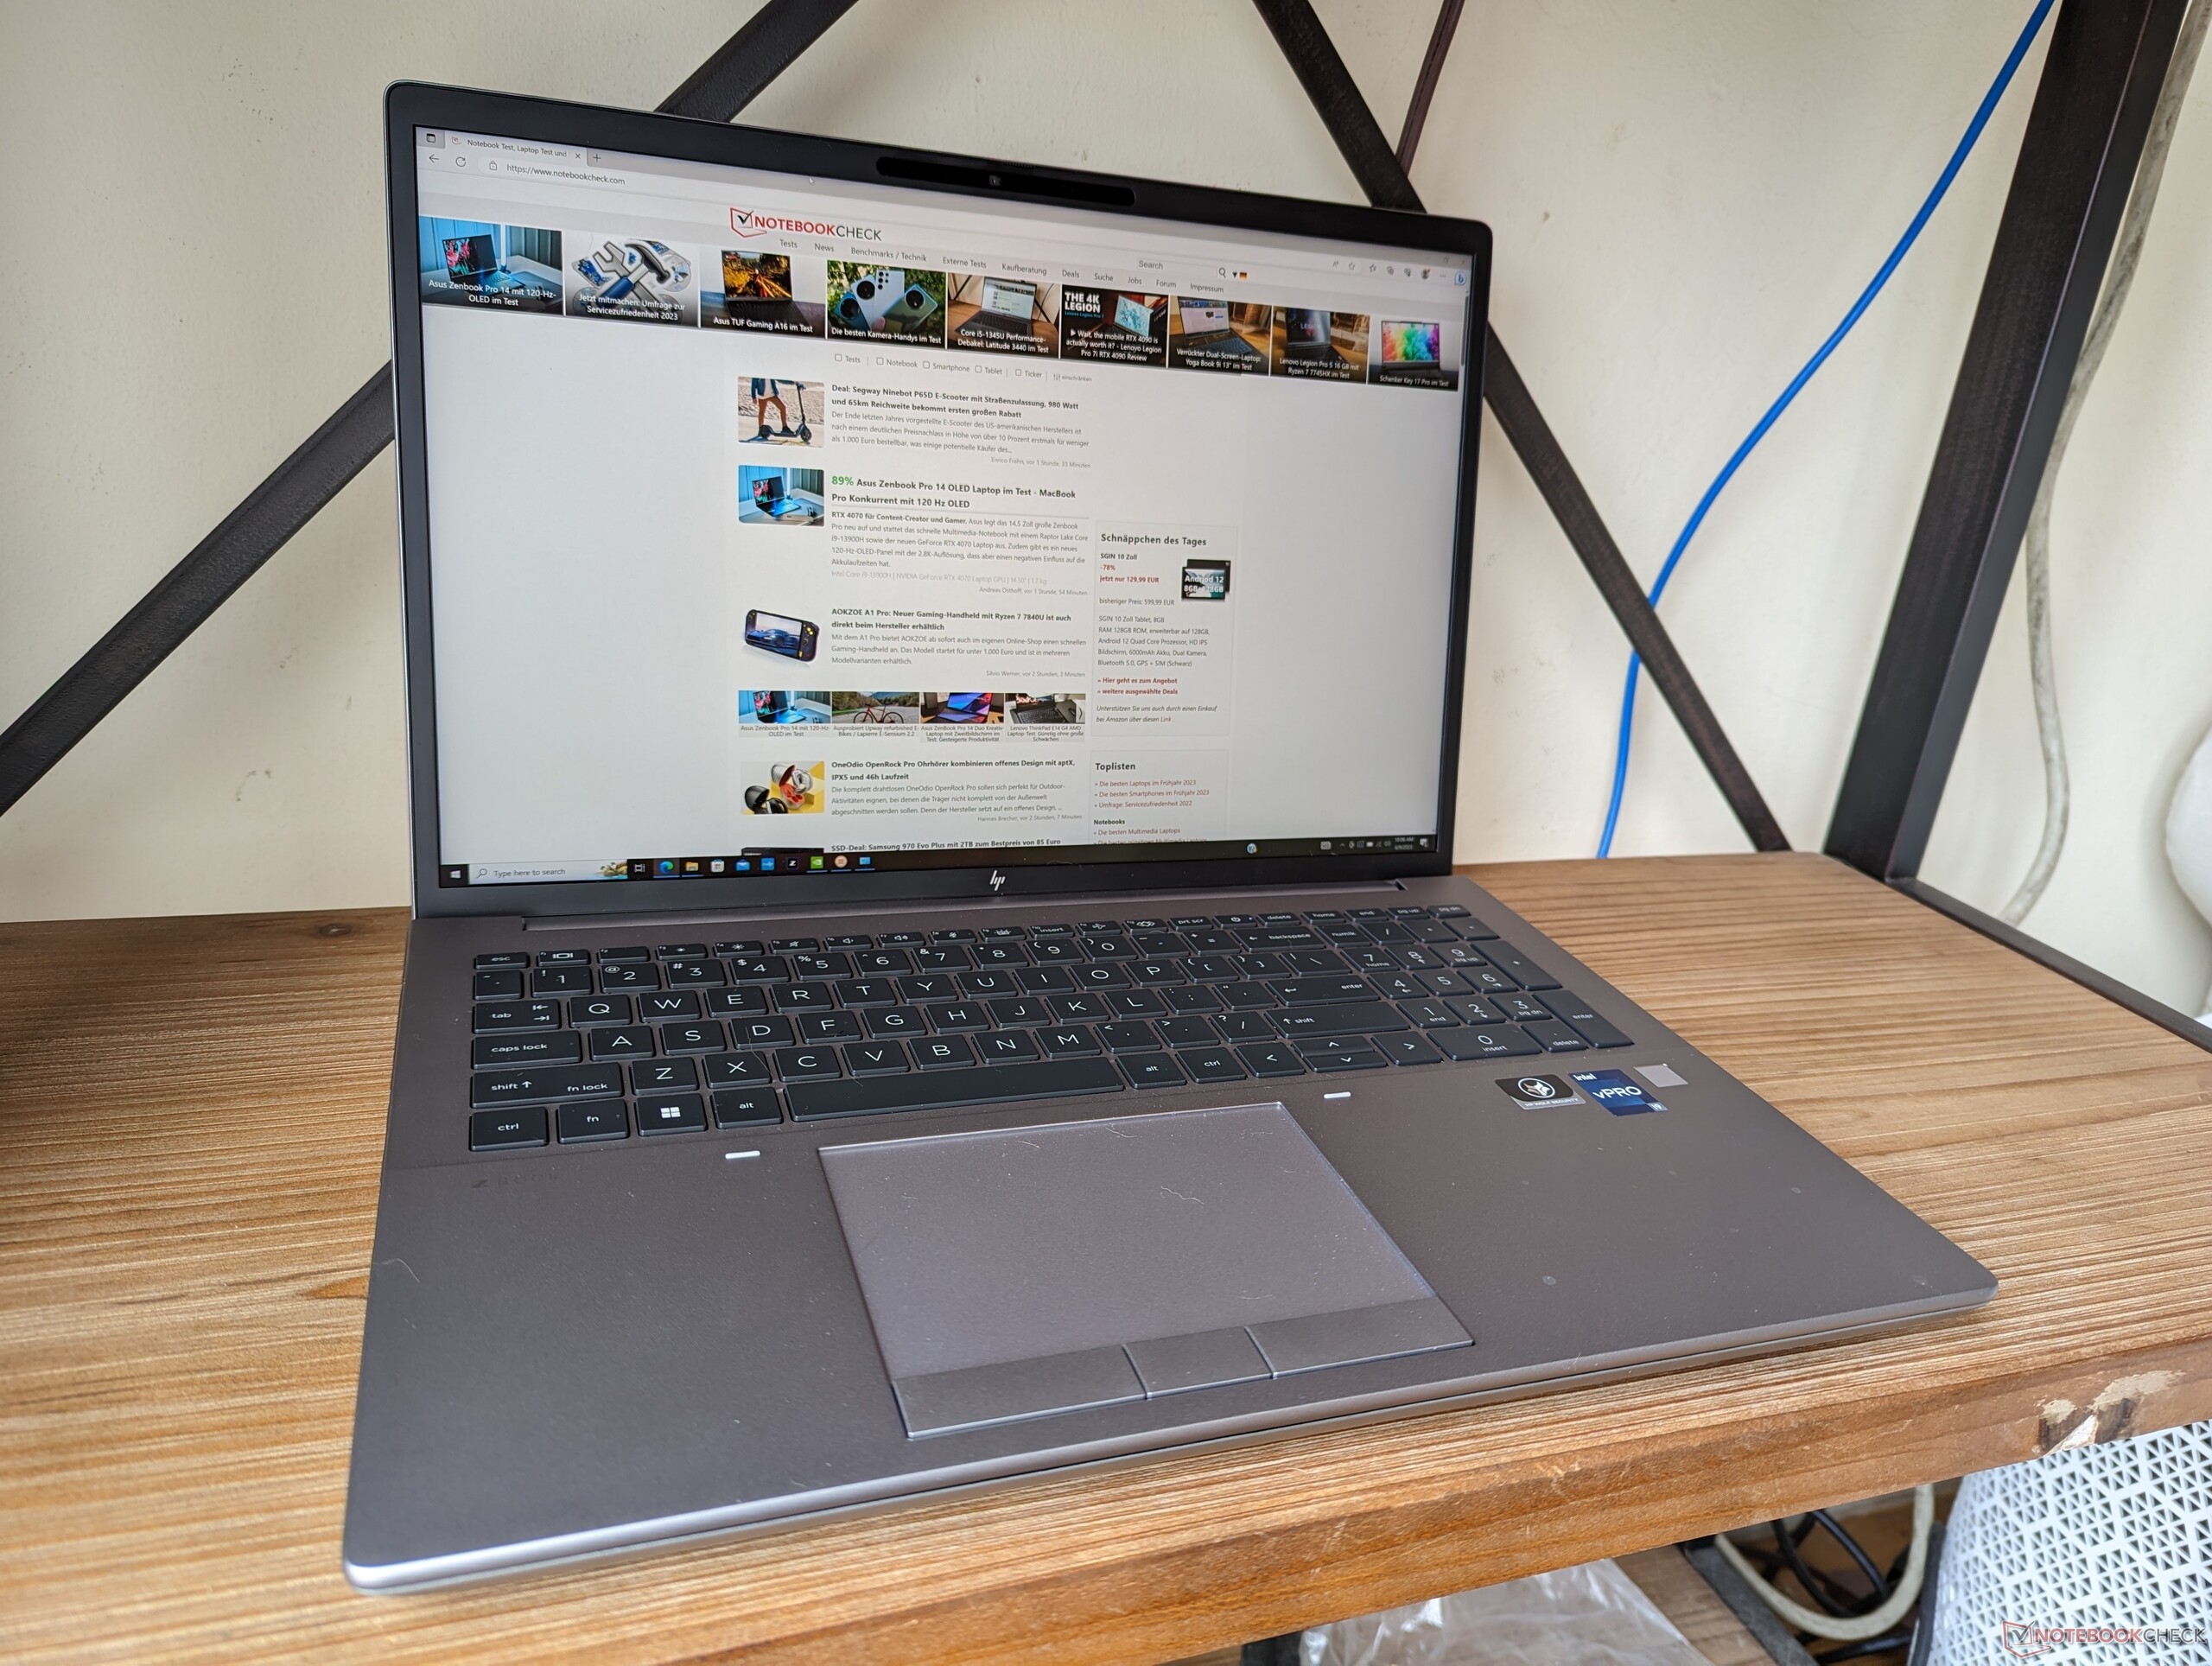
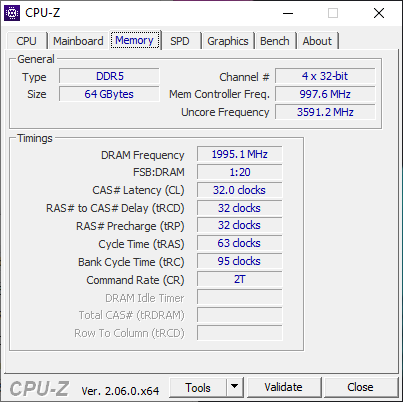
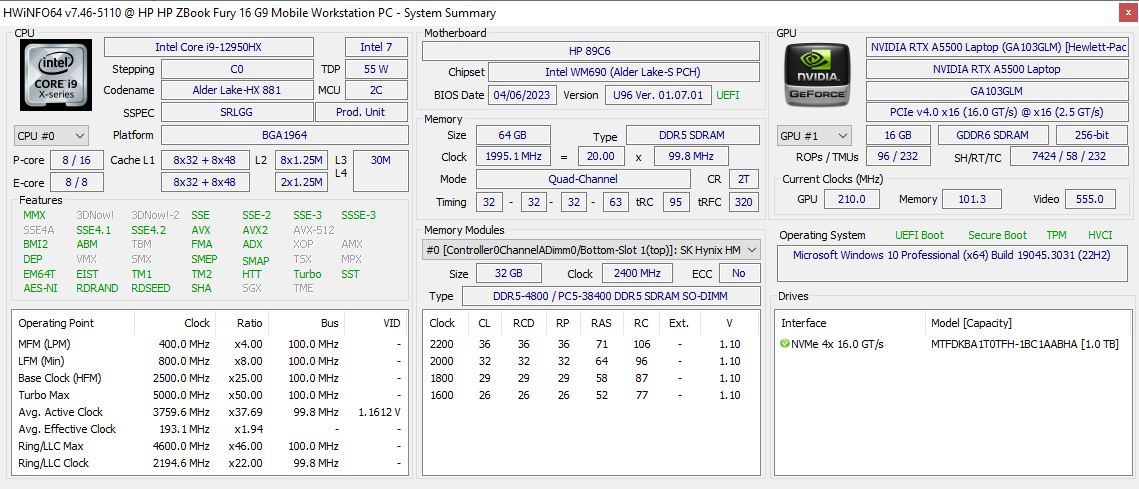
Nossa unidade em análise é uma configuração de ponta do Fury 16 G9 com a CPU Alder Lake-H Core i9-12950HX de 12ª geração, GPU RTX A5500 Ampere, 64 GB de RAM e tela IPS de 3840 x 2400, vendida no varejo por pouco mais de US$ 4.000. As opções de configuração são vastas, com LTE, 5G e até mesmo painéis OLED, conforme listado aqui. Observe que o ZBook Fury G10 com opções mais recentes da Intel de 13ª geração também está disponível, mas o chassi permanece idêntico ao do nosso Fury G9.
As alternativas ao ZBook Fury 16 G9 incluem outras estações de trabalho móveis de 16 polegadas, como a Dell Precision 7670, MSI CreatorPro Z16P, Asus ProArt StudioBook 16ou Lenovo ThinkPad P16 G1.
Mais análises da HP:
Possíveis concorrentes em comparação
Avaliação | Data | Modelo | Peso | Altura | Size | Resolução | Preço |
|---|---|---|---|---|---|---|---|
| 91 % v7 (old) | 06/2023 | HP ZBook Fury 16 G9 i9-12950HX, RTX A5500 Laptop GPU | 2.6 kg | 28.5 mm | 16.00" | 3840x2400 | |
| 90.1 % v7 (old) | 11/2022 | HP ZBook Studio 16 G9 62U04EA i7-12800H, RTX A2000 Laptop GPU | 1.8 kg | 19 mm | 16.00" | 3840x2400 | |
| 82.9 % v7 (old) | 10/2022 | HP ZBook Firefly 16 G9-6B897EA i7-1265U, T550 Laptop GPU | 2 kg | 19.2 mm | 16.00" | 1920x1200 | |
| 91 % v7 (old) | 02/2023 | Lenovo ThinkPad P16 G1 RTX A5500 i9-12950HX, RTX A5500 Laptop GPU | 3 kg | 30.23 mm | 16.00" | 3840x2400 | |
| 89.1 % v7 (old) | 12/2022 | Dell Precision 7000 7670 Performance i9-12950HX, RTX A5500 Laptop GPU | 2.8 kg | 25.95 mm | 16.00" | 3840x2400 | |
| 84.3 % v7 (old) | 11/2022 | MSI CreatorPro Z16P B12UKST i7-12700H, RTX A3000 Laptop GPU | 2.4 kg | 19 mm | 16.00" | 2560x1600 |
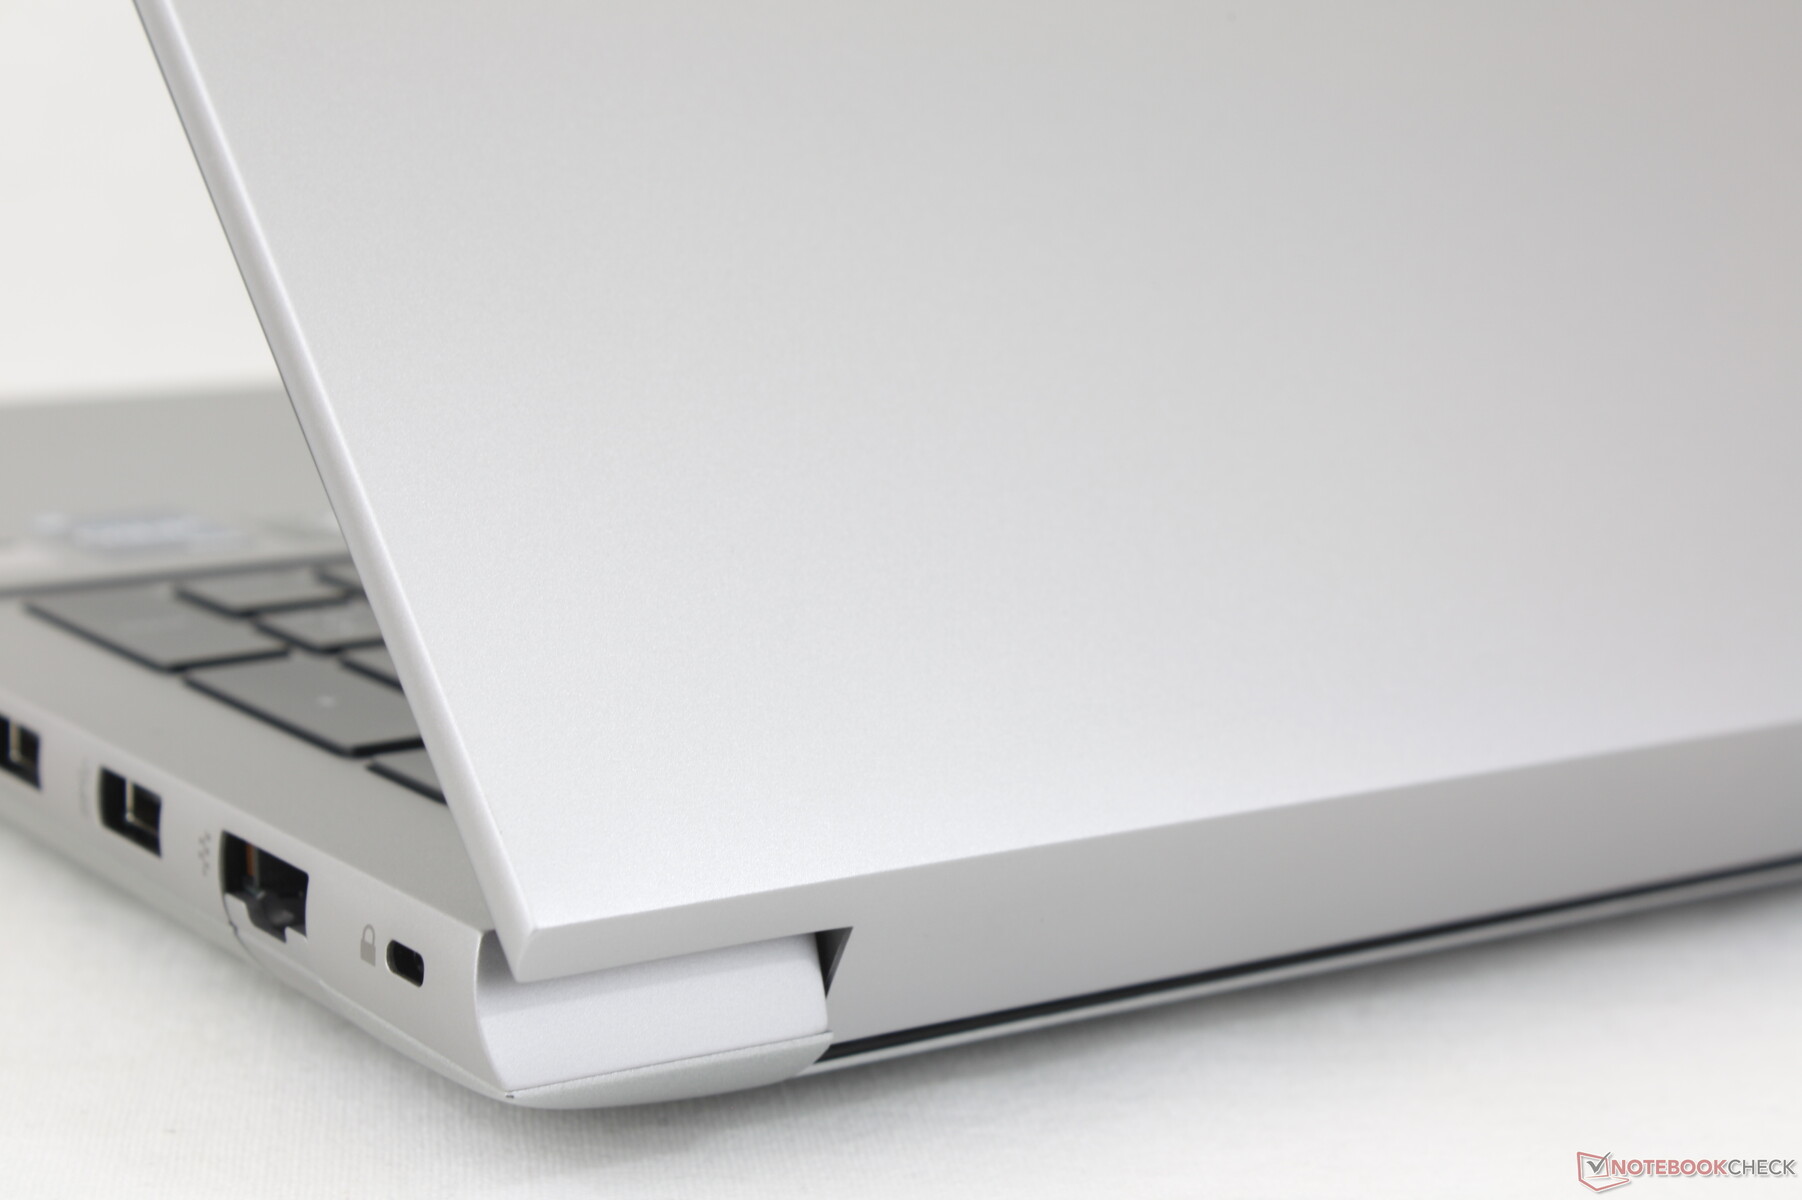
Estojo - Classic ZBook
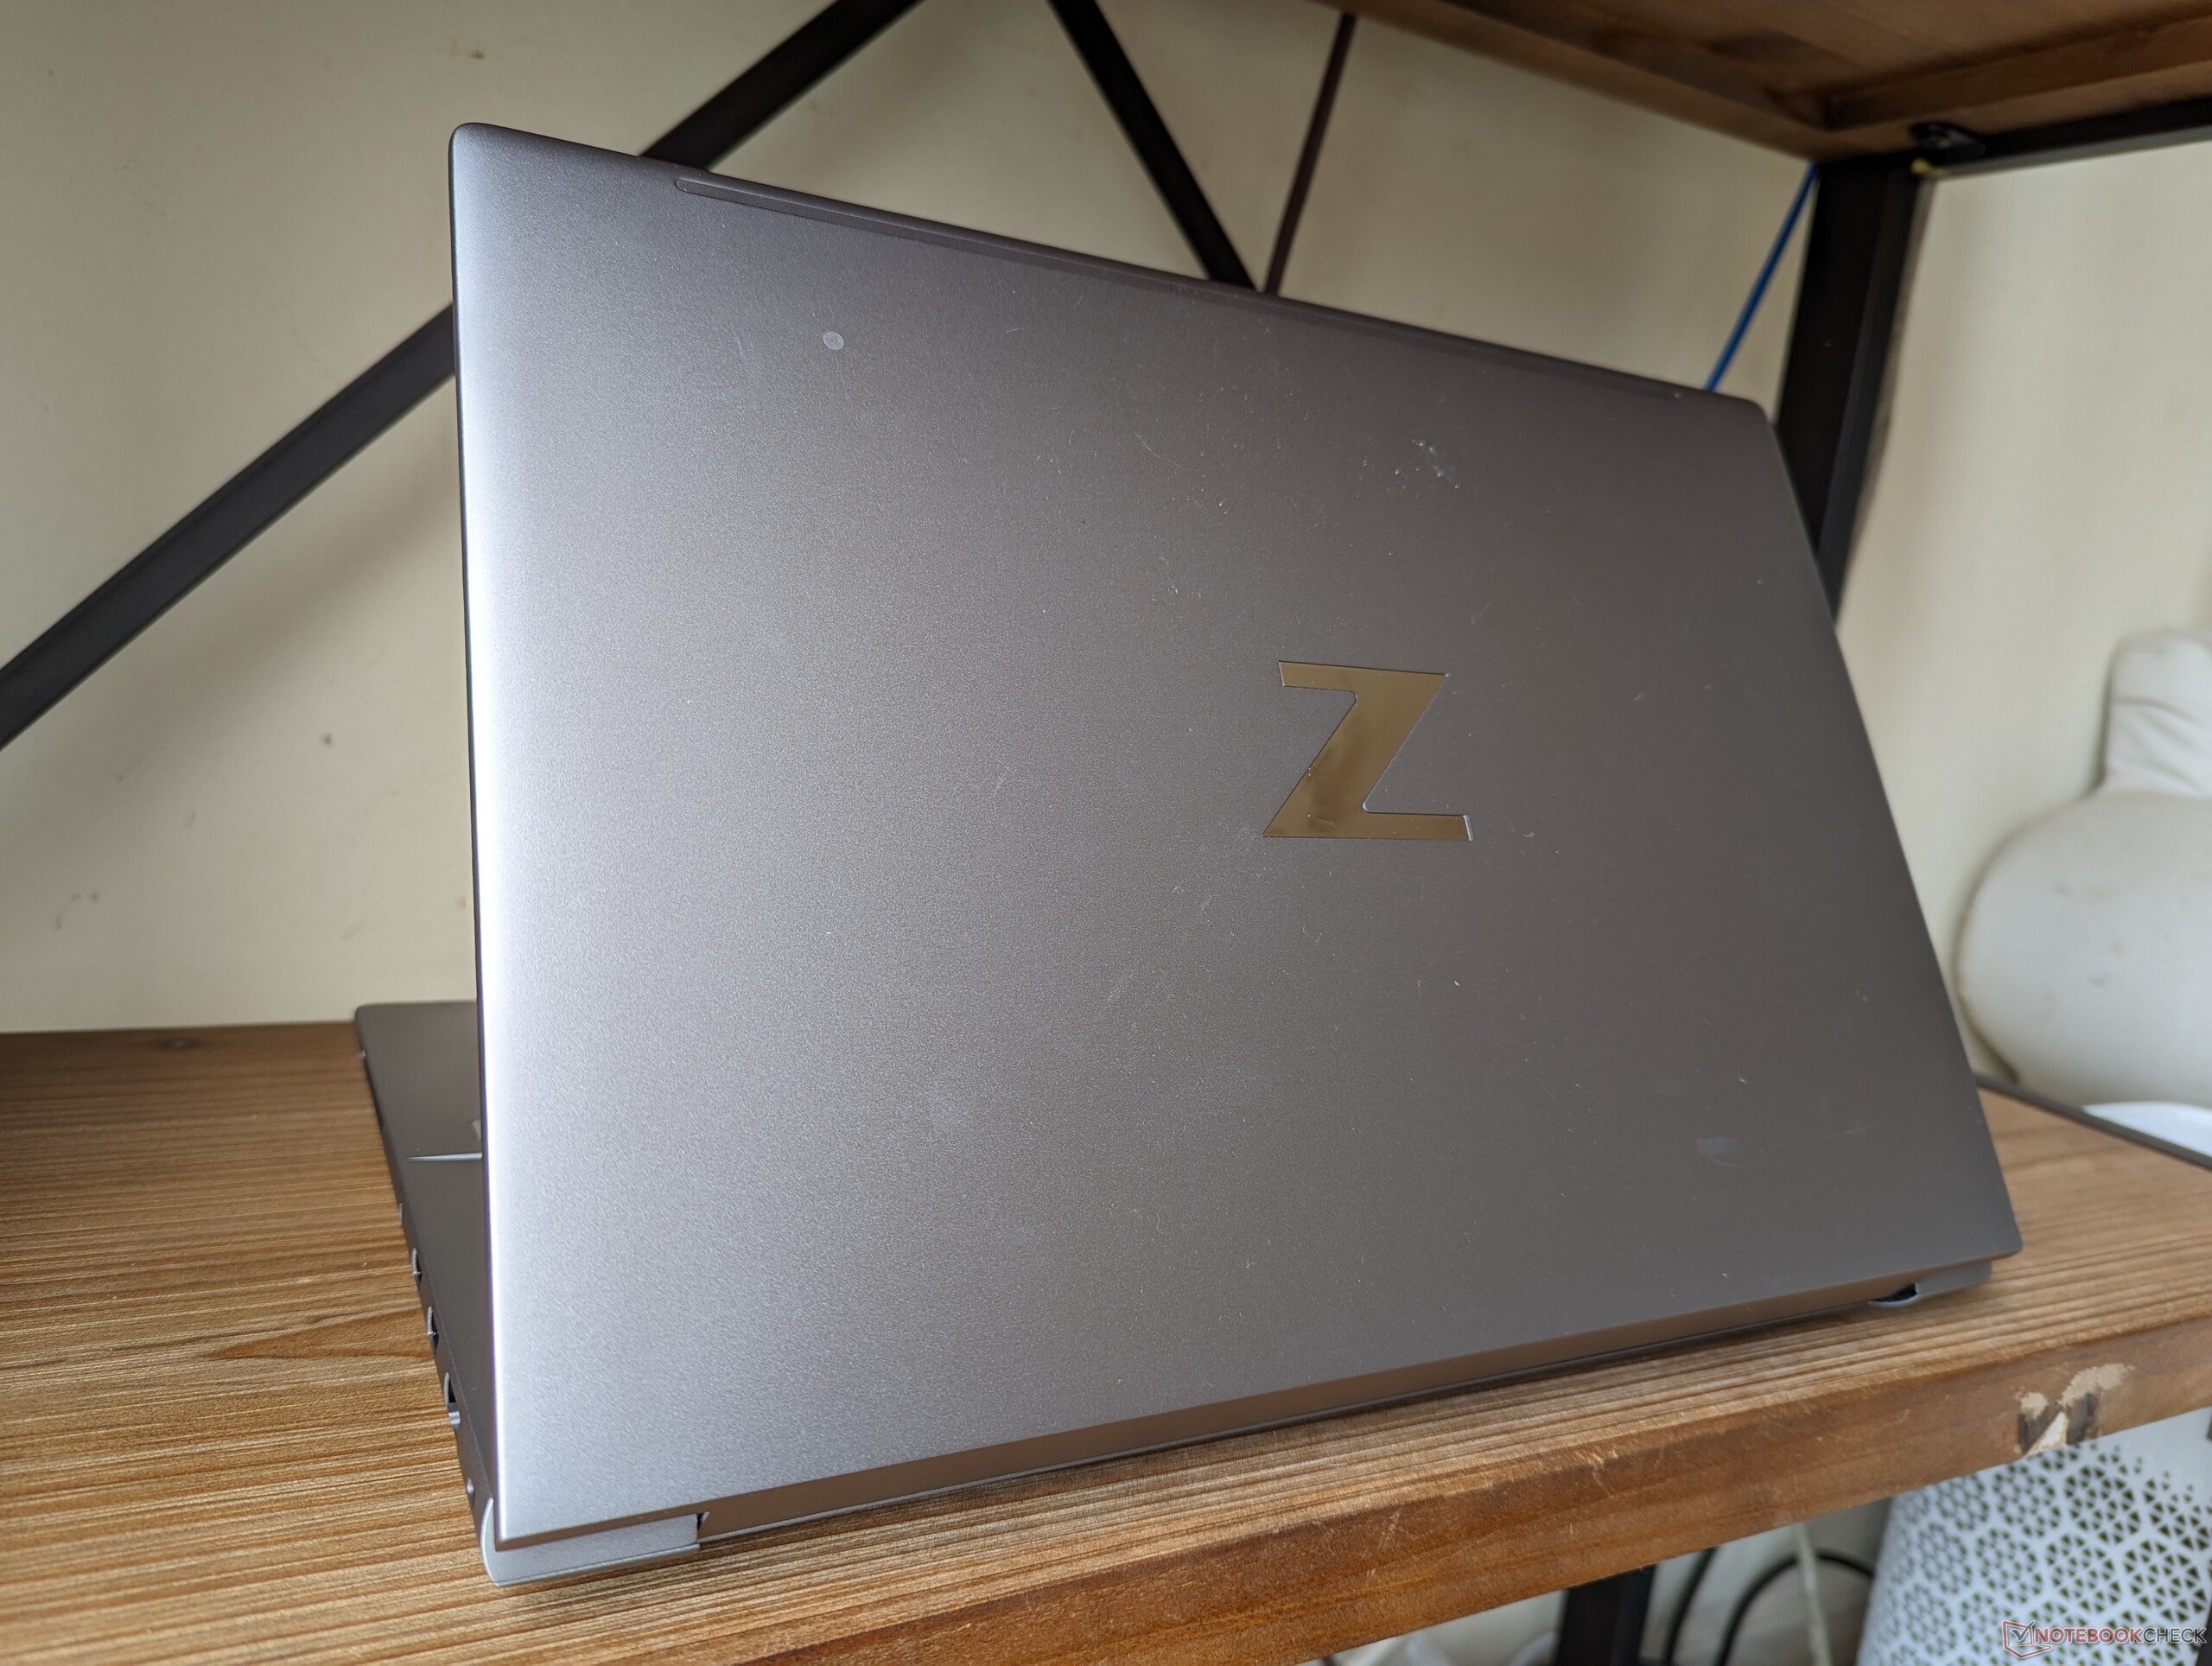
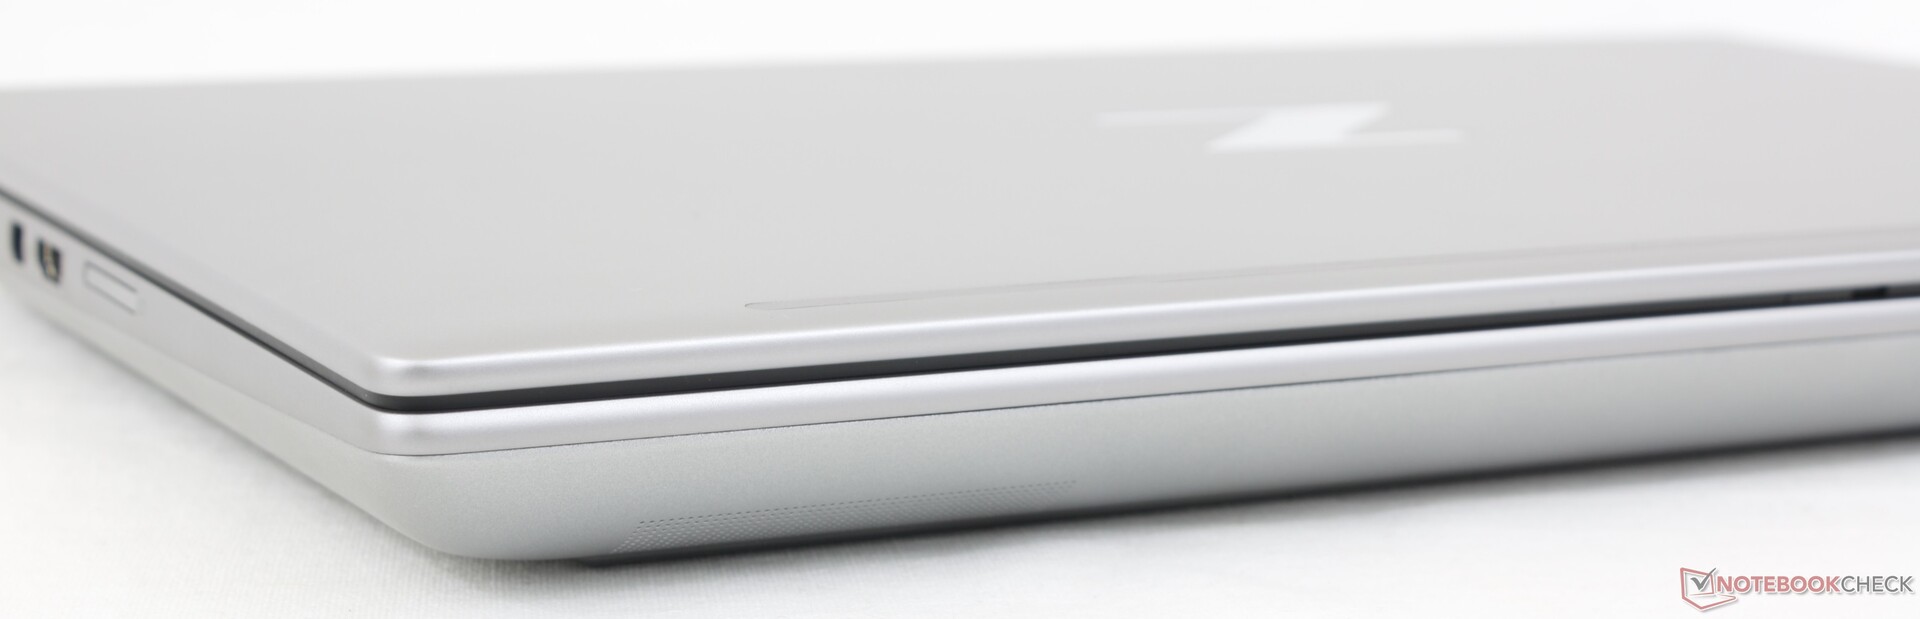
O chassi consiste nos mesmos materiais de liga de alumínio com os quais os proprietários de ZBooks já estão familiarizados. As torções, deformações e rangidos são mínimos e comparáveis aos do Precision 7670 para primeiras impressões sólidas e sem áreas problemáticas. A flexão é mais perceptível quando se aplica pressão no centro da tampa externa, onde o logotipo "Z" está localizado, mas não é motivo de preocupação a longo prazo.
O HP é visivelmente mais leve do que oThinkPad P16 G1 e o Precision 7670, embora todos eles tenham opções semelhantes de CPU e GPU. No entanto, isso tem um custo de desempenho, como mostrarão nossas comparações de benchmark abaixo. Para algo mais portátil, os usuários podem considerar o ZBook Firefly 16 G9 ou o ZBook Studio 16 G9, muito mais finos.
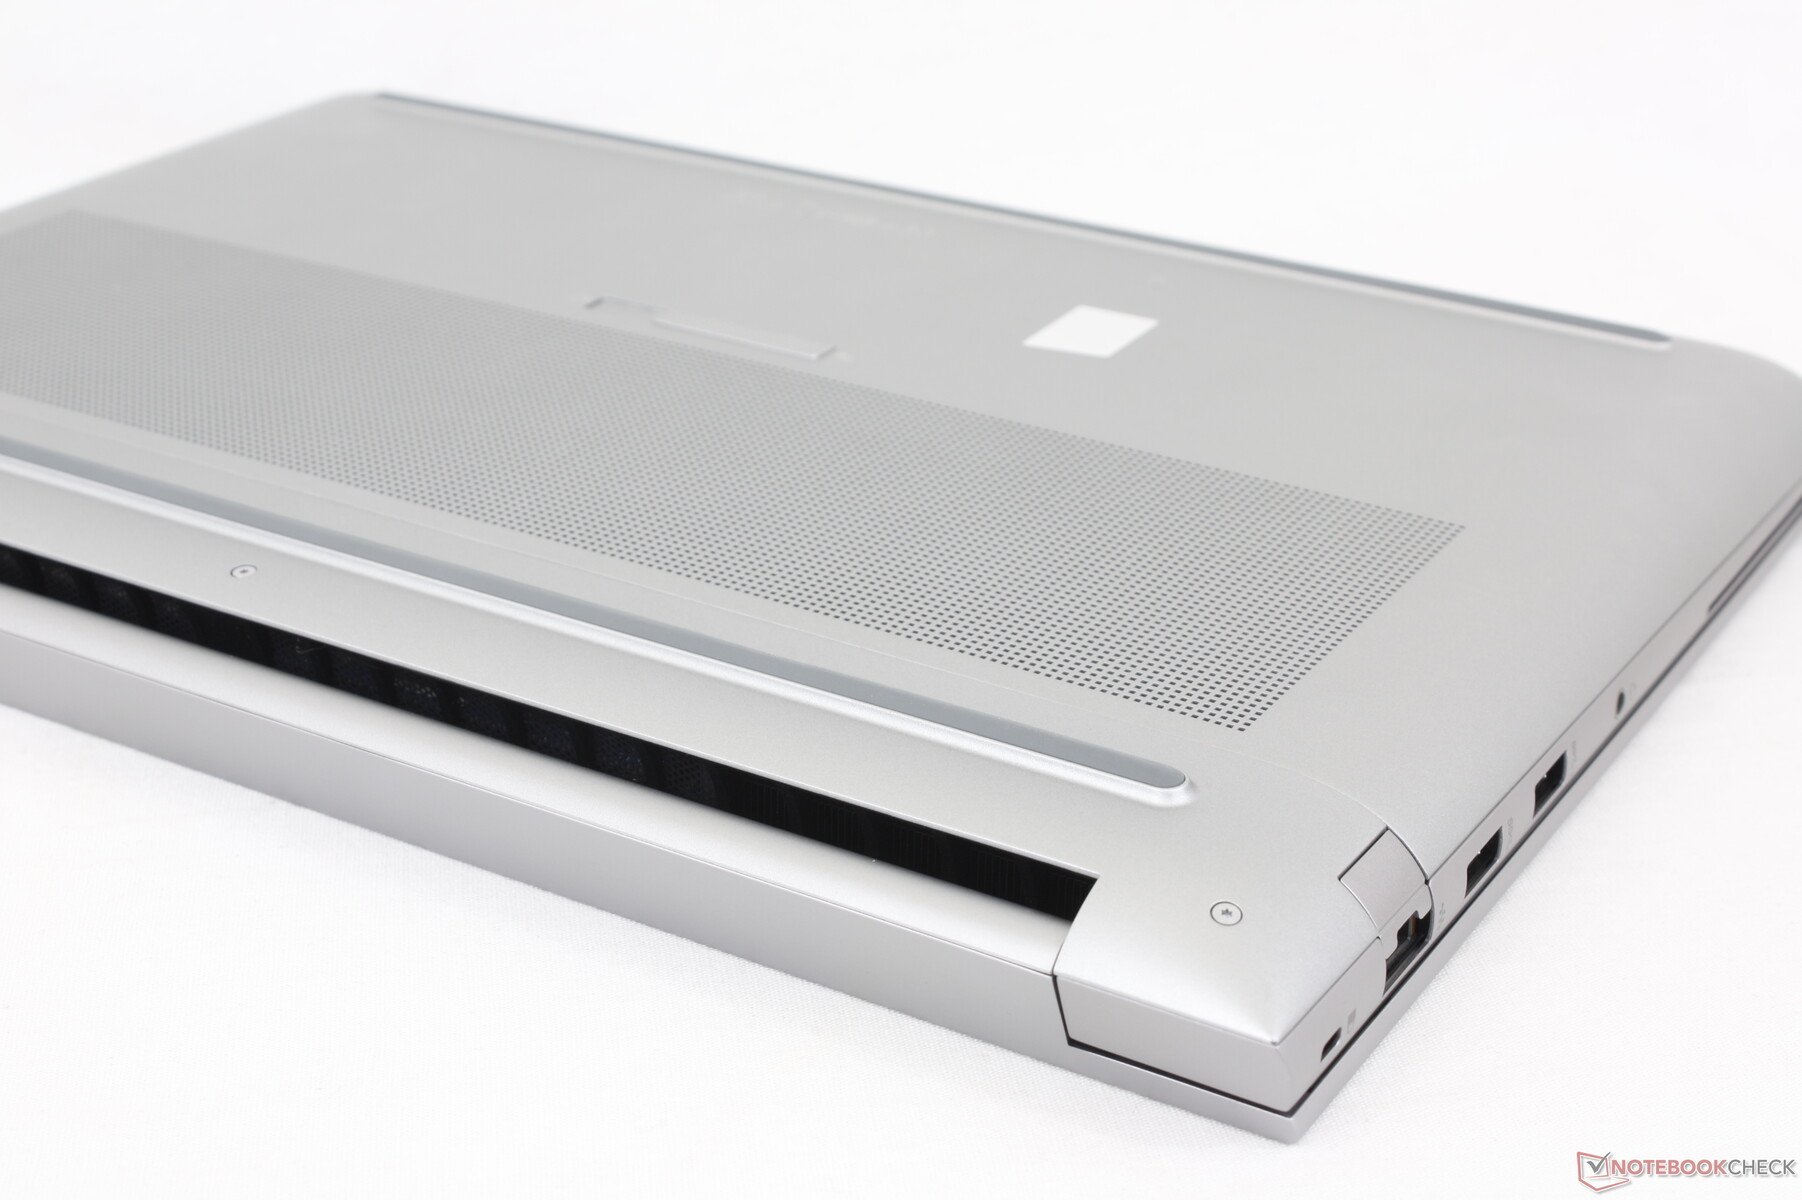
A moldura inferior do Fury G9 é surpreendentemente estreita para uma estação de trabalho, o que contribui para que o modelo seja mais curto em comprimento do que a maioria das outras alternativas de 16 polegadas.
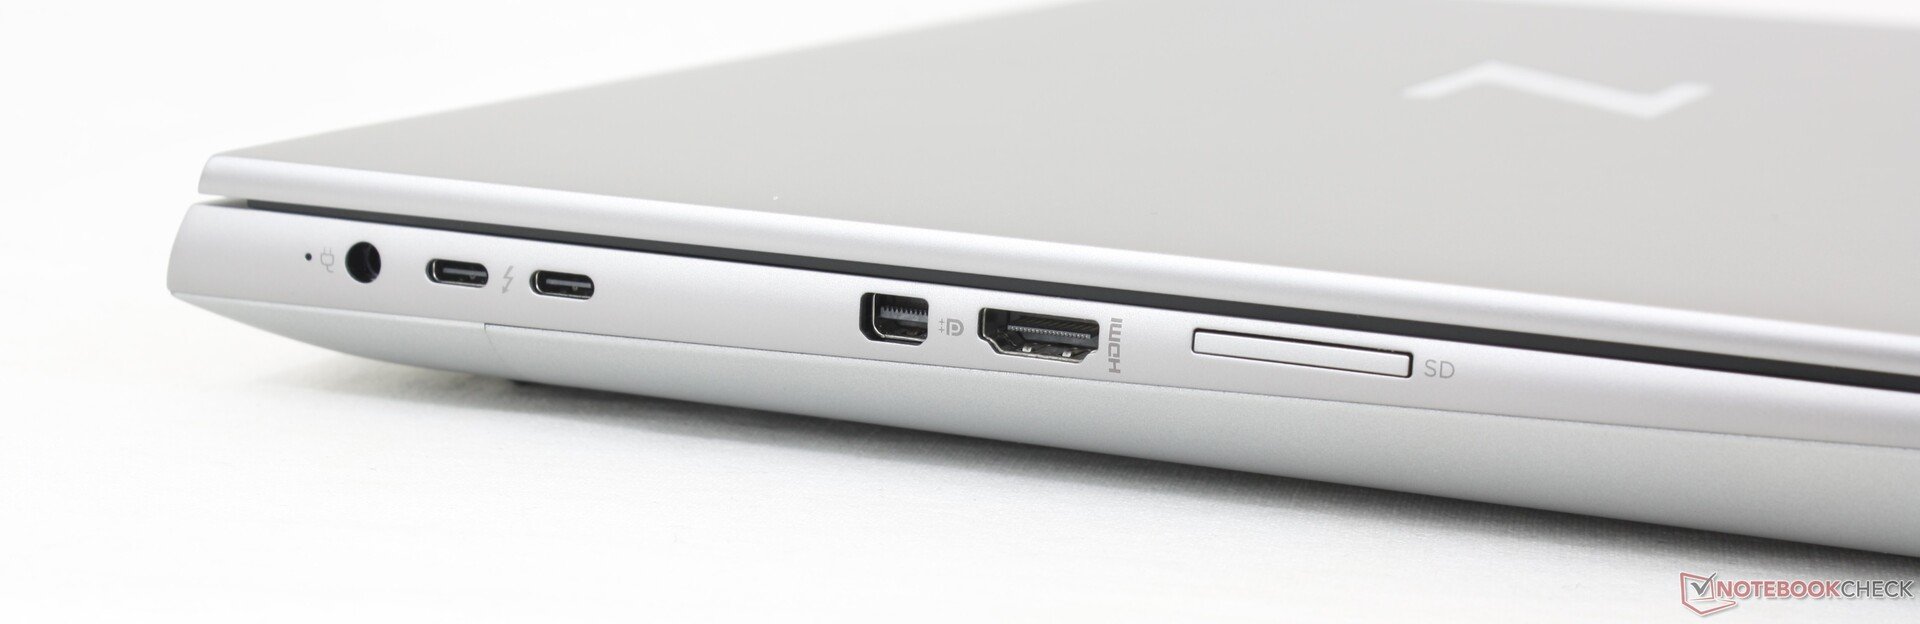
Conectividade
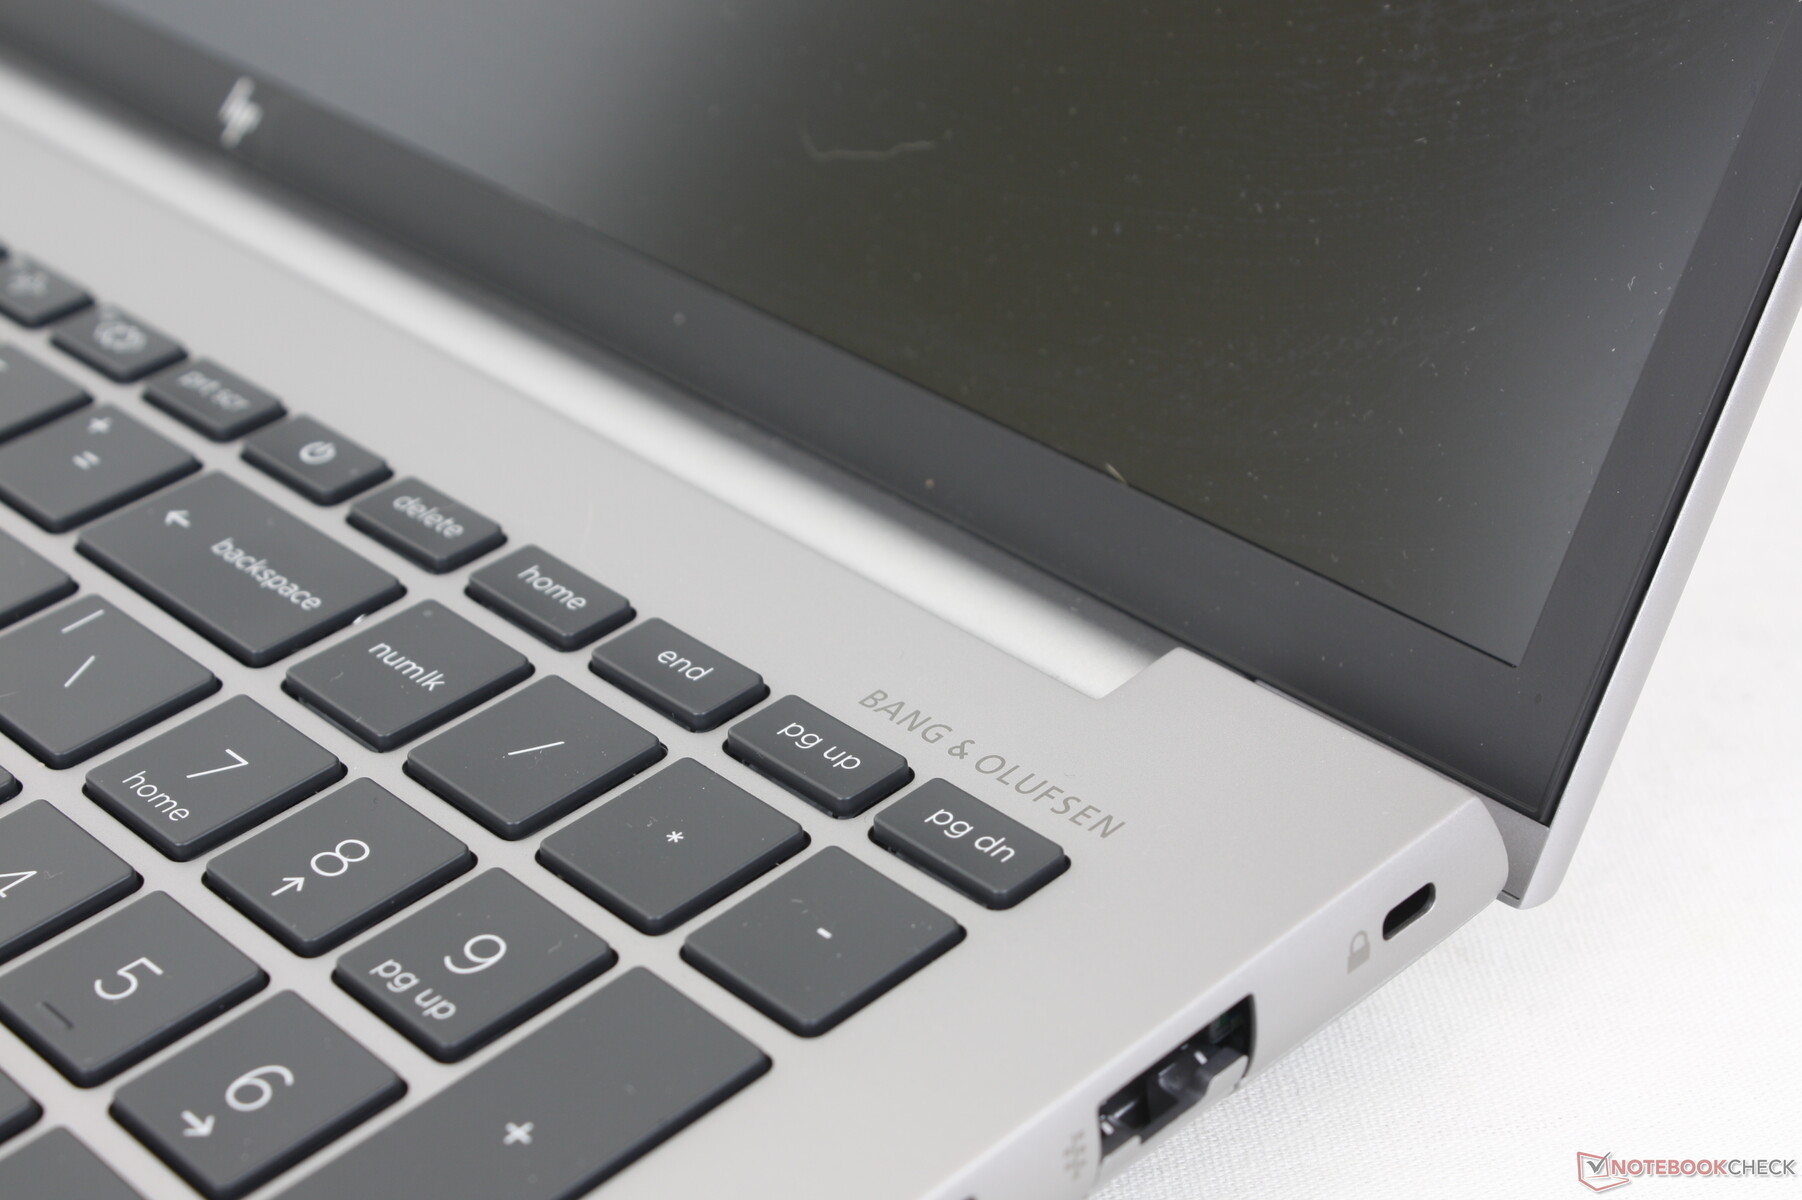
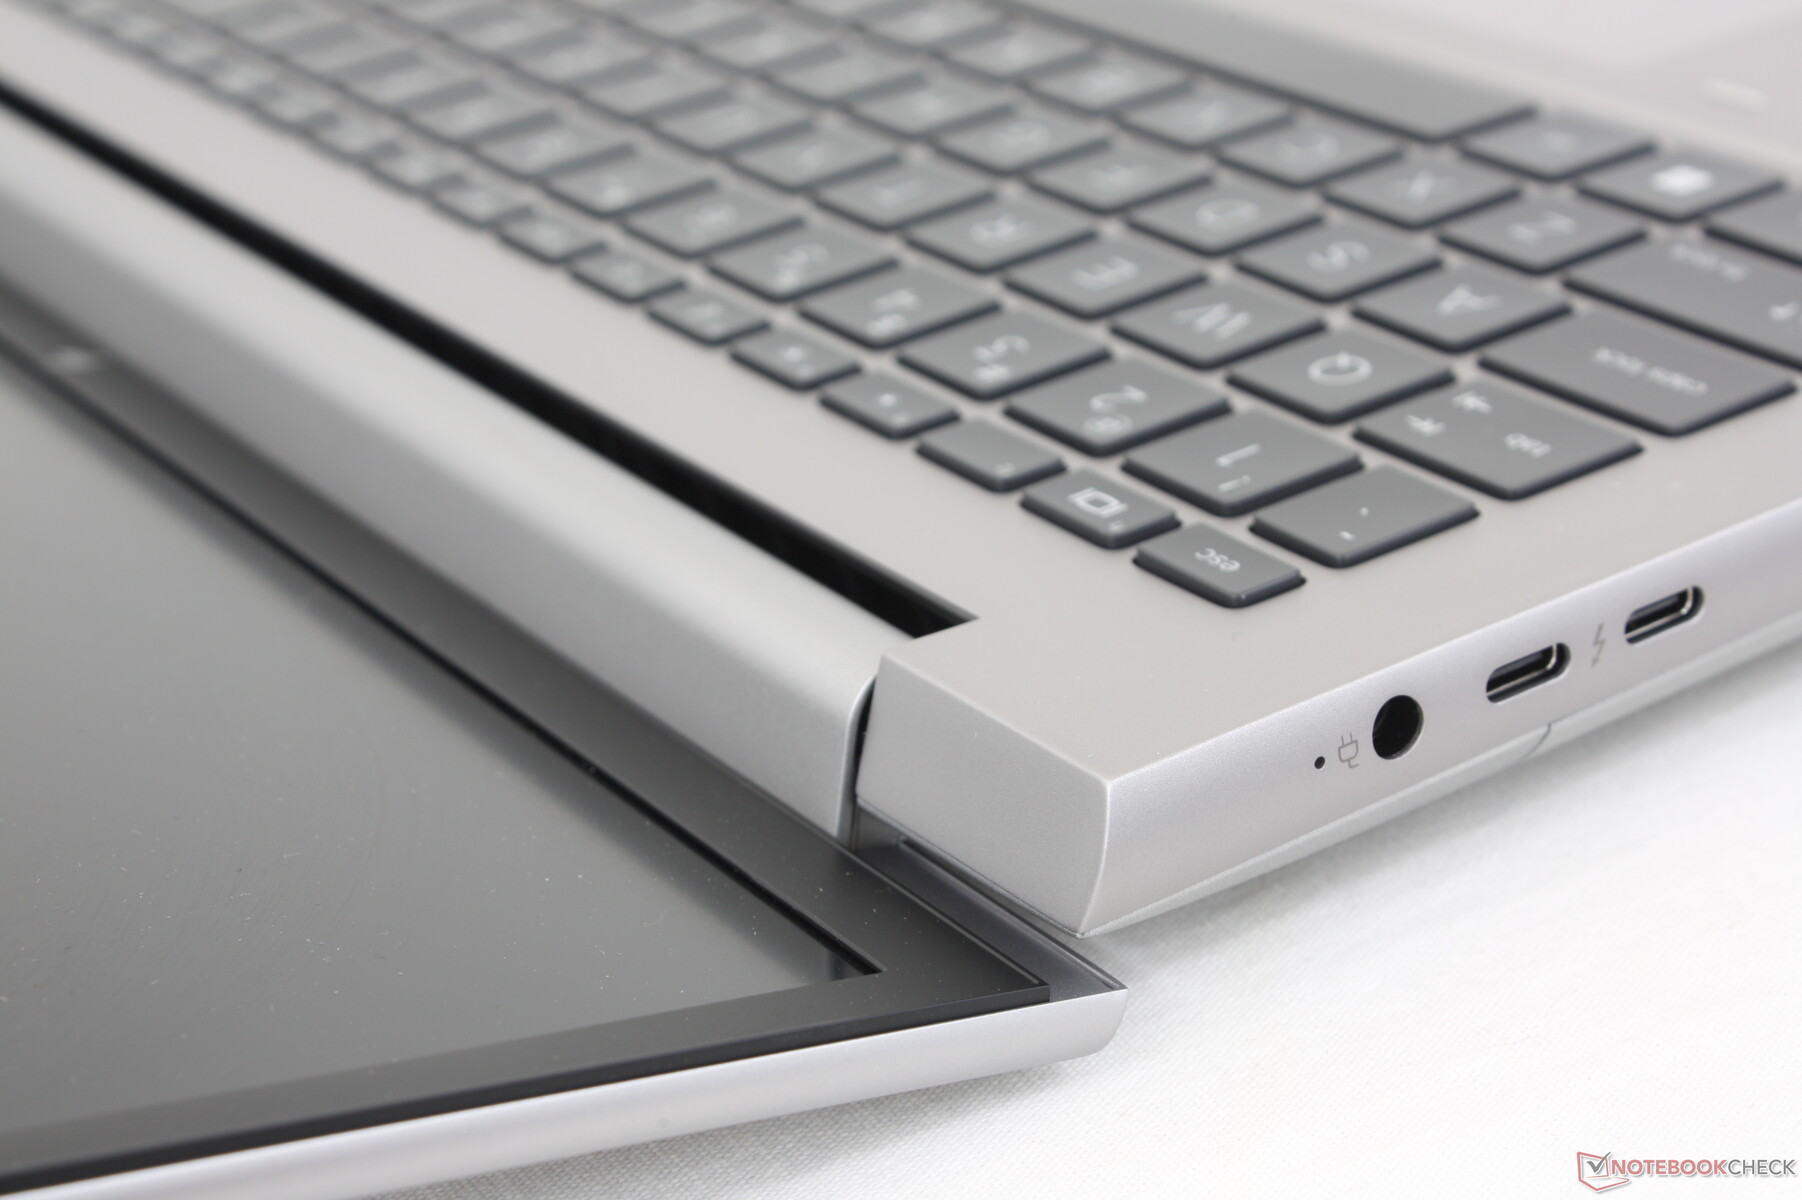
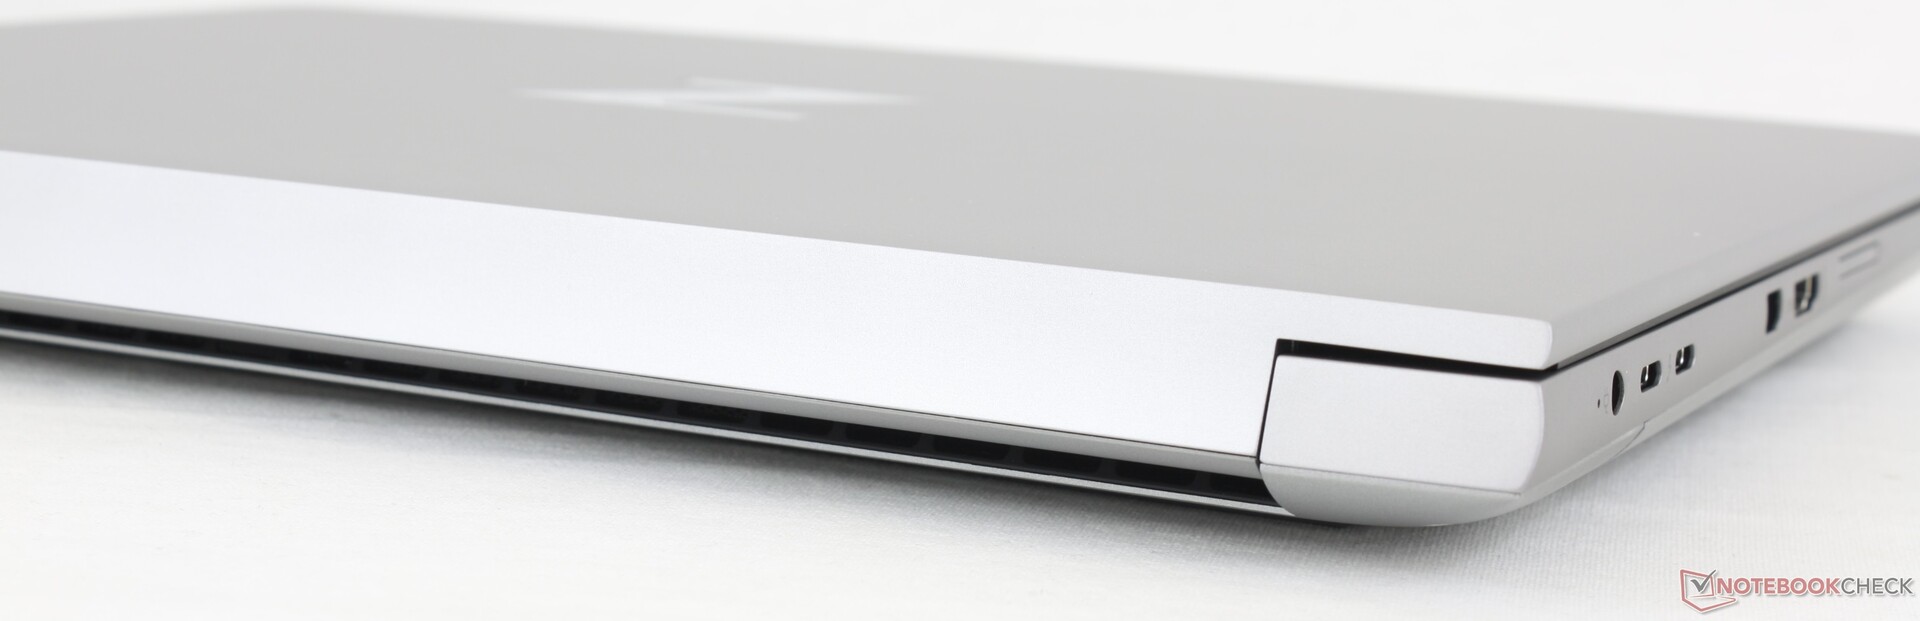
Nosso HP inclui todas as portas encontradas no Precision 7670, mas com uma mini-DisplayPort integrada em vez de uma terceira porta USB-C. De fato, essa é uma das poucas estações de trabalho móveis com uma opção de mini-DisplayPort.
O posicionamento das portas poderia ter sido melhor no que diz respeito às duas portas USB-C, pois elas estão bem juntas ao lado da porta do adaptador CA. Conectar determinados adaptadores ou cabos em uma porta, por exemplo, poderia bloquear o acesso às outras duas portas.
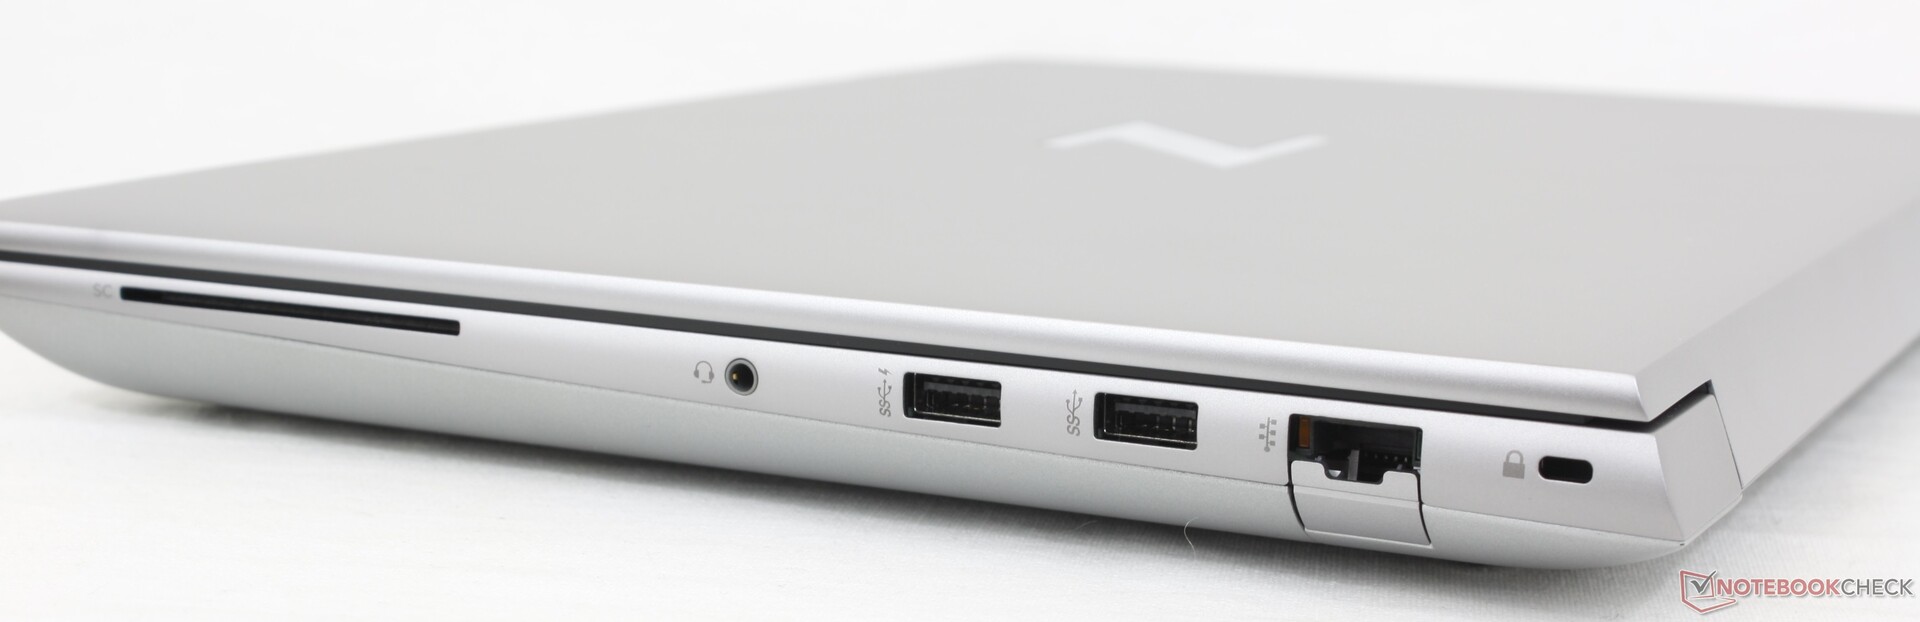
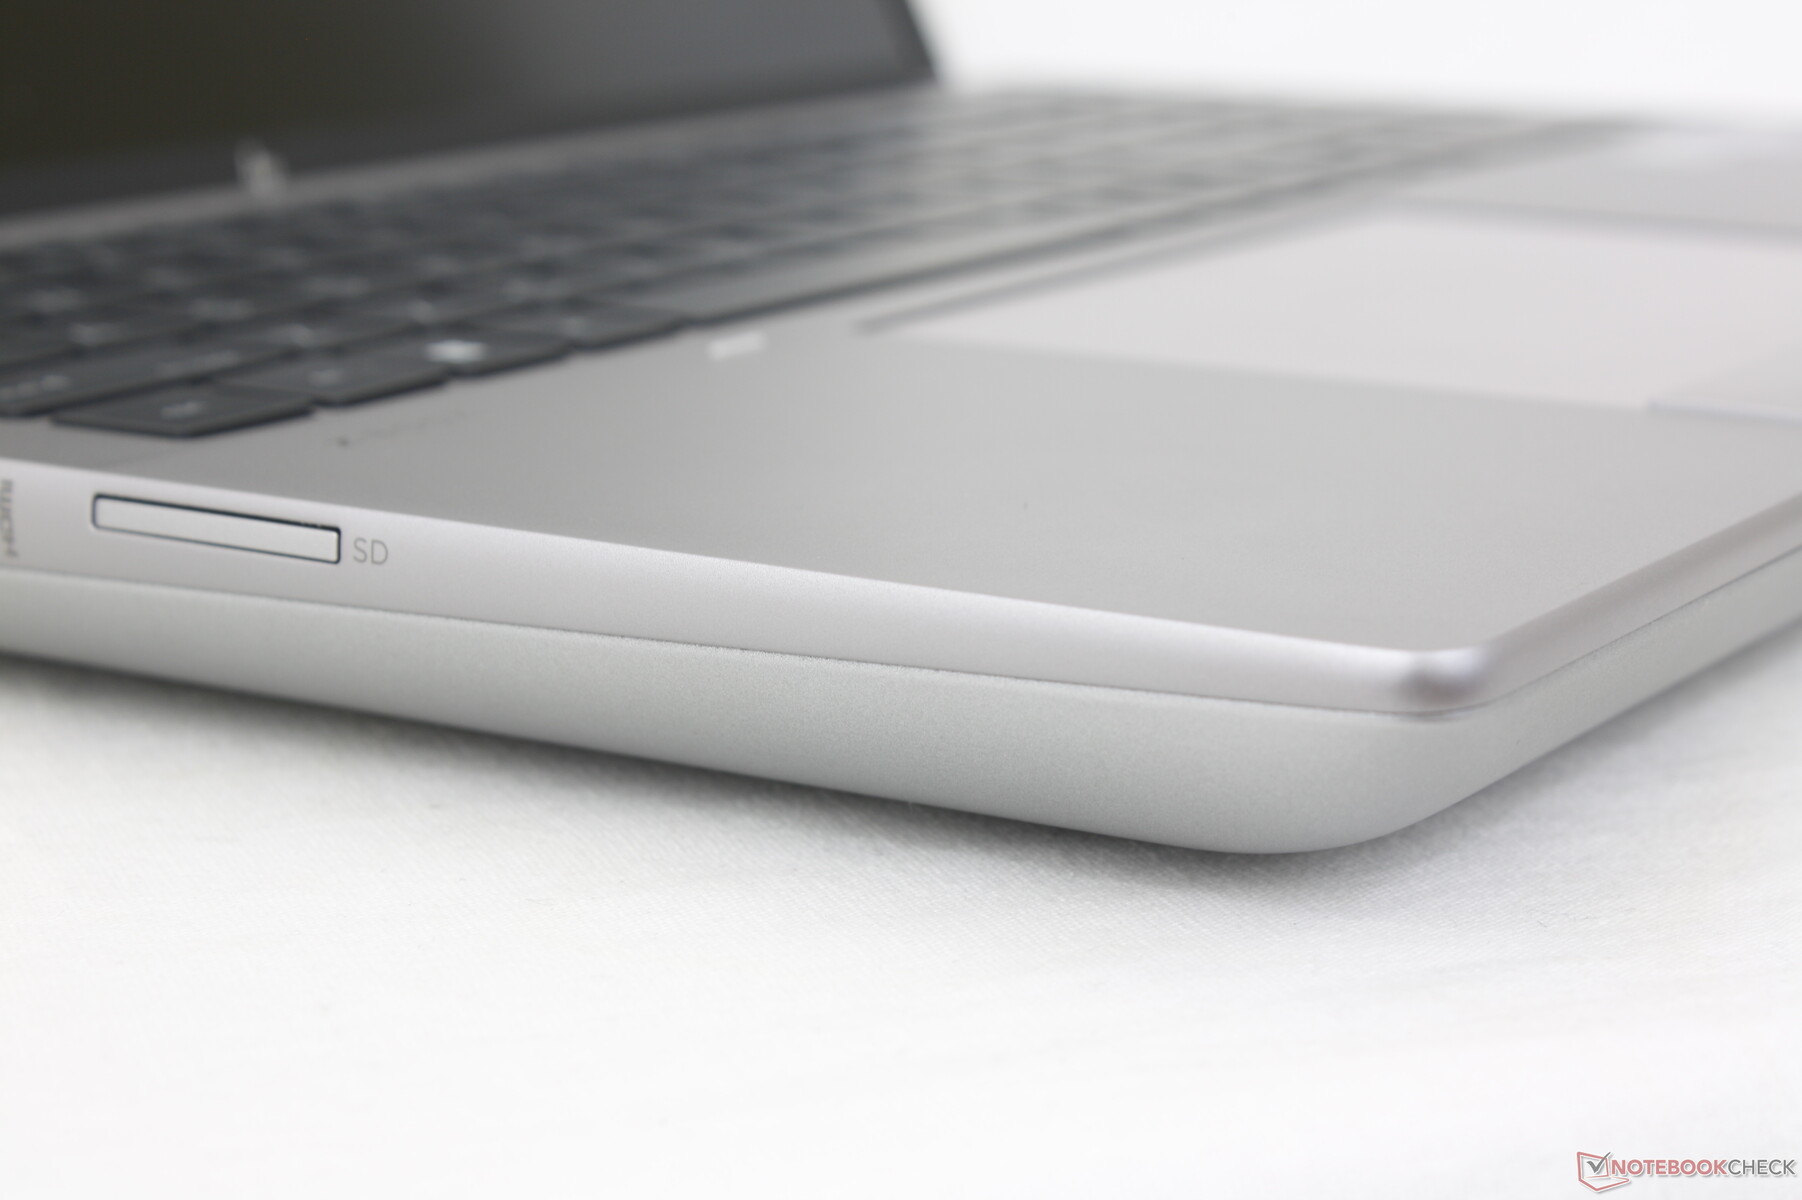
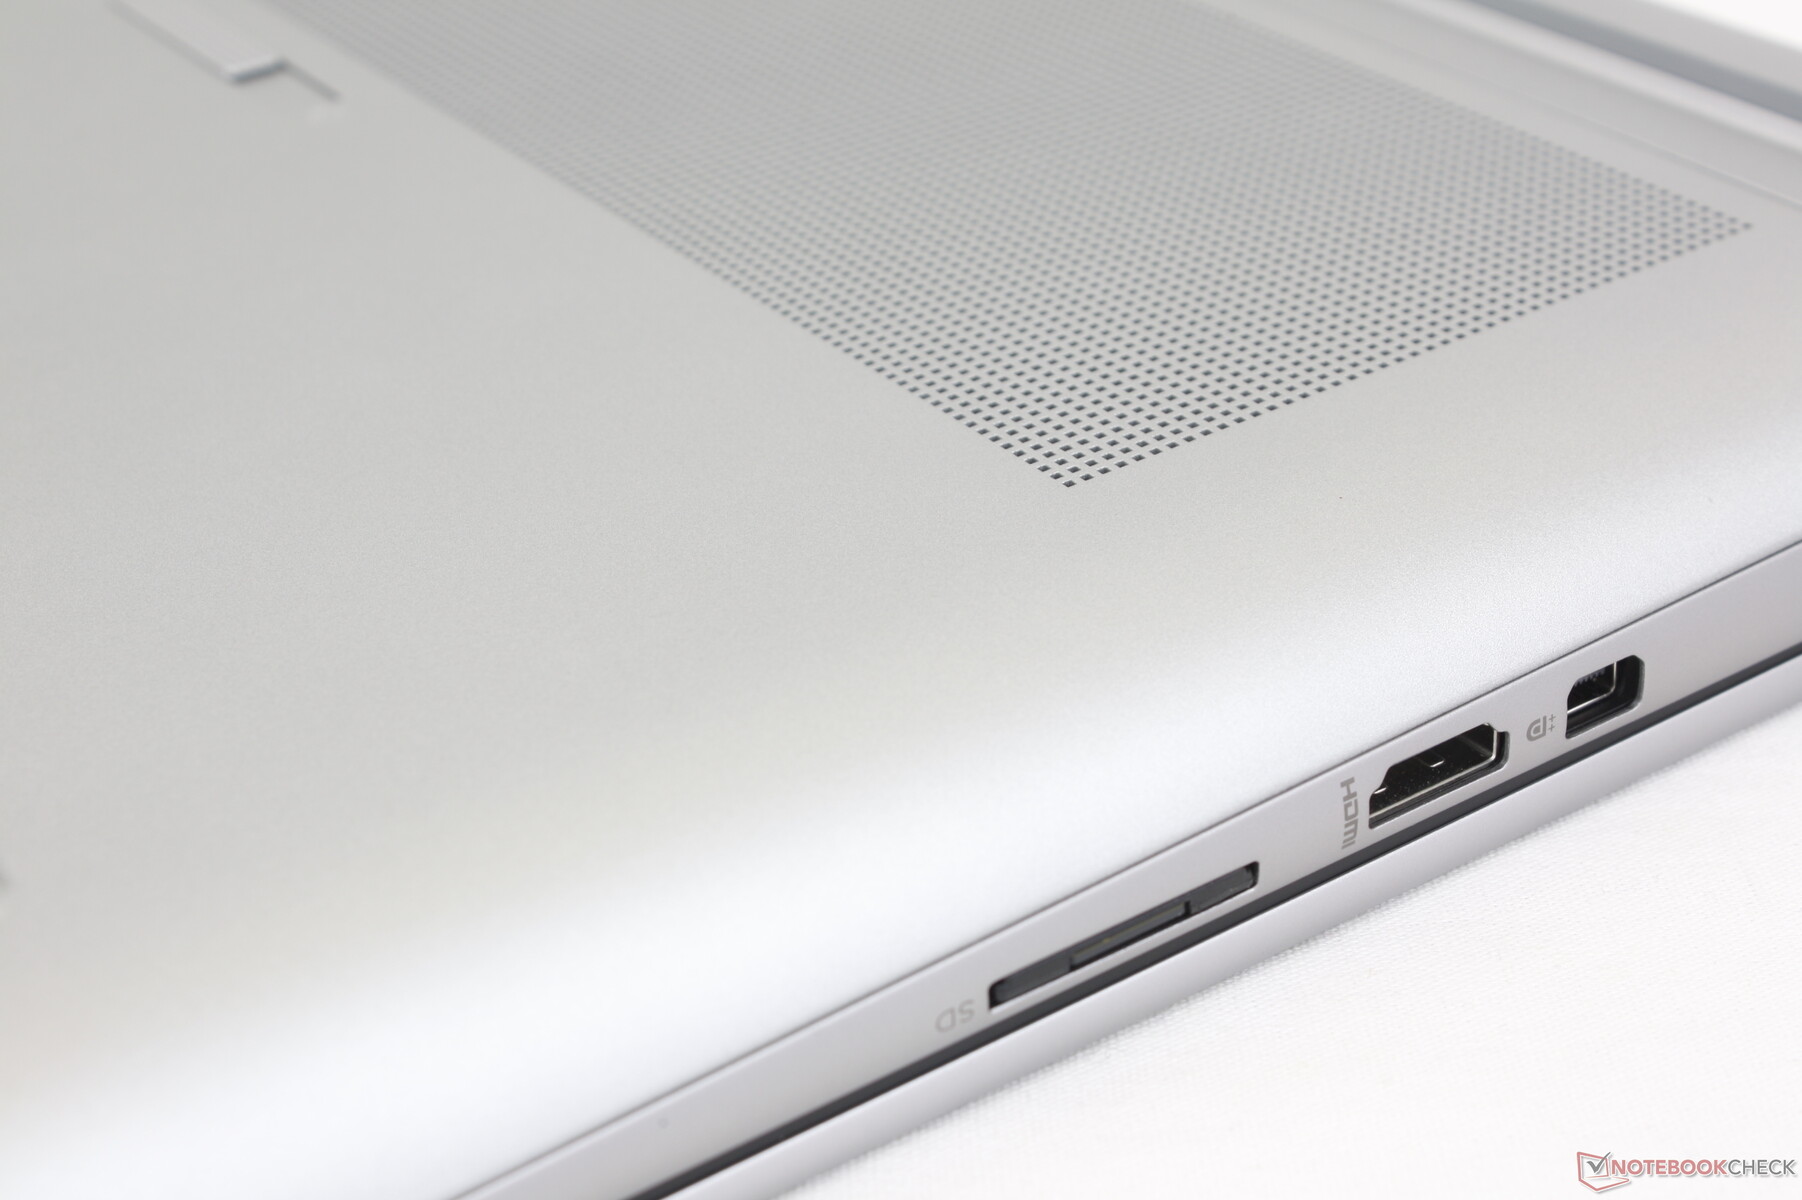
Leitor de cartão SD
As taxas de transferência chegam a cerca de 80 MB/s com o nosso cartão de teste PNY EliteX-PRO60, embora o cartão seja capaz de atingir taxas de transferência de até 280 MB/s. Em comparação, o leitor SD integrado no Precision 7670 é duas vezes mais rápido. Os usuários que dependem de cartões SD para transferências de vídeo e arquivos podem ficar desapontados com o Fury 16 G9 nesse aspecto.
| SD Card Reader | |
| average JPG Copy Test (av. of 3 runs) | |
| Dell Precision 7000 7670 Performance (Toshiba Exceria Pro SDXC 64 GB UHS-II) | |
| MSI CreatorPro Z16P B12UKST (AV Pro V60) | |
| HP ZBook Fury 16 G9 (PNY EliteX-PRO60) | |
| Lenovo ThinkPad P16 G1 RTX A5500 (Toshiba Exceria Pro SDXC 64 GB UHS-II) | |
| HP ZBook Studio 16 G9 62U04EA (Angelbird AV PRO V60) | |
| maximum AS SSD Seq Read Test (1GB) | |
| Dell Precision 7000 7670 Performance (Toshiba Exceria Pro SDXC 64 GB UHS-II) | |
| HP ZBook Fury 16 G9 (PNY EliteX-PRO60) | |
| MSI CreatorPro Z16P B12UKST (AV Pro V60) | |
| Lenovo ThinkPad P16 G1 RTX A5500 (Toshiba Exceria Pro SDXC 64 GB UHS-II) | |
| HP ZBook Studio 16 G9 62U04EA (Angelbird AV PRO V60) | |
Comunicação
Nossa unidade com Windows 10 vem com o Intel AX211 para conectividade Wi-Fi 6E e Bluetooth 5.2. Infelizmente, o Wi-Fi 6E está desativado no Windows 10, pois a Microsoft o tornou (idiotamente) exclusivo do Windows 11. Portanto, você deverá configurar com o Windows 11 se quiser aproveitar os benefícios do Wi-Fi de 6 GHz. Por outro lado, não tivemos problemas de desempenho quando emparelhado com nossa rede Wi-Fi 6 regular.
Webcam
O ZBook Fury 16 G9 herdou a webcam de 5 MP do mais recente Spectre e EliteBook. A qualidade da imagem é mais nítida do que na maioria dos outros laptops, onde os sensores de 1 MP e 2 MP ainda são comuns, inclusive nos concorrentes ThinkPad P16 e Precision 7670.
Um obturador deslizante e um sensor de infravermelho estão incluídos para privacidade e suporte ao Hello, respectivamente.


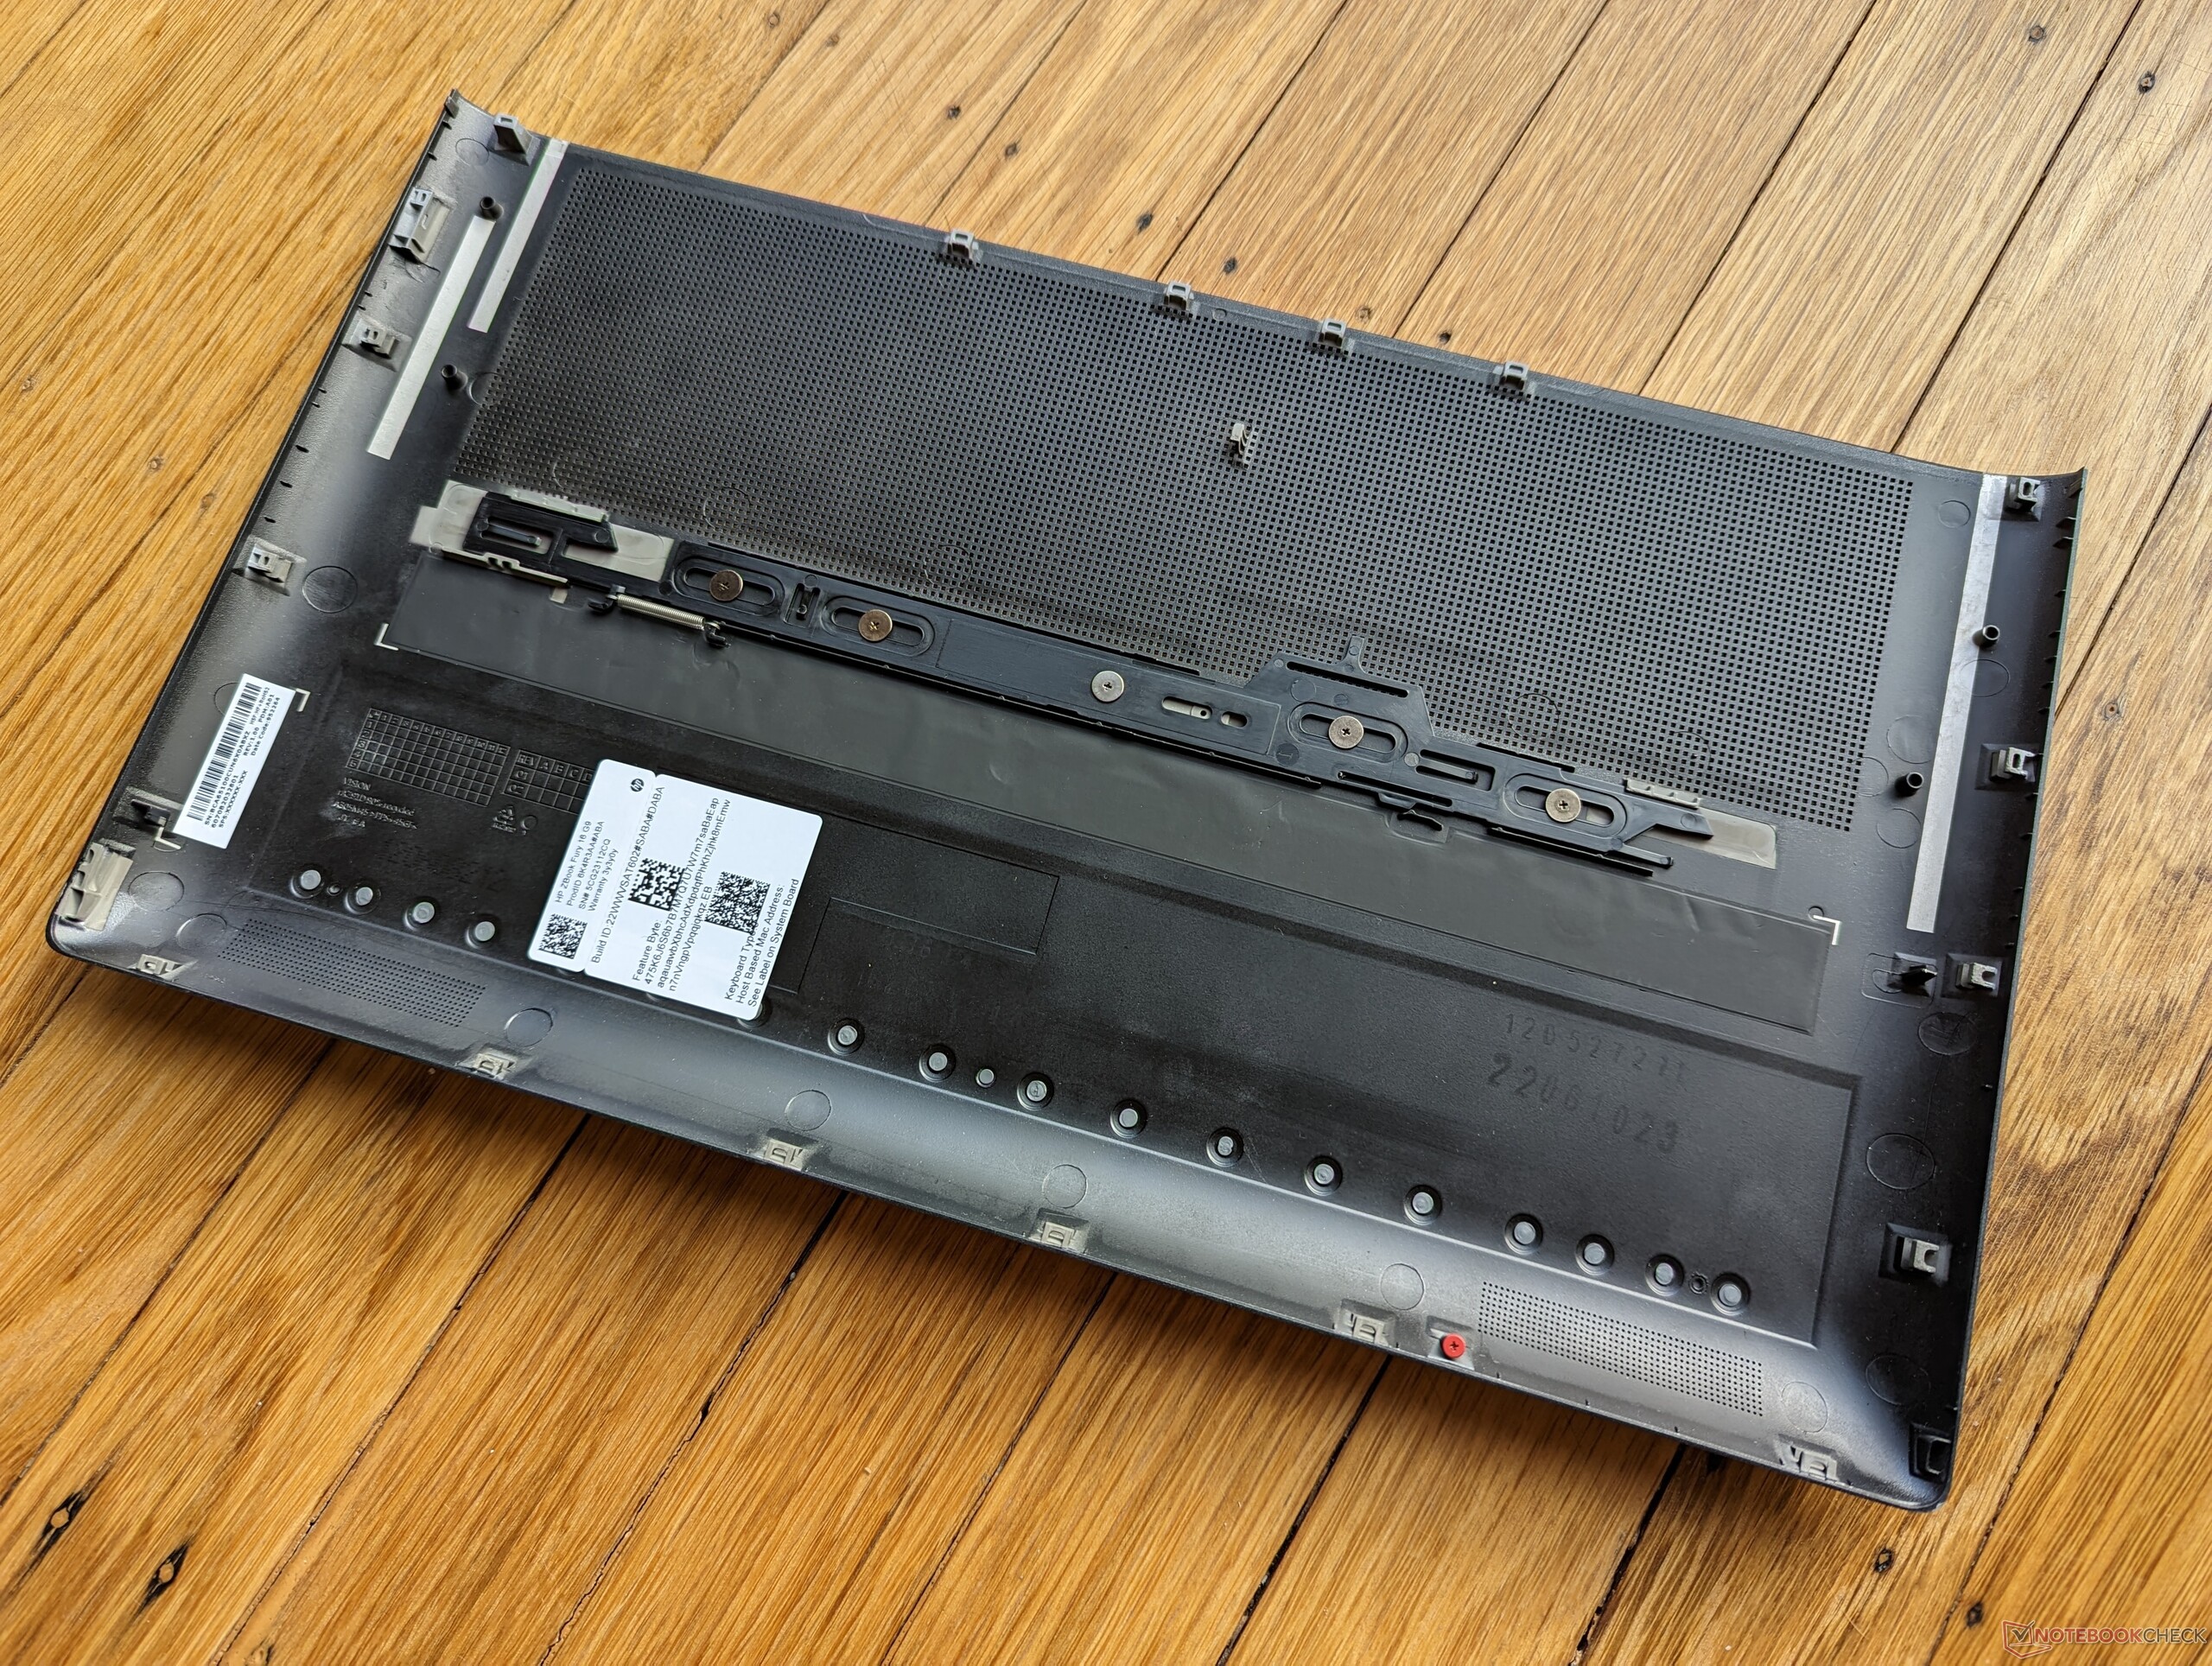
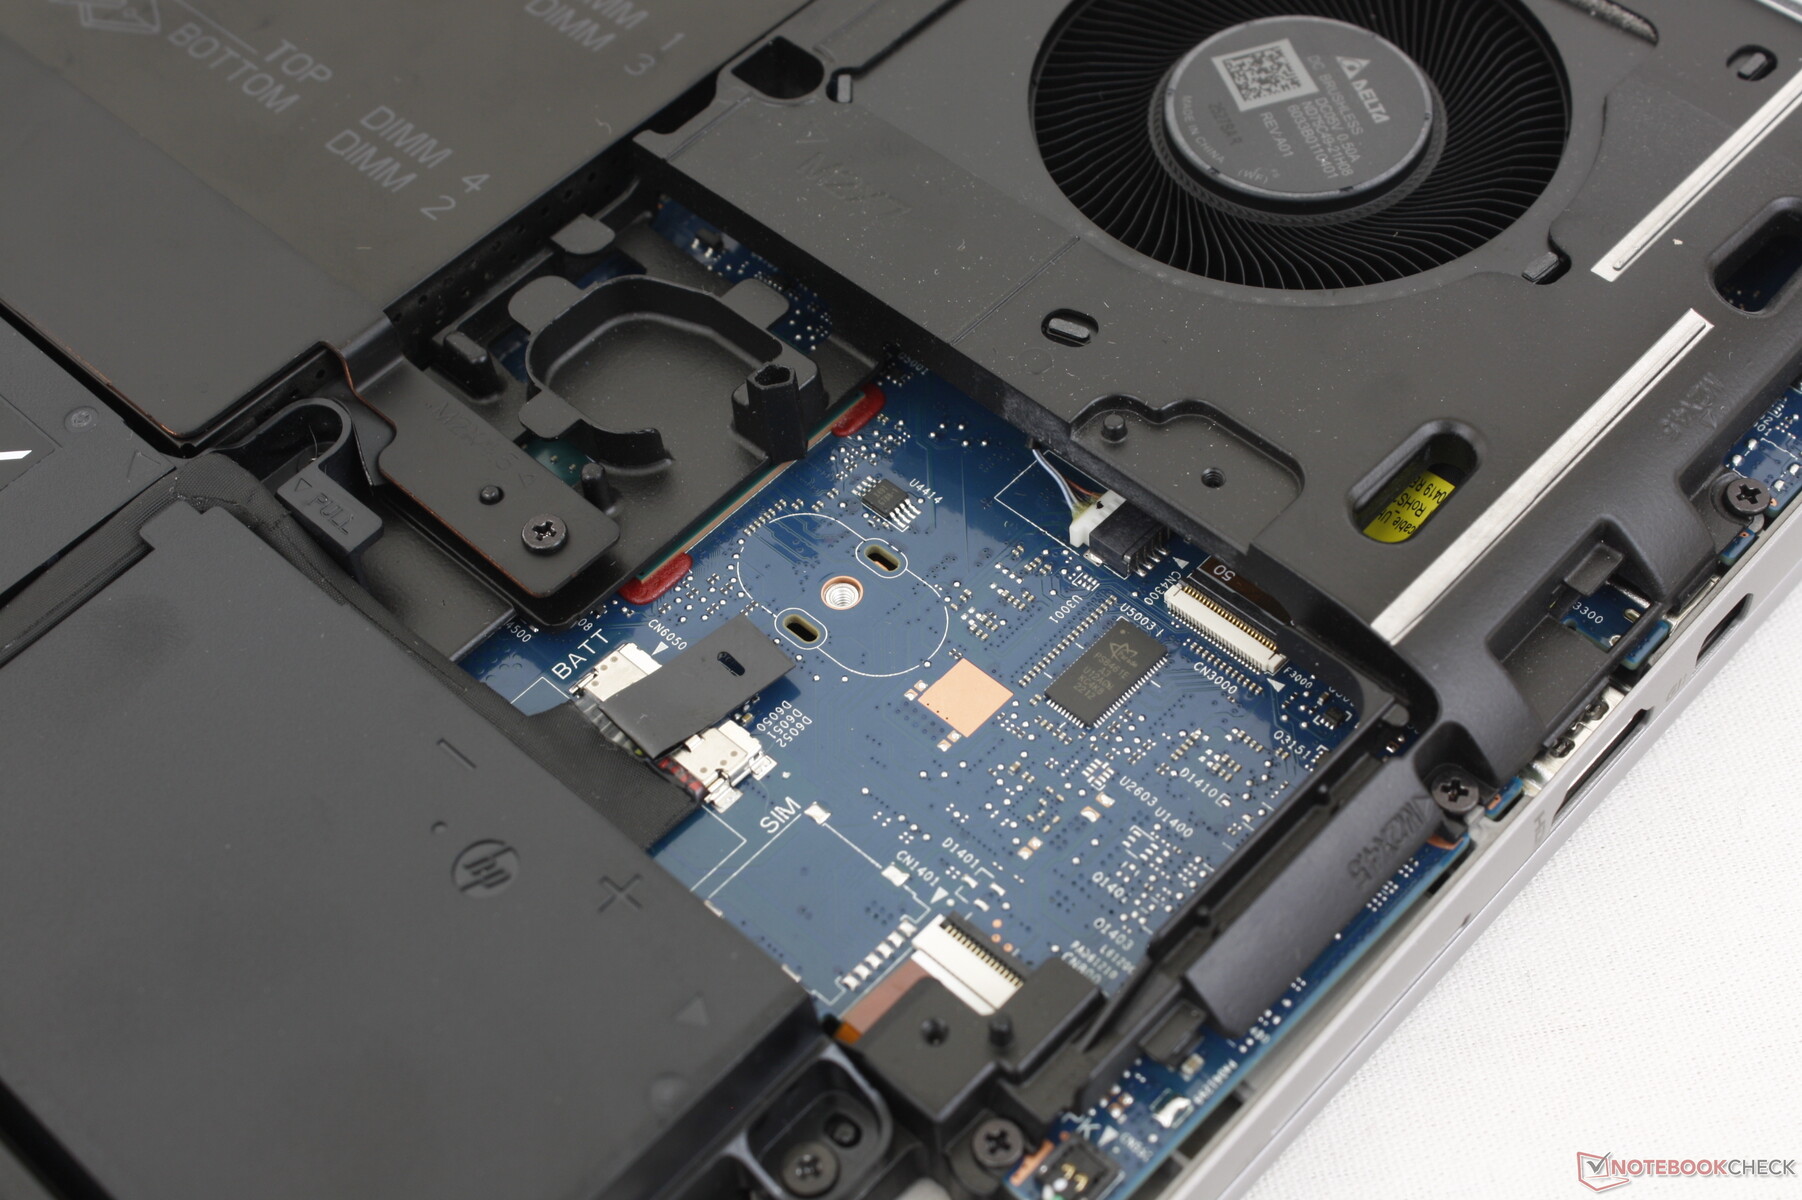
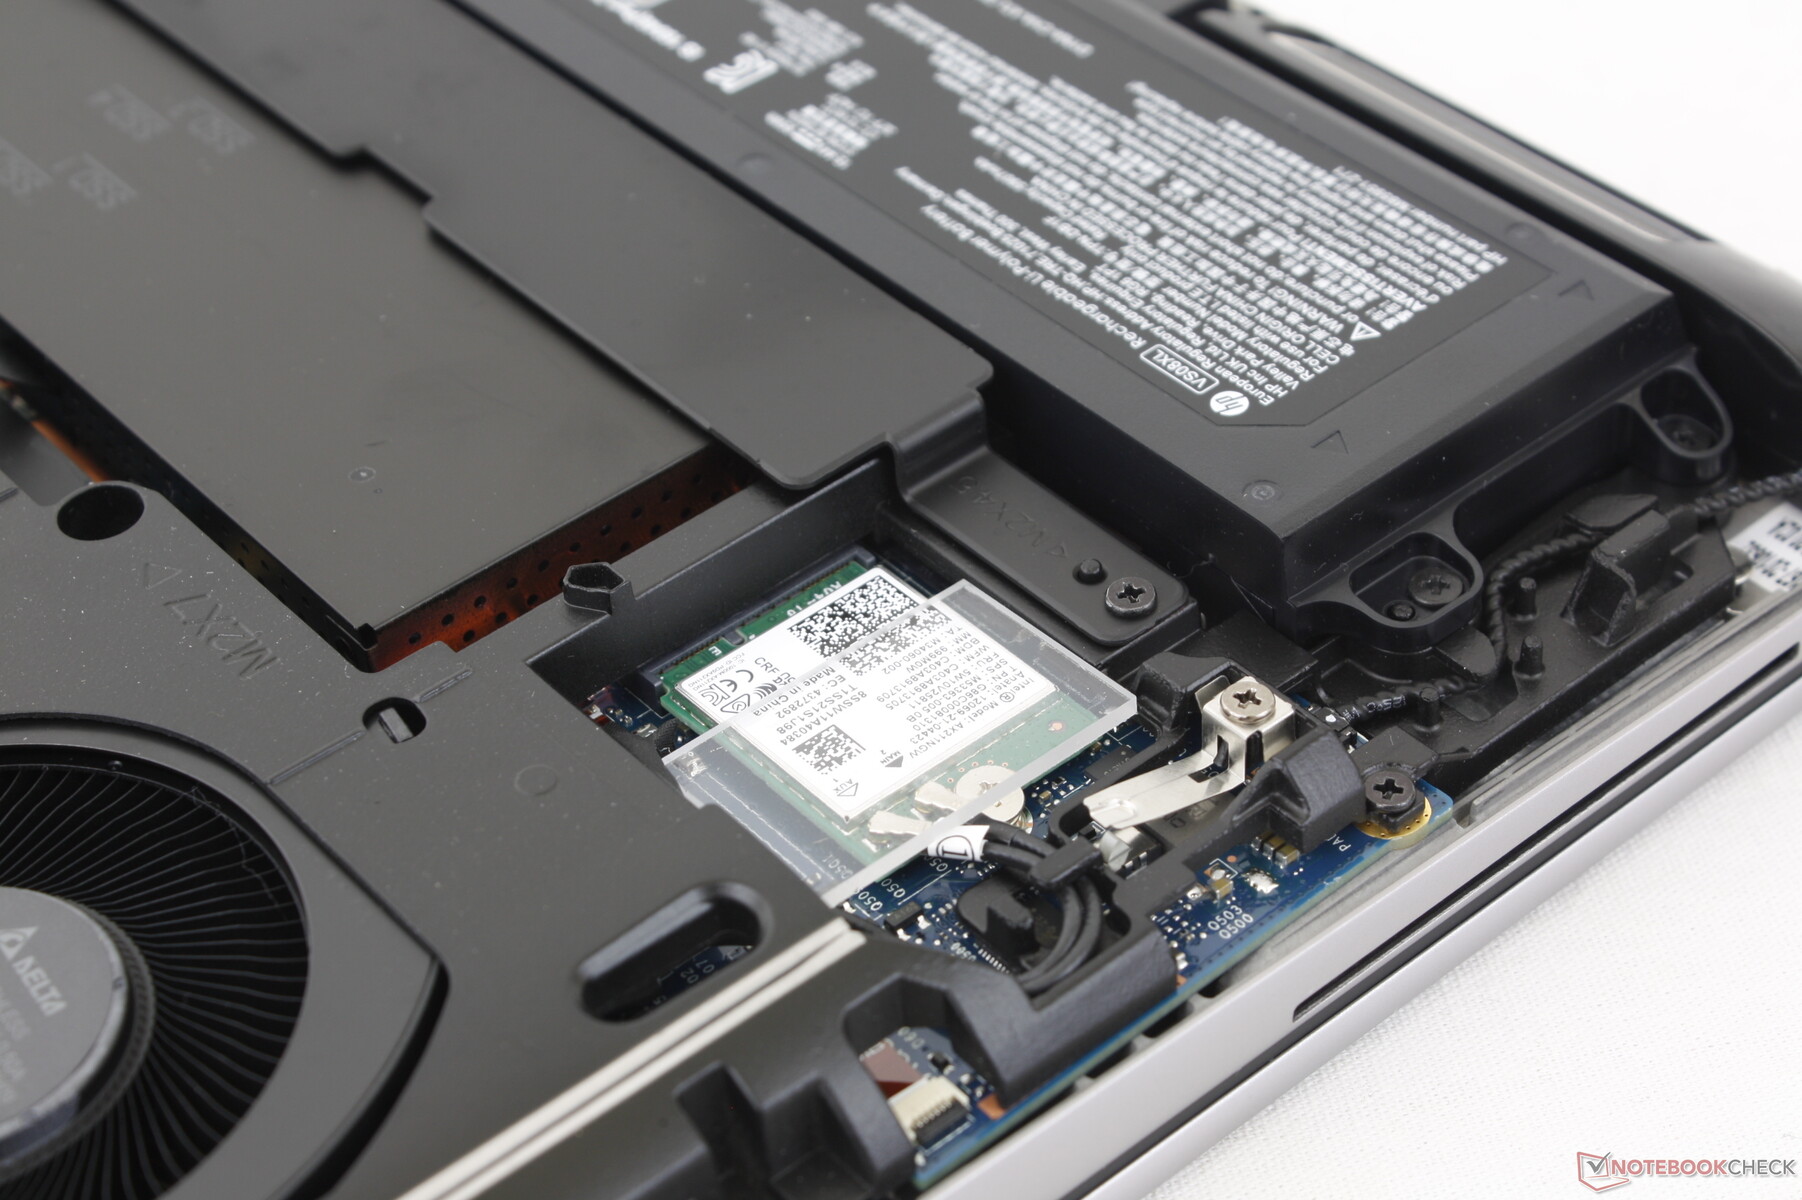
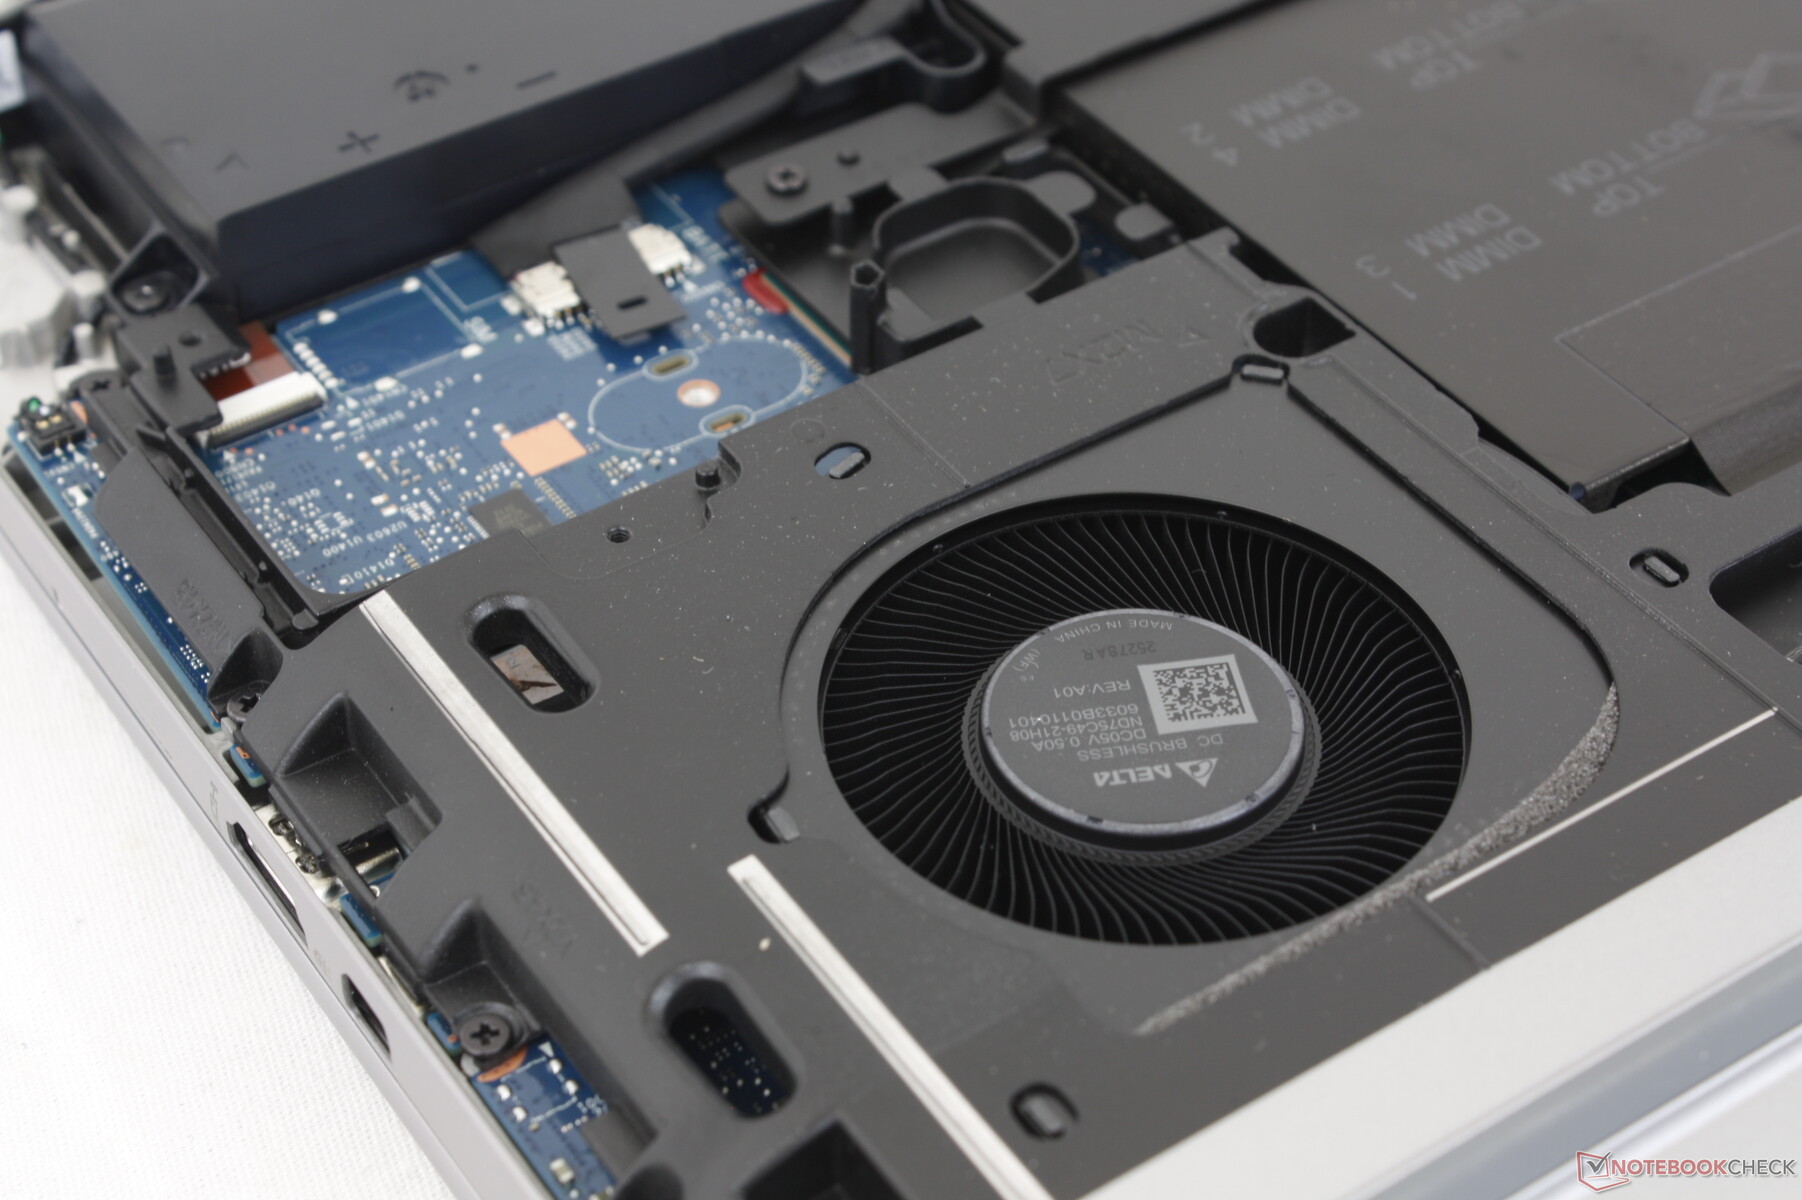
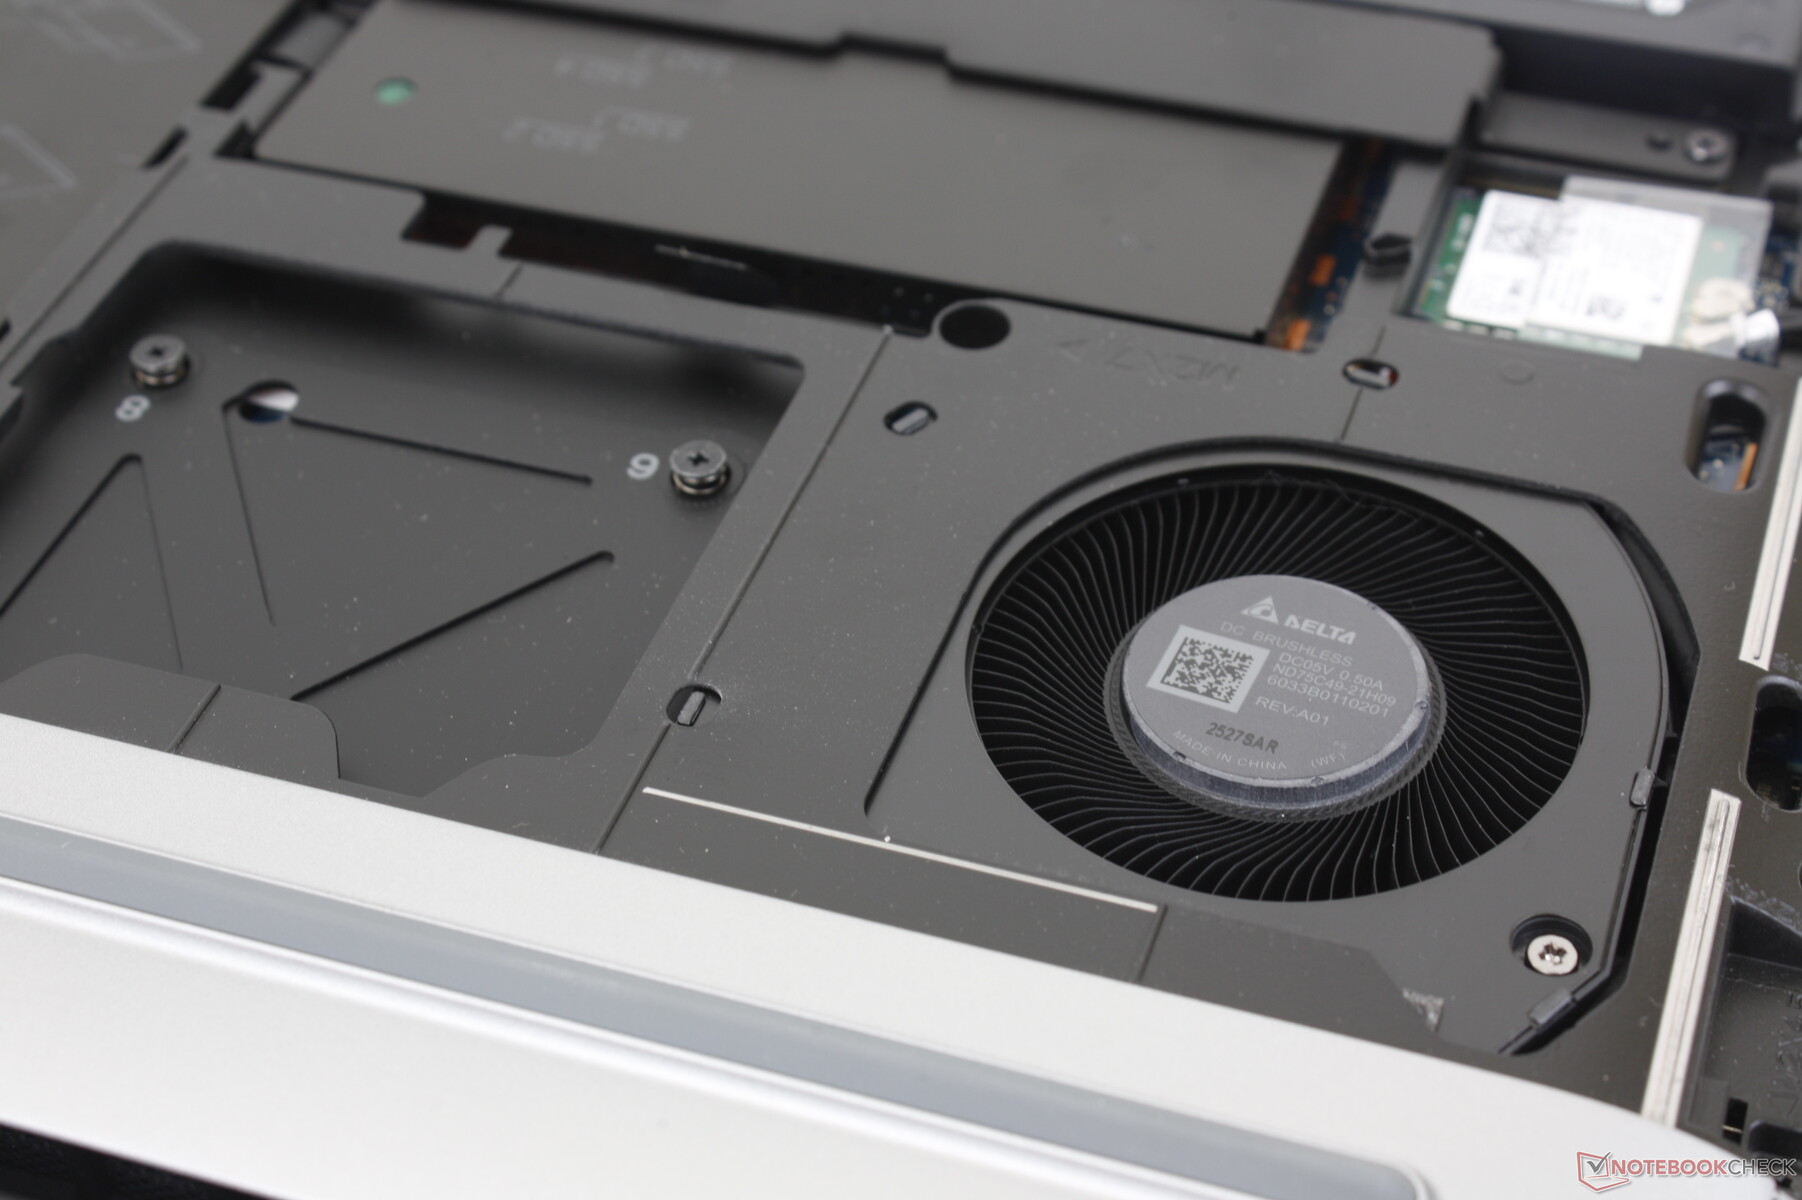
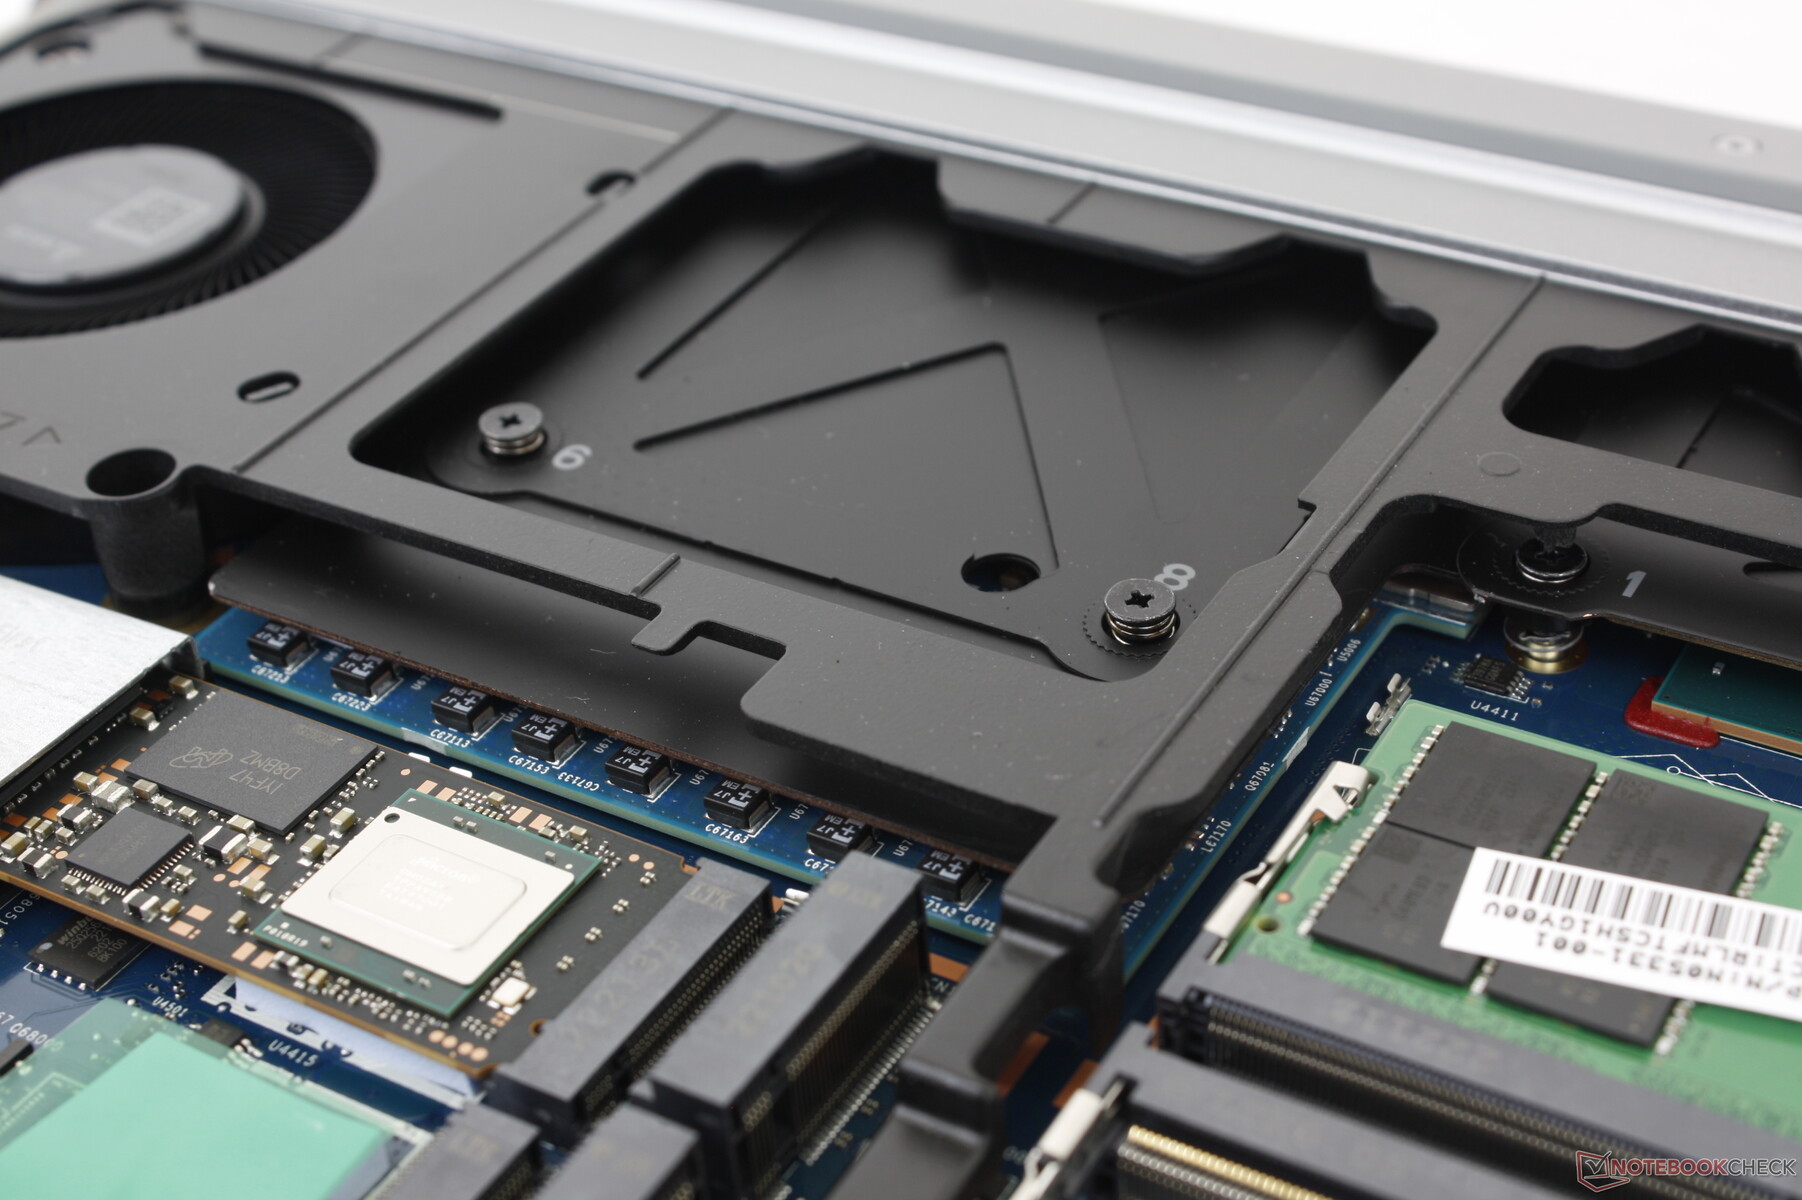
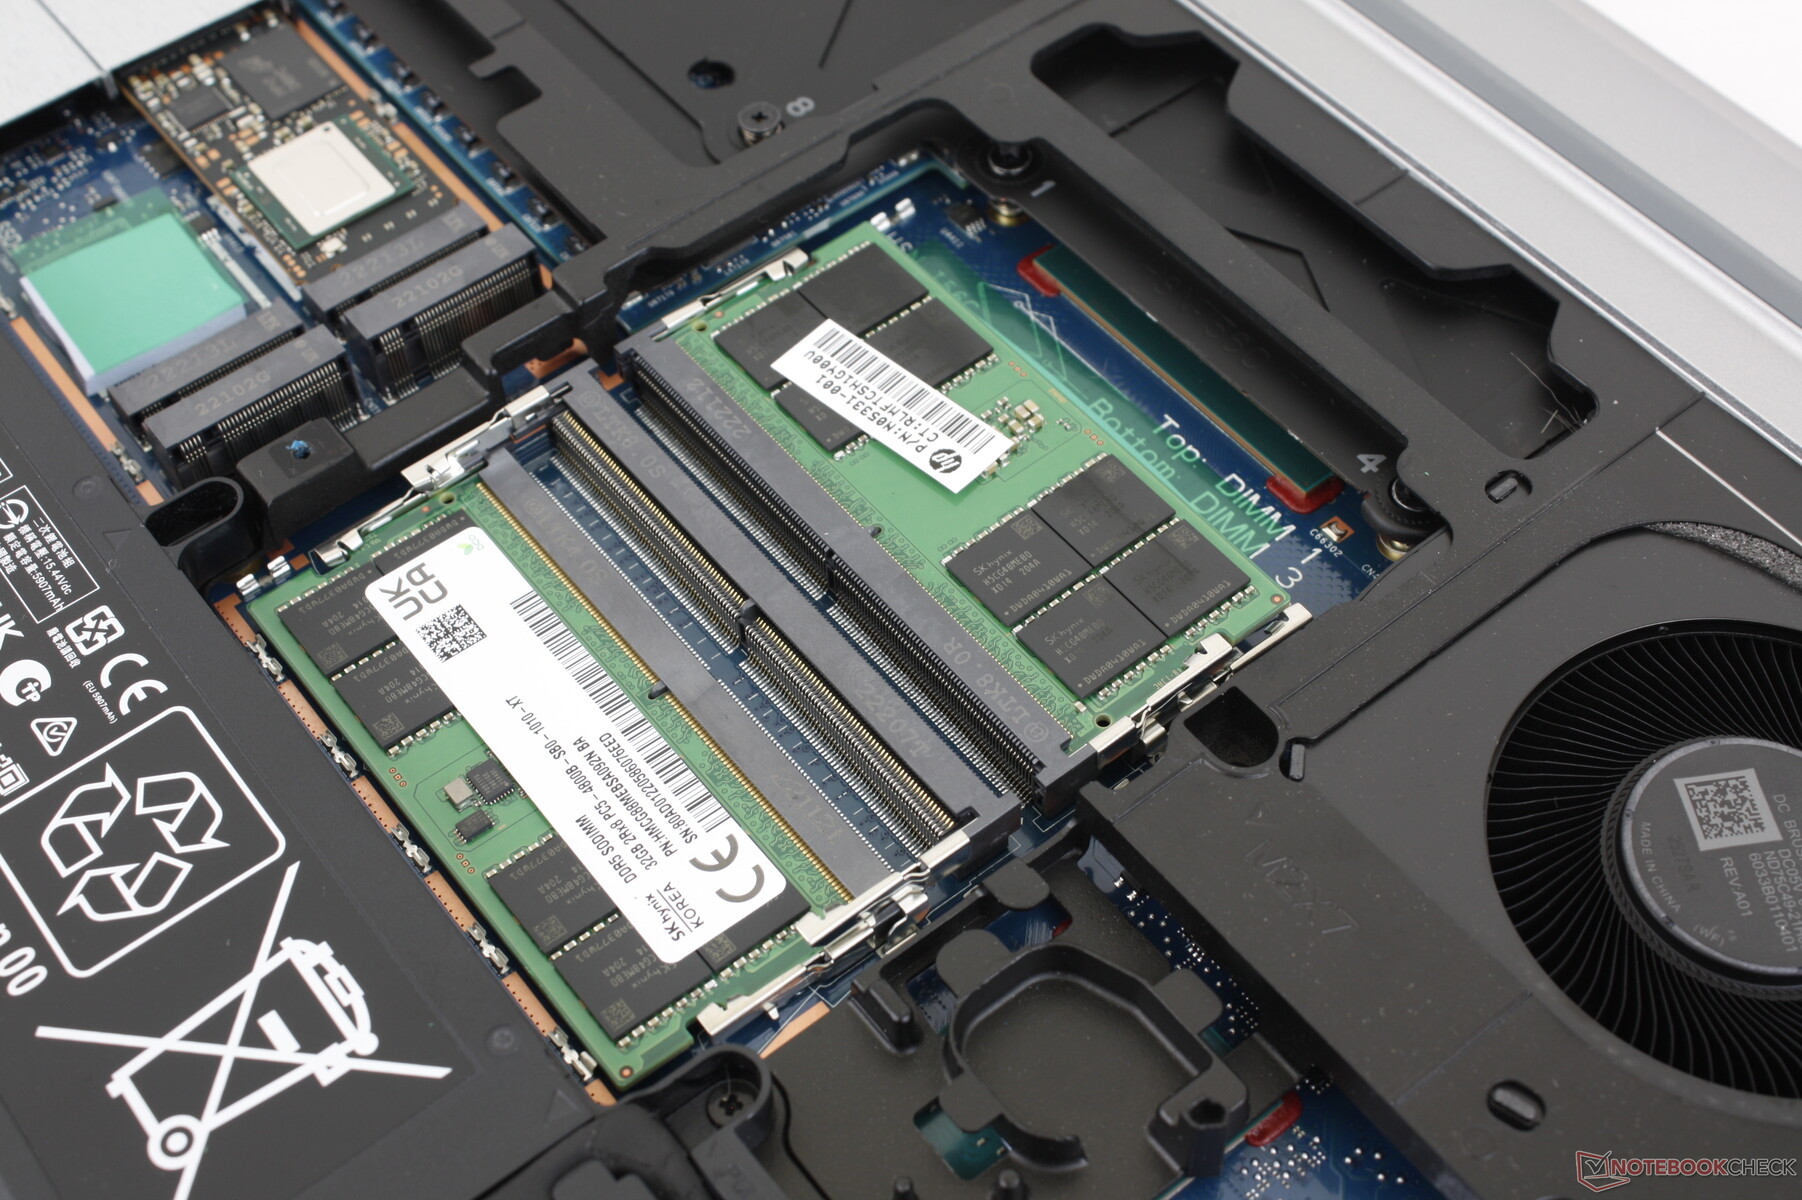
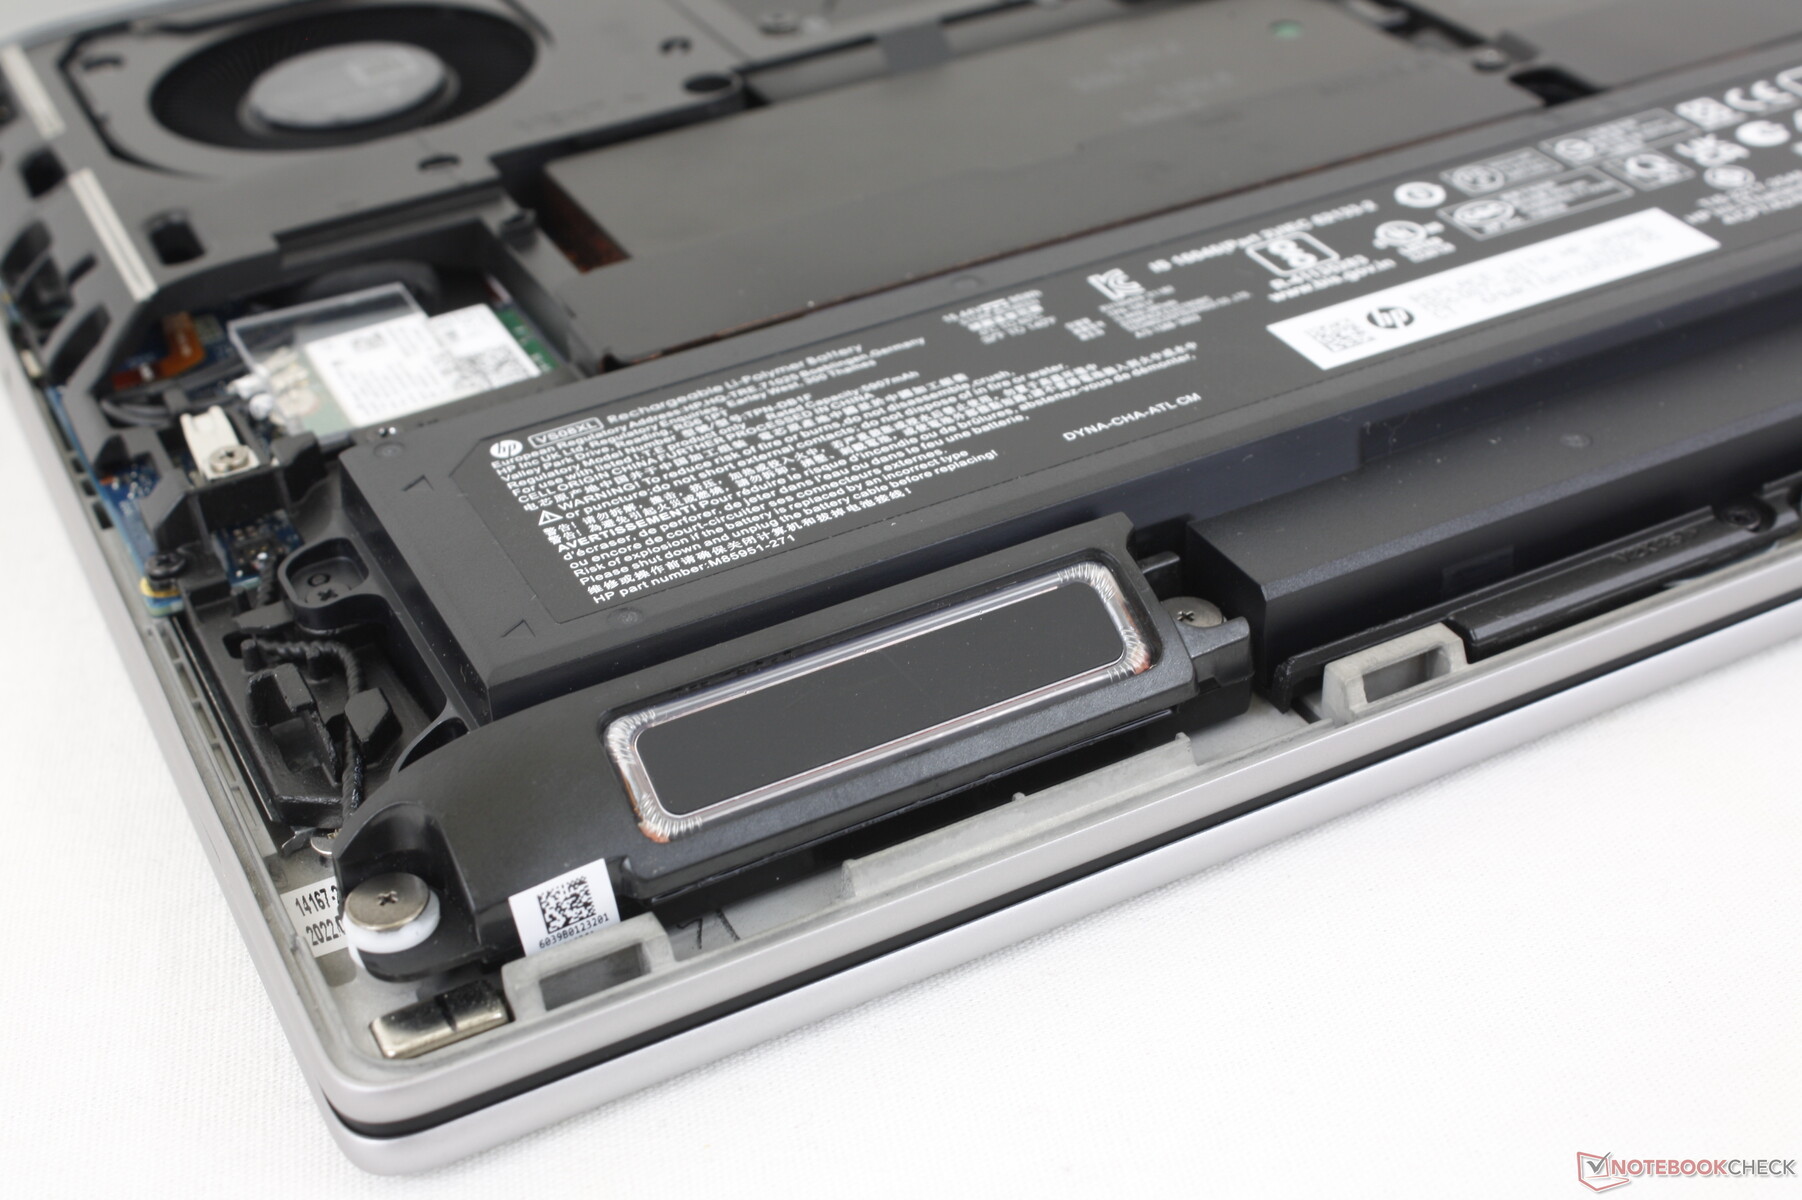
Manutenção
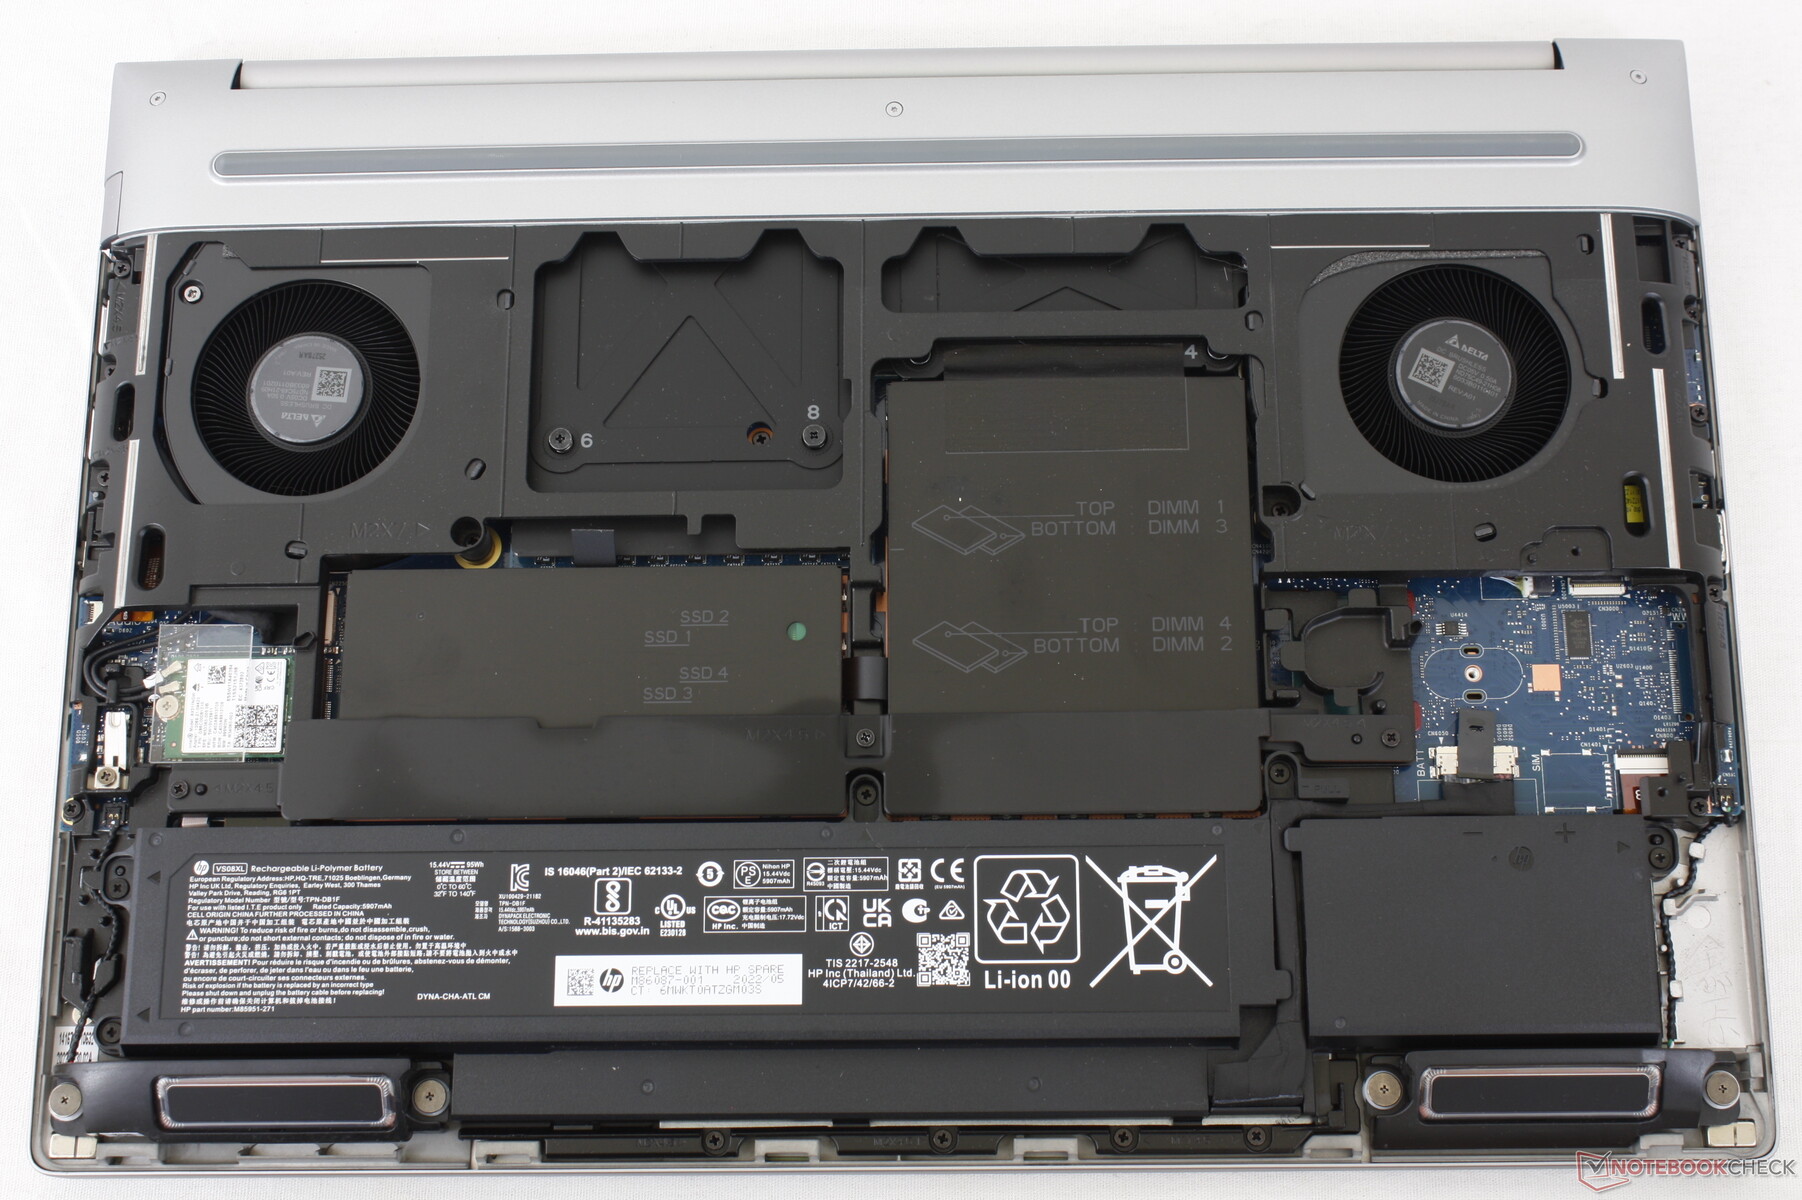
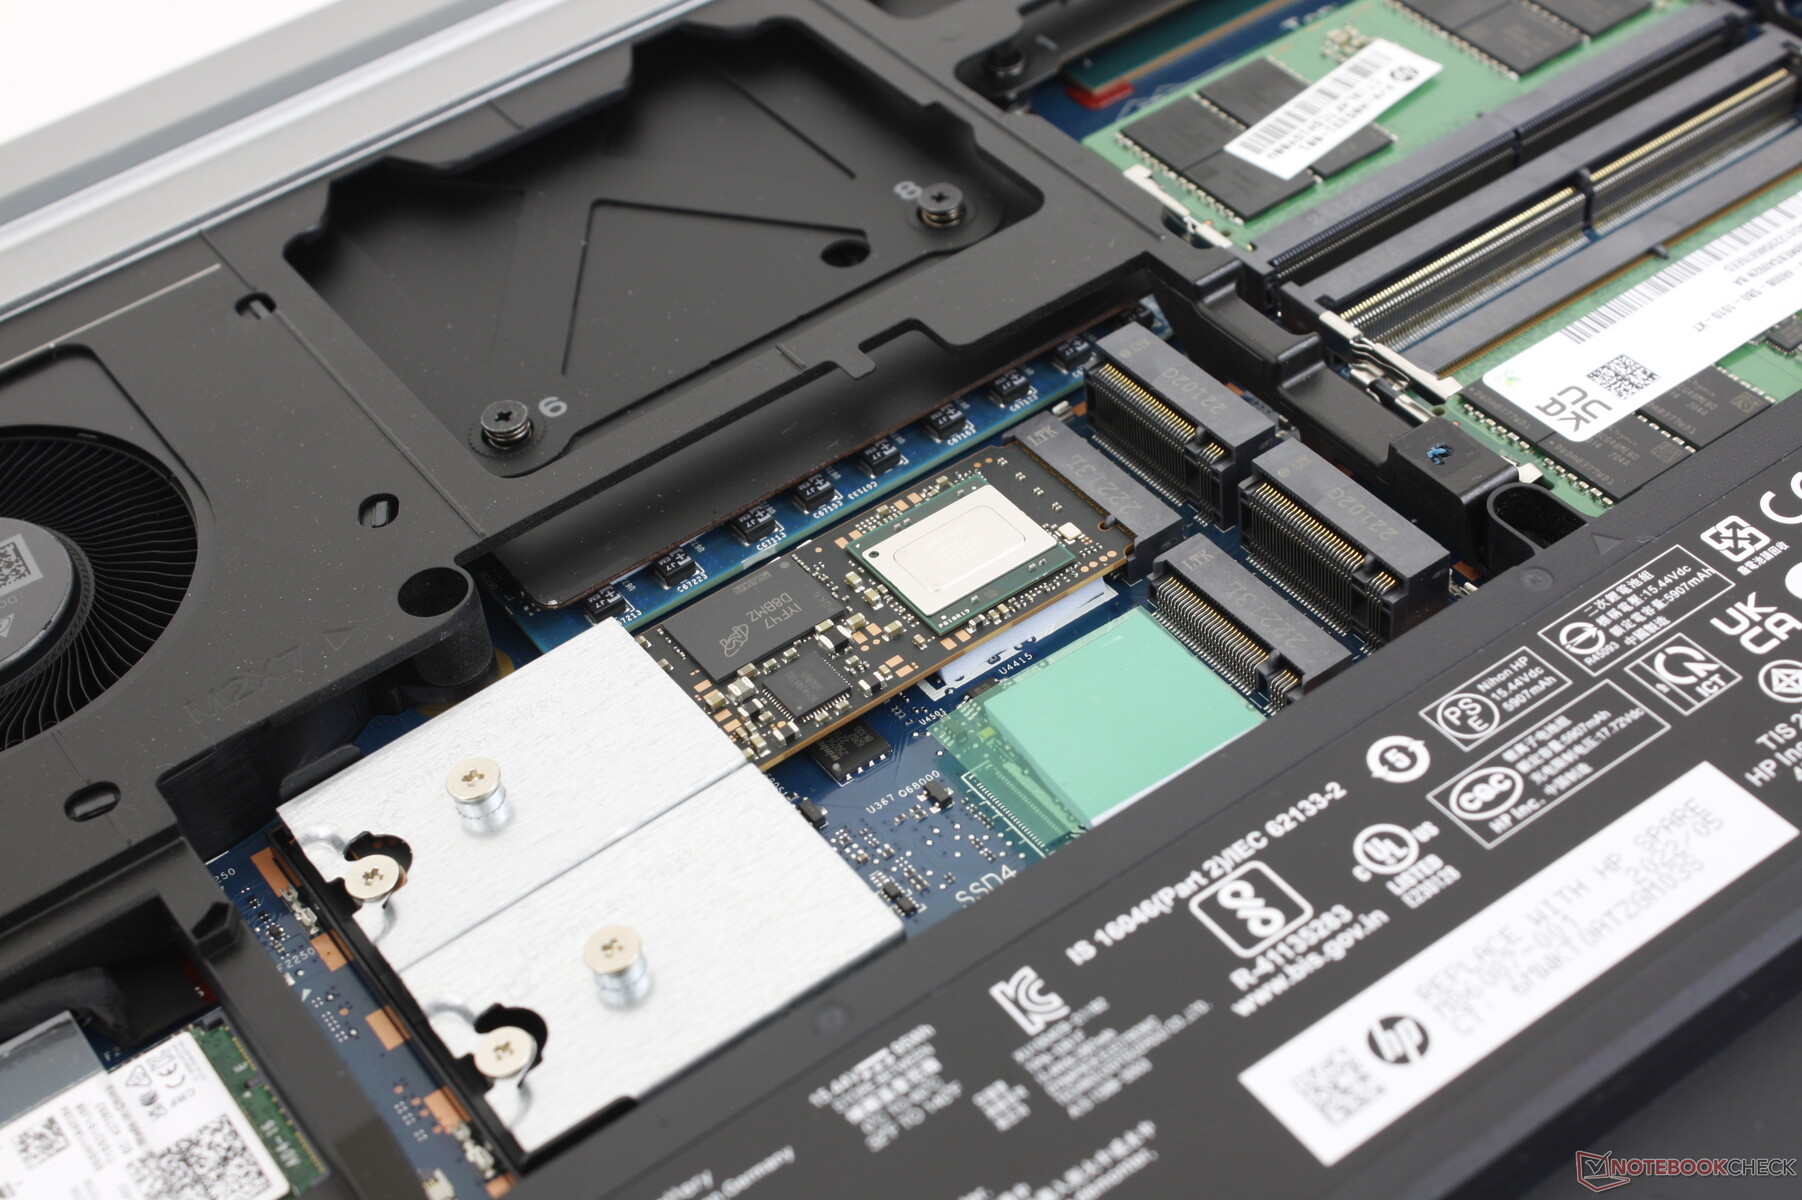
O painel inferior é "sem ferramentas", ou seja, desliza facilmente sem nenhuma ferramenta. Infelizmente, ainda é necessária uma chave de fenda, pois os compartimentos de armazenamento e os slots SODIMM são protegidos por placas de alumínio. O modelo suporta até 4 SSDs M.2 2280 e 4 módulos de RAM DDR5, o que é mais do que o Precision 7670 e o ThinkPad P16 podem oferecer.
Acessórios e garantia
Não há extras incluídos na caixa de varejo, além do adaptador CA e da documentação de praxe. Uma garantia limitada de três anos é padrão se for comprada nos EUA.
Dispositivos de entrada - Espaçoso e confortável
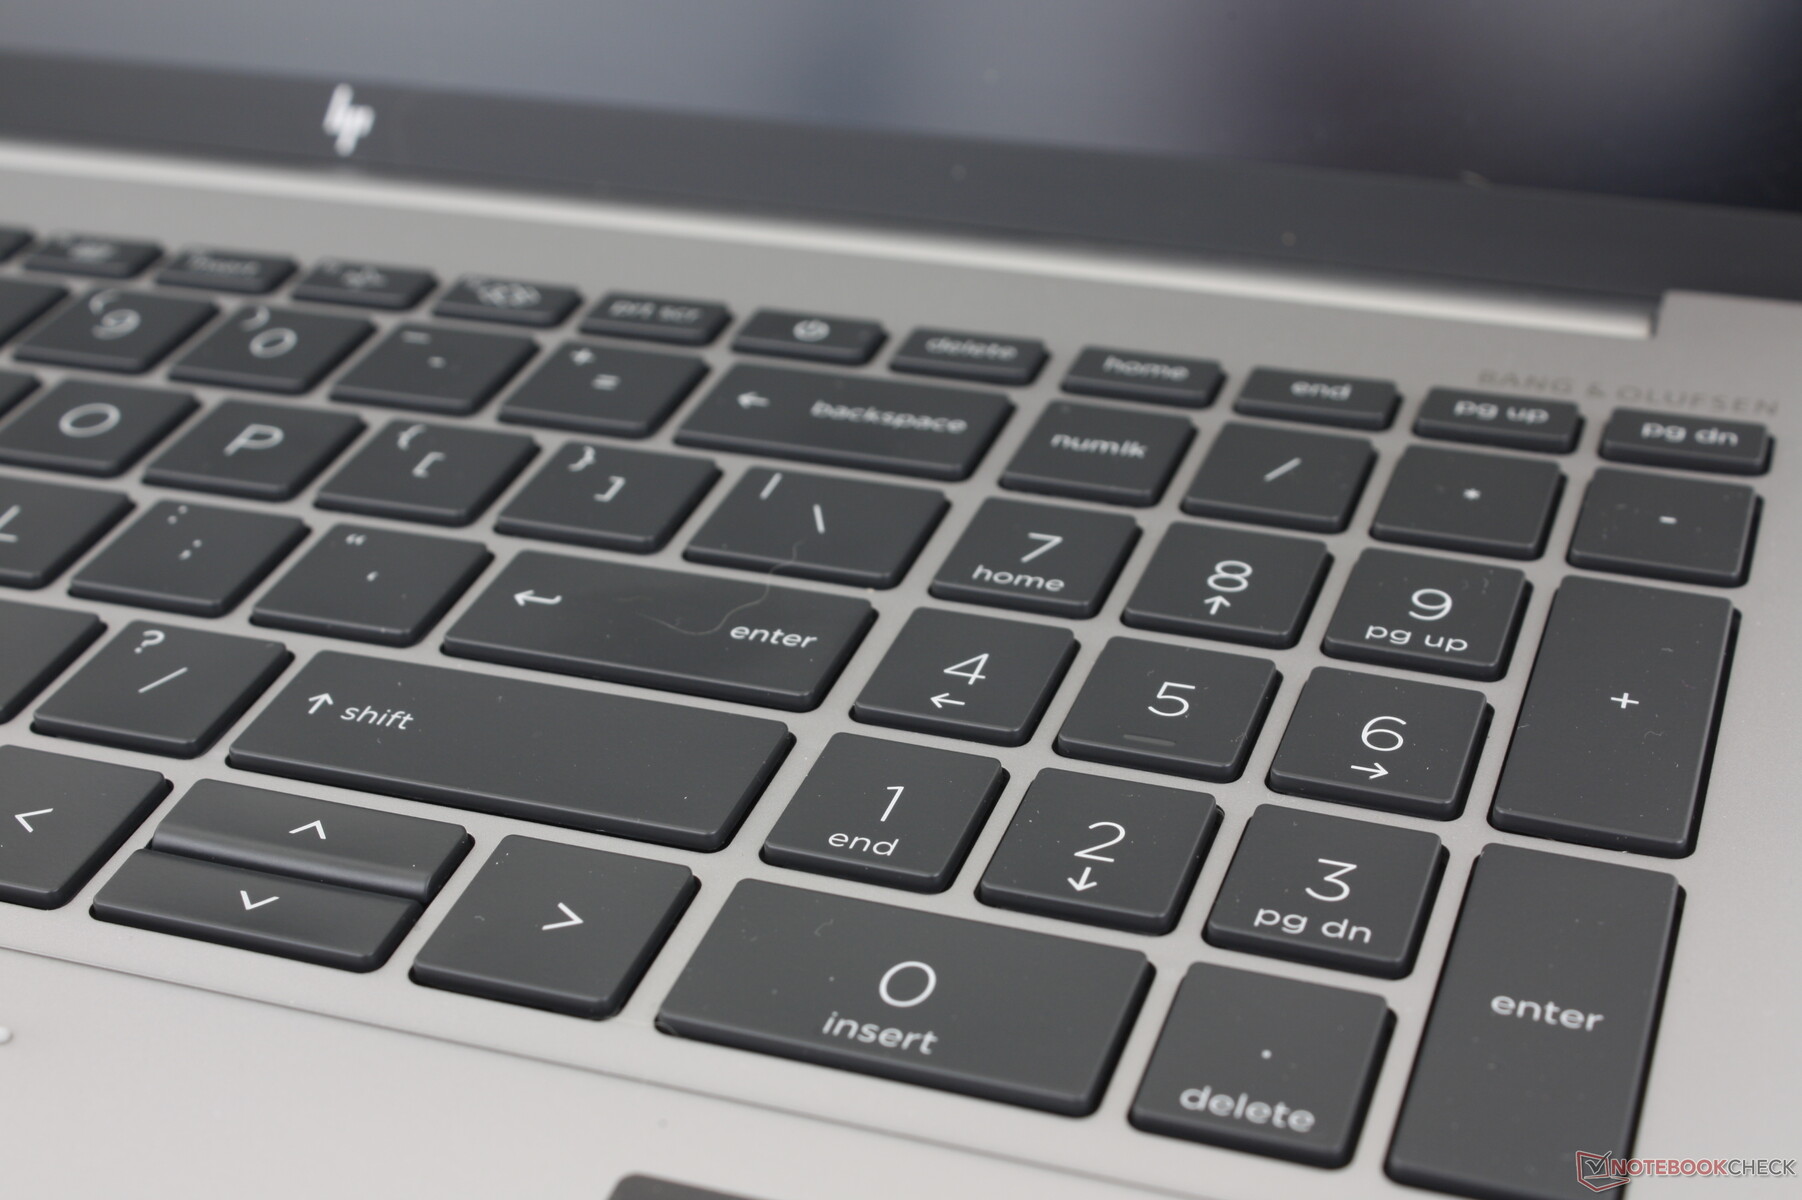
Teclado
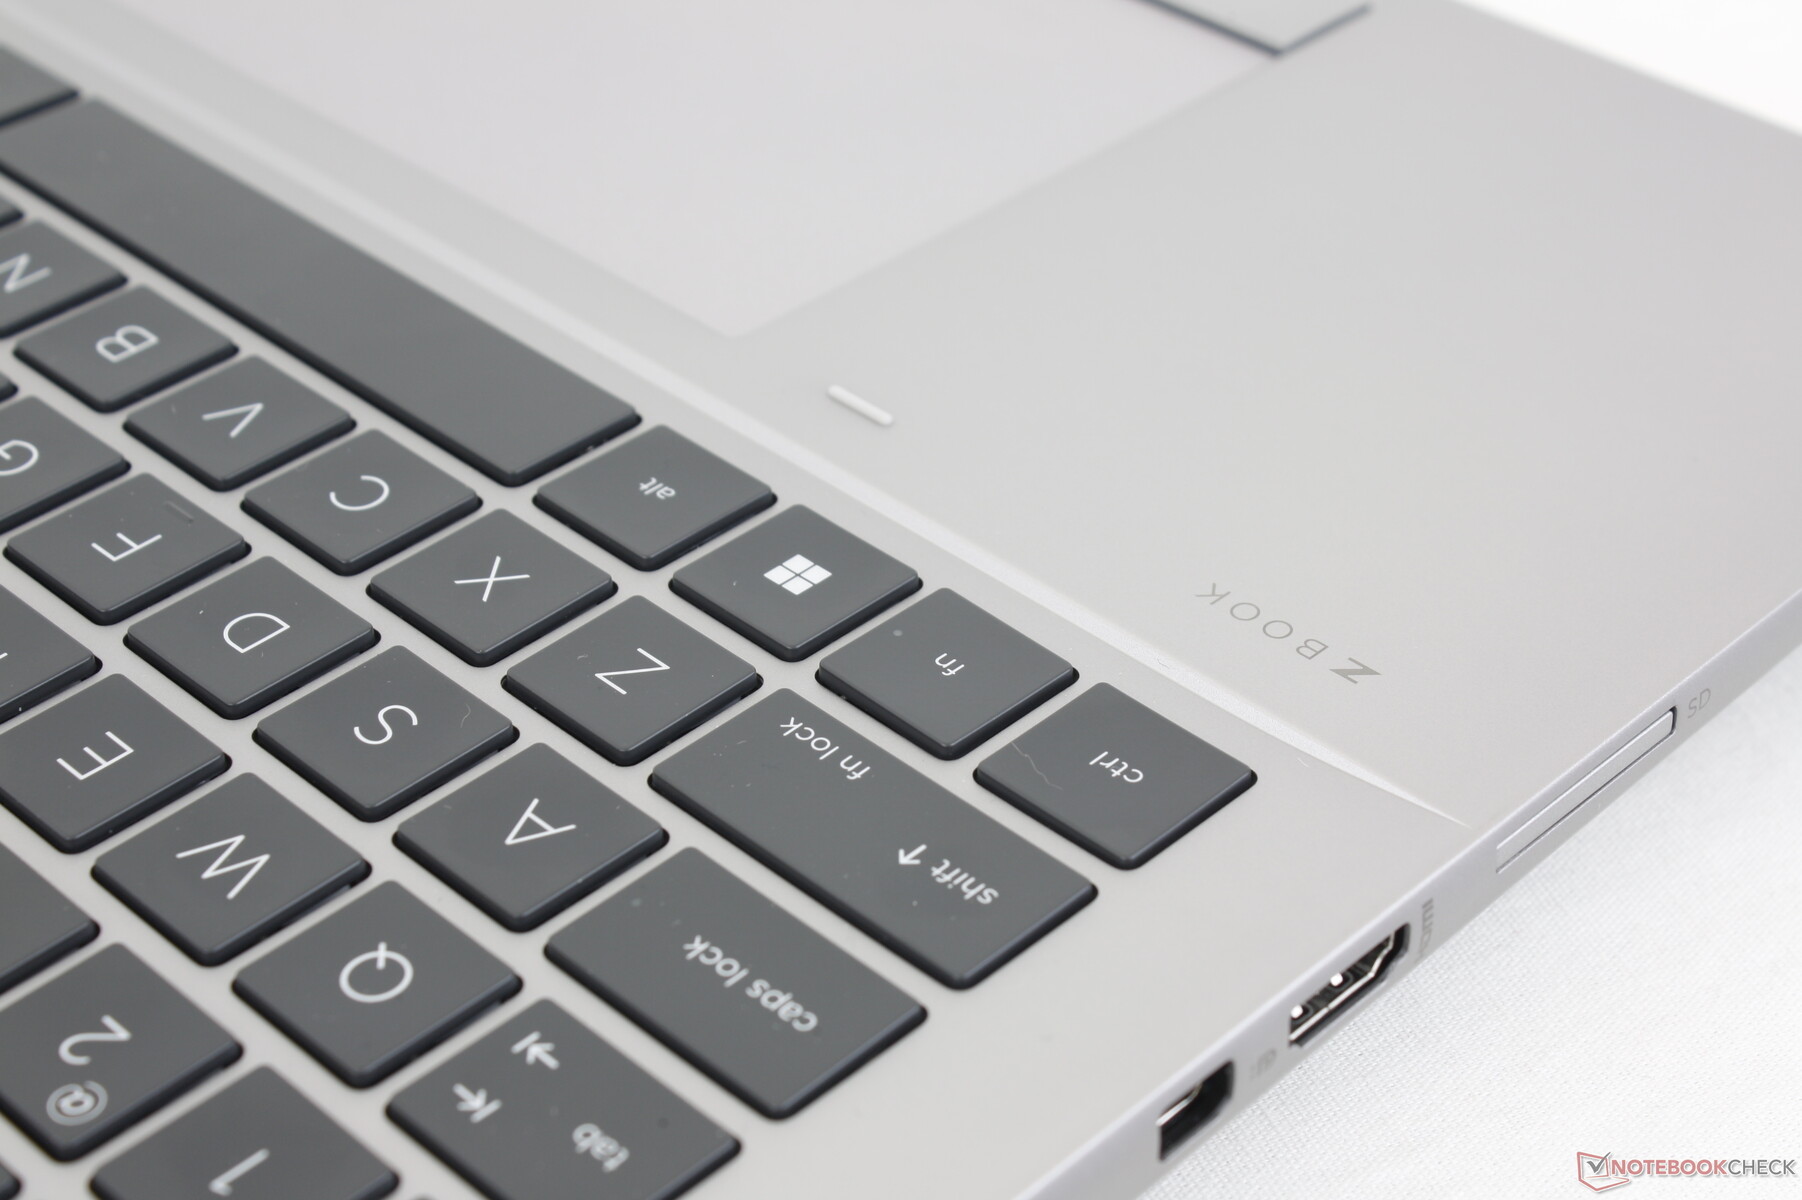
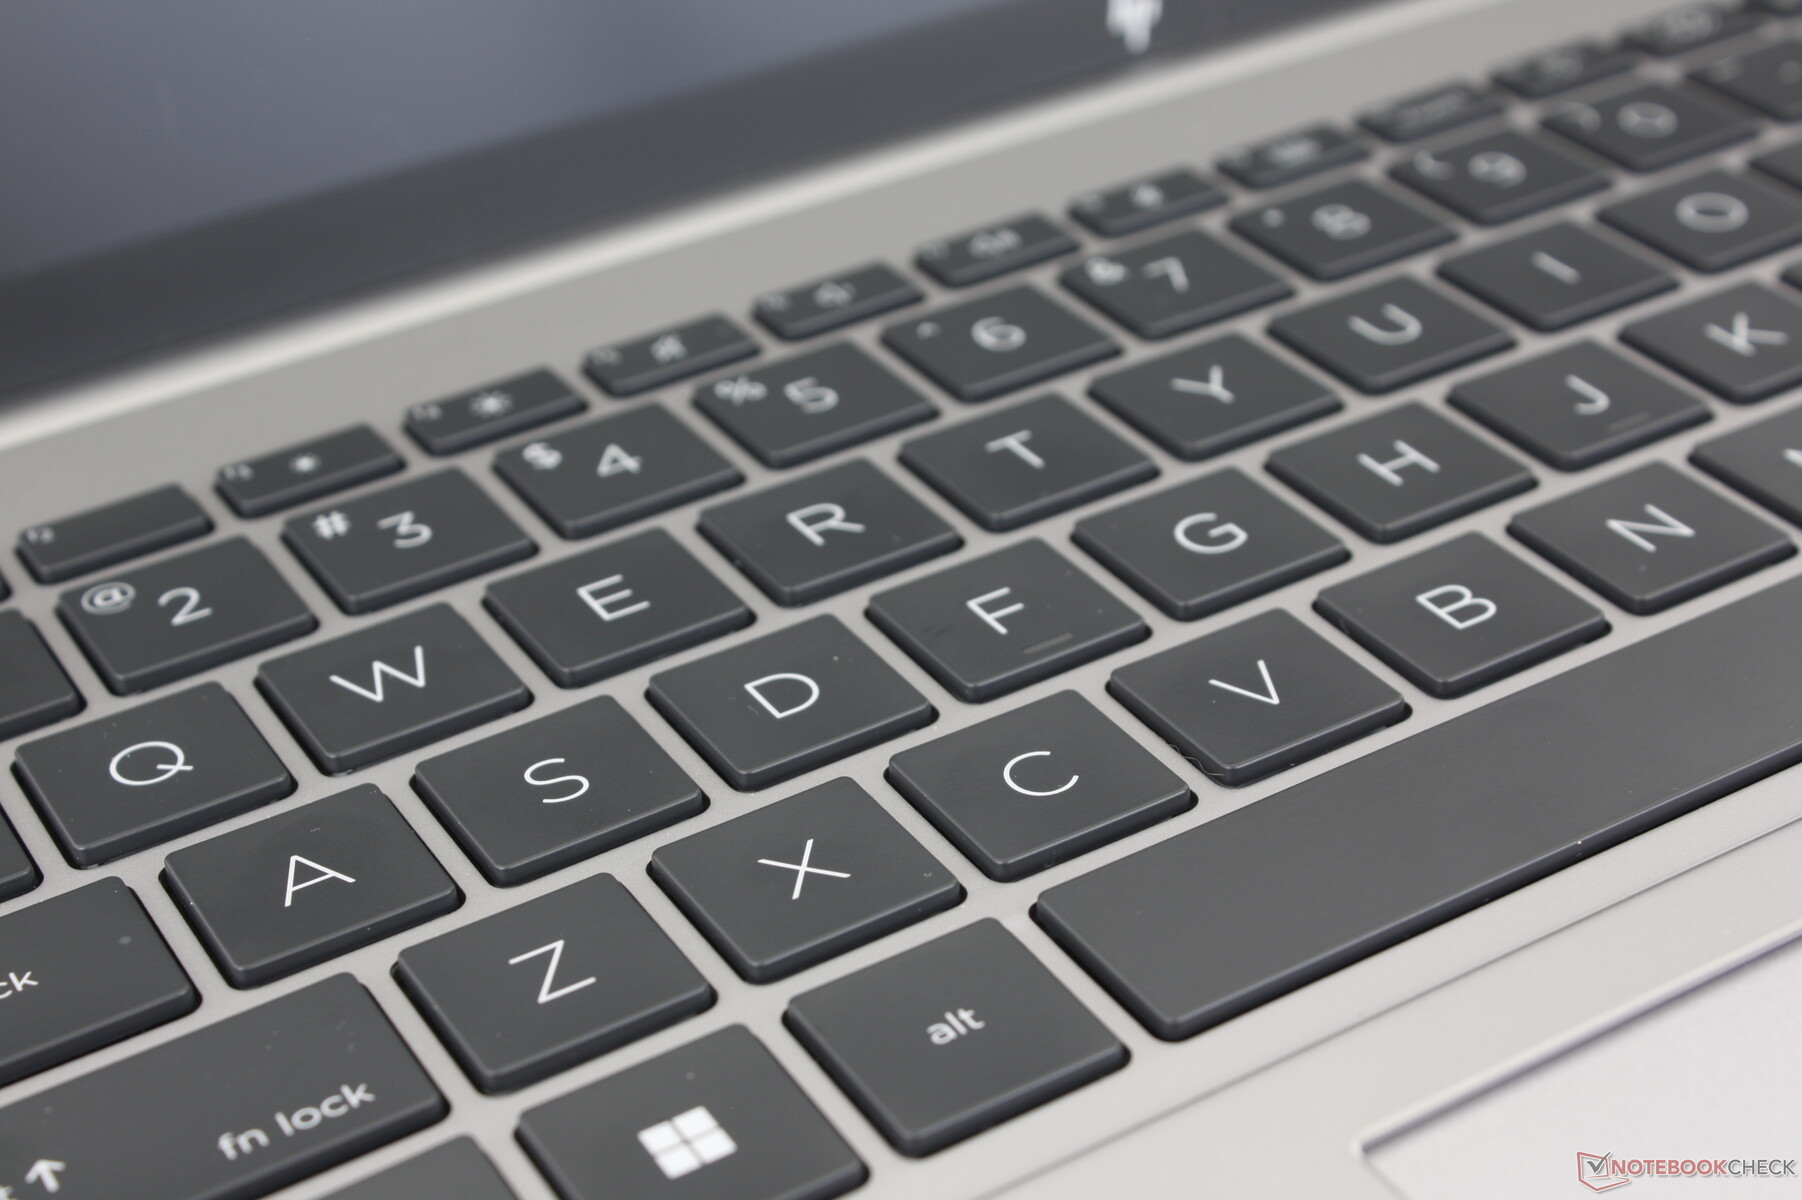
As famílias HP Spectre, EliteBook e ZBook têm alguns dos melhores teclados em suas respectivas categorias quando se trata de feedback e deslocamento. As teclas do Fury 16 G9 são firmes e proporcionam uma experiência de digitação satisfatória. No entanto, o ruído é mais alto do que no ThinkPad P16 G1 ou no Precision 7670, especialmente ao pressionar as teclas Espaço ou Enter. Os digitadores que preferem teclas mais silenciosas talvez queiram experimentar o teclado do ZBook antes de se comprometerem.
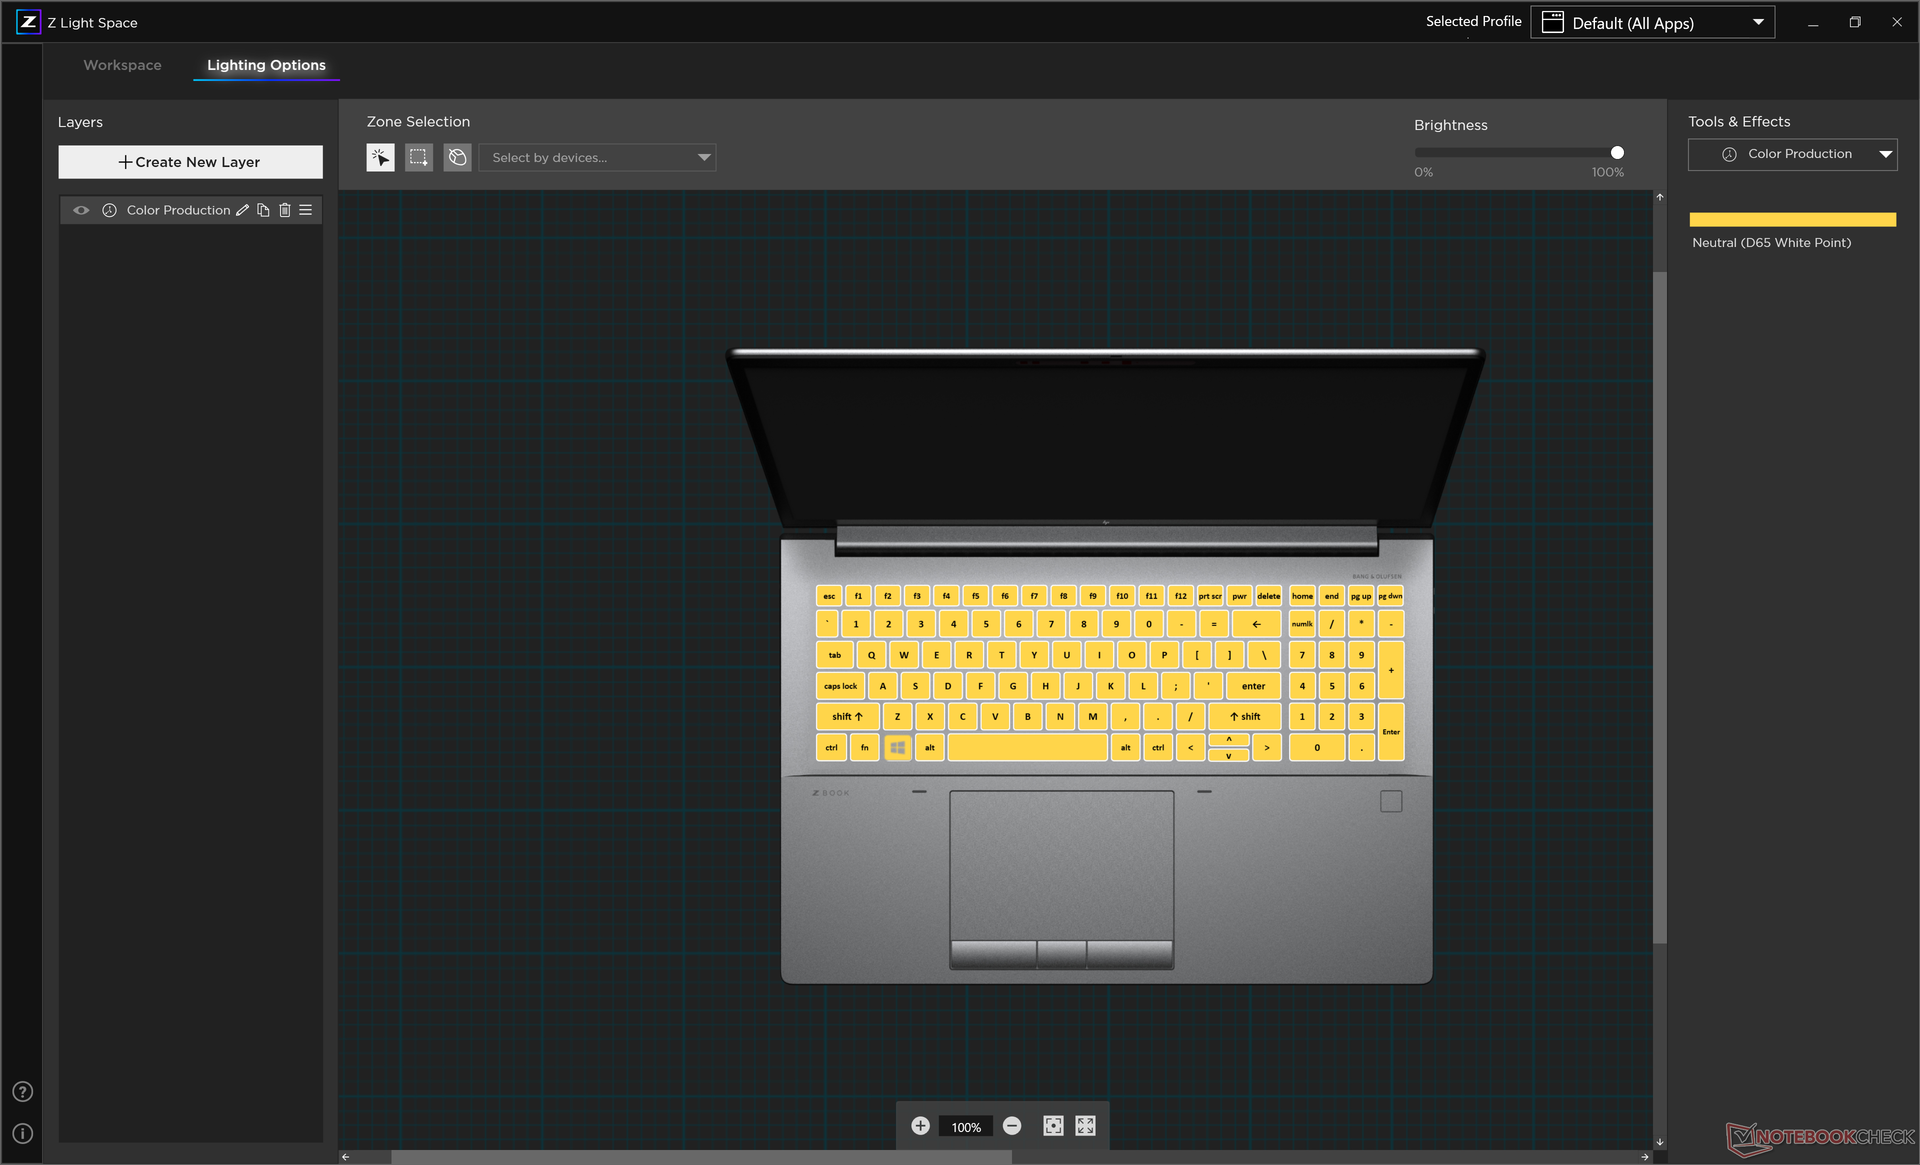
Os recursos notáveis do teclado do ZBook incluem iluminação de fundo RGB por tecla e uma única tecla programável/personalizável. A maioria das outras estações de trabalho ainda não vem com recursos auxiliares semelhantes.
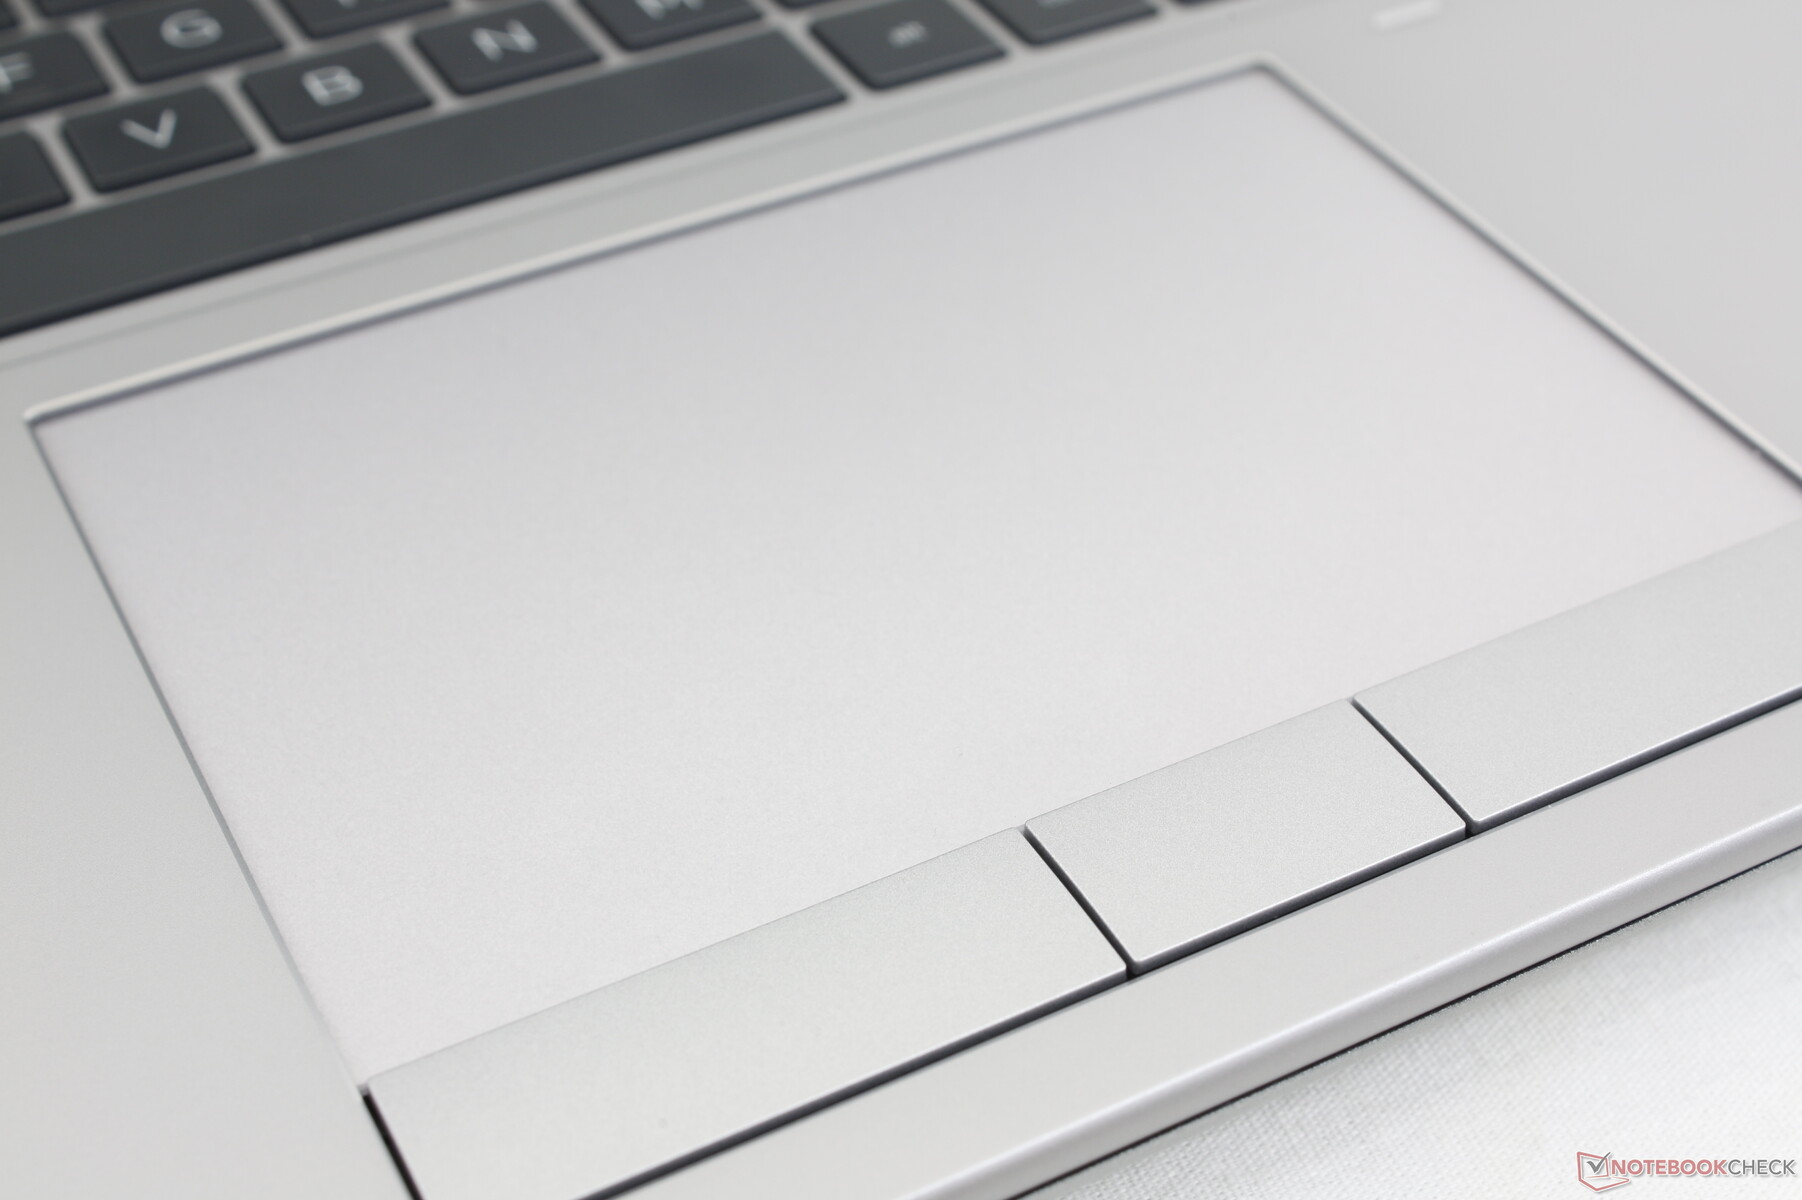
Touchpad
O touchpad é um dos melhores que já usamos em qualquer laptop, seja ele uma estação de trabalho ou não. Além de ser maior (12,4 x 8,3 cm) do que os touchpads do ThinkPad P16 G1 (11,5 x 6,9 cm) ou do Precision 7670 (11,5 x 8 cm), suas propriedades de deslizamento são suaves para um controle confiável do cursor em qualquer velocidade. Enquanto isso, os botões dedicados do mouse têm um curso mais profundo do que na maioria dos outros laptops, mantendo um clique satisfatório quando pressionados. Em comparação, o Precision 7670 não tem botões de mouse dedicados em favor de uma solução de clickpad.
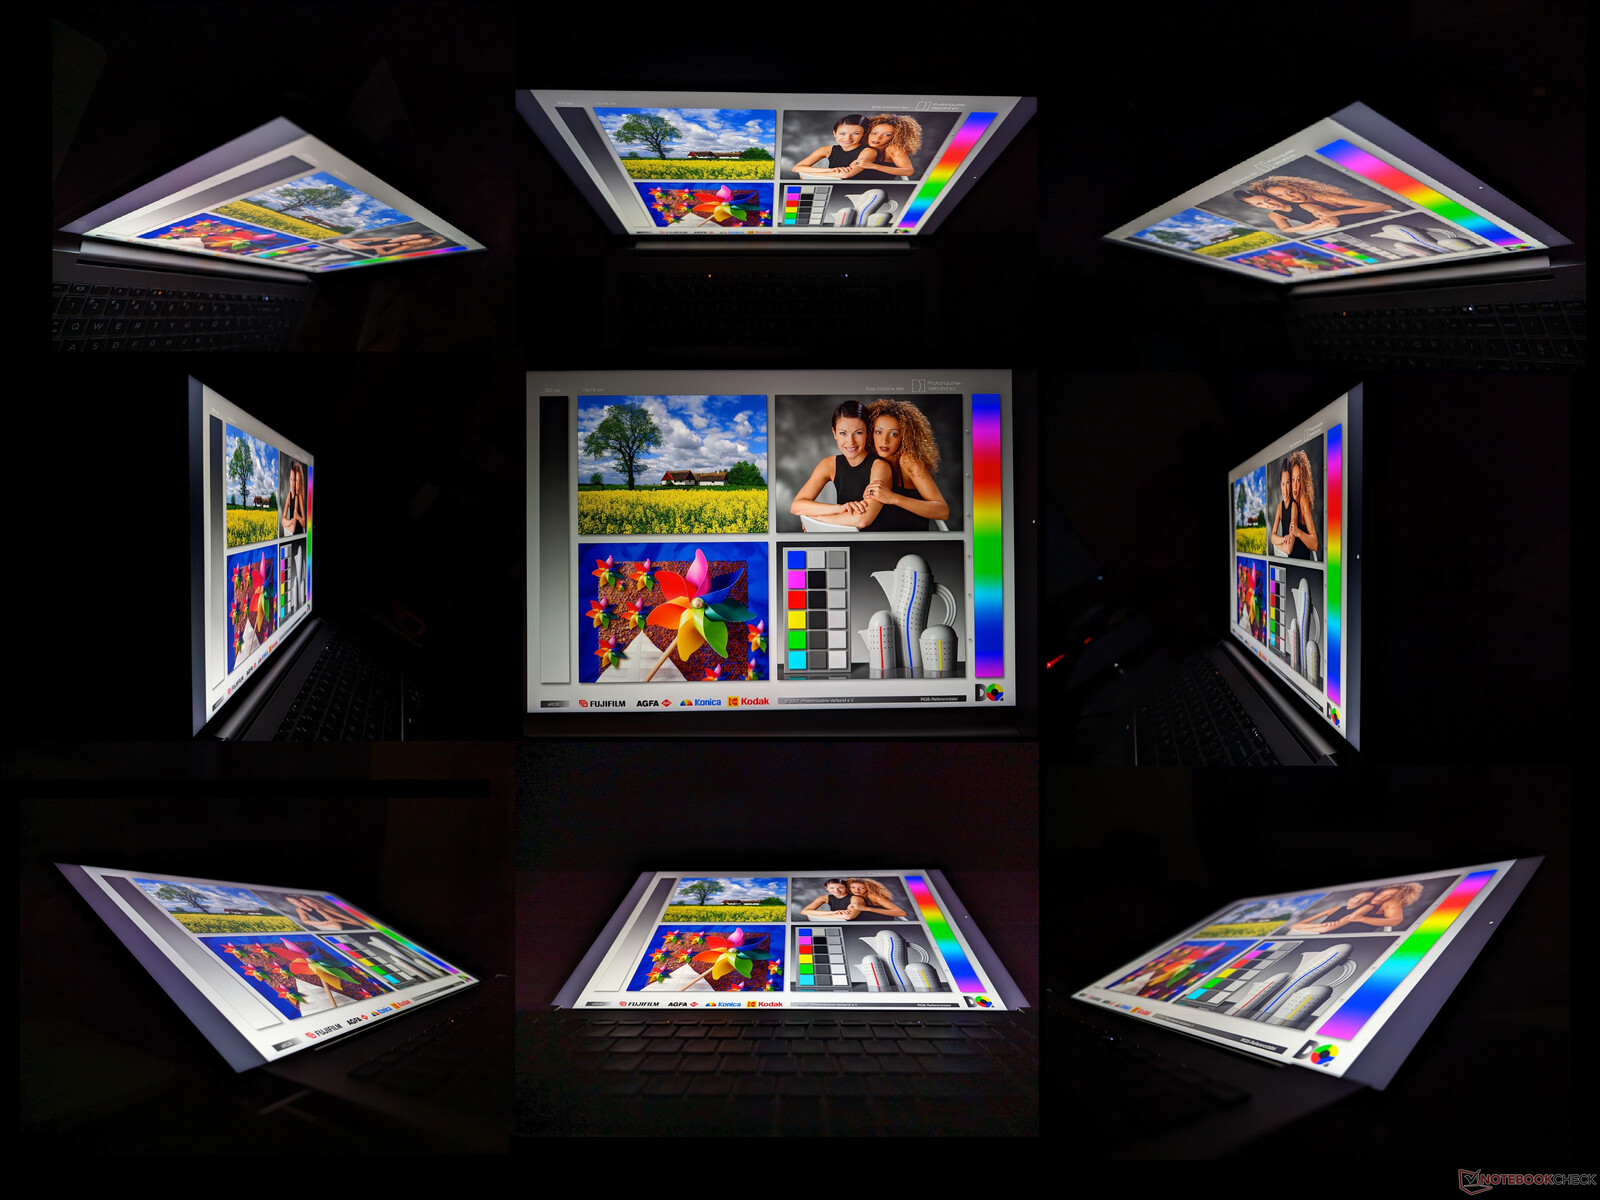
Tela - Cores excelentes com bons tempos de resposta
A HP emprega as mesmas opções de painel BOE em muitos de seus laptops de 16 polegadas. O ZBook Studio 16 G9por exemplo, utiliza o mesmo painel 4K 16:10 que o nosso ZBook Fury 16 G9, conforme exemplificado por seus atributos semelhantes na tabela abaixo.
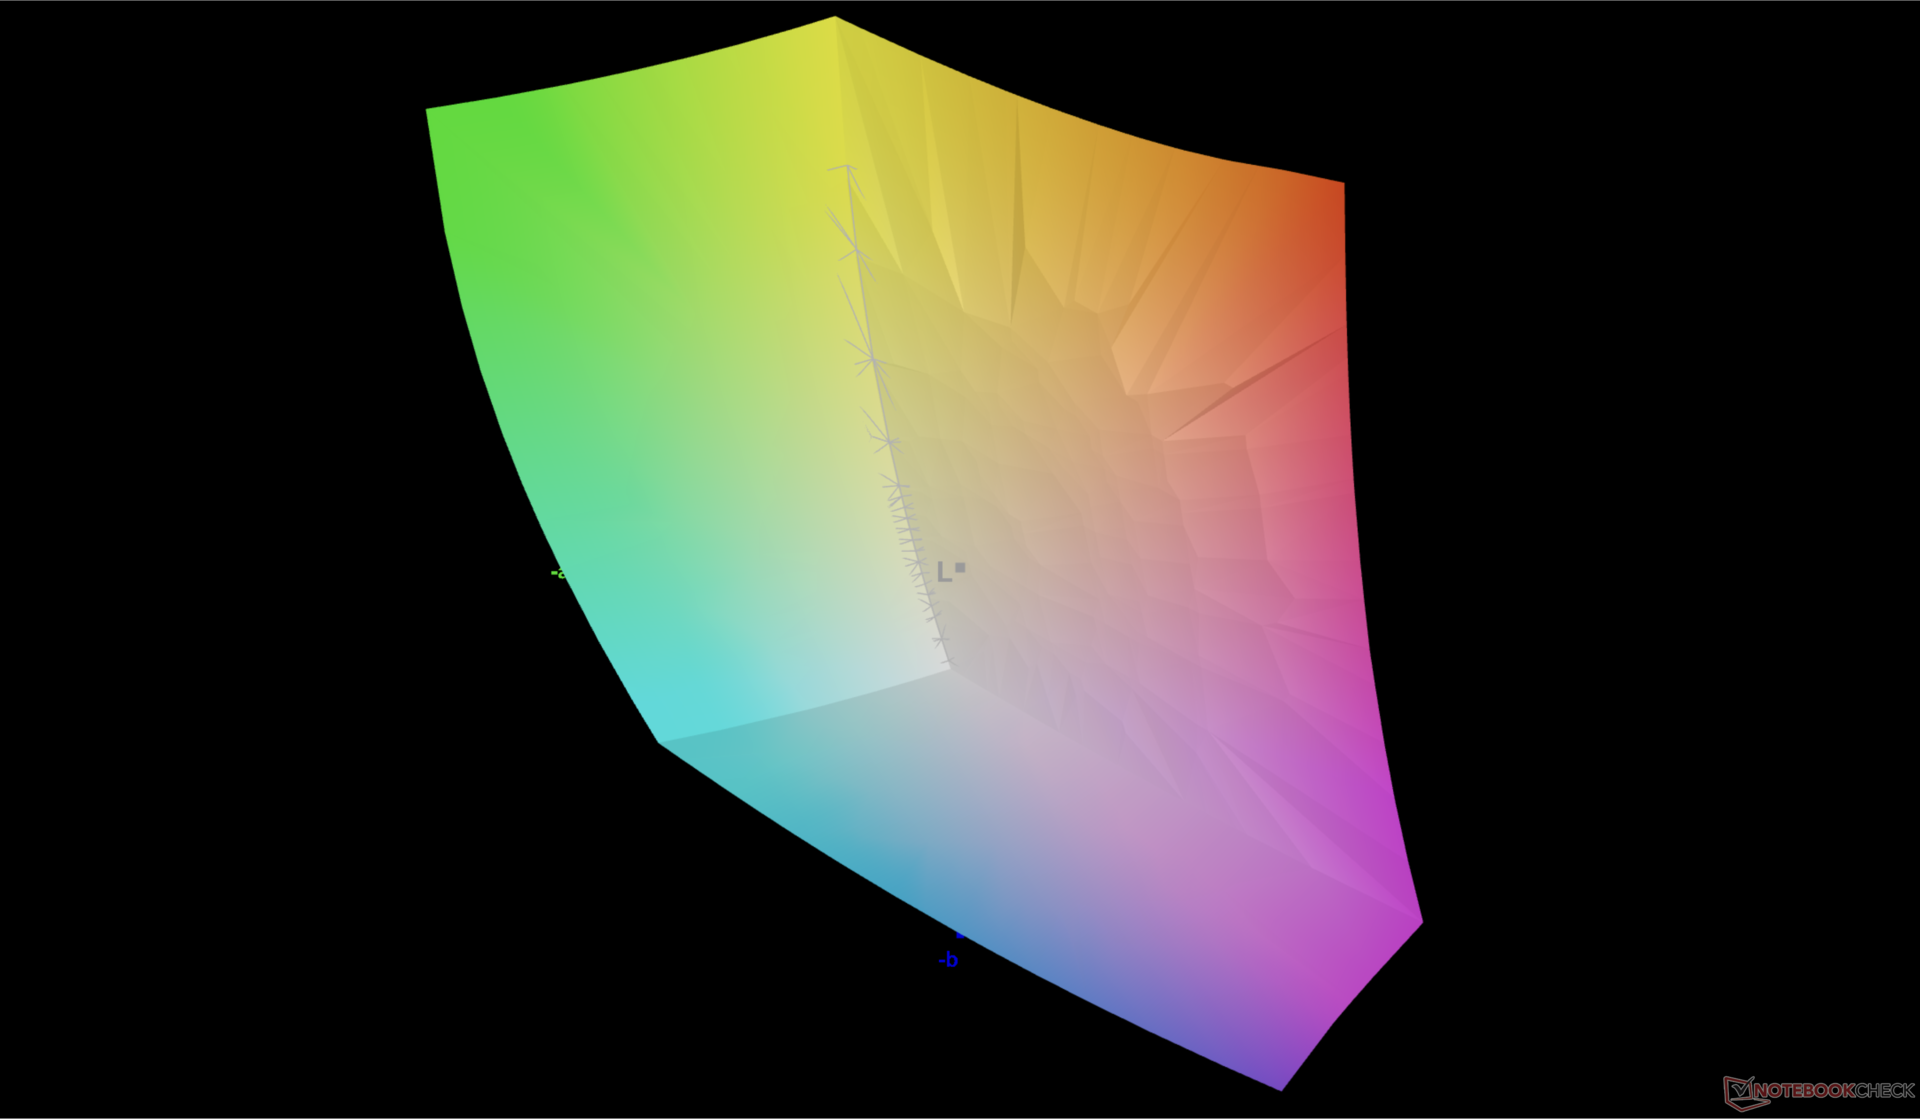
Nosso painel IPS 4K específico é uma oferta de ponta com suas cores P3 amplas e bons tempos de resposta em preto-branco e cinza-cinza, sendo adequado tanto para a criação de conteúdo quanto para aplicativos de jogos. No entanto, a sobreposição fosca não é tão nítida quanto uma alternativa brilhante e a taxa de contraste é limitada a apenas ~1000:1. Felizmente, a HP oferece uma opção OLED para resolver diretamente essas duas deficiências.
| |||||||||||||||||||||||||
iluminação: 83 %
iluminação com acumulador: 451.7 cd/m²
Contraste: 931:1 (Preto: 0.57 cd/m²)
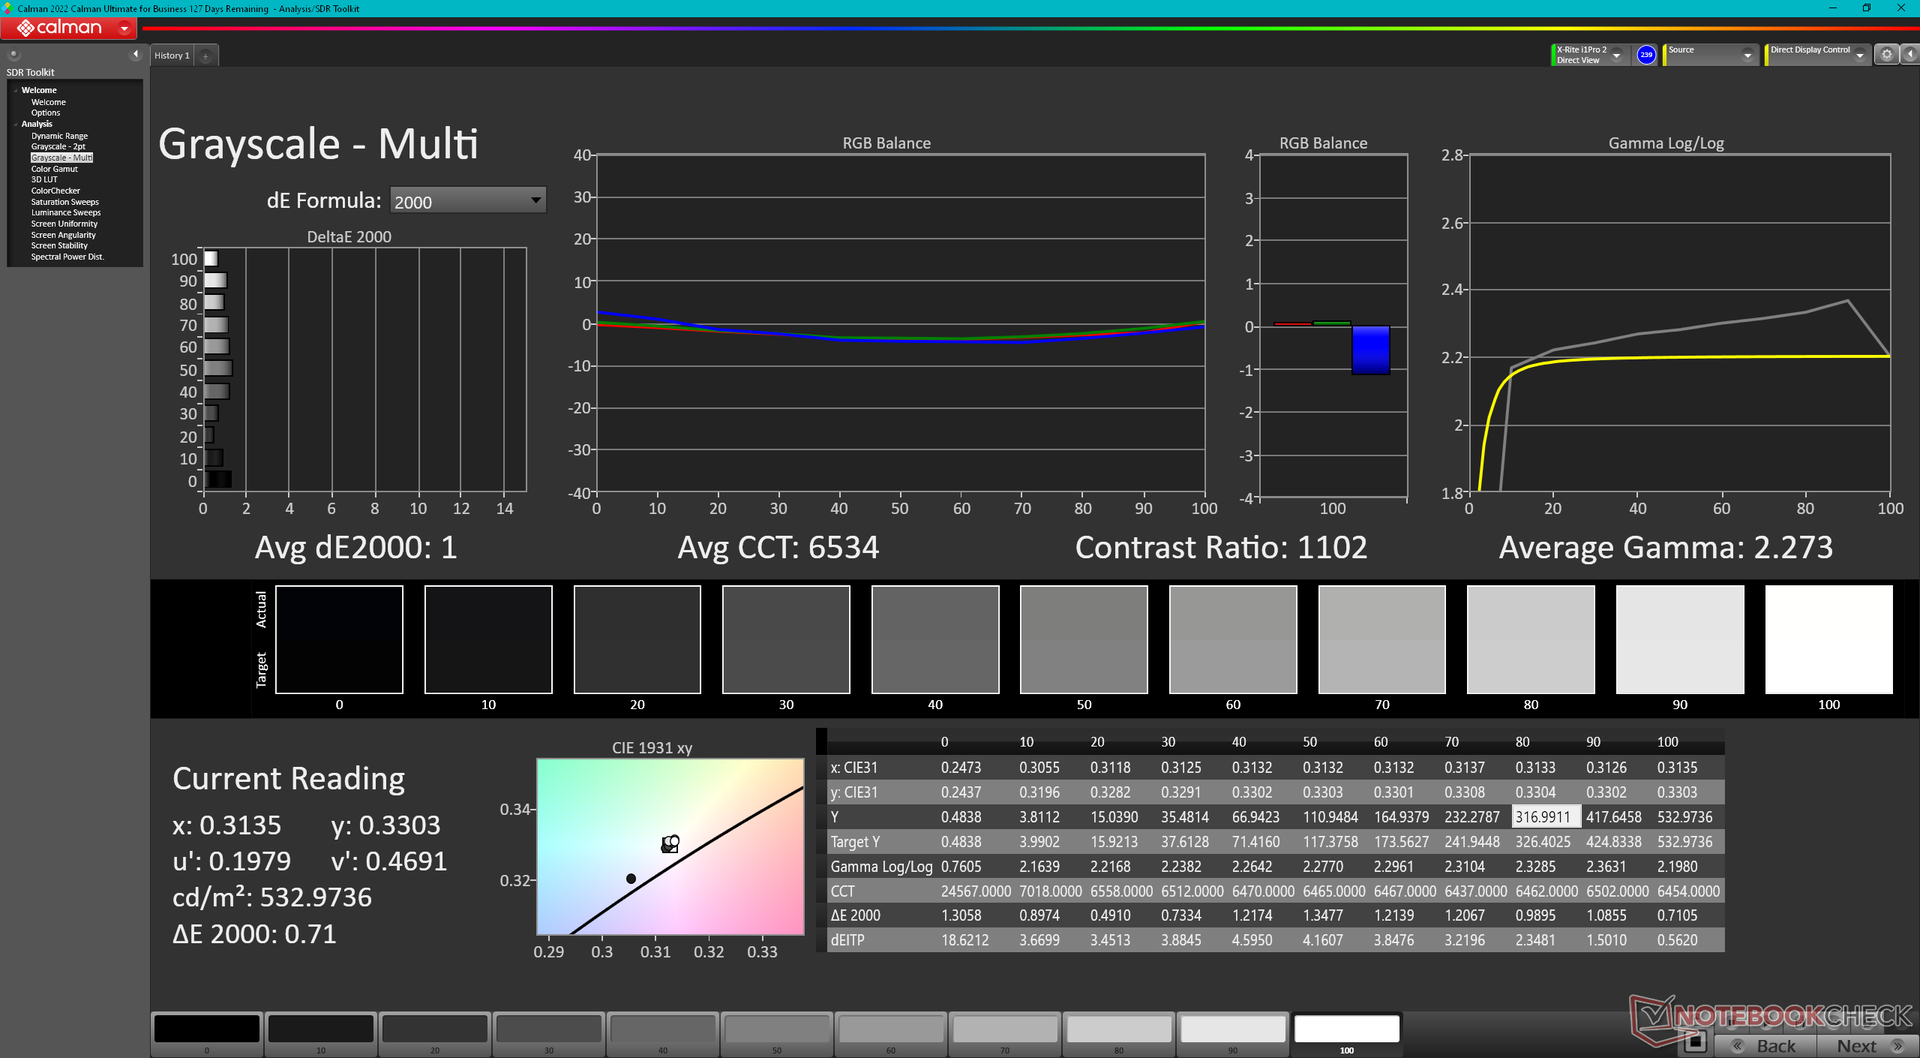
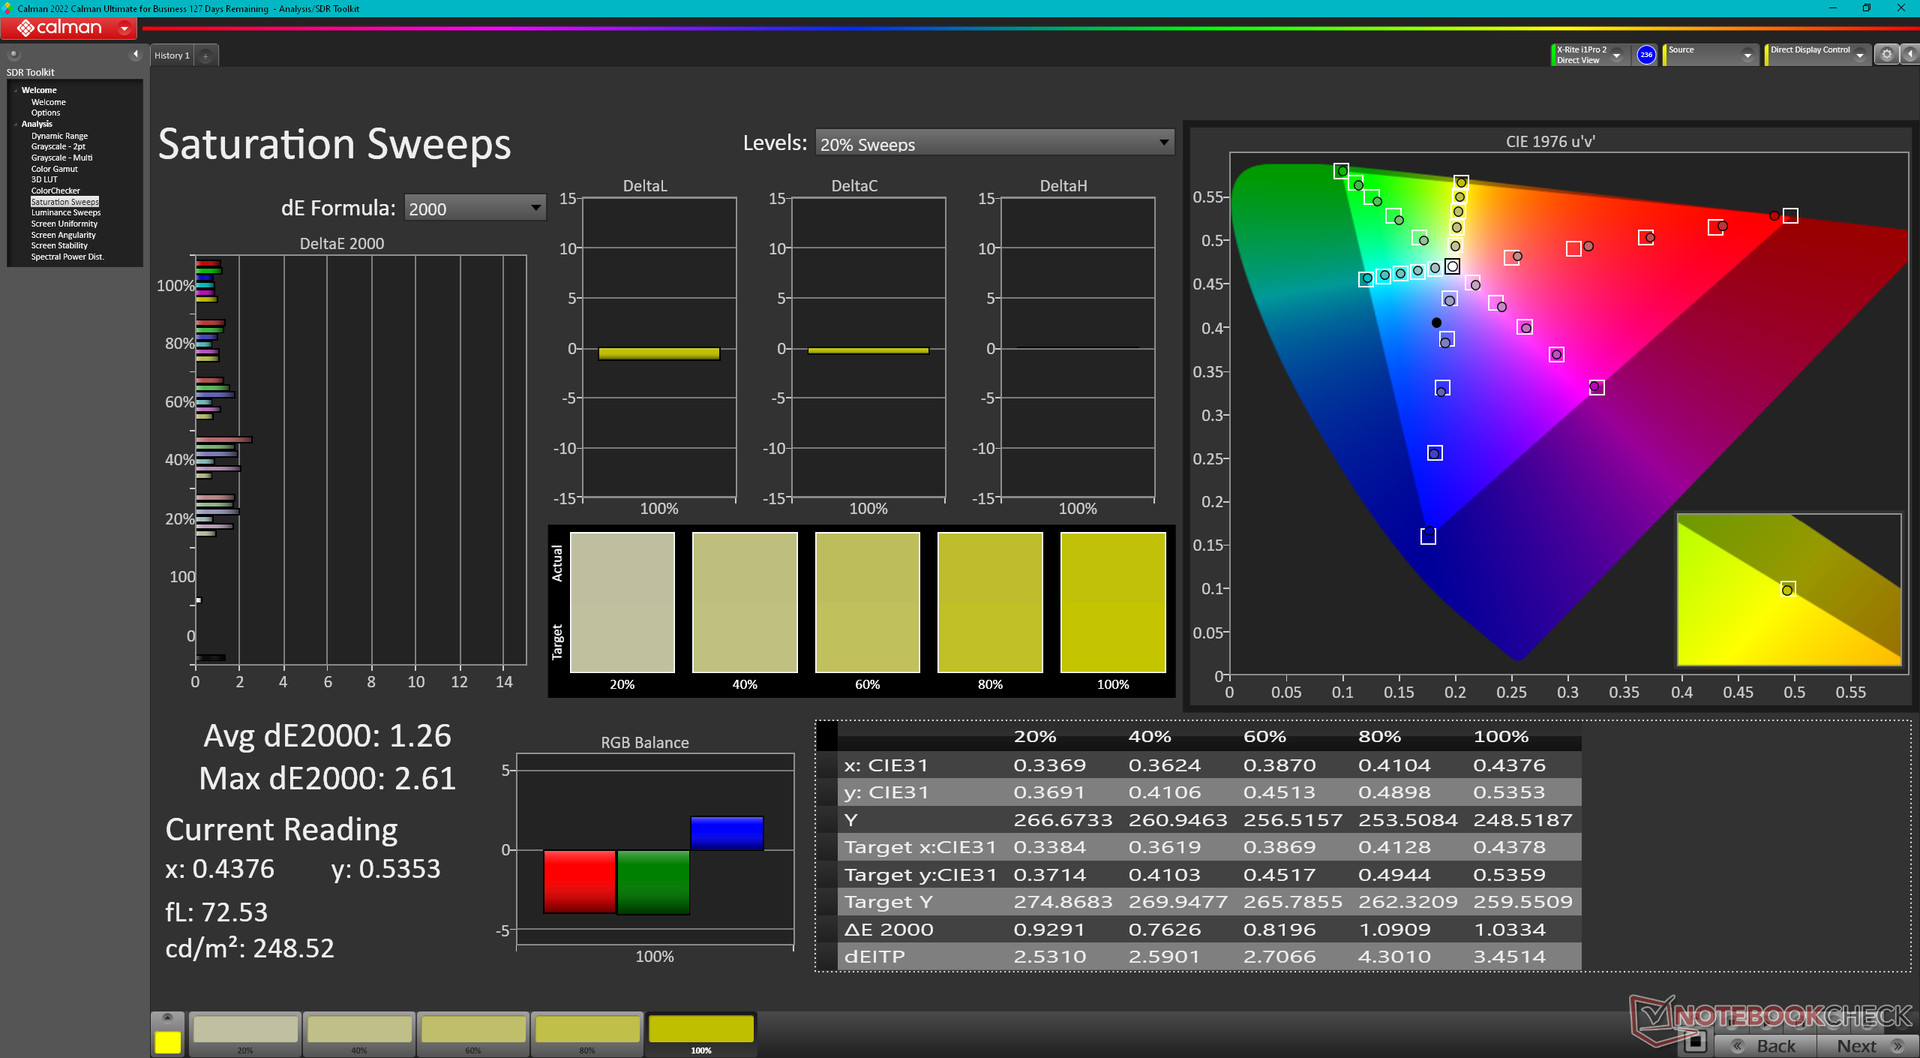
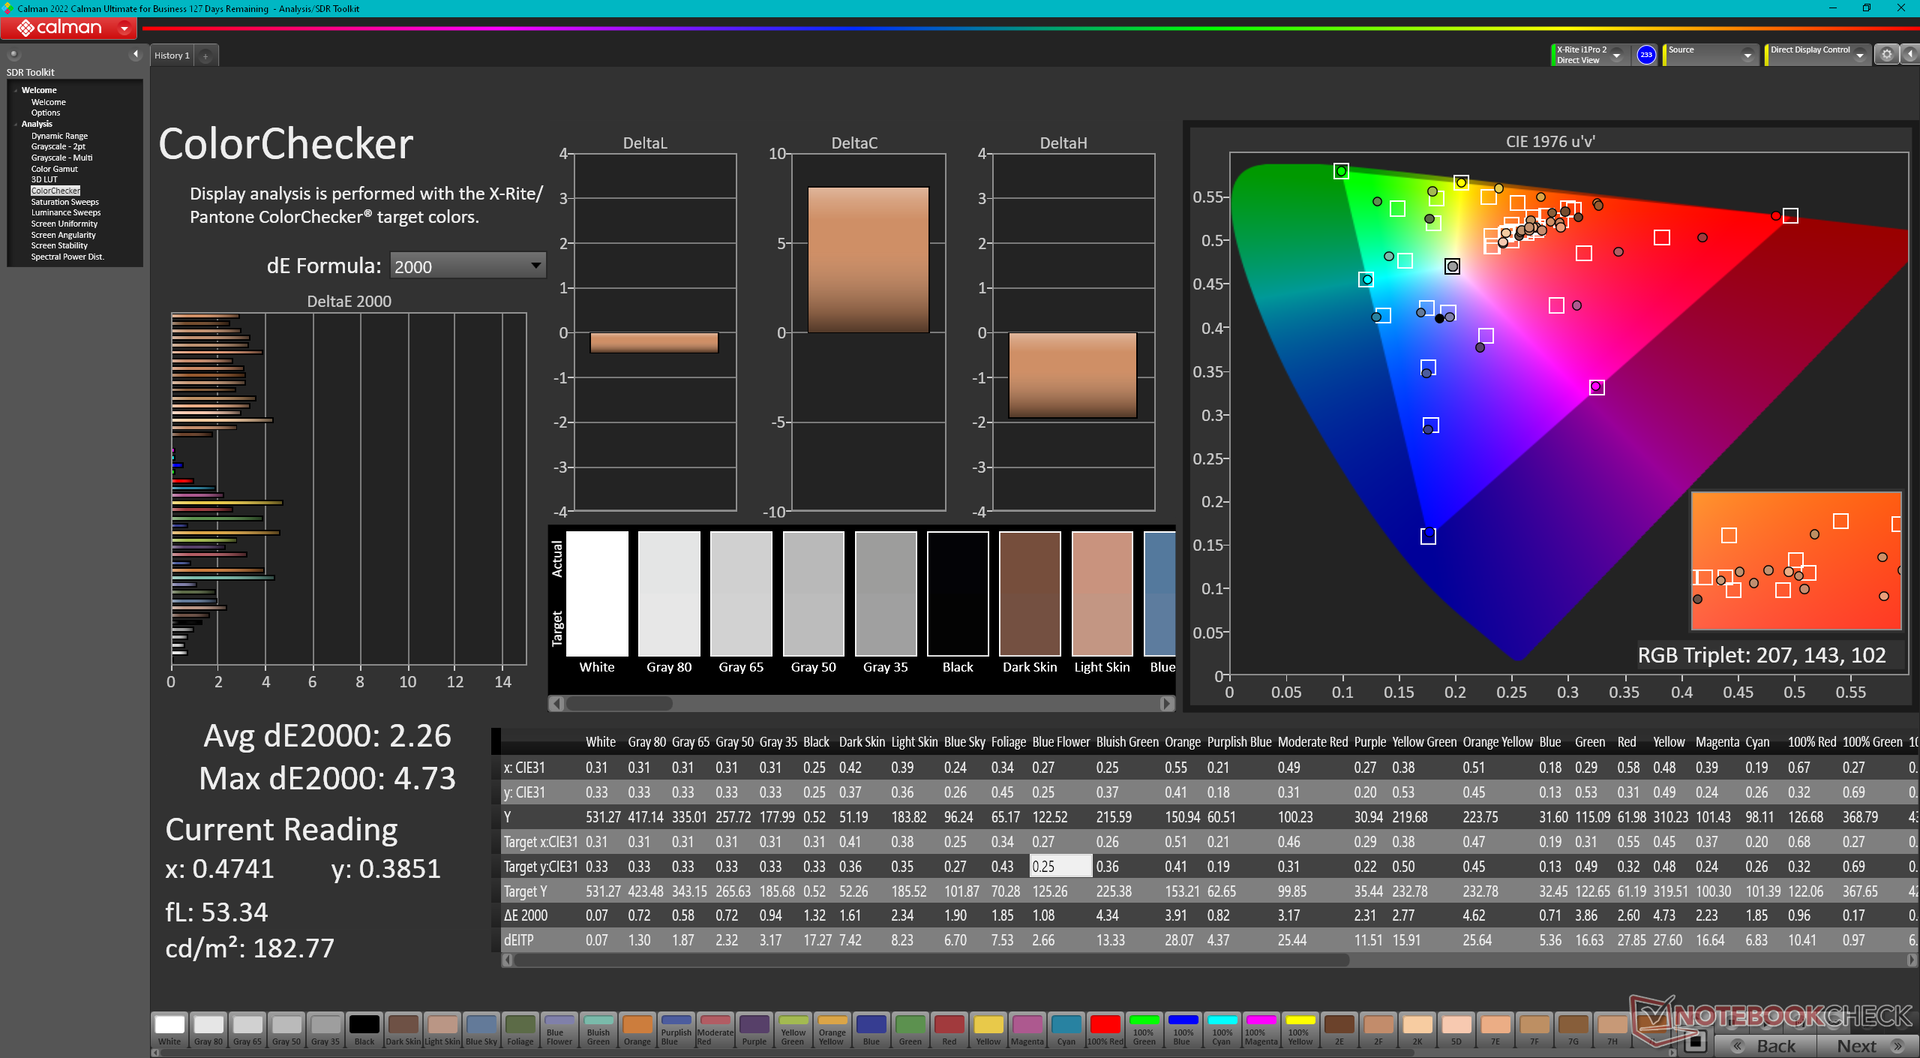
ΔE ColorChecker Calman: 2.26 | ∀{0.5-29.43 Ø4.71}
calibrated: 4.73
ΔE Greyscale Calman: 1 | ∀{0.09-98 Ø4.96}
86.3% AdobeRGB 1998 (Argyll 3D)
99.9% sRGB (Argyll 3D)
97.4% Display P3 (Argyll 3D)
Gamma: 2.28
CCT: 6543 K
| HP ZBook Fury 16 G9 BOE0A52, IPS, 3840x2400, 16" | HP ZBook Studio 16 G9 62U04EA BOE0A52, IPS, 3840x2400, 16" | HP ZBook Firefly 16 G9-6B897EA BOE0A02, IPS, 1920x1200, 16" | Lenovo ThinkPad P16 G1 RTX A5500 LP160UQ1-SPB1, IPS, 3840x2400, 16" | Dell Precision 7000 7670 Performance Samsung 160YV03, OLED, 3840x2400, 16" | MSI CreatorPro Z16P B12UKST B160QAN02.N, IPS, 2560x1600, 16" | |
|---|---|---|---|---|---|---|
| Display | 0% | -18% | -2% | 6% | 0% | |
| Display P3 Coverage (%) | 97.4 | 97.5 0% | 68.1 -30% | 82.9 -15% | 99.9 3% | 97.6 0% |
| sRGB Coverage (%) | 99.9 | 99.9 0% | 96.1 -4% | 98.9 -1% | 100 0% | 99.9 0% |
| AdobeRGB 1998 Coverage (%) | 86.3 | 86.3 0% | 70 -19% | 95.9 11% | 98.1 14% | 87.4 1% |
| Response Times | 9% | -206% | -281% | 83% | 11% | |
| Response Time Grey 50% / Grey 80% * (ms) | 13.7 ? | 15.3 ? -12% | 52.8 ? -285% | 45.6 ? -233% | 1.84 ? 87% | 12.8 ? 7% |
| Response Time Black / White * (ms) | 8.6 ? | 6.1 ? 29% | 19.5 ? -127% | 36.8 ? -328% | 1.92 ? 78% | 7.4 ? 14% |
| PWM Frequency (Hz) | 59.52 ? | |||||
| Screen | 18% | -40% | -12% | -61% | 5% | |
| Brightness middle (cd/m²) | 530.5 | 554 4% | 526 -1% | 601.9 13% | 325.2 -39% | 407 -23% |
| Brightness (cd/m²) | 476 | 516 8% | 499 5% | 569 20% | 328 -31% | 388 -18% |
| Brightness Distribution (%) | 83 | 84 1% | 93 12% | 77 -7% | 97 17% | 88 6% |
| Black Level * (cd/m²) | 0.57 | 0.47 18% | 0.31 46% | 0.47 18% | 0.36 37% | |
| Contrast (:1) | 931 | 1179 27% | 1697 82% | 1281 38% | 1131 21% | |
| Colorchecker dE 2000 * | 2.26 | 1 56% | 3.6 -59% | 2.45 -8% | 4.59 -103% | 1.3 42% |
| Colorchecker dE 2000 calibrated * | 4.73 | 0.6 87% | 2.6 45% | 0.7 85% | ||
| Greyscale dE 2000 * | 1 | 1.6 -60% | 5.5 -450% | 2.6 -160% | 2.5 -150% | 2.1 -110% |
| Gamma | 2.28 96% | 2.29 96% | 2.02 109% | 2.3 96% | 2.1 105% | 2.26 97% |
| CCT | 6543 99% | 6458 101% | 6527 100% | 6805 96% | 6541 99% | 6437 101% |
| Colorchecker dE 2000 max. * | 2.4 | 6.6 | 4.46 | 7.65 | 2.5 | |
| Média Total (Programa/Configurações) | 9% /
12% | -88% /
-60% | -98% /
-54% | 9% /
-12% | 5% /
5% |
* ... menor é melhor
A tela é calibrada imediatamente de acordo com o padrão P3, com valores DeltaE médios de escala de cinza e cor de apenas 1,0 e 2,26, respectivamente.
Exibir tempos de resposta
| ↔ Tempo de resposta preto para branco | ||
|---|---|---|
| 8.6 ms ... ascensão ↗ e queda ↘ combinadas | ↗ 4.7 ms ascensão | 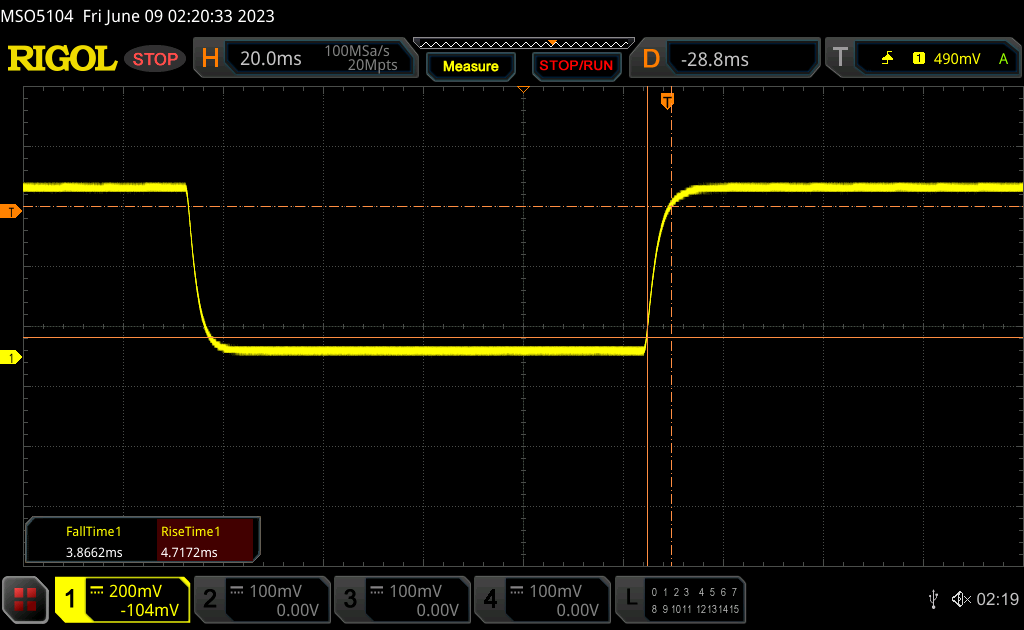 |
| ↘ 3.9 ms queda | ||
| A tela mostra taxas de resposta rápidas em nossos testes e deve ser adequada para jogos. Em comparação, todos os dispositivos testados variam de 0.1 (mínimo) a 240 (máximo) ms. » 24 % de todos os dispositivos são melhores. Isso significa que o tempo de resposta medido é melhor que a média de todos os dispositivos testados (19.8 ms). | ||
| ↔ Tempo de resposta 50% cinza a 80% cinza | ||
| 13.7 ms ... ascensão ↗ e queda ↘ combinadas | ↗ 6.6 ms ascensão | 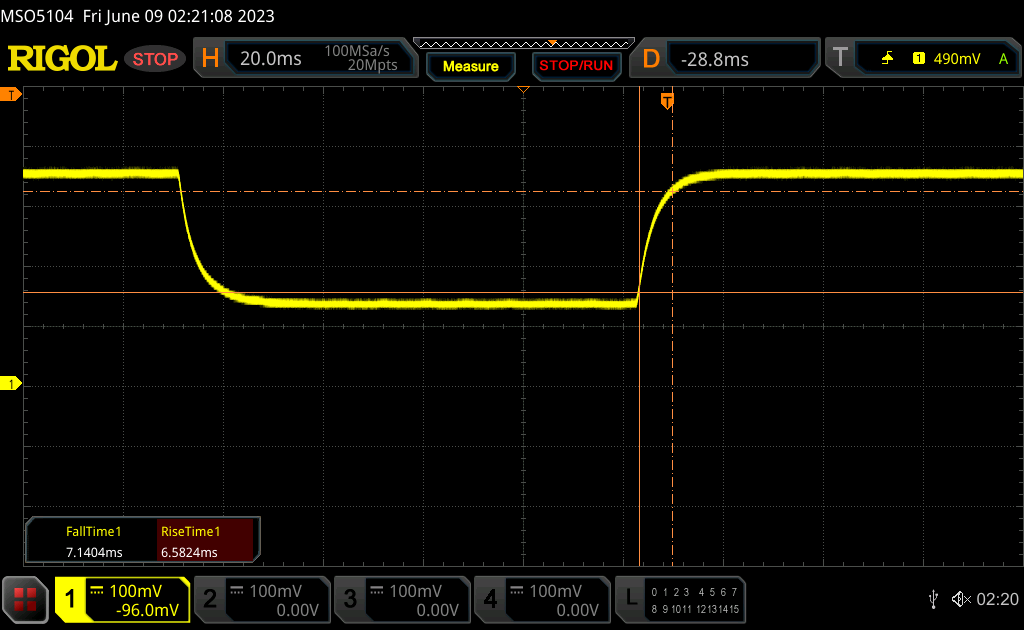 |
| ↘ 7.1 ms queda | ||
| A tela mostra boas taxas de resposta em nossos testes, mas pode ser muito lenta para jogadores competitivos. Em comparação, todos os dispositivos testados variam de 0.165 (mínimo) a 636 (máximo) ms. » 28 % de todos os dispositivos são melhores. Isso significa que o tempo de resposta medido é melhor que a média de todos os dispositivos testados (31 ms). | ||
Cintilação da tela / PWM (modulação por largura de pulso)
| Tela tremeluzindo / PWM não detectado |  | ||
[pwm_comparison] Em comparação: 52 % de todos os dispositivos testados não usam PWM para escurecer a tela. Se PWM foi detectado, uma média de 7757 (mínimo: 5 - máximo: 343500) Hz foi medida. | |||
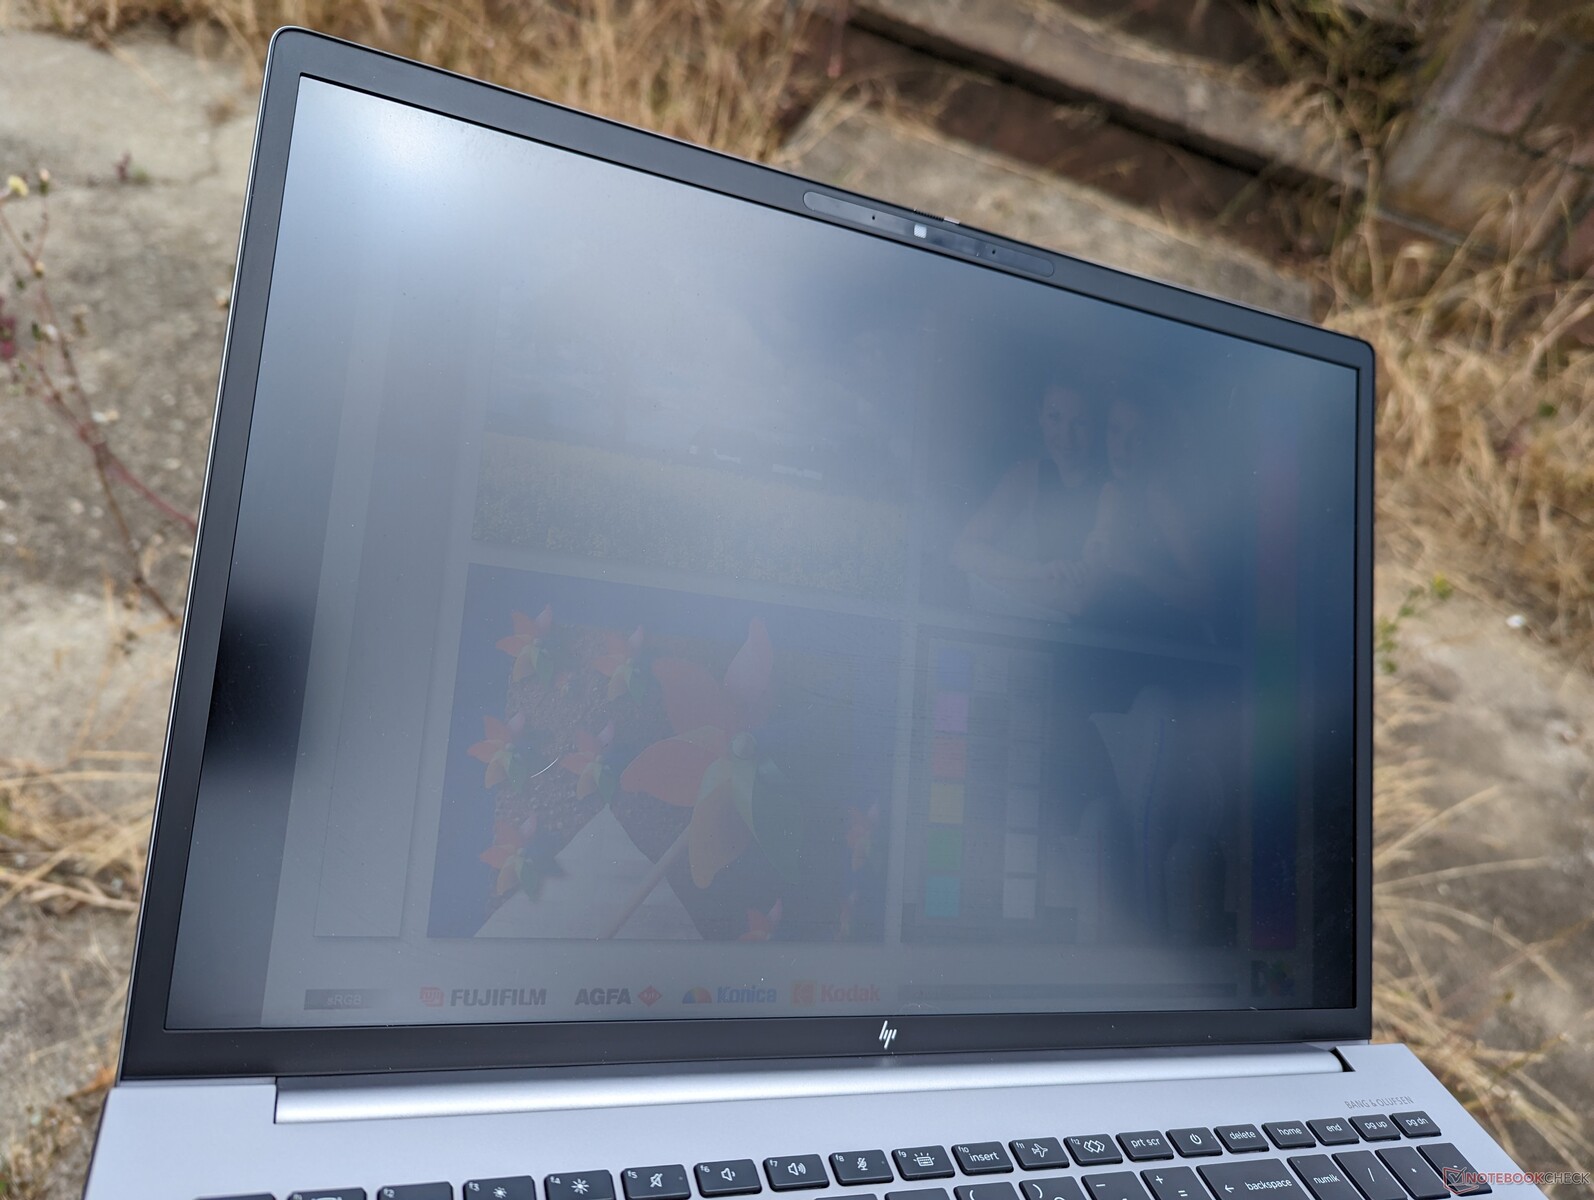
A visibilidade em ambientes externos é decente sob a sombra e comparável à de muitos Ultrabooks de consumo, já que 400 nits é um objetivo comum. A HP oferece uma opção muito mais brilhante de 1000 nits se a visibilidade externa for uma prioridade, mas os painéis estão limitados a IPS e a uma resolução de apenas 1920 x 1200 por enquanto.
Vale a pena observar que a Economia de energia da tela está ativada por padrão, o que significa que o brilho máximo da tela cairá em até 80 nits se estiver funcionando com a bateria. Para evitar isso, inicie o Intel Graphics Command Center e vá para os submenus System e Power para desativar o Display Power Savings.
Desempenho - Intel Alder Lake-H de 12ª geração com Nvidia RTX Ampere
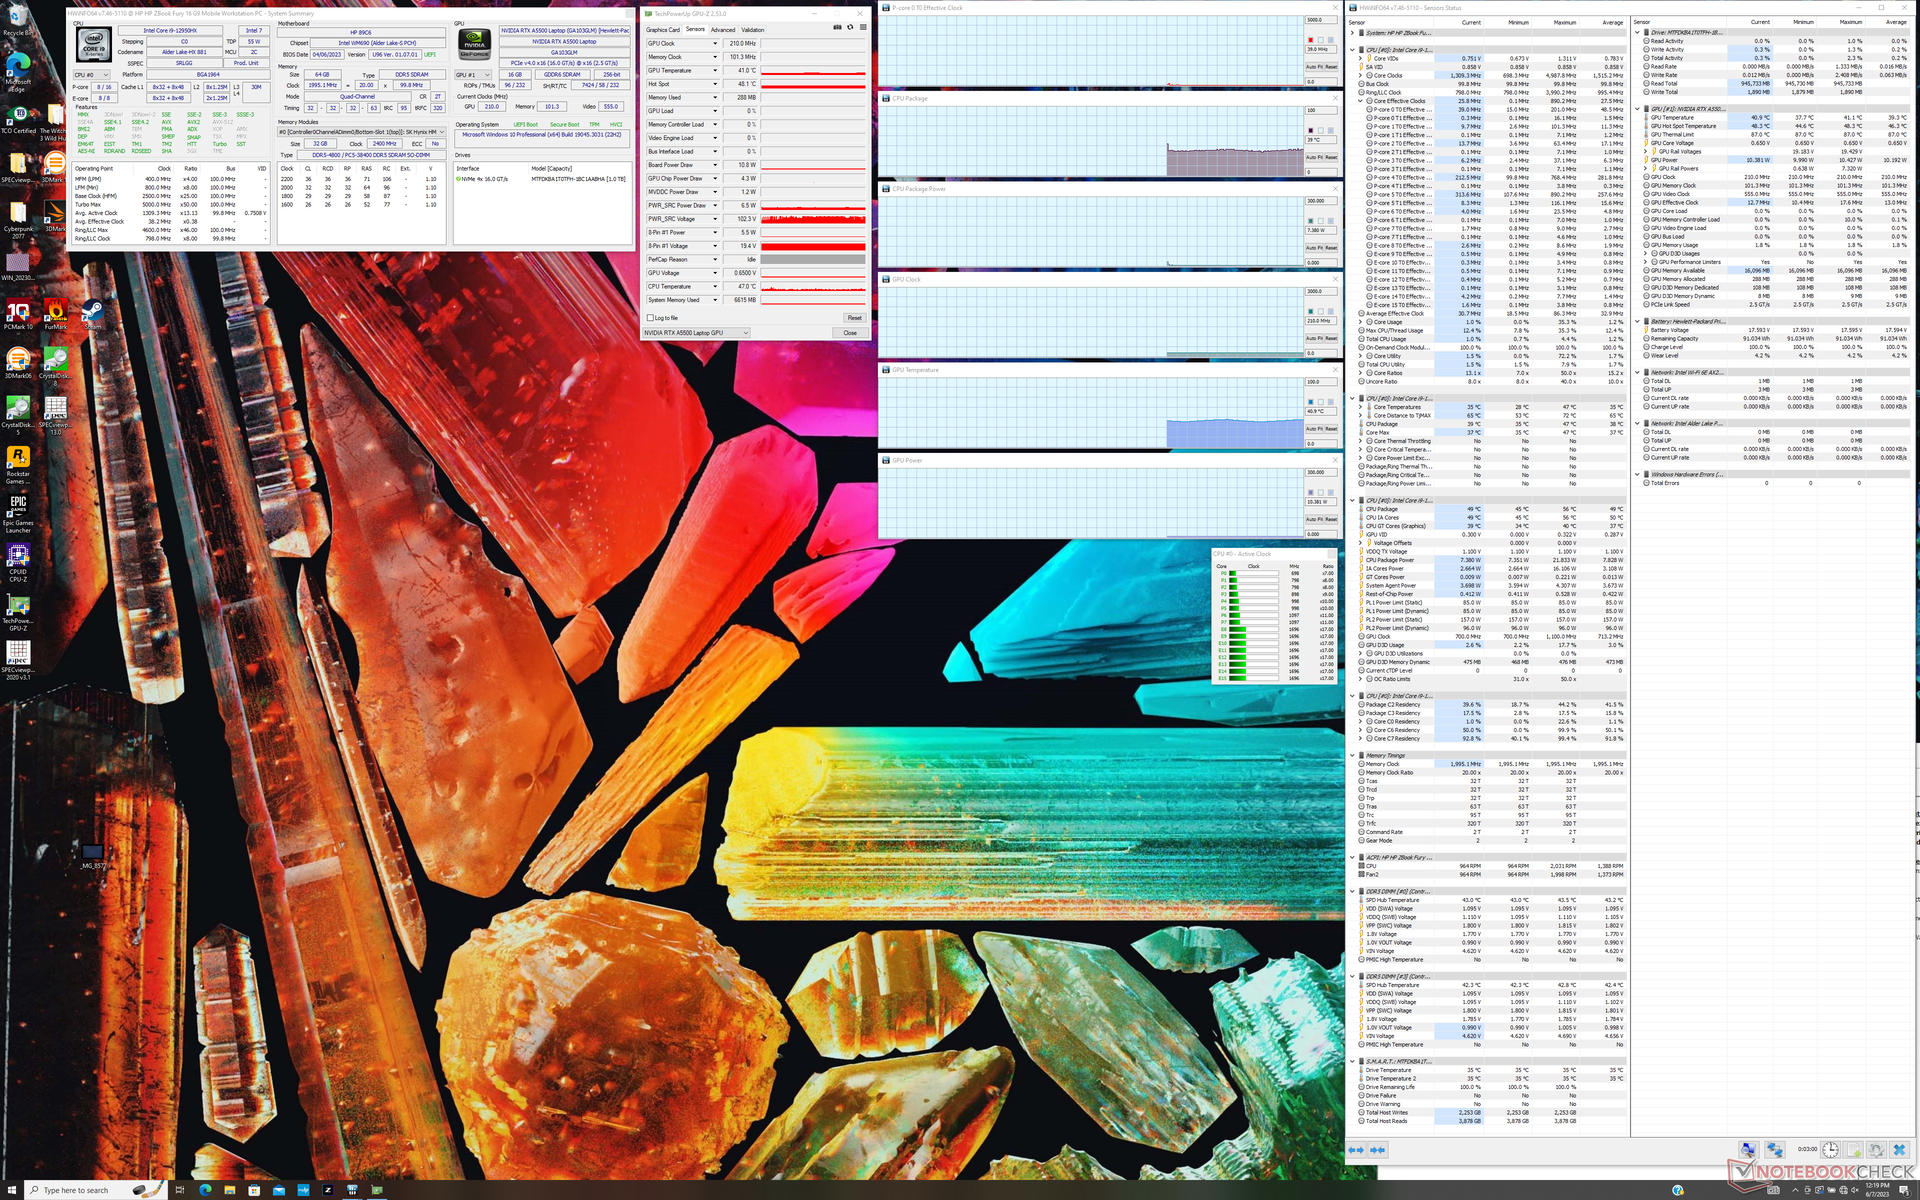
Condições de teste
Colocamos nossa unidade no modo Desempenho antes de executar os benchmarks abaixo. A HP não tem perfis de energia adicionais além dos perfis padrão do Windows e recursos avançados como Optimus 2.0 ou MUX não são suportados.
Recomenda-se que os usuários se familiarizem com o MyHP e o Z Light Space para obter atualizações de software específicas da HP e configurações de teclado RGB, respectivamente.
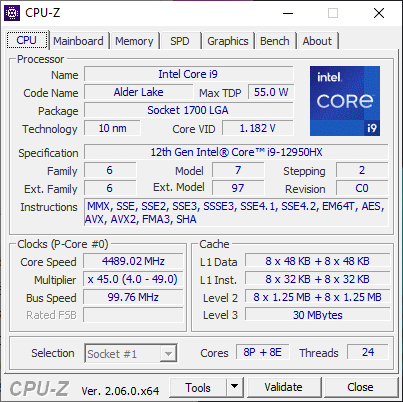
Processador
O processador de 12ª geração Core i9-12950HX foi uma das CPUs móveis mais rápidas disponíveis com suporte a vPro e ECC até o lançamento da 13ª geração do Core i9-13950HX. Para as opções de 13ª geração, o Fury 16 G10 começou a ser comercializado recentemente.
O processador do nosso HP tem um desempenho ligeiramente inferior em cerca de 5% quando comparado ao laptop médio do nosso banco de dados equipado com a mesma CPU Core i9-12950HX. Pior ainda, a CPU parece apresentar uma aceleração mais acentuada quando submetida a longos períodos de estresse. Ao executar o CineBench R15 xT em um loop, por exemplo, o desempenho cairia em cerca de 20% após o sétimo ou oitavo loop. O ThinkPad P16 G1 experimenta um grau mais raso de estrangulamento da CPU, conforme mostrado em nosso gráfico de comparação abaixo.
Espera-se que o downgrade para a configuração Core i7-12850HX do nosso Core i9-12950HX afete os desempenhos single- e multi-thread em cerca de 15 a 20%.
Cinebench R15 Multi Loop
Cinebench R23: Multi Core | Single Core
Cinebench R20: CPU (Multi Core) | CPU (Single Core)
Cinebench R15: CPU Multi 64Bit | CPU Single 64Bit
Blender: v2.79 BMW27 CPU
7-Zip 18.03: 7z b 4 | 7z b 4 -mmt1
Geekbench 5.5: Multi-Core | Single-Core
HWBOT x265 Benchmark v2.2: 4k Preset
LibreOffice : 20 Documents To PDF
R Benchmark 2.5: Overall mean
* ... menor é melhor
AIDA64: FP32 Ray-Trace | FPU Julia | CPU SHA3 | CPU Queen | FPU SinJulia | FPU Mandel | CPU AES | CPU ZLib | FP64 Ray-Trace | CPU PhotoWorxx
| Performance rating | |
| Média Intel Core i9-12950HX | |
| Lenovo ThinkPad P16 G1 RTX A5500 | |
| HP ZBook Fury 16 G9 | |
| MSI CreatorPro Z16P B12UKST | |
| HP ZBook Studio 16 G9 62U04EA | |
| Dell Precision 7000 7670 Performance | |
| HP ZBook Firefly 16 G9-6B897EA | |
| AIDA64 / FP32 Ray-Trace | |
| Lenovo ThinkPad P16 G1 RTX A5500 | |
| Média Intel Core i9-12950HX (15499 - 22868, n=7) | |
| HP ZBook Fury 16 G9 | |
| Dell Precision 7000 7670 Performance | |
| HP ZBook Studio 16 G9 62U04EA | |
| MSI CreatorPro Z16P B12UKST | |
| HP ZBook Firefly 16 G9-6B897EA | |
| AIDA64 / FPU Julia | |
| HP ZBook Fury 16 G9 | |
| Lenovo ThinkPad P16 G1 RTX A5500 | |
| Média Intel Core i9-12950HX (77846 - 115907, n=7) | |
| HP ZBook Studio 16 G9 62U04EA | |
| Dell Precision 7000 7670 Performance | |
| MSI CreatorPro Z16P B12UKST | |
| HP ZBook Firefly 16 G9-6B897EA | |
| AIDA64 / CPU SHA3 | |
| Lenovo ThinkPad P16 G1 RTX A5500 | |
| Média Intel Core i9-12950HX (3426 - 5069, n=7) | |
| HP ZBook Fury 16 G9 | |
| HP ZBook Studio 16 G9 62U04EA | |
| MSI CreatorPro Z16P B12UKST | |
| Dell Precision 7000 7670 Performance | |
| HP ZBook Firefly 16 G9-6B897EA | |
| AIDA64 / CPU Queen | |
| HP ZBook Studio 16 G9 62U04EA | |
| Média Intel Core i9-12950HX (102752 - 104726, n=7) | |
| Lenovo ThinkPad P16 G1 RTX A5500 | |
| Dell Precision 7000 7670 Performance | |
| HP ZBook Fury 16 G9 | |
| MSI CreatorPro Z16P B12UKST | |
| HP ZBook Firefly 16 G9-6B897EA | |
| AIDA64 / FPU SinJulia | |
| Lenovo ThinkPad P16 G1 RTX A5500 | |
| HP ZBook Fury 16 G9 | |
| Média Intel Core i9-12950HX (10134 - 12823, n=7) | |
| Dell Precision 7000 7670 Performance | |
| HP ZBook Studio 16 G9 62U04EA | |
| MSI CreatorPro Z16P B12UKST | |
| HP ZBook Firefly 16 G9-6B897EA | |
| AIDA64 / FPU Mandel | |
| HP ZBook Fury 16 G9 | |
| Lenovo ThinkPad P16 G1 RTX A5500 | |
| Média Intel Core i9-12950HX (37146 - 57340, n=7) | |
| HP ZBook Studio 16 G9 62U04EA | |
| Dell Precision 7000 7670 Performance | |
| MSI CreatorPro Z16P B12UKST | |
| HP ZBook Firefly 16 G9-6B897EA | |
| AIDA64 / CPU ZLib | |
| Lenovo ThinkPad P16 G1 RTX A5500 | |
| HP ZBook Fury 16 G9 | |
| Média Intel Core i9-12950HX (996 - 1417, n=7) | |
| HP ZBook Studio 16 G9 62U04EA | |
| MSI CreatorPro Z16P B12UKST | |
| Dell Precision 7000 7670 Performance | |
| HP ZBook Firefly 16 G9-6B897EA | |
| AIDA64 / FP64 Ray-Trace | |
| Lenovo ThinkPad P16 G1 RTX A5500 | |
| Média Intel Core i9-12950HX (8455 - 12432, n=7) | |
| HP ZBook Fury 16 G9 | |
| HP ZBook Studio 16 G9 62U04EA | |
| Dell Precision 7000 7670 Performance | |
| MSI CreatorPro Z16P B12UKST | |
| HP ZBook Firefly 16 G9-6B897EA | |
| AIDA64 / CPU PhotoWorxx | |
| MSI CreatorPro Z16P B12UKST | |
| Dell Precision 7000 7670 Performance | |
| Média Intel Core i9-12950HX (35479 - 42655, n=7) | |
| Lenovo ThinkPad P16 G1 RTX A5500 | |
| HP ZBook Fury 16 G9 | |
| HP ZBook Studio 16 G9 62U04EA | |
| HP ZBook Firefly 16 G9-6B897EA | |
Desempenho do sistema
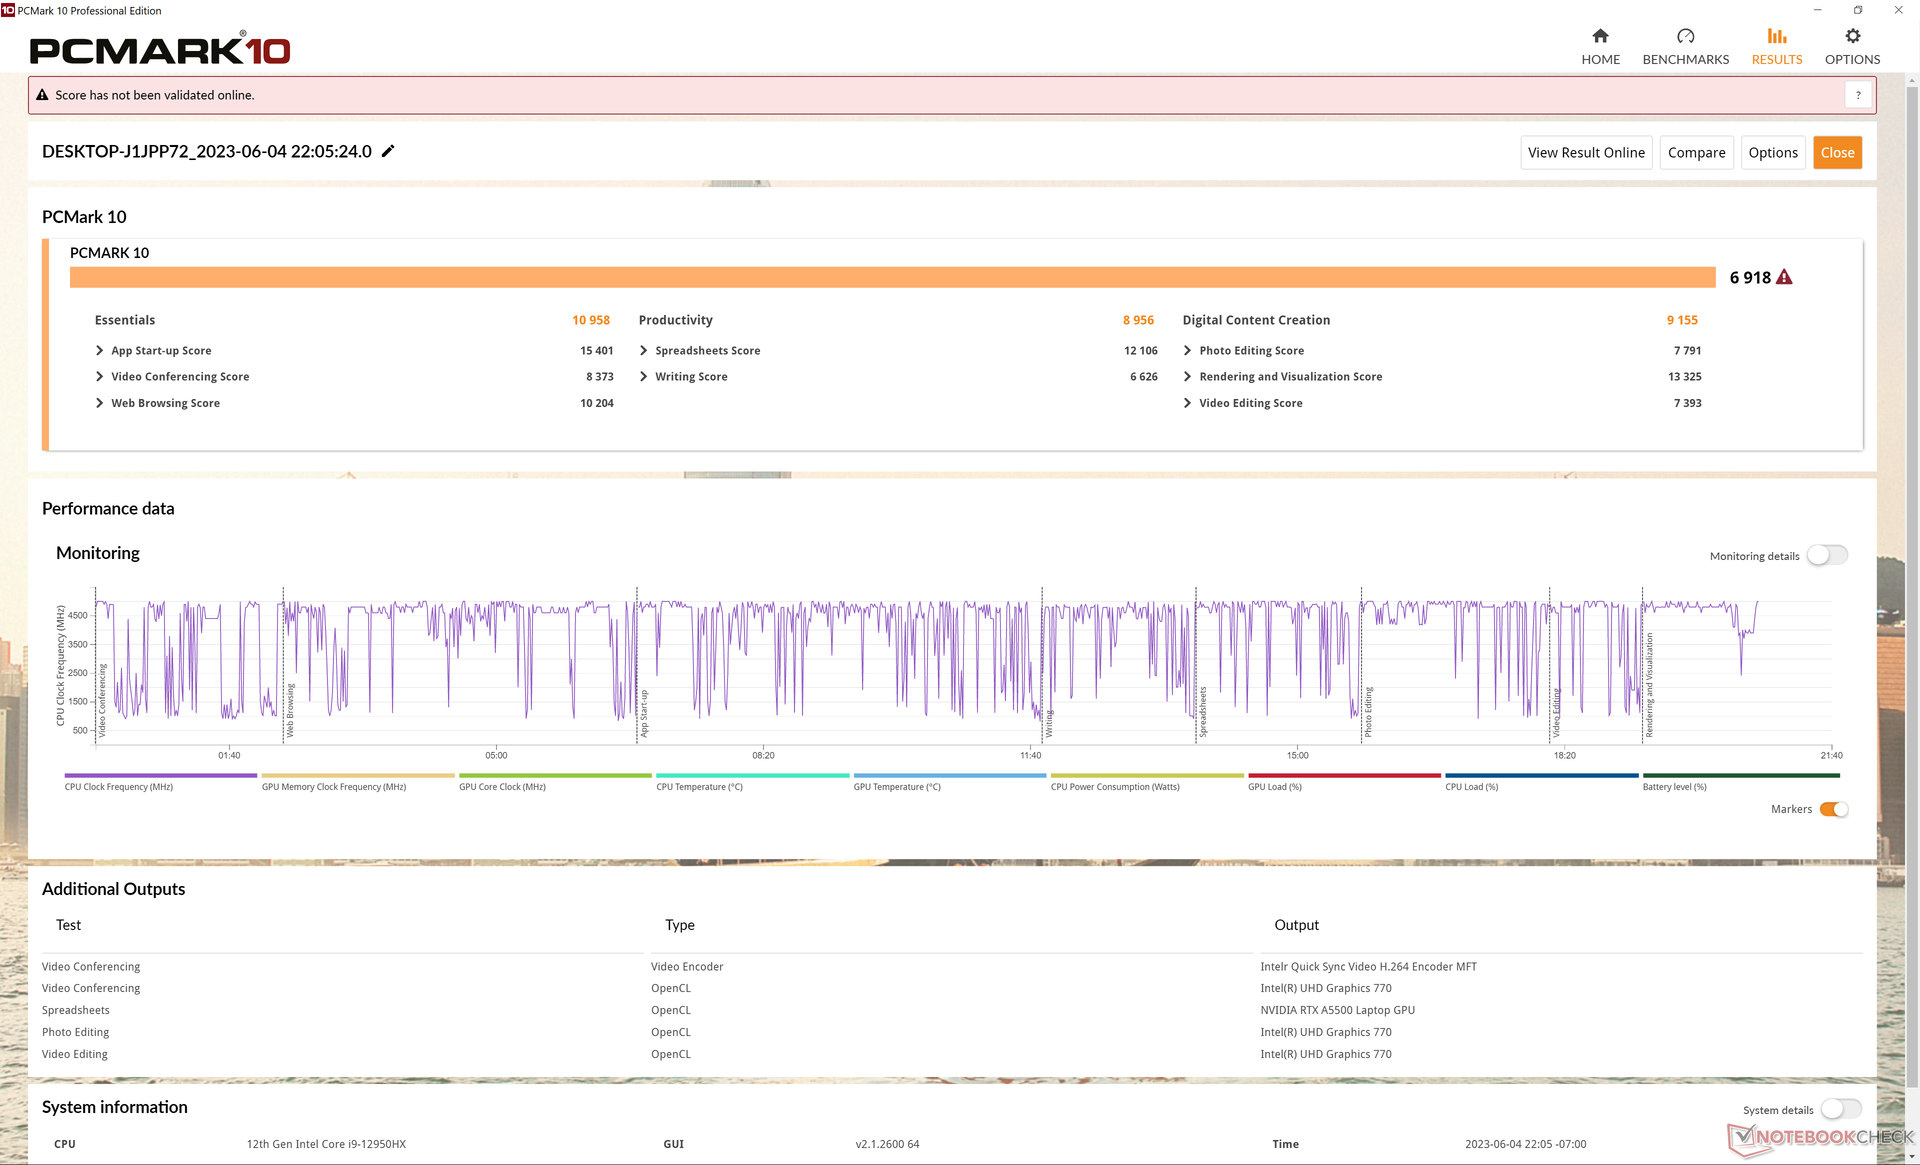
Os resultados do PCMark são comparáveis aos do Dell Precision 7670 e do Lenovo ThinkPad P16 G1. Observe a vantagem significativa sobre o menor ZBook Firefly 16 G9 no subteste Criação de conteúdo digital devido à GPU RTX A5500 mais rápida em nosso Fury 16 G9.
CrossMark: Overall | Productivity | Creativity | Responsiveness
| PCMark 10 / Score | |
| Lenovo ThinkPad P16 G1 RTX A5500 | |
| MSI CreatorPro Z16P B12UKST | |
| Média Intel Core i9-12950HX, NVIDIA RTX A5500 Laptop GPU (6883 - 7236, n=3) | |
| HP ZBook Fury 16 G9 | |
| Dell Precision 7000 7670 Performance | |
| HP ZBook Studio 16 G9 62U04EA | |
| HP ZBook Firefly 16 G9-6B897EA | |
| PCMark 10 / Essentials | |
| Dell Precision 7000 7670 Performance | |
| Média Intel Core i9-12950HX, NVIDIA RTX A5500 Laptop GPU (10898 - 11465, n=3) | |
| HP ZBook Fury 16 G9 | |
| Lenovo ThinkPad P16 G1 RTX A5500 | |
| MSI CreatorPro Z16P B12UKST | |
| HP ZBook Firefly 16 G9-6B897EA | |
| HP ZBook Studio 16 G9 62U04EA | |
| PCMark 10 / Productivity | |
| Lenovo ThinkPad P16 G1 RTX A5500 | |
| MSI CreatorPro Z16P B12UKST | |
| HP ZBook Fury 16 G9 | |
| Média Intel Core i9-12950HX, NVIDIA RTX A5500 Laptop GPU (8054 - 9489, n=3) | |
| HP ZBook Firefly 16 G9-6B897EA | |
| Dell Precision 7000 7670 Performance | |
| HP ZBook Studio 16 G9 62U04EA | |
| PCMark 10 / Digital Content Creation | |
| Lenovo ThinkPad P16 G1 RTX A5500 | |
| MSI CreatorPro Z16P B12UKST | |
| Dell Precision 7000 7670 Performance | |
| Média Intel Core i9-12950HX, NVIDIA RTX A5500 Laptop GPU (9155 - 9944, n=3) | |
| HP ZBook Studio 16 G9 62U04EA | |
| HP ZBook Fury 16 G9 | |
| HP ZBook Firefly 16 G9-6B897EA | |
| CrossMark / Overall | |
| MSI CreatorPro Z16P B12UKST | |
| HP ZBook Fury 16 G9 | |
| Lenovo ThinkPad P16 G1 RTX A5500 | |
| Média Intel Core i9-12950HX, NVIDIA RTX A5500 Laptop GPU (1801 - 1889, n=3) | |
| HP ZBook Studio 16 G9 62U04EA | |
| Dell Precision 7000 7670 Performance | |
| HP ZBook Firefly 16 G9-6B897EA | |
| CrossMark / Productivity | |
| MSI CreatorPro Z16P B12UKST | |
| HP ZBook Fury 16 G9 | |
| Lenovo ThinkPad P16 G1 RTX A5500 | |
| Média Intel Core i9-12950HX, NVIDIA RTX A5500 Laptop GPU (1684 - 1785, n=3) | |
| HP ZBook Studio 16 G9 62U04EA | |
| Dell Precision 7000 7670 Performance | |
| HP ZBook Firefly 16 G9-6B897EA | |
| CrossMark / Creativity | |
| Lenovo ThinkPad P16 G1 RTX A5500 | |
| HP ZBook Fury 16 G9 | |
| Média Intel Core i9-12950HX, NVIDIA RTX A5500 Laptop GPU (2042 - 2192, n=3) | |
| HP ZBook Studio 16 G9 62U04EA | |
| MSI CreatorPro Z16P B12UKST | |
| Dell Precision 7000 7670 Performance | |
| HP ZBook Firefly 16 G9-6B897EA | |
| CrossMark / Responsiveness | |
| MSI CreatorPro Z16P B12UKST | |
| HP ZBook Fury 16 G9 | |
| HP ZBook Studio 16 G9 62U04EA | |
| Média Intel Core i9-12950HX, NVIDIA RTX A5500 Laptop GPU (1501 - 1585, n=3) | |
| Dell Precision 7000 7670 Performance | |
| Lenovo ThinkPad P16 G1 RTX A5500 | |
| HP ZBook Firefly 16 G9-6B897EA | |
| PCMark 10 Score | 6918 pontos | |
Ajuda | ||
| AIDA64 / Memory Copy | |
| Dell Precision 7000 7670 Performance | |
| Média Intel Core i9-12950HX (59731 - 64732, n=7) | |
| Lenovo ThinkPad P16 G1 RTX A5500 | |
| MSI CreatorPro Z16P B12UKST | |
| HP ZBook Studio 16 G9 62U04EA | |
| HP ZBook Fury 16 G9 | |
| HP ZBook Firefly 16 G9-6B897EA | |
| AIDA64 / Memory Read | |
| Dell Precision 7000 7670 Performance | |
| Média Intel Core i9-12950HX (59744 - 70359, n=7) | |
| MSI CreatorPro Z16P B12UKST | |
| HP ZBook Studio 16 G9 62U04EA | |
| Lenovo ThinkPad P16 G1 RTX A5500 | |
| HP ZBook Fury 16 G9 | |
| HP ZBook Firefly 16 G9-6B897EA | |
| AIDA64 / Memory Write | |
| MSI CreatorPro Z16P B12UKST | |
| Dell Precision 7000 7670 Performance | |
| HP ZBook Studio 16 G9 62U04EA | |
| Média Intel Core i9-12950HX (57750 - 67899, n=7) | |
| HP ZBook Firefly 16 G9-6B897EA | |
| Lenovo ThinkPad P16 G1 RTX A5500 | |
| HP ZBook Fury 16 G9 | |
| AIDA64 / Memory Latency | |
| MSI CreatorPro Z16P B12UKST | |
| HP ZBook Fury 16 G9 | |
| Lenovo ThinkPad P16 G1 RTX A5500 | |
| HP ZBook Firefly 16 G9-6B897EA | |
| HP ZBook Studio 16 G9 62U04EA | |
| Média Intel Core i9-12950HX (84.5 - 92.2, n=7) | |
| Dell Precision 7000 7670 Performance | |
* ... menor é melhor
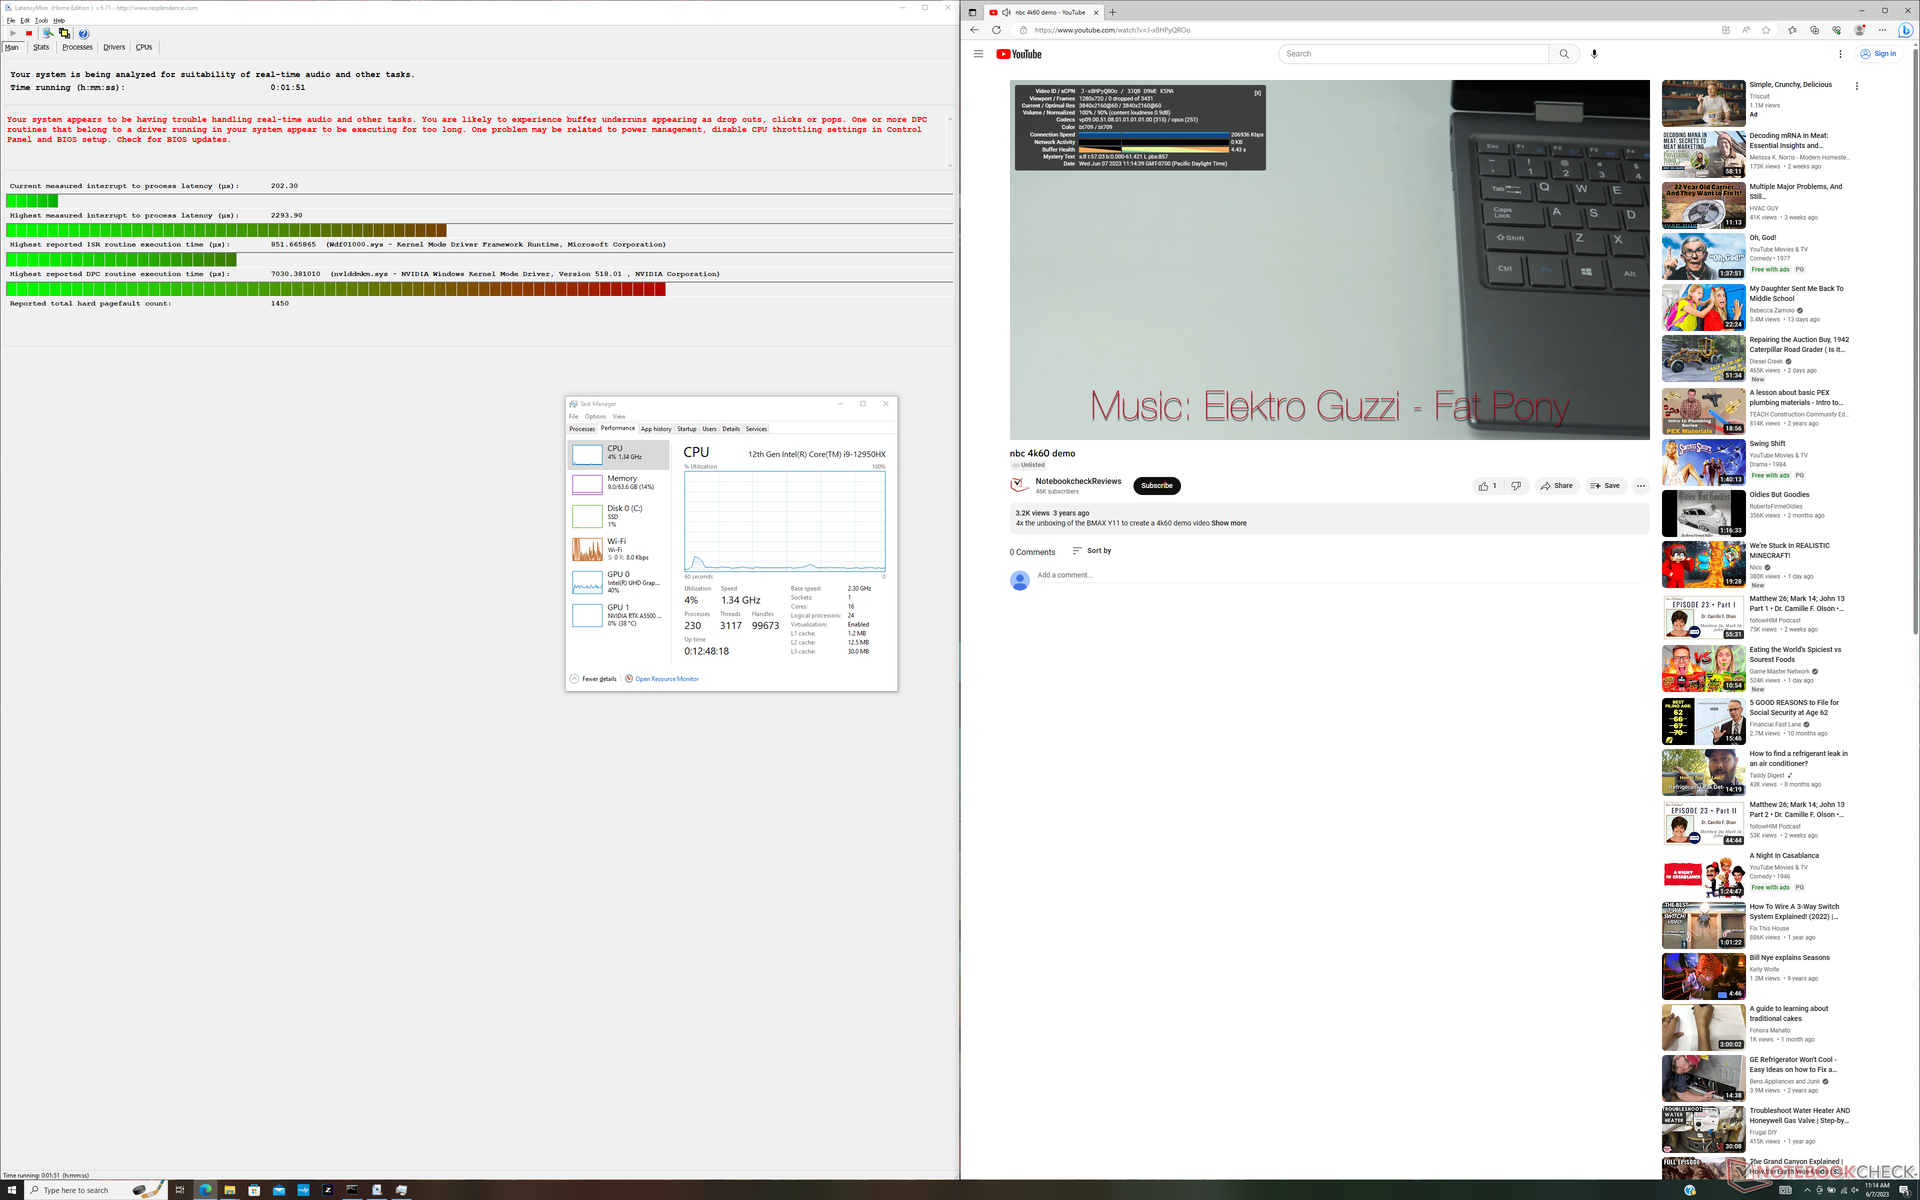
Latência DPC
O LatencyMon revela problemas de DPC ao abrir várias guias do navegador em nossa página inicial. a reprodução de vídeo 4K a 60 FPS é perfeita, com zero queda de quadros durante os testes.
| DPC Latencies / LatencyMon - interrupt to process latency (max), Web, Youtube, Prime95 | |
| HP ZBook Fury 16 G9 | |
| Dell Precision 7000 7670 Performance | |
| Lenovo ThinkPad P16 G1 RTX A5500 | |
| HP ZBook Studio 16 G9 62U04EA | |
| HP ZBook Firefly 16 G9-6B897EA | |
| MSI CreatorPro Z16P B12UKST | |
* ... menor é melhor
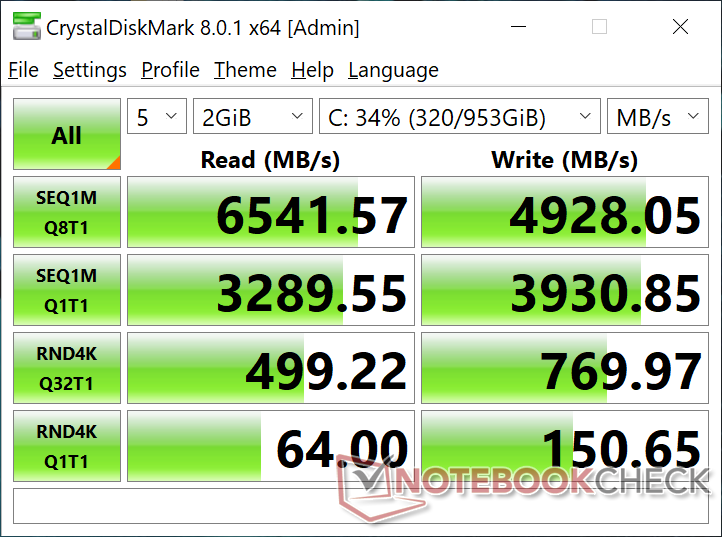
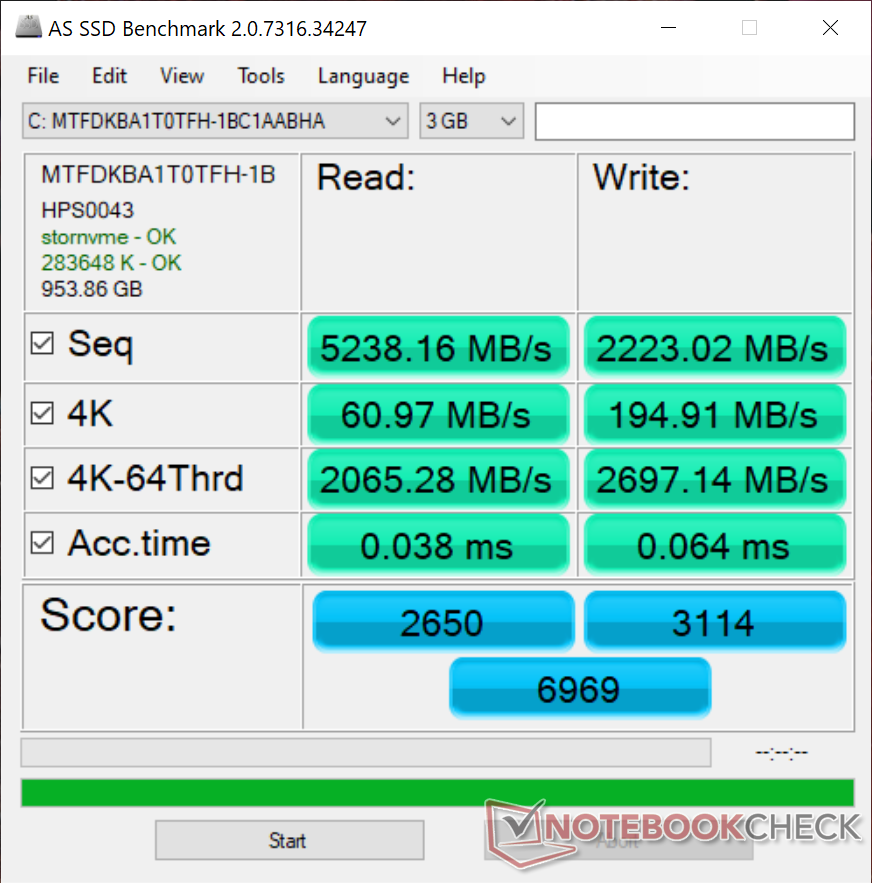
Dispositivos de armazenamento - possível limitação de desempenho
Nossa unidade de teste vem com o mesmo disco de 1 TBMicron 3400 MTFDKBA1T0TFH SSD encontrado noLenovo ThinkPad X1 Extreme G5. Infelizmente, a SSD do nosso HP parece sofrer de problemas graves de limitação de desempenho, conforme mostra o gráfico de comparação abaixo. Ao executar o DiskSpd em um loop, as taxas de transferência ocasionalmente caíam de 6500 MB/s para até 1700 MB/s, enquanto a mesma unidade no Lenovo funcionava a 6500 MB/s indefinidamente. Isso sugere que o Fury 16 pode ter problemas com o resfriamento dos SSDs. Os resultados não melhoraram mesmo depois de múltiplos retestes.

* ... menor é melhor
Disk Throttling: DiskSpd Read Loop, Queue Depth 8
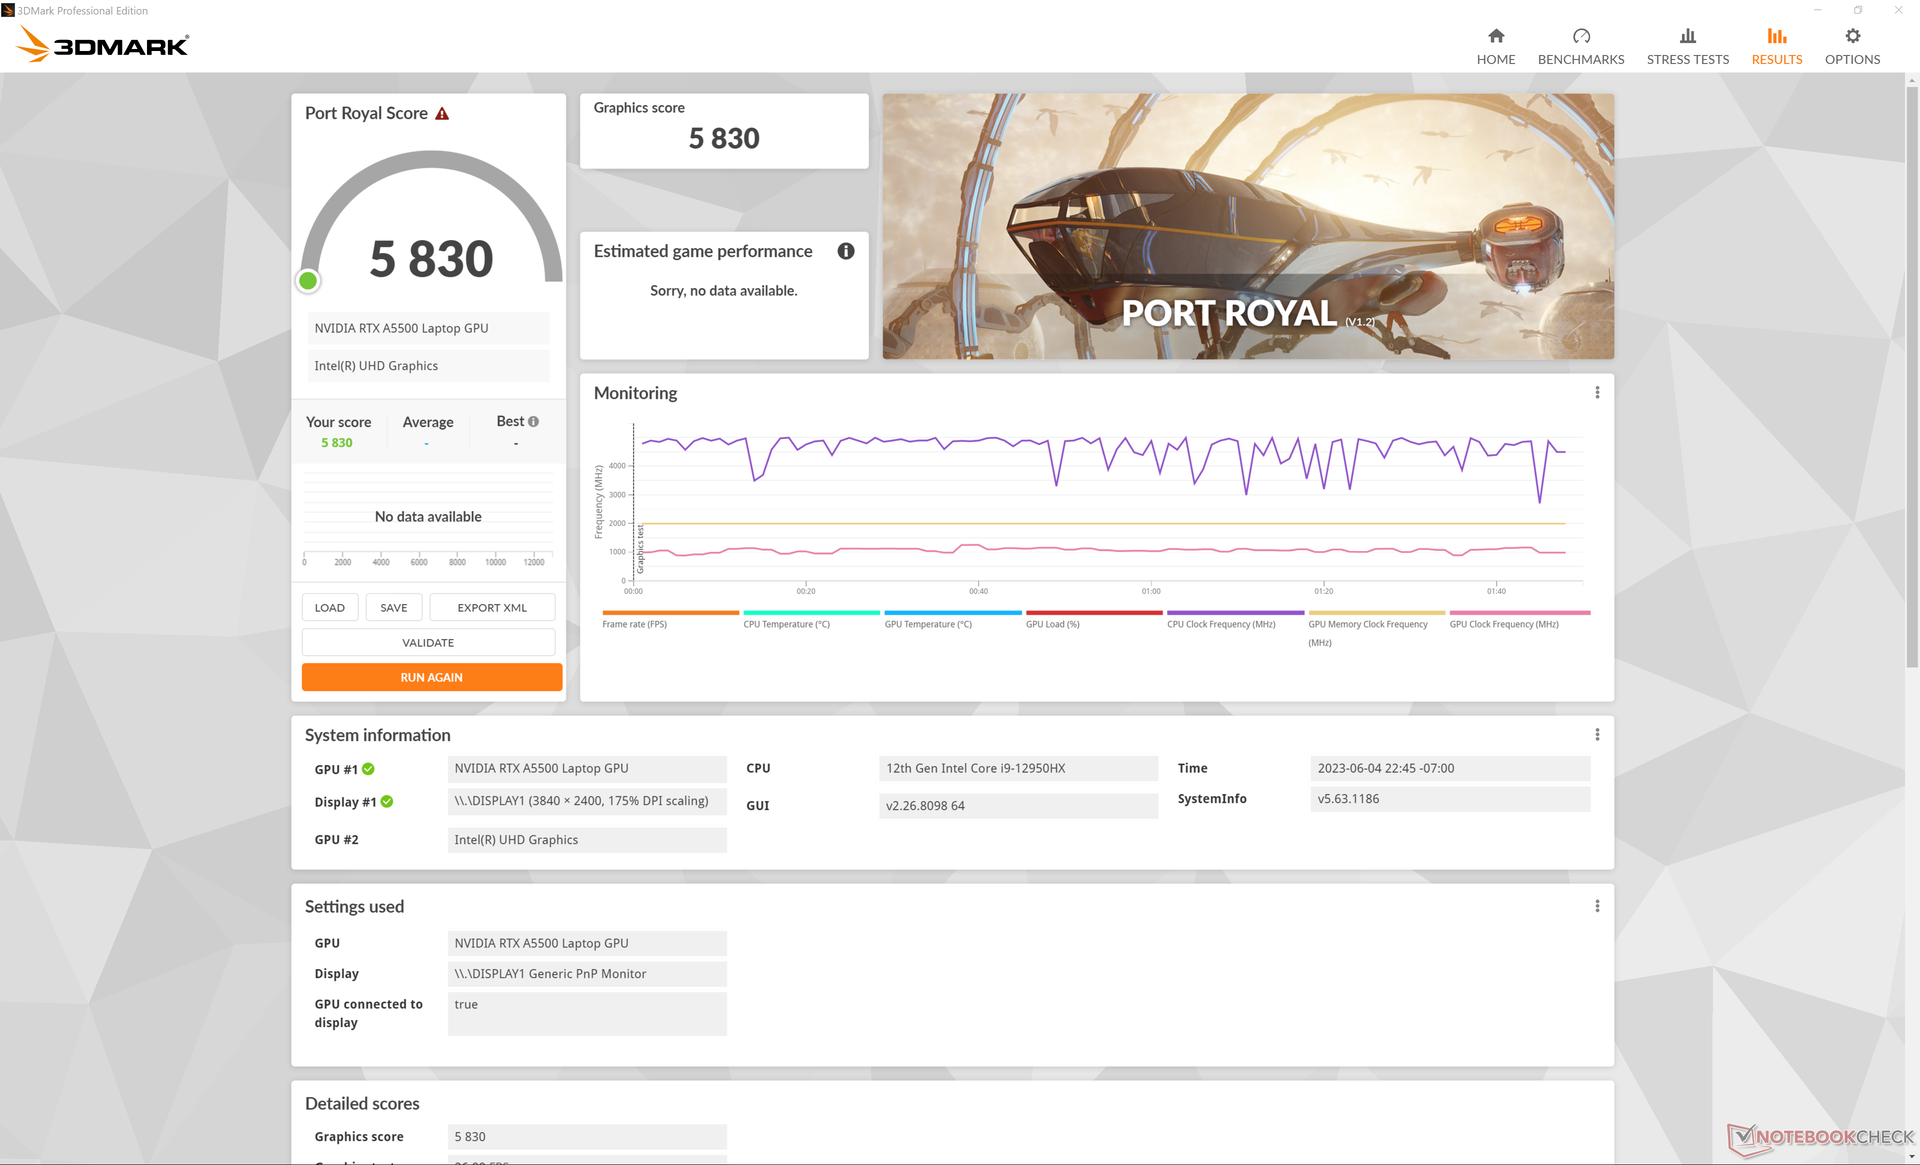
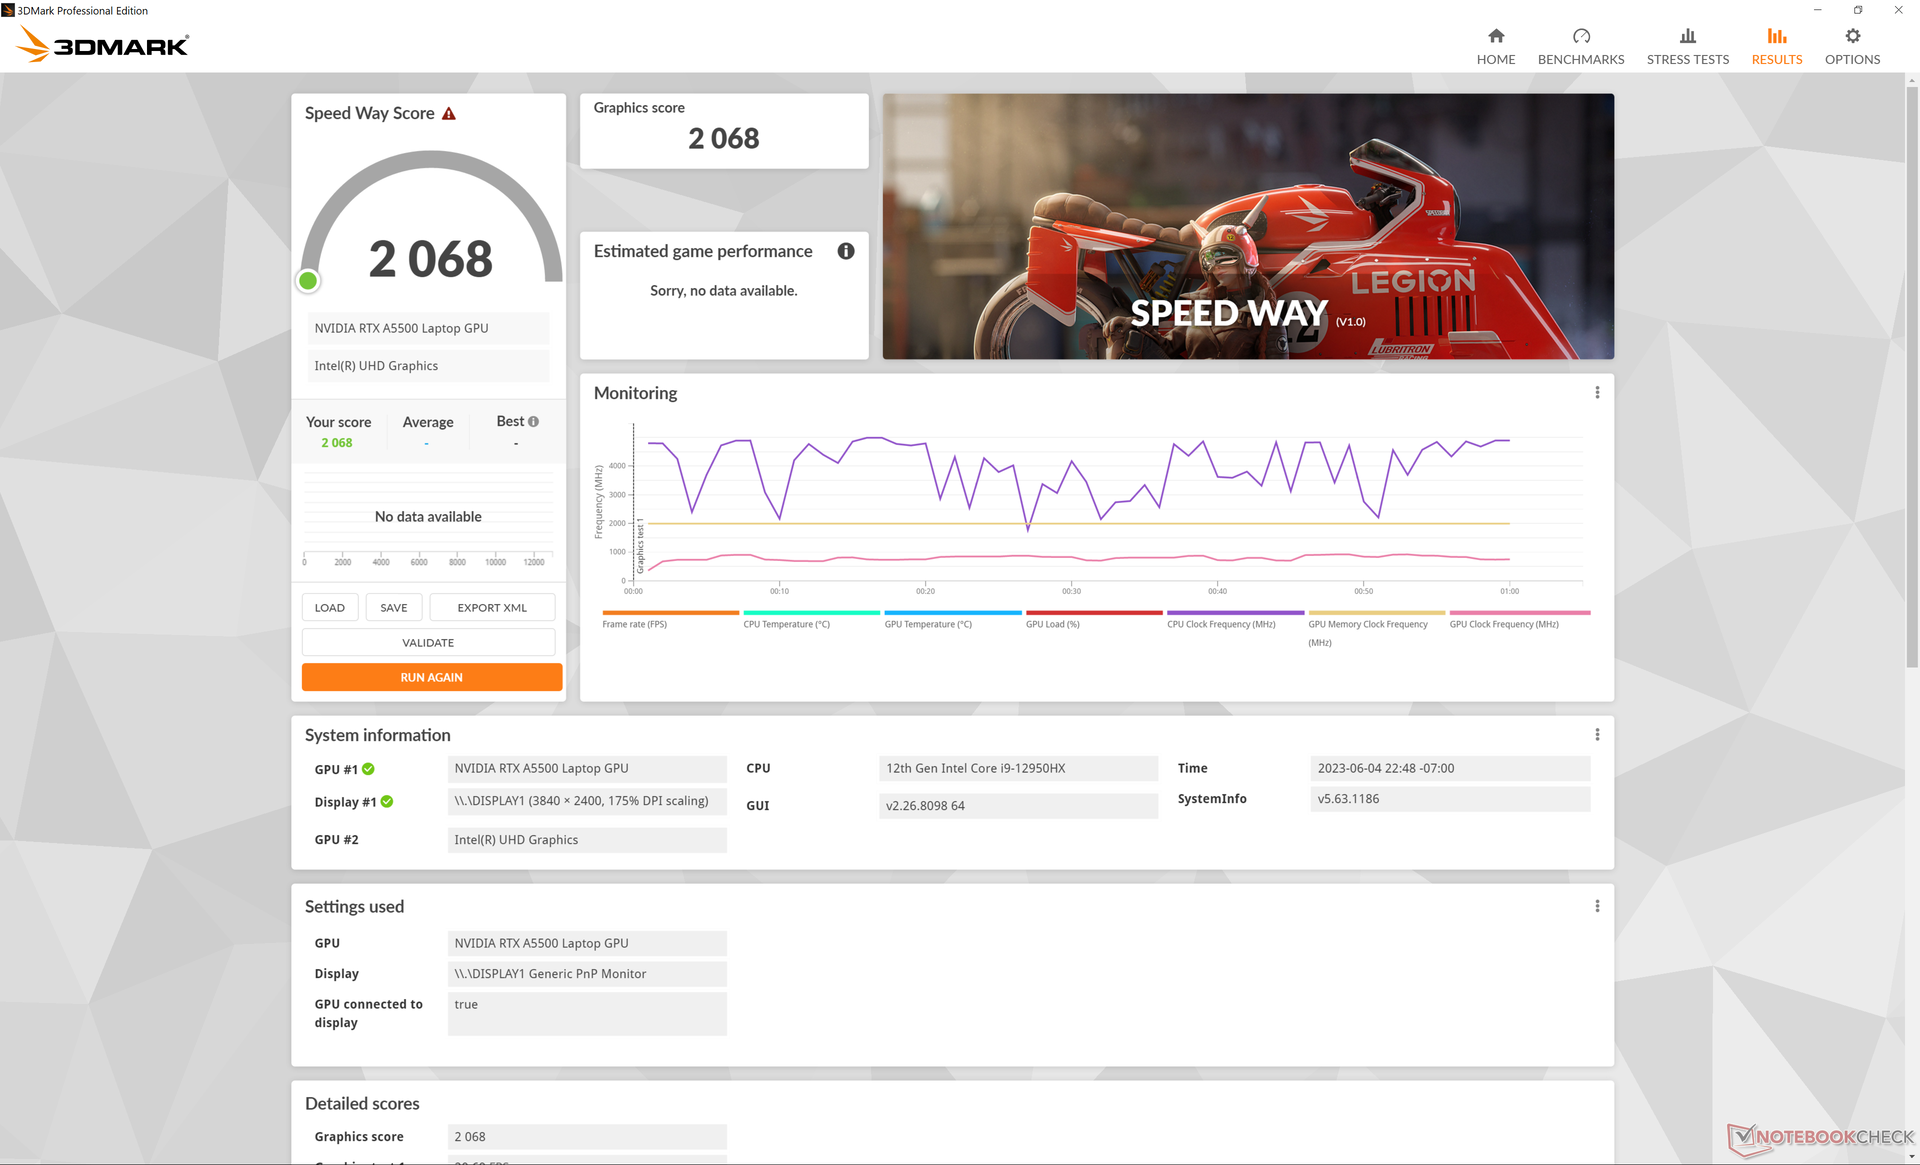
Desempenho da GPU - 100 W TGP
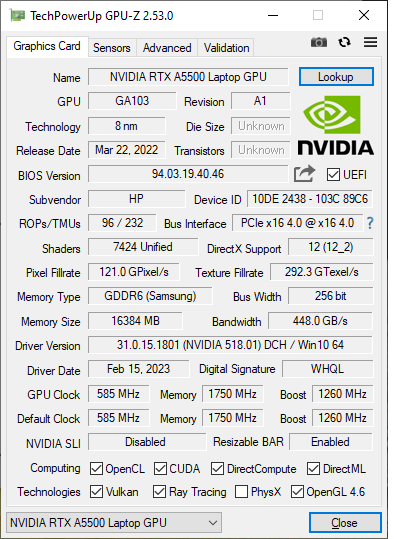
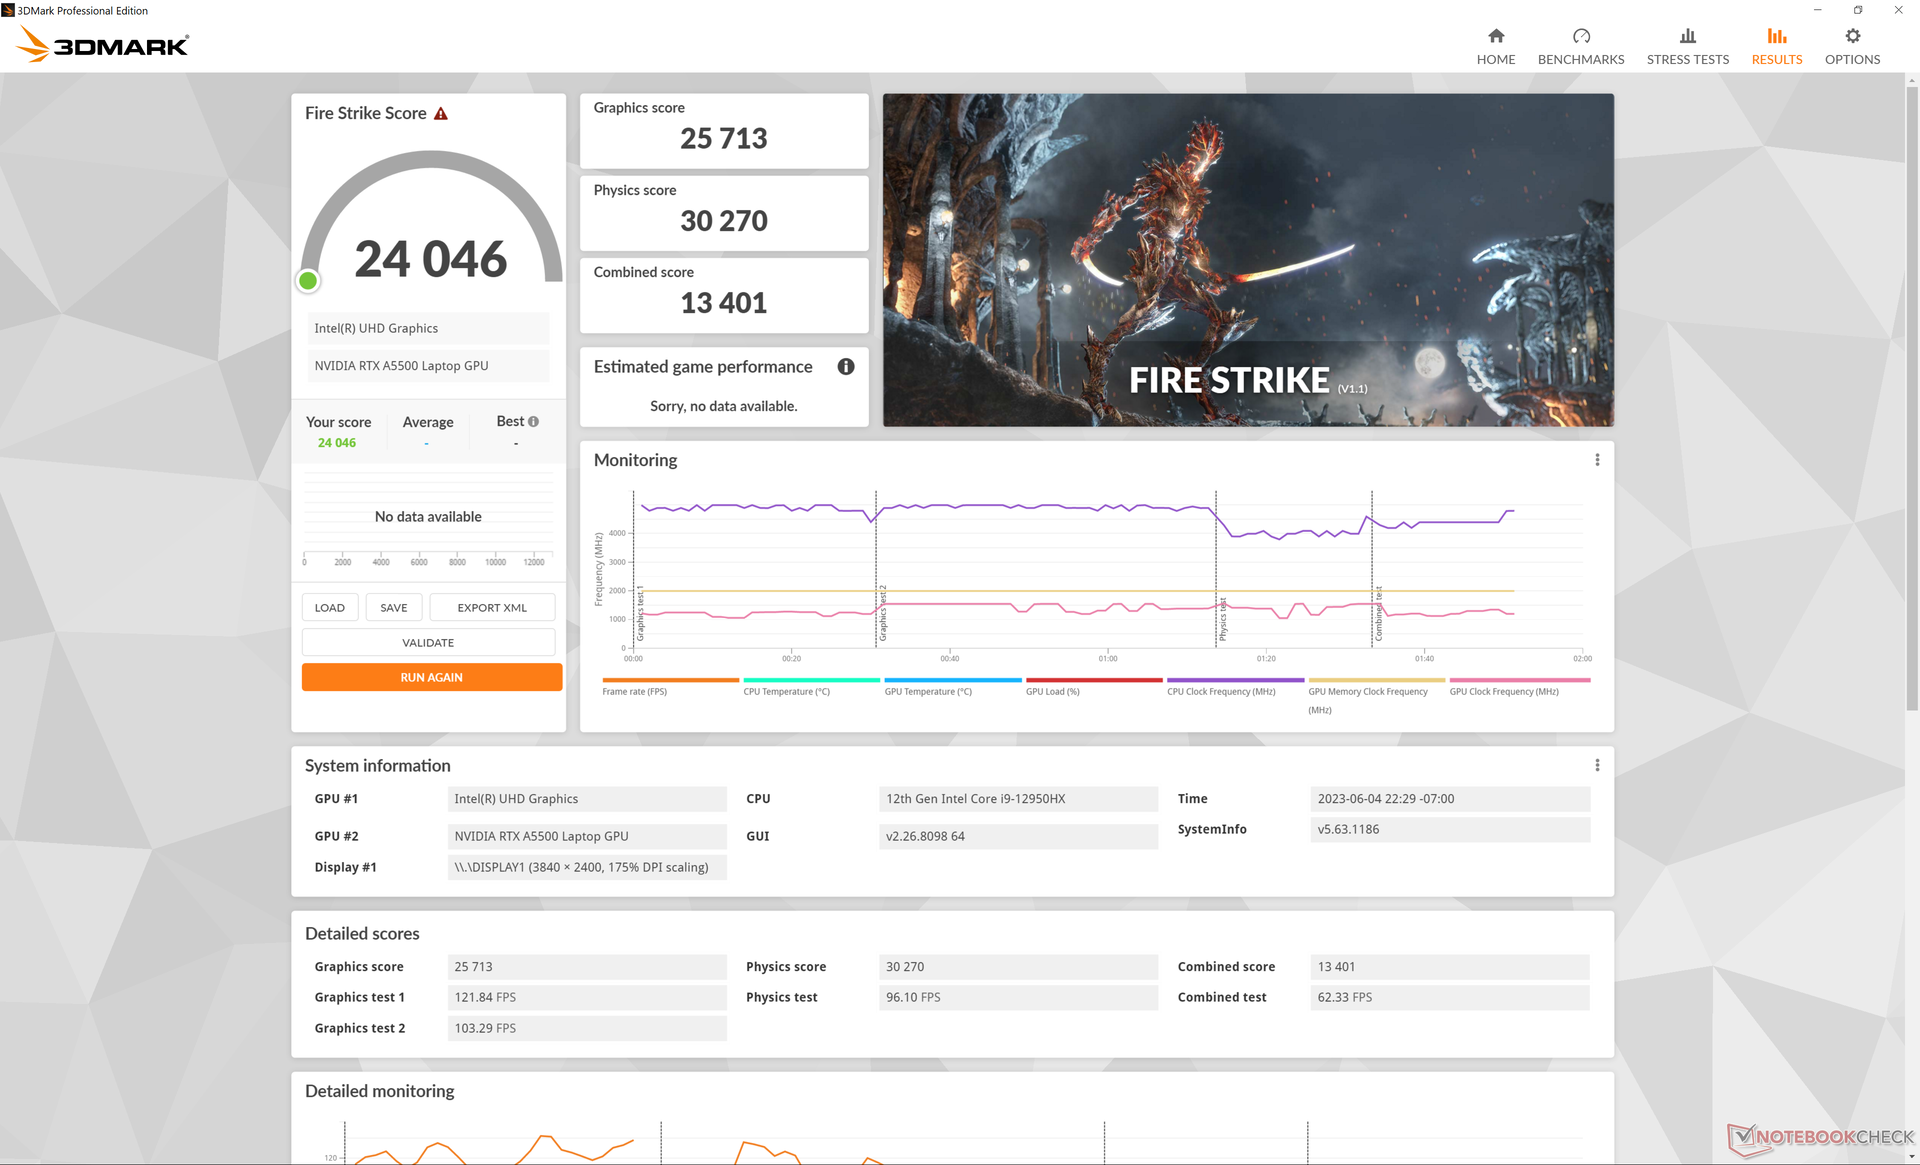
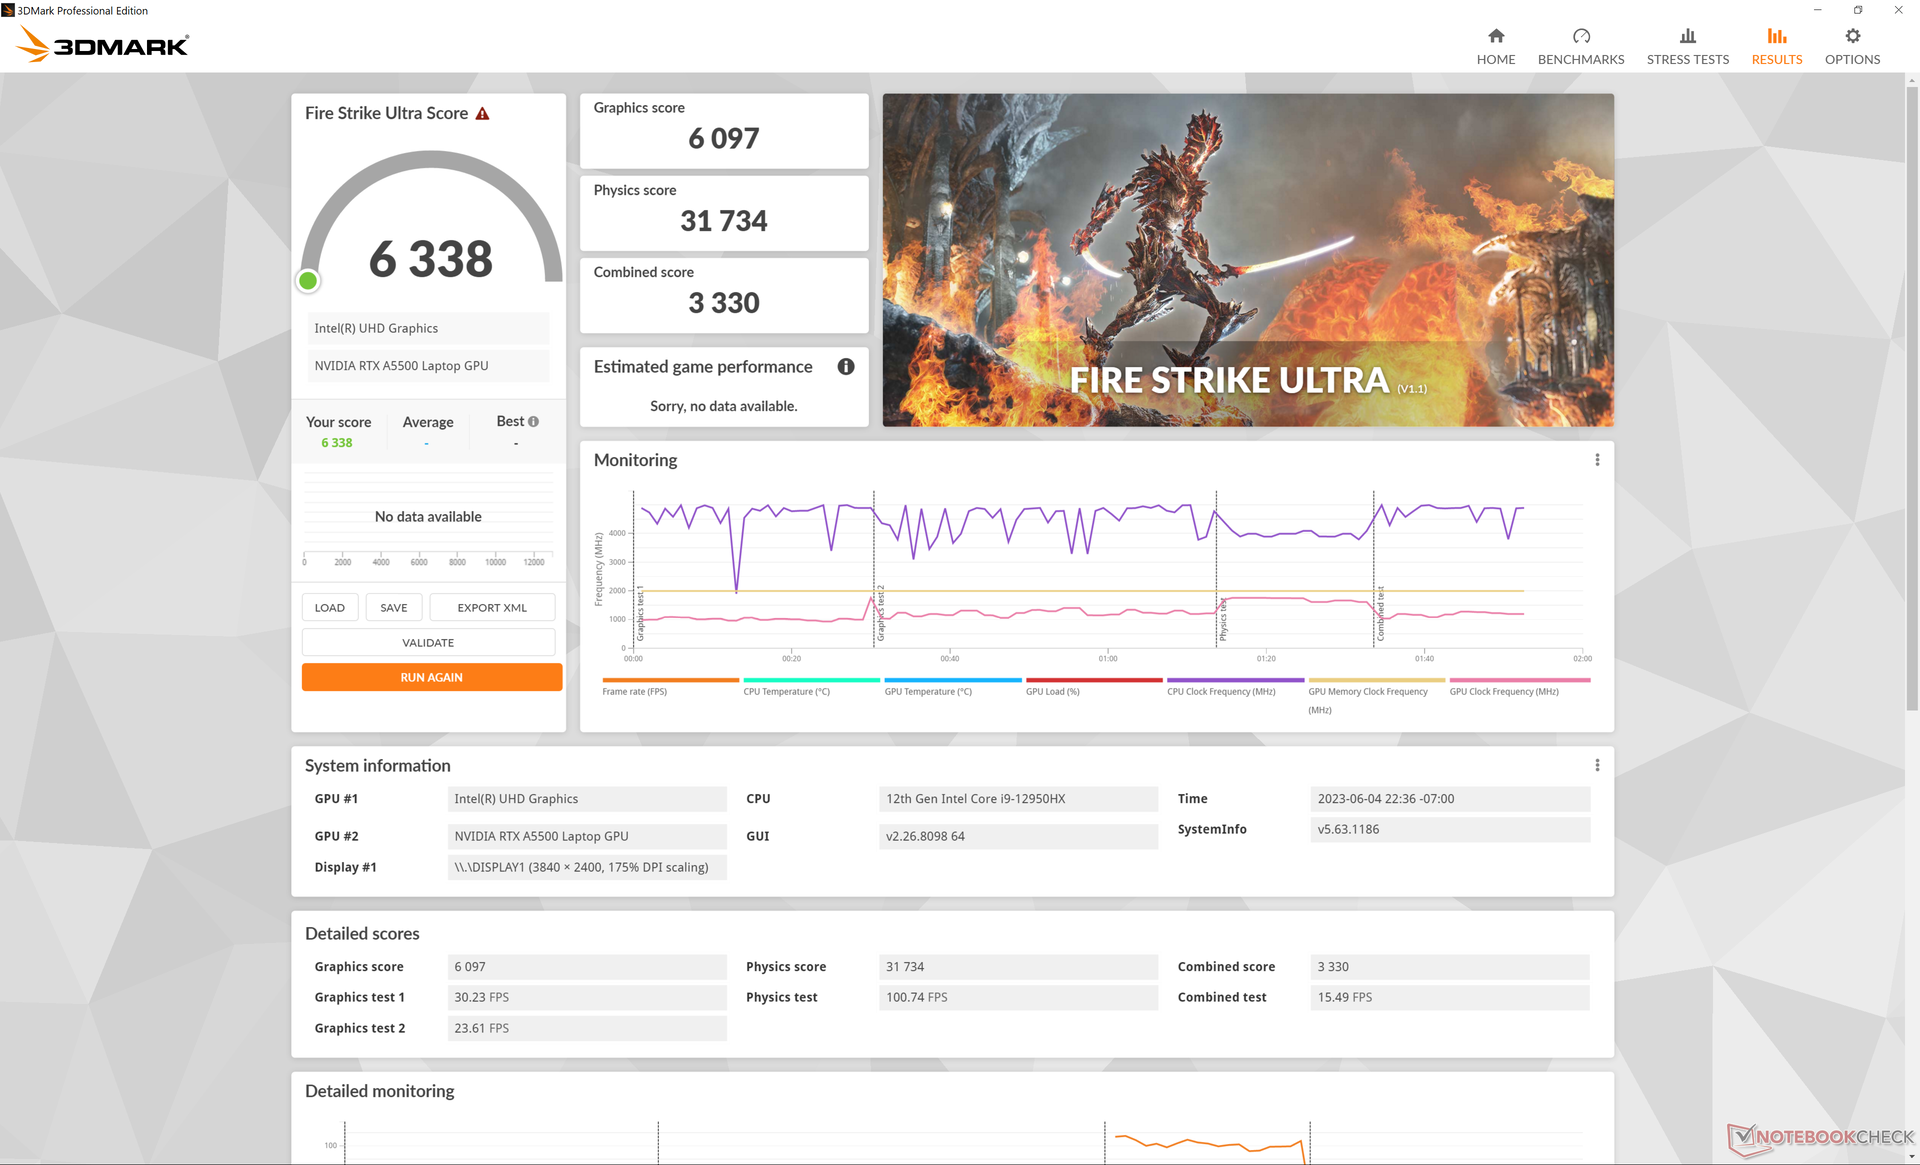
O RTX A5500 em nosso HP tem como meta um TGP de 100 W, em comparação com 130 W e 135 W no ThinkPad P16 G1 e Precision 7670respectivamente. Portanto, o desempenho gráfico deve ser ligeiramente mais lento no HP, embora os três sistemas estejam usando a mesma GPU RTX A5500. os resultados do 3DMark e do SpecViewPerf confirmam isso, pois nosso HP ficaria consistentemente atrás dos modelos da Dell e da Lenovo em até 15% em alguns casos. Ainda é uma estação de trabalho muito rápida, é claro, mas não é a opção mais rápida do mercado.
O downgrade para a RTX A3000 do nosso RTX A5500 topo de linha deverá reduzir o desempenho gráfico em 20 a 30%.
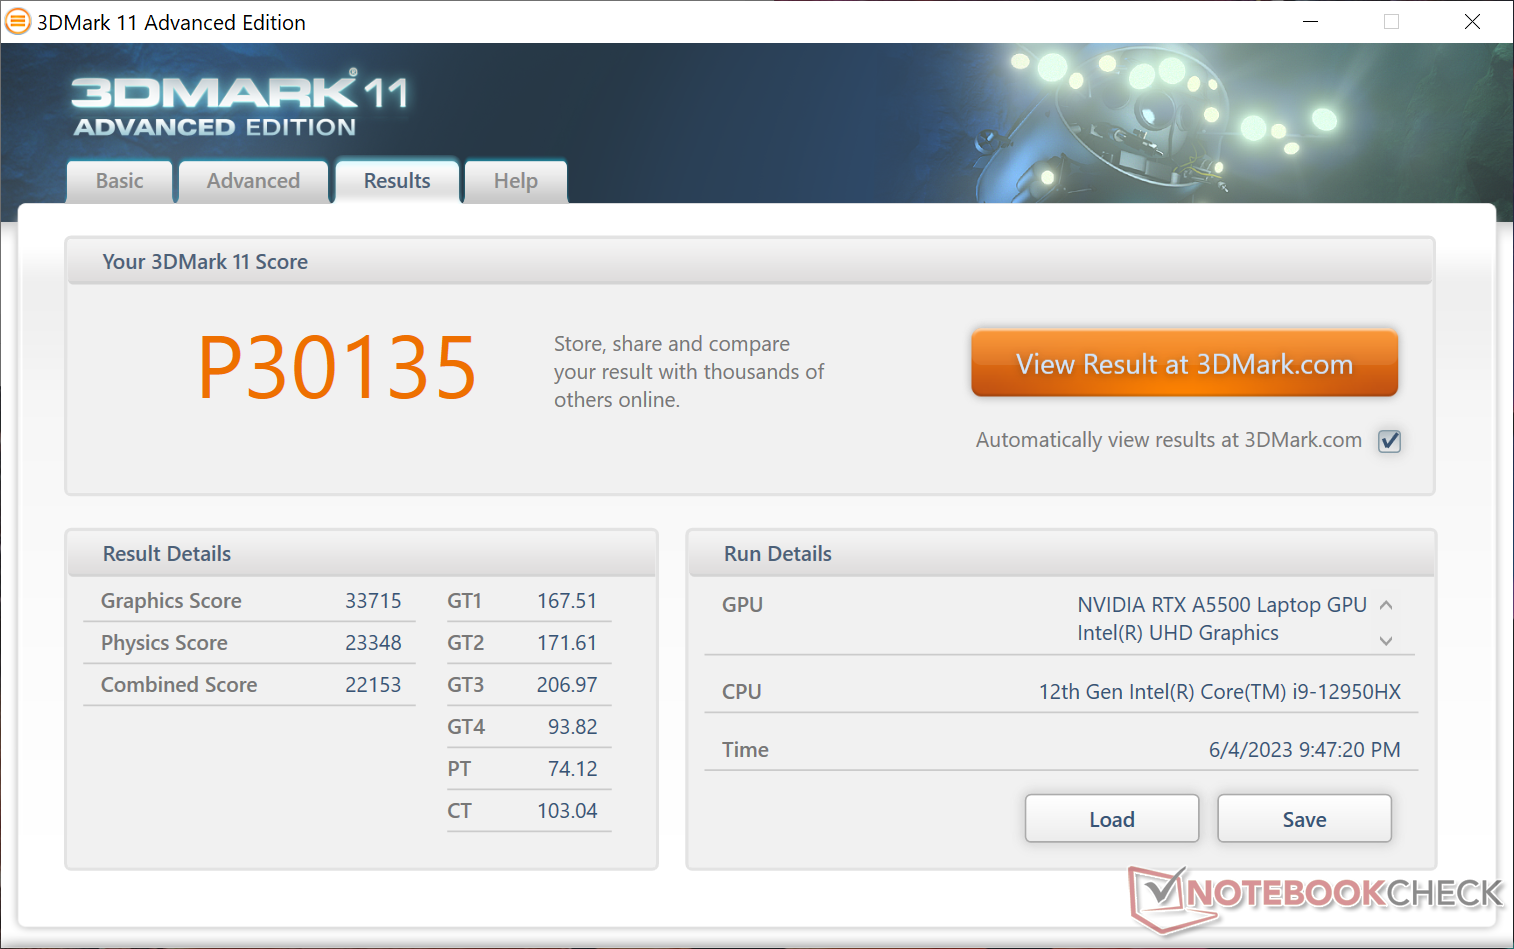
| 3DMark 11 Performance | 30135 pontos | |
| 3DMark Fire Strike Score | 24046 pontos | |
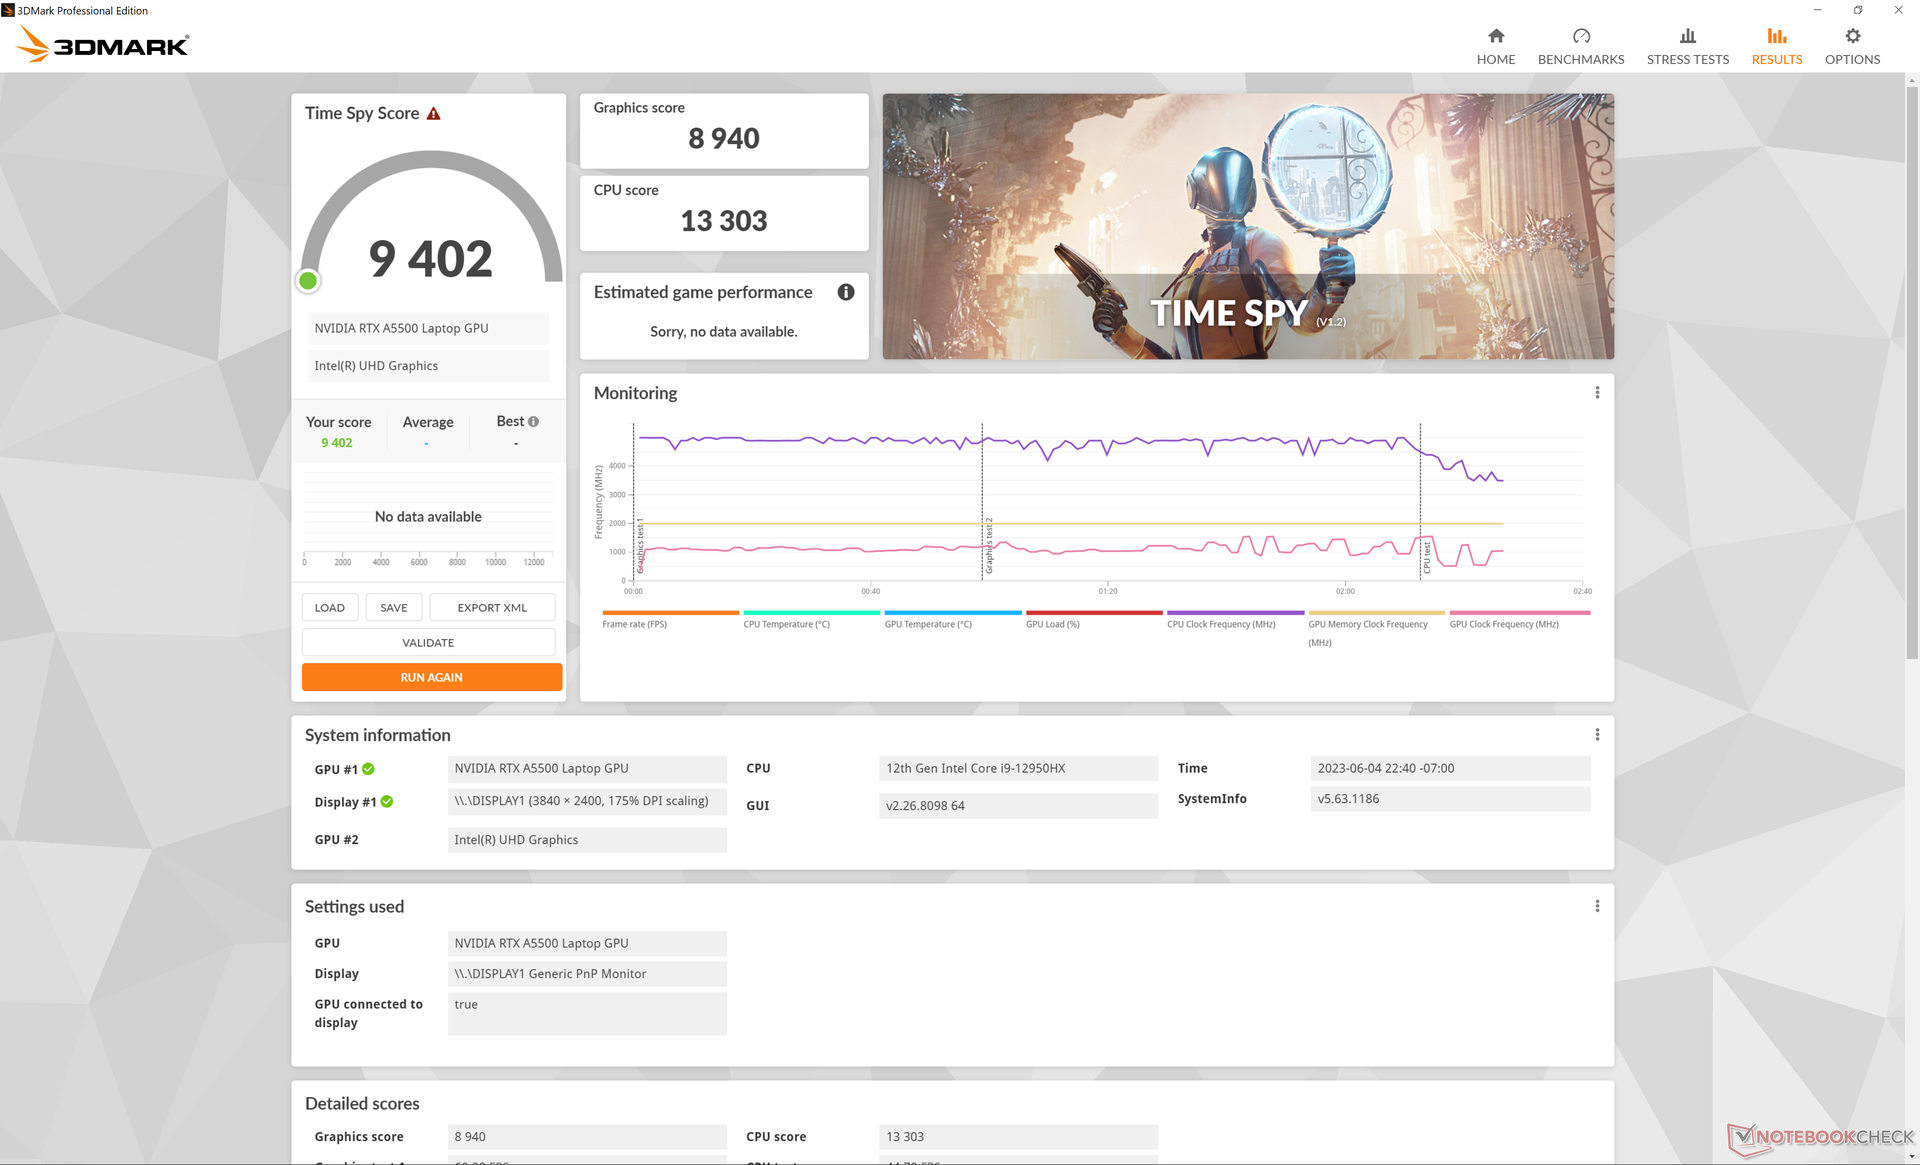
| 3DMark Time Spy Score | 9402 pontos | |
Ajuda | ||
* ... menor é melhor
Desempenho em jogos
Embora não seja uma GPU para jogos, a RTX A5500 é mais do que capaz de reproduzir os títulos mais recentes em altas resoluções e configurações. Os usuários podem esperar que o desempenho em jogos esteja no mesmo nível da móvel GeForce RTX 4070.
| Tiny Tina's Wonderlands | |
| 1920x1080 Low Preset (DX12) | |
| Lenovo Legion Pro 5 16IRX8 | |
| HP ZBook Fury 16 G9 | |
| Média NVIDIA RTX A5500 Laptop GPU (n=1) | |
| Dell XPS 17 9730 RTX 4070 | |
| 1920x1080 Medium Preset (DX12) | |
| Lenovo Legion Pro 5 16IRX8 | |
| HP ZBook Fury 16 G9 | |
| Média NVIDIA RTX A5500 Laptop GPU (n=1) | |
| Dell XPS 17 9730 RTX 4070 | |
| 1920x1080 High Preset (DX12) | |
| Lenovo Legion Pro 5 16IRX8 | |
| HP ZBook Fury 16 G9 | |
| Média NVIDIA RTX A5500 Laptop GPU (n=1) | |
| Dell XPS 17 9730 RTX 4070 | |
| 1920x1080 Badass Preset (DX12) | |
| Asus Zephyrus Duo 16 GX650PY-NM006W | |
| Lenovo Legion Pro 5 16IRX8 | |
| HP ZBook Fury 16 G9 | |
| Média NVIDIA RTX A5500 Laptop GPU (n=1) | |
| Dell XPS 17 9730 RTX 4070 | |
| 2560x1440 Badass Preset (DX12) | |
| Asus Zephyrus Duo 16 GX650PY-NM006W | |
| Lenovo Legion Pro 5 16IRX8 | |
| HP ZBook Fury 16 G9 | |
| Média NVIDIA RTX A5500 Laptop GPU (n=1) | |
| Dell XPS 17 9730 RTX 4070 | |
| 3840x2160 Badass Preset (DX12) | |
| Lenovo Legion Pro 5 16IRX8 | |
| HP ZBook Fury 16 G9 | |
| Média NVIDIA RTX A5500 Laptop GPU (n=1) | |
| Dell XPS 17 9730 RTX 4070 | |
Witcher 3 FPS Chart
| baixo | média | alto | ultra | QHD | 4K | |
|---|---|---|---|---|---|---|
| GTA V (2015) | 185.4 | 182.7 | 170.7 | 118.5 | 97.5 | 97.1 |
| The Witcher 3 (2015) | 447 | 308.5 | 169.3 | 92.8 | 62.2 | |
| Dota 2 Reborn (2015) | 191.3 | 173.1 | 162.4 | 150.7 | 116.1 | |
| Final Fantasy XV Benchmark (2018) | 180.1 | 131.6 | 103.5 | 75.1 | 39.4 | |
| X-Plane 11.11 (2018) | 151.3 | 130.9 | 103.6 | 81.9 | ||
| Strange Brigade (2018) | 447 | 235 | 190.2 | 168.6 | 122 | 67.6 |
| Cyberpunk 2077 1.6 (2022) | 128.7 | 114.4 | 87.6 | 69.8 | 41.4 | 18.1 |
| Tiny Tina's Wonderlands (2022) | 193.7 | 158.6 | 109.5 | 87.5 | 57.9 | 29.6 |
| F1 22 (2022) | 224 | 209 | 170.2 | 60.9 | 37.2 | 17.6 |
| Returnal (2023) | 70 | 68 | 64 | 59 | 42 | 20 |
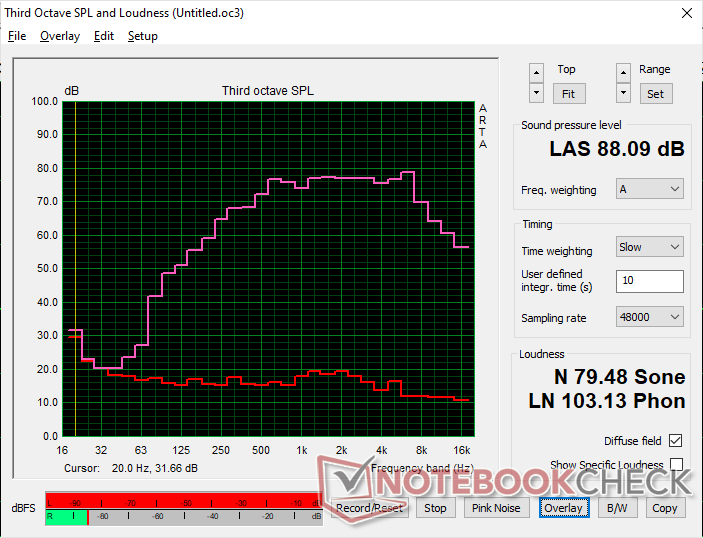
Emissões - Silencioso sob cargas baixas
Ruído do sistema
O ruído do ventilador é silencioso durante a execução de cargas pouco exigentes. Ele tende a oscilar entre 29 dB(A) e 35 dB(A) durante cargas baixas e médias, o que é quase inaudível na maioria dos ambientes de escritório.
A execução de cargas mais exigentes, como jogos, pode induzir a um ruído máximo da ventoinha de pouco menos de 50 dB(A), que é próximo ao que registramos no ThinkPad P16 G1 ou no Precision 7670. No entanto, oThinkPad P16 G1 é capaz de permanecer mais silencioso por períodos mais longos. Ao executar o 3DMark 06, por exemplo, o ruído do ventilador em nosso HP chegaria a 36 dB(A) no final da primeira cena do benchmark, em comparação com apenas 29 dB(A) no Lenovo.
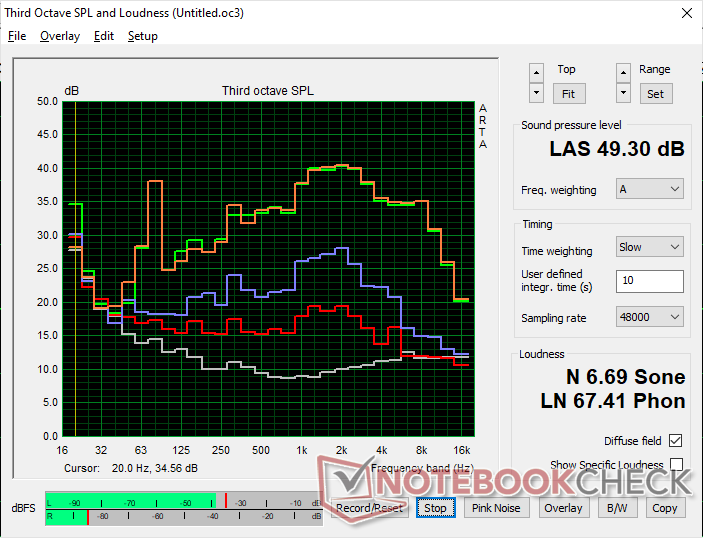
Barulho
| Ocioso |
| 22.7 / 22.7 / 28.8 dB |
| Carga |
| 36.2 / 49.3 dB |
 | ||
30 dB silencioso 40 dB(A) audível 50 dB(A) ruidosamente alto |
||
min: | ||
| HP ZBook Fury 16 G9 RTX A5500 Laptop GPU, i9-12950HX, Micron 3400 1TB MTFDKBA1T0TFH | HP ZBook Studio 16 G9 62U04EA RTX A2000 Laptop GPU, i7-12800H, Micron 3400 1TB MTFDKBA1T0TFH | HP ZBook Firefly 16 G9-6B897EA T550 Laptop GPU, i7-1265U, Samsung PM9A1 MZVL21T0HCLR | Lenovo ThinkPad P16 G1 RTX A5500 RTX A5500 Laptop GPU, i9-12950HX, WDC PC SN810 2TB | Dell Precision 7000 7670 Performance RTX A5500 Laptop GPU, i9-12950HX | MSI CreatorPro Z16P B12UKST RTX A3000 Laptop GPU, i7-12700H, Samsung PM9A1 MZVL21T0HCLR | |
|---|---|---|---|---|---|---|
| Noise | -4% | 4% | 4% | -9% | -6% | |
| desligado / ambiente * (dB) | 22.6 | 24 -6% | 23.8 -5% | 23.1 -2% | 23.9 -6% | 24.1 -7% |
| Idle Minimum * (dB) | 22.7 | 24 -6% | 23.8 -5% | 23.1 -2% | 24 -6% | 27.1 -19% |
| Idle Average * (dB) | 22.7 | 27.7 -22% | 23.8 -5% | 23.1 -2% | 24 -6% | 27.1 -19% |
| Idle Maximum * (dB) | 28.8 | 27.7 4% | 23.8 17% | 23.1 20% | 38 -32% | 27.1 6% |
| Load Average * (dB) | 36.2 | 39.8 -10% | 39.4 -9% | 28.9 20% | 46.3 -28% | 42.9 -19% |
| Witcher 3 ultra * (dB) | 49.5 | 44.3 11% | 40.5 18% | 51.6 -4% | 41.9 15% | 44 11% |
| Load Maximum * (dB) | 49.3 | 47.7 3% | 41.4 16% | 51.4 -4% | 47.9 3% | 47 5% |
* ... menor é melhor
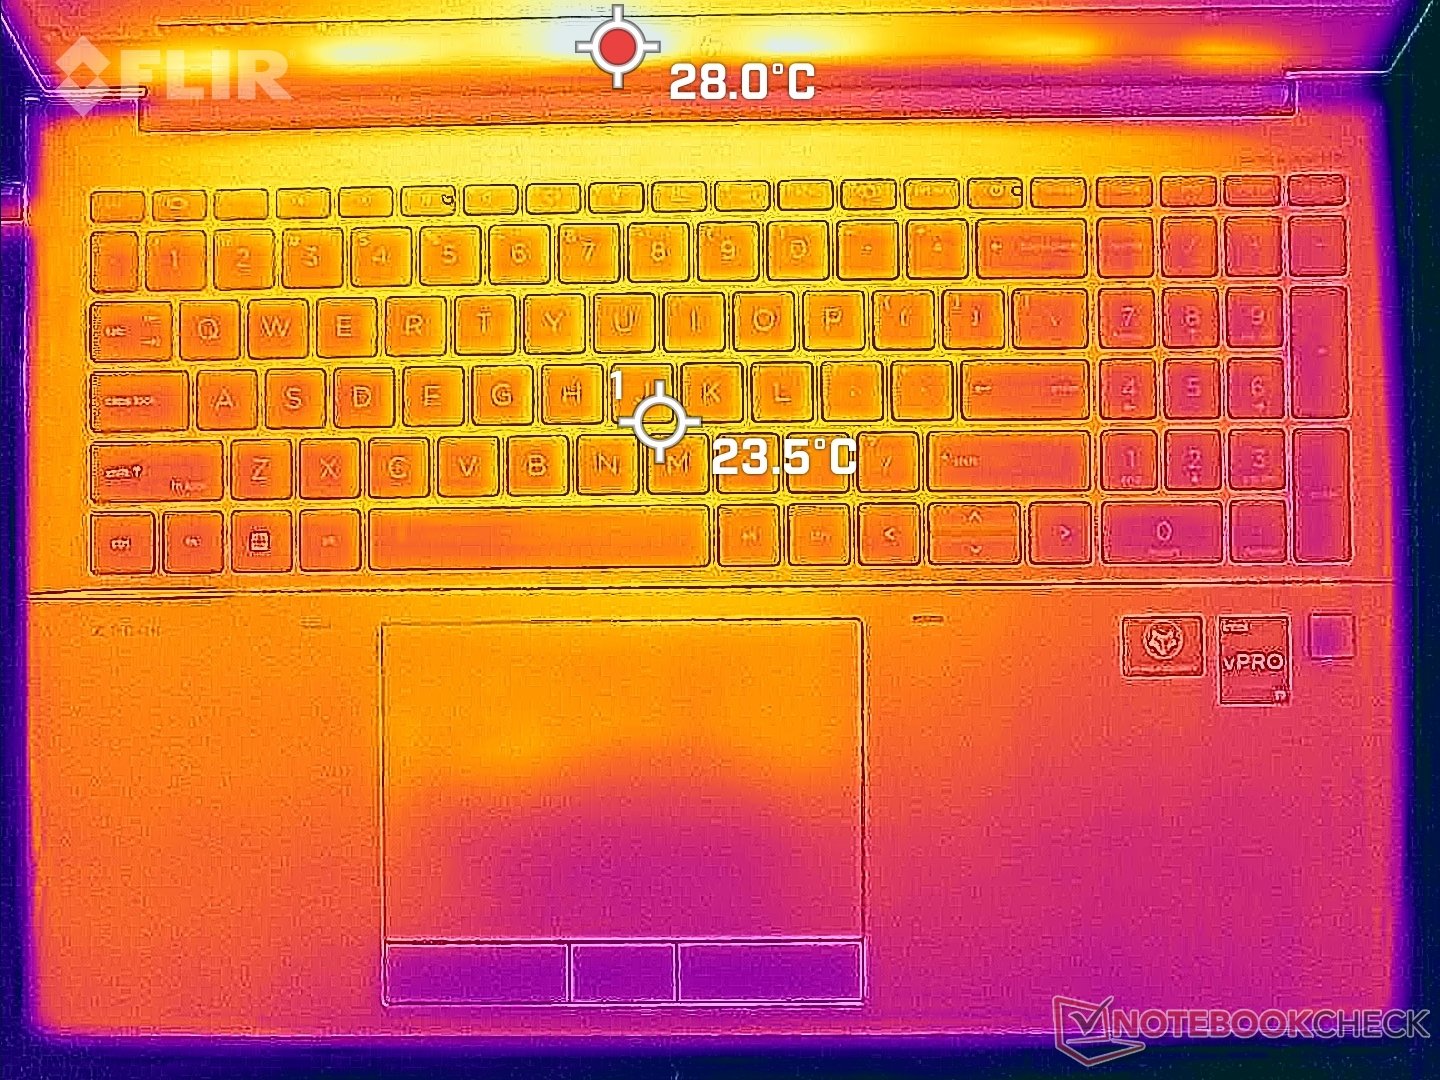
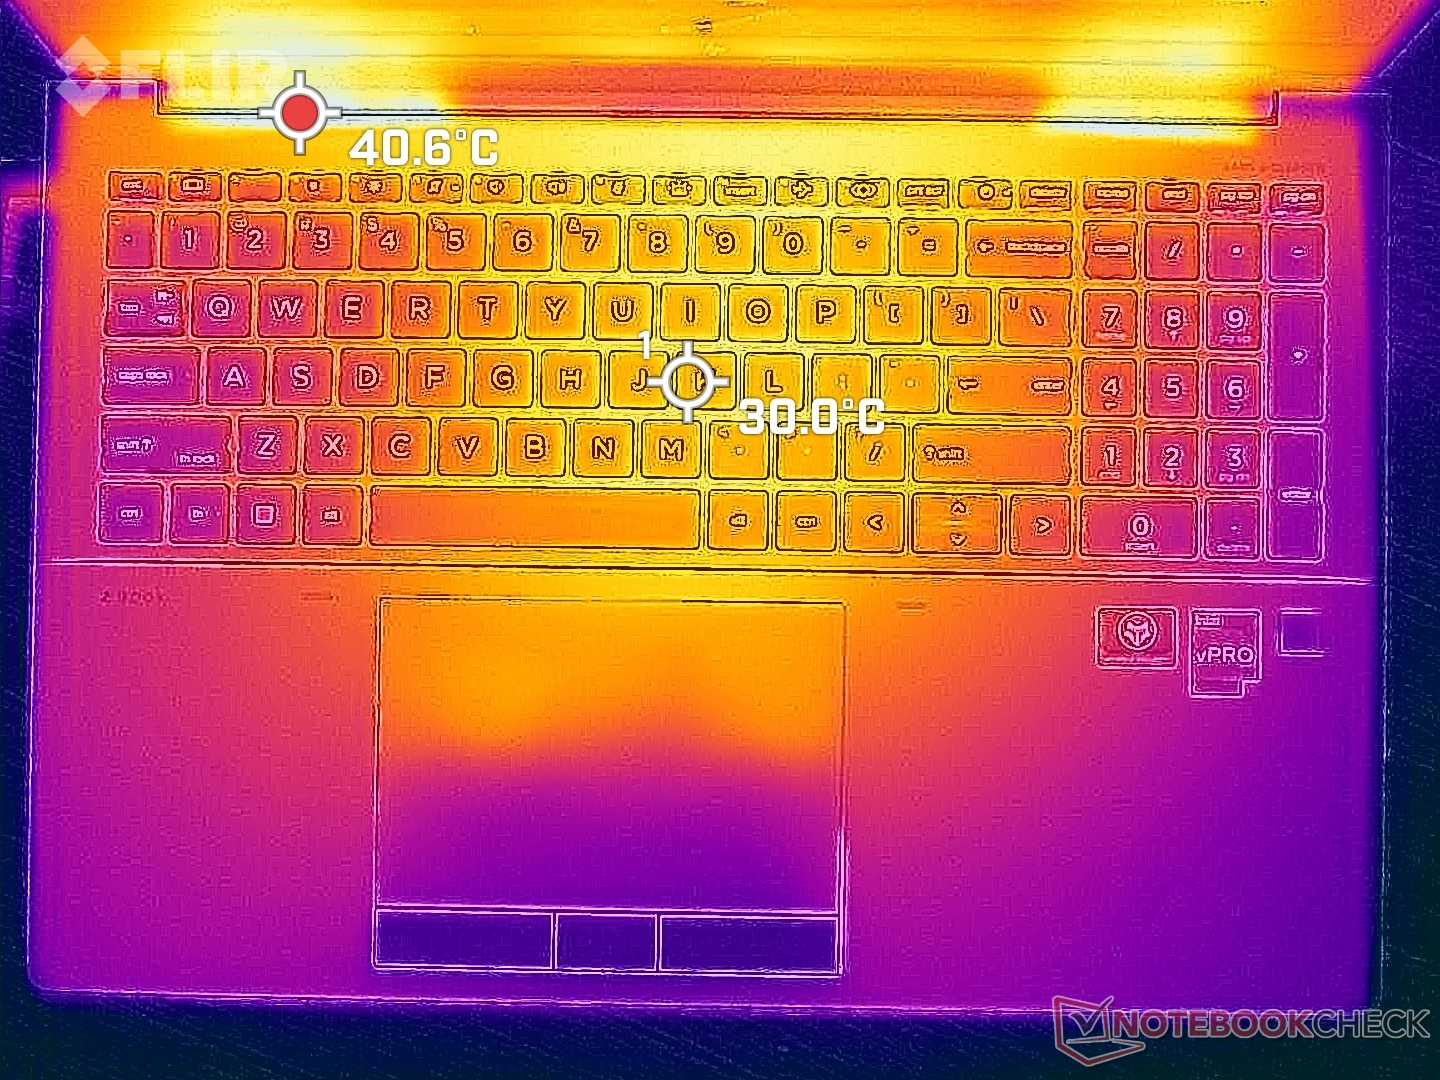
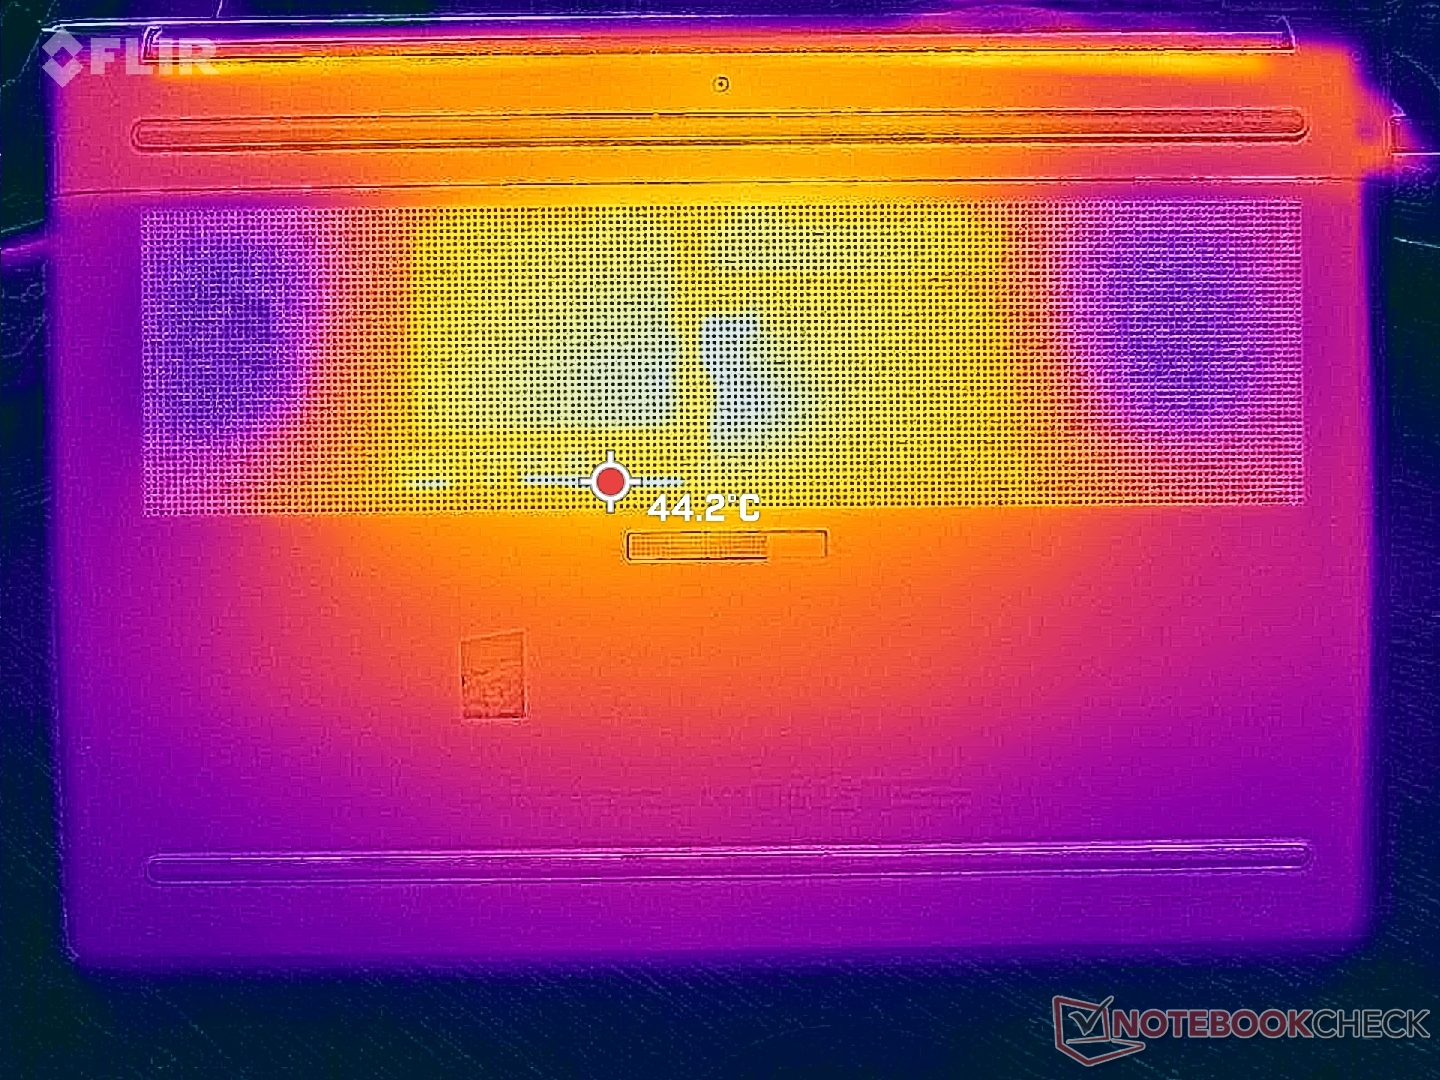
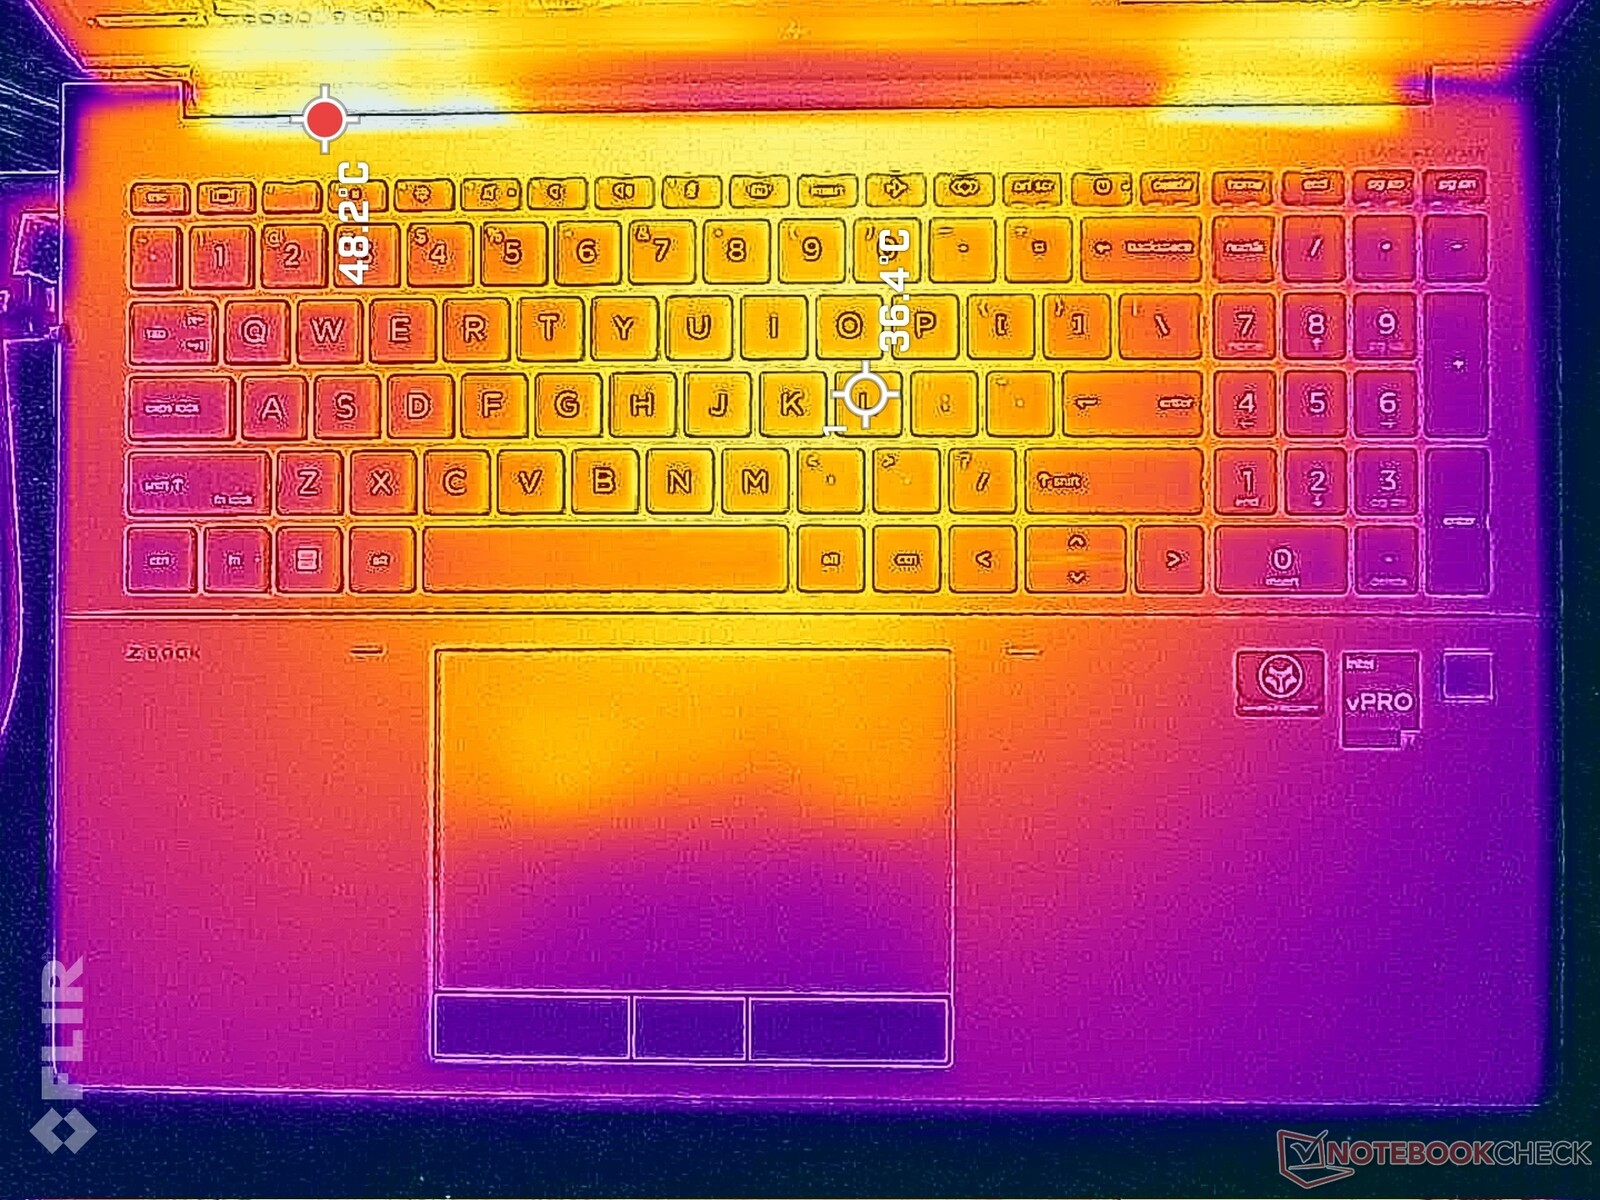
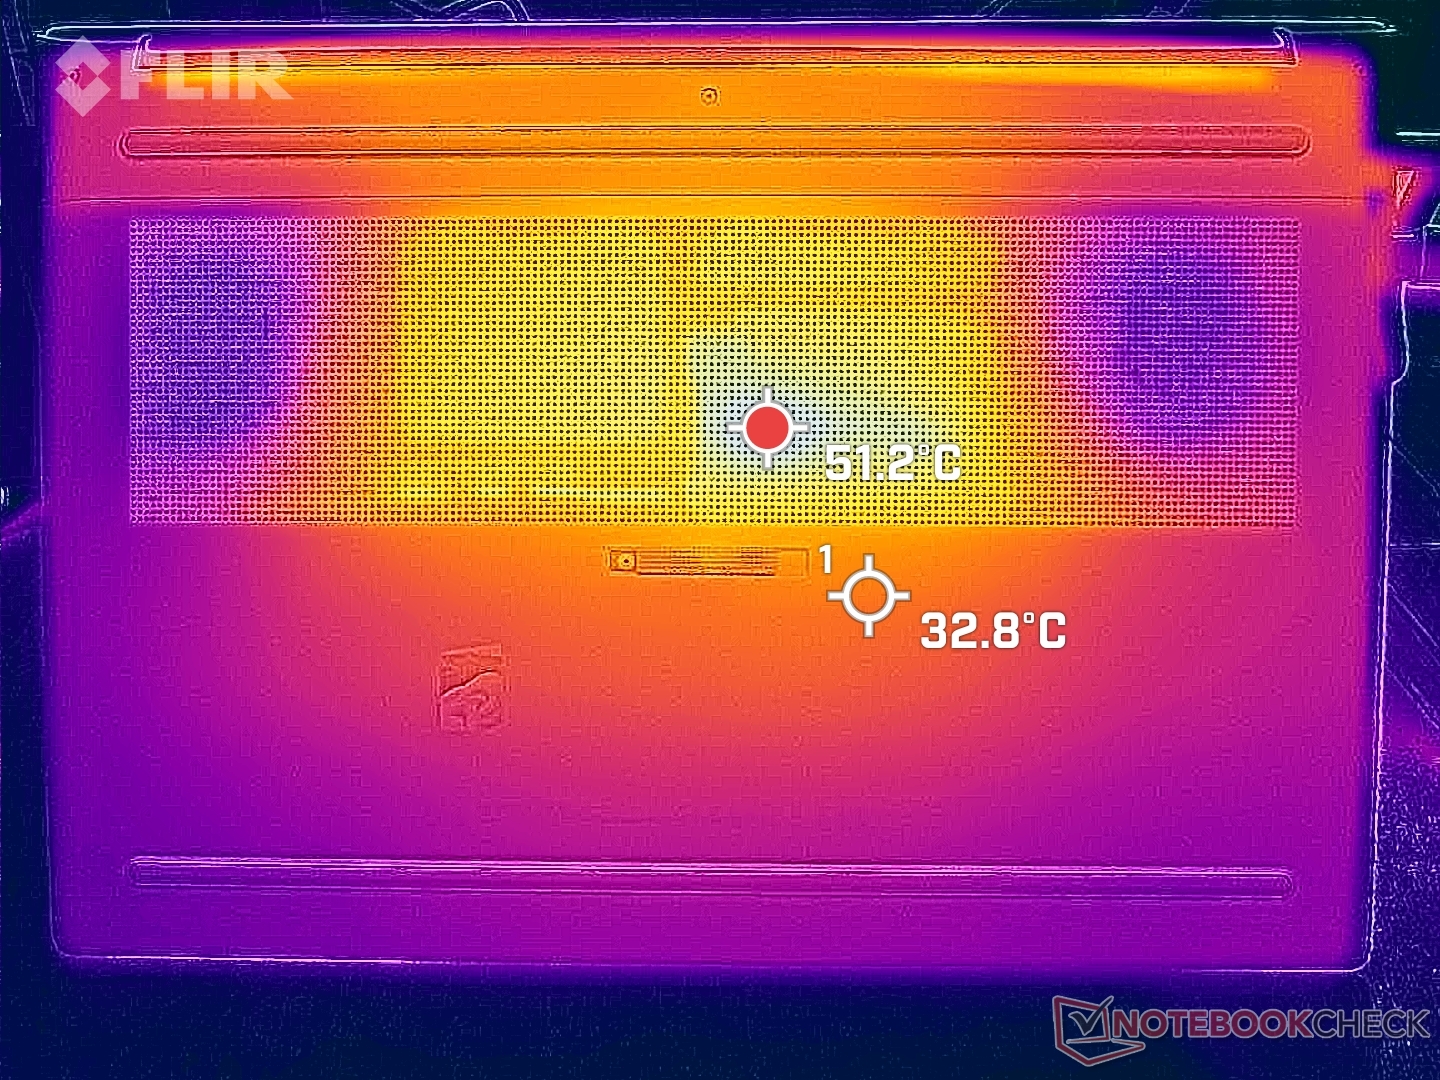
Temperatura - Apoio para as mãos quente sob carga
As temperaturas da superfície tendem a ser mais quentes em direção ao centro do teclado, onde podem chegar a mais de 36 °C quando submetidas a cargas extremas de processamento. O desenvolvimento da temperatura é mais simétrico do que no Precision 7670 ou no ThinkPad P16, mas o touchpad e os apoios para as mãos podem ficar mais quentes do que gostaríamos. Ao executar cargas exigentes, por exemplo, o touchpad do HP pode atingir mais de 35 °C, em comparação com 30 °C ou menos nas alternativas da Lenovo e da Dell mencionadas anteriormente.
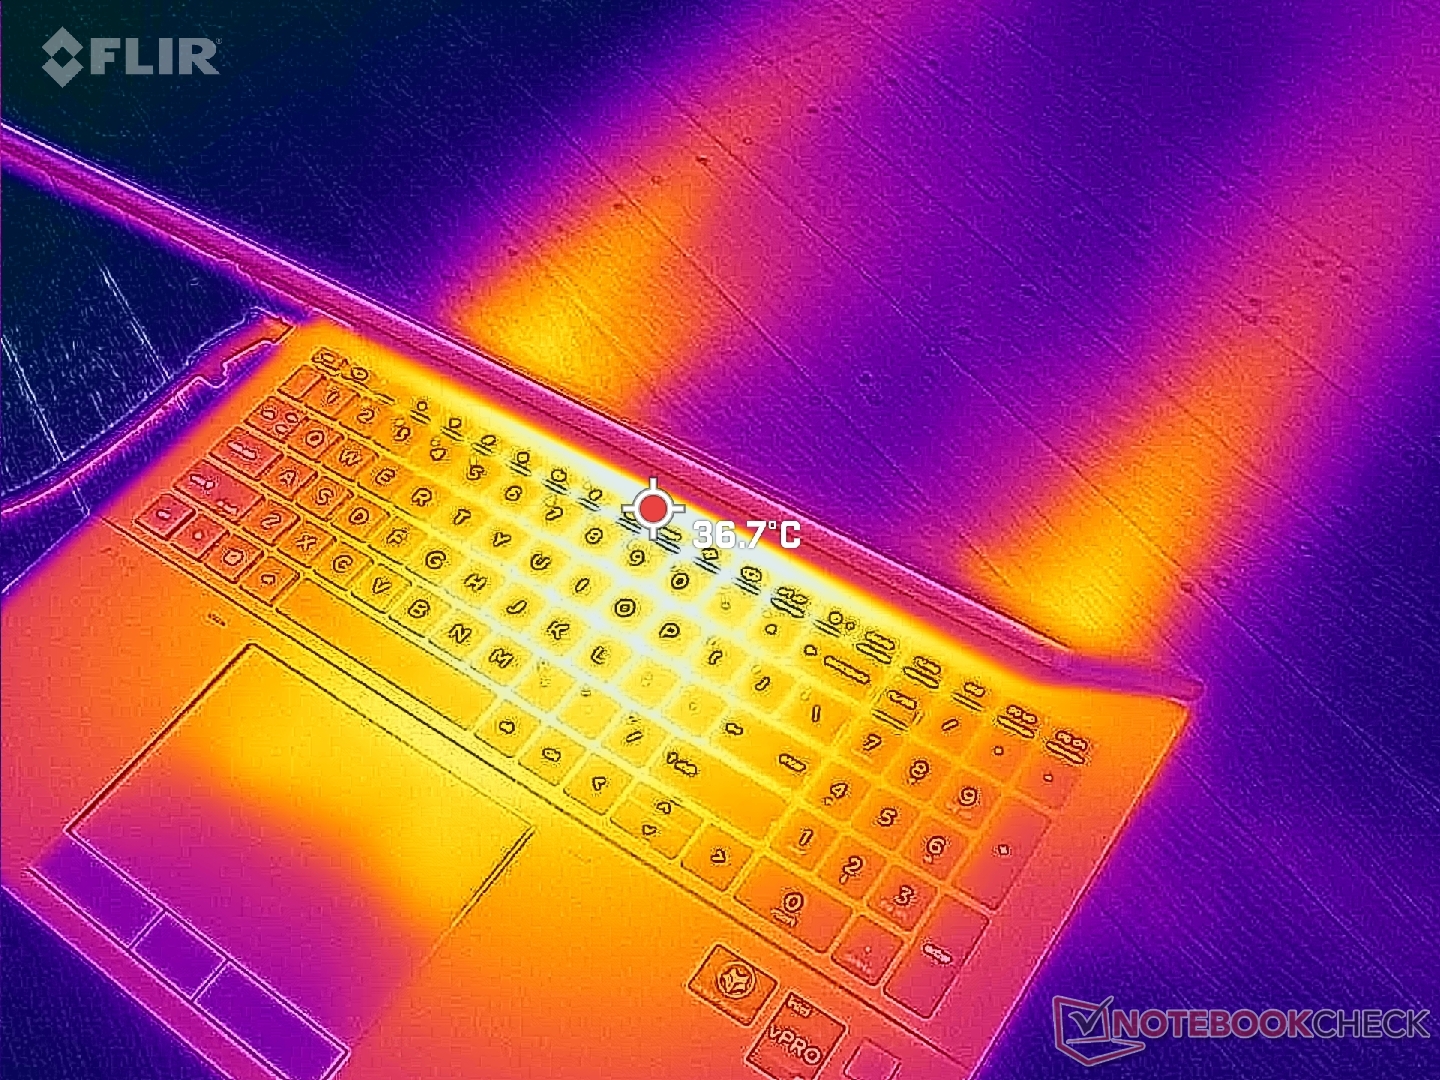
(±) A temperatura máxima no lado superior é 43.2 °C / 110 F, em comparação com a média de 38.2 °C / 101 F , variando de 22.2 a 69.8 °C para a classe Workstation.
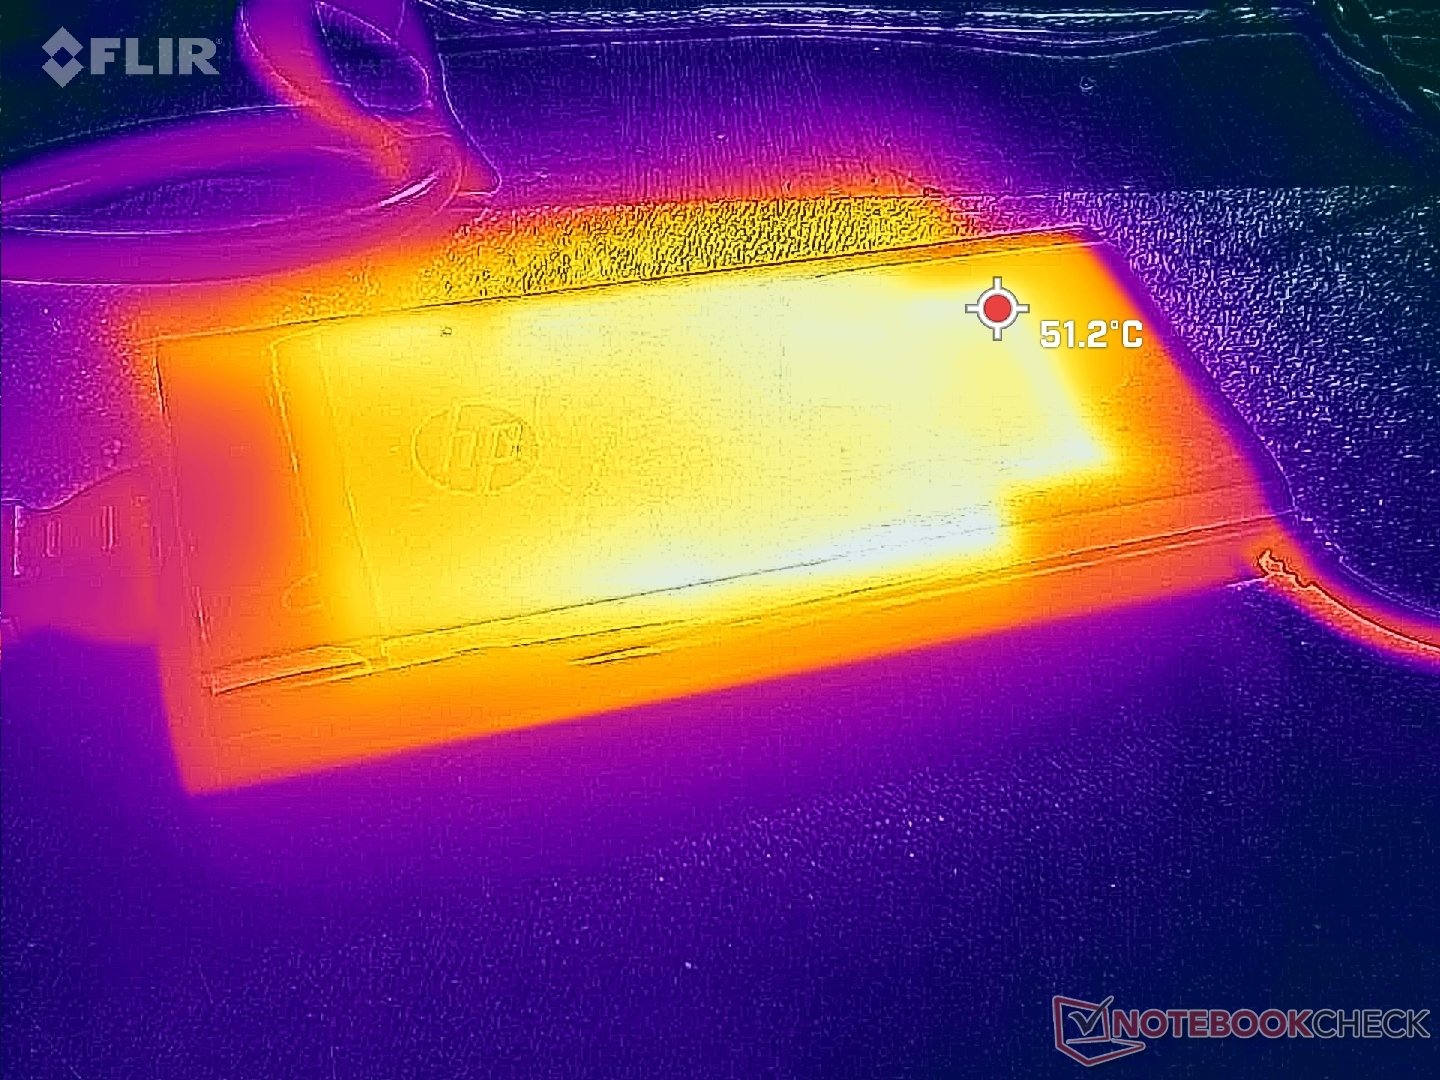
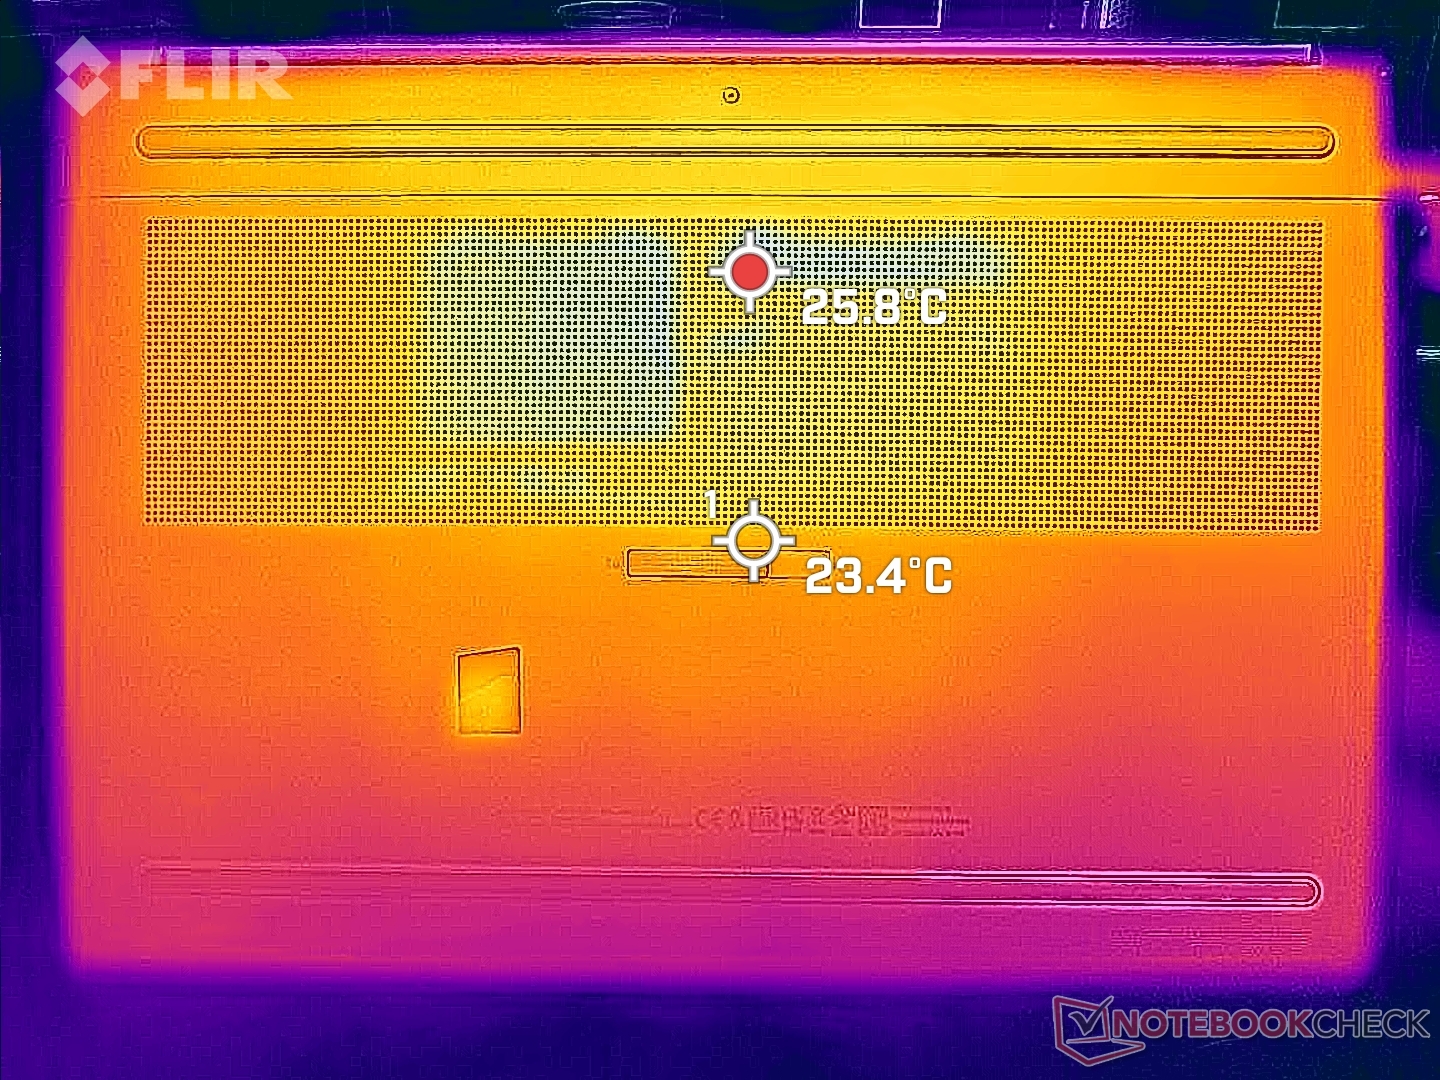
(-) A parte inferior aquece até um máximo de 50.4 °C / 123 F, em comparação com a média de 41.1 °C / 106 F
(+) Em uso inativo, a temperatura média para o lado superior é 27.1 °C / 81 F, em comparação com a média do dispositivo de 32 °C / ### class_avg_f### F.
(±) Jogando The Witcher 3, a temperatura média para o lado superior é 34 °C / 93 F, em comparação com a média do dispositivo de 32 °C / ## #class_avg_f### F.
(+) Os apoios para as mãos e o touchpad estão atingindo a temperatura máxima da pele (35.6 °C / 96.1 F) e, portanto, não estão quentes.
(-) A temperatura média da área do apoio para as mãos de dispositivos semelhantes foi 27.8 °C / 82 F (-7.8 °C / -14.1 F).
| HP ZBook Fury 16 G9 Intel Core i9-12950HX, NVIDIA RTX A5500 Laptop GPU | HP ZBook Studio 16 G9 62U04EA Intel Core i7-12800H, NVIDIA RTX A2000 Laptop GPU | HP ZBook Firefly 16 G9-6B897EA Intel Core i7-1265U, NVIDIA T550 Laptop GPU | Lenovo ThinkPad P16 G1 RTX A5500 Intel Core i9-12950HX, NVIDIA RTX A5500 Laptop GPU | Dell Precision 7000 7670 Performance Intel Core i9-12950HX, NVIDIA RTX A5500 Laptop GPU | MSI CreatorPro Z16P B12UKST Intel Core i7-12700H, NVIDIA RTX A3000 Laptop GPU | |
|---|---|---|---|---|---|---|
| Heat | -1% | -4% | -12% | -15% | -12% | |
| Maximum Upper Side * (°C) | 43.2 | 38.7 10% | 42.1 3% | 44.8 -4% | 53 -23% | 56.3 -30% |
| Maximum Bottom * (°C) | 50.4 | 53.4 -6% | 48 5% | 49.8 1% | 43.2 14% | 68.3 -36% |
| Idle Upper Side * (°C) | 28.6 | 27.3 5% | 29.9 -5% | 30.6 -7% | 36.8 -29% | 25.2 12% |
| Idle Bottom * (°C) | 28.2 | 31.6 -12% | 32.9 -17% | 38.6 -37% | 33.8 -20% | 25.9 8% |
* ... menor é melhor
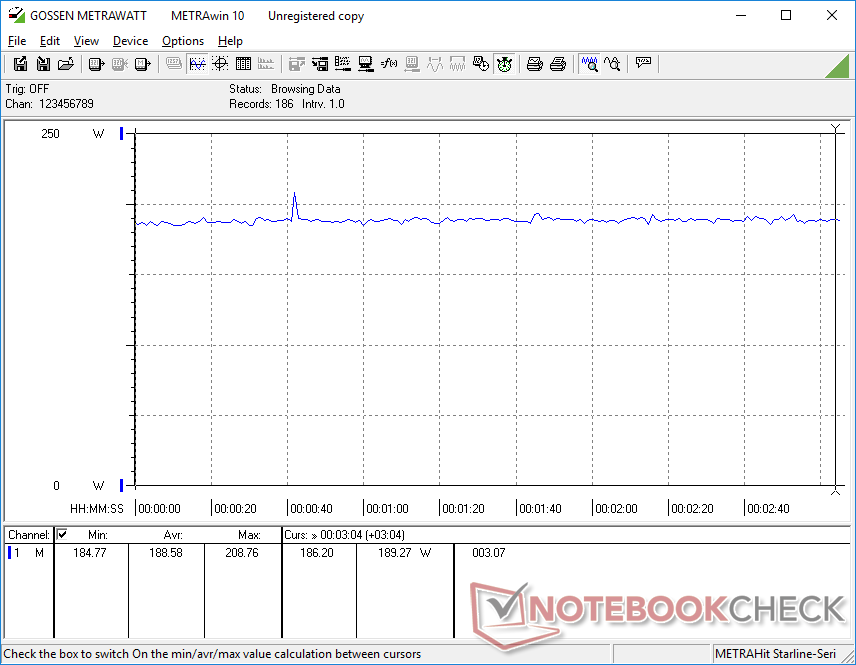
Teste de estresse
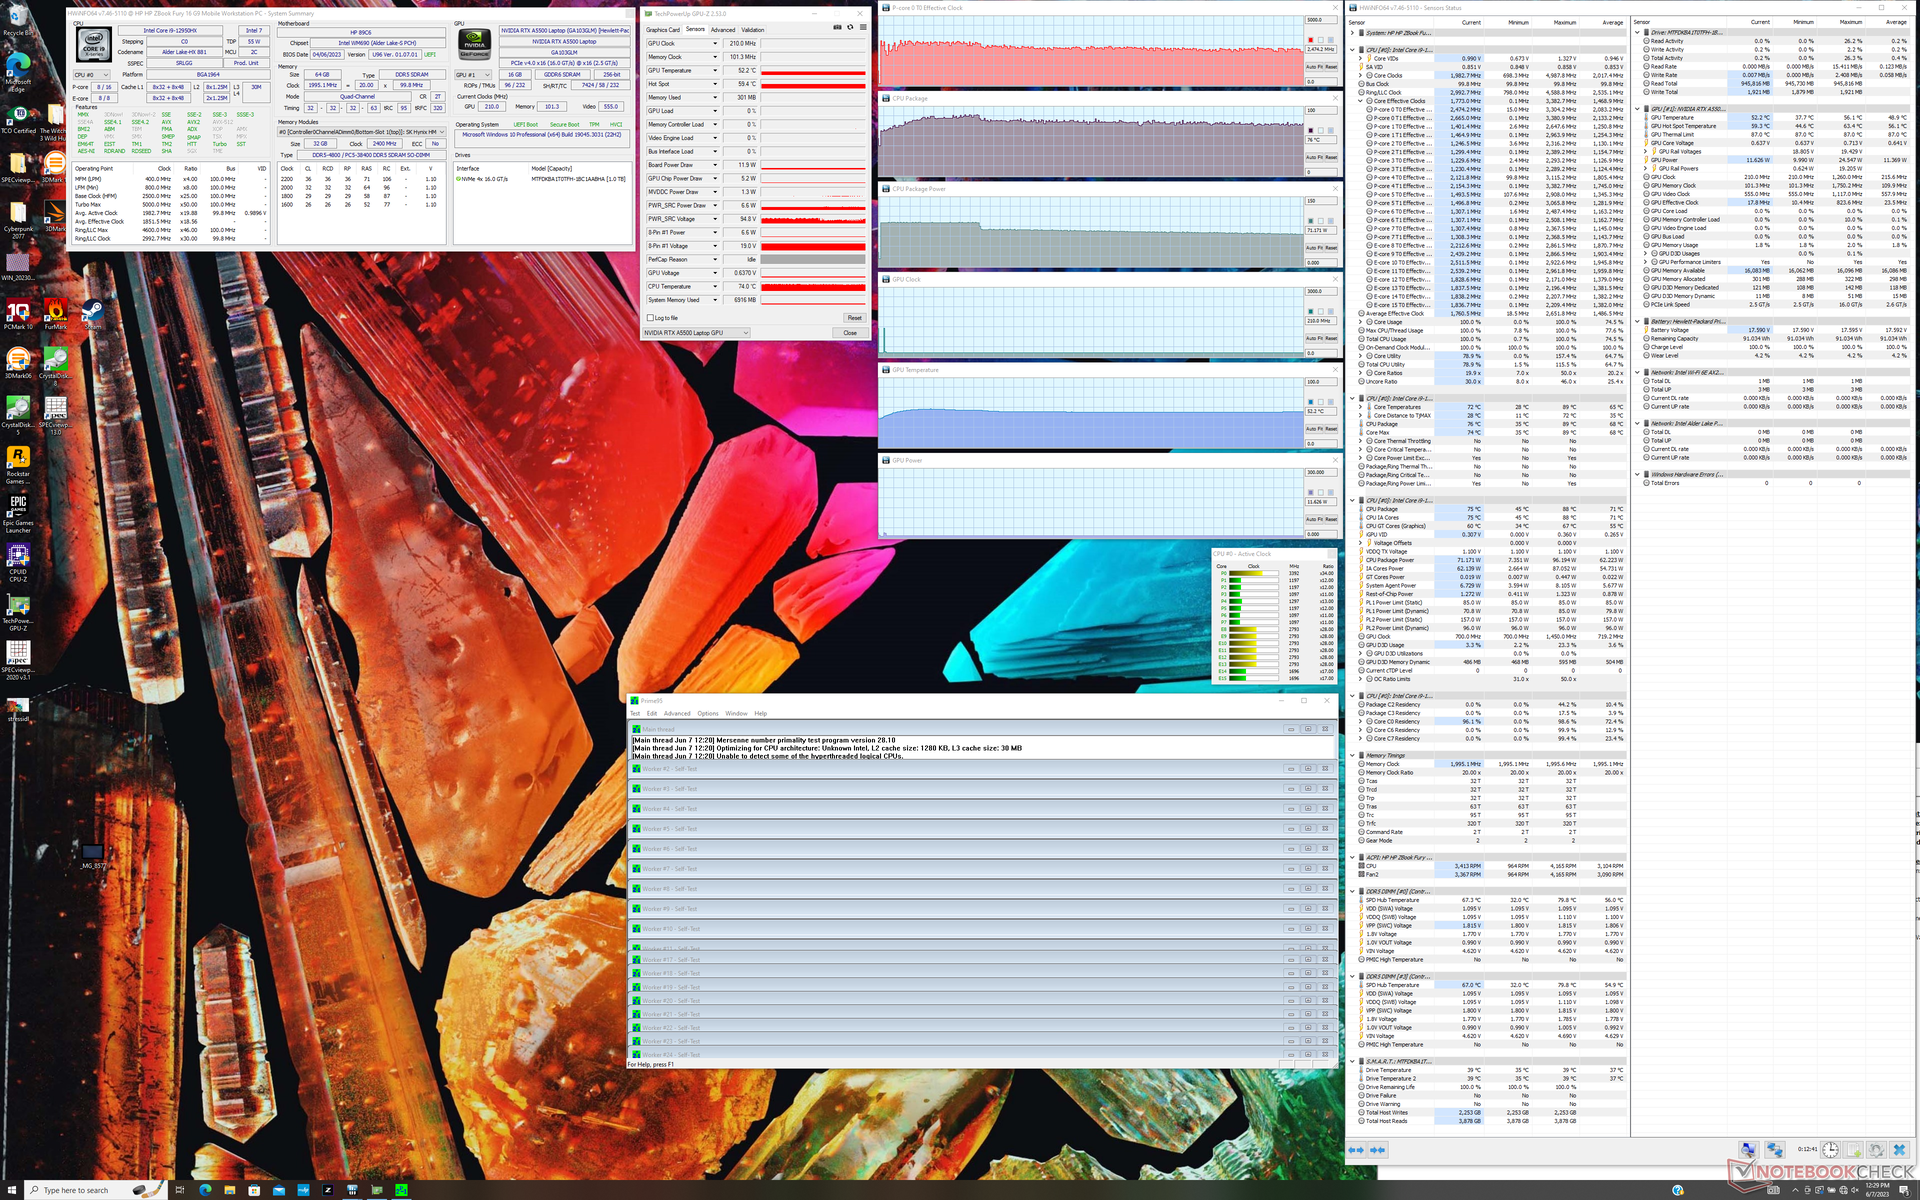
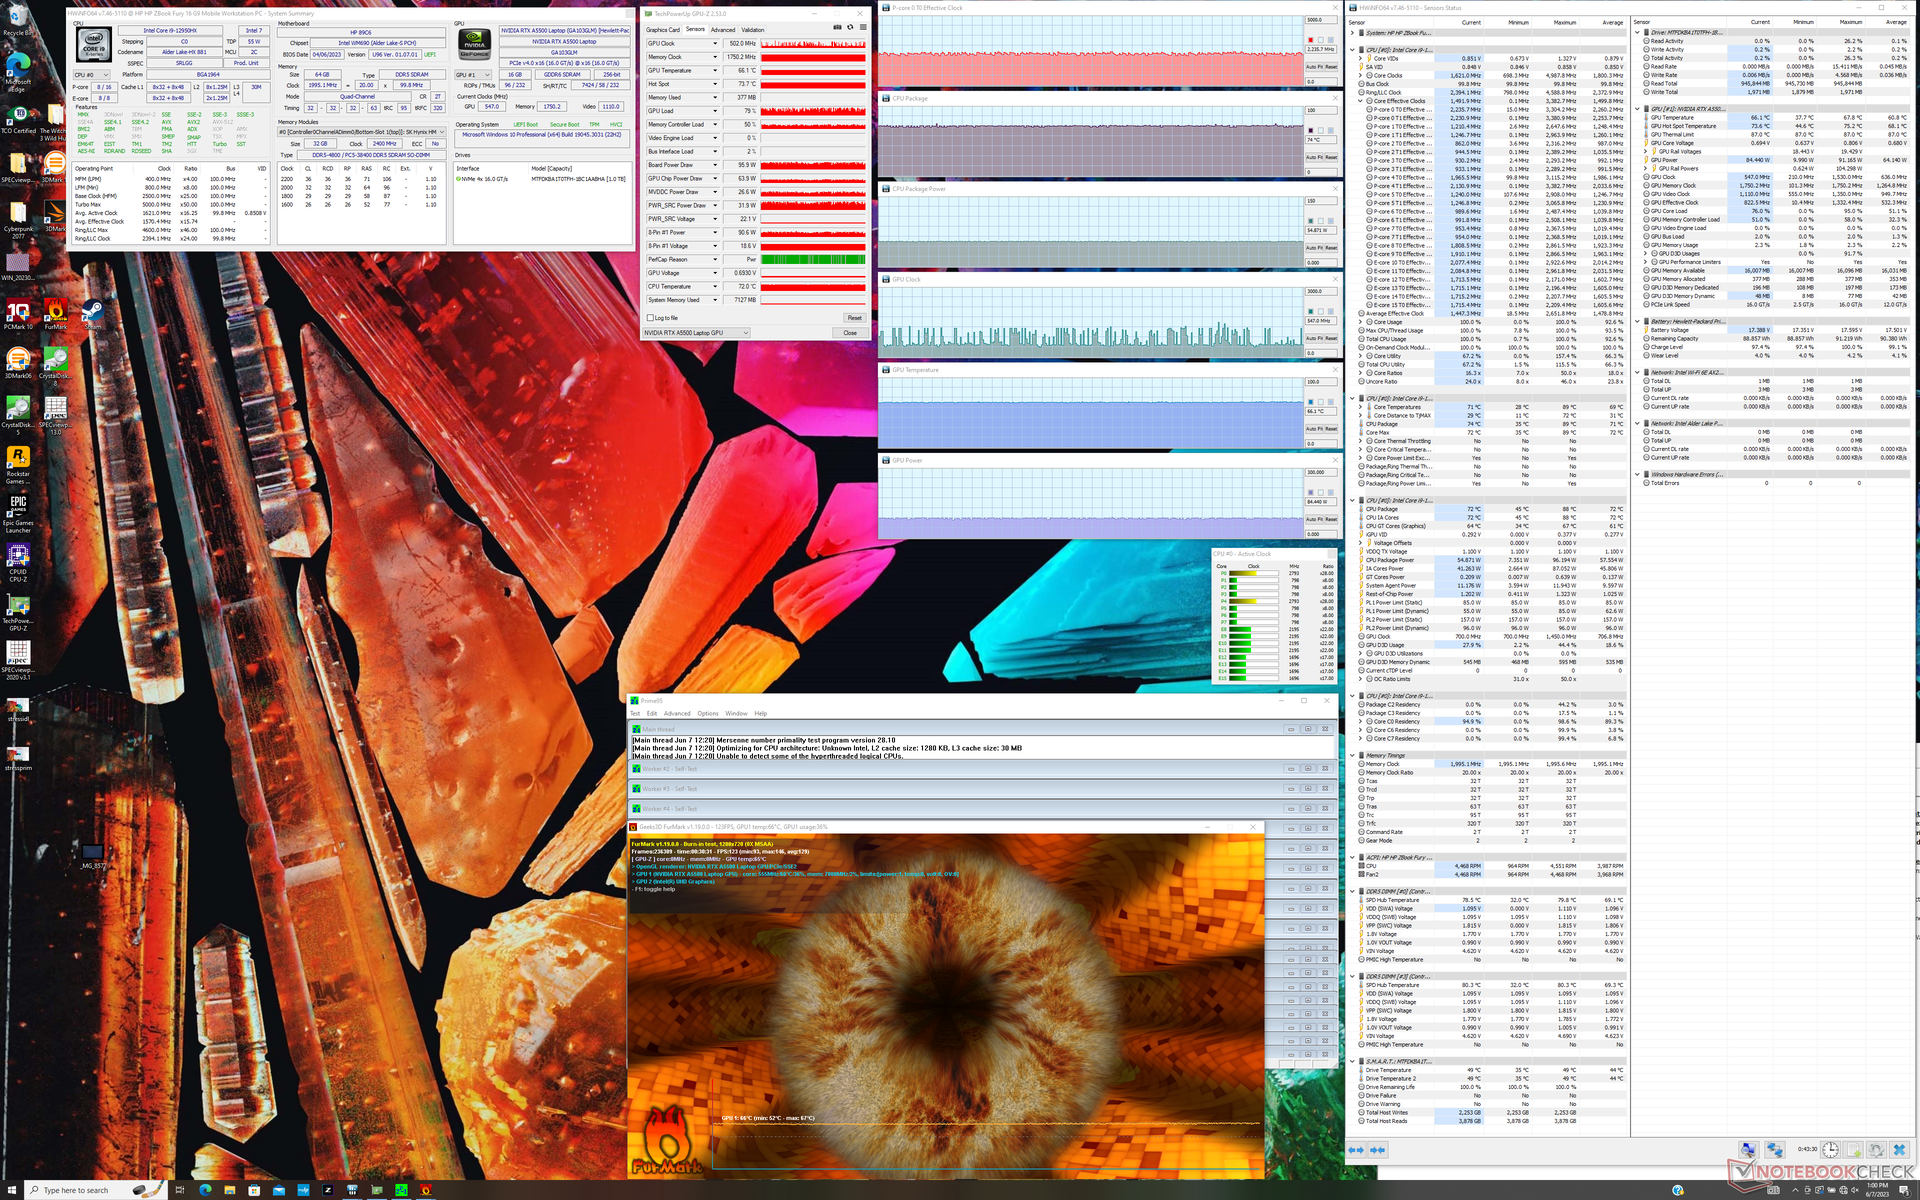
Ao executar o Prime95 para estressar a CPU, as taxas de clock e o consumo de energia da placa aumentam para 3,1 GHz e 96 W, respectivamente, durando apenas alguns minutos ou até que a temperatura do núcleo atinja 89 C. Depois disso, a CPU cairia ainda mais antes de se estabilizar em 2,4 GHz, 76 C e 71 W. Repetindo esse teste no ThinkPad P16 G1 com exatamente o mesmo Core i9-12950HX Resultaria em uma taxa de clock estável mais alta (3,0 GHz) e consumo de energia (81 W) ao custo de uma temperatura de núcleo muito mais alta (100 C). A HP está adotando uma abordagem mais reservada nesse sentido, o que se alinha com nossos resultados do CineBench acima.
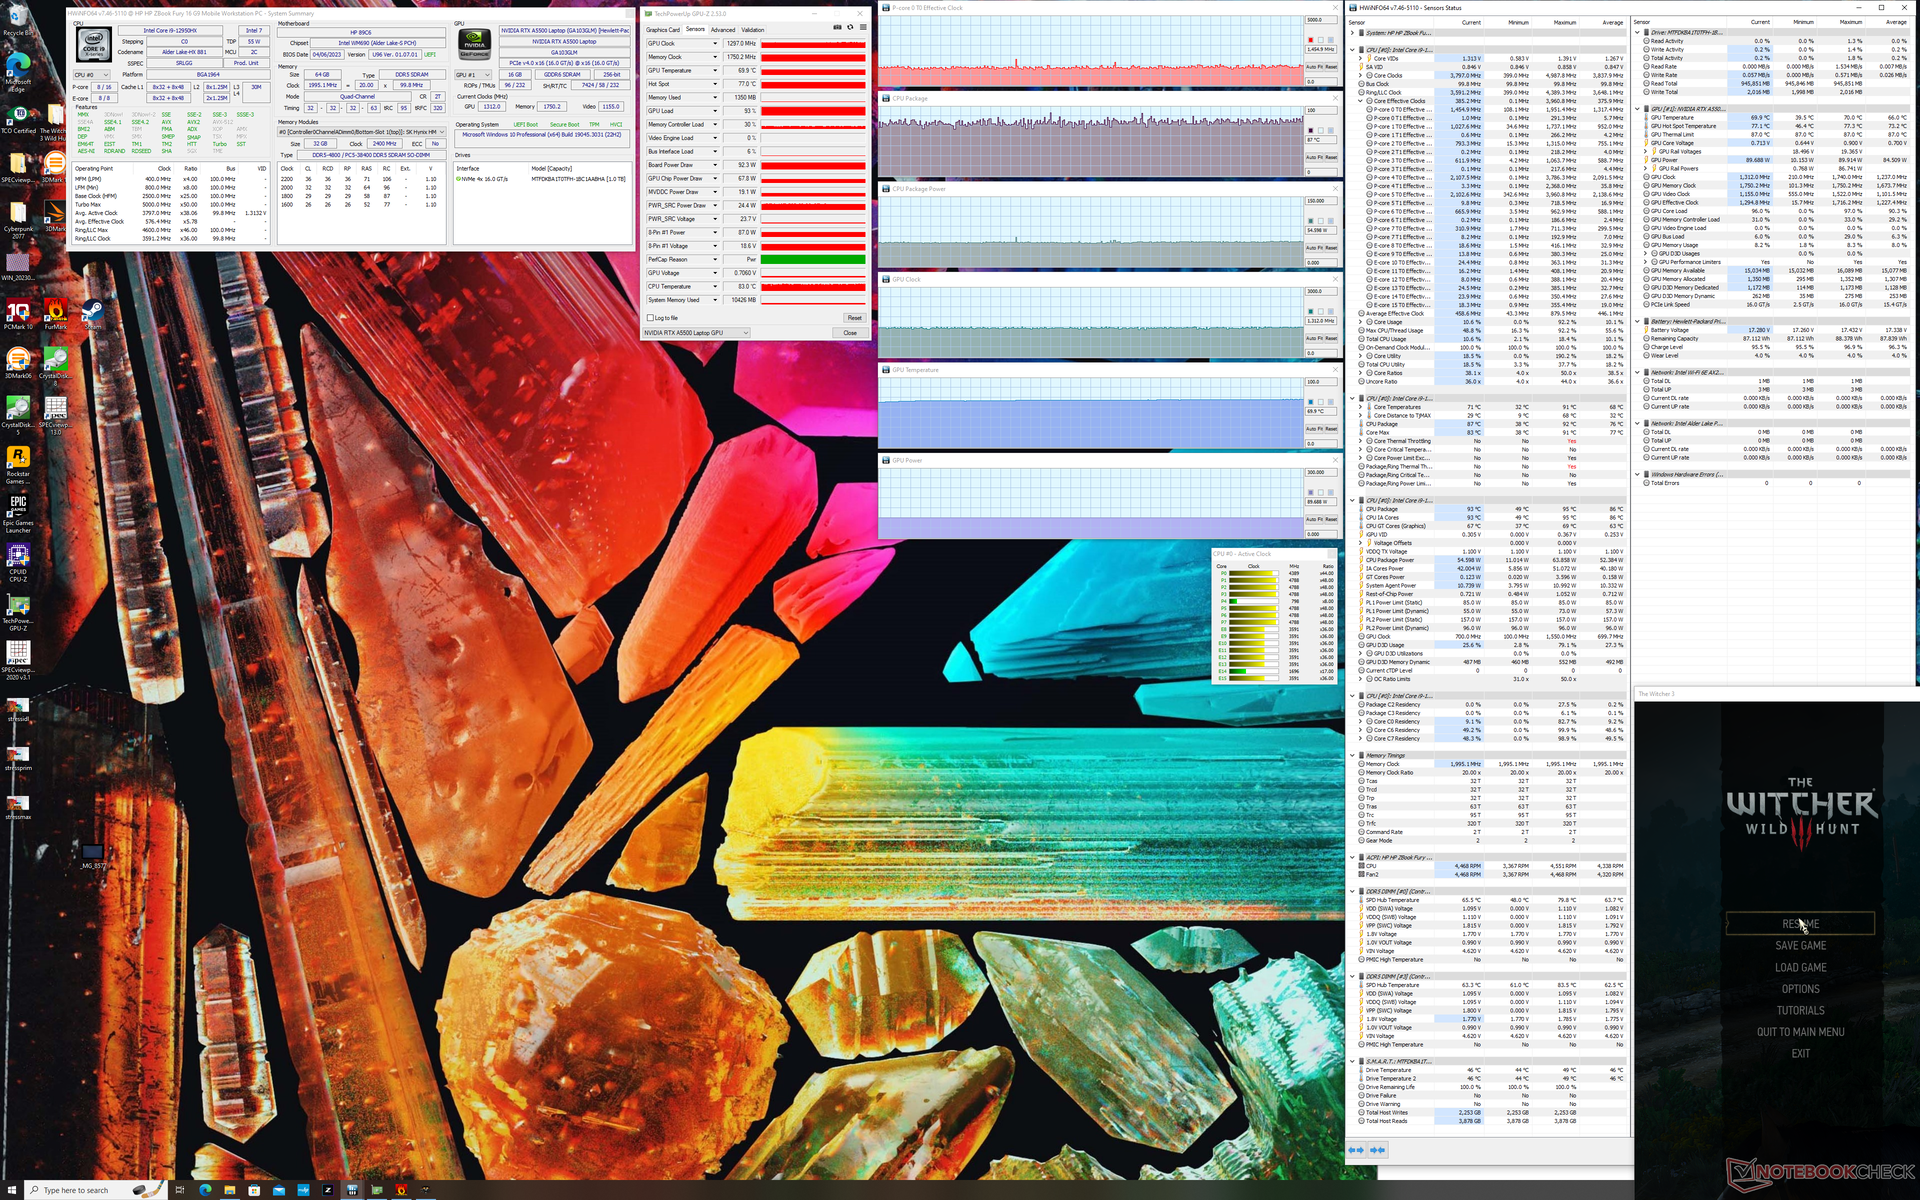
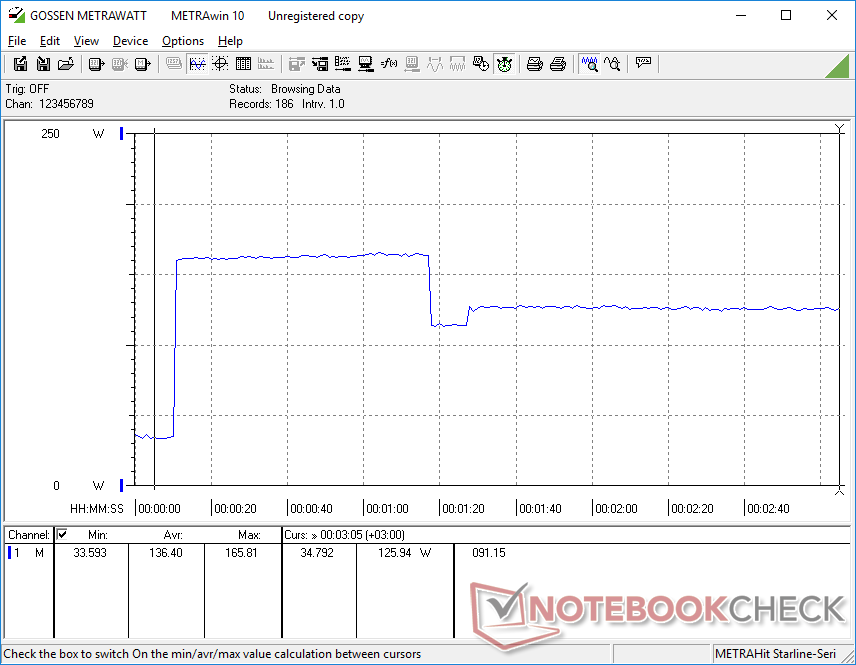
Executar Witcher 3 para representar uma carga gráfica alta resultaria em uma taxa de clock da GPU estável, temperatura e consumo de energia da placa de 1297 MHz, 70 °C e 92 W, respectivamente. Repetir esse teste no ThinkPad P16 G1 resultaria em valores estáveis mais altos em toda a placa, com 1477 MHz, 78 C e 129 W. O clock da memória da GPU também seria mais alto no ThinkPad.
A execução com a energia da bateria limita o desempenho, mesmo quando no perfil de desempenho. Um teste no site Fire Strike com baterias retornaria pontuações de Física e Gráficos de 22837 e 5625 pontos, respectivamente, em comparação com 30270 e 25713 pontos quando ligado à rede elétrica.
| Clock da CPU (GHz) | Clock da GPU (MHz) | Temperatura média da CPU (°C) | Temperatura média da GPU (°C) | |
| Sistema ocioso | -- | -- | 39 | 41 |
| Estresse doPrime95 | 2.5 - 2.7 | -- | 76 | 52 |
| Estresse doPrime95 + FurMark | 2,2 - 2,3 | 547 - 1200 | 74 | 66 |
| Witcher 3 Estresse | ~1,4 | 1297 | 87 | 70 |
Alto-falantes
HP ZBook Fury 16 G9 análise de áudio
(+) | os alto-falantes podem tocar relativamente alto (###valor### dB)
Graves 100 - 315Hz
(-) | quase nenhum baixo - em média 16.1% menor que a mediana
(±) | a linearidade dos graves é média (7.5% delta para a frequência anterior)
Médios 400 - 2.000 Hz
(+) | médios equilibrados - apenas 2.7% longe da mediana
(+) | médios são lineares (3.2% delta para frequência anterior)
Altos 2 - 16 kHz
(+) | agudos equilibrados - apenas 4.2% longe da mediana
(+) | os máximos são lineares (4.9% delta da frequência anterior)
Geral 100 - 16.000 Hz
(+) | o som geral é linear (13.5% diferença em relação à mediana)
Comparado com a mesma classe
» 26% de todos os dispositivos testados nesta classe foram melhores, 5% semelhantes, 70% piores
» O melhor teve um delta de 7%, a média foi 17%, o pior foi 35%
Comparado com todos os dispositivos testados
» 14% de todos os dispositivos testados foram melhores, 4% semelhantes, 82% piores
» O melhor teve um delta de 4%, a média foi 23%, o pior foi 134%
Apple MacBook Pro 16 2021 M1 Pro análise de áudio
(+) | os alto-falantes podem tocar relativamente alto (###valor### dB)
Graves 100 - 315Hz
(+) | bons graves - apenas 3.8% longe da mediana
(+) | o baixo é linear (5.2% delta para a frequência anterior)
Médios 400 - 2.000 Hz
(+) | médios equilibrados - apenas 1.3% longe da mediana
(+) | médios são lineares (2.1% delta para frequência anterior)
Altos 2 - 16 kHz
(+) | agudos equilibrados - apenas 1.9% longe da mediana
(+) | os máximos são lineares (2.7% delta da frequência anterior)
Geral 100 - 16.000 Hz
(+) | o som geral é linear (4.6% diferença em relação à mediana)
Comparado com a mesma classe
» 0% de todos os dispositivos testados nesta classe foram melhores, 0% semelhantes, 100% piores
» O melhor teve um delta de 5%, a média foi 17%, o pior foi 45%
Comparado com todos os dispositivos testados
» 0% de todos os dispositivos testados foram melhores, 0% semelhantes, 100% piores
» O melhor teve um delta de 4%, a média foi 23%, o pior foi 134%
Gerenciamento de energia
Consumo de energia
O consumo de energia é relativamente alto em todos os equipamentos. Por exemplo, um desktop em marcha lenta consumiria pouco mais de 19 W, mesmo com o perfil de economia de energia e a configuração de brilho mínimo, em comparação com 7 W ou 16 W no ThinkPad P16 G1 ou no Precision 7670, respectivamente. A execução de cargas mais exigentes, como Witcher 3 consumiria 189 W ou quase 30 W a mais do que no Precision 7670, embora o Dell ofereça um desempenho gráfico ligeiramente mais rápido.
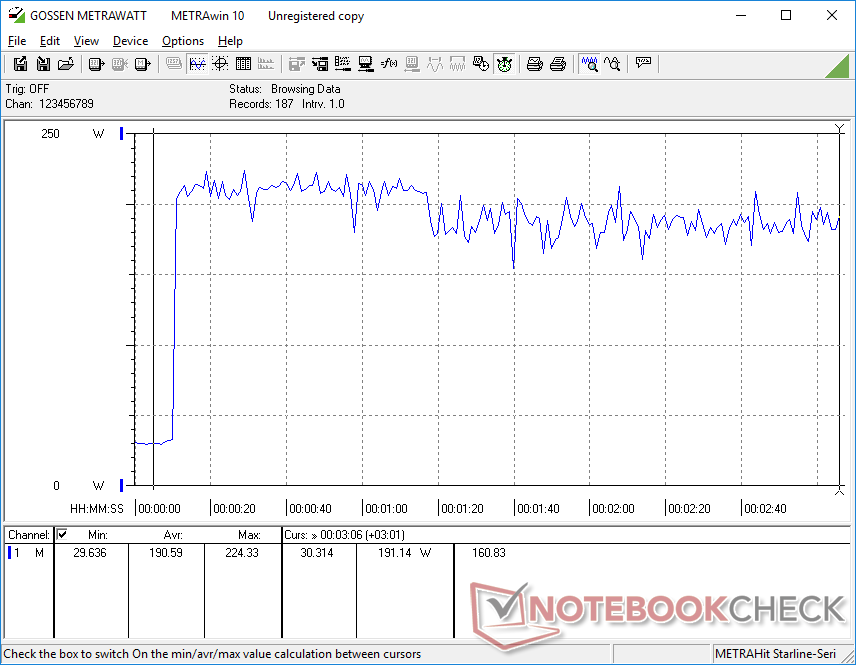
Conseguimos registrar um consumo máximo temporário de 224 W do adaptador CA de 230 W de tamanho médio (~18 x 8,9 x 2,7 cm) quando a CPU e a GPU estão com 100% de utilização. Portanto, o carregamento seria lento e lento se fossem executadas cargas tão altas simultaneamente. Repetir esse teste no Precision 7670 ou no ThinkPad P16 G1 resultaria em níveis de consumo de energia temporários muito mais altos, de cerca de 300 W cada, já que eles têm metas de TGP/TDP mais altas e, portanto, tetos de Turbo Boost mais altos.

| desligado | |
| Ocioso | |
| Carga |
|
Key:
min: | |
| HP ZBook Fury 16 G9 i9-12950HX, RTX A5500 Laptop GPU, Micron 3400 1TB MTFDKBA1T0TFH, IPS, 3840x2400, 16" | HP ZBook Studio 16 G9 62U04EA i7-12800H, RTX A2000 Laptop GPU, Micron 3400 1TB MTFDKBA1T0TFH, IPS, 3840x2400, 16" | HP ZBook Firefly 16 G9-6B897EA i7-1265U, T550 Laptop GPU, Samsung PM9A1 MZVL21T0HCLR, IPS, 1920x1200, 16" | Lenovo ThinkPad P16 G1 RTX A5500 i9-12950HX, RTX A5500 Laptop GPU, WDC PC SN810 2TB, IPS, 3840x2400, 16" | Dell Precision 7000 7670 Performance i9-12950HX, RTX A5500 Laptop GPU, , OLED, 3840x2400, 16" | MSI CreatorPro Z16P B12UKST i7-12700H, RTX A3000 Laptop GPU, Samsung PM9A1 MZVL21T0HCLR, IPS, 2560x1600, 16" | |
|---|---|---|---|---|---|---|
| Power Consumption | 40% | 71% | 10% | -8% | 35% | |
| Idle Minimum * (Watt) | 19.5 | 7.2 63% | 4.5 77% | 7.5 62% | 16.4 16% | 10.8 45% |
| Idle Average * (Watt) | 29 | 18.1 38% | 8 72% | 20.1 31% | 35.9 -24% | 16.3 44% |
| Idle Maximum * (Watt) | 40.7 | 18.5 55% | 8.7 79% | 40 2% | 47 -15% | 16.9 58% |
| Load Average * (Watt) | 142.1 | 112.8 21% | 48.3 66% | 137 4% | 147.1 -4% | 111.7 21% |
| Witcher 3 ultra * (Watt) | 188.6 | 106.7 43% | 45.3 76% | 208 -10% | 158.8 16% | 152.1 19% |
| Load Maximum * (Watt) | 224.4 | 186 17% | 94.7 58% | 285.9 -27% | 311 -39% | 177.4 21% |
* ... menor é melhor
Power Consumption Witcher 3 / Stresstest
Power Consumption external Monitor
Duração da bateria - tempos de execução com erros
O tempo de funcionamento da WLAN de 6 horas é comparável ao doZBook Studio 16 G9 e ao ThinkPad P16 G1, sendo mais de uma hora maior do que o Precision 7670. O ZBook Firefly 16 G9, mais fino, pode durar quase duas vezes mais, pois utiliza uma CPU Core U-series mais lenta.
O carregamento da bateria de 95 Wh, desde o estado vazio até a capacidade total, é rápido e dura pouco mais de uma hora com o adaptador CA incluído. O sistema também pode ser recarregado por meio de adaptadores USB-C de terceiros, mas a compatibilidade não é garantida para capacidades menores. Por exemplo, ao conectar nosso adaptador USB-C de 65 W ao Fury 16 G9, o Windows exibiria uma janela pop-up alegando que a energia para carregar era insuficiente. Por outro lado, nosso adaptador CA USB-C de 130 W carregaria o sistema sem nenhum problema. O desempenho é reduzido ao carregar via USB-C, como era de se esperar.
Estranhamente, a duração da bateria quando ociosa no Power Saver e na configuração de brilho mais baixa seria menor do que em nossas configurações de WLAN balanceada, mesmo depois de vários novos testes. Provavelmente, esse é um bug do modelo que aponta para o gerenciamento deficiente de recursos em segundo plano ou estados de CPU com bugs relacionados às configurações do perfil de energia do Windows.
| HP ZBook Fury 16 G9 i9-12950HX, RTX A5500 Laptop GPU, 95 Wh | HP ZBook Studio 16 G9 62U04EA i7-12800H, RTX A2000 Laptop GPU, 86 Wh | HP ZBook Firefly 16 G9-6B897EA i7-1265U, T550 Laptop GPU, 76 Wh | Lenovo ThinkPad P16 G1 RTX A5500 i9-12950HX, RTX A5500 Laptop GPU, 94 Wh | Dell Precision 7000 7670 Performance i9-12950HX, RTX A5500 Laptop GPU, 93 Wh | MSI CreatorPro Z16P B12UKST i7-12700H, RTX A3000 Laptop GPU, 90 Wh | |
|---|---|---|---|---|---|---|
| Duração da bateria | -2% | 92% | -3% | -22% | -3% | |
| Reader / Idle (h) | 5.3 | |||||
| WiFi v1.3 (h) | 6 | 6.3 5% | 13 117% | 5.8 -3% | 4.7 -22% | 5.8 -3% |
| Load (h) | 1.2 | 1.1 -8% | 2 67% | |||
| H.264 (h) | 8.5 | 18.4 |
Pro
Contra
Veredicto - Bom desempenho, mas a Lenovo e a Dell fazem isso mais rápido
O ZBook Fury 16 G9 oferece recursos que não estão disponíveis na maioria das outras estações de trabalho móveis. O painel superbrilhante de 1000 nits, OLED opcional, iluminação RGB por tecla, tecla programável dedicada e suporte para até 4 SSDs e 4 módulos SODIMM são recursos que os entusiastas podem apreciar. Enquanto isso, o teclado e o touchpad confortáveis são algo que gostaríamos que outros fabricantes pudessem imitar.
A principal desvantagem que impede que o ZBook Fury 16 G9 seja uma recomendação imediata é o fato de seu desempenho ser mais acentuado quando comparado ao Lenovo ThinkPad P16 G1 ou Dell Precision 7670. Embora seja verdade que o HP pode suportar 4 unidades internas, o desempenho dessas unidades tende a diminuir quando estressado. Também é decepcionante o fato de o RTX A5500 ter como meta um TGP de apenas 100 W, quando os modelos da Lenovo e da Dell mencionados acima têm como meta ~130 W para um desempenho mais rápido. Até mesmo a CPU tem um desempenho ligeiramente inferior quando comparada a outros modelos com a mesma opção de processador.
A HP ZBook Fury 16 G9 é mais leve e tem mais recursos do que muitas outras estações de trabalho de 16 polegadas. No entanto, o desempenho é um pouco prejudicado devido às metas mais baixas de TGP e TDP e ao resfriamento insuficiente da SSD.
Se os recursos auxiliares acima não lhe interessam, é melhor maximizar o desempenho optando pelo ThinkPad P16 G1 ou pelo Precision 7670. No entanto, se você não se importar em reduzir um pouco o desempenho por causa desses recursos, talvez valha a pena considerar o HP Fury, que é mais leve.
Preço e disponibilidade
A HP agora está enviando seu ZBook Fury 16 G9 a partir de US$ 1490 para a configuração básica até mais de US$ 4.000 para a nossa configuração de análise. O Fury 16 G10 também está disponível.
HP ZBook Fury 16 G9
- 06/09/2023 v7 (old)
Allen Ngo
Transparência
A seleção dos dispositivos a serem analisados é feita pela nossa equipe editorial. A amostra de teste foi fornecida ao autor como empréstimo pelo fabricante ou varejista para fins desta revisão. O credor não teve influência nesta revisão, nem o fabricante recebeu uma cópia desta revisão antes da publicação. Não houve obrigação de publicar esta revisão. Como empresa de mídia independente, a Notebookcheck não está sujeita à autoridade de fabricantes, varejistas ou editores.
É assim que o Notebookcheck está testando
Todos os anos, o Notebookcheck analisa de forma independente centenas de laptops e smartphones usando procedimentos padronizados para garantir que todos os resultados sejam comparáveis. Desenvolvemos continuamente nossos métodos de teste há cerca de 20 anos e definimos padrões da indústria no processo. Em nossos laboratórios de teste, equipamentos de medição de alta qualidade são utilizados por técnicos e editores experientes. Esses testes envolvem um processo de validação em vários estágios. Nosso complexo sistema de classificação é baseado em centenas de medições e benchmarks bem fundamentados, o que mantém a objetividade.Price comparison

