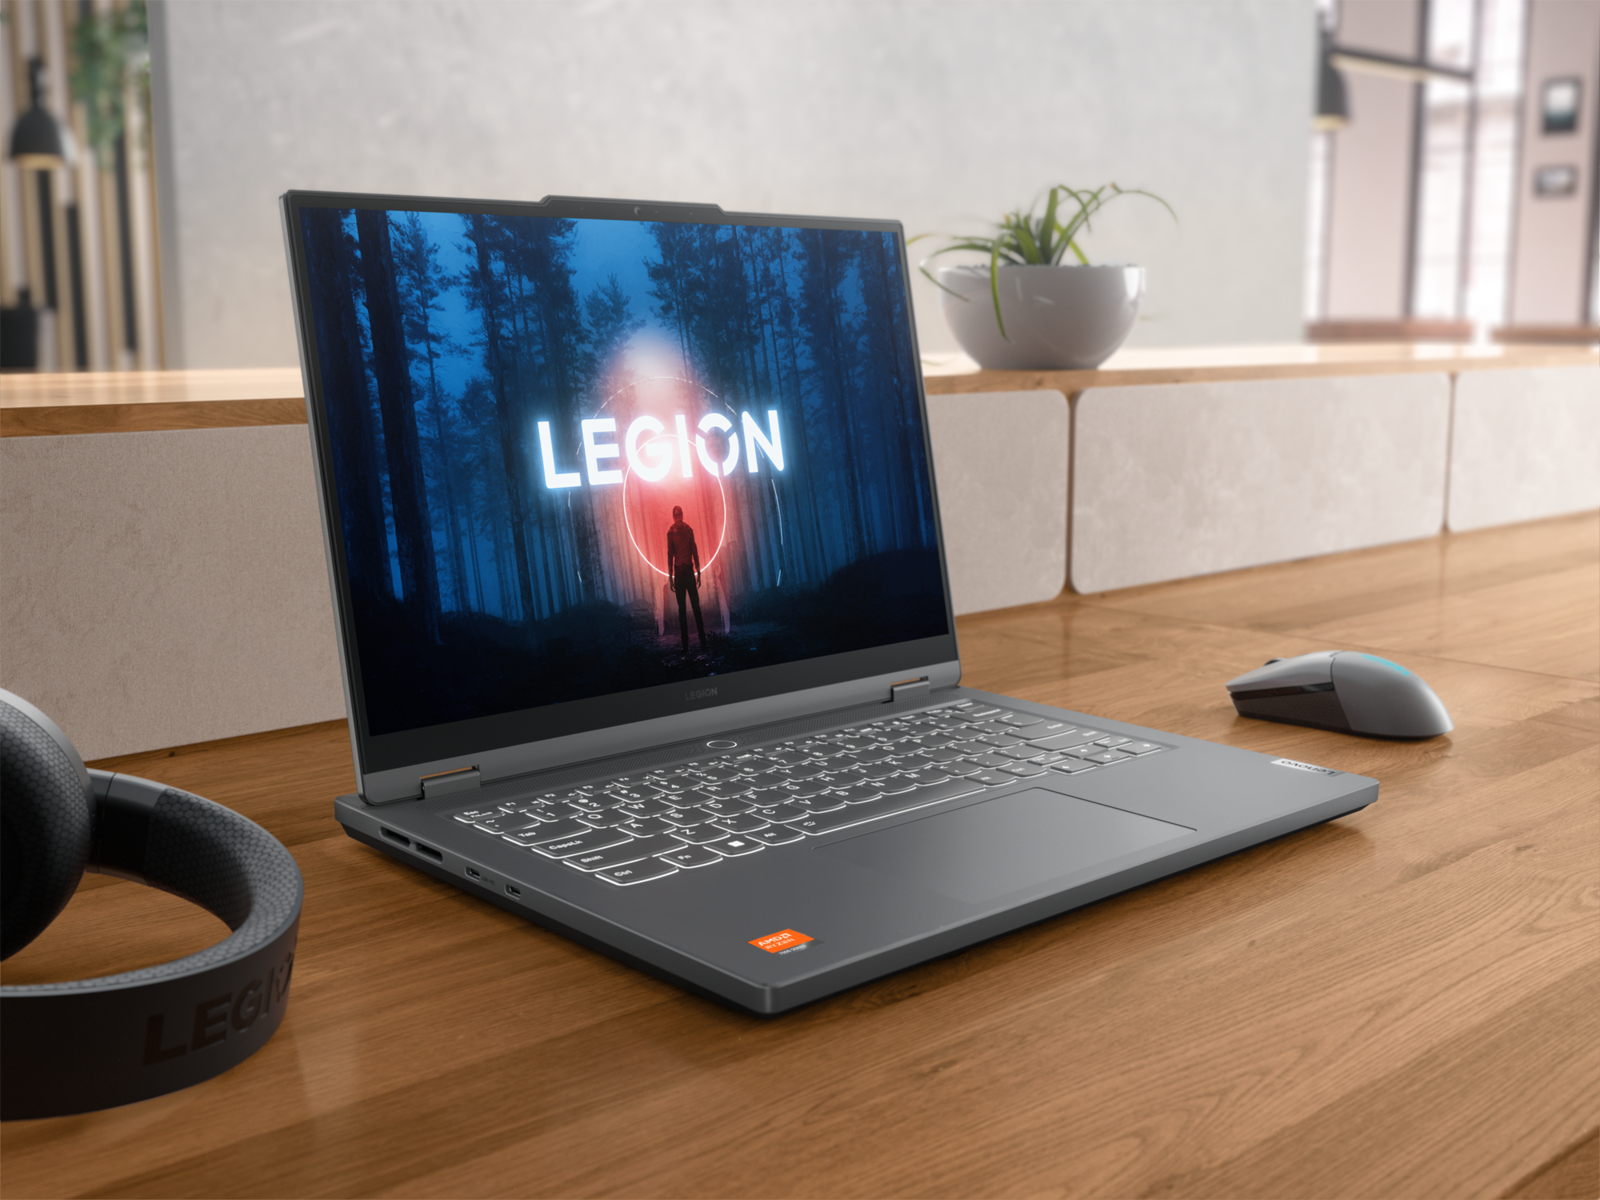
Análise do laptop Lenovo Legion Slim 5 14APH8: o ponto ideal do OLED 2.8K de 120 Hz

O Legion Slim 5 14 é o primeiro e menor laptop de 14 polegadas da família Legion. Ele se diferencia dos outros no mercado com sua tela OLED de 120 Hz e tamanho de tela ligeiramente maior, de 14,5 polegadas, enquanto as alternativas da Razer, Acer ou Asus tendem a vir com painéis IPS de 14,0 polegadas.
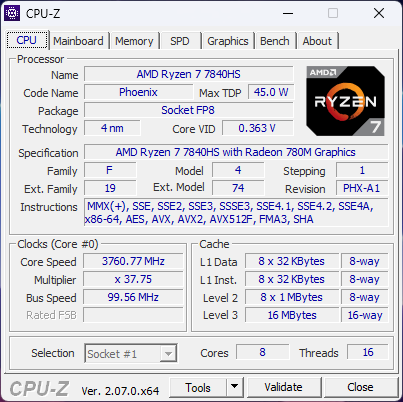
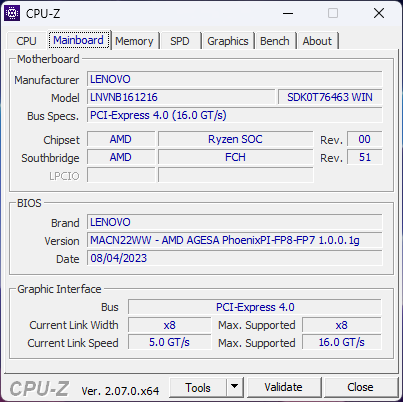
Nossa análise configurou uma SKU de médio porte com o Zen 4 Ryzen 7 7840HS E gráficos de 105 W GeForce RTX 4060 por aproximadamente US$ 1.500 no varejo. Outras SKUs incluem o Ryzen 9 7940HS mais rápido ou o RTX 4050 mais lento, mas a tela OLED sem toque de 14,5 polegadas e 2,8K 120 Hz é fixa em todas as opções. Nenhuma variante da Intel foi anunciada até o momento da publicação.
O modelo da Lenovo compete diretamente com outros notebooks para jogos de 14 polegadas, como oAcer Predator Triton 14, Razer Blade 14,Asus ROG Zephyrus G14ou Alienware x14.
Mais análises da Lenovo:
Possíveis concorrentes em comparação
Avaliação | Data | Modelo | Peso | Altura | Size | Resolução | Preço |
|---|---|---|---|---|---|---|---|
| 87.7 % v7 (old) | 09/2023 | Lenovo Legion Slim 5 14APH8 R7 7840HS, GeForce RTX 4060 Laptop GPU | 1.7 kg | 20.79 mm | 14.50" | 2880x1600 | |
| 87.3 % v7 (old) | 07/2023 | Acer Predator Triton 14 PT14-51 i7-13700H, GeForce RTX 4050 Laptop GPU | 1.7 kg | 19.81 mm | 14.00" | 2560x1600 | |
| 88.7 % v7 (old) | 06/2023 | Razer Blade 14 RTX 4070 R9 7940HS, GeForce RTX 4070 Laptop GPU | 1.8 kg | 17.99 mm | 14.00" | 2560x1600 | |
| 90 % v7 (old) | 05/2023 | Asus ROG Zephyrus G14 GA402XY R9 7940HS, GeForce RTX 4090 Laptop GPU | 1.7 kg | 20.5 mm | 14.00" | 2560x1600 | |
| 86.7 % v7 (old) | 03/2022 | Alienware x14 i7 RTX 3060 i7-12700H, GeForce RTX 3060 Laptop GPU | 1.8 kg | 14.5 mm | 14.00" | 1920x1080 | |
| 85.7 % v7 (old) | 07/2023 | Lenovo LOQ 15APH8 R7 7840HS, GeForce RTX 4050 Laptop GPU | 2.5 kg | 25.2 mm | 15.60" | 1920x1080 |
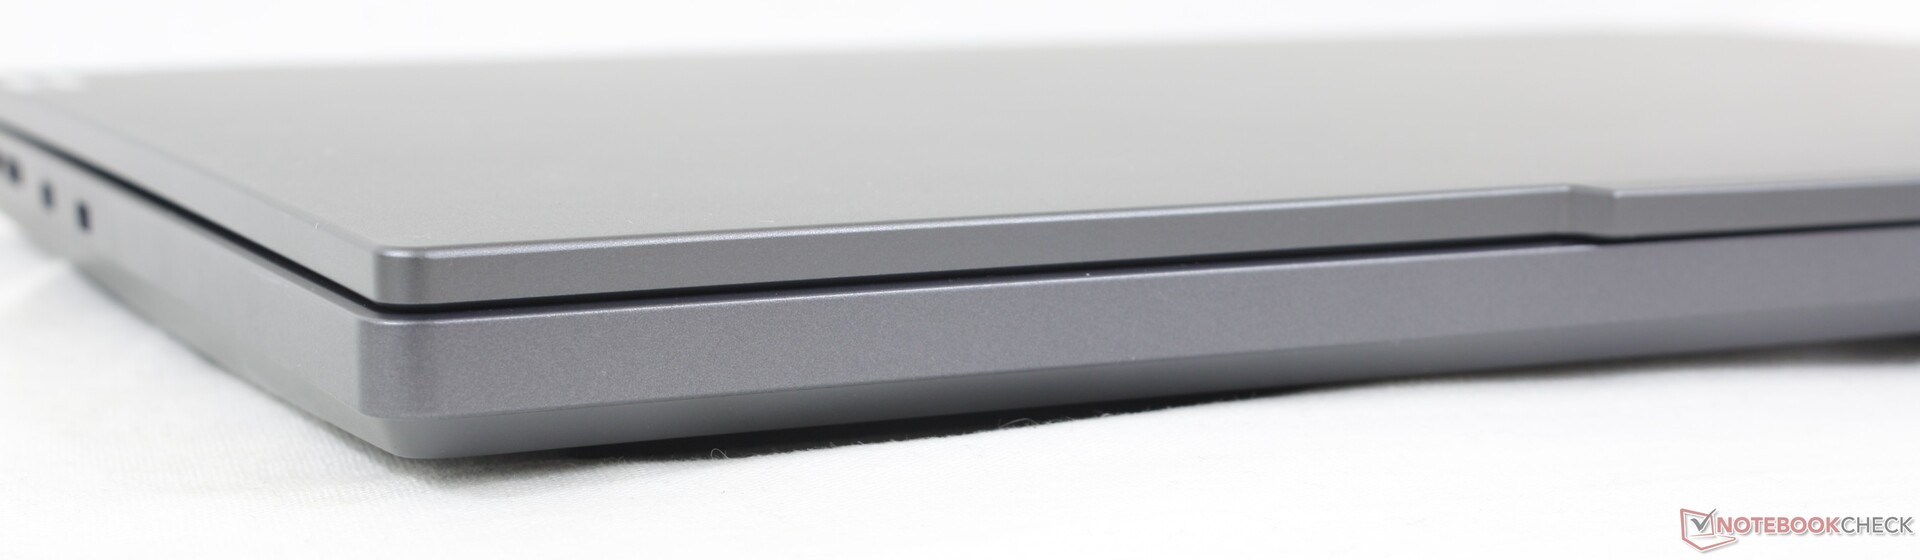
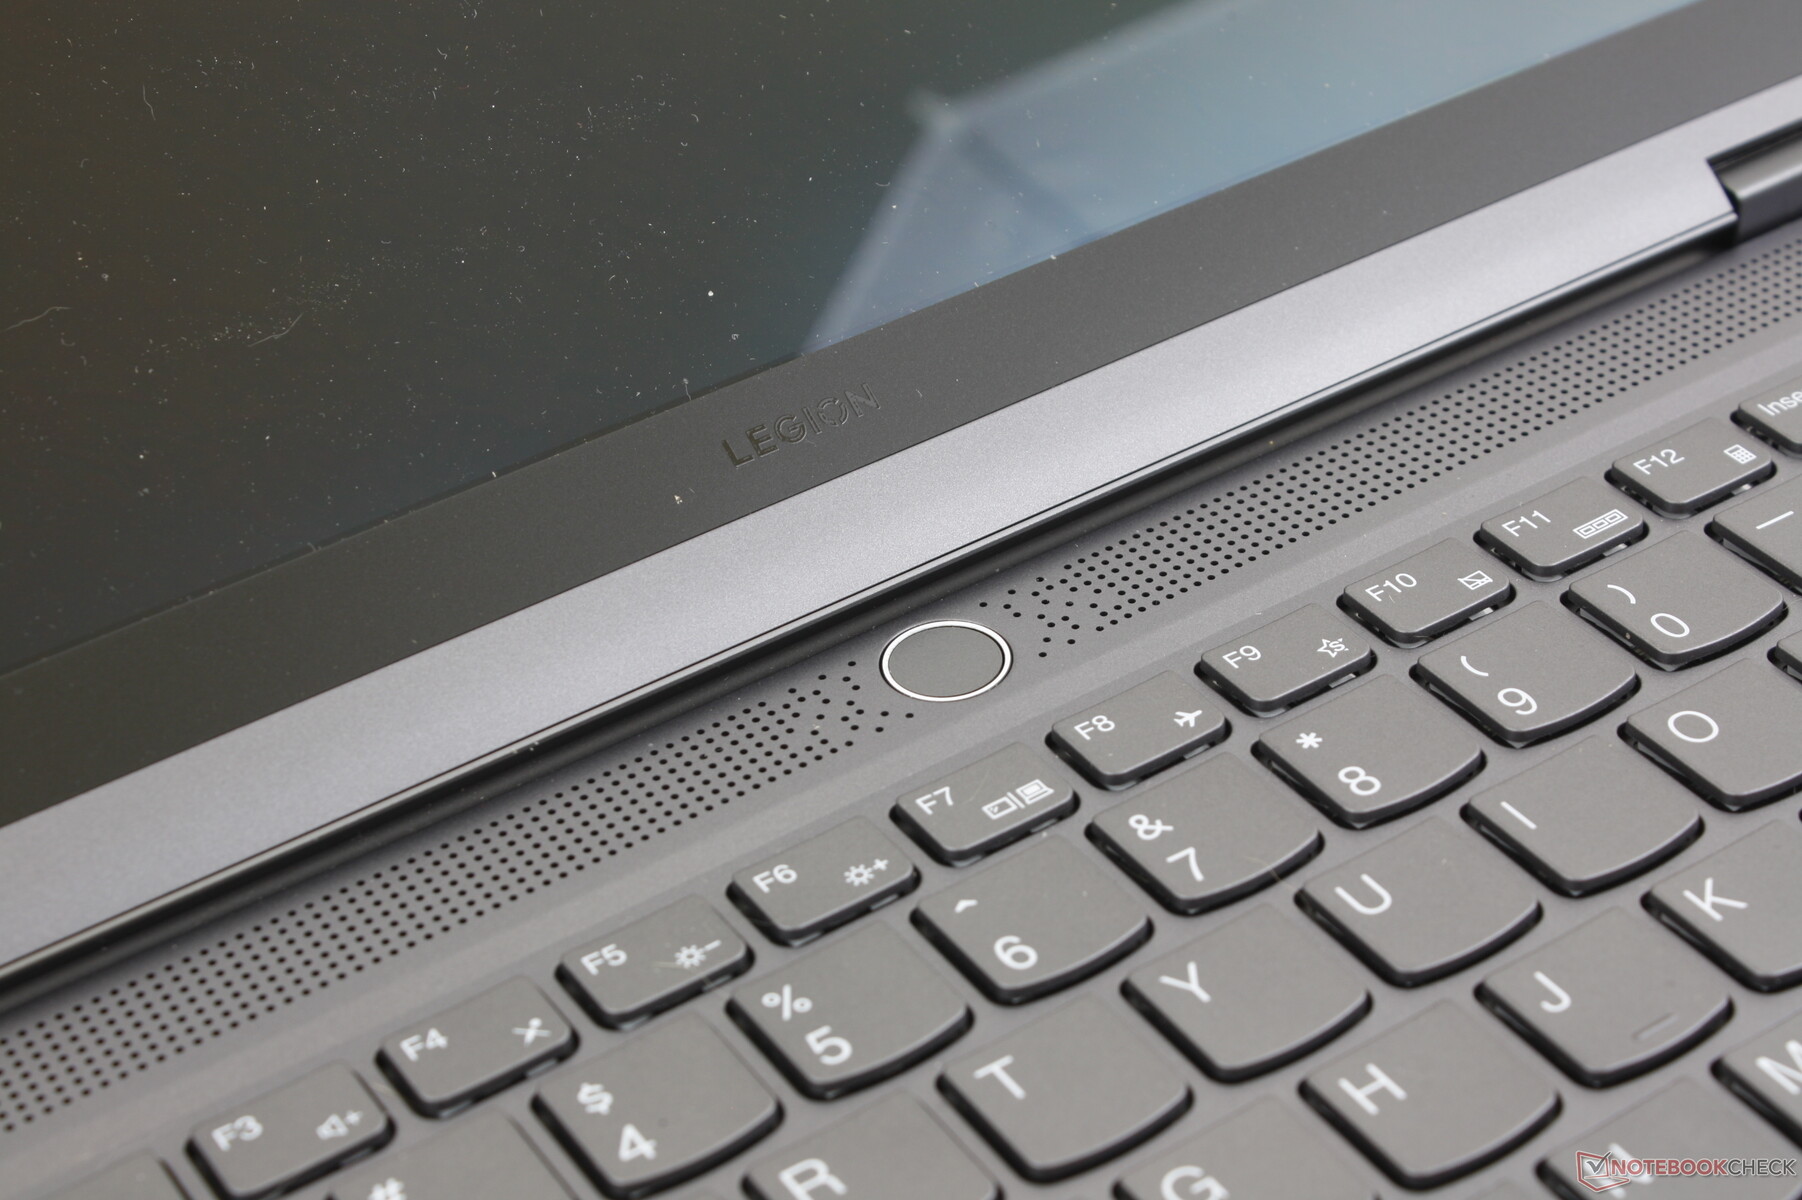
Case - Look Like A ThinkBook, Game Like A Legion
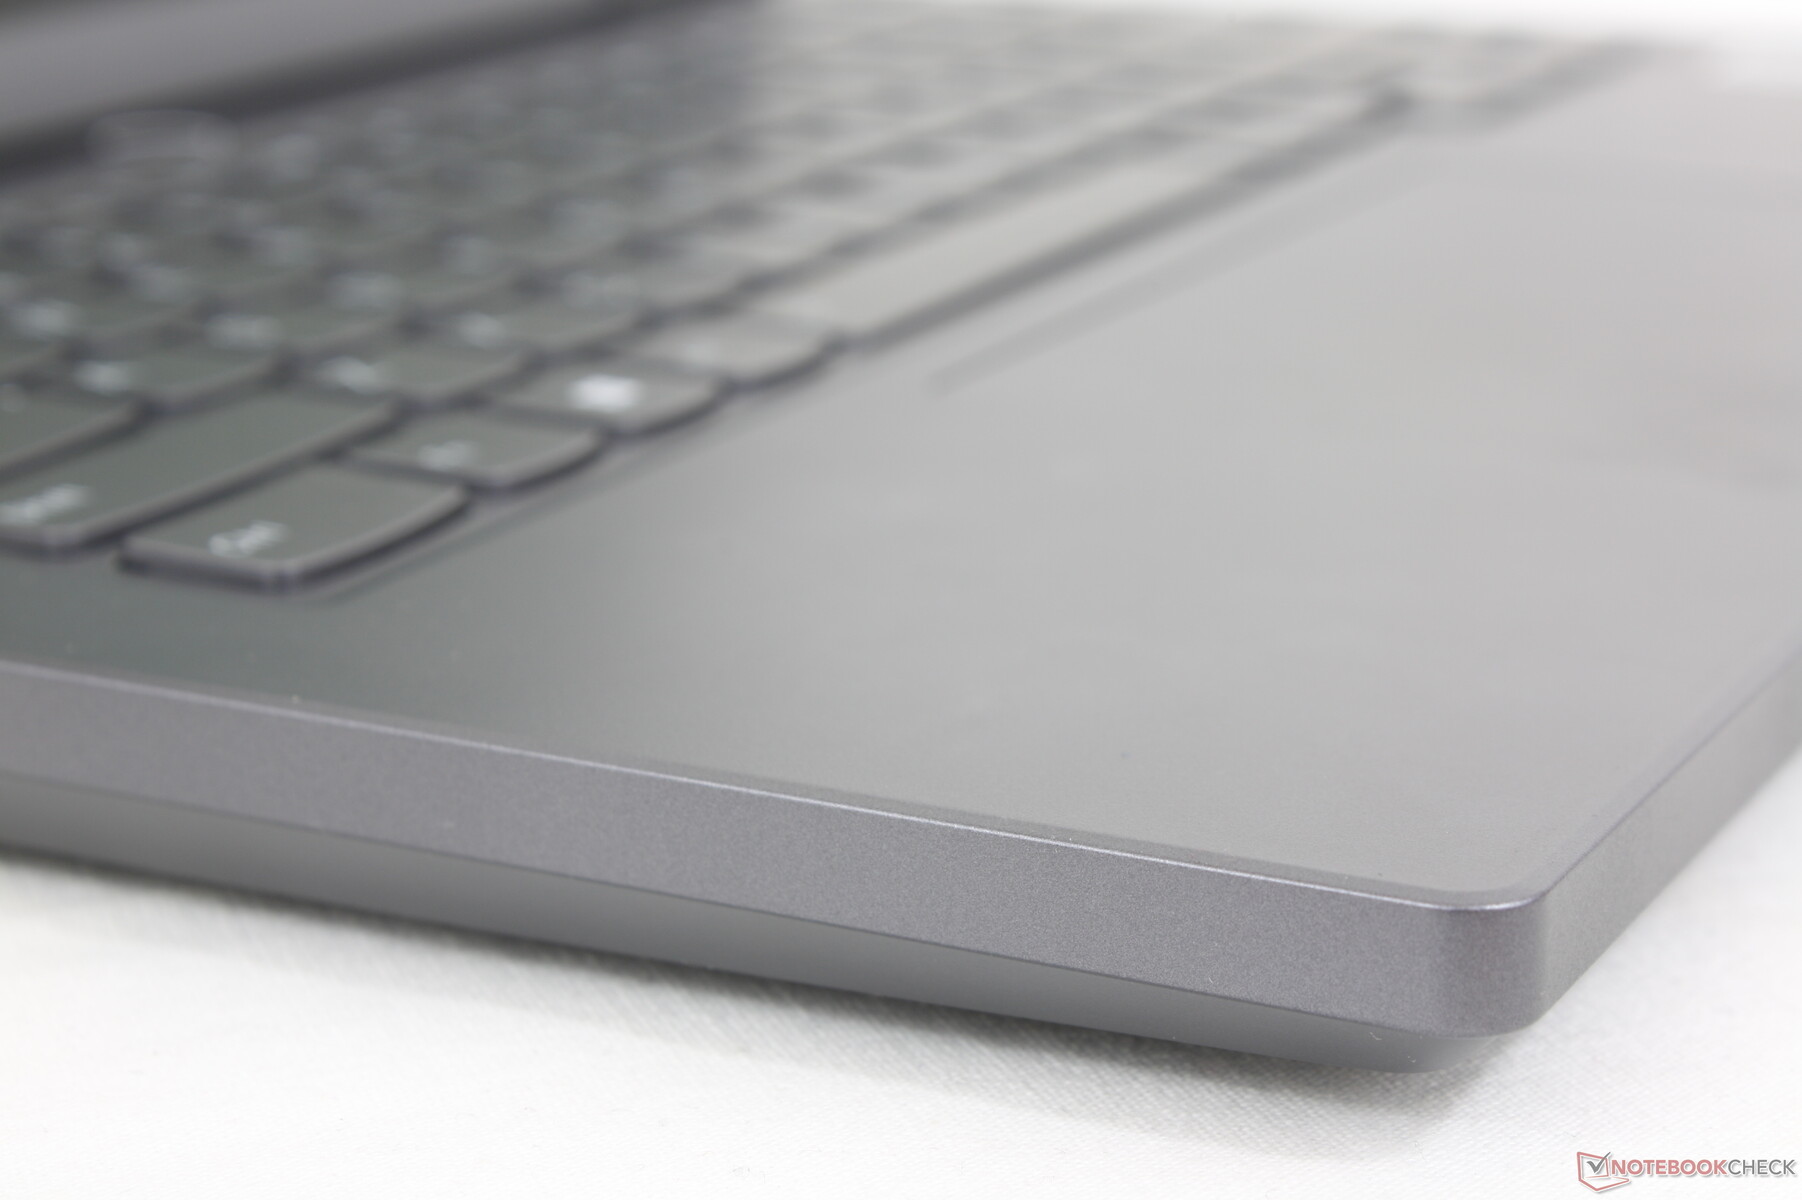
A Lenovo emprega materiais metálicos lisos semelhantes em cinza monótono em muitos de seus modelos Legion e ThinkBook. Os jogadores que não se sentem atraídos pelos designs excêntricos dos notebooks Alienware ou Asus ROG podem achar que o design mais plano e sem RGB do Legion Slim 5 14 é mais atraente, especialmente para salas de aula e ambientes que não sejam de jogos.
A qualidade do chassi é forte de cima a baixo para uma primeira impressão sólida. As superfícies não são tão rígidas como no Blade 14 ou no Alienware x14 e isso é mais perceptível ao aplicar pressão no centro do teclado ou nos apoios para as mãos ou ao girar a tampa, mas qualquer flexão ainda é mínima.
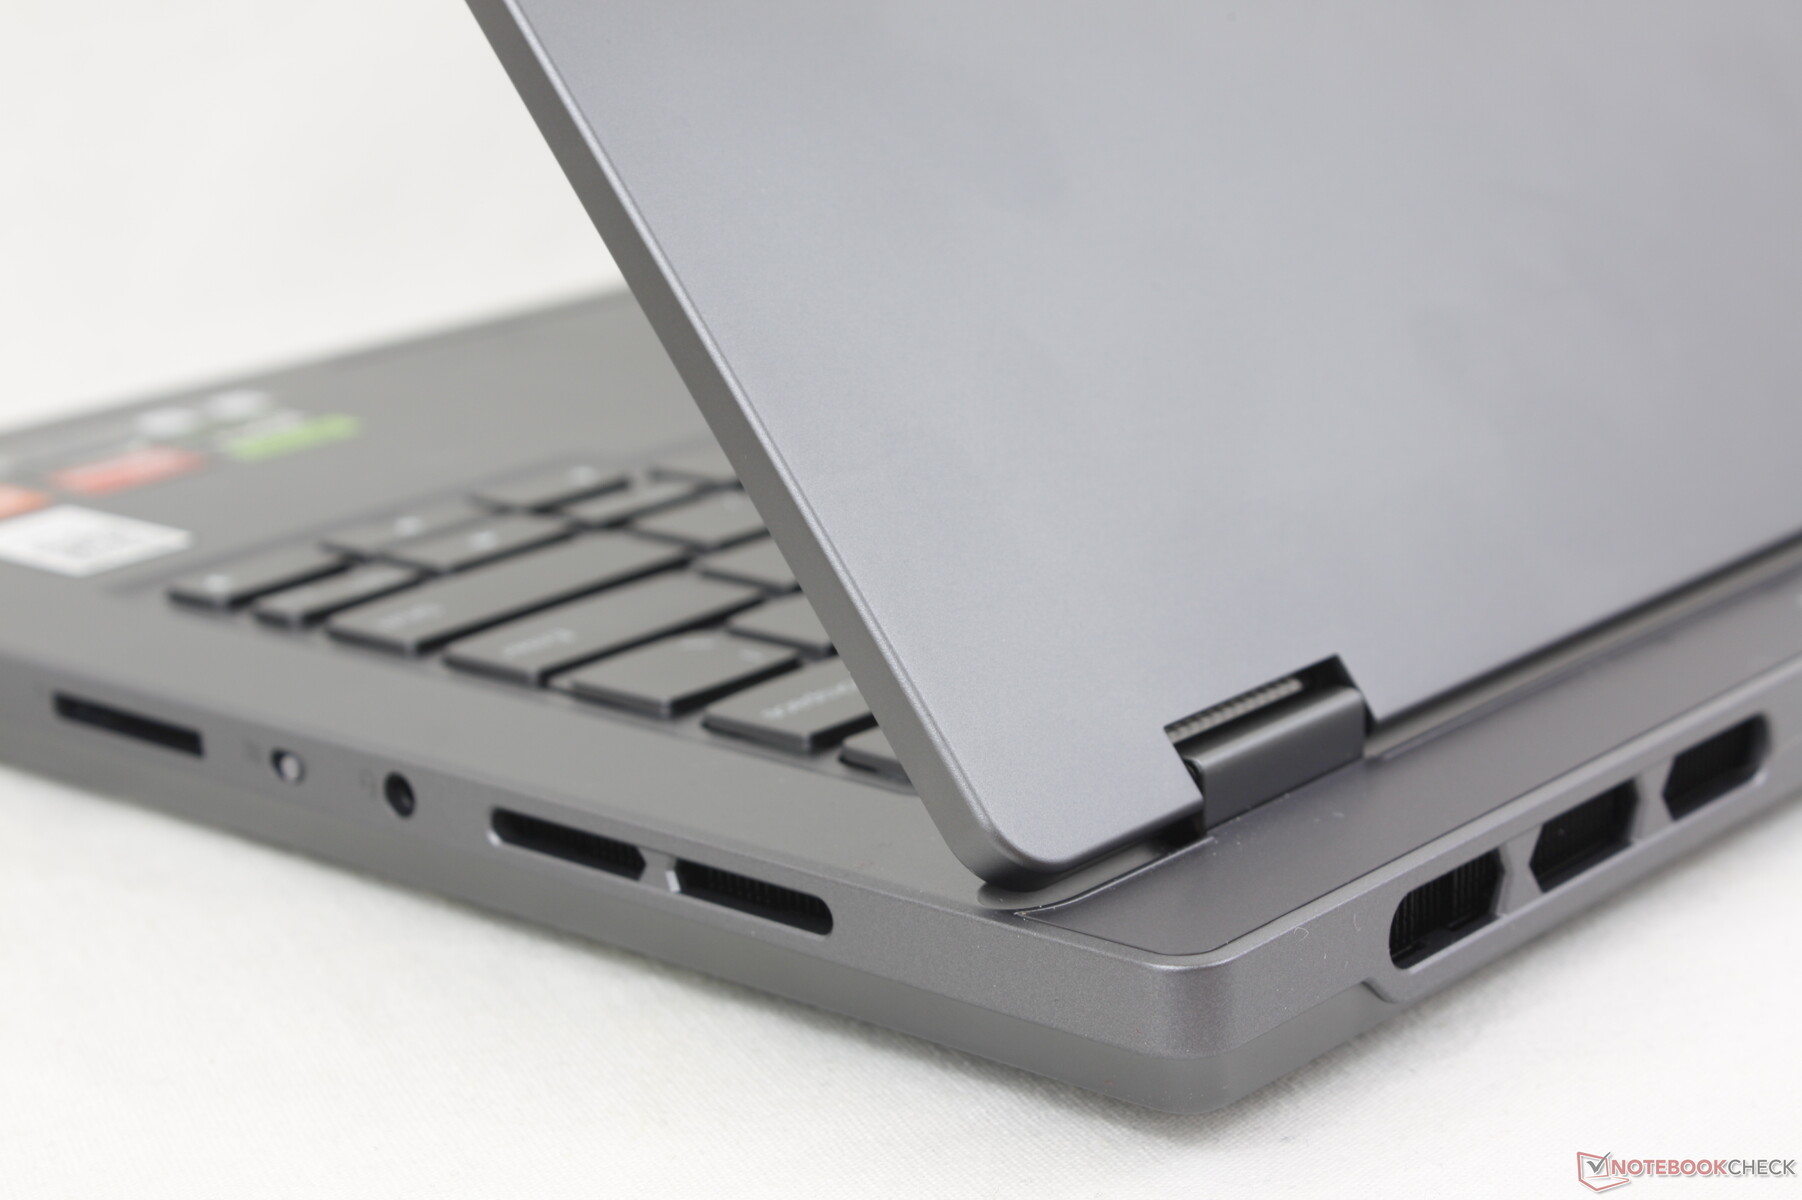
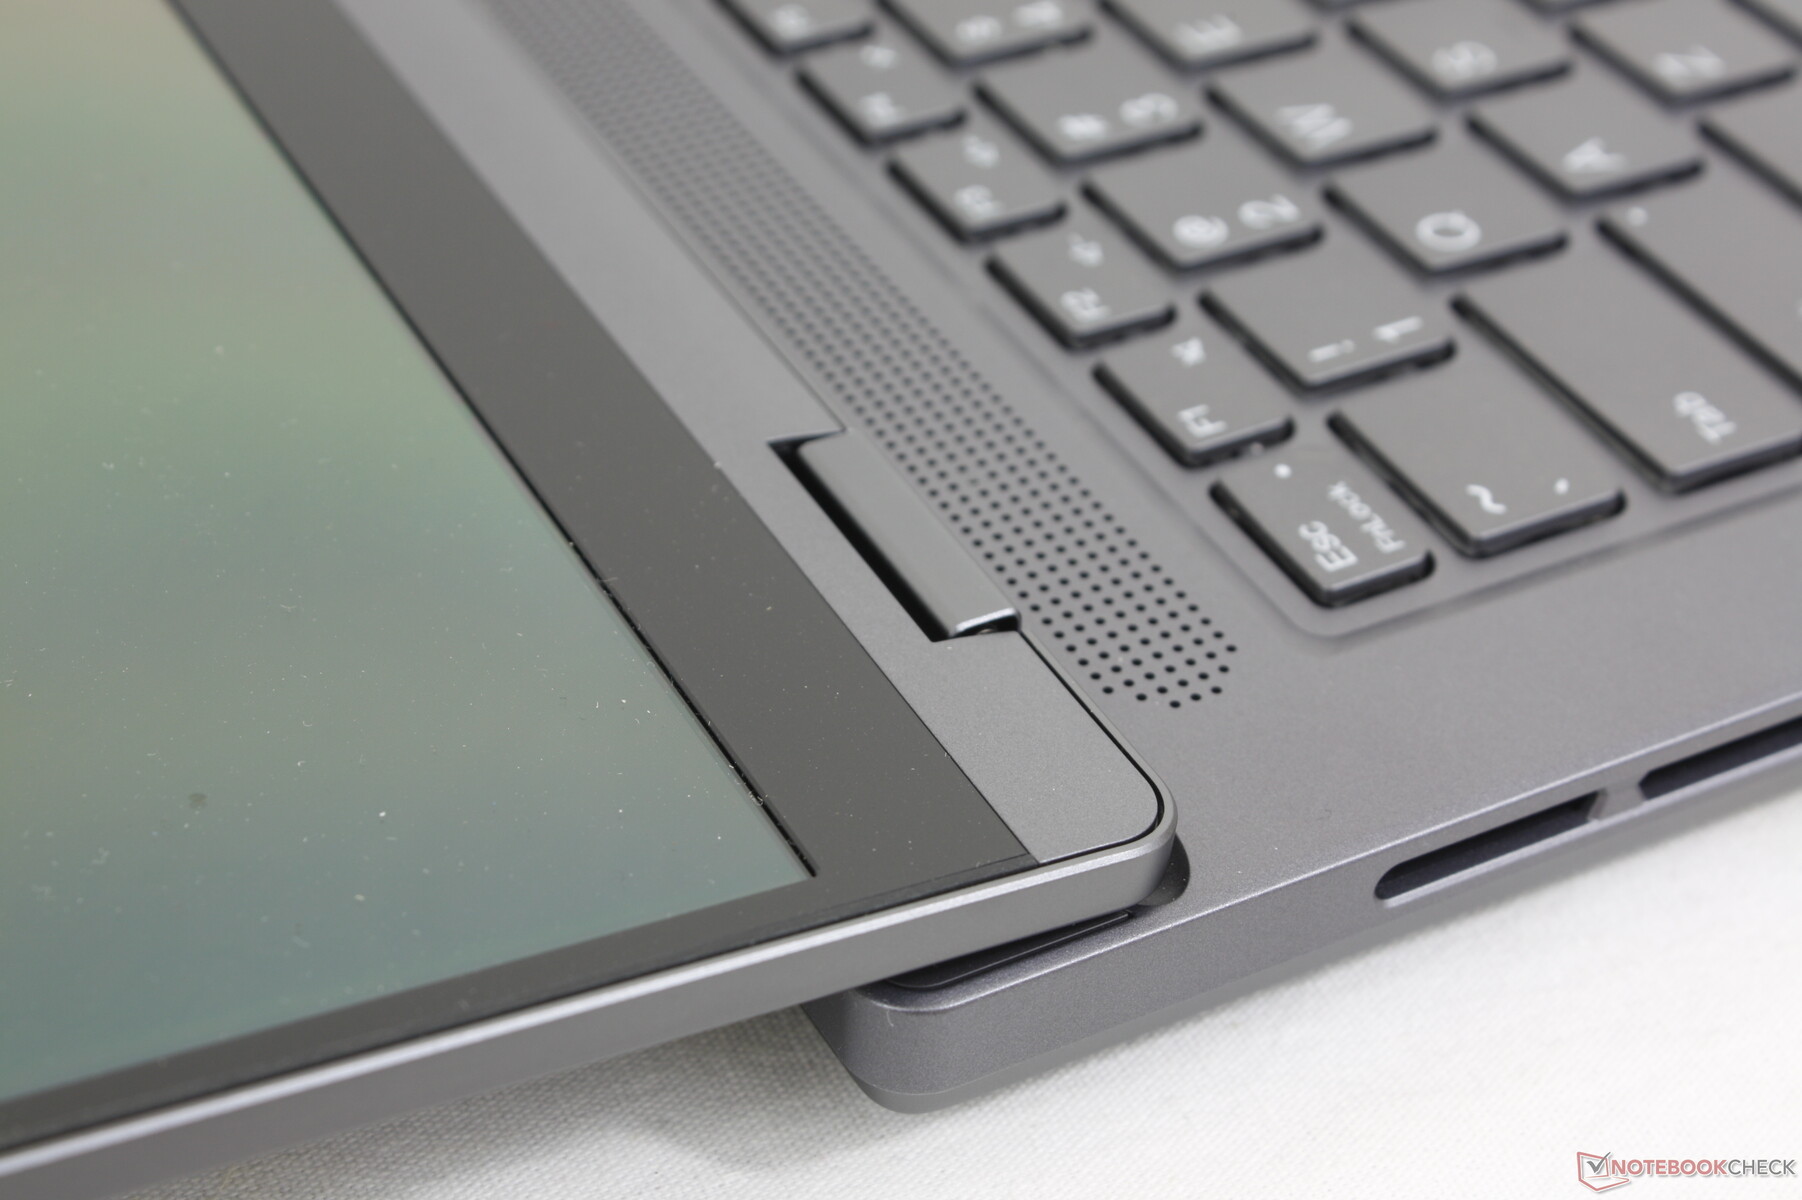
As dobradiças merecem uma menção, pois podem abrir 180 graus, ao contrário de outros laptops para jogos de 14 polegadas. A rigidez das dobradiças é satisfatória, mas poderia ter sido mais rígida em ângulos mais amplos para uma melhor sensação de longevidade.
O tamanho maior da tela de 14,5 polegadas e a traseira estendida do design do Legion dão ao nosso Legion Slim 5 14 uma pegada maior do que a de concorrentes como o Blade 14, Zephyrus G14 ou Predator Triton 14. No entanto, todos eles ainda pesam aproximadamente o mesmo e, portanto, o Legion Slim 5 14 simplesmente não é tão denso.
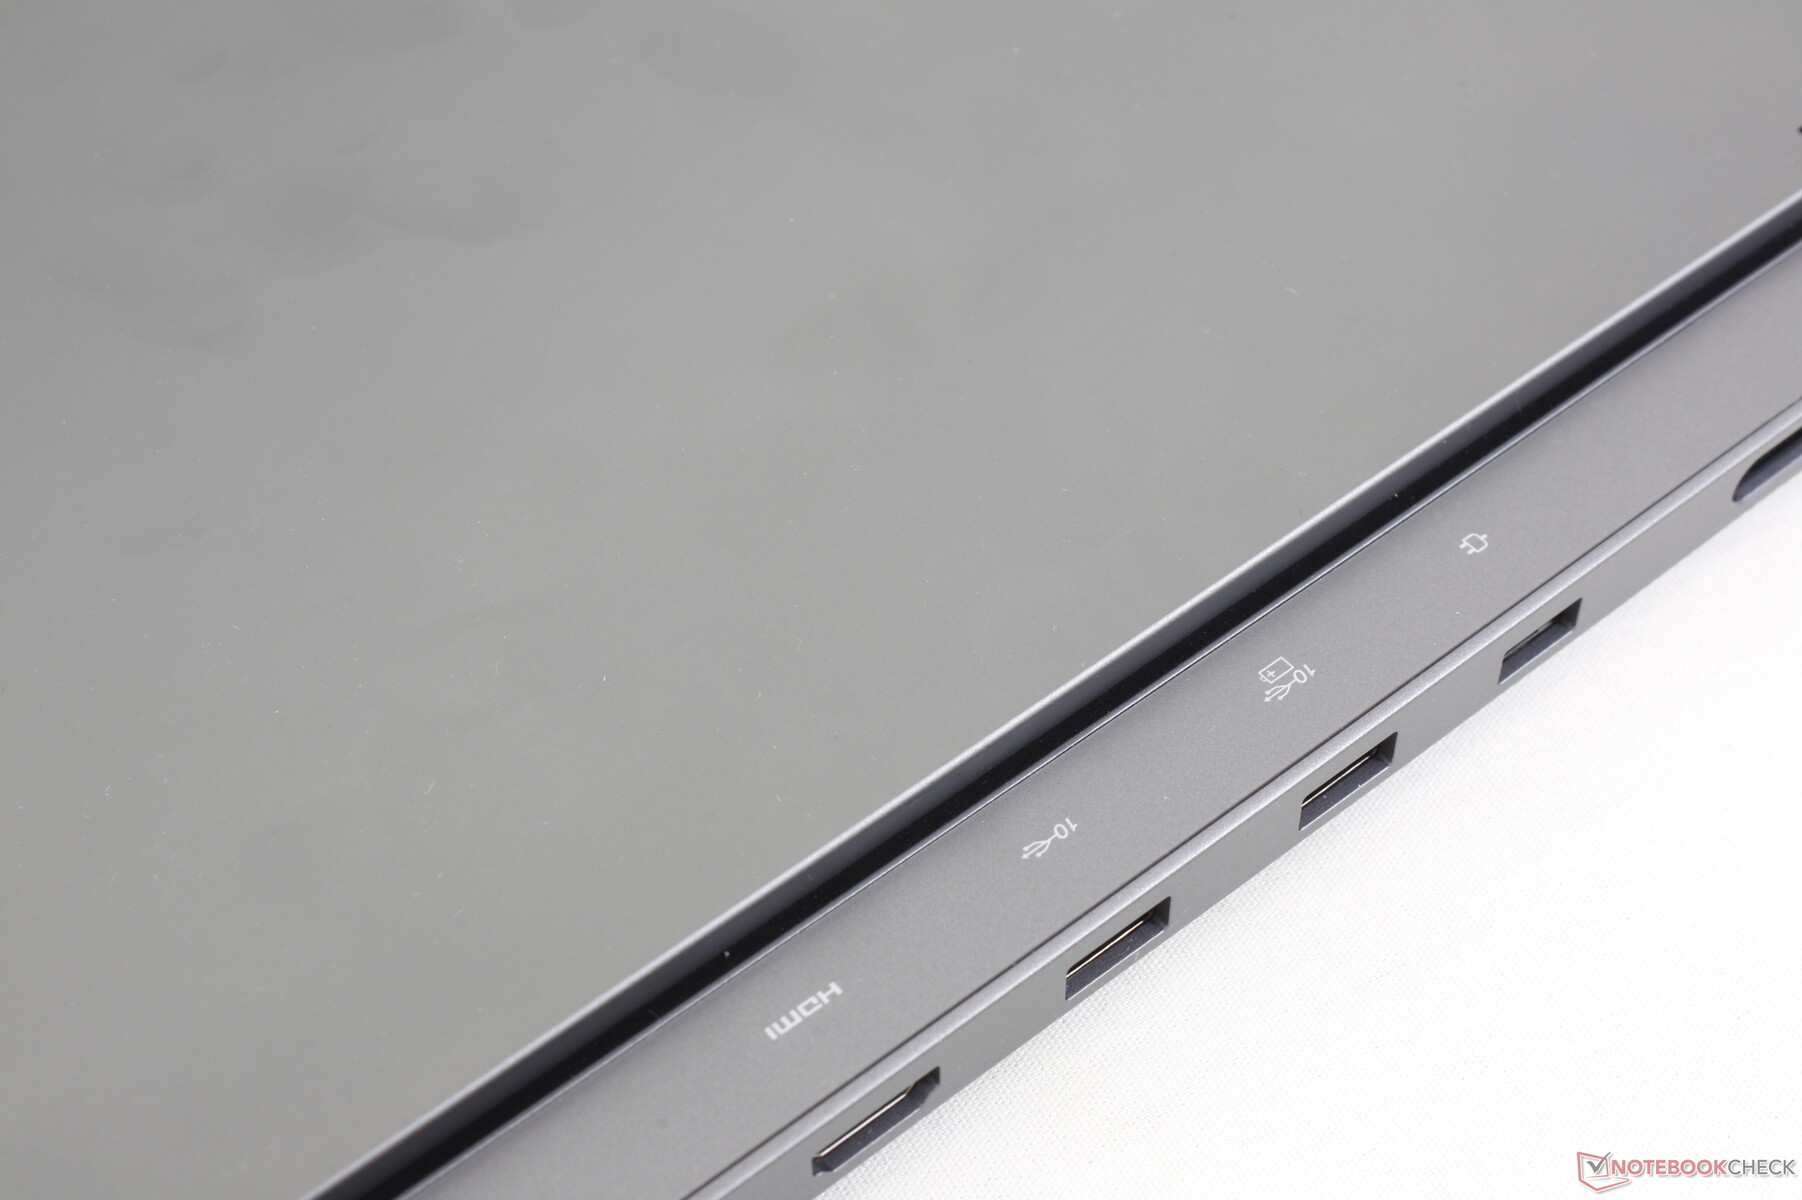
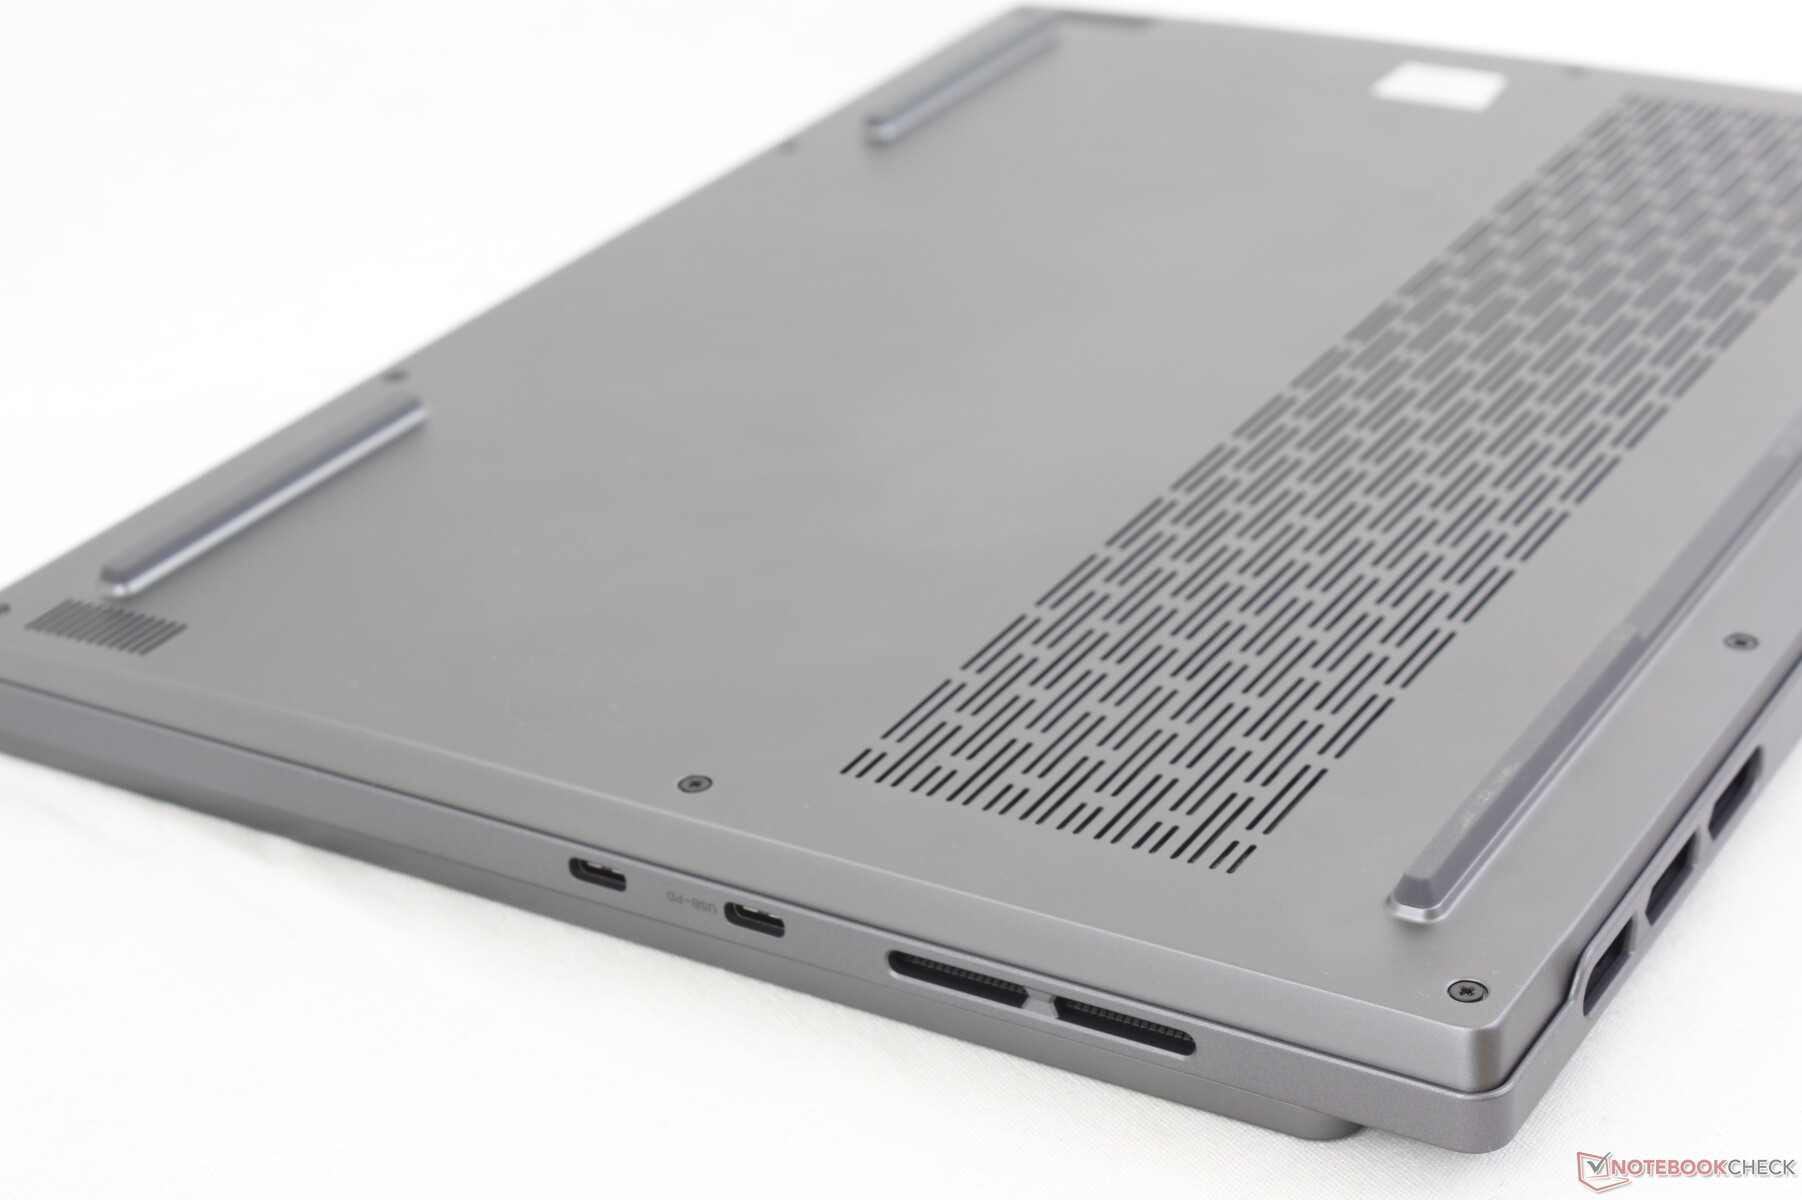
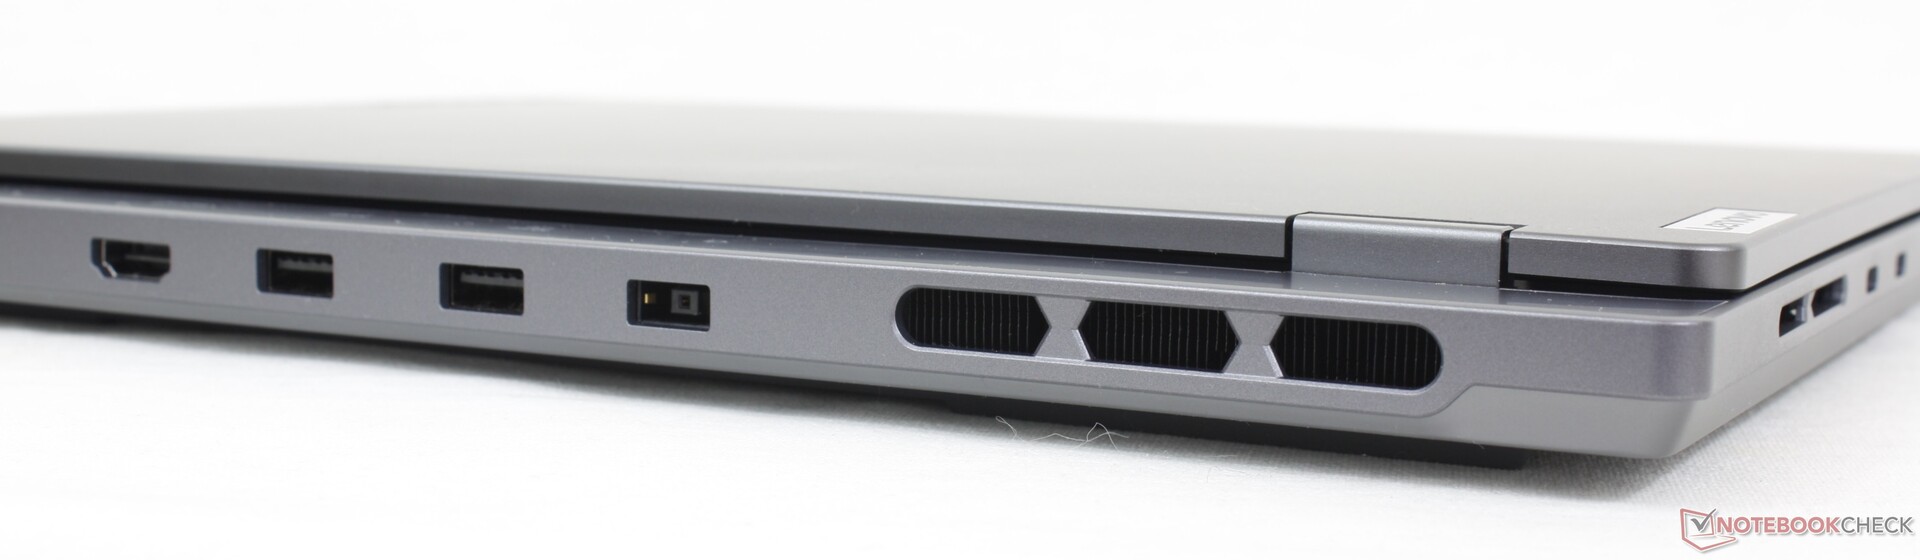
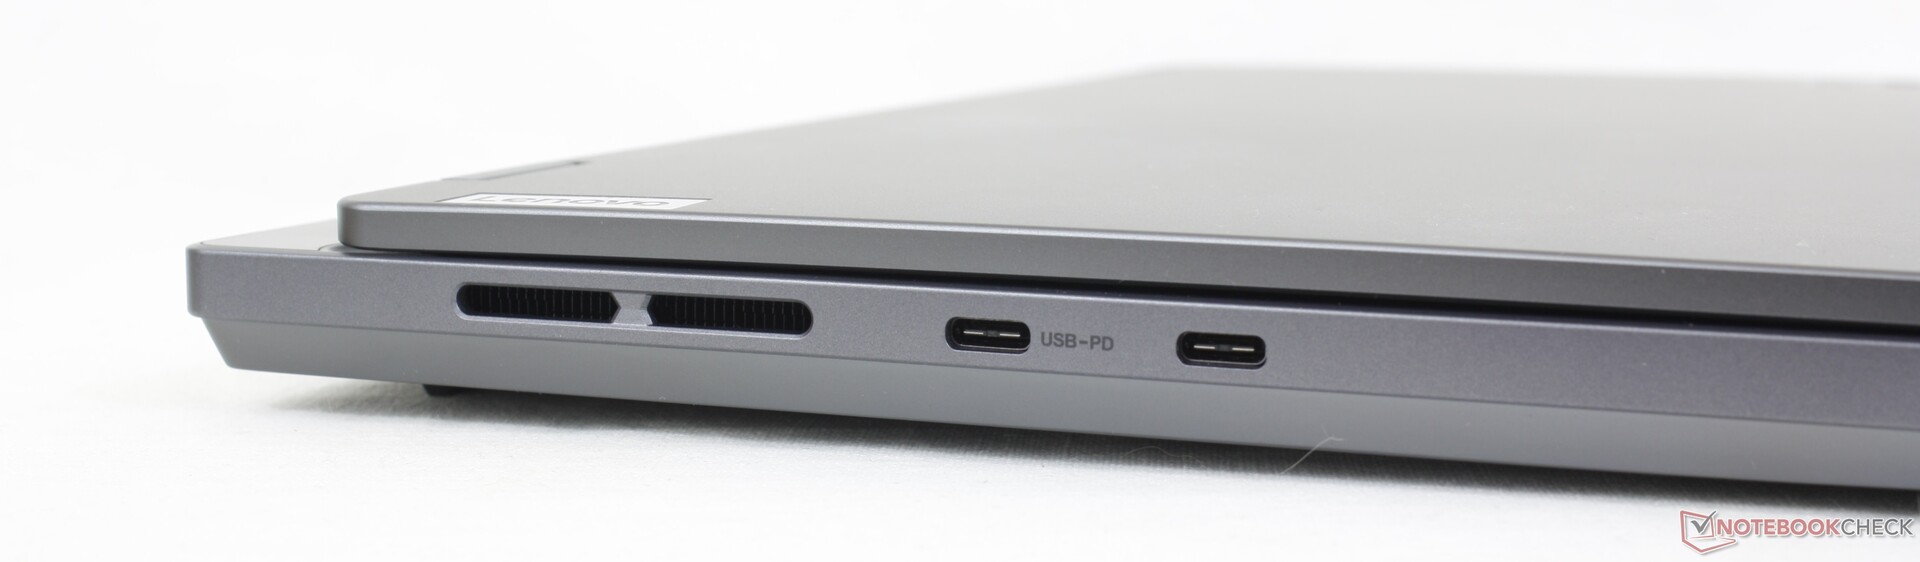
Conectividade - Onde está o USB4?
As opções de portas são muito semelhantes às do Blade 14, embora com um posicionamento muito diferente. Achamos que o posicionamento é desfavorável no Legion Slim 5, pois as portas não estão distribuídas uniformemente e a maioria delas está na parte traseira, incluindo as portas USB-A.
Infelizmente, o modelo não tem suporte para USB4 e Thunderbolt. Também não há trava Kensington.
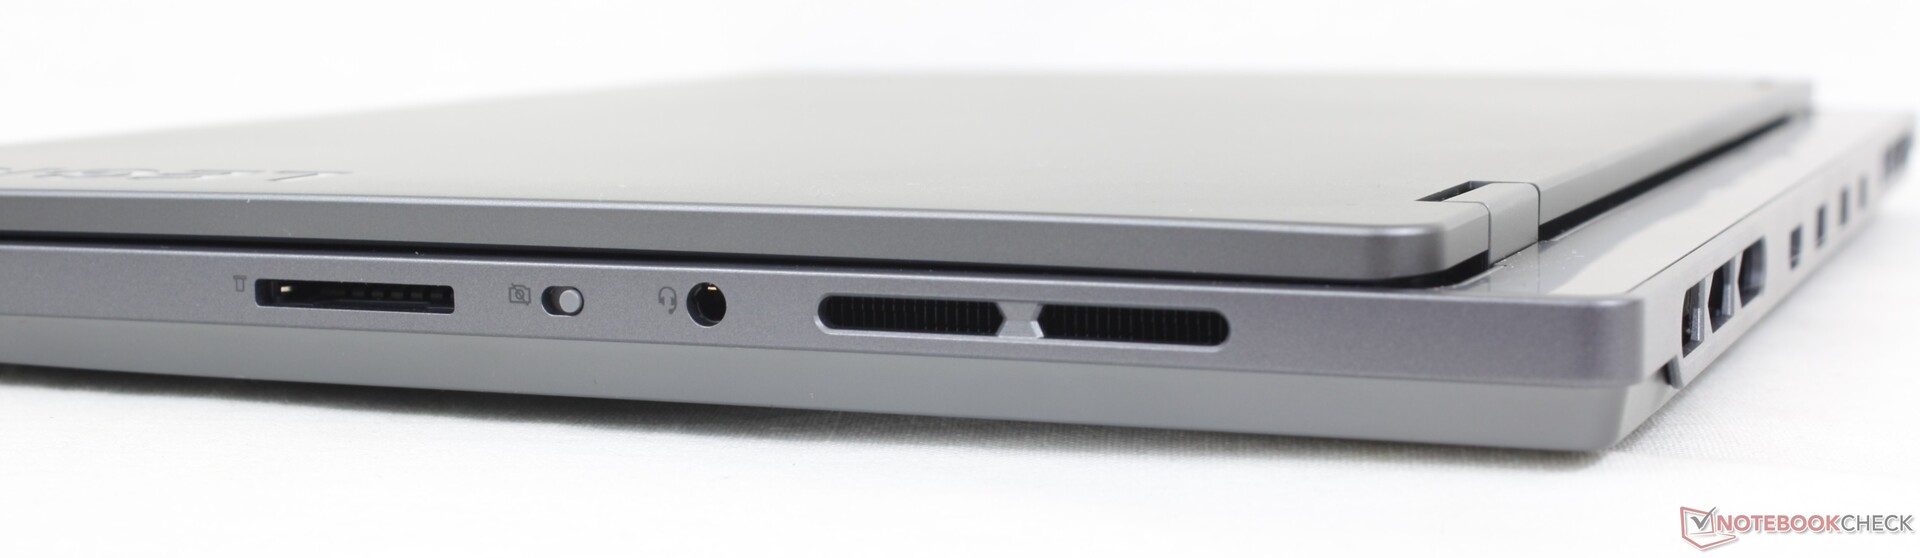
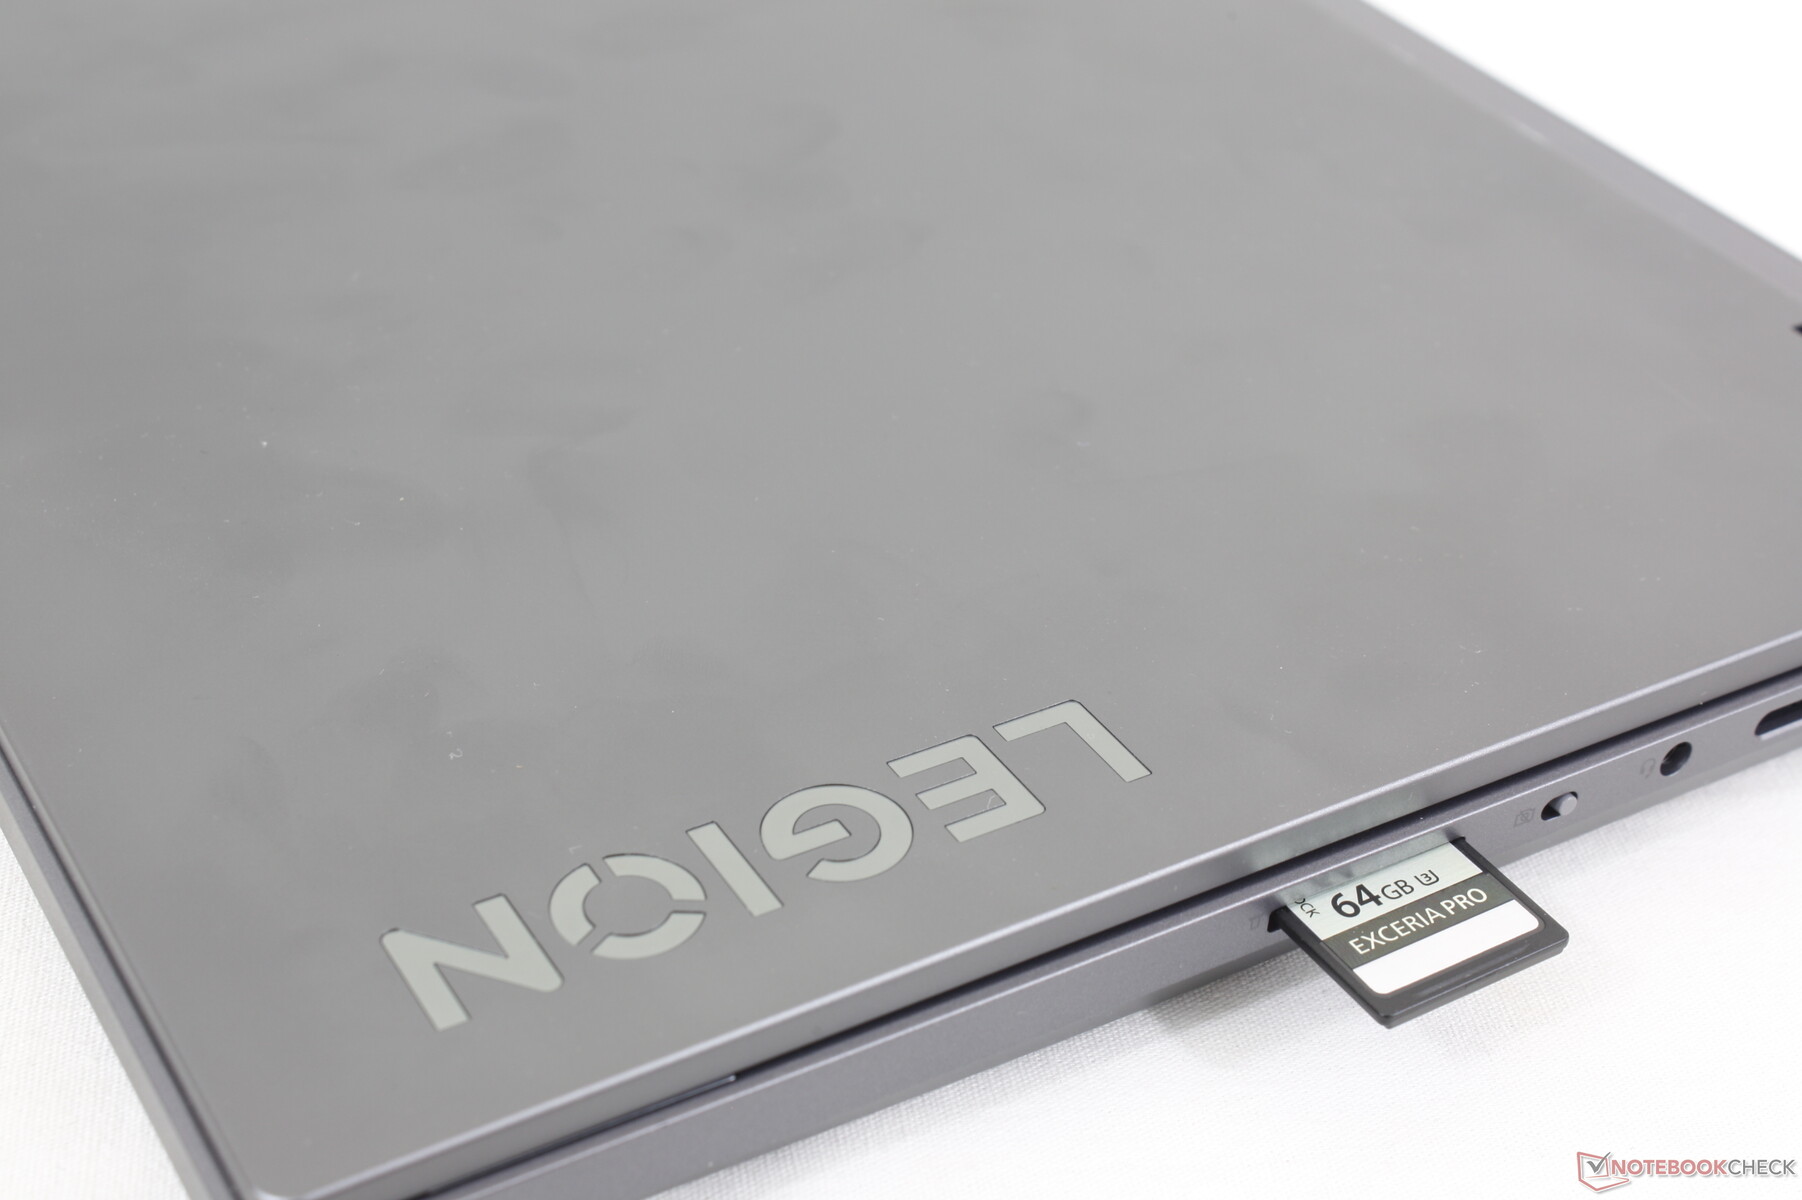
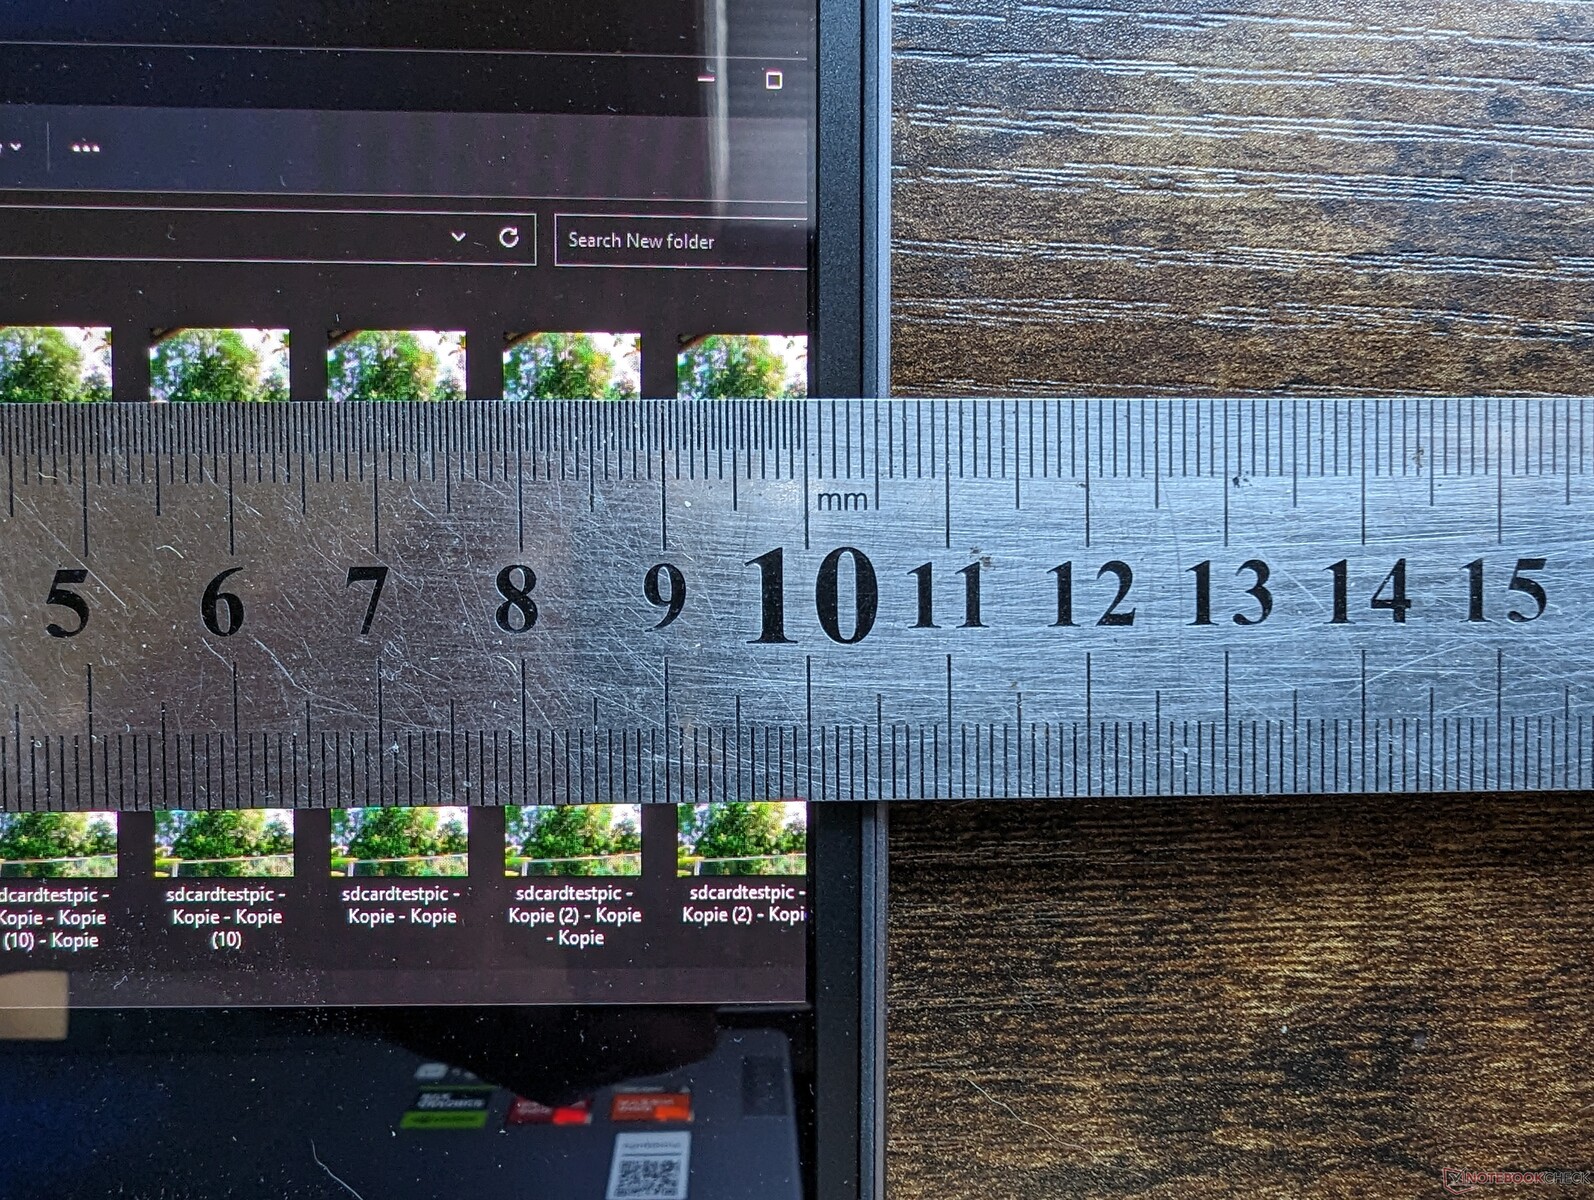
Leitor de cartão SD
O leitor SD integrado é muito mais rápido do que o do Predator Triton 14 mas não tão rápido quanto o do Zephyrus G14 ou do Alienware x14. A transferência de 1 GB de imagens do nosso cartão de teste UHS-II para a área de trabalho leva cerca de 12 segundos, em comparação com apenas metade desse tempo no Alienware x14.
| SD Card Reader | |
| average JPG Copy Test (av. of 3 runs) | |
| Alienware x14 i7 RTX 3060 (Angelbird AV Pro V60) | |
| Asus ROG Zephyrus G14 GA402XY (Angelibrid AV Pro V60) | |
| Lenovo Legion Slim 5 14APH8 (Toshiba Exceria Pro SDXC 64 GB UHS-II) | |
| Acer Predator Triton 14 PT14-51 (AV PRO microSD 128 GB V60) | |
| maximum AS SSD Seq Read Test (1GB) | |
| Asus ROG Zephyrus G14 GA402XY (Angelibrid AV Pro V60) | |
| Alienware x14 i7 RTX 3060 (Angelbird AV Pro V60) | |
| Lenovo Legion Slim 5 14APH8 (Toshiba Exceria Pro SDXC 64 GB UHS-II) | |
| Acer Predator Triton 14 PT14-51 (AV PRO microSD 128 GB V60) | |
Comunicação
Um MediaTek MT7922 vem como padrão em vez do Intel AX211 mais comum para conectividade Wi-Fi 6E e Bluetooth 5.2. Tivemos um desempenho estável e sem problemas quando emparelhado com nossa rede AXE11000 de 6 GHz.
| Networking | |
| iperf3 transmit AX12 | |
| Alienware x14 i7 RTX 3060 | |
| iperf3 receive AX12 | |
| Alienware x14 i7 RTX 3060 | |
| iperf3 transmit AXE11000 | |
| Asus ROG Zephyrus G14 GA402XY | |
| Acer Predator Triton 14 PT14-51 | |
| Lenovo Legion Slim 5 14APH8 | |
| Razer Blade 14 RTX 4070 | |
| Lenovo LOQ 15APH8 | |
| iperf3 receive AXE11000 | |
| Acer Predator Triton 14 PT14-51 | |
| Asus ROG Zephyrus G14 GA402XY | |
| Razer Blade 14 RTX 4070 | |
| Lenovo Legion Slim 5 14APH8 | |
| Lenovo LOQ 15APH8 | |
| iperf3 transmit AXE11000 6GHz | |
| Lenovo Legion Slim 5 14APH8 | |
| Razer Blade 14 RTX 4070 | |
| iperf3 receive AXE11000 6GHz | |
| Razer Blade 14 RTX 4070 | |
| Lenovo Legion Slim 5 14APH8 | |
Webcam
A webcam de 2 MP é padrão em laptops para jogos. O IR e um interruptor de desativação da câmera estão integrados.


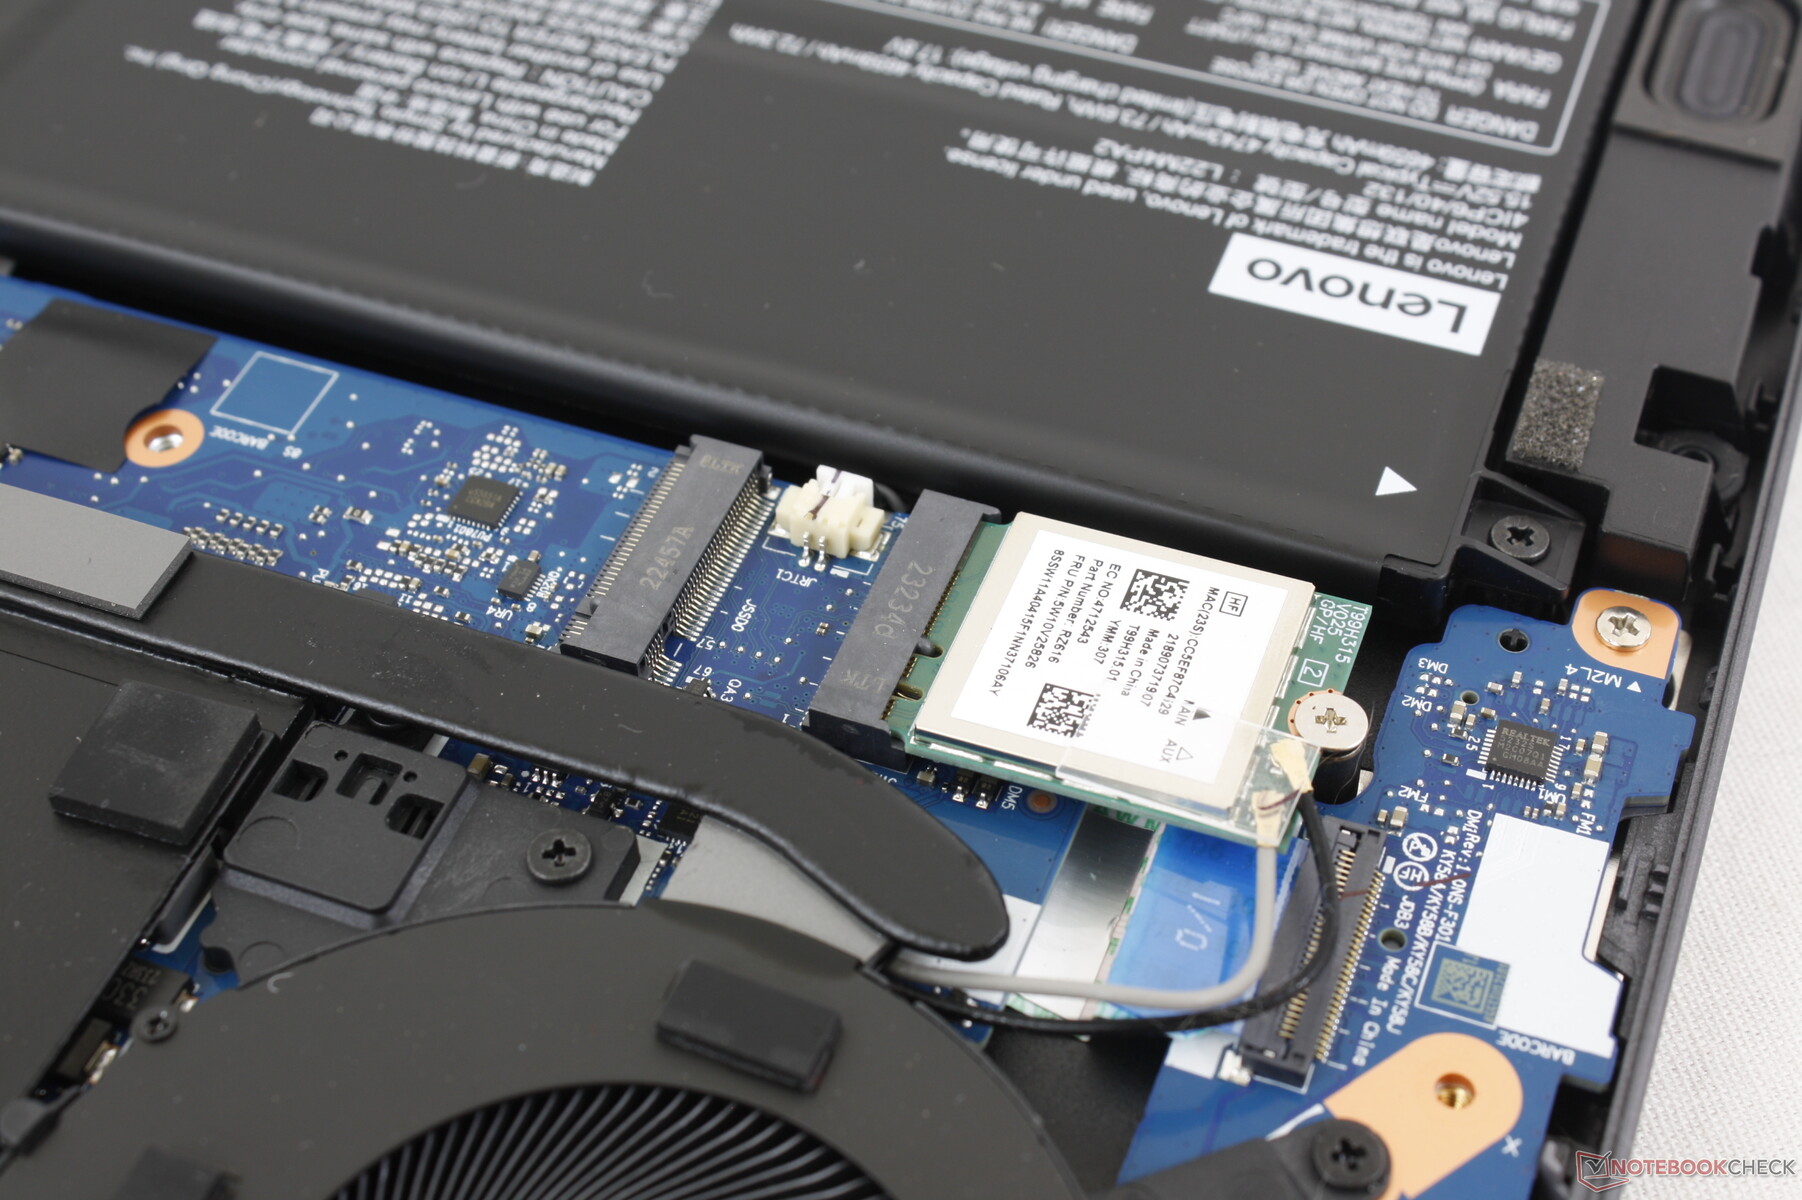
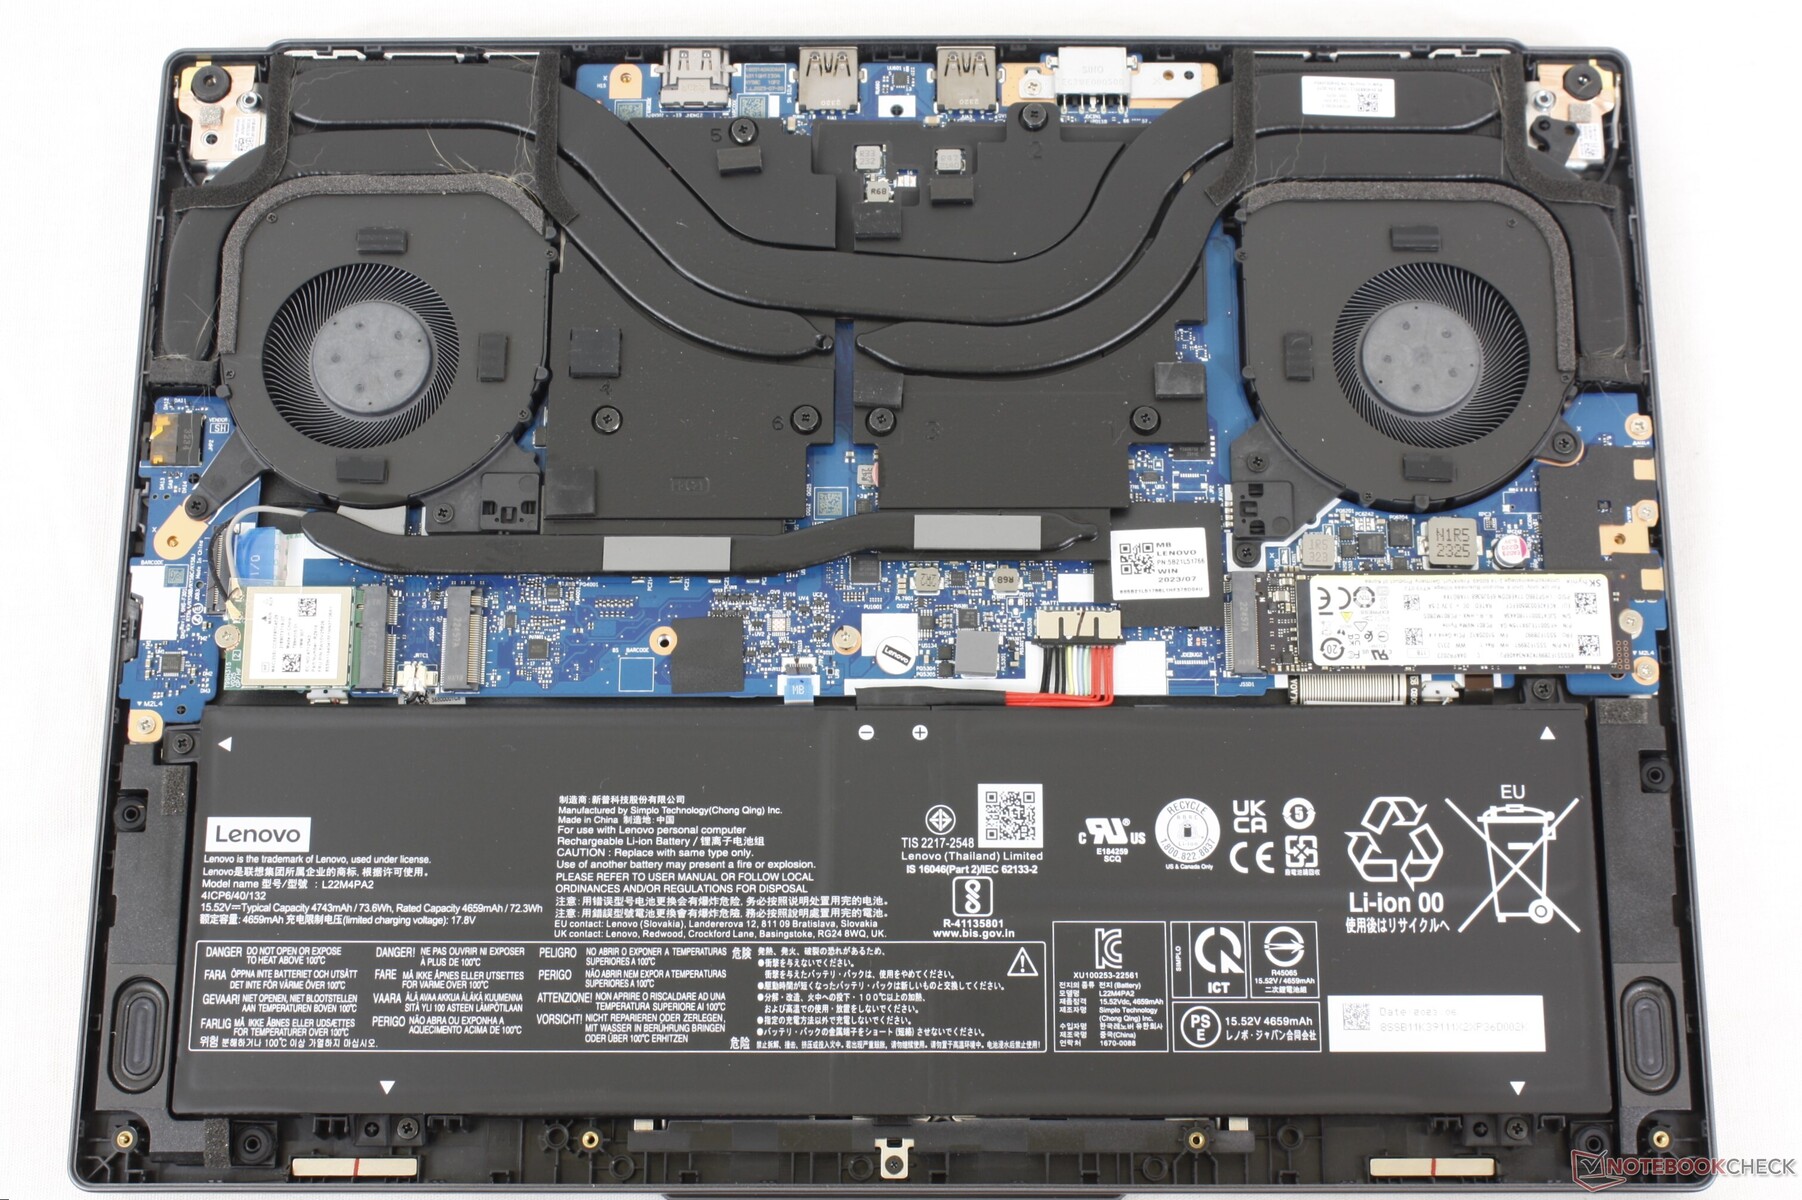
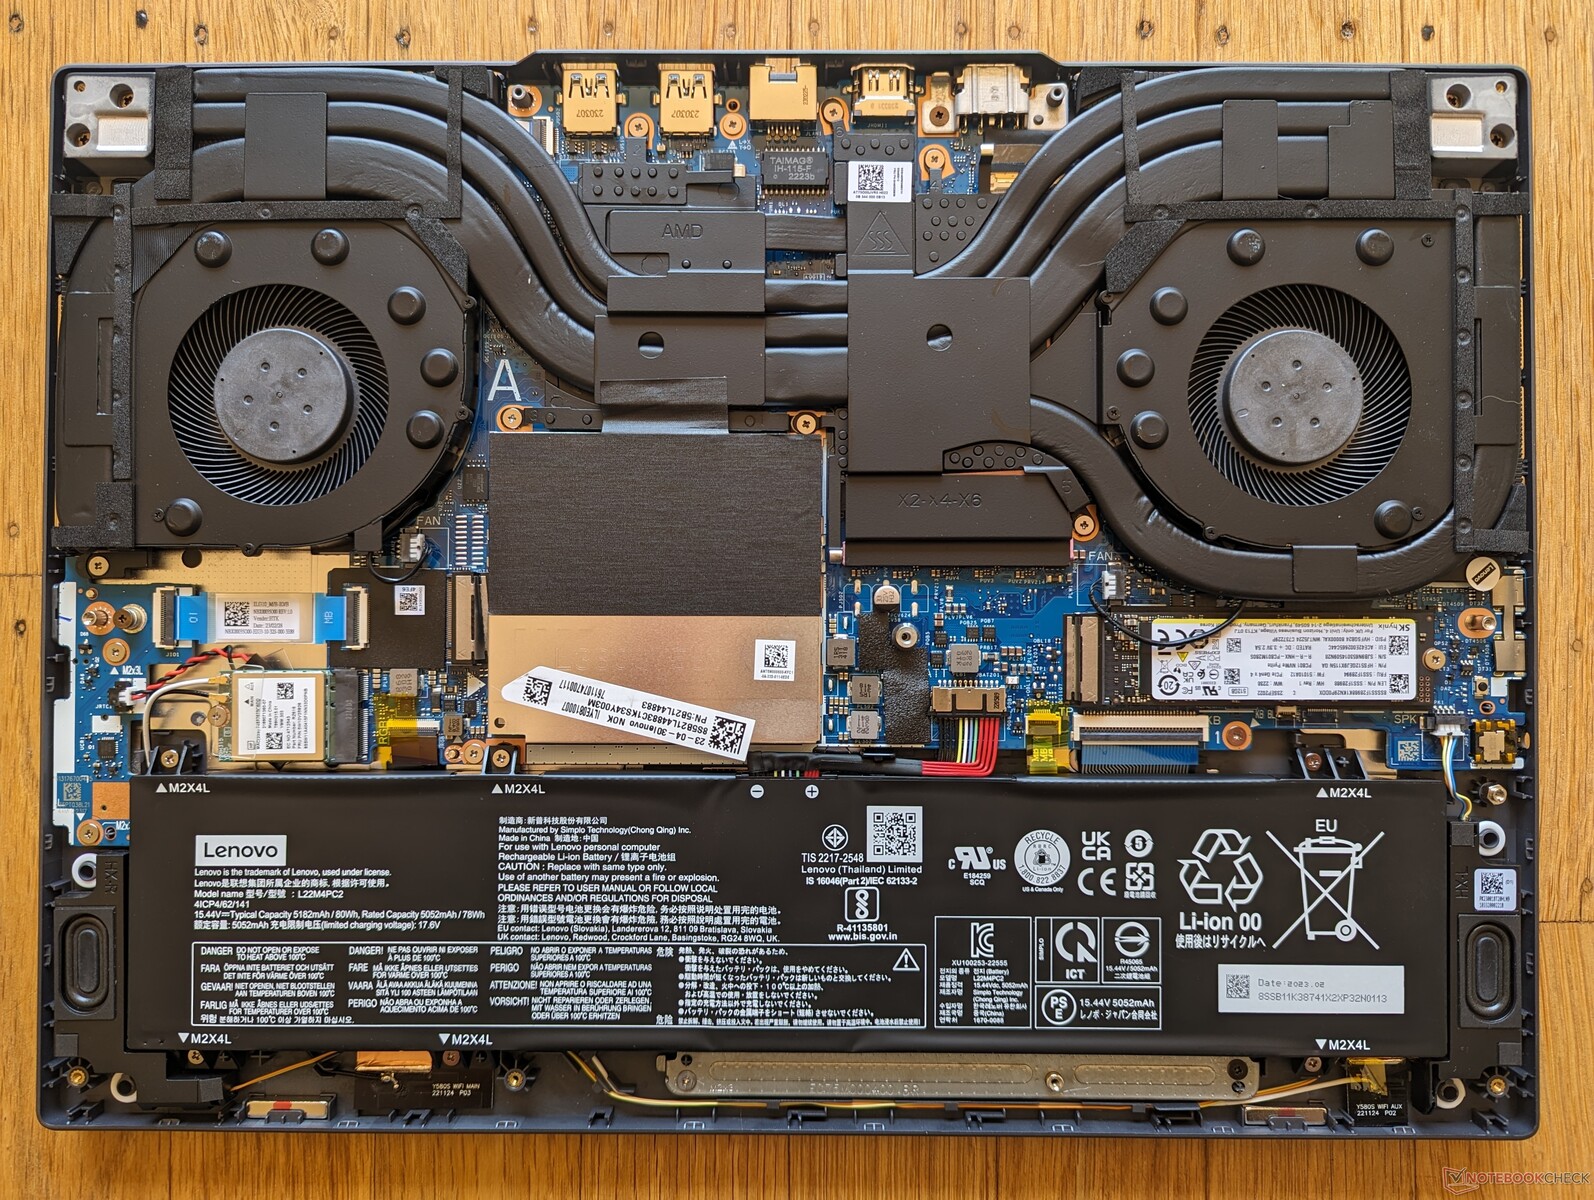
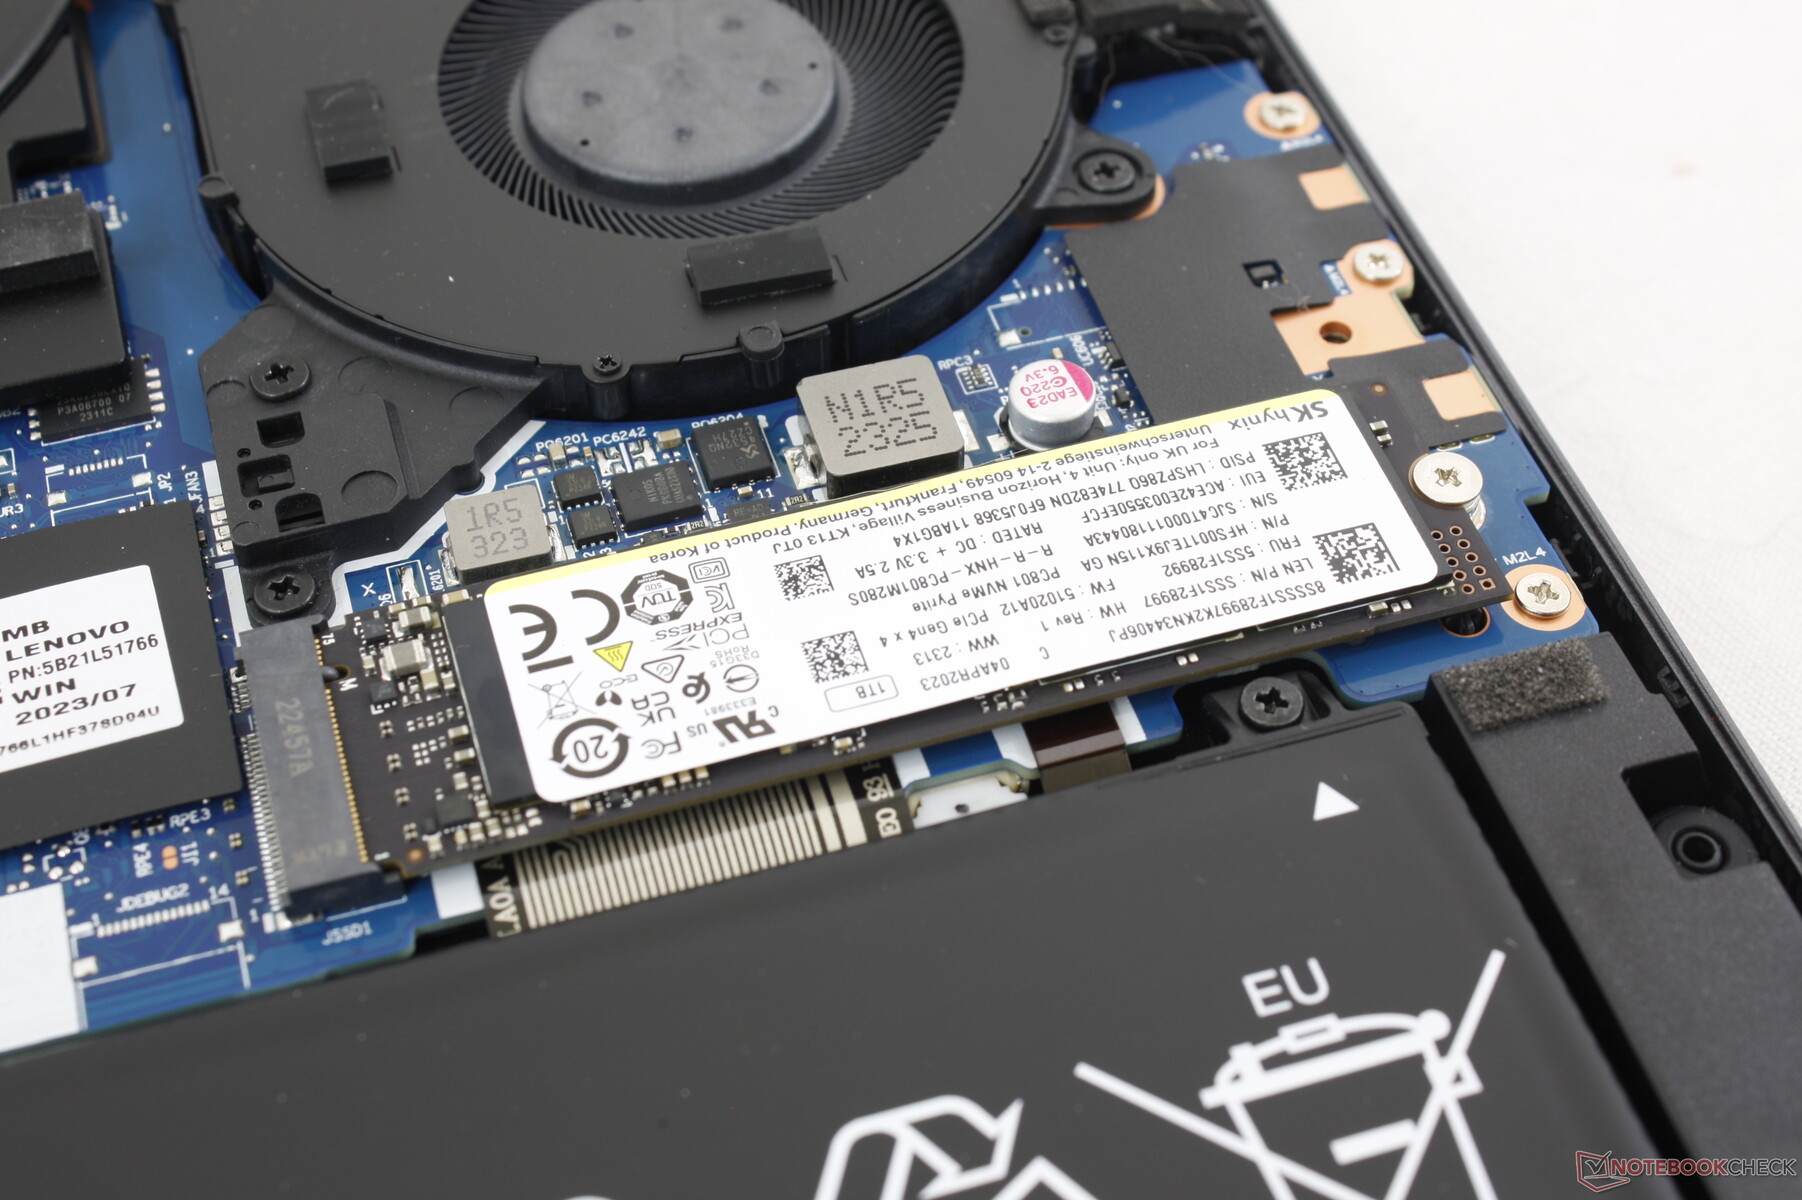
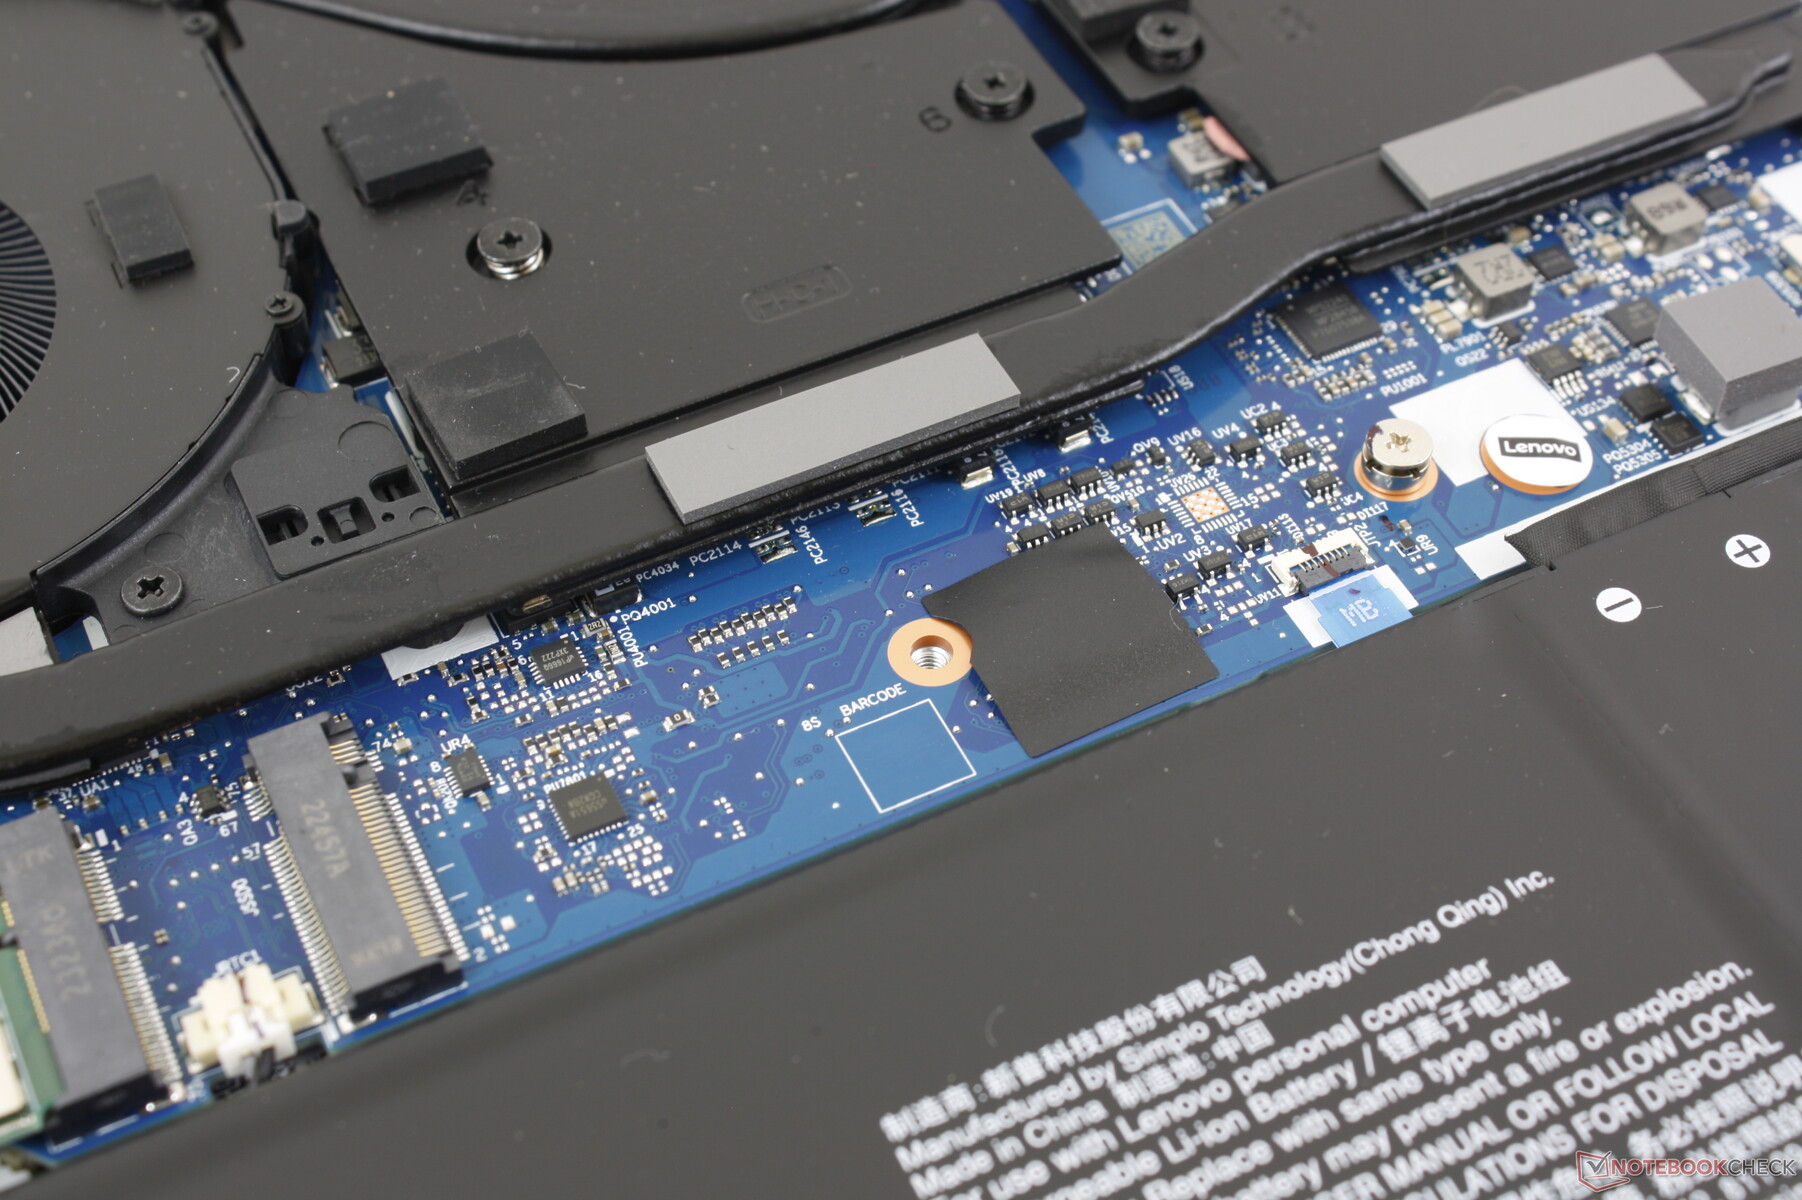
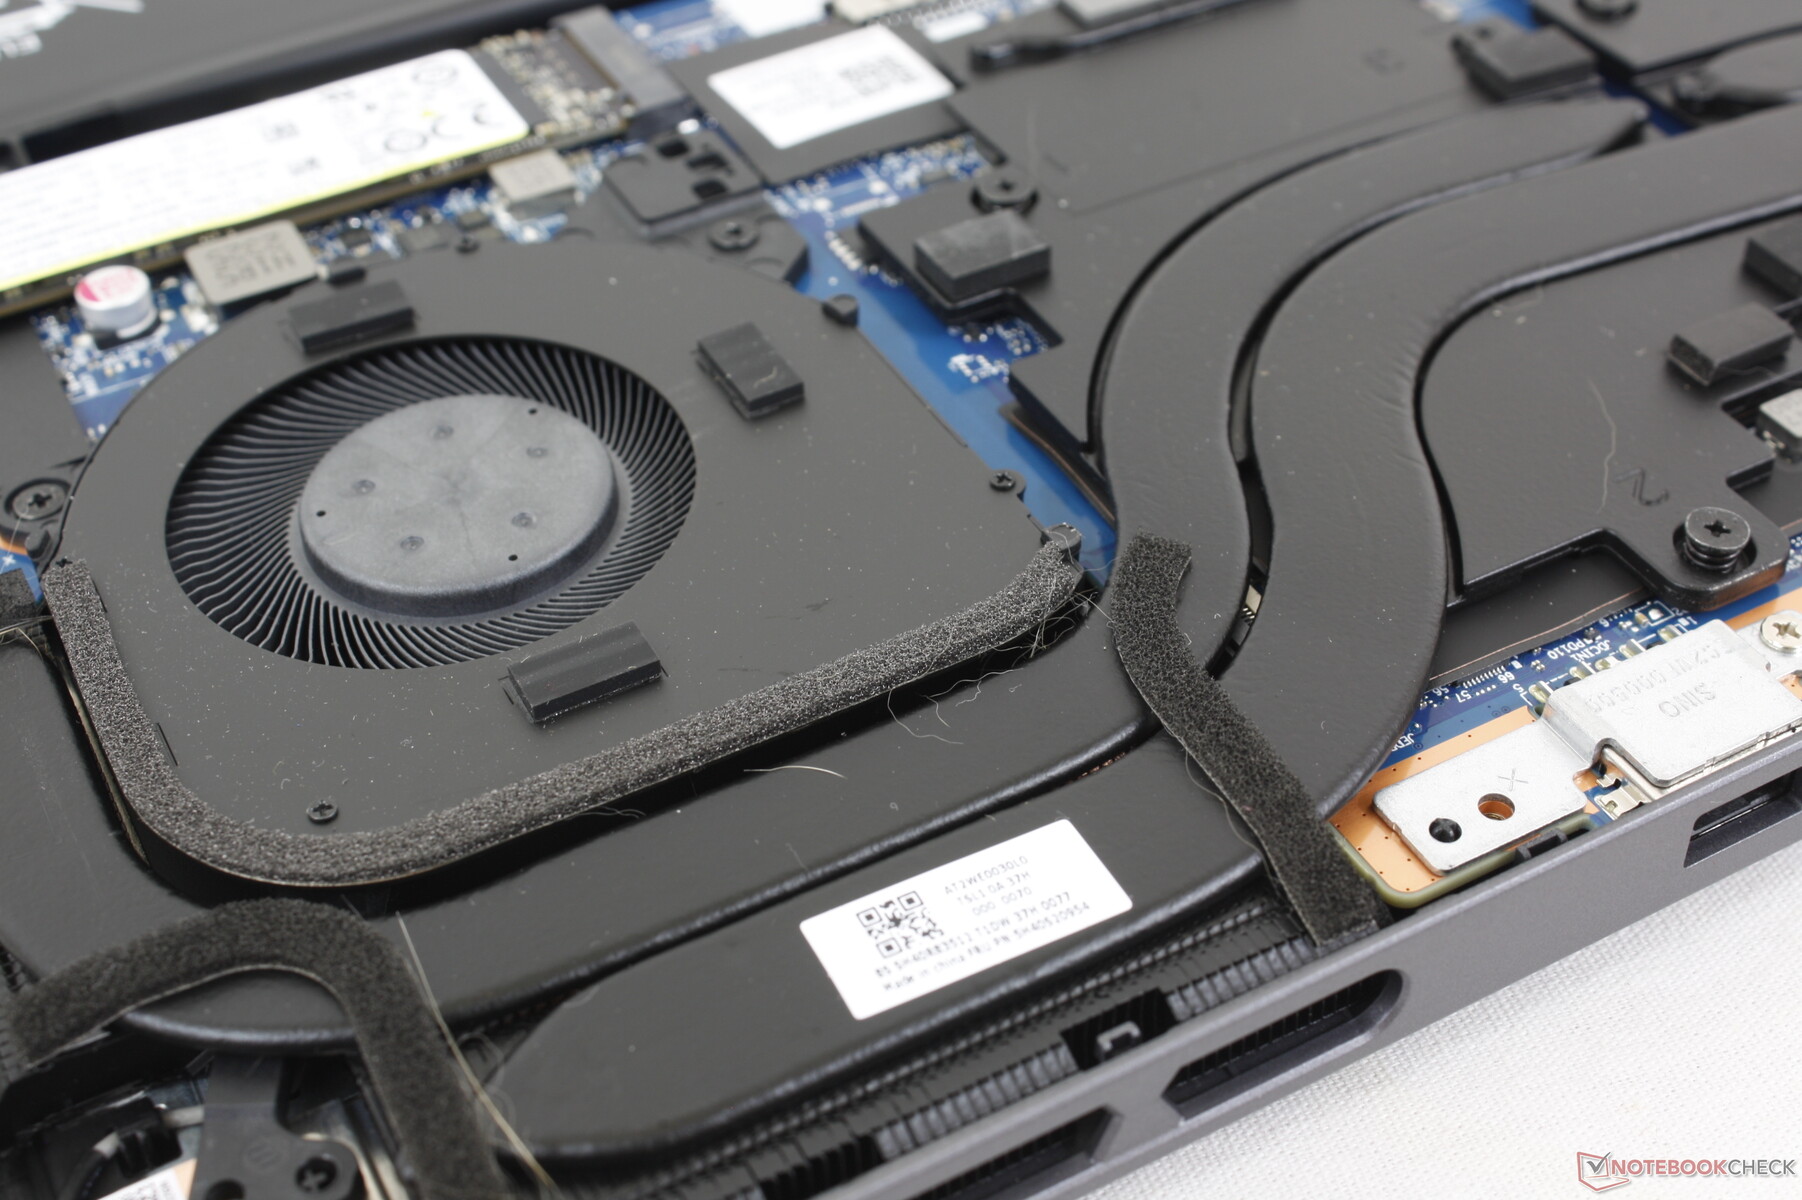
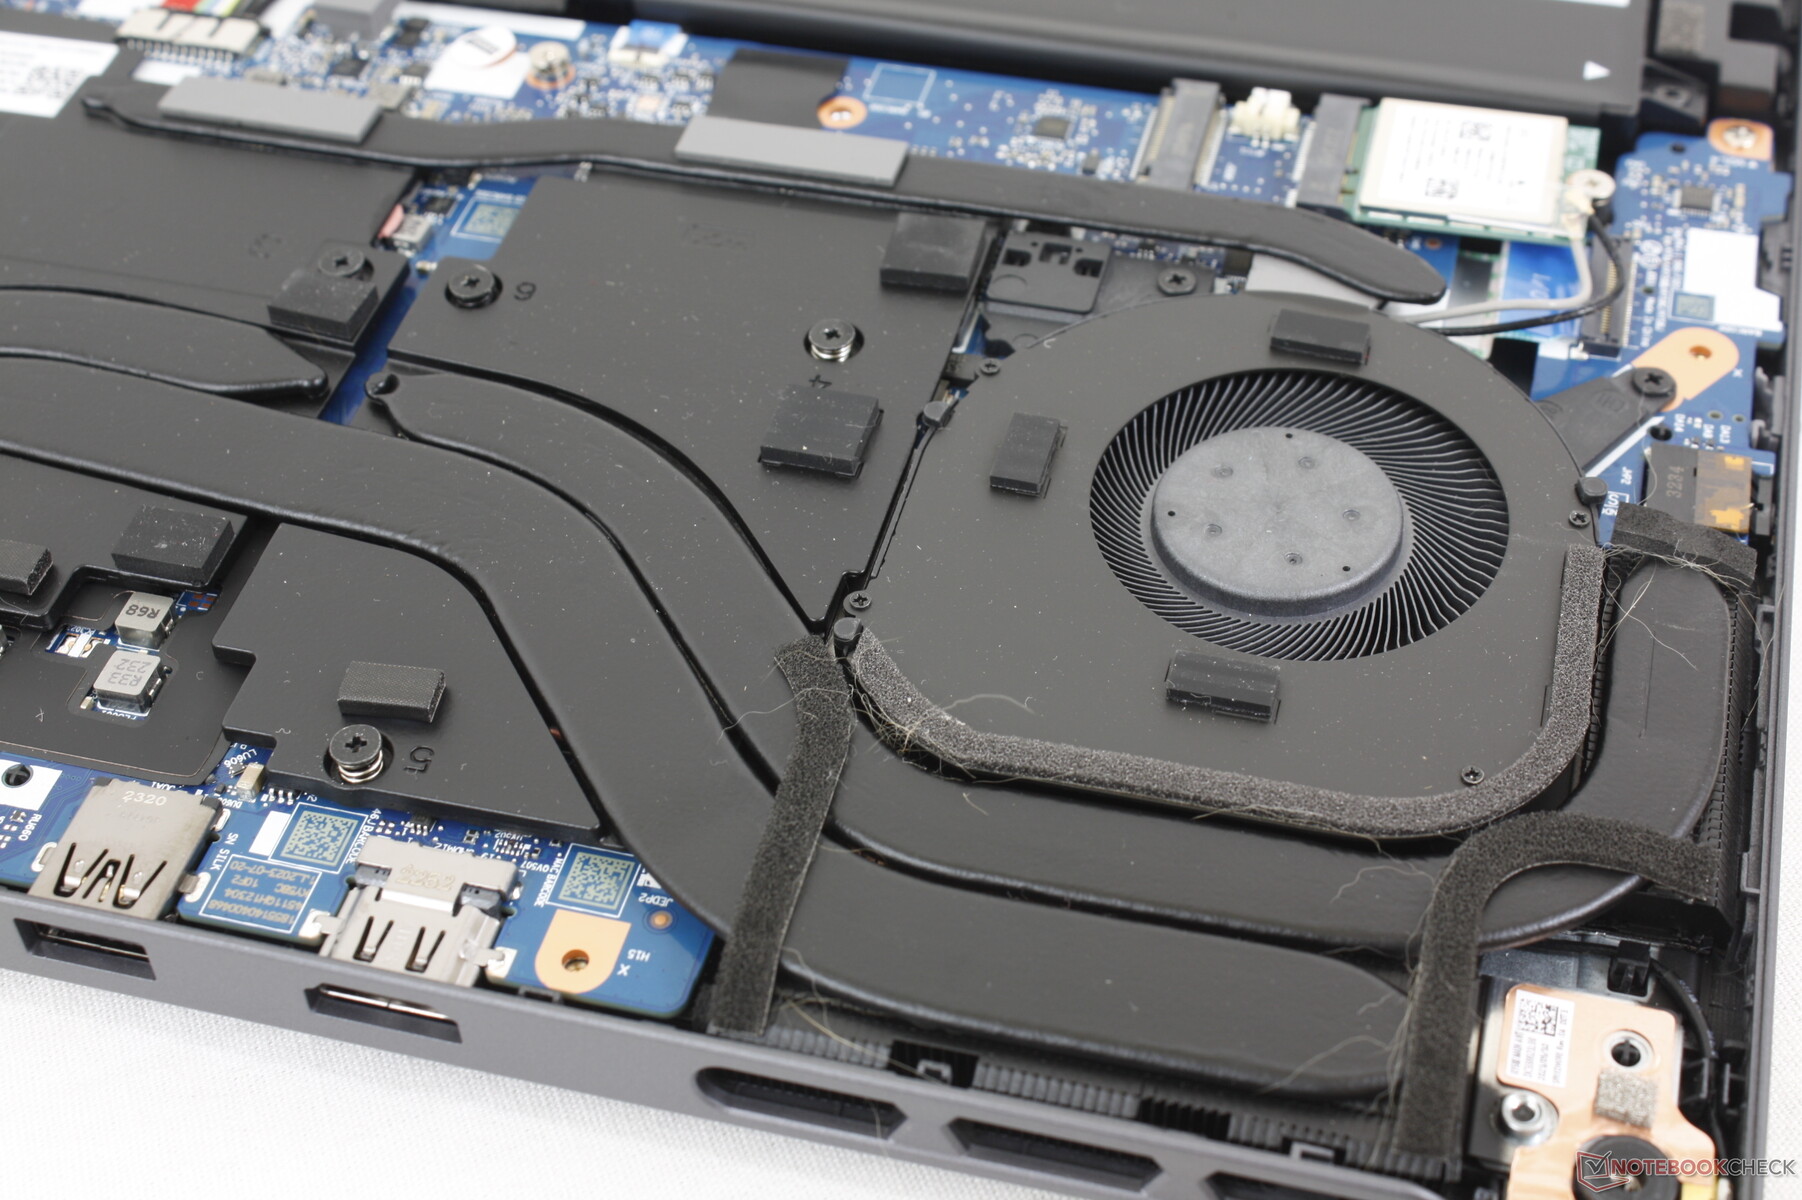
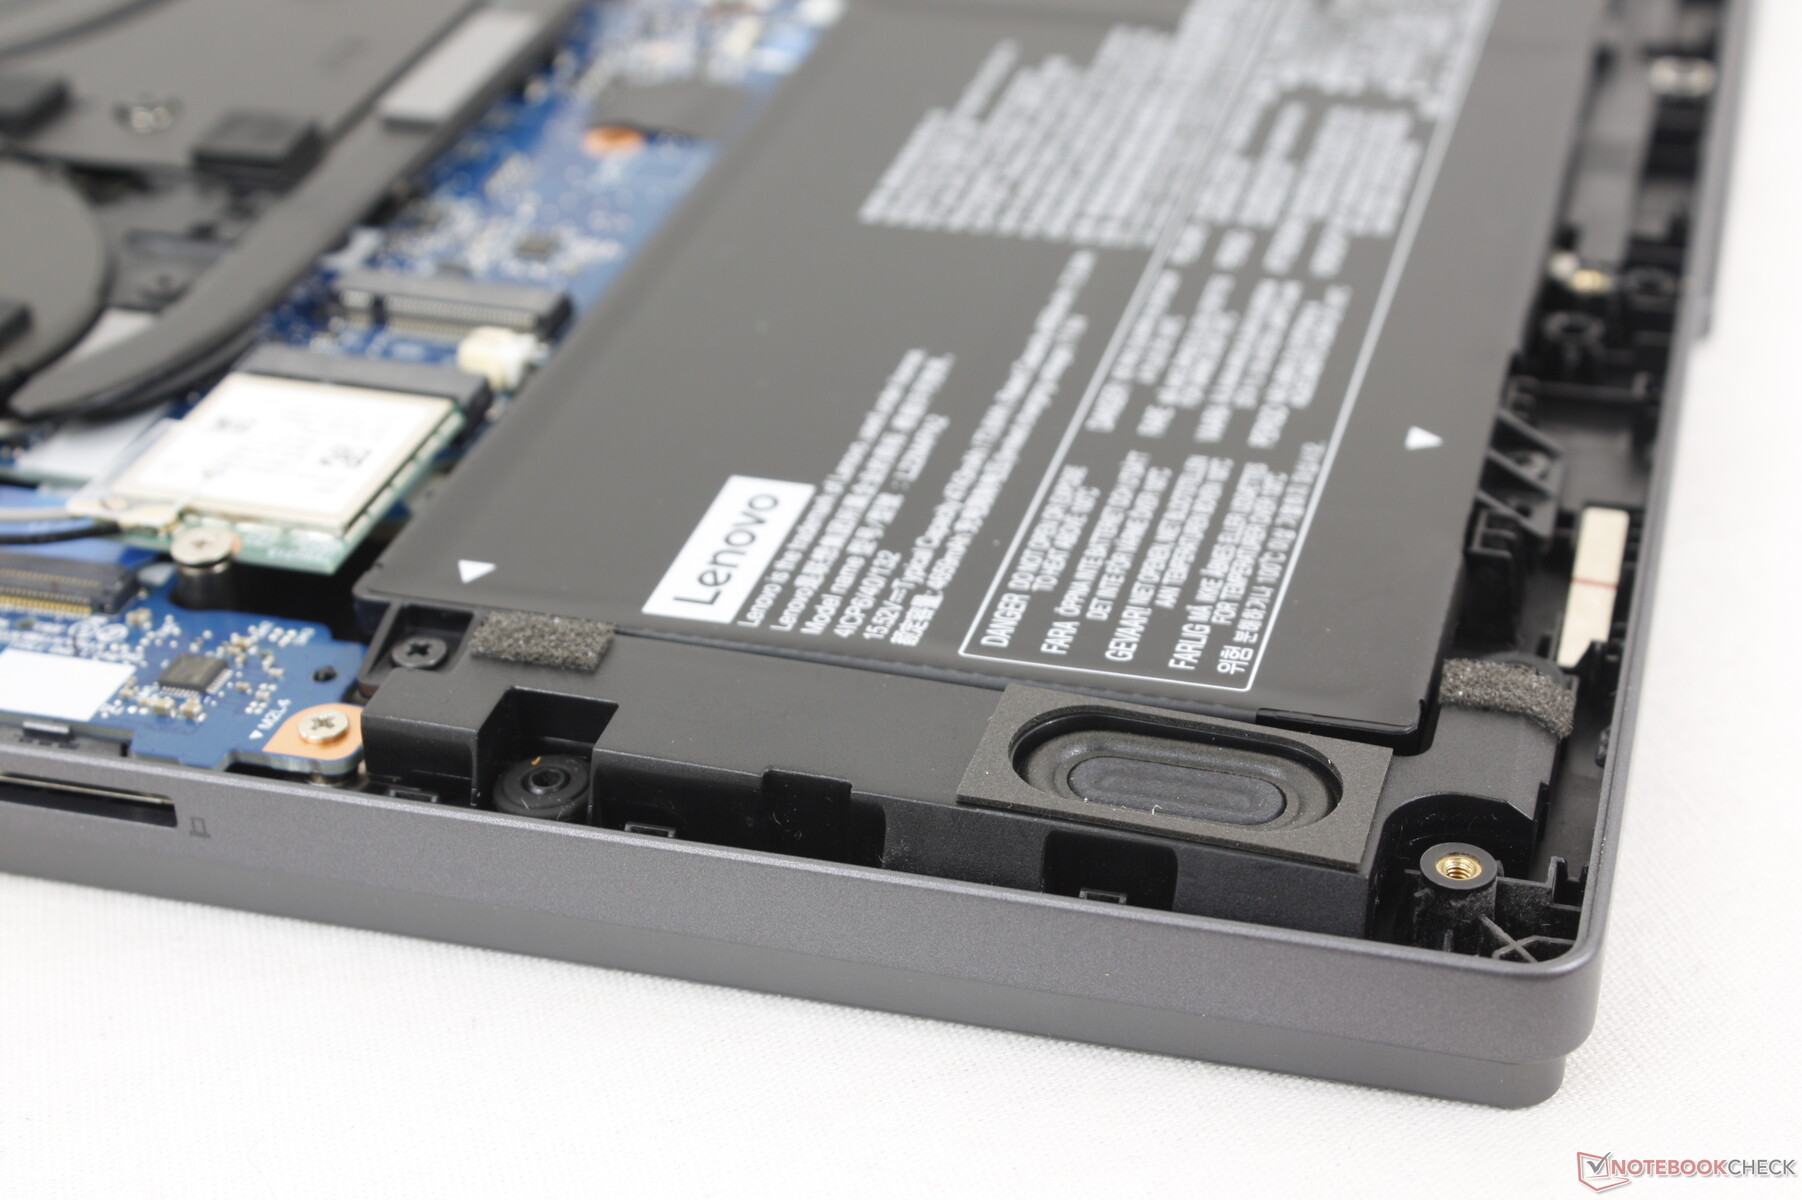
Manutenção
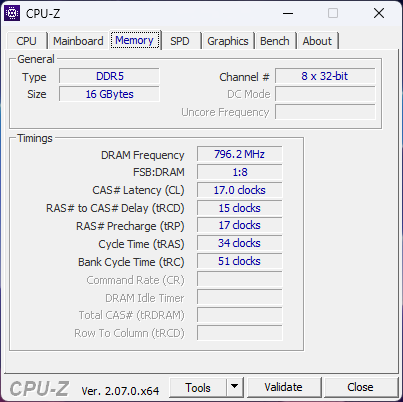
O painel inferior é fixado por 10 parafusos Phillips para facilitar a remoção. A RAM é soldada, deixando os dois slots de SSD M.2 2280 e o módulo WLAN como os únicos componentes atualizáveis. Em comparação, a RAM pode ser atualizada pelo usuário no 2023 Blade 14 e no Zephyrus G14.
Acessórios e garantia
A caixa de varejo inclui o adaptador CA e a documentação, sem extras. A garantia padrão limitada de um ano do fabricante se aplica se for comprada nos EUA.
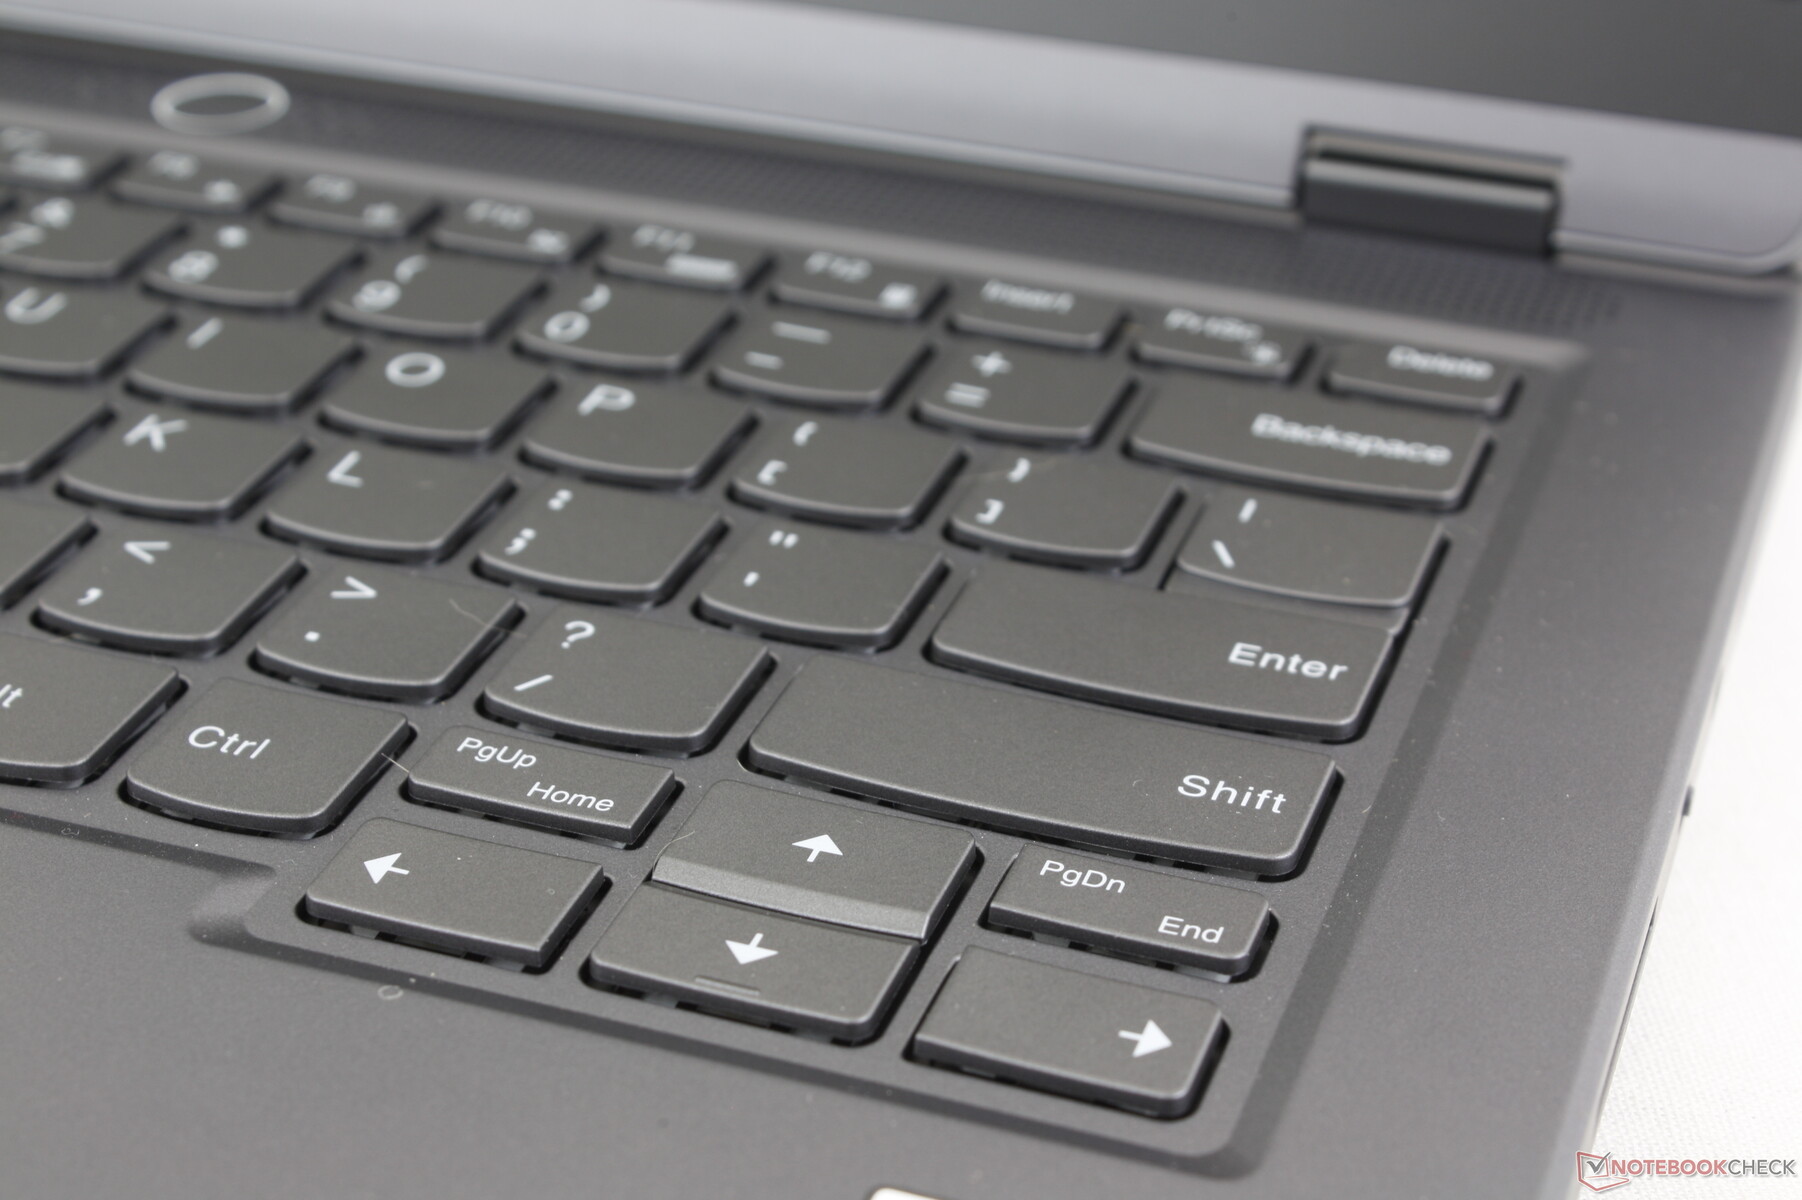
Dispositivos de entrada - Sem iluminação RGB
Teclado
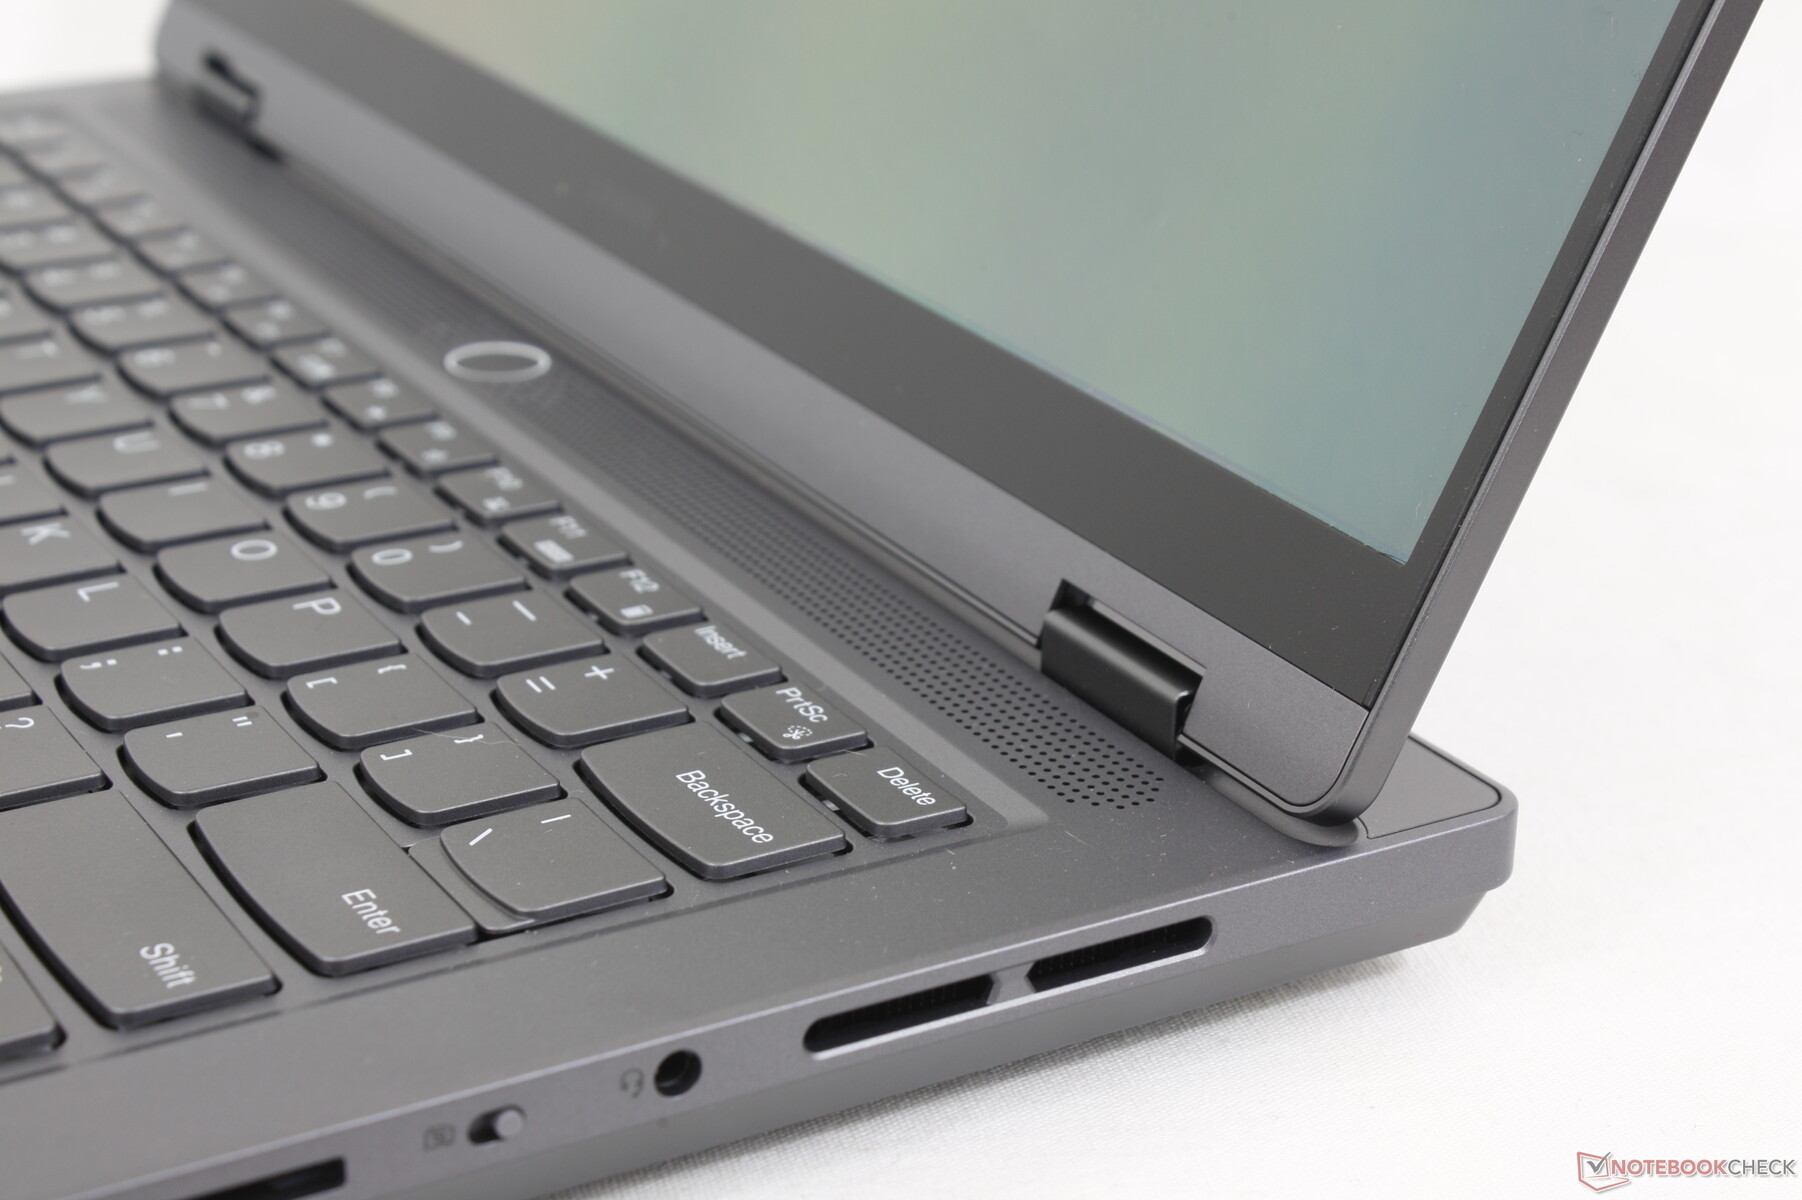
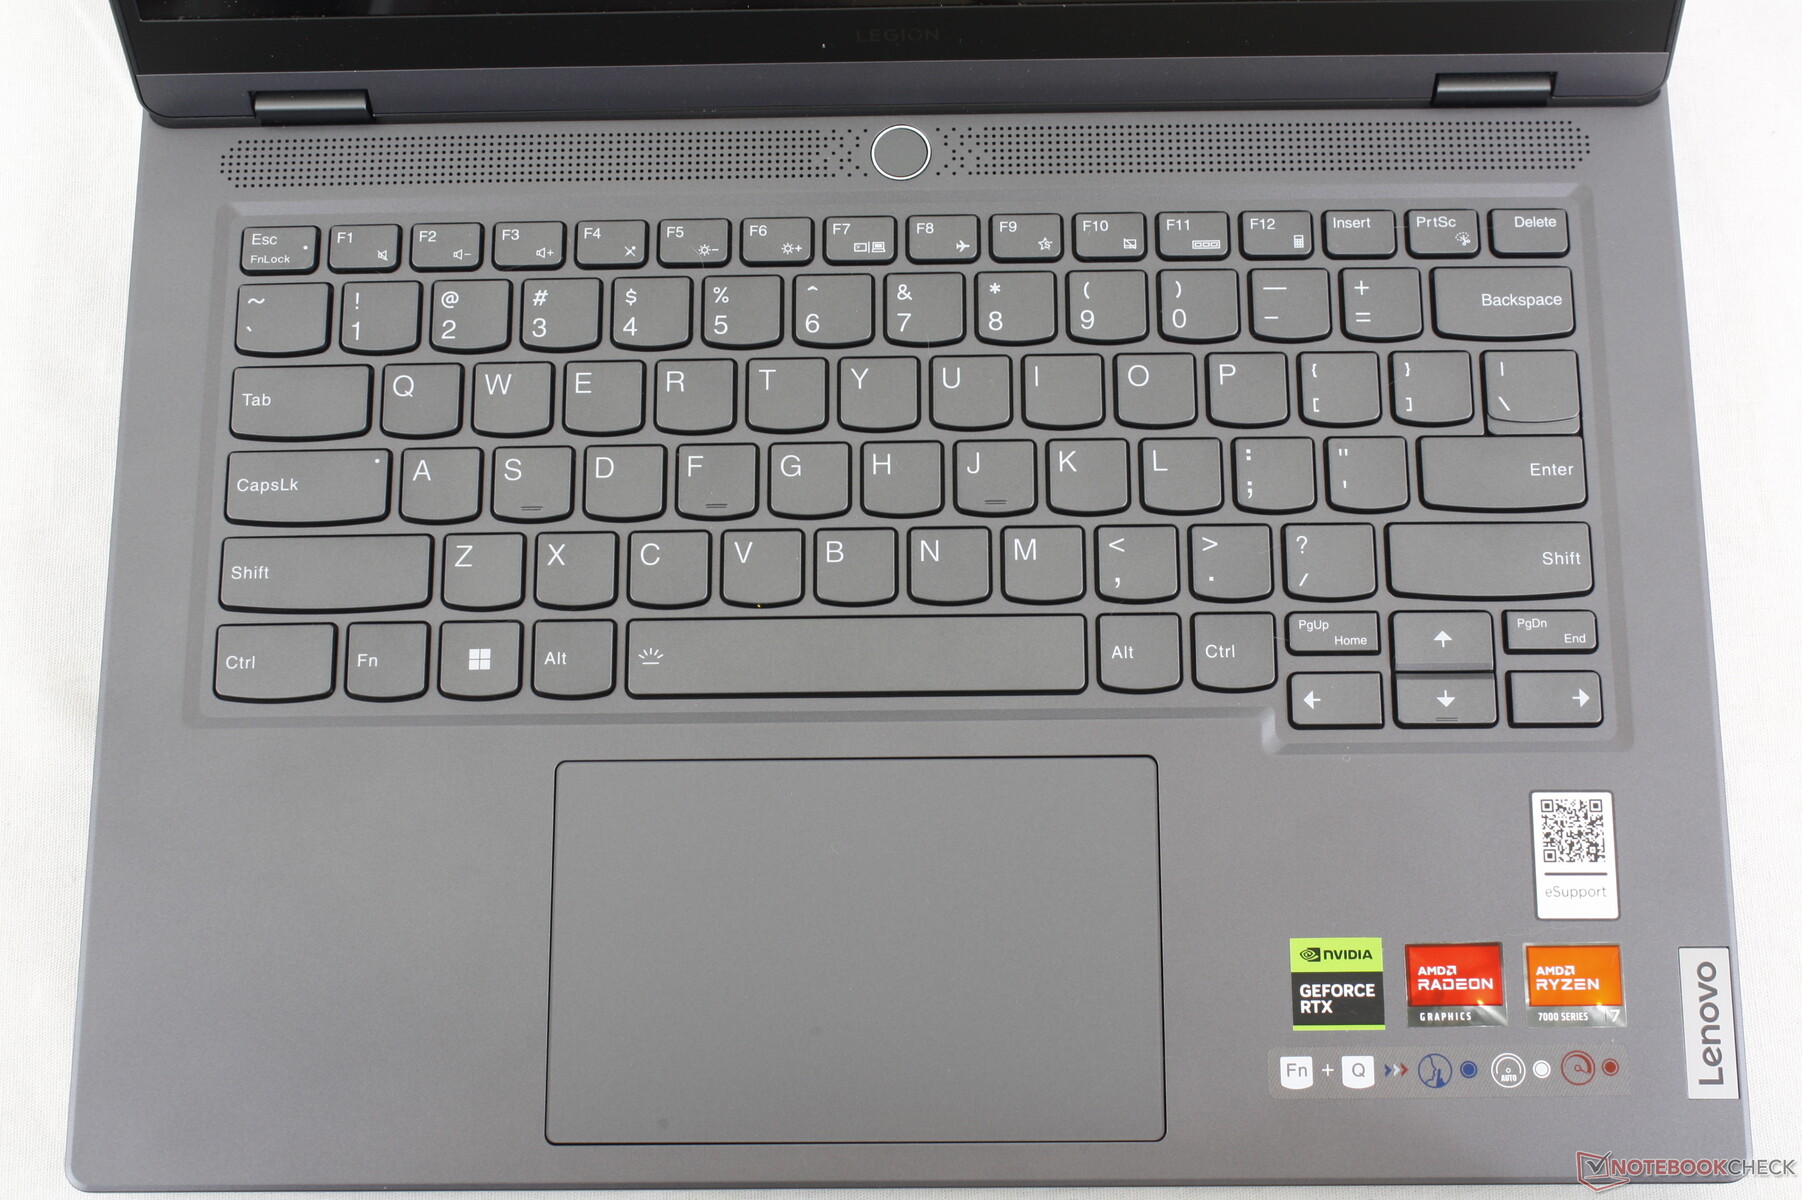
O teclado mantém a sensação e o tamanho das teclas QWERTY principais do modelo maior Legion Slim 5 16 mas com teclas de seta menores e um teclado numérico omitido devido a restrições de área de superfície. A experiência de digitação parece firme e com um feedback mais forte de cada tecla em comparação com as teclas mais suaves do Blade 14. No entanto, as teclas estreitas PgUp e PgDn ficam espremidas entre as teclas de seta e são desconfortáveis de pressionar.
A Lenovo oferece apenas uma luz de fundo branca de zona única, enquanto os modelos da Razer, Asus e Alienware têm iluminação RGB de várias zonas.
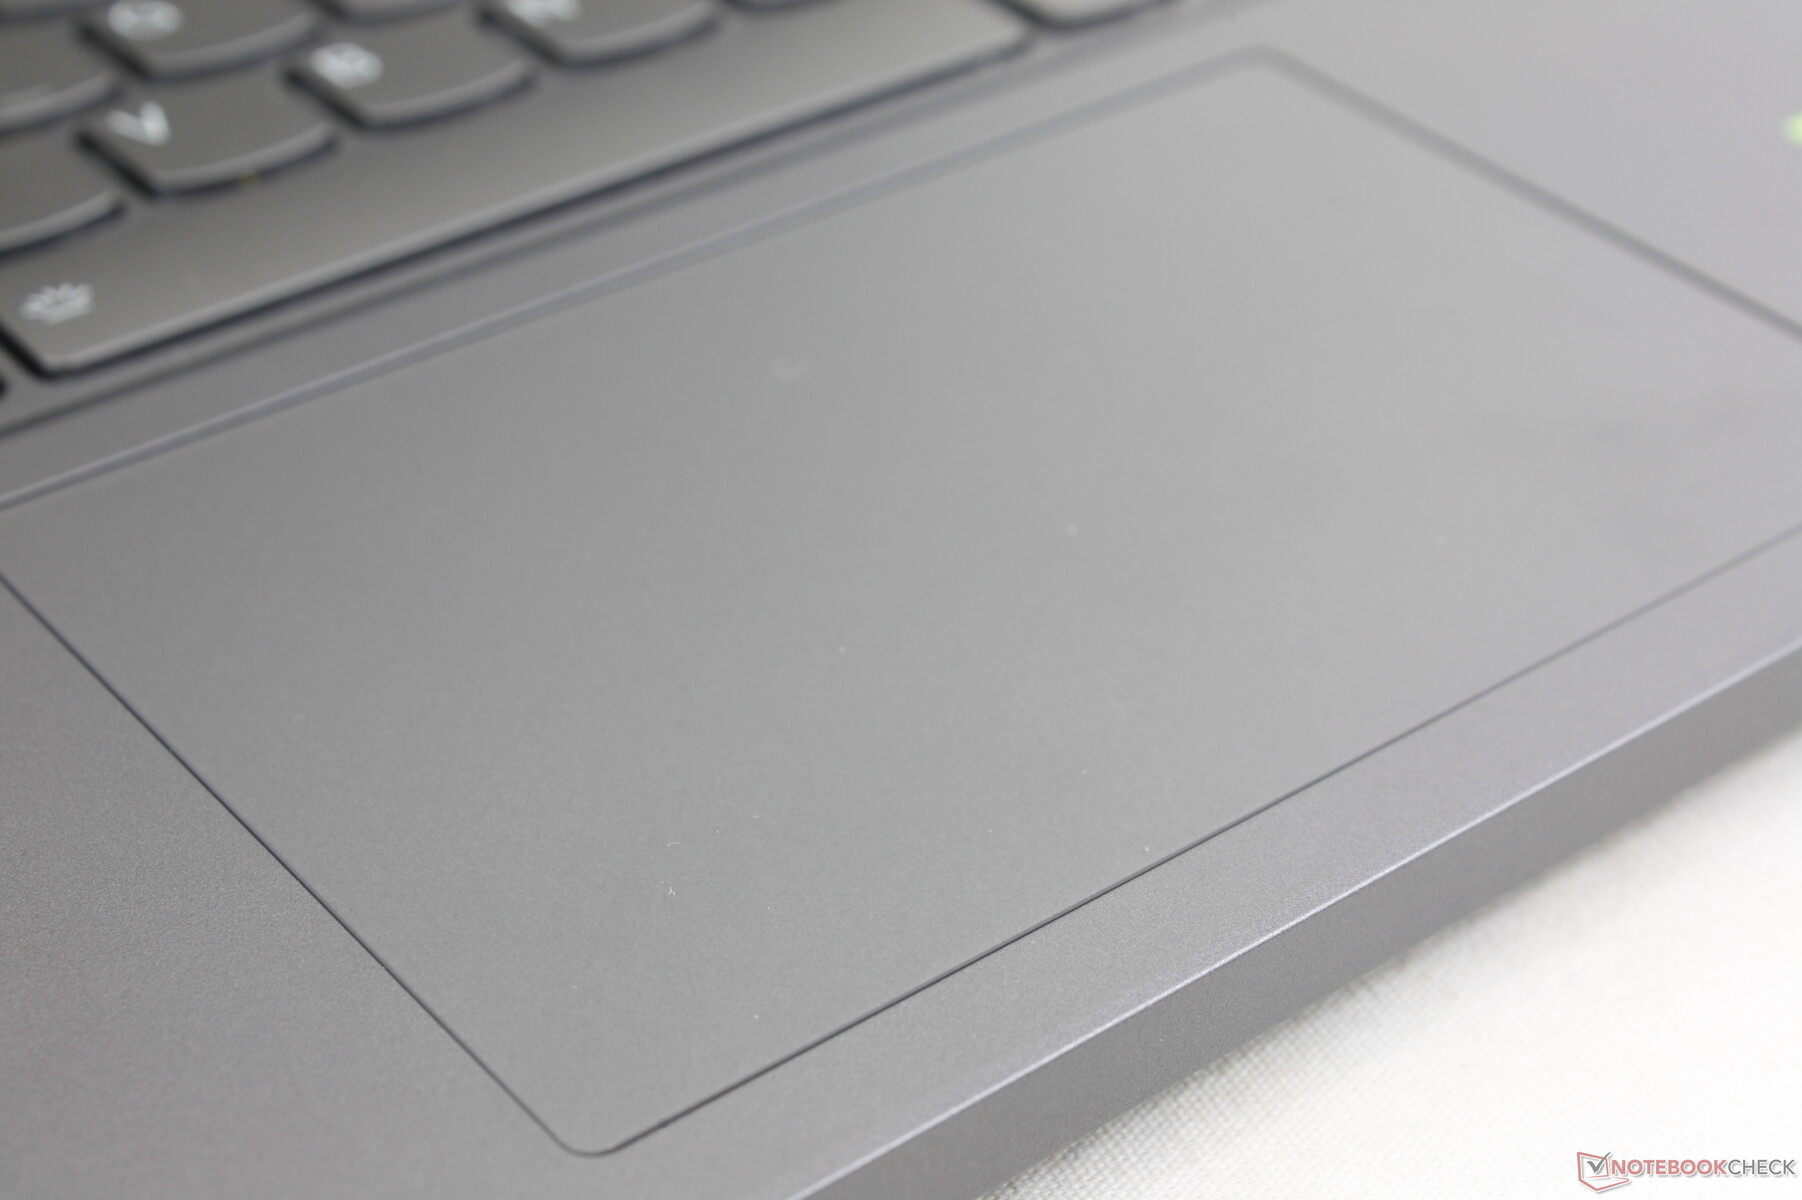
Touchpad
O clickpad (12 x 7,5 cm) é maior do que o do Alienware x14 (10,8 x 5,5 cm), mas é menor do que o do Blade 14 (15 x 8,5 cm). No entanto, é suave e confiável, com um ruído silencioso quando pressionado. O feedback ao inserir um clique poderia ser um pouco mais firme, pois é um pouco mais suave.
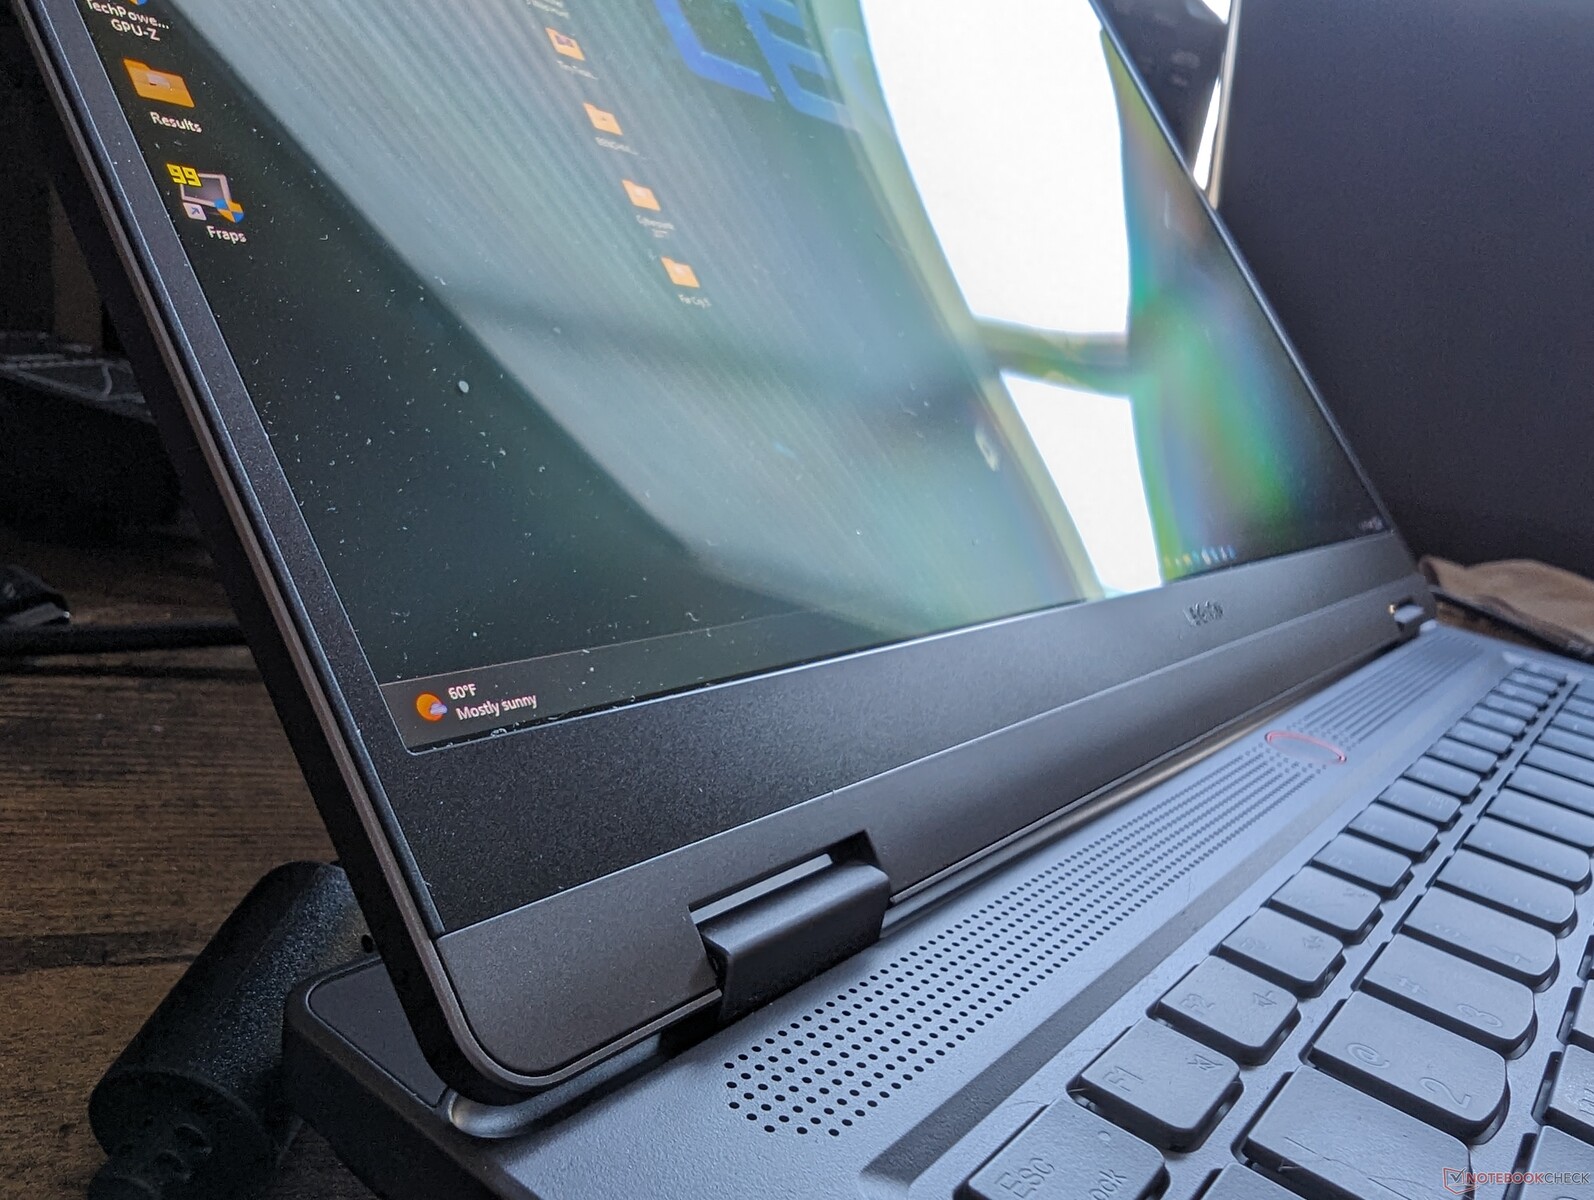
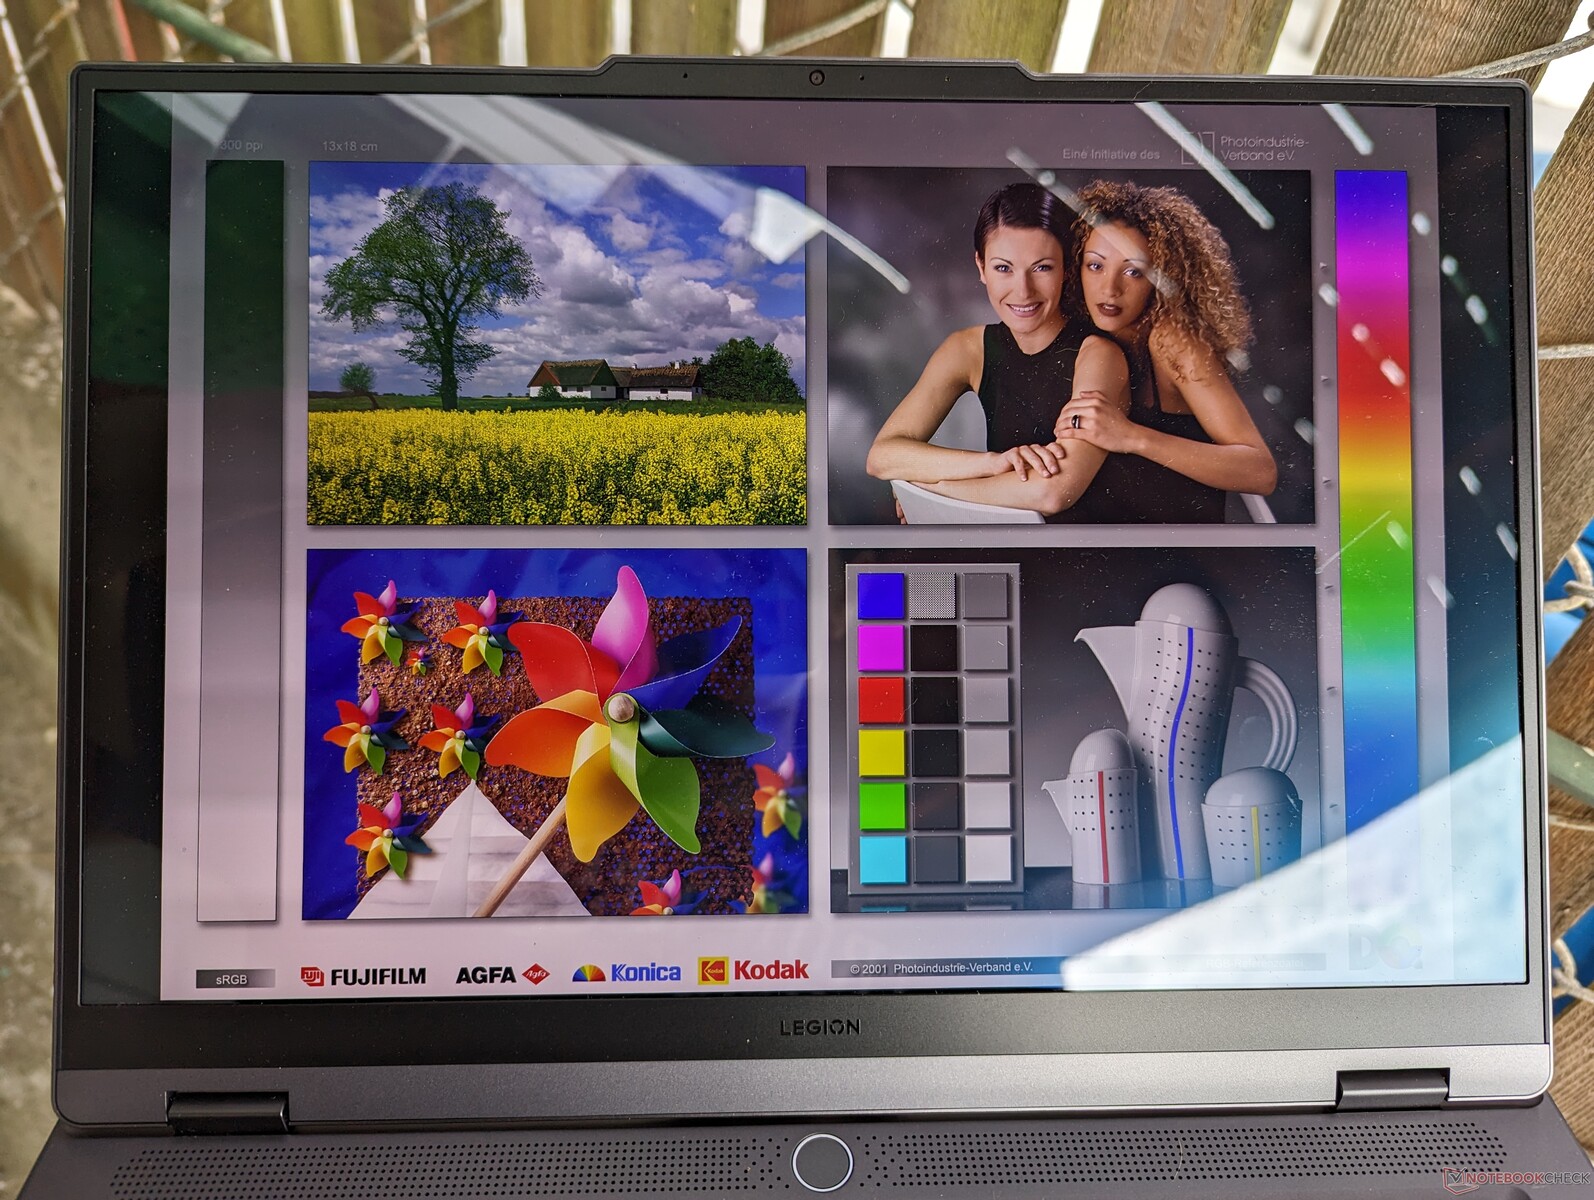
Tela - falta um recurso importante
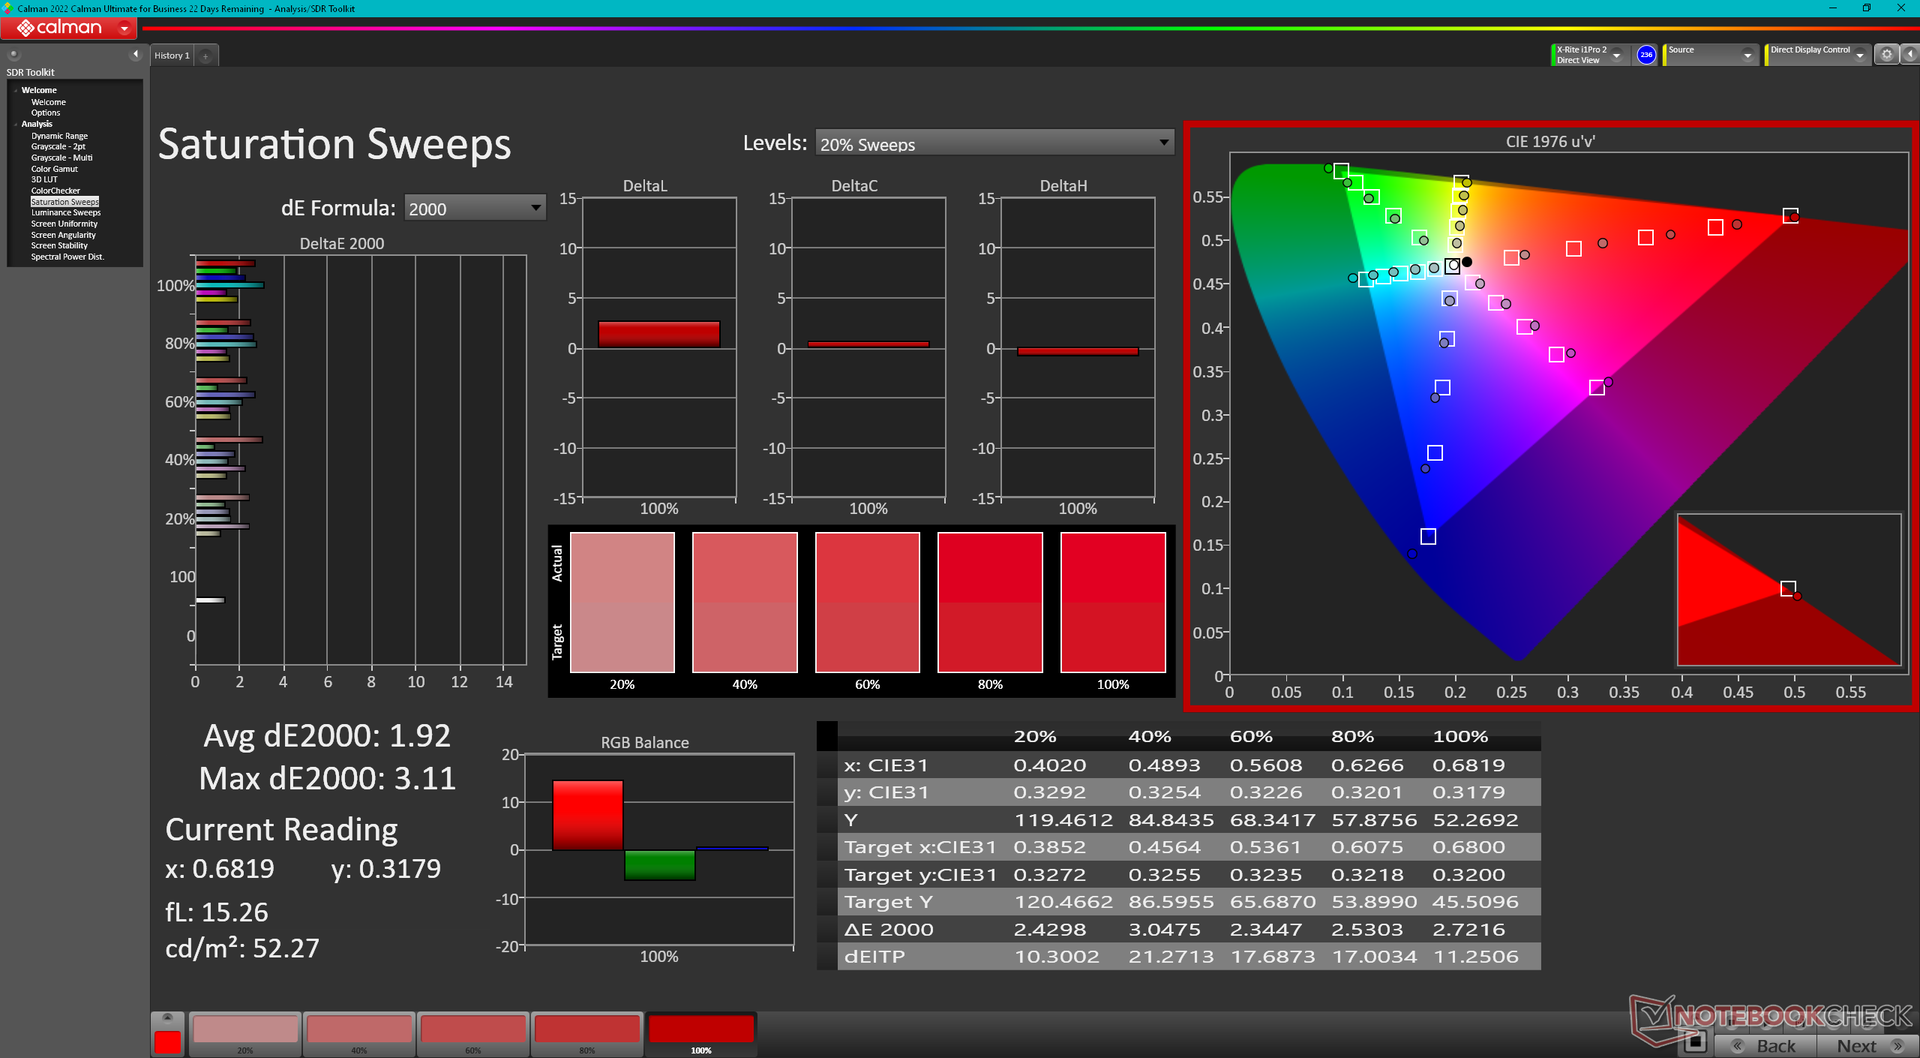
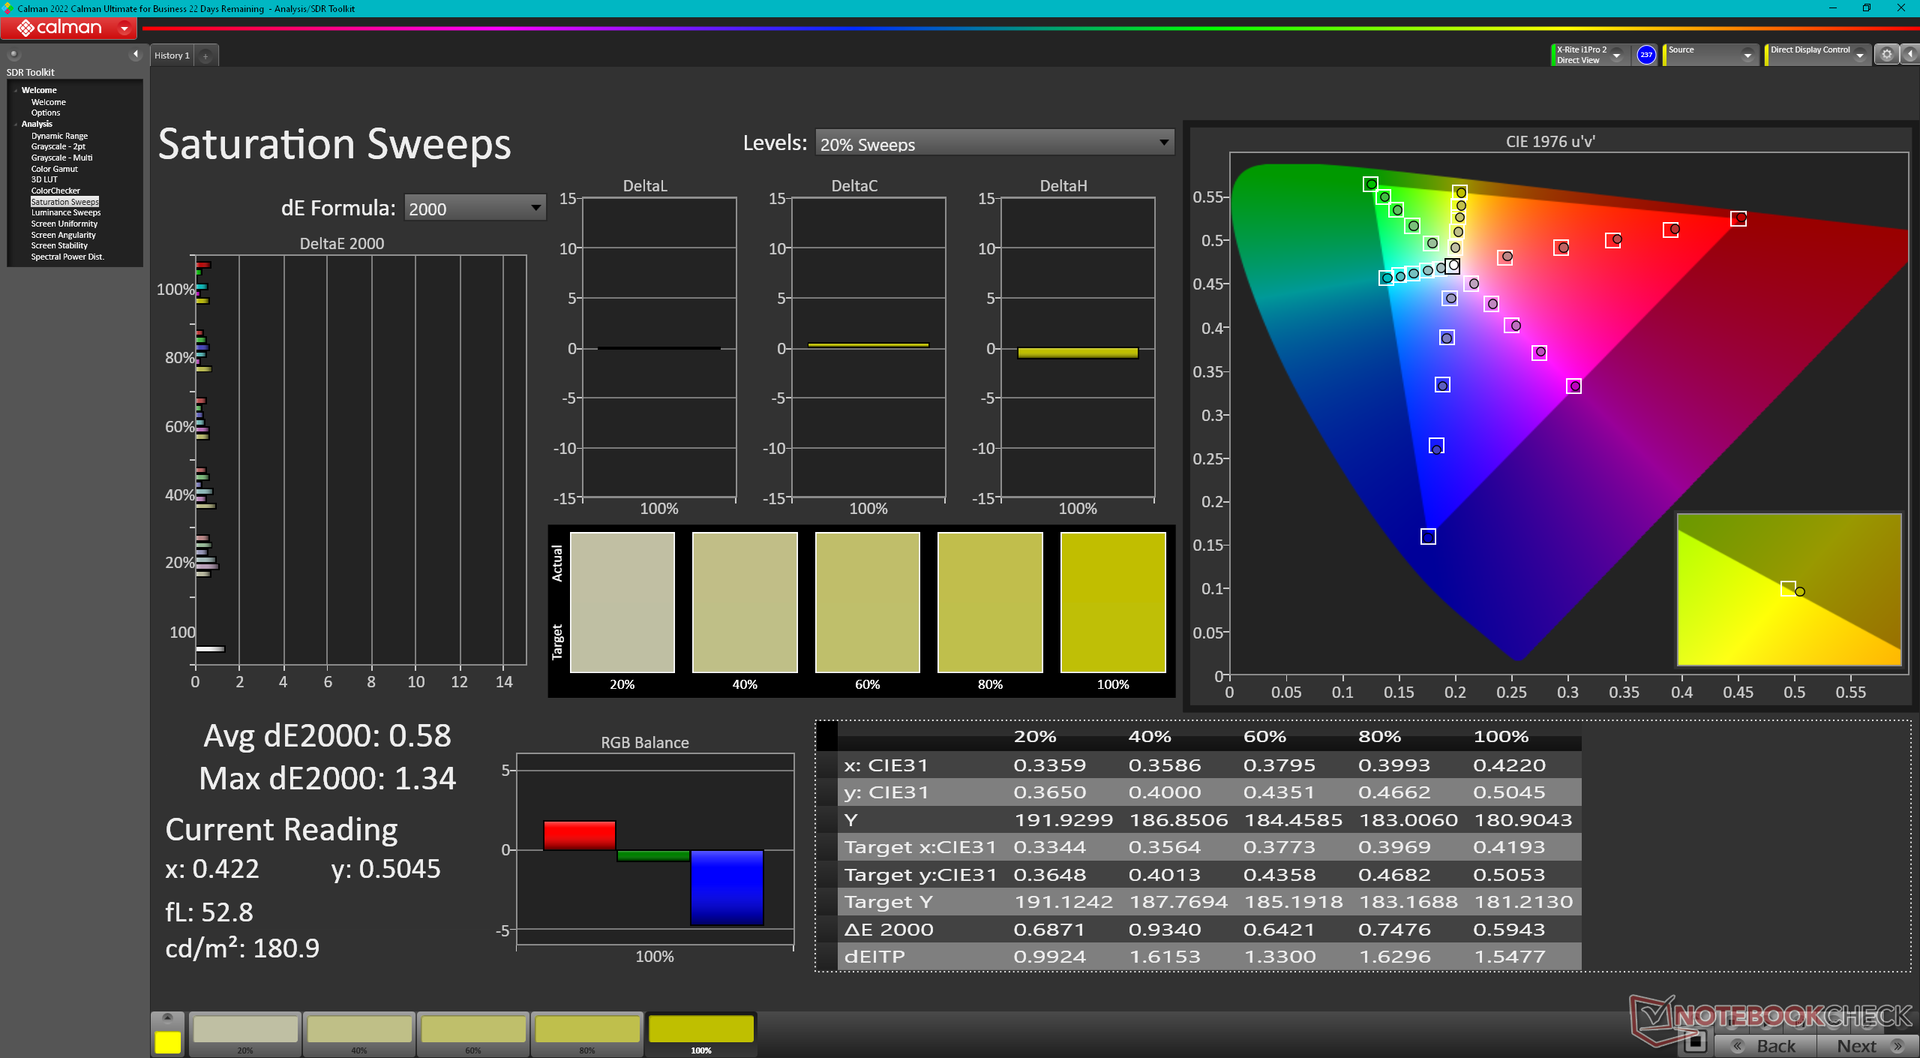
A tela OLED é o destaque do Legion Slim 5 14, pois não pode ser encontrada em nenhum outro laptop para jogos de 14 polegadas no momento. Ela oferece uma taxa de atualização nativa de 120 Hz, resolução densa de 2,8K e cores DCI-P3 completas para ser adequada tanto para jogos quanto para criação de conteúdo. A maioria dos outros painéis OLED, como os da série Série Asus VivoBook mais baratos, estão limitados a 60 Hz ou 90 Hz em comparação. O painel aqui é até certificado pela Pantone, o que não esperávamos de um laptop Legion projetado principalmente para jogos.
A maior desvantagem da tela é a falta de suporte ao G-Sync, o que é uma pena para um laptop caro para jogos.
| |||||||||||||||||||||||||
iluminação: 97 %
iluminação com acumulador: 377.5 cd/m²
Contraste: ∞:1 (Preto: 0 cd/m²)
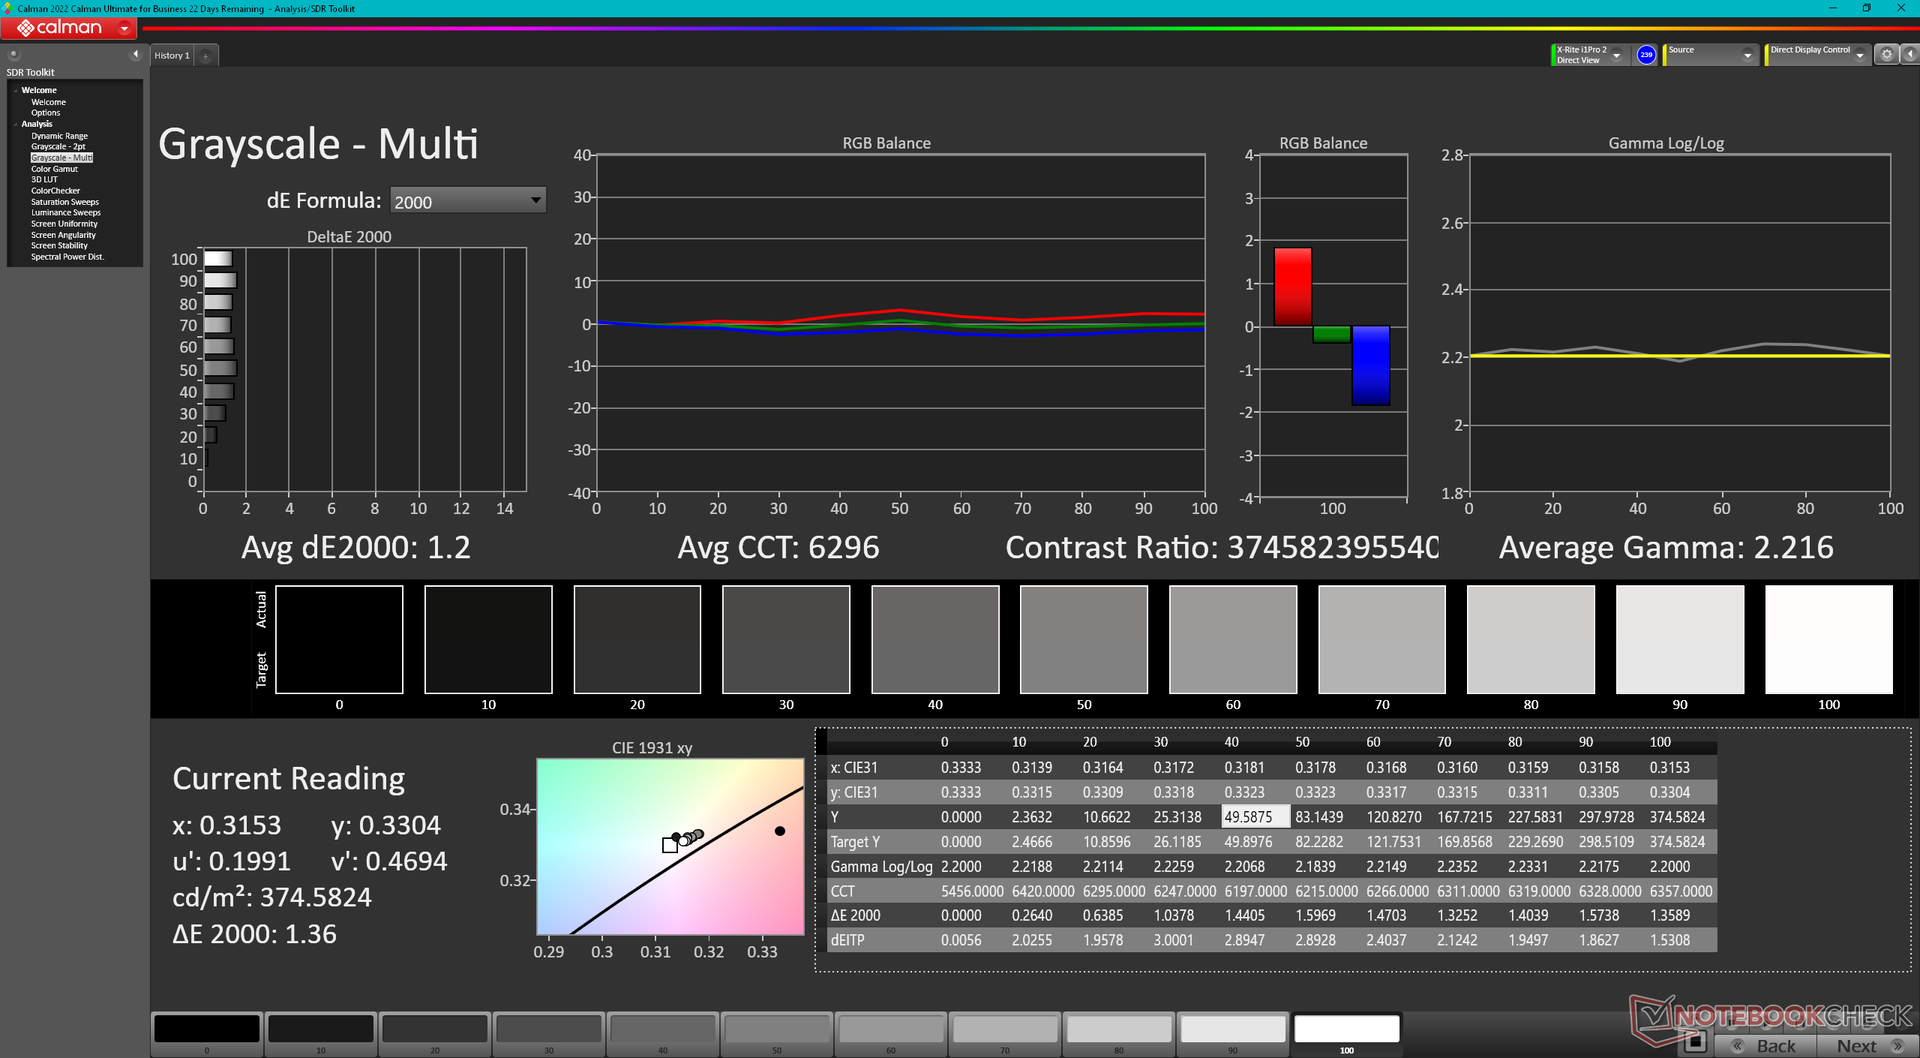
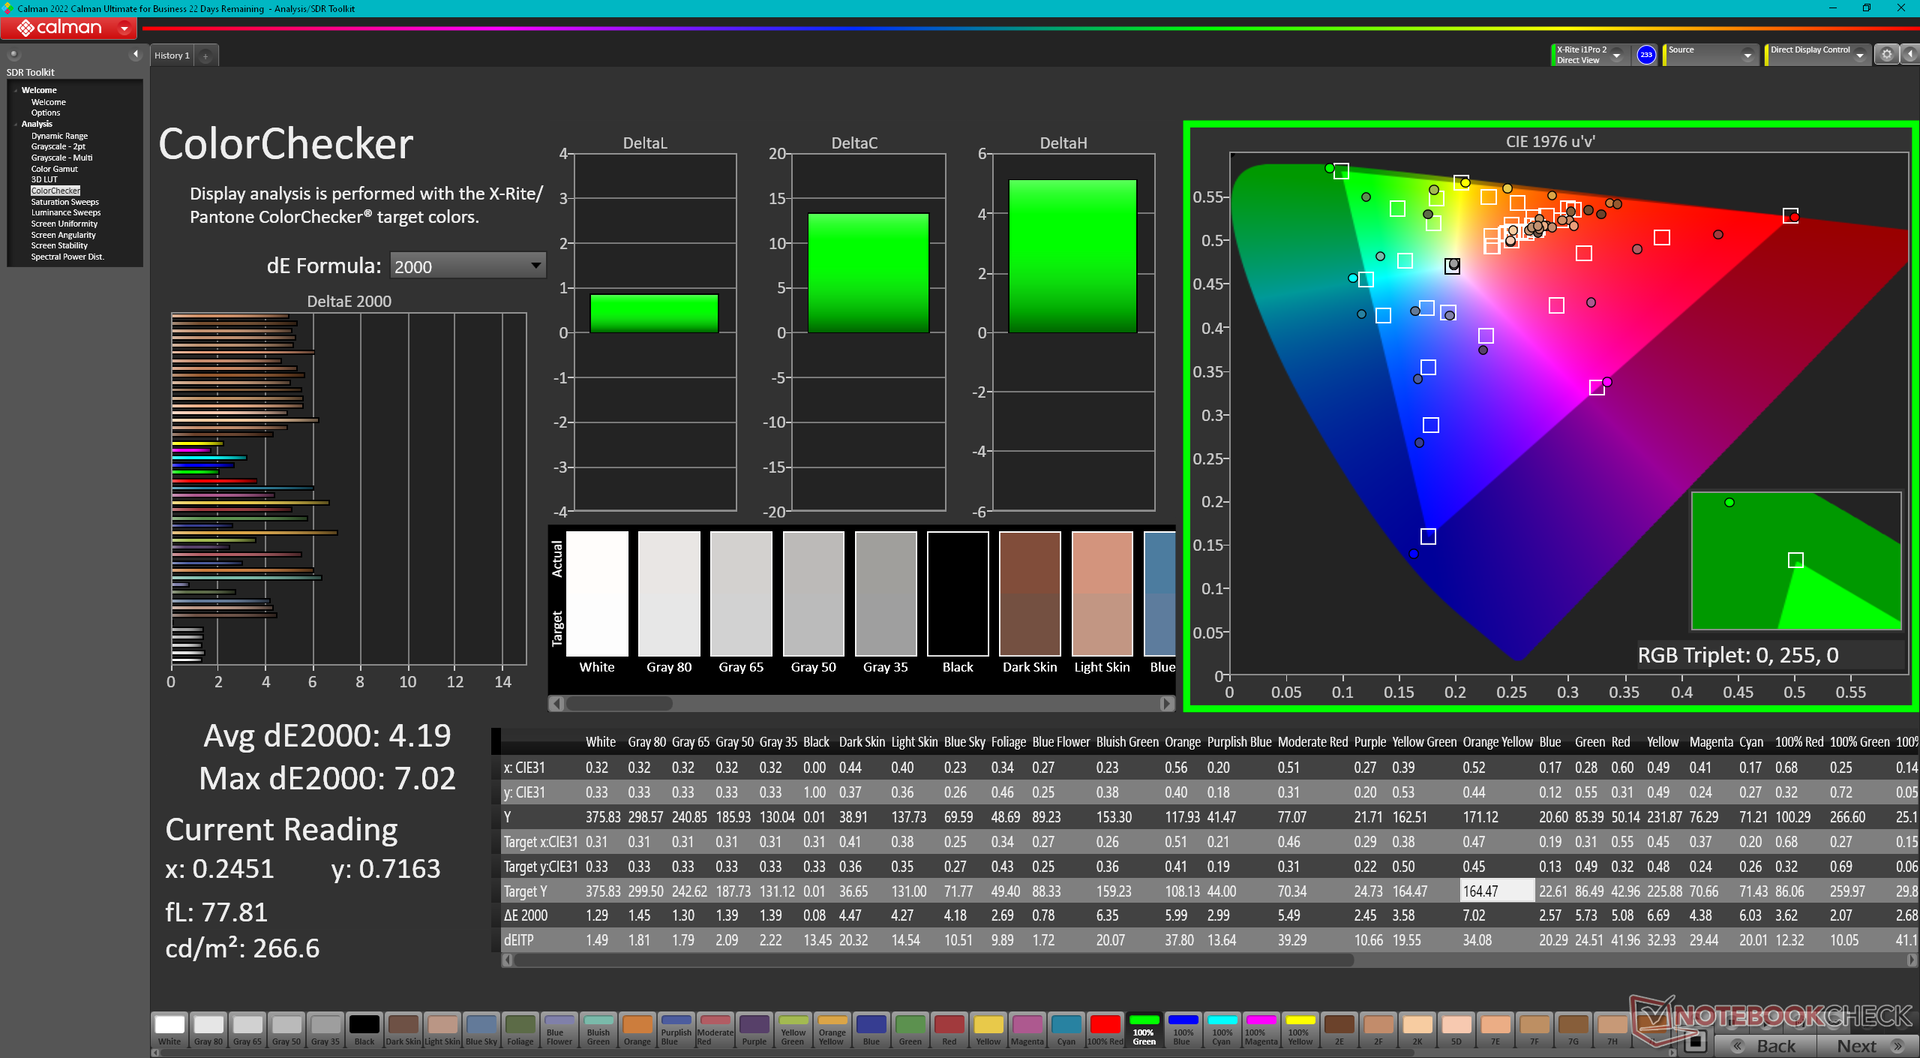
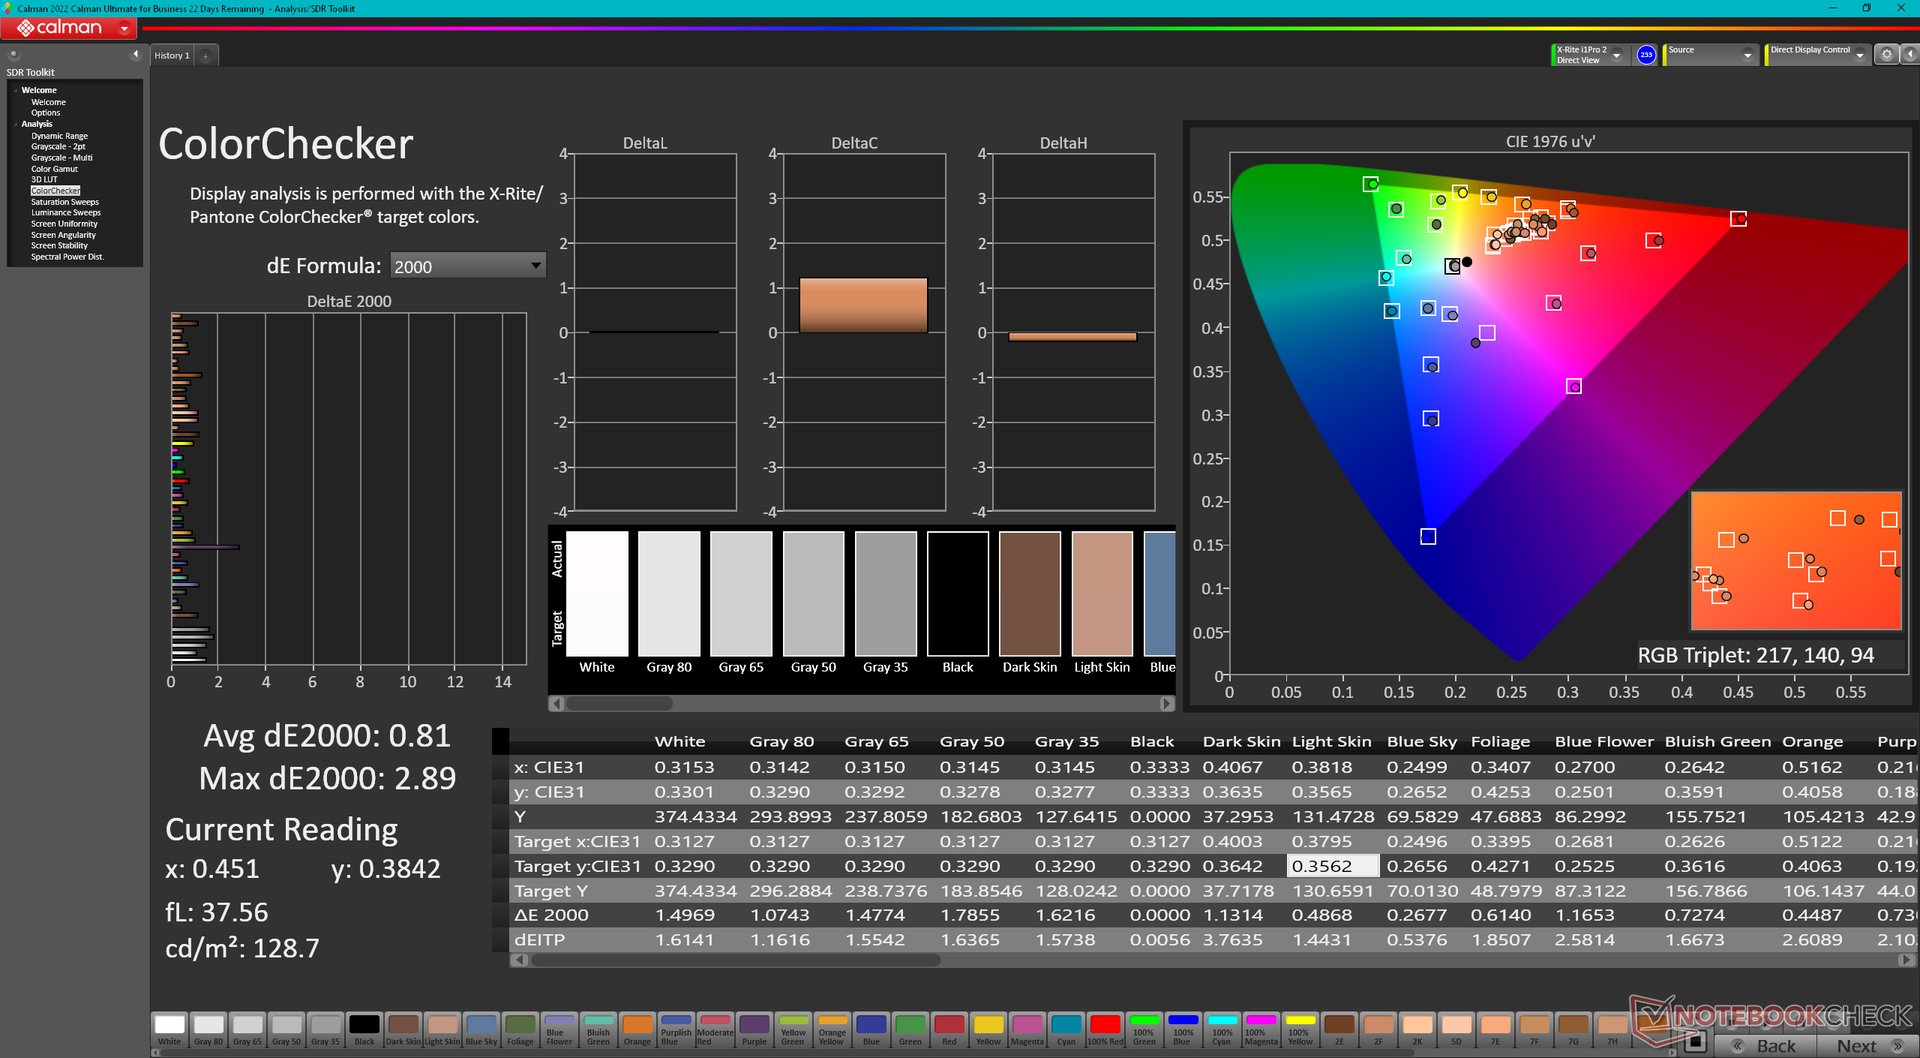
ΔE ColorChecker Calman: 4.19 | ∀{0.5-29.43 Ø4.71}
calibrated: 0.81
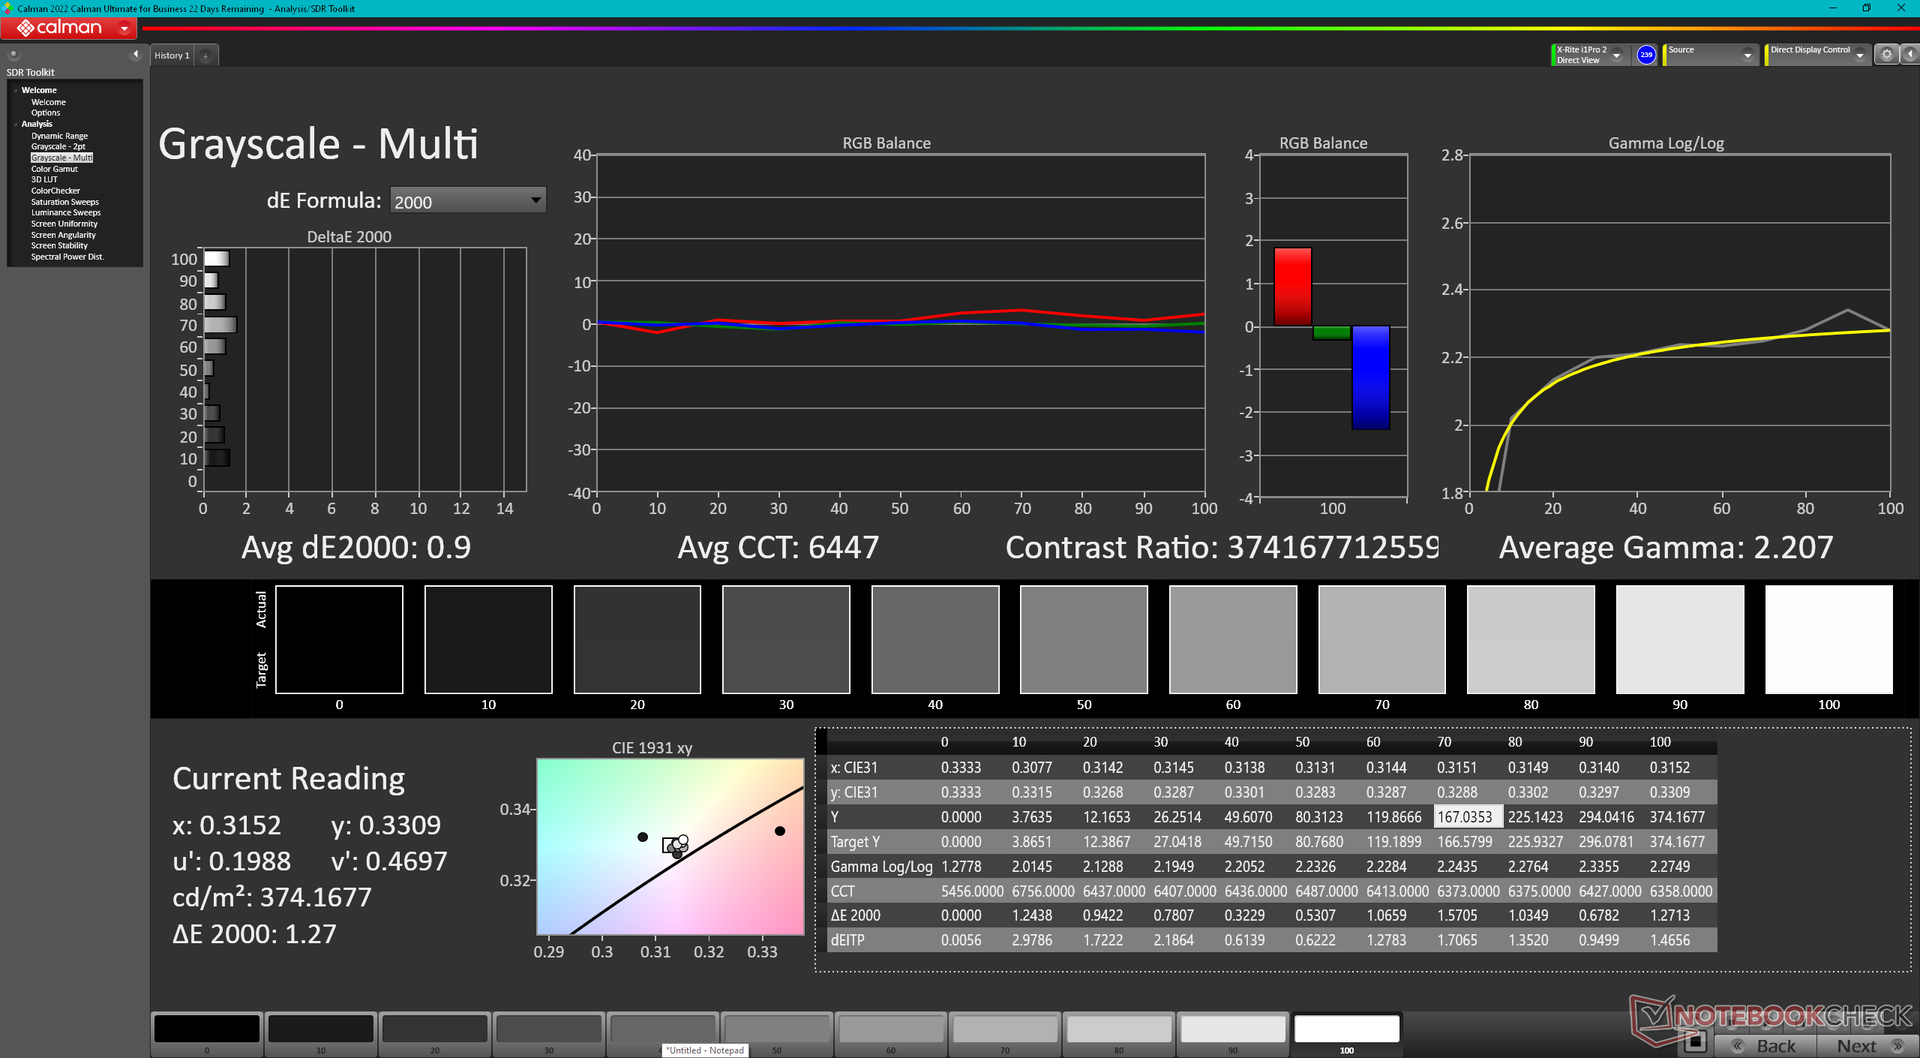
ΔE Greyscale Calman: 1.2 | ∀{0.09-98 Ø4.96}
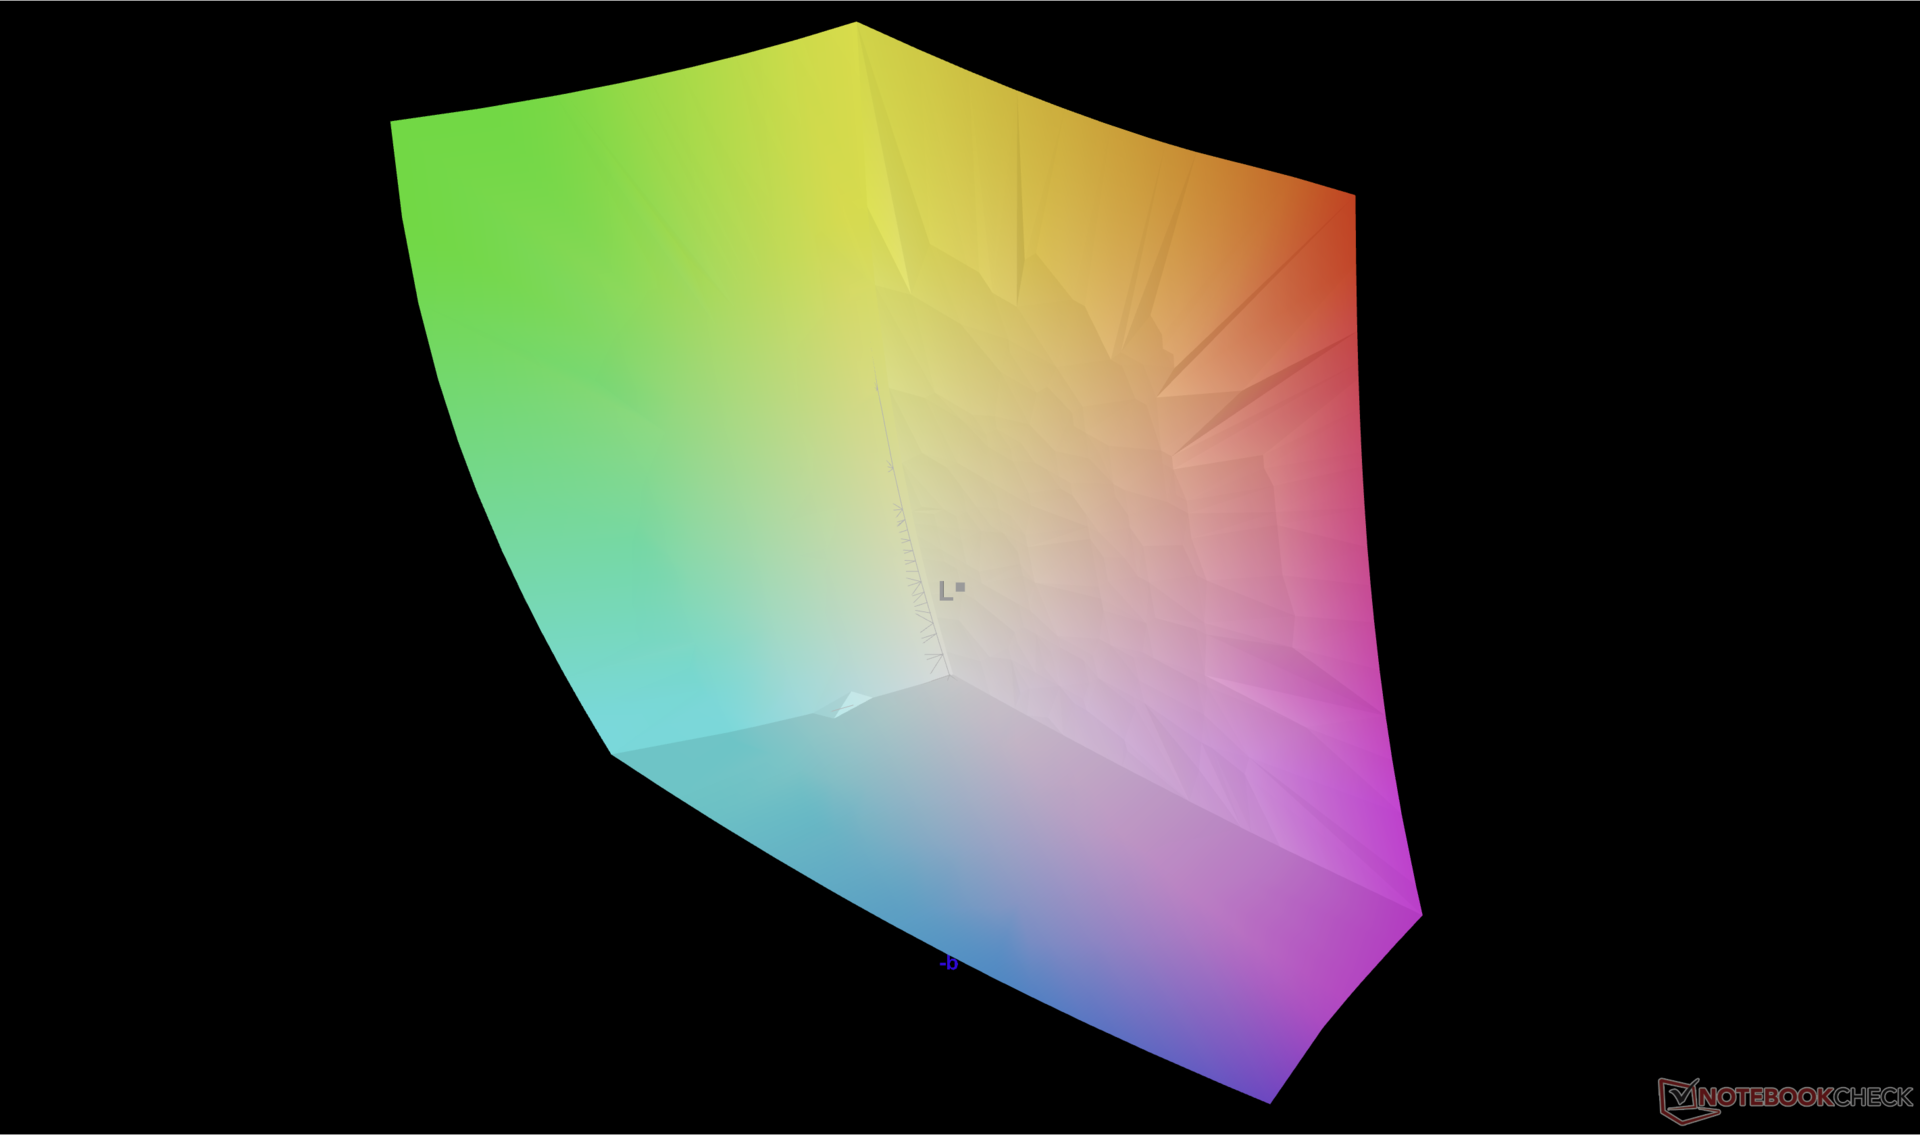
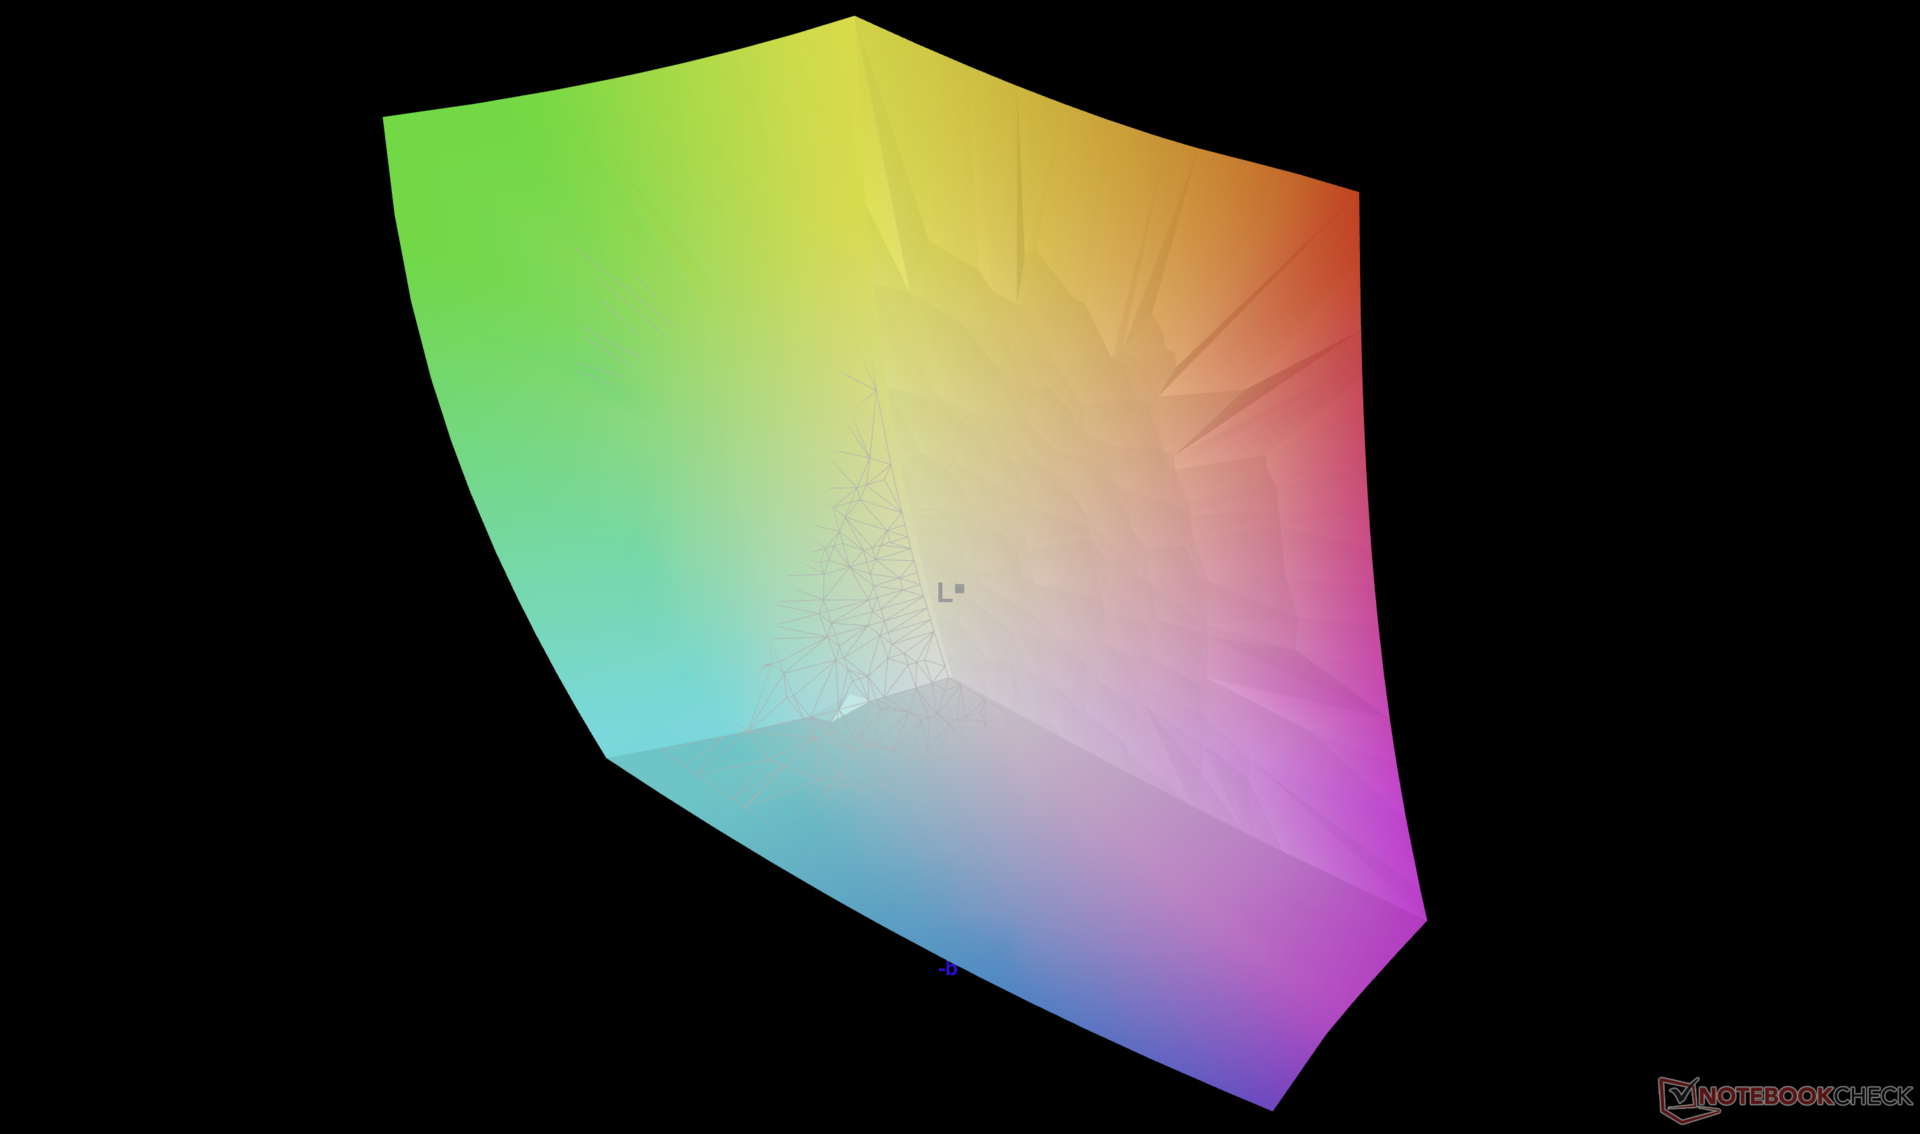
96.5% AdobeRGB 1998 (Argyll 3D)
100% sRGB (Argyll 3D)
99.9% Display P3 (Argyll 3D)
Gamma: 2.22
CCT: 6296 K
| Lenovo Legion Slim 5 14APH8 Samsung SDC ATNA45AF02-2, OLED, 2880x1600, 14.5" | Acer Predator Triton 14 PT14-51 BOE NE140QDM-NY1, IPS, 2560x1600, 14" | Razer Blade 14 RTX 4070 AU Optronics B140QAN06.U, IPS, 2560x1600, 14" | Asus ROG Zephyrus G14 GA402XY B140QAN06.S, Mini-LED, 2560x1600, 14" | Alienware x14 i7 RTX 3060 SHP154D, IPS, 1920x1080, 14" | Lenovo LOQ 15APH8 BOE NJ NE156FHM-NX3, IPS, 1920x1080, 15.6" | |
|---|---|---|---|---|---|---|
| Display | -5% | -5% | -1% | -3% | -52% | |
| Display P3 Coverage (%) | 99.9 | 96.9 -3% | 97.3 -3% | 99.6 0% | 99.6 0% | 40.2 -60% |
| sRGB Coverage (%) | 100 | 99.9 0% | 99.8 0% | 100 0% | 100 0% | 60.2 -40% |
| AdobeRGB 1998 Coverage (%) | 96.5 | 85.5 -11% | 85.3 -12% | 93.4 -3% | 87.6 -9% | 41.5 -57% |
| Response Times | -1143% | -1049% | -1479% | -884% | -3816% | |
| Response Time Grey 50% / Grey 80% * (ms) | 0.79 ? | 15.1 ? -1811% | 11.9 ? -1406% | 17.2 ? -2077% | 9.6 ? -1115% | 42.7 ? -5305% |
| Response Time Black / White * (ms) | 1.01 ? | 5.8 ? -474% | 8 ? -692% | 9.9 ? -880% | 7.6 ? -652% | 24.5 ? -2326% |
| PWM Frequency (Hz) | 240.5 ? | 5430 | ||||
| Screen | -33% | -52% | 28% | -38% | -62% | |
| Brightness middle (cd/m²) | 377.5 | 547 45% | 559.3 48% | 535 42% | 434 15% | 346.2 -8% |
| Brightness (cd/m²) | 381 | 516 35% | 560 47% | 563 48% | 411 8% | 329 -14% |
| Brightness Distribution (%) | 97 | 88 -9% | 88 -9% | 91 -6% | 89 -8% | 81 -16% |
| Black Level * (cd/m²) | 0.56 | 0.44 | 0.25 | 0.31 | ||
| Colorchecker dE 2000 * | 4.19 | 3.28 22% | 4.44 -6% | 1 76% | 3 28% | 4.19 -0% |
| Colorchecker dE 2000 max. * | 7.02 | 8.57 -22% | 9.3 -32% | 2.8 60% | 7.1 -1% | 19.19 -173% |
| Colorchecker dE 2000 calibrated * | 0.81 | 1.09 -35% | 0.39 52% | 0.7 14% | 1.66 -105% | |
| Greyscale dE 2000 * | 1.2 | 4.4 -267% | 6.8 -467% | 1.8 -50% | 5.1 -325% | 2.6 -117% |
| Gamma | 2.22 99% | 2.168 101% | 2.3 96% | 2.24 98% | 2.19 100% | 2.19 100% |
| CCT | 6296 103% | 7767 84% | 6242 104% | 6337 103% | 6204 105% | 6749 96% |
| Contrast (:1) | 977 | 1271 | 1736 | 1117 | ||
| Média Total (Programa/Configurações) | -394% /
-211% | -369% /
-207% | -484% /
-254% | -308% /
-170% | -1310% /
-685% |
* ... menor é melhor
O monitor é bem calibrado desde o início em relação ao padrão DCI-P3 e, portanto, não será necessária uma calibração do usuário final para a maioria dos usuários. No entanto, a temperatura da cor é um pouco quente demais a 6300K, mas isso é apenas um pequeno detalhe. Nosso perfil ICM está disponível para download gratuito acima.
Exibir tempos de resposta
| ↔ Tempo de resposta preto para branco | ||
|---|---|---|
| 1.01 ms ... ascensão ↗ e queda ↘ combinadas | ↗ 0.64 ms ascensão | 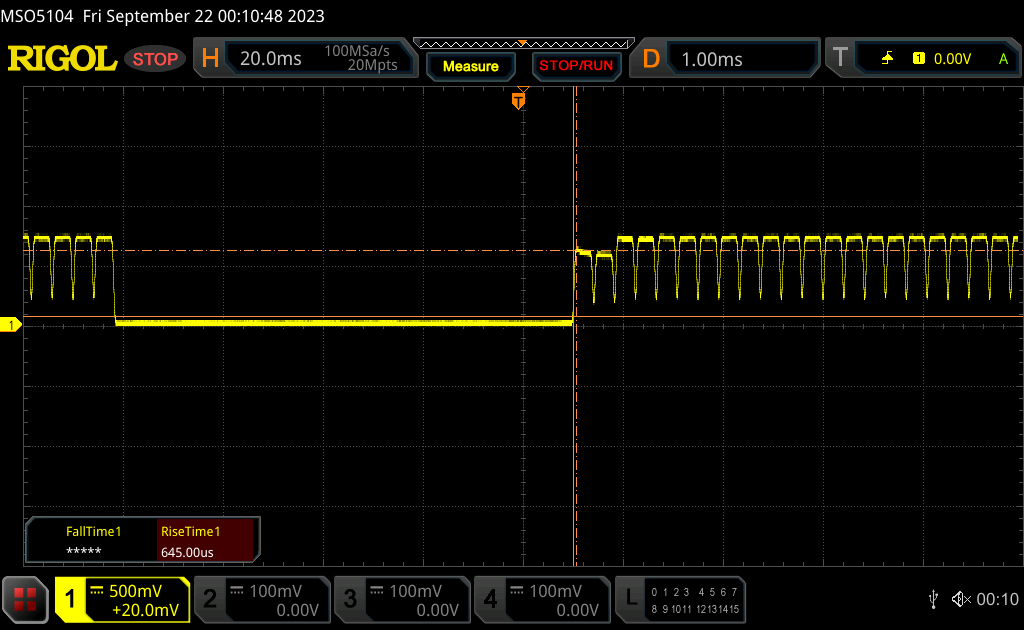 |
| ↘ 0.37 ms queda | ||
| A tela mostra taxas de resposta muito rápidas em nossos testes e deve ser muito adequada para jogos em ritmo acelerado. Em comparação, todos os dispositivos testados variam de 0.1 (mínimo) a 240 (máximo) ms. » 4 % de todos os dispositivos são melhores. Isso significa que o tempo de resposta medido é melhor que a média de todos os dispositivos testados (19.8 ms). | ||
| ↔ Tempo de resposta 50% cinza a 80% cinza | ||
| 0.79 ms ... ascensão ↗ e queda ↘ combinadas | ↗ 0.46 ms ascensão | 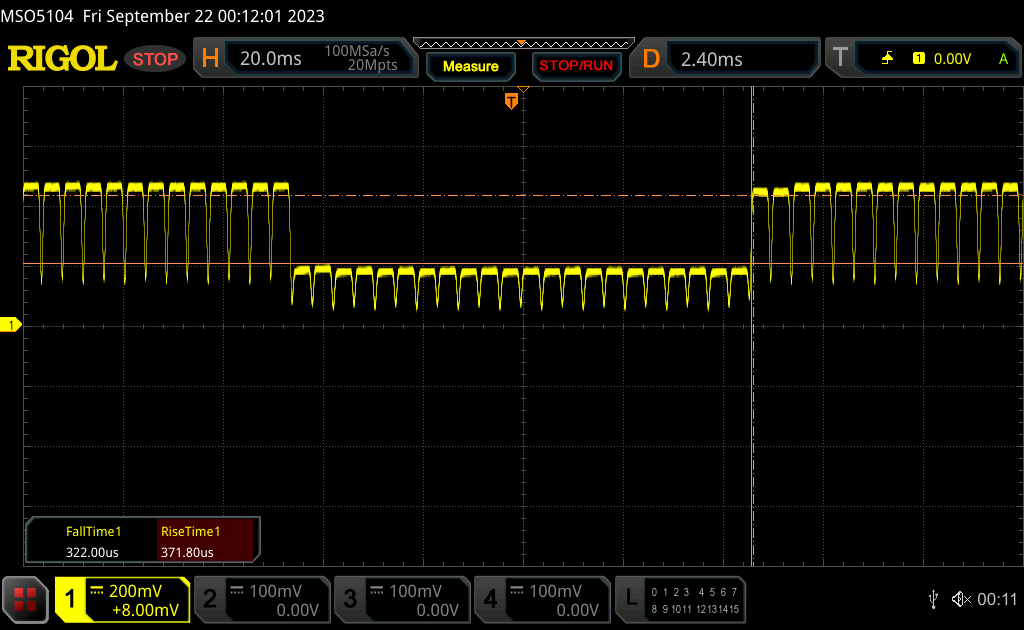 |
| ↘ 0.33 ms queda | ||
| A tela mostra taxas de resposta muito rápidas em nossos testes e deve ser muito adequada para jogos em ritmo acelerado. Em comparação, todos os dispositivos testados variam de 0.165 (mínimo) a 636 (máximo) ms. » 3 % de todos os dispositivos são melhores. Isso significa que o tempo de resposta medido é melhor que a média de todos os dispositivos testados (31 ms). | ||
Cintilação da tela / PWM (modulação por largura de pulso)
| Tela tremeluzindo/PWM detectado | 240.5 Hz | ≤ 100 % configuração de brilho | 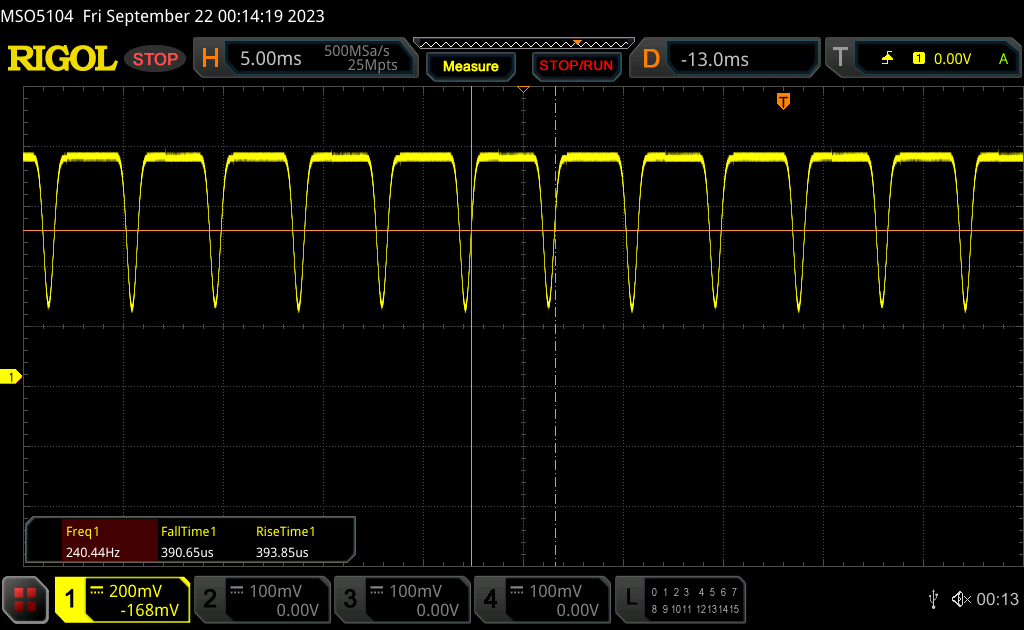 |
A luz de fundo da tela pisca em 240.5 Hz (pior caso, por exemplo, utilizando PWM) Cintilação detectada em uma configuração de brilho de 100 % e abaixo. Não deve haver cintilação ou PWM acima desta configuração de brilho. A frequência de 240.5 Hz é relativamente baixa, portanto, usuários sensíveis provavelmente notarão cintilação e sentirão fadiga ocular na configuração de brilho indicada e abaixo. [pwm_comparison] Em comparação: 52 % de todos os dispositivos testados não usam PWM para escurecer a tela. Se PWM foi detectado, uma média de 7757 (mínimo: 5 - máximo: 343500) Hz foi medida. | |||
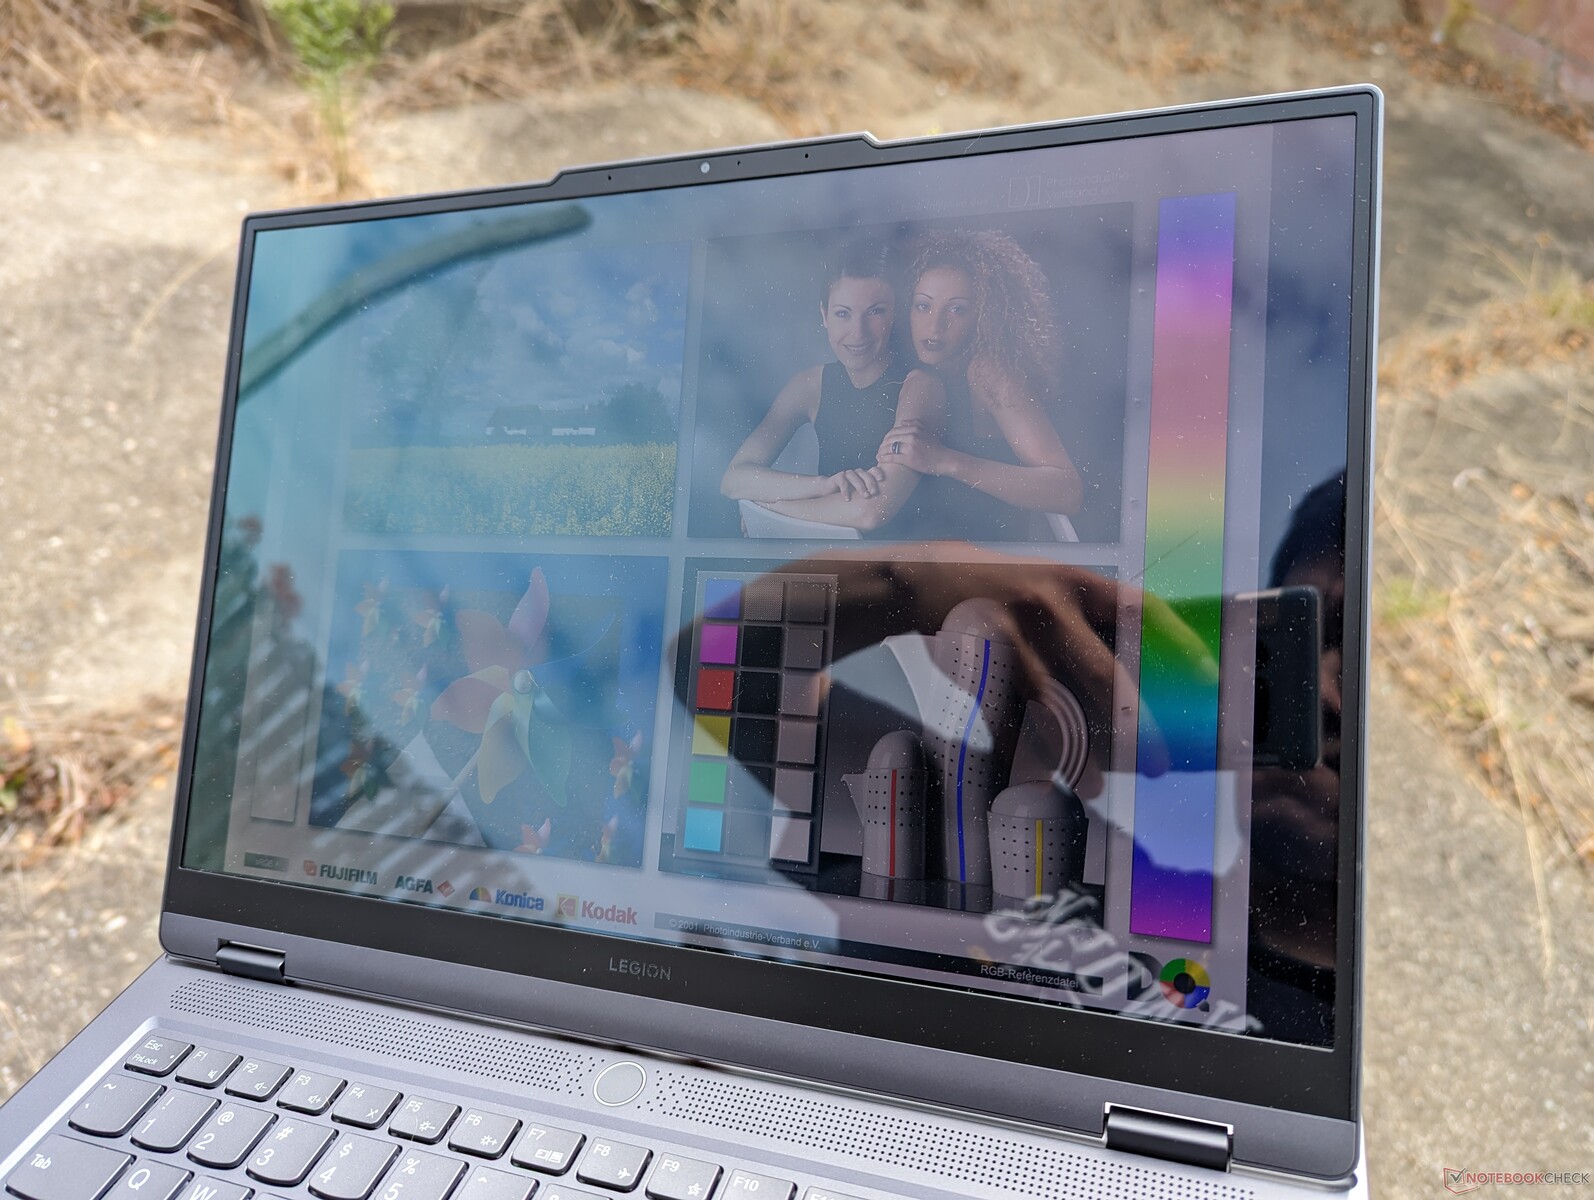
O brilho máximo no mundo real é de cerca de 386 nits, em comparação com a afirmação da Lenovo de 400 nits para conteúdo SDR. Se o HDR estiver ativado, o brilho máximo será de até 515 nits, o que corresponderia à alegação da Lenovo de compatibilidade com HDR500. Os painéis IPS foscos do Blade 14 ou do Zephyrus G14 são visivelmente mais brilhantes, com cerca de 550 nits cada, para conteúdo SDR, proporcionando melhor visibilidade em ambientes externos, em comparação com o nosso modelo muito brilhante da Lenovo.

Desempenho - Zen 4 combina bem com a Nvidia RTX
Condições de teste
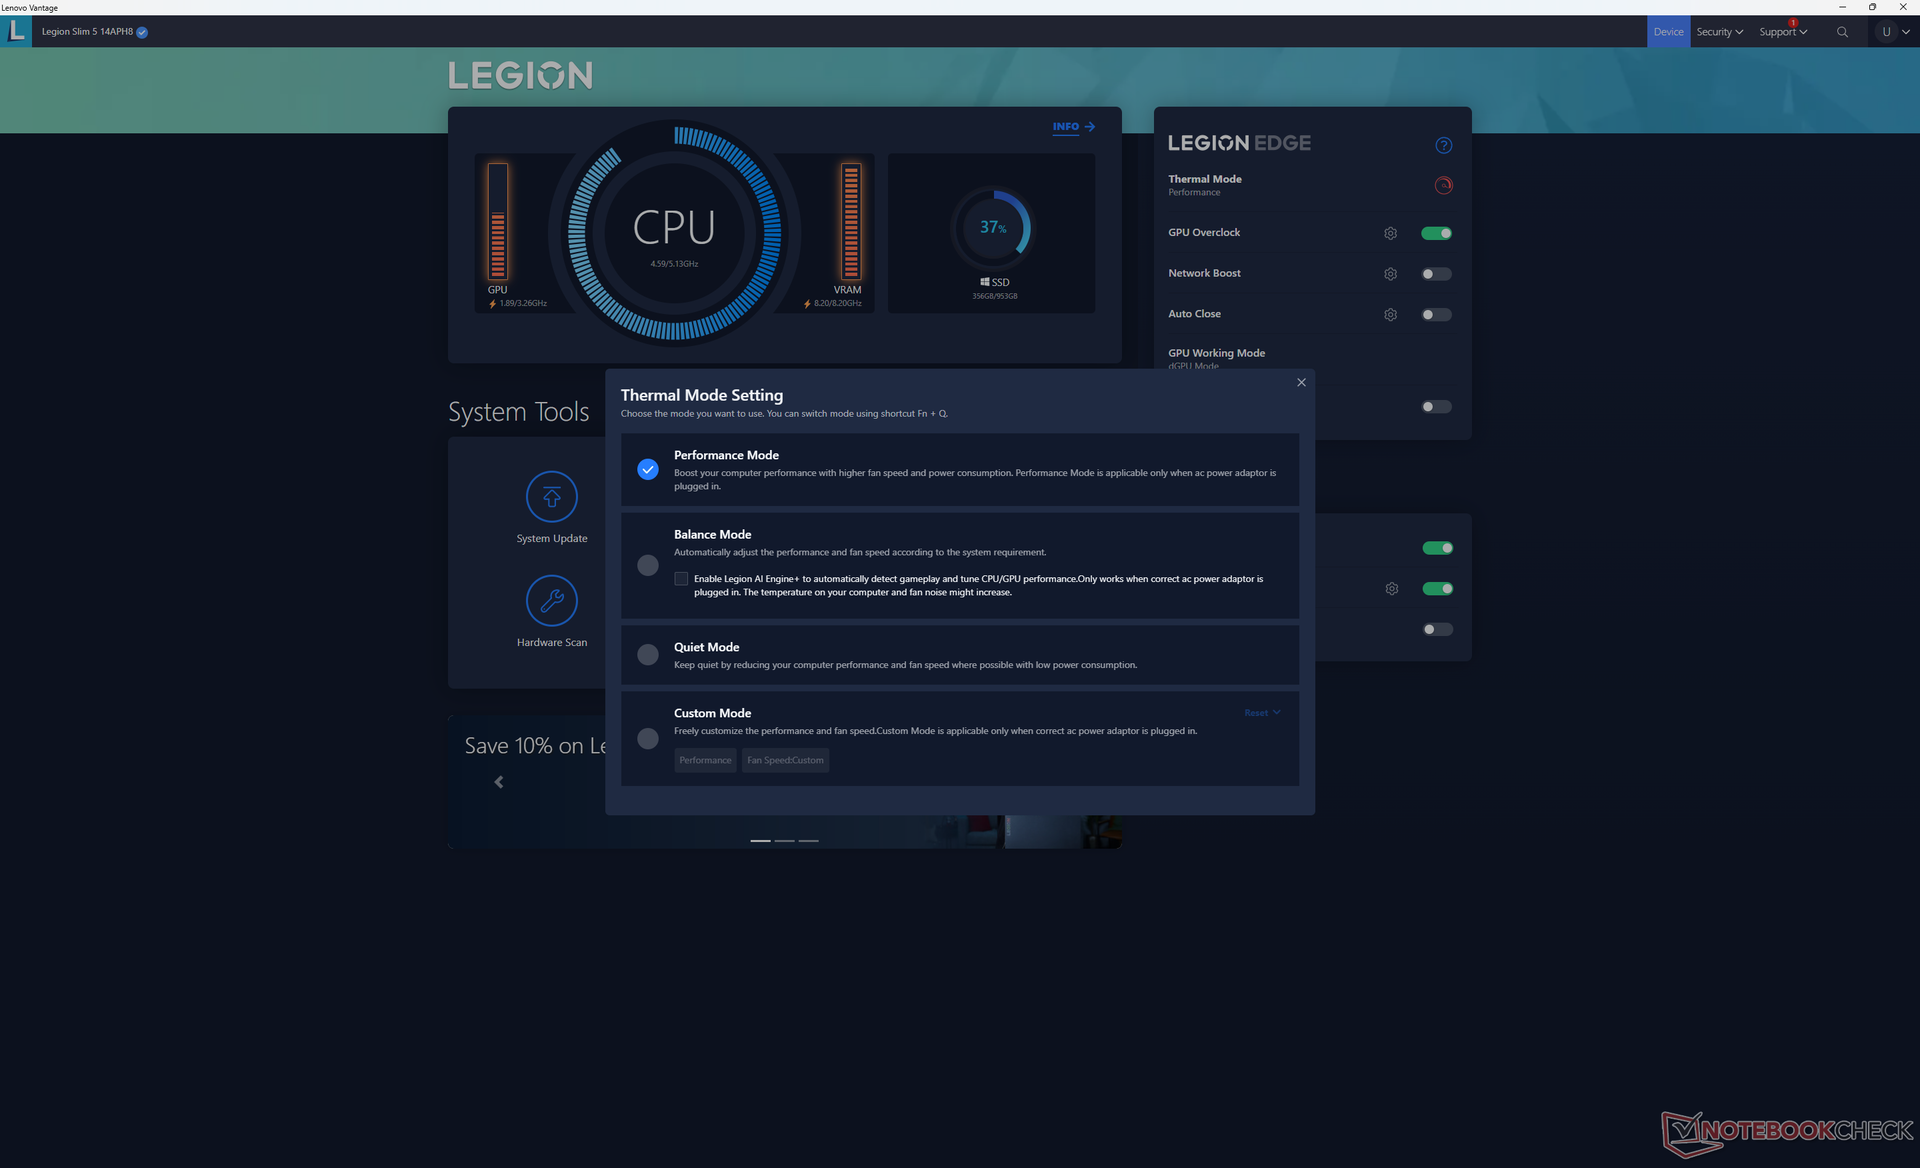
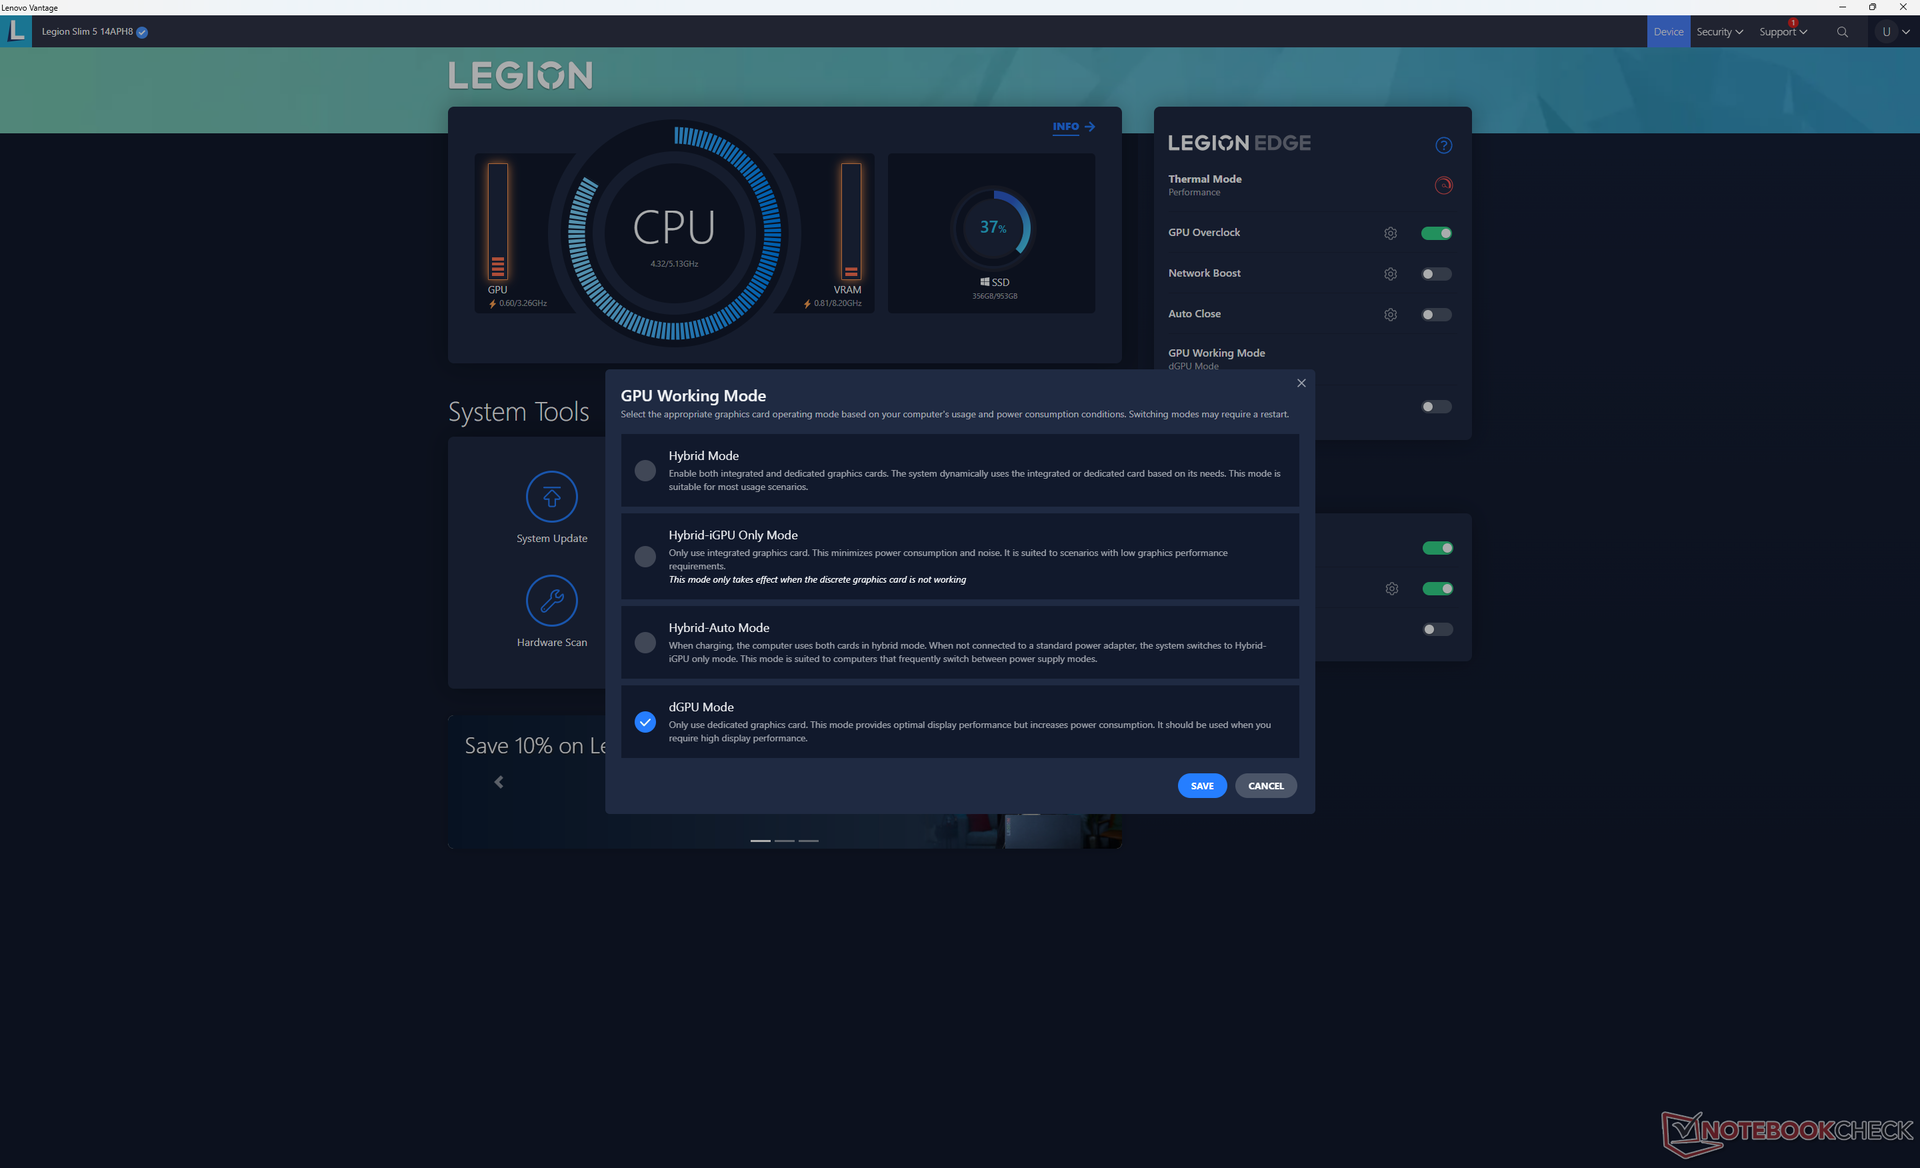
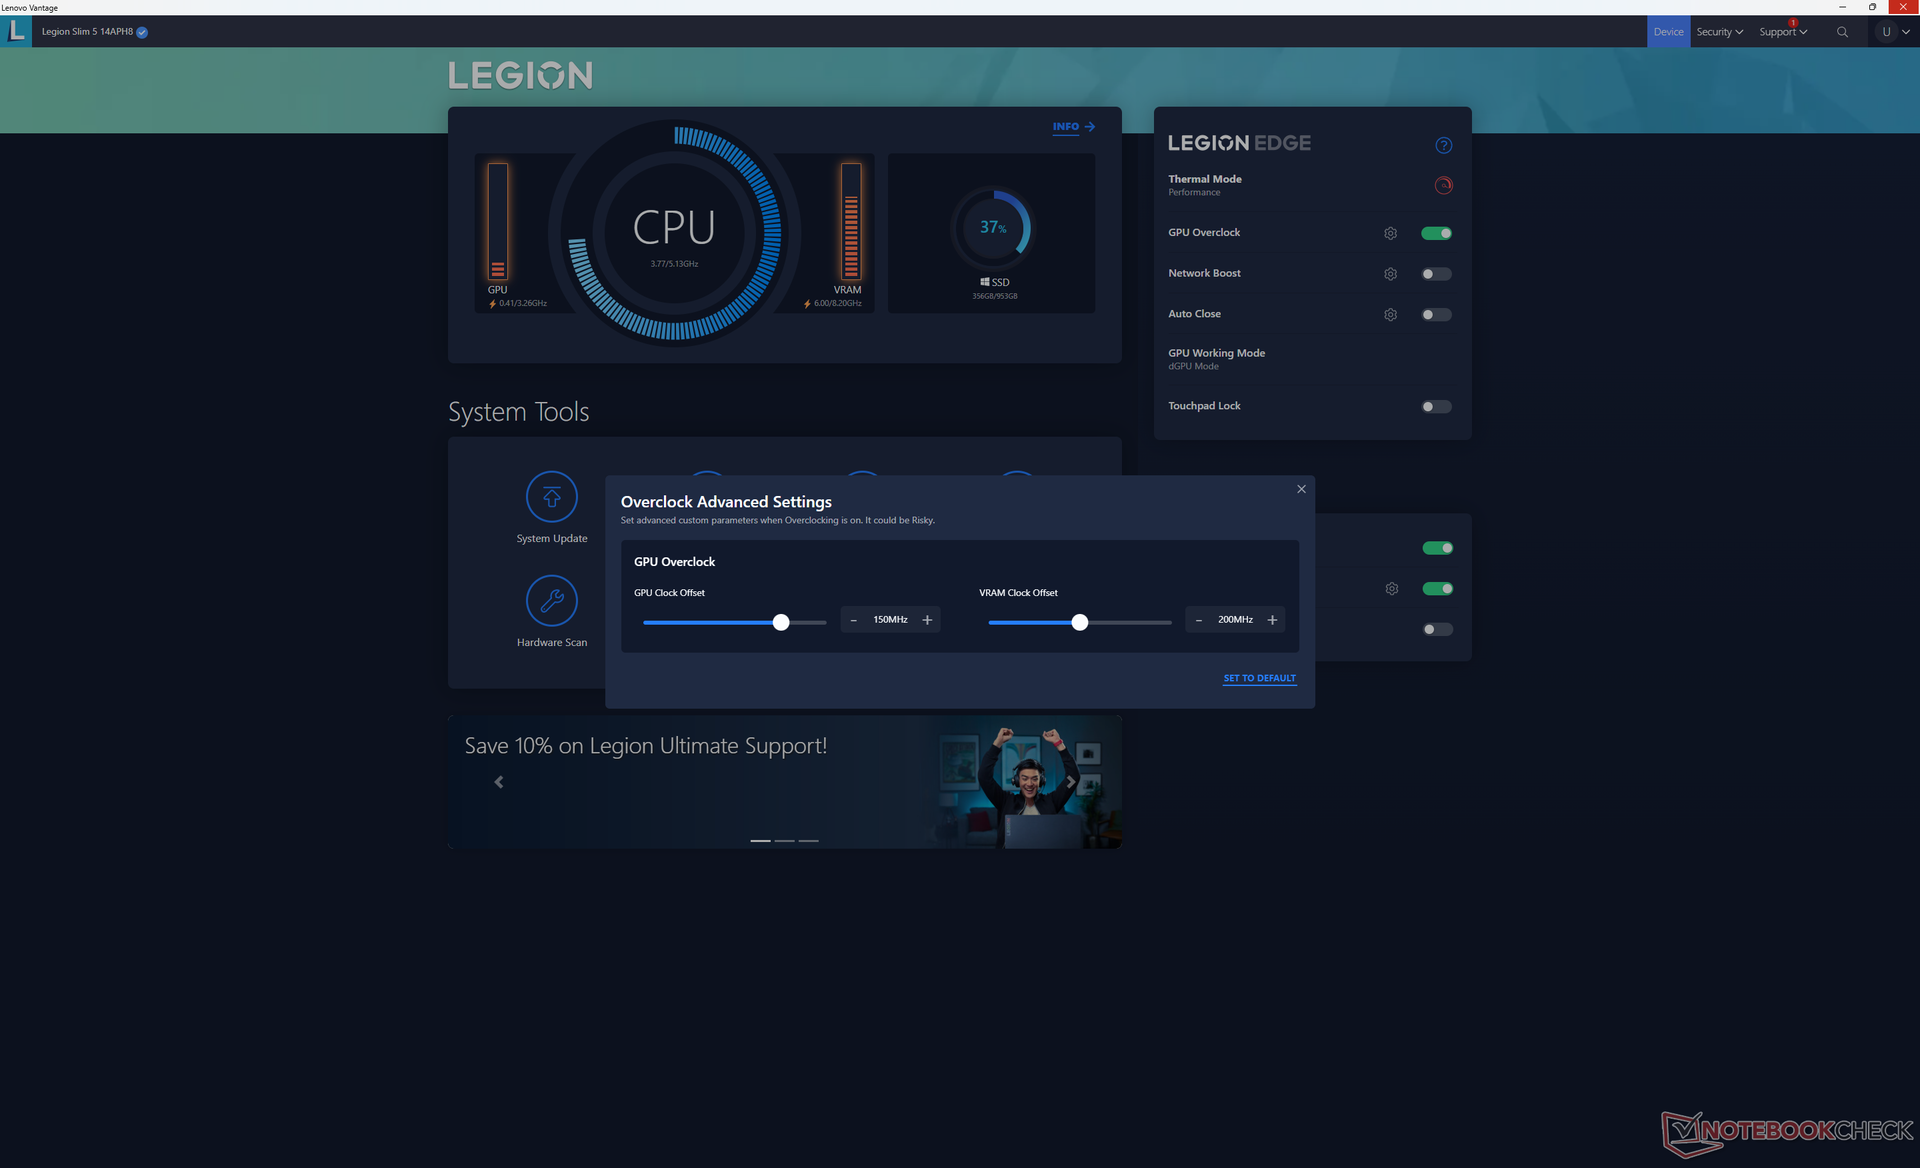
Configuramos o Lenovo Vantage no modo Desempenho e no modo dGPU com GPU Overclock ativo antes de executar os benchmarks abaixo. É recomendável que os usuários se familiarizem com o Vantage, pois ele é o centro de controle para ajustar os perfis de desempenho e as configurações de dGPU/iGPU.
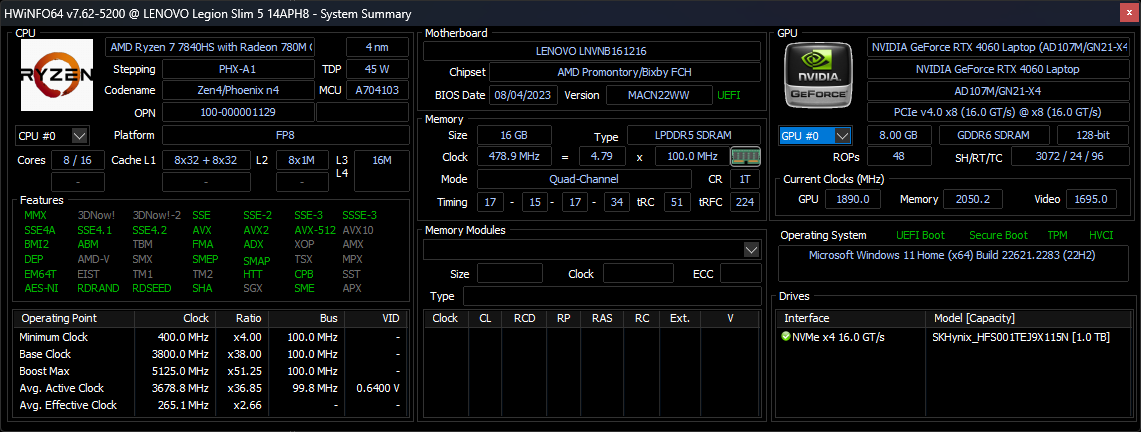
Processador
O Ryzen 7 7840HS tem um bom desempenho, sem grandes problemas de estrangulamento e com resultados multithread que estão apenas 10% atrás do processador comum de 13ª geraçãoCore i7-13700H. A atualização para o Ryzen 9 7940HS deverá aumentar o desempenho em 10%, o que efetivamente eliminaria essa diferença. Em outras palavras, você teria que fazer o upgrade para a configuração do Ryzen 9 se quiser ter o mesmo poder de processamento do Intel Core i7.
CPUs mais potentes da classe Ryzen HX, como o Ryzen 9 7945HX só estão disponíveis em telas de tamanhos maiores.
Cinebench R15 Multi Loop
Cinebench R23: Multi Core | Single Core
Cinebench R20: CPU (Multi Core) | CPU (Single Core)
Cinebench R15: CPU Multi 64Bit | CPU Single 64Bit
Blender: v2.79 BMW27 CPU
7-Zip 18.03: 7z b 4 | 7z b 4 -mmt1
Geekbench 5.5: Multi-Core | Single-Core
HWBOT x265 Benchmark v2.2: 4k Preset
LibreOffice : 20 Documents To PDF
R Benchmark 2.5: Overall mean
| CPU Performance rating | |
| Schenker XMG Pro 15 (E23) | |
| Dell G15 5530 | |
| Asus ROG Zephyrus G14 GA402XY | |
| Lenovo Legion Slim 5 14APH8 | |
| Acer Predator Triton 14 PT14-51 | |
| Média AMD Ryzen 7 7840HS | |
| Acer Predator Triton 300 SE | |
| Alienware x14 i7 RTX 3060 | |
| Asus TUF A15 FA507 | |
| Asus ROG Zephyrus G14 GA402RK | |
| Asus Zephyrus G14 GA401QEC | |
| Asus ROG Strix G15 G513RW | |
| Asus Zephyrus G14 GA401IV -4! | |
| Cinebench R23 / Multi Core | |
| Schenker XMG Pro 15 (E23) | |
| Dell G15 5530 | |
| Acer Predator Triton 14 PT14-51 | |
| Asus ROG Zephyrus G14 GA402XY | |
| Lenovo Legion Slim 5 14APH8 | |
| Média AMD Ryzen 7 7840HS (14784 - 17214, n=19) | |
| Acer Predator Triton 300 SE | |
| Alienware x14 i7 RTX 3060 | |
| Asus TUF A15 FA507 | |
| Asus ROG Strix G15 G513RW | |
| Asus Zephyrus G14 GA401QEC | |
| Asus ROG Zephyrus G14 GA402RK | |
| Cinebench R23 / Single Core | |
| Acer Predator Triton 300 SE | |
| Schenker XMG Pro 15 (E23) | |
| Dell G15 5530 | |
| Lenovo Legion Slim 5 14APH8 | |
| Asus ROG Zephyrus G14 GA402XY | |
| Média AMD Ryzen 7 7840HS (1718 - 1812, n=19) | |
| Alienware x14 i7 RTX 3060 | |
| Acer Predator Triton 14 PT14-51 | |
| Asus ROG Zephyrus G14 GA402RK | |
| Asus TUF A15 FA507 | |
| Asus ROG Strix G15 G513RW | |
| Asus Zephyrus G14 GA401QEC | |
| Cinebench R20 / CPU (Multi Core) | |
| Schenker XMG Pro 15 (E23) | |
| Dell G15 5530 | |
| Acer Predator Triton 14 PT14-51 | |
| Asus ROG Zephyrus G14 GA402XY | |
| Lenovo Legion Slim 5 14APH8 | |
| Média AMD Ryzen 7 7840HS (5761 - 6744, n=19) | |
| Acer Predator Triton 300 SE | |
| Alienware x14 i7 RTX 3060 | |
| Asus TUF A15 FA507 | |
| Asus Zephyrus G14 GA401QEC | |
| Asus ROG Strix G15 G513RW | |
| Asus ROG Zephyrus G14 GA402RK | |
| Asus Zephyrus G14 GA401IV | |
| Cinebench R20 / CPU (Single Core) | |
| Acer Predator Triton 300 SE | |
| Schenker XMG Pro 15 (E23) | |
| Dell G15 5530 | |
| Asus ROG Zephyrus G14 GA402XY | |
| Média AMD Ryzen 7 7840HS (661 - 705, n=19) | |
| Alienware x14 i7 RTX 3060 | |
| Lenovo Legion Slim 5 14APH8 | |
| Acer Predator Triton 14 PT14-51 | |
| Asus ROG Zephyrus G14 GA402RK | |
| Asus TUF A15 FA507 | |
| Asus ROG Strix G15 G513RW | |
| Asus Zephyrus G14 GA401QEC | |
| Asus Zephyrus G14 GA401IV | |
| Cinebench R15 / CPU Multi 64Bit | |
| Schenker XMG Pro 15 (E23) | |
| Dell G15 5530 | |
| Acer Predator Triton 14 PT14-51 | |
| Asus ROG Zephyrus G14 GA402XY | |
| Lenovo Legion Slim 5 14APH8 | |
| Média AMD Ryzen 7 7840HS (2300 - 2729, n=19) | |
| Alienware x14 i7 RTX 3060 | |
| Acer Predator Triton 300 SE | |
| Asus TUF A15 FA507 | |
| Asus Zephyrus G14 GA401QEC | |
| Asus ROG Strix G15 G513RW | |
| Asus ROG Zephyrus G14 GA402RK | |
| Asus Zephyrus G14 GA401IV | |
| Cinebench R15 / CPU Single 64Bit | |
| Asus ROG Zephyrus G14 GA402XY | |
| Média AMD Ryzen 7 7840HS (270 - 286, n=19) | |
| Lenovo Legion Slim 5 14APH8 | |
| Dell G15 5530 | |
| Acer Predator Triton 300 SE | |
| Asus ROG Zephyrus G14 GA402RK | |
| Alienware x14 i7 RTX 3060 | |
| Asus TUF A15 FA507 | |
| Schenker XMG Pro 15 (E23) | |
| Asus ROG Strix G15 G513RW | |
| Acer Predator Triton 14 PT14-51 | |
| Asus Zephyrus G14 GA401QEC | |
| Asus Zephyrus G14 GA401IV | |
| Blender / v2.79 BMW27 CPU | |
| Asus Zephyrus G14 GA401IV | |
| Asus ROG Zephyrus G14 GA402RK | |
| Asus ROG Strix G15 G513RW | |
| Asus Zephyrus G14 GA401QEC | |
| Alienware x14 i7 RTX 3060 | |
| Asus TUF A15 FA507 | |
| Acer Predator Triton 300 SE | |
| Média AMD Ryzen 7 7840HS (185 - 231, n=20) | |
| Lenovo Legion Slim 5 14APH8 | |
| Acer Predator Triton 14 PT14-51 | |
| Asus ROG Zephyrus G14 GA402XY | |
| Dell G15 5530 | |
| Schenker XMG Pro 15 (E23) | |
| 7-Zip 18.03 / 7z b 4 -mmt1 | |
| Asus ROG Zephyrus G14 GA402XY | |
| Média AMD Ryzen 7 7840HS (6049 - 6754, n=20) | |
| Schenker XMG Pro 15 (E23) | |
| Lenovo Legion Slim 5 14APH8 | |
| Asus ROG Zephyrus G14 GA402RK | |
| Asus ROG Strix G15 G513RW | |
| Dell G15 5530 | |
| Asus Zephyrus G14 GA401QEC | |
| Asus TUF A15 FA507 | |
| Alienware x14 i7 RTX 3060 | |
| Acer Predator Triton 300 SE | |
| Acer Predator Triton 14 PT14-51 | |
| Asus Zephyrus G14 GA401IV | |
| Geekbench 5.5 / Multi-Core | |
| Schenker XMG Pro 15 (E23) | |
| Acer Predator Triton 14 PT14-51 | |
| Dell G15 5530 | |
| Alienware x14 i7 RTX 3060 | |
| Acer Predator Triton 300 SE | |
| Asus ROG Zephyrus G14 GA402XY | |
| Média AMD Ryzen 7 7840HS (8446 - 12339, n=23) | |
| Lenovo Legion Slim 5 14APH8 | |
| Asus ROG Zephyrus G14 GA402RK | |
| Asus ROG Strix G15 G513RW | |
| Asus TUF A15 FA507 | |
| Asus Zephyrus G14 GA401QEC | |
| Asus Zephyrus G14 GA401IV | |
| Geekbench 5.5 / Single-Core | |
| Asus ROG Zephyrus G14 GA402XY | |
| Lenovo Legion Slim 5 14APH8 | |
| Média AMD Ryzen 7 7840HS (1837 - 2017, n=23) | |
| Acer Predator Triton 300 SE | |
| Dell G15 5530 | |
| Schenker XMG Pro 15 (E23) | |
| Alienware x14 i7 RTX 3060 | |
| Acer Predator Triton 14 PT14-51 | |
| Asus ROG Zephyrus G14 GA402RK | |
| Asus ROG Strix G15 G513RW | |
| Asus Zephyrus G14 GA401QEC | |
| Asus TUF A15 FA507 | |
| Asus Zephyrus G14 GA401IV | |
| HWBOT x265 Benchmark v2.2 / 4k Preset | |
| Schenker XMG Pro 15 (E23) | |
| Dell G15 5530 | |
| Asus ROG Zephyrus G14 GA402XY | |
| Lenovo Legion Slim 5 14APH8 | |
| Acer Predator Triton 14 PT14-51 | |
| Média AMD Ryzen 7 7840HS (11.7 - 21.8, n=20) | |
| Acer Predator Triton 300 SE | |
| Alienware x14 i7 RTX 3060 | |
| Asus TUF A15 FA507 | |
| Asus ROG Strix G15 G513RW | |
| Asus ROG Zephyrus G14 GA402RK | |
| Asus Zephyrus G14 GA401QEC | |
| Asus Zephyrus G14 GA401IV | |
| LibreOffice / 20 Documents To PDF | |
| Asus ROG Strix G15 G513RW | |
| Asus Zephyrus G14 GA401QEC | |
| Schenker XMG Pro 15 (E23) | |
| Asus TUF A15 FA507 | |
| Média AMD Ryzen 7 7840HS (38.3 - 68.3, n=20) | |
| Asus ROG Zephyrus G14 GA402RK | |
| Acer Predator Triton 14 PT14-51 | |
| Dell G15 5530 | |
| Lenovo Legion Slim 5 14APH8 | |
| Acer Predator Triton 300 SE | |
| Alienware x14 i7 RTX 3060 | |
| Asus ROG Zephyrus G14 GA402XY | |
| R Benchmark 2.5 / Overall mean | |
| Asus Zephyrus G14 GA401QEC | |
| Asus TUF A15 FA507 | |
| Asus ROG Strix G15 G513RW | |
| Acer Predator Triton 14 PT14-51 | |
| Asus ROG Zephyrus G14 GA402RK | |
| Alienware x14 i7 RTX 3060 | |
| Schenker XMG Pro 15 (E23) | |
| Lenovo Legion Slim 5 14APH8 | |
| Média AMD Ryzen 7 7840HS (0.4184 - 0.4739, n=20) | |
| Acer Predator Triton 300 SE | |
| Dell G15 5530 | |
| Asus ROG Zephyrus G14 GA402XY | |
Cinebench R23: Multi Core | Single Core
Cinebench R20: CPU (Multi Core) | CPU (Single Core)
Cinebench R15: CPU Multi 64Bit | CPU Single 64Bit
Blender: v2.79 BMW27 CPU
7-Zip 18.03: 7z b 4 | 7z b 4 -mmt1
Geekbench 5.5: Multi-Core | Single-Core
HWBOT x265 Benchmark v2.2: 4k Preset
LibreOffice : 20 Documents To PDF
R Benchmark 2.5: Overall mean
* ... menor é melhor
AIDA64: FP32 Ray-Trace | FPU Julia | CPU SHA3 | CPU Queen | FPU SinJulia | FPU Mandel | CPU AES | CPU ZLib | FP64 Ray-Trace | CPU PhotoWorxx
| Performance rating | |
| Razer Blade 14 RTX 4070 | |
| Lenovo Legion Slim 5 14APH8 | |
| Média AMD Ryzen 7 7840HS | |
| Lenovo LOQ 15APH8 | |
| Acer Predator Triton 14 PT14-51 | |
| Alienware x14 i7 RTX 3060 | |
| AIDA64 / FP32 Ray-Trace | |
| Razer Blade 14 RTX 4070 | |
| Lenovo Legion Slim 5 14APH8 | |
| Lenovo LOQ 15APH8 | |
| Média AMD Ryzen 7 7840HS (22845 - 28921, n=21) | |
| Acer Predator Triton 14 PT14-51 | |
| Alienware x14 i7 RTX 3060 | |
| AIDA64 / FPU Julia | |
| Lenovo LOQ 15APH8 | |
| Razer Blade 14 RTX 4070 | |
| Lenovo Legion Slim 5 14APH8 | |
| Média AMD Ryzen 7 7840HS (97164 - 123167, n=21) | |
| Acer Predator Triton 14 PT14-51 | |
| Alienware x14 i7 RTX 3060 | |
| AIDA64 / CPU SHA3 | |
| Razer Blade 14 RTX 4070 | |
| Lenovo Legion Slim 5 14APH8 | |
| Lenovo LOQ 15APH8 | |
| Média AMD Ryzen 7 7840HS (4293 - 5155, n=21) | |
| Acer Predator Triton 14 PT14-51 | |
| Alienware x14 i7 RTX 3060 | |
| AIDA64 / CPU Queen | |
| Razer Blade 14 RTX 4070 | |
| Lenovo Legion Slim 5 14APH8 | |
| Lenovo LOQ 15APH8 | |
| Média AMD Ryzen 7 7840HS (102271 - 125820, n=21) | |
| Alienware x14 i7 RTX 3060 | |
| Acer Predator Triton 14 PT14-51 | |
| AIDA64 / FPU SinJulia | |
| Razer Blade 14 RTX 4070 | |
| Lenovo Legion Slim 5 14APH8 | |
| Lenovo LOQ 15APH8 | |
| Média AMD Ryzen 7 7840HS (13767 - 15525, n=21) | |
| Acer Predator Triton 14 PT14-51 | |
| Alienware x14 i7 RTX 3060 | |
| AIDA64 / FPU Mandel | |
| Razer Blade 14 RTX 4070 | |
| Lenovo LOQ 15APH8 | |
| Lenovo Legion Slim 5 14APH8 | |
| Média AMD Ryzen 7 7840HS (52084 - 65812, n=21) | |
| Acer Predator Triton 14 PT14-51 | |
| Alienware x14 i7 RTX 3060 | |
| AIDA64 / CPU AES | |
| Acer Predator Triton 14 PT14-51 | |
| Média AMD Ryzen 7 7840HS (67389 - 177158, n=21) | |
| Alienware x14 i7 RTX 3060 | |
| Razer Blade 14 RTX 4070 | |
| Lenovo Legion Slim 5 14APH8 | |
| Lenovo LOQ 15APH8 | |
| AIDA64 / CPU ZLib | |
| Acer Predator Triton 14 PT14-51 | |
| Razer Blade 14 RTX 4070 | |
| Lenovo LOQ 15APH8 | |
| Lenovo Legion Slim 5 14APH8 | |
| Média AMD Ryzen 7 7840HS (944 - 1123, n=21) | |
| Alienware x14 i7 RTX 3060 | |
| AIDA64 / FP64 Ray-Trace | |
| Razer Blade 14 RTX 4070 | |
| Lenovo LOQ 15APH8 | |
| Lenovo Legion Slim 5 14APH8 | |
| Média AMD Ryzen 7 7840HS (12248 - 15599, n=21) | |
| Acer Predator Triton 14 PT14-51 | |
| Alienware x14 i7 RTX 3060 | |
| AIDA64 / CPU PhotoWorxx | |
| Acer Predator Triton 14 PT14-51 | |
| Alienware x14 i7 RTX 3060 | |
| Média AMD Ryzen 7 7840HS (17615 - 41516, n=21) | |
| Lenovo Legion Slim 5 14APH8 | |
| Razer Blade 14 RTX 4070 | |
| Lenovo LOQ 15APH8 | |
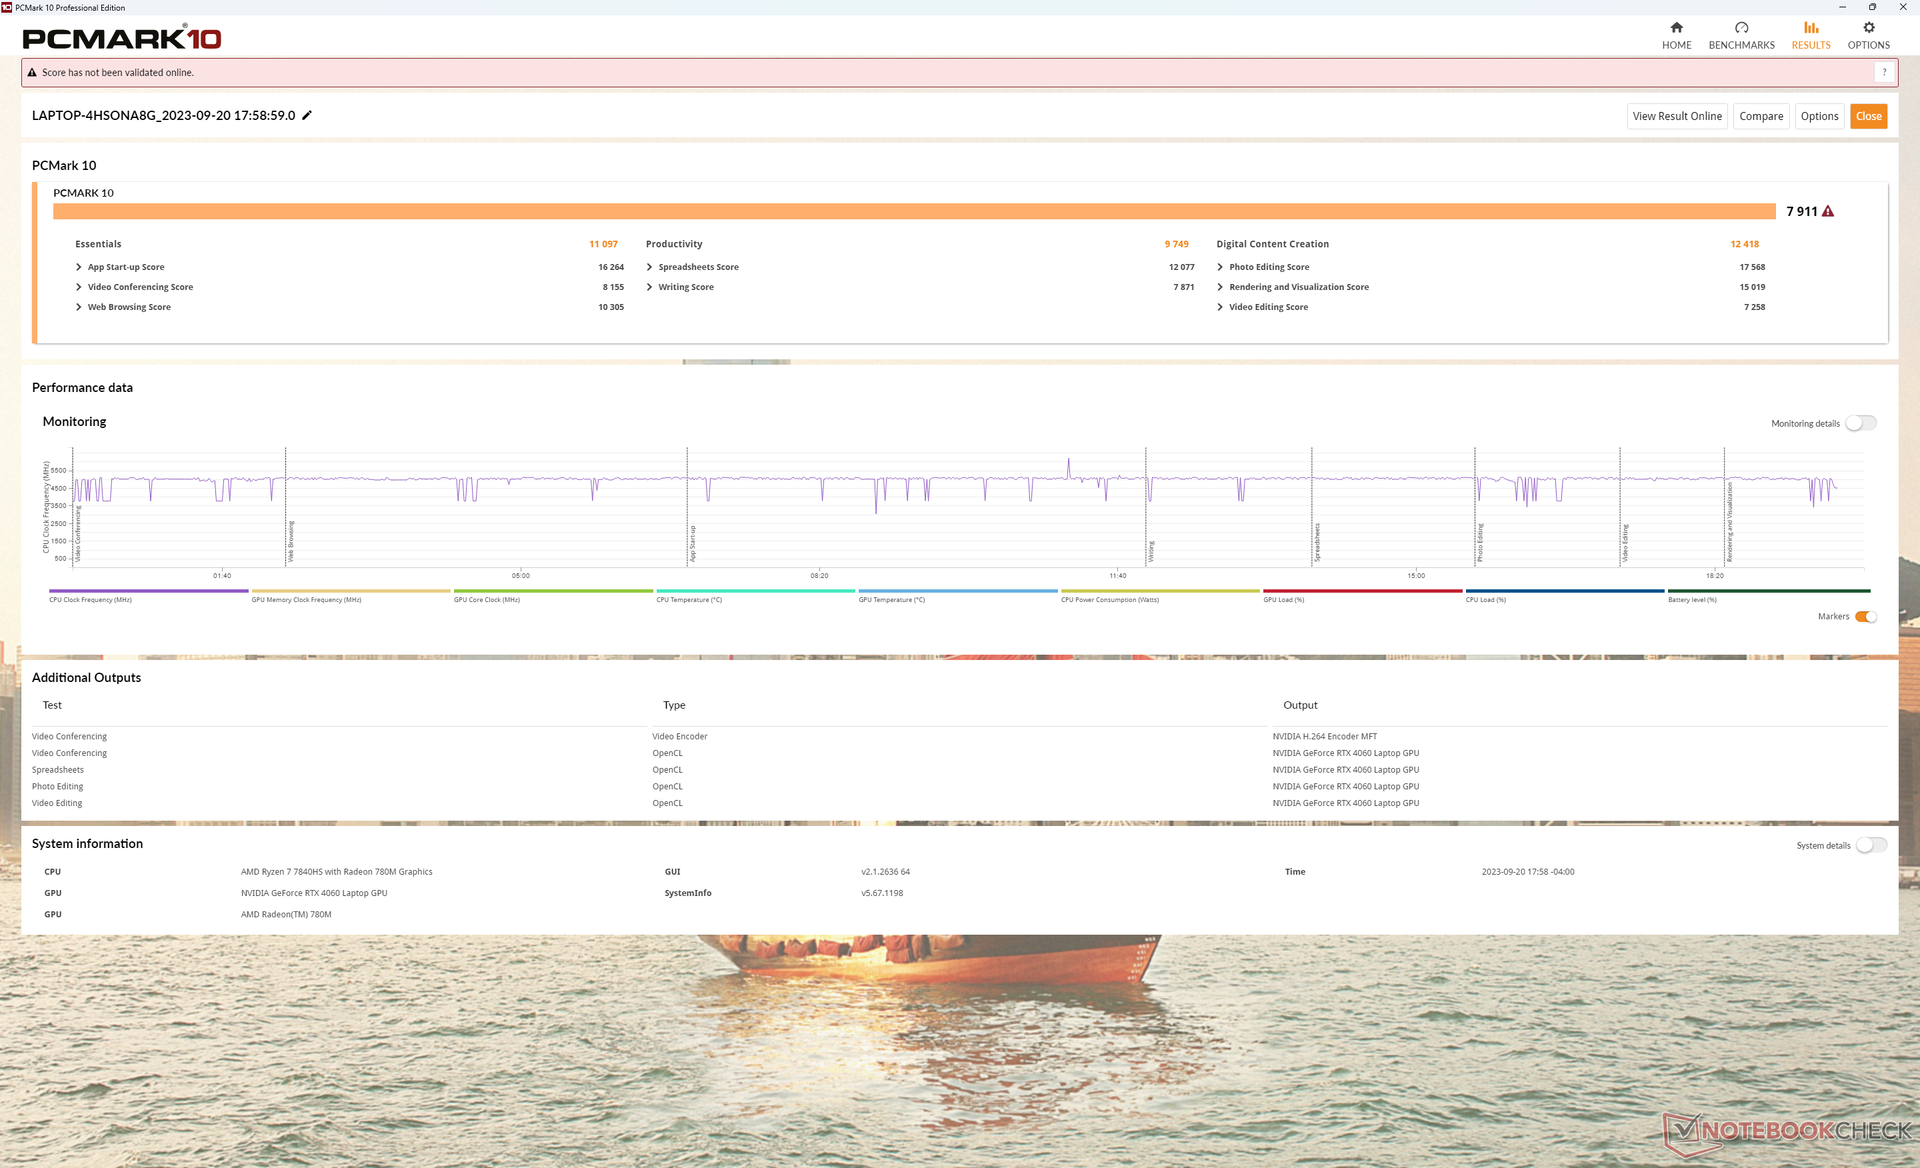
Desempenho do sistema
As pontuações do PCMark são comparáveis às de outros notebooks para jogos concorrentes de 14 polegadas por apenas um dígito de pontos percentuais. Não tivemos problemas notáveis durante nosso tempo com a unidade de teste, ao contrário do recente Legion Slim 5 16 ou do Alienware m16 R1.
CrossMark: Overall | Productivity | Creativity | Responsiveness
| PCMark 10 / Score | |
| Asus ROG Zephyrus G14 GA402XY | |
| Razer Blade 14 RTX 4070 | |
| Lenovo Legion Slim 5 14APH8 | |
| Média AMD Ryzen 7 7840HS, NVIDIA GeForce RTX 4060 Laptop GPU (7502 - 7946, n=4) | |
| Lenovo LOQ 15APH8 | |
| Acer Predator Triton 14 PT14-51 | |
| Alienware x14 i7 RTX 3060 | |
| PCMark 10 / Essentials | |
| Lenovo Legion Slim 5 14APH8 | |
| Razer Blade 14 RTX 4070 | |
| Média AMD Ryzen 7 7840HS, NVIDIA GeForce RTX 4060 Laptop GPU (10441 - 11169, n=4) | |
| Asus ROG Zephyrus G14 GA402XY | |
| Lenovo LOQ 15APH8 | |
| Acer Predator Triton 14 PT14-51 | |
| Alienware x14 i7 RTX 3060 | |
| PCMark 10 / Productivity | |
| Razer Blade 14 RTX 4070 | |
| Asus ROG Zephyrus G14 GA402XY | |
| Lenovo LOQ 15APH8 | |
| Média AMD Ryzen 7 7840HS, NVIDIA GeForce RTX 4060 Laptop GPU (9575 - 10273, n=4) | |
| Acer Predator Triton 14 PT14-51 | |
| Lenovo Legion Slim 5 14APH8 | |
| Alienware x14 i7 RTX 3060 | |
| PCMark 10 / Digital Content Creation | |
| Asus ROG Zephyrus G14 GA402XY | |
| Razer Blade 14 RTX 4070 | |
| Lenovo Legion Slim 5 14APH8 | |
| Média AMD Ryzen 7 7840HS, NVIDIA GeForce RTX 4060 Laptop GPU (11464 - 12418, n=4) | |
| Lenovo LOQ 15APH8 | |
| Acer Predator Triton 14 PT14-51 | |
| Alienware x14 i7 RTX 3060 | |
| CrossMark / Overall | |
| Alienware x14 i7 RTX 3060 | |
| Lenovo Legion Slim 5 14APH8 | |
| Acer Predator Triton 14 PT14-51 | |
| Asus ROG Zephyrus G14 GA402XY | |
| Média AMD Ryzen 7 7840HS, NVIDIA GeForce RTX 4060 Laptop GPU (1800 - 1866, n=3) | |
| Razer Blade 14 RTX 4070 | |
| Lenovo LOQ 15APH8 | |
| CrossMark / Productivity | |
| Lenovo Legion Slim 5 14APH8 | |
| Alienware x14 i7 RTX 3060 | |
| Média AMD Ryzen 7 7840HS, NVIDIA GeForce RTX 4060 Laptop GPU (1743 - 1821, n=3) | |
| Razer Blade 14 RTX 4070 | |
| Asus ROG Zephyrus G14 GA402XY | |
| Acer Predator Triton 14 PT14-51 | |
| Lenovo LOQ 15APH8 | |
| CrossMark / Creativity | |
| Asus ROG Zephyrus G14 GA402XY | |
| Alienware x14 i7 RTX 3060 | |
| Acer Predator Triton 14 PT14-51 | |
| Razer Blade 14 RTX 4070 | |
| Lenovo Legion Slim 5 14APH8 | |
| Média AMD Ryzen 7 7840HS, NVIDIA GeForce RTX 4060 Laptop GPU (1908 - 1966, n=3) | |
| Lenovo LOQ 15APH8 | |
| CrossMark / Responsiveness | |
| Alienware x14 i7 RTX 3060 | |
| Lenovo Legion Slim 5 14APH8 | |
| Acer Predator Triton 14 PT14-51 | |
| Média AMD Ryzen 7 7840HS, NVIDIA GeForce RTX 4060 Laptop GPU (1522 - 1776, n=3) | |
| Razer Blade 14 RTX 4070 | |
| Asus ROG Zephyrus G14 GA402XY | |
| Lenovo LOQ 15APH8 | |
| PCMark 10 Score | 7911 pontos | |
Ajuda | ||
| AIDA64 / Memory Copy | |
| Alienware x14 i7 RTX 3060 | |
| Acer Predator Triton 14 PT14-51 | |
| Lenovo Legion Slim 5 14APH8 | |
| Média AMD Ryzen 7 7840HS (30937 - 72158, n=21) | |
| Razer Blade 14 RTX 4070 | |
| Lenovo LOQ 15APH8 | |
| AIDA64 / Memory Read | |
| Alienware x14 i7 RTX 3060 | |
| Acer Predator Triton 14 PT14-51 | |
| Razer Blade 14 RTX 4070 | |
| Média AMD Ryzen 7 7840HS (30497 - 62147, n=21) | |
| Lenovo Legion Slim 5 14APH8 | |
| Lenovo LOQ 15APH8 | |
| AIDA64 / Memory Write | |
| Lenovo Legion Slim 5 14APH8 | |
| Acer Predator Triton 14 PT14-51 | |
| Média AMD Ryzen 7 7840HS (34590 - 93323, n=21) | |
| Razer Blade 14 RTX 4070 | |
| Alienware x14 i7 RTX 3060 | |
| Lenovo LOQ 15APH8 | |
| AIDA64 / Memory Latency | |
| Lenovo Legion Slim 5 14APH8 | |
| Alienware x14 i7 RTX 3060 | |
| Acer Predator Triton 14 PT14-51 | |
| Lenovo LOQ 15APH8 | |
| Média AMD Ryzen 7 7840HS (85.1 - 112, n=21) | |
| Razer Blade 14 RTX 4070 | |
* ... menor é melhor
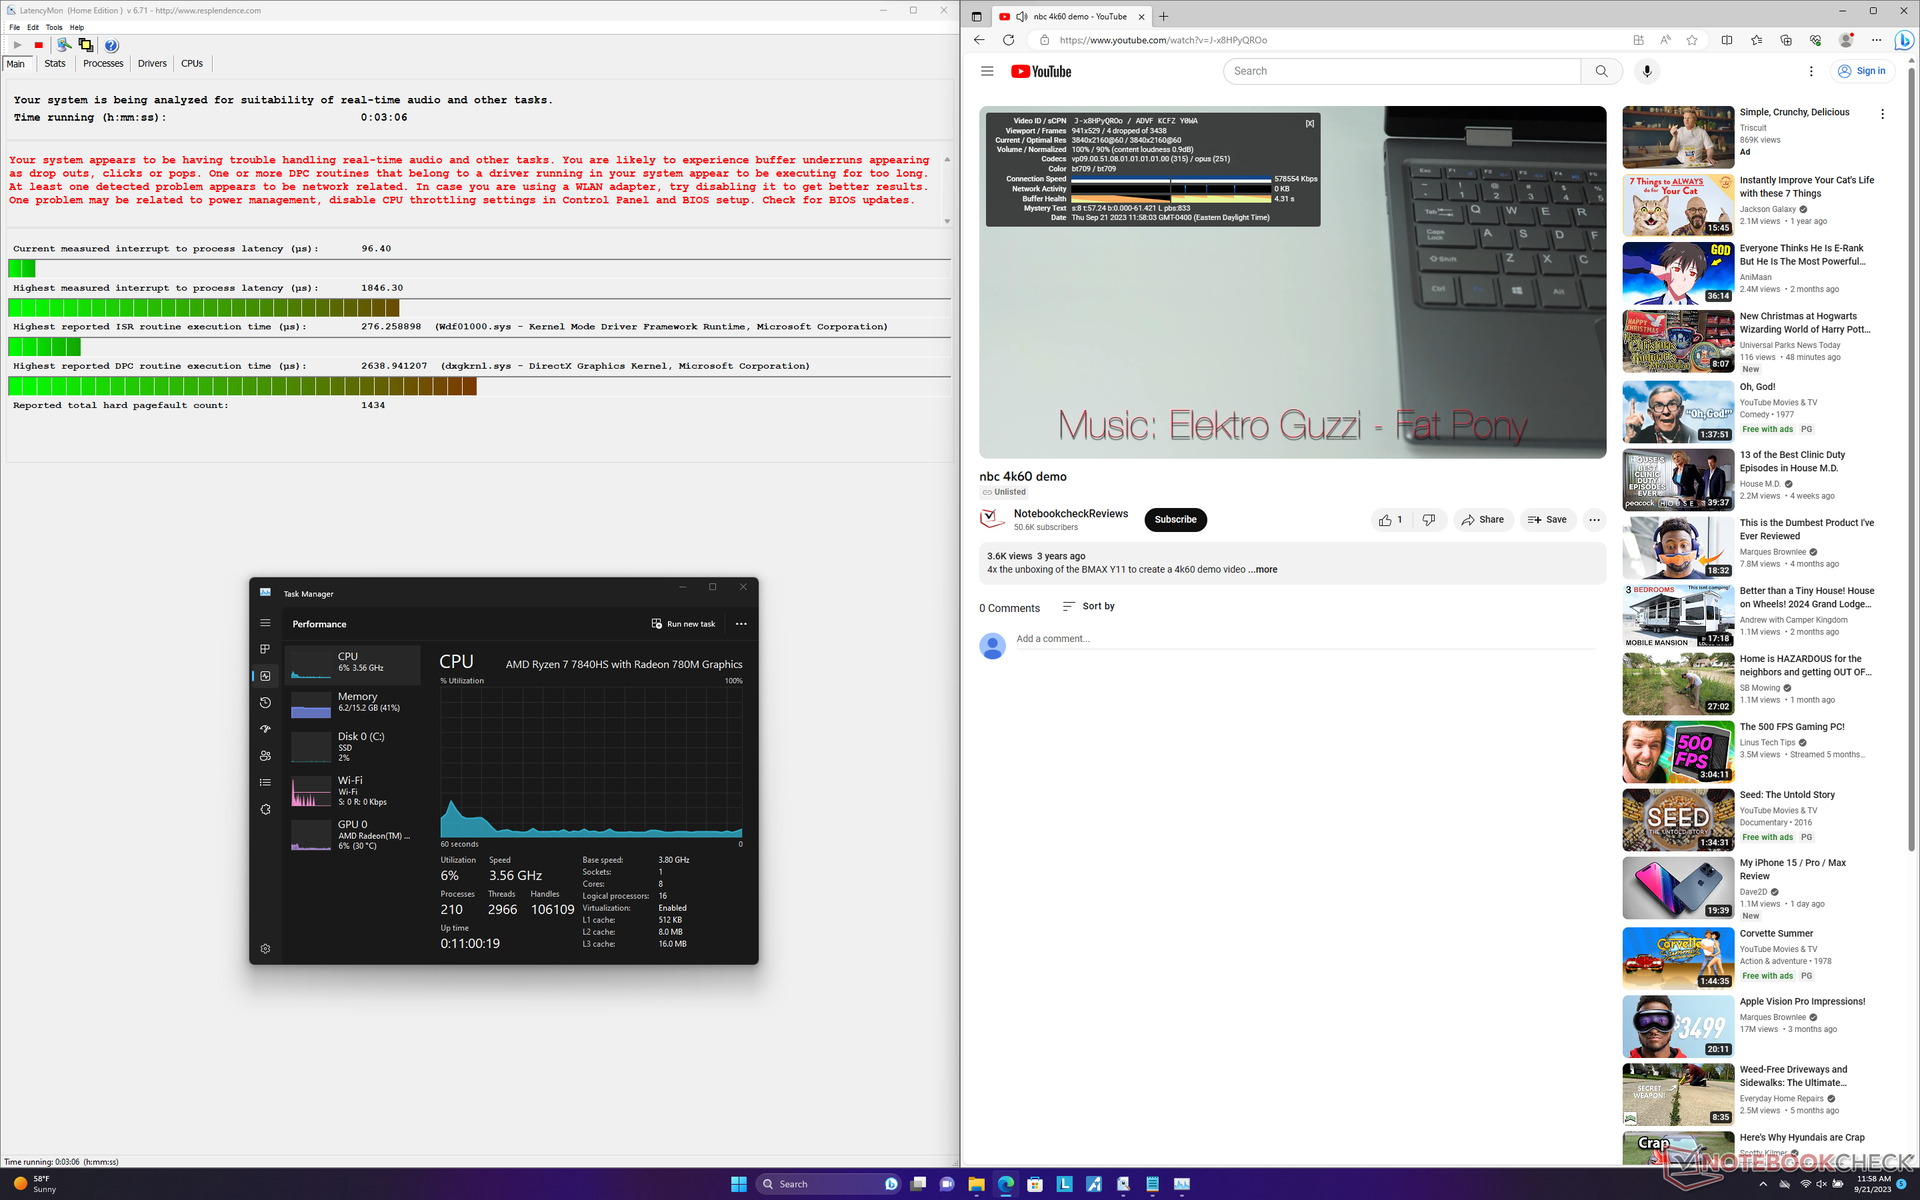
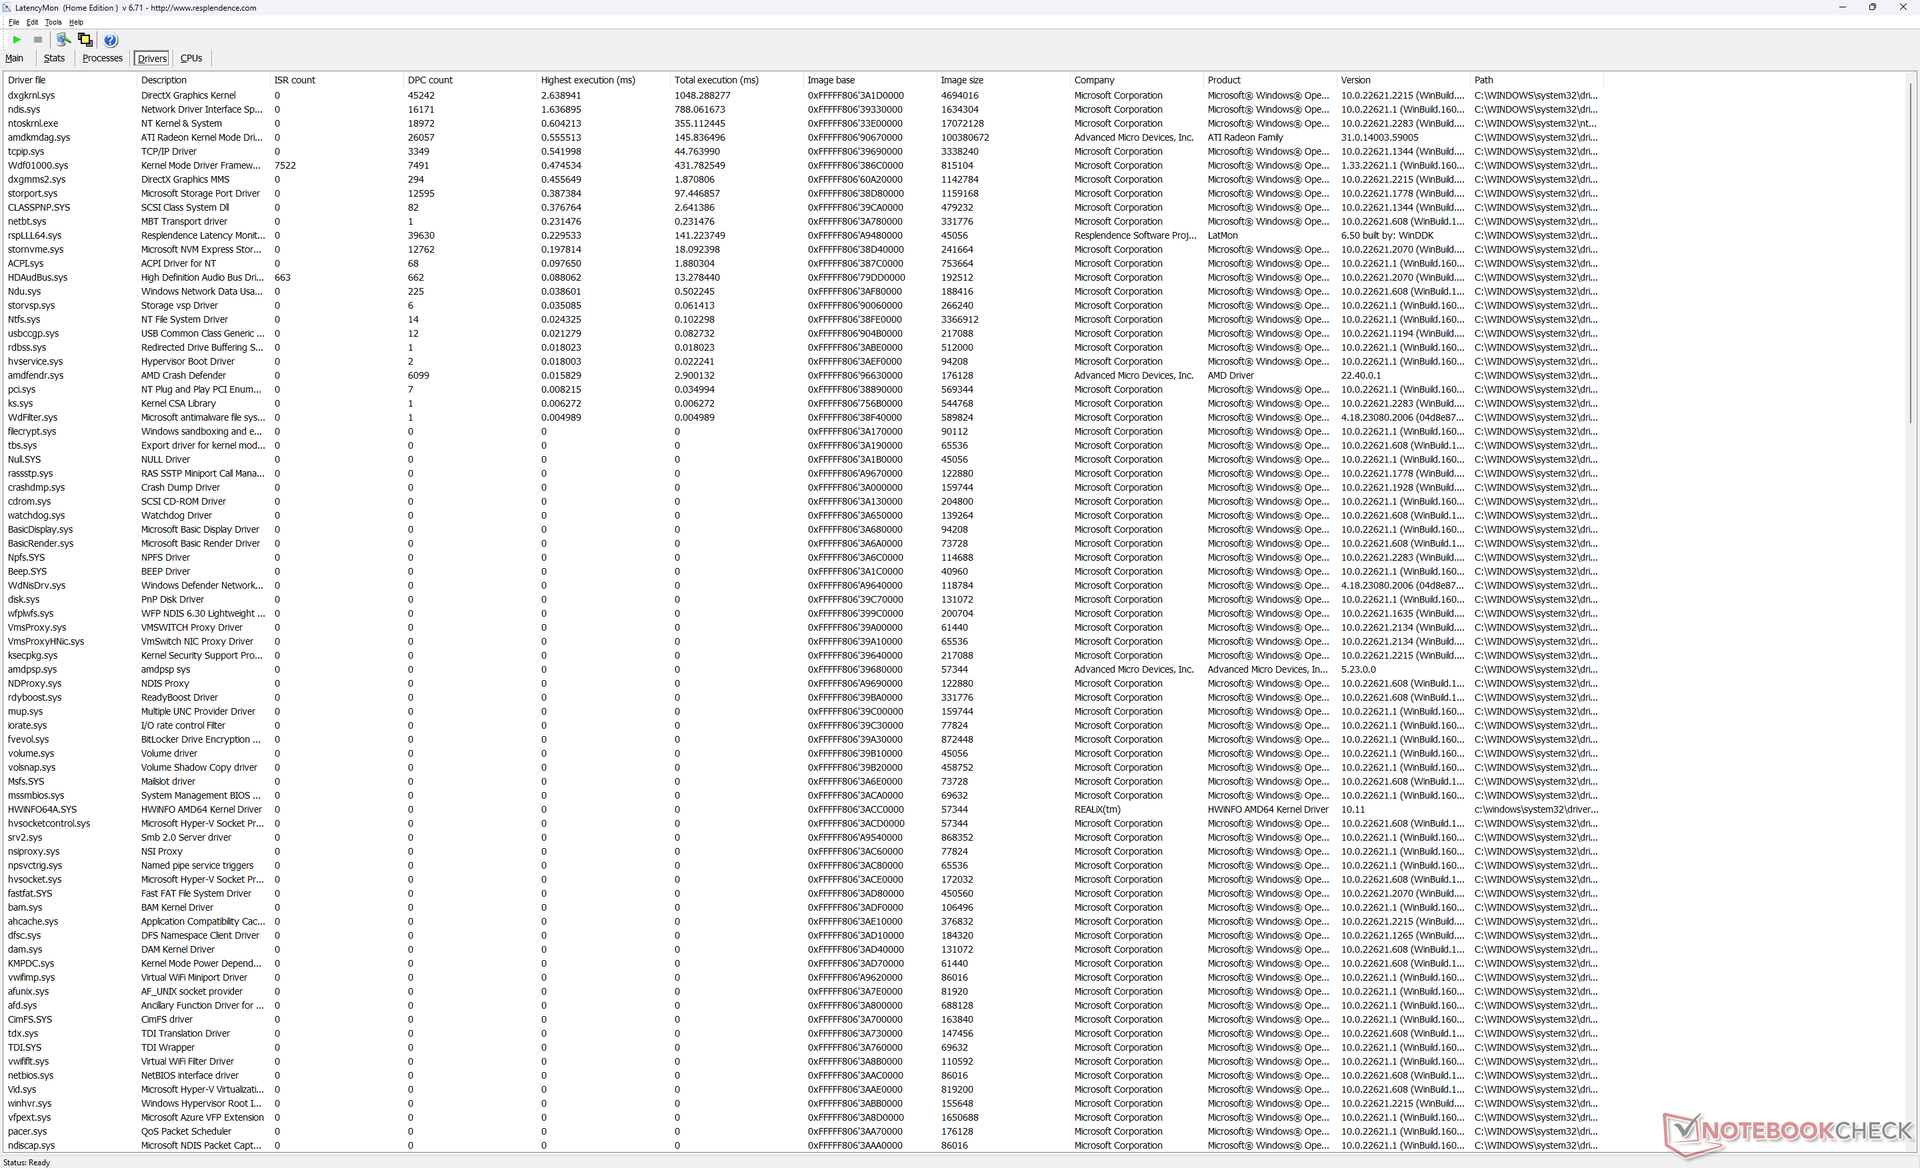
Latência DPC
O LatencyMon mostra problemas de DPC ao abrir várias guias do navegador em nossa página inicial. a reprodução de vídeo 4K a 60 FPS também é imperfeita, com 4 quadros perdidos registrados em um intervalo de tempo de um minuto.
| DPC Latencies / LatencyMon - interrupt to process latency (max), Web, Youtube, Prime95 | |
| Lenovo Legion Slim 5 14APH8 | |
| Acer Predator Triton 14 PT14-51 | |
| Lenovo LOQ 15APH8 | |
| Alienware x14 i7 RTX 3060 | |
| Asus ROG Zephyrus G14 GA402XY | |
| Razer Blade 14 RTX 4070 | |
* ... menor é melhor
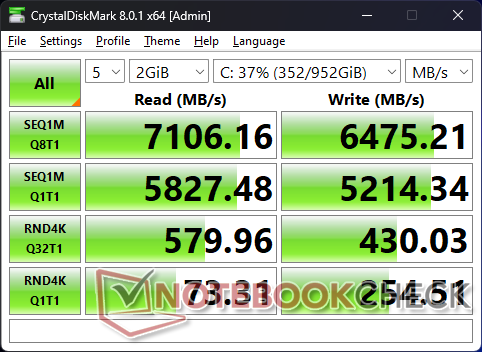
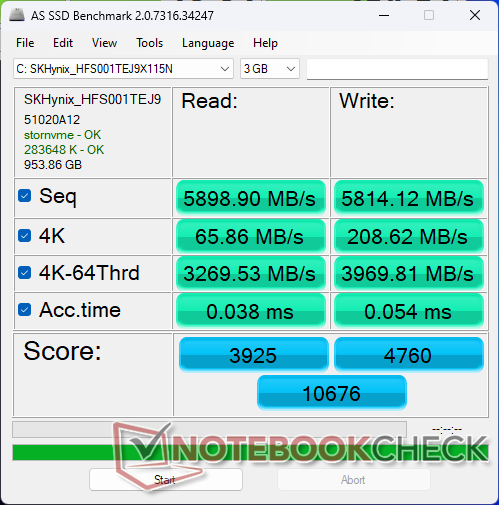
Dispositivos de armazenamento
Nossa unidade é fornecida com uma unidade de 1 TB SK hynix HFS001TEJ9X115N Que é uma unidade PCIe4 x4 de última geração. A unidade não teve problemas para manter taxas de transferência muito rápidas de quase 7100 MB/s quando sob estresse, demonstrando que não há problemas de estrangulamento, apesar do formato menor do Legion Slim.

| Drive Performance rating - Percent | |
| Lenovo Legion Slim 5 14APH8 | |
| Razer Blade 14 RTX 4070 | |
| Alienware x14 i7 RTX 3060 | |
| Asus ROG Zephyrus G14 GA402XY | |
| Acer Predator Triton 14 PT14-51 | |
| Lenovo LOQ 15APH8 | |
* ... menor é melhor
Disk Throttling: DiskSpd Read Loop, Queue Depth 8
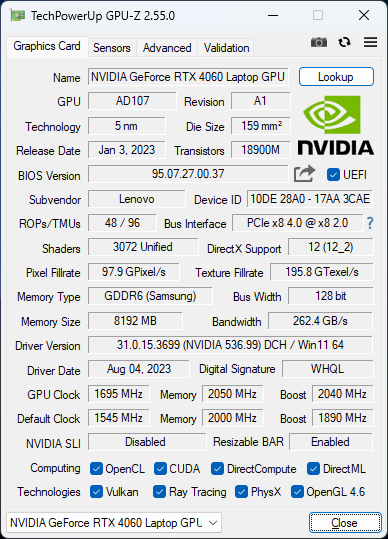
Desempenho da GPU - 105 W GeForce RTX 4060
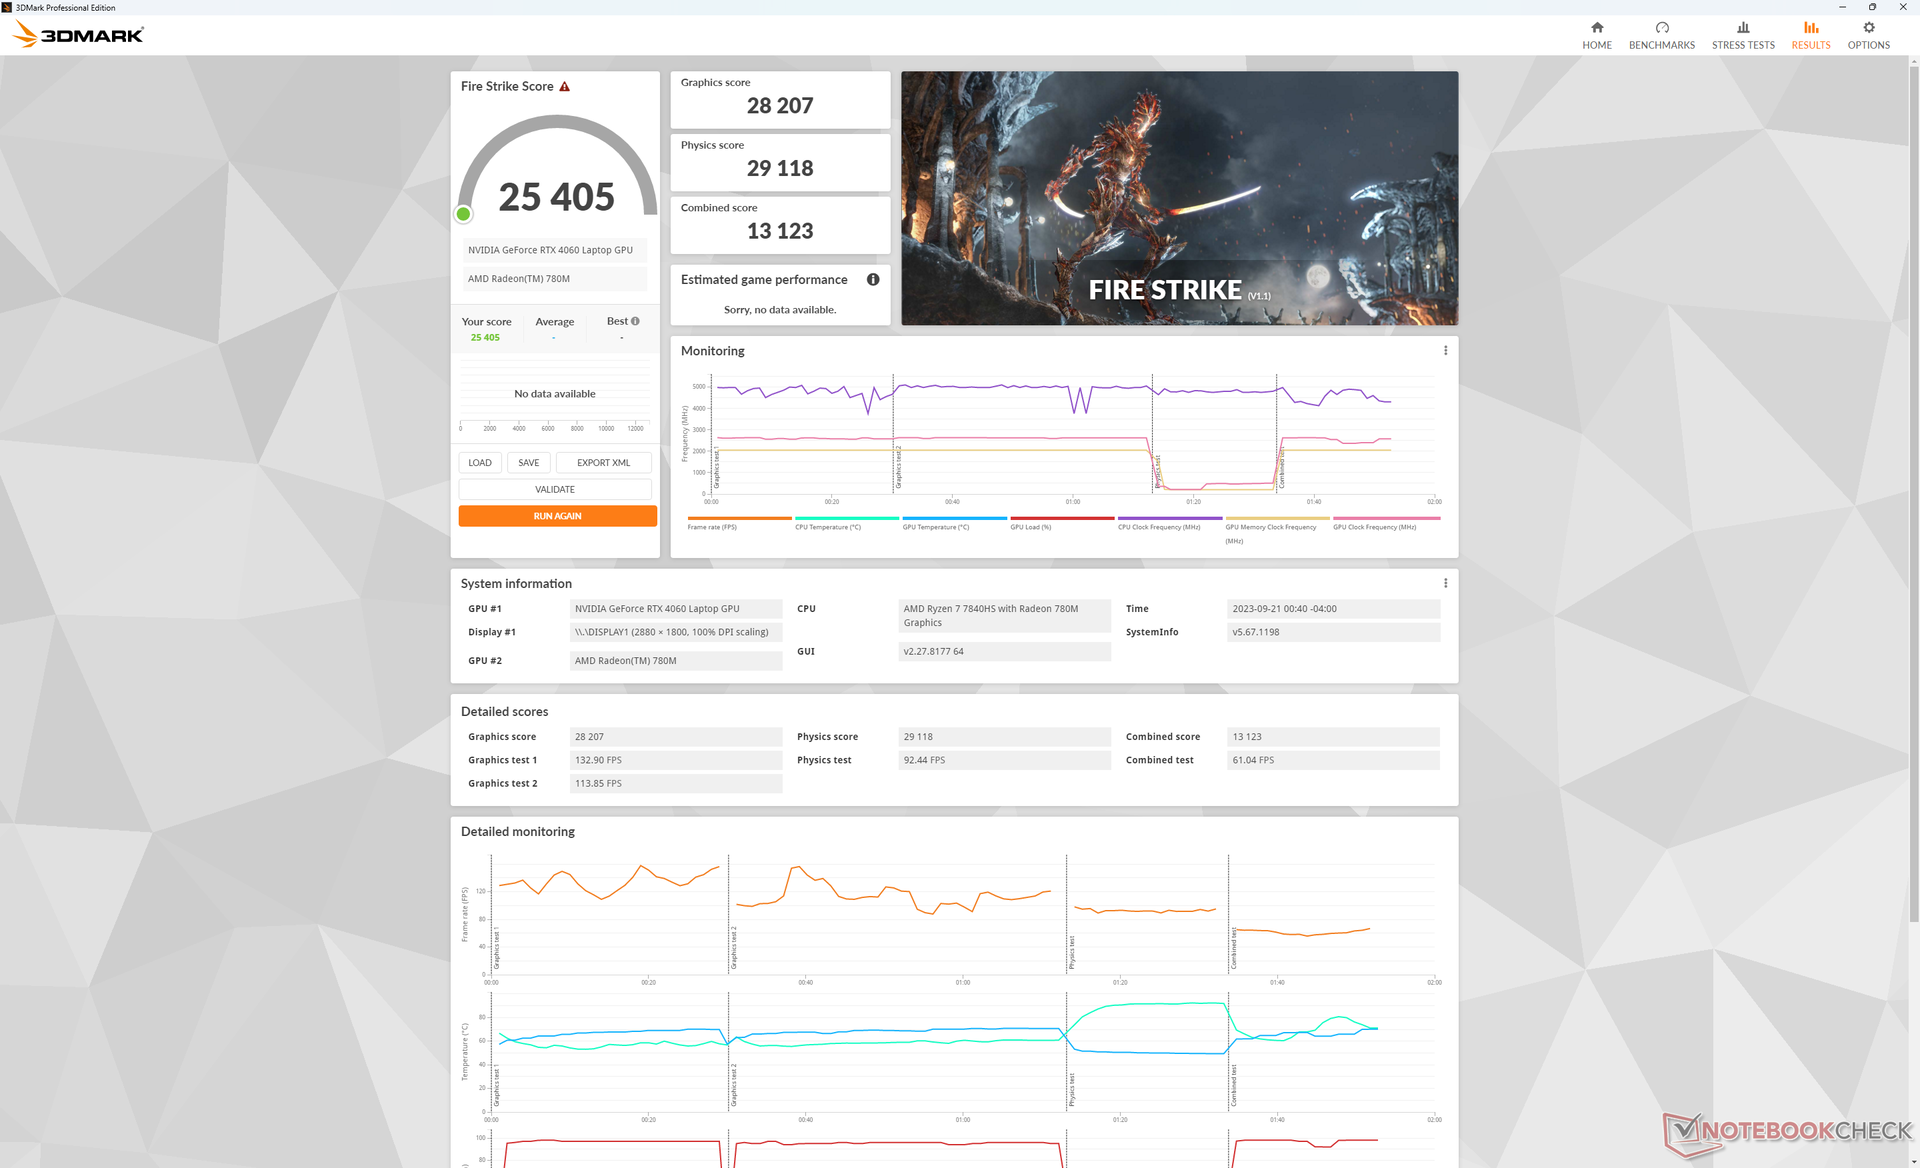
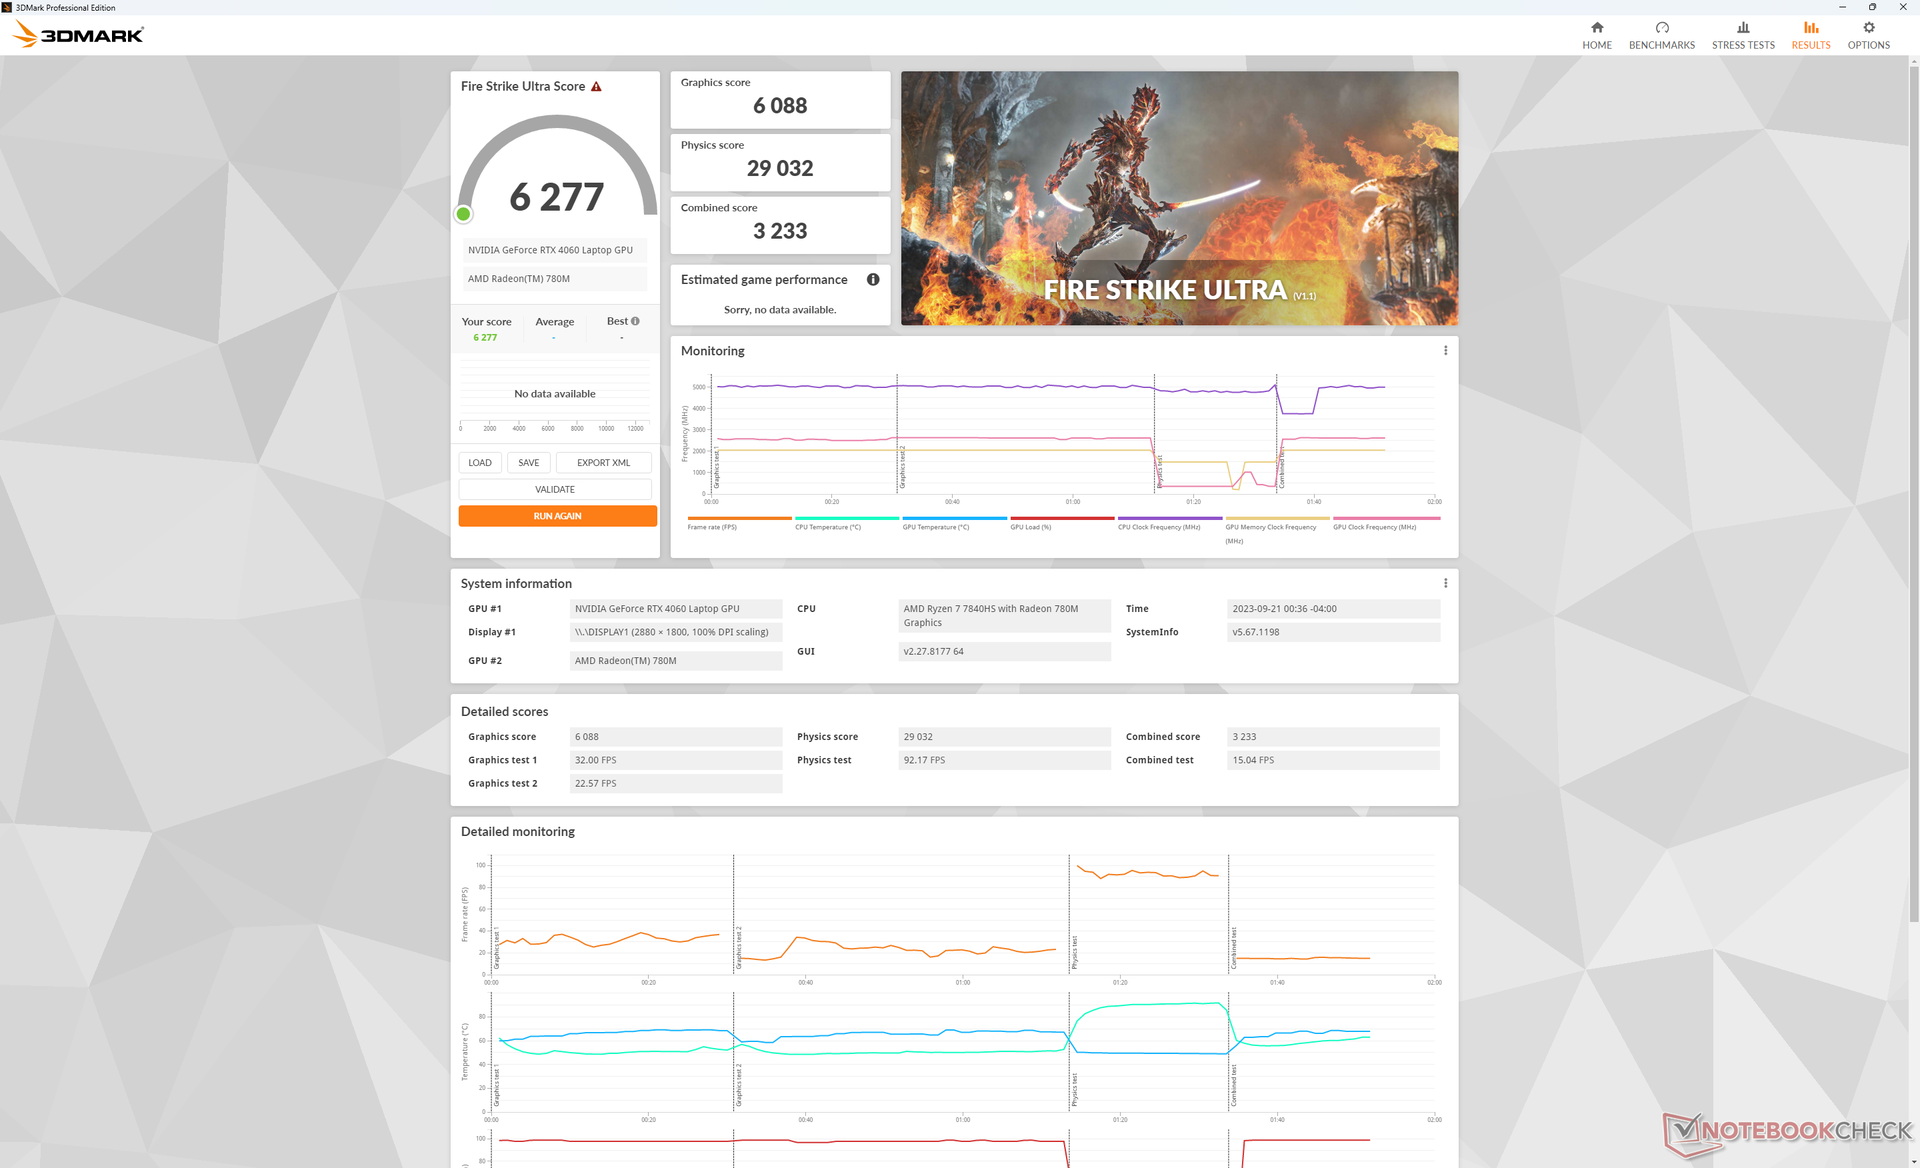
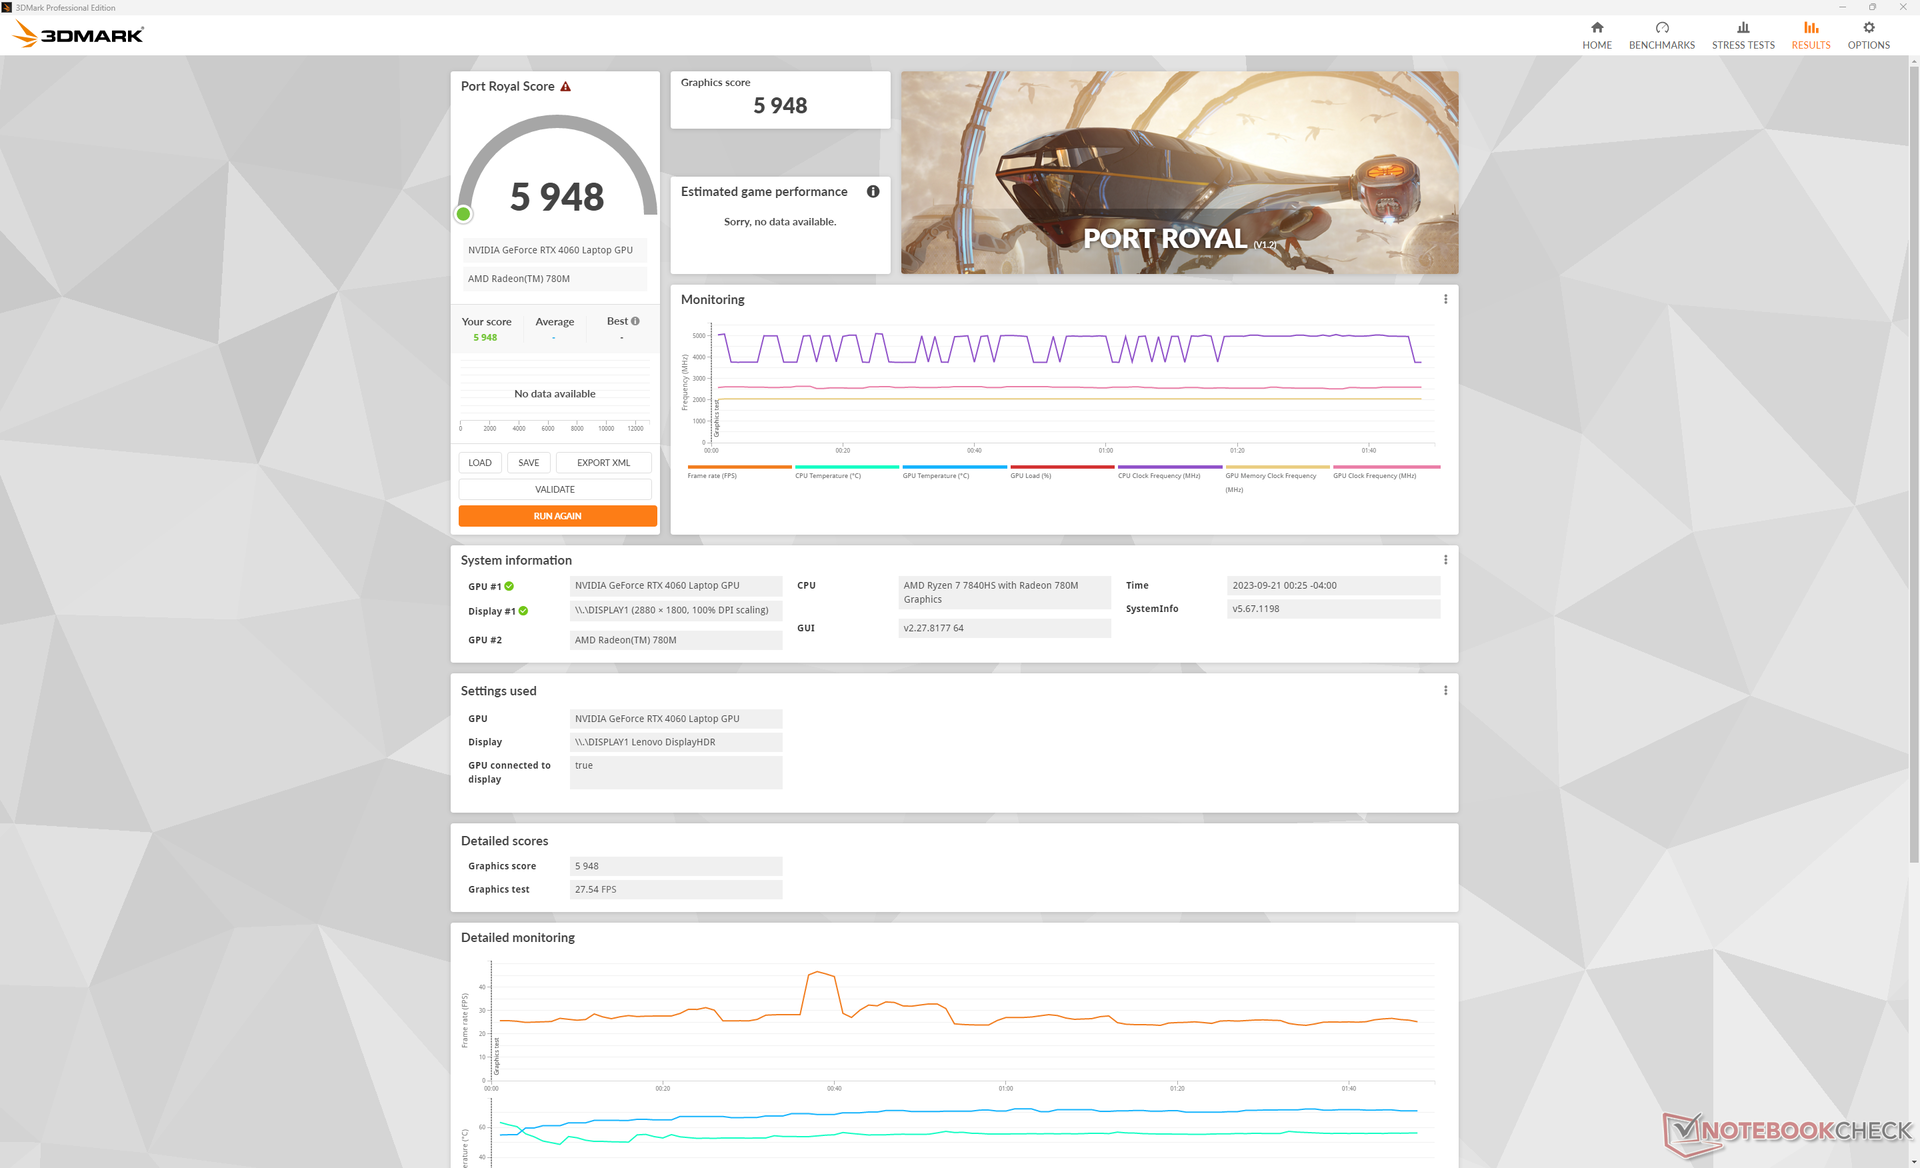
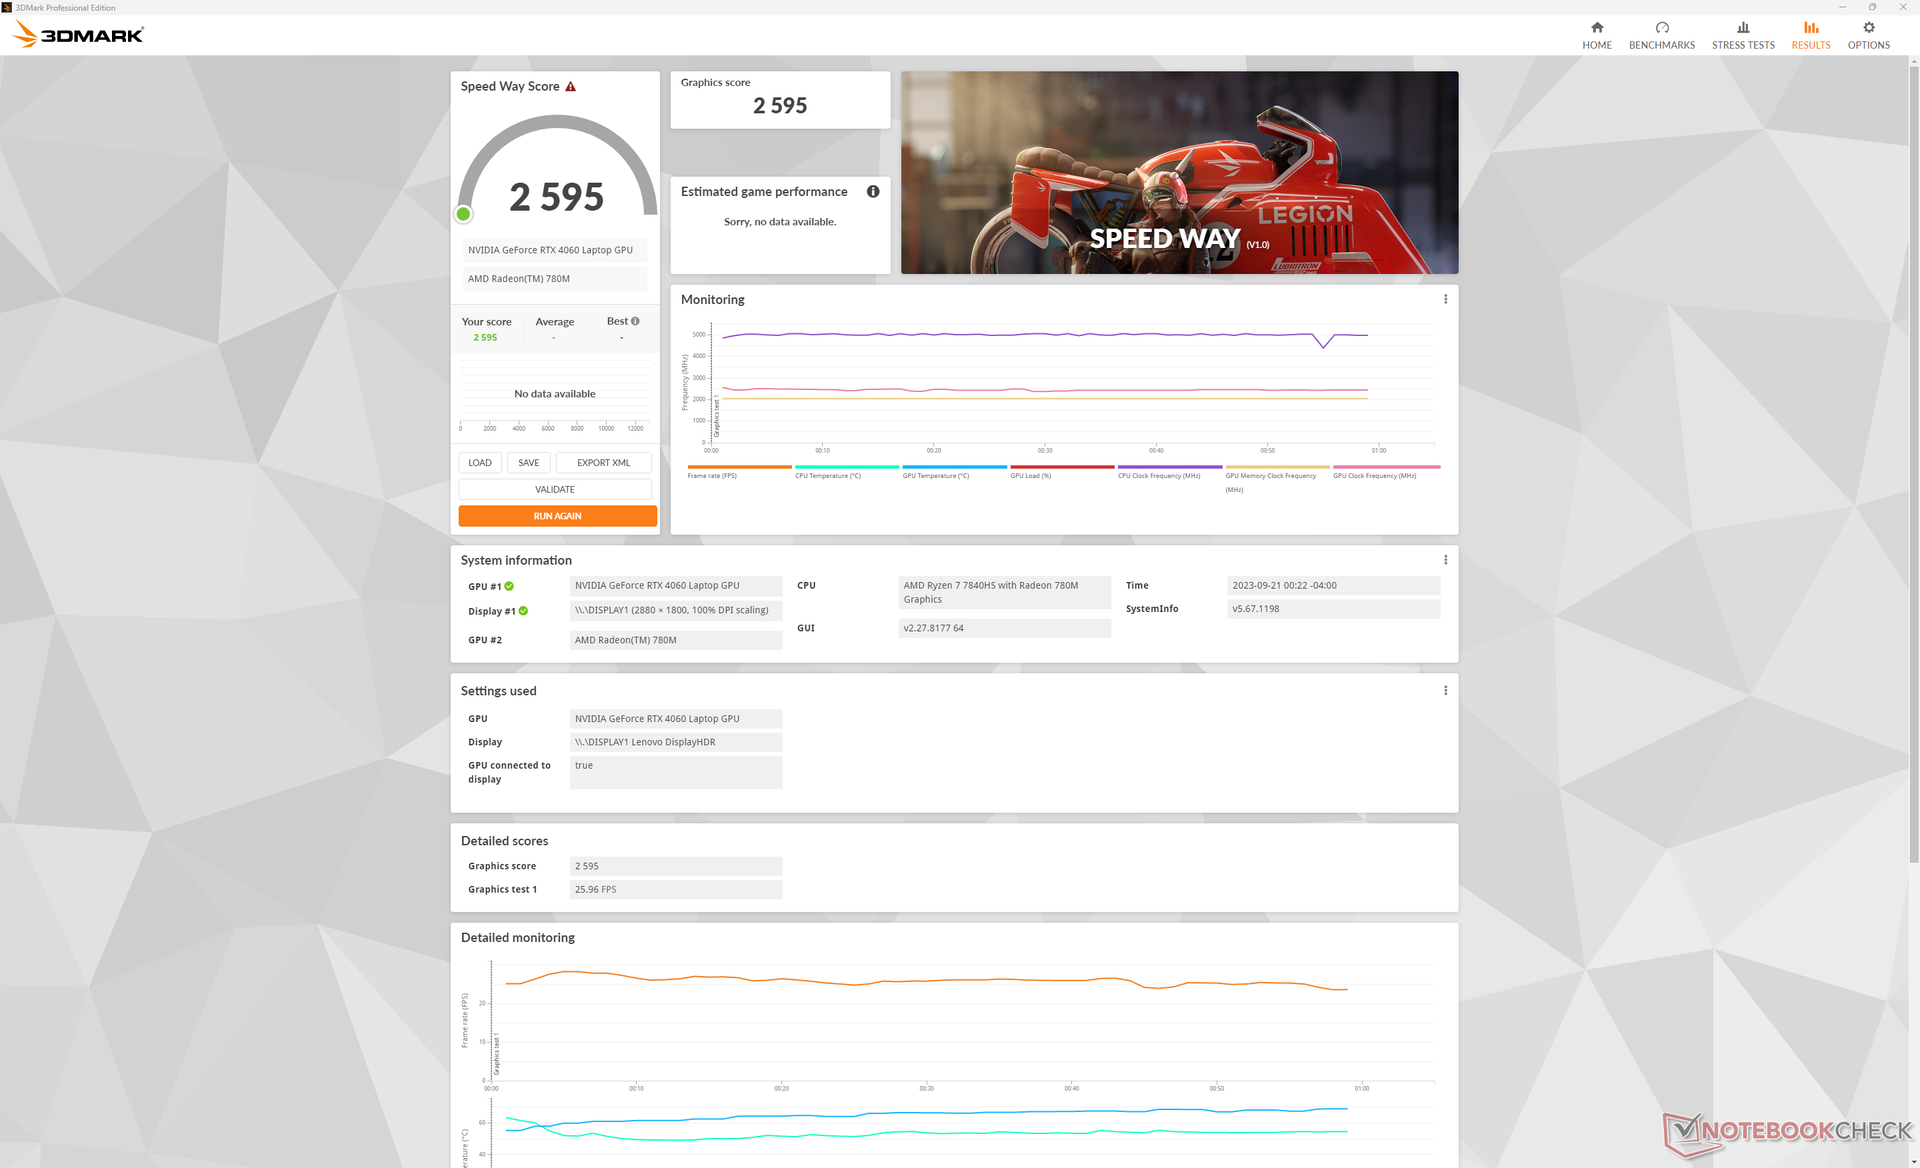
O desempenho gráfico é excelente, com resultados que estão em linha com outros laptops equipados com a mesma RTX 4060 O que sugere que não há grandes problemas de limitação. A RTX 4070 no Blade 14 é 15% mais rápida, mas essa opção não está disponível no modelo atual do Legion Slim 5 14.
O downgrade para a configuração RTX 4050 afetará o desempenho em cerca de 20 a 25 por cento, com base em nosso tempo com o Acer Predator Triton 14. A execução no modo Balanced em vez do modo Performance também afetaria o desempenho gráfico em até 15%, conforme mostrado em nossa tabela de resultados Fire Strike abaixo. No entanto, o modo Equilibrado é um pouco mais silencioso para compensar a redução do desempenho.
| Perfil de energia | Pontuação de gráficos | Pontuação de física | Pontuação combinada |
| Modo de desempenho | 28207 | 29118 | 13123 |
| Modo equilibrado (com o turbo desligado) | 24505 (-13%) | 28015 (-4%) | 11701 (-11%) |
| Energia da bateria | 22396 (-21%) | 26867 (-8%) | 10136 (-23%) |
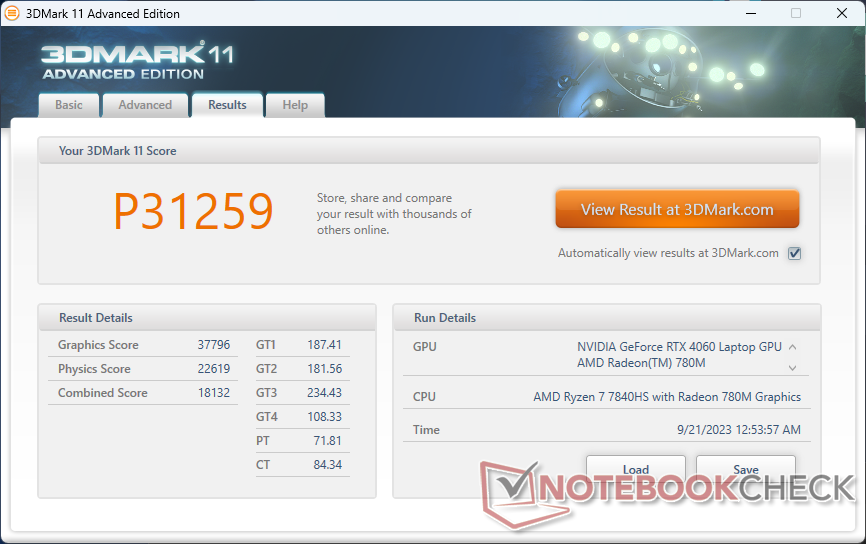
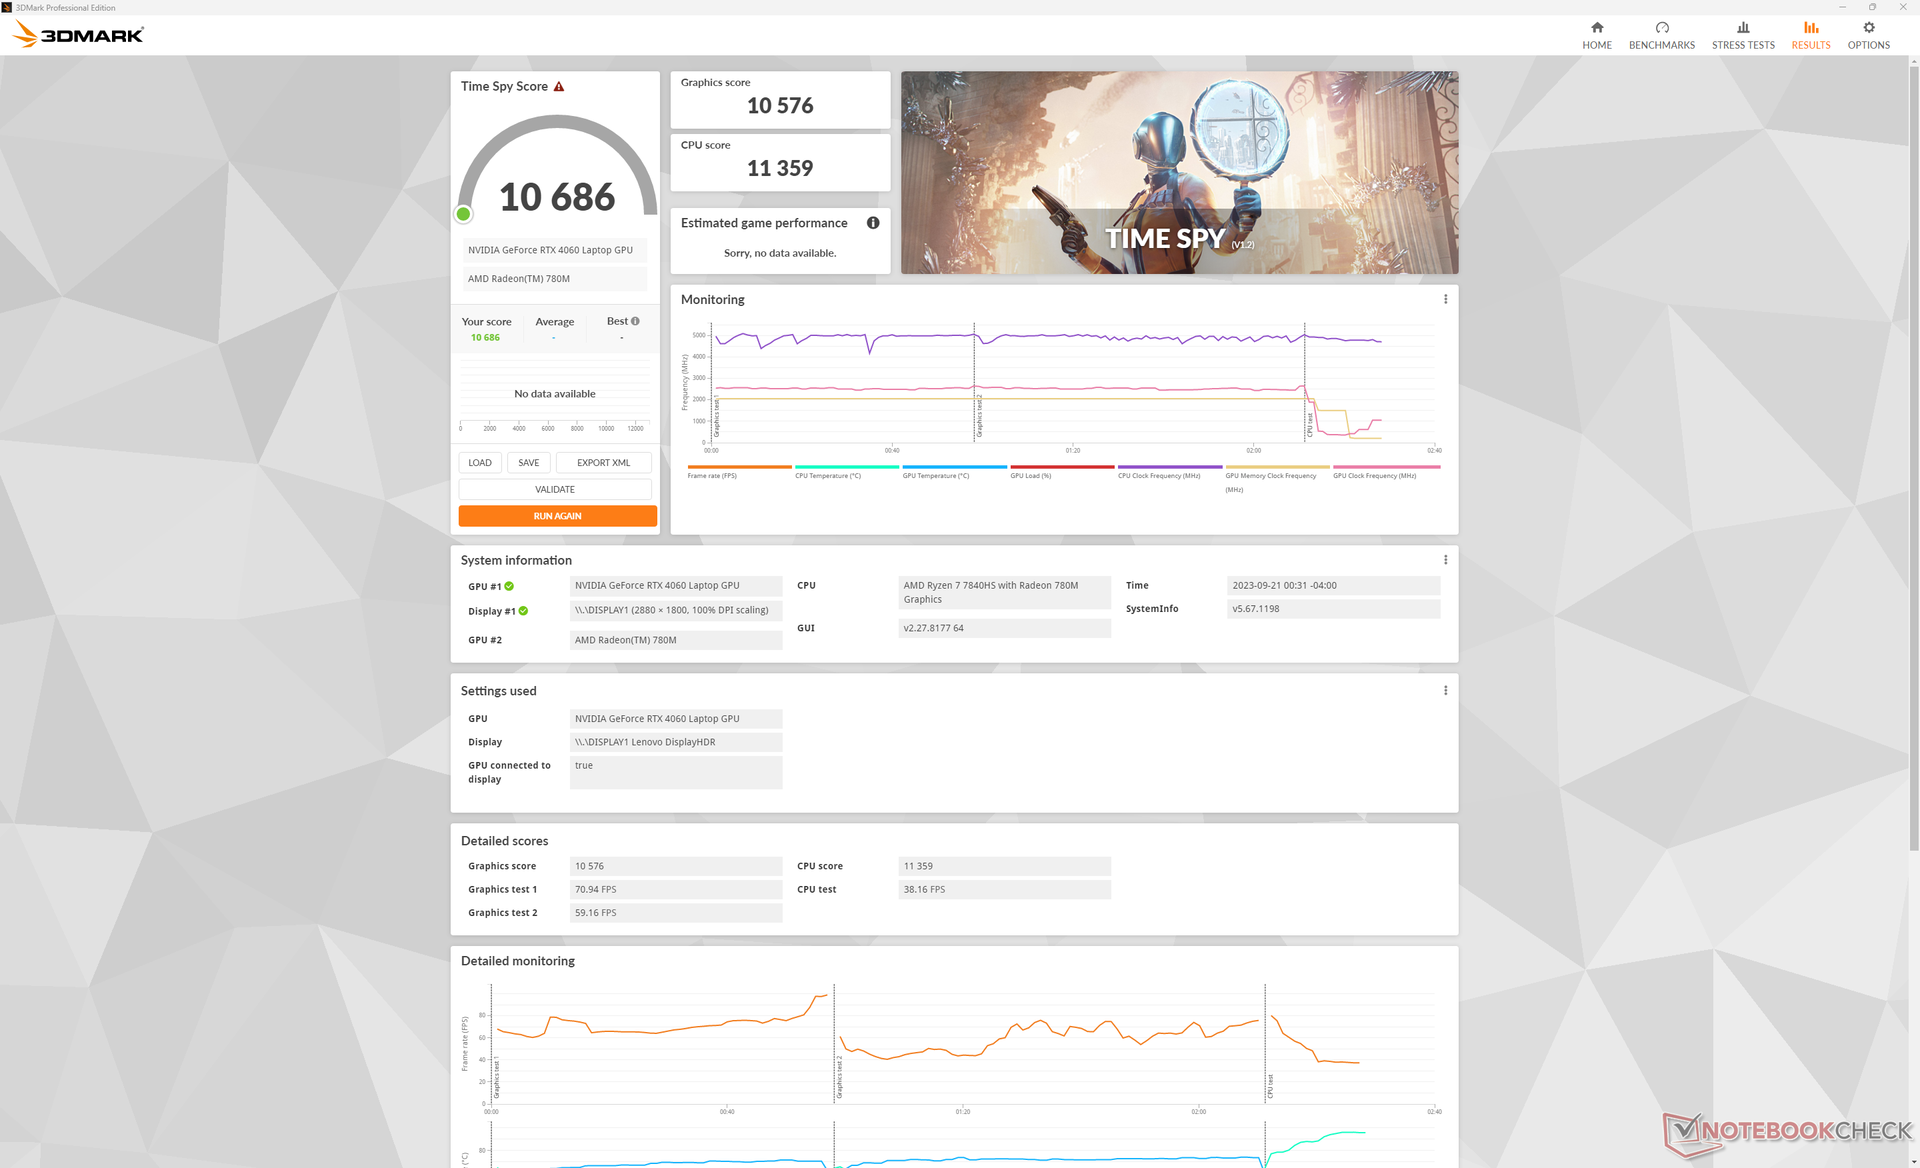
| 3DMark 11 Performance | 31259 pontos | |
| 3DMark Fire Strike Score | 24304 pontos | |
| 3DMark Time Spy Score | 10514 pontos | |
Ajuda | ||
* ... menor é melhor
Desempenho em jogos
Todos os jogos testados funcionam bem no Legion Slim 5 14, mesmo quando configurados com a resolução nativa de 2,8K. No entanto, recomendamos ajustar as configurações para Médio se estiver jogando títulos exigentes como Star Wars Jedi Survivor ou Returnal para manter as taxas de quadros em 60 FPS ou mais, especialmente porque a tela principal não tem G-Sync.
| Far Cry 6 | |
| 1920x1080 High Graphics Quality AA:T | |
| Média NVIDIA GeForce RTX 4060 Laptop GPU (101 - 120, n=2) | |
| Asus ROG Zephyrus G14 GA402RK | |
| Asus ROG Zephyrus G14 GA402XY | |
| Inno3D GeForce RTX 3060 Twin X2 | |
| Lenovo Legion Slim 5 14APH8 | |
| 1920x1080 Ultra Graphics Quality + HD Textures AA:T | |
| Razer Blade 14 RTX 4070 | |
| Média NVIDIA GeForce RTX 4060 Laptop GPU (76 - 117, n=5) | |
| Asus ROG Zephyrus G14 GA402RK | |
| Asus ROG Zephyrus G14 GA402XY | |
| Lenovo Legion Slim 5 14APH8 | |
| Inno3D GeForce RTX 3060 Twin X2 | |
| 2560x1440 Ultra Graphics Quality + HD Textures AA:T | |
| Asus ROG Zephyrus G14 GA402XY | |
| Razer Blade 14 RTX 4070 | |
| Lenovo Legion Slim 5 14APH8 | |
| Asus ROG Zephyrus G14 GA402RK | |
| Inno3D GeForce RTX 3060 Twin X2 | |
| Média NVIDIA GeForce RTX 4060 Laptop GPU (32.6 - 83, n=5) | |
| F1 22 | |
| 1920x1080 High Preset AA:T AF:16x | |
| Asus ROG Zephyrus G14 GA402XY | |
| Lenovo Legion Slim 5 14APH8 | |
| Razer Blade 14 RTX 4070 | |
| Média NVIDIA GeForce RTX 4060 Laptop GPU (124.7 - 217, n=23) | |
| Acer Predator Triton 14 PT14-51 | |
| 1920x1080 Ultra High Preset AA:T AF:16x | |
| Asus ROG Zephyrus G14 GA402XY | |
| Razer Blade 14 RTX 4070 | |
| Lenovo Legion Slim 5 14APH8 | |
| Média NVIDIA GeForce RTX 4060 Laptop GPU (48.7 - 71.4, n=23) | |
| Acer Predator Triton 14 PT14-51 | |
| 2560x1440 Ultra High Preset AA:T AF:16x | |
| Asus ROG Zephyrus G14 GA402XY | |
| Razer Blade 14 RTX 4070 | |
| Lenovo Legion Slim 5 14APH8 | |
| Média NVIDIA GeForce RTX 4060 Laptop GPU (31 - 45.2, n=18) | |
| Acer Predator Triton 14 PT14-51 | |
| Call of Duty Modern Warfare 2 2022 | |
| 1920x1080 Ultra Quality Preset AA:T2X Filmic SM | |
| Asus ROG Zephyrus G14 GA402XY | |
| Lenovo Legion Slim 5 14APH8 | |
| Média NVIDIA GeForce RTX 4060 Laptop GPU (70 - 104, n=4) | |
| 1920x1080 Extreme Quality Preset AA:T2X Filmic SM | |
| Asus ROG Zephyrus G14 GA402XY | |
| Razer Blade 14 RTX 4070 | |
| Lenovo Legion Slim 5 14APH8 | |
| Média NVIDIA GeForce RTX 4060 Laptop GPU (68 - 94, n=9) | |
| 2560x1440 Extreme Quality Preset AA:T2X Filmic SM | |
| Asus ROG Zephyrus G14 GA402XY | |
| Razer Blade 14 RTX 4070 | |
| Lenovo Legion Slim 5 14APH8 | |
| Média NVIDIA GeForce RTX 4060 Laptop GPU (49 - 66, n=7) | |
Witcher 3 FPS Chart
| baixo | média | alto | ultra | QHD | |
|---|---|---|---|---|---|
| GTA V (2015) | 178.9 | 171.6 | 162.3 | 102.1 | 86.6 |
| The Witcher 3 (2015) | 355 | 313.5 | 209.8 | 101.4 | |
| Dota 2 Reborn (2015) | 146 | 141.9 | 137.2 | 131.8 | |
| Final Fantasy XV Benchmark (2018) | 199.9 | 145.9 | 104.3 | 76.3 | |
| X-Plane 11.11 (2018) | 124.4 | 107.8 | 84.9 | ||
| Strange Brigade (2018) | 353 | 282 | 230 | 197.9 | 131.7 |
| Shadow of the Tomb Raider (2018) | 144 | 132 | 93 | ||
| Assassin´s Creed Valhalla (2020) | 117 | 99 | 72 | ||
| Far Cry 6 (2021) | 101 | 94 | 79 | ||
| Cyberpunk 2077 1.6 (2022) | 83.68 | 78.08 | 48.54 | ||
| Tiny Tina's Wonderlands (2022) | 114.65 | 88.15 | 59.69 | ||
| F1 22 (2022) | 218 | 217 | 193.1 | 65.8 | 42.4 |
| Call of Duty Modern Warfare 2 2022 (2022) | 104 | 94 | 65 | ||
| Returnal (2023) | 73 | 67 | 45 | ||
| Star Wars Jedi Survivor (2023) | 67.6 | 65 | 39.9 |
Emissões - Loud Little Gamer
Ruído do sistema
Os ventiladores internos são propensos a pulsar mesmo quando configurados no modo balanceado. O ruído do ventilador varia entre 23 e 31 dB(A) com a simples navegação na Web ou streaming de vídeo. Portanto, é recomendável executar o sistema no modo Silencioso se desejar reduzir o ruído do ventilador.
Jogar no modo Equilibrado em vez do modo Desempenho reduziria ligeiramente o ruído do ventilador de 52,8 dB(A) para 49,3 dB(A). Em ambos os casos, o Legion Slim 5 14 ainda é uma máquina de jogos muito barulhenta, semelhante ao Blade 14,Zephyrus G14ou Alienware x14.
Barulho
| Ocioso |
| 22.8 / 27.3 / 30.7 dB |
| Carga |
| 41.6 / 52.6 dB |
 | ||
30 dB silencioso 40 dB(A) audível 50 dB(A) ruidosamente alto |
||
min: | ||
| Lenovo Legion Slim 5 14APH8 GeForce RTX 4060 Laptop GPU, R7 7840HS, SK Hynix HFS001TEJ9X115N | Acer Predator Triton 14 PT14-51 GeForce RTX 4050 Laptop GPU, i7-13700H, Micron 3400 MTFDKBA512TFH 512GB | Razer Blade 14 RTX 4070 GeForce RTX 4070 Laptop GPU, R9 7940HS, Samsung PM9A1 MZVL21T0HCLR | Asus ROG Zephyrus G14 GA402XY GeForce RTX 4090 Laptop GPU, R9 7940HS, Samsung PM9A1 MZVL21T0HCLR | Alienware x14 i7 RTX 3060 GeForce RTX 3060 Laptop GPU, i7-12700H, WDC PC SN810 1TB | Lenovo LOQ 15APH8 GeForce RTX 4050 Laptop GPU, R7 7840HS, Micron 2450 512GB MTFDKCD512TFK | |
|---|---|---|---|---|---|---|
| Noise | -0% | 7% | -2% | 0% | 6% | |
| desligado / ambiente * (dB) | 22.8 | 25 -10% | 22.7 -0% | 23.3 -2% | 24.7 -8% | 23.1 -1% |
| Idle Minimum * (dB) | 22.8 | 27 -18% | 23.4 -3% | 23.6 -4% | 24.7 -8% | 23.1 -1% |
| Idle Average * (dB) | 27.3 | 29 -6% | 23.4 14% | 23.6 14% | 24.7 10% | 23.1 15% |
| Idle Maximum * (dB) | 30.7 | 31 -1% | 23.4 24% | 33 -7% | 30.9 -1% | 25.2 18% |
| Load Average * (dB) | 41.6 | 42 -1% | 33 21% | 49.5 -19% | 40 4% | 44.3 -6% |
| Witcher 3 ultra * (dB) | 52.8 | 43 19% | 51.8 2% | 52.2 1% | 51.5 2% | 45.8 13% |
| Load Maximum * (dB) | 52.6 | 45 14% | 55.6 -6% | 52.2 1% | 51.5 2% | 52 1% |
* ... menor é melhor
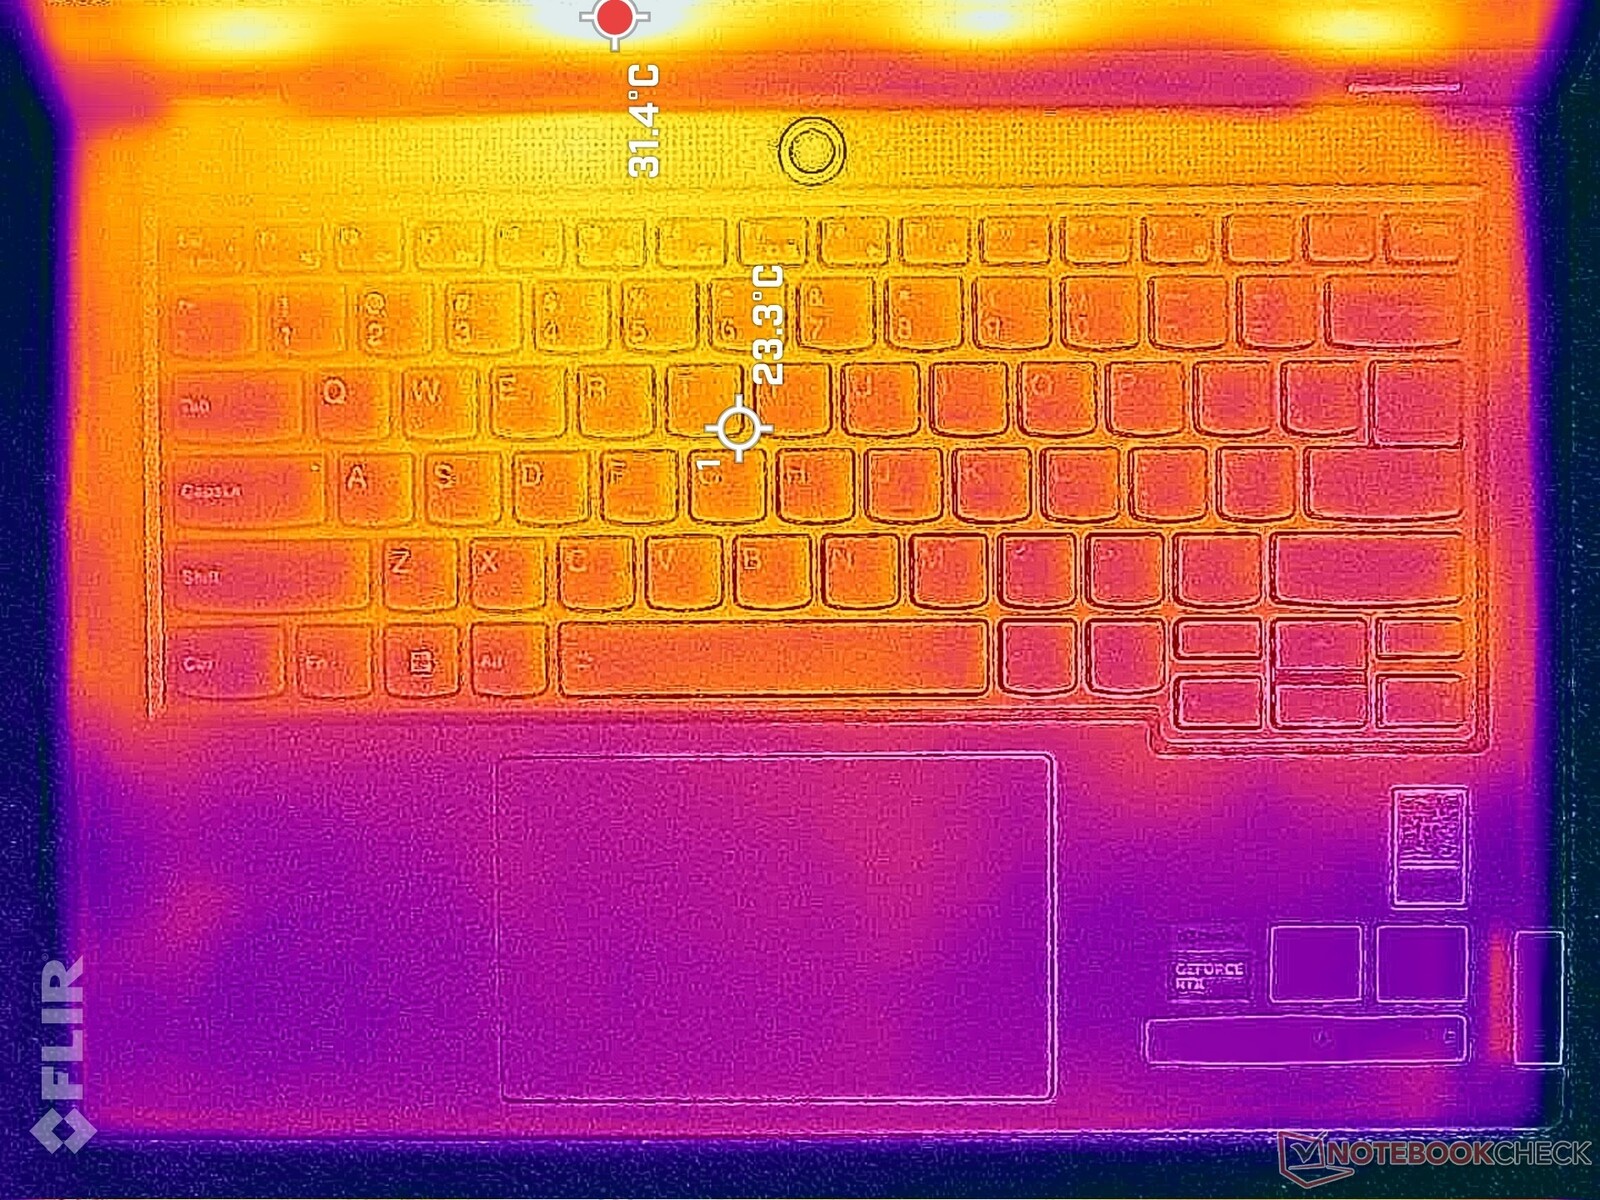
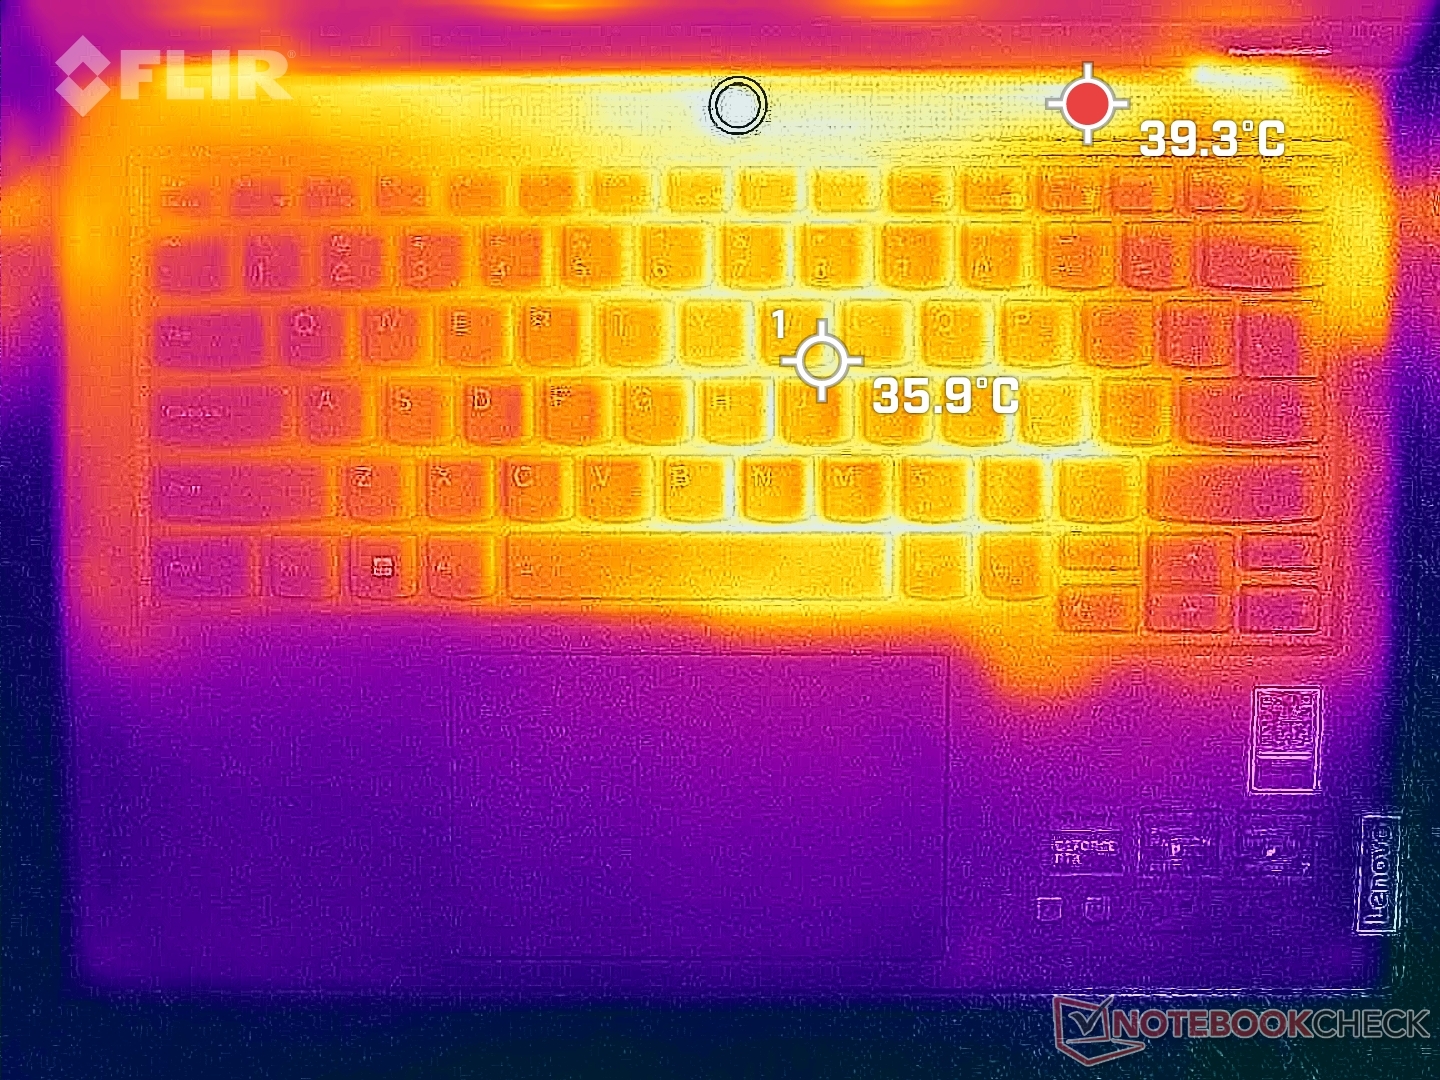
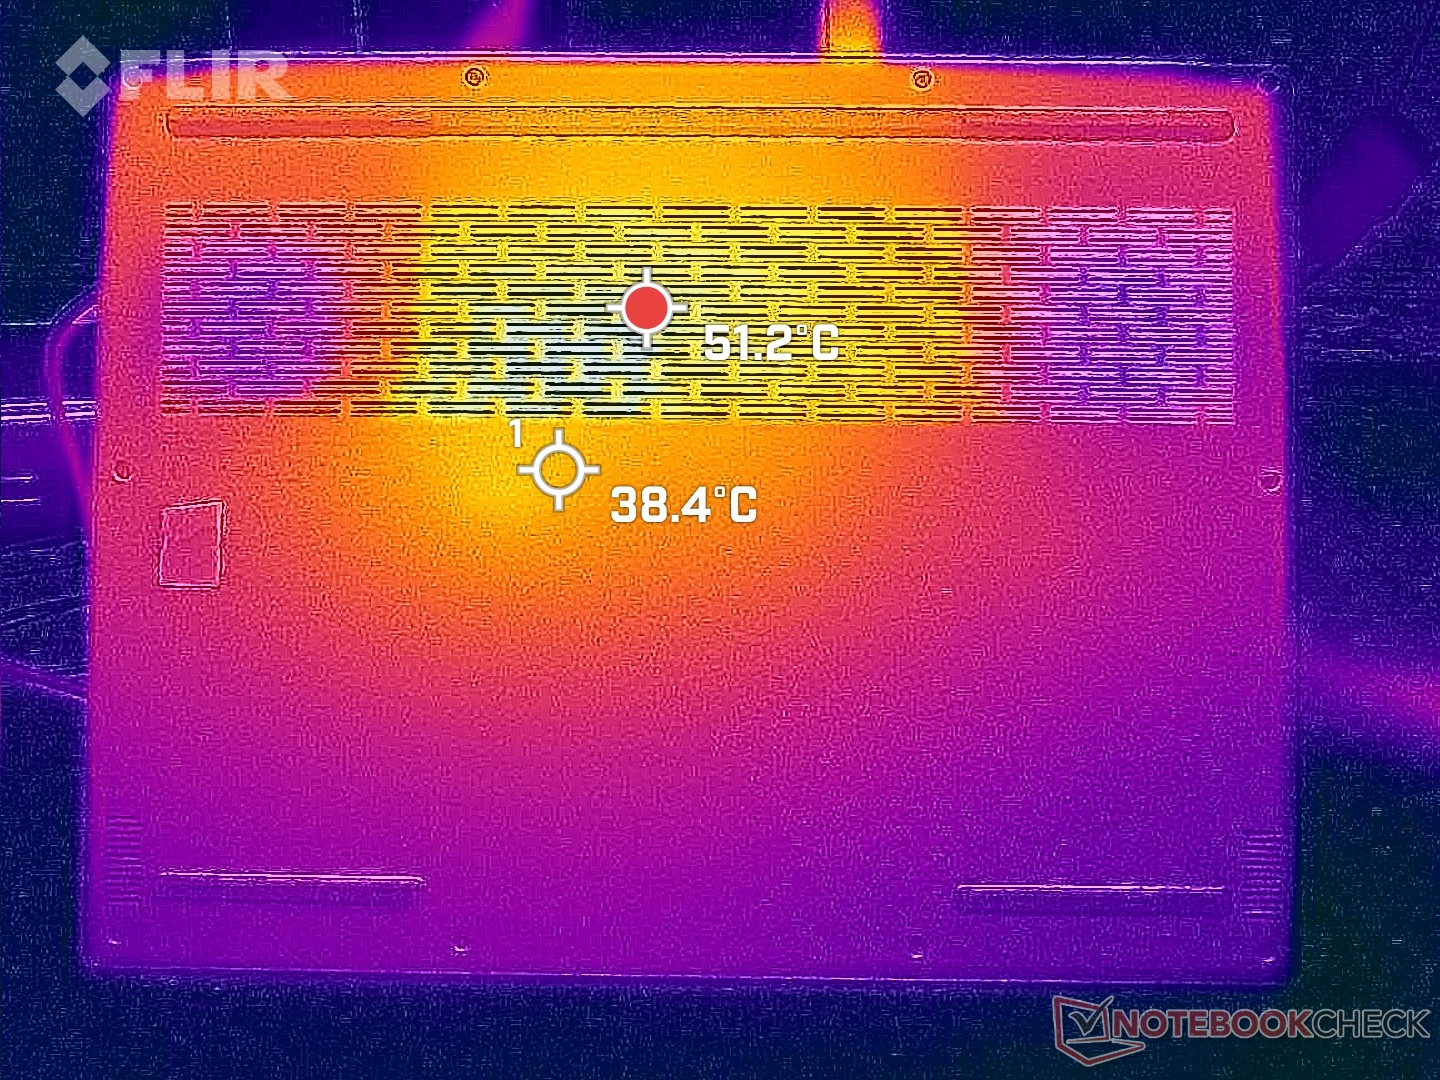
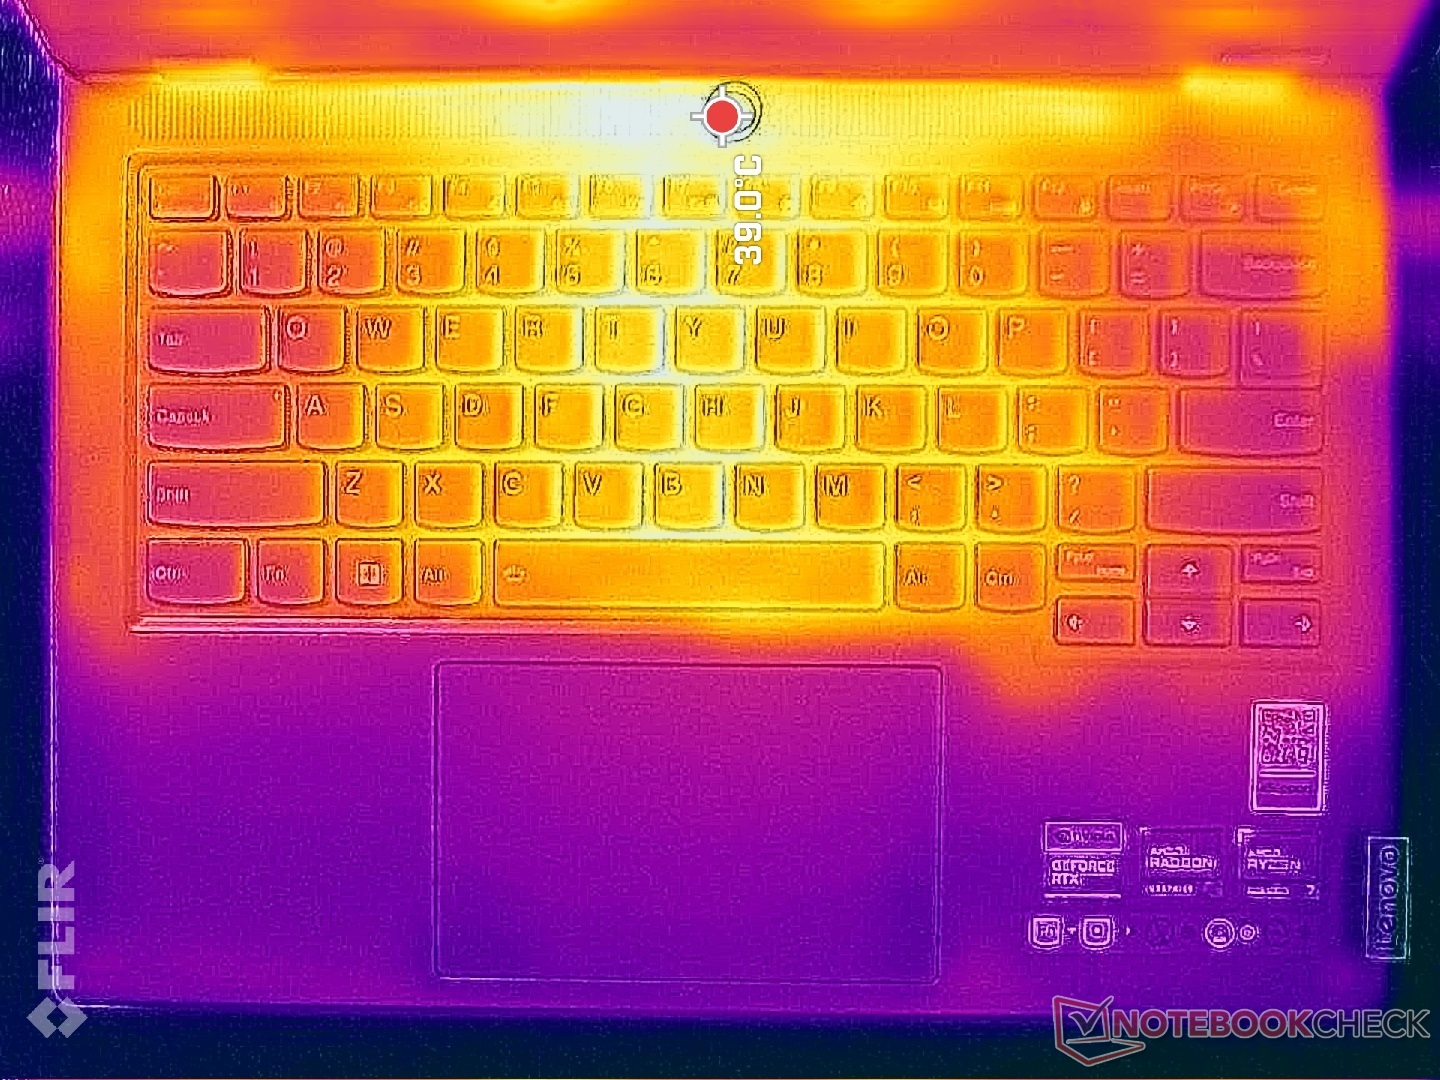
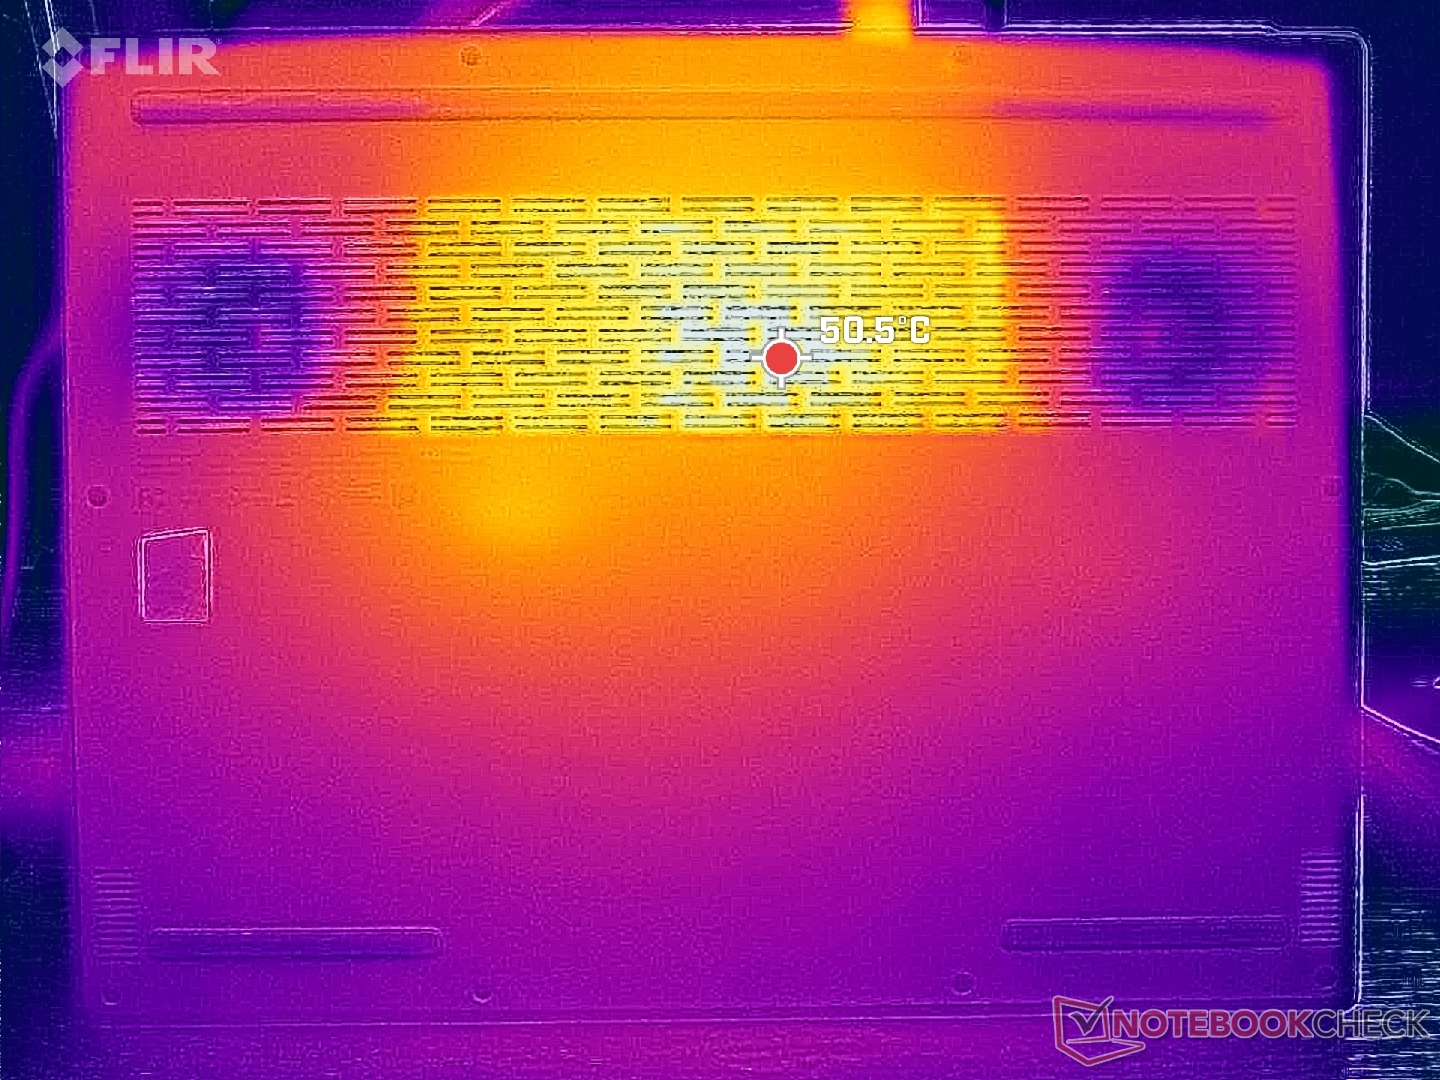
Temperatura
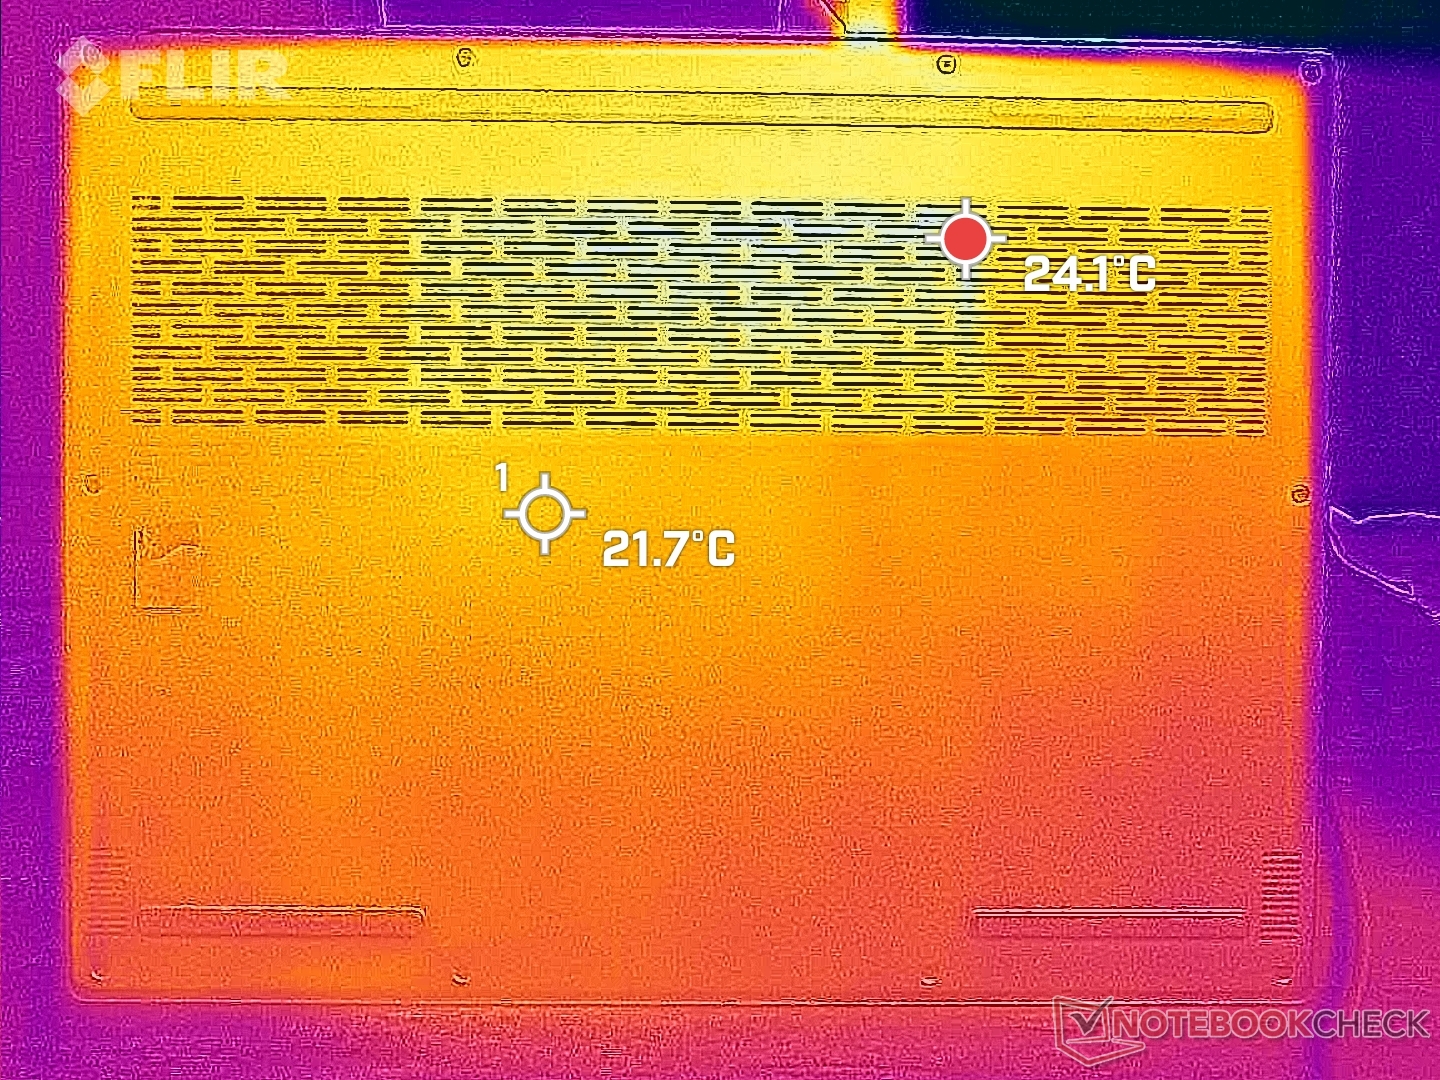
As temperaturas da superfície são mais quentes na parte central e traseira do teclado, onde podem atingir até 36 °C e 52 °C, respectivamente, ao executar cargas exigentes, como jogos. O sistema é um pouco mais quente do que o Blade 14 em média, embora o design da Lenovo incorpore mais grades de ventilação. Os apoios para as mãos e o clickpad permanecem mais frios e mais confortáveis ao toque.
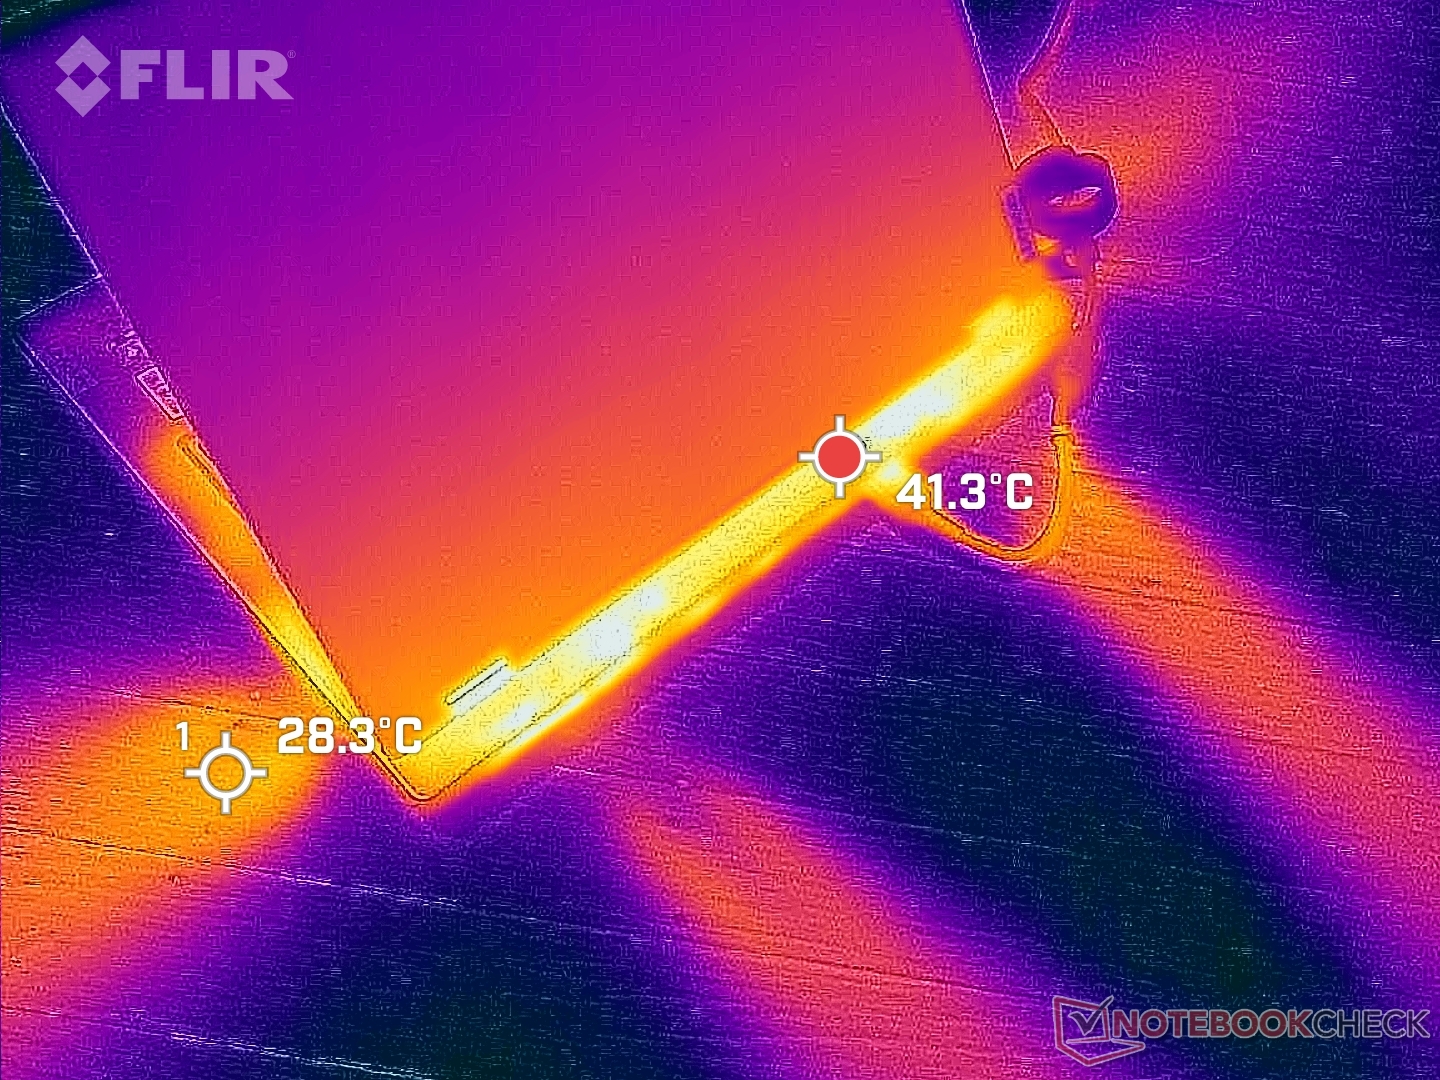
(±) A temperatura máxima no lado superior é 40.4 °C / 105 F, em comparação com a média de 40.4 °C / 105 F , variando de 21.2 a 68.8 °C para a classe Gaming.
(-) A parte inferior aquece até um máximo de 49.4 °C / 121 F, em comparação com a média de 43.2 °C / 110 F
(+) Em uso inativo, a temperatura média para o lado superior é 26.7 °C / 80 F, em comparação com a média do dispositivo de 33.9 °C / ### class_avg_f### F.
(±) Jogando The Witcher 3, a temperatura média para o lado superior é 34.8 °C / 95 F, em comparação com a média do dispositivo de 33.9 °C / ## #class_avg_f### F.
(+) Os apoios para as mãos e o touchpad são mais frios que a temperatura da pele, com um máximo de 29.2 °C / 84.6 F e, portanto, são frios ao toque.
(±) A temperatura média da área do apoio para as mãos de dispositivos semelhantes foi 28.8 °C / 83.8 F (-0.4 °C / -0.8 F).
| Lenovo Legion Slim 5 14APH8 AMD Ryzen 7 7840HS, NVIDIA GeForce RTX 4060 Laptop GPU | Acer Predator Triton 14 PT14-51 Intel Core i7-13700H, NVIDIA GeForce RTX 4050 Laptop GPU | Razer Blade 14 RTX 4070 AMD Ryzen 9 7940HS, NVIDIA GeForce RTX 4070 Laptop GPU | Asus ROG Zephyrus G14 GA402XY AMD Ryzen 9 7940HS, NVIDIA GeForce RTX 4090 Laptop GPU | Alienware x14 i7 RTX 3060 Intel Core i7-12700H, NVIDIA GeForce RTX 3060 Laptop GPU | Lenovo LOQ 15APH8 AMD Ryzen 7 7840HS, NVIDIA GeForce RTX 4050 Laptop GPU | |
|---|---|---|---|---|---|---|
| Heat | -15% | -1% | 1% | -1% | -3% | |
| Maximum Upper Side * (°C) | 40.4 | 54 -34% | 37.4 7% | 47 -16% | 51.3 -27% | 44.4 -10% |
| Maximum Bottom * (°C) | 49.4 | 56 -13% | 35.2 29% | 46.5 6% | 44.4 10% | 52 -5% |
| Idle Upper Side * (°C) | 28.2 | 31 -10% | 33.2 -18% | 25.9 8% | 27.2 4% | 28 1% |
| Idle Bottom * (°C) | 29.8 | 31 -4% | 36.2 -21% | 28 6% | 26.6 11% | 29.6 1% |
* ... menor é melhor
Teste de estresse
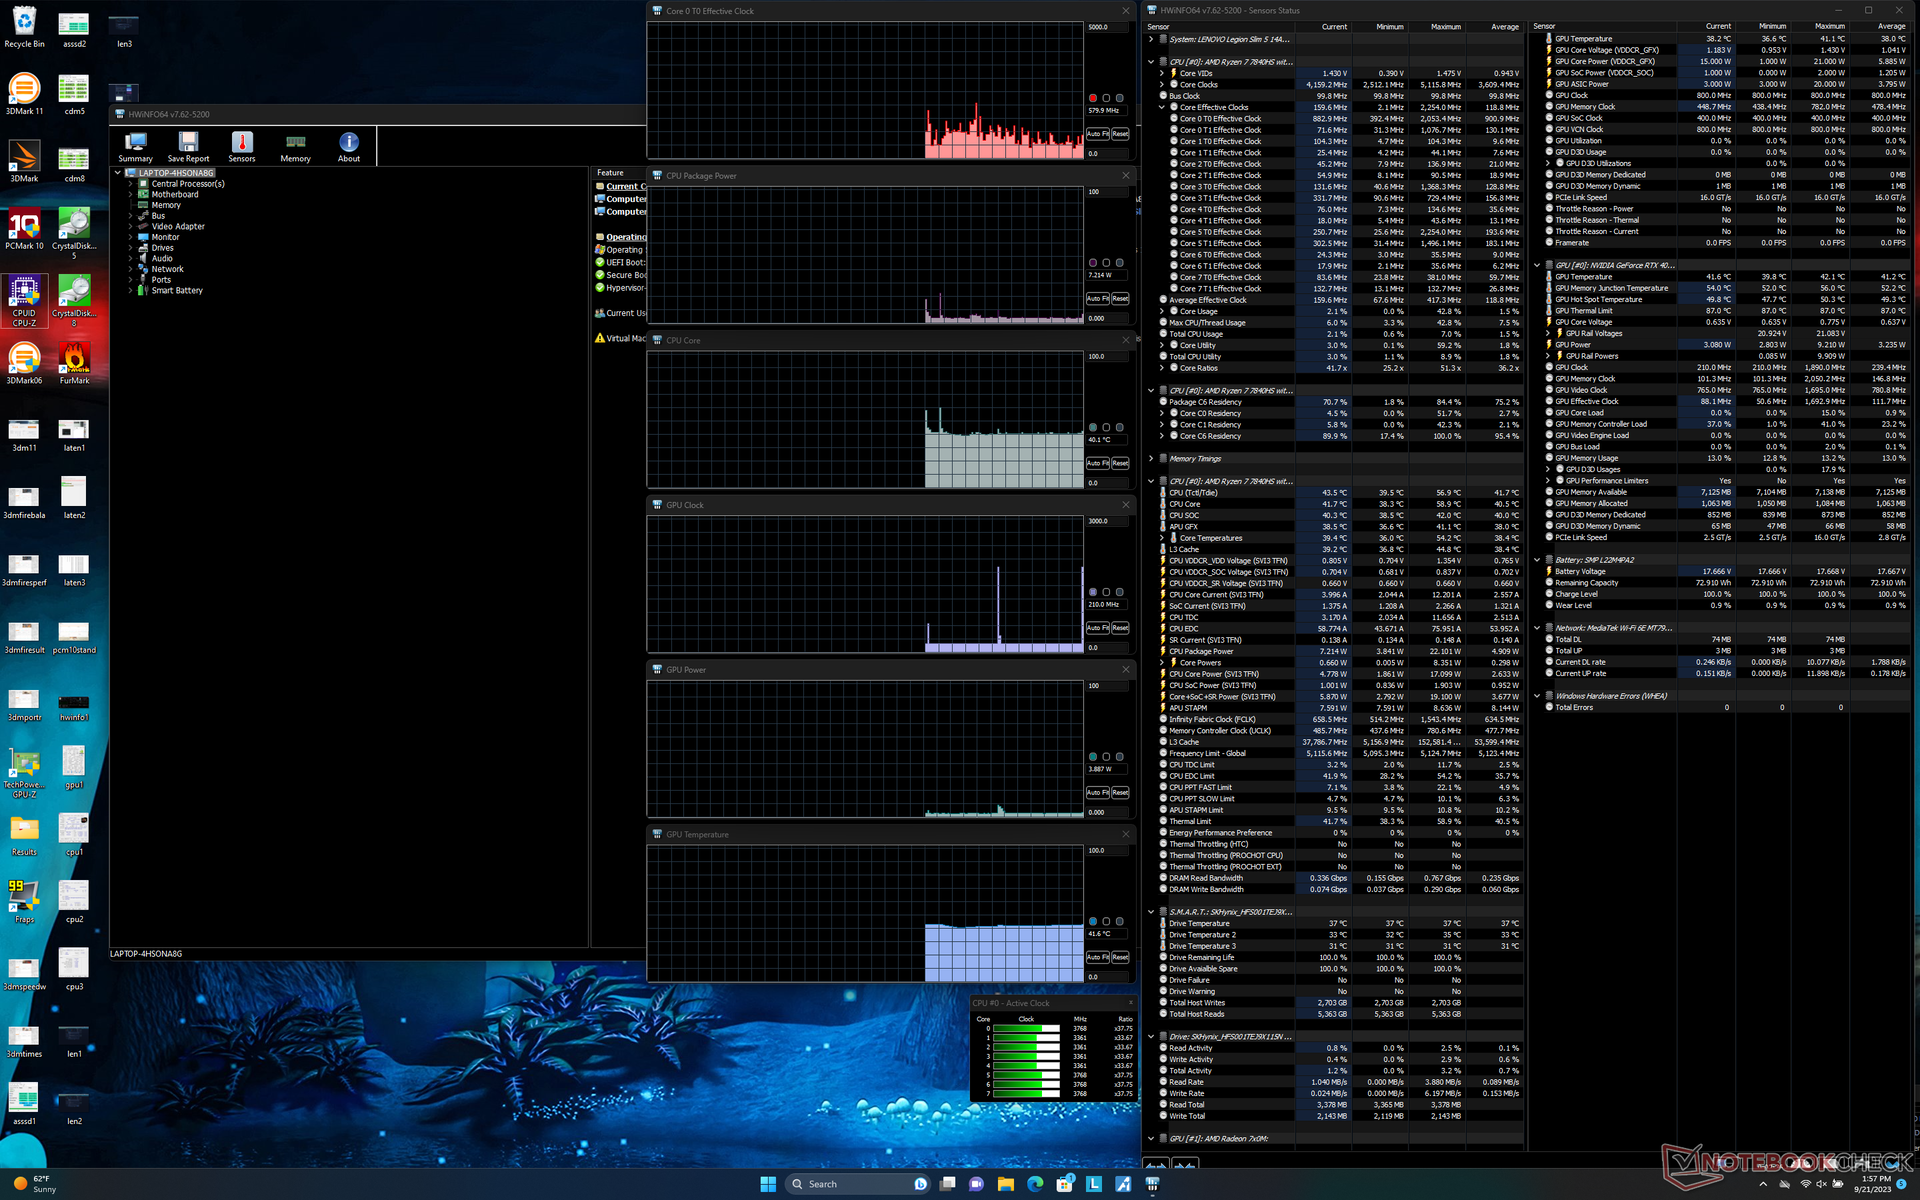
A CPU atingia um pico de 3,8 GHz e 92 W ao iniciar o estresse do Prime95 antes de cair e se estabilizar em 4,6 GHz e 84 W alguns segundos depois. A temperatura do núcleo era muito alta, 100 °C, o que sugere que o processador AMD está levando a capacidade de resfriamento do Legion Slim 5 14 ao seu limite. Repetir esse teste no Blade 14 com uma CPU similar da classe Zen 4 resultaria em uma temperatura central mais fria, de 90 °C, em comparação.
A GPU da Nvidia se estabilizaria em 2625 MHz, 78 °C e 99 W de consumo de energia da placa ao ser executada Witcher 3 no modo Performance, em comparação com apenas 2160 MHz, 69 C e 69 W ao executar o mesmo jogo no modo Balanced. O desempenho reduzido vem acompanhado de menos ruído do ventilador, conforme mencionado acima.
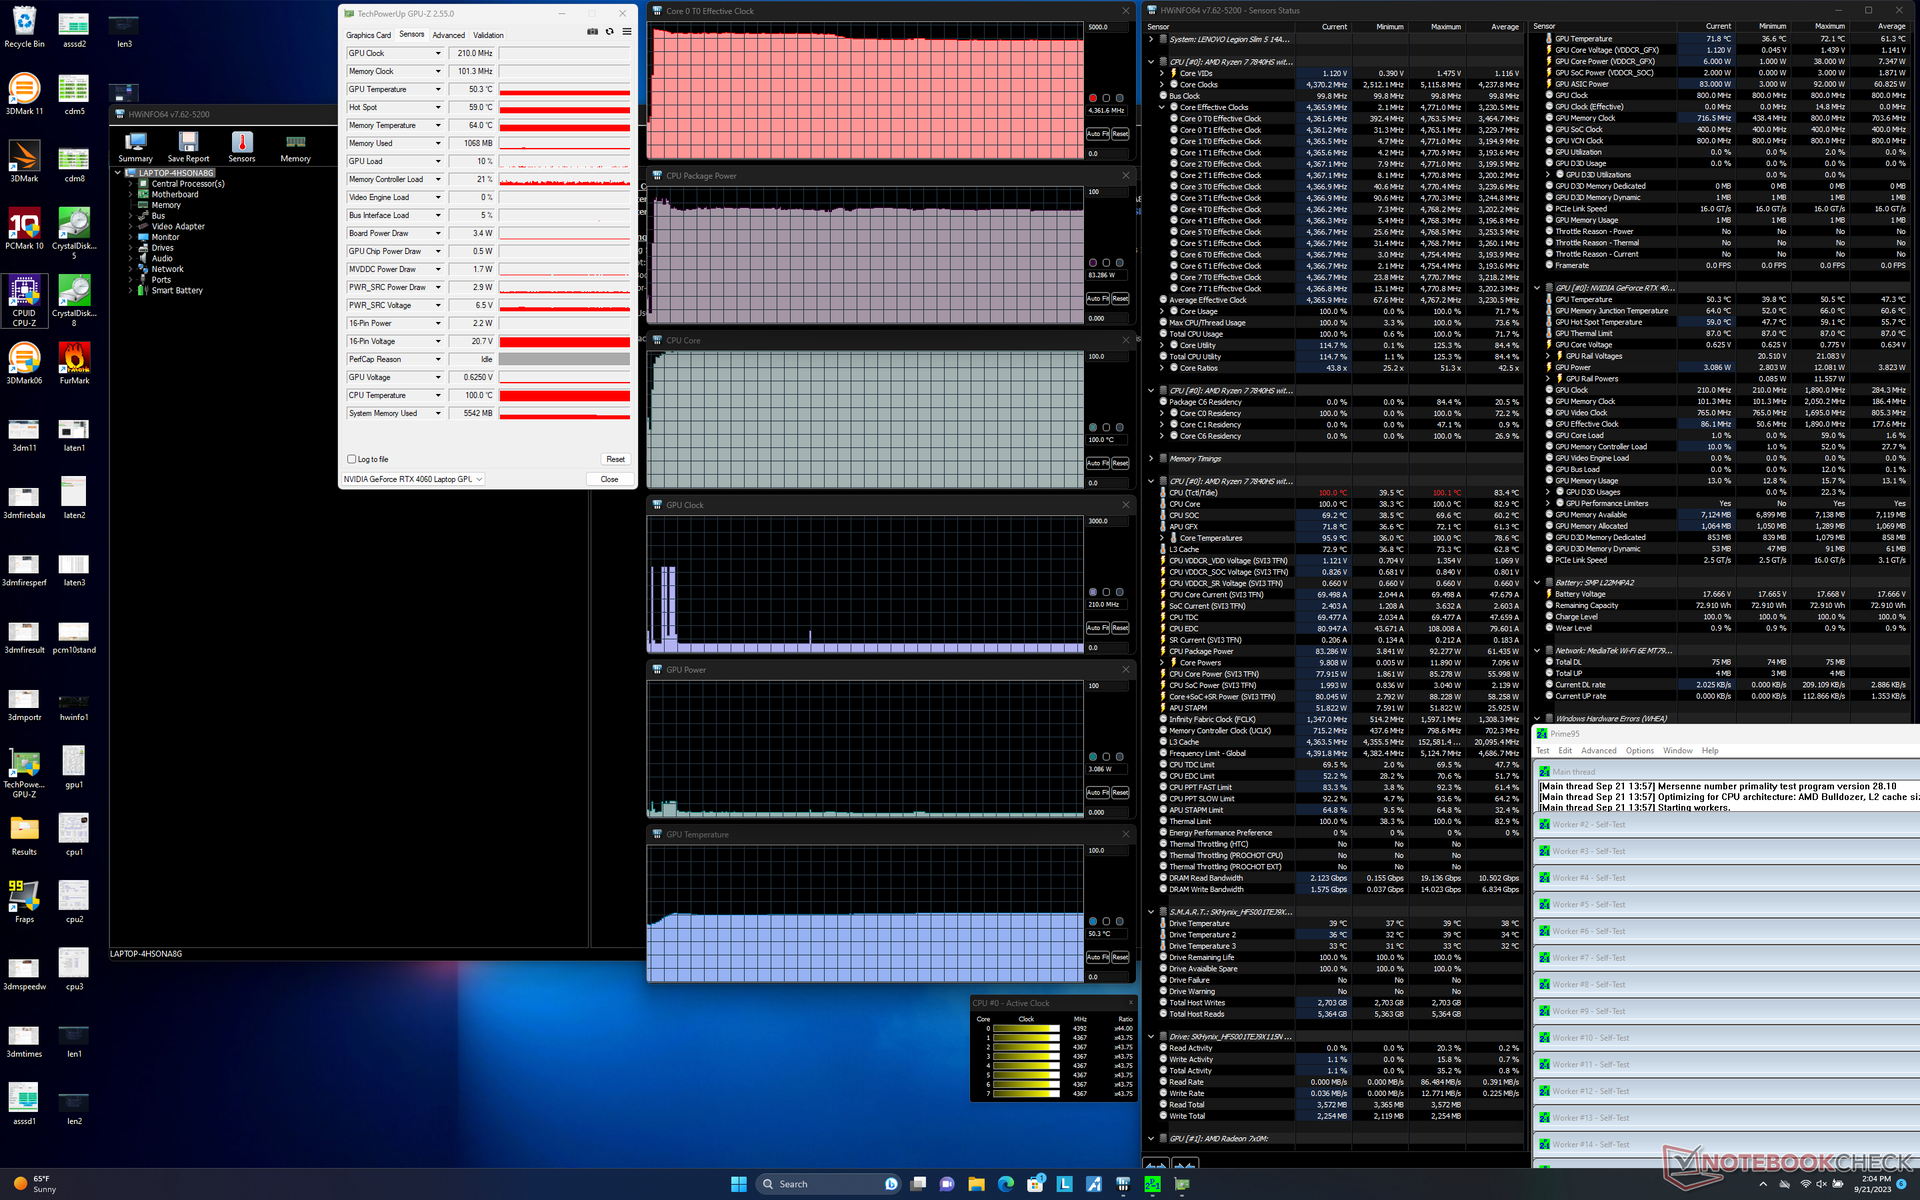
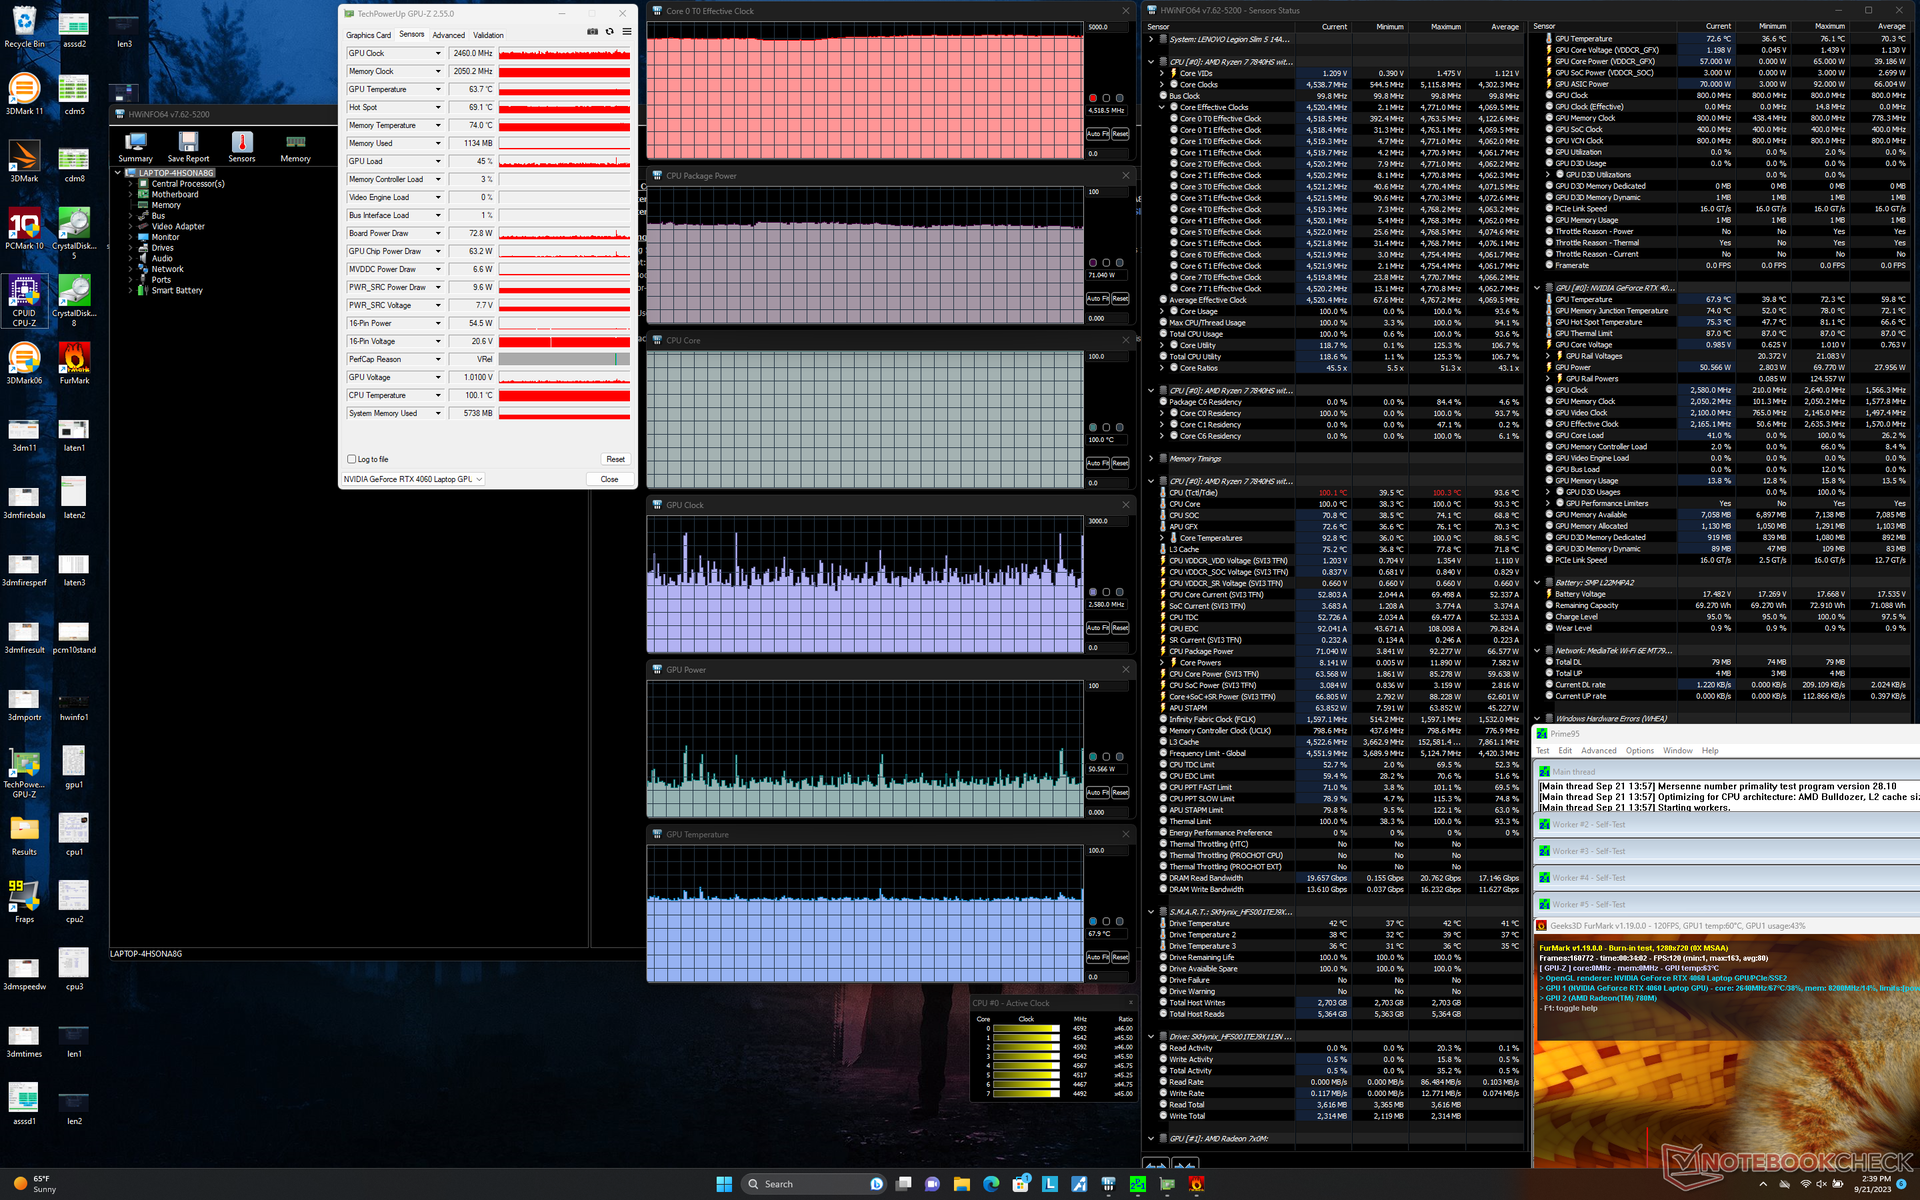
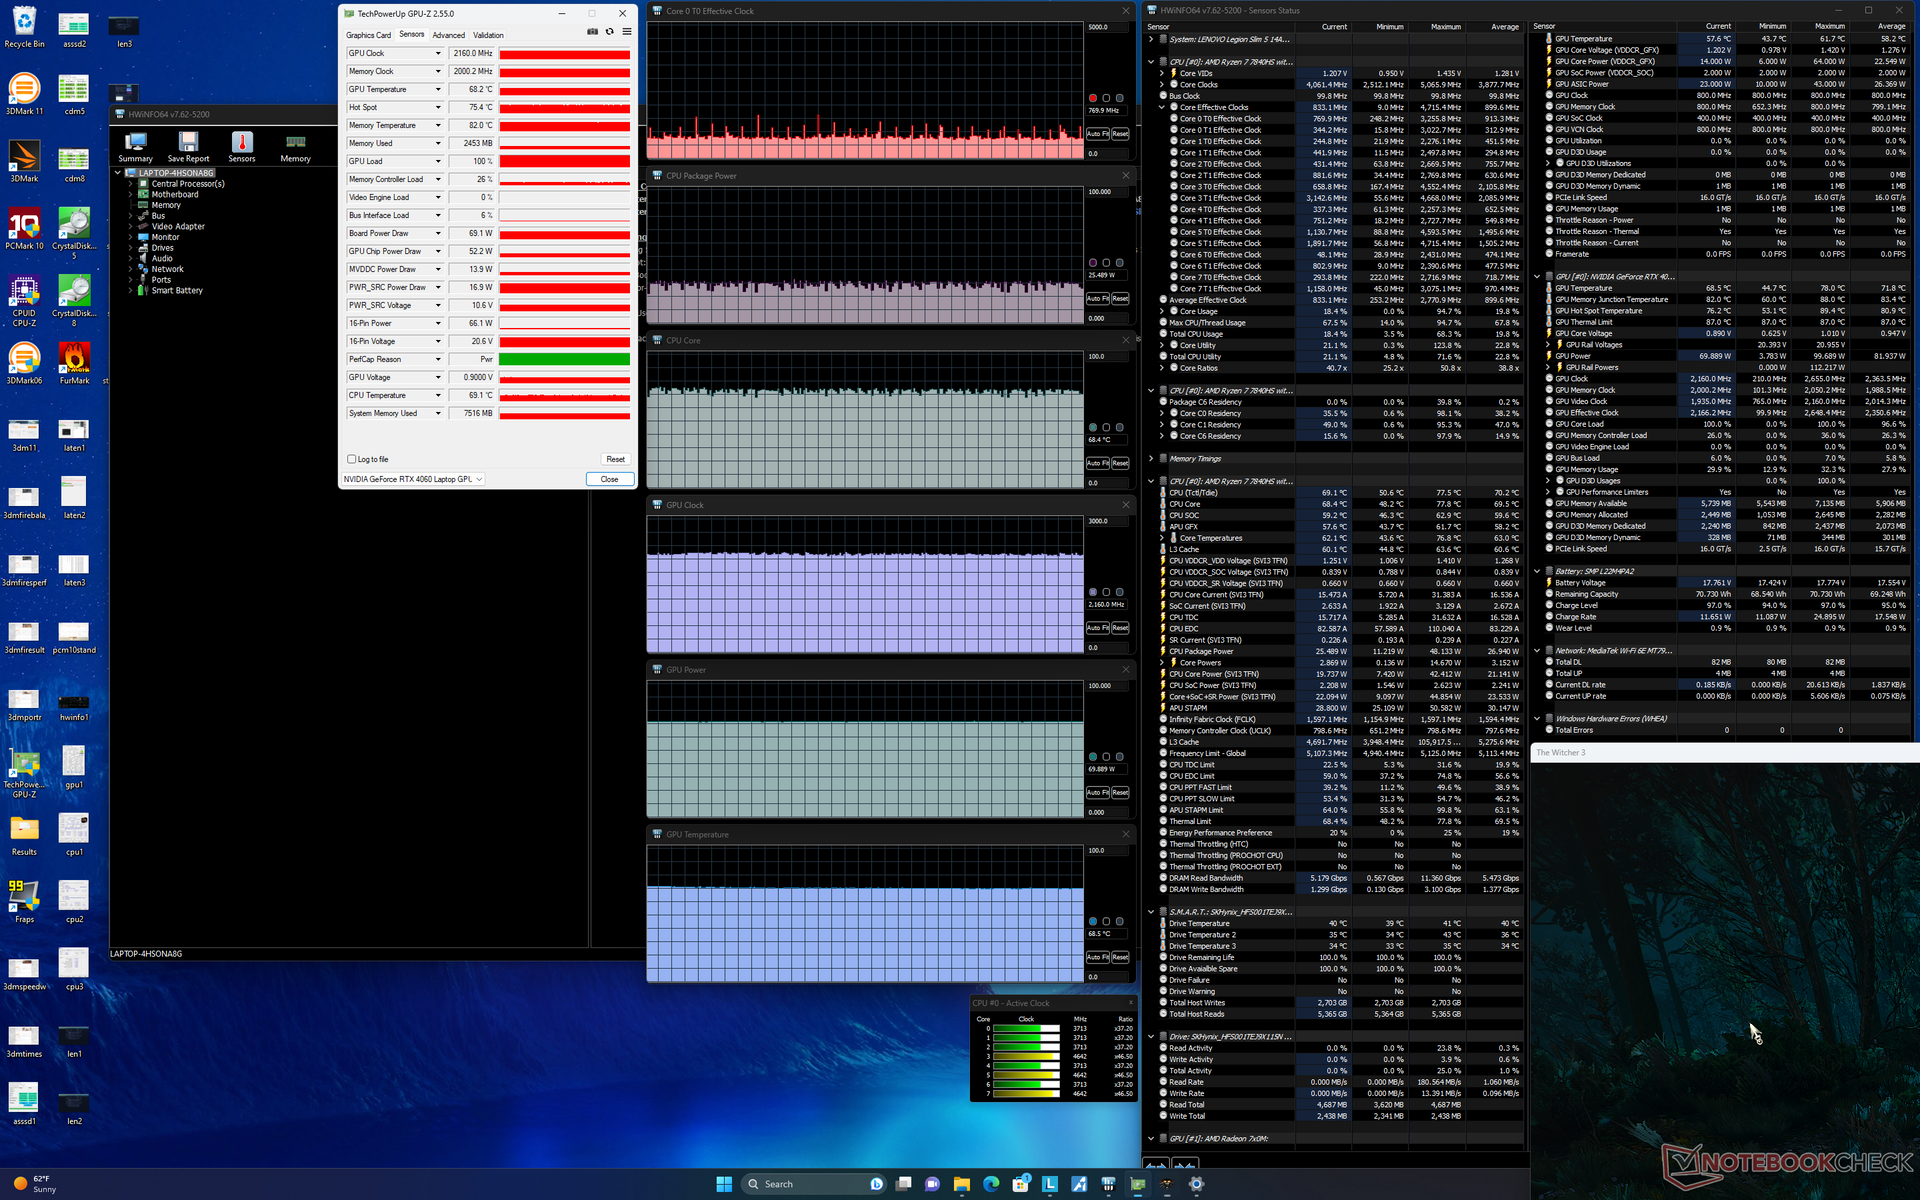
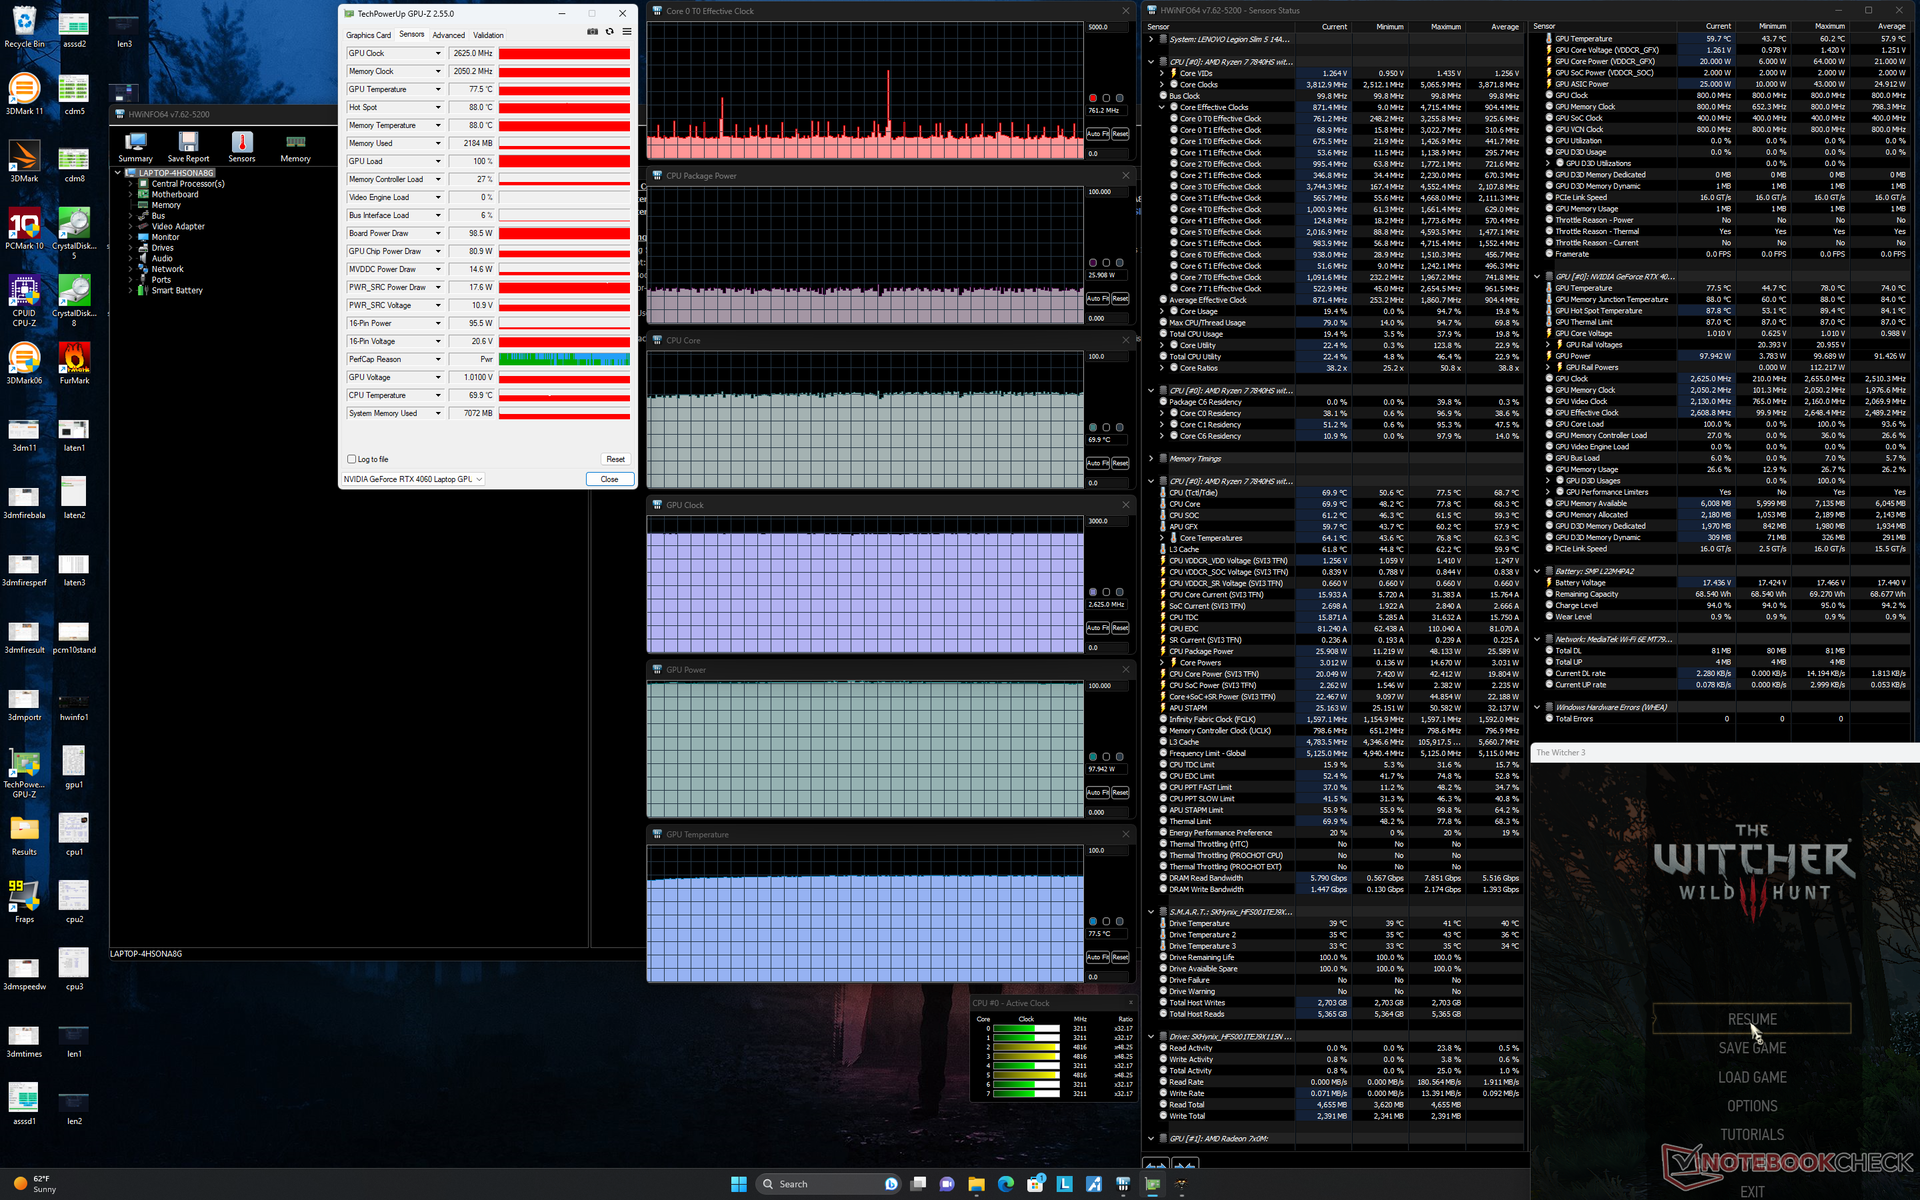
| Clock da CPU (GHz) | Clock da GPU (MHz) | Temperatura média da CPU (°C) | Temperatura média da GPU (°C) | |
| Sistema ocioso | ||||
| Estresse doPrime95 | 4.4 | -- | 100 | 50 |
| Estresse doPrime95 + FurMark | 4.5 | ~2460 | 100 | 68 |
| Witcher 3 Estresse(modo balanceado) | ~0,8 | 2160 | 69 | 69 |
| Witcher 3 Estresse(modo de desempenho) | ~0,8 | 2625 | 70 | 78 |
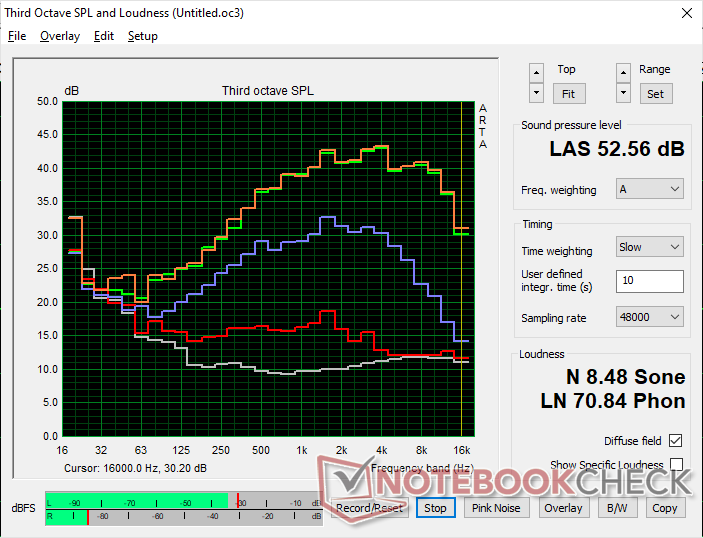
Alto-falantes
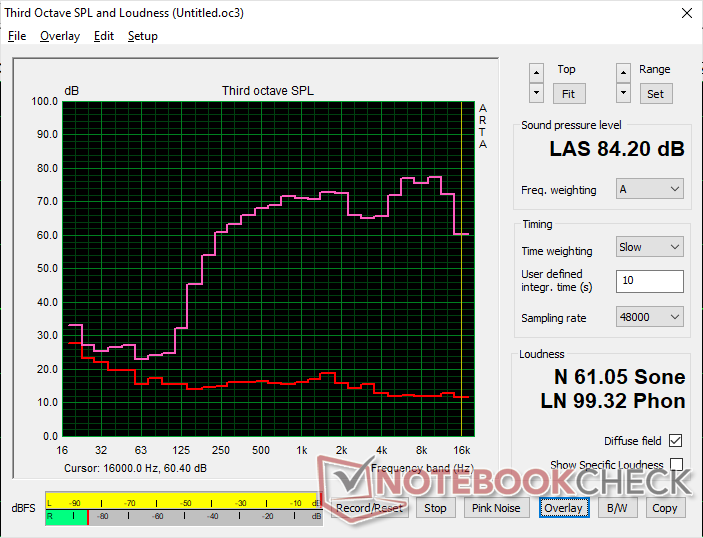
Lenovo Legion Slim 5 14APH8 análise de áudio
(+) | os alto-falantes podem tocar relativamente alto (###valor### dB)
Graves 100 - 315Hz
(-) | quase nenhum baixo - em média 21.4% menor que a mediana
(±) | a linearidade dos graves é média (12.4% delta para a frequência anterior)
Médios 400 - 2.000 Hz
(+) | médios equilibrados - apenas 2.7% longe da mediana
(+) | médios são lineares (2.9% delta para frequência anterior)
Altos 2 - 16 kHz
(±) | máximos mais altos - em média 5.3% maior que a mediana
(+) | os máximos são lineares (6.1% delta da frequência anterior)
Geral 100 - 16.000 Hz
(±) | a linearidade do som geral é média (16.9% diferença em relação à mediana)
Comparado com a mesma classe
» 44% de todos os dispositivos testados nesta classe foram melhores, 11% semelhantes, 44% piores
» O melhor teve um delta de 6%, a média foi 18%, o pior foi 132%
Comparado com todos os dispositivos testados
» 30% de todos os dispositivos testados foram melhores, 8% semelhantes, 62% piores
» O melhor teve um delta de 4%, a média foi 23%, o pior foi 134%
Apple MacBook Pro 16 2021 M1 Pro análise de áudio
(+) | os alto-falantes podem tocar relativamente alto (###valor### dB)
Graves 100 - 315Hz
(+) | bons graves - apenas 3.8% longe da mediana
(+) | o baixo é linear (5.2% delta para a frequência anterior)
Médios 400 - 2.000 Hz
(+) | médios equilibrados - apenas 1.3% longe da mediana
(+) | médios são lineares (2.1% delta para frequência anterior)
Altos 2 - 16 kHz
(+) | agudos equilibrados - apenas 1.9% longe da mediana
(+) | os máximos são lineares (2.7% delta da frequência anterior)
Geral 100 - 16.000 Hz
(+) | o som geral é linear (4.6% diferença em relação à mediana)
Comparado com a mesma classe
» 0% de todos os dispositivos testados nesta classe foram melhores, 0% semelhantes, 100% piores
» O melhor teve um delta de 5%, a média foi 17%, o pior foi 45%
Comparado com todos os dispositivos testados
» 0% de todos os dispositivos testados foram melhores, 0% semelhantes, 100% piores
» O melhor teve um delta de 4%, a média foi 23%, o pior foi 134%
Gerenciamento de energia - Alto desempenho por watt
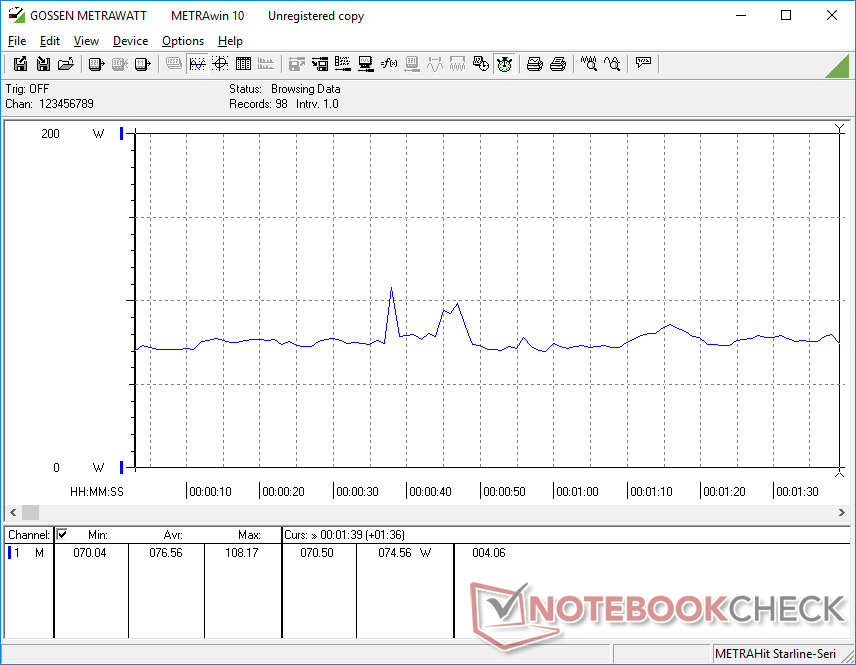
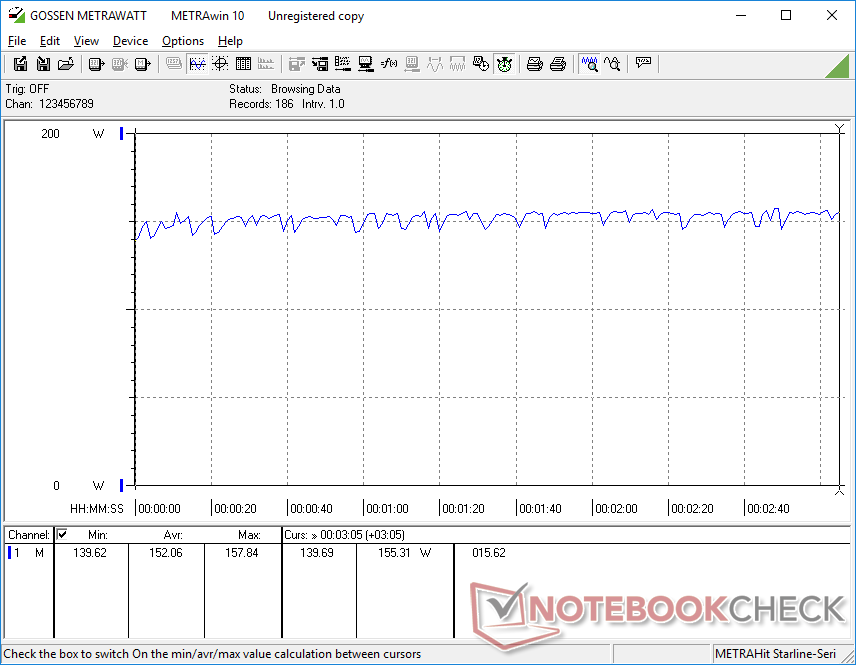
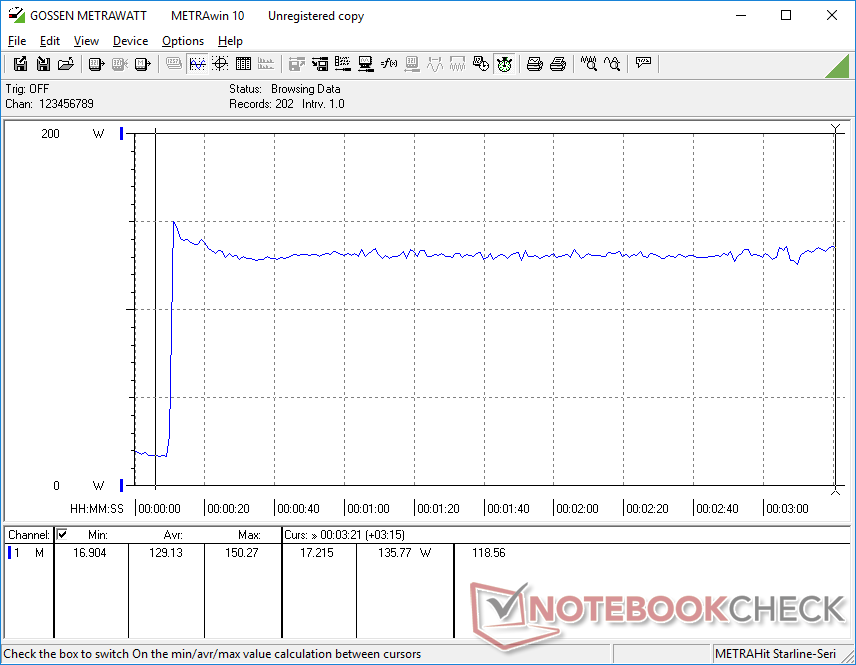
Consumo de energia
Nosso Legion Slim 5 14 consome um pouco menos energia do que o Blade 14, que vem com uma CPU Ryzen 9 mais rápida e uma GPU RTX 4070. O desempenho por watt continua excelente, especialmente quando comparado aos notebooks para jogos com tecnologia Intel e a mesma GPU RTX 4060, como oLegion Pro 5 16 que exige visivelmente mais energia, apesar de ter um desempenho apenas um pouco mais rápido.
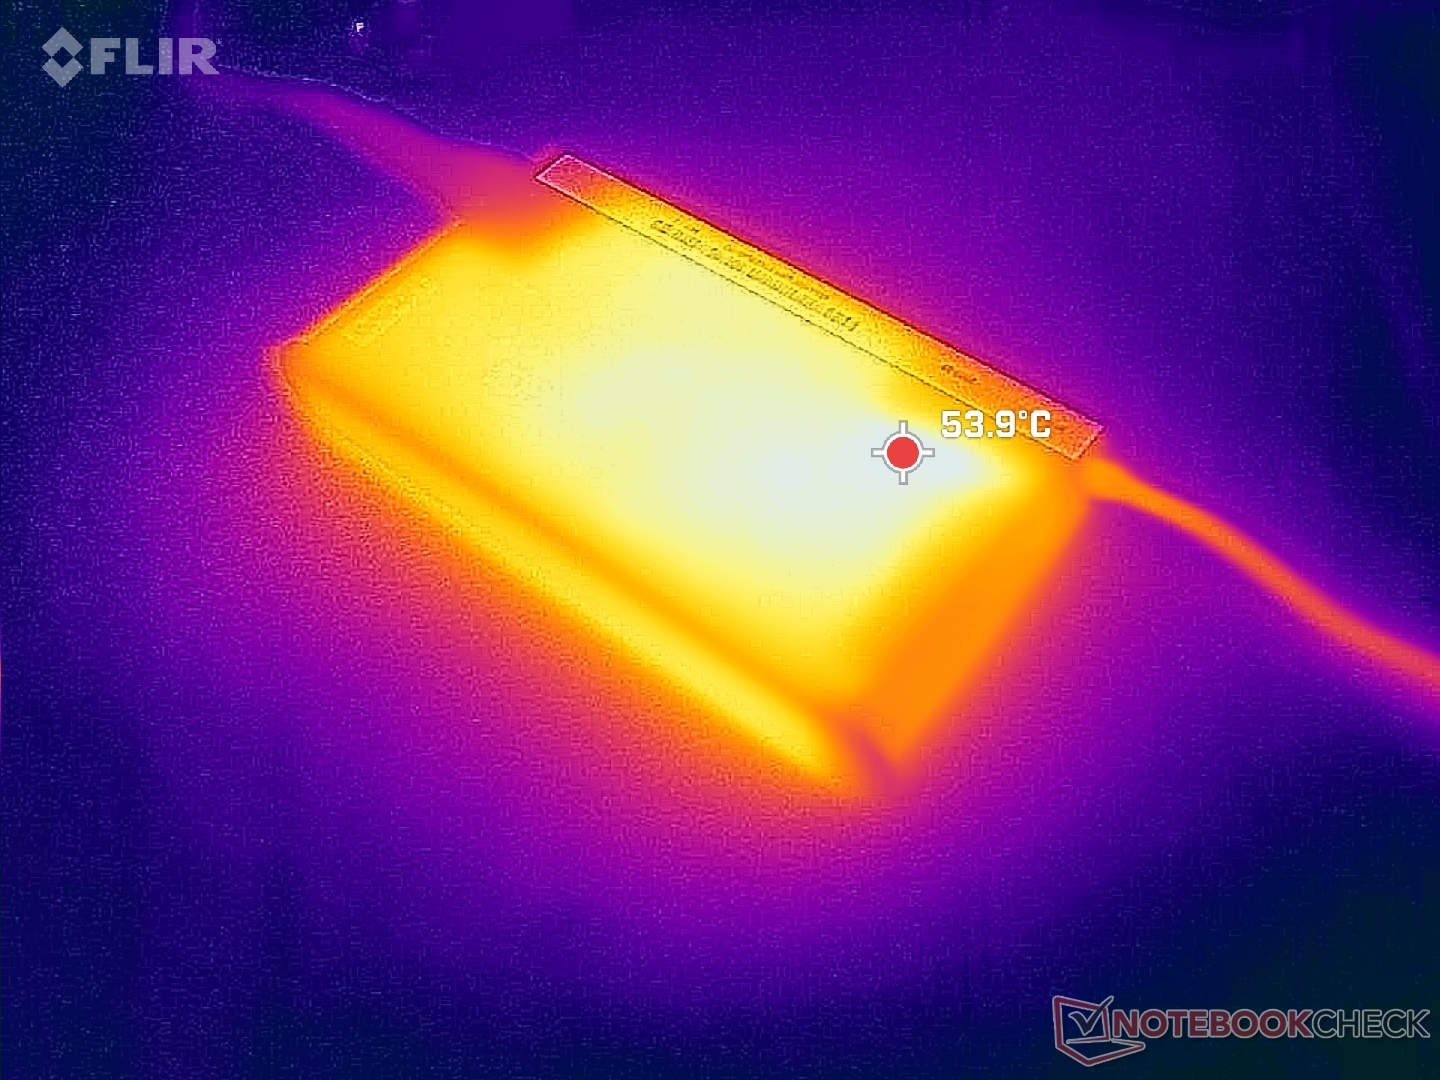
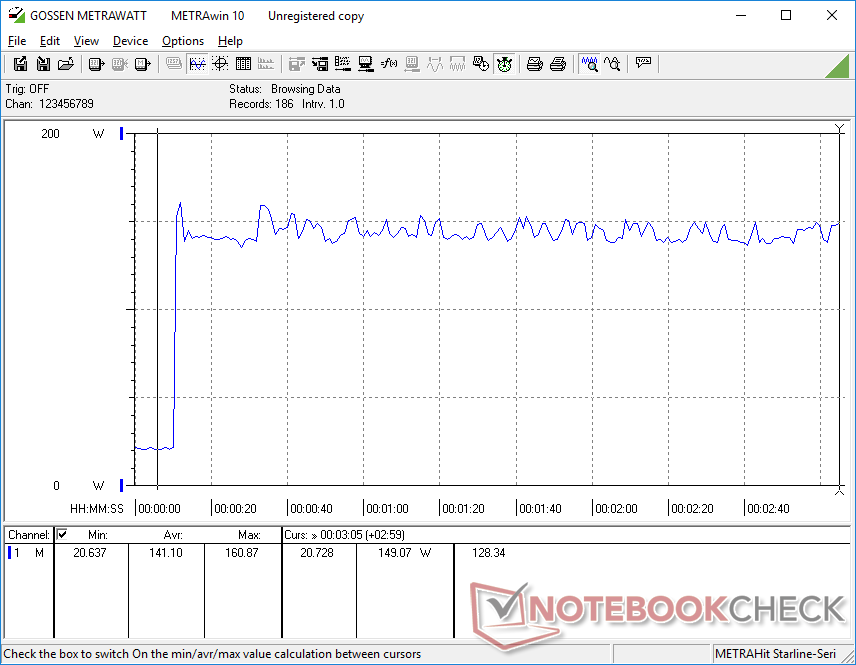
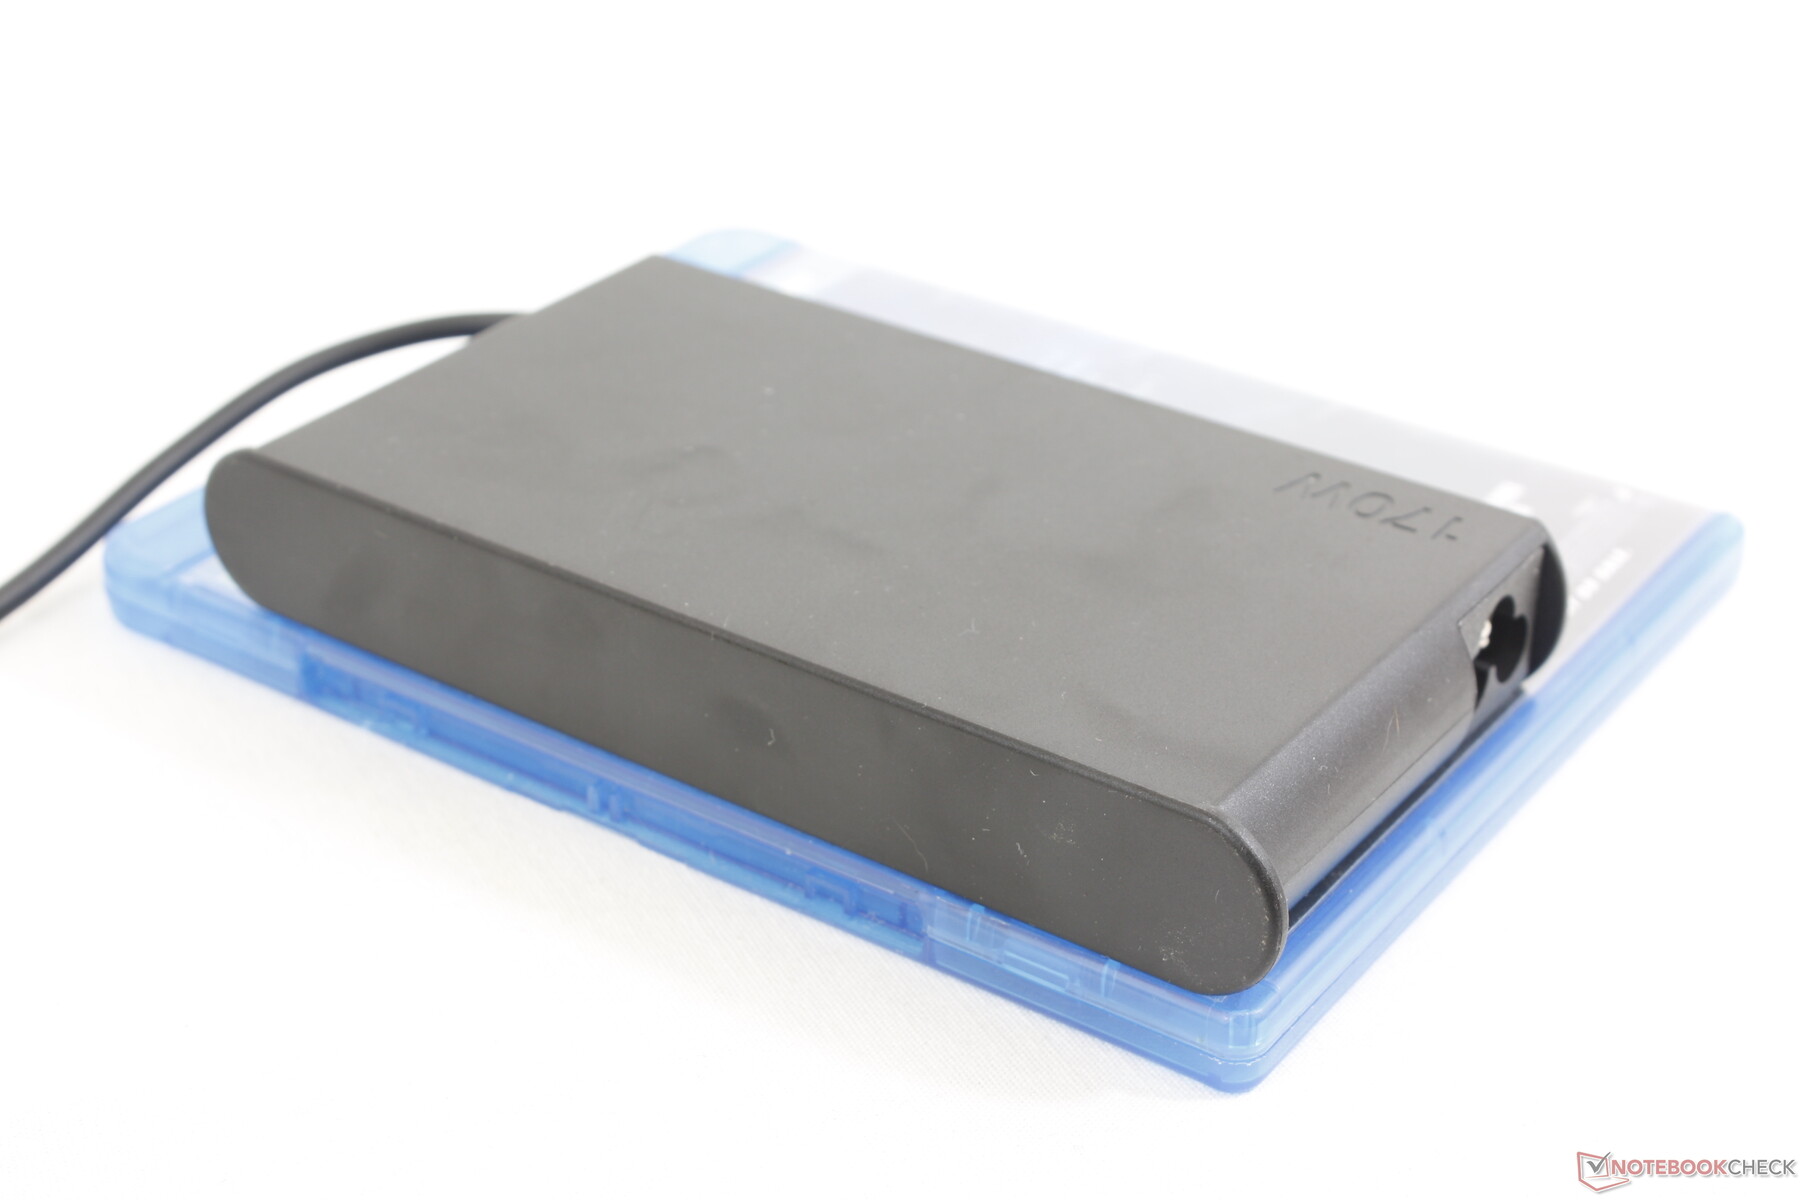
Conseguimos registrar um consumo máximo de 161 W com o adaptador CA de 170 W de tamanho médio (17 x 7,6 x 2,1 cm). Os concorrentes Blade 14 e Zephyrus G14 são fornecidos com adaptadores CA de 230 W e 240 W, maiores e mais capazes, respectivamente. O modelo da Lenovo carrega mais lentamente se estiver executando cargas exigentes simultaneamente.
| desligado | |
| Ocioso | |
| Carga |
|
Key:
min: | |
| Lenovo Legion Slim 5 14APH8 R7 7840HS, GeForce RTX 4060 Laptop GPU, SK Hynix HFS001TEJ9X115N, OLED, 2880x1600, 14.5" | Acer Predator Triton 14 PT14-51 i7-13700H, GeForce RTX 4050 Laptop GPU, Micron 3400 MTFDKBA512TFH 512GB, IPS, 2560x1600, 14" | Razer Blade 14 RTX 4070 R9 7940HS, GeForce RTX 4070 Laptop GPU, Samsung PM9A1 MZVL21T0HCLR, IPS, 2560x1600, 14" | Asus ROG Zephyrus G14 GA402XY R9 7940HS, GeForce RTX 4090 Laptop GPU, Samsung PM9A1 MZVL21T0HCLR, Mini-LED, 2560x1600, 14" | Alienware x14 i7 RTX 3060 i7-12700H, GeForce RTX 3060 Laptop GPU, WDC PC SN810 1TB, IPS, 1920x1080, 14" | Lenovo LOQ 15APH8 R7 7840HS, GeForce RTX 4050 Laptop GPU, Micron 2450 512GB MTFDKCD512TFK, IPS, 1920x1080, 15.6" | |
|---|---|---|---|---|---|---|
| Power Consumption | -31% | -71% | -19% | 1% | -35% | |
| Idle Minimum * (Watt) | 7.3 | 12 -64% | 19.5 -167% | 9.4 -29% | 7.9 -8% | 15 -105% |
| Idle Average * (Watt) | 9.6 | 14 -46% | 24.7 -157% | 14.2 -48% | 11.1 -16% | 17.7 -84% |
| Idle Maximum * (Watt) | 17.3 | 26 -50% | 27 -56% | 14.5 16% | 11.8 32% | 21.5 -24% |
| Load Average * (Watt) | 76.6 | 88 -15% | 83.2 -9% | 79 -3% | 107.4 -40% | 73.5 4% |
| Witcher 3 ultra * (Watt) | 152 | 114.9 24% | 165.8 -9% | 172 -13% | 111 27% | 138.6 9% |
| Load Maximum * (Watt) | 160.9 | 213 -32% | 204.5 -27% | 220.8 -37% | 140.4 13% | 176.5 -10% |
* ... menor é melhor
Power Consumption Witcher 3 / Stresstest
Power Consumption external Monitor
Duração da bateria
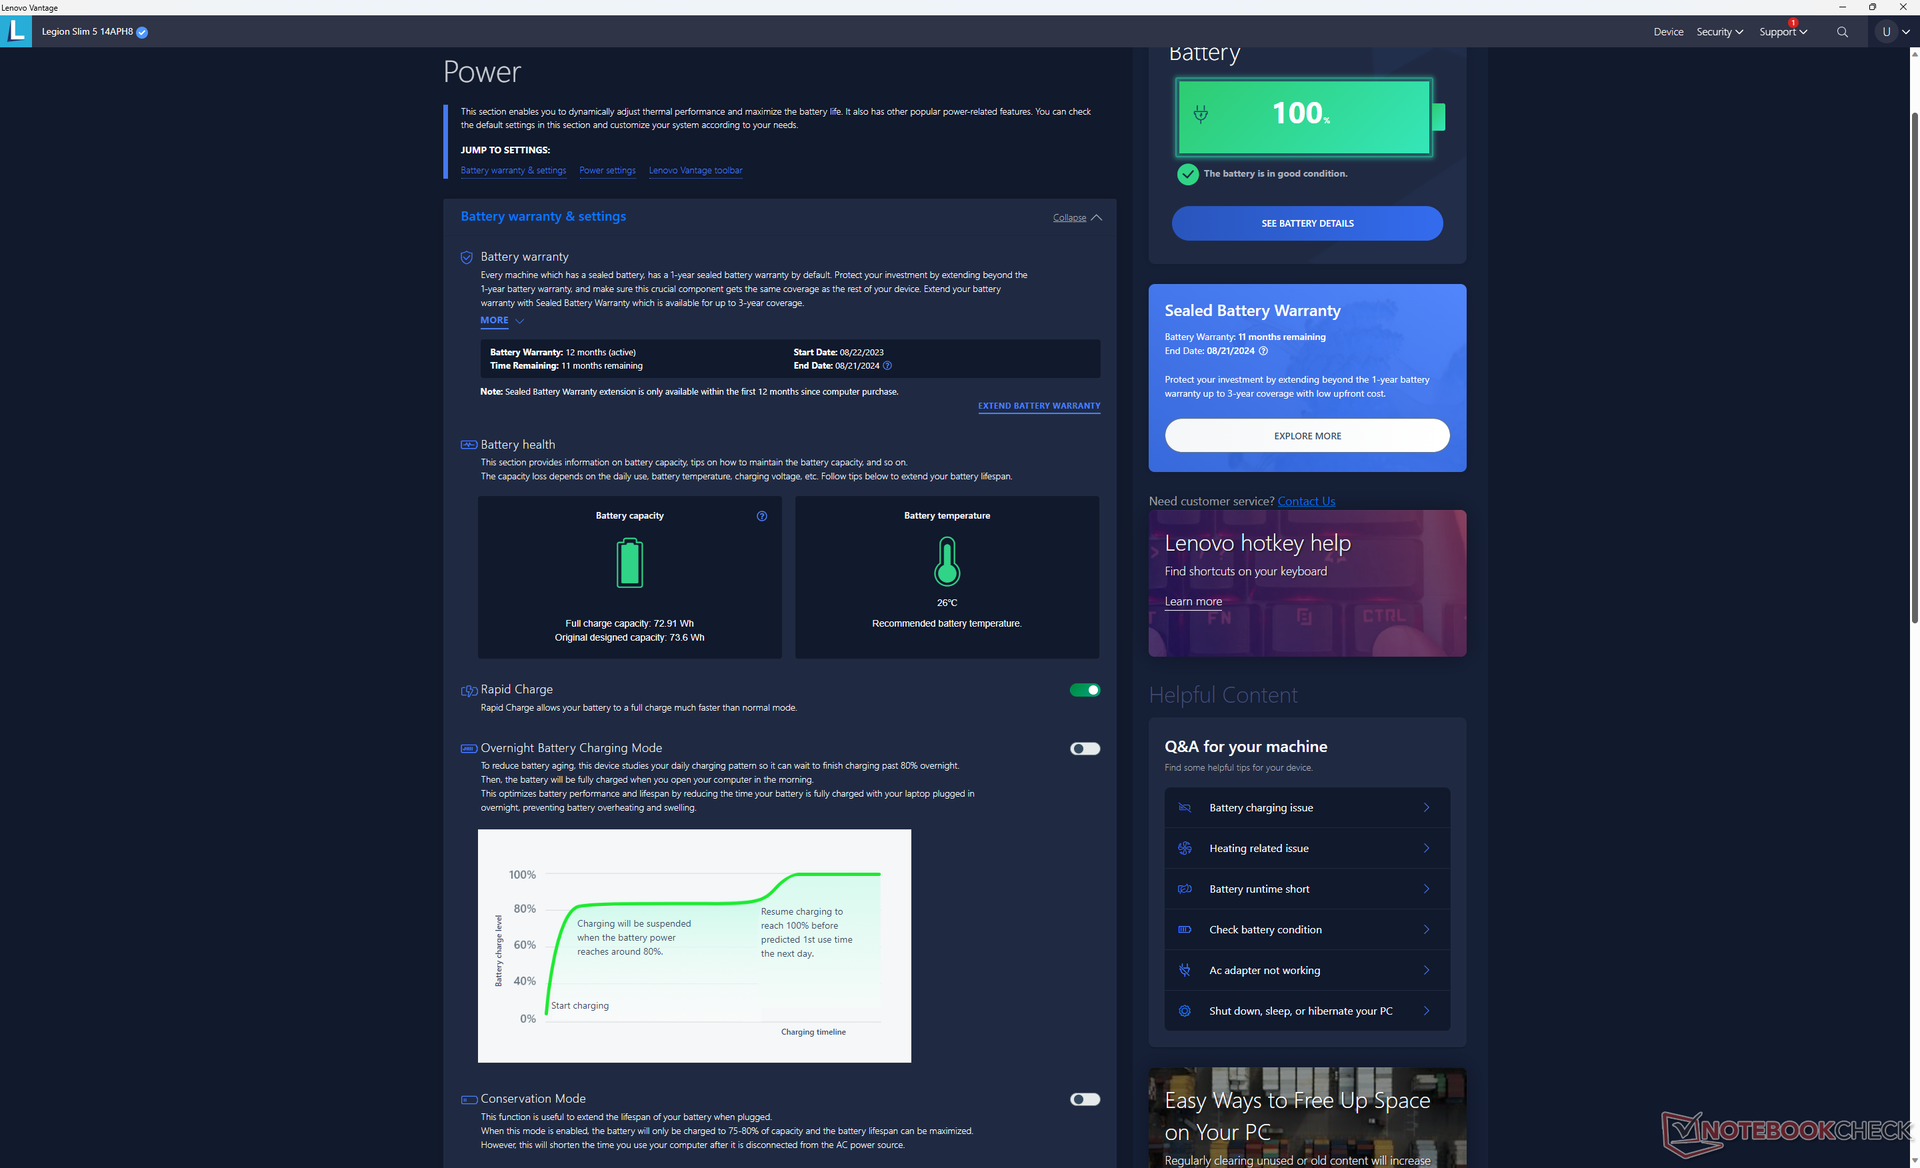
A capacidade da bateria é grande para um laptop de 14 polegadas, com 74 Wh. Os tempos de execução são subsequentemente longos, com quase 7,5 horas de navegação no mundo real no modo balanceado, para ser mais semelhante ao Zephyrus G14.
O carregamento do estado vazio até a capacidade total é muito rápido, com apenas 45 minutos quando o Lenovo Rapid Charge está ativado. A maioria dos outros laptops leva o dobro do tempo ou até mais para carregar totalmente. O sistema também pode ser carregado via USB-C, mas a Lenovo recomenda o carregamento com um adaptador CA USB-C de 140 W opcional da marca Lenovo, pois a maioria dos outros adaptadores não é compatível.
| Lenovo Legion Slim 5 14APH8 R7 7840HS, GeForce RTX 4060 Laptop GPU, 73.6 Wh | Acer Predator Triton 14 PT14-51 i7-13700H, GeForce RTX 4050 Laptop GPU, 76.3 Wh | Razer Blade 14 RTX 4070 R9 7940HS, GeForce RTX 4070 Laptop GPU, 68 Wh | Asus ROG Zephyrus G14 GA402XY R9 7940HS, GeForce RTX 4090 Laptop GPU, 76 Wh | Alienware x14 i7 RTX 3060 i7-12700H, GeForce RTX 3060 Laptop GPU, 80 Wh | Lenovo LOQ 15APH8 R7 7840HS, GeForce RTX 4050 Laptop GPU, 60 Wh | |
|---|---|---|---|---|---|---|
| Duração da bateria | 4% | -19% | -12% | -10% | -8% | |
| Reader / Idle (h) | 10.5 | 11.2 7% | 8.6 -18% | 9.8 -7% | ||
| WiFi v1.3 (h) | 7.5 | 5 -33% | 6.2 -17% | 7.5 0% | 8.9 19% | 7.4 -1% |
| Load (h) | 1.3 | 1.8 38% | 1 -23% | 1 -23% | 0.8 -38% | 1.1 -15% |
| H.264 (h) | 9 | 7.2 | 9.4 | |||
| Witcher 3 ultra (h) | 0.8 |
Pro
Contra
Veredicto - Não é bom apenas para jogos
Alguns aspectos ajudam o Legion Slim 5 14 a se destacar da concorrência. Em primeiro lugar, seu design semelhante ao do ThinkBook e o exterior sem RGB proporcionam uma estética mais profissional do que o estilo agressivo do Acer Predator Triton ou do Zephyrus G14. Os usuários que gostam de ter um laptop para jogos e reuniões de negócios podem, portanto, preferir o design do Legion Slim 5 14 a outros. Em segundo lugar, sua tela OLED de 120 Hz supera facilmente as telas IPS de outros notebooks para jogos de 14 polegadas em termos de níveis de preto, tempos de resposta e qualidade de imagem.
O primeiro laptop para jogos de 14 polegadas da Lenovo Legion teve um bom começo com sua tela OLED 2.8K de 120 Hz. A falta do G-Sync e da luz de fundo RGB do teclado, no entanto, são omissões estranhas em um laptop para jogos que custa bem mais de mil dólares.
Há várias desvantagens das quais os possíveis compradores devem estar cientes. A mais notória é a falta de suporte ao G-Sync para a tela OLED, o que significa que é recomendável ativar o v-sync ou buscar um FPS constante de 120 FPS com configurações reduzidas para limitar o desgaste da tela. O próximo passo é a ausência de iluminação RGB no teclado e de opções de GPU superiores à RTX 4060. Embora o RTX 4060 ainda seja muito bom, a Lenovo está perdendo os entusiastas que podem querer o RTX 4070 ou mais rápido. O Asus Zephyrus G14 e o Razer Blade 14 são menores e vêm com RAM atualizável e opções de GPU mais rápidas.
O ruído alto do ventilador e as altas temperaturas do núcleo são outras desvantagens notáveis, mas essas características são compartilhadas por outros notebooks para jogos de 14 polegadas.
O Legion Slim 5 14 é melhor como um poderoso companheiro de viagem para jogos, processamento gráfico e edição. Para fins de jogos puros, no entanto, as alternativas da Razer, Asus ou Alienware tendem a oferecer GPUs mais avançadas e recursos auxiliares que os jogadores hardcore podem apreciar.
Preço e disponibilidade
Atualmente, a Lenovo está enviando seu modelo Legion Slim 5 14 Gen 8 a partir de US$ 1440 para a configuração básica do Ryzen 7 e RTX 4050, até mais de US$ 1700 se configurado com o Ryzen 9 e RTX 4060.
Lenovo Legion Slim 5 14APH8
- 09/25/2023 v7 (old)
Allen Ngo
Transparência
A seleção dos dispositivos a serem analisados é feita pela nossa equipe editorial. A amostra de teste foi fornecida ao autor como empréstimo pelo fabricante ou varejista para fins desta revisão. O credor não teve influência nesta revisão, nem o fabricante recebeu uma cópia desta revisão antes da publicação. Não houve obrigação de publicar esta revisão. Como empresa de mídia independente, a Notebookcheck não está sujeita à autoridade de fabricantes, varejistas ou editores.
É assim que o Notebookcheck está testando
Todos os anos, o Notebookcheck analisa de forma independente centenas de laptops e smartphones usando procedimentos padronizados para garantir que todos os resultados sejam comparáveis. Desenvolvemos continuamente nossos métodos de teste há cerca de 20 anos e definimos padrões da indústria no processo. Em nossos laboratórios de teste, equipamentos de medição de alta qualidade são utilizados por técnicos e editores experientes. Esses testes envolvem um processo de validação em vários estágios. Nosso complexo sistema de classificação é baseado em centenas de medições e benchmarks bem fundamentados, o que mantém a objetividade.Price comparison

