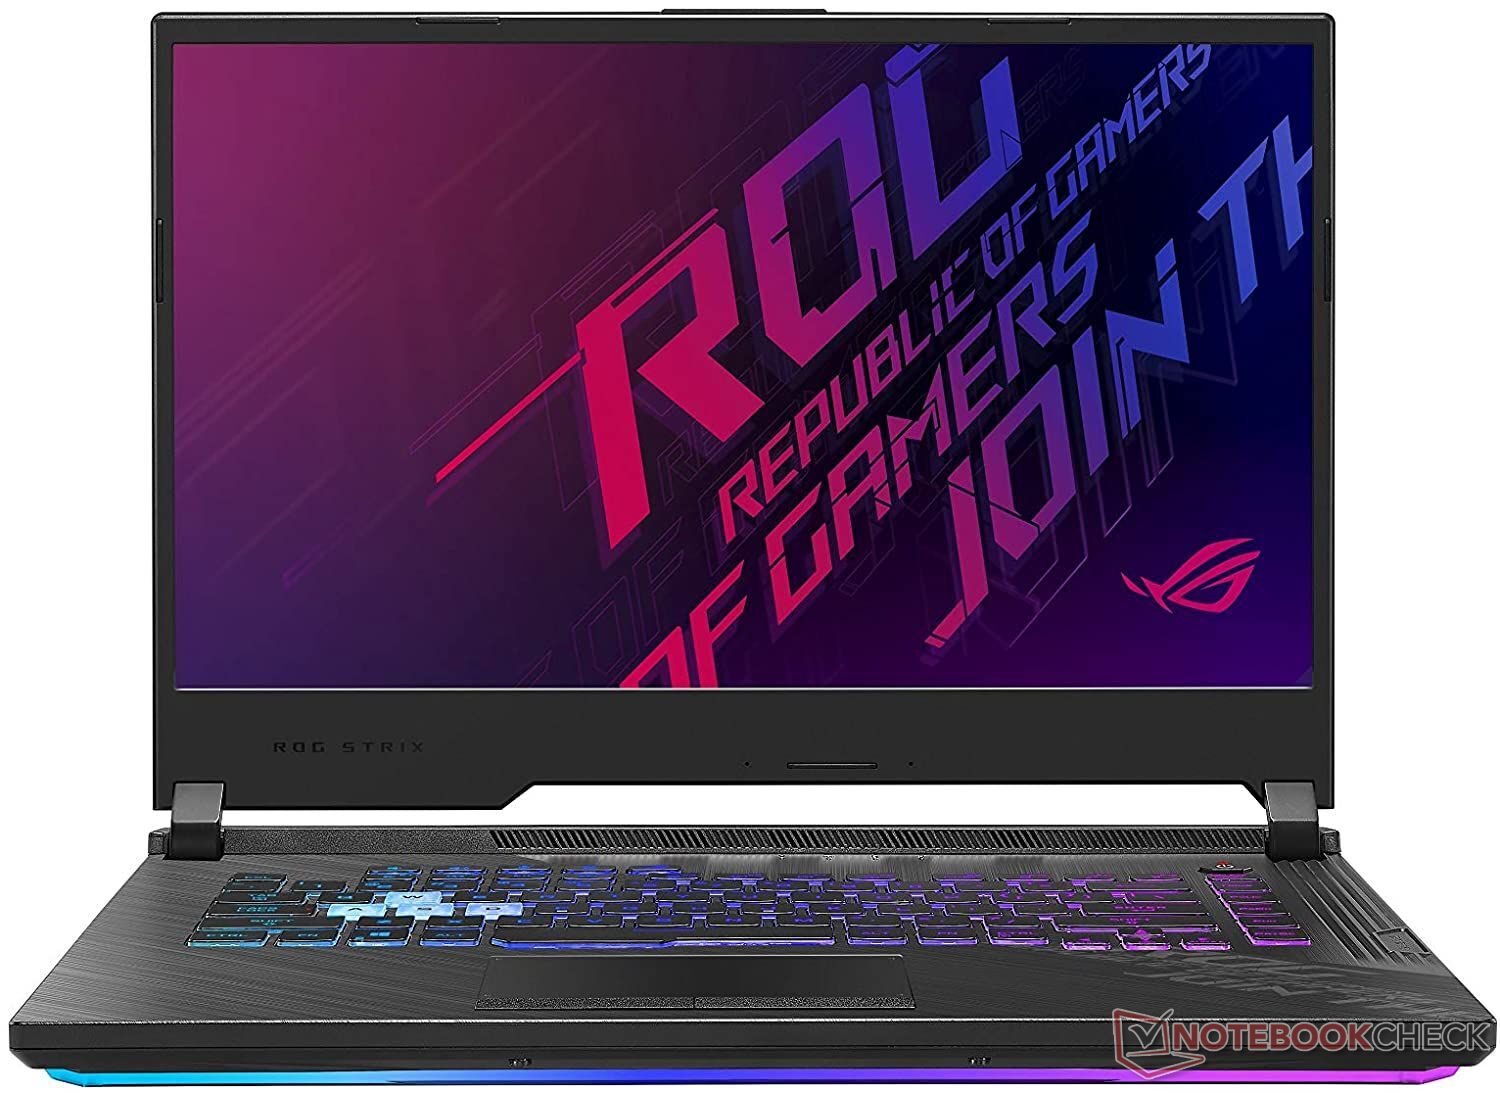
Asus ROG Strix G15 G512LW Revisão de Laptop: Muito melhor que o G512LI
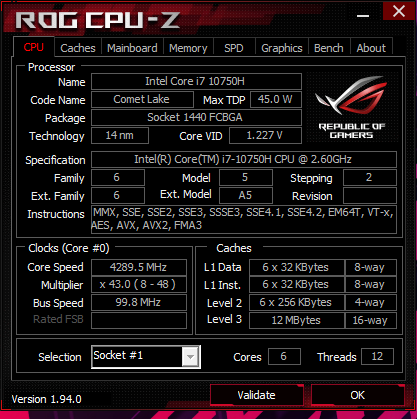
Enquanto a Asus ROG Strix G15 G512LI vem com o display GeForce GTX 1650 Ti e 144 Hz, a Asus ROG Strix G15 G512LW vem com o muito mais potente GeForce RTX 2070 e um display ainda mais rápido de 240 Hz. Ambos os modelos compartilham o mesmo chassi, mas com algumas diferenças importantes que notaremos nesta revisão.
Recomendamos verificar nossa revisão sobre a G512LI para saber mais sobre as características físicas da G512LW, já que quase todos os nossos comentários existentes ainda se aplicam. Esta página explorará o desempenho e mostrará as diferenças entre o G512LW e o G512LI e outros laptops de 15,6 polegadas como o MSI GP65 ou o Alienware m15 R3. Nossa configuração pode ser encontrada no Computer Upgrade King por cerca de $1500 USD e acima dependendo da memória RAM e armazenamento
Mais análises do Asus:
Avaliação | Data | Modelo | Peso | Altura | Size | Resolução | Preço |
|---|---|---|---|---|---|---|---|
| 83.4 % v7 (old) | 11/2020 | Asus ROG Strix G15 G512LW i7-10750H, GeForce RTX 2070 Mobile | 2.3 kg | 25.8 mm | 15.60" | 1920x1080 | |
| 80.8 % v7 (old) | 07/2020 | Asus ROG Strix G15 G512LI i7-10750H, GeForce GTX 1650 Ti Mobile | 2.3 kg | 25.8 mm | 15.60" | 1920x1080 | |
| 86.9 % v7 (old) | 08/2020 | Razer Blade 15 RTX 2070 Super Max-Q i7-10875H, GeForce RTX 2070 Super Max-Q | 2.1 kg | 17.8 mm | 15.60" | 1920x1080 | |
| 83.2 % v7 (old) | 05/2020 | MSI GP65 10SFK-047US i7-10750H, GeForce RTX 2070 Mobile | 2.3 kg | 27.5 mm | 15.60" | 1920x1080 | |
| 84.4 % v7 (old) | 07/2020 | Asus ROG Strix Scar 15 G532LWS i9-10980HK, GeForce RTX 2070 Super Mobile | 2.4 kg | 24.9 mm | 15.60" | 1920x1080 | |
| 84.8 % v7 (old) | 08/2020 | Alienware m15 R3 P87F i7-10750H, GeForce RTX 2070 Mobile | 2.3 kg | 19.9 mm | 15.60" | 1920x1080 |
Caso
Comunicação
O Intel AX201 vem como padrão para conectividade Wi-Fi 6 e Bluetooth 5.1. As taxas médias de transmissão são estranhamente mais lentas desta vez a 790 Mbps quando conectado ao nosso roteador Netgear RAX200. Os resultados não melhorariam mesmo após a reinicialização de nosso roteador e laptop.
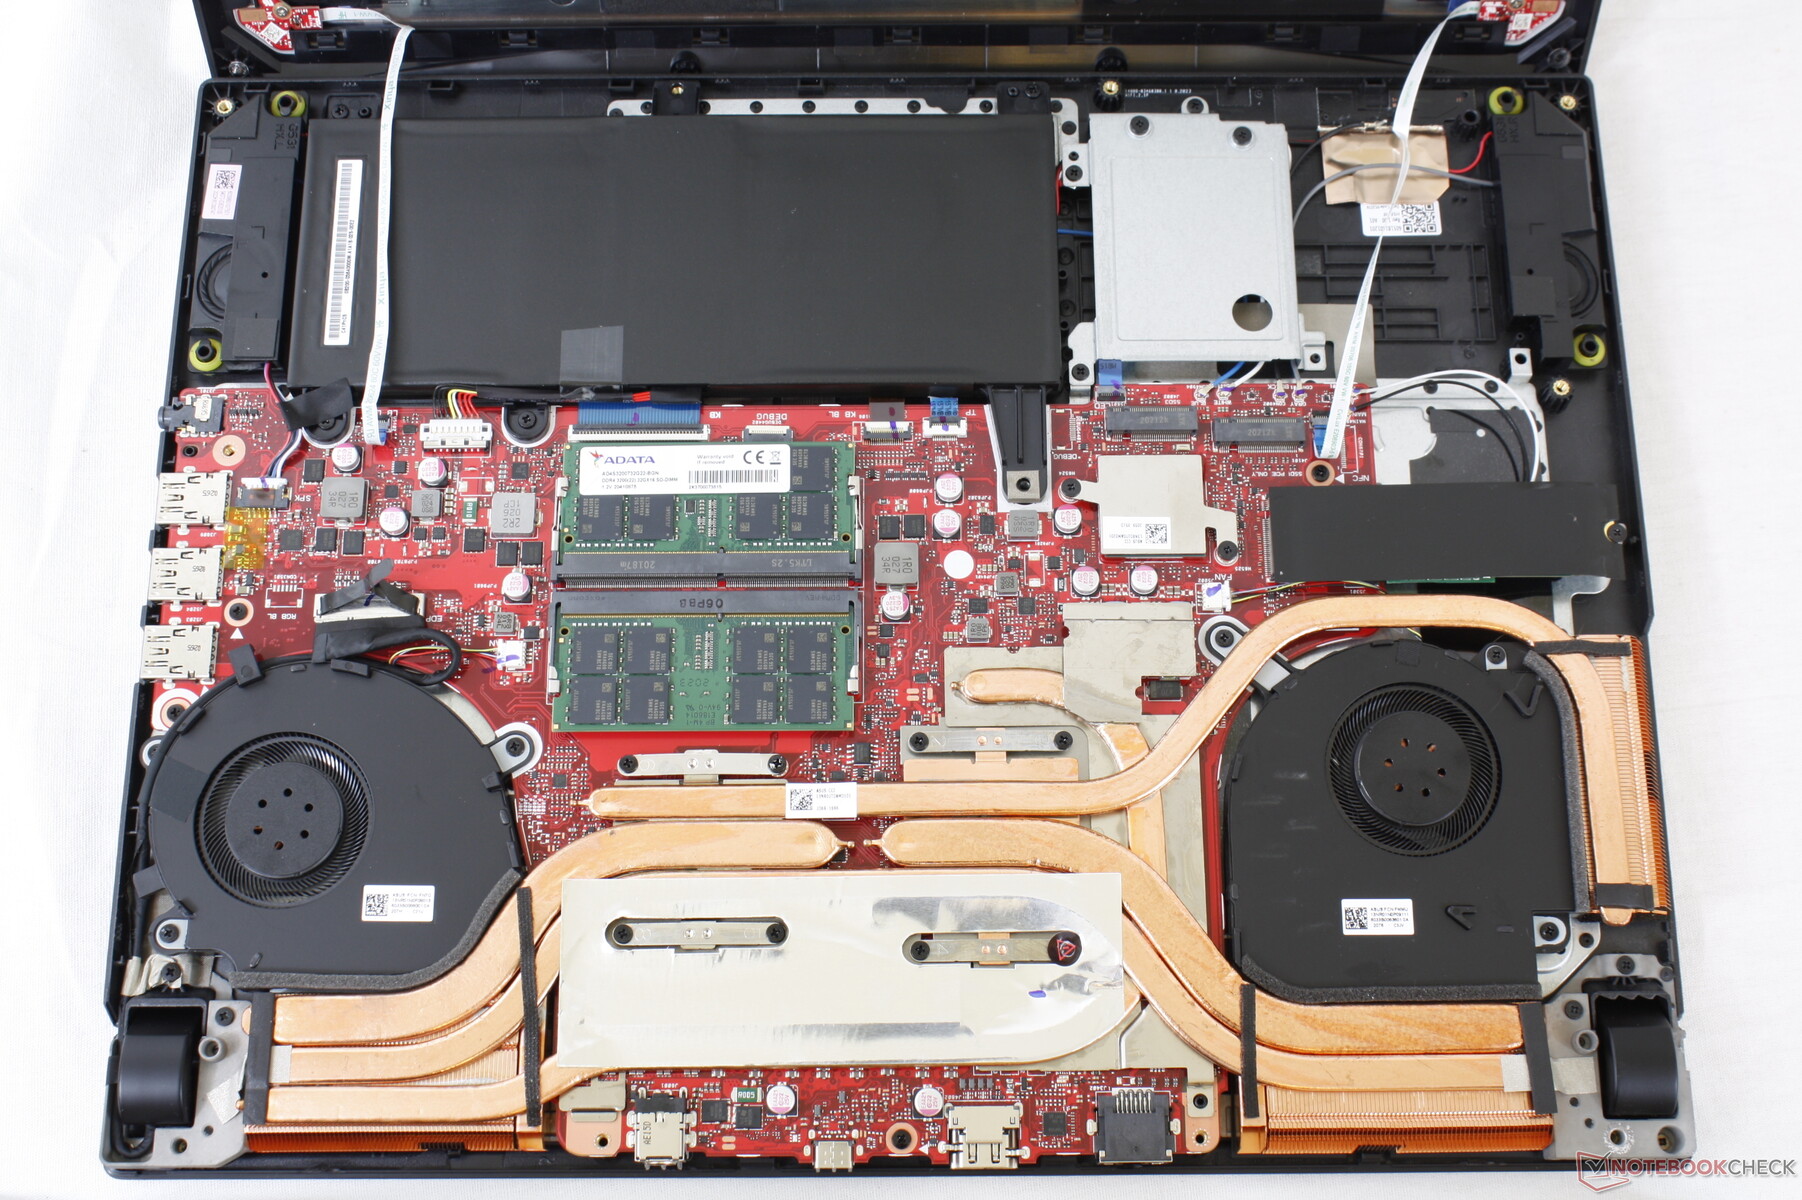
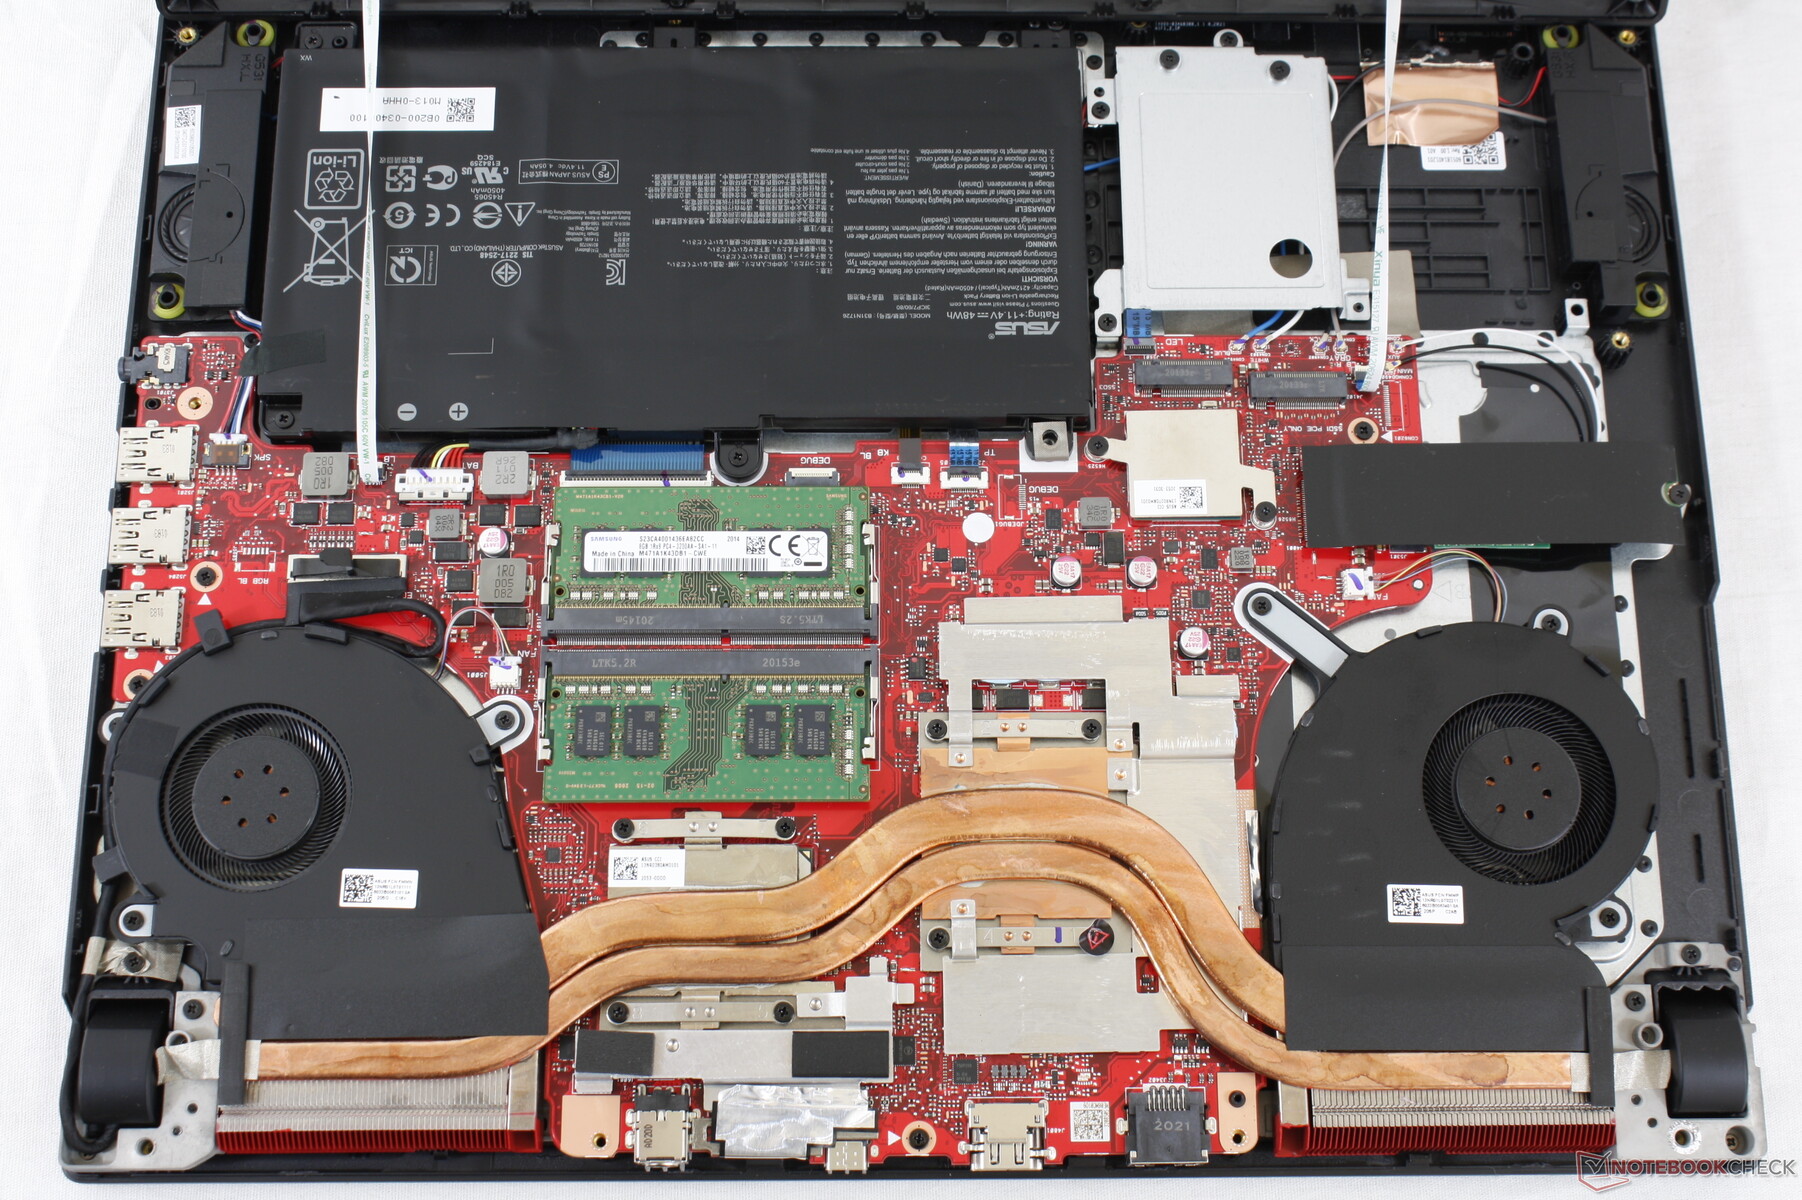
Manutenção
Mostrar
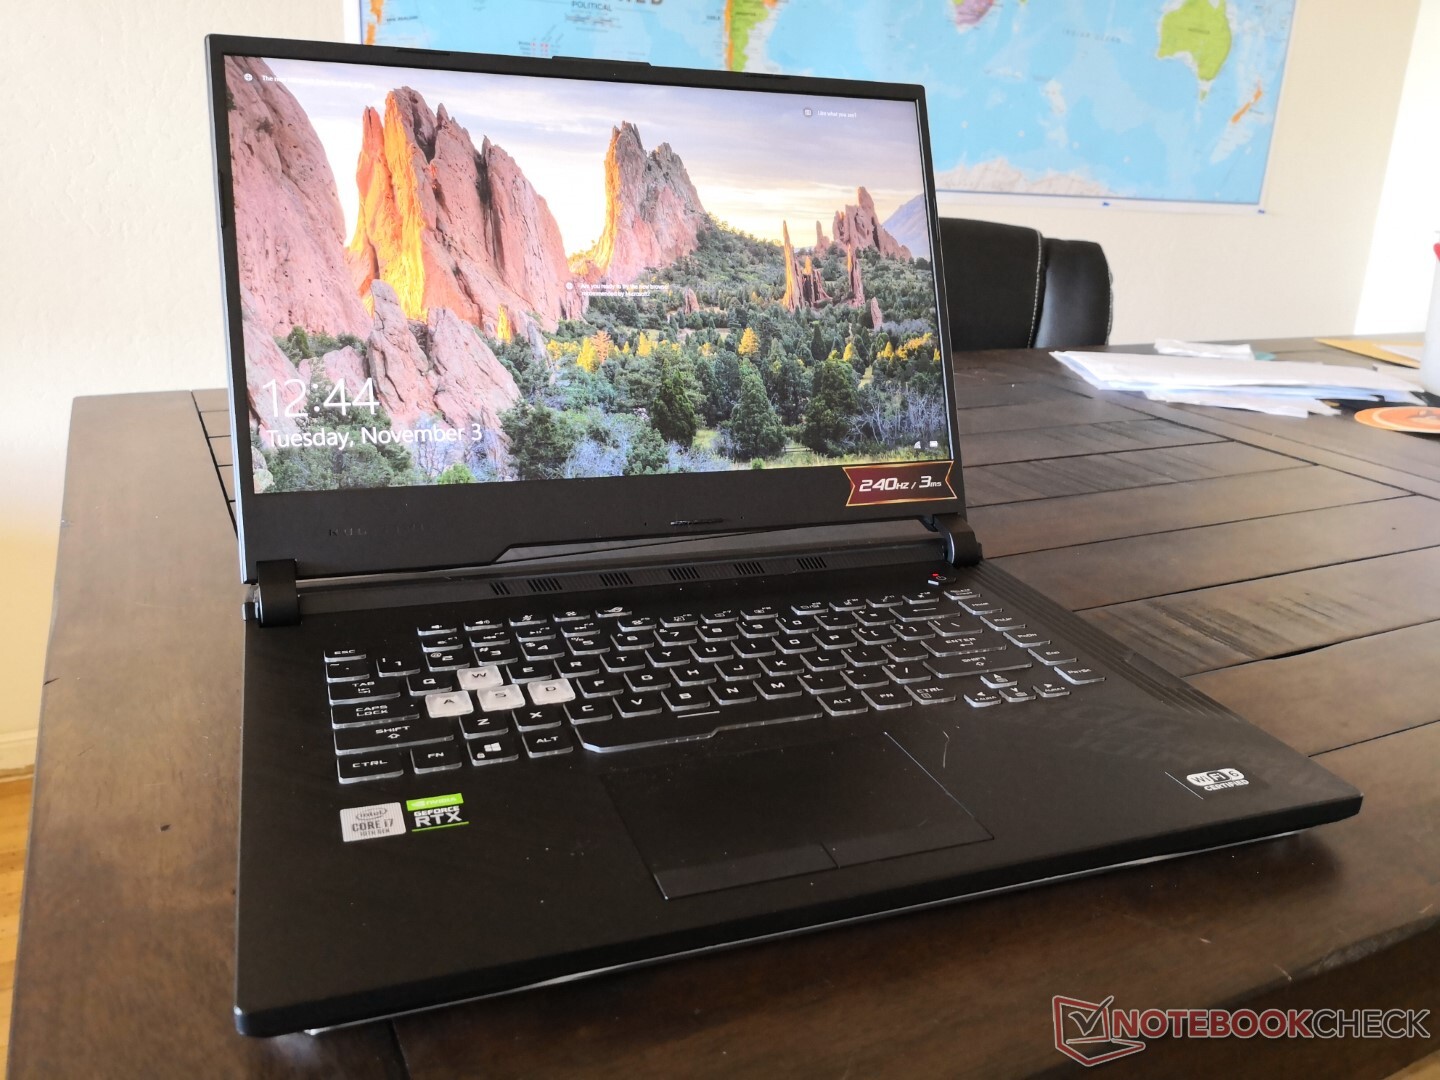
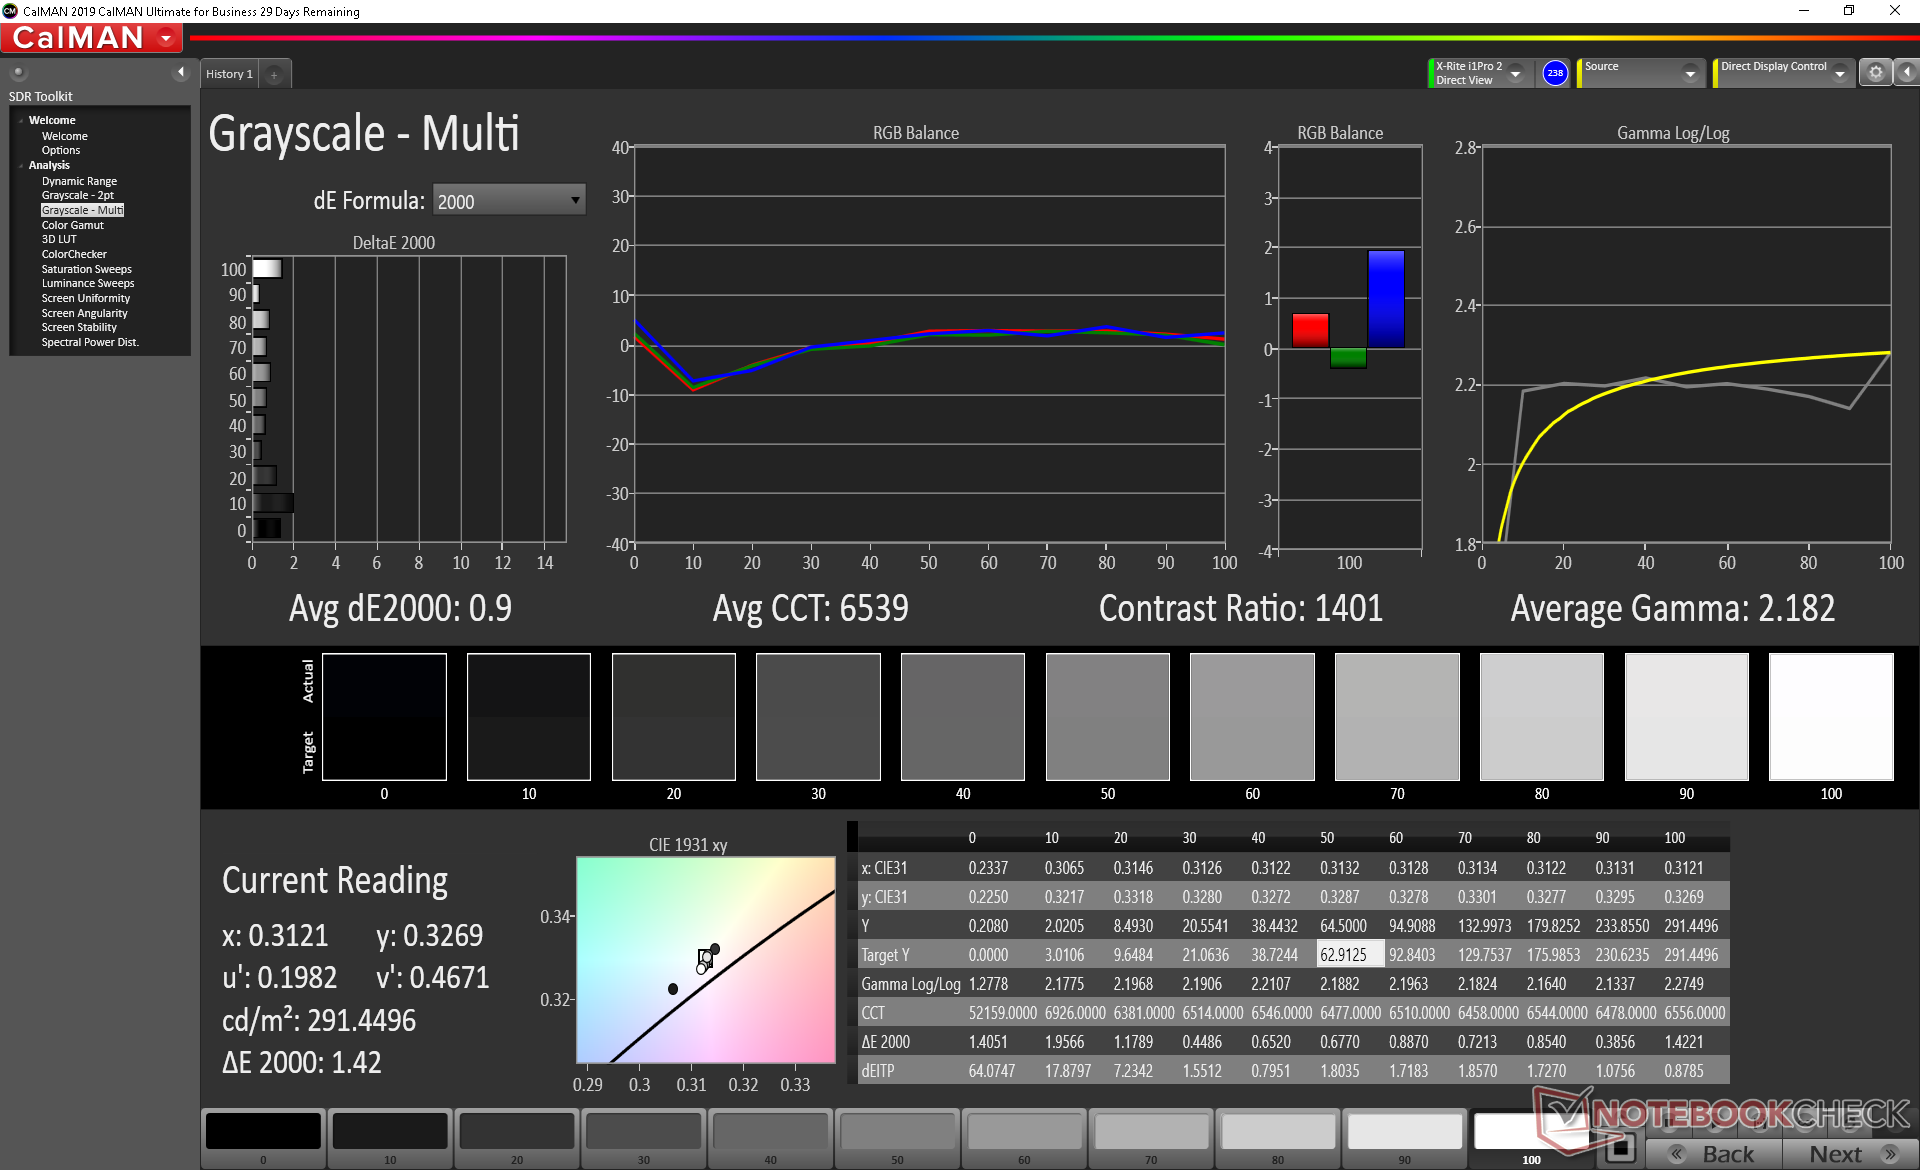
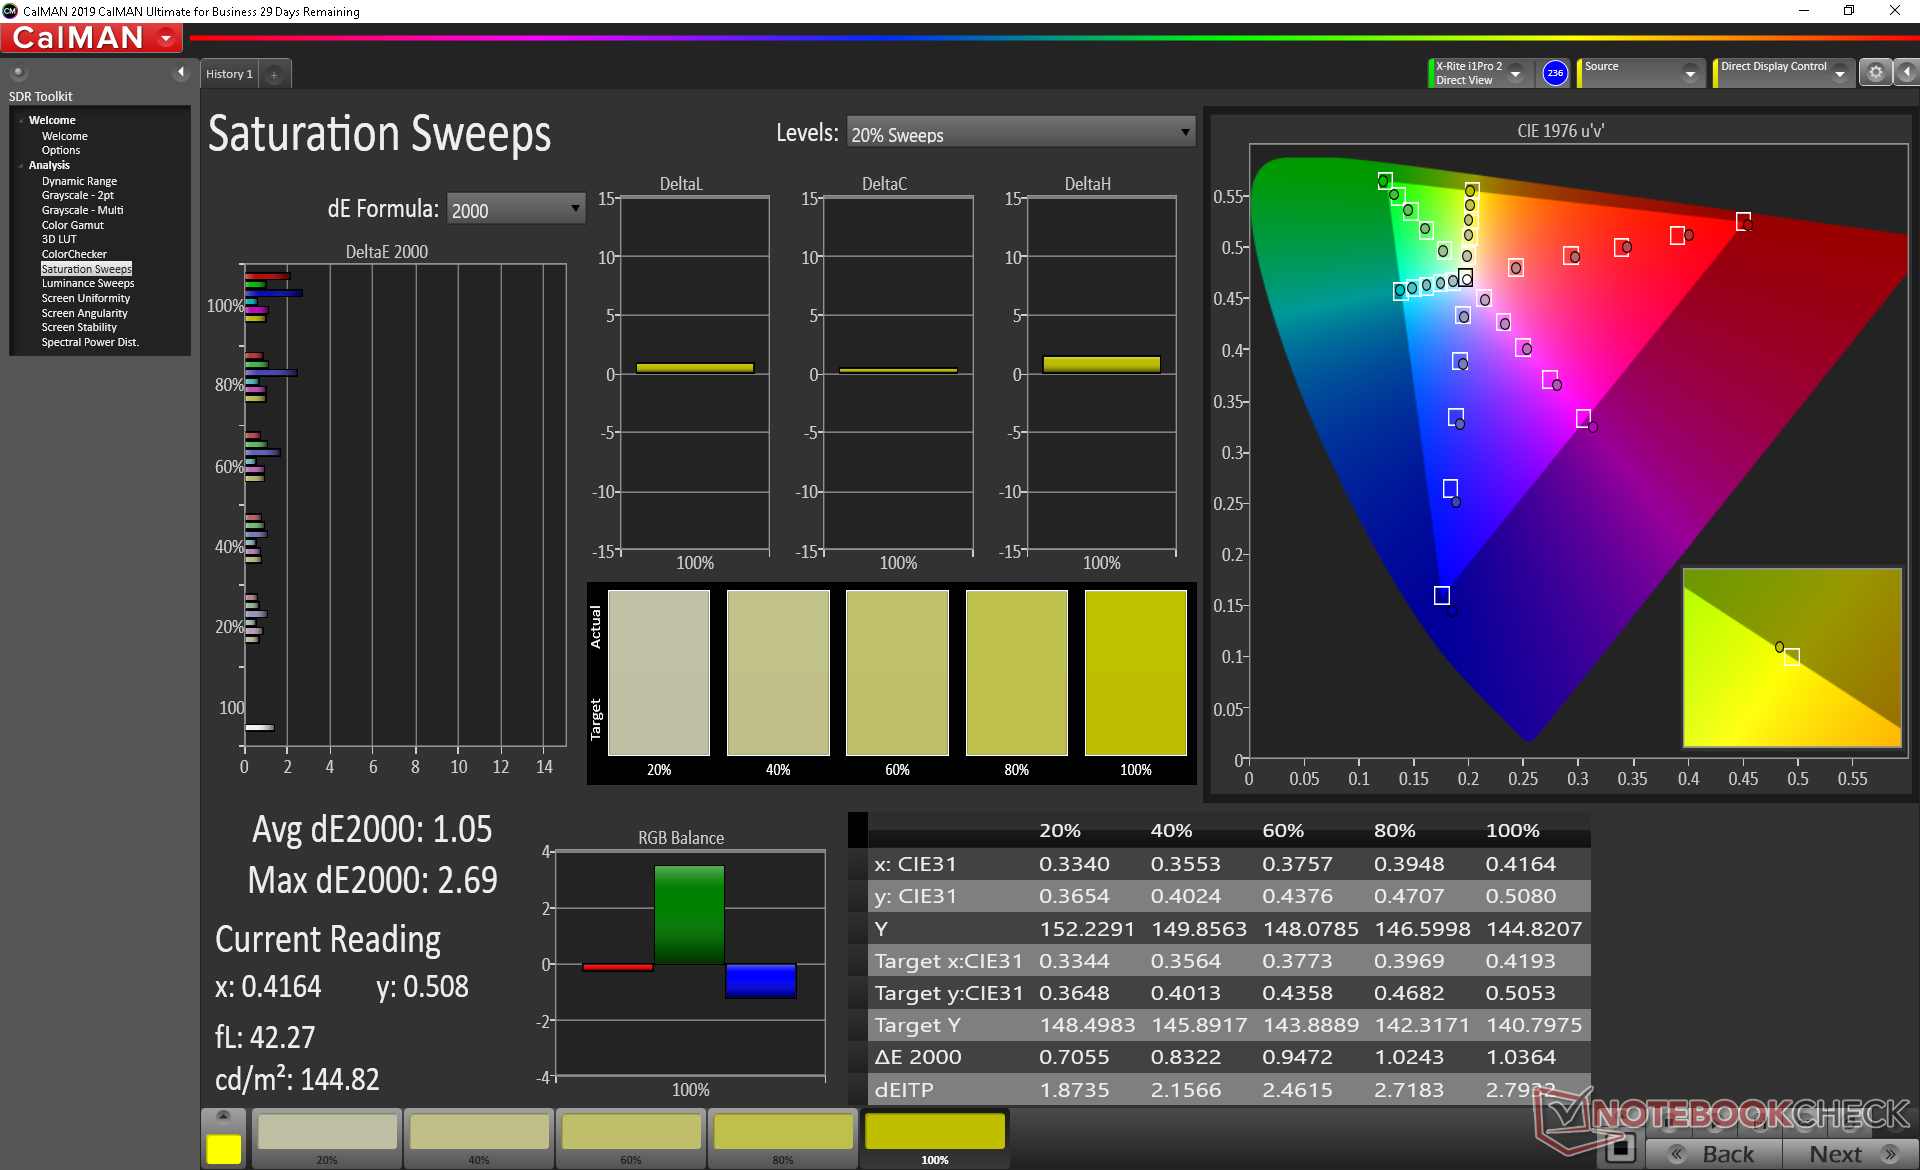
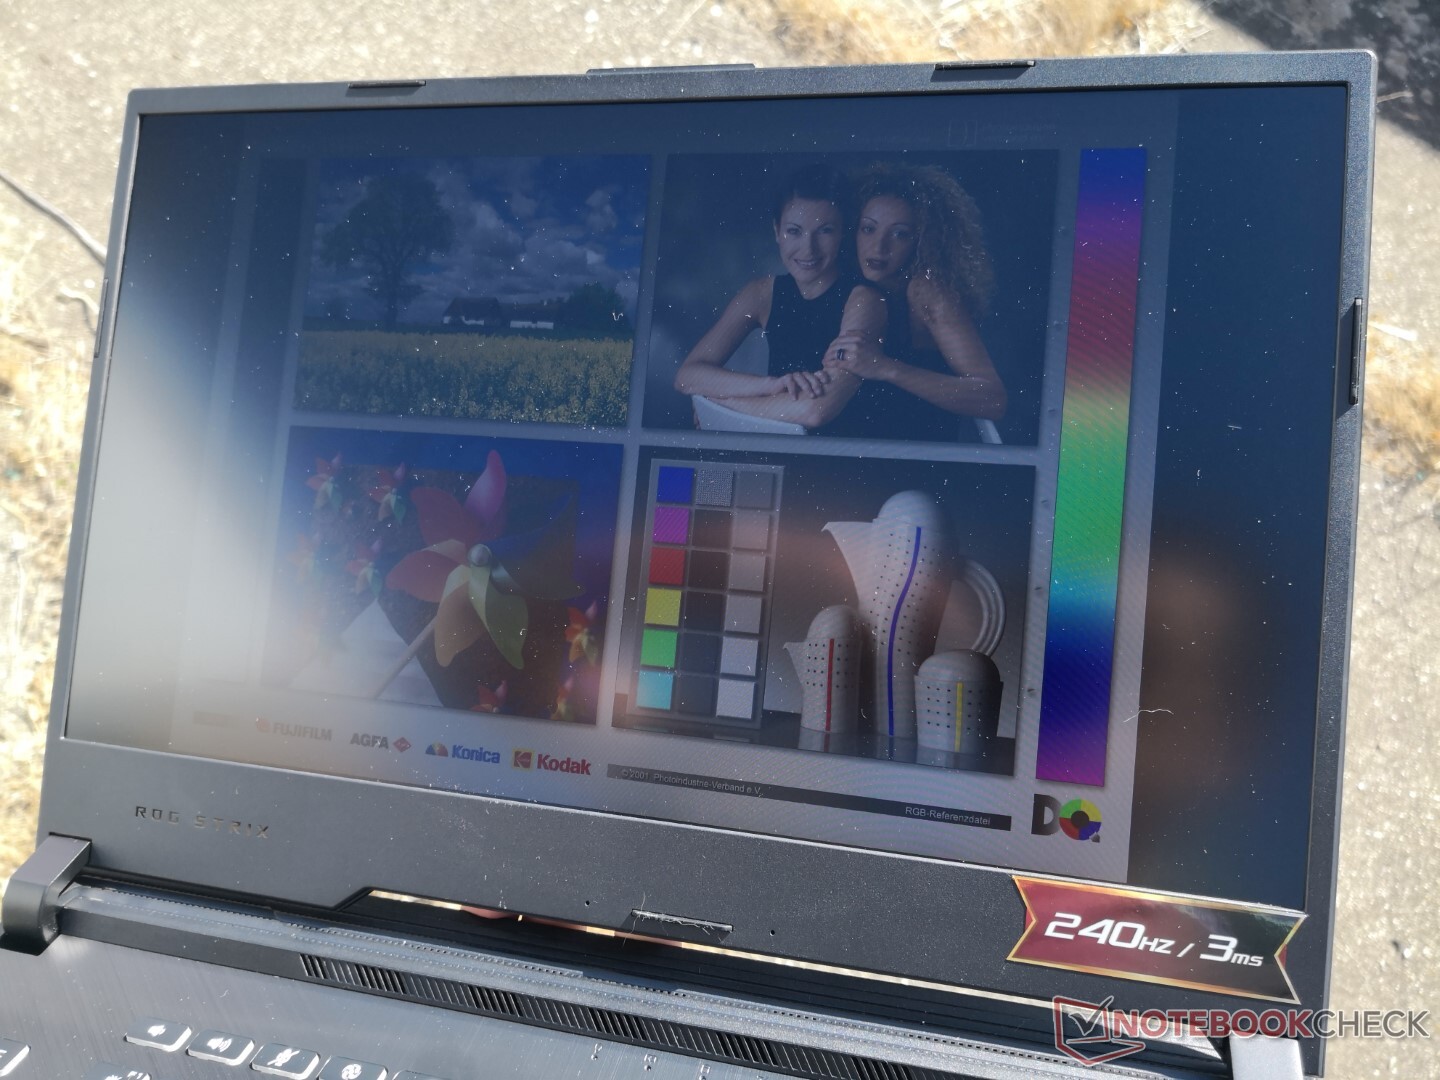
O painel Sharp de 240 Hz em nosso G512LW é superior ao painel Panda de 144 Hz no G512LI mais barato em todos os sentidos. Mais importante ainda, o contraste, o espaço de cores e os tempos de resposta em preto e branco são significativamente melhores para uma experiência visual que reflete a etiqueta de preço de quatro dígitos. Já reclamamos dos painéis Panda no passado e por isso é um alívio não ver um no nível de entusiasmo G512LW.

| |||||||||||||||||||||||||
iluminação: 92 %
iluminação com acumulador: 300.9 cd/m²
Contraste: 971:1 (Preto: 0.31 cd/m²)
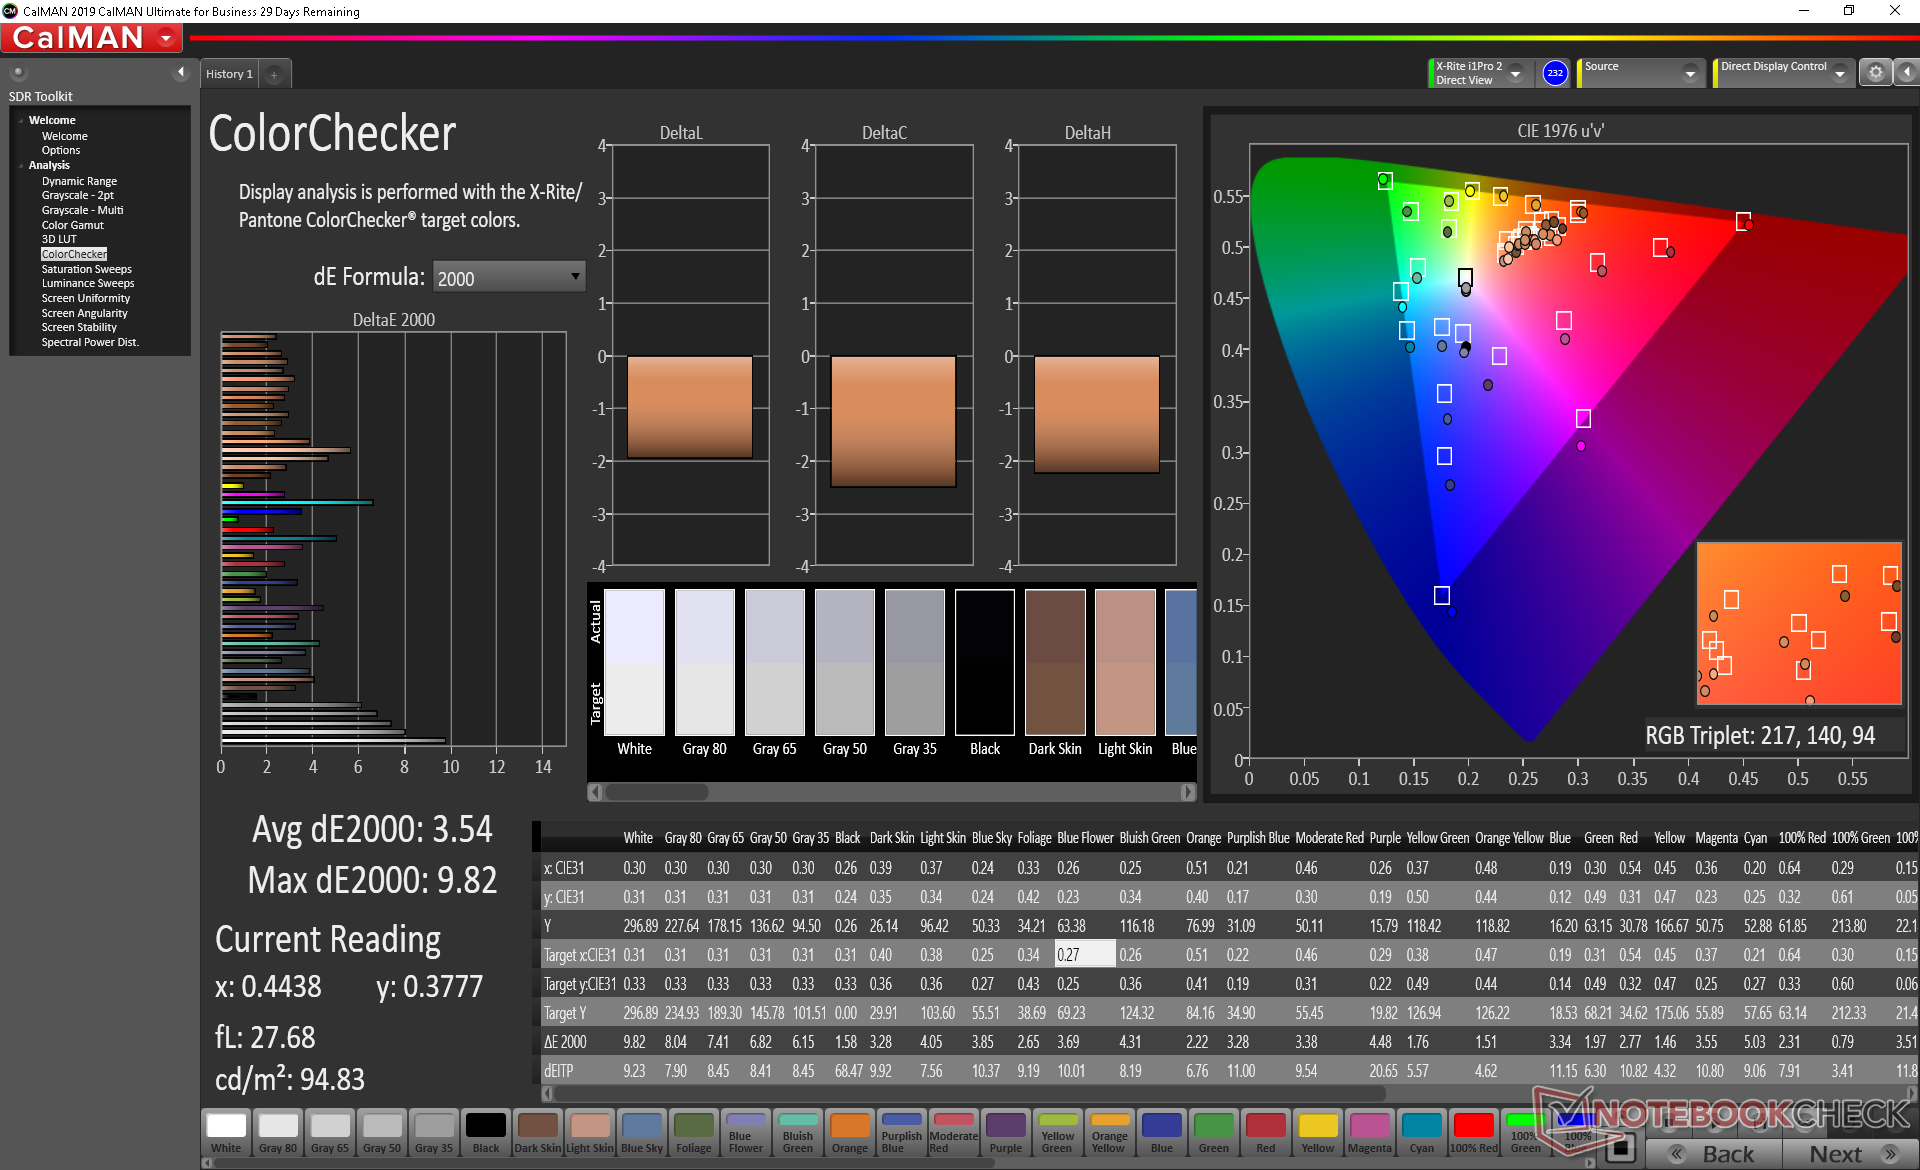
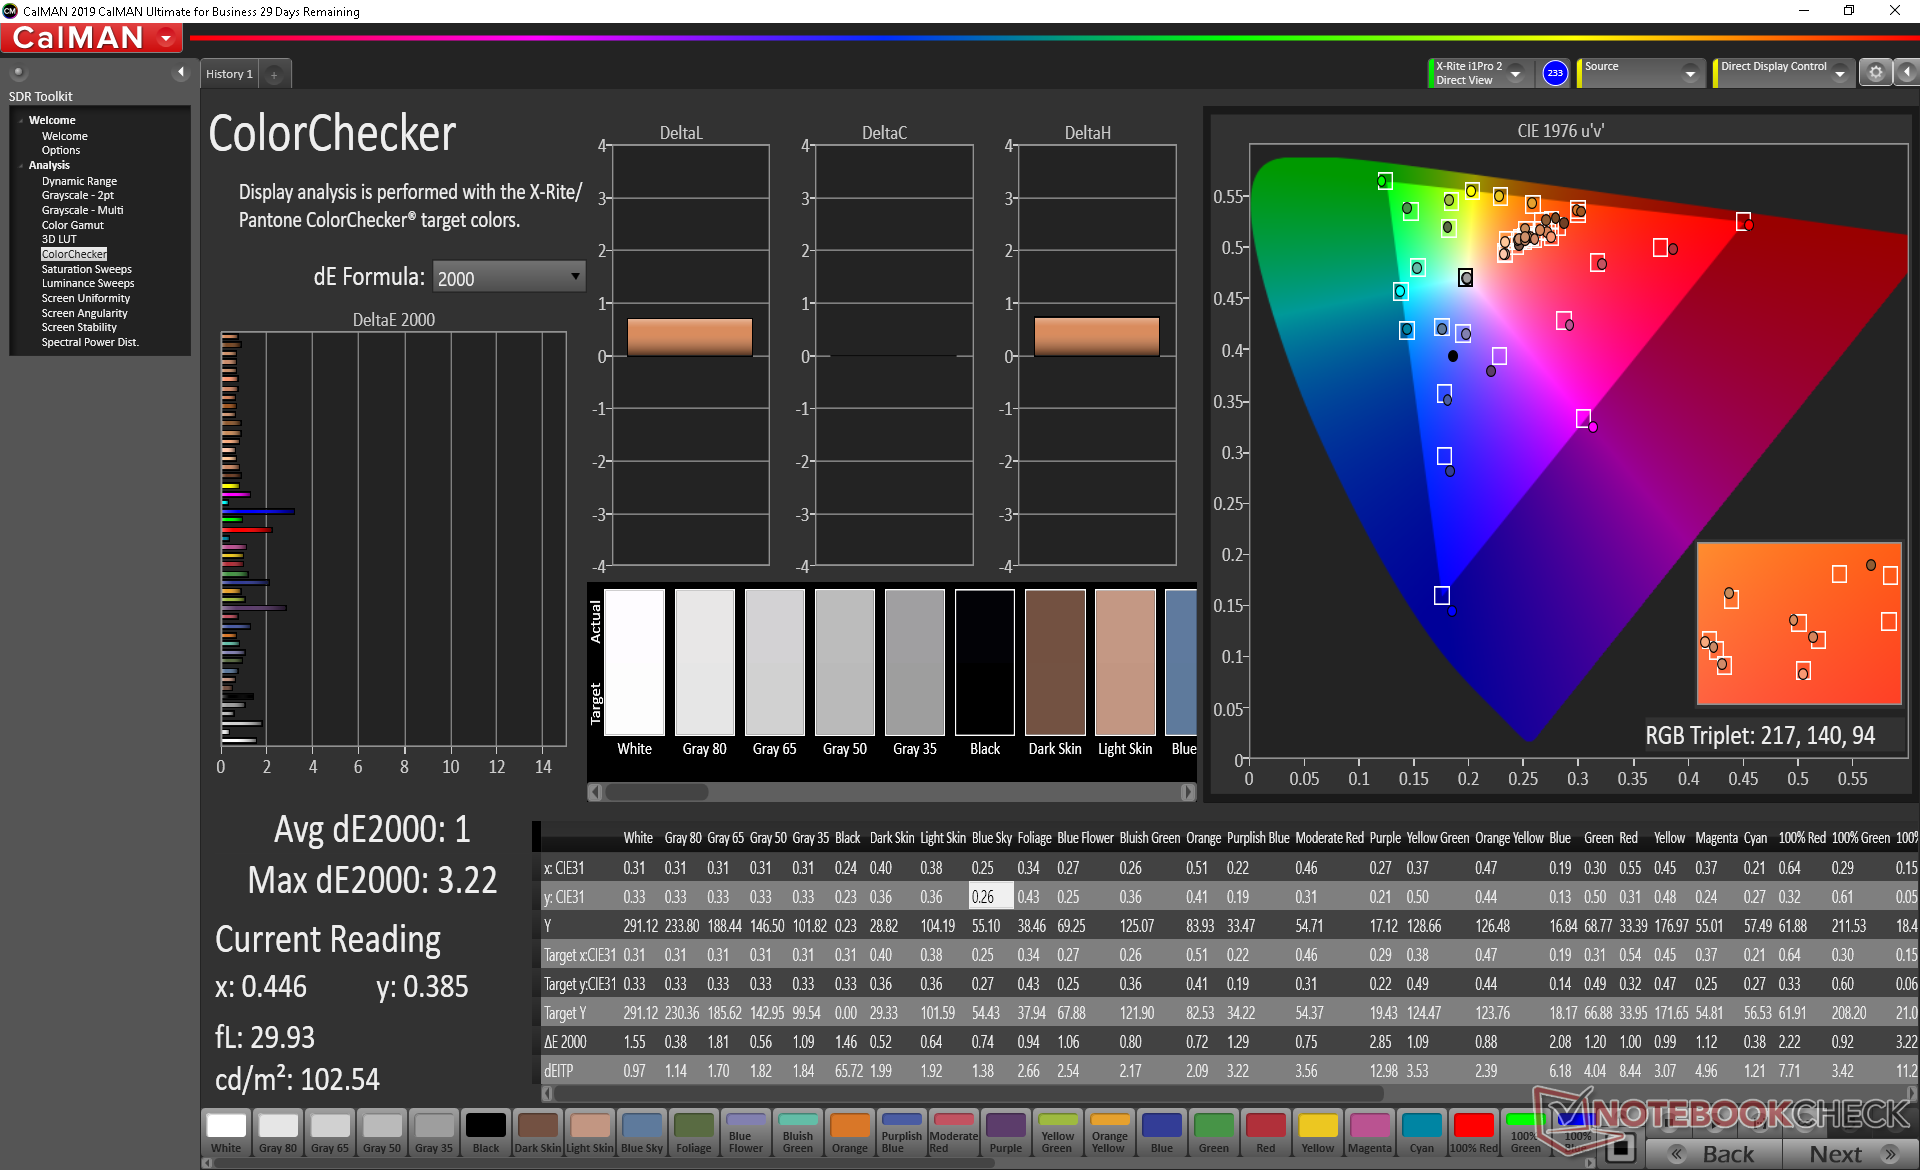
ΔE ColorChecker Calman: 3.54 | ∀{0.5-29.43 Ø4.71}
calibrated: 1
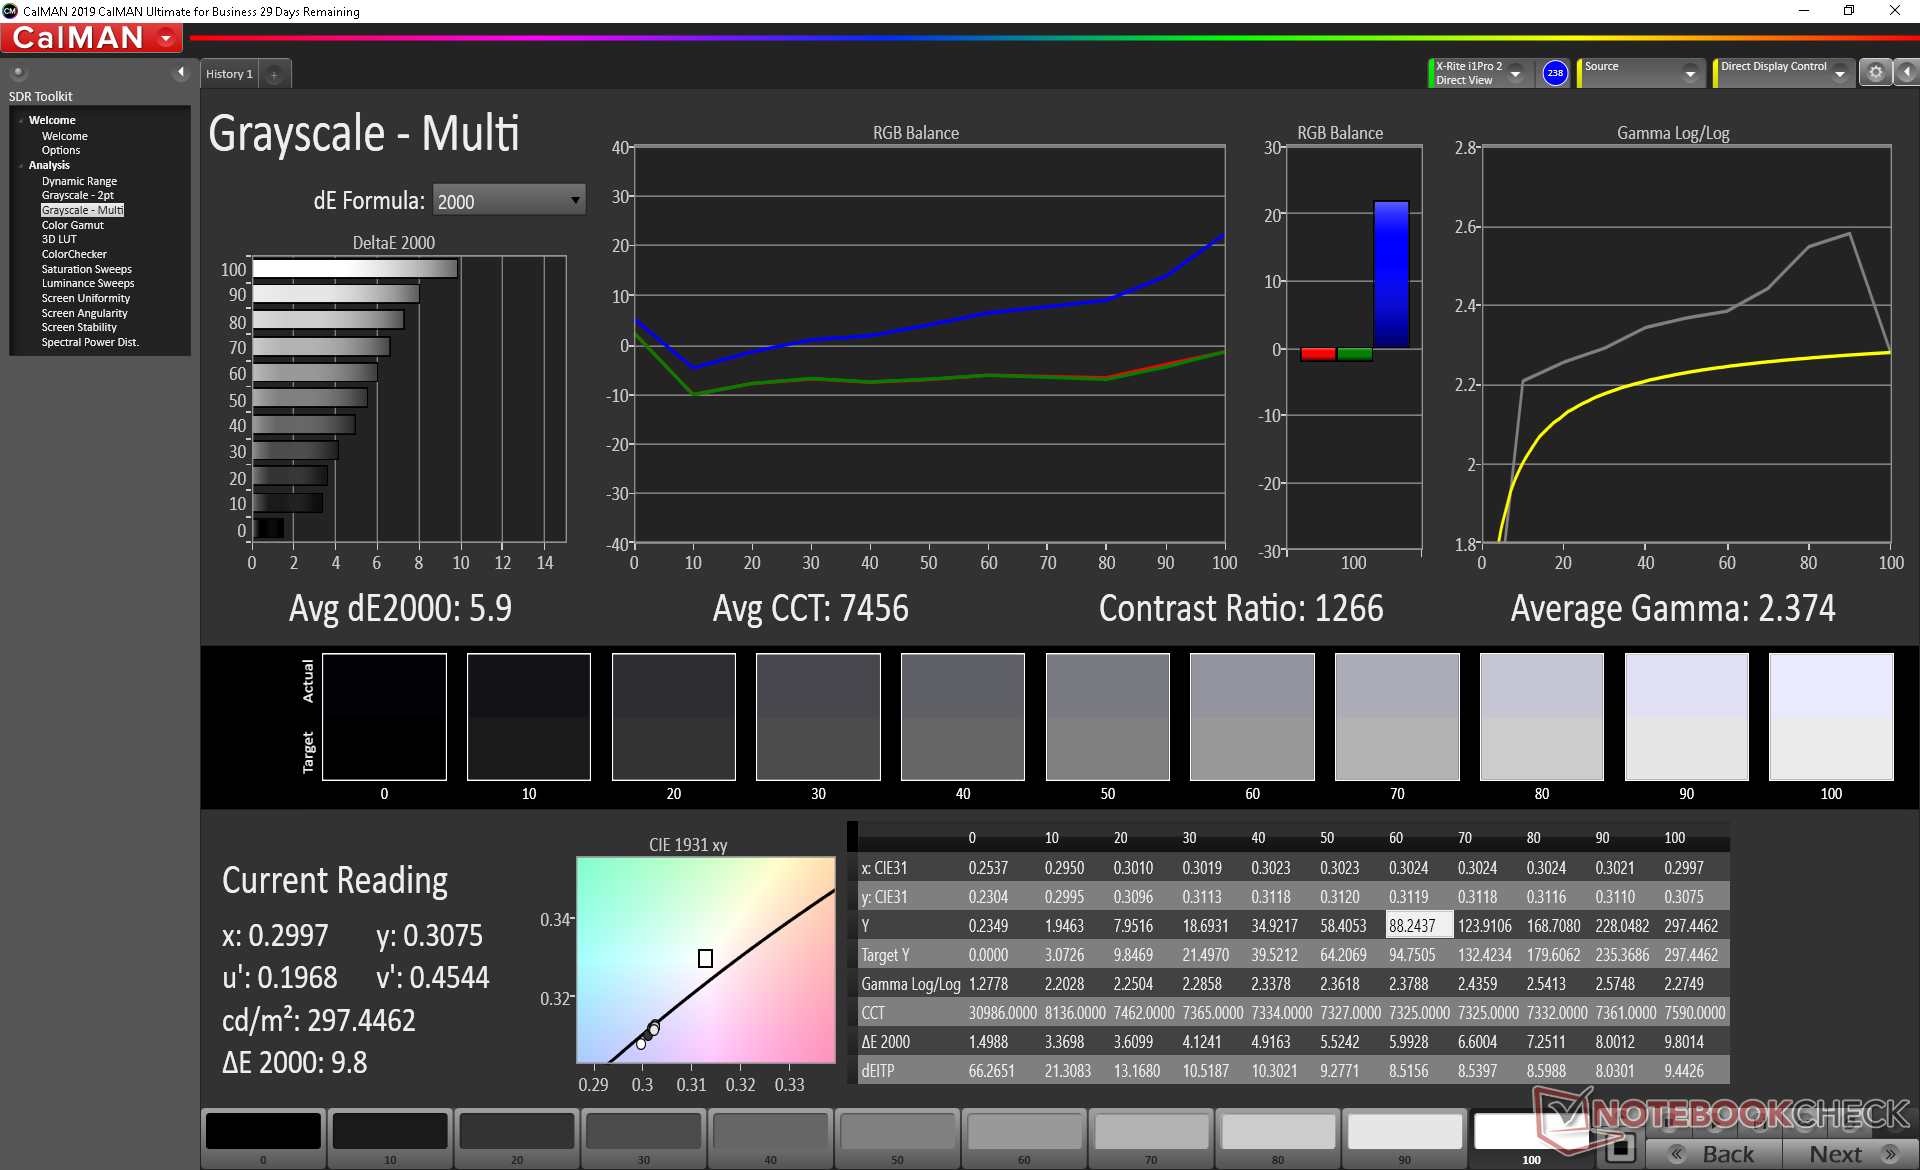
ΔE Greyscale Calman: 5.9 | ∀{0.09-98 Ø4.96}
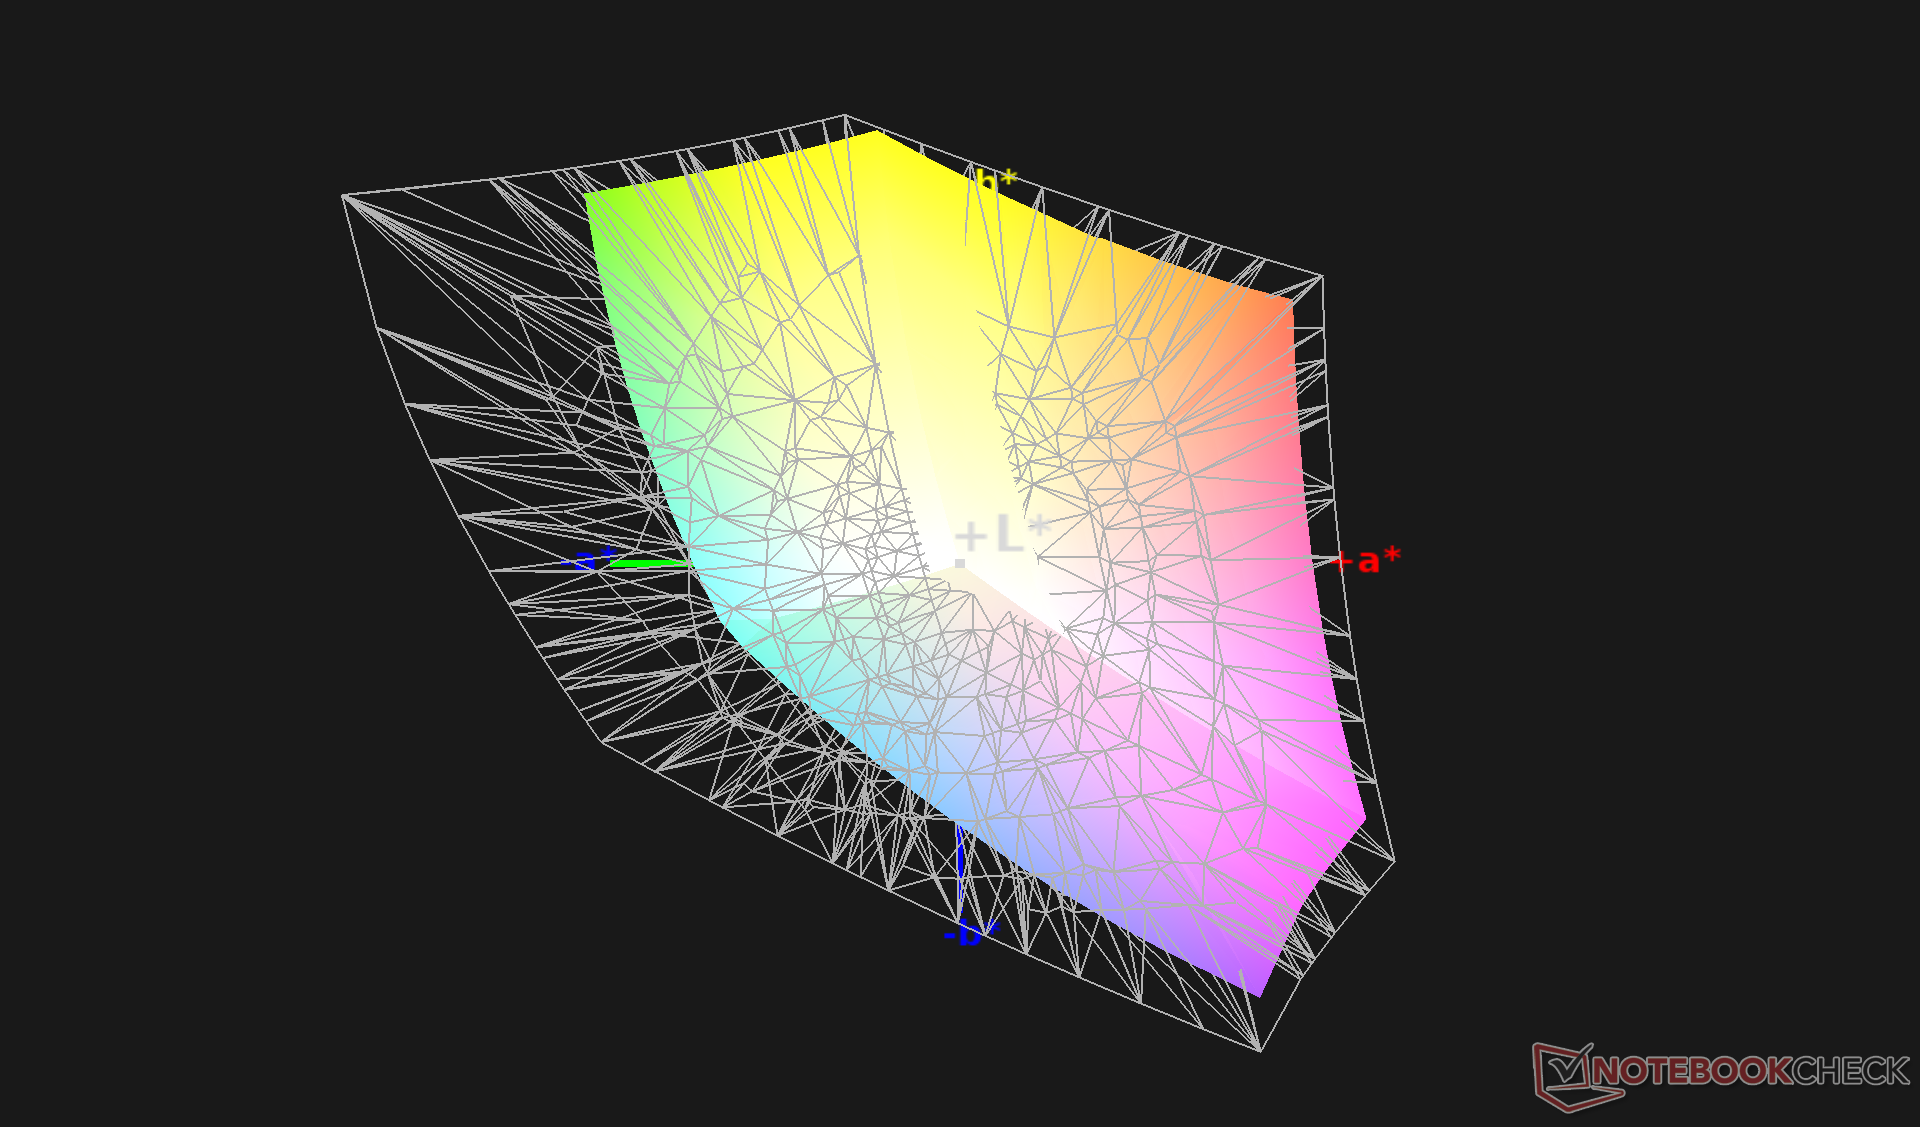
98.3% sRGB (Argyll 1.6.3 3D)
63.3% AdobeRGB 1998 (Argyll 1.6.3 3D)
68.5% AdobeRGB 1998 (Argyll 3D)
98.3% sRGB (Argyll 3D)
67.8% Display P3 (Argyll 3D)
Gamma: 2.37
CCT: 7456 K
| Asus ROG Strix G15 G512LW Sharp LQ156M1JW09, IPS, 15.6", 1920x1080 | Asus ROG Strix G15 G512LI Panda LM156LF-2F01, IPS, 15.6", 1920x1080 | Razer Blade 15 RTX 2070 Super Max-Q AU Optronics B156HAN12.0, IPS, 15.6", 1920x1080 | MSI GP65 10SFK-047US LG Philips LP156WFG-SPB3, IPS, 15.6", 1920x1080 | Asus ROG Strix Scar 15 G532LWS AU Optronics B156HAN12.0, IPS, 15.6", 1920x1080 | Alienware m15 R3 P87F AU Optronics B156HAN, IPS, 15.6", 1920x1080 | |
|---|---|---|---|---|---|---|
| Display | -40% | 2% | -5% | 3% | 1% | |
| Display P3 Coverage (%) | 67.8 | 39.73 -41% | 69.4 2% | 63.5 -6% | 69.9 3% | 68.6 1% |
| sRGB Coverage (%) | 98.3 | 59.8 -39% | 98.8 1% | 94.4 -4% | 99.6 1% | 98.9 1% |
| AdobeRGB 1998 Coverage (%) | 68.5 | 41.06 -40% | 70.5 3% | 65.1 -5% | 71.4 4% | 69.8 2% |
| Response Times | -138% | 52% | 10% | 11% | 36% | |
| Response Time Grey 50% / Grey 80% * (ms) | 16 ? | 33.6 ? -110% | 3.2 ? 80% | 10.4 ? 35% | 14.4 ? 10% | 4 ? 75% |
| Response Time Black / White * (ms) | 10.4 ? | 27.6 ? -165% | 8 ? 23% | 12 ? -15% | 9.2 ? 12% | 10.8 ? -4% |
| PWM Frequency (Hz) | 23580 ? | |||||
| Screen | -57% | 3% | -8% | 22% | 7% | |
| Brightness middle (cd/m²) | 300.9 | 271.2 -10% | 345.4 15% | 384.9 28% | 307.2 2% | 326.7 9% |
| Brightness (cd/m²) | 289 | 252 -13% | 342 18% | 358 24% | 301 4% | 316 9% |
| Brightness Distribution (%) | 92 | 79 -14% | 90 -2% | 87 -5% | 91 -1% | 87 -5% |
| Black Level * (cd/m²) | 0.31 | 0.53 -71% | 0.34 -10% | 0.67 -116% | 0.21 32% | 0.33 -6% |
| Contrast (:1) | 971 | 512 -47% | 1016 5% | 574 -41% | 1463 51% | 990 2% |
| Colorchecker dE 2000 * | 3.54 | 5.04 -42% | 3.18 10% | 2.43 31% | 1.85 48% | 2.4 32% |
| Colorchecker dE 2000 max. * | 9.82 | 16.07 -64% | 6.57 33% | 4.58 53% | 3.92 60% | 6.06 38% |
| Colorchecker dE 2000 calibrated * | 1 | 4.26 -326% | 1.77 -77% | 2.03 -103% | 1.26 -26% | 1.51 -51% |
| Greyscale dE 2000 * | 5.9 | 3.4 42% | 3.8 36% | 2.6 56% | 2 66% | 3.2 46% |
| Gamma | 2.37 93% | 2.09 105% | 2.15 102% | 2.2 100% | 2.15 102% | 2.13 103% |
| CCT | 7456 87% | 7079 92% | 7109 91% | 6981 93% | 6479 100% | 7129 91% |
| Color Space (Percent of AdobeRGB 1998) (%) | 63.3 | 37.8 -40% | 64.3 2% | 59.7 -6% | 65 3% | 63.7 1% |
| Color Space (Percent of sRGB) (%) | 98.3 | 59.5 -39% | 99 1% | 93.9 -4% | 99.7 1% | 99.2 1% |
| Média Total (Programa/Configurações) | -78% /
-64% | 19% /
9% | -1% /
-5% | 12% /
17% | 15% /
9% |
* ... menor é melhor
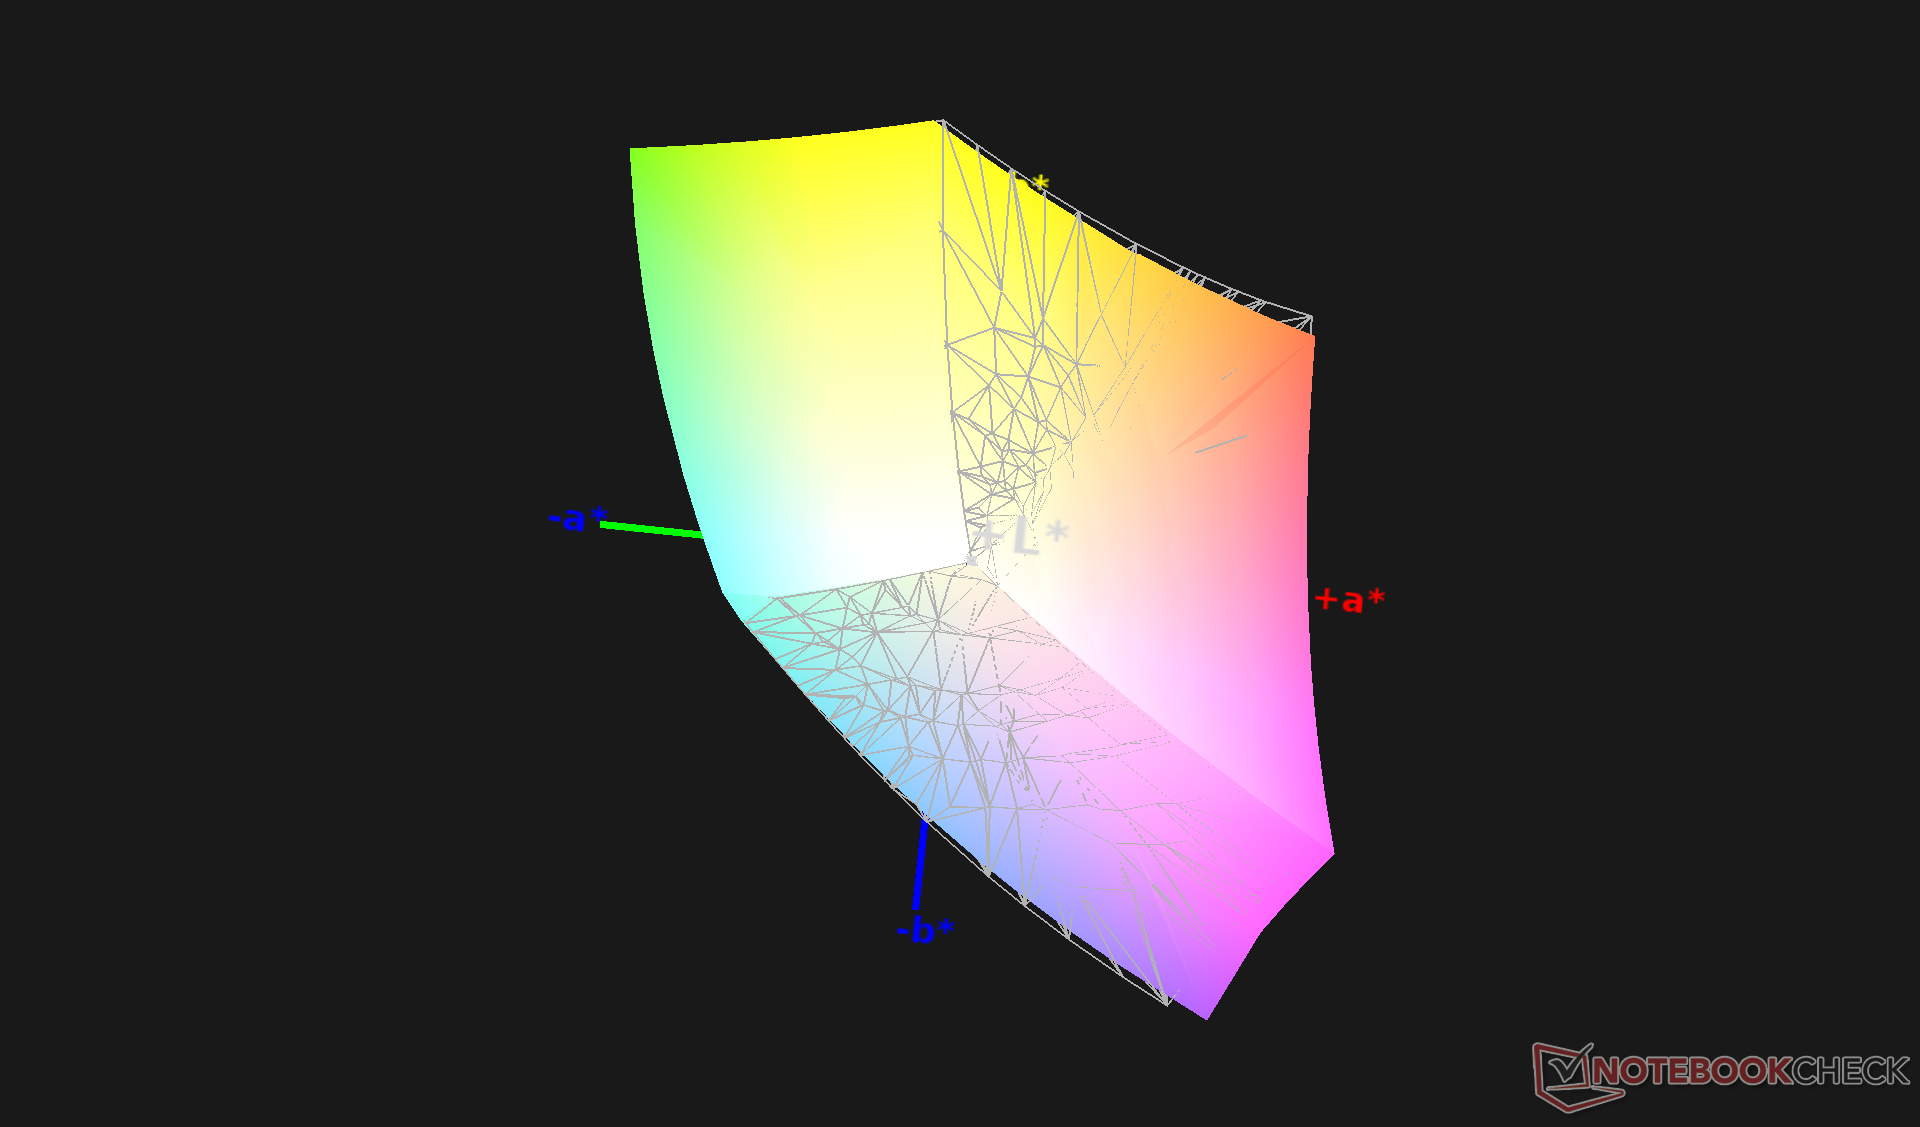
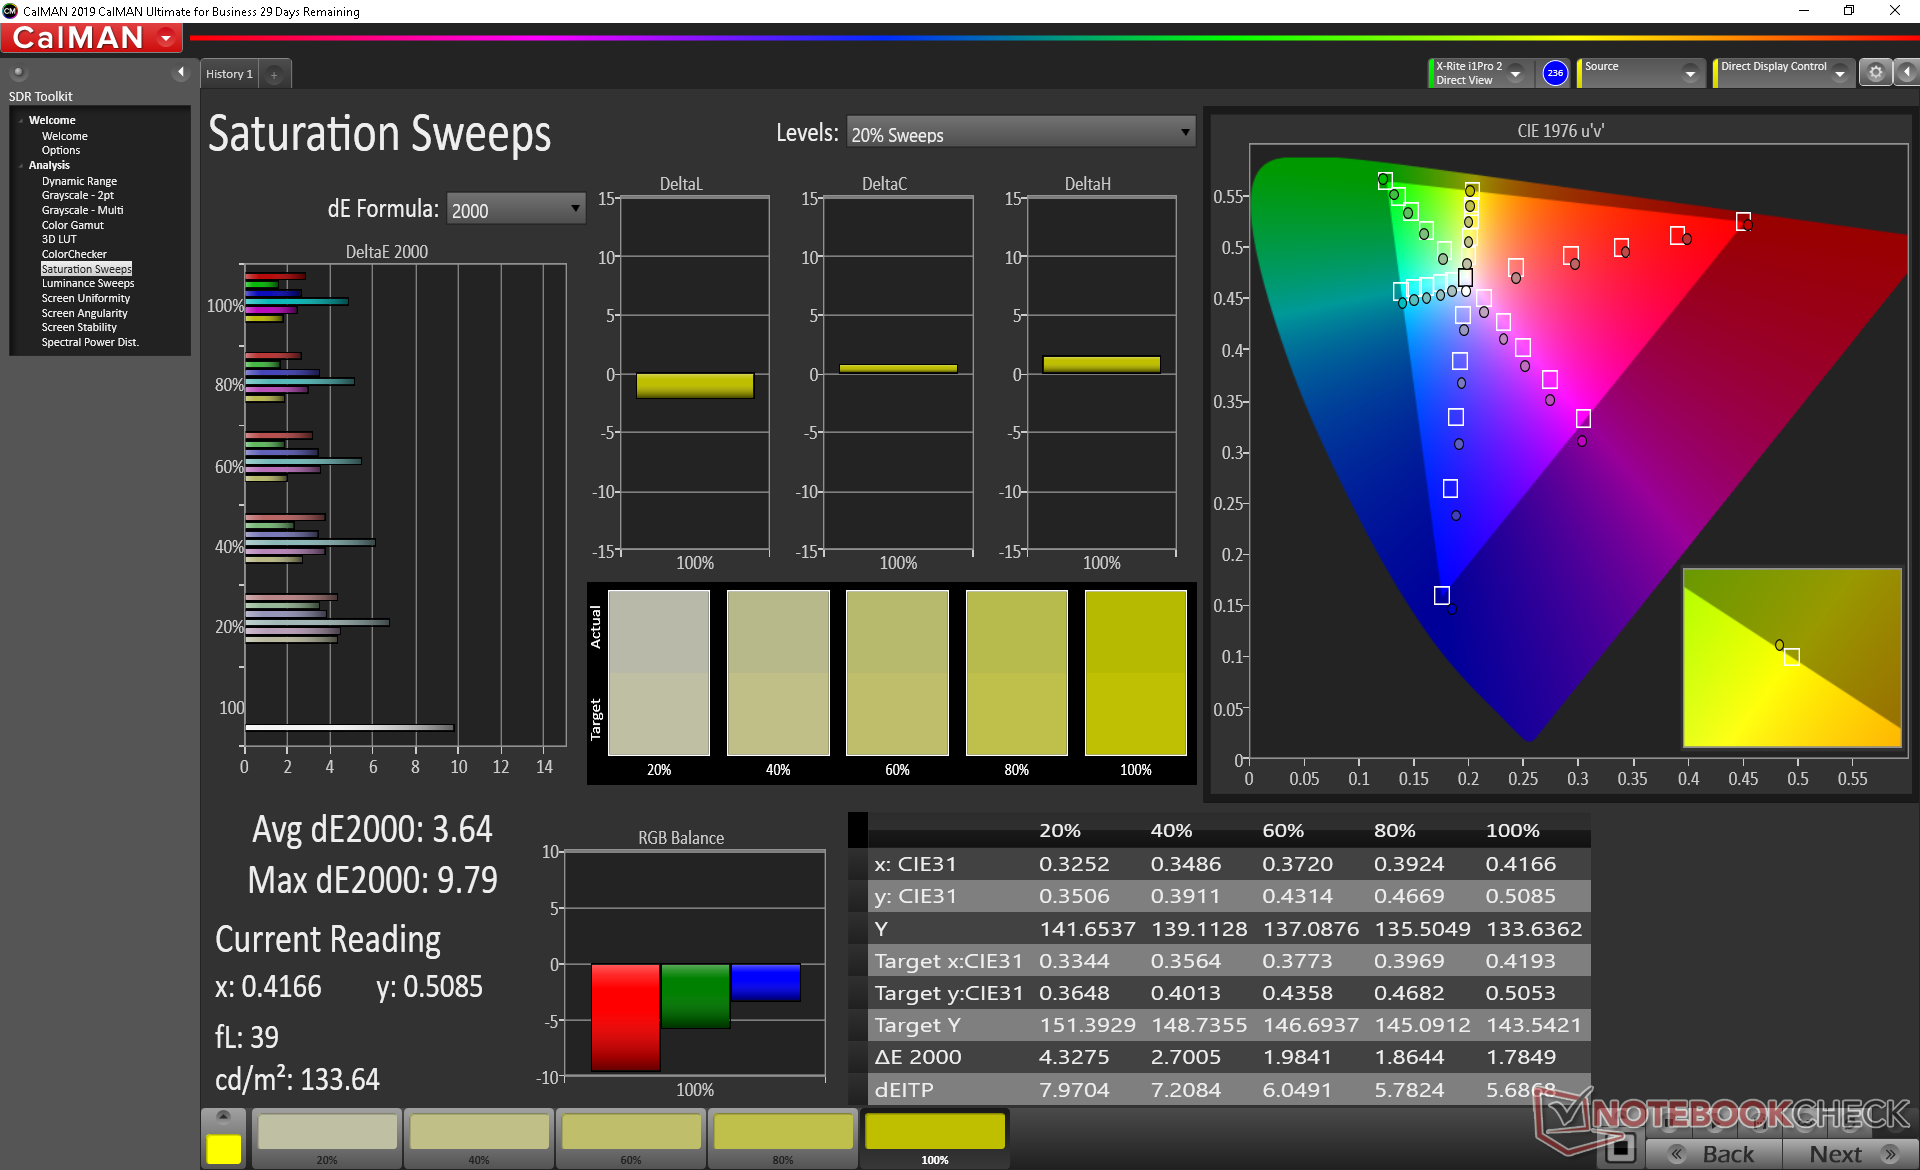
A exibição poderia ter sido melhor calibrada considerando a faixa de preço. A temperatura da cor é excessivamente quente fora da caixa, o que afeta a média da escala de cinza e a precisão da cor. Após calibrarmos nós mesmos o painel, a precisão melhoraria visivelmente em toda a superfície. Recomendamos uma calibração do usuário final, se possível, ou pelo menos ajustes manuais na escala de cinza para uma melhor imagem.
Exibir tempos de resposta
| ↔ Tempo de resposta preto para branco | ||
|---|---|---|
| 10.4 ms ... ascensão ↗ e queda ↘ combinadas | ↗ 5.2 ms ascensão | 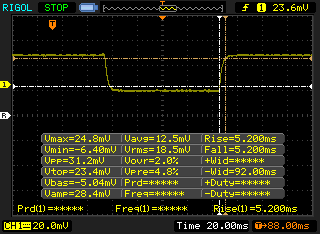 |
| ↘ 5.2 ms queda | ||
| A tela mostra boas taxas de resposta em nossos testes, mas pode ser muito lenta para jogadores competitivos. Em comparação, todos os dispositivos testados variam de 0.1 (mínimo) a 240 (máximo) ms. » 28 % de todos os dispositivos são melhores. Isso significa que o tempo de resposta medido é melhor que a média de todos os dispositivos testados (19.8 ms). | ||
| ↔ Tempo de resposta 50% cinza a 80% cinza | ||
| 16 ms ... ascensão ↗ e queda ↘ combinadas | ↗ 8.4 ms ascensão | 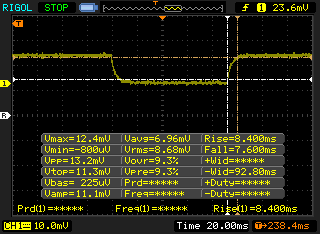 |
| ↘ 7.6 ms queda | ||
| A tela mostra boas taxas de resposta em nossos testes, mas pode ser muito lenta para jogadores competitivos. Em comparação, todos os dispositivos testados variam de 0.165 (mínimo) a 636 (máximo) ms. » 30 % de todos os dispositivos são melhores. Isso significa que o tempo de resposta medido é melhor que a média de todos os dispositivos testados (31 ms). | ||
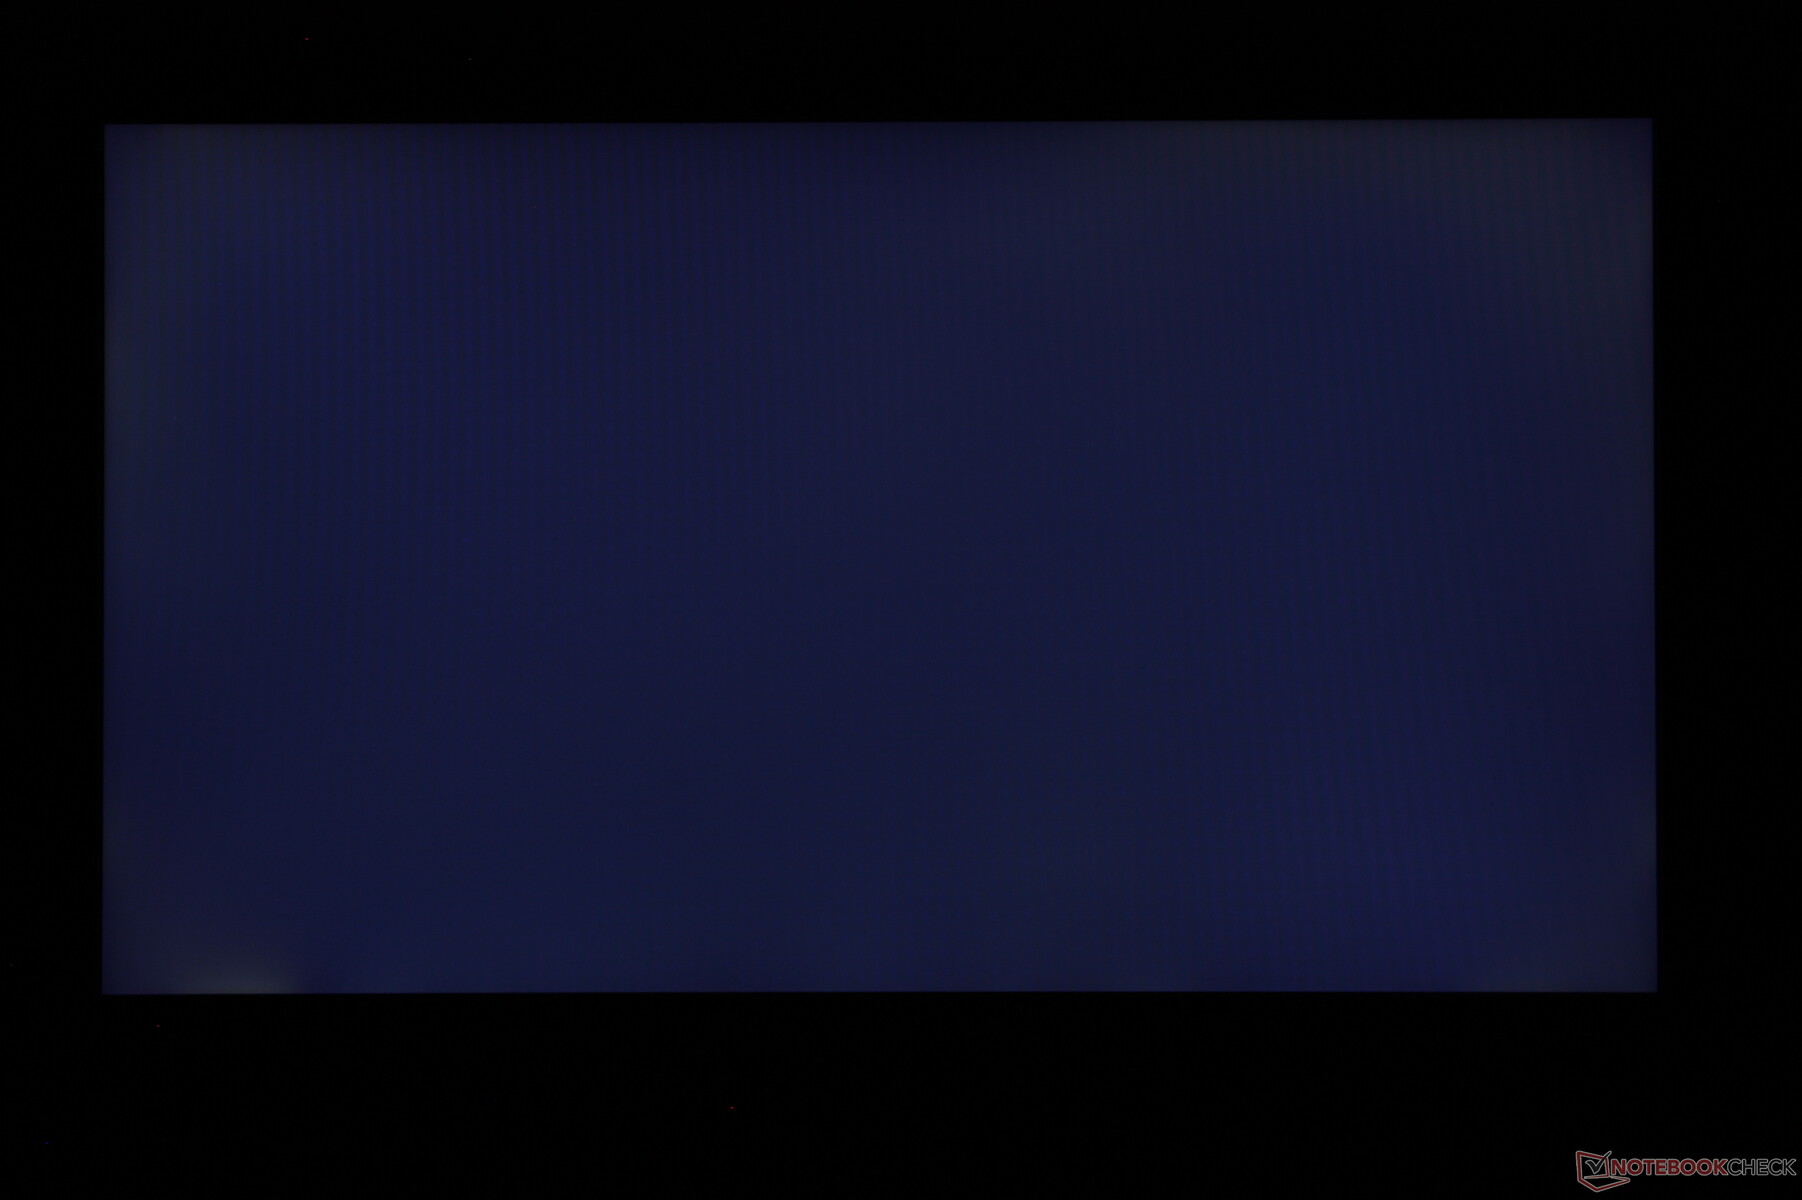
Cintilação da tela / PWM (modulação por largura de pulso)
| Tela tremeluzindo/PWM detectado | 23580 Hz | ≤ 29 % configuração de brilho | 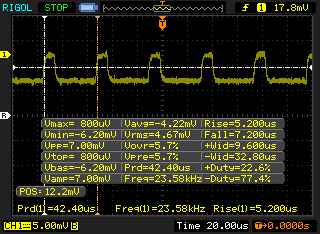 |
A luz de fundo da tela pisca em 23580 Hz (pior caso, por exemplo, utilizando PWM) Cintilação detectada em uma configuração de brilho de 29 % e abaixo. Não deve haver cintilação ou PWM acima desta configuração de brilho. A frequência de 23580 Hz é bastante alta, então a maioria dos usuários sensíveis ao PWM não deve notar nenhuma oscilação. [pwm_comparison] Em comparação: 52 % de todos os dispositivos testados não usam PWM para escurecer a tela. Se PWM foi detectado, uma média de 7757 (mínimo: 5 - máximo: 343500) Hz foi medida. | |||
Desempenho
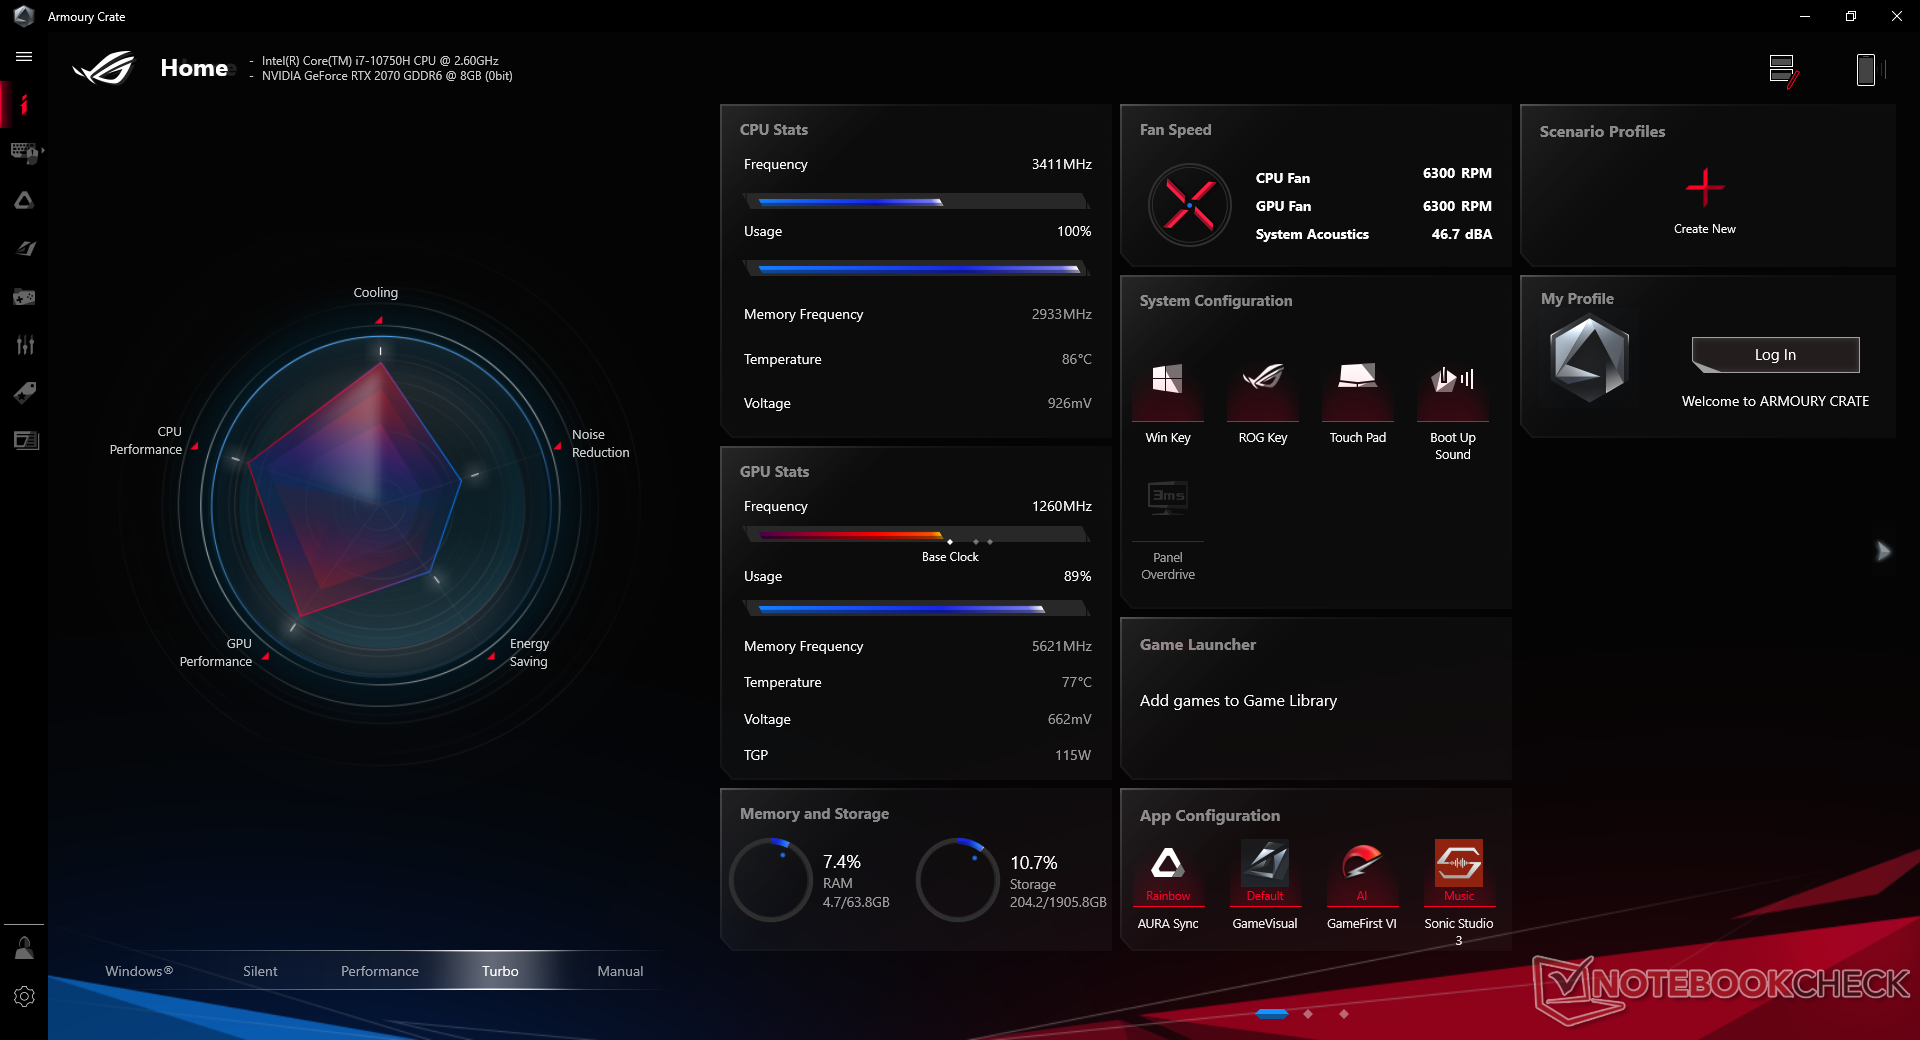
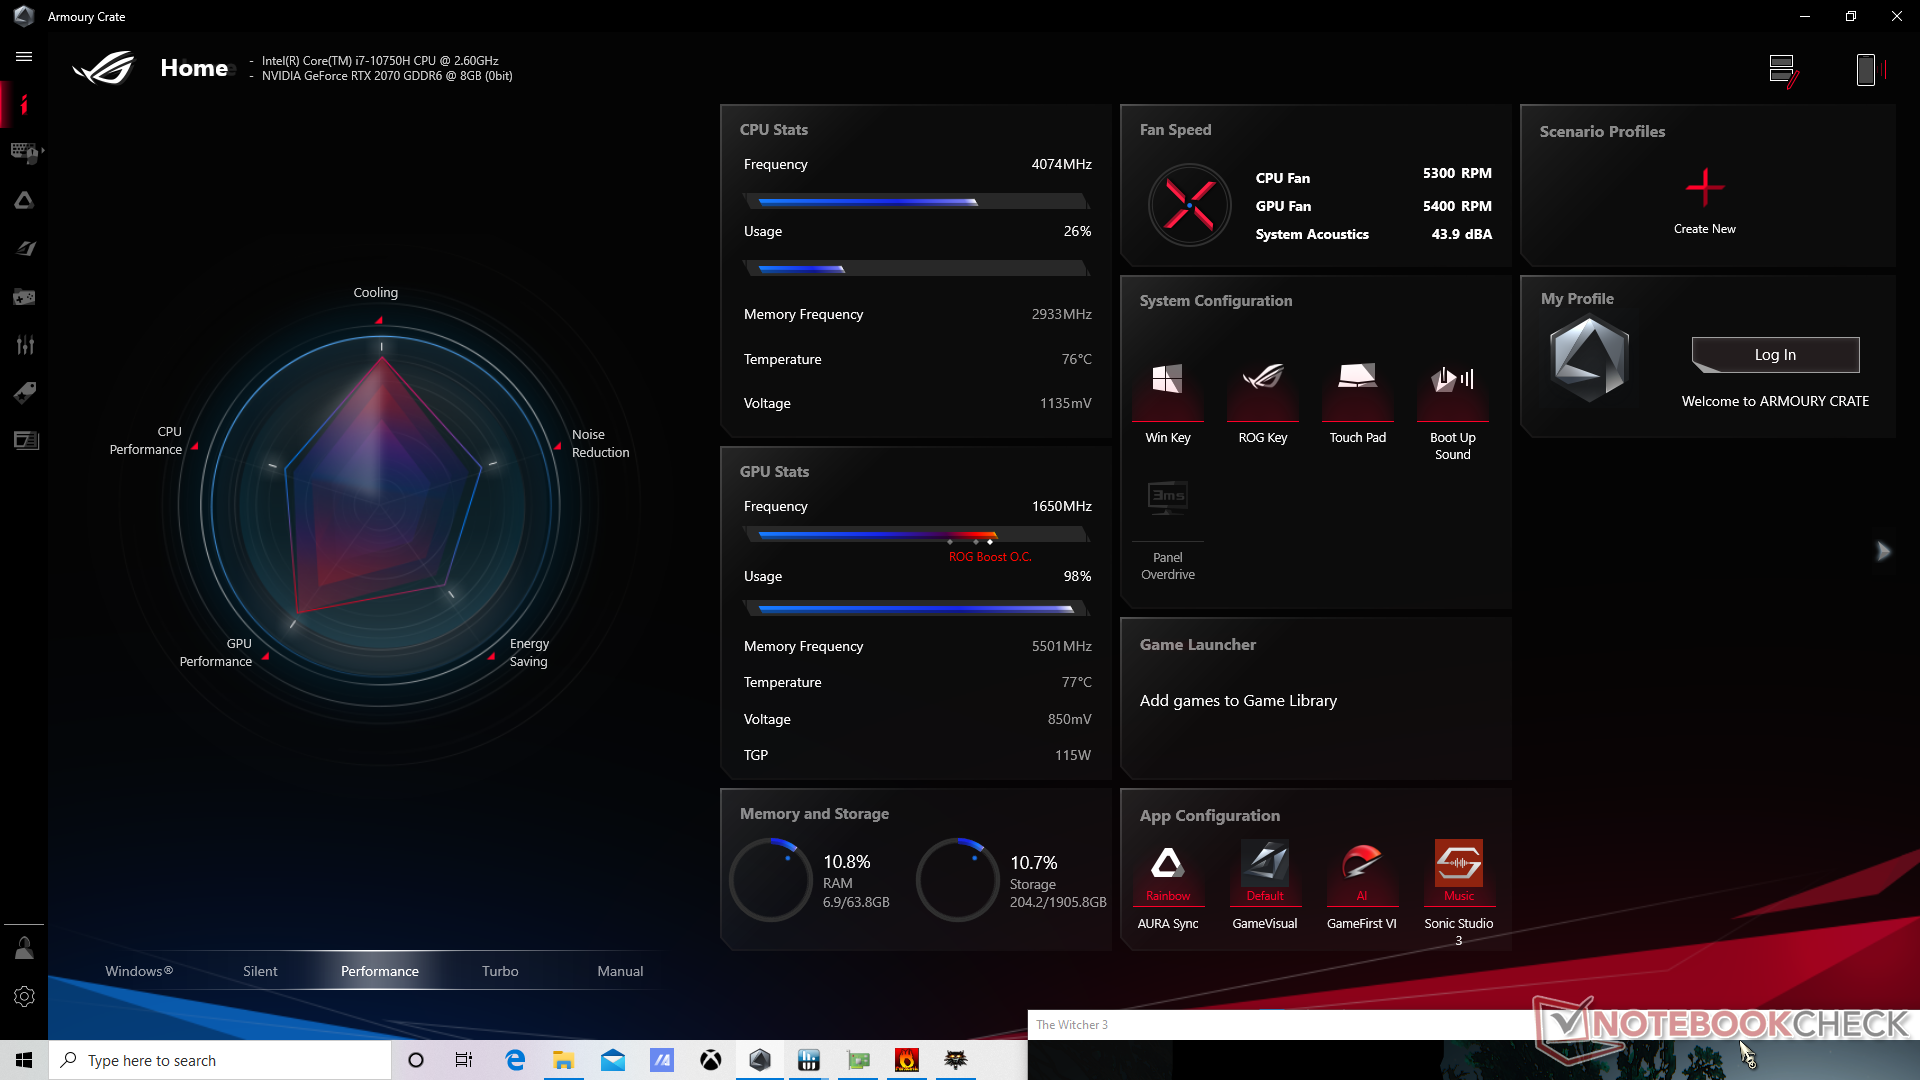
Todos os benchmarks abaixo foram realizados no modo Asus Turbo. Recomendamos aos proprietários que se familiarizem com o Armoury Crate, pois os perfis de potência estão diretamente ligados a este software.
Processador
O desempenho da CPU multi-tarefa é cerca de 5 a 10% mais rápido do que a média do laptop em nosso banco de dados equipado com a mesma CPU Core i7-10750H. A sustentabilidade do desempenho é excelente e até um pouco melhor que a G512LI, como mostra nosso teste de loop do CineBench R15 xT abaixo.
Cinebench R15: CPU Multi 64Bit | CPU Single 64Bit
Blender: v2.79 BMW27 CPU
7-Zip 18.03: 7z b 4 -mmt1 | 7z b 4
Geekbench 5.5: Single-Core | Multi-Core
HWBOT x265 Benchmark v2.2: 4k Preset
LibreOffice : 20 Documents To PDF
R Benchmark 2.5: Overall mean
| Cinebench R20 / CPU (Multi Core) | |
| MSI Bravo 15 A4DCR | |
| Asus Zephyrus S15 GX502L | |
| Asus ROG Strix Scar 15 G532LWS | |
| Asus ROG Zephyrus G15 GA502IU-ES76 | |
| Eurocom Nightsky RX15 | |
| MSI GE65 Raider 9SF-049US | |
| Asus ROG Strix G15 G512LW | |
| Acer Nitro 5 AN515-44-R5FT | |
| Asus ROG Strix G15 G512LI | |
| Média Intel Core i7-10750H (1749 - 3325, n=43) | |
| Maingear Vector 15 | |
| MSI GE63 Raider 8SG | |
| Gateway Creator Series 15.6 GWTN156-3BK | |
| Cinebench R20 / CPU (Single Core) | |
| Asus ROG Strix Scar 15 G532LWS | |
| Asus ROG Zephyrus G15 GA502IU-ES76 | |
| Asus ROG Strix G15 G512LW | |
| Eurocom Nightsky RX15 | |
| MSI Bravo 15 A4DCR | |
| MSI GE65 Raider 9SF-049US | |
| Média Intel Core i7-10750H (431 - 504, n=43) | |
| Asus Zephyrus S15 GX502L | |
| Asus ROG Strix G15 G512LI | |
| Gateway Creator Series 15.6 GWTN156-3BK | |
| Maingear Vector 15 | |
| Acer Nitro 5 AN515-44-R5FT | |
| MSI GE63 Raider 8SG | |
| Cinebench R15 / CPU Multi 64Bit | |
| Eurocom Nightsky RX15 | |
| MSI Bravo 15 A4DCR | |
| Asus ROG Strix Scar 15 G532LWS | |
| Asus Zephyrus S15 GX502L | |
| Asus ROG Zephyrus G15 GA502IU-ES76 | |
| MSI GE65 Raider 9SF-049US | |
| Acer Nitro 5 AN515-44-R5FT | |
| Asus ROG Strix G15 G512LW | |
| Asus ROG Strix G15 G512LI | |
| Maingear Vector 15 | |
| Média Intel Core i7-10750H (804 - 1418, n=50) | |
| MSI GE63 Raider 8SG | |
| Gateway Creator Series 15.6 GWTN156-3BK | |
| Cinebench R15 / CPU Single 64Bit | |
| Asus ROG Strix Scar 15 G532LWS | |
| Asus ROG Strix G15 G512LW | |
| Eurocom Nightsky RX15 | |
| MSI GE65 Raider 9SF-049US | |
| Média Intel Core i7-10750H (184 - 213, n=45) | |
| Asus ROG Strix G15 G512LI | |
| Asus Zephyrus S15 GX502L | |
| Maingear Vector 15 | |
| MSI Bravo 15 A4DCR | |
| Asus ROG Zephyrus G15 GA502IU-ES76 | |
| Acer Nitro 5 AN515-44-R5FT | |
| Gateway Creator Series 15.6 GWTN156-3BK | |
| MSI GE63 Raider 8SG | |
| Blender / v2.79 BMW27 CPU | |
| Eurocom Nightsky RX15 | |
| Gateway Creator Series 15.6 GWTN156-3BK | |
| Média Intel Core i7-10750H (322 - 587, n=43) | |
| Asus ROG Strix G15 G512LI | |
| Acer Nitro 5 AN515-44-R5FT | |
| Asus ROG Strix G15 G512LW | |
| MSI Bravo 15 A4DCR | |
| Asus ROG Zephyrus G15 GA502IU-ES76 | |
| Asus ROG Strix Scar 15 G532LWS | |
| Asus Zephyrus S15 GX502L | |
| 7-Zip 18.03 / 7z b 4 -mmt1 | |
| Asus ROG Strix Scar 15 G532LWS | |
| Eurocom Nightsky RX15 | |
| Asus ROG Strix G15 G512LW | |
| Asus Zephyrus S15 GX502L | |
| Média Intel Core i7-10750H (4504 - 5470, n=43) | |
| Asus ROG Strix G15 G512LI | |
| Asus ROG Zephyrus G15 GA502IU-ES76 | |
| MSI Bravo 15 A4DCR | |
| Gateway Creator Series 15.6 GWTN156-3BK | |
| Acer Nitro 5 AN515-44-R5FT | |
| 7-Zip 18.03 / 7z b 4 | |
| Asus ROG Zephyrus G15 GA502IU-ES76 | |
| Asus Zephyrus S15 GX502L | |
| Asus ROG Strix Scar 15 G532LWS | |
| MSI Bravo 15 A4DCR | |
| Eurocom Nightsky RX15 | |
| Asus ROG Strix G15 G512LW | |
| Acer Nitro 5 AN515-44-R5FT | |
| Asus ROG Strix G15 G512LI | |
| Média Intel Core i7-10750H (26040 - 37345, n=43) | |
| Gateway Creator Series 15.6 GWTN156-3BK | |
| HWBOT x265 Benchmark v2.2 / 4k Preset | |
| Asus Zephyrus S15 GX502L | |
| Asus ROG Strix Scar 15 G532LWS | |
| Eurocom Nightsky RX15 | |
| Asus ROG Zephyrus G15 GA502IU-ES76 | |
| MSI Bravo 15 A4DCR | |
| Asus ROG Strix G15 G512LW | |
| Asus ROG Strix G15 G512LI | |
| Média Intel Core i7-10750H (5.54 - 11.6, n=43) | |
| Acer Nitro 5 AN515-44-R5FT | |
| Gateway Creator Series 15.6 GWTN156-3BK | |
| LibreOffice / 20 Documents To PDF | |
| MSI Bravo 15 A4DCR | |
| Acer Nitro 5 AN515-44-R5FT | |
| Asus ROG Zephyrus G15 GA502IU-ES76 | |
| Gateway Creator Series 15.6 GWTN156-3BK | |
| Média Intel Core i7-10750H (43.1 - 99.2, n=43) | |
| Asus ROG Strix G15 G512LI | |
| Asus ROG Strix Scar 15 G532LWS | |
| Asus Zephyrus S15 GX502L | |
| Asus ROG Strix G15 G512LW | |
| R Benchmark 2.5 / Overall mean | |
| Gateway Creator Series 15.6 GWTN156-3BK | |
| Acer Nitro 5 AN515-44-R5FT | |
| Asus ROG Strix G15 G512LI | |
| Média Intel Core i7-10750H (0.578 - 0.708, n=42) | |
| Asus ROG Strix G15 G512LW | |
| MSI Bravo 15 A4DCR | |
| Asus Zephyrus S15 GX502L | |
| Asus ROG Zephyrus G15 GA502IU-ES76 | |
| Asus ROG Strix Scar 15 G532LWS | |
Cinebench R15: CPU Multi 64Bit | CPU Single 64Bit
Blender: v2.79 BMW27 CPU
7-Zip 18.03: 7z b 4 -mmt1 | 7z b 4
Geekbench 5.5: Single-Core | Multi-Core
HWBOT x265 Benchmark v2.2: 4k Preset
LibreOffice : 20 Documents To PDF
R Benchmark 2.5: Overall mean
* ... menor é melhor
Desempenho do sistema
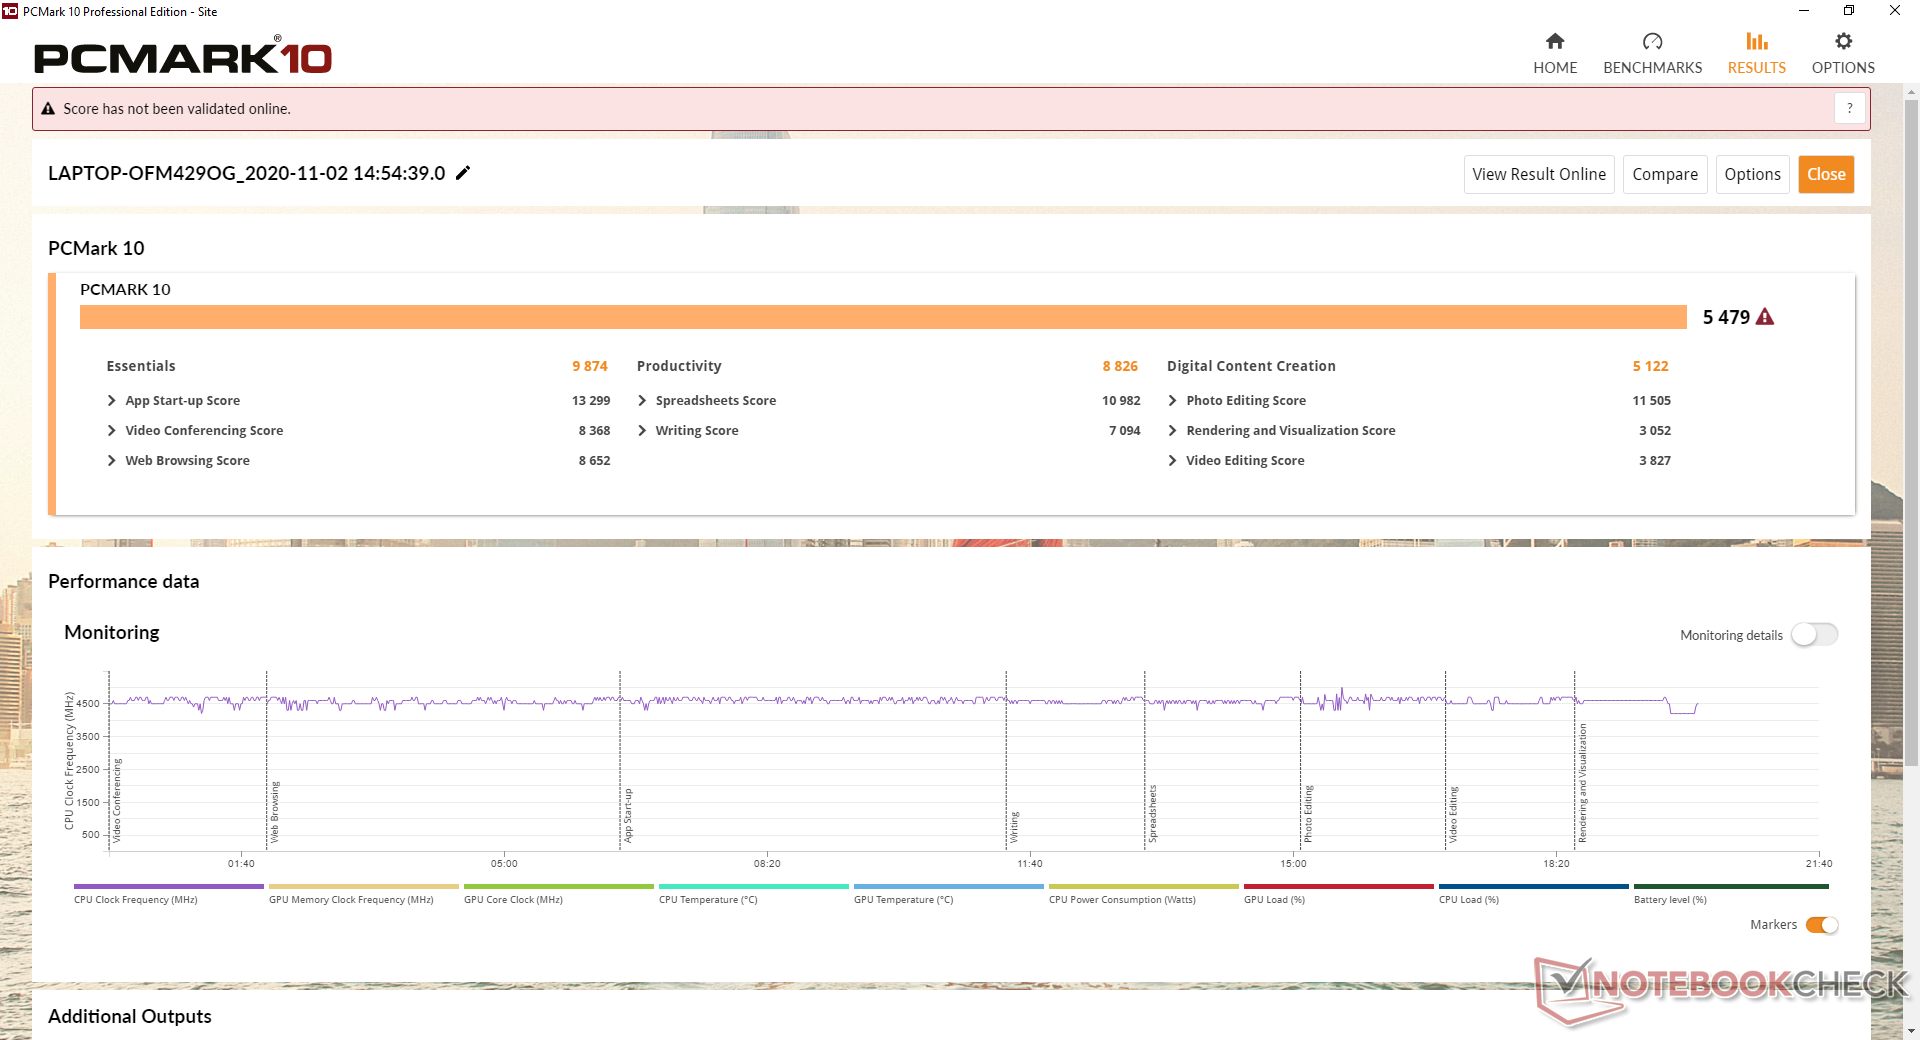
As pontuações PCMark 10 estão onde esperamos que estejam, exceto na Criação de Conteúdo Digital onde nosso sistema tem pontuações mais baixas que a G512LI. Suspeitamos que as taxas de gravação lenta de nosso SSD Toshiba M.2 pode ser o culpado, já que a maioria dos outros laptops desta categoria tendem a vir com unidades de armazenamento muito mais rápidas. O Samsung PM981a, por exemplo, é quase três vezes mais rápido neste aspecto.
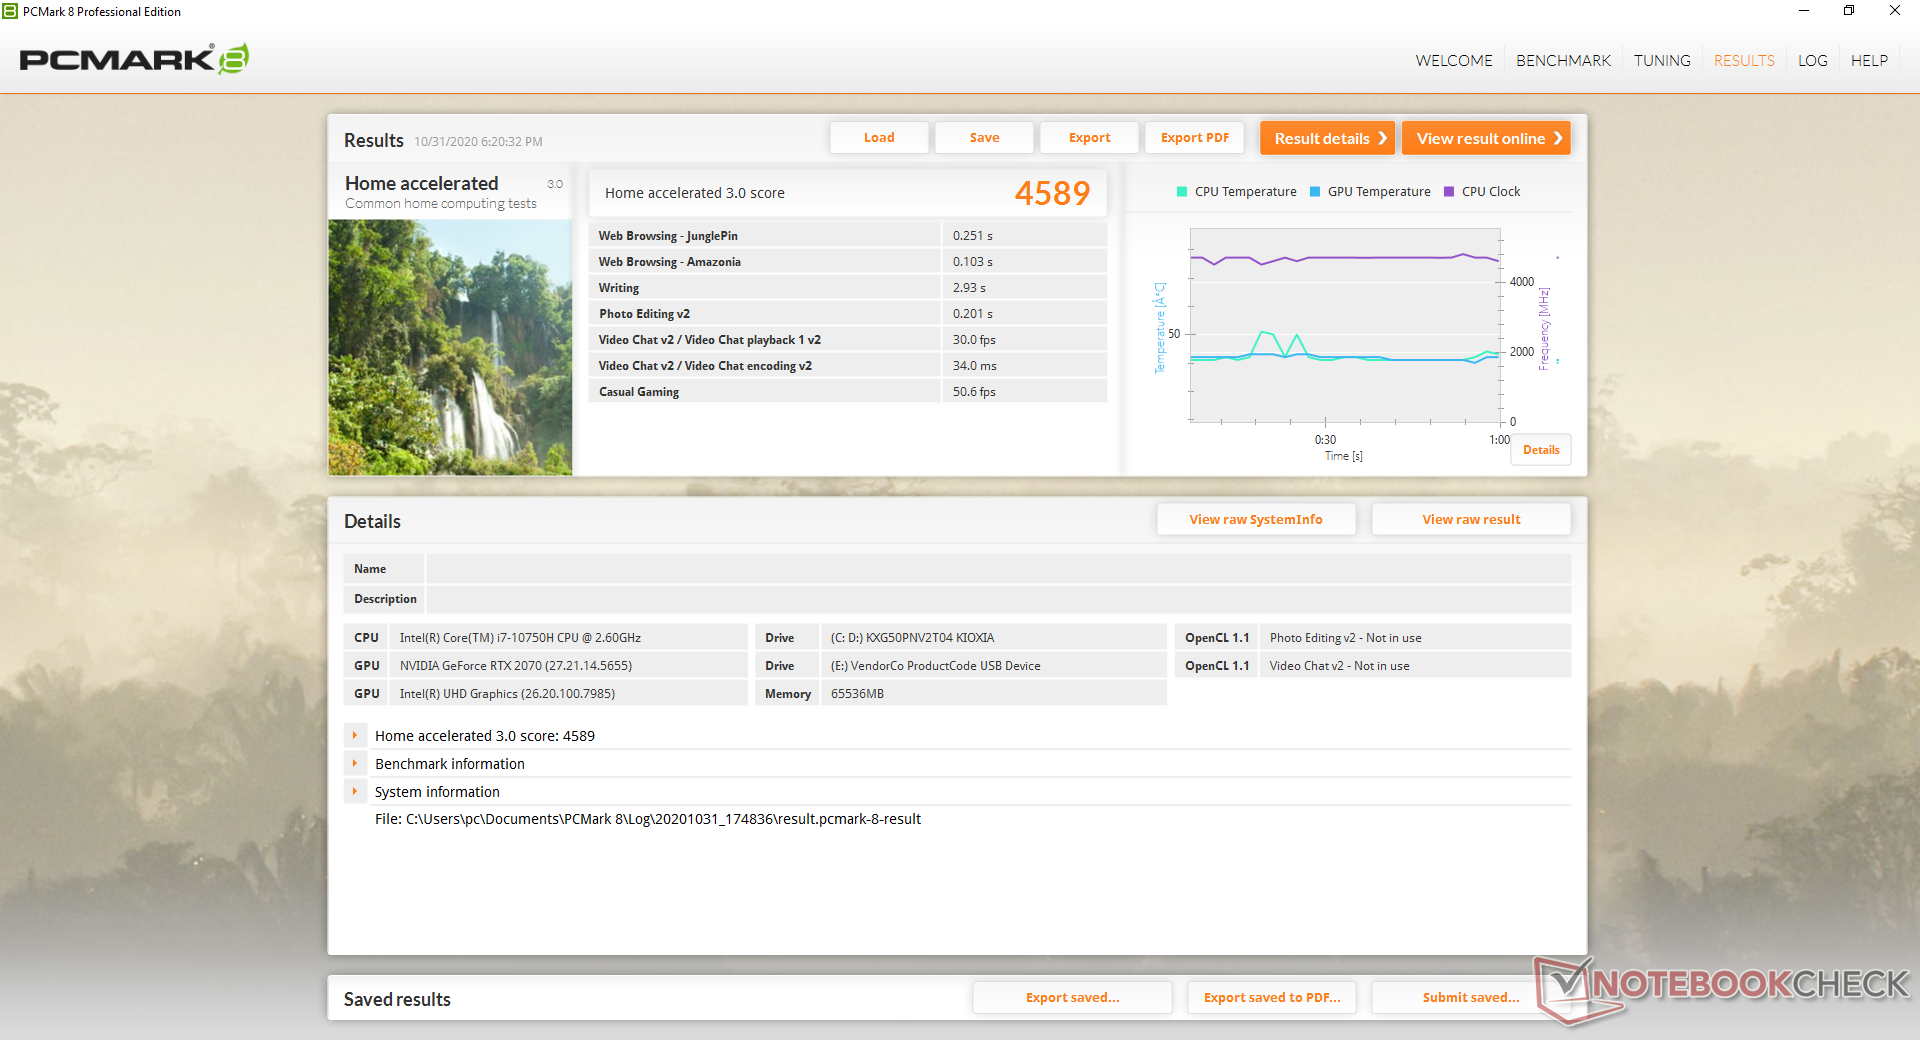
| PCMark 8 Home Score Accelerated v2 | 4589 pontos | |
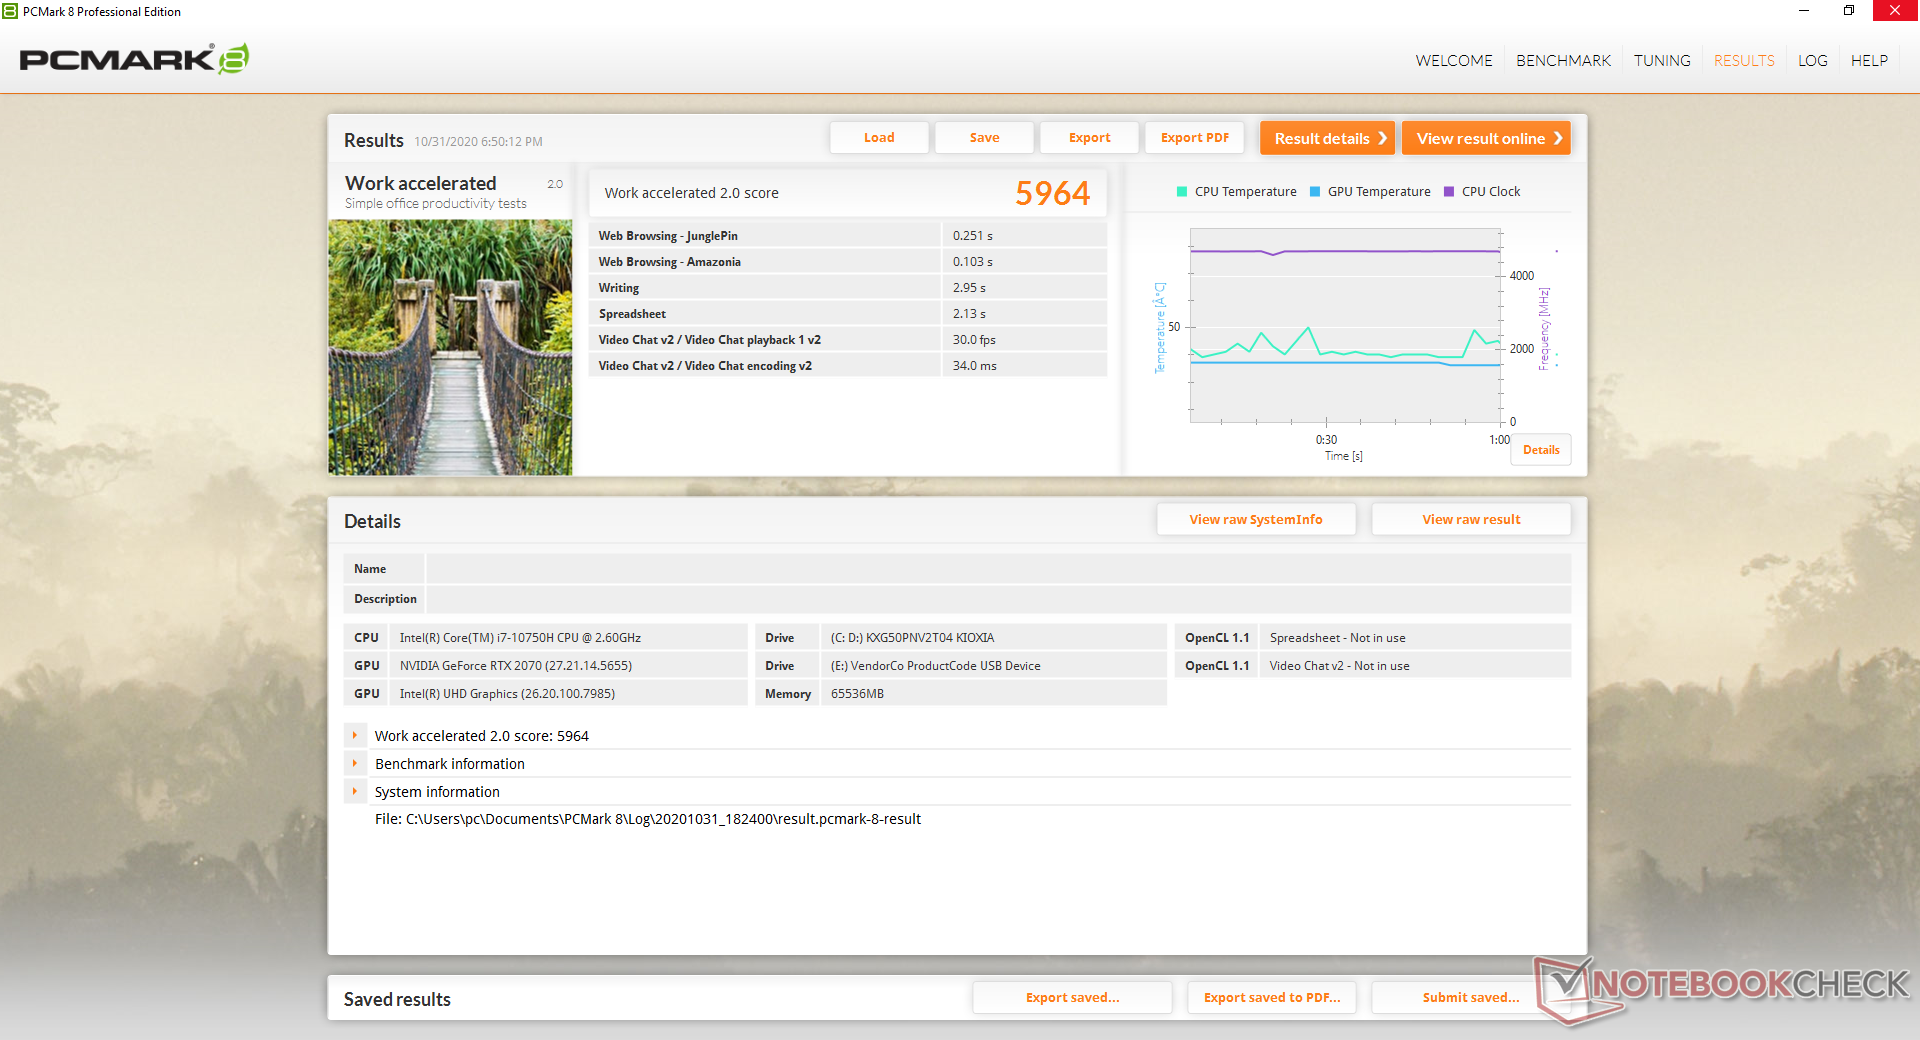
| PCMark 8 Work Score Accelerated v2 | 5964 pontos | |
| PCMark 10 Score | 5479 pontos | |
Ajuda | ||
Latência do DPC
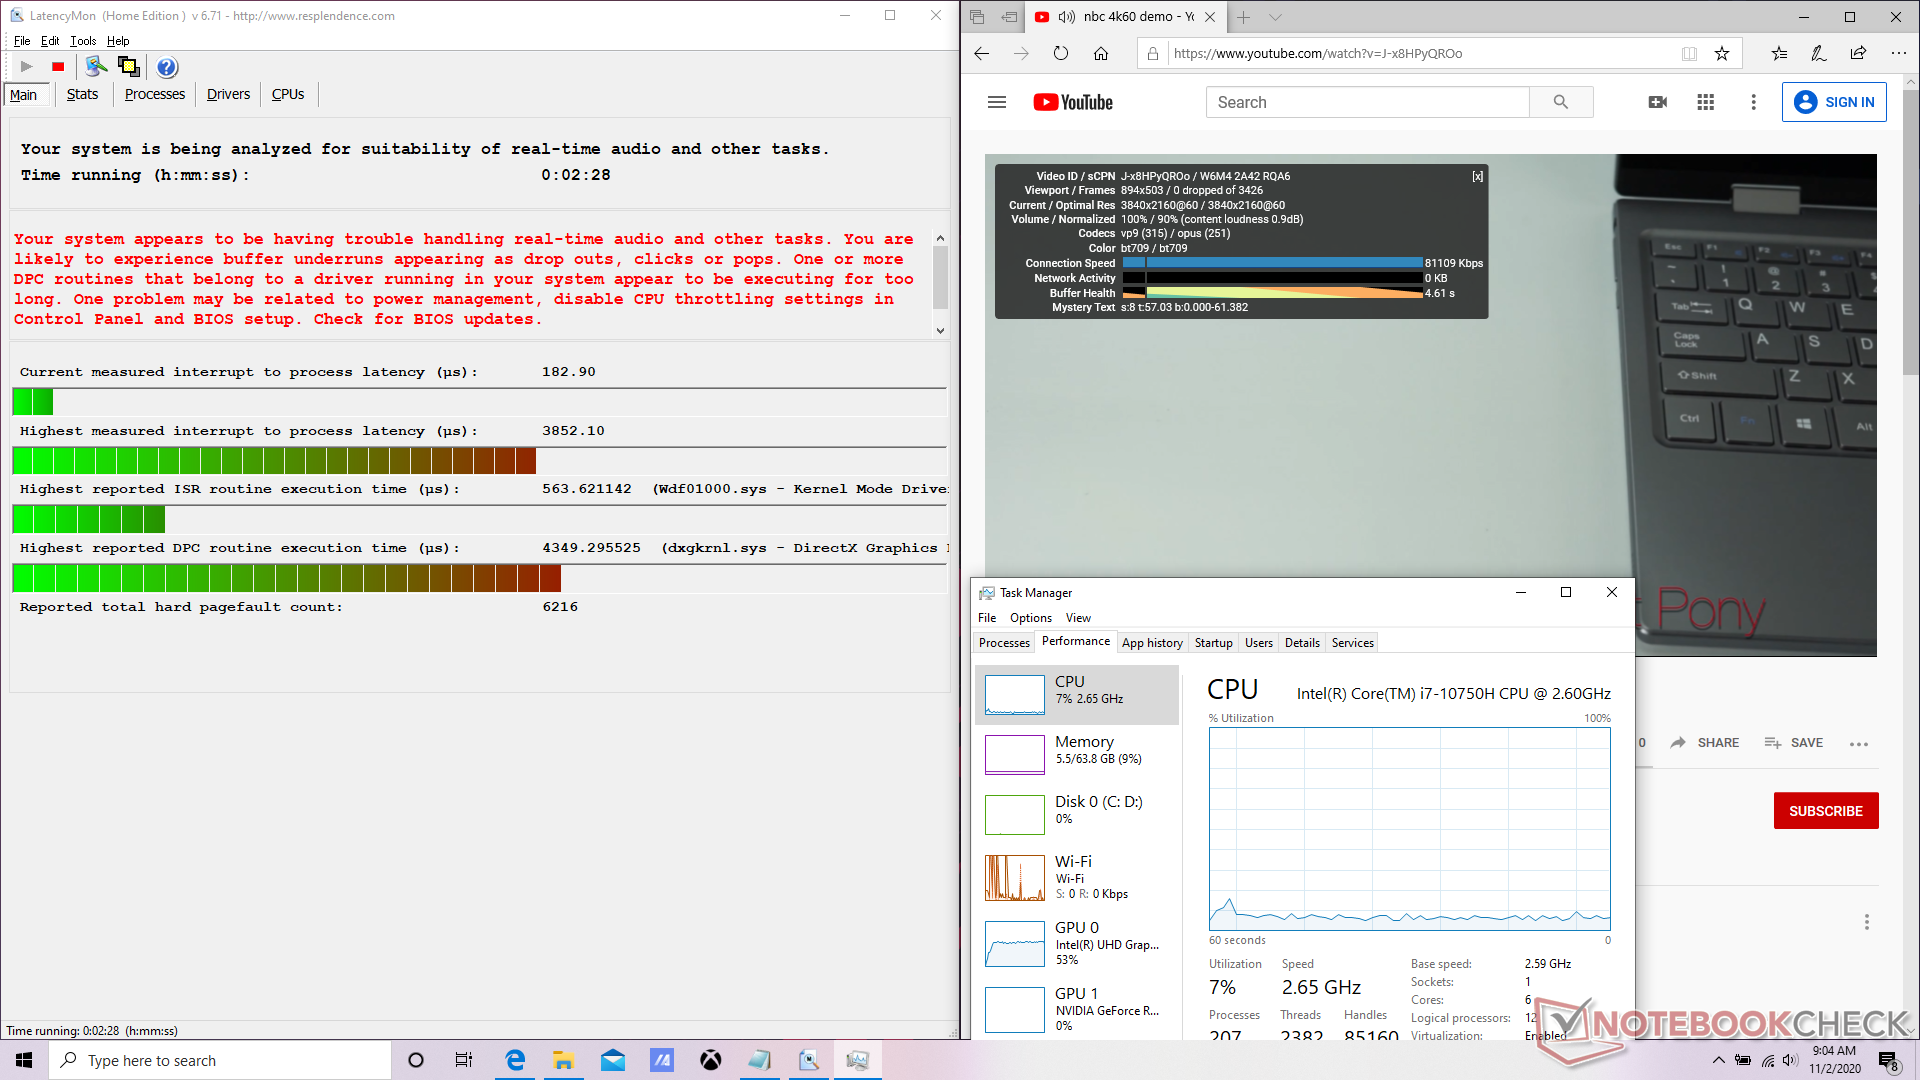
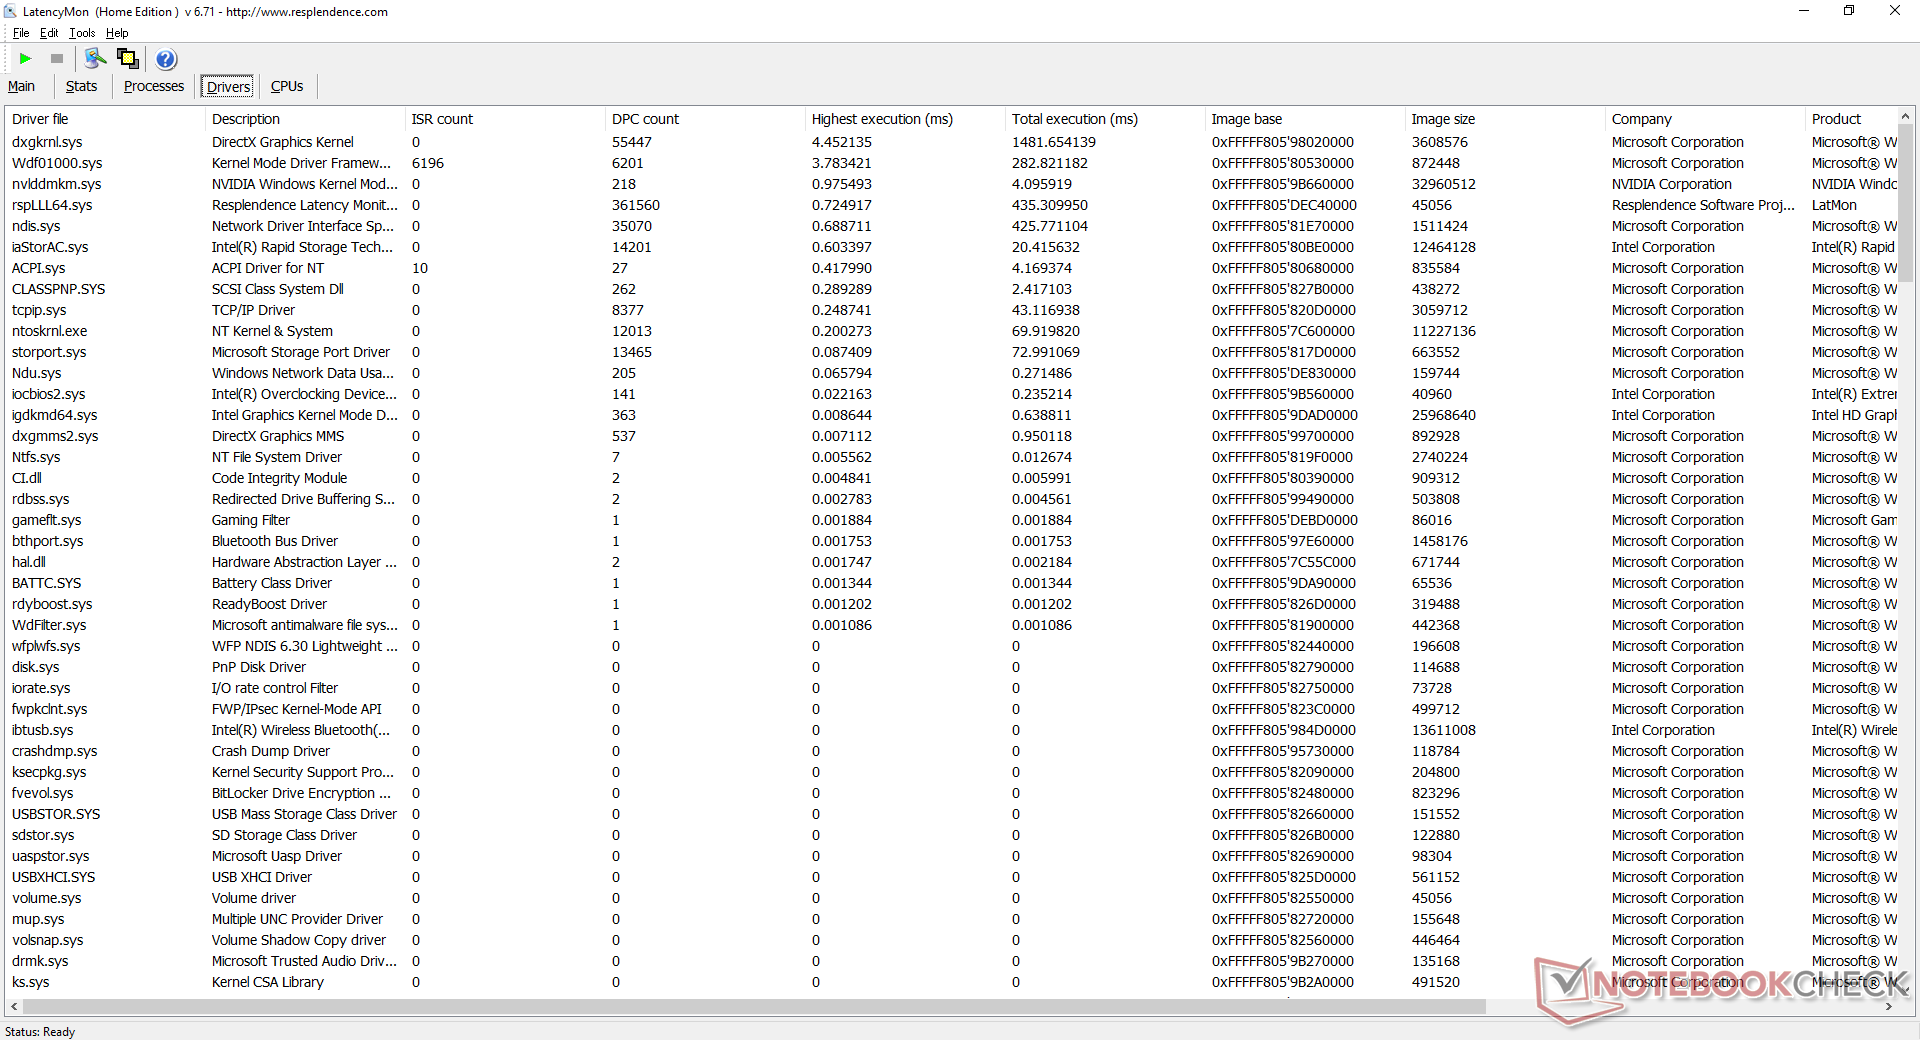
| DPC Latencies / LatencyMon - interrupt to process latency (max), Web, Youtube, Prime95 | |
| Asus ROG Strix G15 G512LW | |
| Razer Blade 15 RTX 2070 Super Max-Q | |
| Asus ROG Strix Scar 15 G532LWS | |
| Asus ROG Strix G15 G512LI | |
| Alienware m15 R3 P87F | |
| MSI GP65 10SFK-047US | |
* ... menor é melhor
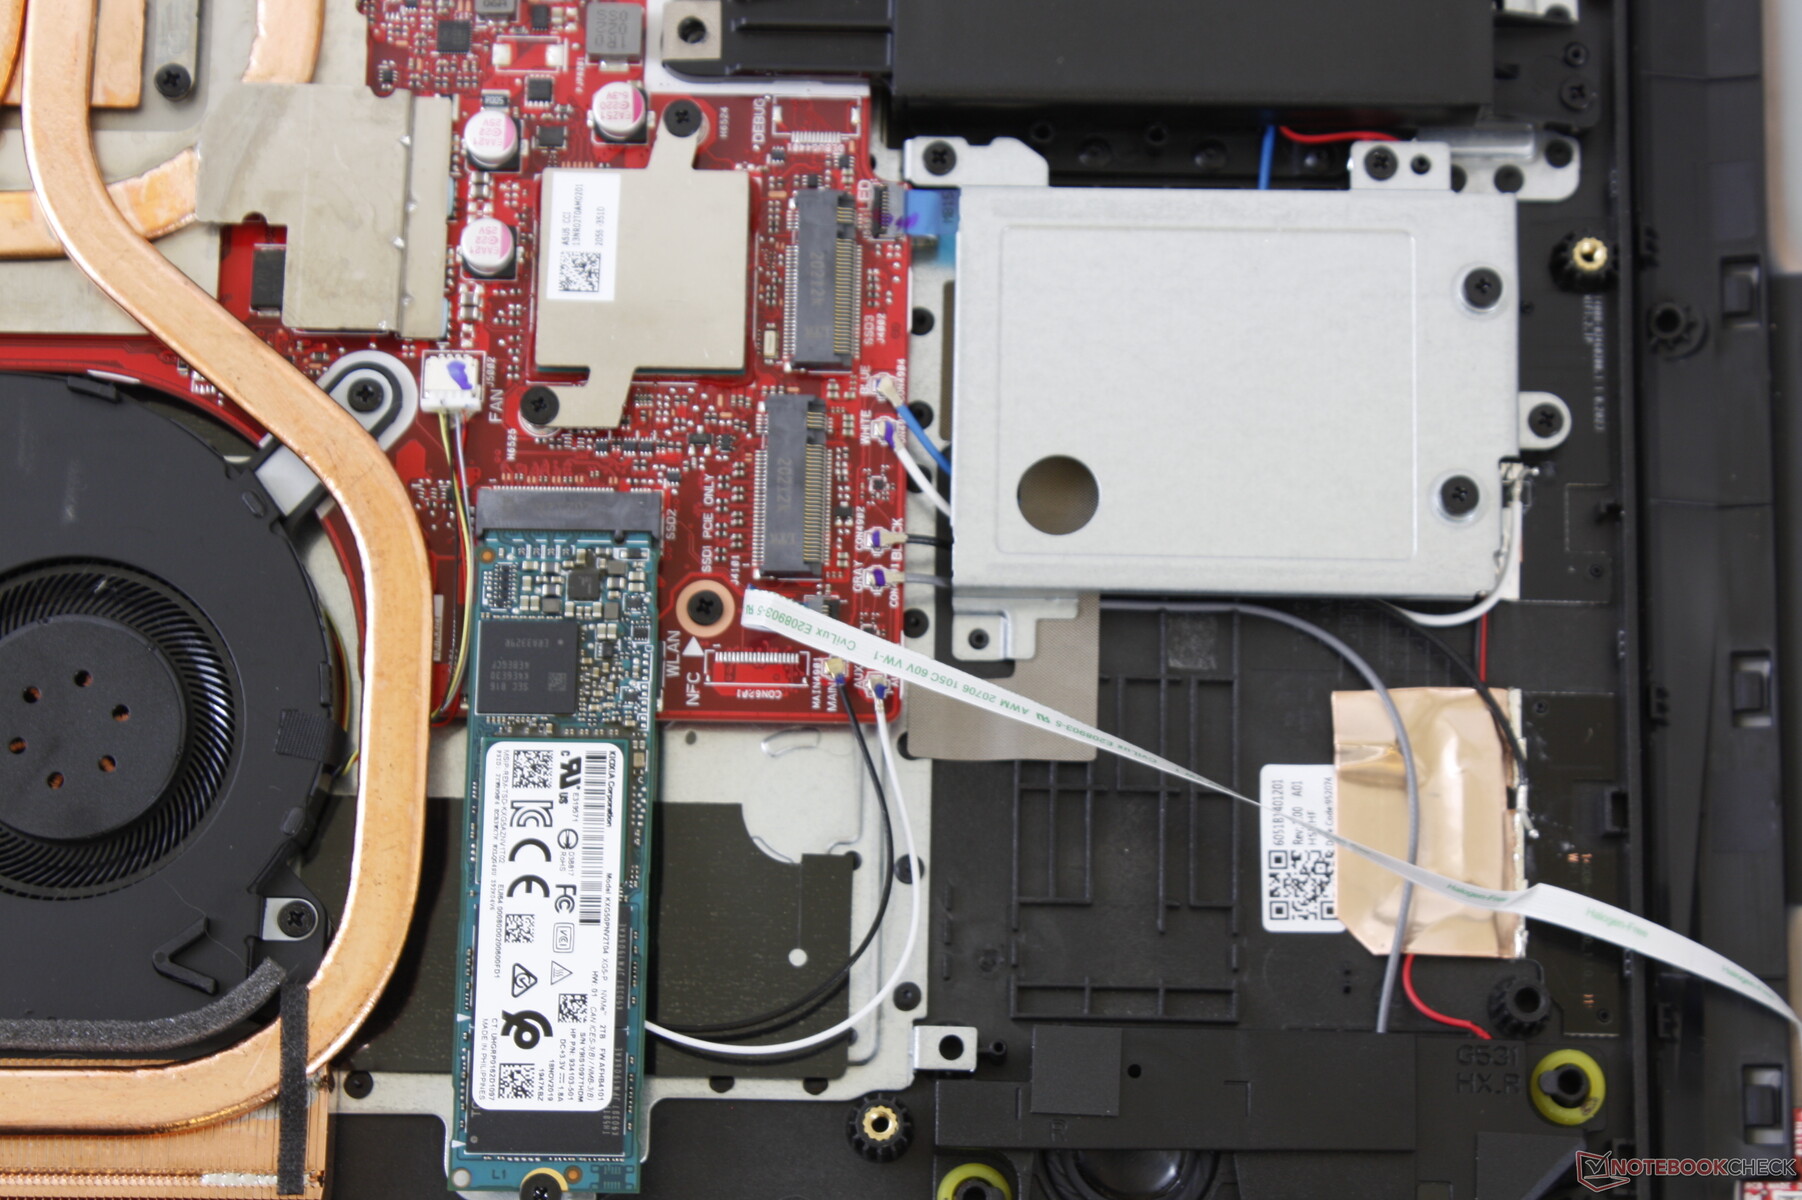
Dispositivos de armazenamento
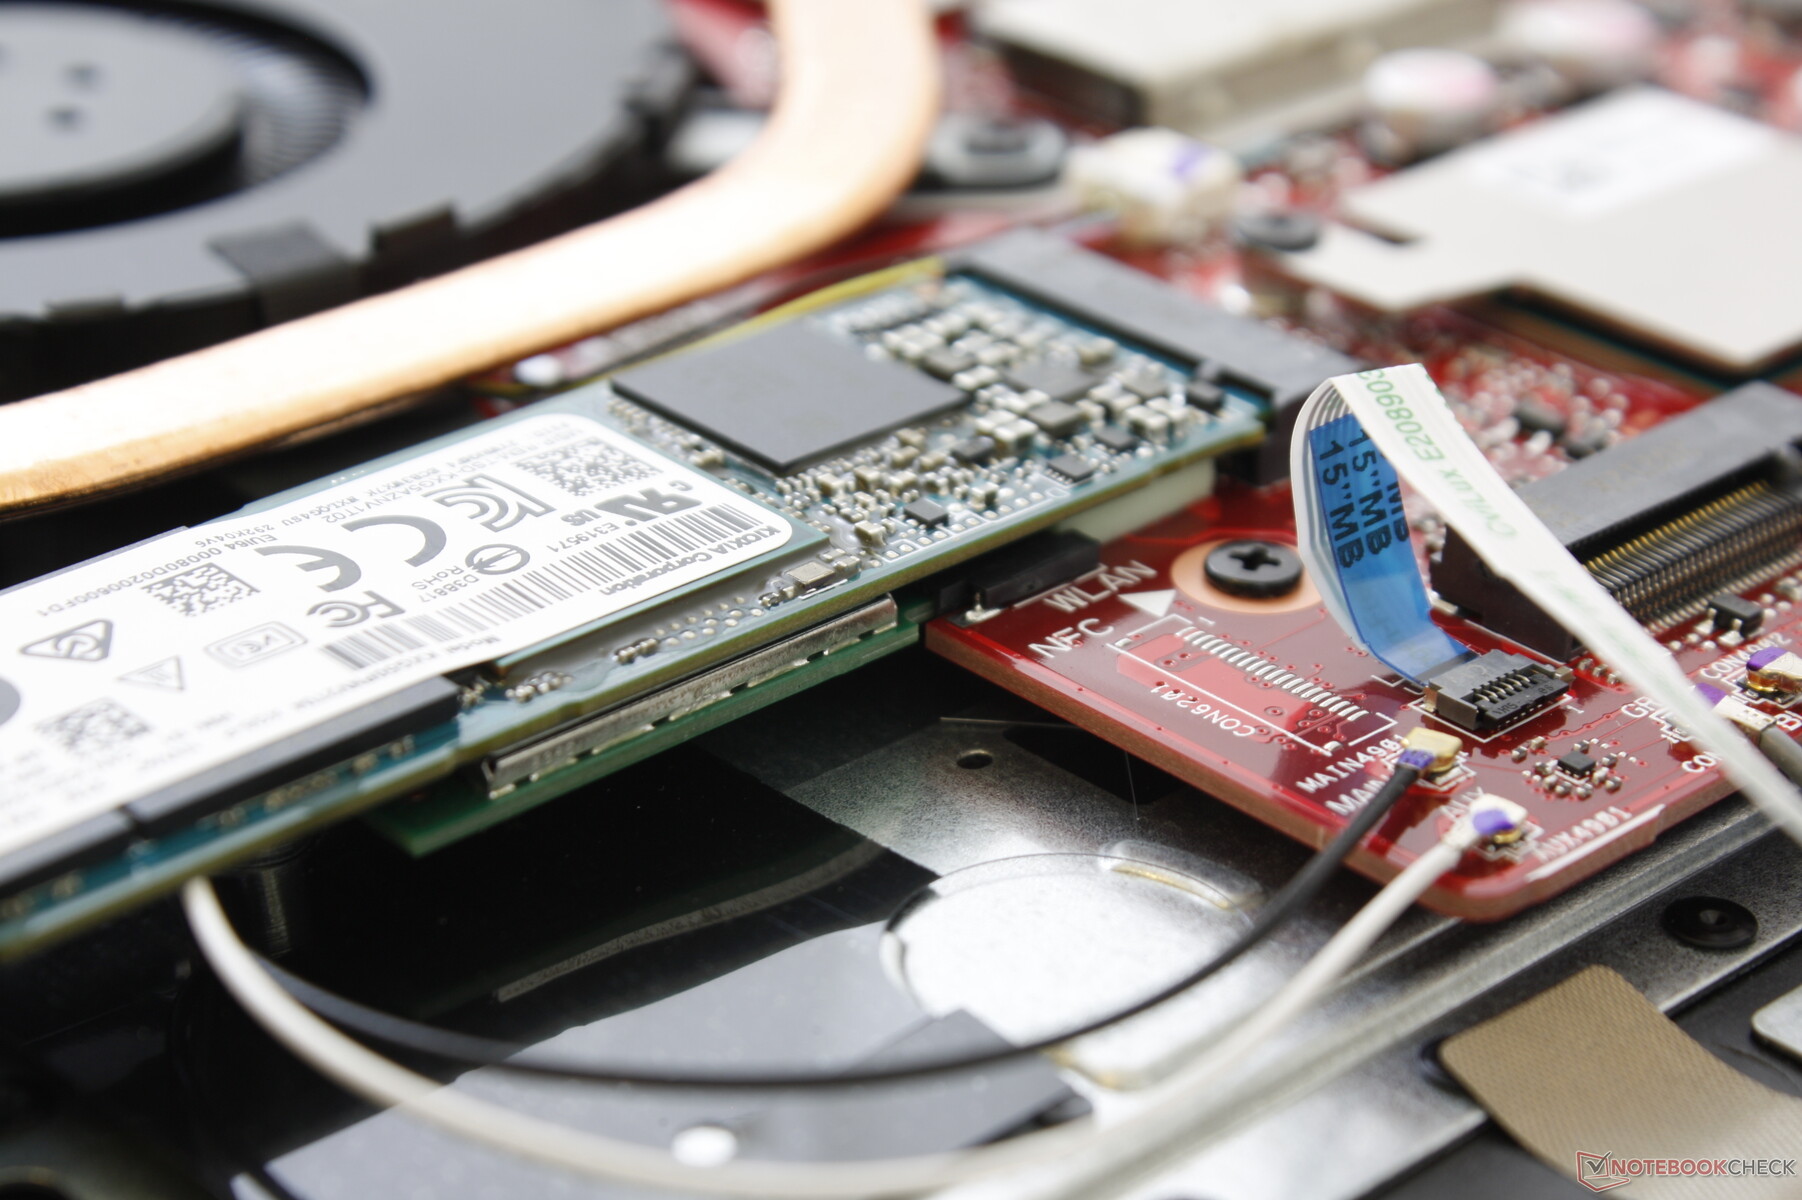
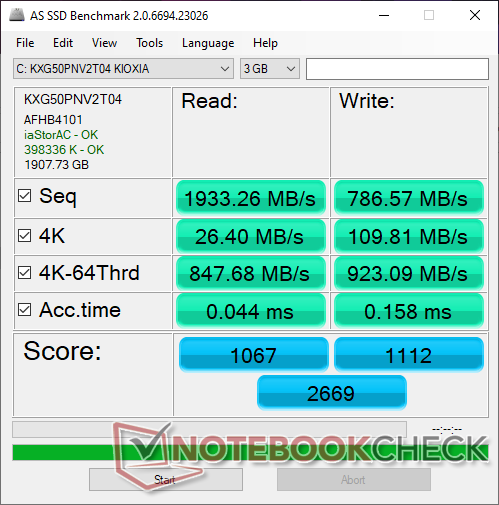
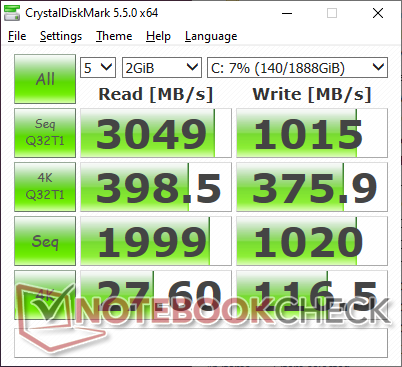
A CUKUSA configurou nossa unidade com um Toshiba XG5-P M.2 NVMe SSD de 2 TB. Embora as taxas de leitura sequencial sejam rápidas, as taxas de gravação são lentas para um SSD PCIe em apenas cerca de 790 MB/s, de acordo com o AS SSD.
| Asus ROG Strix G15 G512LW Toshiba XG5-P KXG50PNV2T04 | Asus ROG Strix G15 G512LI Intel SSD 660p SSDPEKNW512G8 | Razer Blade 15 RTX 2070 Super Max-Q Samsung SSD PM981a MZVLB512HBJQ | Asus ROG Strix Scar 15 G532LWS 2x Intel SSD 660p 1TB SSDPEKNW010T8 (RAID 0) | Alienware m15 R3 P87F 2x Micron 2200S 512 GB (RAID 0) | |
|---|---|---|---|---|---|
| AS SSD | -24% | 46% | 29% | 14% | |
| Seq Read (MB/s) | 1933 | 1157 -40% | 1957 1% | 1982 3% | 2058 6% |
| Seq Write (MB/s) | 787 | 675 -14% | 2092 166% | 1444 83% | 2316 194% |
| 4K Read (MB/s) | 26.4 | 49.99 89% | 50.2 90% | 50.3 91% | 39.72 50% |
| 4K Write (MB/s) | 109.8 | 114 4% | 96.5 -12% | 120.1 9% | 62.9 -43% |
| 4K-64 Read (MB/s) | 848 | 322.2 -62% | 1594 88% | 1016 20% | 1334 57% |
| 4K-64 Write (MB/s) | 923 | 759 -18% | 2005 117% | 1351 46% | 1271 38% |
| Access Time Read * (ms) | 0.044 | 0.07 -59% | 0.057 -30% | 0.044 -0% | 0.062 -41% |
| Access Time Write * (ms) | 0.158 | 0.137 13% | 0.112 29% | 0.109 31% | 0.388 -146% |
| Score Read (Points) | 1067 | 488 -54% | 1840 72% | 1264 18% | 1580 48% |
| Score Write (Points) | 1112 | 940 -15% | 2310 108% | 1615 45% | 1565 41% |
| Score Total (Points) | 2669 | 1673 -37% | 5103 91% | 3510 32% | 3968 49% |
| Copy ISO MB/s (MB/s) | 3210 | 939 -71% | 1793 -44% | 3474 8% | 1685 -48% |
| Copy Program MB/s (MB/s) | 728 | 489.9 -33% | 573 -21% | 751 3% | 669 -8% |
| Copy Game MB/s (MB/s) | 1499 | 895 -40% | 1418 -5% | 1684 12% | 1493 0% |
| CrystalDiskMark 5.2 / 6 | 1% | 62% | 51% | 46% | |
| Write 4K (MB/s) | 116.5 | 125.4 8% | 139.8 20% | 128.4 10% | 67.3 -42% |
| Read 4K (MB/s) | 27.6 | 52.7 91% | 48.62 76% | 53.7 95% | 41.47 50% |
| Write Seq (MB/s) | 1020 | 943 -8% | 2260 122% | 1875 84% | 2239 120% |
| Read Seq (MB/s) | 1999 | 1383 -31% | 2135 7% | 2315 16% | 2112 6% |
| Write 4K Q32T1 (MB/s) | 375.9 | 437.9 16% | 499.3 33% | 427.2 14% | 488.9 30% |
| Read 4K Q32T1 (MB/s) | 398.5 | 334.9 -16% | 552 39% | 440.7 11% | 557 40% |
| Write Seq Q32T1 (MB/s) | 1015 | 960 -5% | 2960 192% | 2793 175% | 2654 161% |
| Read Seq Q32T1 (MB/s) | 3049 | 1530 -50% | 3269 7% | 3101 2% | 3137 3% |
| Média Total (Programa/Configurações) | -12% /
-15% | 54% /
52% | 40% /
37% | 30% /
26% |
* ... menor é melhor

Disk Throttling: DiskSpd Read Loop, Queue Depth 8
Desempenho da GPU
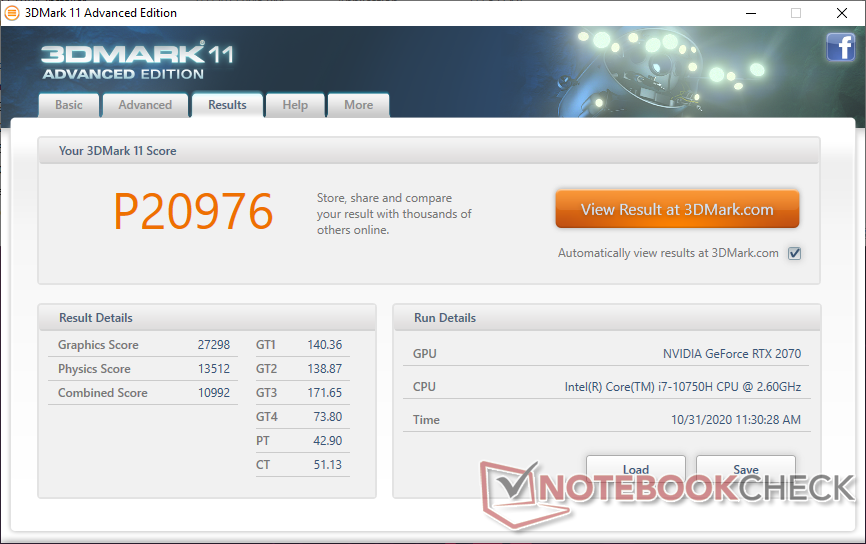
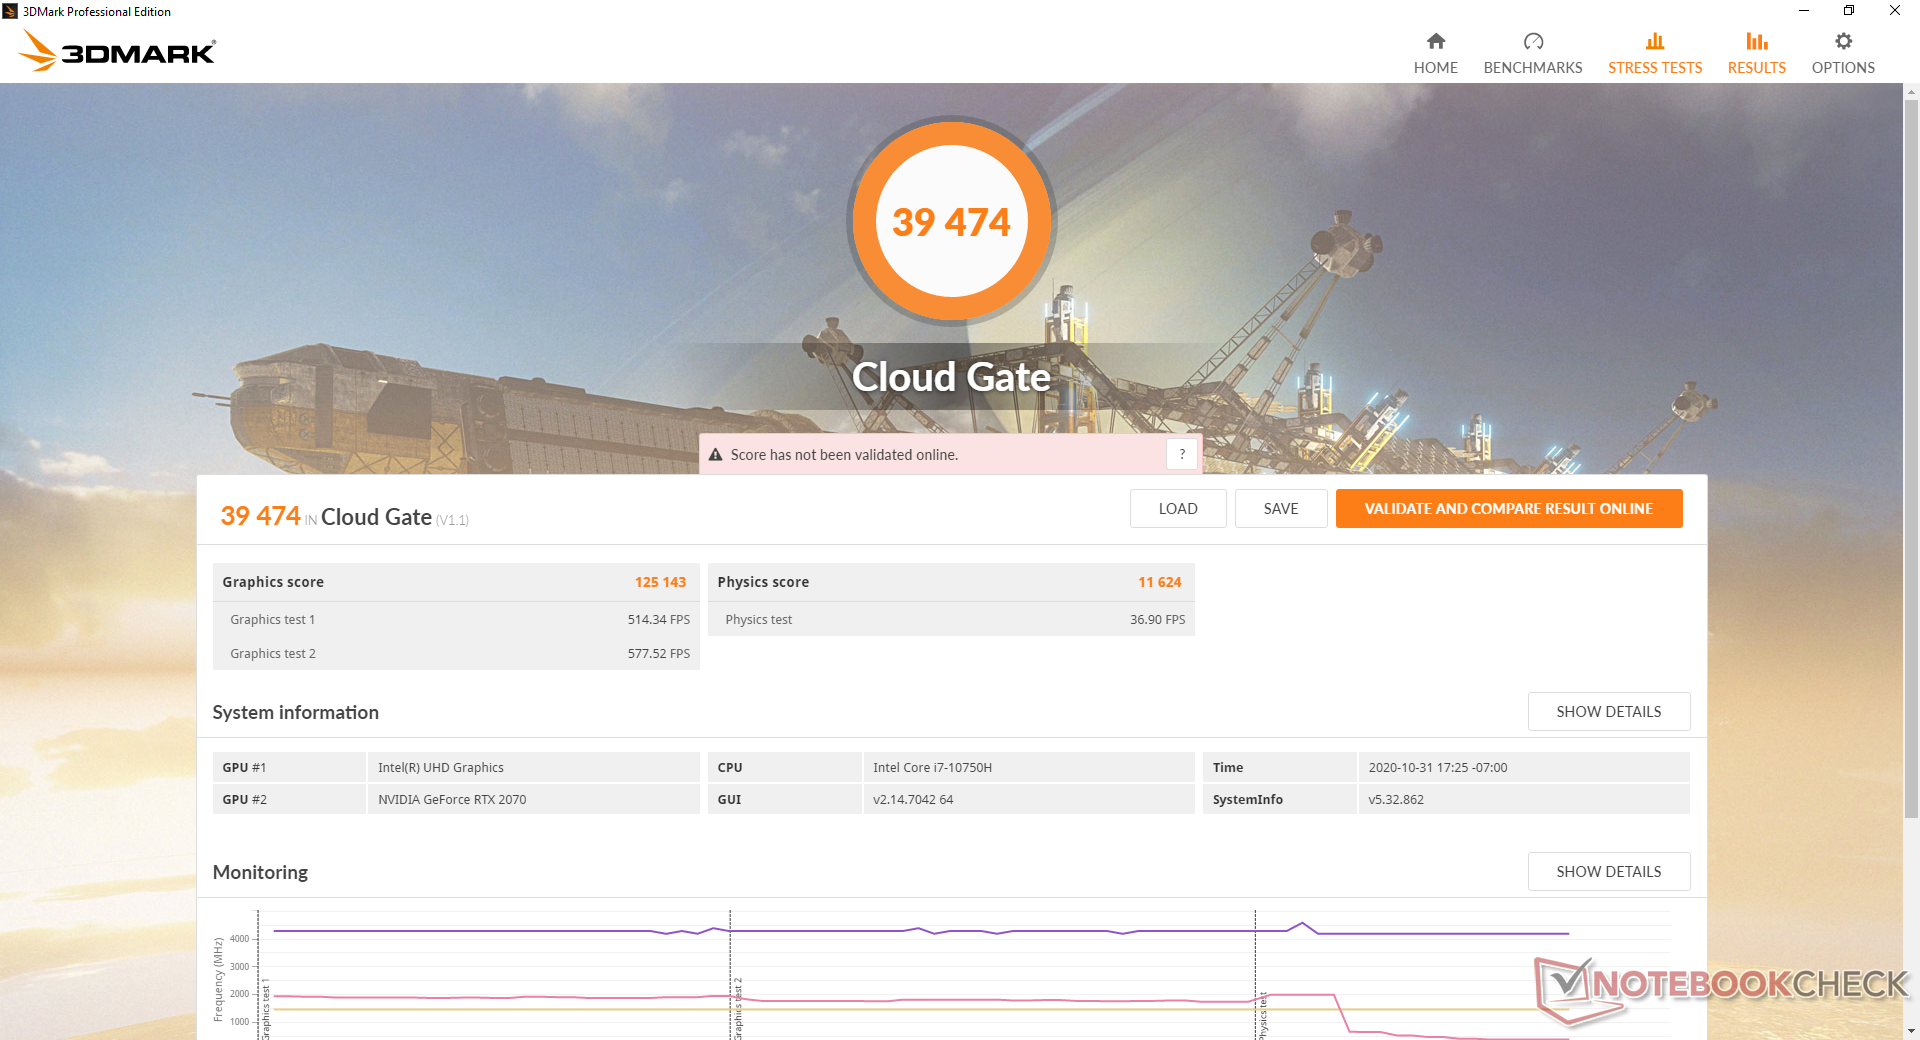
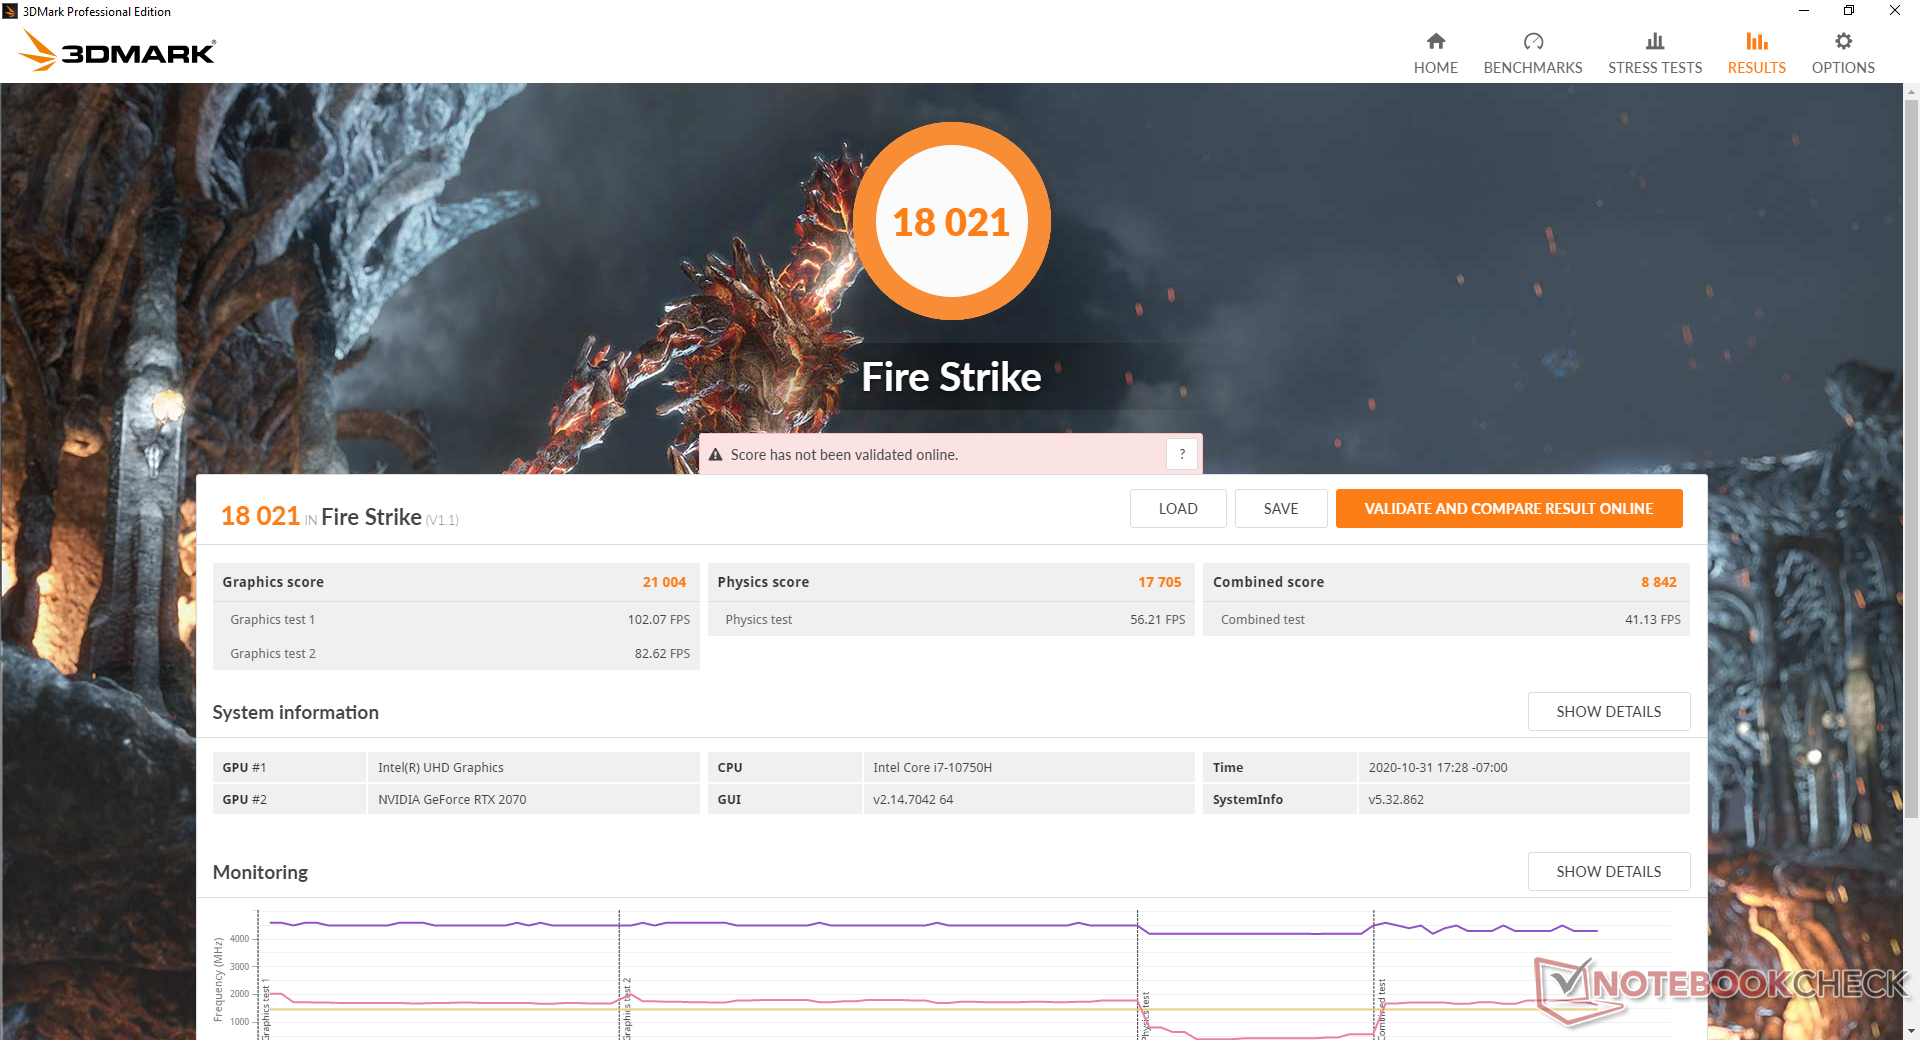
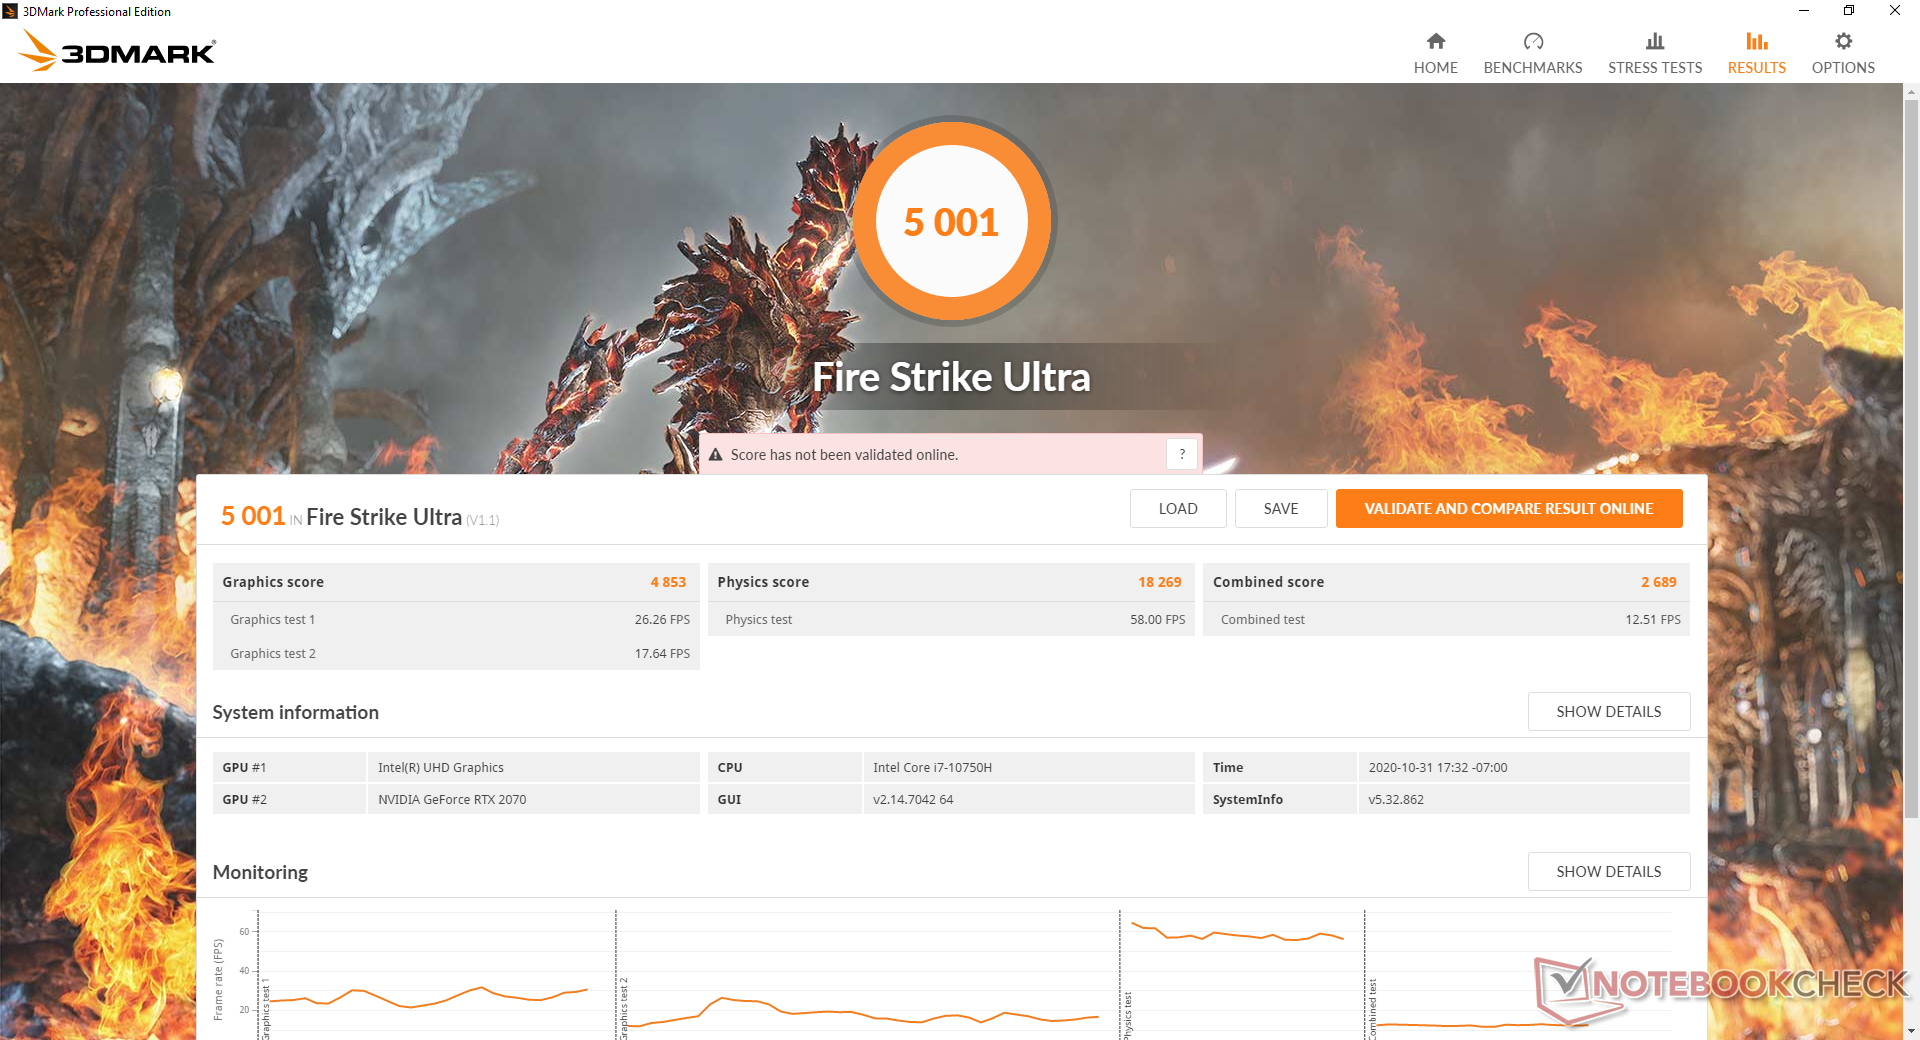
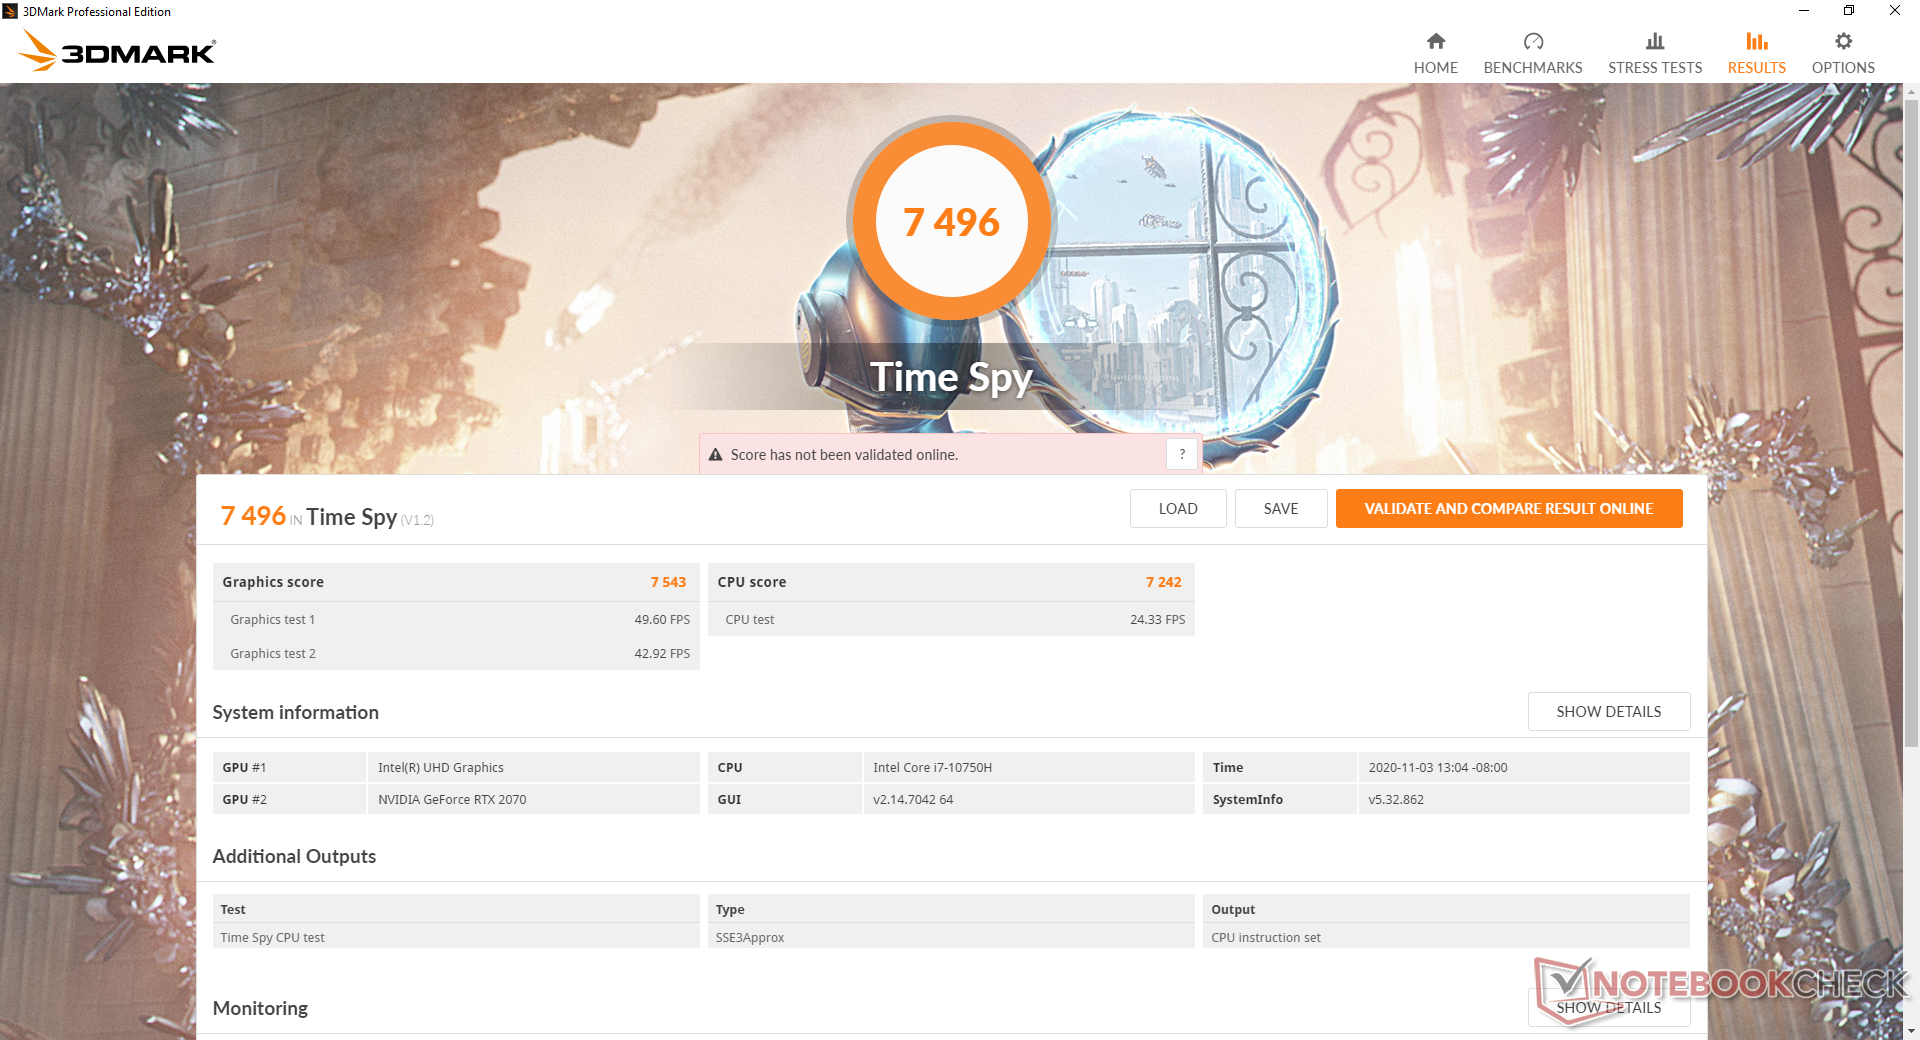
O desempenho gráfico está dentro de alguns pontos percentuais da média móvel da GeForce RTX 2070 em nosso banco de dados. Uma GeForce RTX 2070 de mesa completa é cerca de 10 a 20 por cento mais rápida de acordo com os 3DMark benchmarks. A escolha da G512LW em vez da GTX 1650 Ti-powered G512LI irá proporcionar aos usuários aproximadamente duas vezes mais potência gráfica.
Observe que o desempenho gráfico é ligeiramente mais rápido quando ajustado para o modo Turbo (7826 pontos nos gráficos Time Spy) versus o modo Performance (7543 pontos).

| 3DMark 11 | |
| 1280x720 Performance GPU | |
| Asus Strix Scar 17 G732LXS | |
| Asus ROG Strix RTX 2070 OC | |
| Asus Zephyrus S15 GX502L | |
| Asus ROG Strix G15 G512LW | |
| Asus ROG Zephyrus Duo 15 GX550LXS | |
| MSI RTX 2060 Gaming Z 6G | |
| Média NVIDIA GeForce RTX 2070 Mobile (23335 - 27298, n=21) | |
| Dell G5 15 SE 5505 P89F | |
| Asus ROG Zephyrus M15 GU502LU-BI7N4 | |
| Asus ROG Zephyrus M15 GU502L | |
| Aorus 5 KB | |
| Asus ROG Strix G15 G512LI | |
| HP Pavilion Gaming 15-ec1206ng | |
| 1280x720 Performance Combined | |
| Asus Strix Scar 17 G732LXS | |
| Asus ROG Zephyrus Duo 15 GX550LXS | |
| Asus ROG Strix RTX 2070 OC | |
| MSI RTX 2060 Gaming Z 6G | |
| Asus Zephyrus S15 GX502L | |
| Dell G5 15 SE 5505 P89F | |
| Asus ROG Zephyrus M15 GU502LU-BI7N4 | |
| Asus ROG Strix G15 G512LI | |
| Asus ROG Zephyrus M15 GU502L | |
| Média NVIDIA GeForce RTX 2070 Mobile (8716 - 16364, n=21) | |
| Aorus 5 KB | |
| Asus ROG Strix G15 G512LW | |
| HP Pavilion Gaming 15-ec1206ng | |
| 3DMark 11 Performance | 20976 pontos | |
| 3DMark Cloud Gate Standard Score | 39474 pontos | |
| 3DMark Fire Strike Score | 18021 pontos | |
| 3DMark Time Spy Score | 7718 pontos | |
Ajuda | ||
| baixo | média | alto | ultra | |
|---|---|---|---|---|
| GTA V (2015) | 178 | 170 | 148 | 82 |
| The Witcher 3 (2015) | 303.3 | 227.2 | 144.5 | 78.2 |
| Dota 2 Reborn (2015) | 149 | 130 | 124 | 117 |
| Final Fantasy XV Benchmark (2018) | 151 | 106 | 80.6 | |
| X-Plane 11.11 (2018) | 105 | 90.5 | 77.5 | |
| Strange Brigade (2018) | 313 | 183 | 149 | 125 |
Emissions
Ruído do sistema
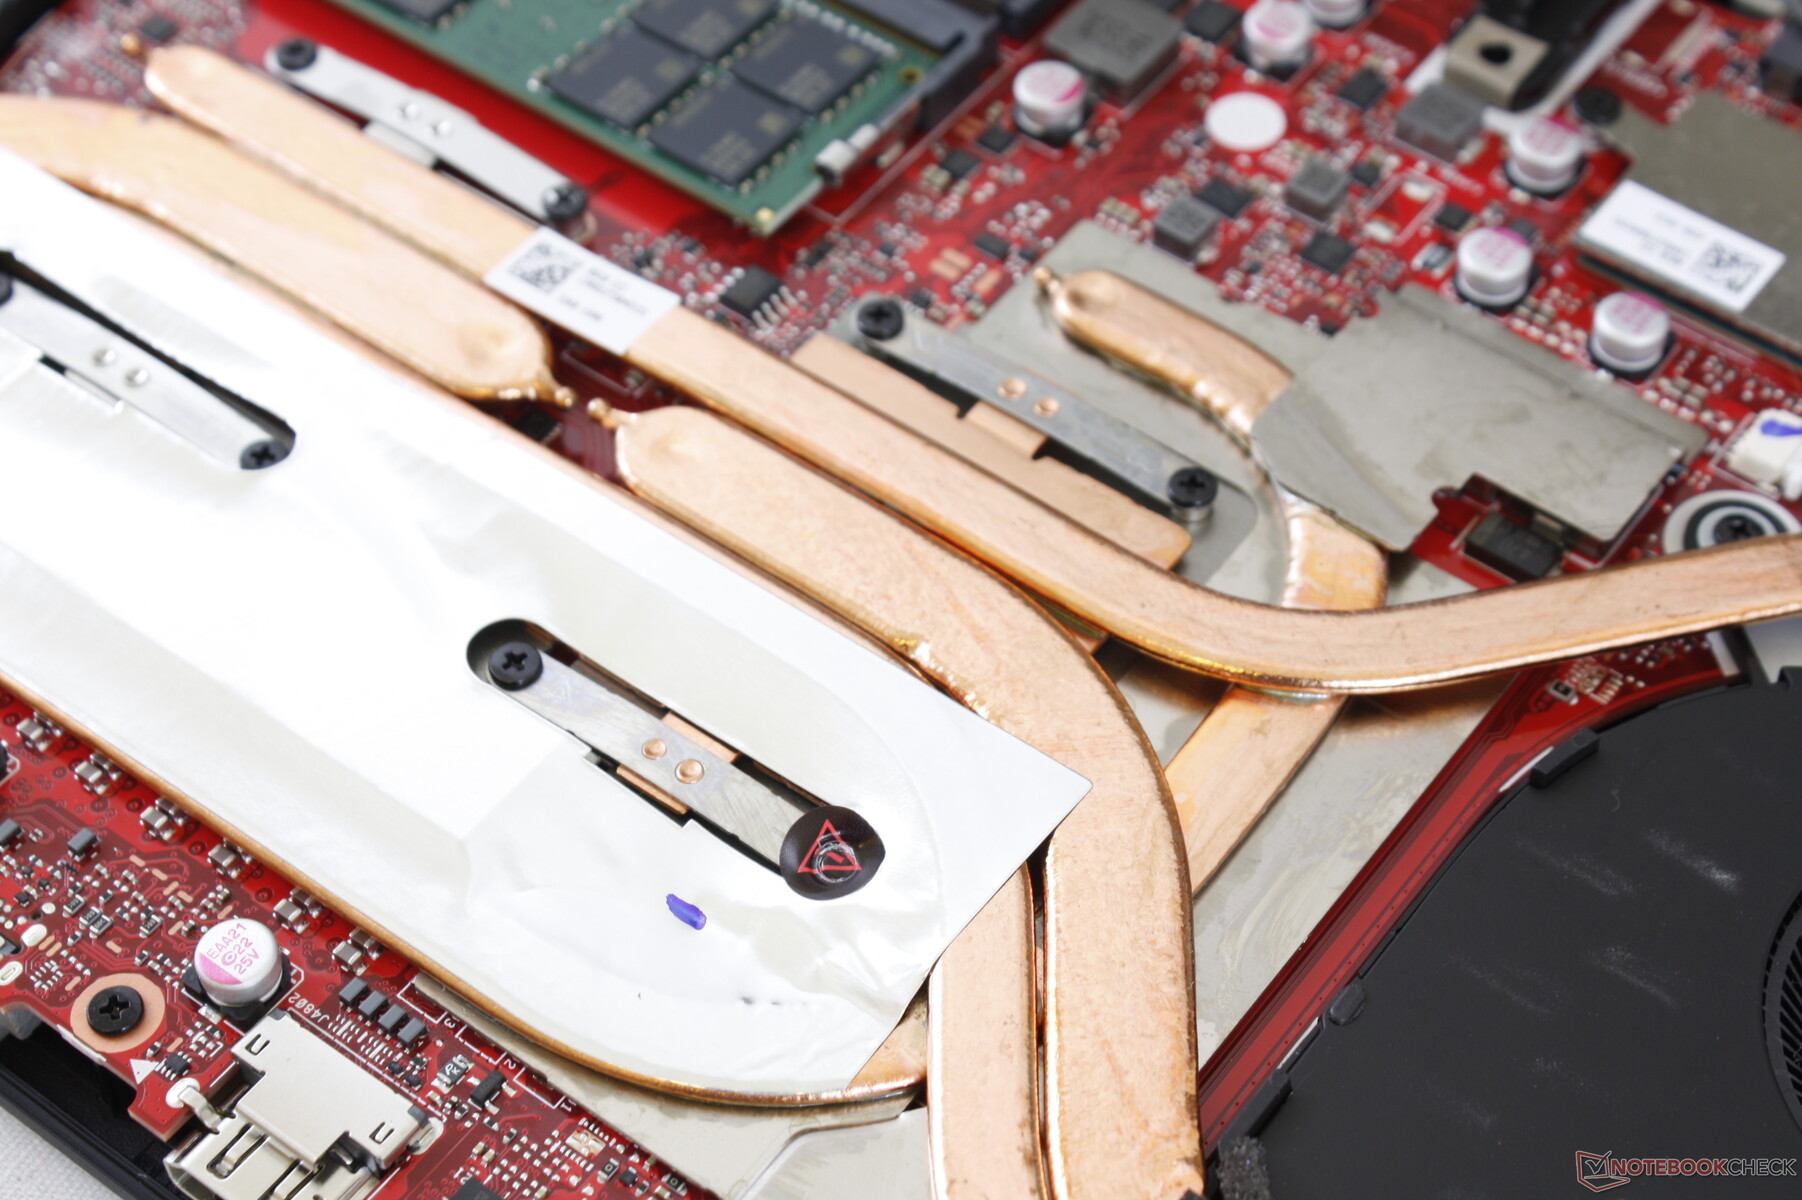
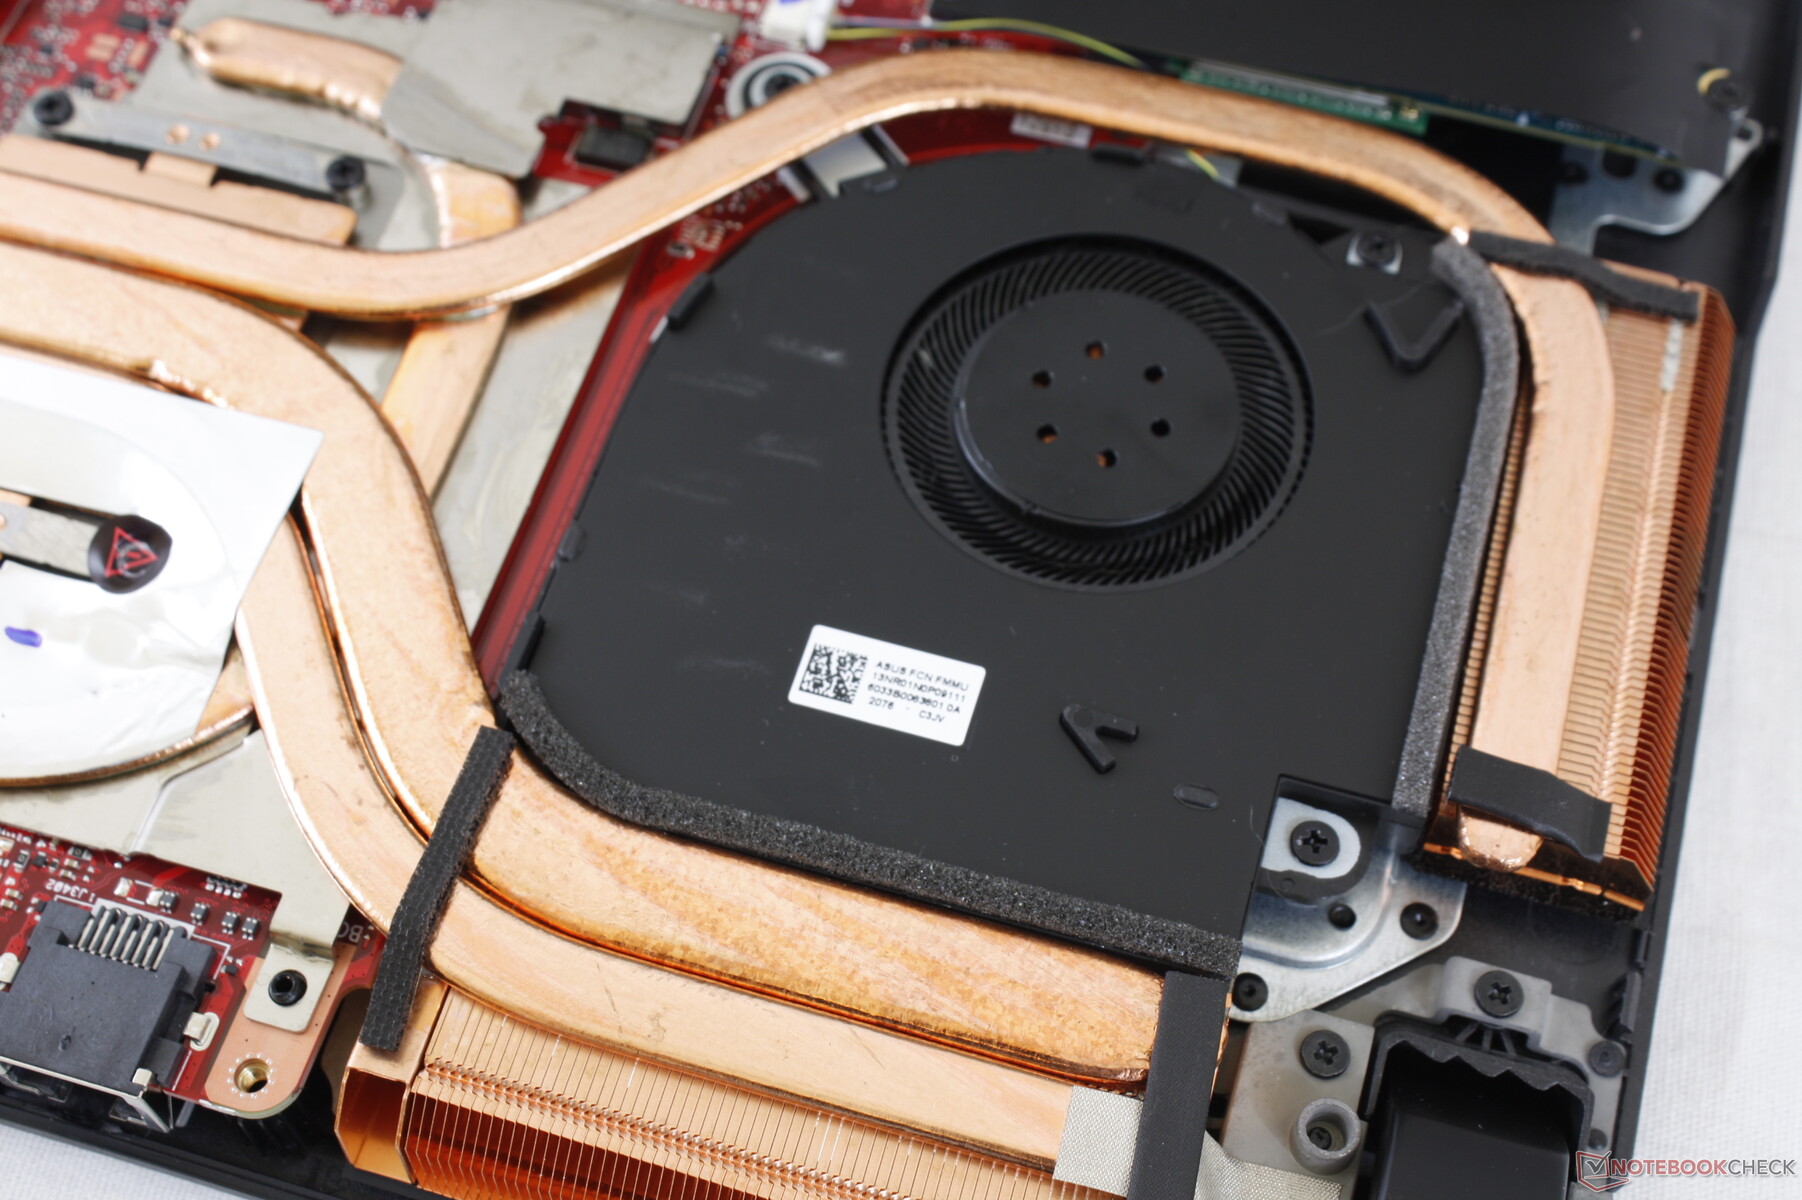
O ruído dos ventiladores é mais alto do que o que gravamos no G512LI, apesar da solução de resfriamento de resfriamento. Rodando Witcher 3 em modo de desempenho e modo Turbo induziria um ruído do ventilador de 52,6 dB(A) e 54,1 dB(A), respectivamente, comparado a apenas 47,9 dB(A) a 49,3 dB(A) no G512LI. Isto é tão alto ou mais alto que o Razer Blade 15 ou MSI GP65, ambos de tamanho menor que o Asus.
Para cargas não exigentes como streaming de vídeo ou navegação na web, o sistema nunca é verdadeiramente silencioso mesmo quando configurado para o modo "Silencioso". O ruído do ventilador tende a oscilar em torno de 30 a 34 dB(A) o que, embora não seja particularmente incômodo, certamente é perceptível. Recomendamos que o ventilador funcione no modo "Silent" para reduzir a pulsação aleatória do ventilador.
| Asus ROG Strix G15 G512LW GeForce RTX 2070 Mobile, i7-10750H, Toshiba XG5-P KXG50PNV2T04 | Asus ROG Strix G15 G512LI GeForce GTX 1650 Ti Mobile, i7-10750H, Intel SSD 660p SSDPEKNW512G8 | Razer Blade 15 RTX 2070 Super Max-Q GeForce RTX 2070 Super Max-Q, i7-10875H, Samsung SSD PM981a MZVLB512HBJQ | MSI GP65 10SFK-047US GeForce RTX 2070 Mobile, i7-10750H, Samsung SSD PM981 MZVLB1T0HALR | Asus ROG Strix Scar 15 G532LWS GeForce RTX 2070 Super Mobile, i9-10980HK, 2x Intel SSD 660p 1TB SSDPEKNW010T8 (RAID 0) | Alienware m15 R3 P87F GeForce RTX 2070 Mobile, i7-10750H, 2x Micron 2200S 512 GB (RAID 0) | |
|---|---|---|---|---|---|---|
| Noise | -8% | 2% | -9% | -8% | 2% | |
| desligado / ambiente * (dB) | 25.7 | 27.7 -8% | 27 -5% | 29.3 -14% | 26.5 -3% | 26.3 -2% |
| Idle Minimum * (dB) | 25.7 | 34.2 -33% | 27 -5% | 31.9 -24% | 27.1 -5% | 26.7 -4% |
| Idle Average * (dB) | 29.7 | 36 -21% | 27 9% | 31.9 -7% | 32.2 -8% | 26.7 10% |
| Idle Maximum * (dB) | 34 | 36.6 -8% | 27 21% | 33.5 1% | 34 -0% | 30.7 10% |
| Load Average * (dB) | 38.9 | 44.3 -14% | 44.7 -15% | 47 -21% | 52.4 -35% | 40.2 -3% |
| Witcher 3 ultra * (dB) | 54.1 | 47.9 11% | 51.2 5% | 53.8 1% | 57.5 -6% | 51 6% |
| Load Maximum * (dB) | 57.4 | 49.3 14% | 54 6% | 56.7 1% | 57.5 -0% | 59.7 -4% |
* ... menor é melhor
Barulho
| Ocioso |
| 25.7 / 29.7 / 34 dB |
| Carga |
| 38.9 / 57.4 dB |
 | ||
30 dB silencioso 40 dB(A) audível 50 dB(A) ruidosamente alto |
||
min: | ||
Temperatura
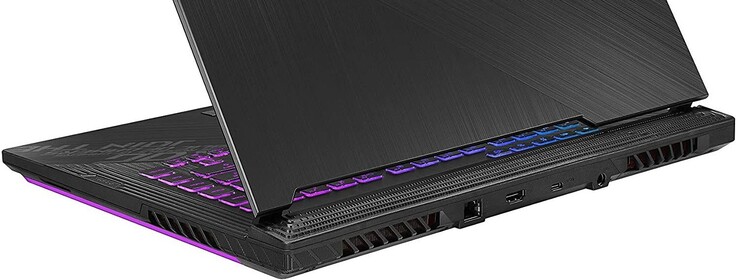
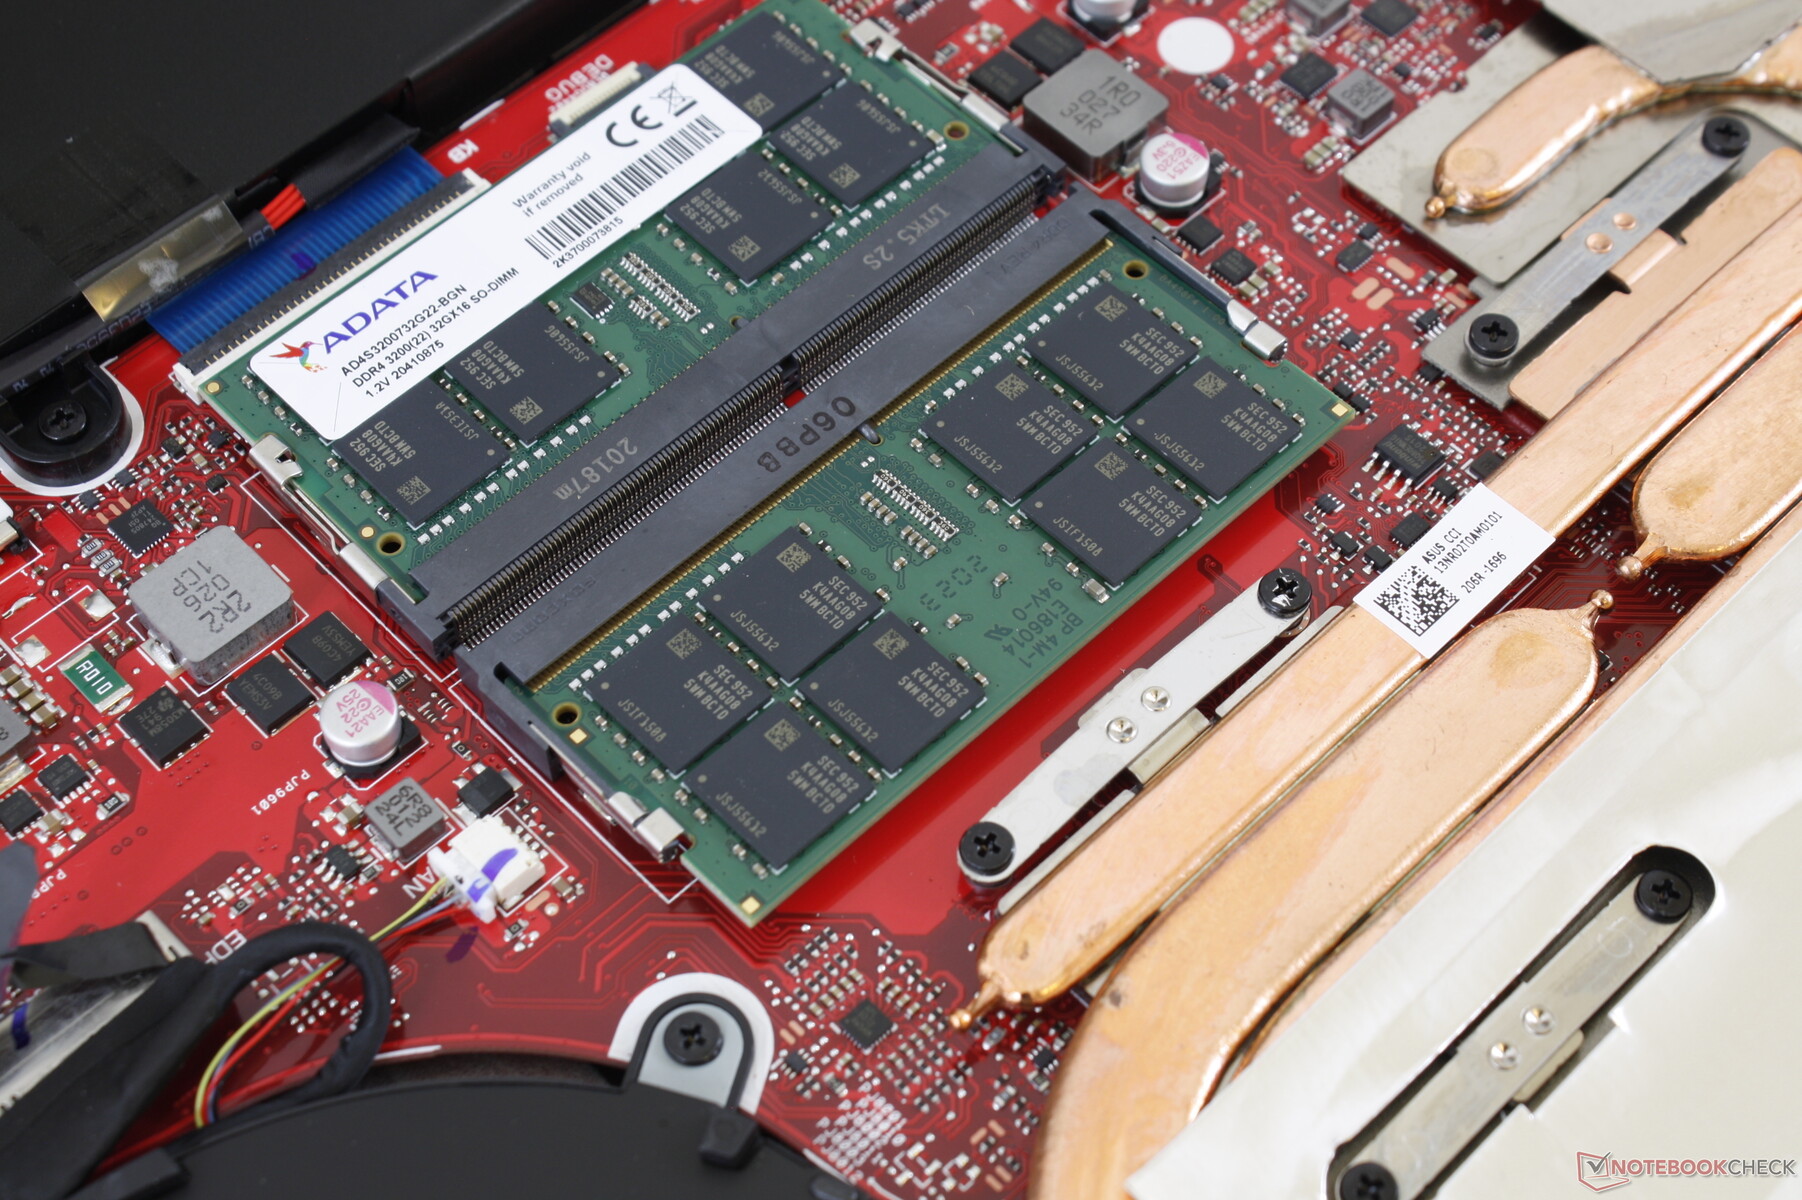
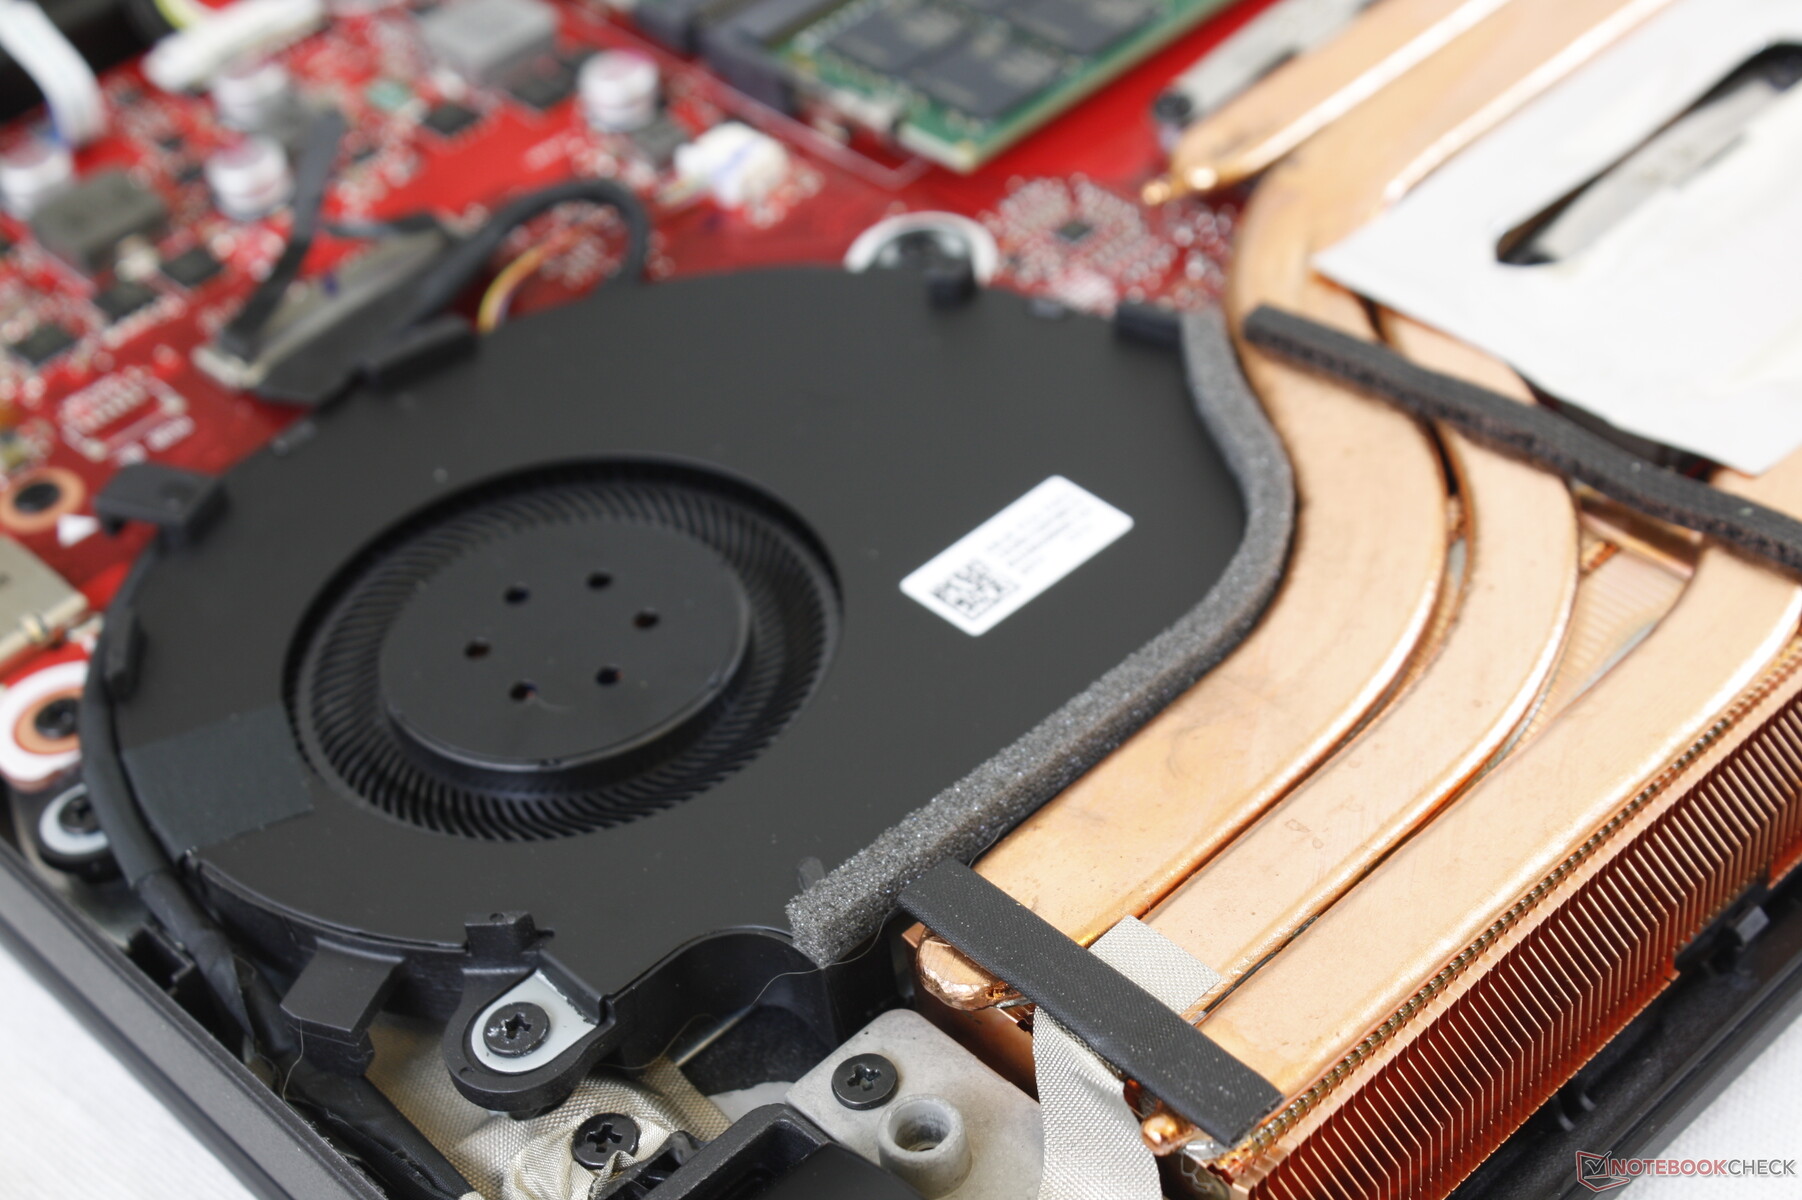
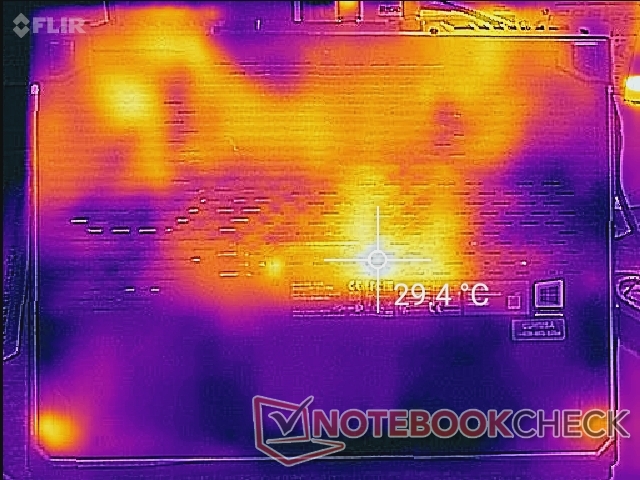
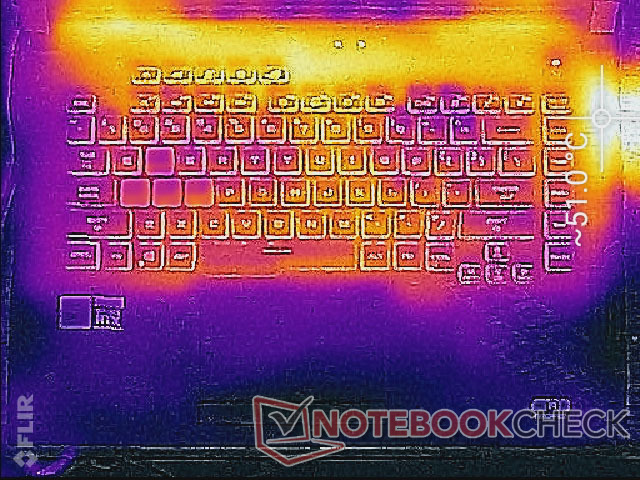
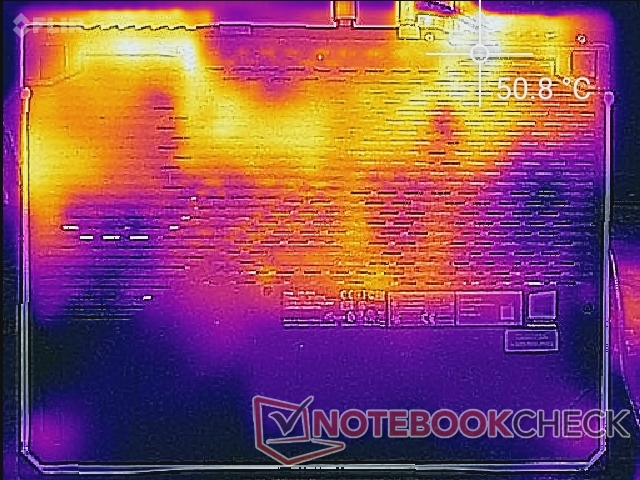
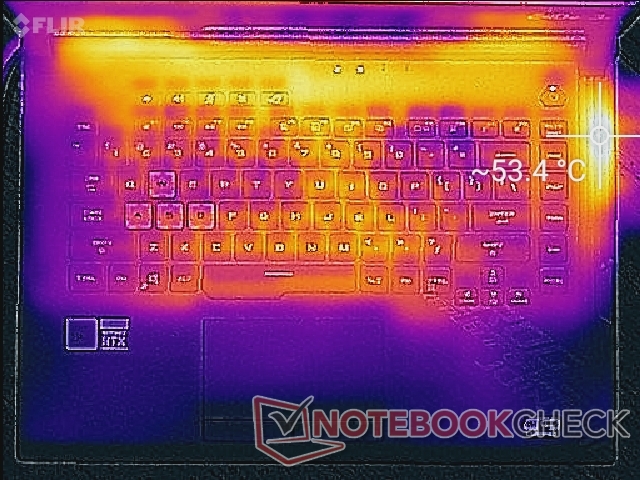
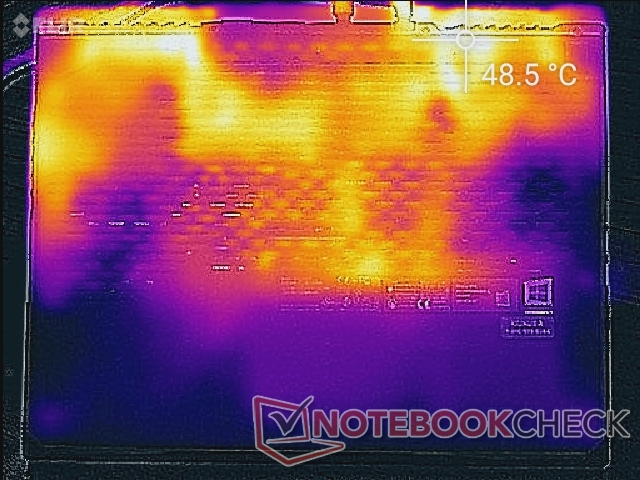
As temperaturas da superfície são ligeiramente diferentes das da G512LI porque a G512LW incorpora ventilação adicional ao longo da borda direita do chassi. Como resultado, a borda direita do laptop será muito mais quente do que este mesmo ponto na G512LI. O descanso da palma da mão e a maioria das teclas do teclado permanecem mais frias ao toque, especialmente quando comparadas a laptops de jogos ultra-finos e unibody como o Razer Blade 15.
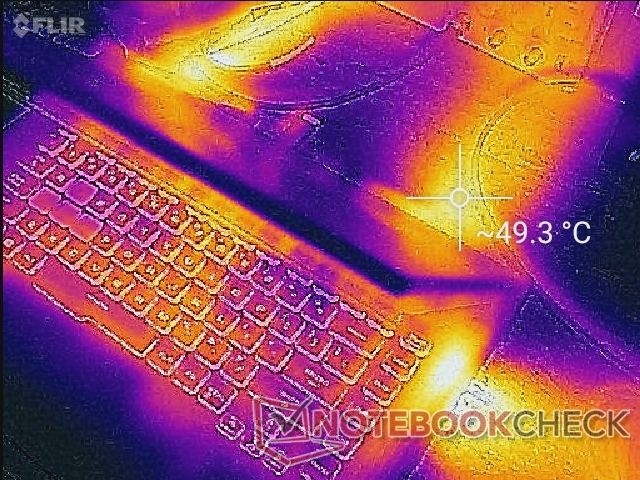
(-) A temperatura máxima no lado superior é 53.4 °C / 128 F, em comparação com a média de 40.4 °C / 105 F , variando de 21.2 a 68.8 °C para a classe Gaming.
(-) A parte inferior aquece até um máximo de 49 °C / 120 F, em comparação com a média de 43.2 °C / 110 F
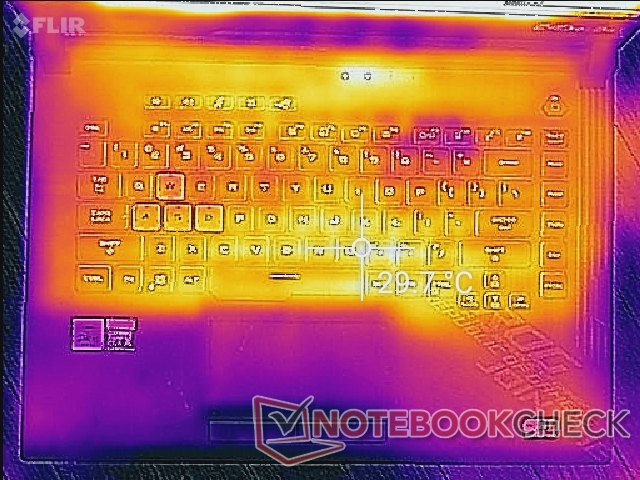
(+) Em uso inativo, a temperatura média para o lado superior é 28.4 °C / 83 F, em comparação com a média do dispositivo de 33.9 °C / ### class_avg_f### F.
(±) Jogando The Witcher 3, a temperatura média para o lado superior é 34.1 °C / 93 F, em comparação com a média do dispositivo de 33.9 °C / ## #class_avg_f### F.
(+) Os apoios para as mãos e o touchpad são mais frios que a temperatura da pele, com um máximo de 27.6 °C / 81.7 F e, portanto, são frios ao toque.
(±) A temperatura média da área do apoio para as mãos de dispositivos semelhantes foi 28.8 °C / 83.8 F (+1.2 °C / 2.1 F).
Teste de estresse
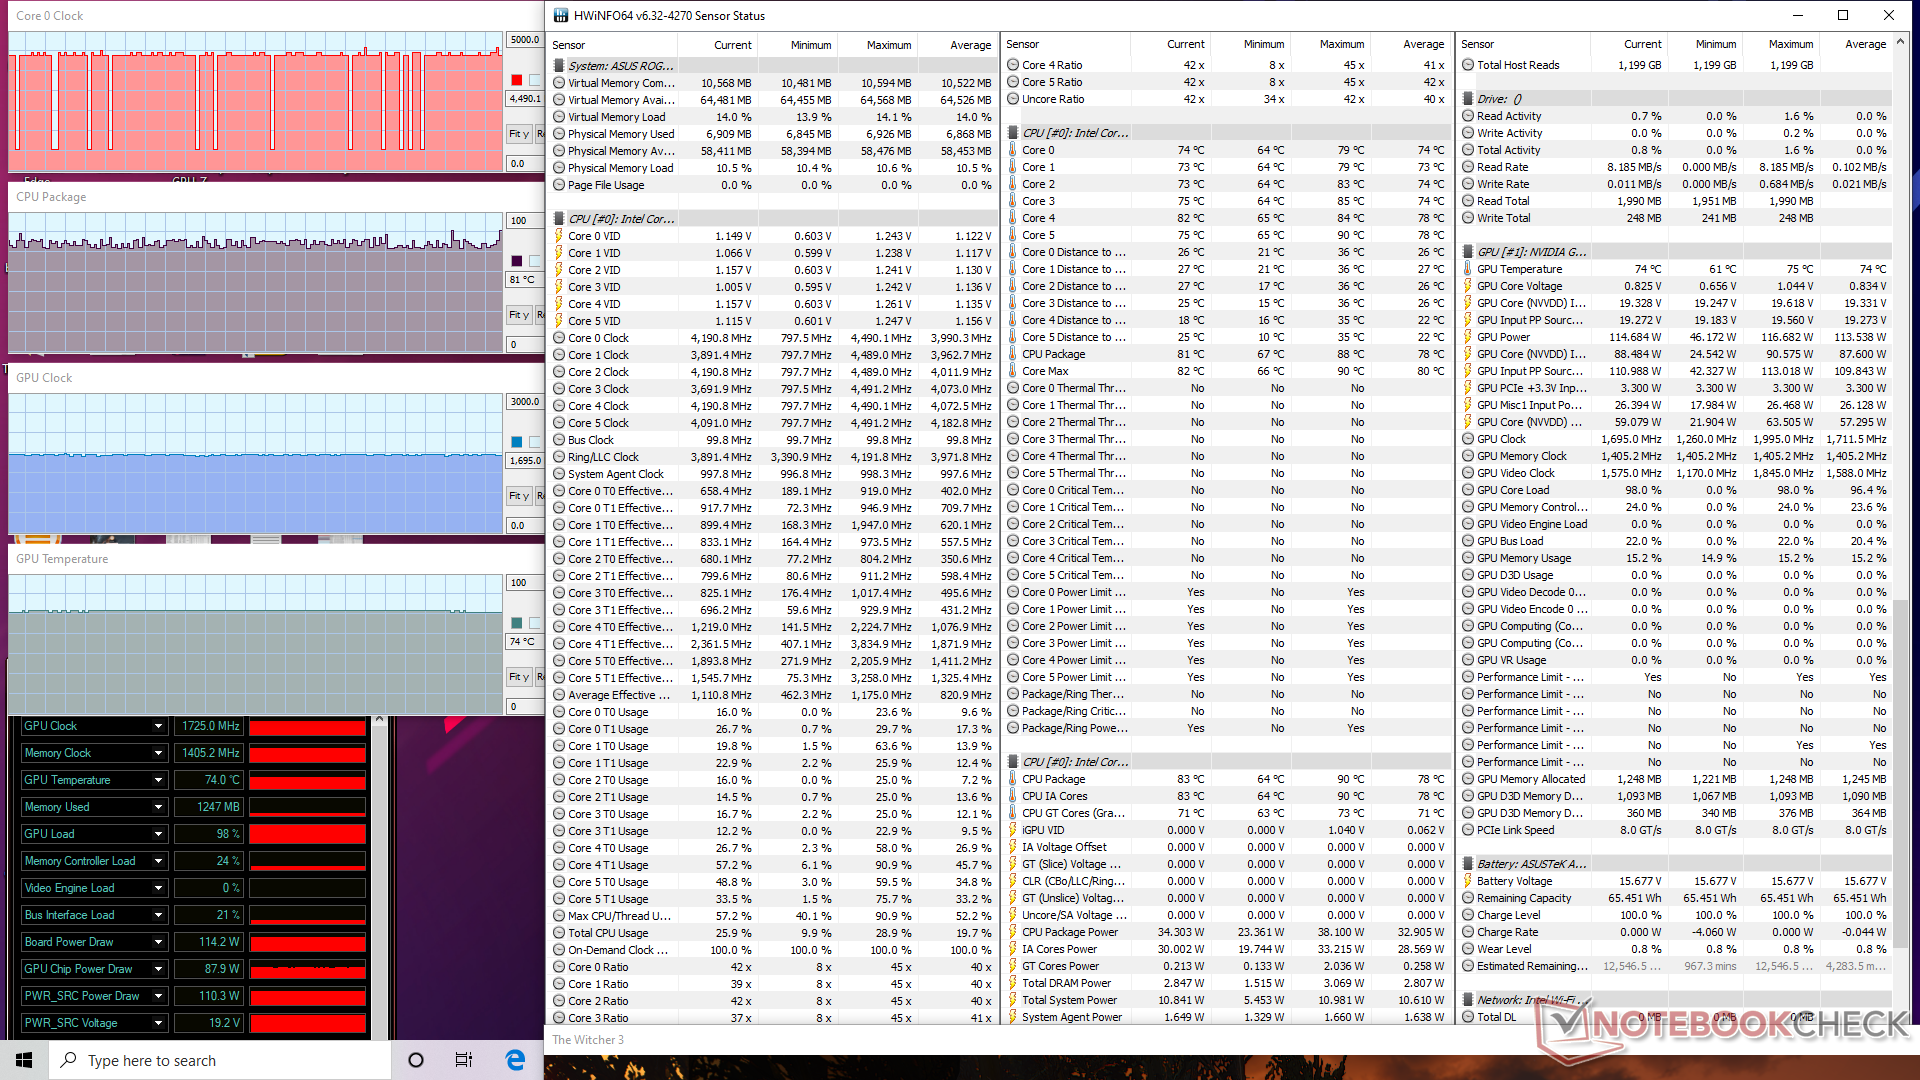
Quando estressada com Prime95, a CPU aumentaria para 4,2 GHz sem cair em seguida para espelhar nossos resultados do loop test do CineBench R15 xT acima. O laptop é capaz de manter as altas taxas do relógio Turbo Boost indefinidamente
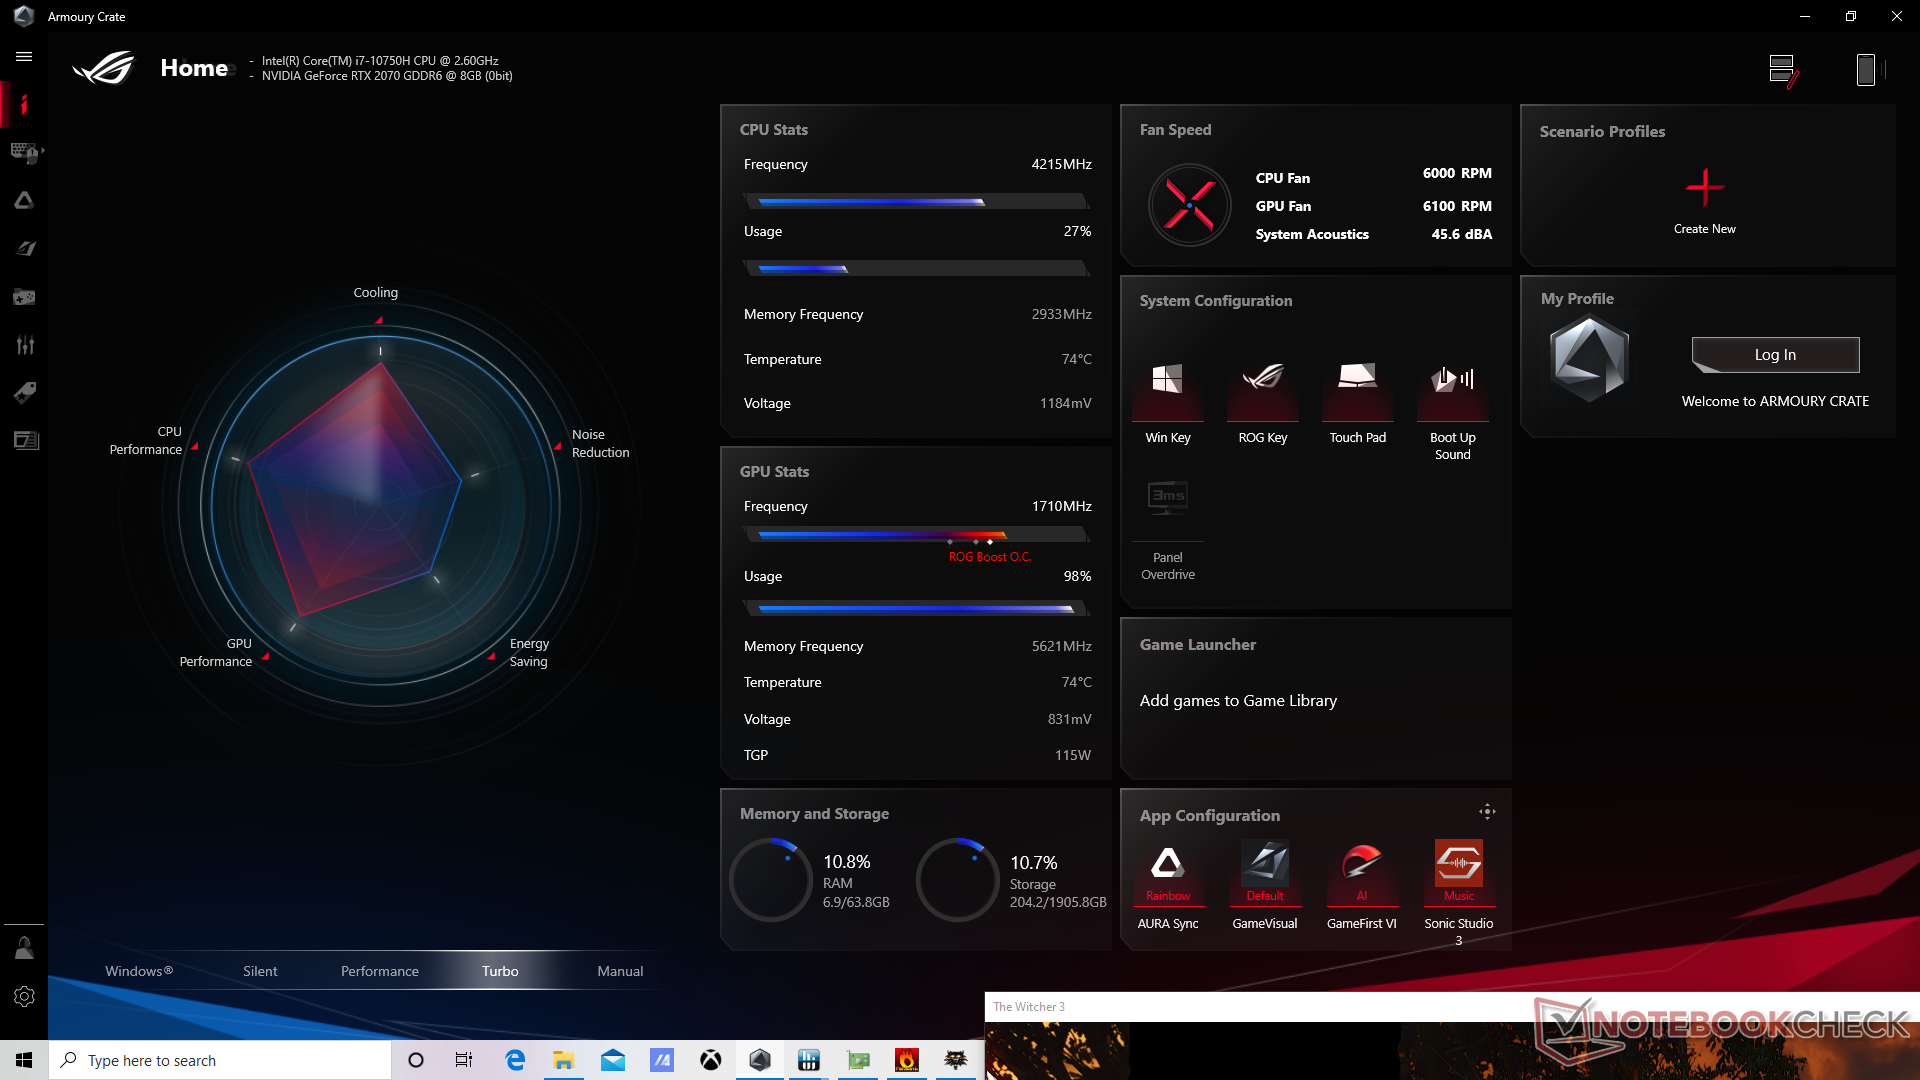
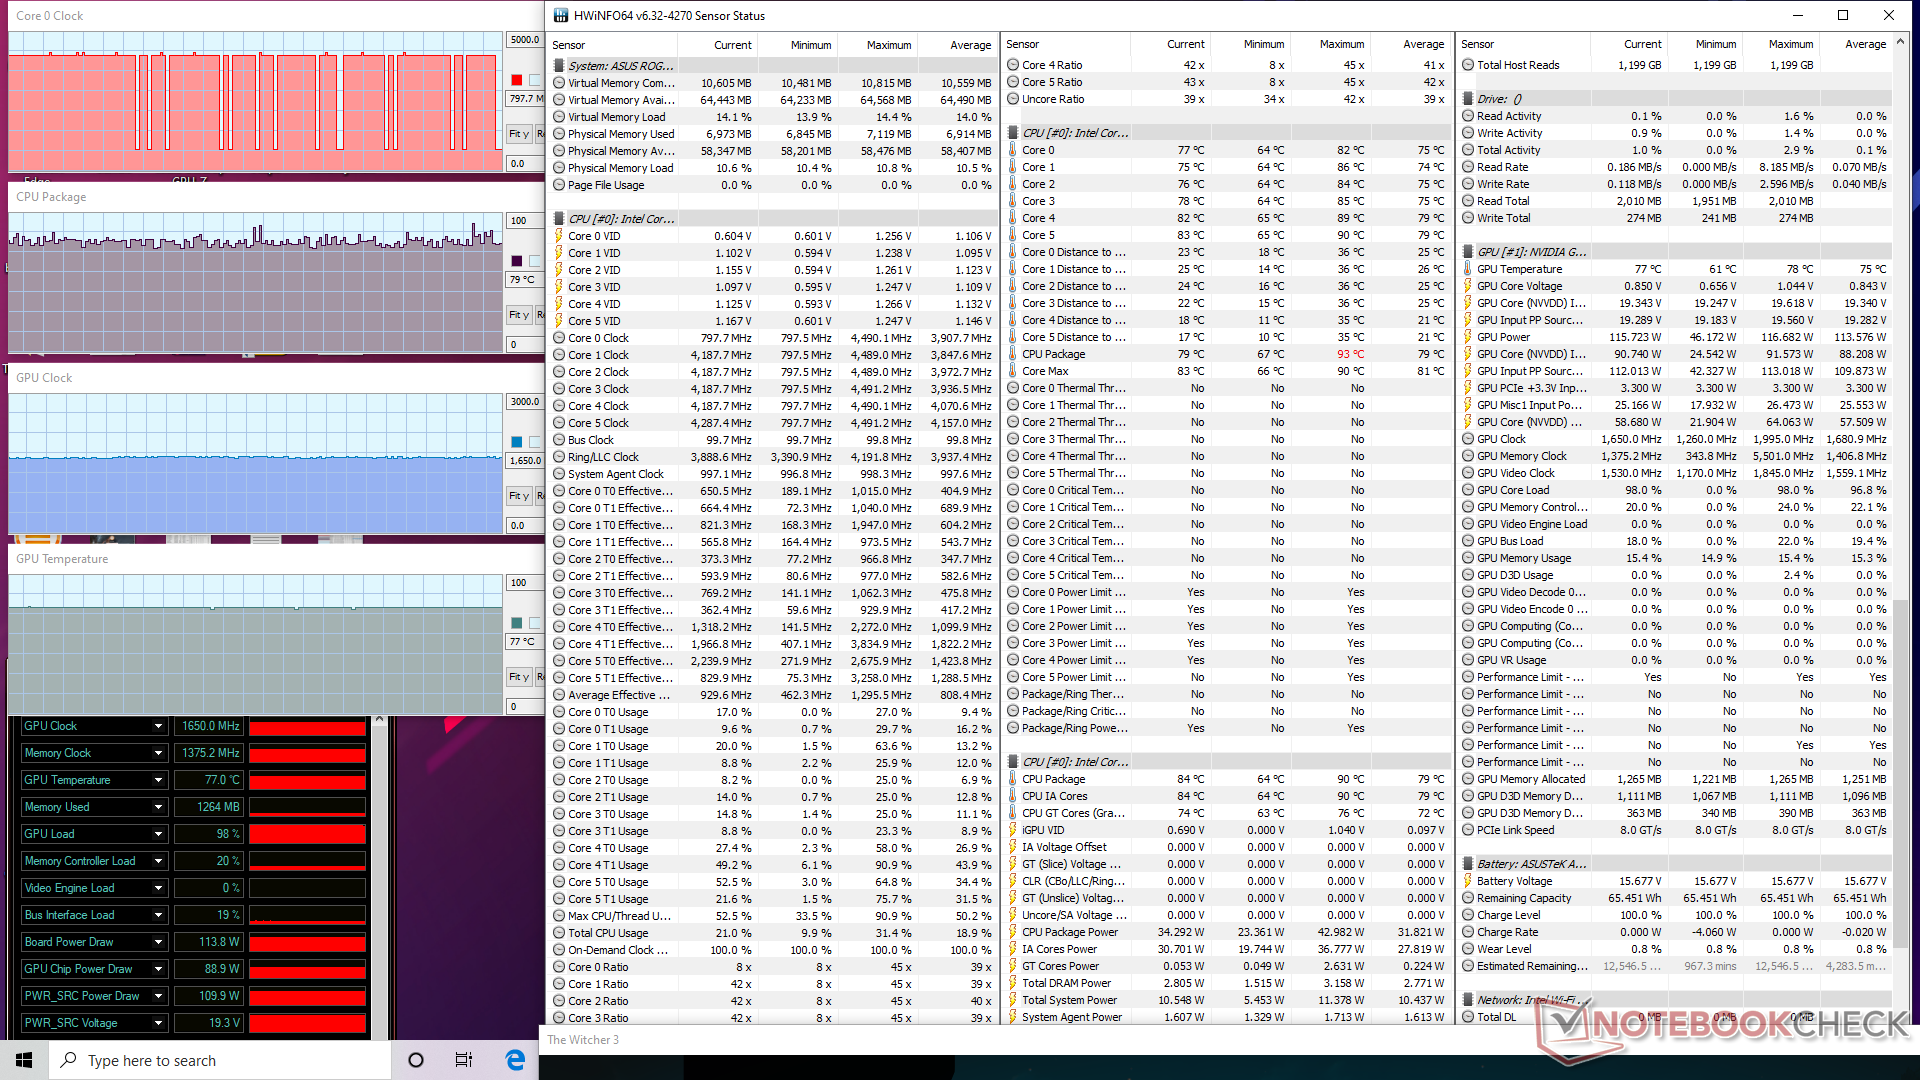
Rodando Witcher 3 no modo Turbo resultaria em taxas de relógio (1725 MHz vs. 1650 MHz) e taxas de memória (1405,2 MHz vs. 1375,2 MHz) ligeiramente mais rápidas do que no modo Performance sem afetar as temperaturas do núcleo, já que as RPM dos ventiladores também subiriam ligeiramente. As temperaturas da CPU e da GPU se estabilizariam em cerca de 80 C e 74 C, respectivamente, em comparação com apenas 60 C cada na G512LI mais lenta quando sob condições de jogo similares
O funcionamento com a energia da bateria terá impacto no desempenho. Um teste 3DMark 11 com baterias retornaria pontuações de Física e Gráficos de 9811 e 10435 pontos, respectivamente, em comparação com 13512 e 27298 pontos quando em rede elétrica.
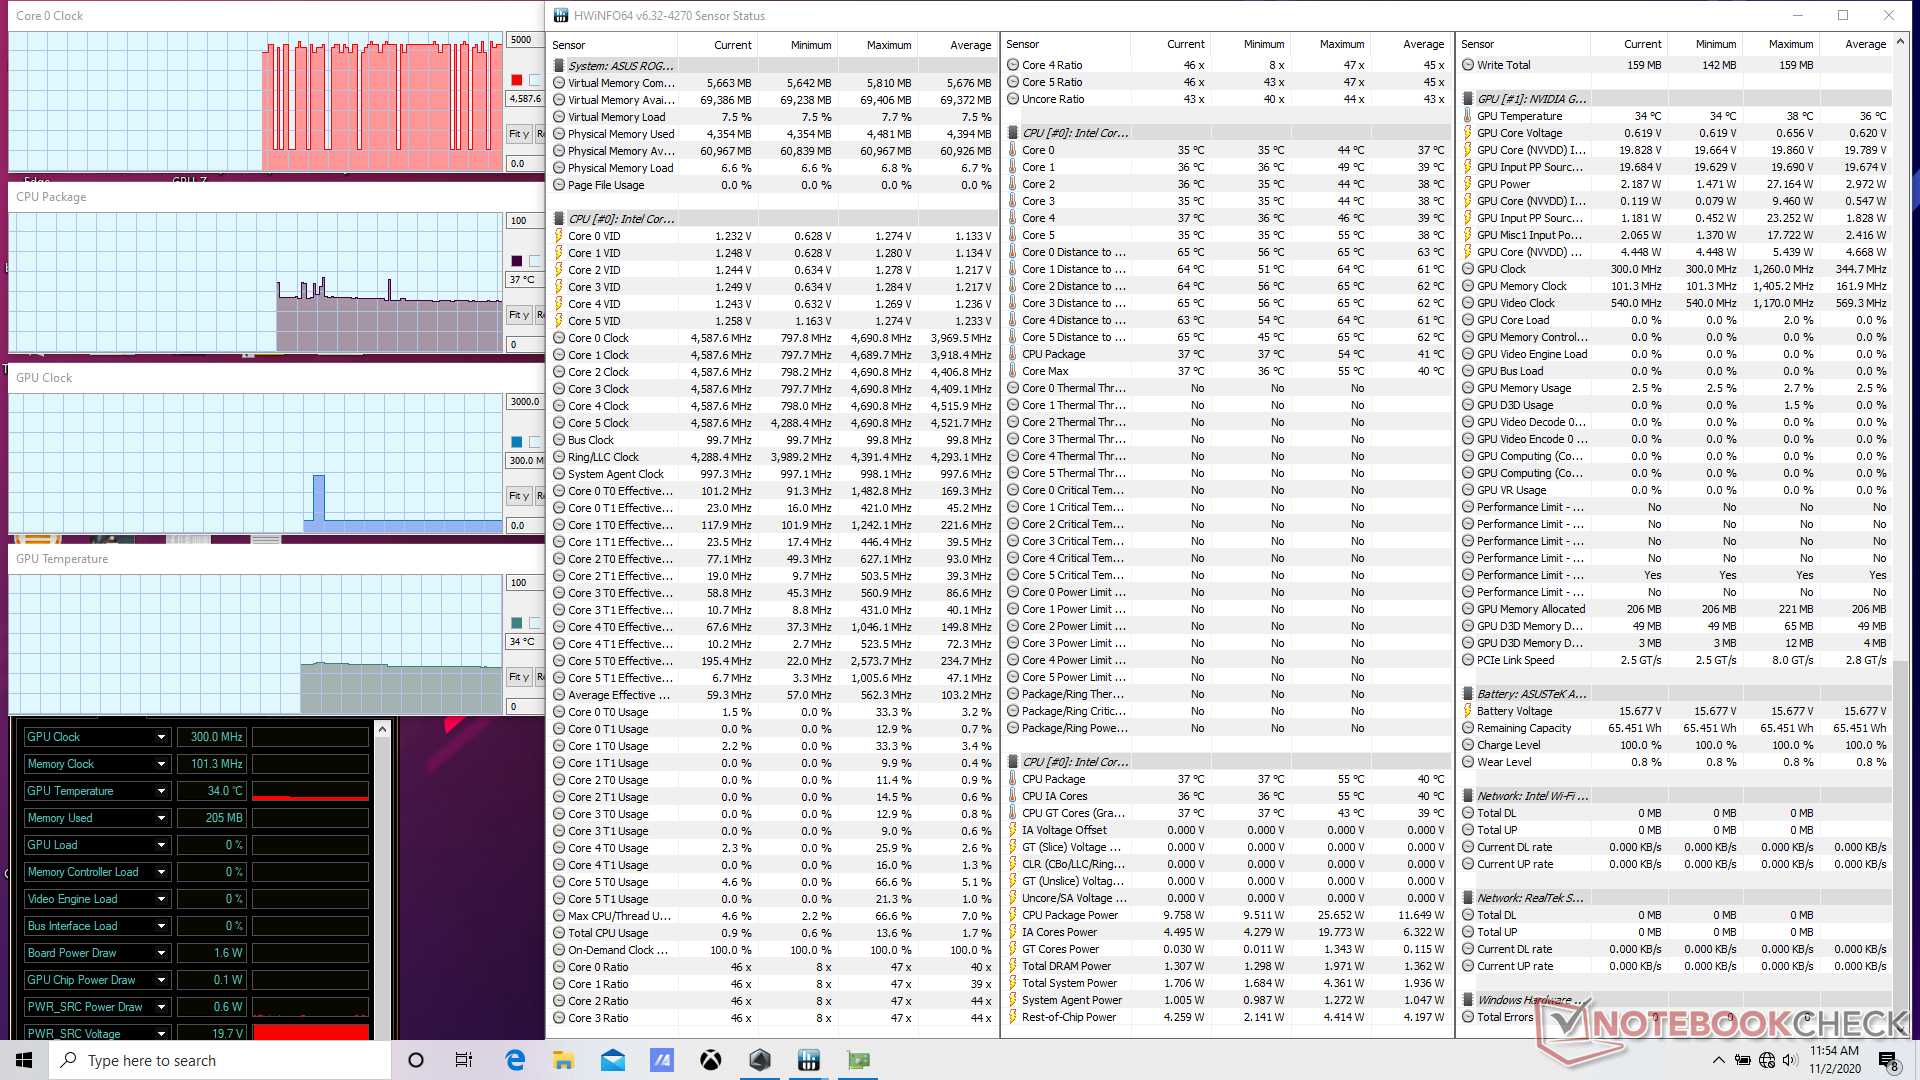
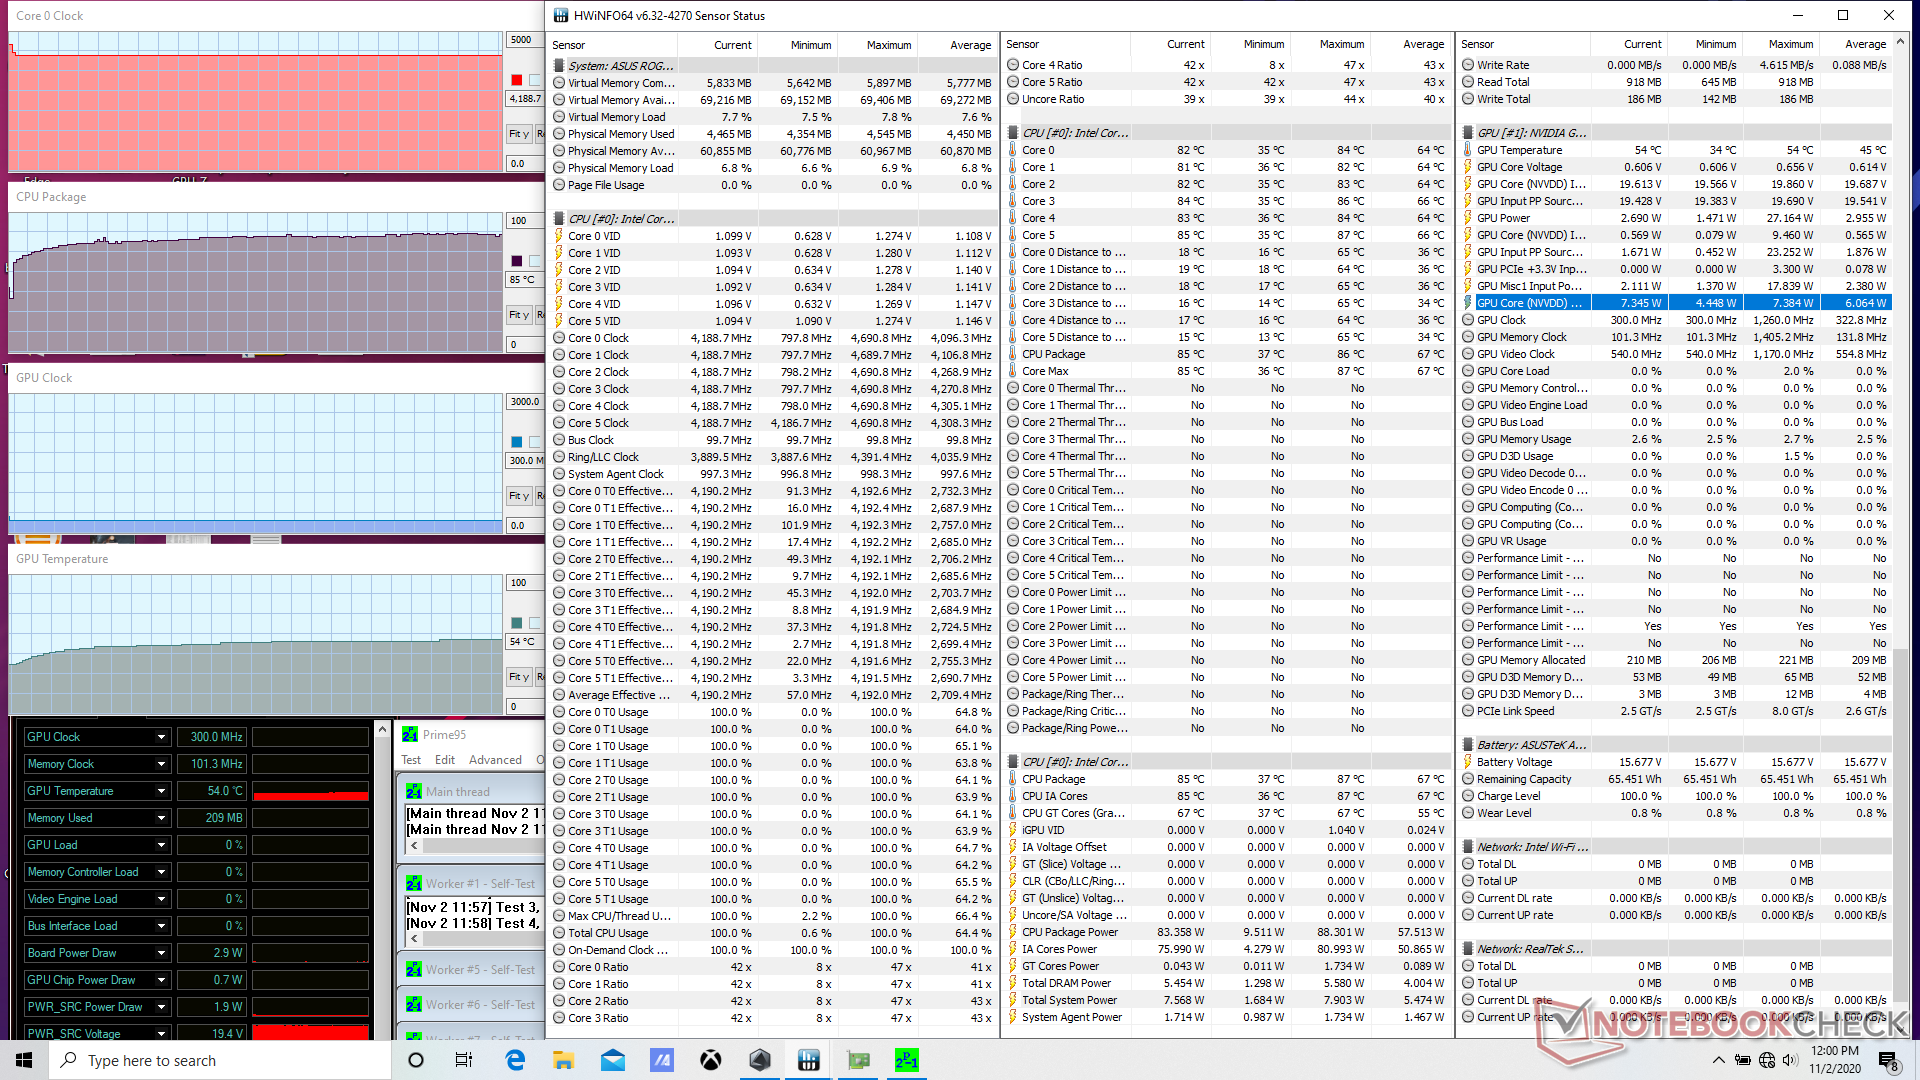
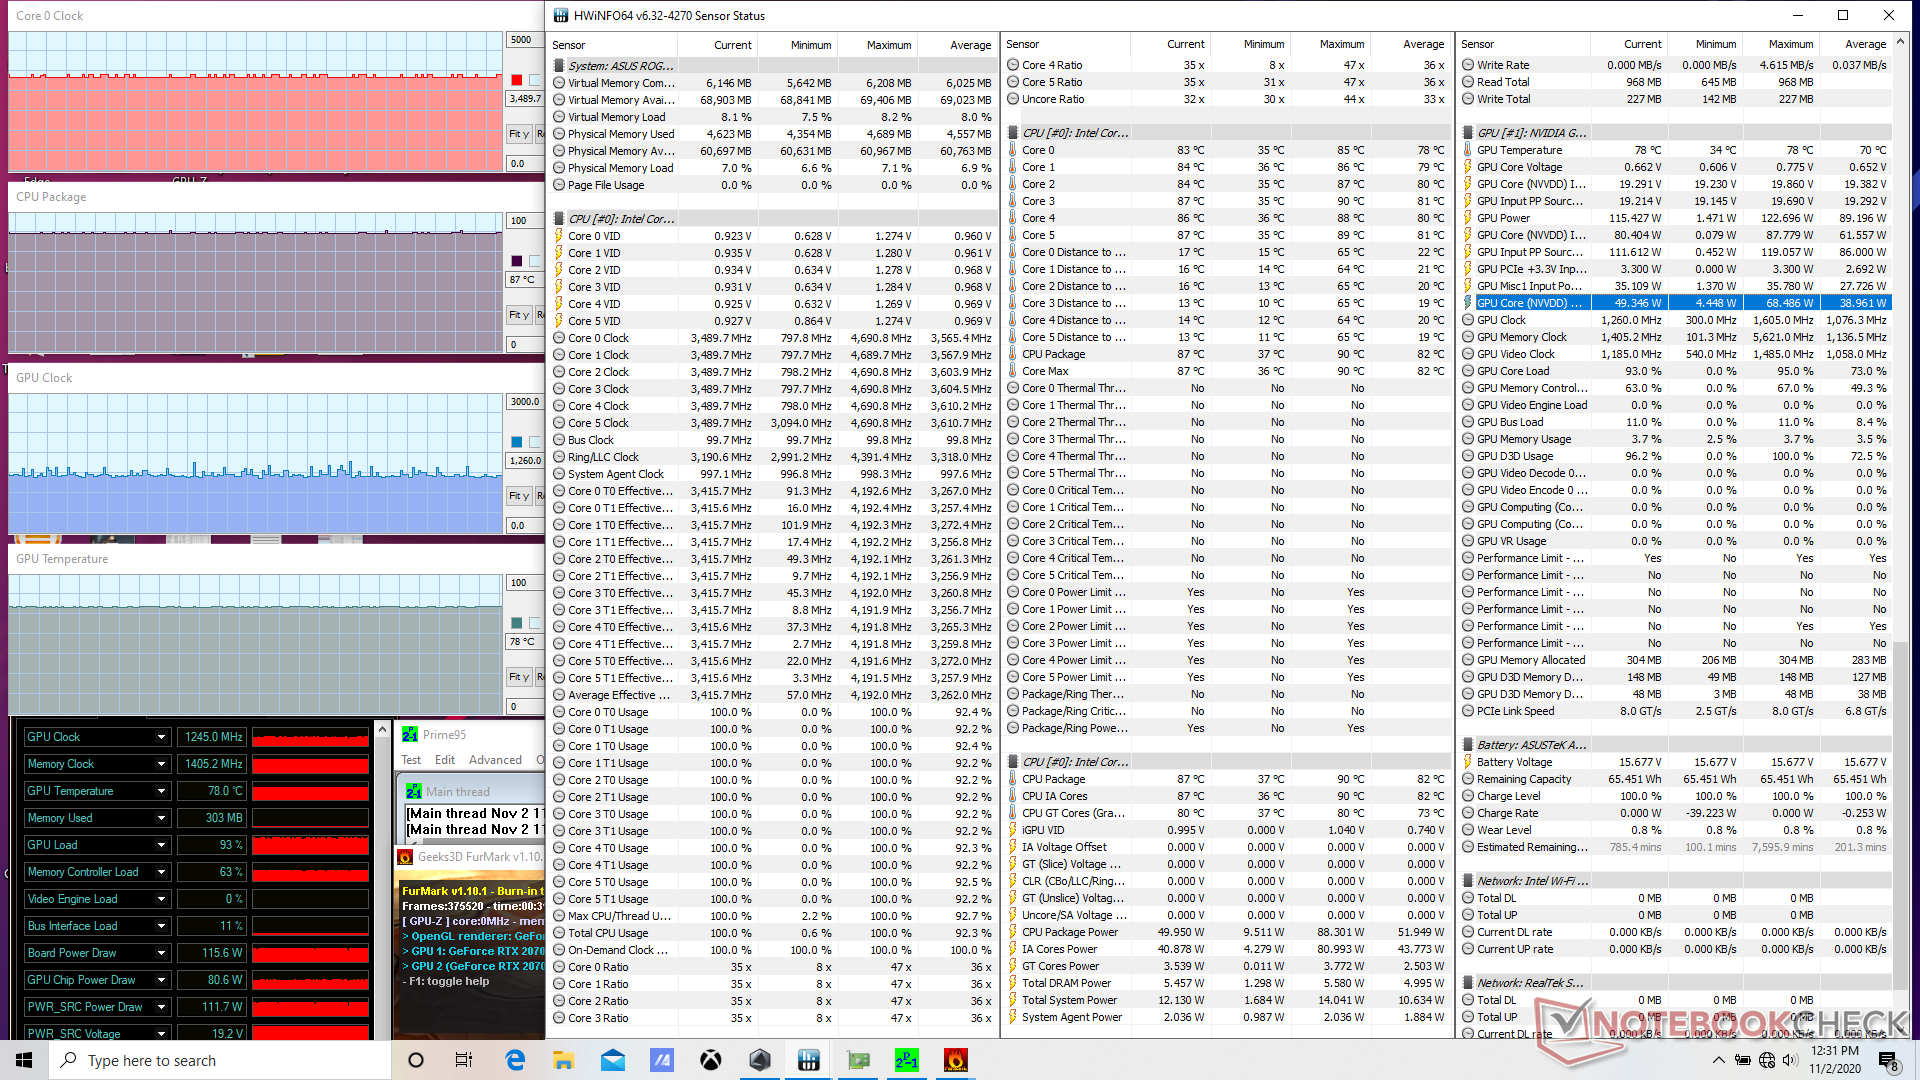
| RelógioCPU (GHz) | RelógioGPU (MHz) | Temperaturamédiada CPU (°C) | Temperaturamédiada GPU (°C) | |
| System Idle | -- | -- | 37 | 34 |
| Prime95 Stress | 4.2 | -- | 85 | 54 |
| Prime95 + FurMark Stress (modo Turbo) | 3.4 - 3.5 | 1245 | 87 | 78 |
| Witcher 3 Stress (modo de desempenho) | 0.8 - 4.2 | 1650 | ~79 | 77 |
| Witcher 3 Stress (Modo Turbo | 0.8 - 4.2 | 1725 | ~80 | 74 |
Oradores


Asus ROG Strix G15 G512LW análise de áudio
(+) | os alto-falantes podem tocar relativamente alto (###valor### dB)
Graves 100 - 315Hz
(±) | graves reduzidos - em média 8.8% menor que a mediana
(±) | a linearidade dos graves é média (7.8% delta para a frequência anterior)
Médios 400 - 2.000 Hz
(±) | médios mais altos - em média 7.5% maior que a mediana
(+) | médios são lineares (6.2% delta para frequência anterior)
Altos 2 - 16 kHz
(+) | agudos equilibrados - apenas 2.4% longe da mediana
(+) | os máximos são lineares (6% delta da frequência anterior)
Geral 100 - 16.000 Hz
(±) | a linearidade do som geral é média (16.4% diferença em relação à mediana)
Comparado com a mesma classe
» 42% de todos os dispositivos testados nesta classe foram melhores, 6% semelhantes, 52% piores
» O melhor teve um delta de 6%, a média foi 18%, o pior foi 132%
Comparado com todos os dispositivos testados
» 27% de todos os dispositivos testados foram melhores, 6% semelhantes, 67% piores
» O melhor teve um delta de 4%, a média foi 23%, o pior foi 134%
Apple MacBook 12 (Early 2016) 1.1 GHz análise de áudio
(+) | os alto-falantes podem tocar relativamente alto (###valor### dB)
Graves 100 - 315Hz
(±) | graves reduzidos - em média 11.3% menor que a mediana
(±) | a linearidade dos graves é média (14.2% delta para a frequência anterior)
Médios 400 - 2.000 Hz
(+) | médios equilibrados - apenas 2.4% longe da mediana
(+) | médios são lineares (5.5% delta para frequência anterior)
Altos 2 - 16 kHz
(+) | agudos equilibrados - apenas 2% longe da mediana
(+) | os máximos são lineares (4.5% delta da frequência anterior)
Geral 100 - 16.000 Hz
(+) | o som geral é linear (10.2% diferença em relação à mediana)
Comparado com a mesma classe
» 7% de todos os dispositivos testados nesta classe foram melhores, 2% semelhantes, 90% piores
» O melhor teve um delta de 5%, a média foi 18%, o pior foi 53%
Comparado com todos os dispositivos testados
» 5% de todos os dispositivos testados foram melhores, 1% semelhantes, 94% piores
» O melhor teve um delta de 4%, a média foi 23%, o pior foi 134%
Energy Management
Consumo de energia
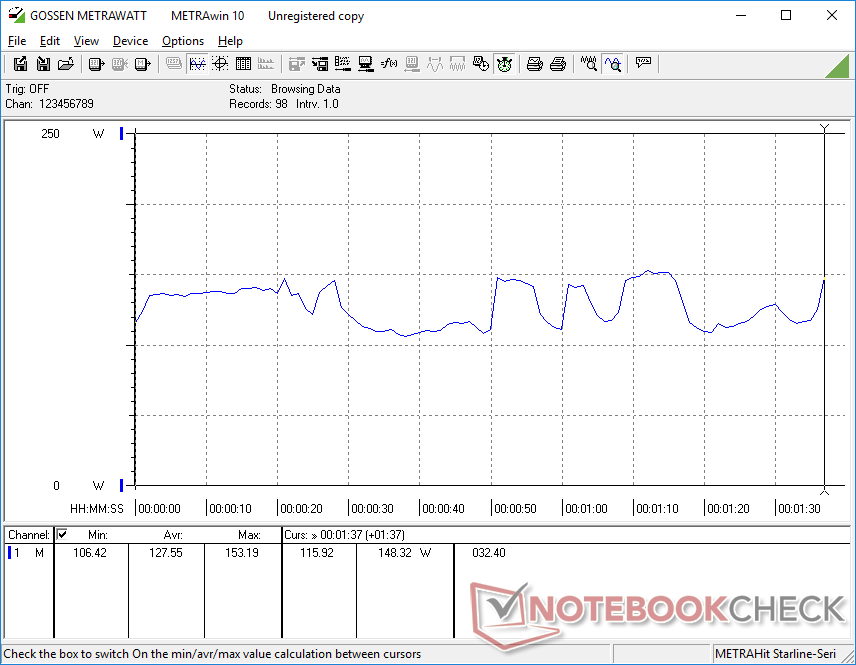
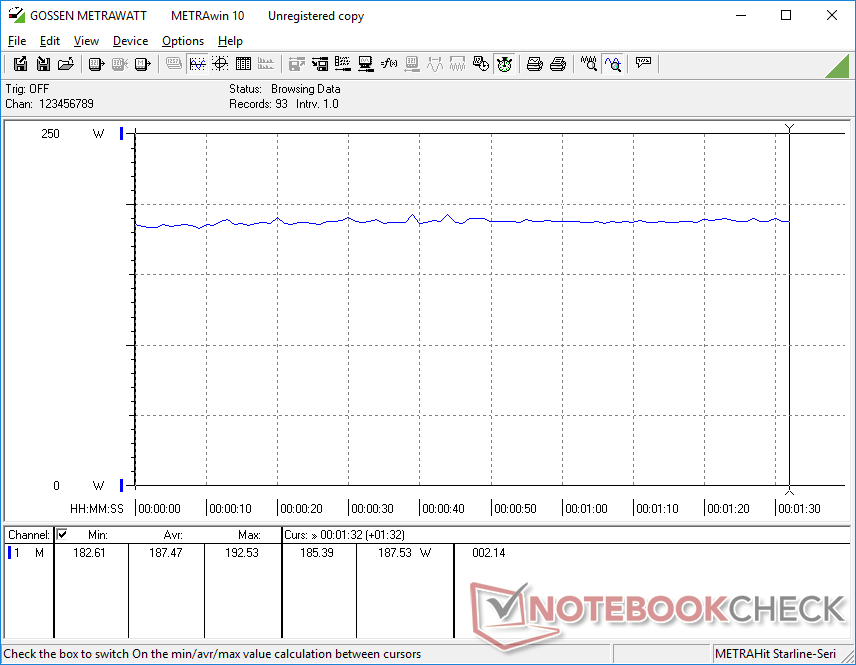
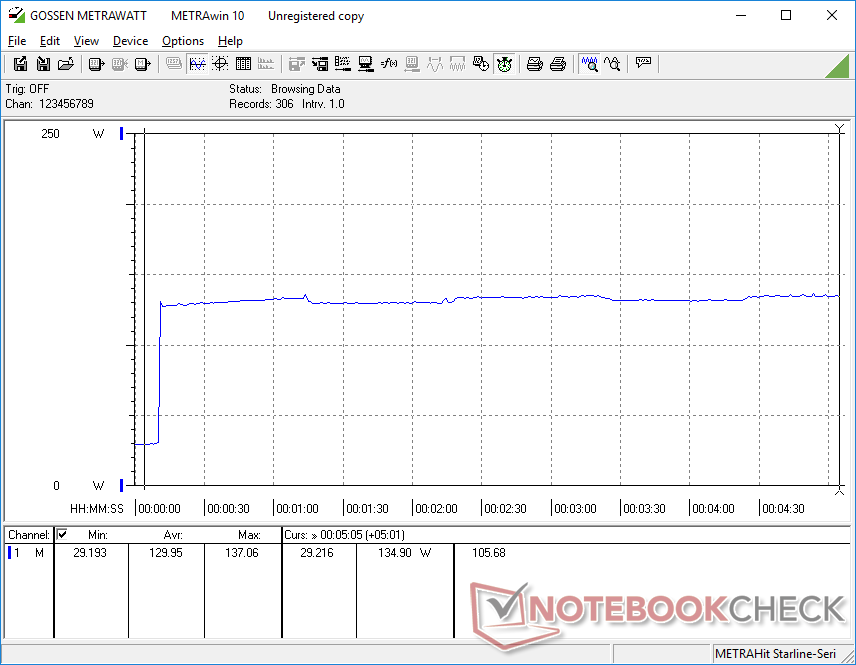
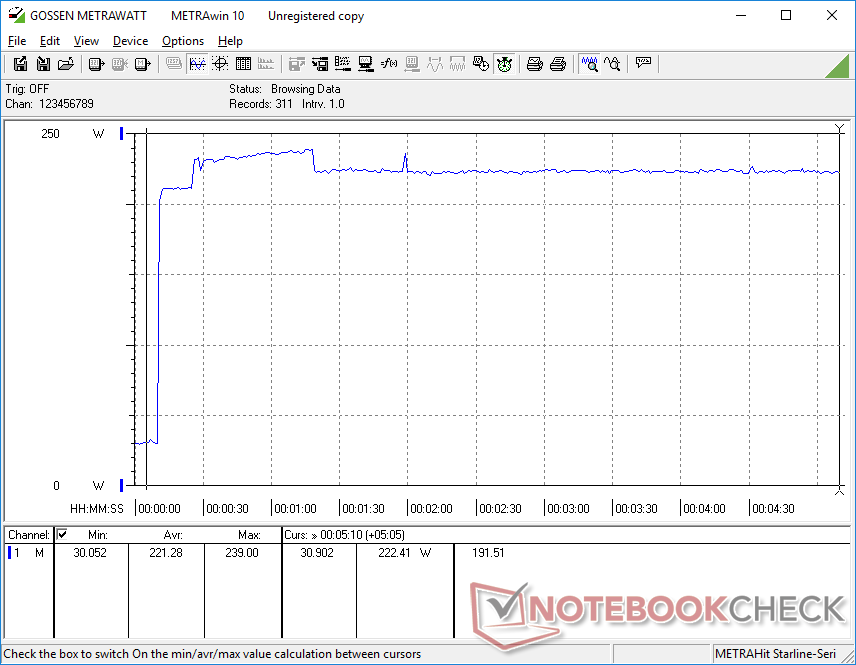
A manipulação na área de trabalho exigirá entre 16 W e 31 W, dependendo do perfil de brilho e potência. Caso contrário, o jogo exigirá cerca de 187 W para ser semelhante ao que gravamos no MSI GP65 10SFK equipado com a mesma CPU e GPU. O consumo é cerca de 2x maior do que o G512LI que se alinha com o 2x maior desempenho gráfico mencionado acima.
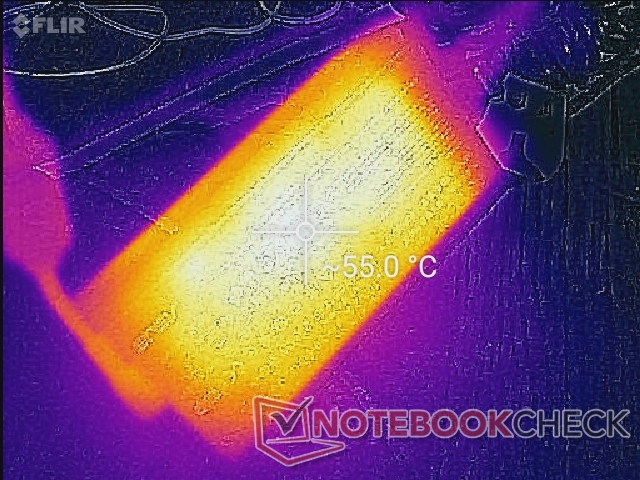
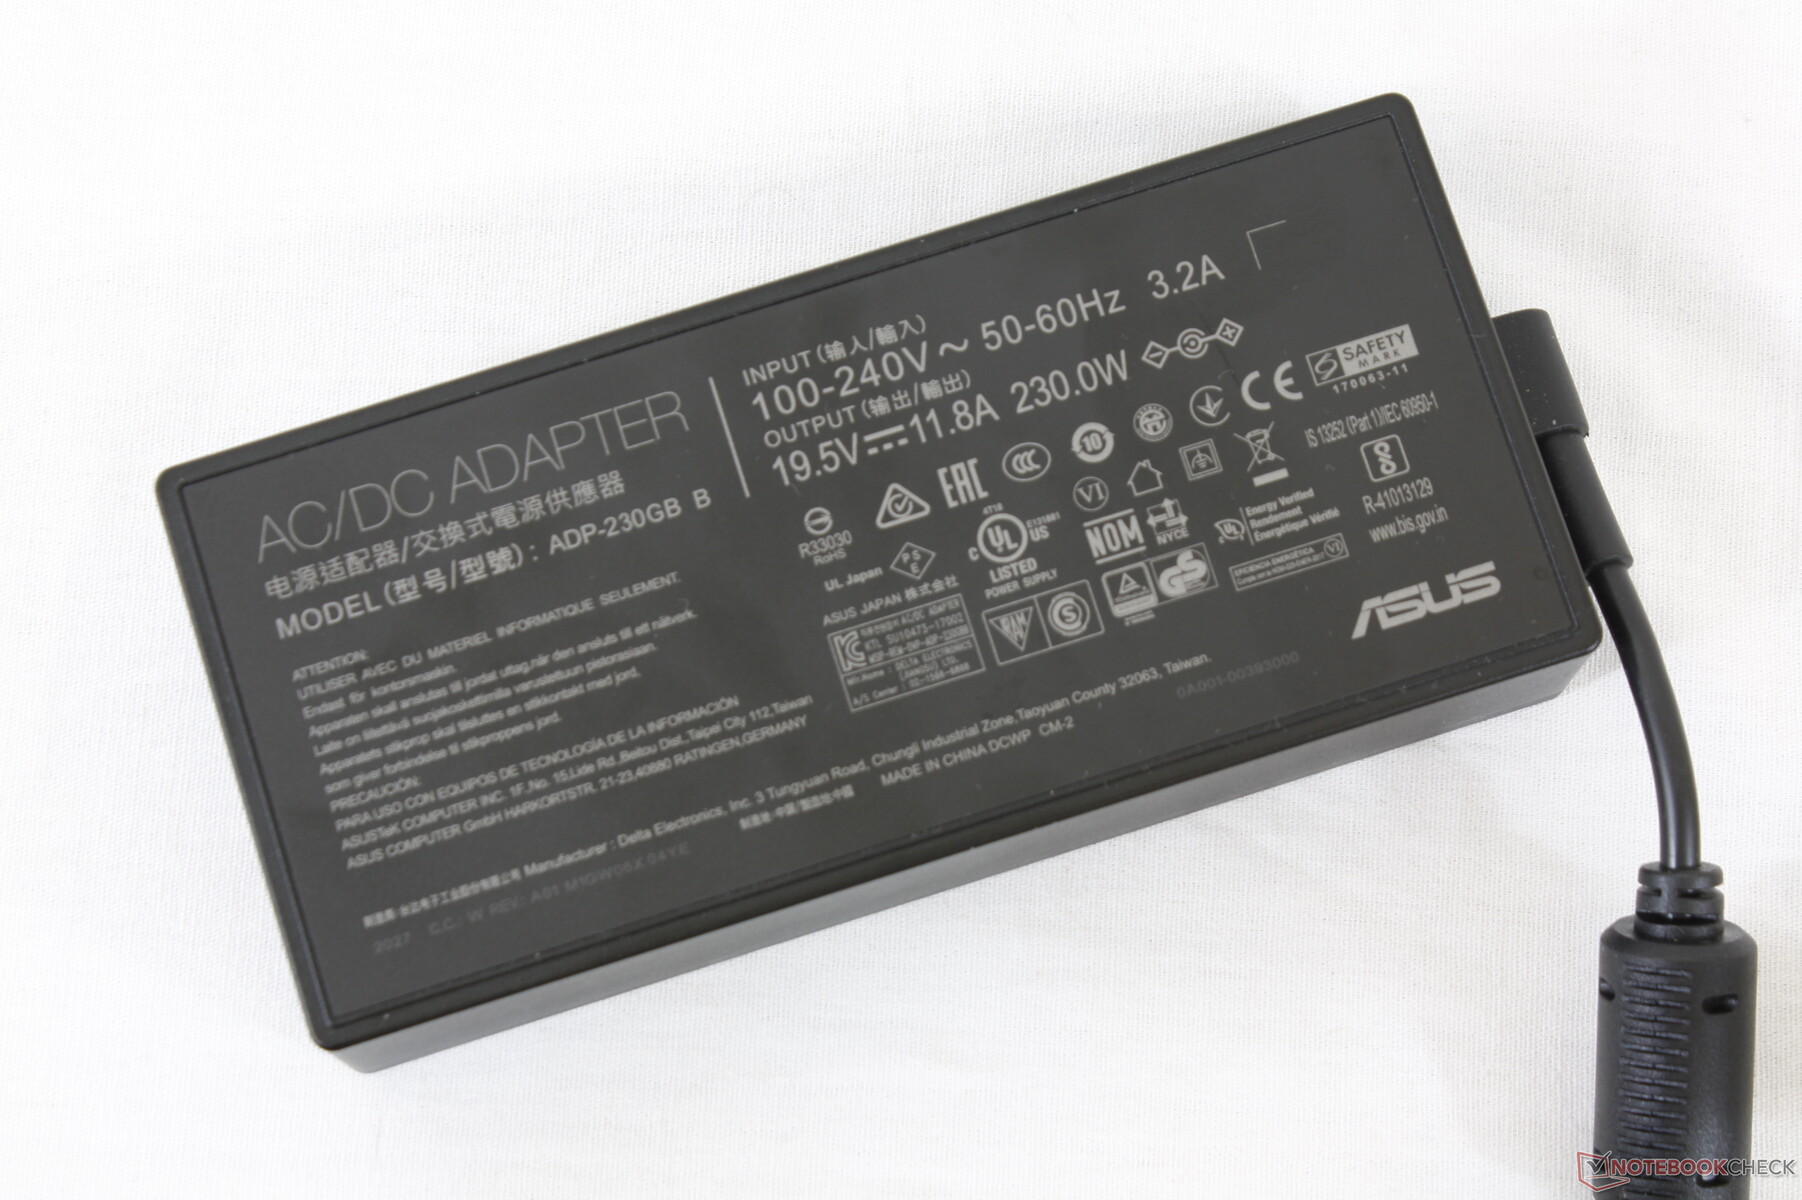
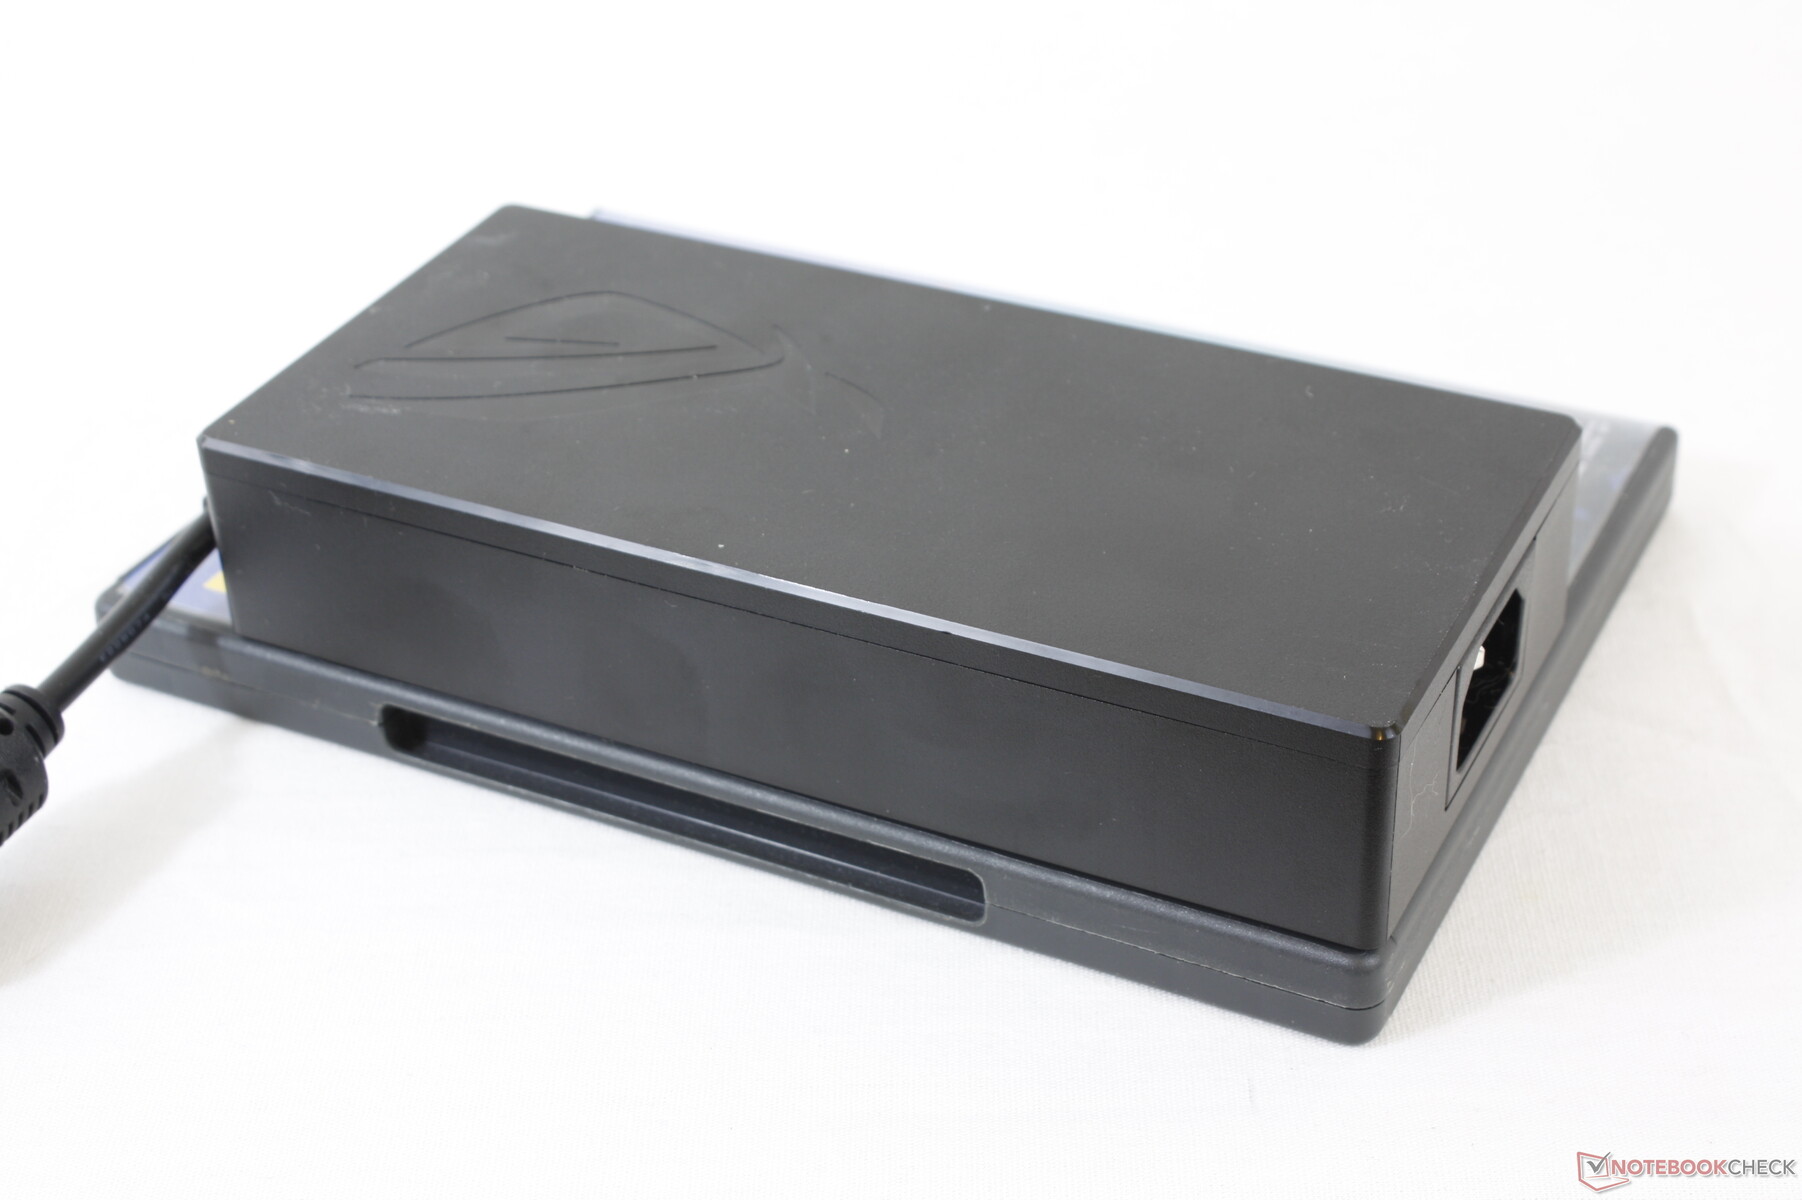
Note que o G512LW vem com um adaptador AC de 240 W maior (~16,5 x 7,5 x 3,2 cm) comparado com o adaptador AC de 150 W para o G512LI devido à GPU RTX 2070 mais exigente.
| desligado | |
| Ocioso | |
| Carga |
|
Key:
min: | |
| Asus ROG Strix G15 G512LW i7-10750H, GeForce RTX 2070 Mobile, Toshiba XG5-P KXG50PNV2T04, IPS, 1920x1080, 15.6" | Asus ROG Strix G15 G512LI i7-10750H, GeForce GTX 1650 Ti Mobile, Intel SSD 660p SSDPEKNW512G8, IPS, 1920x1080, 15.6" | Razer Blade 15 RTX 2070 Super Max-Q i7-10875H, GeForce RTX 2070 Super Max-Q, Samsung SSD PM981a MZVLB512HBJQ, IPS, 1920x1080, 15.6" | MSI GP65 10SFK-047US i7-10750H, GeForce RTX 2070 Mobile, Samsung SSD PM981 MZVLB1T0HALR, IPS, 1920x1080, 15.6" | Asus ROG Strix Scar 15 G532LWS i9-10980HK, GeForce RTX 2070 Super Mobile, 2x Intel SSD 660p 1TB SSDPEKNW010T8 (RAID 0), IPS, 1920x1080, 15.6" | |
|---|---|---|---|---|---|
| Power Consumption | 43% | 5% | 14% | 12% | |
| Idle Minimum * (Watt) | 16.2 | 5.7 65% | 14.3 12% | 14.2 12% | 8 51% |
| Idle Average * (Watt) | 24.1 | 9.3 61% | 22.3 7% | 18.8 22% | 9.8 59% |
| Idle Maximum * (Watt) | 30.8 | 20.9 32% | 36.9 -20% | 23.9 22% | 25.8 16% |
| Load Average * (Watt) | 127.6 | 105.1 18% | 118.4 7% | 96.9 24% | 169 -32% |
| Witcher 3 ultra * (Watt) | 187.5 | 94.5 50% | 153.7 18% | 185 1% | 201 -7% |
| Load Maximum * (Watt) | 239 | 160.8 33% | 220.8 8% | 233.4 2% | 271.6 -14% |
* ... menor é melhor
Vida útil da bateria
O Asus aumentou a capacidade da bateria de 48 Wh no G512LI para 66 Wh em nosso G512LW. Posteriormente, os tempos de funcionamento da WLAN são quase duas horas mais longos com pouco menos de 6,5 horas de uso da WLAN no mundo real. A recarga de capacidade vazia para plena ainda leva menos de 1,5 horas.
| Asus ROG Strix G15 G512LW i7-10750H, GeForce RTX 2070 Mobile, 66 Wh | Asus ROG Strix G15 G512LI i7-10750H, GeForce GTX 1650 Ti Mobile, 48 Wh | Razer Blade 15 RTX 2070 Super Max-Q i7-10875H, GeForce RTX 2070 Super Max-Q, 80 Wh | MSI GP65 10SFK-047US i7-10750H, GeForce RTX 2070 Mobile, 51 Wh | Asus ROG Strix Scar 15 G532LWS i9-10980HK, GeForce RTX 2070 Super Mobile, 66 Wh | Alienware m15 R3 P87F i7-10750H, GeForce RTX 2070 Mobile, 86 Wh | |
|---|---|---|---|---|---|---|
| Duração da bateria | -30% | -2% | -42% | -23% | -56% | |
| WiFi v1.3 (h) | 6.4 | 4.5 -30% | 6.3 -2% | 3.7 -42% | 4.9 -23% | 2.8 -56% |
| Reader / Idle (h) | 13.3 | 8.1 | 5 | |||
| Load (h) | 1.4 | 1.5 | 0.7 |
Pro
Contra
Veredicto

Uma má exibição pode arruinar um laptop para jogos que de outra forma seria bom. Embora o ROG Strix G15 G512LI, menos caro, tenha um bom desempenho, seu tempo de resposta de exibição lento e sua reprodução de cores limitada fariam com que a experiência de jogo se sentisse subestimada. Felizmente, o G512LW usa um painel totalmente diferente que se adapta melhor ao público alvo de jogadores hardcore ou concorrentes.
Os principais inconvenientes continuam sendo todos comuns na série G512. Os perfis de potência do Armoury Crate continuam a chocar com os perfis de potência do Windows. O modo Turbo em particular é necessário para obter o máximo desempenho do G512, o que significa que o máximo ruído do ventilador será inevitável para muitos gamers. Entretanto, as dimensões são grandes, especialmente em comprimento, devido à parte traseira saliente. Thunderbolt 3, webcam, leitor de cartões SD, e até mesmo Asus Keystone estão todos ausentes, o que pode irritar os usuários que confiam nestas características. Há muita potência e expansibilidade sob o capô se você puder lidar com as grandes pegadas, pequenas setas de teclas e ventiladores altos.
Excelente desempenho a temperaturas decentes, especialmente tendo em vista a potência total da GeForce RTX 2070 no interior. Os proprietários vão gostar do display de 240 Hz e da RAM e armazenamento expansível, mas os ventiladores altos podem ser incômodos sem um par de fones de ouvido.
Asus ROG Strix G15 G512LW
- 11/04/2020 v7 (old)
Allen Ngo
Price comparison

