Breve Análise do Chromebook Google Pixelbook
| Networking | |
| iperf3 transmit AX12 | |
| Microsoft Surface Laptop i5 | |
| Samsung Notebook 9 NP900X3N-K01US | |
| Google Pixelbook | |
| iperf3 receive AX12 | |
| Samsung Notebook 9 NP900X3N-K01US | |
| Google Pixelbook | |
| Microsoft Surface Laptop i5 | |
| |||||||||||||||||||||||||
iluminação: 80 %
iluminação com acumulador: 473.9 cd/m²
Contraste: 1354:1 (Preto: 0.35 cd/m²)
ΔE ColorChecker Calman: 3.9 | ∀{0.5-29.43 Ø4.71}
ΔE Greyscale Calman: 5.4 | ∀{0.09-98 Ø4.96}
Gamma: 2.13
CCT: 7643 K
| Google Pixelbook IPS, 12.3", 2400x1600 | Microsoft Surface Pro (2017) i7 LG Display LP123WQ112604, IPS, 12.3", 2736x1824 | Microsoft Surface Laptop i5 ID: MEI96A2, Name: Panasonic VVX14T092N00, IPS, 13.5", 2256x1504 | Apple MacBook Pro 13 2017 APPA033, IPS, 13.3", 2560x1600 | Apple MacBook 12 (Early 2016) 1.1 GHz APPA027, IPS, 12", 2304x1440 | |
|---|---|---|---|---|---|
| Display | |||||
| Display P3 Coverage (%) | 66.6 | 67.8 | 99.2 | 66.8 | |
| sRGB Coverage (%) | 96.5 | 94.3 | 99.9 | 95.4 | |
| AdobeRGB 1998 Coverage (%) | 67.8 | 69.5 | 87.1 | 68 | |
| Response Times | 34% | 6% | 24% | 23% | |
| Response Time Grey 50% / Grey 80% * (ms) | 59.2 ? | 37 ? 37% | 50.8 ? 14% | 42.8 ? 28% | 41.2 ? 30% |
| Response Time Black / White * (ms) | 36 ? | 25 ? 31% | 37.2 ? -3% | 28.8 ? 20% | 30.4 ? 16% |
| PWM Frequency (Hz) | 820 ? | 22130 ? | |||
| Screen | -1% | 17% | 26% | 11% | |
| Brightness middle (cd/m²) | 473.9 | 482 2% | 384.2 -19% | 588 24% | 387 -18% |
| Brightness (cd/m²) | 443 | 466 5% | 378 -15% | 561 27% | 358 -19% |
| Brightness Distribution (%) | 80 | 92 15% | 90 13% | 92 15% | 88 10% |
| Black Level * (cd/m²) | 0.35 | 0.395 -13% | 0.36 -3% | 0.45 -29% | 0.47 -34% |
| Contrast (:1) | 1354 | 1220 -10% | 1067 -21% | 1307 -3% | 823 -39% |
| Colorchecker dE 2000 * | 3.9 | 4 -3% | 1.8 54% | 1.7 56% | 1.6 59% |
| Colorchecker dE 2000 max. * | 7.7 | 7.2 6% | 4.2 45% | 3.5 55% | 4 48% |
| Greyscale dE 2000 * | 5.4 | 5.7 -6% | 1.2 78% | 1.9 65% | 1 81% |
| Gamma | 2.13 103% | 2.28 96% | 2.21 100% | 2.33 94% | 2.26 97% |
| CCT | 7643 85% | 7950 82% | 6708 97% | 6738 96% | 6680 97% |
| Color Space (Percent of AdobeRGB 1998) (%) | 62 | 63.7 | 77.92 | 61.6 | |
| Color Space (Percent of sRGB) (%) | 96 | 94.2 | 99.94 | 82.2 | |
| Média Total (Programa/Configurações) | 17% /
6% | 12% /
14% | 25% /
26% | 17% /
13% |
* ... menor é melhor
Exibir tempos de resposta
| ↔ Tempo de resposta preto para branco | ||
|---|---|---|
| 36 ms ... ascensão ↗ e queda ↘ combinadas | ↗ 20 ms ascensão | 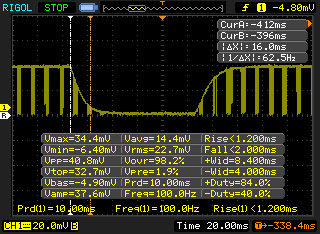 |
| ↘ 16 ms queda | ||
| A tela mostra taxas de resposta lentas em nossos testes e será insatisfatória para os jogadores. Em comparação, todos os dispositivos testados variam de 0.1 (mínimo) a 240 (máximo) ms. » 94 % de todos os dispositivos são melhores. Isso significa que o tempo de resposta medido é pior que a média de todos os dispositivos testados (19.8 ms). | ||
| ↔ Tempo de resposta 50% cinza a 80% cinza | ||
| 59.2 ms ... ascensão ↗ e queda ↘ combinadas | ↗ 29.6 ms ascensão | 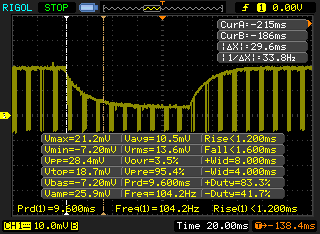 |
| ↘ 29.6 ms queda | ||
| A tela mostra taxas de resposta lentas em nossos testes e será insatisfatória para os jogadores. Em comparação, todos os dispositivos testados variam de 0.165 (mínimo) a 636 (máximo) ms. » 95 % de todos os dispositivos são melhores. Isso significa que o tempo de resposta medido é pior que a média de todos os dispositivos testados (31 ms). | ||
Cintilação da tela / PWM (modulação por largura de pulso)
| Tela tremeluzindo/PWM detectado | 820 Hz | ≤ 100 % configuração de brilho | 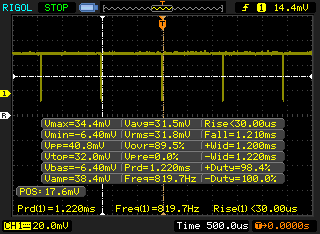 |
A luz de fundo da tela pisca em 820 Hz (pior caso, por exemplo, utilizando PWM) Cintilação detectada em uma configuração de brilho de 100 % e abaixo. Não deve haver cintilação ou PWM acima desta configuração de brilho. A frequência de 820 Hz é bastante alta, então a maioria dos usuários sensíveis ao PWM não deve notar nenhuma oscilação. [pwm_comparison] Em comparação: 52 % de todos os dispositivos testados não usam PWM para escurecer a tela. Se PWM foi detectado, uma média de 7754 (mínimo: 5 - máximo: 343500) Hz foi medida. | |||
| Sunspider | |
| 1.0 Total Score | |
| Acer Chromebook 14 CP5-471-53QV | |
| Google Pixelbook | |
| HP Chromebook 13 G1 Core m5 | |
| Lenovo ThinkPad 13 Chromebook | |
| Microsoft Surface Laptop i5 | |
| 0.9.1 Total Score | |
| Google Chromebook Pixel | |
* ... menor é melhor
| AnTuTu v6 - Total Score | |
| Google Pixelbook | |
| Huawei Mate 10 Pro | |
| OnePlus 5 | |
| Samsung Galaxy Note 8 | |
| Sony Xperia XZ Premium | |
| Samsung Galaxy S8 | |
| Honor 8 Pro | |
| HTC U Ultra | |
| PCMark for Android | |
| Work 2.0 battery life | |
| Huawei Mate 10 Pro | |
| Samsung Galaxy S8 | |
| Samsung Galaxy Note 8 | |
| Computer Vision score | |
| Google Pixelbook | |
| Huawei Mate 10 Pro | |
| Samsung Galaxy S8 | |
| Samsung Galaxy Note 8 | |
| Storage score | |
| Google Pixelbook | |
| Huawei Mate 10 Pro | |
| Samsung Galaxy Note 8 | |
| Samsung Galaxy S8 | |
| Work 2.0 performance score | |
| Google Pixelbook | |
| Huawei Mate 10 Pro | |
| OnePlus 5 | |
| Sony Xperia XZ Premium | |
| Honor 8 Pro | |
| Samsung Galaxy S8 | |
| HTC U Ultra | |
| Samsung Galaxy Note 8 | |
| Work performance score | |
| Huawei Mate 10 Pro | |
| OnePlus 5 | |
| Sony Xperia XZ Premium | |
| Honor 8 Pro | |
| Samsung Galaxy Note 8 | |
| Samsung Galaxy S8 | |
| HTC U Ultra | |
| Geekbench 4.4 | |
| Compute RenderScript Score | |
| Huawei Mate 10 Pro | |
| Samsung Galaxy S8 | |
| Samsung Galaxy Note 8 | |
| OnePlus 5 | |
| Sony Xperia XZ Premium | |
| 64 Bit Multi-Core Score | |
| Google Pixelbook | |
| OnePlus 5 | |
| Huawei Mate 10 Pro | |
| Samsung Galaxy Note 8 | |
| Samsung Galaxy S8 | |
| Sony Xperia XZ Premium | |
| Honor 8 Pro | |
| 64 Bit Single-Core Score | |
| Google Pixelbook | |
| Samsung Galaxy Note 8 | |
| Samsung Galaxy S8 | |
| OnePlus 5 | |
| Sony Xperia XZ Premium | |
| Huawei Mate 10 Pro | |
| Honor 8 Pro | |
| Lightmark - 1920x1080 1080p | |
| Samsung Galaxy Note 8 | |
| Samsung Galaxy S8 | |
| Huawei Mate 10 Pro | |
| Google Pixelbook | |
| Basemark X 1.1 | |
| High Quality | |
| Samsung Galaxy S8 | |
| Samsung Galaxy Note 8 | |
| Google Pixelbook | |
| Huawei Mate 10 Pro | |
| Medium Quality | |
| Samsung Galaxy S8 | |
| Samsung Galaxy Note 8 | |
| Google Pixelbook | |
| Huawei Mate 10 Pro | |
| Cinebench R15 | |
| Cinebench R15 CPU Single 64 Bit | |
| Cinebench R15 CPU Multi 64 Bit |
| Cinebench R11.5 | |
| Cinebench R11.5 CPU Multi 64 Bit | |
| Cinebench R11.5 CPU Single 64 Bit |
| Cinebench R10 | |
| Cinebench R10 Rend. Single (32bit) | |
| Cinebench R10 Rend. Multi (32bit) |
| wPrime 2.10 - 1024m wPrime 2.0 1024m |
* ... menor é melhor
| Google Pixelbook | Samsung Galaxy Note 8 64 GB UFS 2.1 Flash | Huawei Mate 10 Pro 128 GB UFS 2.1 Flash | Google Pixel XL 2016 32 GB eMMC Flash | OnePlus 5 64 GB UFS 2.1 Flash | |
|---|---|---|---|---|---|
| AndroBench 3-5 | 247% | 539% | 77% | 261% | |
| Sequential Write 256KB SDCard (MB/s) | 59.3 | ||||
| Sequential Read 256KB SDCard (MB/s) | 67.9 | ||||
| Random Write 4KB (MB/s) | 12.6 | 14.55 15% | 164.4 1205% | 14.56 16% | 19.3 53% |
| Random Read 4KB (MB/s) | 28.87 | 122.5 324% | 132.3 358% | 87.7 204% | 141 388% |
| Sequential Write 256KB (MB/s) | 112.1 | 205.9 84% | 208.7 86% | 83.4 -26% | 201.5 80% |
| Sequential Read 256KB (MB/s) | 120.3 | 797 563% | 732 508% | 258.2 115% | 748 522% |
Barulho
| Ocioso |
| / / dB |
| Carga |
| / dB |
 | ||
30 dB silencioso 40 dB(A) audível 50 dB(A) ruidosamente alto |
||
min: | ||
| Google Pixelbook HD Graphics 615, i5-7Y57 | Microsoft Surface Pro (2017) i7 Iris Plus Graphics 640, i7-7660U, Samsung PM971 KUS040202M | Microsoft Surface Laptop i5 HD Graphics 620, i5-7200U, Toshiba THNSN0128GTYA | Apple MacBook Pro 13 2017 Iris Plus Graphics 640, i5-7360U, Apple SSD AP0128 | Huawei MateBook X HD Graphics 620, i5-7200U, LITEON CB1-SD256 | Samsung Notebook 9 NP900X3N-K01US HD Graphics 620, i5-7200U, Samsung CM871a MZNTY256HDHP | |
|---|---|---|---|---|---|---|
| Noise | ||||||
| desligado / ambiente * (dB) | 29.6 | 28.2 | 30.2 | 28.4 | ||
| Idle Minimum * (dB) | 29.6 | 28.2 | 30.2 | 28.4 | ||
| Idle Average * (dB) | 29.6 | 28.2 | 30.2 | 28.4 | ||
| Idle Maximum * (dB) | 29.6 | 29 | 30.2 | 28.4 | ||
| Load Average * (dB) | 33.4 | 30.3 | 32.9 | 33.2 | ||
| Witcher 3 ultra * (dB) | 33.4 | |||||
| Load Maximum * (dB) | 34.1 | 39.3 | 39.3 | 35.2 |
* ... menor é melhor
(+) A temperatura máxima no lado superior é 38.8 °C / 102 F, em comparação com a média de 35.4 °C / 96 F , variando de 19.6 a 60 °C para a classe Convertible.
(+) A parte inferior aquece até um máximo de 38 °C / 100 F, em comparação com a média de 36.9 °C / 98 F
(+) Em uso inativo, a temperatura média para o lado superior é 25.6 °C / 78 F, em comparação com a média do dispositivo de 30.3 °C / ### class_avg_f### F.
(+) Os apoios para as mãos e o touchpad são mais frios que a temperatura da pele, com um máximo de 28.8 °C / 83.8 F e, portanto, são frios ao toque.
(±) A temperatura média da área do apoio para as mãos de dispositivos semelhantes foi 28 °C / 82.4 F (-0.8 °C / -1.4 F).
Google Pixelbook análise de áudio
(-) | alto-falantes não muito altos (###valor### dB)
Graves 100 - 315Hz
(-) | quase nenhum baixo - em média 17.1% menor que a mediana
(±) | a linearidade dos graves é média (10.2% delta para a frequência anterior)
Médios 400 - 2.000 Hz
(±) | médios mais altos - em média 5.4% maior que a mediana
(±) | a linearidade dos médios é média (8.4% delta para frequência anterior)
Altos 2 - 16 kHz
(±) | máximos mais altos - em média 5.7% maior que a mediana
(+) | os máximos são lineares (5.8% delta da frequência anterior)
Geral 100 - 16.000 Hz
(±) | a linearidade do som geral é média (24.8% diferença em relação à mediana)
Comparado com a mesma classe
» 75% de todos os dispositivos testados nesta classe foram melhores, 6% semelhantes, 18% piores
» O melhor teve um delta de 6%, a média foi 20%, o pior foi 57%
Comparado com todos os dispositivos testados
» 76% de todos os dispositivos testados foram melhores, 5% semelhantes, 19% piores
» O melhor teve um delta de 4%, a média foi 23%, o pior foi 134%
Apple MacBook 12 (Early 2016) 1.1 GHz análise de áudio
(+) | os alto-falantes podem tocar relativamente alto (###valor### dB)
Graves 100 - 315Hz
(±) | graves reduzidos - em média 11.3% menor que a mediana
(±) | a linearidade dos graves é média (14.2% delta para a frequência anterior)
Médios 400 - 2.000 Hz
(+) | médios equilibrados - apenas 2.4% longe da mediana
(+) | médios são lineares (5.5% delta para frequência anterior)
Altos 2 - 16 kHz
(+) | agudos equilibrados - apenas 2% longe da mediana
(+) | os máximos são lineares (4.5% delta da frequência anterior)
Geral 100 - 16.000 Hz
(+) | o som geral é linear (10.2% diferença em relação à mediana)
Comparado com a mesma classe
» 7% de todos os dispositivos testados nesta classe foram melhores, 2% semelhantes, 90% piores
» O melhor teve um delta de 5%, a média foi 18%, o pior foi 53%
Comparado com todos os dispositivos testados
» 5% de todos os dispositivos testados foram melhores, 1% semelhantes, 94% piores
» O melhor teve um delta de 4%, a média foi 23%, o pior foi 134%
| desligado | |
| Ocioso | |
| Carga |
|
Key:
min: | |
| Google Pixelbook i5-7Y57, HD Graphics 615, , IPS, 2400x1600, 12.3" | Microsoft Surface Pro (2017) i7 i7-7660U, Iris Plus Graphics 640, Samsung PM971 KUS040202M, IPS, 2736x1824, 12.3" | Microsoft Surface Laptop i5 i5-7200U, HD Graphics 620, Toshiba THNSN0128GTYA, IPS, 2256x1504, 13.5" | Apple MacBook Pro 13 2017 i5-7360U, Iris Plus Graphics 640, Apple SSD AP0128, IPS, 2560x1600, 13.3" | Apple MacBook 12 2017 m3-7Y32, HD Graphics 615, Apple SSD AP0256, LED IPS, 2304x1440, 12" | Samsung Notebook 9 NP900X3N-K01US i5-7200U, HD Graphics 620, Samsung CM871a MZNTY256HDHP, IPS, 1920x1080, 13.3" | |
|---|---|---|---|---|---|---|
| Power Consumption | ||||||
| Idle Minimum * (Watt) | 4.2 | 3.2 | 3.7 | 2 | 3.8 | |
| Idle Average * (Watt) | 10.1 | 6.5 | 5.2 | 5.4 | 11 | |
| Idle Maximum * (Watt) | 14 | 6.8 | 7.6 | 6.6 | 11.3 | |
| Load Average * (Watt) | 37.4 | 28.2 | 41.6 | 22 | 35.6 | |
| Load Maximum * (Watt) | 34 | 36 | 50.5 | 20 | 37.2 | |
| Witcher 3 ultra * (Watt) | 38.1 |
* ... menor é melhor
| Google Pixelbook i5-7Y57, HD Graphics 615, 41 Wh | Microsoft Surface Pro (2017) i7 i7-7660U, Iris Plus Graphics 640, 45 Wh | Microsoft Surface Laptop i5 i5-7200U, HD Graphics 620, 45 Wh | Apple MacBook Pro 13 2017 i5-7360U, Iris Plus Graphics 640, 54.5 Wh | Samsung Notebook 9 NP900X3N-K01US i5-7200U, HD Graphics 620, 30 Wh | Apple MacBook 12 2017 m3-7Y32, HD Graphics 615, 41.4 Wh | |
|---|---|---|---|---|---|---|
| Duração da bateria | -39% | -21% | -38% | -61% | -35% | |
| Reader / Idle (h) | 23.8 | 22.5 -5% | 11.6 -51% | |||
| WiFi v1.3 (h) | 13.9 | 8.2 -41% | 10 -28% | 11.4 -18% | 4.7 -66% | 9 -35% |
| Load (h) | 3 | 1.9 -37% | 2.1 -30% | 1.3 -57% | 1 -67% | |
| Witcher 3 ultra (h) | 1.9 |
Pro
Contra
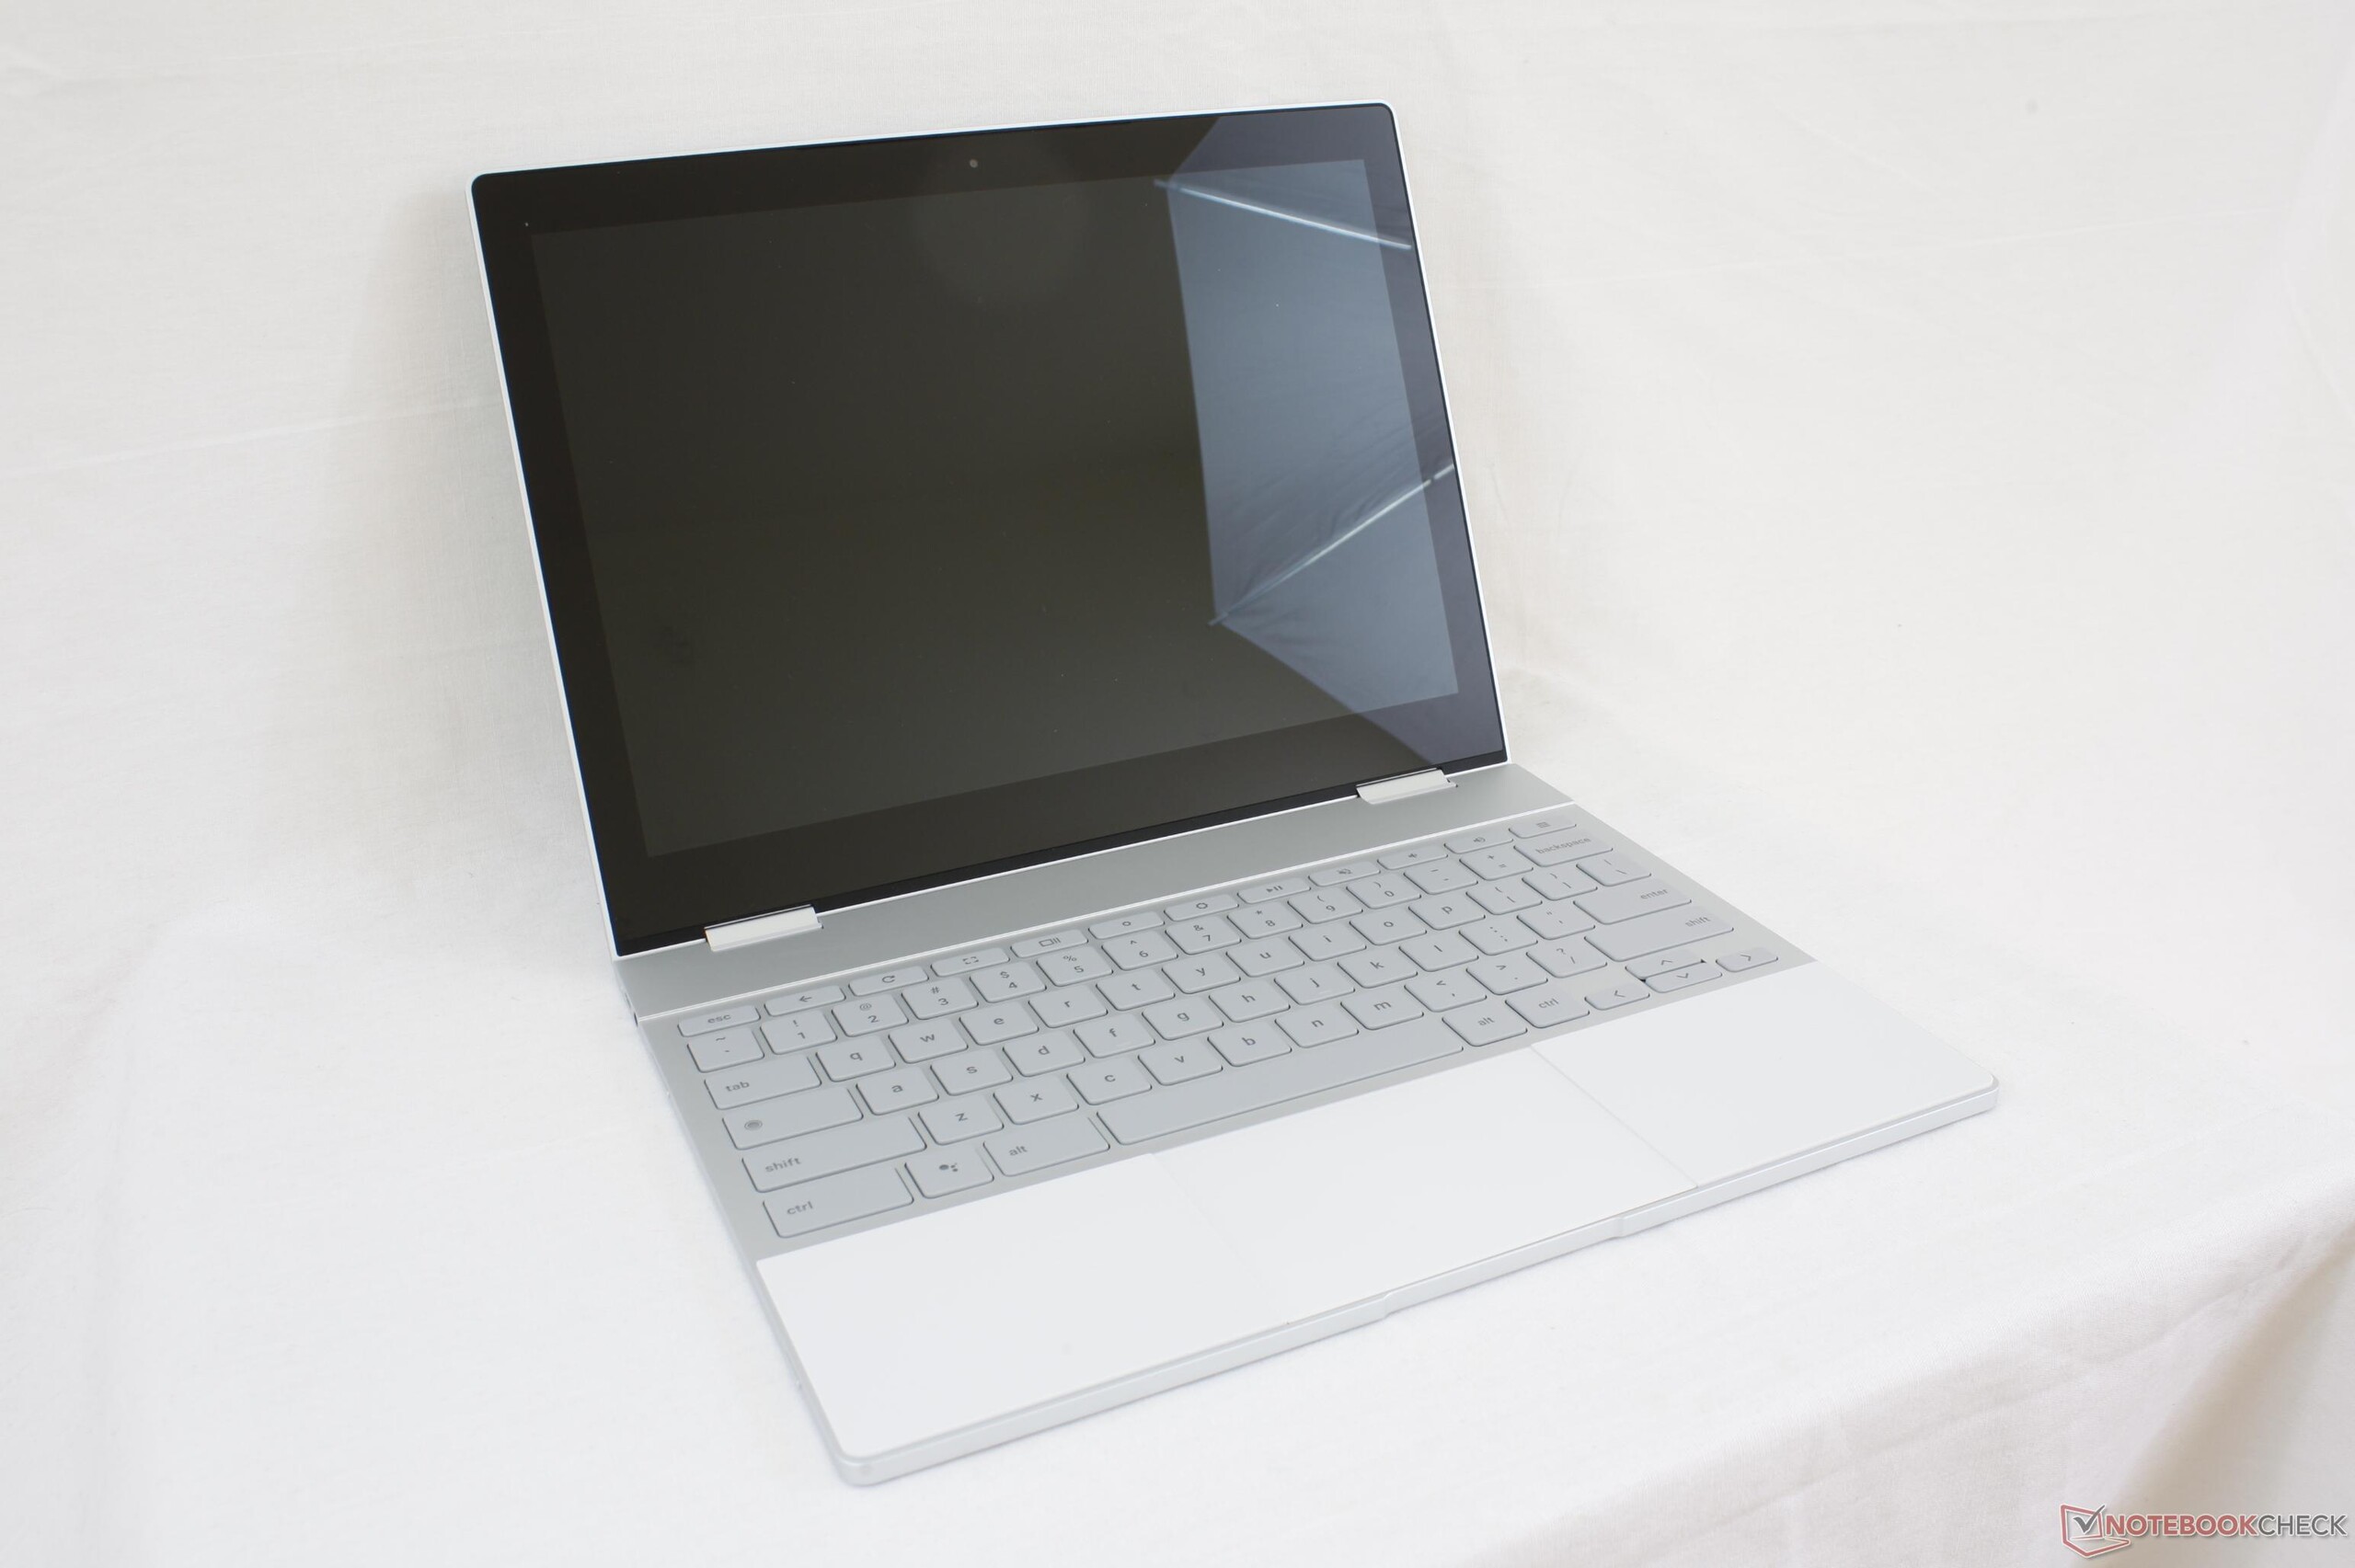
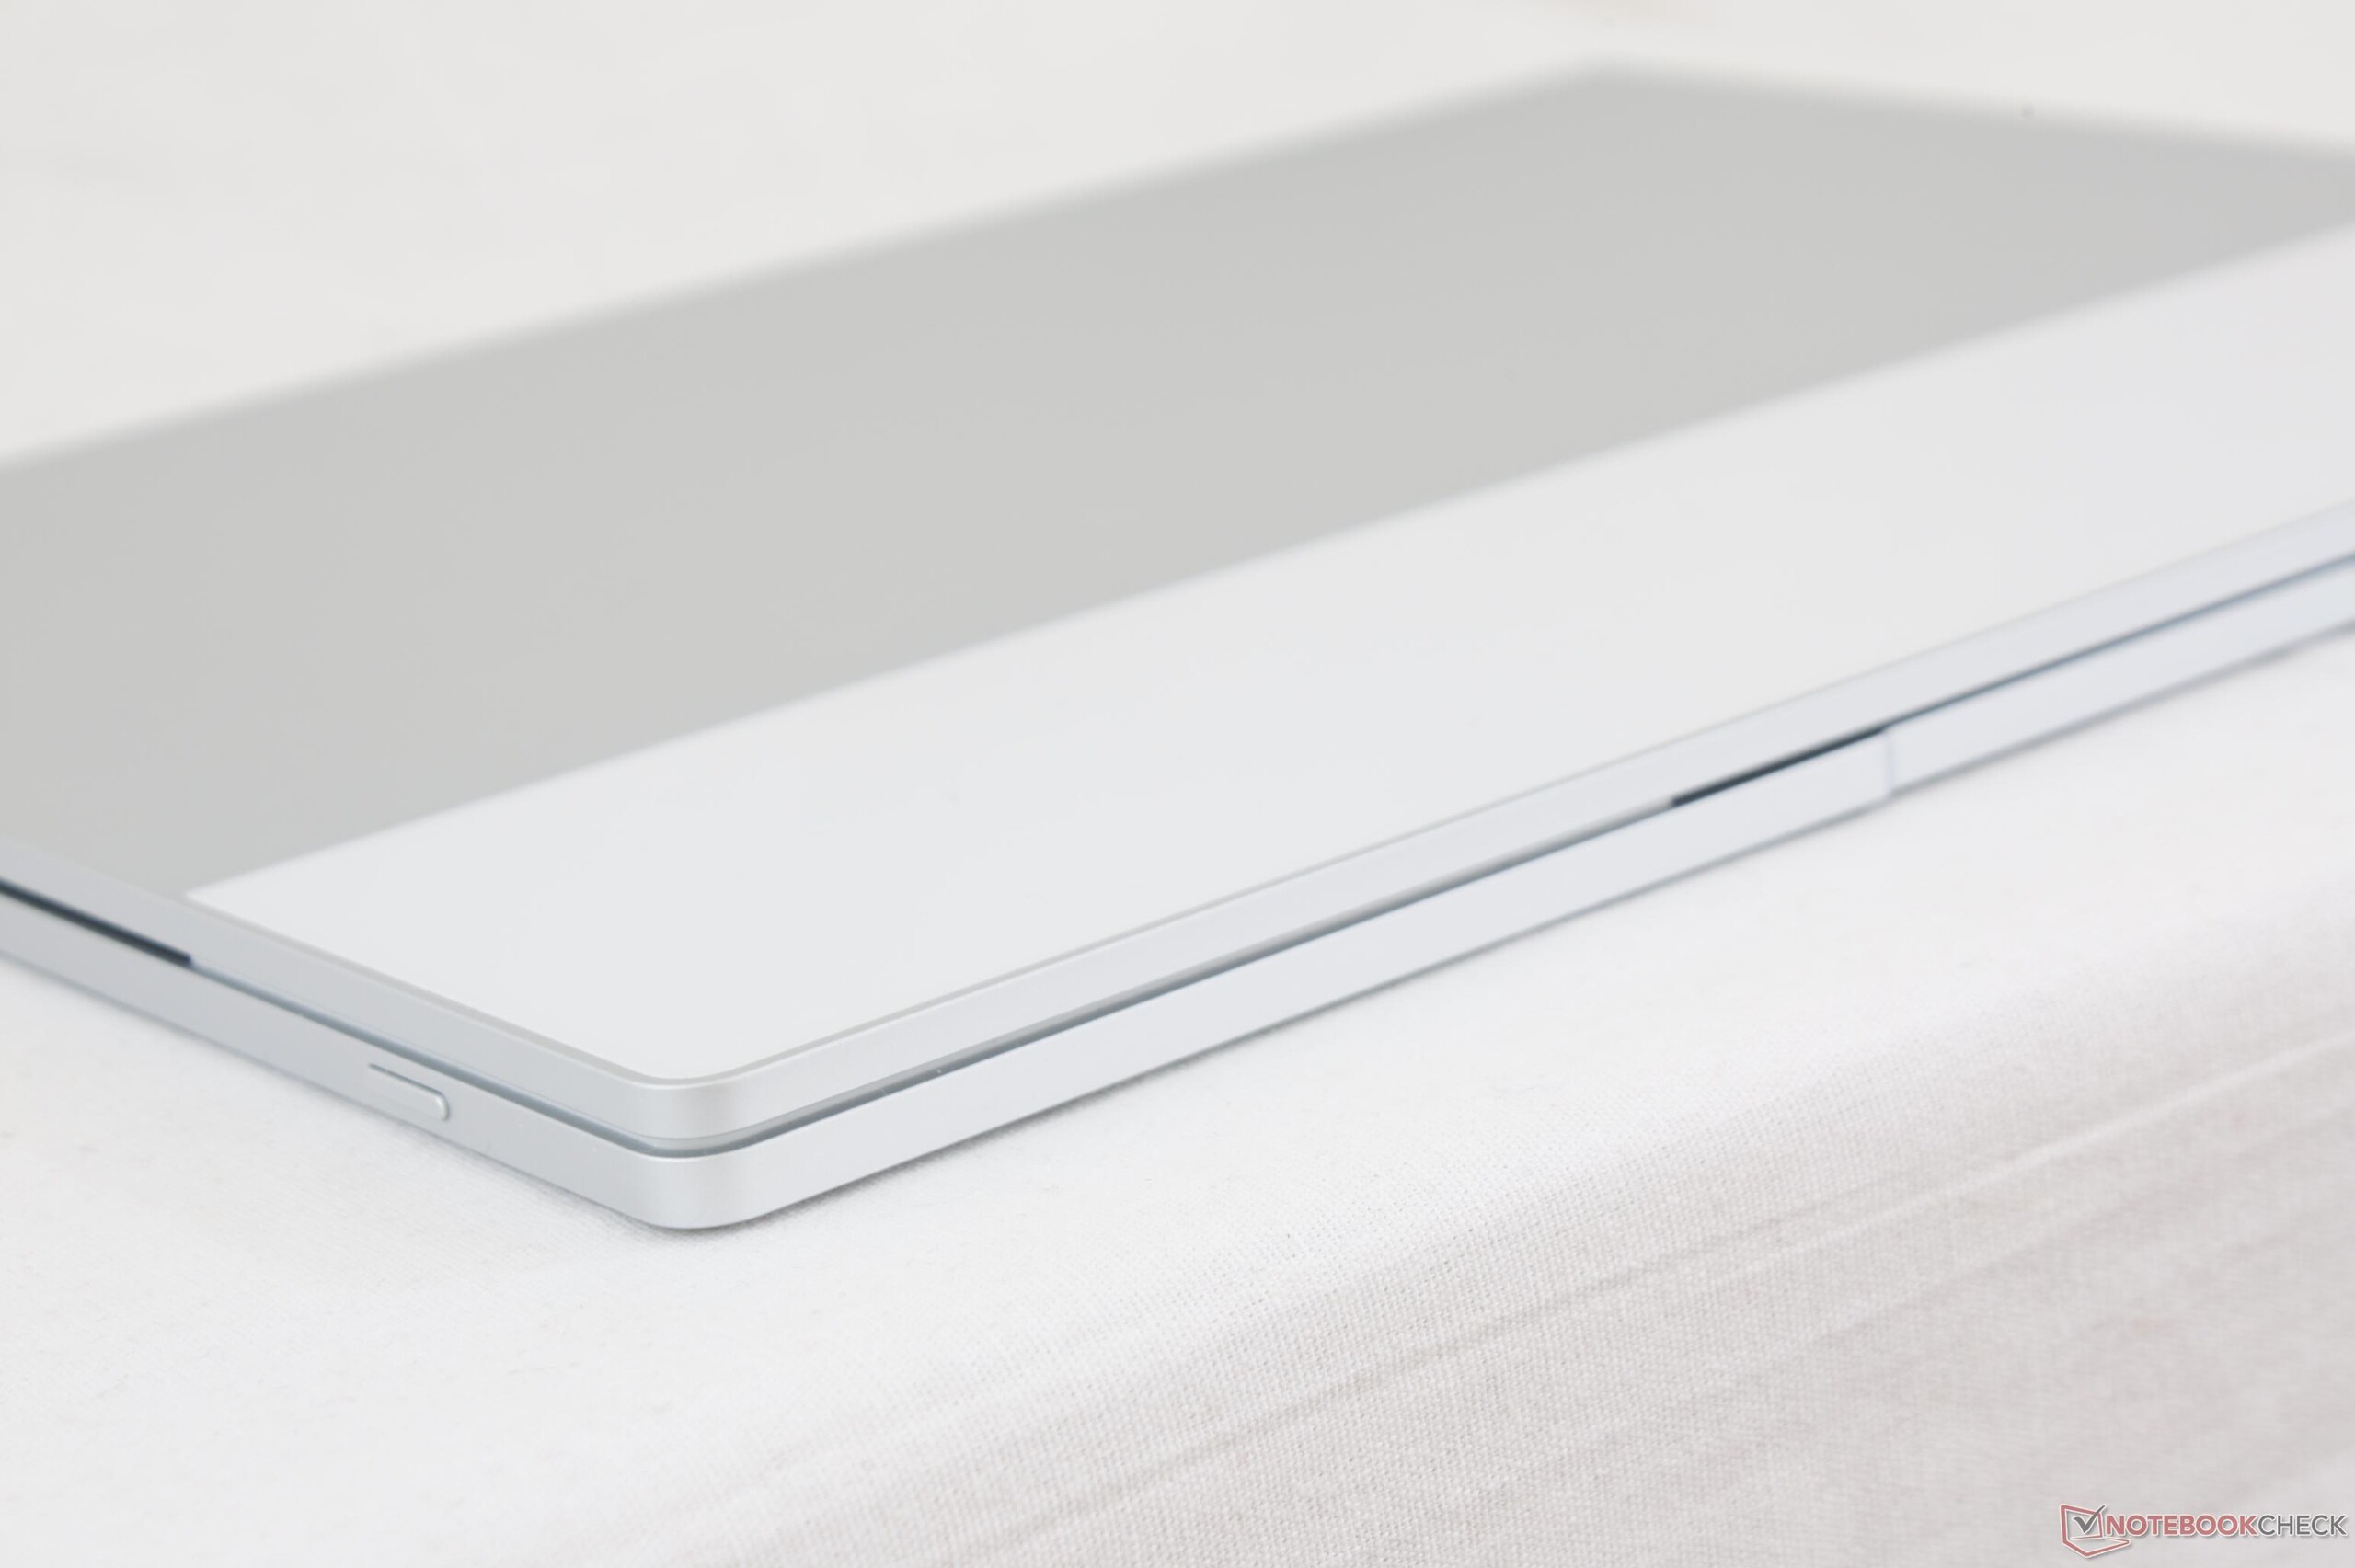
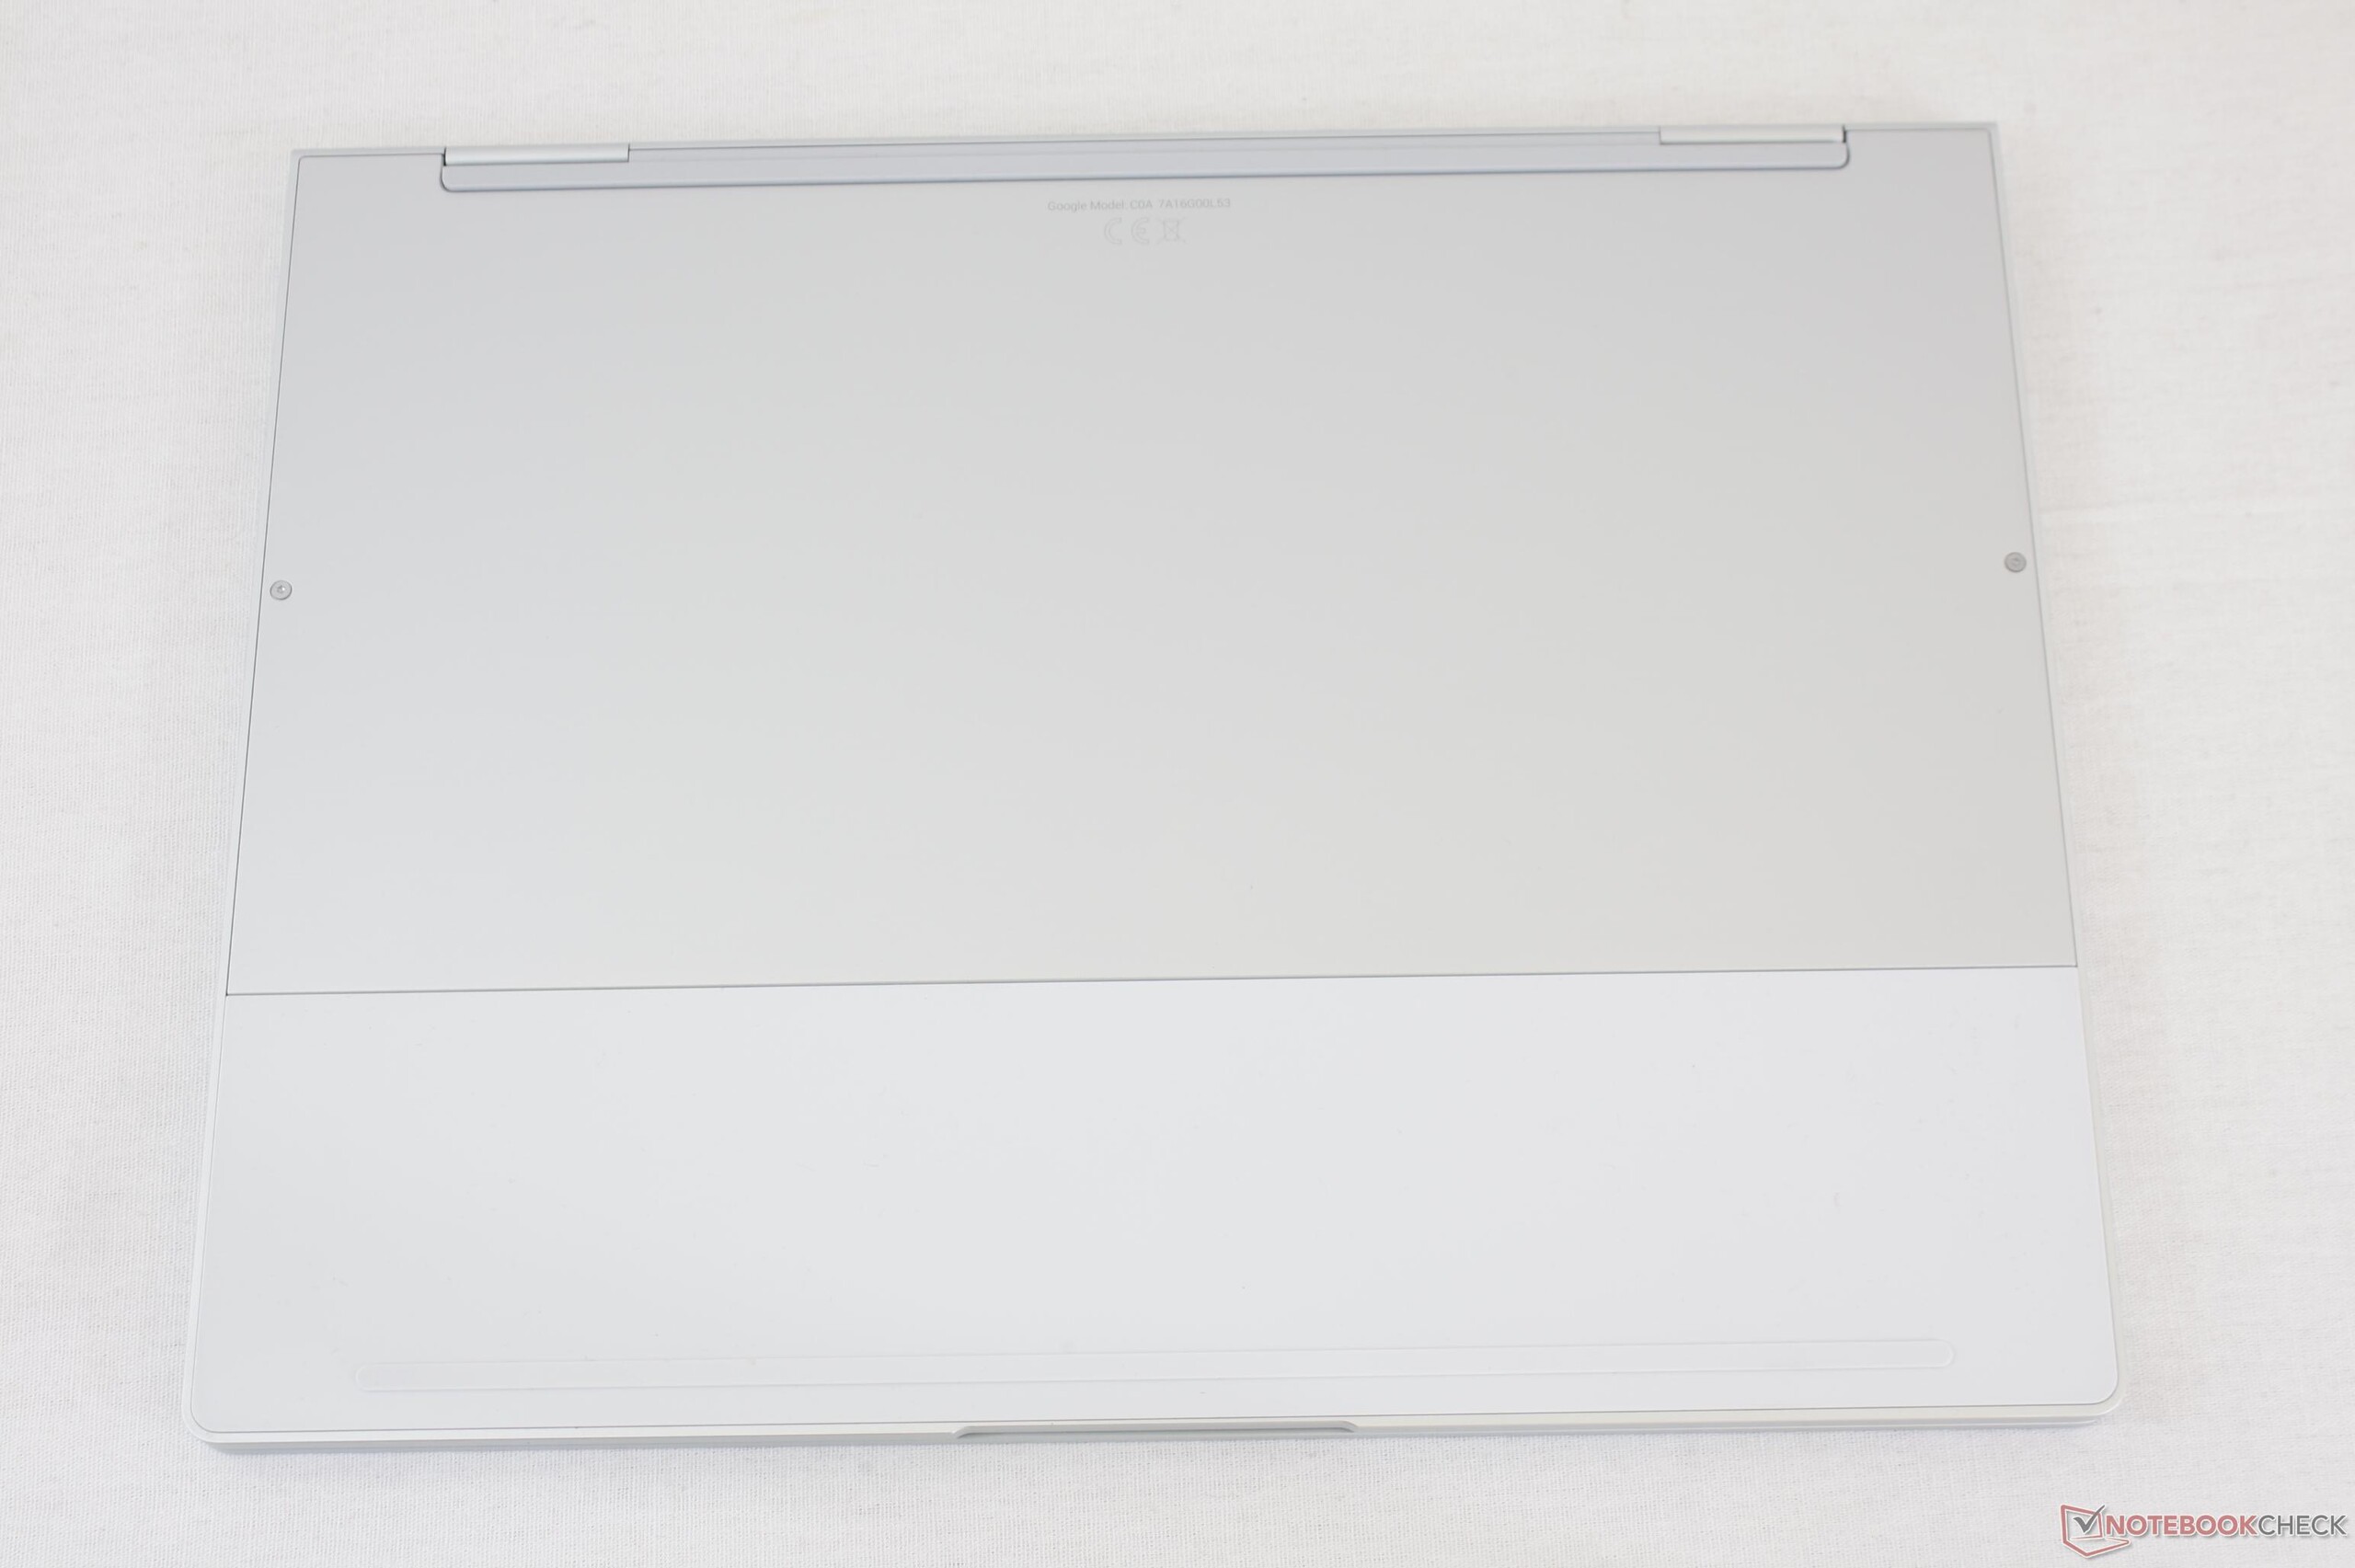
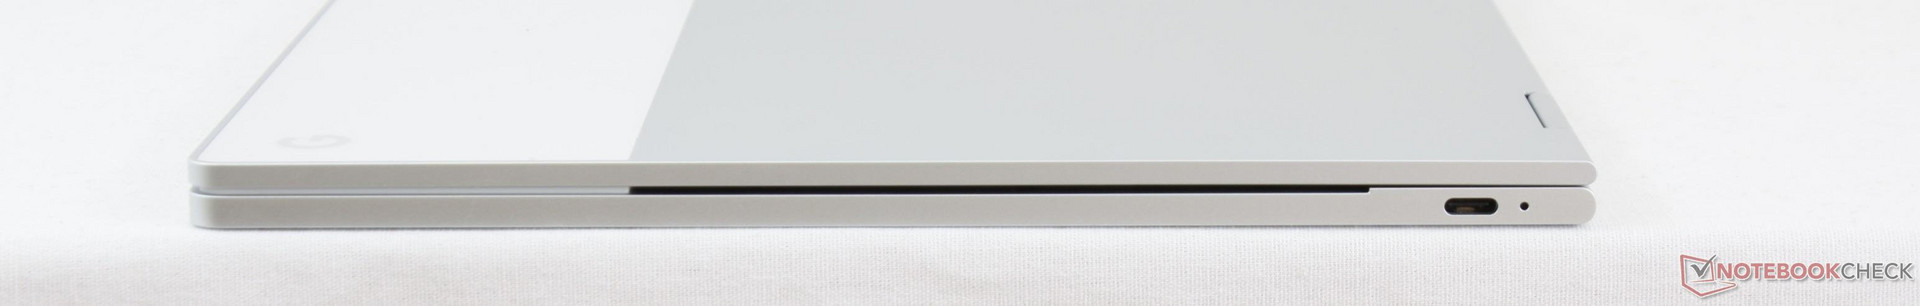
Não há como negar que o Pixelbook se sente ótimo para segurar e usar. O próprio chassi é o melhor que a Lenovo, a HP e a Dell têm para oferecer na categoria conversível de subportáteis leves, se mantendo firme e surpreendentemente inflexível. Seria um belo concorrente no espaço dos Ultrabooks no caso improvável de ver um Pixelbook baseado em Windows.
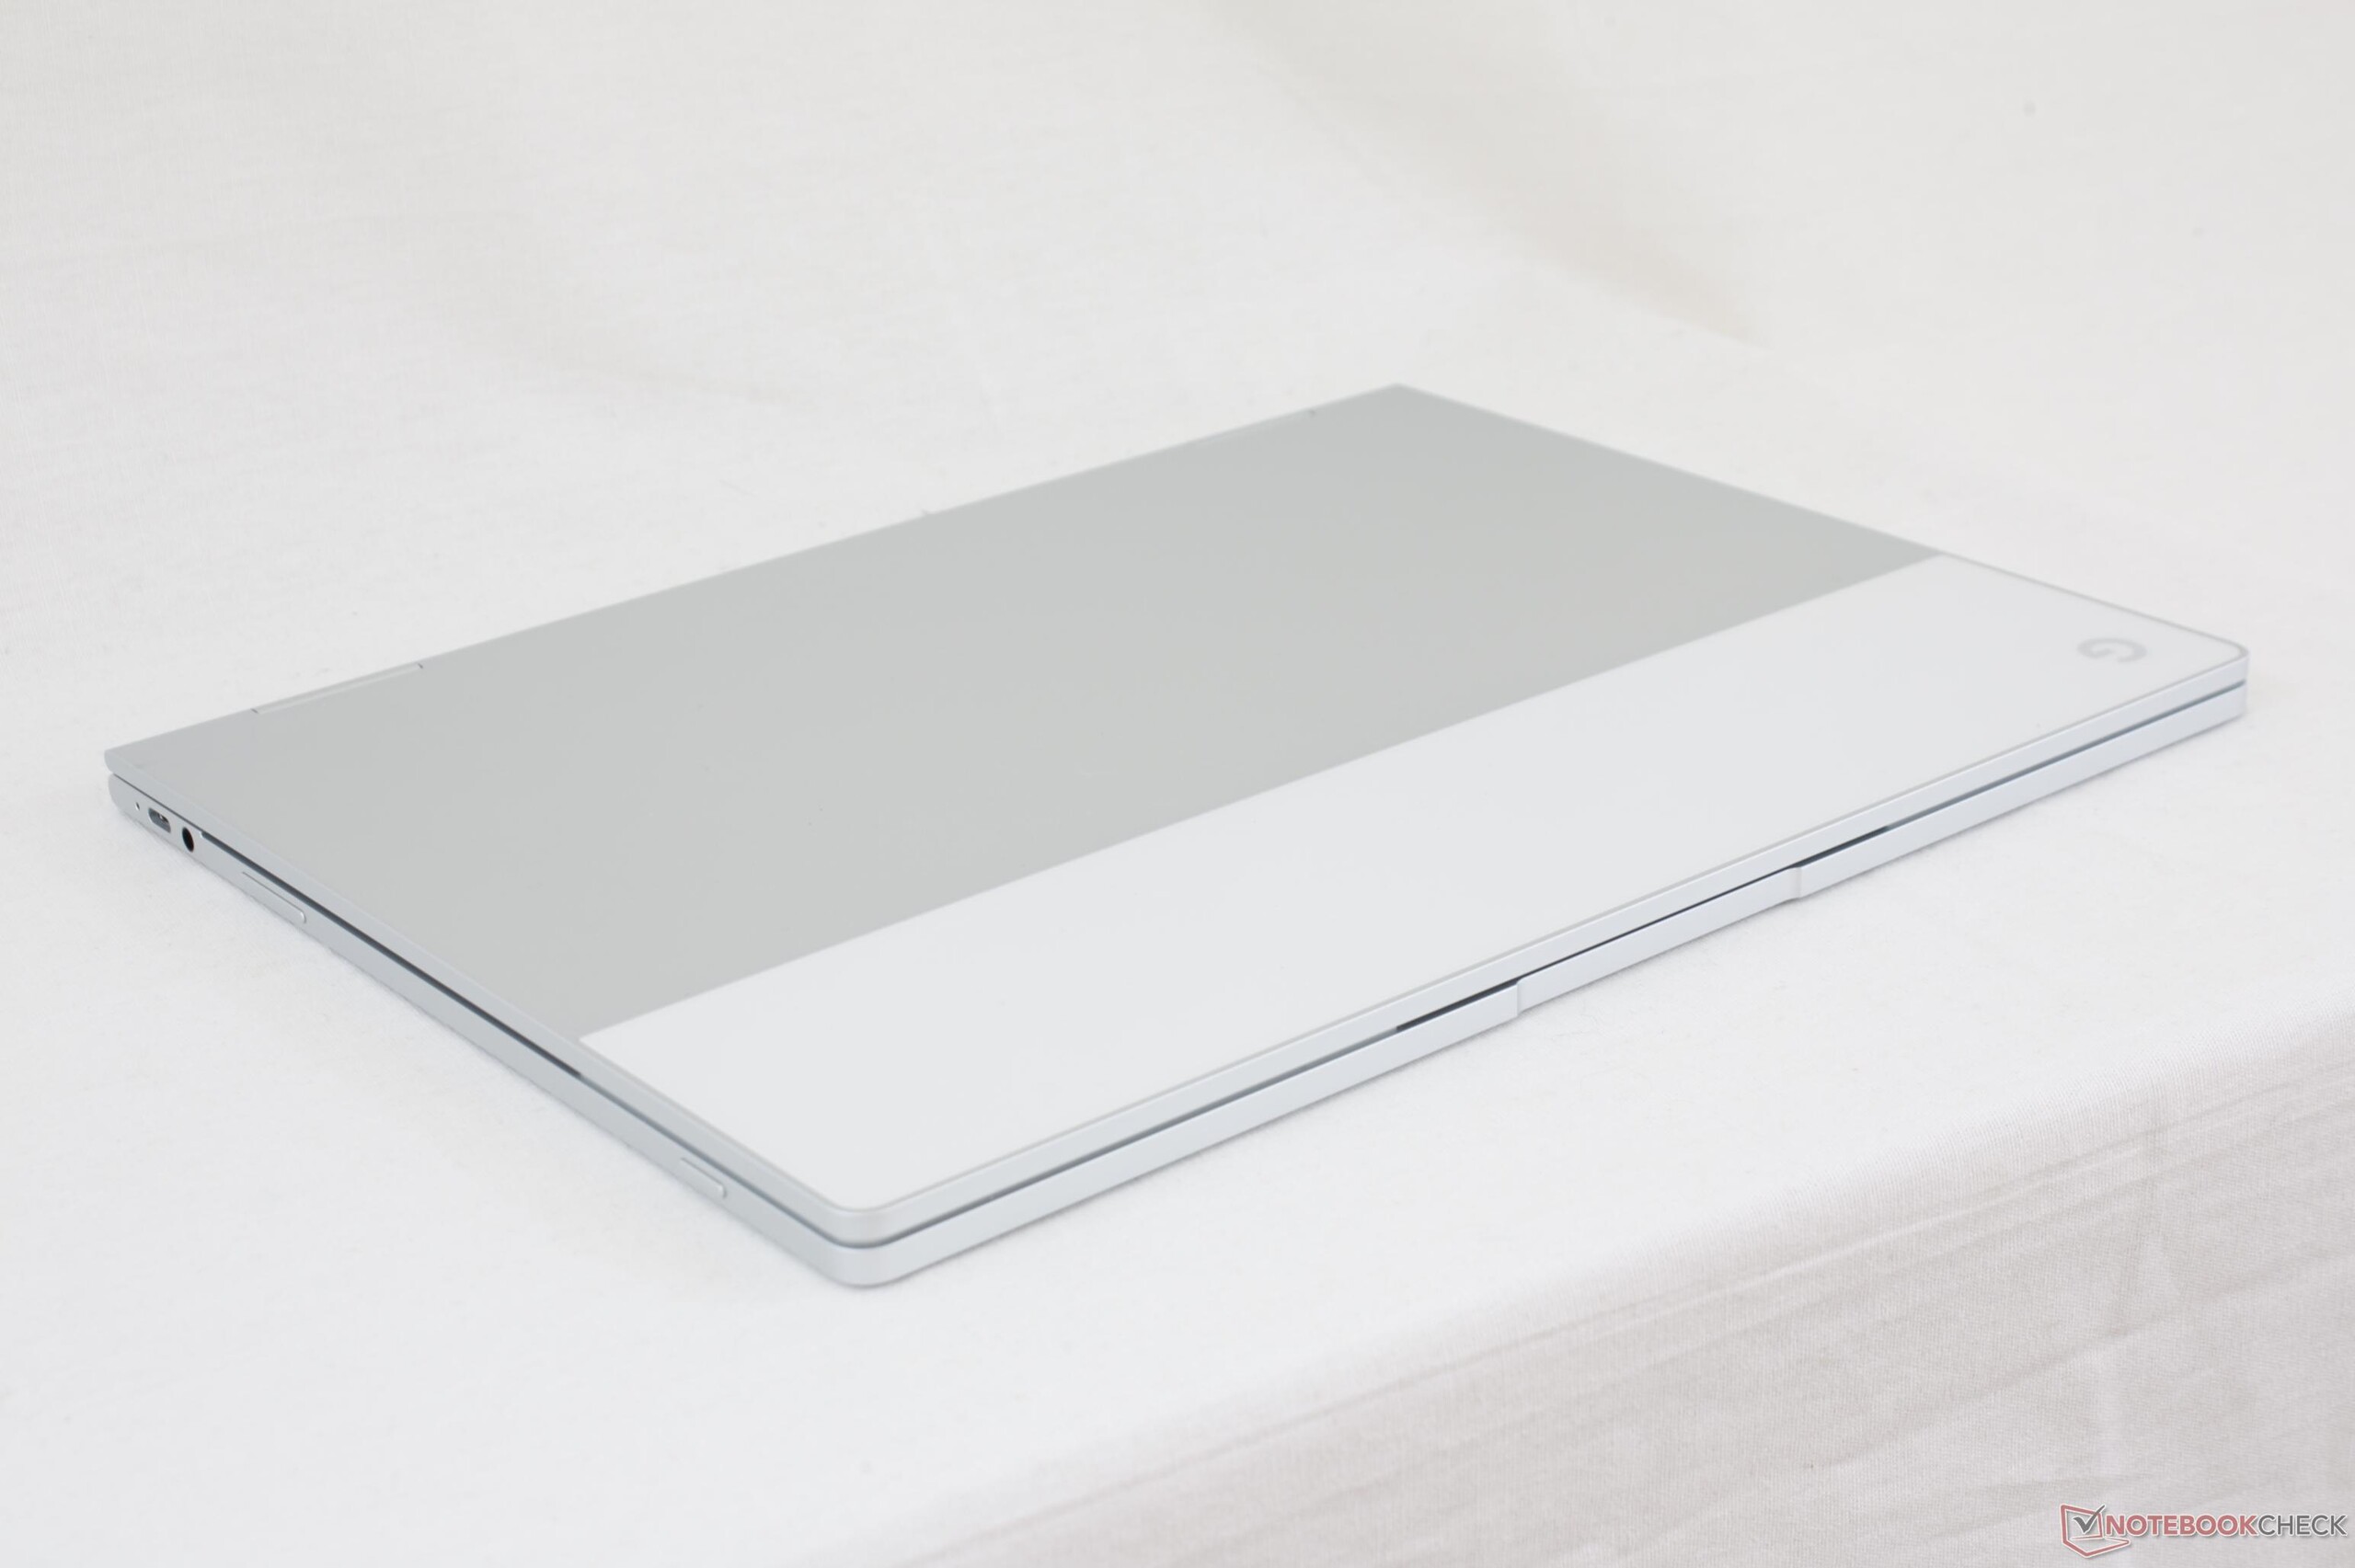
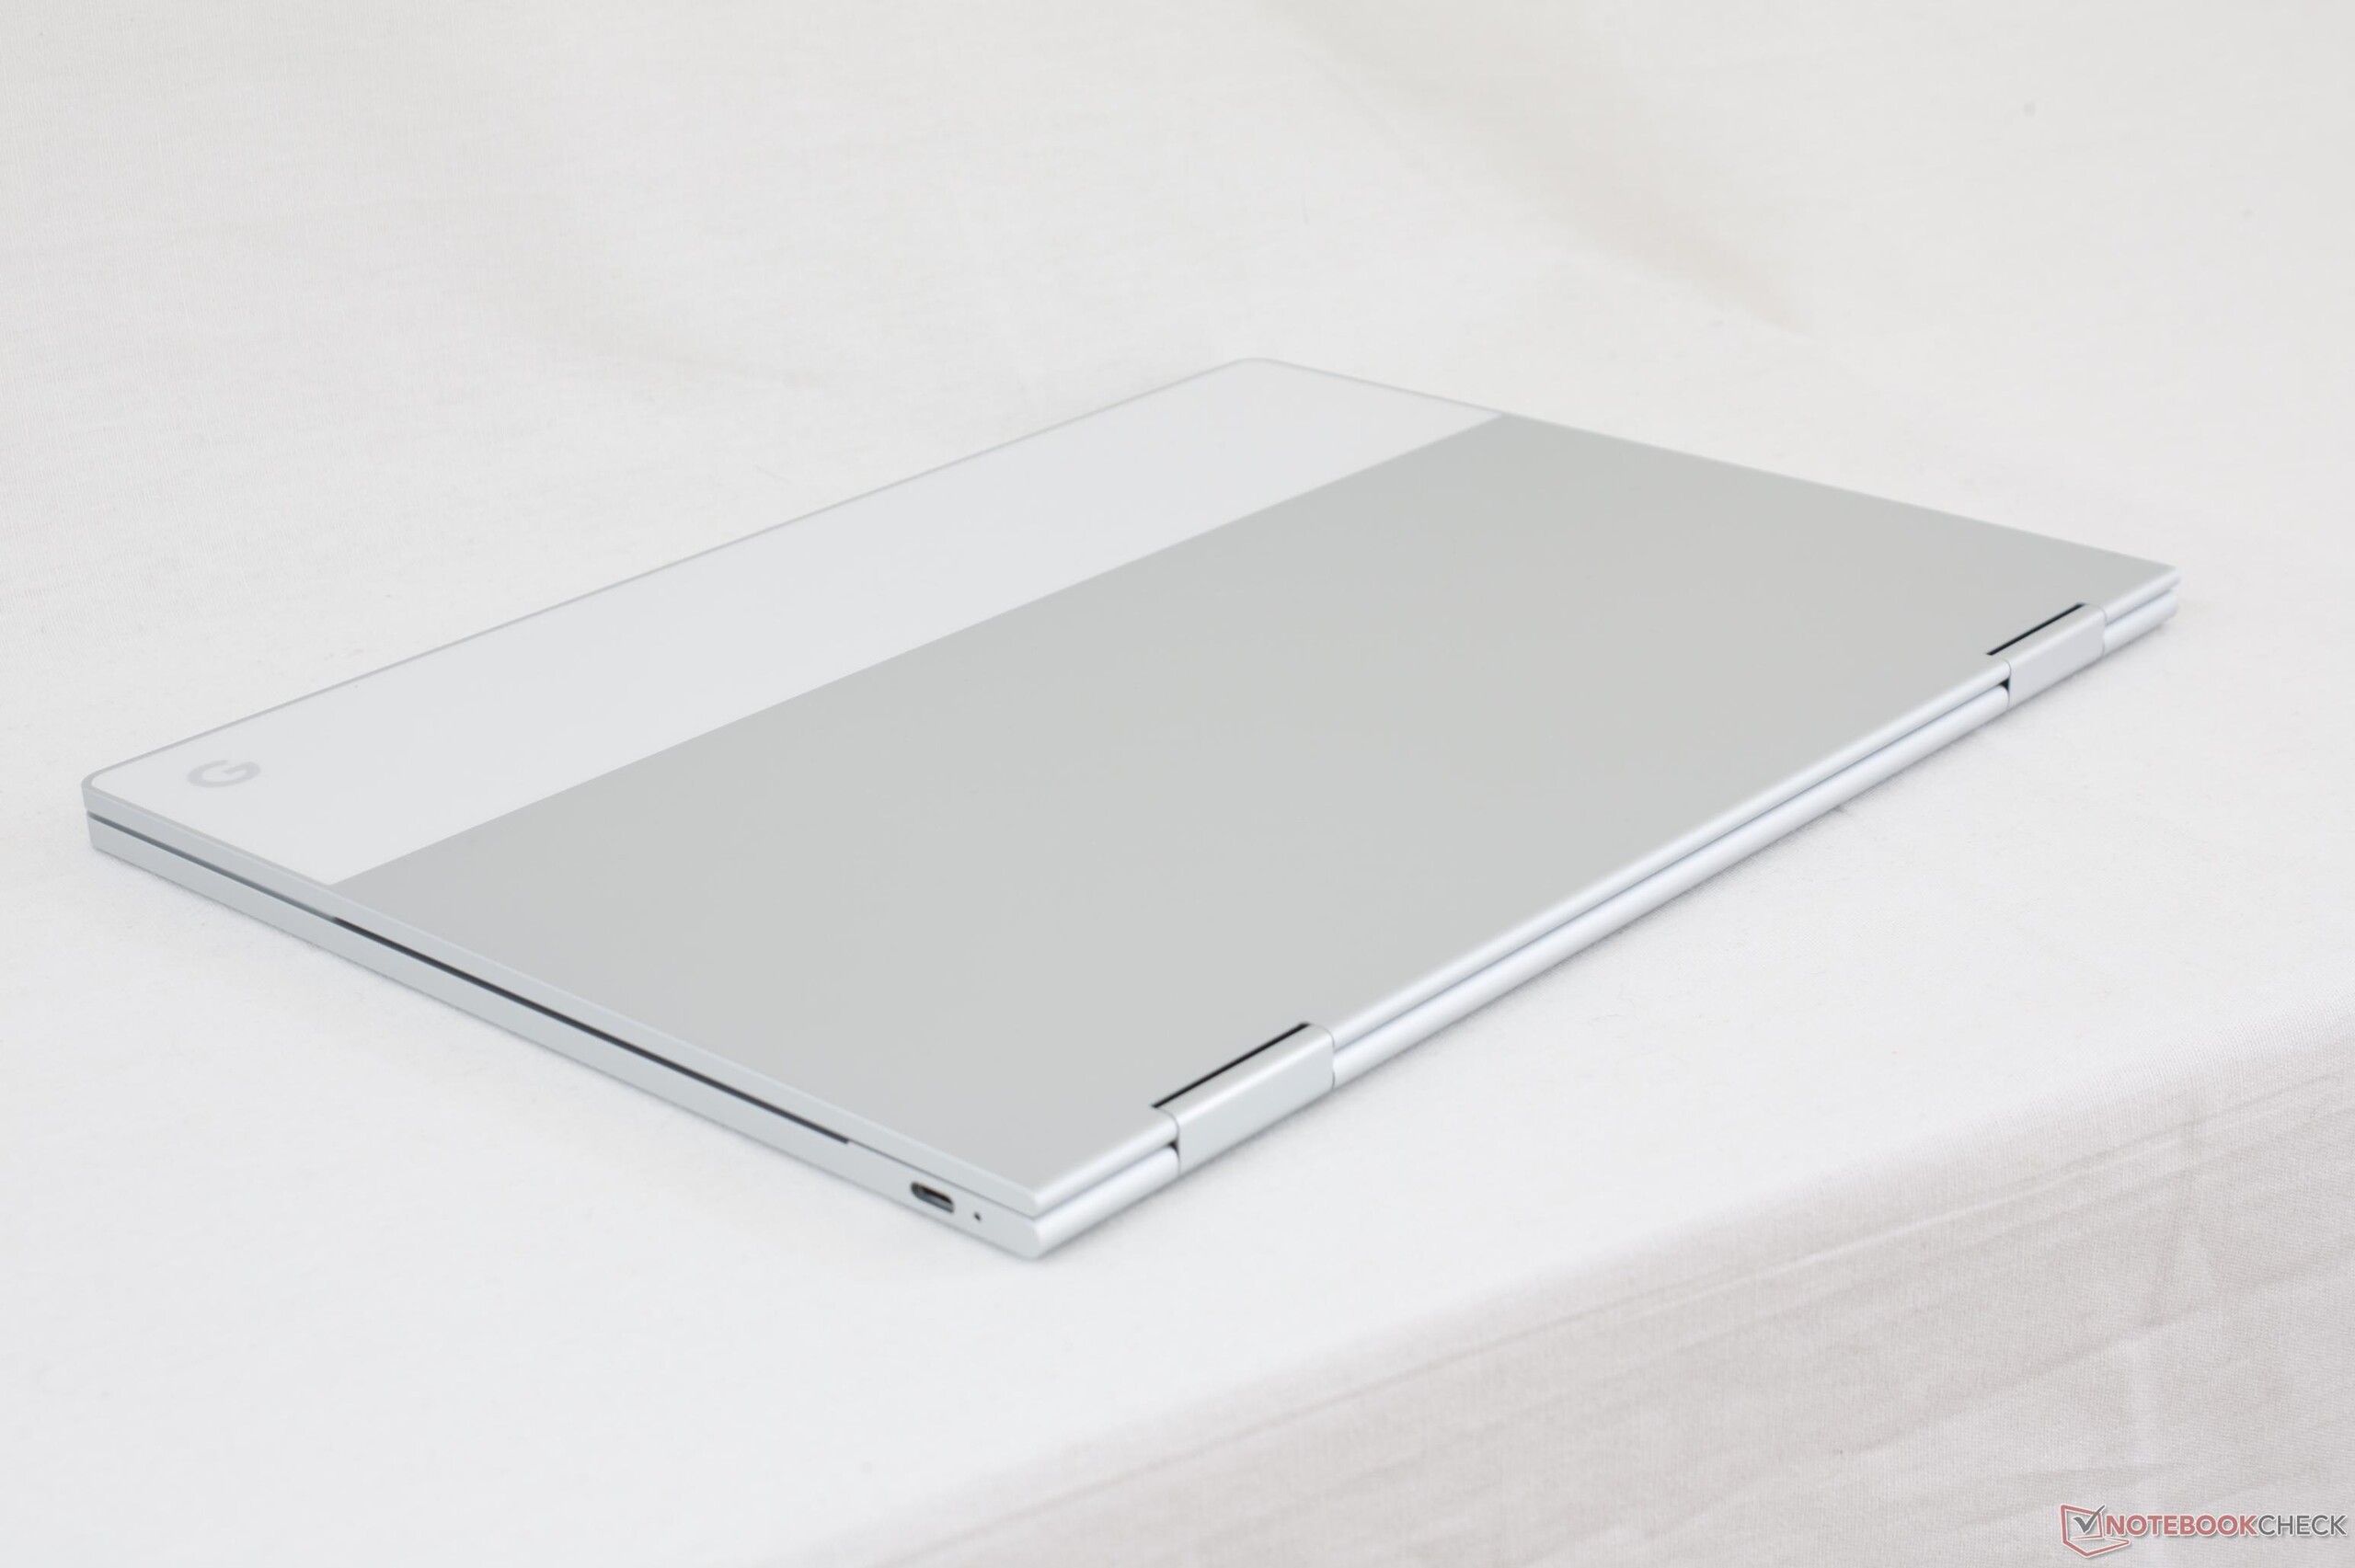
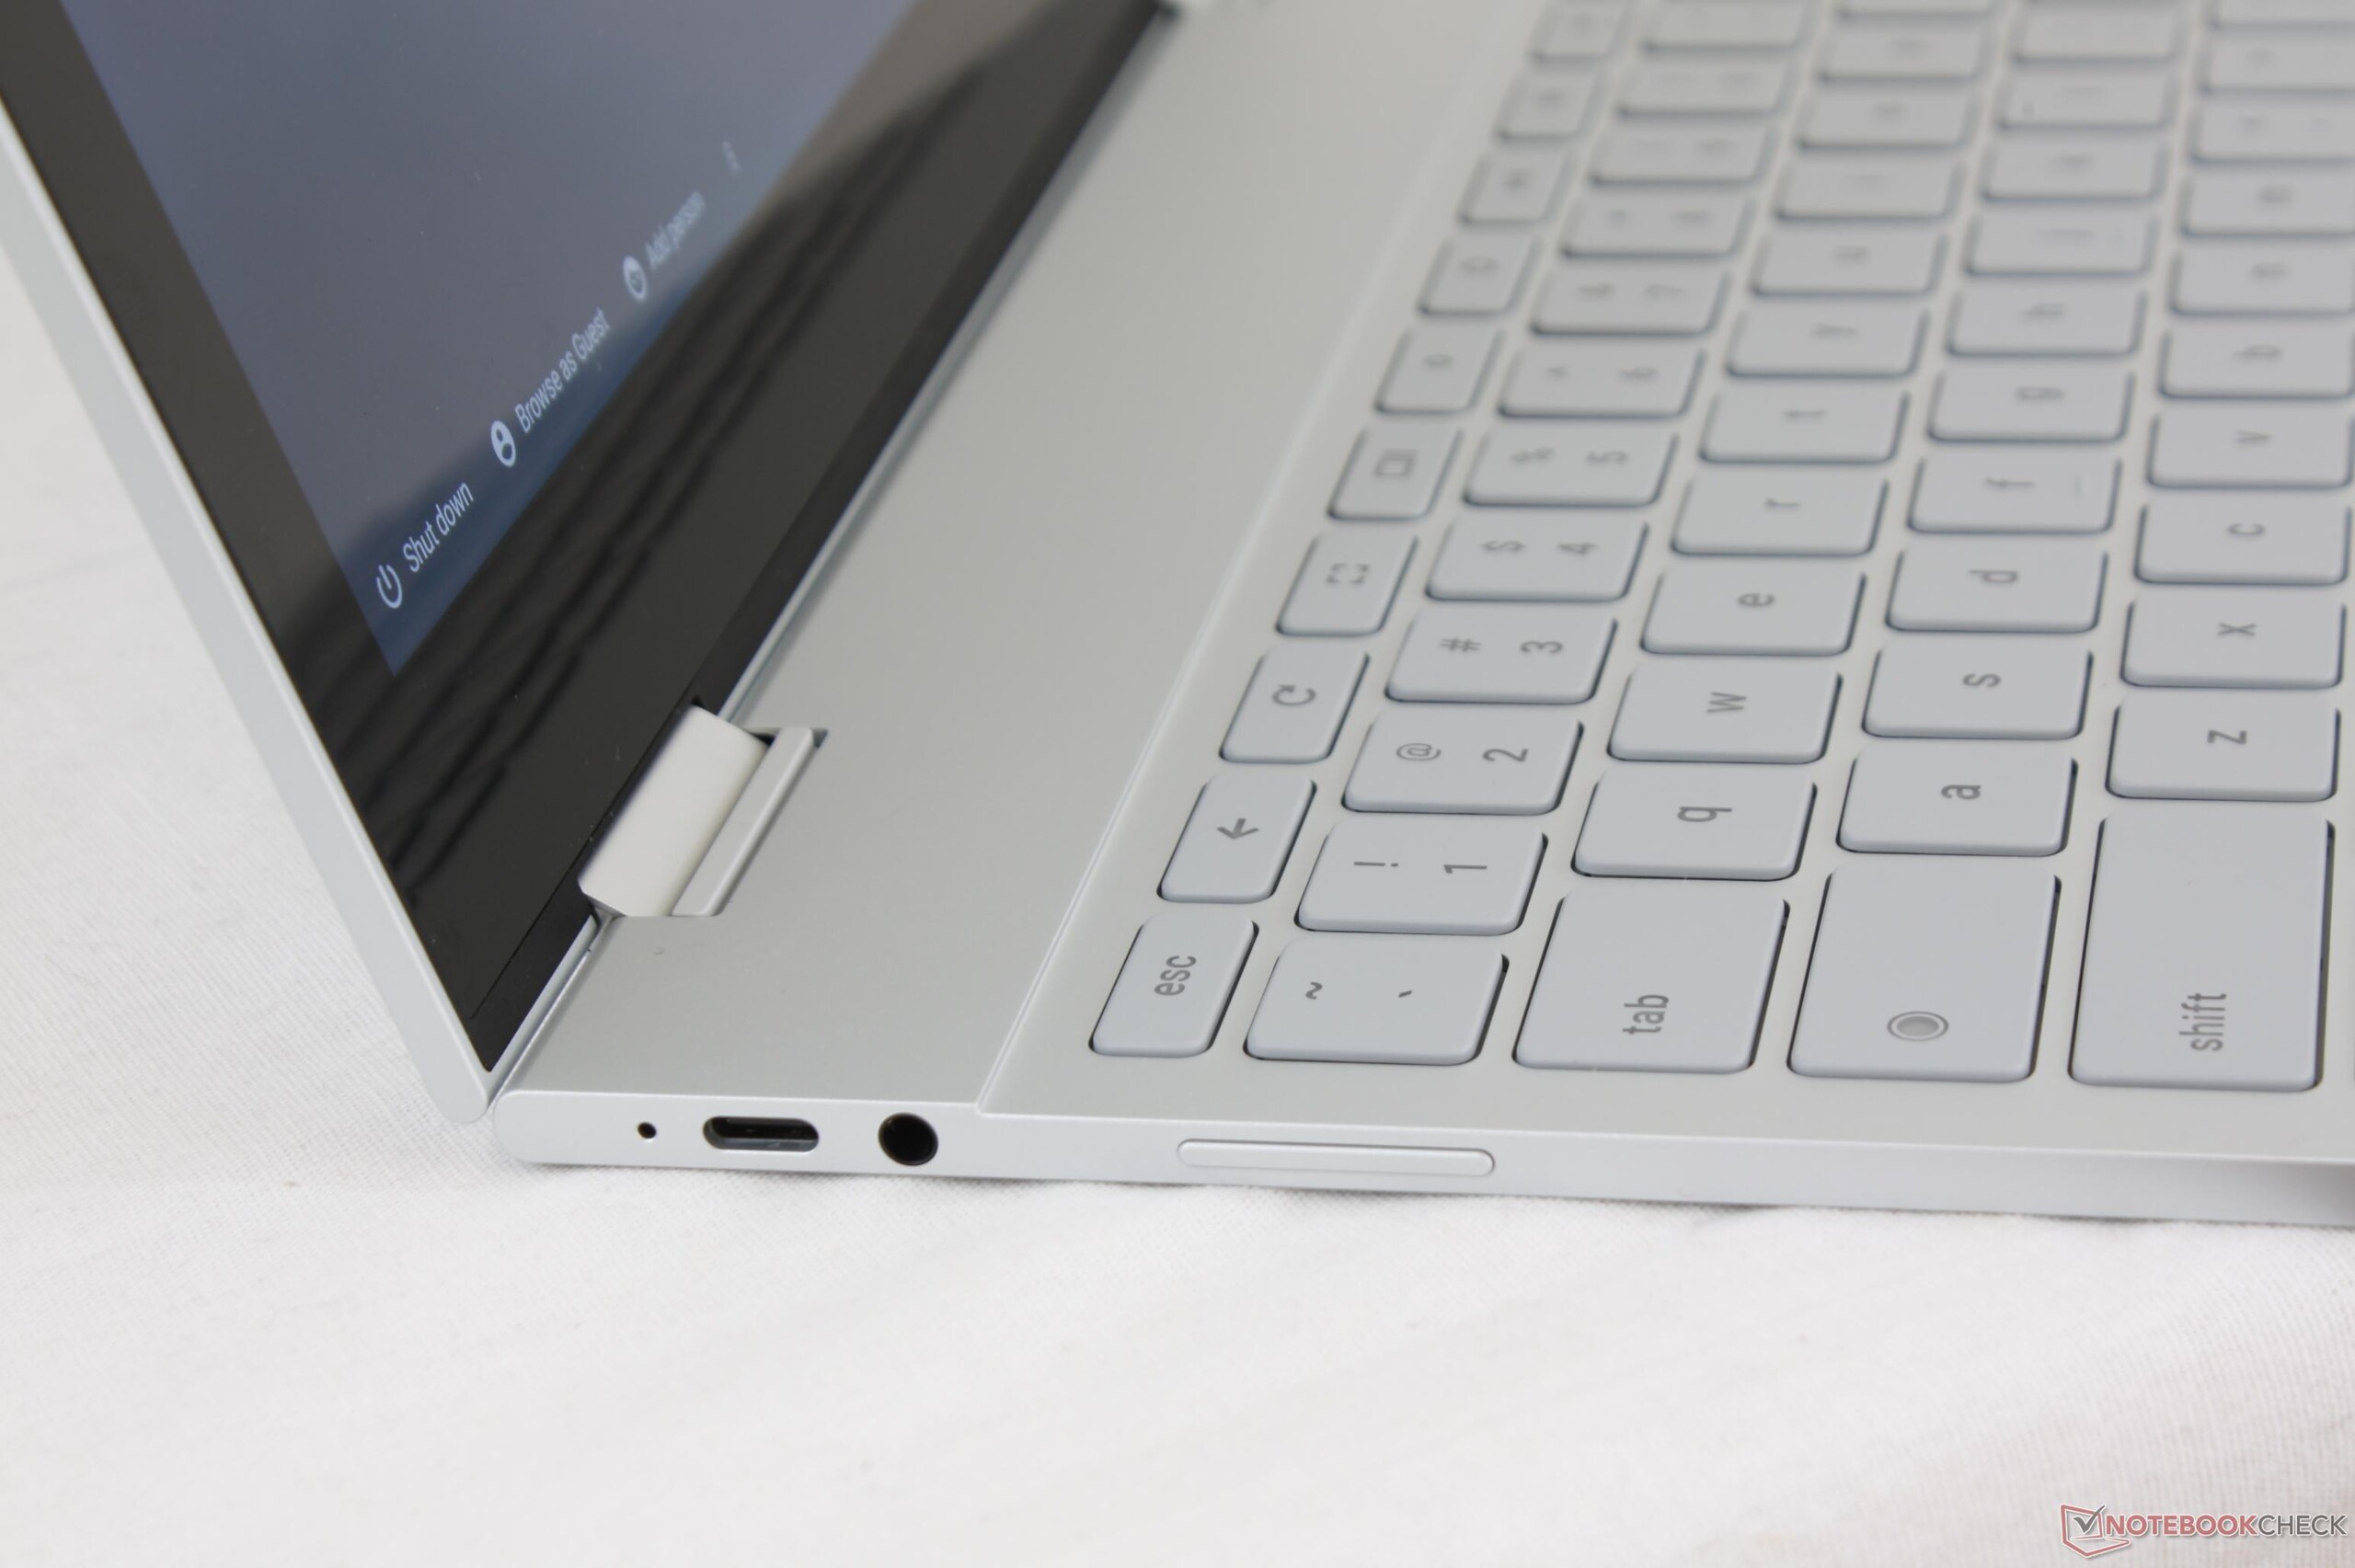
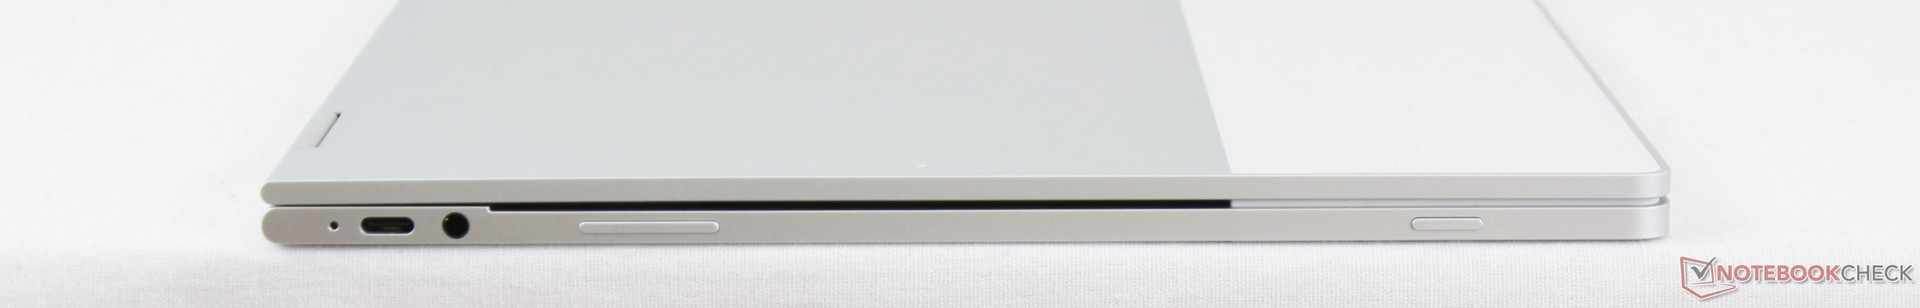
Será que definitivamente podemos chamar o Pixelbook de o melhor Chromebook disponível? Embora seja definitivamente rápido e o mais caro, o Pixelbook sacrifica recursos importantes em comparação com os Chromebooks de $300 USD para satisfazer suas dimensões apertadas. Por um lado, a falta de um USB Type-A e de um leitor de cartões SD inevitavelmente se tornará um aborrecimento, especialmente em uma máquina tão portátil, onde a conectividade deve estar prontamente disponível. O HP Chromebook 13 G1 inclui ambas as opções que estão faltando com um processador mais rápido e as mesmas duas portas USB Type-C por cerca de $300 USD a menos. Além disso, a HP e a maioria dos Chromebooks de nível básico podem receber manutenções mais facilmente em comparação com a natureza fechada do Pixelbook que os entusiastas e os departamentos de TI apreciarão.
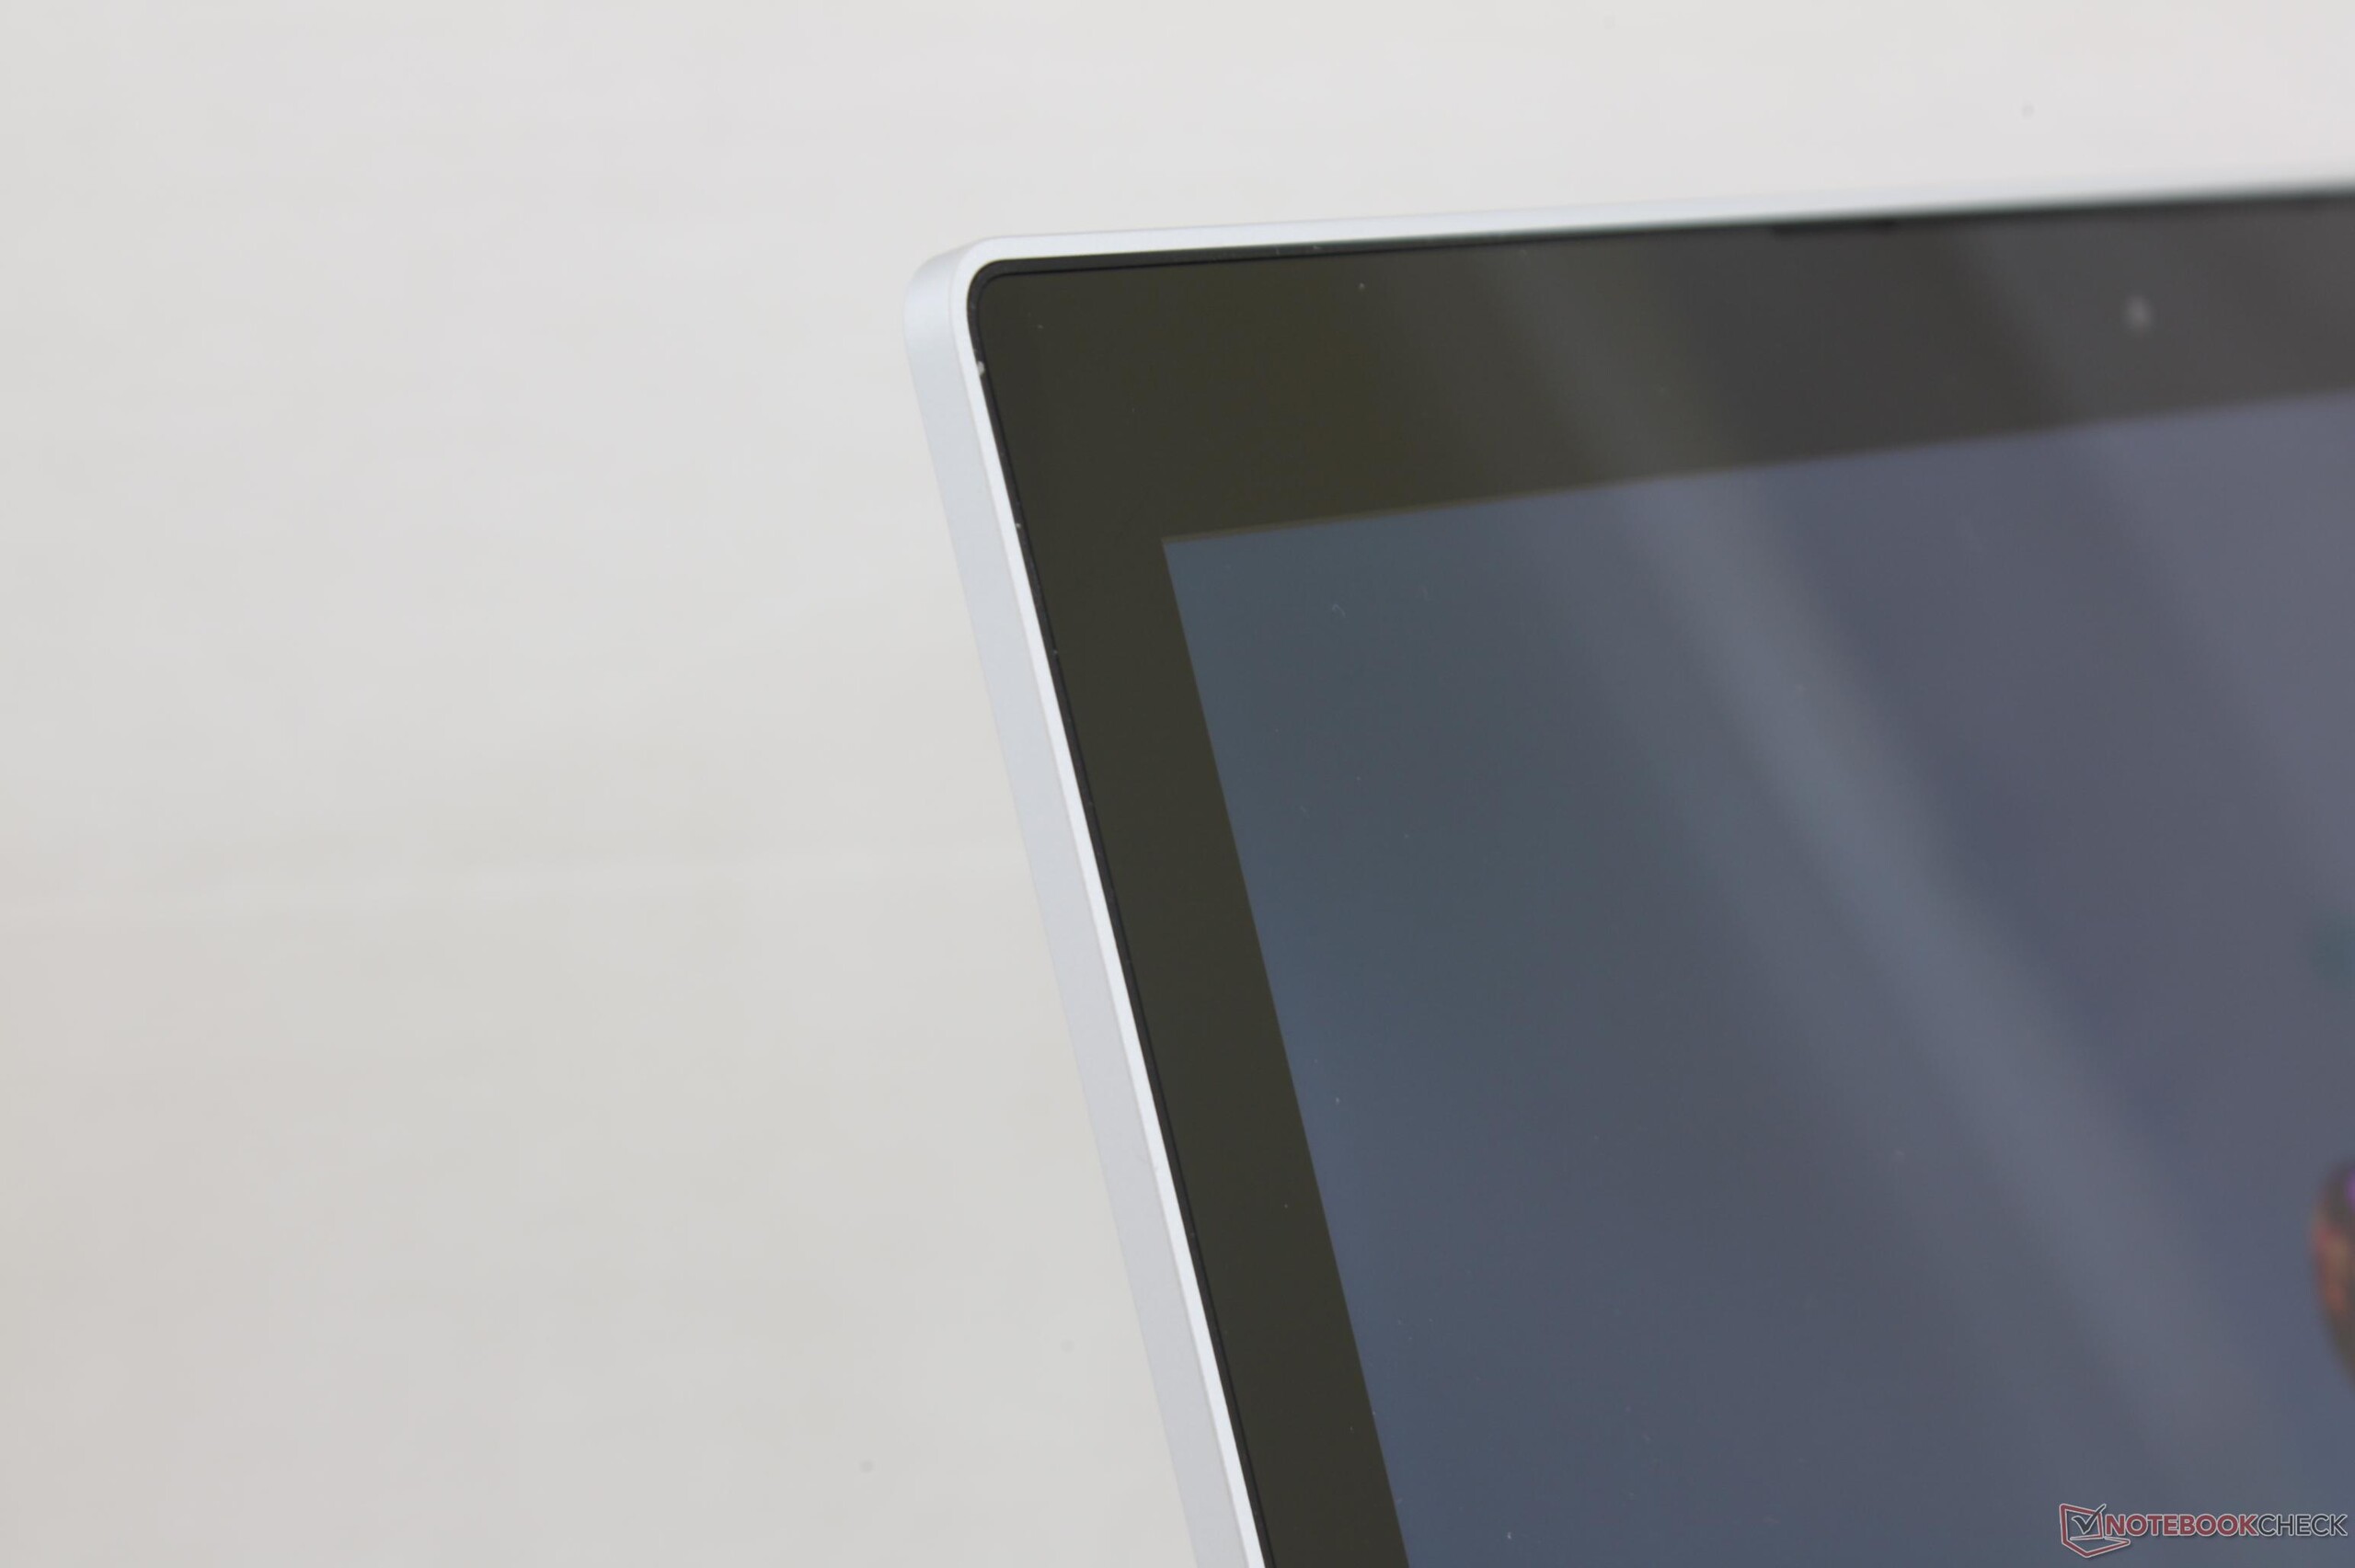
Outros detalhes menores estragam o que de outra forma é uma experiência excelente e barebone do Chromebook. A tela não está tão calibrada quanto a do Surface Pro ou MacBook Pro e os tempos de resposta mais lentos do preto-branco e cinza-cinza se tornam muito notórios ao navegar pela web no modo tablet. O SSD interno de 128 GB é superado por SSDs SATA III padrão e o teclado com barulho de alta frequência é muito perceptível se estiver em uma sala de aula ou biblioteca.
O Pixelbook é ideal para aqueles que querem um Chromebook duradouro, autossuficiente e amigável para viagens, que também, por acaso, tem um modo de tablet brilhante para aplicativos Android da Play Store. Se esses pontos fortes não são tentadores, então um Chromebook mais barato, como o Lenovo ThinkPad 13 ou Asus Chromebook Flip com suporte para Play Store, podem servir igualmente e com uma maior variedade de portas integradas.
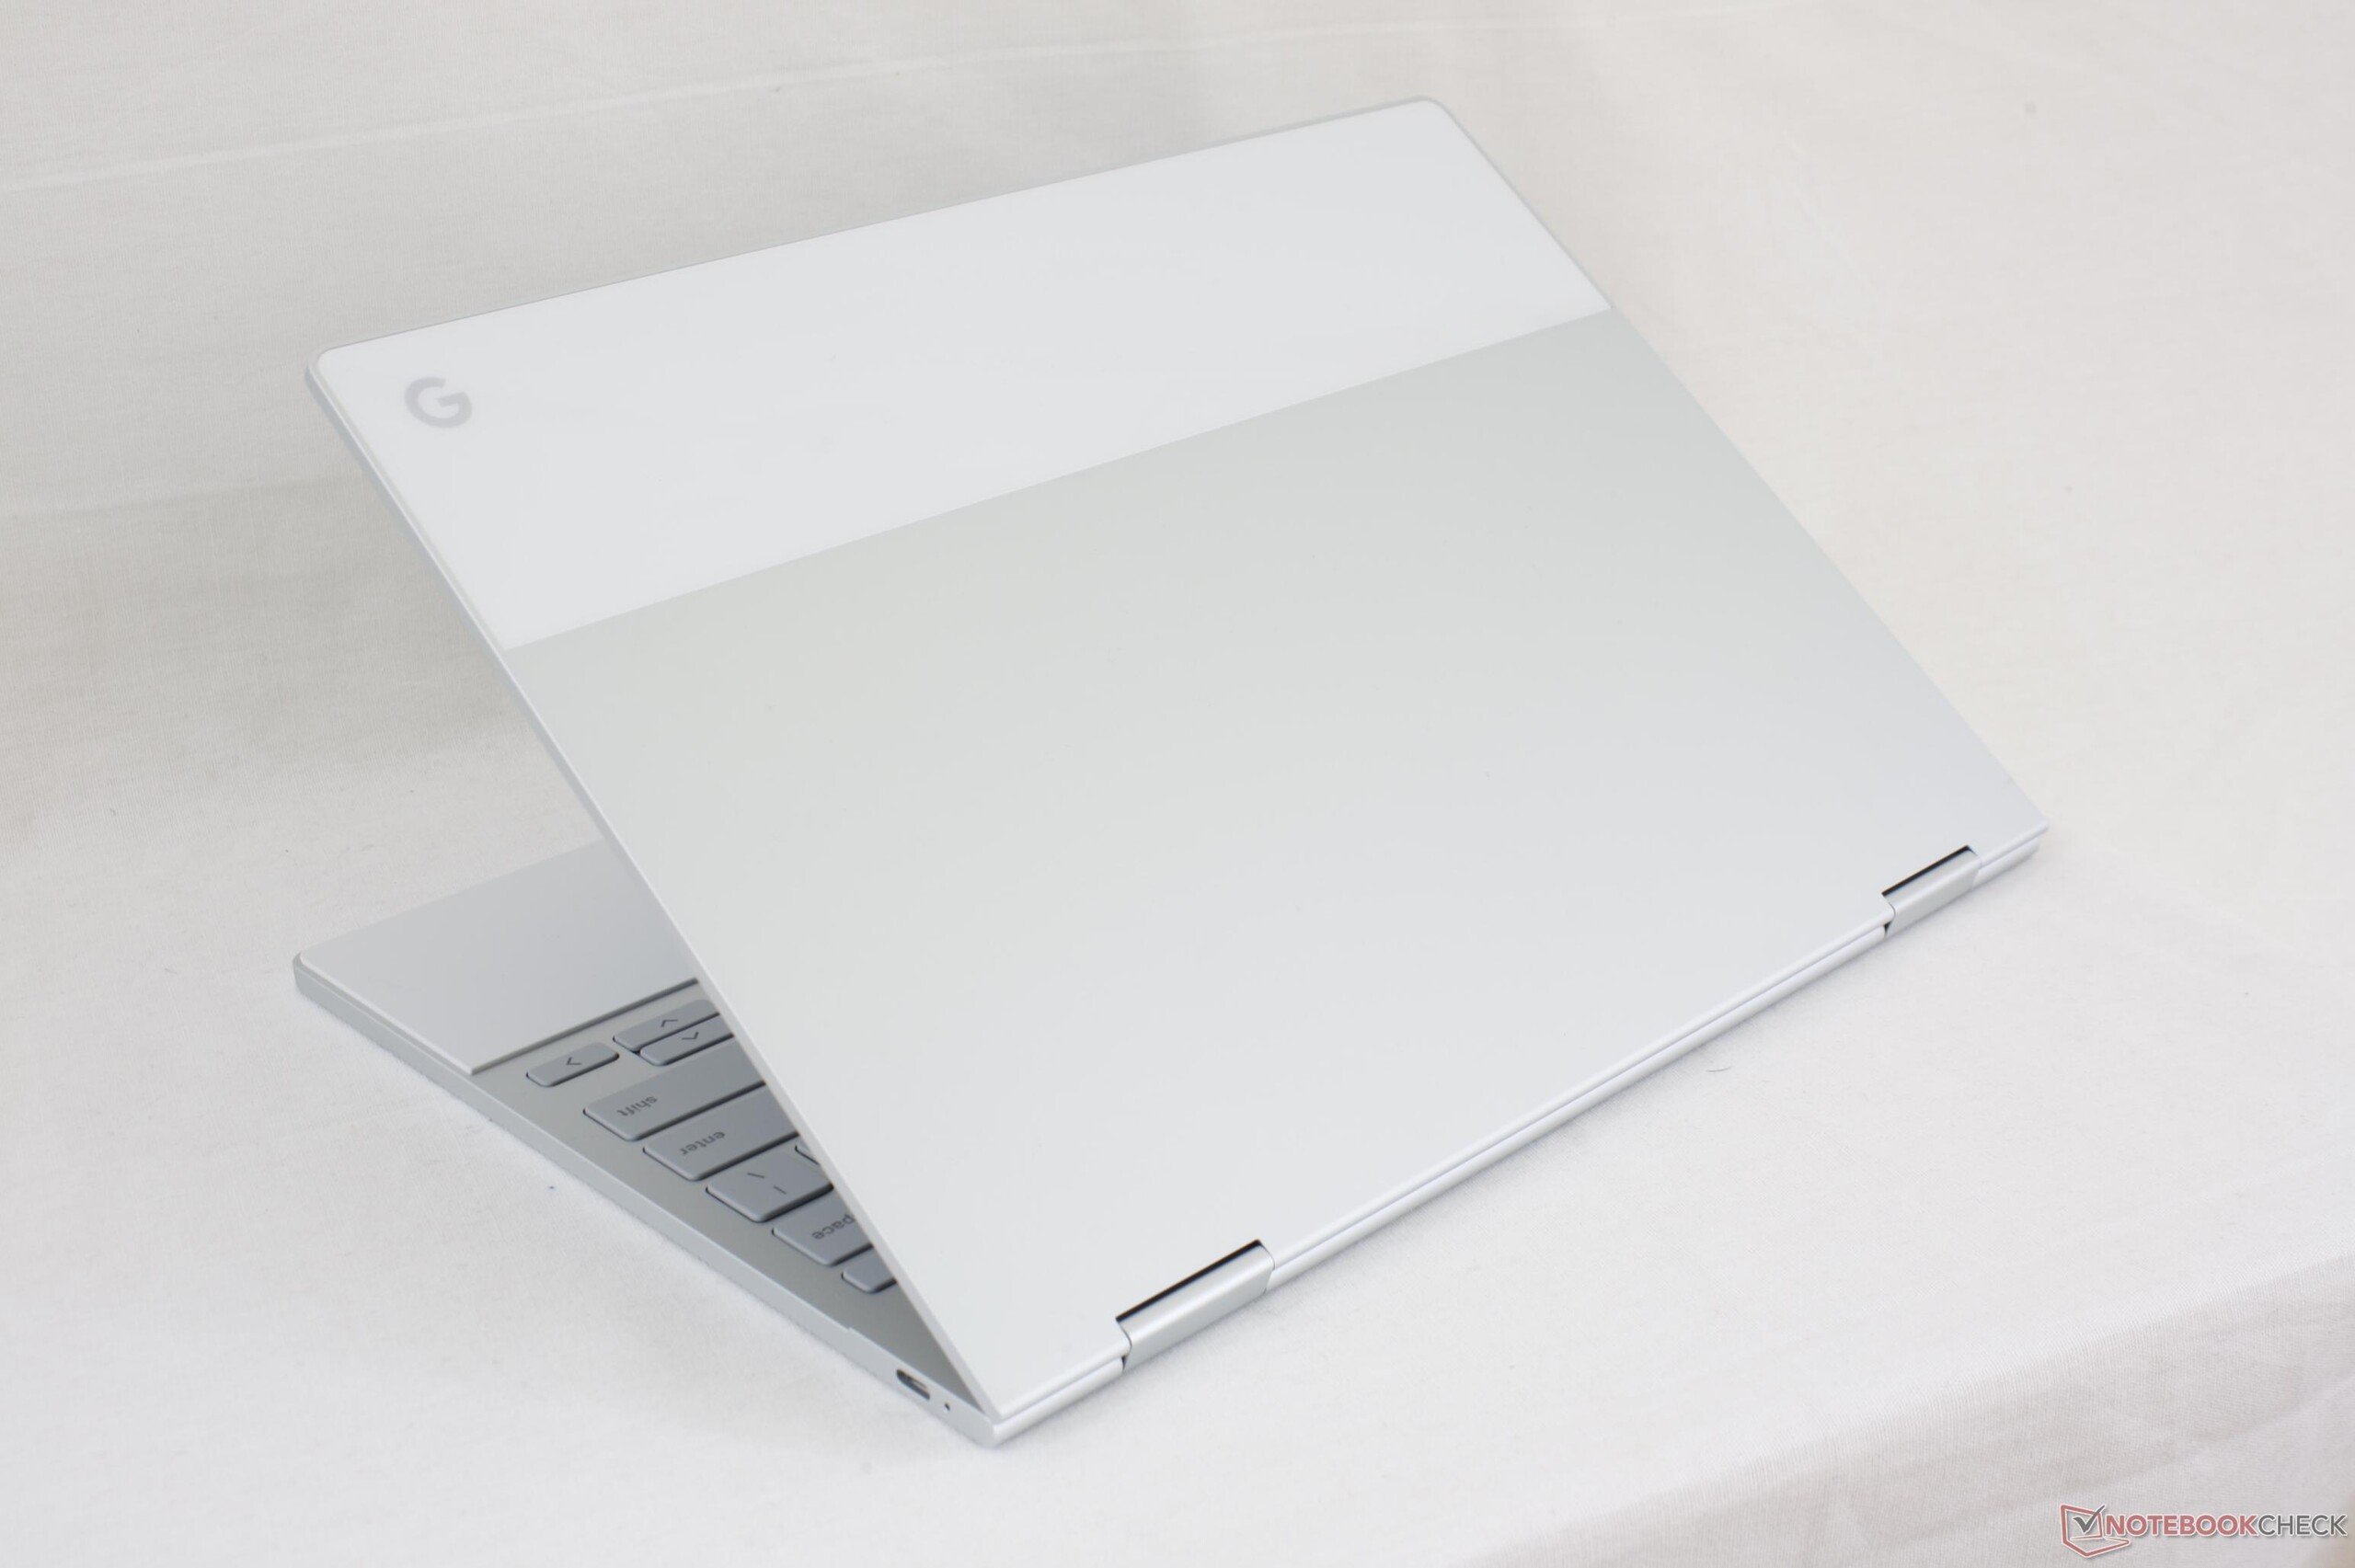
O Pixelbook é fino e resistente ao custo elevado de ter menos recursos integrados. Sua leveza, forte apelo visual e modos versáteis 2-em-1 são retidos por suas opções de conectividade limitadas e uma tela que não é tão precisa quanto a melhor da Microsoft ou da Apple com ghosting e cintilações mais visíveis.
Google Pixelbook
- 11/10/2017 v6 (old)
Allen Ngo
Price comparison
