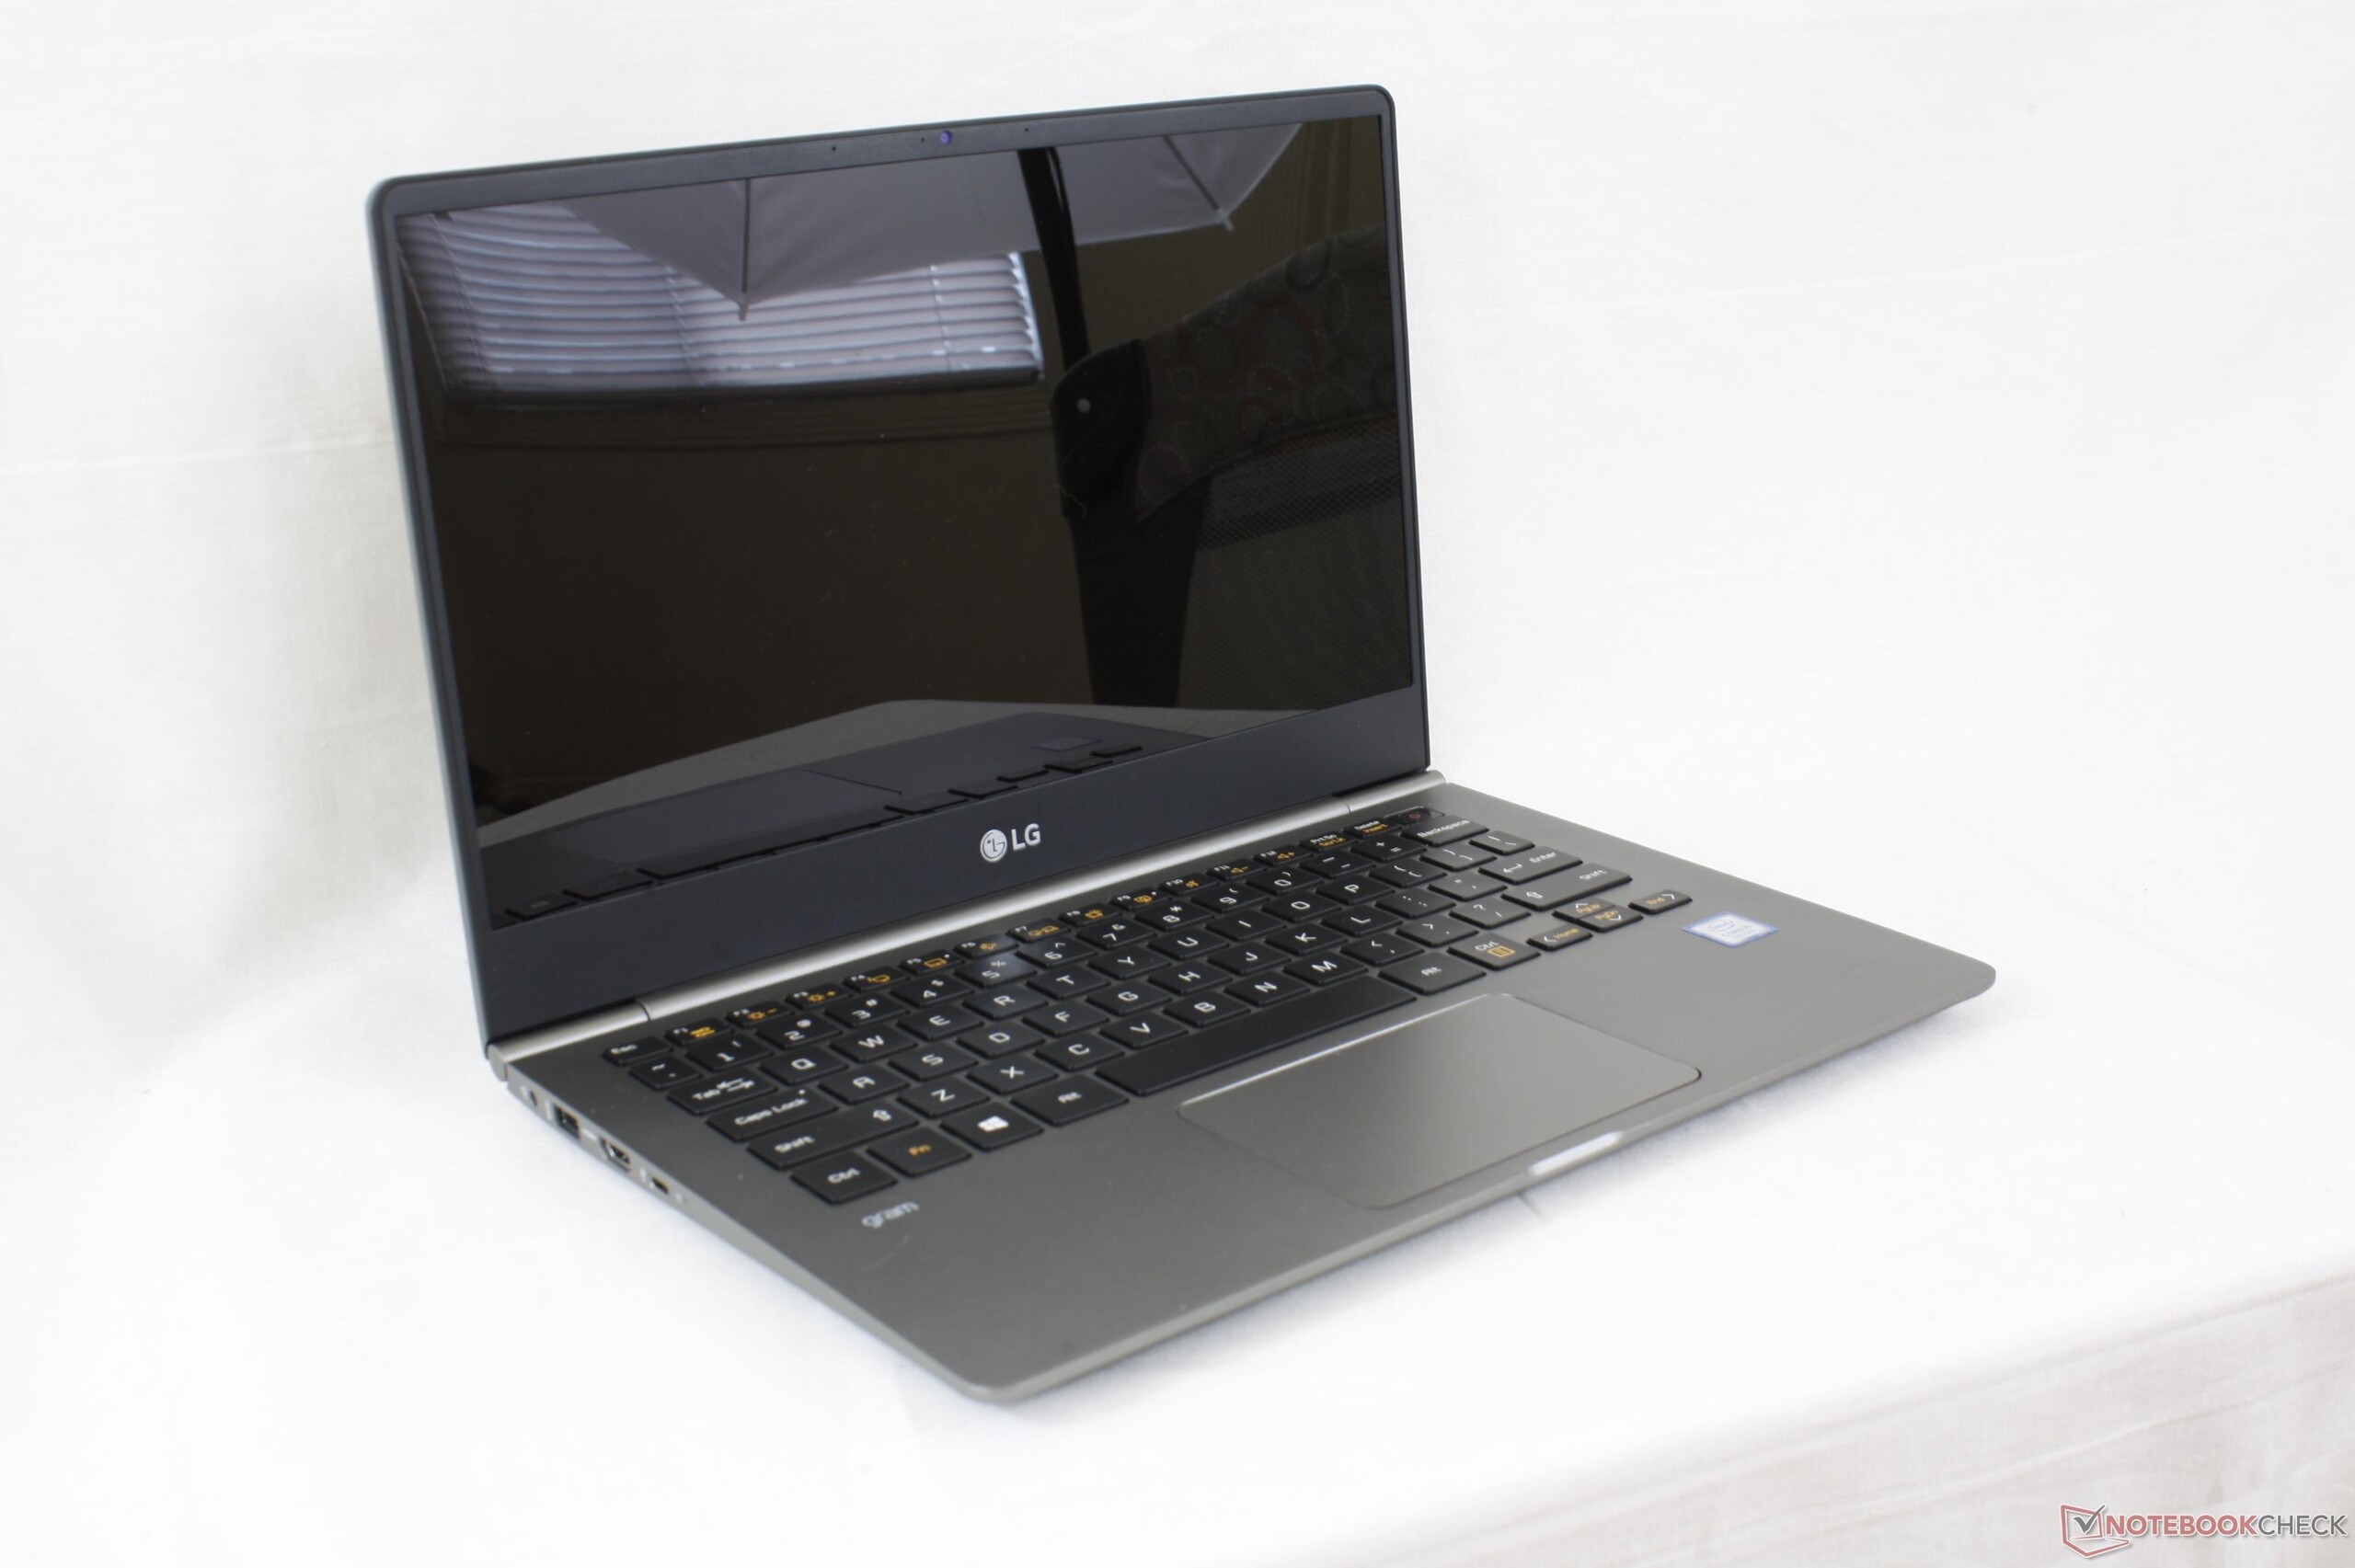
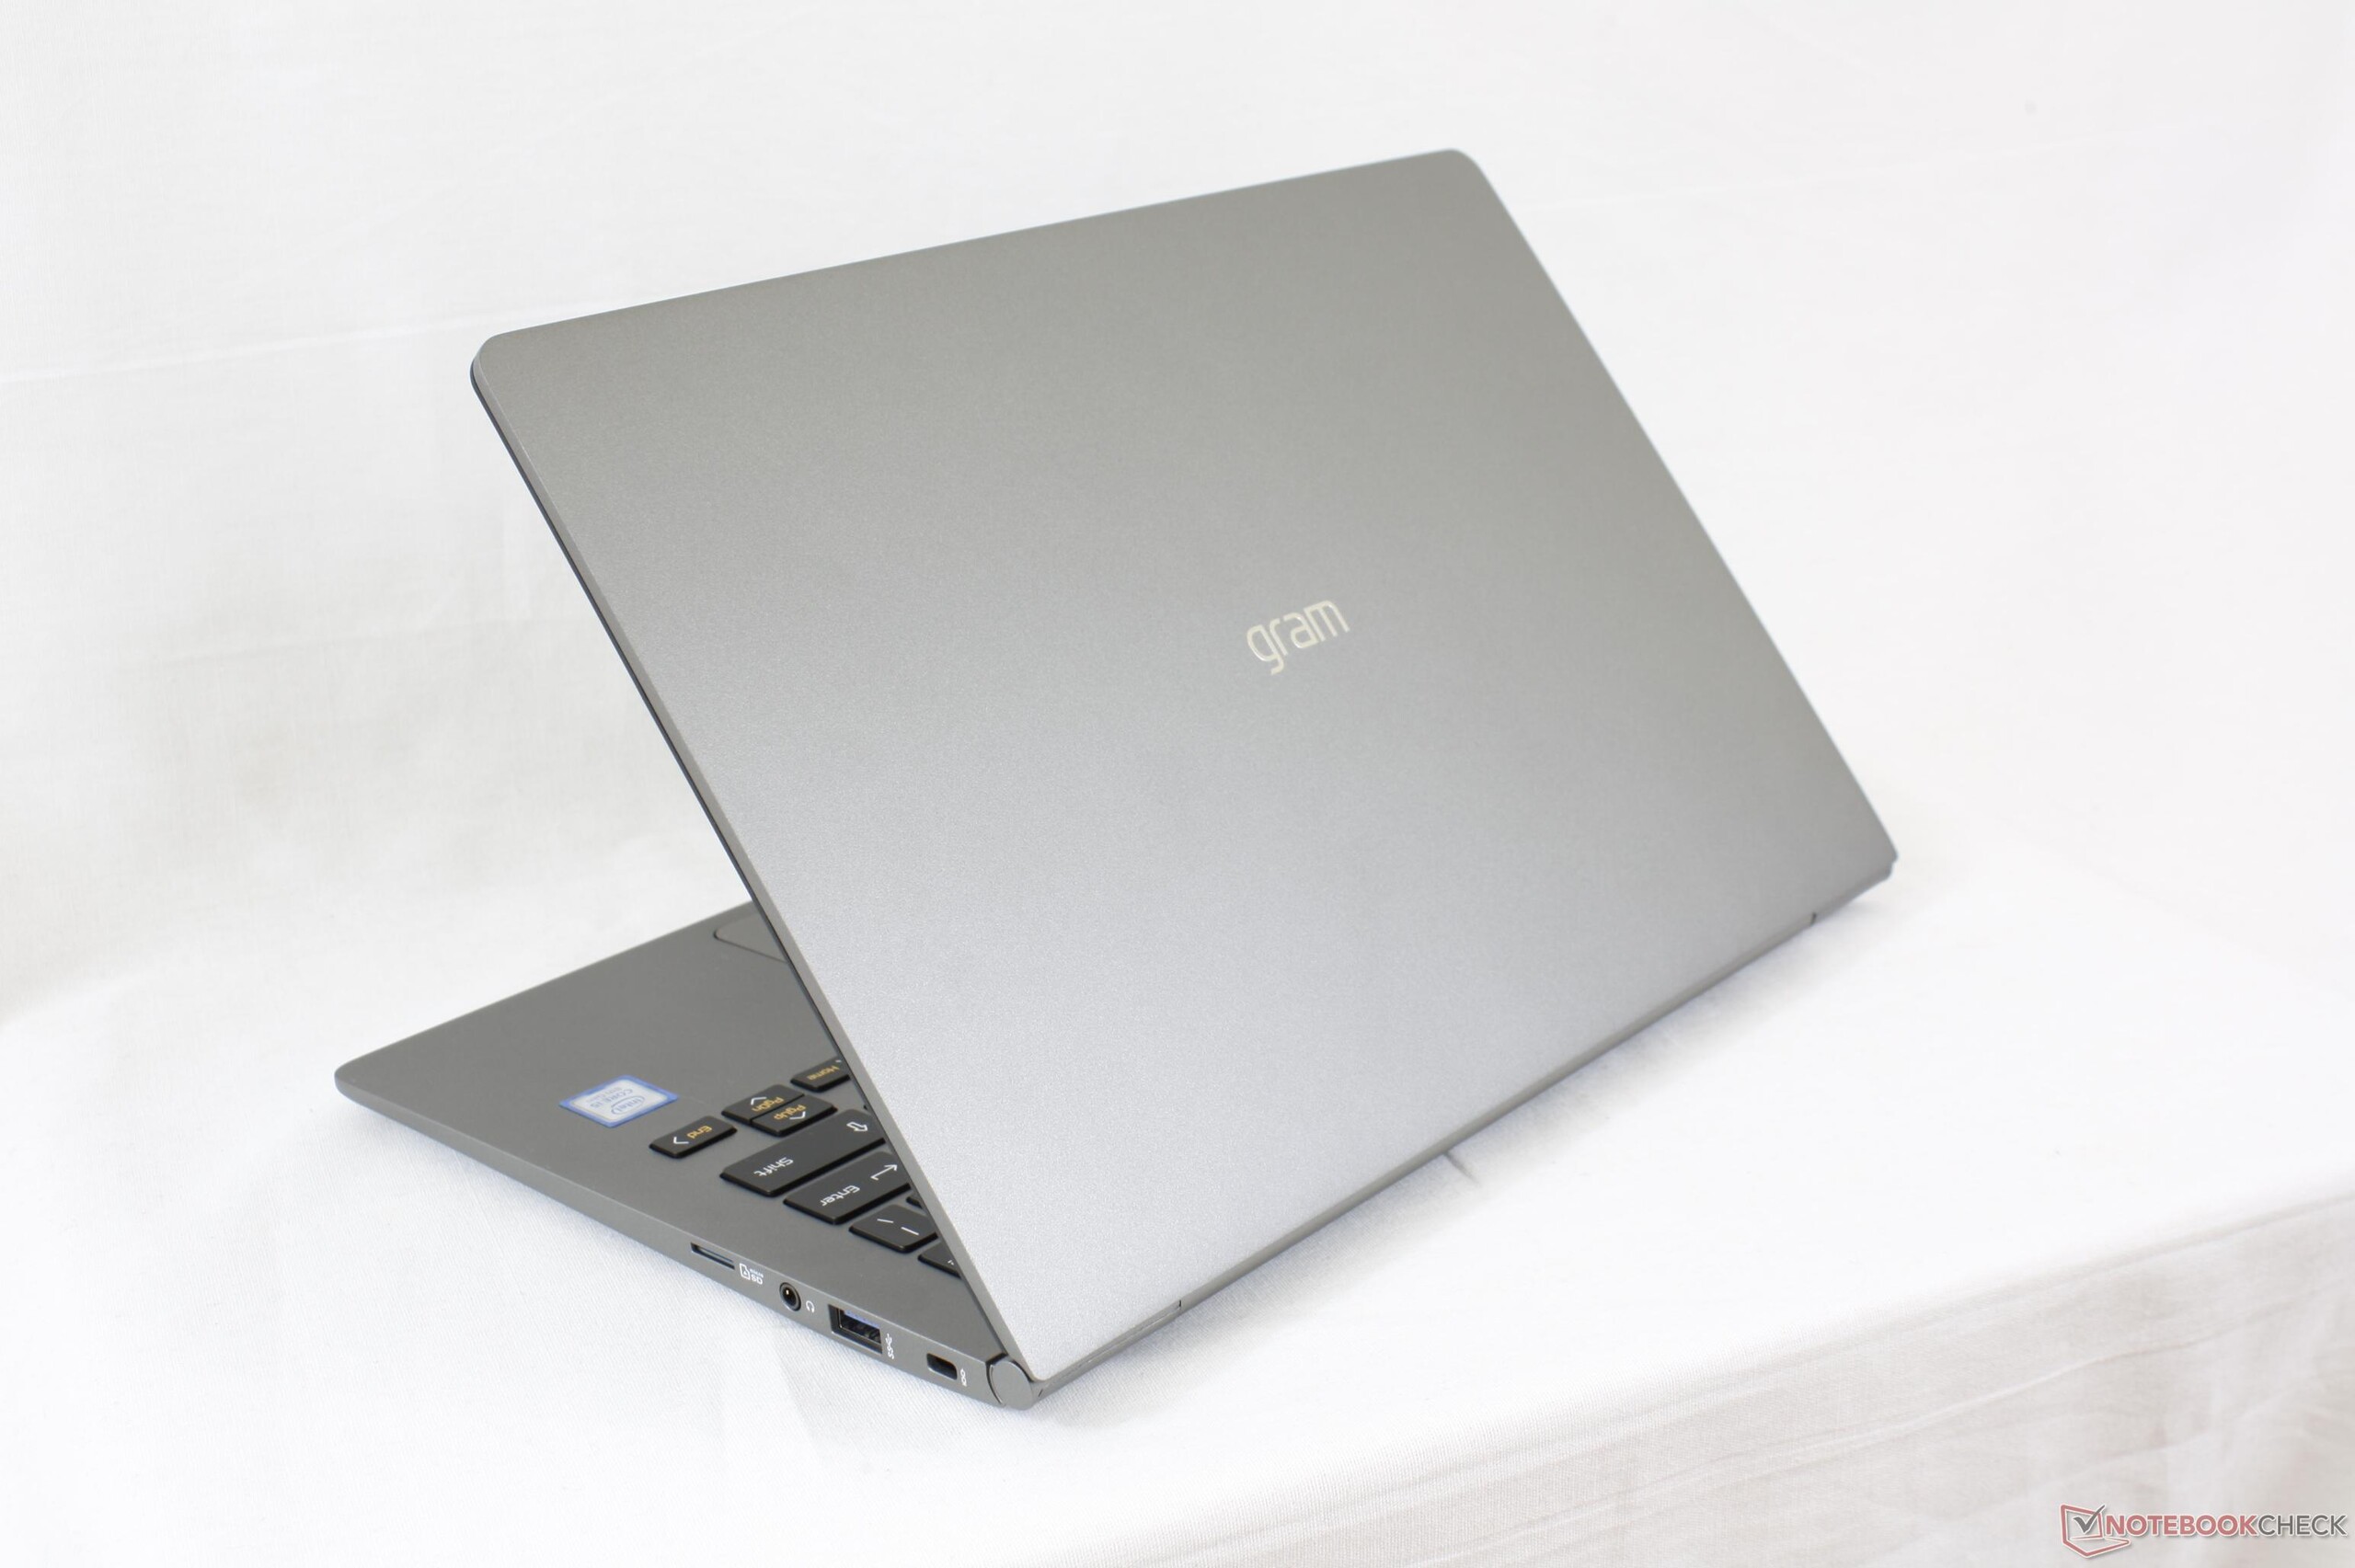
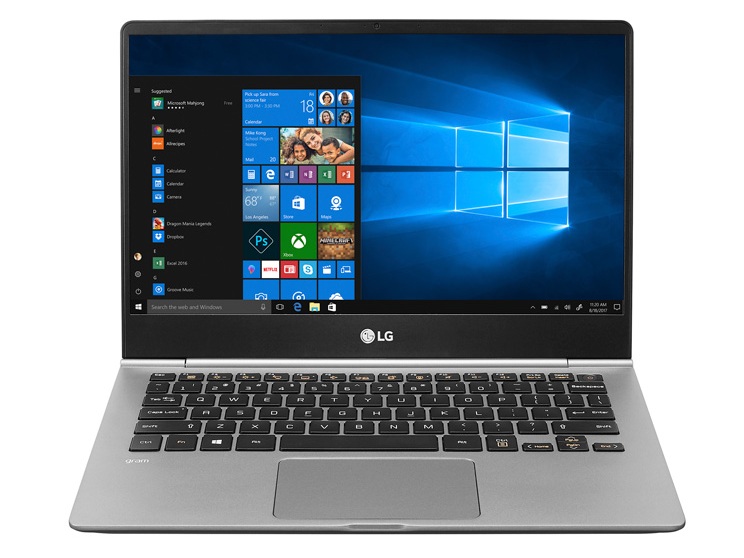
Breve Análise do Portátil LG Gram 13Z980-A (i5-8250U)
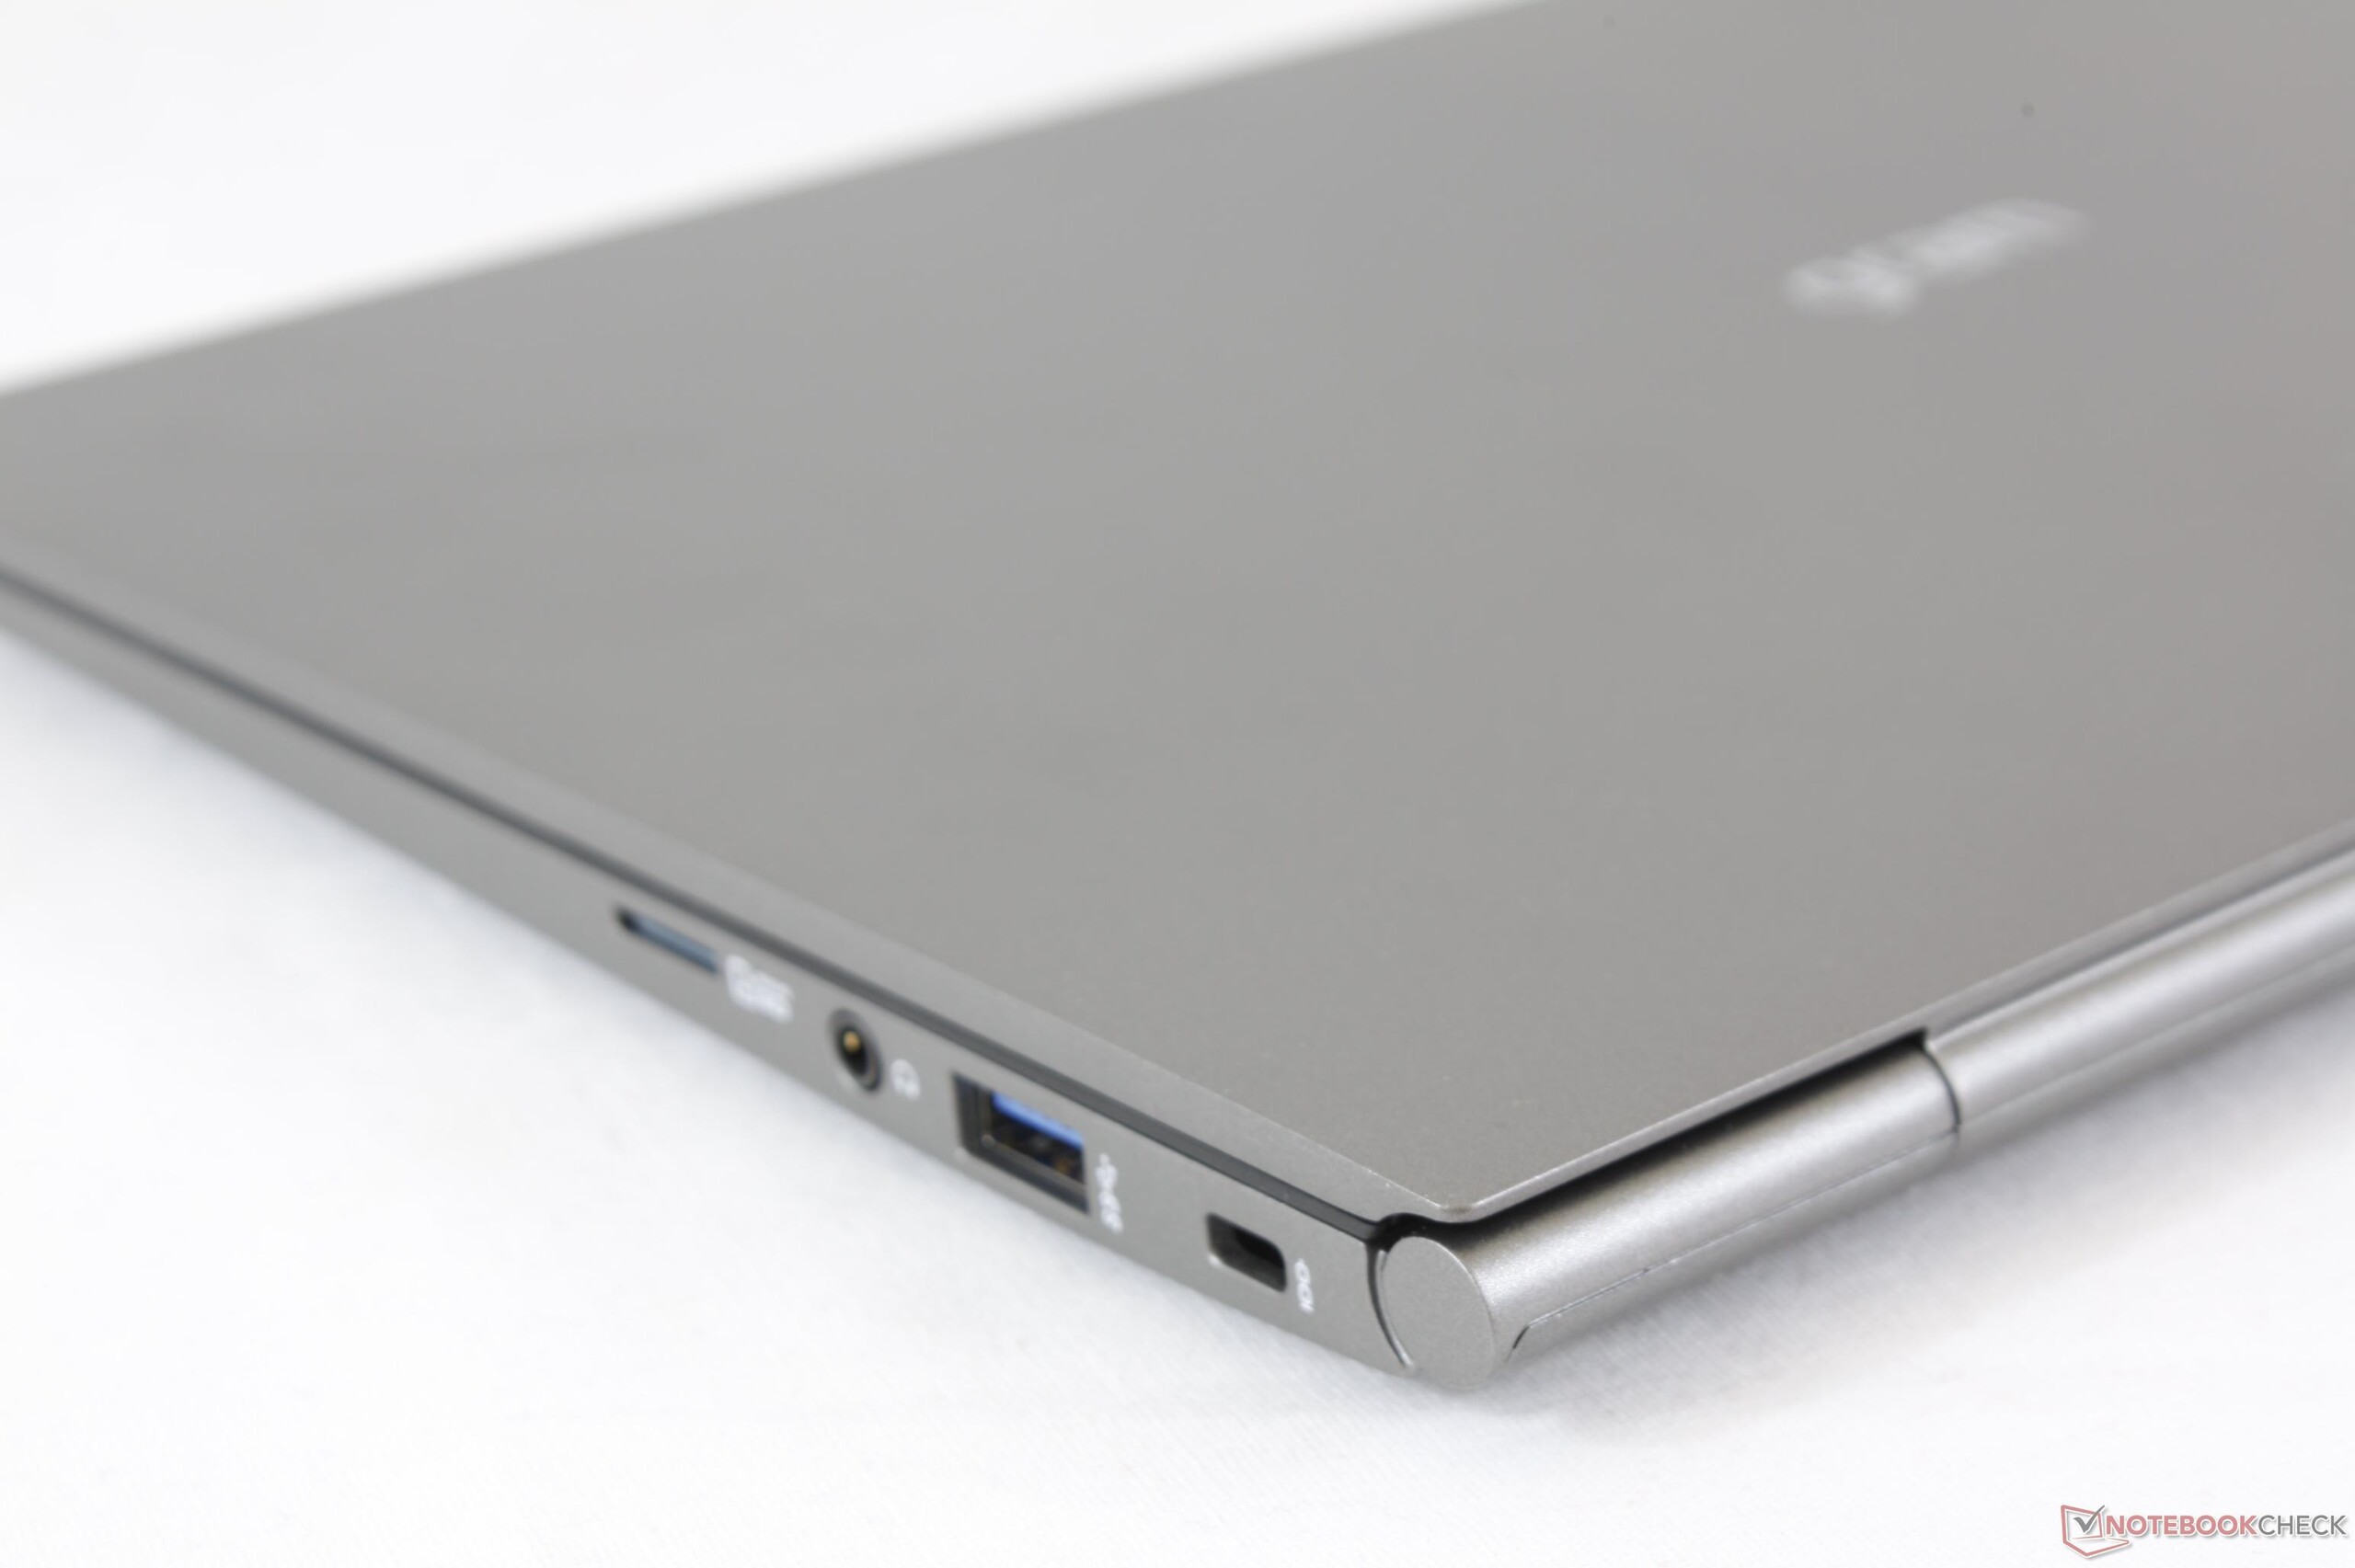
| SD Card Reader | |
| average JPG Copy Test (av. of 3 runs) | |
| Dell XPS 13 9370 FHD i5 (Toshiba Exceria Pro M501 64 GB UHS-II) | |
| LG Gram 13Z980-A (Toshiba Exceria Pro M501 UHS-II) | |
| Samsung Notebook 9 NP900X3N-K01US (Toshiba THN-M401S0640E2) | |
| maximum AS SSD Seq Read Test (1GB) | |
| Dell XPS 13 9370 FHD i5 (Toshiba Exceria Pro M501 64 GB UHS-II) | |
| Samsung Notebook 9 NP900X3N-K01US (Toshiba THN-M401S0640E2) | |
| LG Gram 13Z980-A (Toshiba Exceria Pro M501 UHS-II) | |
| Networking | |
| iperf3 transmit AX12 | |
| Dell XPS 13 9370 FHD i5 | |
| Samsung Notebook 9 NP900X3N-K01US | |
| LG Gram 13Z980-A | |
| iperf3 receive AX12 | |
| Samsung Notebook 9 NP900X3N-K01US | |
| LG Gram 13Z980-A | |
| Dell XPS 13 9370 FHD i5 | |
| |||||||||||||||||||||||||
iluminação: 89 %
iluminação com acumulador: 347.8 cd/m²
Contraste: 966:1 (Preto: 0.36 cd/m²)
ΔE ColorChecker Calman: 2.37 | ∀{0.5-29.43 Ø4.71}
calibrated: 4.21
ΔE Greyscale Calman: 2.5 | ∀{0.09-98 Ø4.96}
97% sRGB (Argyll 1.6.3 3D)
62.5% AdobeRGB 1998 (Argyll 1.6.3 3D)
67.9% AdobeRGB 1998 (Argyll 3D)
97.3% sRGB (Argyll 3D)
66.9% Display P3 (Argyll 3D)
Gamma: 2.15
CCT: 6384 K
| LG Gram 13Z980-A LG LP133WF6-SPC1, IPS, 13.3", 1920x1080 | Samsung Notebook 9 NP900X3N-K01US ID: BOE06E1, Name: NV133FHB-N31, IPS, 13.3", 1920x1080 | Dell XPS 13 9370 FHD i5 SHP1484, IPS, 13.3", 1920x1080 | HP Spectre 13-af033ng AU Optronics AUO422D, IPS, 13.3", 1920x1080 | Lenovo Yoga 920-13IKB-80Y7 AU Optronics B139HAN03.0, IPS, 13.9", 1920x1080 | Huawei MateBook X Chi Mei CMN8201 / P130ZDZ-EF1, , 13.3", 2160x1440 | |
|---|---|---|---|---|---|---|
| Display | -7% | 2% | -5% | -6% | -2% | |
| Display P3 Coverage (%) | 66.9 | 63.4 -5% | 68.9 3% | 64 -4% | 62.5 -7% | 65.8 -2% |
| sRGB Coverage (%) | 97.3 | 88.6 -9% | 96.6 -1% | 90.7 -7% | 91.7 -6% | 96.2 -1% |
| AdobeRGB 1998 Coverage (%) | 67.9 | 64 -6% | 69.6 3% | 65.1 -4% | 64.1 -6% | 66.8 -2% |
| Response Times | -17% | -66% | 21% | -18% | 13% | |
| Response Time Grey 50% / Grey 80% * (ms) | 37.6 ? | 41.6 ? -11% | 62.4 ? -66% | 27 ? 28% | 46 ? -22% | 33 ? 12% |
| Response Time Black / White * (ms) | 27.6 ? | 34 ? -23% | 45.6 ? -65% | 24 ? 13% | 31.6 ? -14% | 24 ? 13% |
| PWM Frequency (Hz) | 210.1 ? | 1008 ? | ||||
| Screen | -10% | -7% | -8% | -54% | 11% | |
| Brightness middle (cd/m²) | 347.8 | 510.7 47% | 428 23% | 304 -13% | 297.9 -14% | 408 17% |
| Brightness (cd/m²) | 331 | 481 45% | 405 22% | 287 -13% | 278 -16% | 395 19% |
| Brightness Distribution (%) | 89 | 90 1% | 87 -2% | 80 -10% | 81 -9% | 88 -1% |
| Black Level * (cd/m²) | 0.36 | 0.66 -83% | 0.26 28% | 0.21 42% | 0.44 -22% | 0.45 -25% |
| Contrast (:1) | 966 | 774 -20% | 1646 70% | 1448 50% | 677 -30% | 907 -6% |
| Colorchecker dE 2000 * | 2.37 | 2.4 -1% | 3.8 -60% | 3.66 -54% | 5.1 -115% | 1.55 35% |
| Colorchecker dE 2000 max. * | 4.21 | 7.3 -73% | 7.2 -71% | 5.66 -34% | 11 -161% | 2.19 48% |
| Colorchecker dE 2000 calibrated * | 4.21 | |||||
| Greyscale dE 2000 * | 2.5 | 2.4 4% | 4.4 -76% | 3.51 -40% | 6.7 -168% | 1.91 24% |
| Gamma | 2.15 102% | 2.23 99% | 2.21 100% | 2.55 86% | 2.9 76% | 2.34 94% |
| CCT | 6384 102% | 6747 96% | 7067 92% | 6955 93% | 6839 95% | 6491 100% |
| Color Space (Percent of AdobeRGB 1998) (%) | 62.5 | 57 -9% | 62.8 0% | 59 -6% | 64.1 3% | 61 -2% |
| Color Space (Percent of sRGB) (%) | 97 | 88.1 -9% | 96.4 -1% | 91 -6% | 91.7 -5% | 96 -1% |
| Média Total (Programa/Configurações) | -11% /
-10% | -24% /
-13% | 3% /
-4% | -26% /
-39% | 7% /
9% |
* ... menor é melhor
Exibir tempos de resposta
| ↔ Tempo de resposta preto para branco | ||
|---|---|---|
| 27.6 ms ... ascensão ↗ e queda ↘ combinadas | ↗ 16.8 ms ascensão | 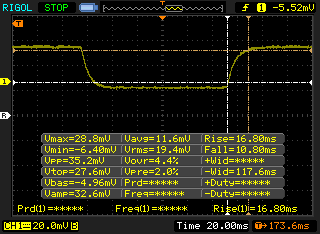 |
| ↘ 10.8 ms queda | ||
| A tela mostra taxas de resposta relativamente lentas em nossos testes e pode ser muito lenta para os jogadores. Em comparação, todos os dispositivos testados variam de 0.1 (mínimo) a 240 (máximo) ms. » 70 % de todos os dispositivos são melhores. Isso significa que o tempo de resposta medido é pior que a média de todos os dispositivos testados (19.8 ms). | ||
| ↔ Tempo de resposta 50% cinza a 80% cinza | ||
| 37.6 ms ... ascensão ↗ e queda ↘ combinadas | ↗ 19.6 ms ascensão | 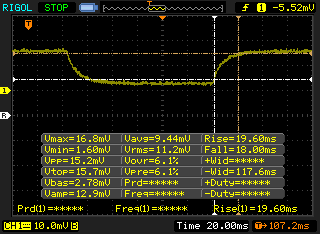 |
| ↘ 18 ms queda | ||
| A tela mostra taxas de resposta lentas em nossos testes e será insatisfatória para os jogadores. Em comparação, todos os dispositivos testados variam de 0.165 (mínimo) a 636 (máximo) ms. » 55 % de todos os dispositivos são melhores. Isso significa que o tempo de resposta medido é pior que a média de todos os dispositivos testados (31 ms). | ||
Cintilação da tela / PWM (modulação por largura de pulso)
| Tela tremeluzindo / PWM não detectado | 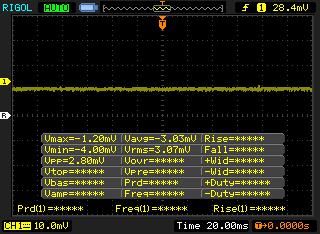 | ||
[pwm_comparison] Em comparação: 52 % de todos os dispositivos testados não usam PWM para escurecer a tela. Se PWM foi detectado, uma média de 7757 (mínimo: 5 - máximo: 343500) Hz foi medida. | |||
* ... menor é melhor
| PCMark 8 | |
| Home Score Accelerated v2 | |
| Lenovo Yoga 920-13IKB-80Y7 | |
| Dell XPS 13 9370 FHD i5 | |
| Samsung Notebook 9 NP900X3N-K01US | |
| HP Spectre 13-af033ng | |
| LG Gram 13Z980-A | |
| Work Score Accelerated v2 | |
| Lenovo Yoga 920-13IKB-80Y7 | |
| Dell XPS 13 9370 FHD i5 | |
| Samsung Notebook 9 NP900X3N-K01US | |
| LG Gram 13Z980-A | |
| HP Spectre 13-af033ng | |
| Creative Score Accelerated v2 | |
| Lenovo Yoga 920-13IKB-80Y7 | |
| Dell XPS 13 9370 FHD i5 | |
| HP Spectre 13-af033ng | |
| Samsung Notebook 9 NP900X3N-K01US | |
| LG Gram 13Z980-A | |
| PCMark 10 - Score | |
| Lenovo Yoga 920-13IKB-80Y7 | |
| Dell XPS 13 9370 FHD i5 | |
| Samsung Notebook 9 NP900X3N-K01US | |
| LG Gram 13Z980-A | |
| PCMark 8 Home Score Accelerated v2 | 3241 pontos | |
| PCMark 8 Creative Score Accelerated v2 | 3308 pontos | |
| PCMark 8 Work Score Accelerated v2 | 4592 pontos | |
| PCMark 10 Score | 3381 pontos | |
Ajuda | ||
| LG Gram 13Z980-A SK Hynix HFS256G39TND-N210A | Samsung Notebook 9 NP900X3N-K01US Samsung CM871a MZNTY256HDHP | HP Spectre 13-af033ng Samsung PM961 NVMe MZVLW512HMJP | Lenovo Yoga 920-13IKB-80Y7 Samsung PM961 MZVLW256HEHP | Xiaomi Mi Notebook Air 13.3 2016 Samsung PM951 NVMe MZVLV256 | |
|---|---|---|---|---|---|
| AS SSD | 28% | 8% | 180% | 72% | |
| Copy Game MB/s (MB/s) | 191.7 | 186.8 -3% | 381.2 99% | 319.2 67% | 225.9 18% |
| Copy Program MB/s (MB/s) | 127.6 | 213 67% | 337.8 165% | 463.3 263% | 156.4 23% |
| Copy ISO MB/s (MB/s) | 204.5 | 335.9 64% | 695 240% | 1341 556% | 297.8 46% |
| Score Total (Points) | 997 | 1057 6% | 1879 88% | 2536 154% | 2266 127% |
| Score Write (Points) | 316 | 350 11% | 105 -67% | 608 92% | 360 14% |
| Score Read (Points) | 453 | 463 2% | 1201 165% | 1316 191% | 1293 185% |
| Access Time Write * (ms) | 0.235 | 0.053 77% | 2.294 -876% | 0.028 88% | 0.034 86% |
| Access Time Read * (ms) | 0.084 | 0.066 21% | 0.073 13% | 0.044 48% | 0.069 18% |
| 4K-64 Write (MB/s) | 231.3 | 223.8 -3% | 69.7 -70% | 391.3 69% | 223.7 -3% |
| 4K-64 Read (MB/s) | 376.7 | 379.4 1% | 1020 171% | 1039 176% | 1122 198% |
| 4K Write (MB/s) | 61 | 79.2 30% | 1.07 -98% | 128.1 110% | 107.7 77% |
| 4K Read (MB/s) | 27.16 | 31.24 15% | 45.86 69% | 48.46 78% | 38.11 40% |
| Seq Write (MB/s) | 241.7 | 466 93% | 337.5 40% | 885 266% | 282.6 17% |
| Seq Read (MB/s) | 496.4 | 520 5% | 1351 172% | 2282 360% | 1332 168% |
* ... menor é melhor

| 3DMark 11 | |
| 1280x720 Performance GPU | |
| HP Envy 17-ae143ng | |
| HP Envy x360 15-bq102ng | |
| Lenovo ThinkPad 25 | |
| Apple MacBook Pro 13 2017 | |
| LG Gram 13Z980-A | |
| Dell Latitude 7390 | |
| Huawei Matebook E | |
| HP 250 G6 2UB93ES | |
| 1280x720 Performance Combined | |
| HP Envy 17-ae143ng | |
| Lenovo ThinkPad 25 | |
| HP Envy x360 15-bq102ng | |
| Apple MacBook Pro 13 2017 | |
| LG Gram 13Z980-A | |
| Dell Latitude 7390 | |
| Huawei Matebook E | |
| HP 250 G6 2UB93ES | |
| 3DMark | |
| 1280x720 Cloud Gate Standard Graphics | |
| HP Envy 17-ae143ng | |
| HP Envy x360 15-bq102ng | |
| Lenovo ThinkPad 25 | |
| Apple MacBook Pro 13 2017 | |
| LG Gram 13Z980-A | |
| Dell Latitude 7390 | |
| HP 250 G6 2UB93ES | |
| 1920x1080 Fire Strike Graphics | |
| HP Envy 17-ae143ng | |
| Lenovo ThinkPad 25 | |
| HP Envy x360 15-bq102ng | |
| Apple MacBook Pro 13 2017 | |
| LG Gram 13Z980-A | |
| Dell Latitude 7390 | |
| HP 250 G6 2UB93ES | |
| 1920x1080 Ice Storm Extreme Graphics | |
| HP Envy 17-ae143ng | |
| HP Envy x360 15-bq102ng | |
| LG Gram 13Z980-A | |
| Lenovo ThinkPad 25 | |
| 3DMark 11 Performance | 1965 pontos | |
| 3DMark Ice Storm Standard Score | 59410 pontos | |
| 3DMark Cloud Gate Standard Score | 7325 pontos | |
| 3DMark Fire Strike Score | 1014 pontos | |
Ajuda | ||
| baixo | média | alto | ultra | |
|---|---|---|---|---|
| BioShock Infinite (2013) | 63 | 35 | 29.2 | 9.7 |
| Rise of the Tomb Raider (2016) | 21.5 | 13.5 |
Barulho
| Ocioso |
| 28.1 / 28.1 / 28.1 dB |
| Carga |
| 34.3 / 34.3 dB |
 | ||
30 dB silencioso 40 dB(A) audível 50 dB(A) ruidosamente alto |
||
min: | ||
| LG Gram 13Z980-A UHD Graphics 620, i5-8250U, SK Hynix HFS256G39TND-N210A | Samsung Notebook 9 NP900X3N-K01US HD Graphics 620, i5-7200U, Samsung CM871a MZNTY256HDHP | Dell XPS 13 9370 FHD i5 UHD Graphics 620, i5-8250U, Toshiba XG5 KXG50ZNV256G | HP Spectre 13-af033ng UHD Graphics 620, i5-8550U, Samsung PM961 NVMe MZVLW512HMJP | Lenovo Yoga 920-13IKB-80Y7 UHD Graphics 620, i5-8550U, Samsung PM961 MZVLW256HEHP | Xiaomi Mi Notebook Air 13.3 2016 GeForce 940MX, 6200U, Samsung PM951 NVMe MZVLV256 | |
|---|---|---|---|---|---|---|
| Noise | -1% | -3% | -3% | -2% | -13% | |
| desligado / ambiente * (dB) | 28.1 | 28.4 -1% | 29.1 -4% | 30.13 -7% | 28 -0% | 31.15 -11% |
| Idle Minimum * (dB) | 28.1 | 28.4 -1% | 29.1 -4% | 30.13 -7% | 28 -0% | 31.15 -11% |
| Idle Average * (dB) | 28.1 | 28.4 -1% | 29.1 -4% | 30.13 -7% | 28.8 -2% | 31.15 -11% |
| Idle Maximum * (dB) | 28.1 | 28.4 -1% | 29.1 -4% | 30.13 -7% | 30.3 -8% | 31.15 -11% |
| Load Average * (dB) | 34.3 | 33.2 3% | 32.2 6% | 31.5 8% | 34.5 -1% | 38.2 -11% |
| Load Maximum * (dB) | 34.3 | 35.2 -3% | 37.3 -9% | 33.5 2% | 34.3 -0% | 41.7 -22% |
* ... menor é melhor
(±) A temperatura máxima no lado superior é 40.2 °C / 104 F, em comparação com a média de 36.8 °C / 98 F , variando de 21 a 71 °C para a classe Multimedia.
(±) A parte inferior aquece até um máximo de 42.4 °C / 108 F, em comparação com a média de 39.1 °C / 102 F
(+) Em uso inativo, a temperatura média para o lado superior é 25.9 °C / 79 F, em comparação com a média do dispositivo de 31.3 °C / ### class_avg_f### F.
(+) Os apoios para as mãos e o touchpad são mais frios que a temperatura da pele, com um máximo de 25 °C / 77 F e, portanto, são frios ao toque.
(+) A temperatura média da área do apoio para as mãos de dispositivos semelhantes foi 28.7 °C / 83.7 F (+3.7 °C / 6.7 F).
LG Gram 13Z980-A análise de áudio
(-) | alto-falantes não muito altos (###valor### dB)
Graves 100 - 315Hz
(-) | quase nenhum baixo - em média 19.7% menor que a mediana
(±) | a linearidade dos graves é média (12.1% delta para a frequência anterior)
Médios 400 - 2.000 Hz
(+) | médios equilibrados - apenas 4.5% longe da mediana
(±) | a linearidade dos médios é média (8.1% delta para frequência anterior)
Altos 2 - 16 kHz
(+) | agudos equilibrados - apenas 4.2% longe da mediana
(±) | a linearidade dos máximos é média (10.3% delta para frequência anterior)
Geral 100 - 16.000 Hz
(±) | a linearidade do som geral é média (24.6% diferença em relação à mediana)
Comparado com a mesma classe
» 87% de todos os dispositivos testados nesta classe foram melhores, 5% semelhantes, 9% piores
» O melhor teve um delta de 5%, a média foi 17%, o pior foi 45%
Comparado com todos os dispositivos testados
» 75% de todos os dispositivos testados foram melhores, 5% semelhantes, 20% piores
» O melhor teve um delta de 4%, a média foi 23%, o pior foi 134%
Apple MacBook 12 (Early 2016) 1.1 GHz análise de áudio
(+) | os alto-falantes podem tocar relativamente alto (###valor### dB)
Graves 100 - 315Hz
(±) | graves reduzidos - em média 11.3% menor que a mediana
(±) | a linearidade dos graves é média (14.2% delta para a frequência anterior)
Médios 400 - 2.000 Hz
(+) | médios equilibrados - apenas 2.4% longe da mediana
(+) | médios são lineares (5.5% delta para frequência anterior)
Altos 2 - 16 kHz
(+) | agudos equilibrados - apenas 2% longe da mediana
(+) | os máximos são lineares (4.5% delta da frequência anterior)
Geral 100 - 16.000 Hz
(+) | o som geral é linear (10.2% diferença em relação à mediana)
Comparado com a mesma classe
» 7% de todos os dispositivos testados nesta classe foram melhores, 2% semelhantes, 90% piores
» O melhor teve um delta de 5%, a média foi 18%, o pior foi 53%
Comparado com todos os dispositivos testados
» 5% de todos os dispositivos testados foram melhores, 1% semelhantes, 94% piores
» O melhor teve um delta de 4%, a média foi 23%, o pior foi 134%
| desligado | |
| Ocioso | |
| Carga |
|
Key:
min: | |
| LG Gram 13Z980-A i5-8250U, UHD Graphics 620, SK Hynix HFS256G39TND-N210A, IPS, 1920x1080, 13.3" | Samsung Notebook 9 NP900X3N-K01US i5-7200U, HD Graphics 620, Samsung CM871a MZNTY256HDHP, IPS, 1920x1080, 13.3" | Dell XPS 13 9370 FHD i5 i5-8250U, UHD Graphics 620, Toshiba XG5 KXG50ZNV256G, IPS, 1920x1080, 13.3" | HP Spectre 13-af033ng i5-8550U, UHD Graphics 620, Samsung PM961 NVMe MZVLW512HMJP, IPS, 1920x1080, 13.3" | Lenovo Yoga 920-13IKB-80Y7 i5-8550U, UHD Graphics 620, Samsung PM961 MZVLW256HEHP, IPS, 1920x1080, 13.9" | Apple MacBook Air 13.3" 1.8 GHz (2017) 5350U, HD Graphics 6000, Apple SSD SM0128G, TN LED, 1440x900, 13.3" | |
|---|---|---|---|---|---|---|
| Power Consumption | -21% | 4% | 5% | 8% | 5% | |
| Idle Minimum * (Watt) | 3.9 | 3.8 3% | 3.14 19% | 2.8 28% | 3.1 21% | 3.4 13% |
| Idle Average * (Watt) | 7.3 | 11 -51% | 5.22 28% | 6.2 15% | 6.6 10% | 6.3 14% |
| Idle Maximum * (Watt) | 7.4 | 11.3 -53% | 6 19% | 9.4 -27% | 7 5% | 7 5% |
| Load Average * (Watt) | 36.1 | 35.6 1% | 38.5 -7% | 32.2 11% | 35.2 2% | 34.5 4% |
| Load Maximum * (Watt) | 35.8 | 37.2 -4% | 50.4 -41% | 36.6 -2% | 34.6 3% | 40 -12% |
* ... menor é melhor
| LG Gram 13Z980-A i5-8250U, UHD Graphics 620, 72 Wh | Samsung Notebook 9 NP900X3N-K01US i5-7200U, HD Graphics 620, 30 Wh | Dell XPS 13 9370 FHD i5 i5-8250U, UHD Graphics 620, 52 Wh | HP Spectre 13-af033ng i5-8550U, UHD Graphics 620, 43 Wh | Lenovo Yoga 920-13IKB-80Y7 i5-8550U, UHD Graphics 620, 70 Wh | Apple MacBook Air 13.3" 1.8 GHz (2017) 5350U, HD Graphics 6000, 54 Wh | |
|---|---|---|---|---|---|---|
| Duração da bateria | -61% | -12% | -51% | -6% | -12% | |
| WiFi v1.3 (h) | 12.1 | 4.7 -61% | 10.7 -12% | 5.9 -51% | 11.4 -6% | 10.6 -12% |
| Reader / Idle (h) | 11.6 | 23.6 | 27.6 | |||
| Load (h) | 1 | 2 | 1.7 | 2.3 |
Pro
Contra
O Gram 13 exibe conjuntos únicos de vantagens e desvantagens em comparação com outros portáteis. No lado positivo, sua tela é mais precisa do que muitos outros Ultrabooks e a duração da bateria é surpreendentemente longa. Este último aspecto é particularmente notável, já que alternativas mais pesadas, como o XPS 13 ou o Spectre 13, possuem tempos de duração comparativamente mais curtos. Em contraste com o Samsung NP900X3N, o LG é a prova de que a duração da bateria não tem que sofrer quando se pretende um design super leve.
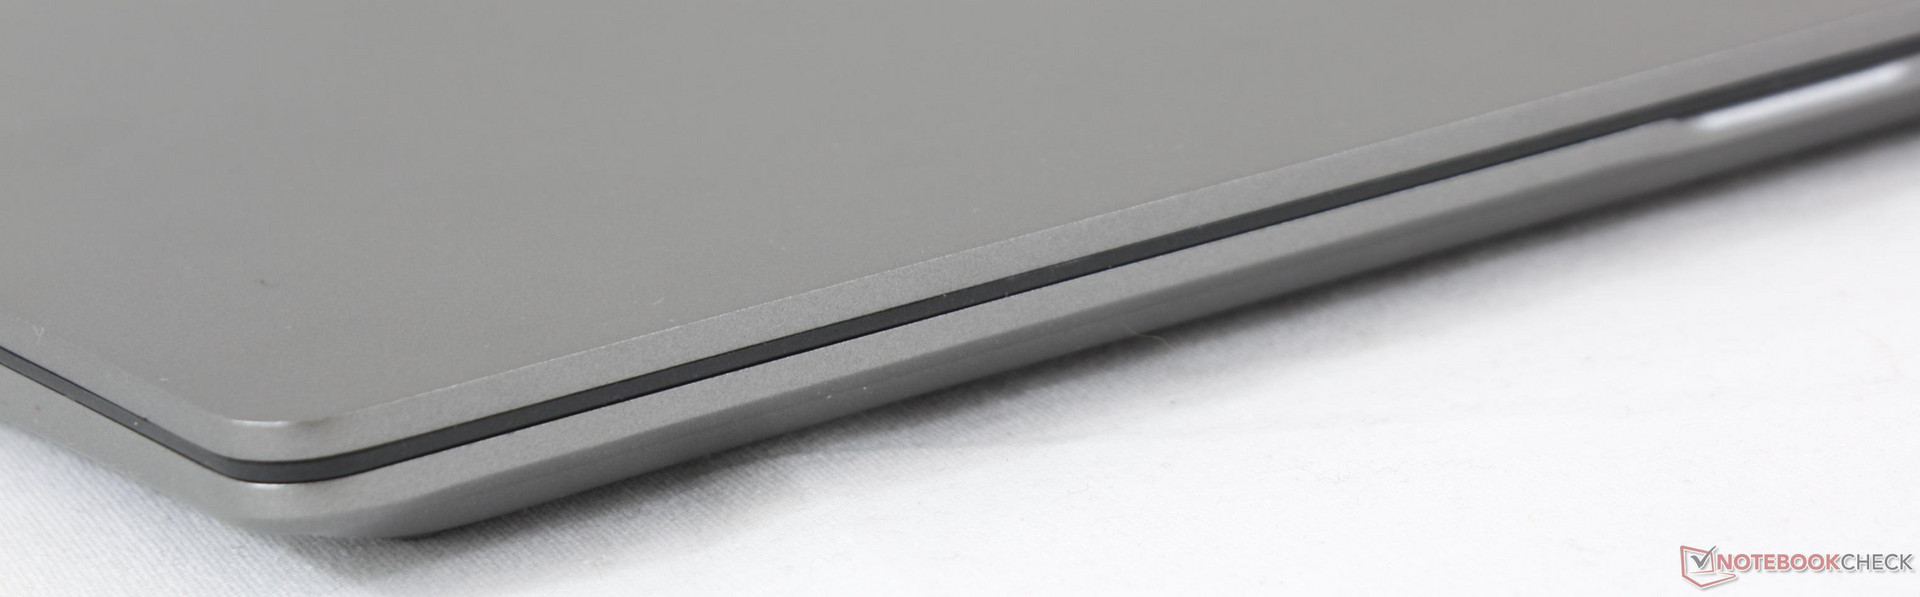
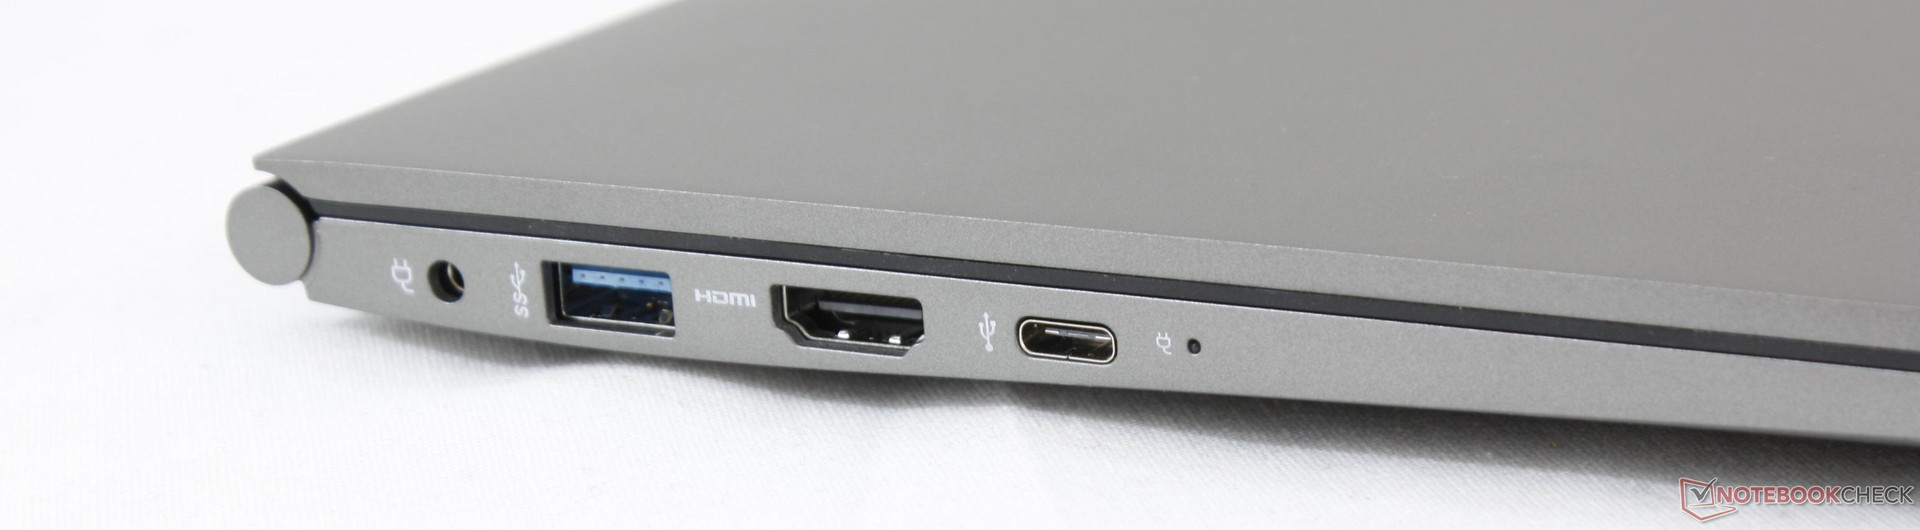
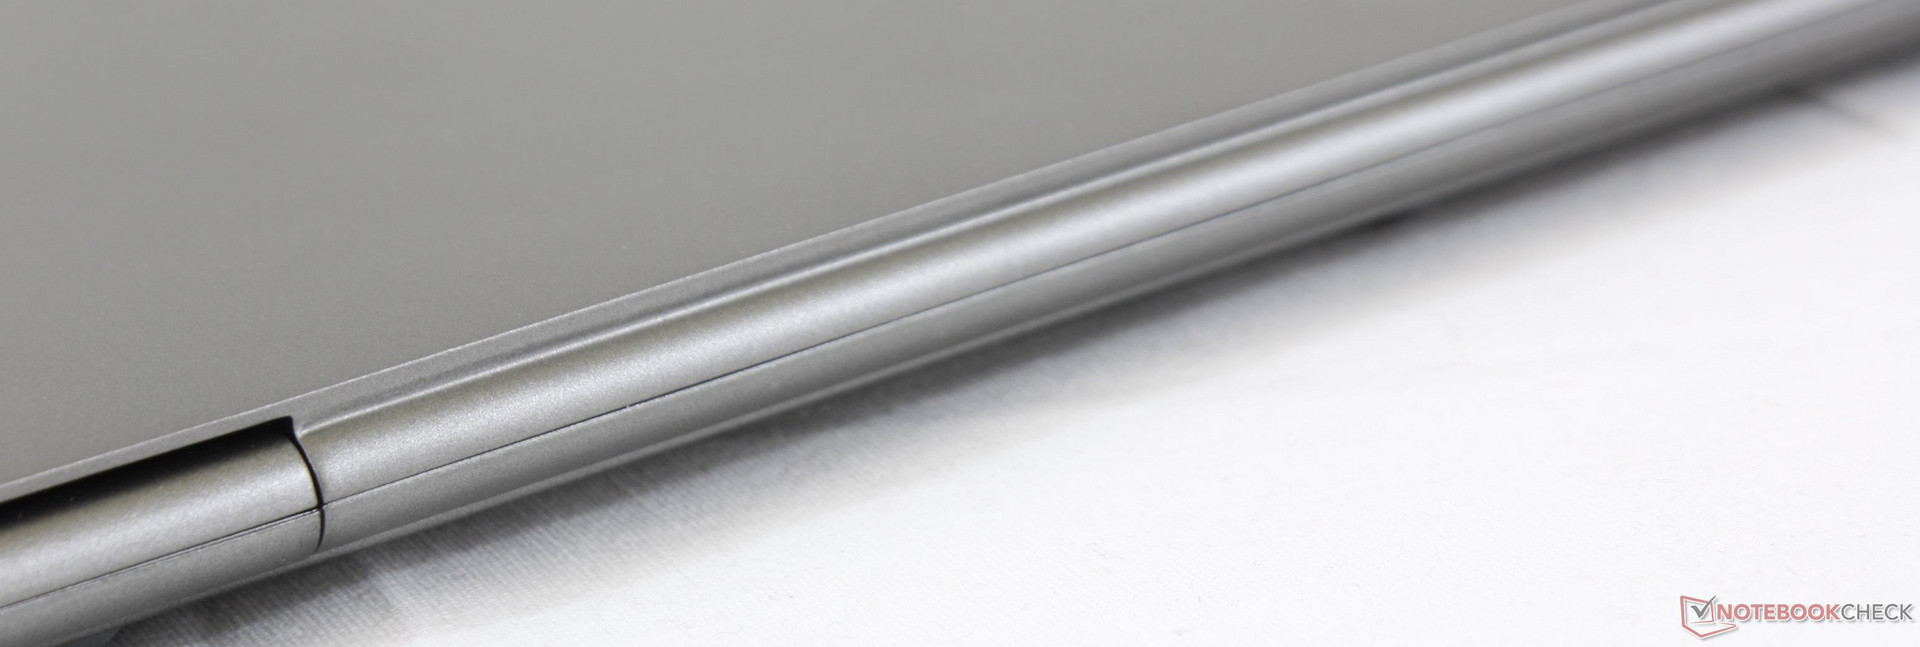
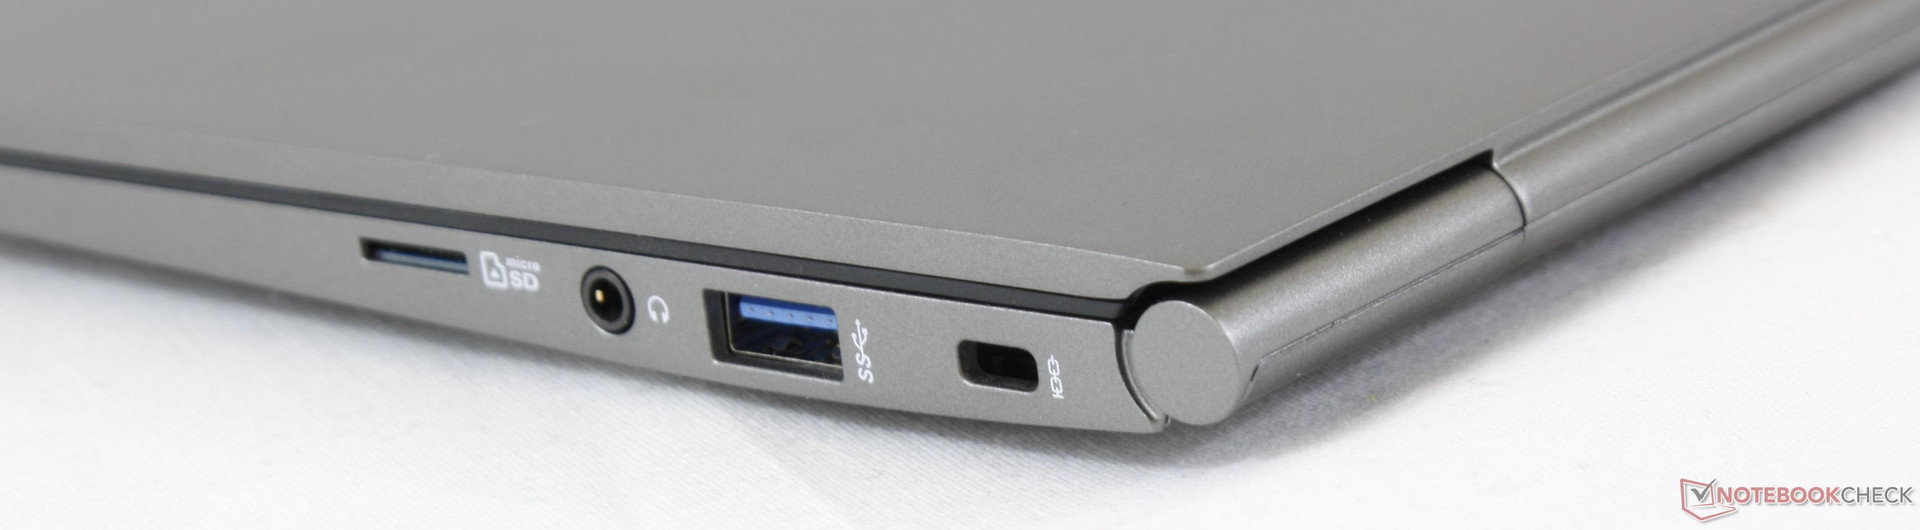
Os principais pontos negativos do sistema são difíceis de ignorar quando colocados ao lado da lista de pontos positivos. A tampa é muito frágil e flexível, especialmente para uma tela táctil, e as variações muito limitadas nos SKUs fazem com que o Gram 13 se sinta menos capaz do que os Ultrabooks mais populares. O XPS 13, Samsung NP900X3N, e Spectre 13, por exemplo, contam com Intel iris ou 4K, gráficos GeForce MX150, e opções Thunderbolt 3, respectivamente, algo que não encontramos no Gram 13. É uma experiência mais barebone com o LG, já que os usuários estão sacrificando o desempenho e os recursos em nome da portabilidade e do peso.
Outros atributos importantes, como a rigidez do chassi, a resposta do teclado e do trackpad e o brilho da tela, são apenas médios, se não um pouco abaixo dos concorrentes populares. Embora o Gram 13 seja muito leve, não é o melhor companheiro ao ar livre, já que há Ultrabooks mais brilhantes e inflexíveis por aí, nessa faixa de preços.
Se a visibilidade ao ar livre é primordial, o Samsung Notebook 9 NP900X3N é a opção mais brilhante ao pesar menos que o LG. Seu peso leve, longa duração da bateria e slots M.2 duplos são os principais atributos que o Gram 13 tem sobre a maior parte de sua concorrência. Caso contrário, o sistema estéril não oferece nada atraente ou indispensável para o alto preço inicial de $1.200.
LG Gram 13Z980-A
- 04/13/2018 v6 (old)
Allen Ngo
Price comparison
