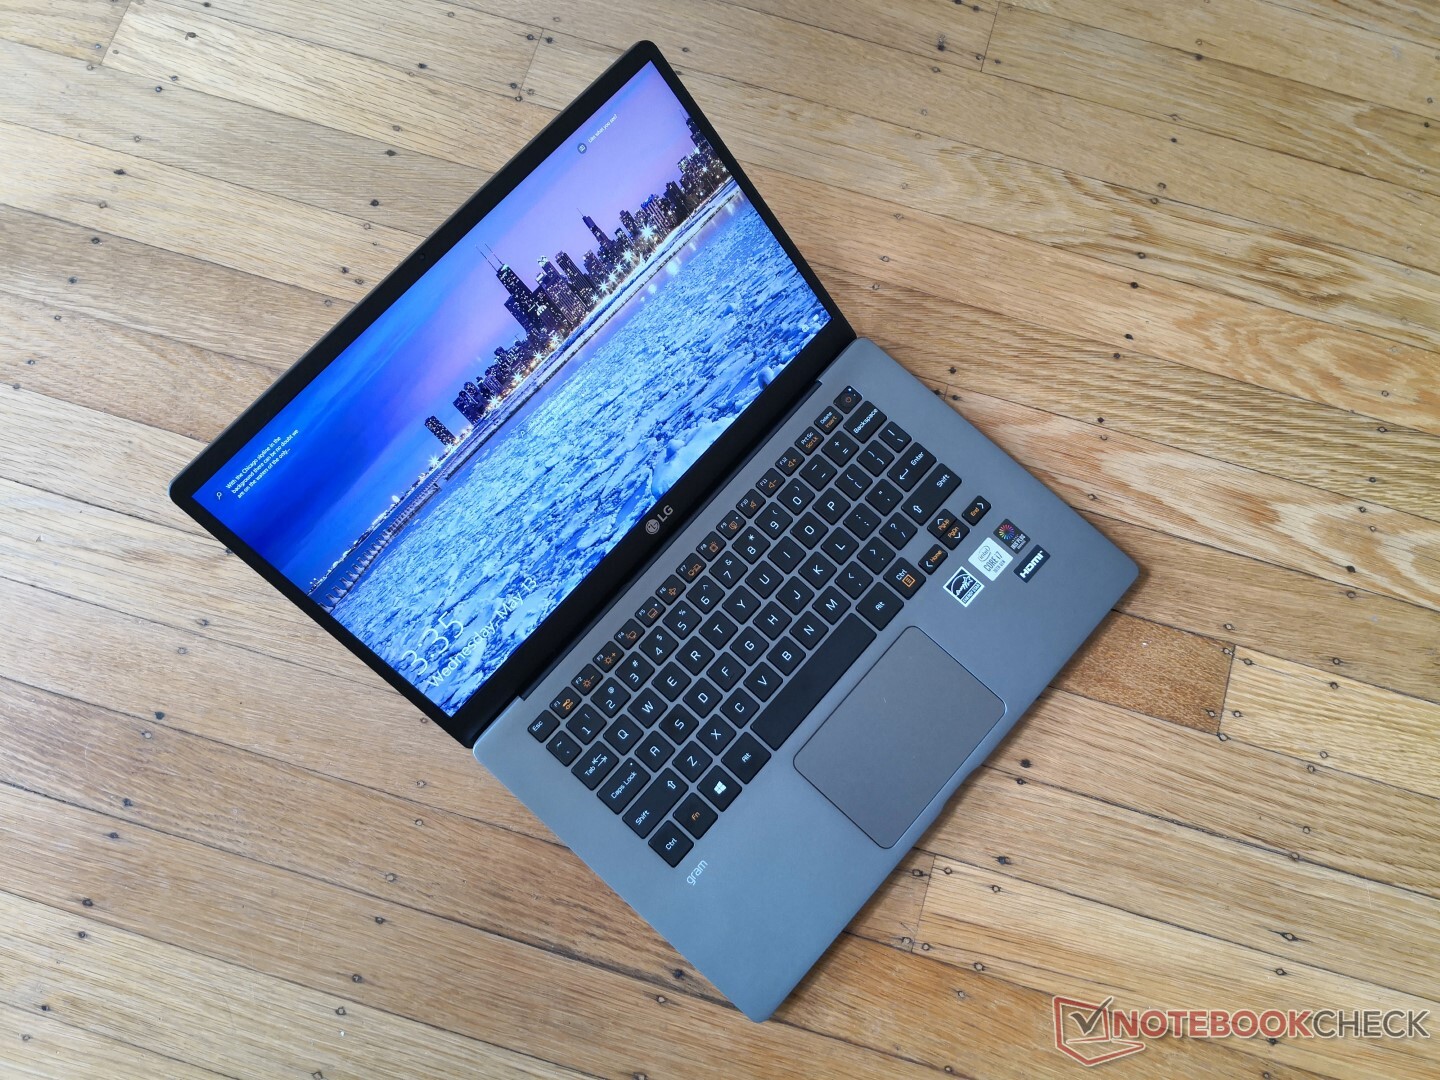
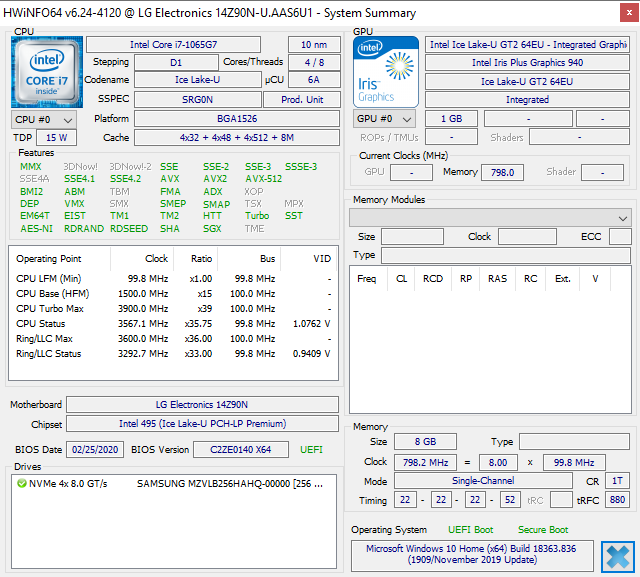
Breve Análise do Portátil LG Gram 14Z90N: Leve ao Custo do Desempenho
Avaliação | Data | Modelo | Peso | Altura | Size | Resolução | Preço |
|---|---|---|---|---|---|---|---|
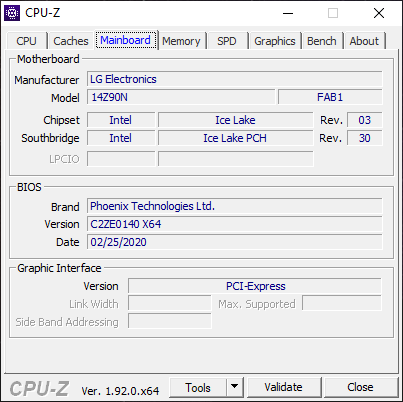
| 85.3 % v7 (old) | 05/2020 | LG Gram 14Z90N i7-1065G7, Iris Plus Graphics G7 (Ice Lake 64 EU) | 994 g | 18 mm | 14.00" | 1920x1080 | |
| 81.2 % v7 (old) | 04/2020 | LG Gram 14T90N i7-10510U, UHD Graphics 620 | 1.2 kg | 18 mm | 14.00" | 1920x1080 | |
| 88.9 % v7 (old) | 03/2020 | Dell XPS 13 9300 Core i7-1065G7 i7-1065G7, Iris Plus Graphics G7 (Ice Lake 64 EU) | 1.2 kg | 14.8 mm | 13.40" | 1920x1200 | |
| 85 % v6 (old) | 07/2019 | Lenovo IdeaPad S940-14IWL i7-8565U, UHD Graphics 620 | 1.2 kg | 12 mm | 14.00" | 3840x2160 | |
| 81.2 % v7 (old) | 02/2020 | Asus ZenBook 14 UM431DA-AM020T R7 3700U, Vega 10 | 1.4 kg | 16 mm | 14.00" | 1920x1080 | |
| 82 % v7 (old) | 12/2019 | Lenovo ThinkBook 14-IML-20RV006TGE i5-10210U, UHD Graphics 620 | 1.6 kg | 17.9 mm | 14.00" | 1920x1080 |
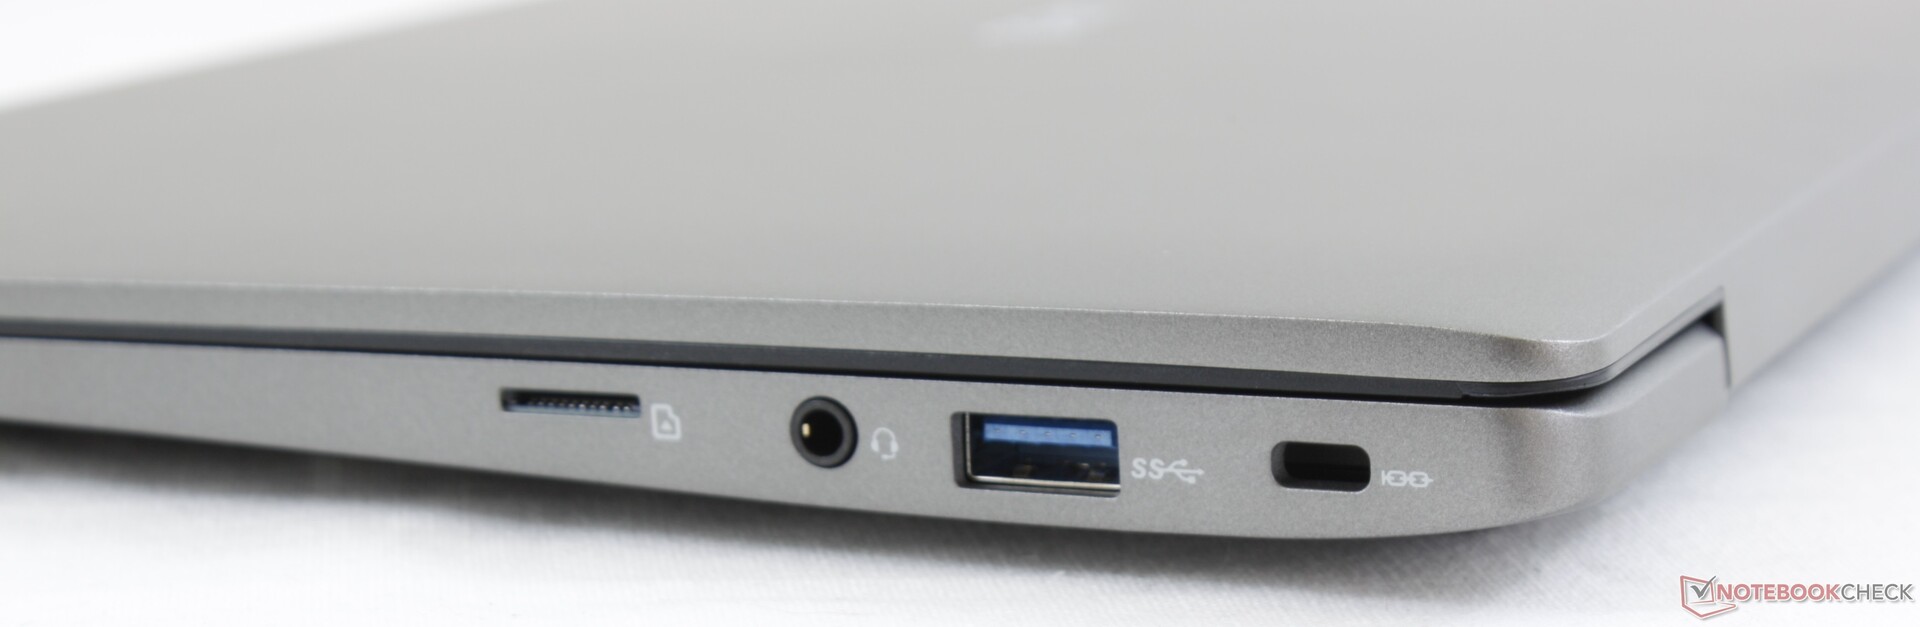
| SD Card Reader | |
| average JPG Copy Test (av. of 3 runs) | |
| Dell XPS 13 9300 Core i7-1065G7 (Toshiba Exceria Pro M501 64 GB UHS-II) | |
| LG Gram 14Z90N (Toshiba Exceria Pro M501 64 GB UHS-II) | |
| LG Gram 14T90N (Toshiba Exceria Pro M501 64 GB UHS-II) | |
| LG Gram 14Z980-U.AAW5U1 (Toshiba Exceria Pro M501 microSDXC 64GB) | |
| Asus ZenBook 14 UM431DA-AM020T (Toshiba Exceria Pro SDXC 64 GB UHS-II) | |
| maximum AS SSD Seq Read Test (1GB) | |
| Dell XPS 13 9300 Core i7-1065G7 (Toshiba Exceria Pro M501 64 GB UHS-II) | |
| LG Gram 14Z90N (Toshiba Exceria Pro M501 64 GB UHS-II) | |
| LG Gram 14Z980-U.AAW5U1 (Toshiba Exceria Pro M501 microSDXC 64GB) | |
| LG Gram 14T90N (Toshiba Exceria Pro M501 64 GB UHS-II) | |
| Asus ZenBook 14 UM431DA-AM020T (Toshiba Exceria Pro SDXC 64 GB UHS-II) | |

, i7-1065G7, Samsung SSD PM981 MZVLB256HAHQ")
, i7-1065G7, Samsung SSD PM981 MZVLB256HAHQ")
| |||||||||||||||||||||||||
iluminação: 89 %
iluminação com acumulador: 316.8 cd/m²
Contraste: 960:1 (Preto: 0.33 cd/m²)
ΔE ColorChecker Calman: 1.74 | ∀{0.5-29.43 Ø4.71}
calibrated: 1.37
ΔE Greyscale Calman: 2.7 | ∀{0.09-98 Ø4.96}
95.4% sRGB (Argyll 1.6.3 3D)
61.3% AdobeRGB 1998 (Argyll 1.6.3 3D)
66.1% AdobeRGB 1998 (Argyll 3D)
95.5% sRGB (Argyll 3D)
65% Display P3 (Argyll 3D)
Gamma: 2.23
CCT: 6655 K
| LG Gram 14Z90N LG Philips LP140WF7-SPG1, IPS, 14", 1920x1080 | LG Gram 14T90N LG Philips LP140WFA-SPY1, IPS, 14", 1920x1080 | LG Gram 14Z980-U.AAW5U1 LG Philips LP140WF7-SPG1, IPS, 14", 1920x1080 | Dell XPS 13 9300 Core i7-1065G7 Sharp LQ134N1, IPS, 13.4", 1920x1200 | Lenovo IdeaPad S940-14IWL B140ZAN01.3, IPS, 14", 3840x2160 | Asus ZenBook 14 UM431DA-AM020T CEC PA LM140LF-3L03, IPS, 14", 1920x1080 | |
|---|---|---|---|---|---|---|
| Display | 0% | -0% | 3% | 21% | 1% | |
| Display P3 Coverage (%) | 65 | 65 0% | 64.7 0% | 66.3 2% | 87.5 35% | 66.7 3% |
| sRGB Coverage (%) | 95.5 | 95.7 0% | 94.3 -1% | 97.3 2% | 99.7 4% | 92.3 -3% |
| AdobeRGB 1998 Coverage (%) | 66.1 | 66.7 1% | 66 0% | 68.5 4% | 81.1 23% | 67.5 2% |
| Response Times | -24% | 3% | -20% | -27% | 11% | |
| Response Time Grey 50% / Grey 80% * (ms) | 40.4 ? | 54 ? -34% | 36.8 ? 9% | 50 ? -24% | 57.2 ? -42% | 36 ? 11% |
| Response Time Black / White * (ms) | 28.8 ? | 32.8 ? -14% | 30 ? -4% | 33.2 ? -15% | 32 ? -11% | 26 ? 10% |
| PWM Frequency (Hz) | 2500 ? | 44 ? | ||||
| Screen | -10% | -26% | 2% | -26% | -72% | |
| Brightness middle (cd/m²) | 316.8 | 322.2 2% | 333.8 5% | 607.6 92% | 594.5 88% | 253 -20% |
| Brightness (cd/m²) | 298 | 301 1% | 307 3% | 595 100% | 536 80% | 245 -18% |
| Brightness Distribution (%) | 89 | 86 -3% | 83 -7% | 96 8% | 83 -7% | 78 -12% |
| Black Level * (cd/m²) | 0.33 | 0.25 24% | 0.4 -21% | 0.4 -21% | 0.43 -30% | 0.225 32% |
| Contrast (:1) | 960 | 1289 34% | 835 -13% | 1519 58% | 1383 44% | 1124 17% |
| Colorchecker dE 2000 * | 1.74 | 3.62 -108% | 3.54 -103% | 3.23 -86% | 4.87 -180% | 8.89 -411% |
| Colorchecker dE 2000 max. * | 5.41 | 6.9 -28% | 5.8 -7% | 8.67 -60% | 7.9 -46% | 4.56 16% |
| Colorchecker dE 2000 calibrated * | 1.37 | 1.22 11% | 2.36 -72% | 1.01 26% | 2.83 -107% | 4.9 -258% |
| Greyscale dE 2000 * | 2.7 | 3.9 -44% | 4.7 -74% | 5.5 -104% | 6.7 -148% | 6.33 -134% |
| Gamma | 2.23 99% | 2.43 91% | 2.14 103% | 2.12 104% | 2.091 105% | 2.52 87% |
| CCT | 6655 98% | 6344 102% | 6261 104% | 6413 101% | 6891 94% | 6745 96% |
| Color Space (Percent of AdobeRGB 1998) (%) | 61.3 | 61.3 0% | 61.2 0% | 63 3% | 72 17% | 60 -2% |
| Color Space (Percent of sRGB) (%) | 95.4 | 95.6 0% | 94.7 -1% | 97.5 2% | 100 5% | 91 -5% |
| Média Total (Programa/Configurações) | -11% /
-10% | -8% /
-18% | -5% /
-1% | -11% /
-17% | -20% /
-48% |
* ... menor é melhor
Exibir tempos de resposta
| ↔ Tempo de resposta preto para branco | ||
|---|---|---|
| 28.8 ms ... ascensão ↗ e queda ↘ combinadas | ↗ 18 ms ascensão | 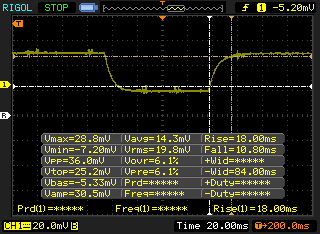 |
| ↘ 10.8 ms queda | ||
| A tela mostra taxas de resposta relativamente lentas em nossos testes e pode ser muito lenta para os jogadores. Em comparação, todos os dispositivos testados variam de 0.1 (mínimo) a 240 (máximo) ms. » 76 % de todos os dispositivos são melhores. Isso significa que o tempo de resposta medido é pior que a média de todos os dispositivos testados (19.8 ms). | ||
| ↔ Tempo de resposta 50% cinza a 80% cinza | ||
| 40.4 ms ... ascensão ↗ e queda ↘ combinadas | ↗ 20.8 ms ascensão | 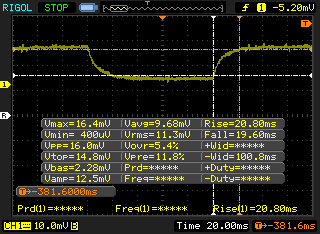 |
| ↘ 19.6 ms queda | ||
| A tela mostra taxas de resposta lentas em nossos testes e será insatisfatória para os jogadores. Em comparação, todos os dispositivos testados variam de 0.165 (mínimo) a 636 (máximo) ms. » 64 % de todos os dispositivos são melhores. Isso significa que o tempo de resposta medido é pior que a média de todos os dispositivos testados (31 ms). | ||
Cintilação da tela / PWM (modulação por largura de pulso)
| Tela tremeluzindo / PWM não detectado | 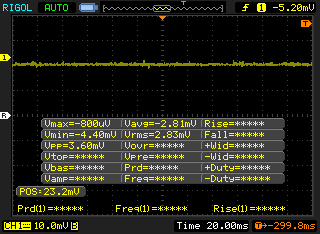 | ||
[pwm_comparison] Em comparação: 52 % de todos os dispositivos testados não usam PWM para escurecer a tela. Se PWM foi detectado, uma média de 7757 (mínimo: 5 - máximo: 343500) Hz foi medida. | |||
Cinebench R15: CPU Multi 64Bit | CPU Single 64Bit
Blender: v2.79 BMW27 CPU
7-Zip 18.03: 7z b 4 -mmt1 | 7z b 4
Geekbench 5.5: Single-Core | Multi-Core
HWBOT x265 Benchmark v2.2: 4k Preset
LibreOffice : 20 Documents To PDF
R Benchmark 2.5: Overall mean
| Cinebench R20 / CPU (Single Core) | |
| Dell XPS 13 9300 Core i7-1065G7 | |
| Asus ZenBook 15 UX534FT-DB77 | |
| Média Intel Core i7-1065G7 (358 - 474, n=31) | |
| Dell XPS 13 9300 i5 FHD | |
| Asus VivoBook 14 X403FA | |
| LG Gram 14T90N | |
| Lenovo IdeaPad S540-14API | |
| LG Gram 14Z90N | |
| Dell Latitude 13 3390 | |
| Huawei MateBook D 14-53010TVS | |
| Huawei MateBook D 14-53010TVS | |
| Blender / v2.79 BMW27 CPU | |
| LG Gram 14Z90N | |
| LG Gram 14T90N | |
| Dell Latitude 13 3390 | |
| MSI Modern 14 A10RB | |
| Média Intel Core i7-1065G7 (675 - 1650, n=23) | |
| Asus VivoBook 14 X403FA | |
| Dell XPS 13 9300 i5 FHD | |
| Lenovo IdeaPad S540-14API | |
| Huawei MateBook D 14-53010TVS | |
| Huawei MateBook D 14-53010TVS | |
| 7-Zip 18.03 / 7z b 4 -mmt1 | |
| MSI Modern 14 A10RB | |
| LG Gram 14T90N | |
| Média Intel Core i7-1065G7 (3289 - 4589, n=24) | |
| LG Gram 14Z90N | |
| Dell XPS 13 9300 i5 FHD | |
| Asus VivoBook 14 X403FA | |
| Dell Latitude 13 3390 | |
| Lenovo IdeaPad S540-14API | |
| Huawei MateBook D 14-53010TVS | |
| Huawei MateBook D 14-53010TVS | |
| Geekbench 5.5 / Single-Core | |
| Média Intel Core i7-1065G7 (948 - 1348, n=18) | |
| LG Gram 14T90N | |
| Dell XPS 13 9300 i5 FHD | |
| LG Gram 14Z90N | |
| Huawei MateBook D 14-53010TVS | |
| Huawei MateBook D 14-53010TVS | |
| Geekbench 5.5 / Multi-Core | |
| Dell XPS 13 9300 i5 FHD | |
| Média Intel Core i7-1065G7 (2464 - 4855, n=18) | |
| LG Gram 14T90N | |
| Huawei MateBook D 14-53010TVS | |
| Huawei MateBook D 14-53010TVS | |
| LG Gram 14Z90N | |
| HWBOT x265 Benchmark v2.2 / 4k Preset | |
| Asus VivoBook 14 X403FA | |
| Média Intel Core i7-1065G7 (2.2 - 6.38, n=22) | |
| Dell XPS 13 9300 i5 FHD | |
| MSI Modern 14 A10RB | |
| Huawei MateBook D 14-53010TVS | |
| Huawei MateBook D 14-53010TVS | |
| Lenovo IdeaPad S540-14API | |
| Dell Latitude 13 3390 | |
| LG Gram 14T90N | |
| LG Gram 14Z90N | |
| LibreOffice / 20 Documents To PDF | |
| LG Gram 14Z90N | |
| LG Gram 14T90N | |
| Média Intel Core i7-1065G7 (46.9 - 85.3, n=19) | |
| R Benchmark 2.5 / Overall mean | |
| LG Gram 14Z90N | |
| Huawei MateBook D 14-53010TVS | |
| Huawei MateBook D 14-53010TVS | |
| Dell XPS 13 9300 i5 FHD | |
| Média Intel Core i7-1065G7 (0.661 - 0.798, n=18) | |
| LG Gram 14T90N | |
* ... menor é melhor
| PCMark 8 Home Score Accelerated v2 | 3402 pontos | |
| PCMark 8 Work Score Accelerated v2 | 5141 pontos | |
| PCMark 10 Score | 4231 pontos | |
Ajuda | ||
| DPC Latencies / LatencyMon - interrupt to process latency (max), Web, Youtube, Prime95 | |
| LG Gram 14Z90N | |
* ... menor é melhor
| LG Gram 14Z90N Samsung SSD PM981 MZVLB256HAHQ | LG Gram 14T90N Samsung SSD PM981a MZVLB512HBJQ | LG Gram 14Z980-U.AAW5U1 SK Hynix SC313 HFS256G39TNF | Dell XPS 13 9300 Core i7-1065G7 Intel SSDPEMKF512G8 NVMe SSD | Lenovo IdeaPad S940-14IWL Samsung SSD PM981 MZVLB512HAJQ | |
|---|---|---|---|---|---|
| AS SSD | 20% | -56% | -25% | 19% | |
| Seq Read (MB/s) | 1744 | 1829 5% | 476.1 -73% | 1956 12% | 2625 51% |
| Seq Write (MB/s) | 1450 | 2048 41% | 487.4 -66% | 1227 -15% | 1360 -6% |
| 4K Read (MB/s) | 57.4 | 54.2 -6% | 30.57 -47% | 63 10% | 47.71 -17% |
| 4K Write (MB/s) | 140.9 | 120.5 -14% | 66.1 -53% | 156.6 11% | 115.5 -18% |
| 4K-64 Read (MB/s) | 907 | 1512 67% | 352.9 -61% | 475.6 -48% | 1492 64% |
| 4K-64 Write (MB/s) | 1372 | 1573 15% | 263.1 -81% | 539 -61% | 1154 -16% |
| Access Time Read * (ms) | 0.059 | 0.046 22% | 0.092 -56% | 0.042 29% | 0.045 24% |
| Access Time Write * (ms) | 0.081 | 0.091 -12% | 0.055 32% | 0.105 -30% | 0.032 60% |
| Score Read (Points) | 1138 | 1749 54% | 431 -62% | 734 -36% | 1802 58% |
| Score Write (Points) | 1658 | 1899 15% | 378 -77% | 818 -51% | 1406 -15% |
| Score Total (Points) | 3380 | 4560 35% | 1040 -69% | 1915 -43% | 4069 20% |
| Copy ISO MB/s (MB/s) | 1520 | 1891 24% | 514 -66% | 1022 -33% | |
| Copy Program MB/s (MB/s) | 539 | 569 6% | 259.3 -52% | 302.8 -44% | |
| Copy Game MB/s (MB/s) | 1070 | 1425 33% | 521 -51% | 491.4 -54% | |
| CrystalDiskMark 5.2 / 6 | 11% | -67% | 0% | -8% | |
| Write 4K (MB/s) | 183.6 | 181.4 -1% | 74.7 -59% | 186.8 2% | 105.3 -43% |
| Read 4K (MB/s) | 48.51 | 52.5 8% | 14.89 -69% | 71.4 47% | 40.9 -16% |
| Write Seq (MB/s) | 1520 | 1592 5% | 502 -67% | 1203 -21% | 1914 26% |
| Read Seq (MB/s) | 1914 | 1617 -16% | 498.6 -74% | 2600 36% | 2224 16% |
| Write 4K Q32T1 (MB/s) | 529 | 556 5% | 214.3 -59% | 514 -3% | 419.3 -21% |
| Read 4K Q32T1 (MB/s) | 560 | 539 -4% | 225.5 -60% | 570 2% | 288.1 -49% |
| Write Seq Q32T1 (MB/s) | 1540 | 2955 92% | 505 -67% | 786 -49% | 1954 27% |
| Read Seq Q32T1 (MB/s) | 3408 | 3270 -4% | 560 -84% | 2947 -14% | 3382 -1% |
| Média Total (Programa/Configurações) | 16% /
17% | -62% /
-60% | -13% /
-16% | 6% /
8% |
* ... menor é melhor

Disk Throttling: DiskSpd Read Loop, Queue Depth 8
| 3DMark 11 Performance | 3050 pontos | |
| 3DMark Cloud Gate Standard Score | 6971 pontos | |
| 3DMark Fire Strike Score | 1363 pontos | |
| 3DMark Time Spy Score | 602 pontos | |
Ajuda | ||
| baixo | média | alto | ultra | |
|---|---|---|---|---|
| The Witcher 3 (2015) | 32.5 | |||
| Dota 2 Reborn (2015) | 56.3 | 32.6 | 19 | 17.7 |
| X-Plane 11.11 (2018) | 22.8 | 11.7 | 11.9 |
| LG Gram 14Z90N Iris Plus Graphics G7 (Ice Lake 64 EU), i7-1065G7, Samsung SSD PM981 MZVLB256HAHQ | LG Gram 14T90N UHD Graphics 620, i7-10510U, Samsung SSD PM981a MZVLB512HBJQ | LG Gram 14Z980-U.AAW5U1 UHD Graphics 620, i5-8250U, SK Hynix SC313 HFS256G39TNF | Dell XPS 13 9300 Core i7-1065G7 Iris Plus Graphics G7 (Ice Lake 64 EU), i7-1065G7, Intel SSDPEMKF512G8 NVMe SSD | Lenovo IdeaPad S940-14IWL UHD Graphics 620, i7-8565U, Samsung SSD PM981 MZVLB512HAJQ | Asus ZenBook 14 UM431DA-AM020T Vega 10, R7 3700U, SK hynix BC501 HFM512GDHTNG-8310A | |
|---|---|---|---|---|---|---|
| Noise | -10% | -5% | -6% | -6% | -9% | |
| desligado / ambiente * (dB) | 28.6 | 29 -1% | 28.2 1% | 28.3 1% | 28.3 1% | 29.8 -4% |
| Idle Minimum * (dB) | 28.6 | 30 -5% | 28.4 1% | 28.3 1% | 28.3 1% | 28 2% |
| Idle Average * (dB) | 29.2 | 30 -3% | 28.4 3% | 28.3 3% | 28.3 3% | 28 4% |
| Idle Maximum * (dB) | 29.2 | 30 -3% | 28.4 3% | 28.3 3% | 31.3 -7% | 28 4% |
| Load Average * (dB) | 29.2 | 35.2 -21% | 35.7 -22% | 32.5 -11% | 34.3 -17% | 36.8 -26% |
| Load Maximum * (dB) | 29.5 | 37 -25% | 34.2 -16% | 39.3 -33% | 34.3 -16% | 39 -32% |
| Witcher 3 ultra * (dB) | 39.3 |
* ... menor é melhor
Barulho
| Ocioso |
| 28.6 / 29.2 / 29.2 dB |
| Carga |
| 29.2 / 29.5 dB |
 | ||
30 dB silencioso 40 dB(A) audível 50 dB(A) ruidosamente alto |
||
min: | ||
(±) A temperatura máxima no lado superior é 41 °C / 106 F, em comparação com a média de 35.9 °C / 97 F , variando de 21.4 a 59 °C para a classe Subnotebook.
(±) A parte inferior aquece até um máximo de 40.2 °C / 104 F, em comparação com a média de 39.2 °C / 103 F
(+) Em uso inativo, a temperatura média para o lado superior é 27.4 °C / 81 F, em comparação com a média do dispositivo de 30.8 °C / ### class_avg_f### F.
(+) Os apoios para as mãos e o touchpad são mais frios que a temperatura da pele, com um máximo de 27.8 °C / 82 F e, portanto, são frios ao toque.
(±) A temperatura média da área do apoio para as mãos de dispositivos semelhantes foi 28.2 °C / 82.8 F (+0.4 °C / 0.8 F).
LG Gram 14Z90N análise de áudio
(+) | os alto-falantes podem tocar relativamente alto (###valor### dB)
Graves 100 - 315Hz
(-) | quase nenhum baixo - em média 19.3% menor que a mediana
(±) | a linearidade dos graves é média (11.7% delta para a frequência anterior)
Médios 400 - 2.000 Hz
(+) | médios equilibrados - apenas 4.5% longe da mediana
(+) | médios são lineares (5.6% delta para frequência anterior)
Altos 2 - 16 kHz
(+) | agudos equilibrados - apenas 1.6% longe da mediana
(+) | os máximos são lineares (5.9% delta da frequência anterior)
Geral 100 - 16.000 Hz
(±) | a linearidade do som geral é média (16.9% diferença em relação à mediana)
Comparado com a mesma classe
» 44% de todos os dispositivos testados nesta classe foram melhores, 8% semelhantes, 49% piores
» O melhor teve um delta de 5%, a média foi 18%, o pior foi 53%
Comparado com todos os dispositivos testados
» 30% de todos os dispositivos testados foram melhores, 8% semelhantes, 62% piores
» O melhor teve um delta de 4%, a média foi 23%, o pior foi 134%
Apple MacBook 12 (Early 2016) 1.1 GHz análise de áudio
(+) | os alto-falantes podem tocar relativamente alto (###valor### dB)
Graves 100 - 315Hz
(±) | graves reduzidos - em média 11.3% menor que a mediana
(±) | a linearidade dos graves é média (14.2% delta para a frequência anterior)
Médios 400 - 2.000 Hz
(+) | médios equilibrados - apenas 2.4% longe da mediana
(+) | médios são lineares (5.5% delta para frequência anterior)
Altos 2 - 16 kHz
(+) | agudos equilibrados - apenas 2% longe da mediana
(+) | os máximos são lineares (4.5% delta da frequência anterior)
Geral 100 - 16.000 Hz
(+) | o som geral é linear (10.2% diferença em relação à mediana)
Comparado com a mesma classe
» 7% de todos os dispositivos testados nesta classe foram melhores, 2% semelhantes, 90% piores
» O melhor teve um delta de 5%, a média foi 18%, o pior foi 53%
Comparado com todos os dispositivos testados
» 5% de todos os dispositivos testados foram melhores, 1% semelhantes, 94% piores
» O melhor teve um delta de 4%, a média foi 23%, o pior foi 134%
| desligado | |
| Ocioso | |
| Carga |
|
Key:
min: | |
| LG Gram 14Z90N i7-1065G7, Iris Plus Graphics G7 (Ice Lake 64 EU), Samsung SSD PM981 MZVLB256HAHQ, IPS, 1920x1080, 14" | LG Gram 14T90N i7-10510U, UHD Graphics 620, Samsung SSD PM981a MZVLB512HBJQ, IPS, 1920x1080, 14" | Dell XPS 13 9300 Core i7-1065G7 i7-1065G7, Iris Plus Graphics G7 (Ice Lake 64 EU), Intel SSDPEMKF512G8 NVMe SSD, IPS, 1920x1200, 13.4" | Lenovo IdeaPad S940-14IWL i7-8565U, UHD Graphics 620, Samsung SSD PM981 MZVLB512HAJQ, IPS, 3840x2160, 14" | Asus ZenBook 14 UM431DA-AM020T R7 3700U, Vega 10, SK hynix BC501 HFM512GDHTNG-8310A, IPS, 1920x1080, 14" | Huawei Matebook X Pro i5 i5-8250U, GeForce MX150, Samsung PM961 MZVLW256HEHP, IPS, 3000x2000, 13.9" | |
|---|---|---|---|---|---|---|
| Power Consumption | -4% | -21% | -60% | -27% | -49% | |
| Idle Minimum * (Watt) | 2.6 | 2.9 -12% | 4.2 -62% | 5.2 -100% | 3.6 -38% | 3.5 -35% |
| Idle Average * (Watt) | 5.9 | 5.8 2% | 6.9 -17% | 10.2 -73% | 7.2 -22% | 8.9 -51% |
| Idle Maximum * (Watt) | 8 | 6.2 22% | 7.5 6% | 11.9 -49% | 10.8 -35% | 12.3 -54% |
| Load Average * (Watt) | 29.8 | 32.9 -10% | 33.3 -12% | 42.1 -41% | 38 -28% | 54.2 -82% |
| Witcher 3 ultra * (Watt) | 30.9 | 37.1 -20% | 42.4 -37% | |||
| Load Maximum * (Watt) | 39.5 | 48.5 -23% | 48.4 -23% | 53.6 -36% | 45.2 -14% | 52.1 -32% |
* ... menor é melhor
| LG Gram 14Z90N i7-1065G7, Iris Plus Graphics G7 (Ice Lake 64 EU), 72 Wh | LG Gram 14T90N i7-10510U, UHD Graphics 620, 72 Wh | LG Gram 14Z980-U.AAW5U1 i5-8250U, UHD Graphics 620, 72 Wh | Dell XPS 13 9300 Core i7-1065G7 i7-1065G7, Iris Plus Graphics G7 (Ice Lake 64 EU), 52 Wh | Lenovo IdeaPad S940-14IWL i7-8565U, UHD Graphics 620, 52 Wh | Asus ZenBook 14 UM431DA-AM020T R7 3700U, Vega 10, 47 Wh | |
|---|---|---|---|---|---|---|
| Duração da bateria | -22% | -18% | -9% | -66% | -51% | |
| Reader / Idle (h) | 45.6 | 32.8 -28% | 37.3 -18% | 8.4 -82% | 17.8 -61% | |
| WiFi v1.3 (h) | 14 | 12.5 -11% | 12 -14% | 12.7 -9% | 5 -64% | 6.7 -52% |
| Load (h) | 3.5 | 2.6 -26% | 2.7 -23% | 1.7 -51% | 2.1 -40% |
Pro
Contra
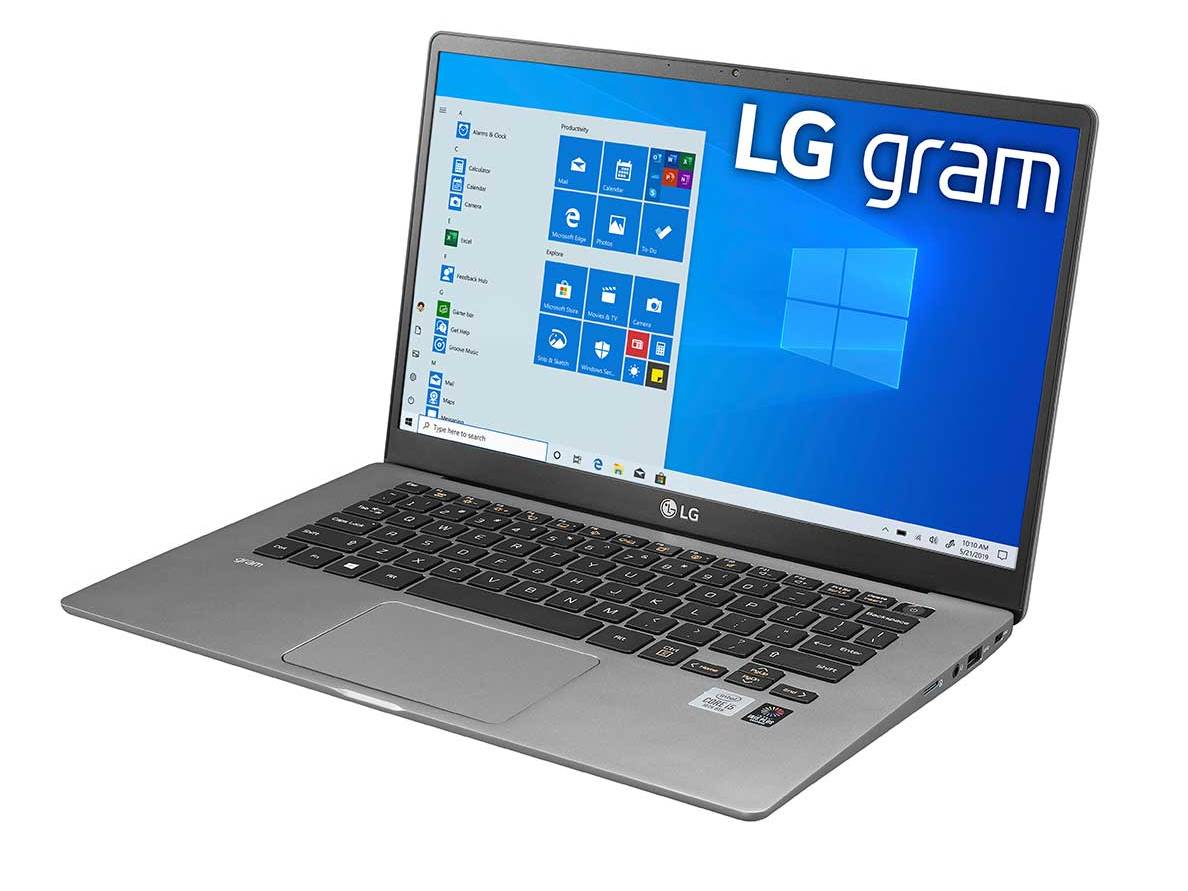
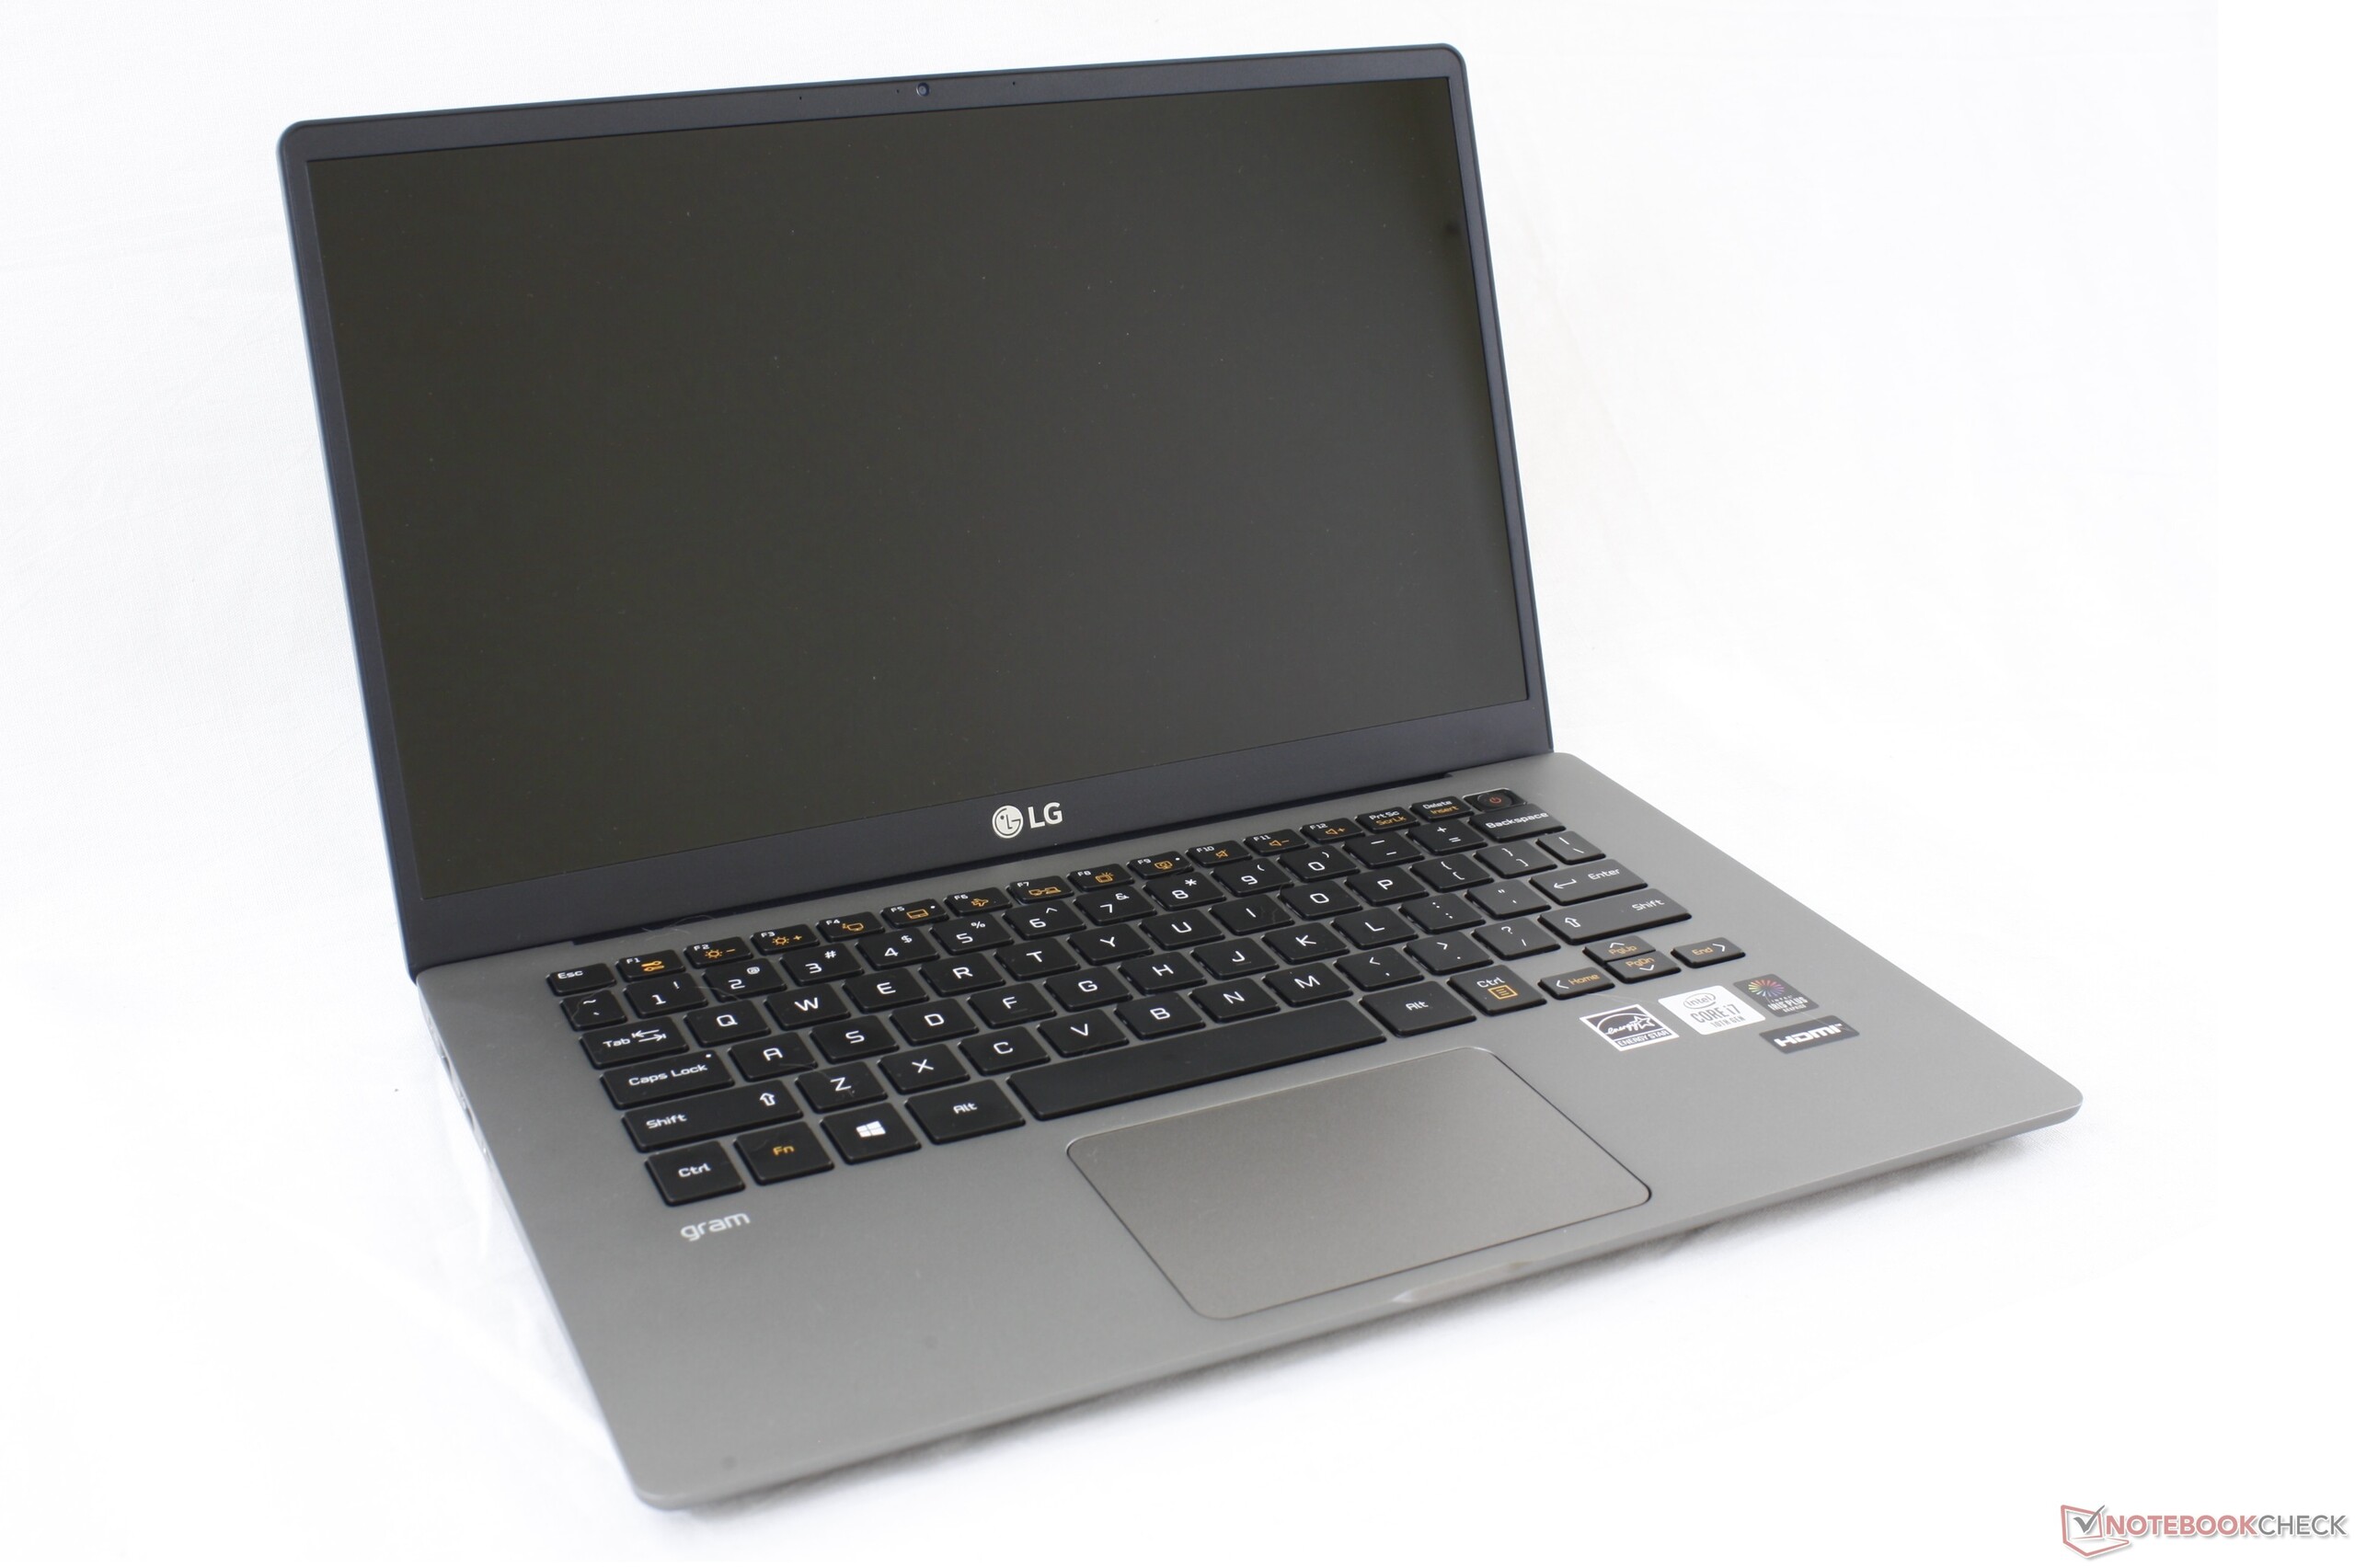
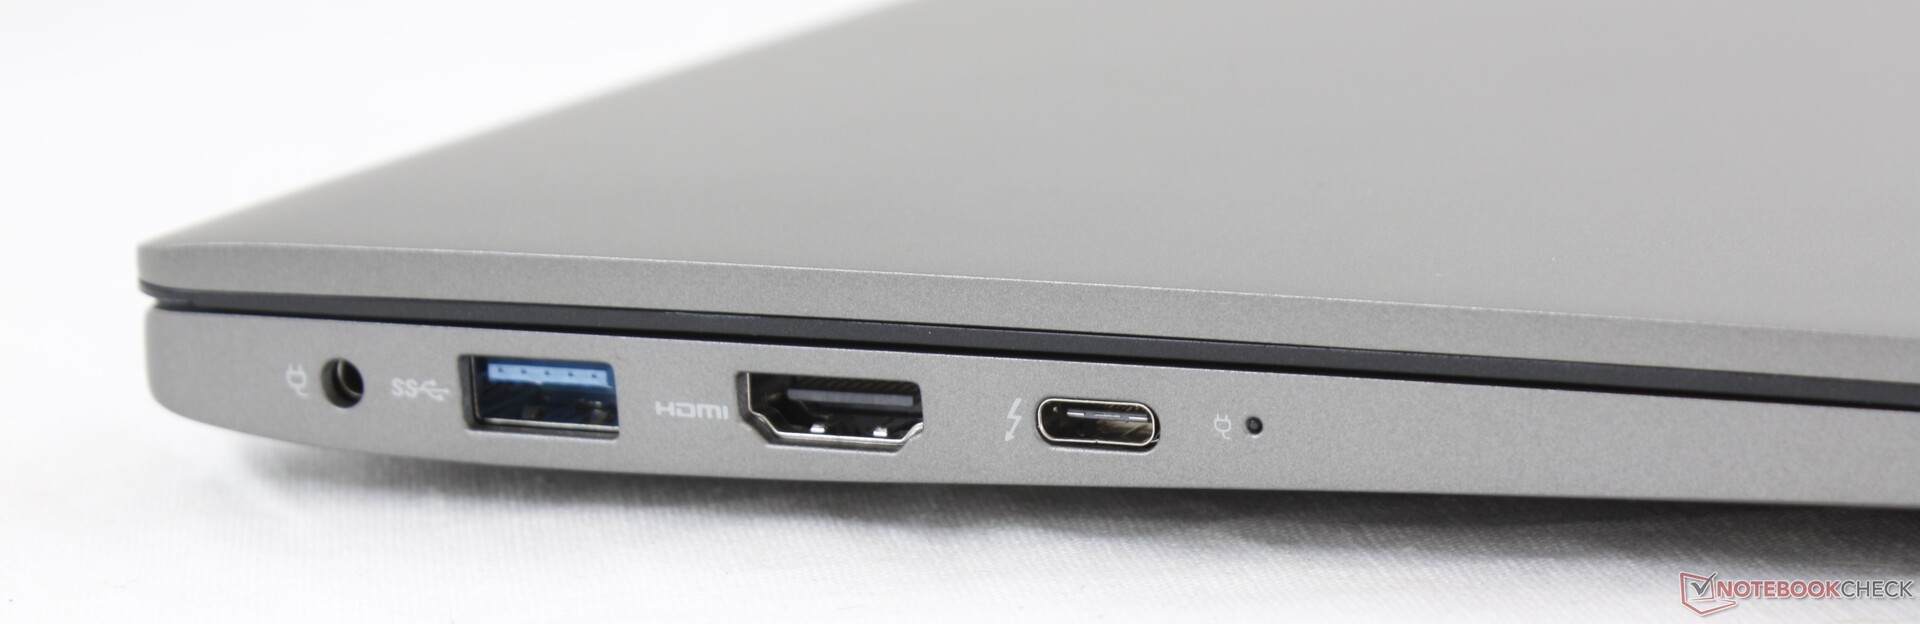
O LG Gram 14Z90N trata apenas de algumas deficiências no Gram 14Z980 do ano passado enquanto ignora o resto. As mudanças bem-vindas incluem o suporte ao Thunderbolt 3, um design de dobradiça mais forte e uma resposta aparentemente mais forte das teclas.
Infelizmente, os principais inconvenientes permanecem, tais como o desempenho sombrio do processador, o brilho médio da tela e a difícil manutenção. Os usuários que podem estar ansiosos para ter uma CPU Core i7 Ice Lake-U só vão encontrar uma pisca do que o processador é capaz quando comparado com máquinas com exatamente a mesma CPU como a Dell XPS 13 9300. Suspeitamos que o fabricante teve que diminuir o desempenho do Core i7 a fim de atender as metas baixas e o potencial de resfriamento limitado. É também decepcionante que a LG não tenha tomado o tempo para aumentar o brilho da luz de fundo porque, por mais leve e portátil que seja o sistema, não é tão bom assim em exteriores onde o brilho se torna predominante.
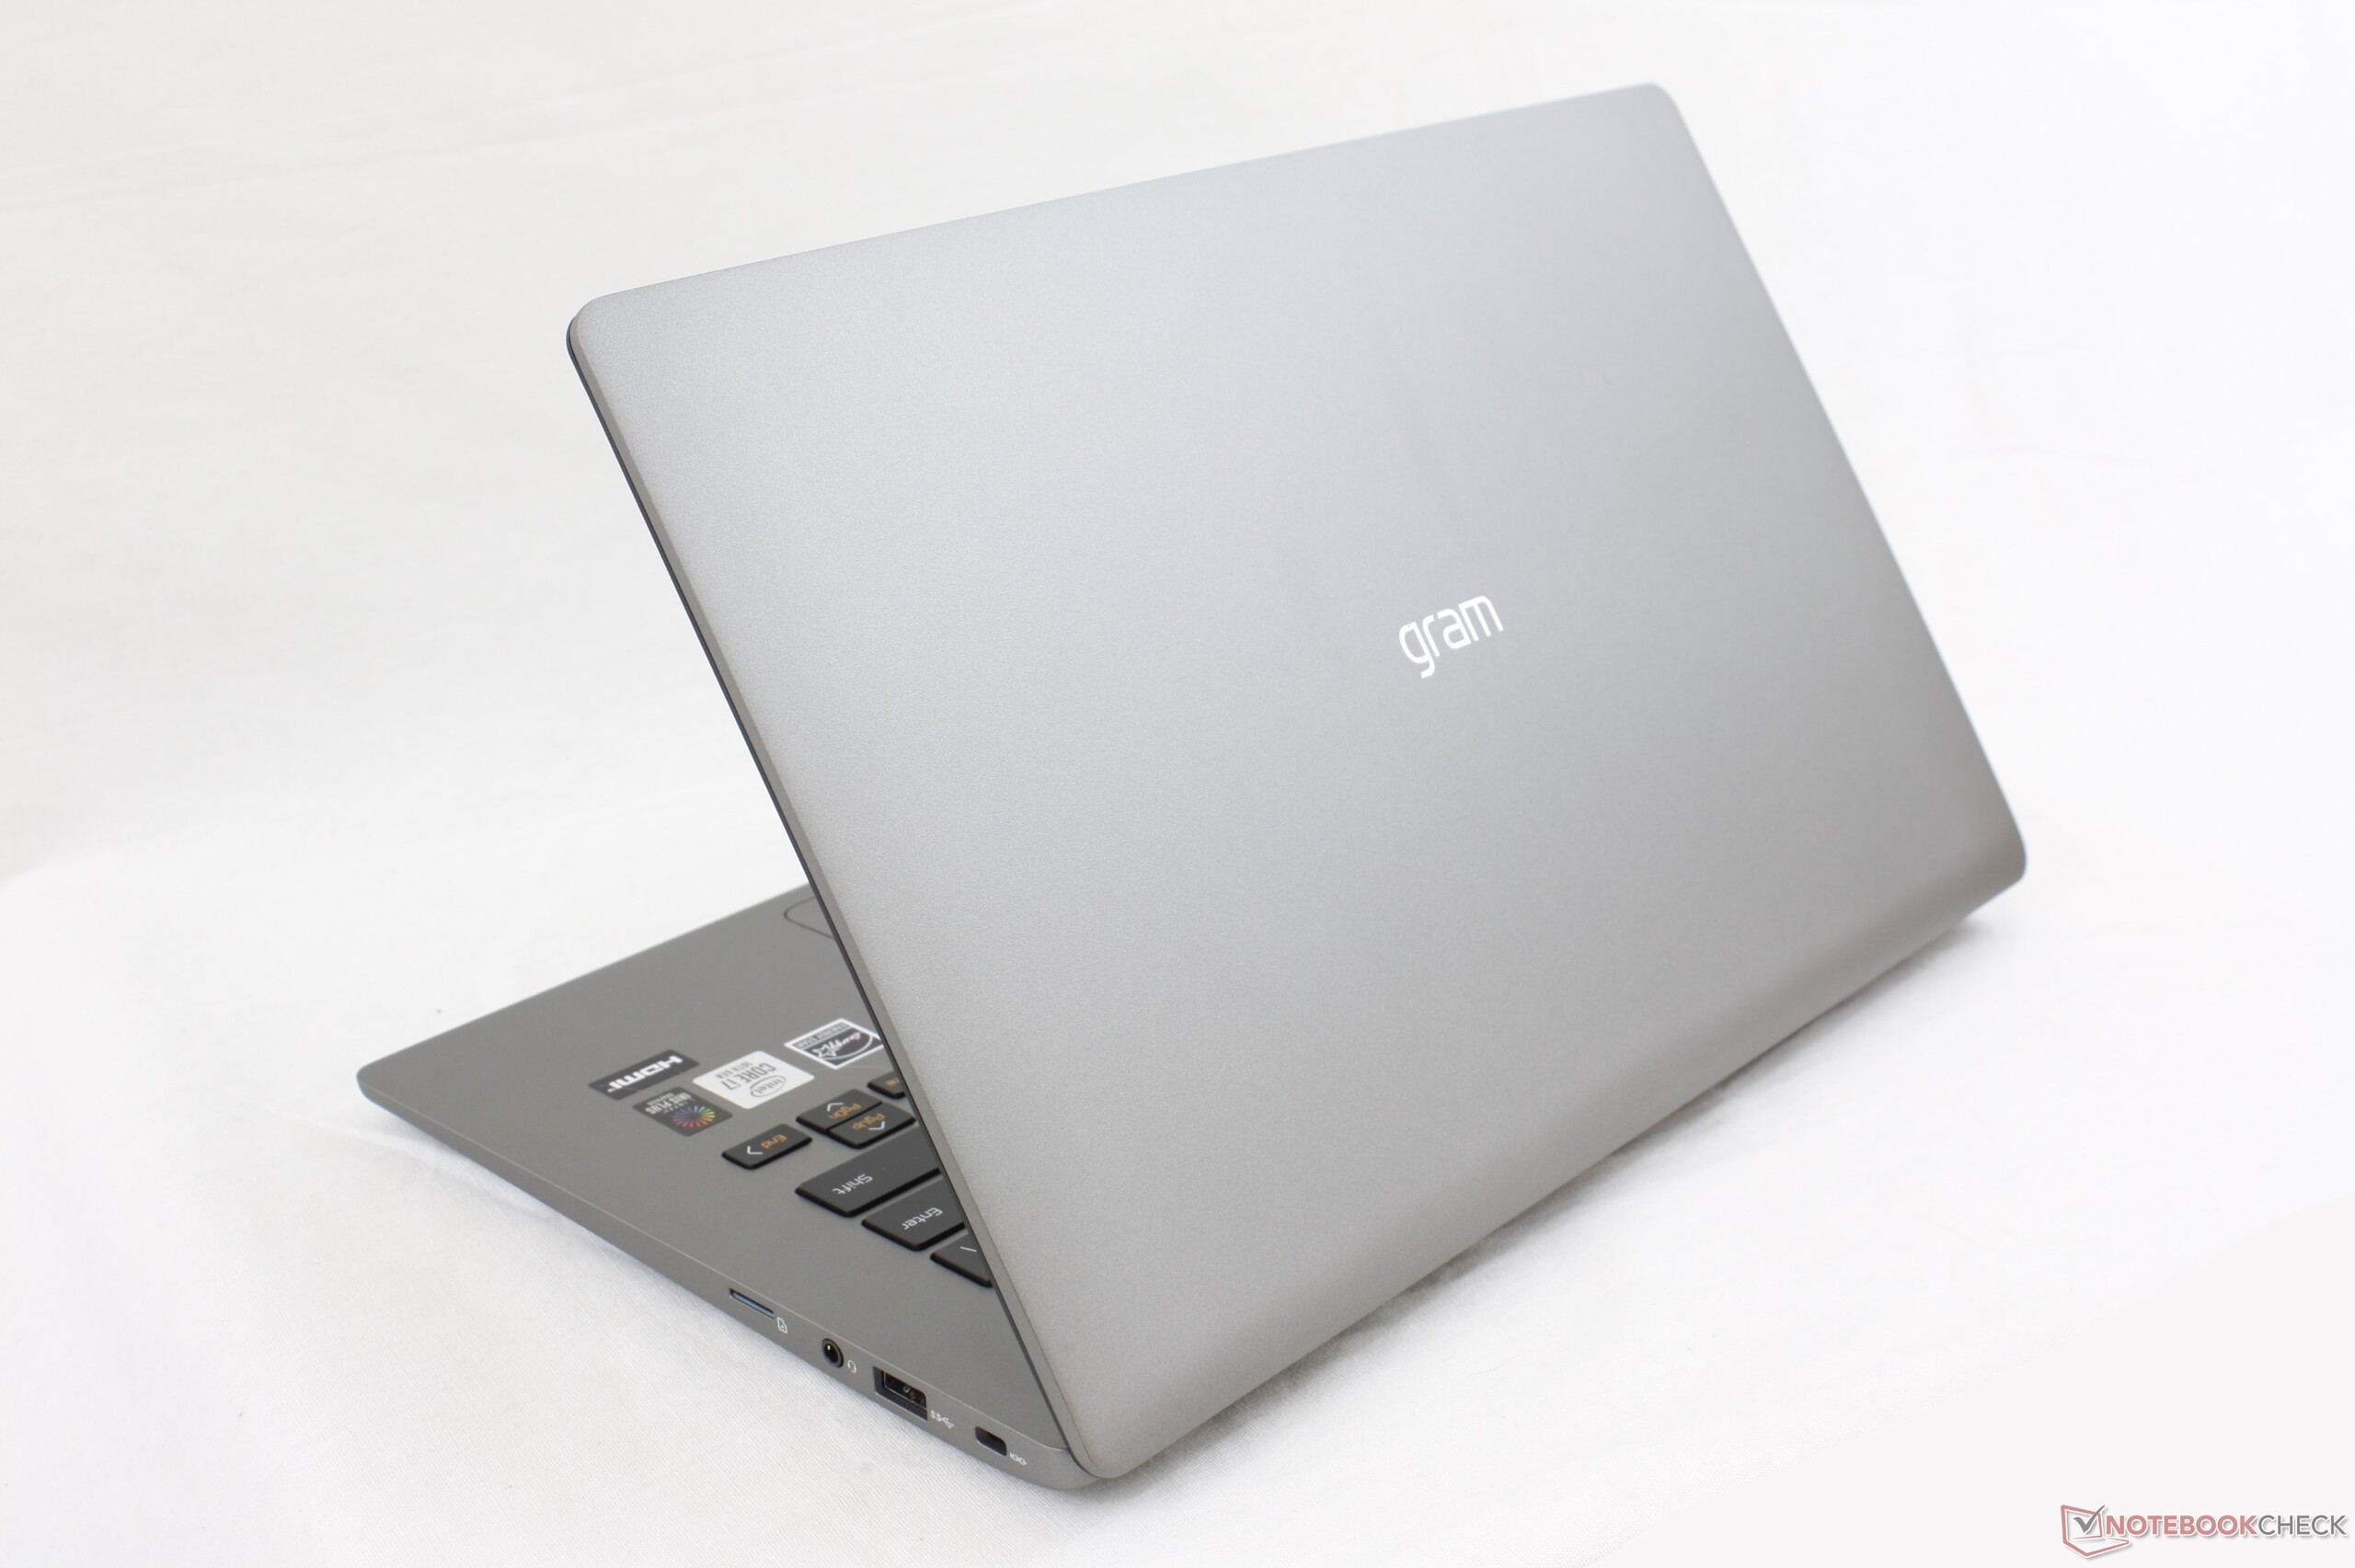
As principais vantagens do Gram foram, felizmente, transferidas para tornar o pacote geral ainda atraente. As opções super leves, ampla variedade de portas, ventilador silencioso, tela nítida e bem calibrada e duração de bateria extralonga são todas representativas do alto preço pedido de ~$1,500 USD. Se você está procurando por mais poder de CPU e GPU, entretanto, alternativas da Dell, HP, Lenovo ou Asus seriam sua melhor aposta.
Ótimo para tarefas de escritório leves a moderadas, especialmente em movimento. O LG Gram 14 é bastante versátil considerando o peso leve, mas não o sobrecarregue com aplicações exigentes, pois o desempenho da CPU está bem abaixo da média para um Core i7 classe U.
LG Gram 14Z90N
- 05/16/2020 v7 (old)
Allen Ngo
Price comparison
