Breve Análise do Smartphone Sony Xperia XZ3
| Networking | |
| iperf3 transmit AX12 | |
| LG G7 ThinQ | |
| HTC U12 Plus | |
| Sony Xperia XZ3 | |
| Apple iPhone X | |
| Asus ZenFone 3 Deluxe ZS570KL | |
| iperf3 receive AX12 | |
| Apple iPhone X | |
| LG G7 ThinQ | |
| Sony Xperia XZ3 | |
| HTC U12 Plus | |
| Asus ZenFone 3 Deluxe ZS570KL | |


| |||||||||||||||||||||||||
iluminação: 92 %
iluminação com acumulador: 361 cd/m²
Contraste: ∞:1 (Preto: 0 cd/m²)
ΔE ColorChecker Calman: 6.6 | ∀{0.5-29.43 Ø4.71}
ΔE Greyscale Calman: 4.7 | ∀{0.09-98 Ø4.96}
100% sRGB (Calman 2D)
Gamma: 1.835
CCT: 6817 K
| Sony Xperia XZ3 OLED, 2880x1440, 6" | HTC U12 Plus Super LCD 6, 2880x1440, 6" | Asus ZenFone 3 Deluxe ZS570KL AMOLED, 1920x1080, 5.7" | LG G7 ThinQ IPS, 3120x1440, 6.1" | Apple iPhone X Super AMOLED, 2436x1125, 5.8" | |
|---|---|---|---|---|---|
| Screen | 28% | 15% | 26% | 41% | |
| Brightness middle (cd/m²) | 543 | 395 -27% | 464 -15% | 974 79% | 600 10% |
| Brightness (cd/m²) | 542 | 402 -26% | 468 -14% | 975 80% | 606 12% |
| Brightness Distribution (%) | 92 | 90 -2% | 85 -8% | 96 4% | 94 2% |
| Black Level * (cd/m²) | 0.37 | 0.49 | |||
| Colorchecker dE 2000 * | 6.6 | 1.6 76% | 3.2 52% | 5.4 18% | 1.2 82% |
| Colorchecker dE 2000 max. * | 11 | 3.4 69% | 10.5 5% | 13.1 -19% | 3 73% |
| Greyscale dE 2000 * | 4.7 | 1.1 77% | 1.4 70% | 5 -6% | 1.6 66% |
| Gamma | 1.835 120% | 2.14 103% | 2.27 97% | 2.31 95% | 2.23 99% |
| CCT | 6817 95% | 6536 99% | 6590 99% | 7480 87% | 6707 97% |
| Contrast (:1) | 1068 | 1988 |
* ... menor é melhor
Cintilação da tela / PWM (modulação por largura de pulso)
| Tela tremeluzindo/PWM detectado | 240.4 Hz | 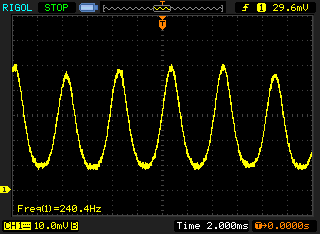 | |
A luz de fundo da tela pisca em 240.4 Hz (pior caso, por exemplo, utilizando PWM) . A frequência de 240.4 Hz é relativamente baixa, portanto, usuários sensíveis provavelmente notarão cintilação e sentirão fadiga ocular na configuração de brilho indicada e abaixo. [pwm_comparison] Em comparação: 52 % de todos os dispositivos testados não usam PWM para escurecer a tela. Se PWM foi detectado, uma média de 7741 (mínimo: 5 - máximo: 343500) Hz foi medida. | |||
Exibir tempos de resposta
| ↔ Tempo de resposta preto para branco | ||
|---|---|---|
| 8 ms ... ascensão ↗ e queda ↘ combinadas | ↗ 5 ms ascensão | 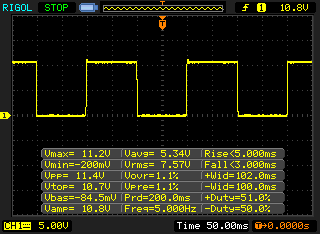 |
| ↘ 3 ms queda | ||
| A tela mostra taxas de resposta rápidas em nossos testes e deve ser adequada para jogos. Em comparação, todos os dispositivos testados variam de 0.1 (mínimo) a 240 (máximo) ms. » 22 % de todos os dispositivos são melhores. Isso significa que o tempo de resposta medido é melhor que a média de todos os dispositivos testados (19.8 ms). | ||
| ↔ Tempo de resposta 50% cinza a 80% cinza | ||
| 8 ms ... ascensão ↗ e queda ↘ combinadas | ↗ 5 ms ascensão | 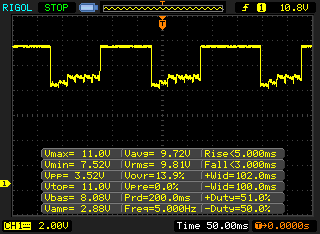 |
| ↘ 3 ms queda | ||
| A tela mostra taxas de resposta rápidas em nossos testes e deve ser adequada para jogos. Em comparação, todos os dispositivos testados variam de 0.165 (mínimo) a 636 (máximo) ms. » 21 % de todos os dispositivos são melhores. Isso significa que o tempo de resposta medido é melhor que a média de todos os dispositivos testados (30.9 ms). | ||
| PCMark for Android - Work performance score (classificar por valor) | |
| Sony Xperia XZ3 | |
| HTC U12 Plus | |
| Asus ZenFone 3 Deluxe ZS570KL | |
| LG G7 ThinQ | |
| Média Qualcomm Snapdragon 845 (7998 - 13211, n=26) | |
| AnTuTu v7 - Total Score (classificar por valor) | |
| Sony Xperia XZ3 | |
| HTC U12 Plus | |
| LG G7 ThinQ | |
| Apple iPhone X | |
| Média Qualcomm Snapdragon 845 (246366 - 299878, n=27) | |
| AnTuTu v6 - Total Score (classificar por valor) | |
| Sony Xperia XZ3 | |
| HTC U12 Plus | |
| Asus ZenFone 3 Deluxe ZS570KL | |
| LG G7 ThinQ | |
| Apple iPhone X | |
| Média Qualcomm Snapdragon 845 (162183 - 242953, n=23) | |
| JetStream 1.1 - 1.1 Total | |
| Apple iPhone X (IOS 11.1.1) | |
| LG G7 ThinQ (Chrome 66) | |
| Sony Xperia XZ3 (Chrome 70) | |
| HTC U12 Plus (Chrome 66) | |
| Média Qualcomm Snapdragon 845 (22.5 - 90.9, n=25) | |
| Asus ZenFone 3 Deluxe ZS570KL (Chrome 55) | |
| Octane V2 - Total Score | |
| Média da turma Smartphone (2800 - 126661, n=140, últimos 2 anos) | |
| Apple iPhone X (IOS 11.1.2) | |
| Sony Xperia XZ3 (Chrome 70) | |
| LG G7 ThinQ (Chrome 66) | |
| HTC U12 Plus (Chrome 66) | |
| Média Qualcomm Snapdragon 845 (3991 - 18275, n=28) | |
| Asus ZenFone 3 Deluxe ZS570KL (Chrome 55) | |
| Mozilla Kraken 1.1 - Total | |
| Média Qualcomm Snapdragon 845 (2154 - 11204, n=28) | |
| LG G7 ThinQ (Chrome 66) | |
| HTC U12 Plus (Chrome 66) | |
| Asus ZenFone 3 Deluxe ZS570KL (Chrome 55) | |
| Sony Xperia XZ3 (Chrome 70) | |
| Média da turma Smartphone (257 - 28190, n=119, últimos 2 anos) | |
| Apple iPhone X (IOS 11.1.2) | |
| WebXPRT 3 - Overall | |
| Média da turma Smartphone (104 - 380, n=12, últimos 2 anos) | |
| Apple iPhone X (Safari Mobile 11.3) | |
| HTC U12 Plus (Chrome 66) | |
| Sony Xperia XZ3 (Chrome 70) | |
| LG G7 ThinQ (Chrome 66) | |
| Média Qualcomm Snapdragon 845 (19 - 103, n=17) | |
| WebXPRT 2015 - Overall | |
| Apple iPhone X (Safari Mobile 11.0) | |
| HTC U12 Plus (Chrome 66) | |
| LG G7 ThinQ (Chrome 66) | |
| Média Qualcomm Snapdragon 845 (96 - 291, n=23) | |
| Sony Xperia XZ3 (Chrome 70) | |
| Asus ZenFone 3 Deluxe ZS570KL (Chrome 55) | |
* ... menor é melhor
| Sony Xperia XZ3 | HTC U12 Plus | Asus ZenFone 3 Deluxe ZS570KL | LG G7 ThinQ | Média 64 GB UFS 2.1 Flash | Média da turma Smartphone | |
|---|---|---|---|---|---|---|
| AndroBench 3-5 | 103% | 17% | 39% | 79% | 689% | |
| Sequential Read 256KB (MB/s) | 681 | 709 4% | 409 -40% | 695 2% | 696 ? 2% | 2236 ? 228% |
| Sequential Write 256KB (MB/s) | 196.1 | 195.8 0% | 163.1 -17% | 176.4 -10% | 224 ? 14% | 1921 ? 880% |
| Random Read 4KB (MB/s) | 135.7 | 118.1 -13% | 100.9 -26% | 110.5 -19% | 137.2 ? 1% | 311 ? 129% |
| Random Write 4KB (MB/s) | 22.22 | 104.2 369% | 14.55 -35% | 23.26 5% | 84.7 ? 281% | 360 ? 1520% |
| Sequential Read 256KB SDCard (MB/s) | 34.2 ? | 84.3 ? 146% | 77.8 ? 127% | 84.7 ? 148% | 68.6 ? 101% | |
| Sequential Write 256KB SDCard (MB/s) | 30.4 ? | 63.6 ? 109% | 59 ? 94% | 62.7 ? 106% | 52.2 ? 72% |
| Arena of Valor | |||
| Configurações | Valor | ||
| min | 60 fps | ||
| high HD | 60 fps | ||
| Asphalt 9: Legends | |||
| Configurações | Valor | ||
| High Quality | 30 fps | ||
| Standard / low | 30 fps | ||
(±) A temperatura máxima no lado superior é 41.5 °C / 107 F, em comparação com a média de 35.3 °C / 96 F , variando de 21.9 a 247 °C para a classe Smartphone.
(±) A parte inferior aquece até um máximo de 42.6 °C / 109 F, em comparação com a média de 34 °C / 93 F
(+) Em uso inativo, a temperatura média para o lado superior é 27.9 °C / 82 F, em comparação com a média do dispositivo de 33 °C / ### class_avg_f### F.
Sony Xperia XZ3 análise de áudio
(±) | o volume do alto-falante é médio, mas bom (###valor### dB)
Graves 100 - 315Hz
(-) | quase nenhum baixo - em média 23.4% menor que a mediana
(±) | a linearidade dos graves é média (8.9% delta para a frequência anterior)
Médios 400 - 2.000 Hz
(±) | médios mais altos - em média 6.5% maior que a mediana
(±) | a linearidade dos médios é média (7.9% delta para frequência anterior)
Altos 2 - 16 kHz
(+) | agudos equilibrados - apenas 3.8% longe da mediana
(±) | a linearidade dos máximos é média (7.5% delta para frequência anterior)
Geral 100 - 16.000 Hz
(±) | a linearidade do som geral é média (22.9% diferença em relação à mediana)
Comparado com a mesma classe
» 51% de todos os dispositivos testados nesta classe foram melhores, 7% semelhantes, 42% piores
» O melhor teve um delta de 11%, a média foi 34%, o pior foi 134%
Comparado com todos os dispositivos testados
» 68% de todos os dispositivos testados foram melhores, 6% semelhantes, 26% piores
» O melhor teve um delta de 4%, a média foi 23%, o pior foi 134%
Apple iPhone X análise de áudio
(+) | os alto-falantes podem tocar relativamente alto (###valor### dB)
Graves 100 - 315Hz
(±) | graves reduzidos - em média 14.9% menor que a mediana
(±) | a linearidade dos graves é média (9.4% delta para a frequência anterior)
Médios 400 - 2.000 Hz
(+) | médios equilibrados - apenas 3.4% longe da mediana
(+) | médios são lineares (5.1% delta para frequência anterior)
Altos 2 - 16 kHz
(±) | máximos mais altos - em média 7.3% maior que a mediana
(+) | os máximos são lineares (4.6% delta da frequência anterior)
Geral 100 - 16.000 Hz
(±) | a linearidade do som geral é média (19% diferença em relação à mediana)
Comparado com a mesma classe
» 24% de todos os dispositivos testados nesta classe foram melhores, 9% semelhantes, 66% piores
» O melhor teve um delta de 11%, a média foi 34%, o pior foi 134%
Comparado com todos os dispositivos testados
» 45% de todos os dispositivos testados foram melhores, 7% semelhantes, 47% piores
» O melhor teve um delta de 4%, a média foi 23%, o pior foi 134%
| desligado | |
| Ocioso | |
| Carga |
|
Key:
min: | |
| Sony Xperia XZ3 3300 mAh | HTC U12 Plus 3500 mAh | Asus ZenFone 3 Deluxe ZS570KL 3000 mAh | LG G7 ThinQ 3000 mAh | Apple iPhone X 2716 mAh | Média Qualcomm Snapdragon 845 | Média da turma Smartphone | |
|---|---|---|---|---|---|---|---|
| Power Consumption | -44% | -18% | -35% | -34% | -28% | -33% | |
| Idle Minimum * (Watt) | 0.8 | 0.77 4% | 0.85 -6% | 1.16 -45% | 1.03 -29% | 0.862 ? -8% | 0.879 ? -10% |
| Idle Average * (Watt) | 1.2 | 2.18 -82% | 1.2 -0% | 1.98 -65% | 2.4 -100% | 1.728 ? -44% | 1.474 ? -23% |
| Idle Maximum * (Watt) | 1.5 | 2.21 -47% | 1.25 17% | 2.07 -38% | 2.6 -73% | 2.07 ? -38% | 1.663 ? -11% |
| Load Average * (Watt) | 4.8 | 6.25 -30% | 6.97 -45% | 4.51 6% | 2.96 38% | 4.87 ? -1% | 6.75 ? -41% |
| Load Maximum * (Watt) | 6.2 | 10.16 -64% | 9.74 -57% | 8.3 -34% | 6.6 -6% | 9.27 ? -50% | 11.2 ? -81% |
* ... menor é melhor
| Sony Xperia XZ3 3300 mAh | HTC U12 Plus 3500 mAh | Asus ZenFone 3 Deluxe ZS570KL 3000 mAh | LG G7 ThinQ 3000 mAh | Apple iPhone X 2716 mAh | |
|---|---|---|---|---|---|
| Duração da bateria | 14% | 21% | 54% | 19% | |
| Reader / Idle (h) | 21.2 | 24.2 14% | 23.2 9% | 27.7 31% | 21.5 1% |
| H.264 (h) | 7 | 7.7 10% | 13.3 90% | 15.1 116% | 10.6 51% |
| WiFi v1.3 (h) | 7 | 8.5 21% | 7.7 10% | 9.9 41% | 9.4 34% |
| Load (h) | 3.4 | 3.8 12% | 2.5 -26% | 4.3 26% | 3 -12% |
Pro
Contra
O Sony Xperia XZ3 é adequado para quase qualquer tarefa. O dispositivo tira boas fotos e tem um desempenho sólido do sistema. Nosso dispositivo de teste também lida bem com aplicativos e jogos complexos. O modo de uma mão é imprevisível, especialmente porque nós o ativamos com frequência enquanto pegamos o dispositivo.
O Sony Xperia XZ3 é um dispositivo carro-chefe que se sai bem contra os seus concorrentes, sem ter que saltar sobre as tendências do mercado.
No entanto, o nosso dispositivo de teste tem uma duração de bateria decepcionante, enquanto levará algum tempo para se acostumar ao posicionamento do sensor de digitais. Além disso, aconselhamos segurar o dispositivo com cuidado, pois é susceptível de escapar de suas mãos. No geral, o Xperia XZ3 é um ótimo smartphone que tem um visual e sensação diferente ao de muitos dos seus concorrentes.
Sony Xperia XZ3
- 11/18/2018 v6 (old)
Mike Wobker
Price comparison
