
Veredicto - O Galaxy Book6 Ultra é um laptop multimídia muito bom
O novo Galaxy Book6 Ultra da Samsung é um laptop multimídia muito bom com uma linda tela OLED, desempenho suficiente com o processador Panther Lake, bem como GPU Nvidia Blackwell e um excelente sistema de alto-falantes. No entanto, o novo design do chassi é muito semelhante ao MacBook Pro da Apple e não ficaríamos surpresos se muitos usuários confundissem os dois sistemas. Isso também significa que a Samsung abandonou o teclado numérico, o que pode ser um problema para alguns usuários.
O desempenho dos componentes é muito bom para um laptop multimídia e a unidade de resfriamento funciona bem. As ventoinhas serão bastante audíveis se o senhor realmente usar o laptop no modo de alto desempenho, mas ele ainda é mais silencioso do que muitos rivais. Ficamos particularmente impressionados com a nova tela touchscreen OLED, com sua incrível qualidade de imagem e perfis de cores precisos, mas a oscilação do PWM com a alta amplitude é um problema.
A tela OLED com taxa de atualização variável entre 30 e 120 Hz também é muito eficiente e resulta em excelente duração da bateria, que claramente supera todas as alternativas do Windows, apesar da menor capacidade da bateria. No entanto, se o senhor quiser mais desempenho, telas ainda melhores (painéis OLED em tandem) e teclados superiores, deve dar uma olhada no Asus ProArt P16 ou o Yoga Pro 9i 16 da Lenovo. Apple's MacBook Pro também é obviamente um rival e também oferece uma tela mais brilhante, mais portas e ventoinhas mais silenciosas. O desempenho do M4 Pro ou M4 Max também é melhor e os próximos modelos M5 Pro/M5 Max devem aumentar ainda mais a diferença.
Pro
Contra
Preço e disponibilidade
Ainda não temos informações sobre preços ou disponibilidade nos EUA.
Índice
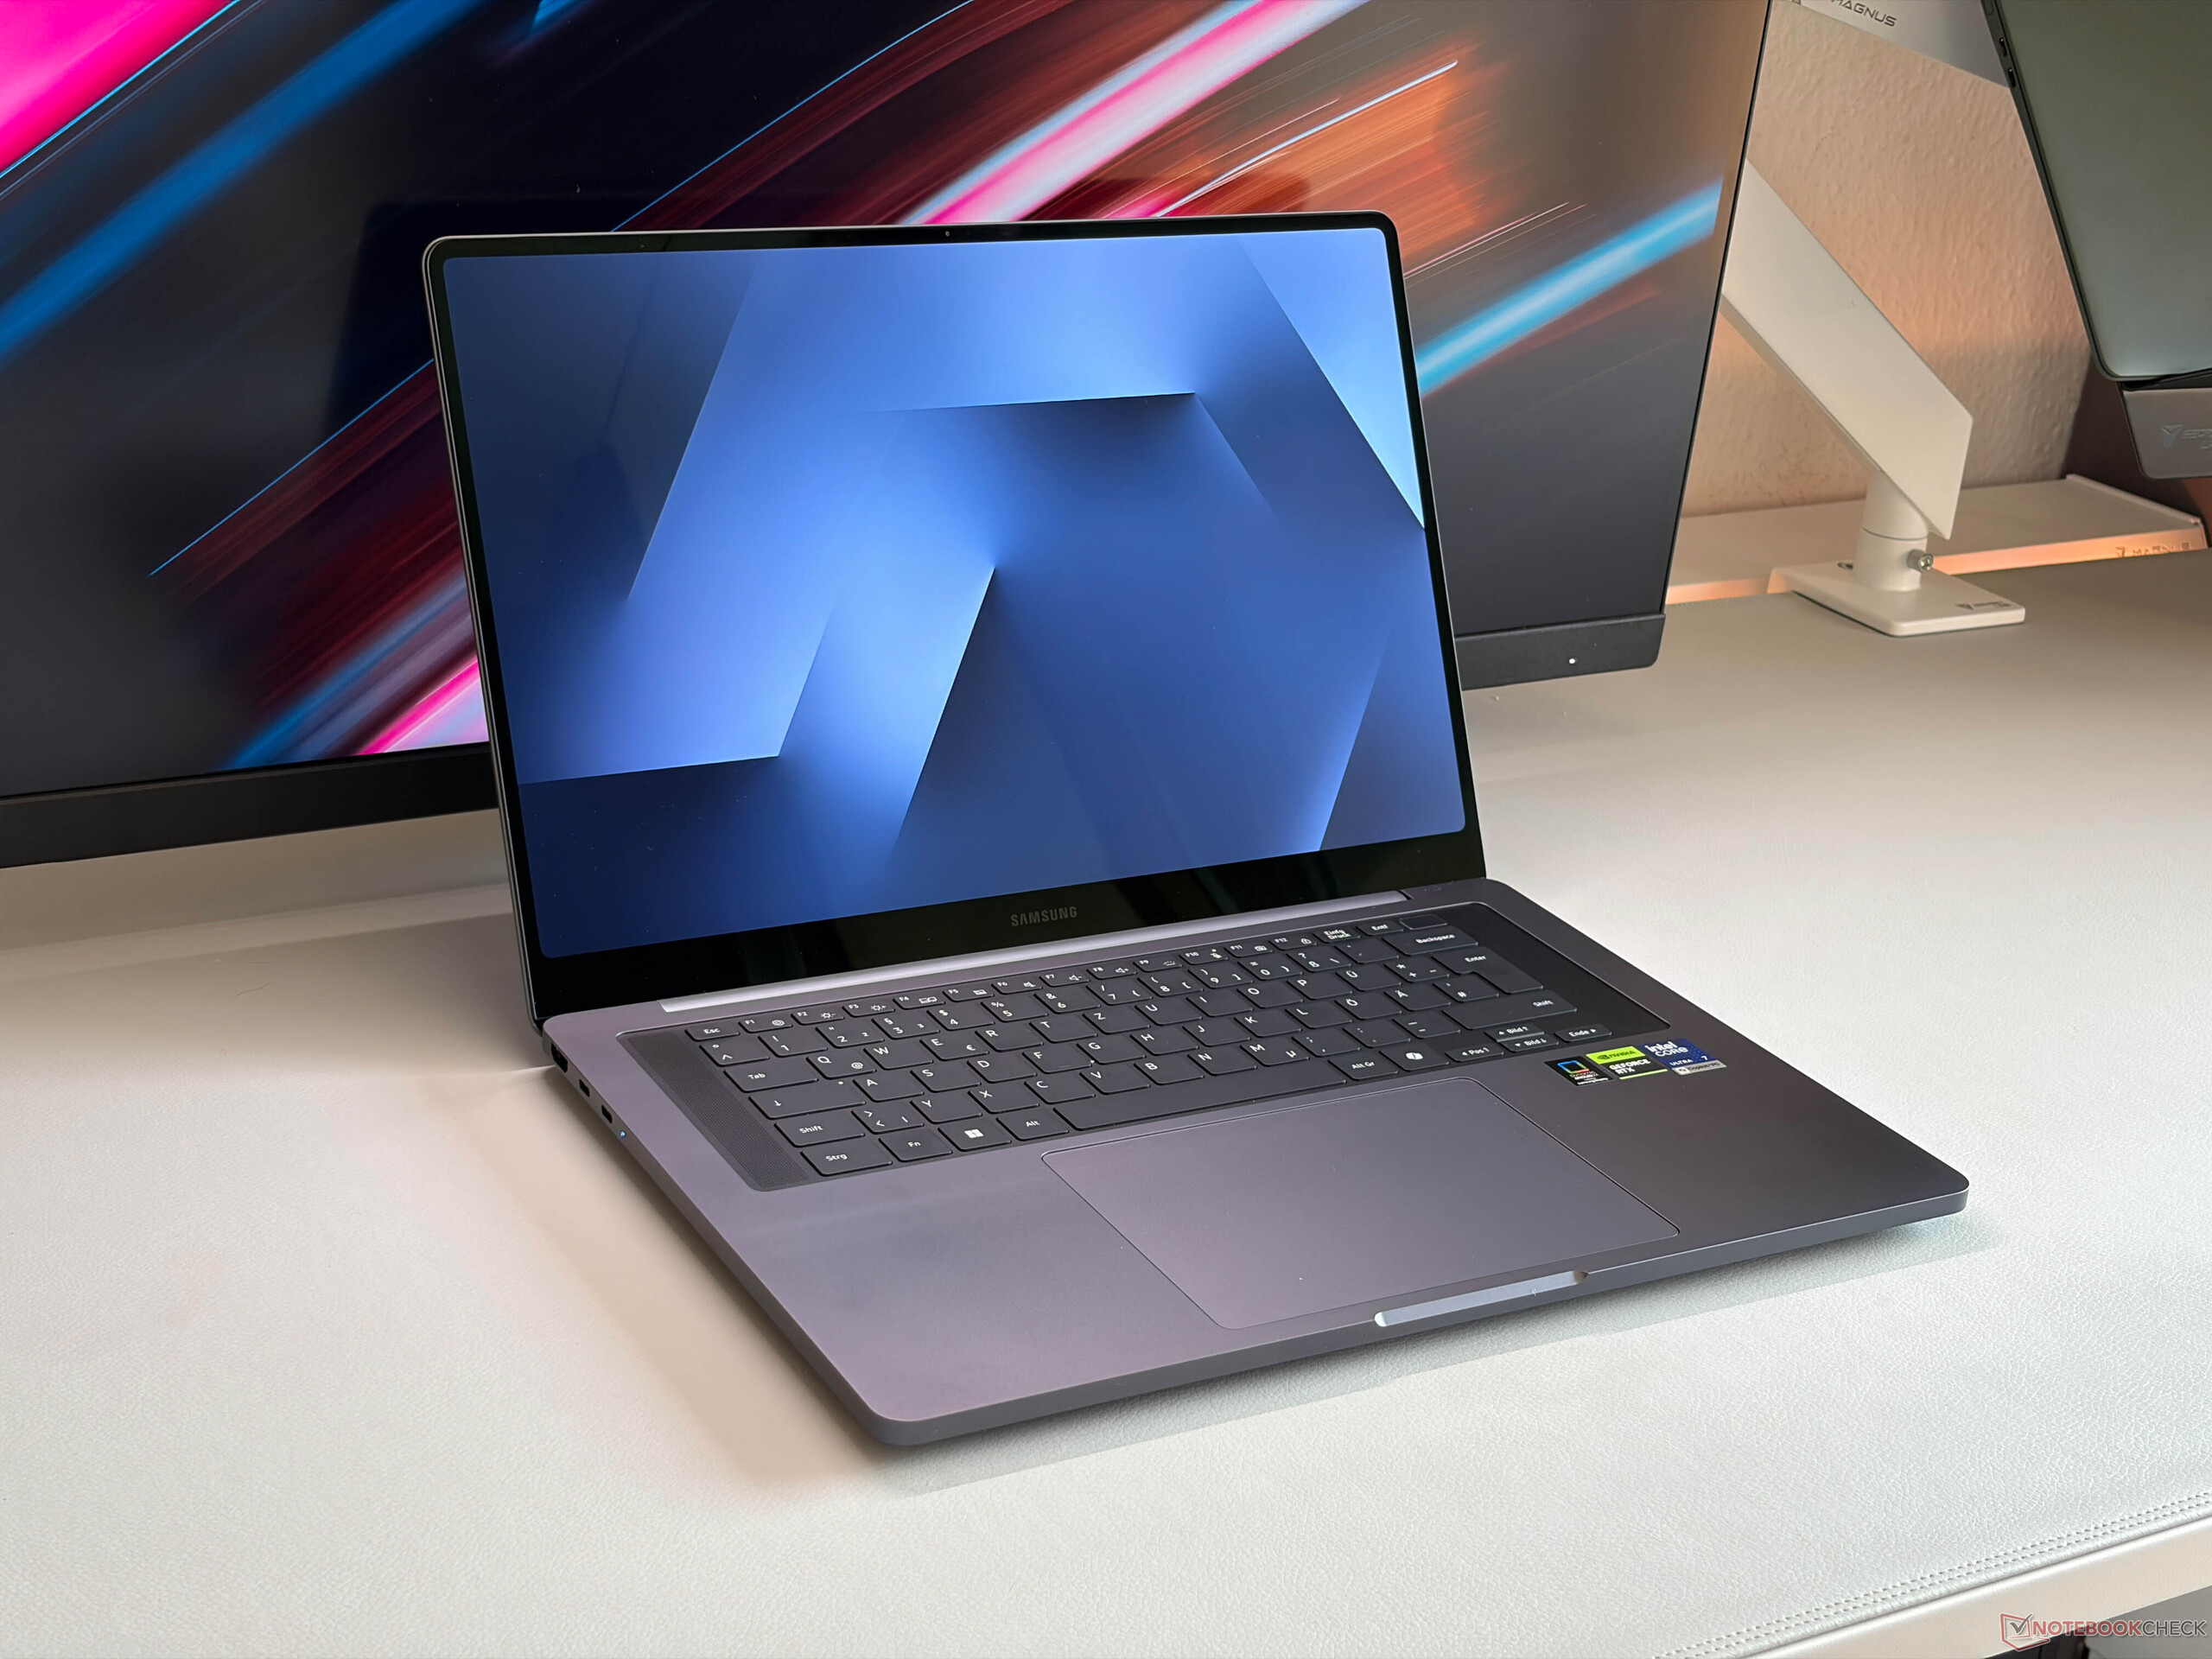
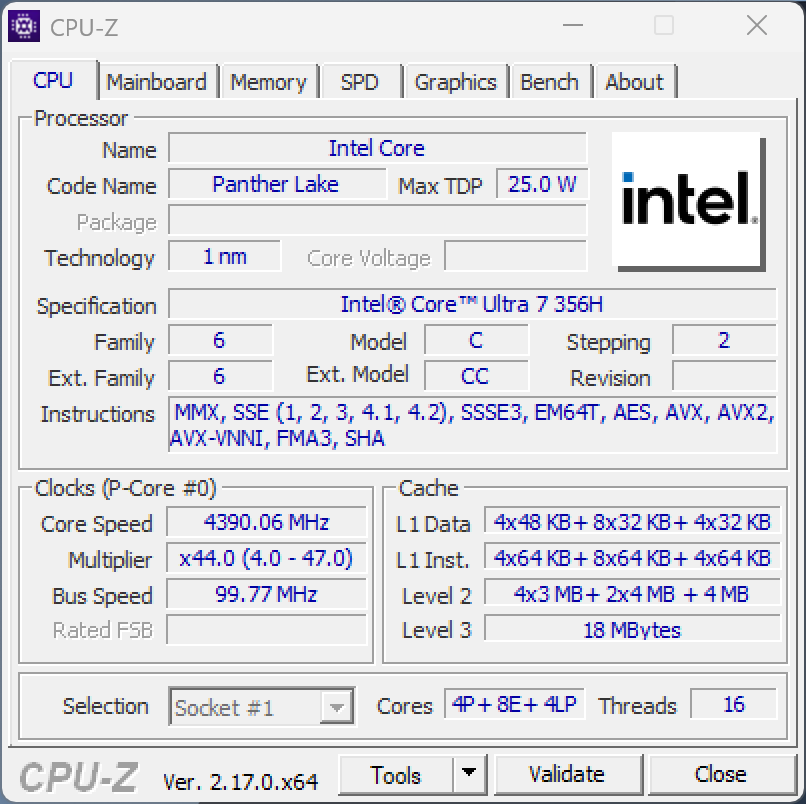
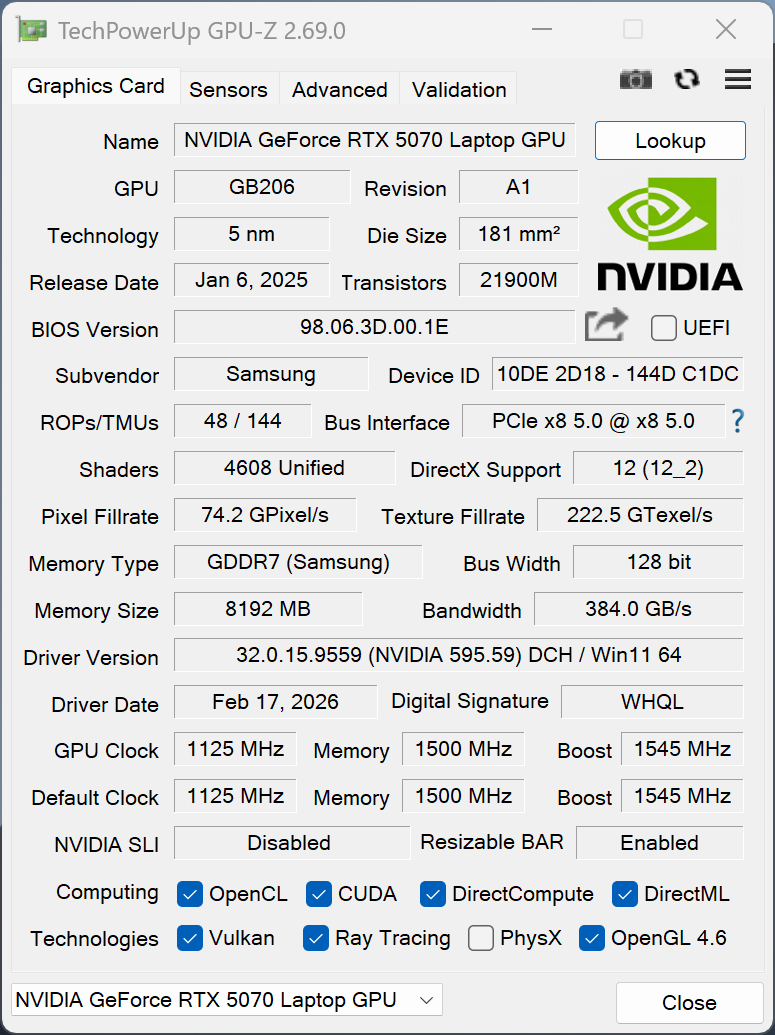
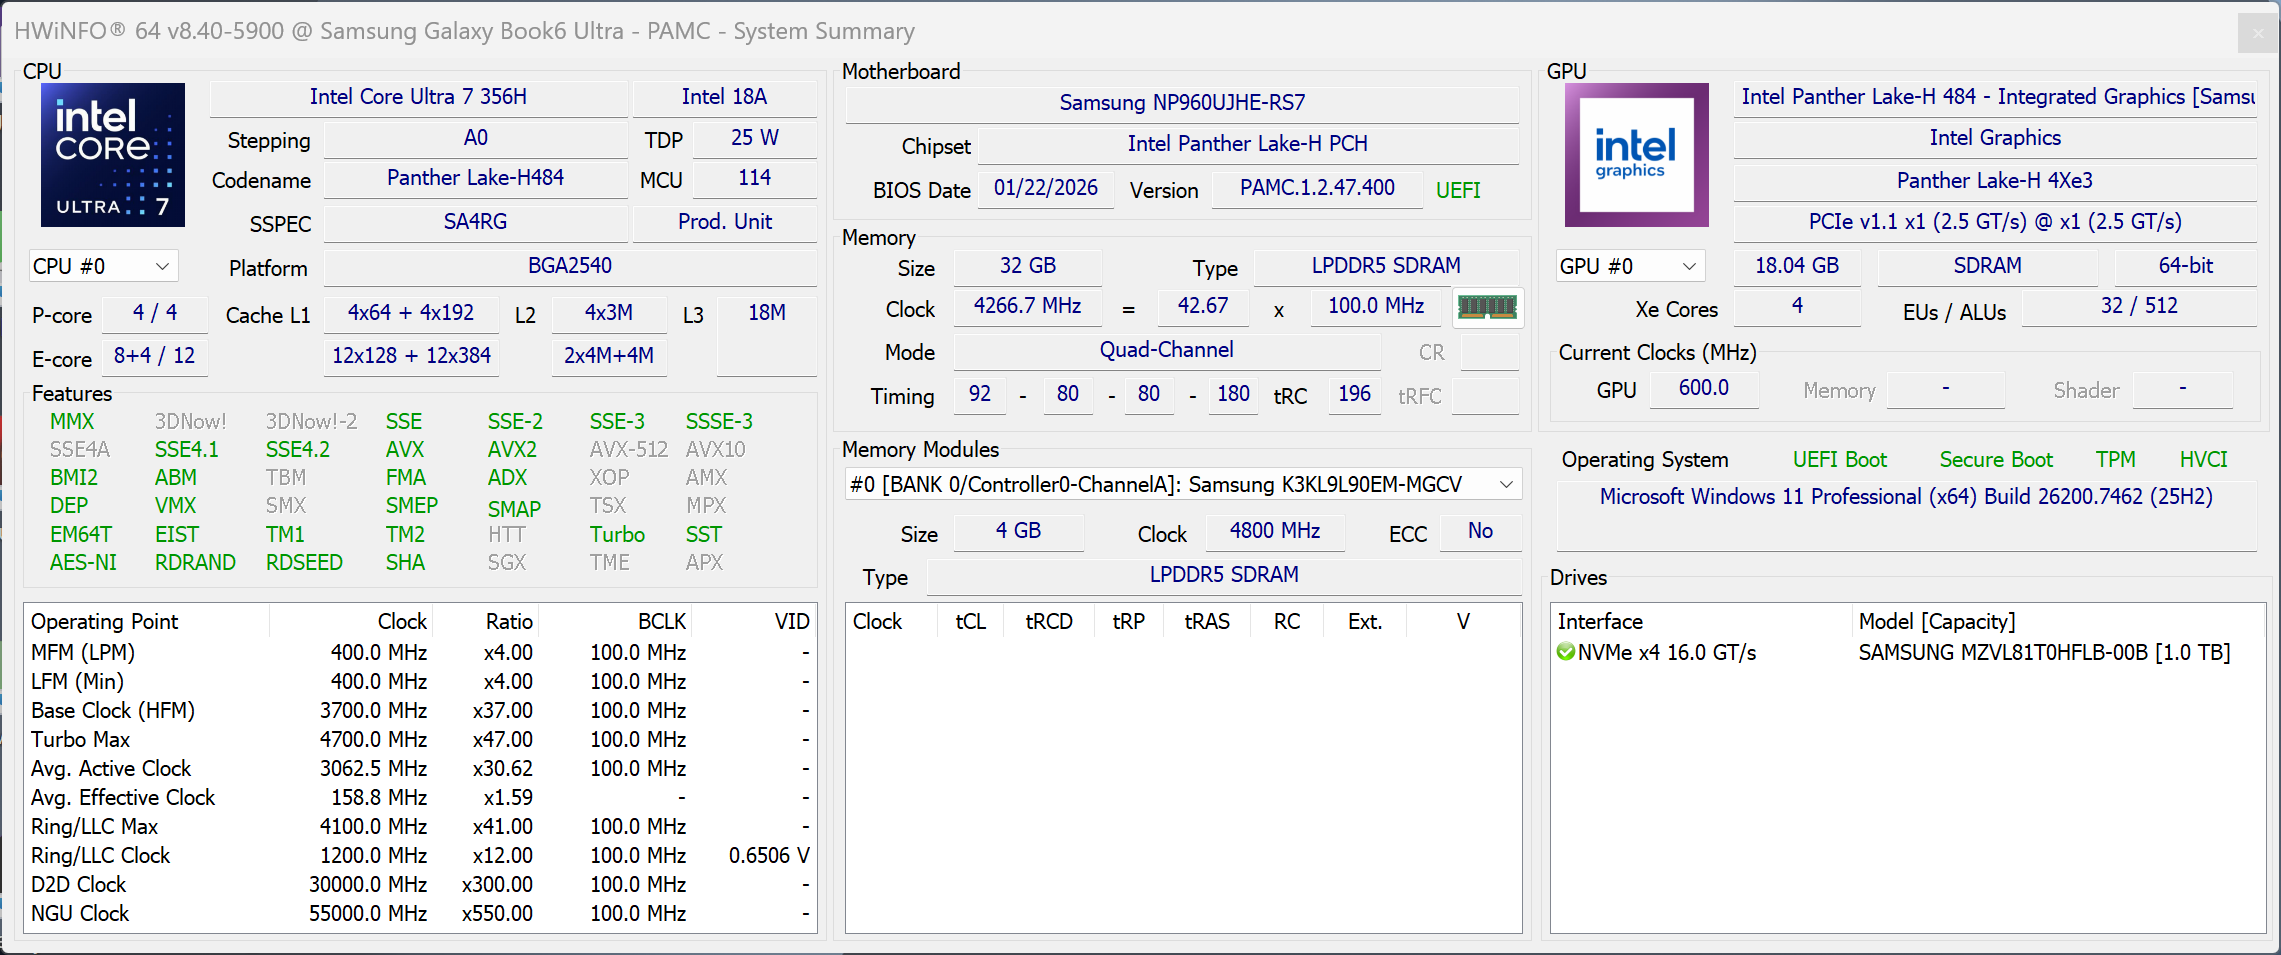
A Samsung renova seu laptop mais poderoso, o Galaxy Book6 Ultra. O dispositivo multimídia de 16 polegadas agora apresenta novos chips Intel Panther Lake, GPUs Nvidia Blackwell opcionais, bem como uma nova tela sensível ao toque OLED dentro de um chassi revisado. Analisamos o modelo com o Core Ultra 7 356H, GeForce RTX 5070, 32 GB de RAM e 1 TB de armazenamento SSD.
Especificações
Estojo e conectividade
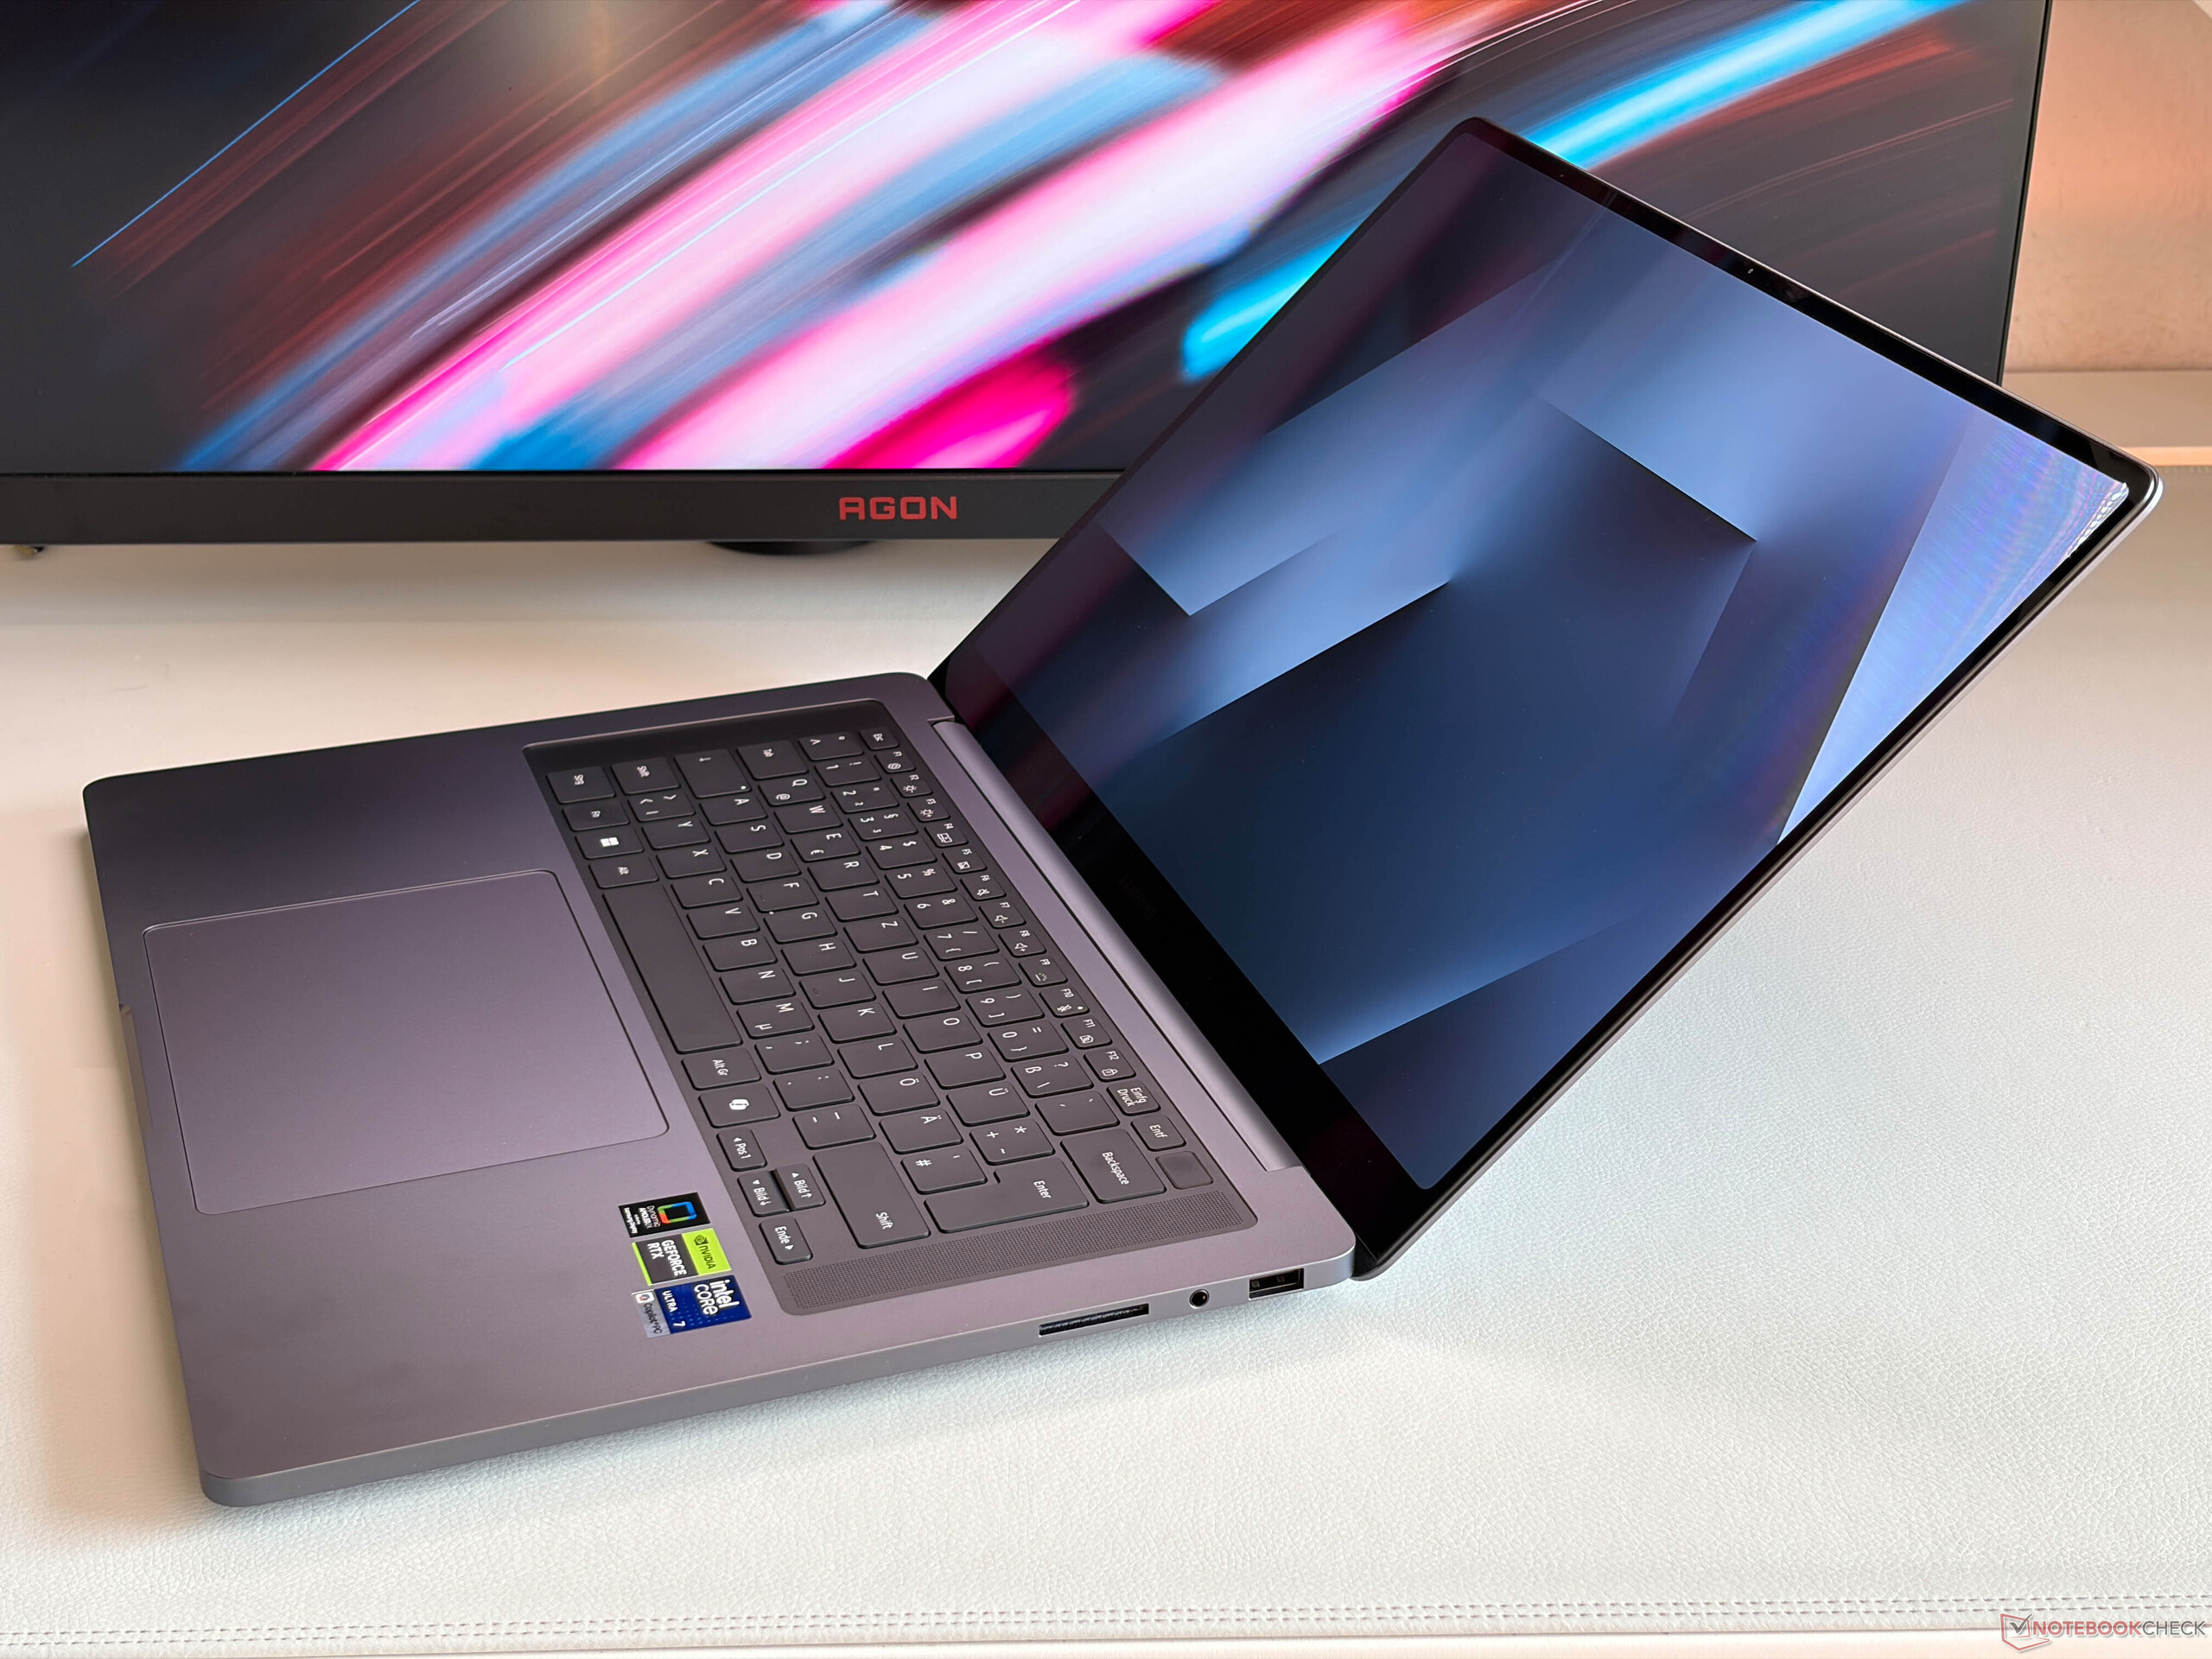
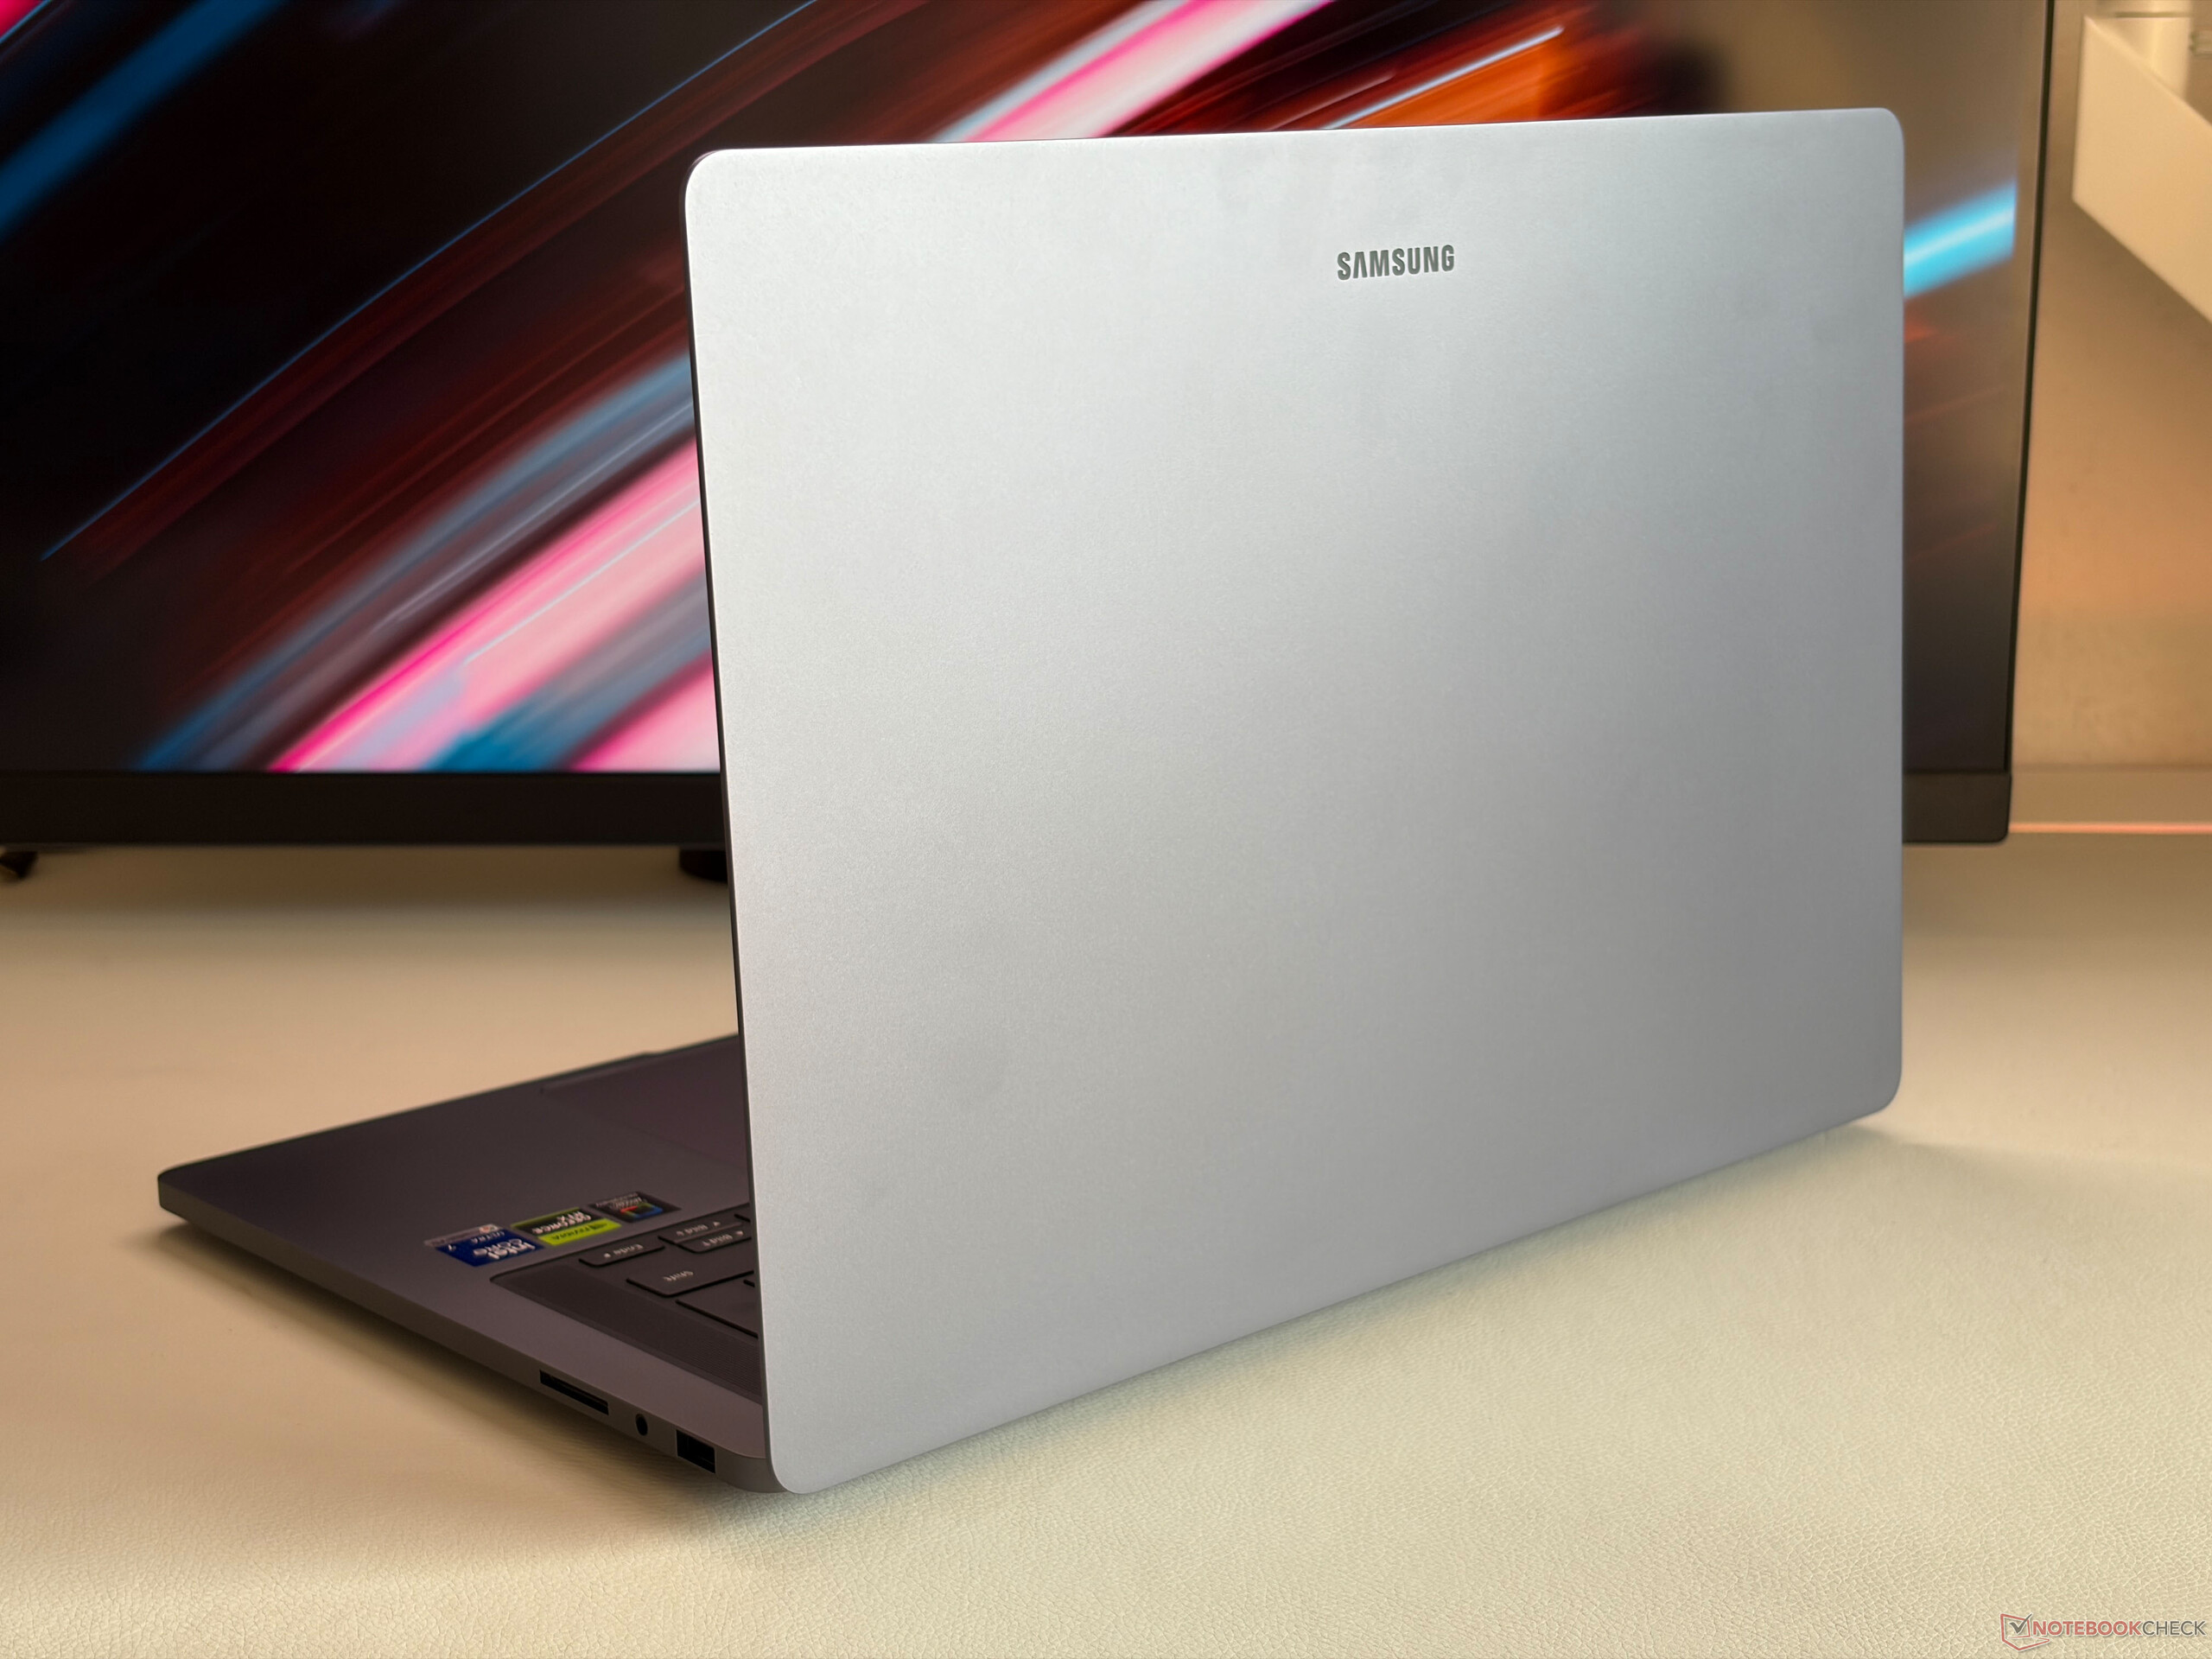
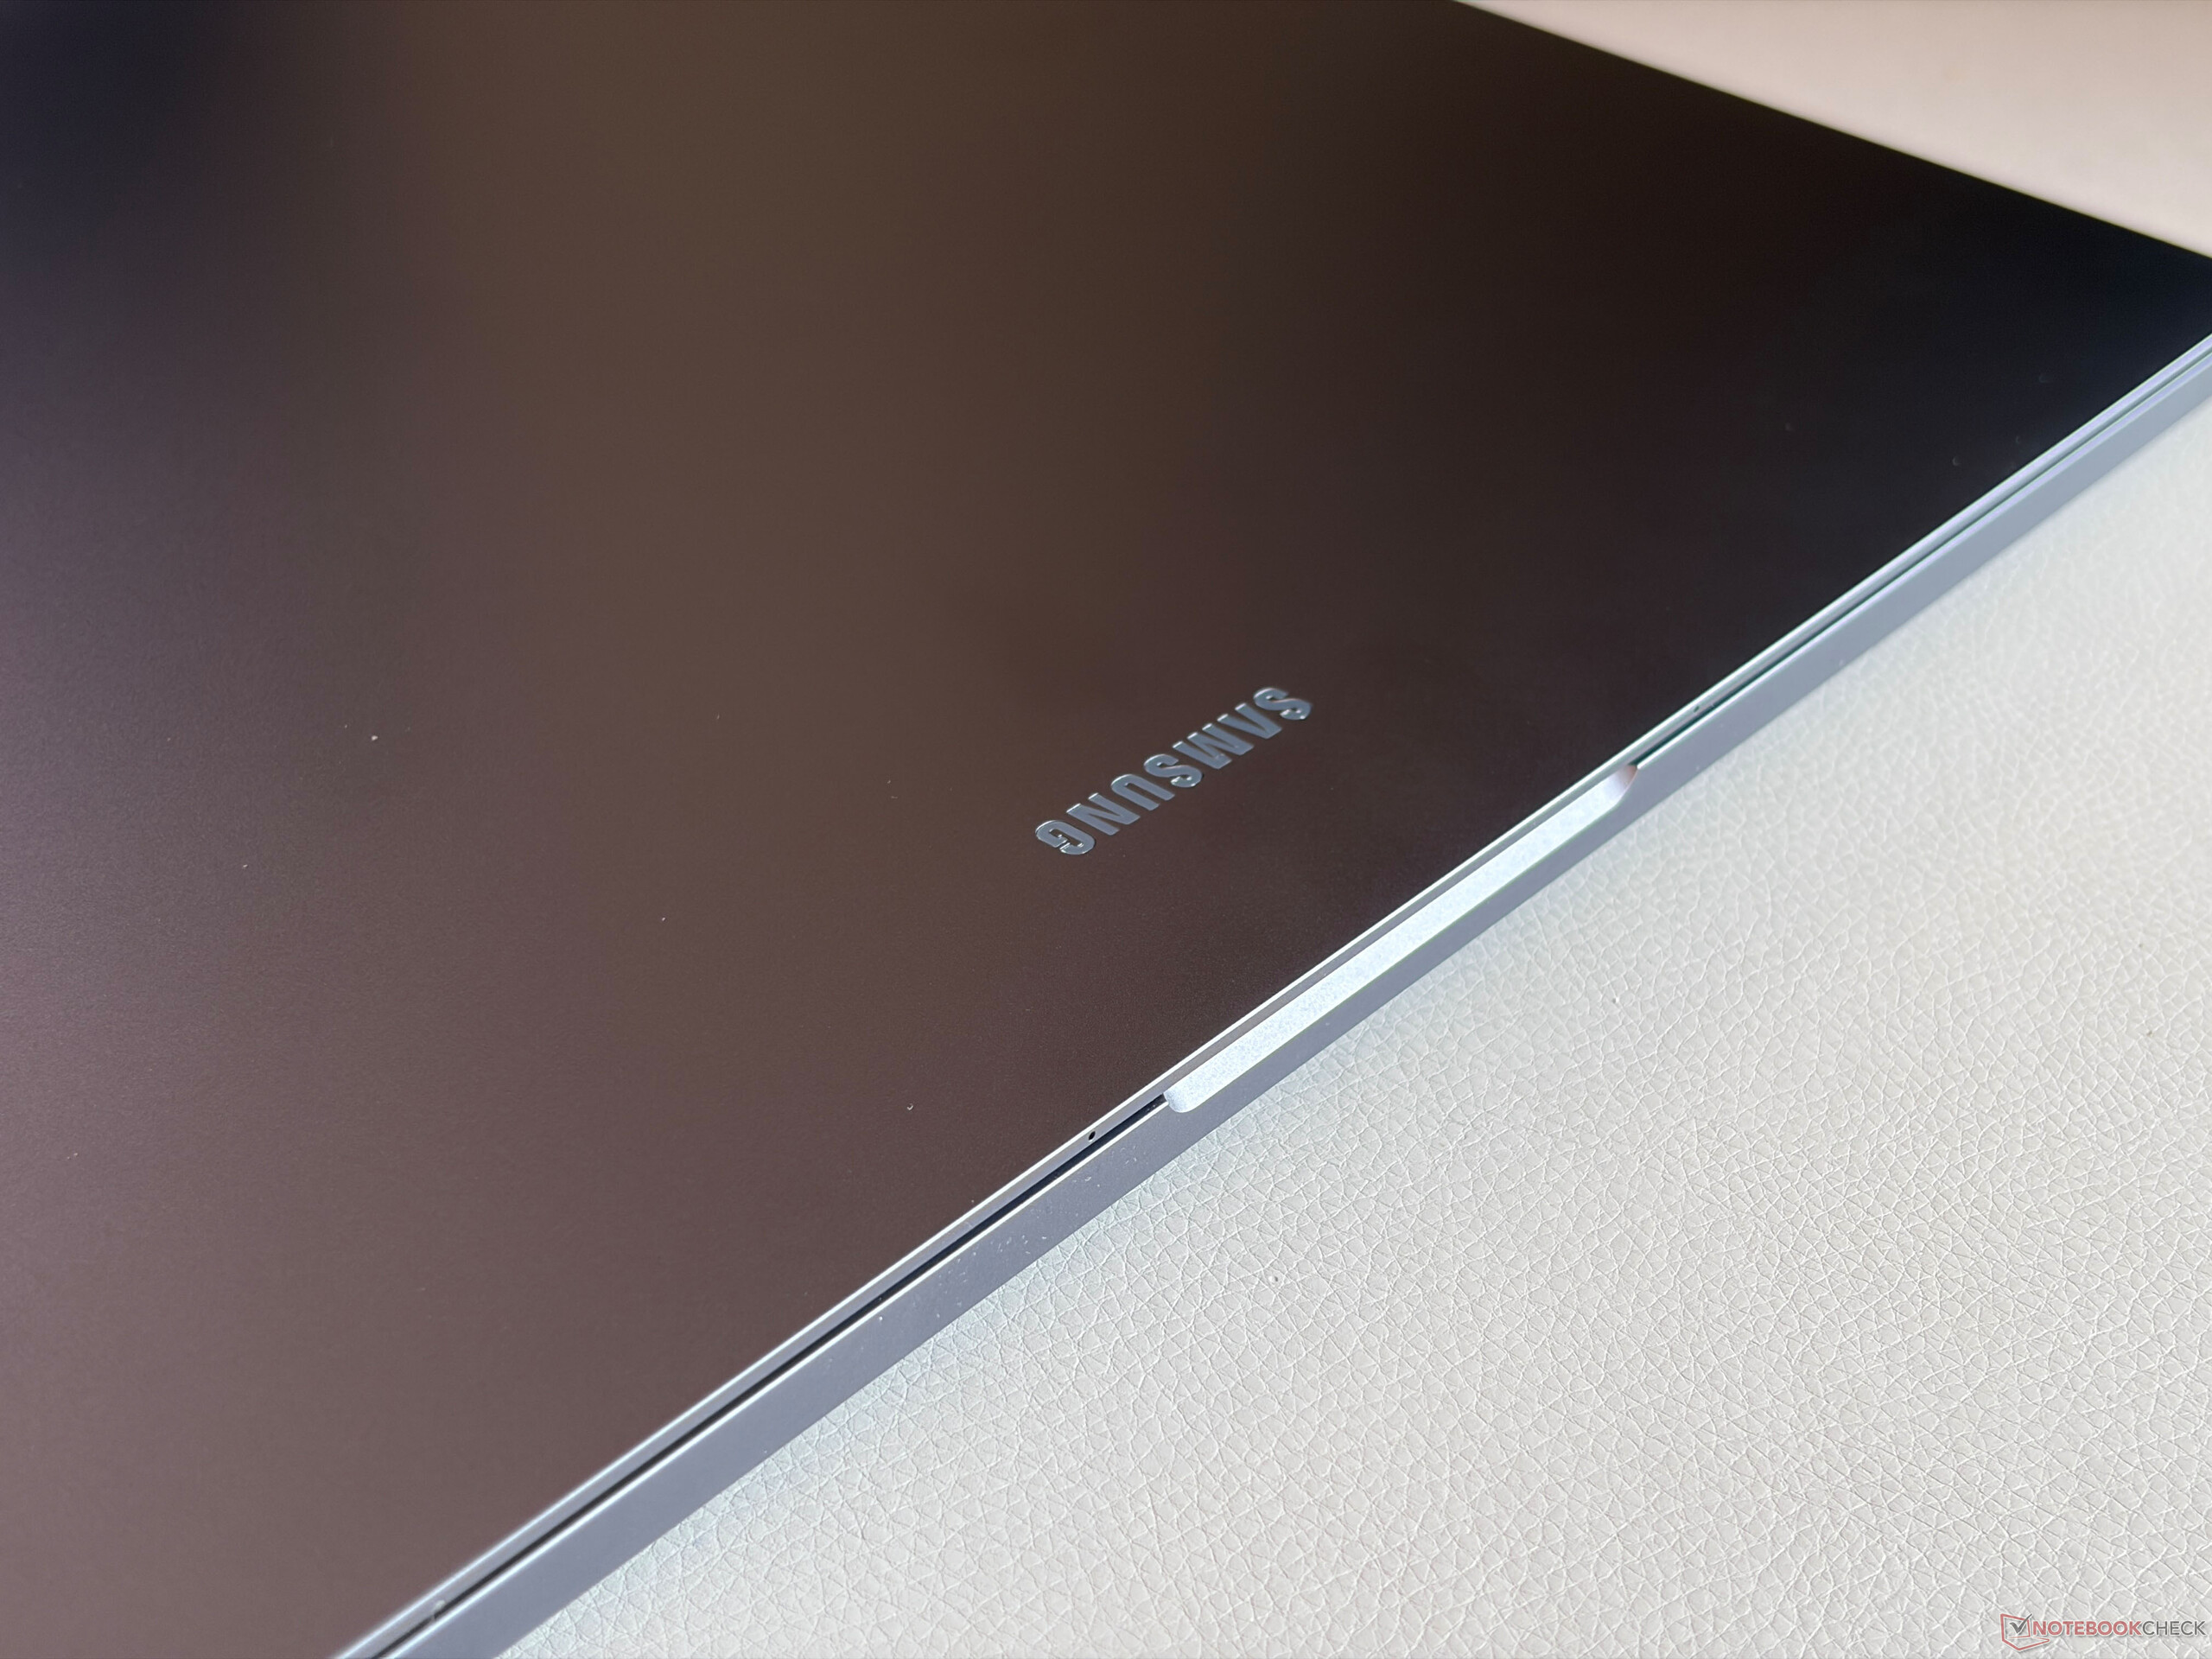
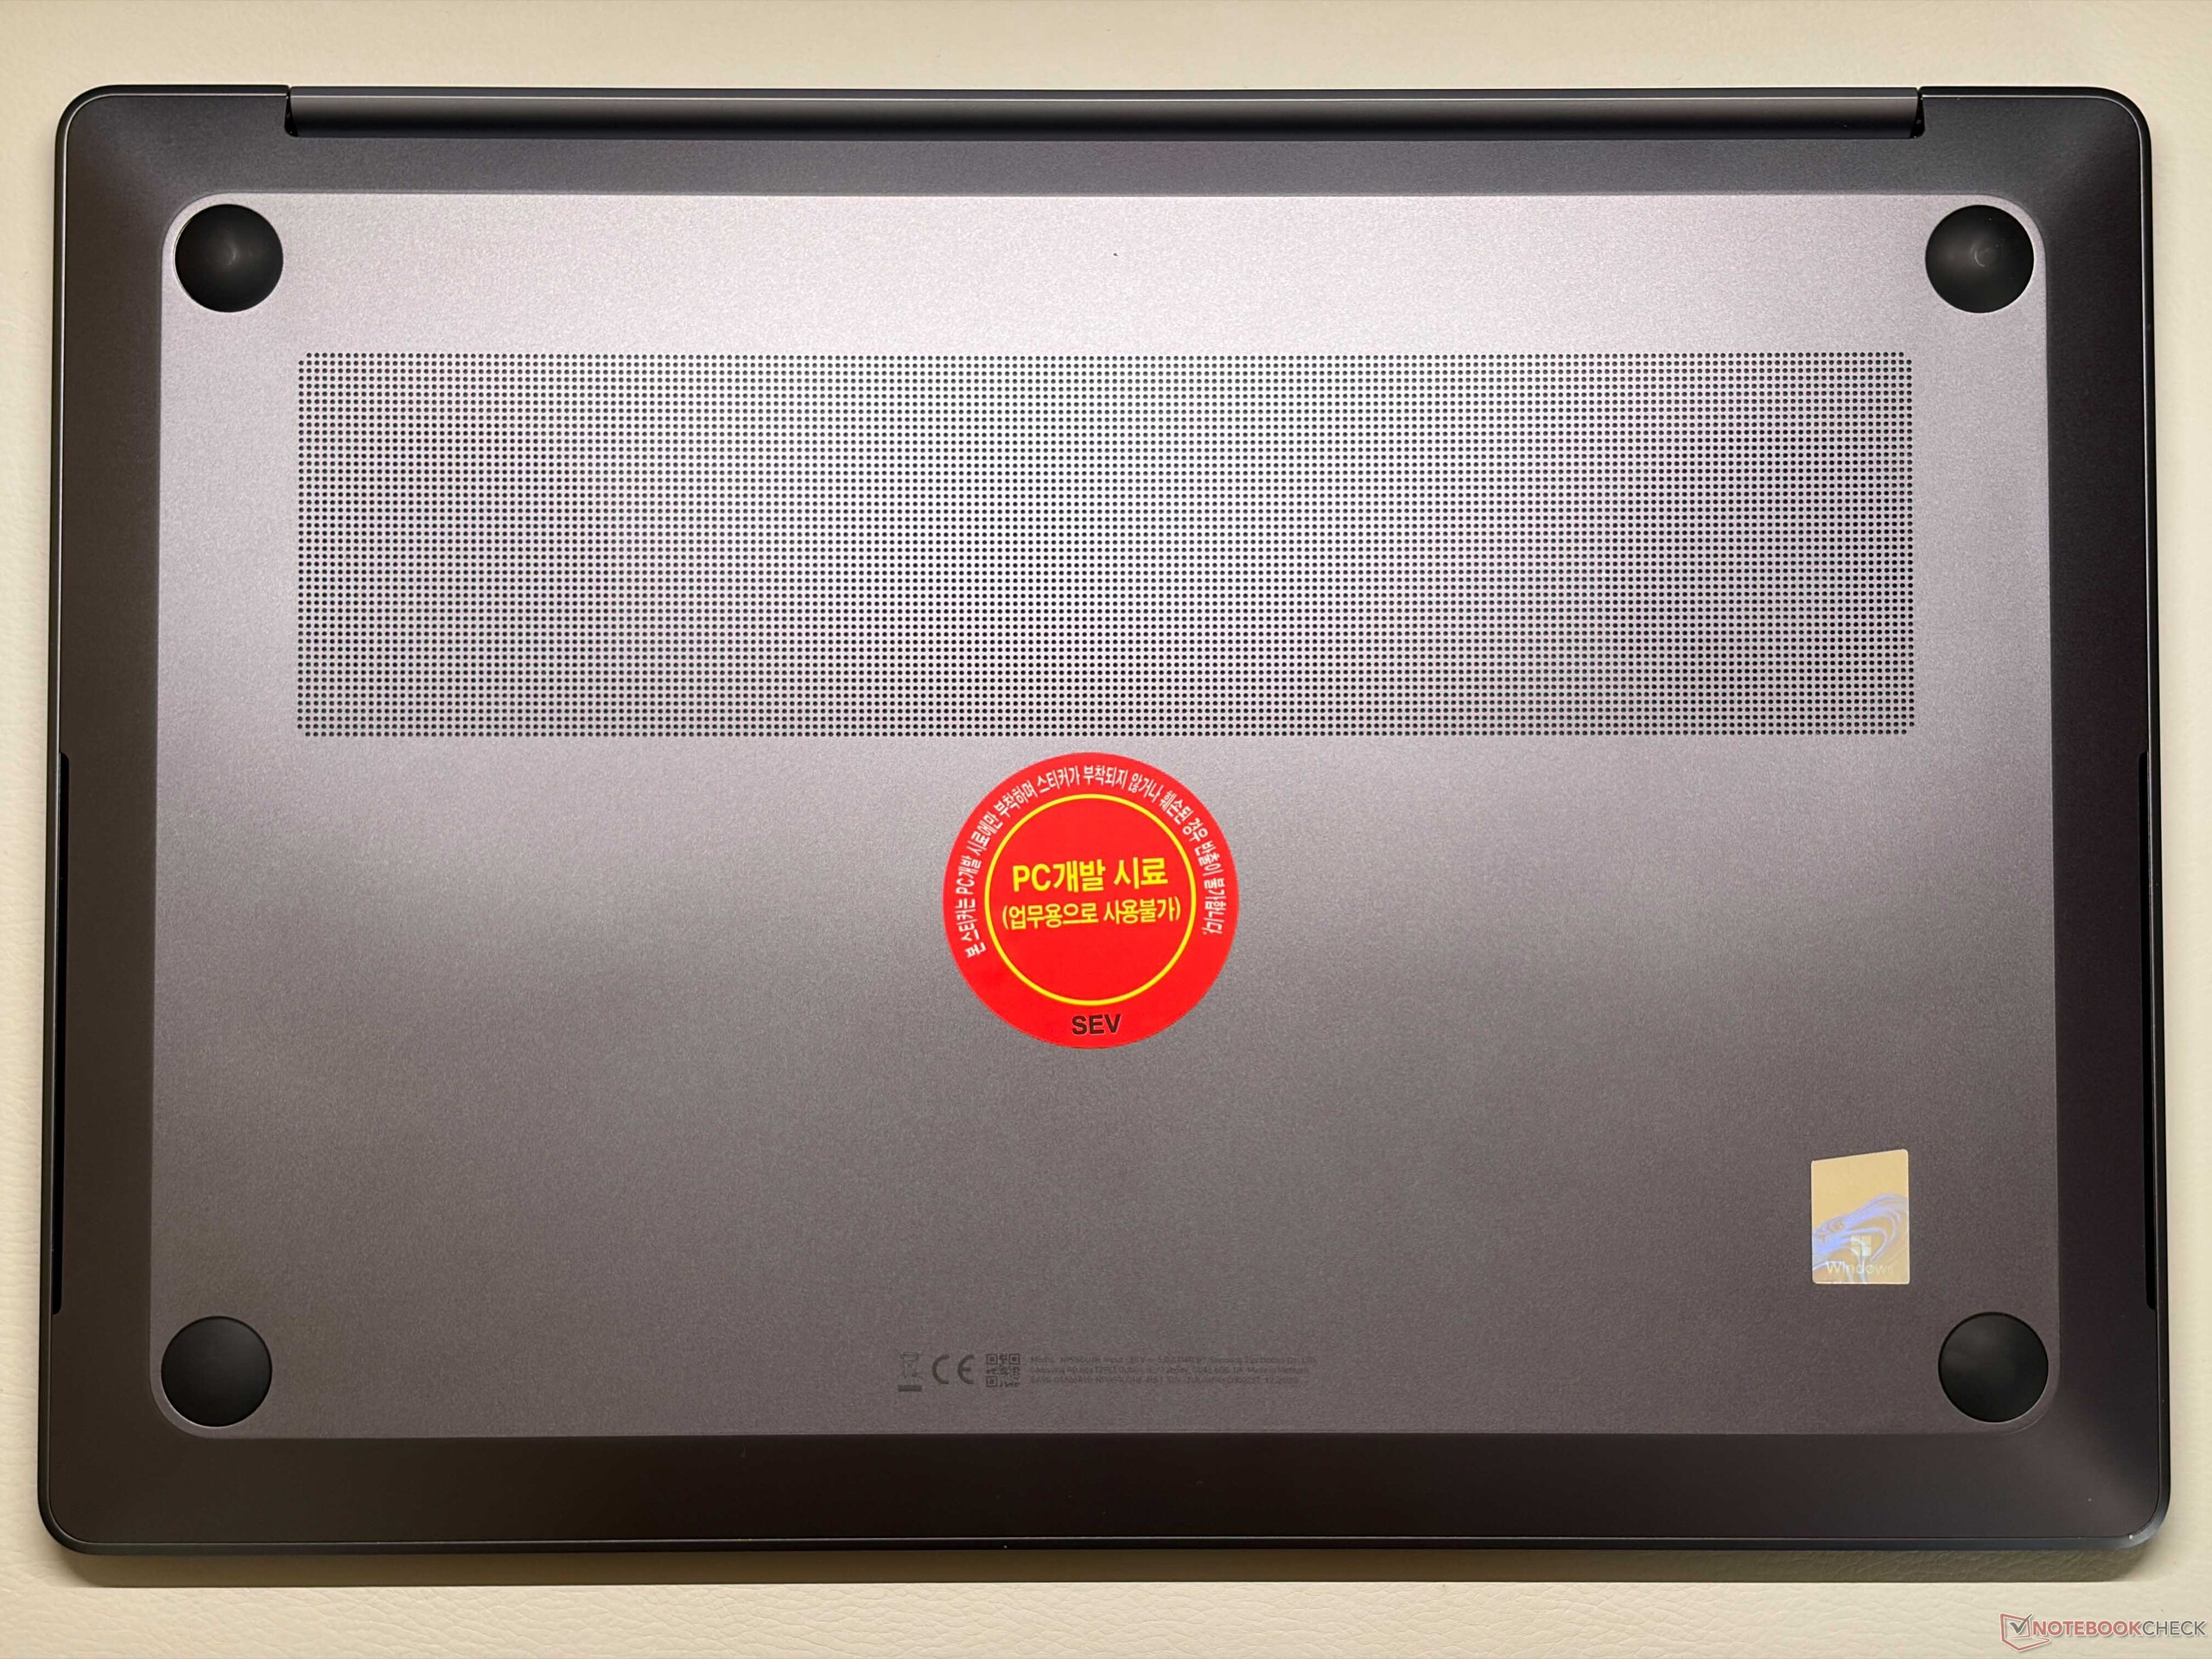
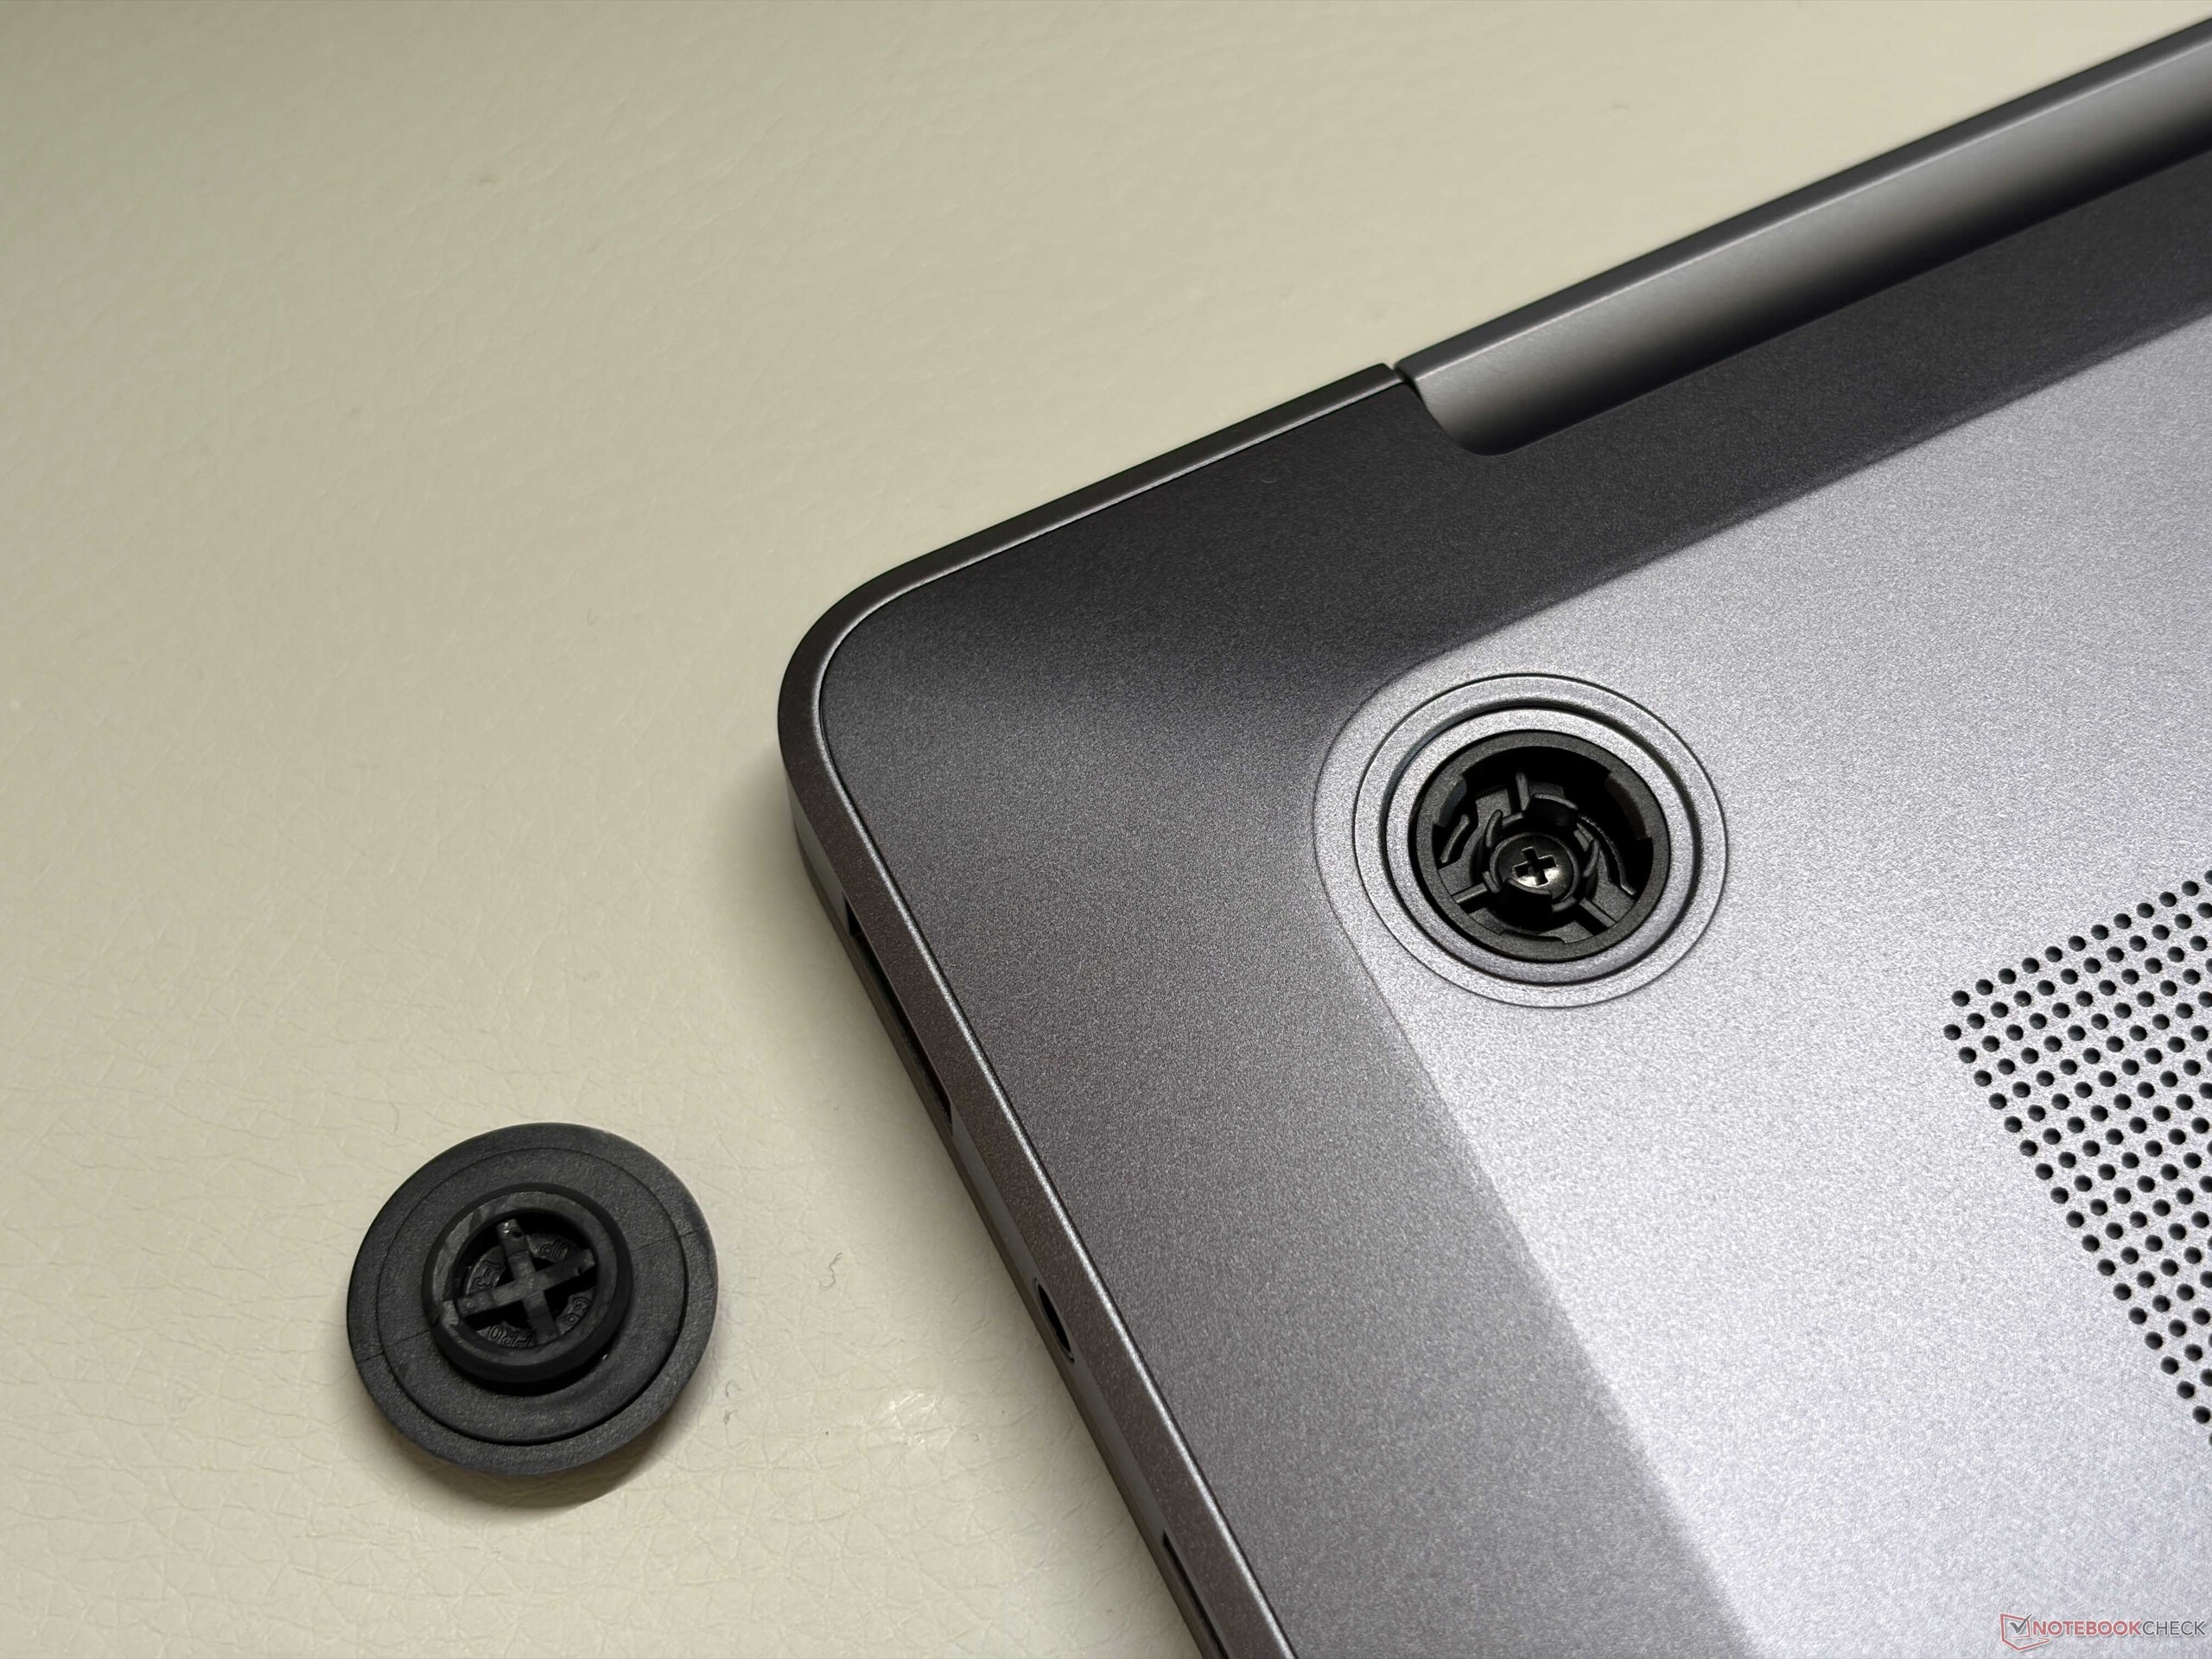
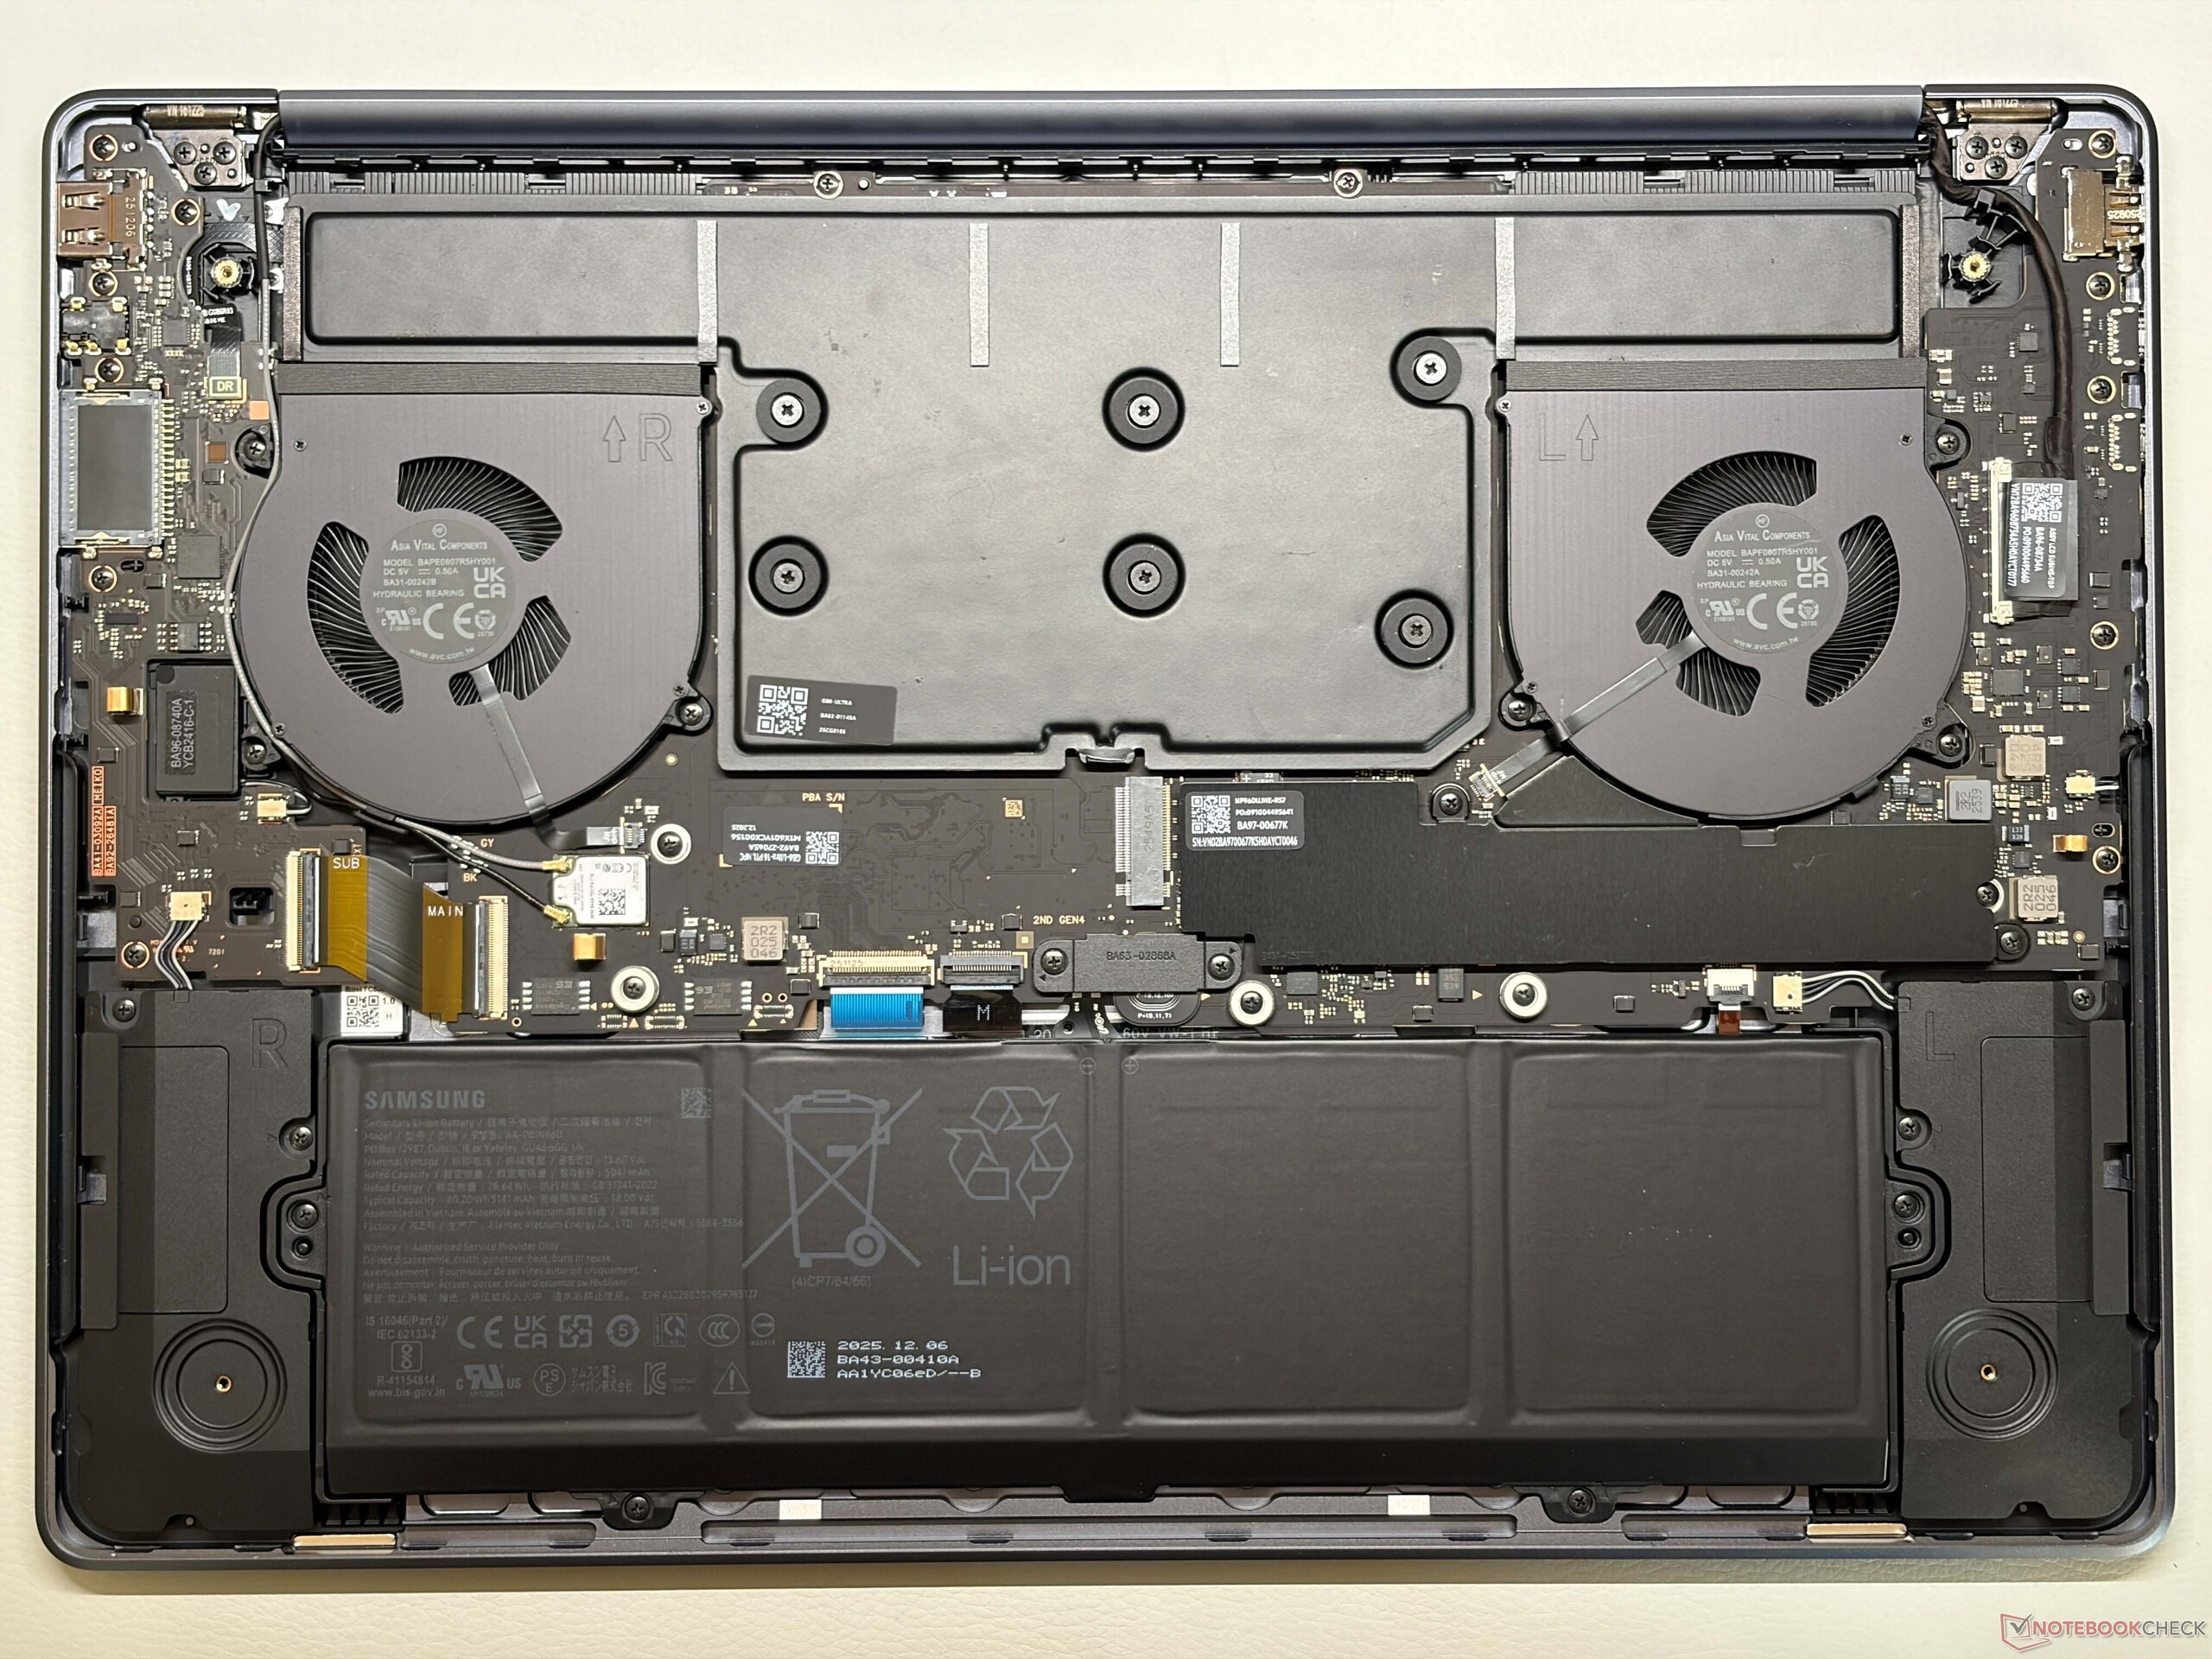
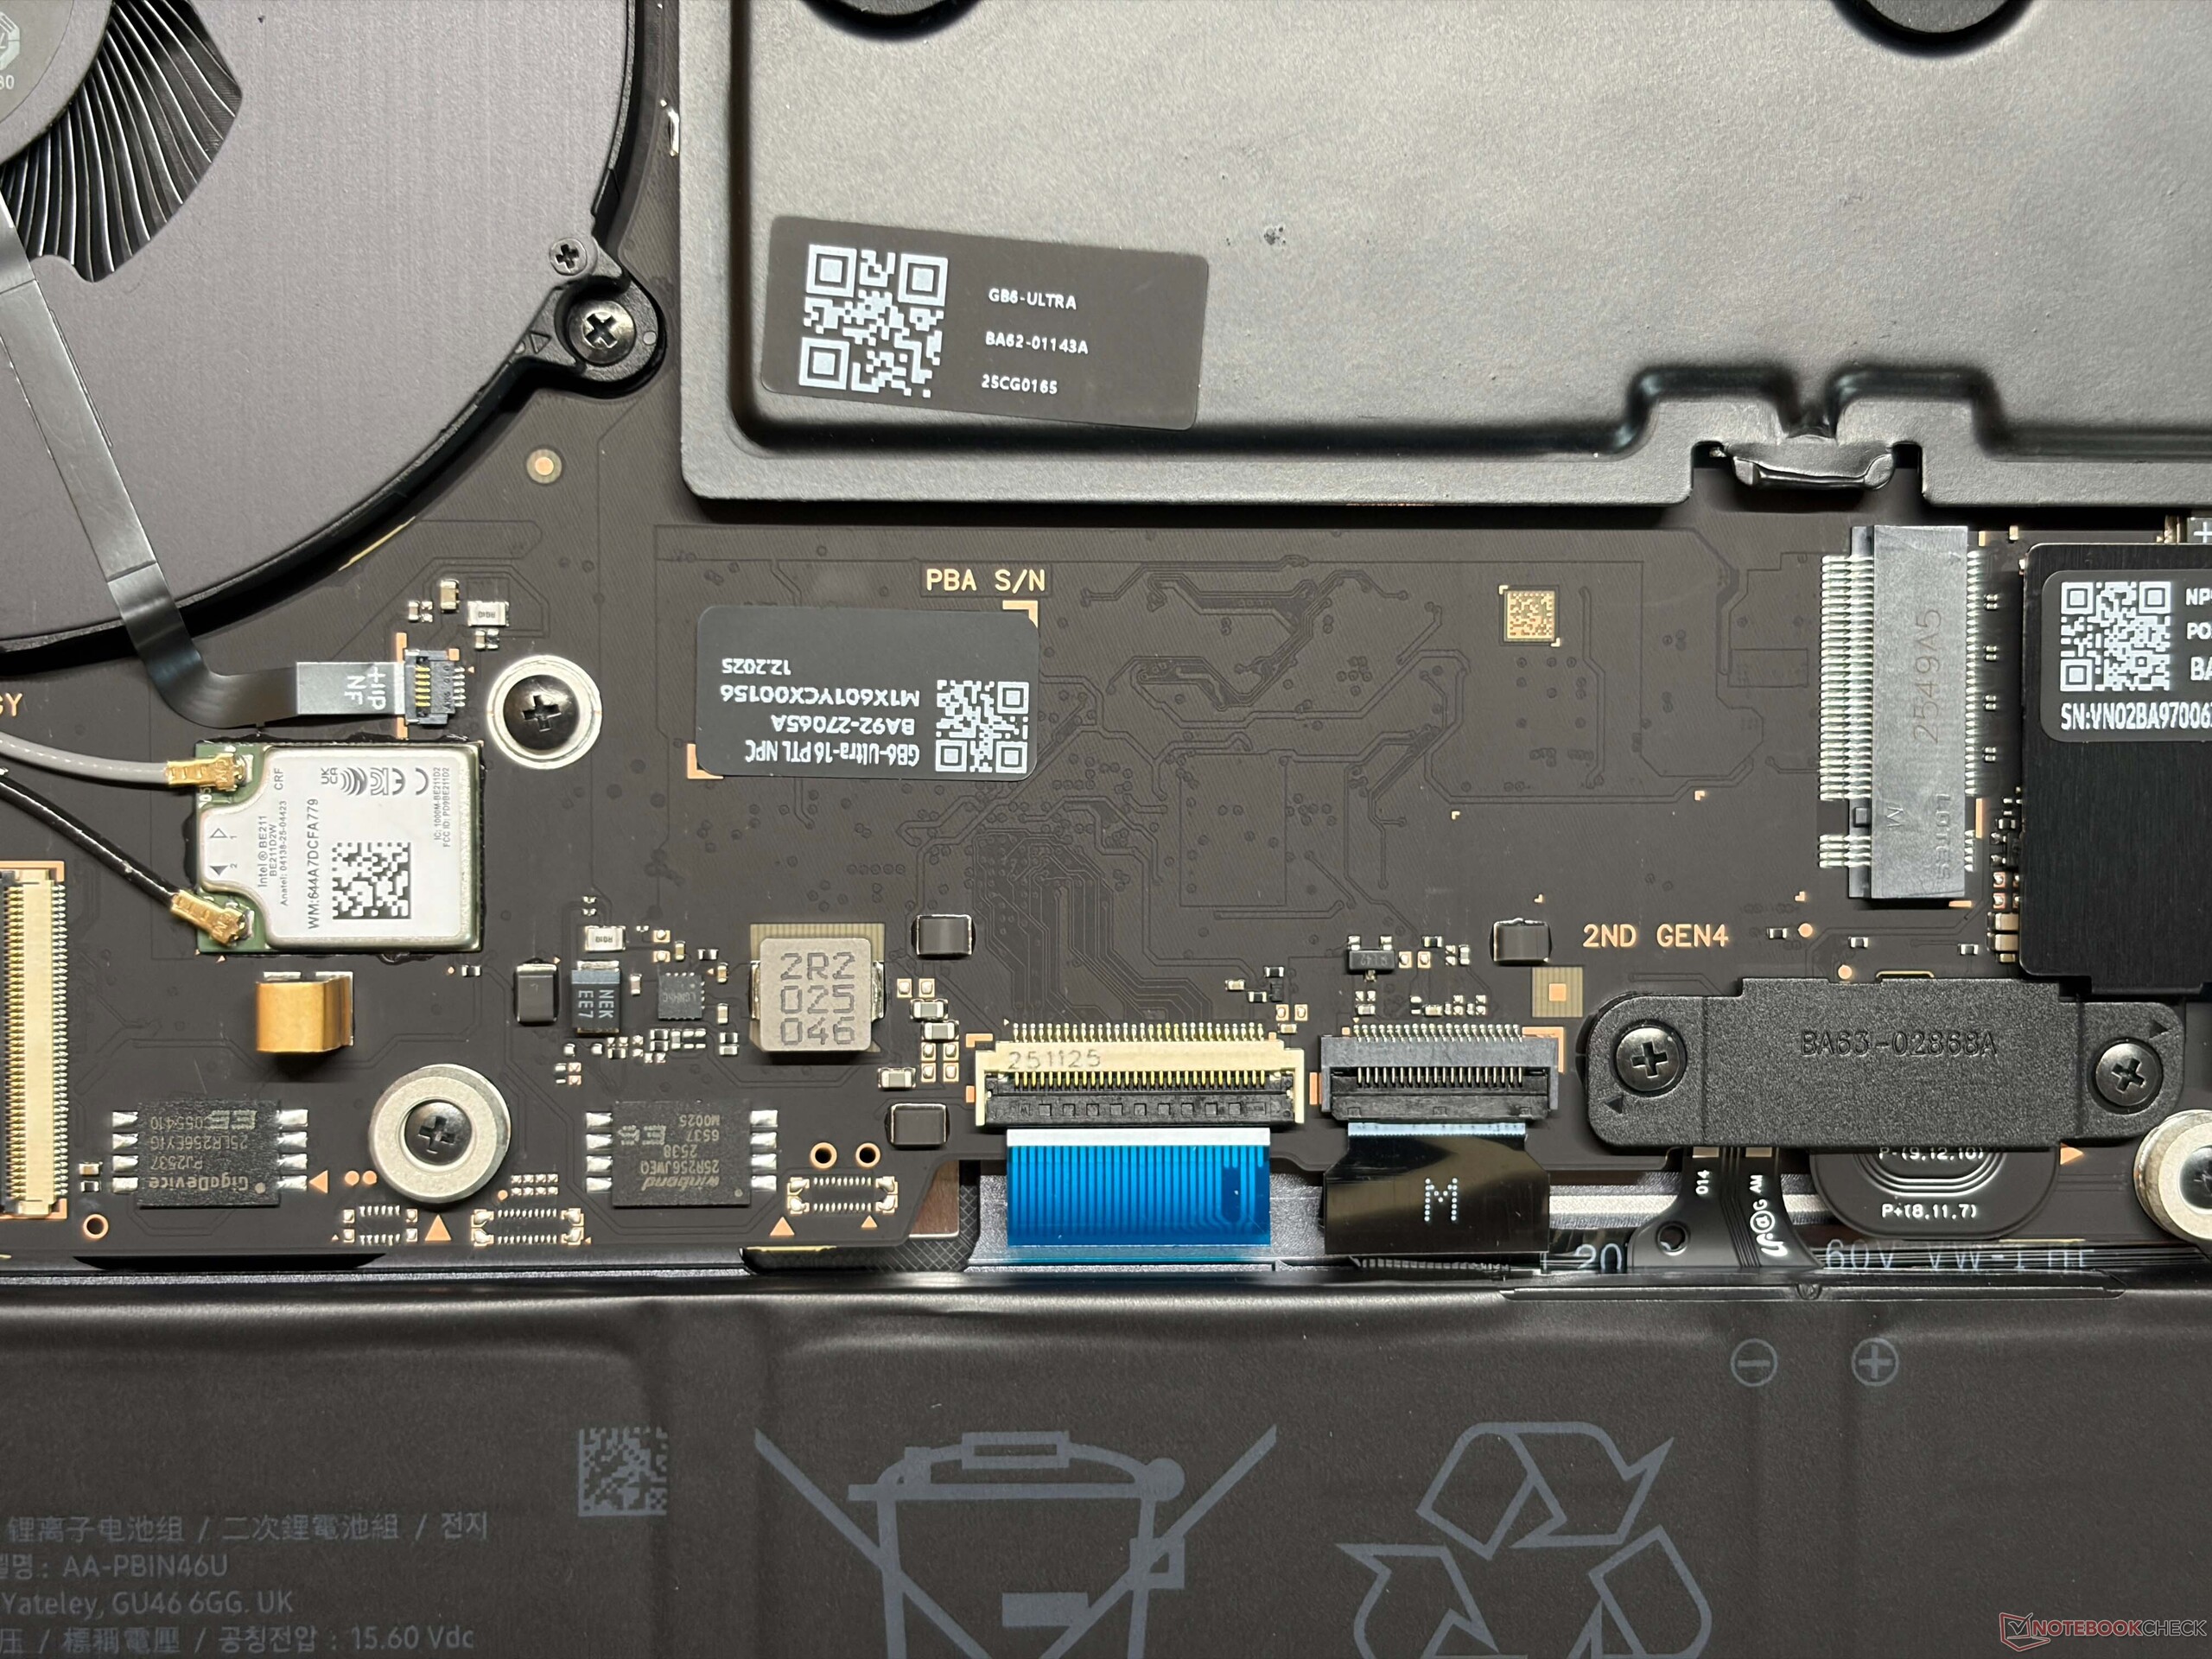
A Samsung abandonou o design anterior com a unidade de base em forma de cunha (que ainda está sendo usada para os outros modelos do Galaxy Book6) e o novo Galaxy Book6 Ultra se parece muito mais com um MacBook Pro 16. Temos certeza de que muitos usuários teriam dificuldade em diferenciar os dois modelos se os logotipos fossem removidos. A qualidade geral do Galaxy Book6 Ultra com o chassi de alumínio é excelente, tanto em termos de estabilidade quanto de qualidade de construção. No entanto, as impressões digitais são um problema e as superfícies não são fáceis de limpar. Não estamos satisfeitos com as dobradiças (ângulo máximo de abertura ~135 graus), pois a tela oscila um pouco. A moldura inferior também é muito grossa. É possível remover o painel inferior e acessar os slots de SSD, a bateria e as ventoinhas, mas a memória e o módulo Wi-Fi não podem ser substituídos.
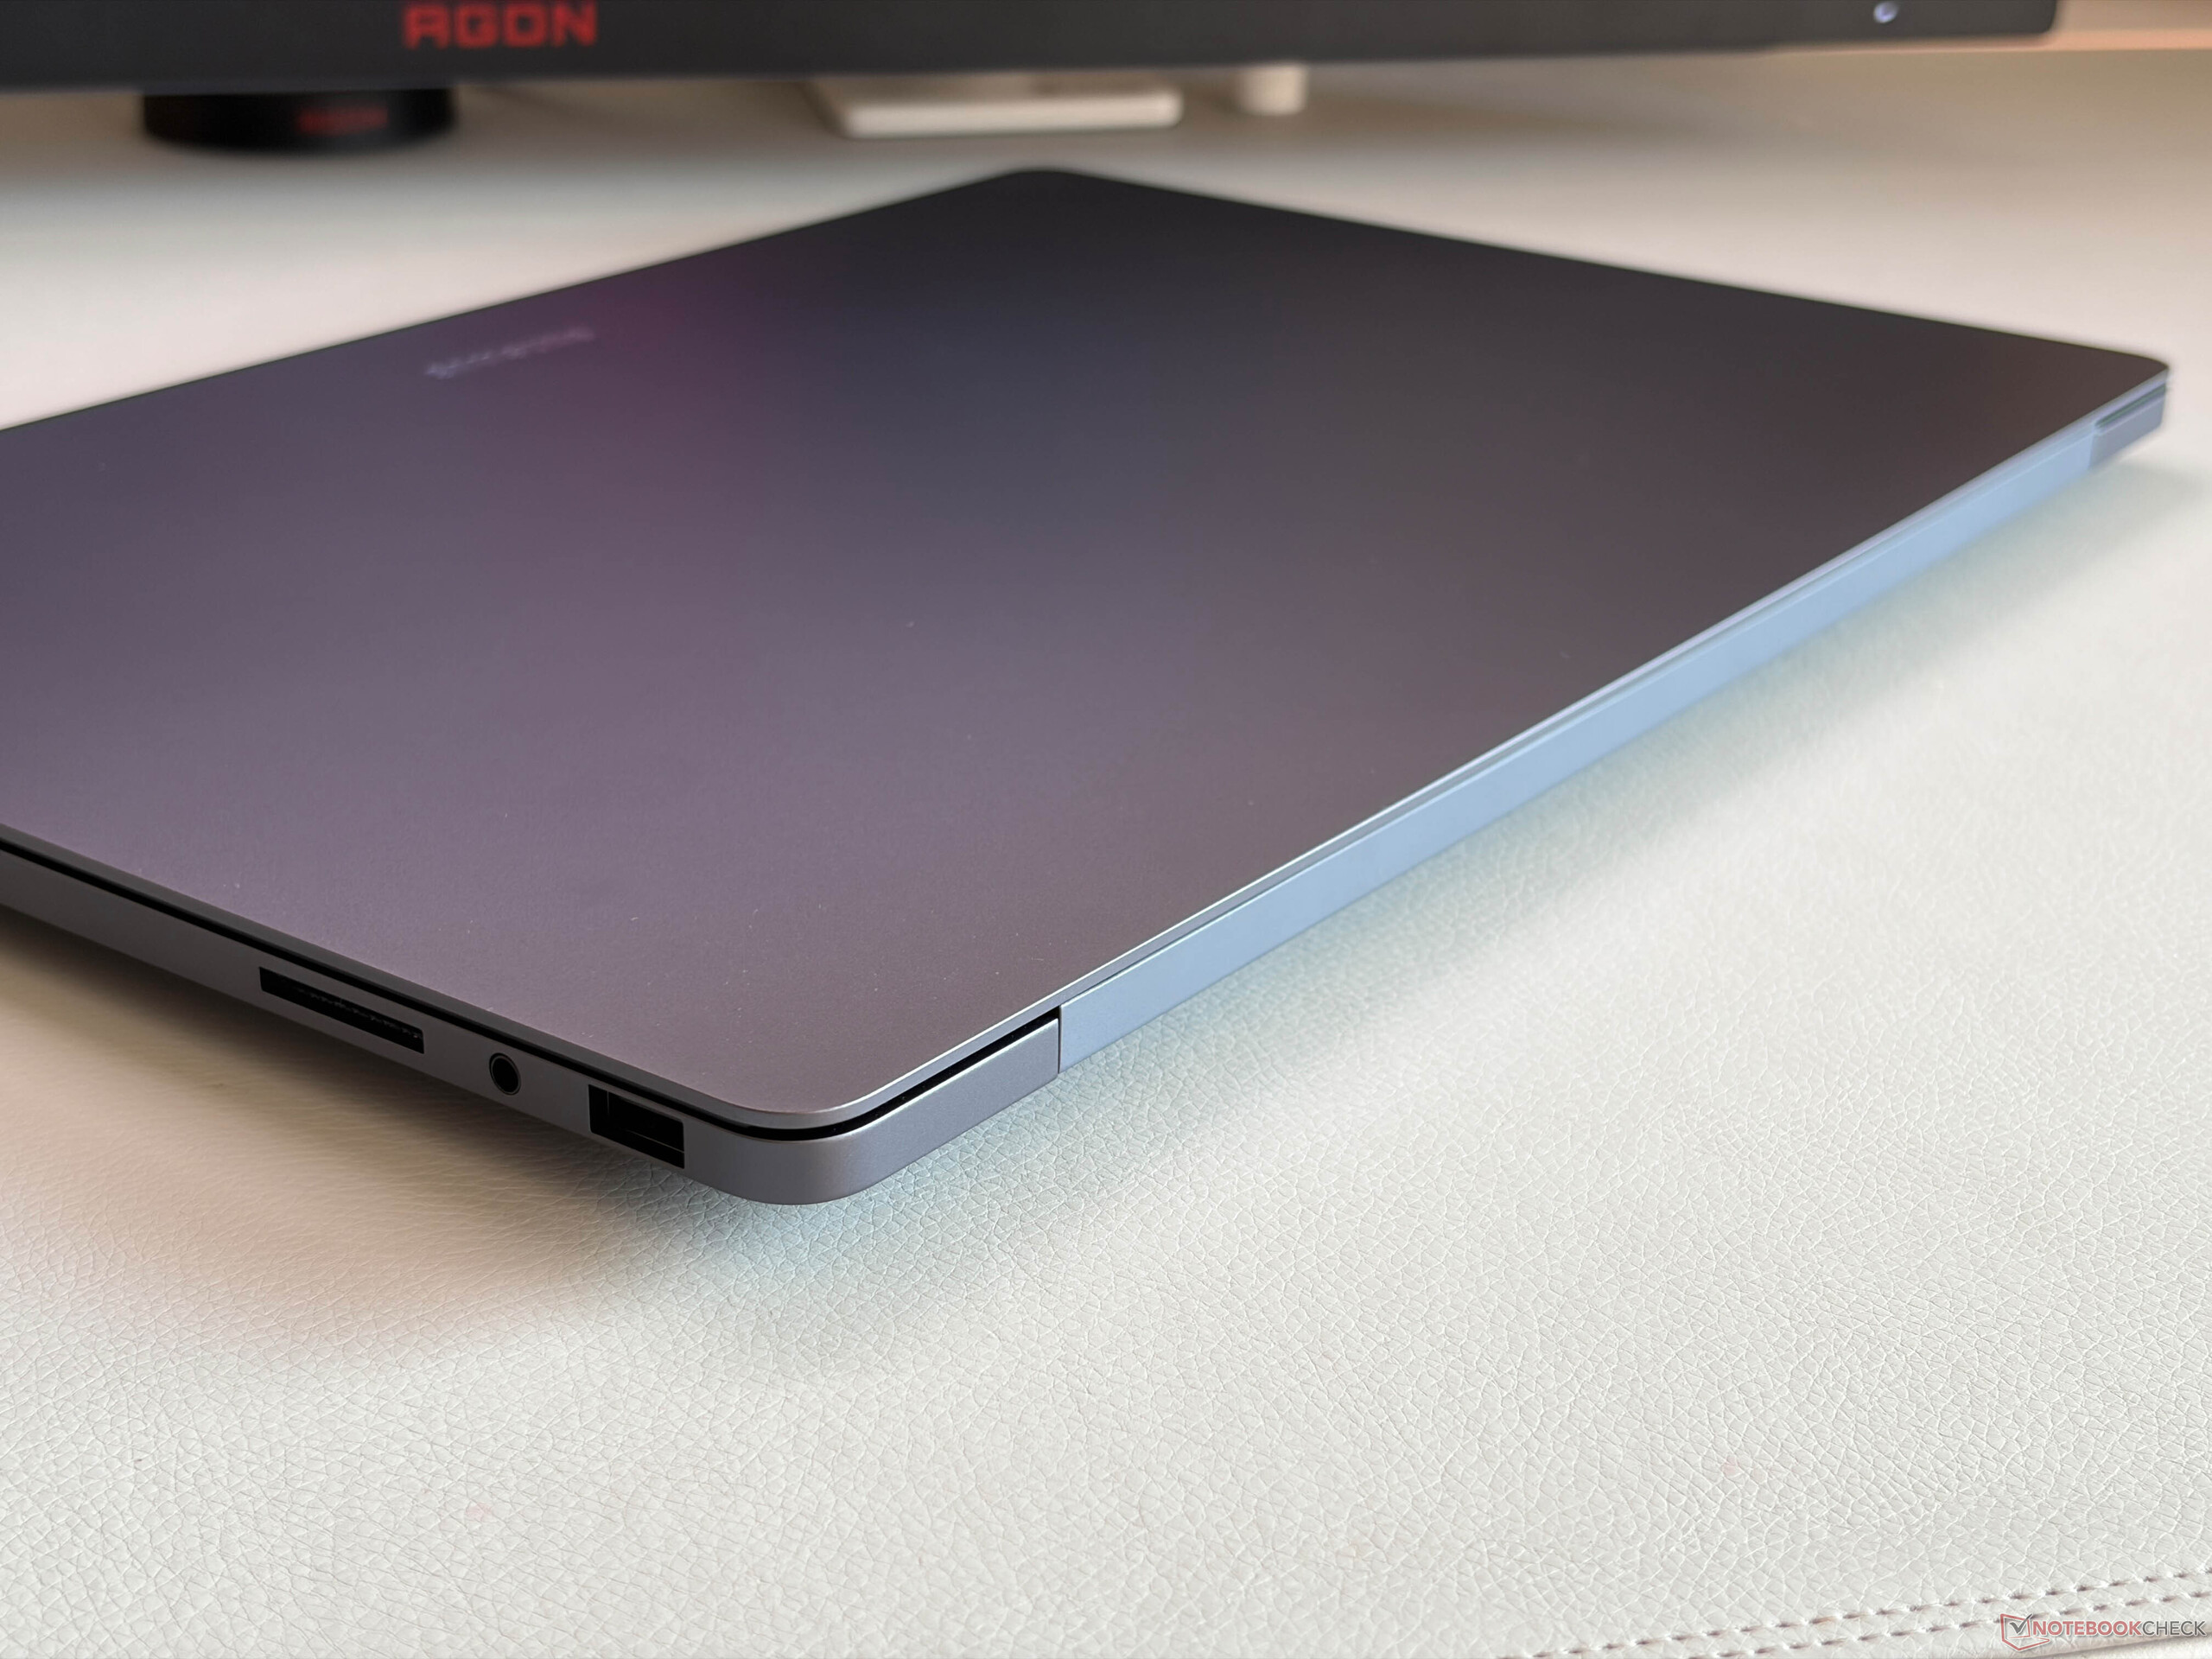
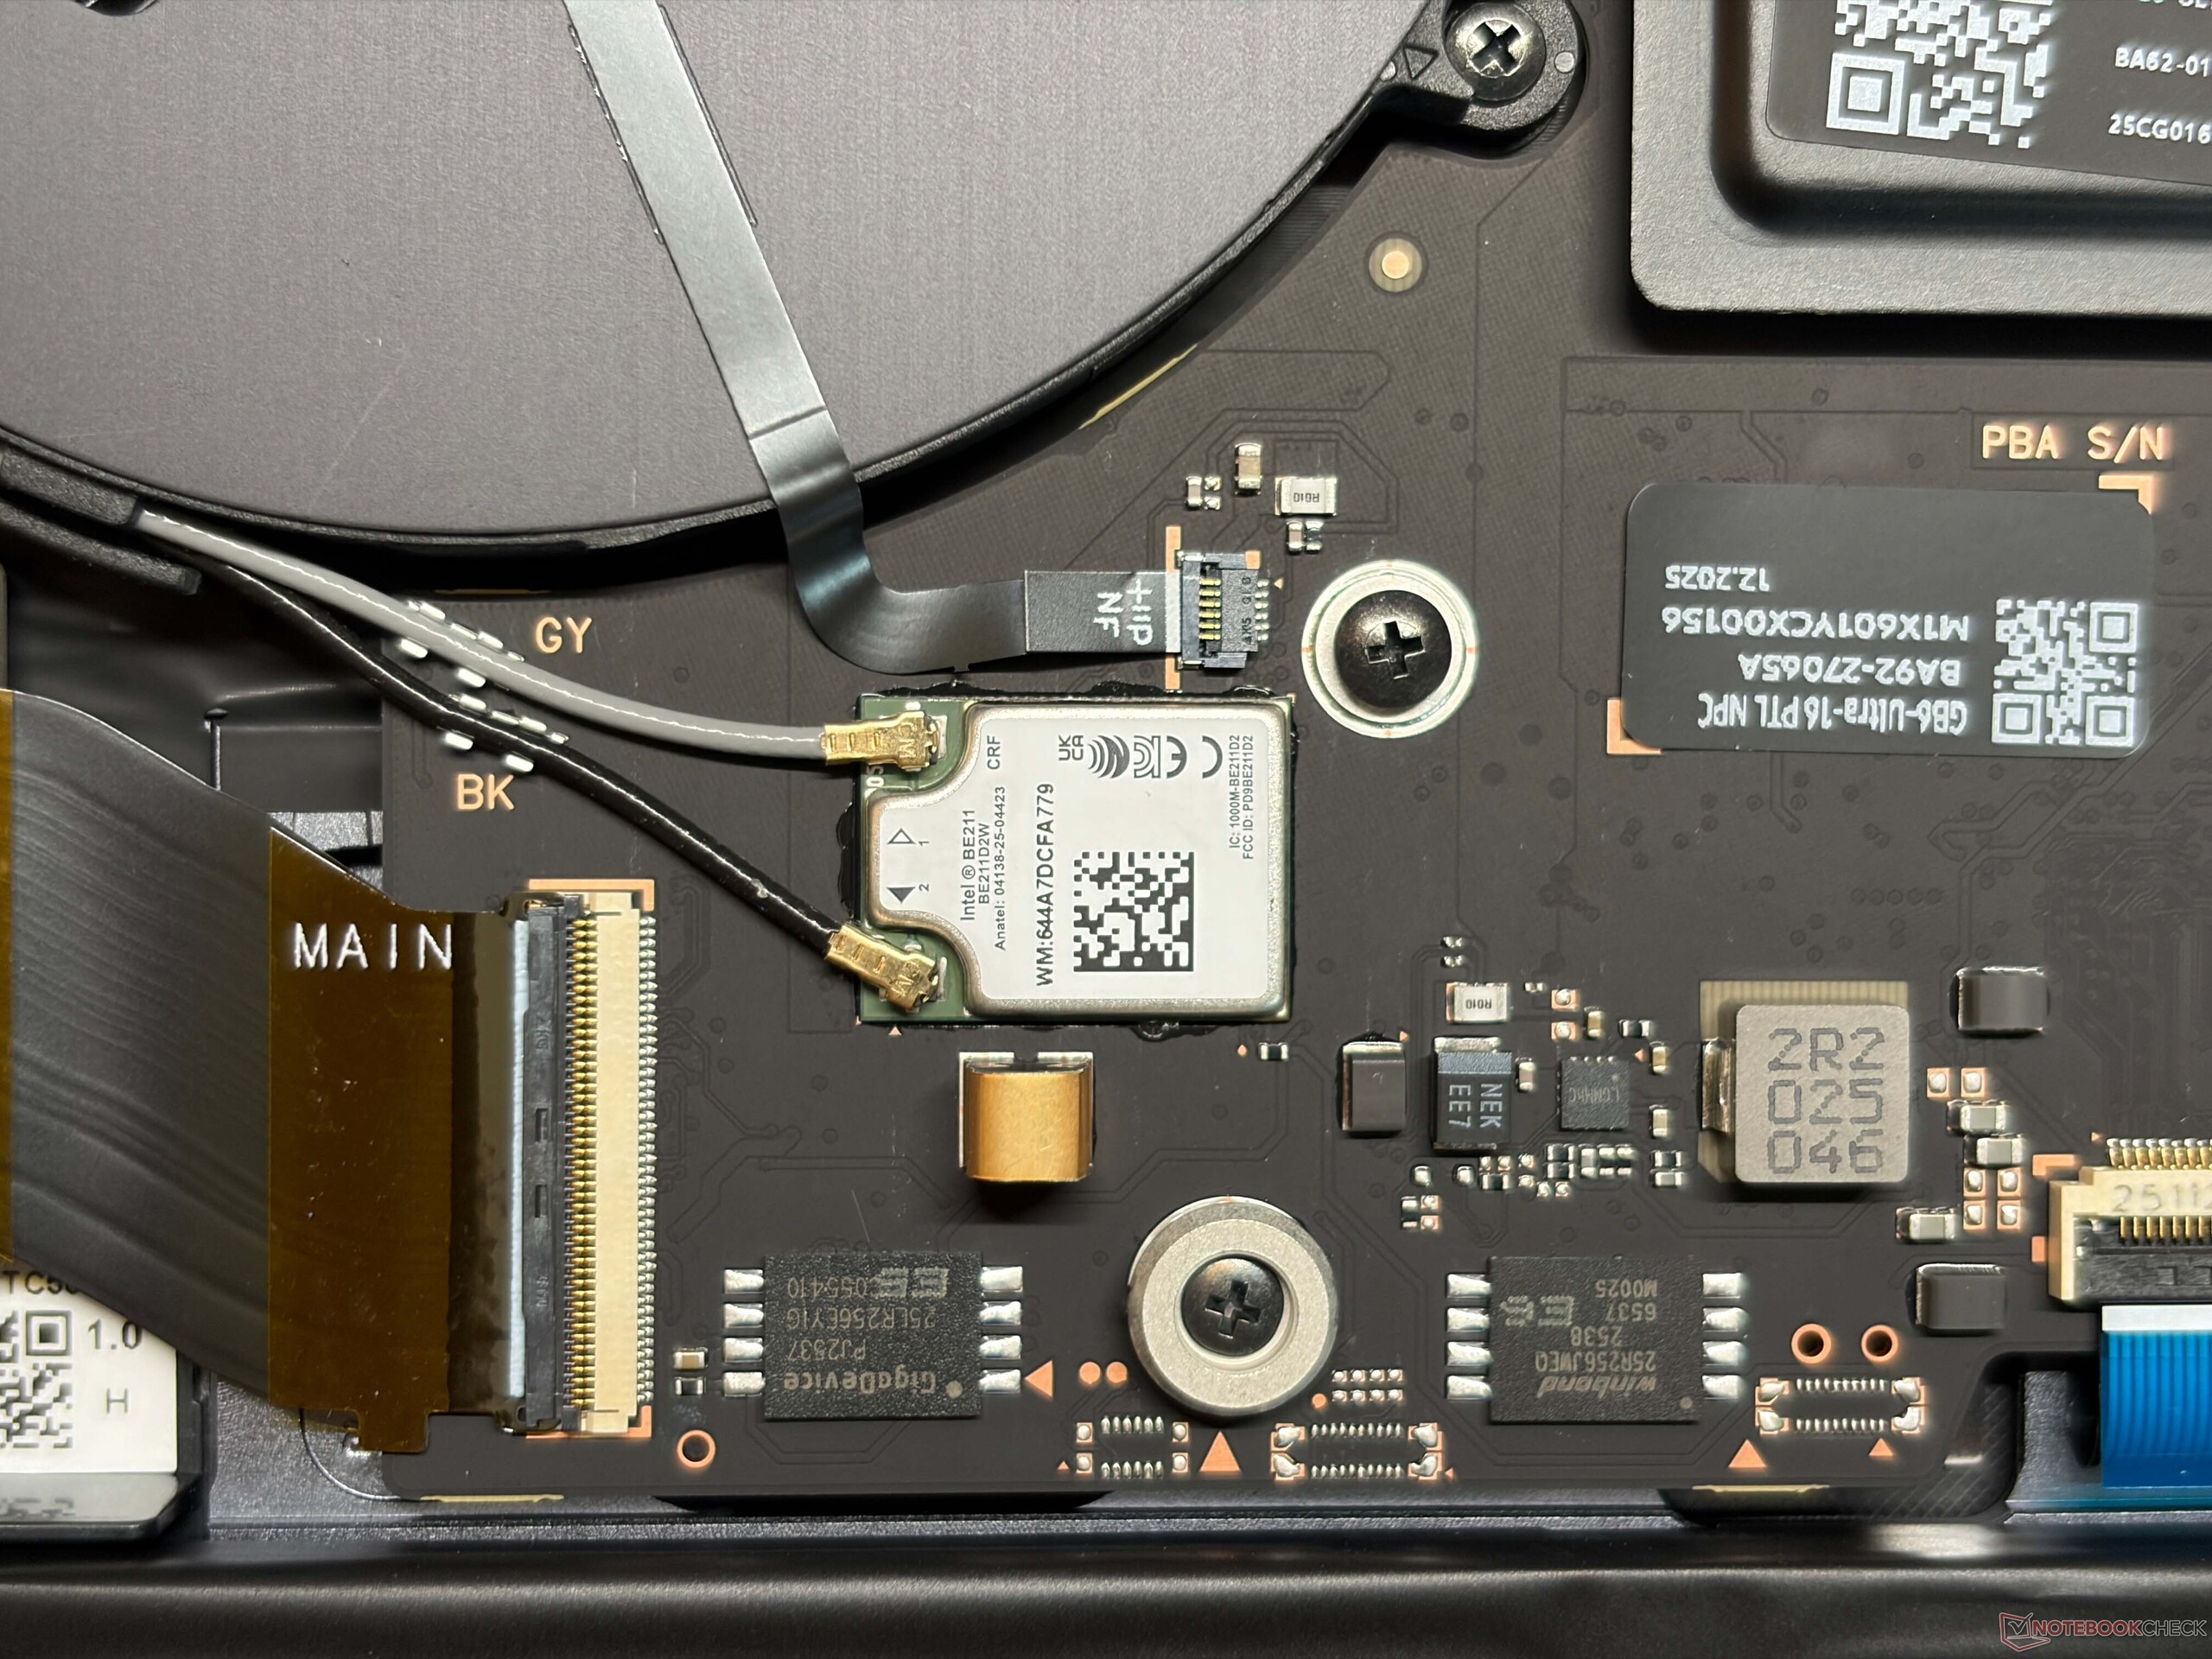
A situação das portas é limitada, com duas portas USB-C e uma porta USB-A. Uma das portas USB-C também está ocupada pelo adaptador de energia, portanto, o número de portas utilizáveis é limitado. O leitor de cartão SD é bastante lento, com cerca de 80-90 MB/s, e não é compatível com o SD-Express. O senhor tem um módulo Wi-Fi 7 moderno com Bluetooth 5.4 e as taxas de transferência são boas. A câmera de 1080p tira fotos medianas e também suporta reconhecimento facial, mas não há obturador.


| SD Card Reader | |
| average JPG Copy Test (av. of 3 runs) | |
| Lenovo ThinkPad T1g Gen 8 21TD003GE (ADATA SD8.0 Express 512 GBAV Pro V60) | |
| Lenovo ThinkPad T1g Gen 8 21TD003GE (Angelbird AV Pro V60) | |
| Asus ProArt P16 H7606WP (Angelbird AV Pro V60) | |
| Apple MacBook Pro 16 2024 M4 Pro (Angelbird AV Pro V60) | |
| Média da turma Multimedia (23 - 531, n=41, últimos 2 anos) | |
| Lenovo Yoga Pro 9i 16 RTX 5070 (Angelbird AV Pro V60) | |
| Samsung Galaxy Book6 Ultra (Angelbird AV Pro V60) | |
| maximum AS SSD Seq Read Test (1GB) | |
| Lenovo ThinkPad T1g Gen 8 21TD003GE (ADATA SD8.0 Express 512 GB) | |
| Lenovo ThinkPad T1g Gen 8 21TD003GE (Angelbird AV Pro V60) | |
| Asus ProArt P16 H7606WP (Angelbird AV Pro V60) | |
| Apple MacBook Pro 16 2024 M4 Pro (Angelbird AV Pro V60) | |
| Média da turma Multimedia (37.3 - 1455, n=40, últimos 2 anos) | |
| Lenovo Yoga Pro 9i 16 RTX 5070 (Angelbird AV Pro V60) | |
| Samsung Galaxy Book6 Ultra (Angelbird AV Pro V60) | |
| Networking | |
| Samsung Galaxy Book6 Ultra | |
| iperf3 transmit AXE11000 | |
| iperf3 receive AXE11000 | |
| Apple MacBook Pro 16 2024 M4 Pro | |
| iperf3 transmit AXE11000 | |
| iperf3 receive AXE11000 | |
| Lenovo Yoga Pro 9i 16 RTX 5070 | |
| iperf3 transmit AXE11000 | |
| iperf3 receive AXE11000 | |
| Dell 16 Premium DA16250 | |
| iperf3 transmit AXE11000 | |
| iperf3 receive AXE11000 | |
| iperf3 transmit AXE11000 6GHz | |
| iperf3 receive AXE11000 6GHz | |
| Lenovo ThinkPad T1g Gen 8 21TD003GE | |
| iperf3 transmit AXE11000 | |
| iperf3 receive AXE11000 | |
| Asus ProArt P16 H7606WP | |
| iperf3 transmit AXE11000 | |
| iperf3 receive AXE11000 | |


Dispositivos de entrada
A Samsung também tentou copiar o teclado do MacBook Pro e se livrou do teclado numérico do modelo anterior. O deslocamento das teclas é bastante superficial e a experiência de digitação entre o Samsung e o Apple é, na verdade, muito semelhante e boa no geral, mas há teclados mais confortáveis no mercado, como o do Asus ProArt P16 ou o Lenovo Yoga Pro 9i 16. O touchpad háptico funciona muito bem e o usuário também pode usar a tela sensível ao toque capacitiva para fazer entradas.


Tela - Nova tela touchscreen OLED

A Samsung usa uma nova tela touchscreen OLED (2880 x 1800 pixels) para o Galaxy Book6 Ultra e a qualidade subjetiva da imagem é excelente, com pretos profundos, cores ricas, movimentos suaves graças a 120 Hz (adaptável entre 30-120 Hz) e os conteúdos brilhantes também não são afetados pela camada de toque. Os tempos de resposta são rápidos, mas podemos medir a oscilação de PWM a 240 Hz para cada nível de brilho com uma amplitude bastante grande, portanto, os usuários sensíveis devem experimentar o painel primeiro.
O brilho também foi aprimorado e agora medimos cerca de 500 nits para SDR e até 1182 nits para conteúdo HDR (645 nits para uma imagem totalmente branca). Isso é uma melhoria, mas não chega aos pés das telas OLED em tandem ou da tela Mini-LED do MacBook. A Samsung inclui vários perfis de cores, incluindo P3 e sRGB. Nossa análise com o software profissional CalMAN mostra que a precisão das cores é muito boa e nossa própria calibração não melhorou ainda mais a qualidade da imagem. O Galaxy Book6 Ultra é, portanto, muito adequado para a edição de imagens.
| |||||||||||||||||||||||||
iluminação: 97 %
iluminação com acumulador: 499 cd/m²
Contraste: ∞:1 (Preto: 0 cd/m²)
ΔE ColorChecker Calman: 0.9 | ∀{0.5-29.43 Ø4.72}
ΔE Greyscale Calman: 1.6 | ∀{0.09-98 Ø4.97}
85.3% AdobeRGB 1998 (Argyll 3D)
99.9% sRGB (Argyll 3D)
97% Display P3 (Argyll 3D)
Gamma: 2.22
CCT: 6445 K
| Samsung Galaxy Book6 Ultra ATNA60HR05-0, OLED, 2880x1800, 16", 120 Hz | Apple MacBook Pro 16 2024 M4 Pro Mini-LED, 3456x2234, 16.2", 120 Hz | Lenovo Yoga Pro 9i 16 RTX 5070 ATNA60KA01-0, OLED, 3200x2000, 16", 120 Hz | Asus ProArt P16 RTX 5090 ATNA60HC03-0, OLED, 3840x2400, 16", 120 Hz | Dell 16 Premium DA16250 Samsung 163DU02, OLED, 3840x2400, 16.3", 120 Hz | Lenovo ThinkPad T1g Gen 8 21TD003GE ATNA60KA02-0, Tandem-OLED, 3200x2000, 16", 120 Hz | |
|---|---|---|---|---|---|---|
| Display | 2% | 4% | 2% | 2% | 2% | |
| Display P3 Coverage (%) | 97 | 99.7 3% | 97.4 0% | 98.9 2% | 99.7 3% | 98.8 2% |
| sRGB Coverage (%) | 99.9 | 100 0% | 100 0% | 100 0% | 100 0% | 100 0% |
| AdobeRGB 1998 Coverage (%) | 85.3 | 88.8 4% | 96.8 13% | 88.6 4% | 88.1 3% | 88.9 4% |
| Response Times | -6230% | 44% | 30% | -26% | 40% | |
| Response Time Grey 50% / Grey 80% * (ms) | 0.5 ? | 43 ? -8500% | 0.27 ? 46% | 0.3 ? 40% | 0.61 ? -22% | 0.26 ? 48% |
| Response Time Black / White * (ms) | 0.4 ? | 41.2 ? -10200% | 0.37 ? 7% | 0.45 ? -13% | 0.88 ? -120% | 0.42 ? -5% |
| PWM Frequency (Hz) | 240 ? | 14880 | 1200 | 480 ? | 490.8 ? | 1200 ? |
| PWM Amplitude * (%) | 100 | 90 10% | 22 78% | 38 62% | 35 65% | 22 78% |
| Screen | 29% | 38% | 34% | -19% | -37% | |
| Brightness middle (cd/m²) | 499 | 632 27% | 974 95% | 661 32% | 385.7 -23% | 578 16% |
| Brightness (cd/m²) | 505 | 616 22% | 979 94% | 663 31% | 387 -23% | 583 15% |
| Brightness Distribution (%) | 97 | 95 -2% | 98 1% | 99 2% | 98 1% | 98 1% |
| Black Level * (cd/m²) | ||||||
| Colorchecker dE 2000 * | 0.9 | 0.6 33% | 0.9 -0% | 0.5 44% | 1.36 -51% | 1.6 -78% |
| Colorchecker dE 2000 max. * | 2.1 | 1.2 43% | 1.7 19% | 1.4 33% | 2.85 -36% | 4.5 -114% |
| Greyscale dE 2000 * | 1.6 | 0.8 50% | 1.3 19% | 0.6 63% | 1.3 19% | 2.6 -63% |
| Gamma | 2.22 99% | 2.21 100% | 2.21 100% | 2.19 100% | 2.2 100% | 2.19 100% |
| CCT | 6445 101% | 6450 101% | 6751 96% | 6565 99% | 6282 103% | 6527 100% |
| Colorchecker dE 2000 calibrated * | 0.65 | |||||
| Média Total (Programa/Configurações) | -2066% /
-1543% | 29% /
31% | 22% /
25% | -14% /
-15% | 2% /
-8% |
* ... menor é melhor


Exibir tempos de resposta
| ↔ Tempo de resposta preto para branco | ||
|---|---|---|
| 0.4 ms ... ascensão ↗ e queda ↘ combinadas | ↗ 0.2 ms ascensão | 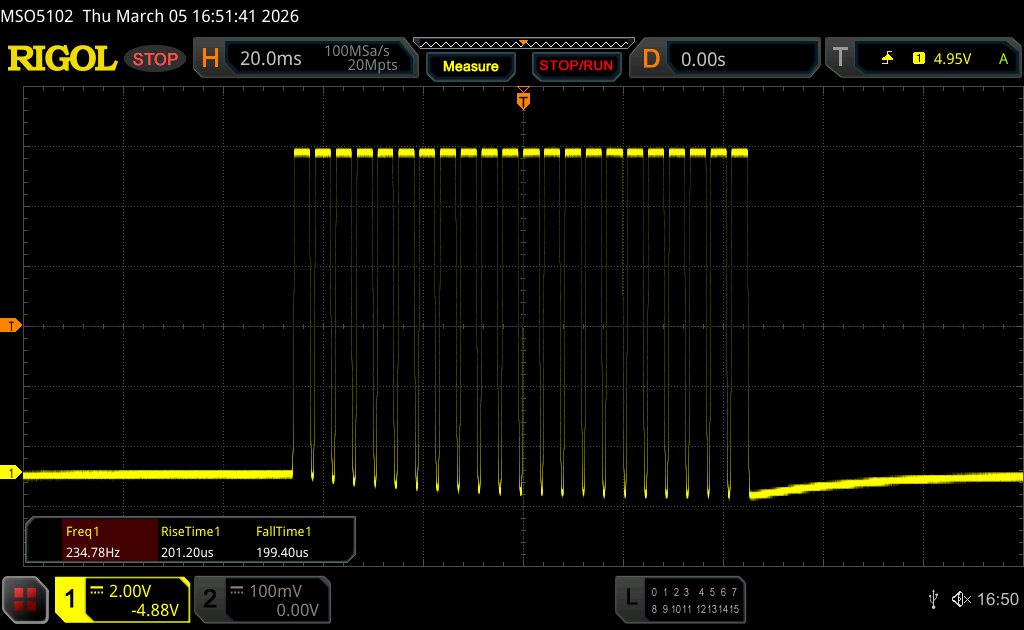 |
| ↘ 0.2 ms queda | ||
| A tela mostra taxas de resposta muito rápidas em nossos testes e deve ser muito adequada para jogos em ritmo acelerado. Em comparação, todos os dispositivos testados variam de 0.1 (mínimo) a 240 (máximo) ms. » 0 % de todos os dispositivos são melhores. Isso significa que o tempo de resposta medido é melhor que a média de todos os dispositivos testados (19.8 ms). | ||
| ↔ Tempo de resposta 50% cinza a 80% cinza | ||
| 0.5 ms ... ascensão ↗ e queda ↘ combinadas | ↗ 0.25 ms ascensão | 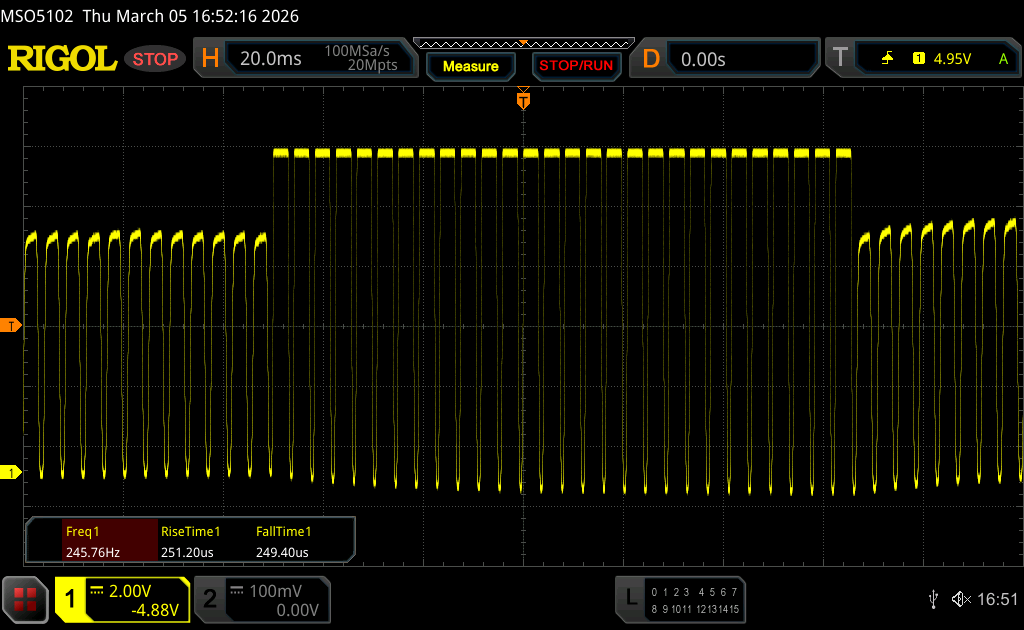 |
| ↘ 0.25 ms queda | ||
| A tela mostra taxas de resposta muito rápidas em nossos testes e deve ser muito adequada para jogos em ritmo acelerado. Em comparação, todos os dispositivos testados variam de 0.165 (mínimo) a 636 (máximo) ms. » 1 % de todos os dispositivos são melhores. Isso significa que o tempo de resposta medido é melhor que a média de todos os dispositivos testados (31 ms). | ||
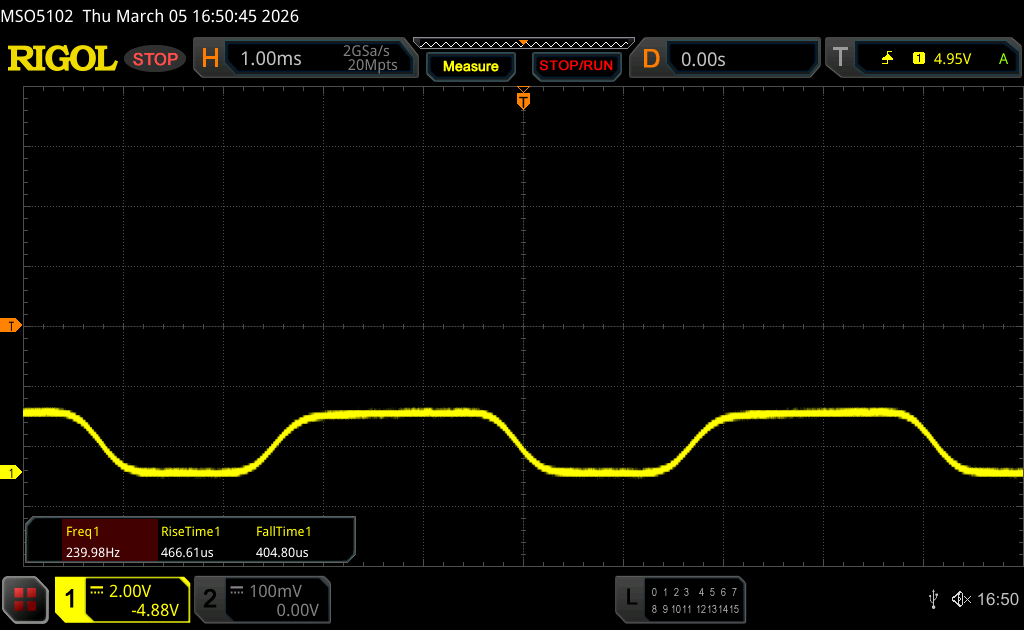
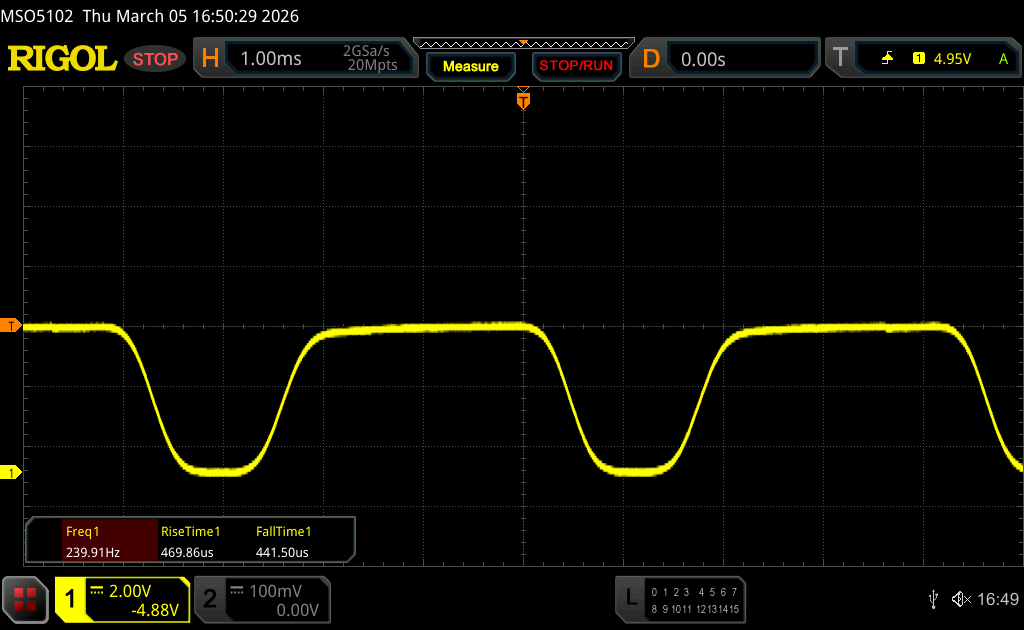
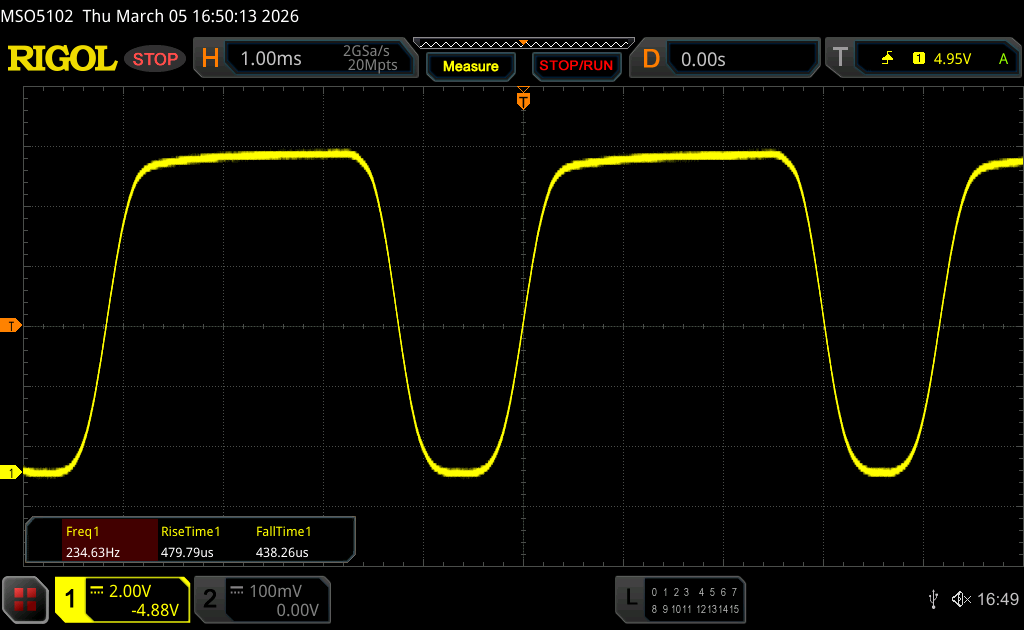
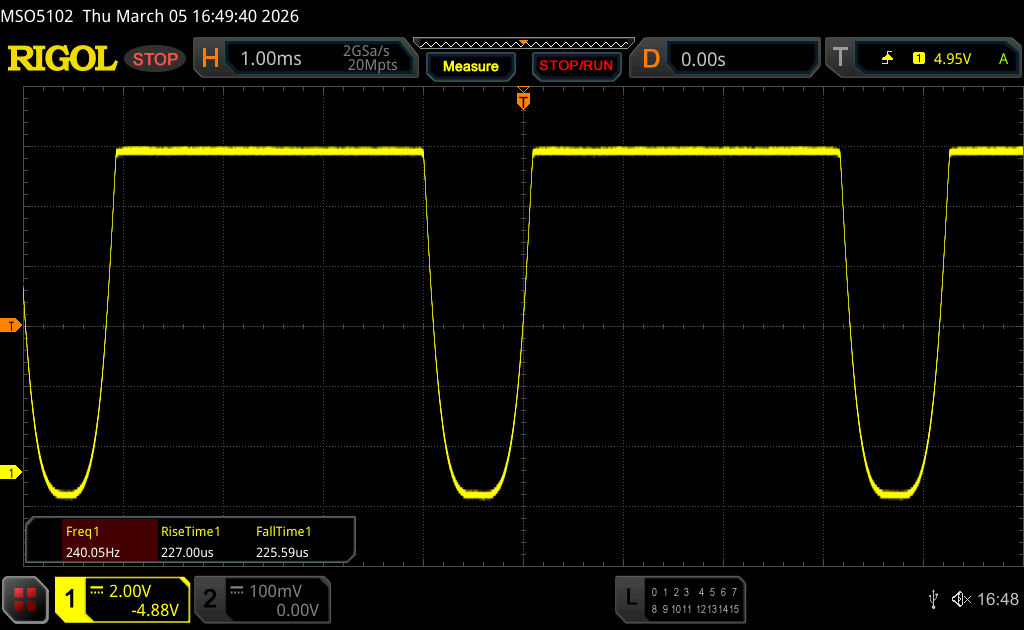
Cintilação da tela / PWM (modulação por largura de pulso)
| Tela tremeluzindo/PWM detectado | 240 Hz Amplitude: 100 % | ≤ 100 % configuração de brilho | 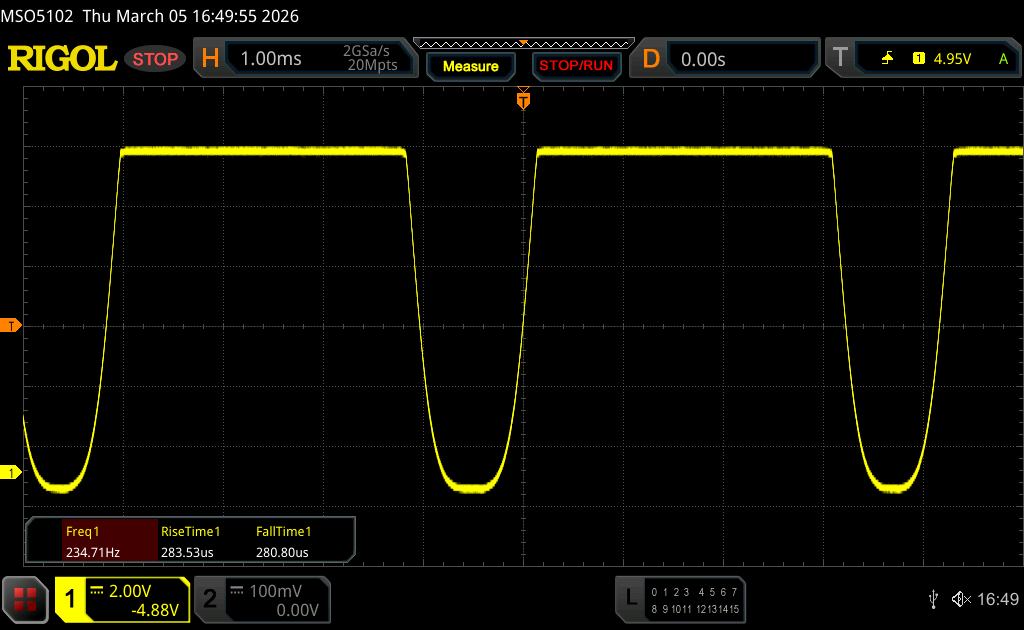 |
A luz de fundo da tela pisca em 240 Hz (pior caso, por exemplo, utilizando PWM) Cintilação detectada em uma configuração de brilho de 100 % e abaixo. Não deve haver cintilação ou PWM acima desta configuração de brilho. A frequência de 240 Hz é relativamente baixa, portanto, usuários sensíveis provavelmente notarão cintilação e sentirão fadiga ocular na configuração de brilho indicada e abaixo. [pwm_comparison] Em comparação: 52 % de todos os dispositivos testados não usam PWM para escurecer a tela. Se PWM foi detectado, uma média de 7747 (mínimo: 5 - máximo: 343500) Hz foi medida. | |||


Desempenho - Panther Lake encontra Blackwell
Condições de teste
A Samsung inclui vários perfis de energia e eles são sincronizados com as configurações do Windows. Realizamos nossos benchmarks no modo de alto desempenho.
| Perfil | TDP (Watts) | CB R24 Multi (pontos) | TGP (Watts) | Time Sy Graphics (Pontos) | Cyberpunk 2077 QHD Ultra (FPS) | ruído máximo da ventoinha (dB(A)) |
|---|---|---|---|---|---|---|
| Silencioso | 45/30 | 916 | 22 | 3054 | 14,4 | 33,7 |
| Otimizado | 65/45/35 | 1002 | 60 | 9149 | 47,2 | 40,3 |
| Alto desempenho | 65 | 1232 | 90 | 12027 | 57,4 | 48,5 |
| Bateria | 65/50 | 1173 | 70 | 10258 | 49,7 | 48,2 |
Processador
Nossa unidade de análise está equipada com o Core Ultra 7 356H (Panther Lake), que oferece 16 núcleos e um clock máximo de 4,7 GHz. Ele é quase idêntico ao Core Ultra X7 (até 4,8 GHz), mas não inclui a rápida GPU Arc B390. O desempenho da CPU com o limite de energia de 65 Watts é bom e estável. Todos os dispositivos Windows estão bem próximos aqui, apenas o MacBook Pro com o M4 Pro é claramente superior em cenários de vários núcleos e, especialmente, de um único núcleo, e o próximo modelo M5 Pro provavelmente aumentará ainda mais a diferença.
Cinebench R15 Multi Loop
Cinebench 2024: CPU Multi Core | CPU Single Core
Cinebench R23: Multi Core | Single Core
Cinebench R20: CPU (Multi Core) | CPU (Single Core)
Cinebench R15: CPU Multi 64Bit | CPU Single 64Bit
Blender: v2.79 BMW27 CPU
7-Zip 18.03: 7z b 4 | 7z b 4 -mmt1
Geekbench 6.7: Multi-Core | Single-Core
Geekbench 5.5: Multi-Core | Single-Core
HWBOT x265 Benchmark v2.2: 4k Preset
LibreOffice : 20 Documents To PDF
R Benchmark 2.5: Overall mean
| CPU Performance rating | |
| Apple MacBook Pro 16 M4 Max -8! | |
| Apple MacBook Pro 16 2024 M4 Pro -12! | |
| Lenovo Yoga Pro 9i 16 RTX 5070 | |
| Lenovo ThinkPad T1g Gen 8 21TD003GE | |
| Asus ProArt P16 RTX 5090 | |
| Samsung Galaxy Book6 Ultra | |
| Dell 16 Premium DA16250 | |
| Média Intel Core Ultra 7 356H | |
| Média da turma Multimedia | |
| Cinebench 2024 / CPU Multi Core | |
| Apple MacBook Pro 16 M4 Max | |
| Apple MacBook Pro 16 M4 Max | |
| Apple MacBook Pro 16 2024 M4 Pro | |
| Asus ProArt P16 RTX 5090 | |
| Samsung Galaxy Book6 Ultra | |
| Lenovo Yoga Pro 9i 16 RTX 5070 | |
| Média Intel Core Ultra 7 356H (1006 - 1232, n=3) | |
| Lenovo ThinkPad T1g Gen 8 21TD003GE | |
| Dell 16 Premium DA16250 | |
| Média da turma Multimedia (327 - 2437, n=76, últimos 2 anos) | |
| Cinebench 2024 / CPU Single Core | |
| Apple MacBook Pro 16 2024 M4 Pro | |
| Apple MacBook Pro 16 M4 Max | |
| Média da turma Multimedia (72.5 - 201, n=60, últimos 2 anos) | |
| Lenovo Yoga Pro 9i 16 RTX 5070 | |
| Lenovo ThinkPad T1g Gen 8 21TD003GE | |
| Samsung Galaxy Book6 Ultra | |
| Dell 16 Premium DA16250 | |
| Média Intel Core Ultra 7 356H (116 - 122.4, n=3) | |
| Asus ProArt P16 RTX 5090 | |
| Cinebench R23 / Multi Core | |
| Apple MacBook Pro 16 M4 Max | |
| Asus ProArt P16 RTX 5090 | |
| Lenovo Yoga Pro 9i 16 RTX 5070 | |
| Apple MacBook Pro 16 2024 M4 Pro | |
| Lenovo ThinkPad T1g Gen 8 21TD003GE | |
| Dell 16 Premium DA16250 | |
| Samsung Galaxy Book6 Ultra | |
| Média Intel Core Ultra 7 356H (18395 - 20650, n=2) | |
| Média da turma Multimedia (4861 - 33362, n=77, últimos 2 anos) | |
| Cinebench R23 / Single Core | |
| Apple MacBook Pro 16 2024 M4 Pro | |
| Apple MacBook Pro 16 M4 Max | |
| Lenovo Yoga Pro 9i 16 RTX 5070 | |
| Lenovo ThinkPad T1g Gen 8 21TD003GE | |
| Samsung Galaxy Book6 Ultra | |
| Média Intel Core Ultra 7 356H (2040 - 2045, n=2) | |
| Asus ProArt P16 RTX 5090 | |
| Média da turma Multimedia (1128 - 2459, n=69, últimos 2 anos) | |
| Dell 16 Premium DA16250 | |
| Cinebench R20 / CPU (Multi Core) | |
| Asus ProArt P16 RTX 5090 | |
| Lenovo Yoga Pro 9i 16 RTX 5070 | |
| Lenovo ThinkPad T1g Gen 8 21TD003GE | |
| Dell 16 Premium DA16250 | |
| Samsung Galaxy Book6 Ultra | |
| Média Intel Core Ultra 7 356H (7180 - 8074, n=2) | |
| Apple MacBook Pro 16 M4 Max | |
| Média da turma Multimedia (1887 - 12912, n=60, últimos 2 anos) | |
| Cinebench R20 / CPU (Single Core) | |
| Lenovo Yoga Pro 9i 16 RTX 5070 | |
| Lenovo ThinkPad T1g Gen 8 21TD003GE | |
| Asus ProArt P16 RTX 5090 | |
| Média Intel Core Ultra 7 356H (773 - 774, n=2) | |
| Samsung Galaxy Book6 Ultra | |
| Dell 16 Premium DA16250 | |
| Média da turma Multimedia (425 - 853, n=60, últimos 2 anos) | |
| Apple MacBook Pro 16 M4 Max | |
| Cinebench R15 / CPU Multi 64Bit | |
| Apple MacBook Pro 16 M4 Max | |
| Asus ProArt P16 RTX 5090 | |
| Lenovo Yoga Pro 9i 16 RTX 5070 | |
| Lenovo ThinkPad T1g Gen 8 21TD003GE | |
| Dell 16 Premium DA16250 | |
| Samsung Galaxy Book6 Ultra | |
| Média Intel Core Ultra 7 356H (2937 - 3201, n=2) | |
| Média da turma Multimedia (856 - 5224, n=64, últimos 2 anos) | |
| Cinebench R15 / CPU Single 64Bit | |
| Lenovo Yoga Pro 9i 16 RTX 5070 | |
| Lenovo ThinkPad T1g Gen 8 21TD003GE | |
| Apple MacBook Pro 16 M4 Max | |
| Samsung Galaxy Book6 Ultra | |
| Média Intel Core Ultra 7 356H (303 - 306, n=2) | |
| Dell 16 Premium DA16250 | |
| Média da turma Multimedia (184.8 - 326, n=62, últimos 2 anos) | |
| Asus ProArt P16 RTX 5090 | |
| Blender / v2.79 BMW27 CPU | |
| Média da turma Multimedia (100 - 557, n=61, últimos 2 anos) | |
| Média Intel Core Ultra 7 356H (163 - 196, n=2) | |
| Dell 16 Premium DA16250 | |
| Samsung Galaxy Book6 Ultra | |
| Lenovo ThinkPad T1g Gen 8 21TD003GE | |
| Lenovo Yoga Pro 9i 16 RTX 5070 | |
| Asus ProArt P16 RTX 5090 | |
| 7-Zip 18.03 / 7z b 4 | |
| Asus ProArt P16 RTX 5090 | |
| Lenovo Yoga Pro 9i 16 RTX 5070 | |
| Samsung Galaxy Book6 Ultra | |
| Lenovo ThinkPad T1g Gen 8 21TD003GE | |
| Dell 16 Premium DA16250 | |
| Média Intel Core Ultra 7 356H (65579 - 69785, n=2) | |
| Média da turma Multimedia (26062 - 130368, n=58, últimos 2 anos) | |
| 7-Zip 18.03 / 7z b 4 -mmt1 | |
| Média Intel Core Ultra 7 356H (6305 - 6375, n=2) | |
| Samsung Galaxy Book6 Ultra | |
| Lenovo Yoga Pro 9i 16 RTX 5070 | |
| Asus ProArt P16 RTX 5090 | |
| Lenovo ThinkPad T1g Gen 8 21TD003GE | |
| Média da turma Multimedia (3666 - 7545, n=59, últimos 2 anos) | |
| Dell 16 Premium DA16250 | |
| Geekbench 6.7 / Multi-Core | |
| Apple MacBook Pro 16 M4 Max | |
| Apple MacBook Pro 16 2024 M4 Pro | |
| Lenovo Yoga Pro 9i 16 RTX 5070 | |
| Lenovo ThinkPad T1g Gen 8 21TD003GE | |
| Dell 16 Premium DA16250 | |
| Samsung Galaxy Book6 Ultra | |
| Média Intel Core Ultra 7 356H (15578 - 16676, n=3) | |
| Asus ProArt P16 RTX 5090 | |
| Média da turma Multimedia (4983 - 29415, n=72, últimos 2 anos) | |
| Geekbench 6.7 / Single-Core | |
| Apple MacBook Pro 16 M4 Max | |
| Apple MacBook Pro 16 2024 M4 Pro | |
| Lenovo Yoga Pro 9i 16 RTX 5070 | |
| Lenovo ThinkPad T1g Gen 8 21TD003GE | |
| Asus ProArt P16 RTX 5090 | |
| Média da turma Multimedia (1534 - 4335, n=71, últimos 2 anos) | |
| Samsung Galaxy Book6 Ultra | |
| Dell 16 Premium DA16250 | |
| Média Intel Core Ultra 7 356H (2532 - 2851, n=3) | |
| Geekbench 5.5 / Multi-Core | |
| Lenovo Yoga Pro 9i 16 RTX 5070 | |
| Lenovo ThinkPad T1g Gen 8 21TD003GE | |
| Samsung Galaxy Book6 Ultra | |
| Média Intel Core Ultra 7 356H (16721 - 16761, n=2) | |
| Dell 16 Premium DA16250 | |
| Asus ProArt P16 RTX 5090 | |
| Média da turma Multimedia (4652 - 20422, n=59, últimos 2 anos) | |
| Geekbench 5.5 / Single-Core | |
| Asus ProArt P16 RTX 5090 | |
| Lenovo Yoga Pro 9i 16 RTX 5070 | |
| Lenovo ThinkPad T1g Gen 8 21TD003GE | |
| Média Intel Core Ultra 7 356H (2086 - 2098, n=2) | |
| Samsung Galaxy Book6 Ultra | |
| Média da turma Multimedia (805 - 2974, n=59, últimos 2 anos) | |
| Dell 16 Premium DA16250 | |
| HWBOT x265 Benchmark v2.2 / 4k Preset | |
| Asus ProArt P16 RTX 5090 | |
| Lenovo Yoga Pro 9i 16 RTX 5070 | |
| Lenovo ThinkPad T1g Gen 8 21TD003GE | |
| Samsung Galaxy Book6 Ultra | |
| Dell 16 Premium DA16250 | |
| Média Intel Core Ultra 7 356H (20 - 25.1, n=2) | |
| Média da turma Multimedia (5.26 - 36.1, n=59, últimos 2 anos) | |
| LibreOffice / 20 Documents To PDF | |
| Média Intel Core Ultra 7 356H (47.3 - 57.8, n=2) | |
| Média da turma Multimedia (23.9 - 146.7, n=60, últimos 2 anos) | |
| Asus ProArt P16 RTX 5090 | |
| Samsung Galaxy Book6 Ultra | |
| Lenovo Yoga Pro 9i 16 RTX 5070 | |
| Dell 16 Premium DA16250 | |
| Lenovo ThinkPad T1g Gen 8 21TD003GE | |
| R Benchmark 2.5 / Overall mean | |
| Média da turma Multimedia (0.3604 - 0.947, n=59, últimos 2 anos) | |
| Dell 16 Premium DA16250 | |
| Média Intel Core Ultra 7 356H (0.4268 - 0.459, n=2) | |
| Samsung Galaxy Book6 Ultra | |
| Lenovo ThinkPad T1g Gen 8 21TD003GE | |
| Asus ProArt P16 RTX 5090 | |
| Lenovo Yoga Pro 9i 16 RTX 5070 | |
* ... menor é melhor
AIDA64: FP32 Ray-Trace | FPU Julia | CPU SHA3 | CPU Queen | FPU SinJulia | FPU Mandel | CPU AES | CPU ZLib | FP64 Ray-Trace | CPU PhotoWorxx | CPU CheckMate
| Performance rating | |
| Asus ProArt P16 RTX 5090 -1! | |
| Lenovo Yoga Pro 9i 16 RTX 5070 -1! | |
| Lenovo ThinkPad T1g Gen 8 21TD003GE -1! | |
| Samsung Galaxy Book6 Ultra -1! | |
| Média Intel Core Ultra 7 356H -1! | |
| Média da turma Multimedia | |
| AIDA64 / FP32 Ray-Trace | |
| Asus ProArt P16 RTX 5090 (v6.92.6600) | |
| Lenovo Yoga Pro 9i 16 RTX 5070 (v6.92.6600) | |
| Lenovo ThinkPad T1g Gen 8 21TD003GE (v6.92.6600) | |
| Samsung Galaxy Book6 Ultra (v8.20.8100) | |
| Média Intel Core Ultra 7 356H (16303 - 20528, n=2) | |
| Média da turma Multimedia (2214 - 50388, n=56, últimos 2 anos) | |
| AIDA64 / FPU Julia | |
| Asus ProArt P16 RTX 5090 (v6.92.6600) | |
| Lenovo Yoga Pro 9i 16 RTX 5070 (v6.92.6600) | |
| Lenovo ThinkPad T1g Gen 8 21TD003GE (v6.92.6600) | |
| Samsung Galaxy Book6 Ultra (v8.20.8100) | |
| Média Intel Core Ultra 7 356H (81236 - 108092, n=2) | |
| Média da turma Multimedia (12867 - 201874, n=57, últimos 2 anos) | |
| AIDA64 / CPU SHA3 | |
| Lenovo Yoga Pro 9i 16 RTX 5070 (v6.92.6600) | |
| Lenovo ThinkPad T1g Gen 8 21TD003GE (v6.92.6600) | |
| Samsung Galaxy Book6 Ultra (v8.20.8100) | |
| Asus ProArt P16 RTX 5090 (v6.92.6600) | |
| Média Intel Core Ultra 7 356H (4141 - 5284, n=2) | |
| Média da turma Multimedia (626 - 8623, n=57, últimos 2 anos) | |
| AIDA64 / CPU Queen | |
| Asus ProArt P16 RTX 5090 (v6.92.6600) | |
| Média da turma Multimedia (13483 - 181505, n=44, últimos 2 anos) | |
| Lenovo ThinkPad T1g Gen 8 21TD003GE (v6.92.6600) | |
| Lenovo Yoga Pro 9i 16 RTX 5070 (v6.92.6600) | |
| AIDA64 / FPU SinJulia | |
| Asus ProArt P16 RTX 5090 (v6.92.6600) | |
| Lenovo Yoga Pro 9i 16 RTX 5070 (v6.92.6600) | |
| Lenovo ThinkPad T1g Gen 8 21TD003GE (v6.92.6600) | |
| Média da turma Multimedia (886 - 28794, n=57, últimos 2 anos) | |
| Média Intel Core Ultra 7 356H (6960 - 6965, n=2) | |
| Samsung Galaxy Book6 Ultra (v8.20.8100) | |
| AIDA64 / FPU Mandel | |
| Asus ProArt P16 RTX 5090 (v6.92.6600) | |
| Lenovo Yoga Pro 9i 16 RTX 5070 (v6.92.6600) | |
| Lenovo ThinkPad T1g Gen 8 21TD003GE (v6.92.6600) | |
| Samsung Galaxy Book6 Ultra (v8.20.8100) | |
| Média Intel Core Ultra 7 356H (44538 - 58505, n=2) | |
| Média da turma Multimedia (6395 - 105740, n=56, últimos 2 anos) | |
| AIDA64 / CPU AES | |
| Asus ProArt P16 RTX 5090 (v6.92.6600) | |
| Lenovo Yoga Pro 9i 16 RTX 5070 (v6.92.6600) | |
| Lenovo ThinkPad T1g Gen 8 21TD003GE (v6.92.6600) | |
| Samsung Galaxy Book6 Ultra (v8.20.8100) | |
| Média Intel Core Ultra 7 356H (64920 - 67037, n=2) | |
| Média da turma Multimedia (8171 - 126790, n=57, últimos 2 anos) | |
| AIDA64 / CPU ZLib | |
| Asus ProArt P16 RTX 5090 (v6.92.6600) | |
| Lenovo Yoga Pro 9i 16 RTX 5070 (v6.92.6600) | |
| Lenovo ThinkPad T1g Gen 8 21TD003GE (v6.92.6600) | |
| Samsung Galaxy Book6 Ultra (v8.20.8100) | |
| Média Intel Core Ultra 7 356H (1086 - 1199, n=2) | |
| Média da turma Multimedia (143.8 - 2022, n=57, últimos 2 anos) | |
| AIDA64 / FP64 Ray-Trace | |
| Asus ProArt P16 RTX 5090 (v6.92.6600) | |
| Lenovo Yoga Pro 9i 16 RTX 5070 (v6.92.6600) | |
| Lenovo ThinkPad T1g Gen 8 21TD003GE (v6.92.6600) | |
| Samsung Galaxy Book6 Ultra (v8.20.8100) | |
| Média Intel Core Ultra 7 356H (8201 - 11057, n=2) | |
| Média da turma Multimedia (1014 - 26875, n=57, últimos 2 anos) | |
| AIDA64 / CPU PhotoWorxx | |
| Média Intel Core Ultra 7 356H (83099 - 83163, n=2) | |
| Samsung Galaxy Book6 Ultra (v8.20.8100) | |
| Lenovo Yoga Pro 9i 16 RTX 5070 (v6.92.6600) | |
| Lenovo ThinkPad T1g Gen 8 21TD003GE (v6.92.6600) | |
| Média da turma Multimedia (8187 - 88154, n=57, últimos 2 anos) | |
| Asus ProArt P16 RTX 5090 (v6.92.6600) | |
| AIDA64 / CPU CheckMate | |
| Samsung Galaxy Book6 Ultra (v8.20.8100) | |
| Média Intel Core Ultra 7 356H (4196 - 4629, n=2) | |
| Média da turma Multimedia (569 - 4742, n=16, últimos 2 anos) | |
Desempenho do sistema
A impressão subjetiva de desempenho é excelente e as pontuações de benchmark são muito altas. Não encontramos nenhum problema de estabilidade durante o período de análise.
PCMark 10: Score | Essentials | Productivity | Digital Content Creation
CrossMark: Overall | Productivity | Creativity | Responsiveness
WebXPRT 3: Overall
WebXPRT 4: Overall
Mozilla Kraken 1.1: Total
| Performance rating | |
| Apple MacBook Pro 16 2024 M4 Pro -4! | |
| Lenovo ThinkPad T1g Gen 8 21TD003GE | |
| Lenovo Yoga Pro 9i 16 RTX 5070 | |
| Samsung Galaxy Book6 Ultra | |
| Média Intel Core Ultra 7 356H, NVIDIA GeForce RTX 5070 Laptop | |
| Dell 16 Premium DA16250 -4! | |
| Média da turma Multimedia | |
| Asus ProArt P16 RTX 5090 -4! | |
| PCMark 10 / Score | |
| Lenovo ThinkPad T1g Gen 8 21TD003GE | |
| Samsung Galaxy Book6 Ultra | |
| Média Intel Core Ultra 7 356H, NVIDIA GeForce RTX 5070 Laptop (n=1) | |
| Lenovo Yoga Pro 9i 16 RTX 5070 | |
| Média da turma Multimedia (4325 - 10386, n=55, últimos 2 anos) | |
| PCMark 10 / Essentials | |
| Lenovo Yoga Pro 9i 16 RTX 5070 | |
| Média da turma Multimedia (8025 - 11664, n=54, últimos 2 anos) | |
| Lenovo ThinkPad T1g Gen 8 21TD003GE | |
| Samsung Galaxy Book6 Ultra | |
| Média Intel Core Ultra 7 356H, NVIDIA GeForce RTX 5070 Laptop (n=1) | |
| PCMark 10 / Productivity | |
| Lenovo ThinkPad T1g Gen 8 21TD003GE | |
| Samsung Galaxy Book6 Ultra | |
| Média Intel Core Ultra 7 356H, NVIDIA GeForce RTX 5070 Laptop (n=1) | |
| Média da turma Multimedia (7323 - 18233, n=54, últimos 2 anos) | |
| Lenovo Yoga Pro 9i 16 RTX 5070 | |
| PCMark 10 / Digital Content Creation | |
| Lenovo Yoga Pro 9i 16 RTX 5070 | |
| Lenovo ThinkPad T1g Gen 8 21TD003GE | |
| Samsung Galaxy Book6 Ultra | |
| Média Intel Core Ultra 7 356H, NVIDIA GeForce RTX 5070 Laptop (n=1) | |
| Média da turma Multimedia (3651 - 16240, n=54, últimos 2 anos) | |
| CrossMark / Overall | |
| Lenovo ThinkPad T1g Gen 8 21TD003GE | |
| Apple MacBook Pro 16 2024 M4 Pro | |
| Lenovo Yoga Pro 9i 16 RTX 5070 | |
| Dell 16 Premium DA16250 | |
| Asus ProArt P16 RTX 5090 | |
| Samsung Galaxy Book6 Ultra | |
| Média Intel Core Ultra 7 356H, NVIDIA GeForce RTX 5070 Laptop (n=1) | |
| Média da turma Multimedia (866 - 2728, n=63, últimos 2 anos) | |
| CrossMark / Productivity | |
| Lenovo ThinkPad T1g Gen 8 21TD003GE | |
| Apple MacBook Pro 16 2024 M4 Pro | |
| Lenovo Yoga Pro 9i 16 RTX 5070 | |
| Dell 16 Premium DA16250 | |
| Asus ProArt P16 RTX 5090 | |
| Média da turma Multimedia (931 - 2489, n=63, últimos 2 anos) | |
| Samsung Galaxy Book6 Ultra | |
| Média Intel Core Ultra 7 356H, NVIDIA GeForce RTX 5070 Laptop (n=1) | |
| CrossMark / Creativity | |
| Apple MacBook Pro 16 2024 M4 Pro | |
| Lenovo ThinkPad T1g Gen 8 21TD003GE | |
| Lenovo Yoga Pro 9i 16 RTX 5070 | |
| Asus ProArt P16 RTX 5090 | |
| Samsung Galaxy Book6 Ultra | |
| Média Intel Core Ultra 7 356H, NVIDIA GeForce RTX 5070 Laptop (n=1) | |
| Dell 16 Premium DA16250 | |
| Média da turma Multimedia (907 - 3465, n=63, últimos 2 anos) | |
| CrossMark / Responsiveness | |
| Lenovo ThinkPad T1g Gen 8 21TD003GE | |
| Dell 16 Premium DA16250 | |
| Lenovo Yoga Pro 9i 16 RTX 5070 | |
| Apple MacBook Pro 16 2024 M4 Pro | |
| Samsung Galaxy Book6 Ultra | |
| Média Intel Core Ultra 7 356H, NVIDIA GeForce RTX 5070 Laptop (n=1) | |
| Média da turma Multimedia (605 - 2024, n=63, últimos 2 anos) | |
| Asus ProArt P16 RTX 5090 | |
| WebXPRT 3 / Overall | |
| Apple MacBook Pro 16 2024 M4 Pro | |
| Lenovo Yoga Pro 9i 16 RTX 5070 | |
| Média da turma Multimedia (136.4 - 596, n=66, últimos 2 anos) | |
| Dell 16 Premium DA16250 | |
| Lenovo ThinkPad T1g Gen 8 21TD003GE | |
| Samsung Galaxy Book6 Ultra | |
| Média Intel Core Ultra 7 356H, NVIDIA GeForce RTX 5070 Laptop (n=1) | |
| Asus ProArt P16 RTX 5090 | |
| WebXPRT 4 / Overall | |
| Apple MacBook Pro 16 2024 M4 Pro | |
| Lenovo Yoga Pro 9i 16 RTX 5070 | |
| Lenovo ThinkPad T1g Gen 8 21TD003GE | |
| Dell 16 Premium DA16250 | |
| Samsung Galaxy Book6 Ultra | |
| Média Intel Core Ultra 7 356H, NVIDIA GeForce RTX 5070 Laptop (n=1) | |
| Média da turma Multimedia (167.3 - 402, n=68, últimos 2 anos) | |
| Asus ProArt P16 RTX 5090 | |
| Mozilla Kraken 1.1 / Total | |
| Dell 16 Premium DA16250 | |
| Samsung Galaxy Book6 Ultra | |
| Média Intel Core Ultra 7 356H, NVIDIA GeForce RTX 5070 Laptop (n=1) | |
| Média da turma Multimedia (228 - 835, n=69, últimos 2 anos) | |
| Lenovo ThinkPad T1g Gen 8 21TD003GE | |
| Lenovo Yoga Pro 9i 16 RTX 5070 | |
| Asus ProArt P16 RTX 5090 | |
| Apple MacBook Pro 16 2024 M4 Pro | |
* ... menor é melhor
| PCMark 10 Score | 9383 pontos | |
Ajuda | ||
| AIDA64 / Memory Copy | |
| Média Intel Core Ultra 7 356H (116043 - 121055, n=2) | |
| Samsung Galaxy Book6 Ultra | |
| Lenovo Yoga Pro 9i 16 RTX 5070 | |
| Lenovo ThinkPad T1g Gen 8 21TD003GE | |
| Asus ProArt P16 RTX 5090 | |
| Média da turma Multimedia (11299 - 132135, n=57, últimos 2 anos) | |
| AIDA64 / Memory Read | |
| Média Intel Core Ultra 7 356H (107881 - 112376, n=2) | |
| Samsung Galaxy Book6 Ultra | |
| Asus ProArt P16 RTX 5090 | |
| Lenovo Yoga Pro 9i 16 RTX 5070 | |
| Média da turma Multimedia (11624 - 174586, n=57, últimos 2 anos) | |
| Lenovo ThinkPad T1g Gen 8 21TD003GE | |
| AIDA64 / Memory Write | |
| Média Intel Core Ultra 7 356H (120431 - 120449, n=2) | |
| Samsung Galaxy Book6 Ultra | |
| Asus ProArt P16 RTX 5090 | |
| Média da turma Multimedia (11755 - 134998, n=57, últimos 2 anos) | |
| Lenovo ThinkPad T1g Gen 8 21TD003GE | |
| Lenovo Yoga Pro 9i 16 RTX 5070 | |
| AIDA64 / Memory Latency | |
| Lenovo ThinkPad T1g Gen 8 21TD003GE | |
| Média da turma Multimedia (7 - 535, n=56, últimos 2 anos) | |
| Lenovo Yoga Pro 9i 16 RTX 5070 | |
| Asus ProArt P16 RTX 5090 | |
| Samsung Galaxy Book6 Ultra | |
| Média Intel Core Ultra 7 356H (88.6 - 90, n=2) | |
* ... menor é melhor
Latência DPC
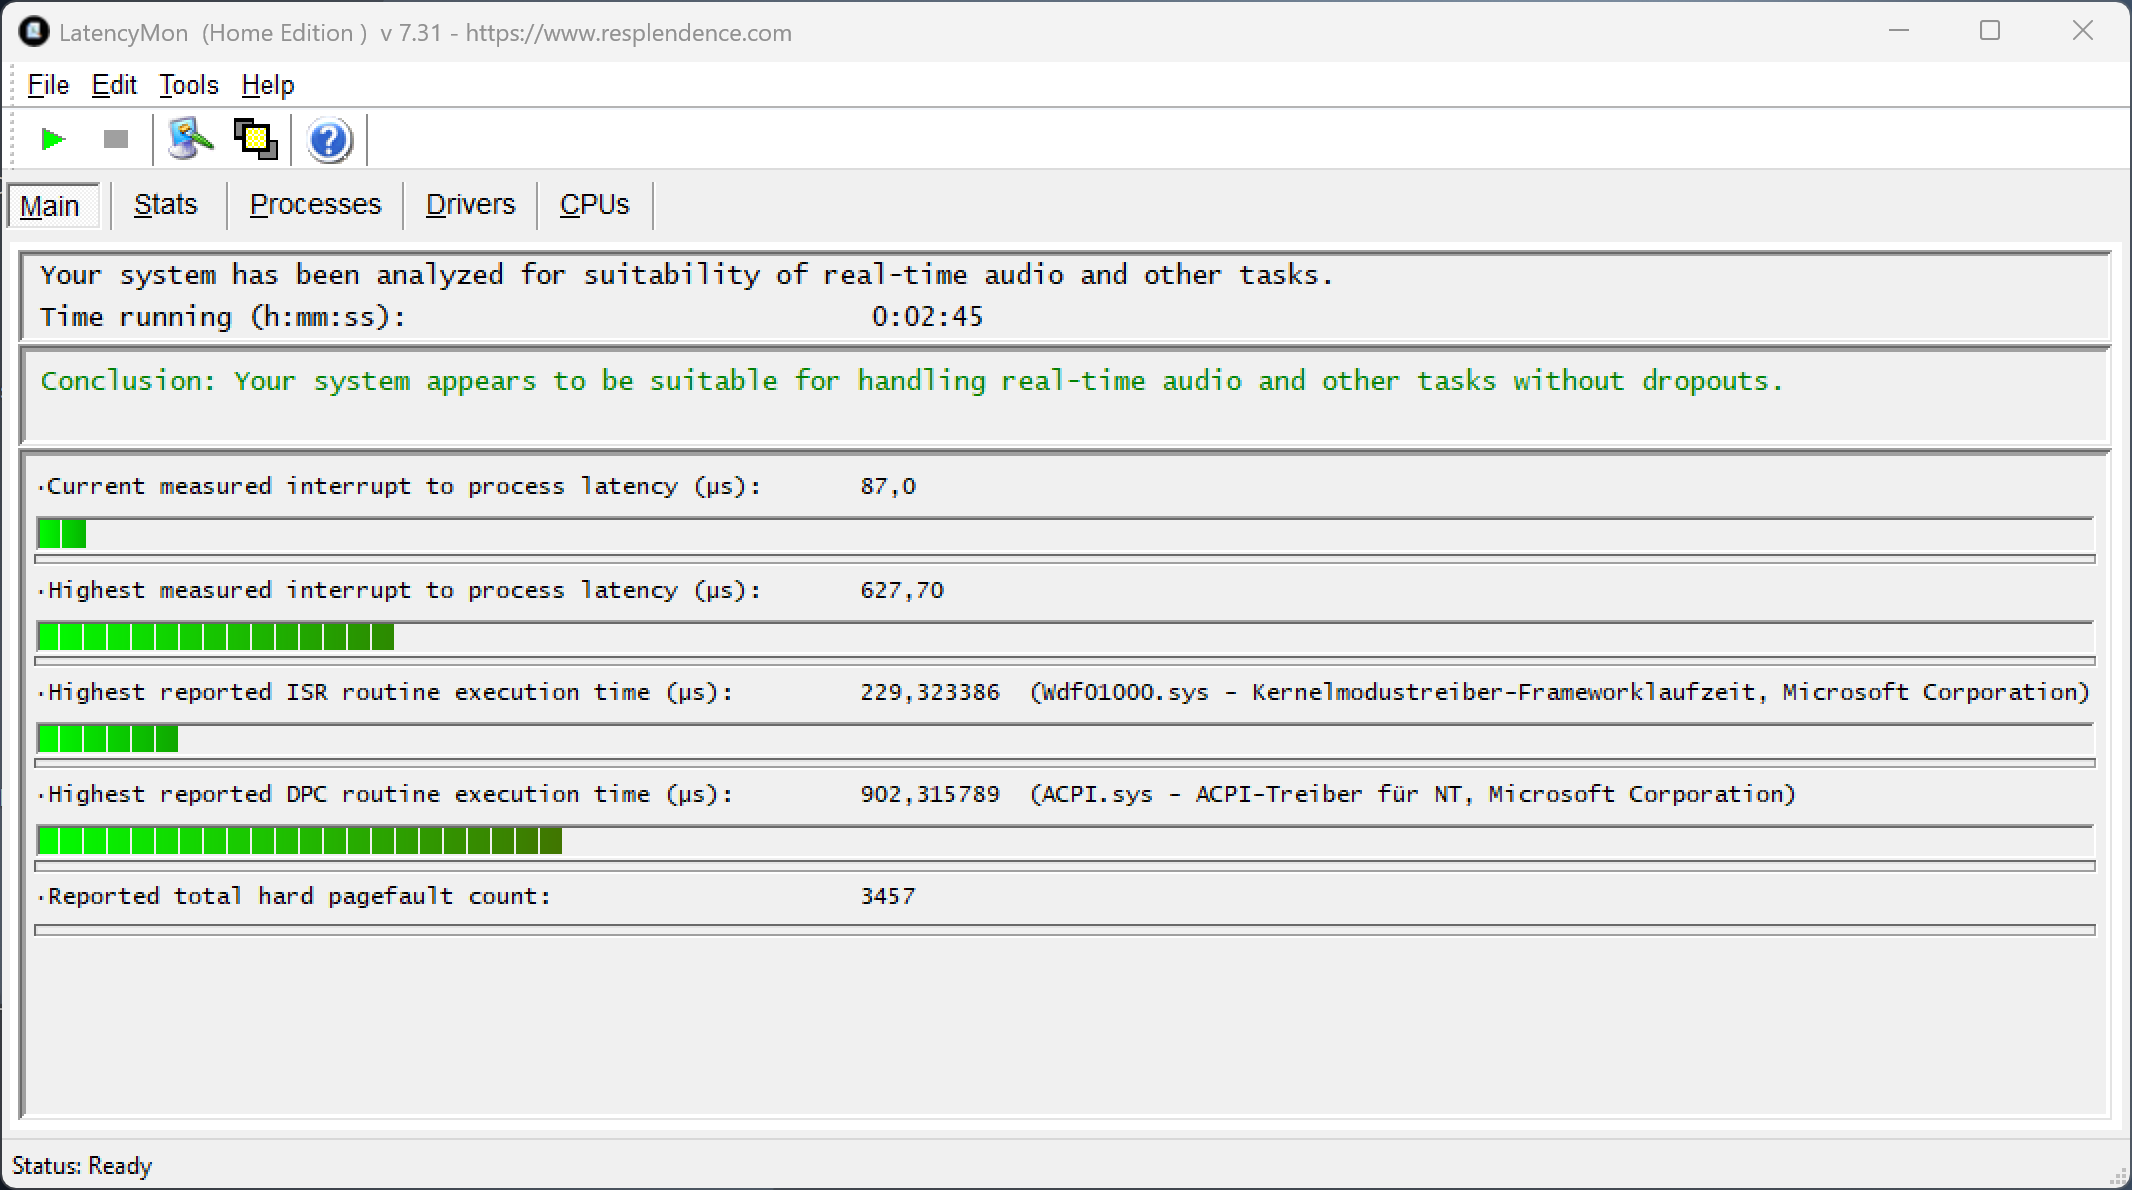
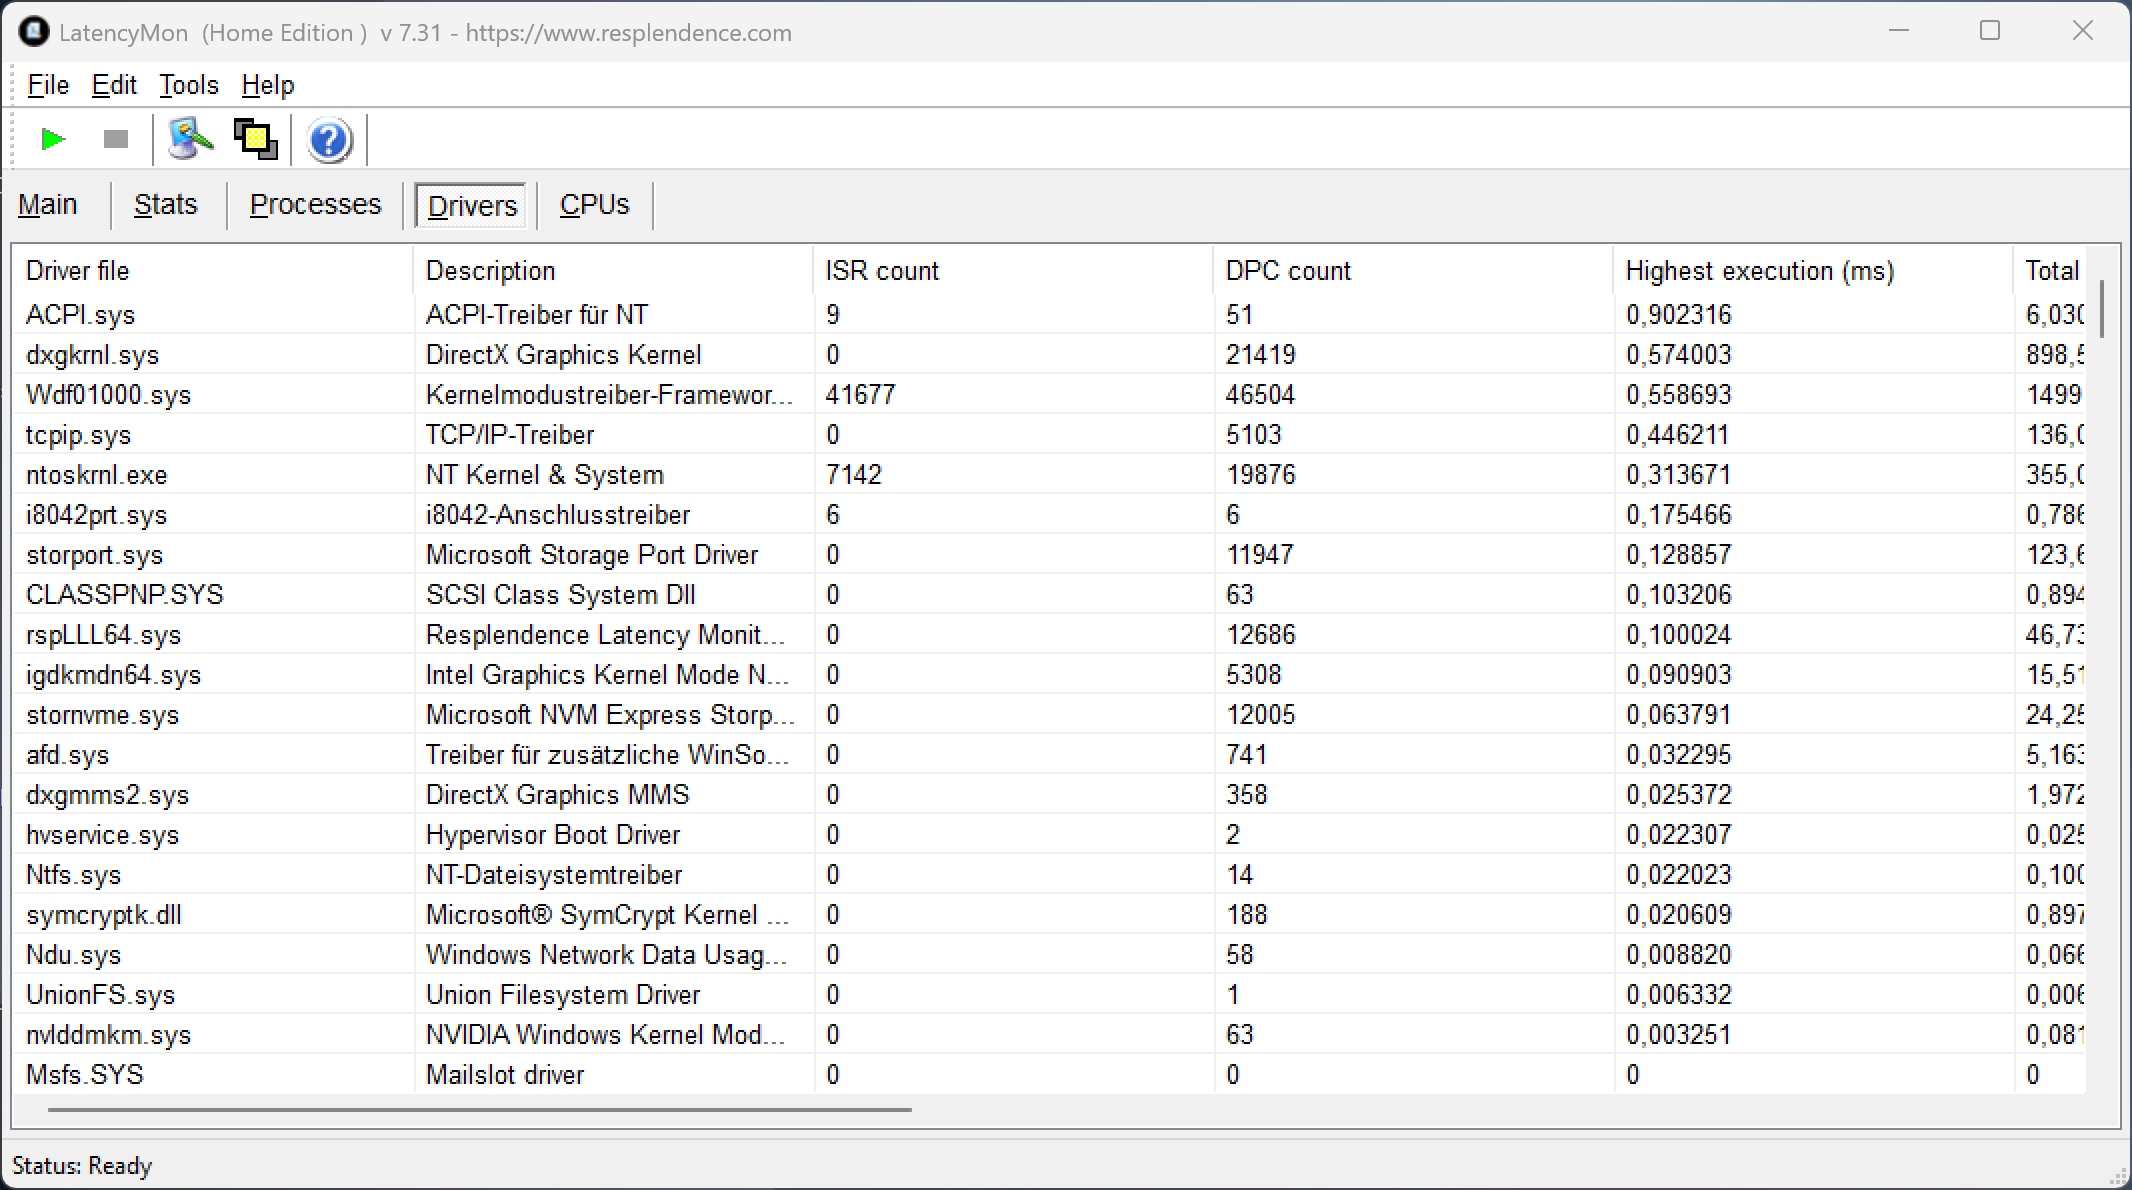
A unidade de análise não apresentou nenhum problema com aplicativos de áudio em tempo real durante nosso teste de latência padronizado (navegação na Web, reprodução em 4K no YouTube, carga da CPU).
| DPC Latencies / LatencyMon - interrupt to process latency (max), Web, Youtube, Prime95 | |
| Asus ProArt P16 RTX 5090 | |
| Lenovo ThinkPad T1g Gen 8 21TD003GE | |
| Lenovo Yoga Pro 9i 16 RTX 5070 | |
| Samsung Galaxy Book6 Ultra | |
| Dell 16 Premium DA16250 | |
* ... menor é melhor
Dispositivos de armazenamento
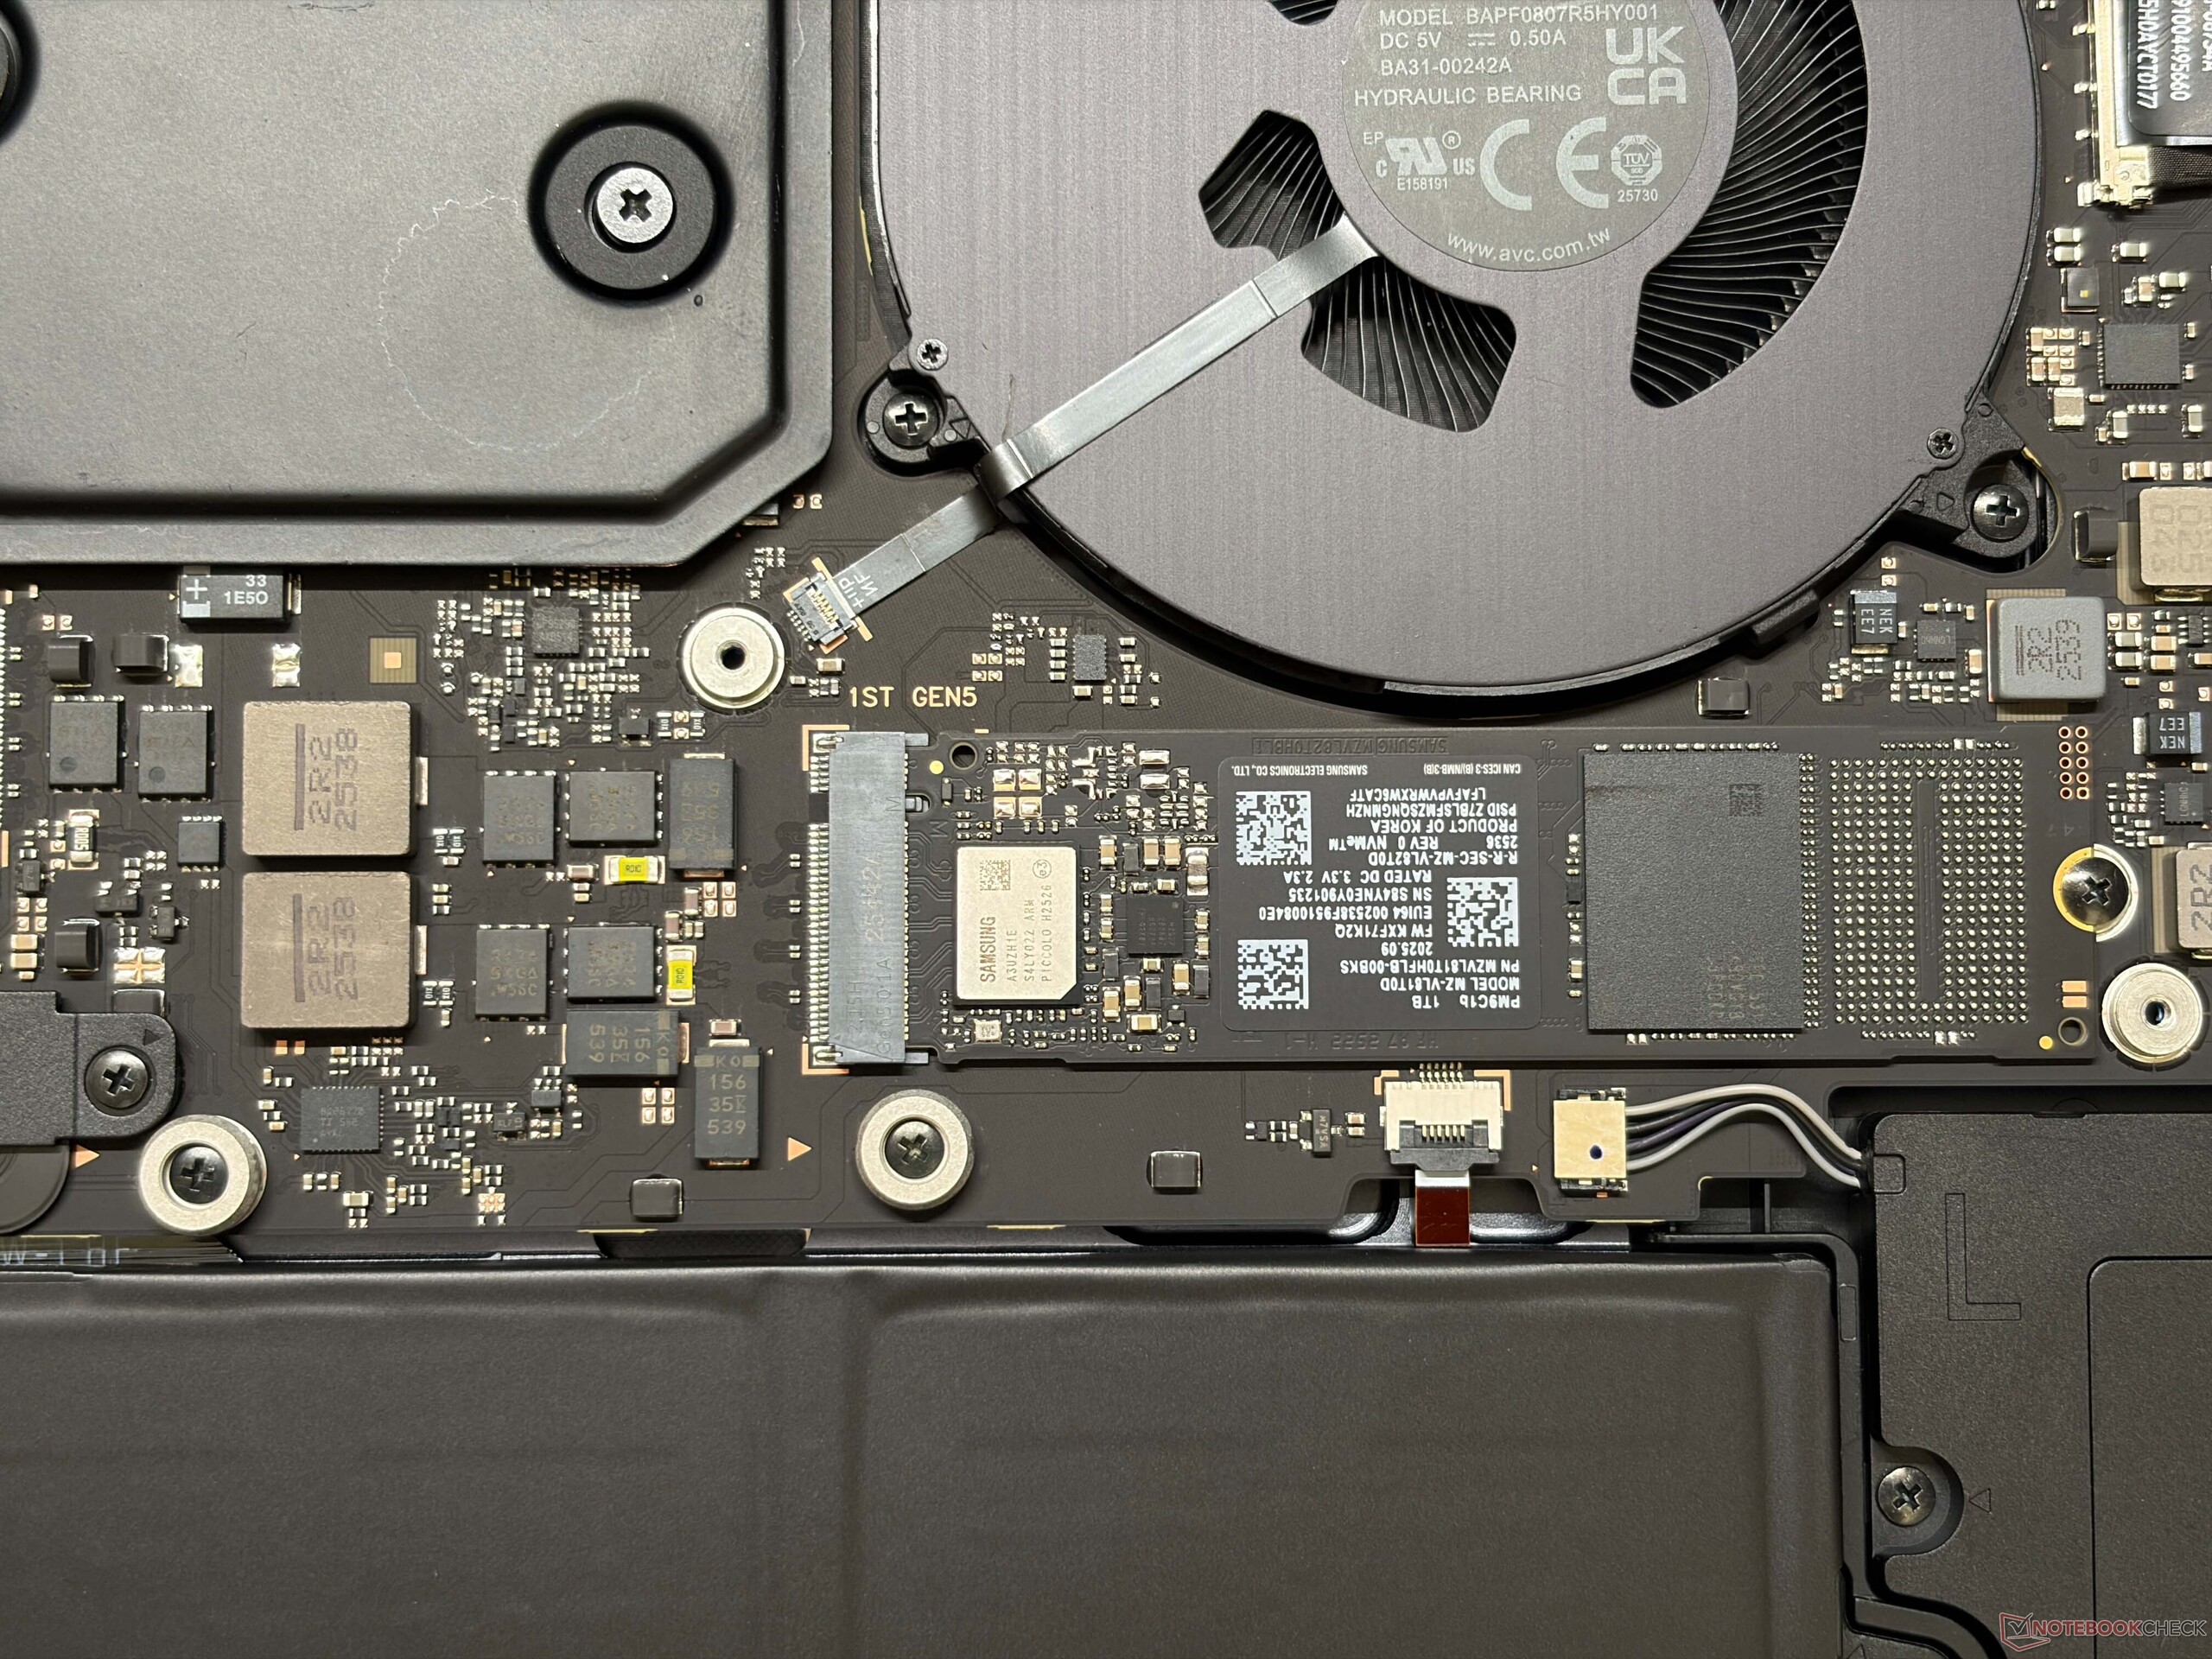
Nossa unidade de análise está equipada com uma unidade de 1 TB da Samsung (PM9C1b, 846 GB livres) com taxas de transferência decentes e estáveis. Há também um slot secundário M.2-2280 se o senhor quiser adicionar mais armazenamento, mas ambos os slots são limitados a PCIe 4.0.

* ... menor é melhor
Limitação de disco: Loop de leitura do DiskSpd, profundidade da fila 8
Desempenho da GPU
O GeForce RTX 5070 pode consumir até 90 Watts e oferece bons números de desempenho para um laptop multimídia. O desempenho em jogos também é bom e estável, mas a quantidade limitada de VRAM (8 GB) pode ser uma limitação em jogos exigentes. Consulte nosso artigo dedicado para obter mais informações.
| 3DMark 11 Performance | 33399 pontos | |
| 3DMark Fire Strike Score | 27336 pontos | |
| 3DMark Time Spy Score | 11467 pontos | |
| 3DMark Steel Nomad Score | 2784 pontos | |
| 3DMark Steel Nomad Light Score | 12271 pontos | |
Ajuda | ||
| Blender / v3.3 Classroom OPTIX/RTX | |
| Média da turma Multimedia (12 - 105, n=23, últimos 2 anos) | |
| Lenovo Yoga Pro 9i 16 RTX 5070 | |
| Lenovo ThinkPad T1g Gen 8 21TD003GE | |
| Dell 16 Premium DA16250 | |
| Samsung Galaxy Book6 Ultra | |
| Média NVIDIA GeForce RTX 5070 Laptop (17 - 24, n=28) | |
| Asus ProArt P16 RTX 5090 | |
| Blender / v3.3 Classroom CUDA | |
| Média da turma Multimedia (20 - 186, n=23, últimos 2 anos) | |
| Média NVIDIA GeForce RTX 5070 Laptop (29 - 228, n=29) | |
| Lenovo ThinkPad T1g Gen 8 21TD003GE | |
| Dell 16 Premium DA16250 | |
| Lenovo Yoga Pro 9i 16 RTX 5070 | |
| Samsung Galaxy Book6 Ultra | |
| Asus ProArt P16 RTX 5090 | |
| Blender / v3.3 Classroom CPU | |
| Média da turma Multimedia (134.5 - 1042, n=64, últimos 2 anos) | |
| Dell 16 Premium DA16250 | |
| Samsung Galaxy Book6 Ultra | |
| Lenovo ThinkPad T1g Gen 8 21TD003GE | |
| Média NVIDIA GeForce RTX 5070 Laptop (137 - 507, n=26) | |
| Lenovo Yoga Pro 9i 16 RTX 5070 | |
| Asus ProArt P16 RTX 5090 | |
* ... menor é melhor
| GTA V - 1920x1080 Highest AA:4xMSAA + FX AF:16x | |
| Lenovo Yoga Pro 9i 16 RTX 5070 | |
| Samsung Galaxy Book6 Ultra | |
| Lenovo ThinkPad T1g Gen 8 21TD003GE | |
| Dell 16 Premium DA16250 | |
| Asus ProArt P16 RTX 5090 | |
| Média da turma Multimedia (7.92 - 141.6, n=59, últimos 2 anos) | |
| Final Fantasy XV Benchmark - 1920x1080 High Quality | |
| Asus ProArt P16 RTX 5090 | |
| Lenovo Yoga Pro 9i 16 RTX 5070 | |
| Lenovo ThinkPad T1g Gen 8 21TD003GE | |
| Samsung Galaxy Book6 Ultra | |
| Dell 16 Premium DA16250 | |
| Média da turma Multimedia (7.61 - 144.4, n=61, últimos 2 anos) | |
| Strange Brigade - 1920x1080 ultra AA:ultra AF:16 | |
| Asus ProArt P16 RTX 5090 | |
| Lenovo Yoga Pro 9i 16 RTX 5070 | |
| Samsung Galaxy Book6 Ultra | |
| Lenovo ThinkPad T1g Gen 8 21TD003GE | |
| Dell 16 Premium DA16250 | |
| Média da turma Multimedia (13.3 - 303, n=61, últimos 2 anos) | |
| Dota 2 Reborn - 1920x1080 ultra (3/3) best looking | |
| Lenovo Yoga Pro 9i 16 RTX 5070 | |
| Dell 16 Premium DA16250 | |
| Samsung Galaxy Book6 Ultra | |
| Lenovo ThinkPad T1g Gen 8 21TD003GE | |
| Asus ProArt P16 RTX 5090 | |
| Média da turma Multimedia (29 - 179.9, n=63, últimos 2 anos) | |
Gráfico de ultra FPS do Cyberpunk 2077
| baixo | média | alto | ultra | QHD DLSS | QHD | 4K | |
|---|---|---|---|---|---|---|---|
| GTA V (2015) | 137.1 | 111.9 | |||||
| Dota 2 Reborn (2015) | 173.3 | 155.4 | 149.3 | 139.7 | |||
| Final Fantasy XV Benchmark (2018) | 178.8 | 137.3 | 116.6 | 88.8 | 48.7 | ||
| X-Plane 11.11 (2018) | 109.6 | 102.4 | 76 | ||||
| Strange Brigade (2018) | 479 | 315 | 257 | 220 | 151.8 | ||
| Baldur's Gate 3 (2023) | 149.1 | 129.7 | 111.1 | 109.2 | 76.2 | ||
| Cyberpunk 2077 (2023) | 114.1 | 104 | 92.5 | 84.6 | 67.5 | 57.4 | |
| F1 24 (2024) | 257 | 217 | 77.5 | 77.2 | 49.5 |
Emissões e consumo de energia
Ruído do sistema

A Samsung usa uma unidade de resfriamento de câmara de vapor com duas ventoinhas e o Galaxy Book6 Ultra é um dispositivo muito silencioso em situações cotidianas, mesmo no perfil de energia de alto desempenho. Quando o usuário começa a estressar os componentes, as ventoinhas se tornam audíveis e medimos um ruído máximo de 48,5 dB(A). Os outros perfis de energia são mais silenciosos (33-40 dB(A)), mas o senhor também sacrificará um pouco do desempenho. Nossa unidade de teste não apresentou problemas com outros ruídos eletrônicos.
Barulho
| Ocioso |
| 25.1 / 25.1 / 25.1 dB |
| Carga |
| 36.9 / 48.5 dB |
 | ||
30 dB silencioso 40 dB(A) audível 50 dB(A) ruidosamente alto |
||
min: | ||
| Samsung Galaxy Book6 Ultra Ultra 7 356H, GeForce RTX 5070 Laptop | Apple MacBook Pro 16 2024 M4 Pro M4 Pro 14-Core, M4 Pro 20-Core GPU | Lenovo Yoga Pro 9i 16 RTX 5070 Ultra 9 285H, GeForce RTX 5070 Laptop | Asus ProArt P16 RTX 5090 Ryzen AI 9 HX 370, GeForce RTX 5090 Laptop | Dell 16 Premium DA16250 Ultra 7 255H, GeForce RTX 5070 Laptop | Lenovo ThinkPad T1g Gen 8 21TD003GE Ultra 9 285H, GeForce RTX 5070 Laptop | |
|---|---|---|---|---|---|---|
| Noise | 13% | -4% | -9% | 2% | -1% | |
| desligado / ambiente * (dB) | 25.1 | 24 4% | 24.1 4% | 24.2 4% | 23.2 8% | 25 -0% |
| Idle Minimum * (dB) | 25.1 | 24 4% | 24.1 4% | 24.2 4% | 23.2 8% | 25 -0% |
| Idle Average * (dB) | 25.1 | 24 4% | 24.1 4% | 27.6 -10% | 23.2 8% | 25 -0% |
| Idle Maximum * (dB) | 25.1 | 24 4% | 25.1 -0% | 32.6 -30% | 26.6 -6% | 27.3 -9% |
| Load Average * (dB) | 36.9 | 25.3 31% | 44.2 -20% | 42.6 -15% | 39.4 -7% | 37.3 -1% |
| Cyberpunk 2077 ultra * (dB) | 48.5 | 33.9 30% | 52.7 -9% | 51.2 -6% | 47.3 2% | 47.8 1% |
| Load Maximum * (dB) | 48.5 | 42.3 13% | 52.7 -9% | 53.2 -10% | 48.9 -1% | 47.8 1% |
* ... menor é melhor
Temperatura
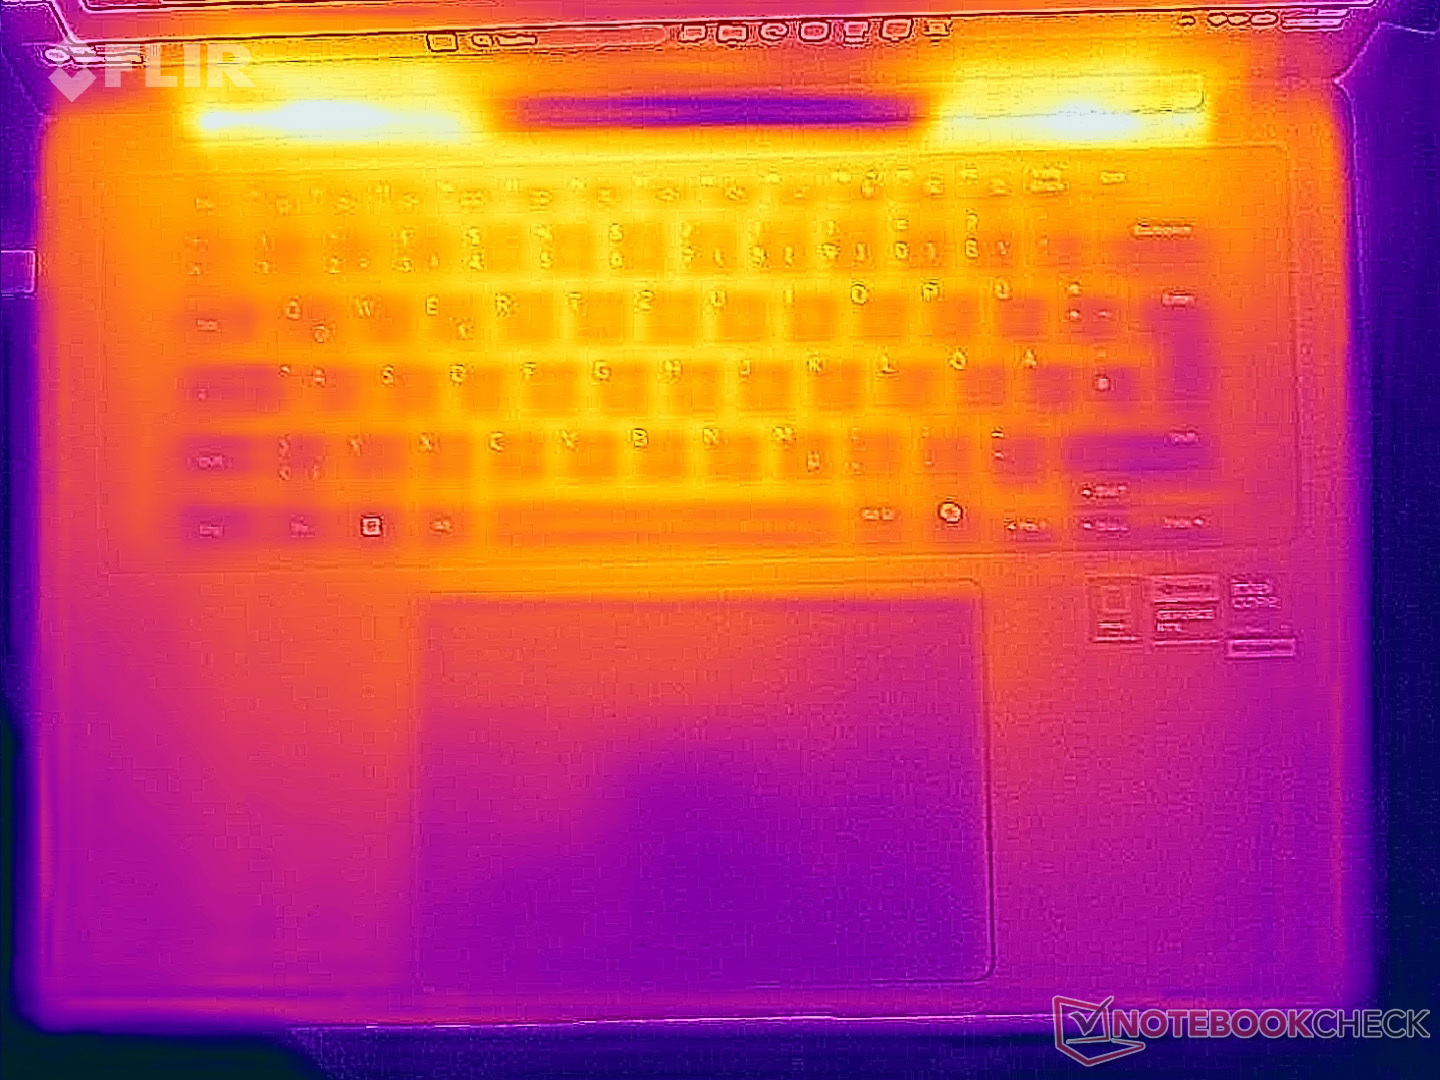
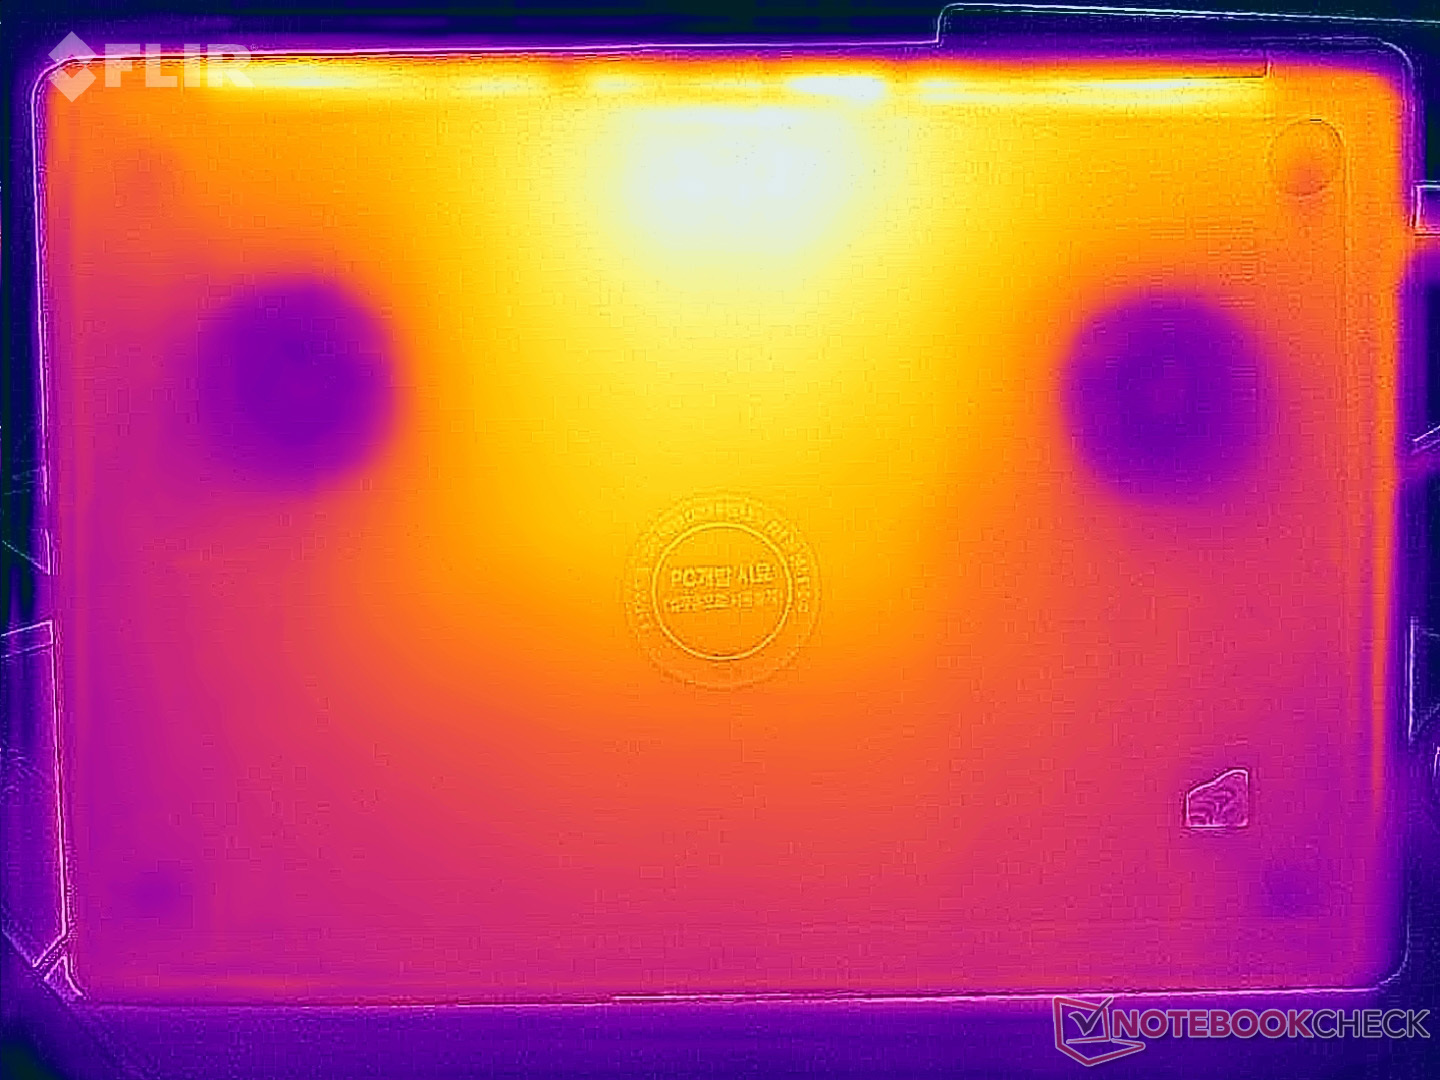
As superfícies de alumínio são muito frias em situações cotidianas, mas alguns pontos ficam bem quentes sob carga. Medimos quase 50 °C na seção central superior do painel inferior, portanto, é preciso evitar o contato com a pele. Caso contrário, não há limitações e o teclado aquece apenas até ~40 °C, portanto, a digitação não é afetada. Durante o teste de estresse, a CPU se estabiliza em apenas 20 Watts, enquanto a GPU mantém 80 Watts.

(±) A temperatura máxima no lado superior é 42.7 °C / 109 F, em comparação com a média de 36.8 °C / 98 F , variando de 21 a 71 °C para a classe Multimedia.
(-) A parte inferior aquece até um máximo de 49.1 °C / 120 F, em comparação com a média de 39.1 °C / 102 F
(+) Em uso inativo, a temperatura média para o lado superior é 24.9 °C / 77 F, em comparação com a média do dispositivo de 31.3 °C / ### class_avg_f### F.
(-) 3: The average temperature for the upper side is 38.5 °C / 101 F, compared to the average of 31.3 °C / 88 F for the class Multimedia.
(+) Os apoios para as mãos e o touchpad estão atingindo a temperatura máxima da pele (34.7 °C / 94.5 F) e, portanto, não estão quentes.
(-) A temperatura média da área do apoio para as mãos de dispositivos semelhantes foi 28.7 °C / 83.7 F (-6 °C / -10.8 F).
| Samsung Galaxy Book6 Ultra Ultra 7 356H, GeForce RTX 5070 Laptop | Apple MacBook Pro 16 2024 M4 Pro M4 Pro 14-Core, M4 Pro 20-Core GPU | Lenovo Yoga Pro 9i 16 RTX 5070 Ultra 9 285H, GeForce RTX 5070 Laptop | Asus ProArt P16 RTX 5090 Ryzen AI 9 HX 370, GeForce RTX 5090 Laptop | Dell 16 Premium DA16250 Ultra 7 255H, GeForce RTX 5070 Laptop | Lenovo ThinkPad T1g Gen 8 21TD003GE Ultra 9 285H, GeForce RTX 5070 Laptop | |
|---|---|---|---|---|---|---|
| Heat | 11% | -2% | -3% | -0% | -1% | |
| Maximum Upper Side * (°C) | 42.7 | 42.7 -0% | 41.8 2% | 47 -10% | 36.8 14% | 44.7 -5% |
| Maximum Bottom * (°C) | 49.1 | 43.1 12% | 47.9 2% | 51.6 -5% | 34.8 29% | 42.8 13% |
| Idle Upper Side * (°C) | 25.4 | 21.5 15% | 26.3 -4% | 24.9 2% | 31.2 -23% | 26.9 -6% |
| Idle Bottom * (°C) | 25.5 | 21.5 16% | 27.6 -8% | 25.5 -0% | 30.8 -21% | 27.3 -7% |
* ... menor é melhor
Alto-falantes
O sistema de áudio com seis alto-falantes oferece um desempenho de som impressionante e não precisa se esconder atrás da concorrência. No entanto, para ser justo, todos os dispositivos de comparação oferecem excelente qualidade de som e será difícil ouvir a diferença.
Samsung Galaxy Book6 Ultra análise de áudio
(+) | os alto-falantes podem tocar relativamente alto (###valor### dB)
Graves 100 - 315Hz
(±) | graves reduzidos - em média 5.9% menor que a mediana
(±) | a linearidade dos graves é média (7.9% delta para a frequência anterior)
Médios 400 - 2.000 Hz
(+) | médios equilibrados - apenas 3.7% longe da mediana
(+) | médios são lineares (4.3% delta para frequência anterior)
Altos 2 - 16 kHz
(+) | agudos equilibrados - apenas 2.2% longe da mediana
(+) | os máximos são lineares (3.4% delta da frequência anterior)
Geral 100 - 16.000 Hz
(+) | o som geral é linear (7.3% diferença em relação à mediana)
Comparado com a mesma classe
» 6% de todos os dispositivos testados nesta classe foram melhores, 1% semelhantes, 94% piores
» O melhor teve um delta de 5%, a média foi 17%, o pior foi 45%
Comparado com todos os dispositivos testados
» 1% de todos os dispositivos testados foram melhores, 0% semelhantes, 99% piores
» O melhor teve um delta de 4%, a média foi 23%, o pior foi 134%
Apple MacBook Pro 16 2024 M4 Pro análise de áudio
(+) | os alto-falantes podem tocar relativamente alto (###valor### dB)
Graves 100 - 315Hz
(±) | graves reduzidos - em média 5.1% menor que a mediana
(+) | o baixo é linear (5.6% delta para a frequência anterior)
Médios 400 - 2.000 Hz
(+) | médios equilibrados - apenas 1.4% longe da mediana
(+) | médios são lineares (2.4% delta para frequência anterior)
Altos 2 - 16 kHz
(+) | agudos equilibrados - apenas 1.6% longe da mediana
(+) | os máximos são lineares (3% delta da frequência anterior)
Geral 100 - 16.000 Hz
(+) | o som geral é linear (4.8% diferença em relação à mediana)
Comparado com a mesma classe
» 0% de todos os dispositivos testados nesta classe foram melhores, 0% semelhantes, 99% piores
» O melhor teve um delta de 5%, a média foi 17%, o pior foi 45%
Comparado com todos os dispositivos testados
» 0% de todos os dispositivos testados foram melhores, 0% semelhantes, 100% piores
» O melhor teve um delta de 4%, a média foi 23%, o pior foi 134%
Lenovo Yoga Pro 9i 16 RTX 5070 análise de áudio
(±) | o volume do alto-falante é médio, mas bom (###valor### dB)
Graves 100 - 315Hz
(±) | graves reduzidos - em média 5.5% menor que a mediana
(±) | a linearidade dos graves é média (7.5% delta para a frequência anterior)
Médios 400 - 2.000 Hz
(+) | médios equilibrados - apenas 1.7% longe da mediana
(+) | médios são lineares (3.1% delta para frequência anterior)
Altos 2 - 16 kHz
(±) | máximos reduzidos - em média 6.2% menor que a mediana
(+) | os máximos são lineares (3.9% delta da frequência anterior)
Geral 100 - 16.000 Hz
(+) | o som geral é linear (9.7% diferença em relação à mediana)
Comparado com a mesma classe
» 13% de todos os dispositivos testados nesta classe foram melhores, 1% semelhantes, 85% piores
» O melhor teve um delta de 5%, a média foi 17%, o pior foi 45%
Comparado com todos os dispositivos testados
» 4% de todos os dispositivos testados foram melhores, 1% semelhantes, 95% piores
» O melhor teve um delta de 4%, a média foi 23%, o pior foi 134%
Asus ProArt P16 RTX 5090 análise de áudio
(±) | o volume do alto-falante é médio, mas bom (###valor### dB)
Graves 100 - 315Hz
(+) | bons graves - apenas 3.3% longe da mediana
(±) | a linearidade dos graves é média (7.7% delta para a frequência anterior)
Médios 400 - 2.000 Hz
(+) | médios equilibrados - apenas 2.9% longe da mediana
(+) | médios são lineares (1.9% delta para frequência anterior)
Altos 2 - 16 kHz
(+) | agudos equilibrados - apenas 4.1% longe da mediana
(+) | os máximos são lineares (5.5% delta da frequência anterior)
Geral 100 - 16.000 Hz
(+) | o som geral é linear (8.3% diferença em relação à mediana)
Comparado com a mesma classe
» 9% de todos os dispositivos testados nesta classe foram melhores, 2% semelhantes, 89% piores
» O melhor teve um delta de 5%, a média foi 17%, o pior foi 45%
Comparado com todos os dispositivos testados
» 2% de todos os dispositivos testados foram melhores, 1% semelhantes, 97% piores
» O melhor teve um delta de 4%, a média foi 23%, o pior foi 134%
Dell 16 Premium DA16250 análise de áudio
(+) | os alto-falantes podem tocar relativamente alto (###valor### dB)
Graves 100 - 315Hz
(±) | graves reduzidos - em média 6.1% menor que a mediana
(+) | o baixo é linear (4.2% delta para a frequência anterior)
Médios 400 - 2.000 Hz
(+) | médios equilibrados - apenas 1.4% longe da mediana
(+) | médios são lineares (3.6% delta para frequência anterior)
Altos 2 - 16 kHz
(+) | agudos equilibrados - apenas 1.5% longe da mediana
(+) | os máximos são lineares (2.2% delta da frequência anterior)
Geral 100 - 16.000 Hz
(+) | o som geral é linear (5.1% diferença em relação à mediana)
Comparado com a mesma classe
» 1% de todos os dispositivos testados nesta classe foram melhores, 0% semelhantes, 99% piores
» O melhor teve um delta de 5%, a média foi 17%, o pior foi 45%
Comparado com todos os dispositivos testados
» 0% de todos os dispositivos testados foram melhores, 0% semelhantes, 100% piores
» O melhor teve um delta de 4%, a média foi 23%, o pior foi 134%
Lenovo ThinkPad T1g Gen 8 21TD003GE análise de áudio
(+) | os alto-falantes podem tocar relativamente alto (###valor### dB)
Graves 100 - 315Hz
(±) | graves reduzidos - em média 9.3% menor que a mediana
(±) | a linearidade dos graves é média (11.9% delta para a frequência anterior)
Médios 400 - 2.000 Hz
(+) | médios equilibrados - apenas 2.5% longe da mediana
(+) | médios são lineares (4% delta para frequência anterior)
Altos 2 - 16 kHz
(+) | agudos equilibrados - apenas 3.4% longe da mediana
(±) | a linearidade dos máximos é média (7.5% delta para frequência anterior)
Geral 100 - 16.000 Hz
(+) | o som geral é linear (8.7% diferença em relação à mediana)
Comparado com a mesma classe
» 11% de todos os dispositivos testados nesta classe foram melhores, 2% semelhantes, 87% piores
» O melhor teve um delta de 5%, a média foi 17%, o pior foi 45%
Comparado com todos os dispositivos testados
» 3% de todos os dispositivos testados foram melhores, 1% semelhantes, 97% piores
» O melhor teve um delta de 4%, a média foi 23%, o pior foi 134%
Consumo de energia

O Galaxy Book6 Ultra é surpreendentemente eficiente quando está ocioso, com um consumo máximo de apenas 7,1 Watts com o brilho total do SDR. Durante o teste de estresse, medimos cerca de 140-144 watts nos primeiros 40 segundos, mas o consumo se estabiliza em cerca de 124 watts e a bateria não se esgota, portanto, o adaptador de energia de 140 watts é suficiente.
| desligado | |
| Ocioso | |
| Carga |
|
Key:
min: | |
| Samsung Galaxy Book6 Ultra Ultra 7 356H, GeForce RTX 5070 Laptop, Samsung PM9C1b MZVL81T0HFLB-00BH1, OLED, 2880x1800, 16" | Apple MacBook Pro 16 2024 M4 Pro M4 Pro 14-Core, M4 Pro 20-Core GPU, Apple SSD AP2048Z, Mini-LED, 3456x2234, 16.2" | Lenovo Yoga Pro 9i 16 RTX 5070 Ultra 9 285H, GeForce RTX 5070 Laptop, WD PC SN7100S SDFPMSL-1T00-1101, OLED, 3200x2000, 16" | Asus ProArt P16 RTX 5090 Ryzen AI 9 HX 370, GeForce RTX 5090 Laptop, Micron 2500 2TB MTFDKBA2T0QGN-1BN1AABGA, OLED, 3840x2400, 16" | Dell 16 Premium DA16250 Ultra 7 255H, GeForce RTX 5070 Laptop, Kioxia BG6 KBG6AZNV1T02, OLED, 3840x2400, 16.3" | Lenovo ThinkPad T1g Gen 8 21TD003GE Ultra 9 285H, GeForce RTX 5070 Laptop, Samsung PM9E1 MZVLC2T0HBLD, Tandem-OLED, 3200x2000, 16" | Média NVIDIA GeForce RTX 5070 Laptop | Média da turma Multimedia | |
|---|---|---|---|---|---|---|---|---|
| Power Consumption | -38% | -73% | -82% | -66% | -48% | -122% | -32% | |
| Idle Minimum * (Watt) | 4.4 | 4.6 -5% | 8.8 -100% | 10.9 -148% | 6.5 -48% | 8.5 -93% | 10.8 ? -145% | 5.68 ? -29% |
| Idle Average * (Watt) | 6.4 | 16.8 -163% | 16.1 -152% | 12.1 -89% | 8.1 -27% | 13.6 -113% | 15.4 ? -141% | 10.2 ? -59% |
| Idle Maximum * (Watt) | 7.1 | 17.1 -141% | 16.5 -132% | 12.5 -76% | 33 -365% | 14.1 -99% | 21 ? -196% | 12.4 ? -75% |
| Load Average * (Watt) | 55.1 | 76.4 -39% | 89.3 -62% | 129.3 -135% | 88.9 -61% | 84.5 -53% | 98.7 ? -79% | 65.4 ? -19% |
| Cyberpunk 2077 ultra external monitor * (Watt) | 133 | 79.3 40% | 157.9 -19% | 172.8 -30% | 108.9 18% | 118.1 11% | ||
| Cyberpunk 2077 ultra * (Watt) | 134.3 | 83.4 38% | 160.6 -20% | 176.6 -31% | 108.7 19% | 120.3 10% | ||
| Load Maximum * (Watt) | 143.9 | 138.1 4% | 177.4 -23% | 233.9 -63% | 138.3 4% | 143 1% | 218 ? -51% | 113.3 ? 21% |
* ... menor é melhor
Consumo de energia Cyberpunk / Teste de estresse
Consumo de energia do monitor externo
Duração da bateria
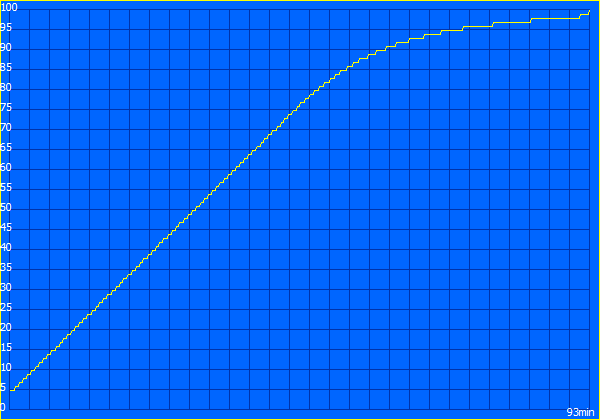
Embora o Galaxy Book6 Ultra tenha a menor capacidade de bateria em nosso grupo de comparação, com apenas 80,2 Wh, ele consegue uma duração de bateria impressionante, mesmo chegando perto do MacBook Pro. Com 150 nits, nosso teste de Wi-Fi dura quase 17 horas e, portanto, muito mais tempo em comparação com qualquer outro concorrente do Windows. Com brilho total, ainda registramos quase 8,5 horas, o que supera o MacBook Pro (que é um pouco mais brilhante) em cerca de uma hora.

Classificação do Notebookcheck
Samsung Galaxy Book6 Ultra
- 03/06/2026 v8
Andreas Osthoff
 Total Sustainability Score:
 Concorrentes potenciais em comparação
Imagem | Modelo / Análises | Preço | Peso | Altura | Tela |
|---|---|---|---|---|---|
1. 90.7%  | Samsung Galaxy Book6 Ultra Intel Core Ultra 7 356H ⎘ NVIDIA GeForce RTX 5070 Laptop ⎘ 32 GB Memória, 1000 GB SSD | Amazon: Preço de tabela: 3599€ | 1.9 kg | 15.4 mm | 16.00" 2880x1800 212 PPI OLED |
2. 93%  | Apple MacBook Pro 16 2024 M4 Pro Apple M4 Pro 14-Core ⎘ Apple M4 Pro 20-Core GPU ⎘ 48 GB Memória, 2048 GB SSD | Amazon: Preço de tabela: 4219€ | 2.1 kg | 16.8 mm | 16.20" 3456x2234 254 PPI Mini-LED |
3. 90.4%  | Lenovo Yoga Pro 9i 16 RTX 5070 Intel Core Ultra 9 285H ⎘ NVIDIA GeForce RTX 5070 Laptop ⎘ 64 GB Memória, 1024 GB SSD | Amazon: Preço de tabela: 2800€ | 1.9 kg | 17.9 mm | 16.00" 3200x2000 236 PPI OLED |
4. 89.7%  | Asus ProArt P16 RTX 5090 AMD Ryzen AI 9 HX 370 ⎘ NVIDIA GeForce RTX 5090 Laptop ⎘ 64 GB Memória, 2048 GB SSD | Amazon: Preço de tabela: 4799€ | 2 kg | 18.3 mm | 16.00" 3840x2400 283 PPI OLED |
5. 87.9%  | Dell 16 Premium DA16250 Intel Core Ultra 7 255H ⎘ NVIDIA GeForce RTX 5070 Laptop ⎘ 32 GB Memória, 1024 GB SSD | Amazon: Preço de tabela: 3300 USD | 2.3 kg | 18.7 mm | 16.30" 3840x2400 278 PPI OLED |
6. 92.4%  | Lenovo ThinkPad T1g Gen 8 21TD003GE Intel Core Ultra 9 285H ⎘ NVIDIA GeForce RTX 5070 Laptop ⎘ 64 GB Memória, 2048 GB SSD | Amazon: Preço de tabela: 4500€ | 1.9 kg | 15.8 mm | 16.00" 3200x2000 236 PPI Tandem-OLED |
Transparência
A seleção dos dispositivos a serem analisados é feita pela nossa equipe editorial. A amostra de teste foi fornecida ao autor como empréstimo pelo fabricante ou varejista para fins desta revisão. O credor não teve influência nesta revisão, nem o fabricante recebeu uma cópia desta revisão antes da publicação. Não houve obrigação de publicar esta revisão. Como empresa de mídia independente, a Notebookcheck não está sujeita à autoridade de fabricantes, varejistas ou editores.
É assim que o Notebookcheck está testando
Todos os anos, o Notebookcheck analisa de forma independente centenas de laptops e smartphones usando procedimentos padronizados para garantir que todos os resultados sejam comparáveis. Desenvolvemos continuamente nossos métodos de teste há cerca de 20 anos e definimos padrões da indústria no processo. Em nossos laboratórios de teste, equipamentos de medição de alta qualidade são utilizados por técnicos e editores experientes. Esses testes envolvem um processo de validação em vários estágios. Nosso complexo sistema de classificação é baseado em centenas de medições e benchmarks bem fundamentados, o que mantém a objetividade.
