Veredicto
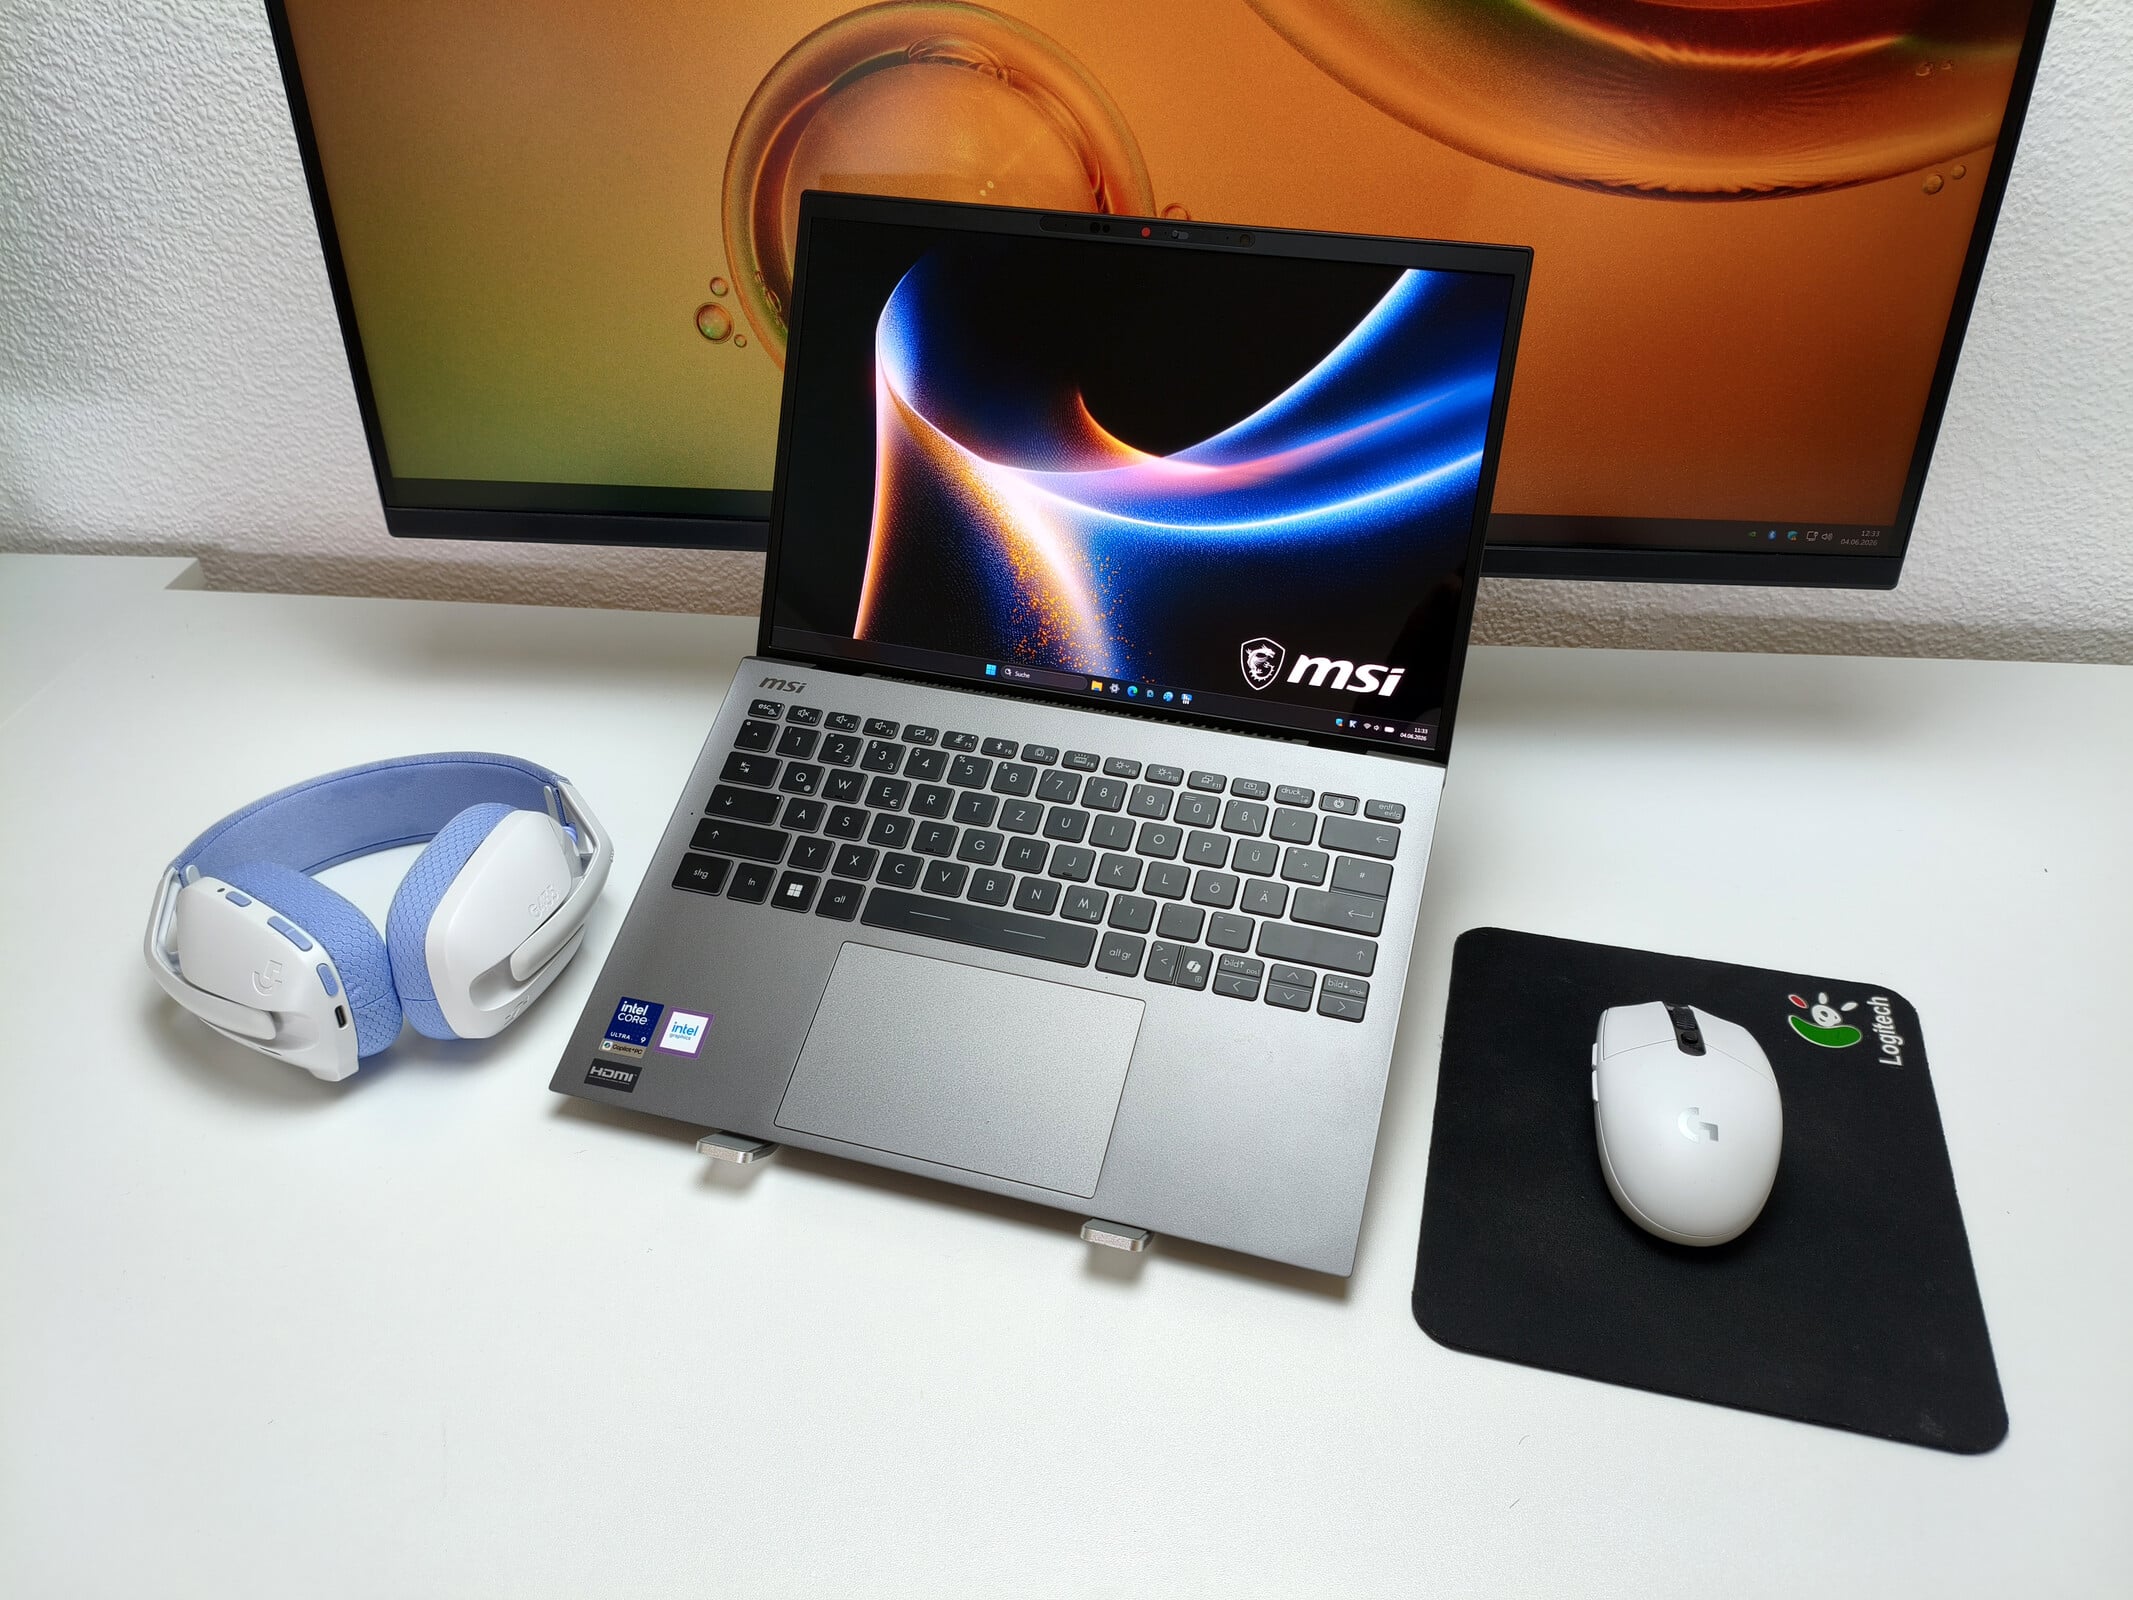
Como mencionado no início, o MSI Prestige 13 AI+ impressiona acima de tudo pelo seu design fino combinado com seu peso muito baixo. Com pouco menos de 900 g, ele é significativamente mais leve do que muitos concorrentes, que normalmente pesam mais de 1 kg e, muitas vezes, quase 1,5 kg. Como resultado, o modelo de 13 polegadas é muito fácil de transportar.
Graças à eficiente CPU Panther Lake, que perde algum desempenho sob carga prolongada, as emissões permanecem razoavelmente bem controladas, apesar das dimensões compactas. A duração da bateria é outro ponto forte, embora quase todos os rivais também tenham um bom desempenho nessa área. O Prestige 13 AI+ mais uma vez se destaca da concorrência com seu leitor de cartão rápido, módulo Wi-Fi 7 forte e duas portas Thunderbolt 4. A MSI deveria melhorar o som, pois os alto-falantes são bastante medíocres, assim como o layout do teclado e o tamanho de algumas teclas.
O Prestige 13 AI+ compete com outros subnotebooks com os atuais chips Panther Lake, como o Lenovo Yoga Slim 7 14 (Core Ultra 7 355), o Lenovo IdeaPad 5i 2 em 1 14 (Core Ultra 5 322) ou o Honor MagicBook Pro 14 (Core Ultra 5 338H). Do lado da AMD, os dispositivos com o Ryzen AI 7 350 são comparações adequadas, como o Asus ZenBook 14 OLED. No lado do Snapdragon, o ZenBook A14 é uma alternativa relevante.
Pro
Contra
Preço e disponibilidade
O Prestige 13 AI+ A3MG testado está disponível em vários revendedores on-line a partir de cerca de 1.600 euros (aproximadamente US$ 1.847).
Especificações
Estojo, conectividade, manutenção e dispositivos de entrada
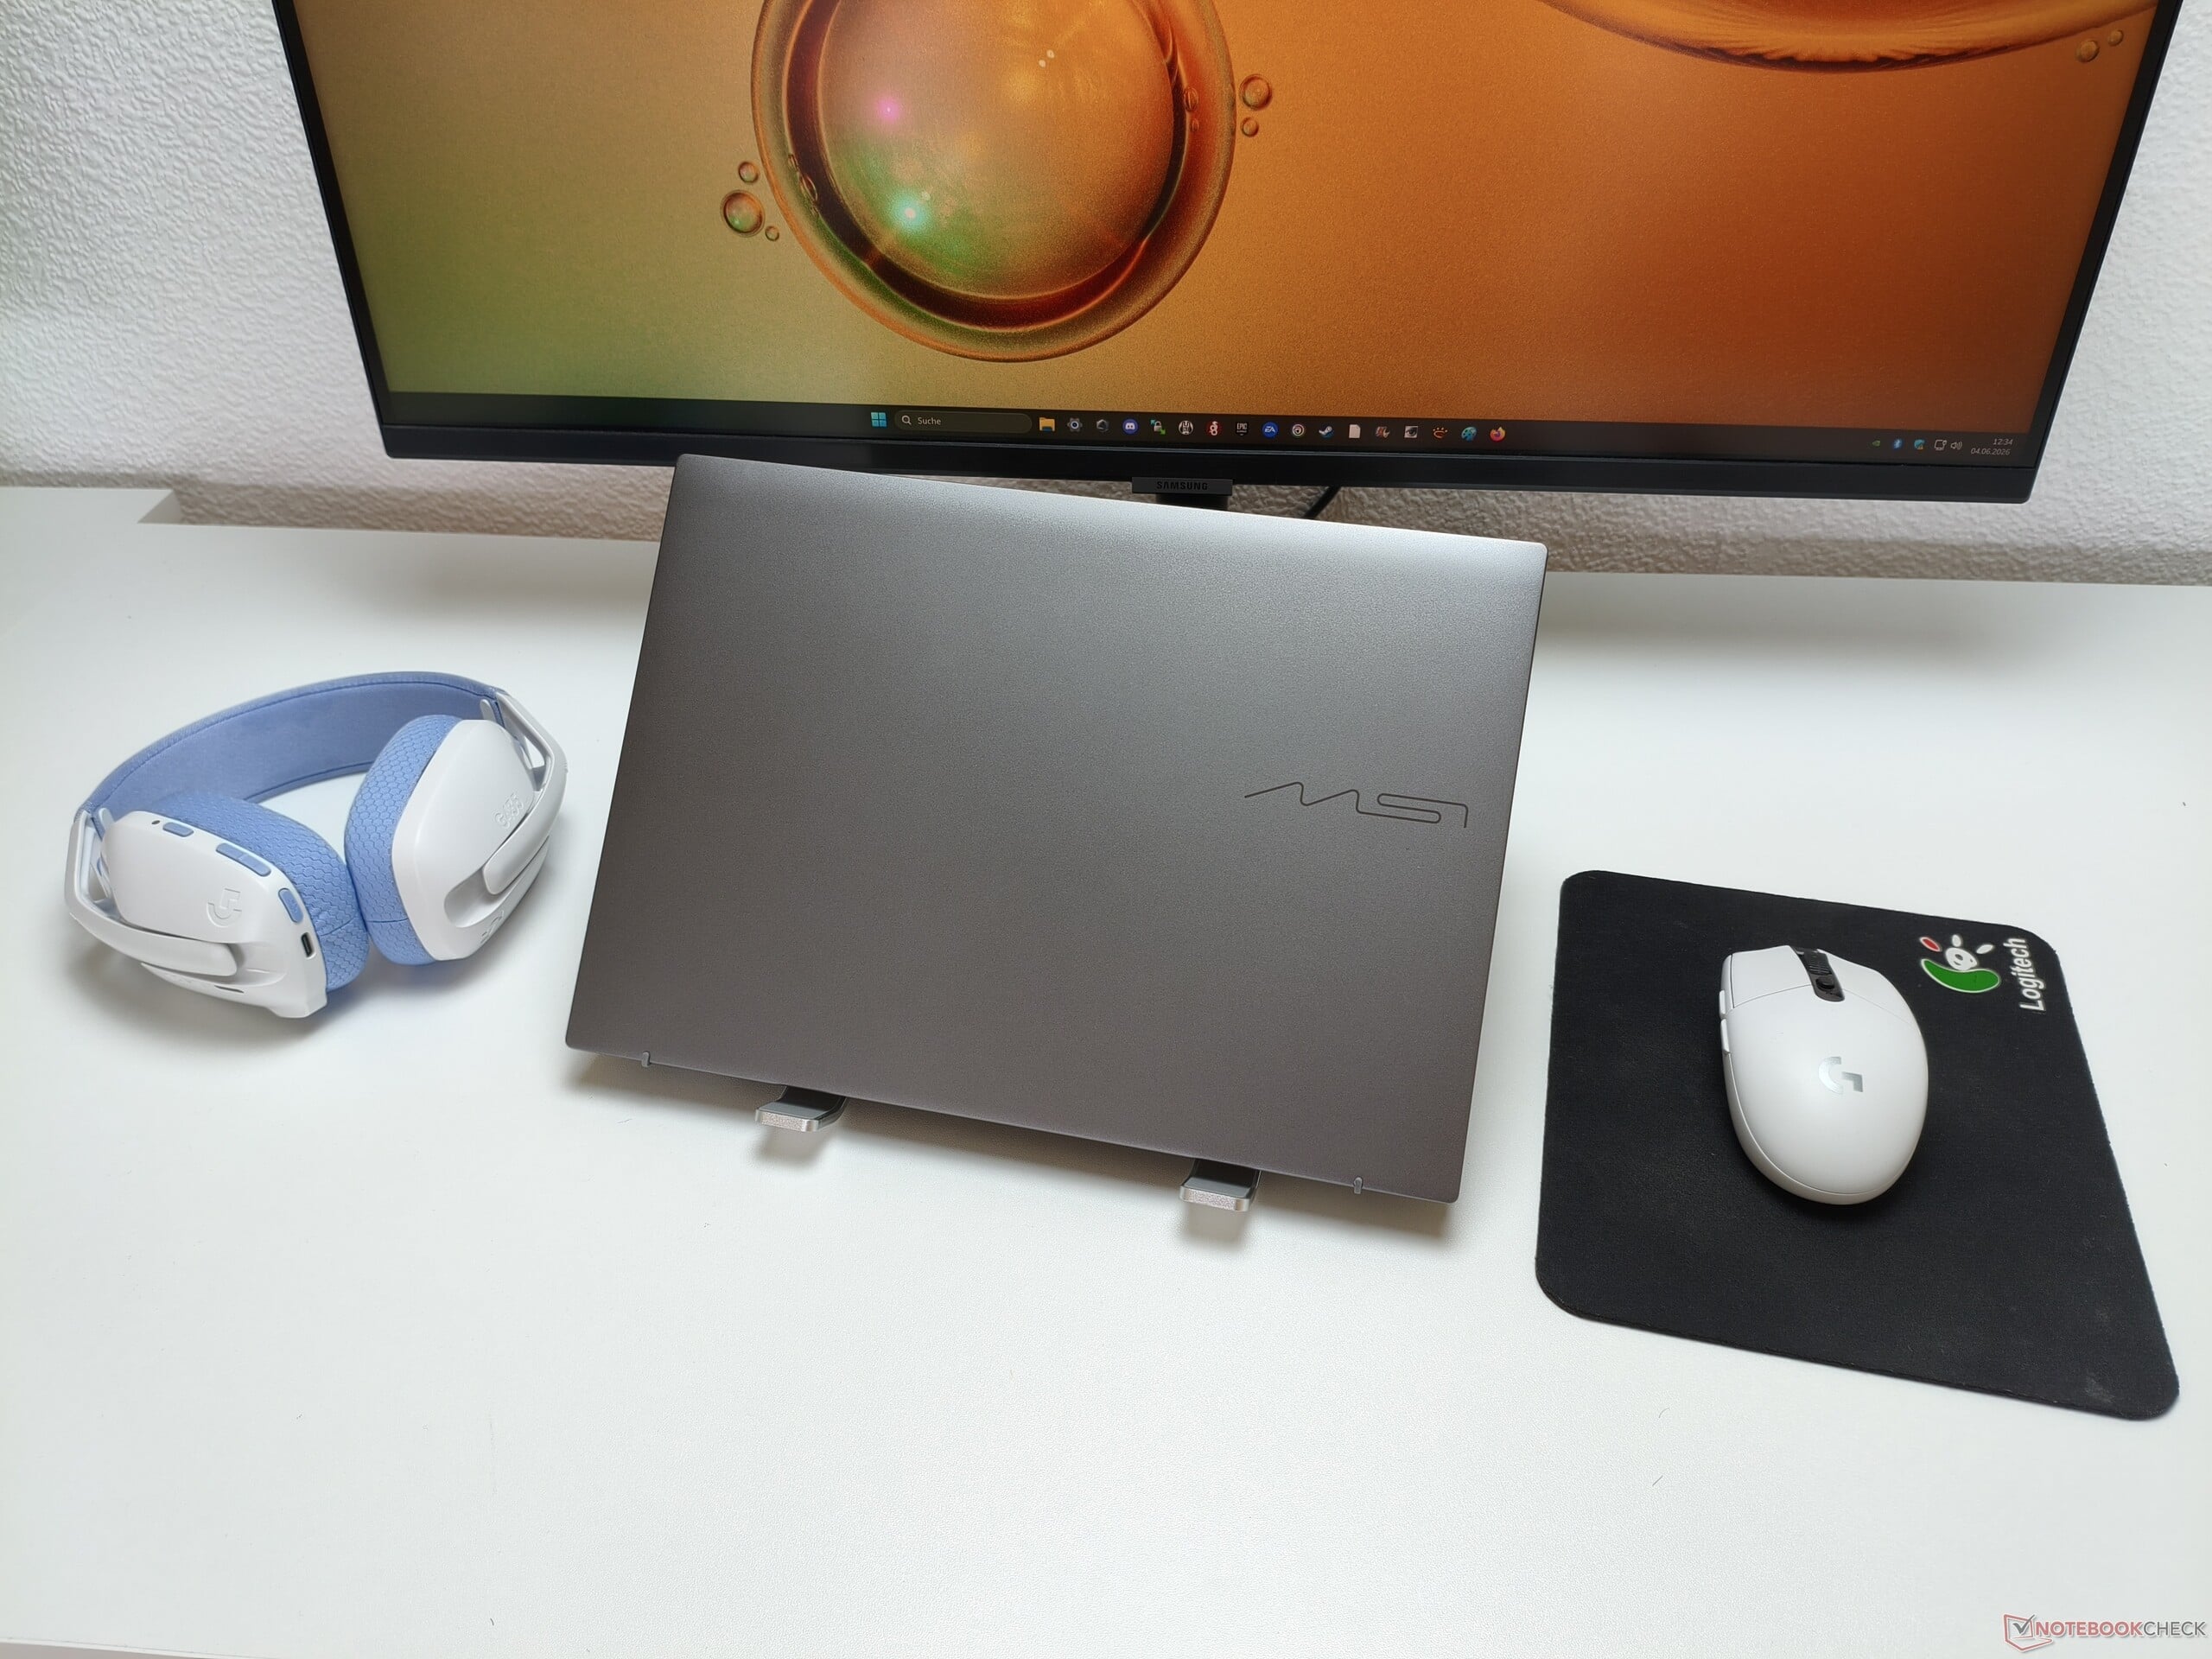
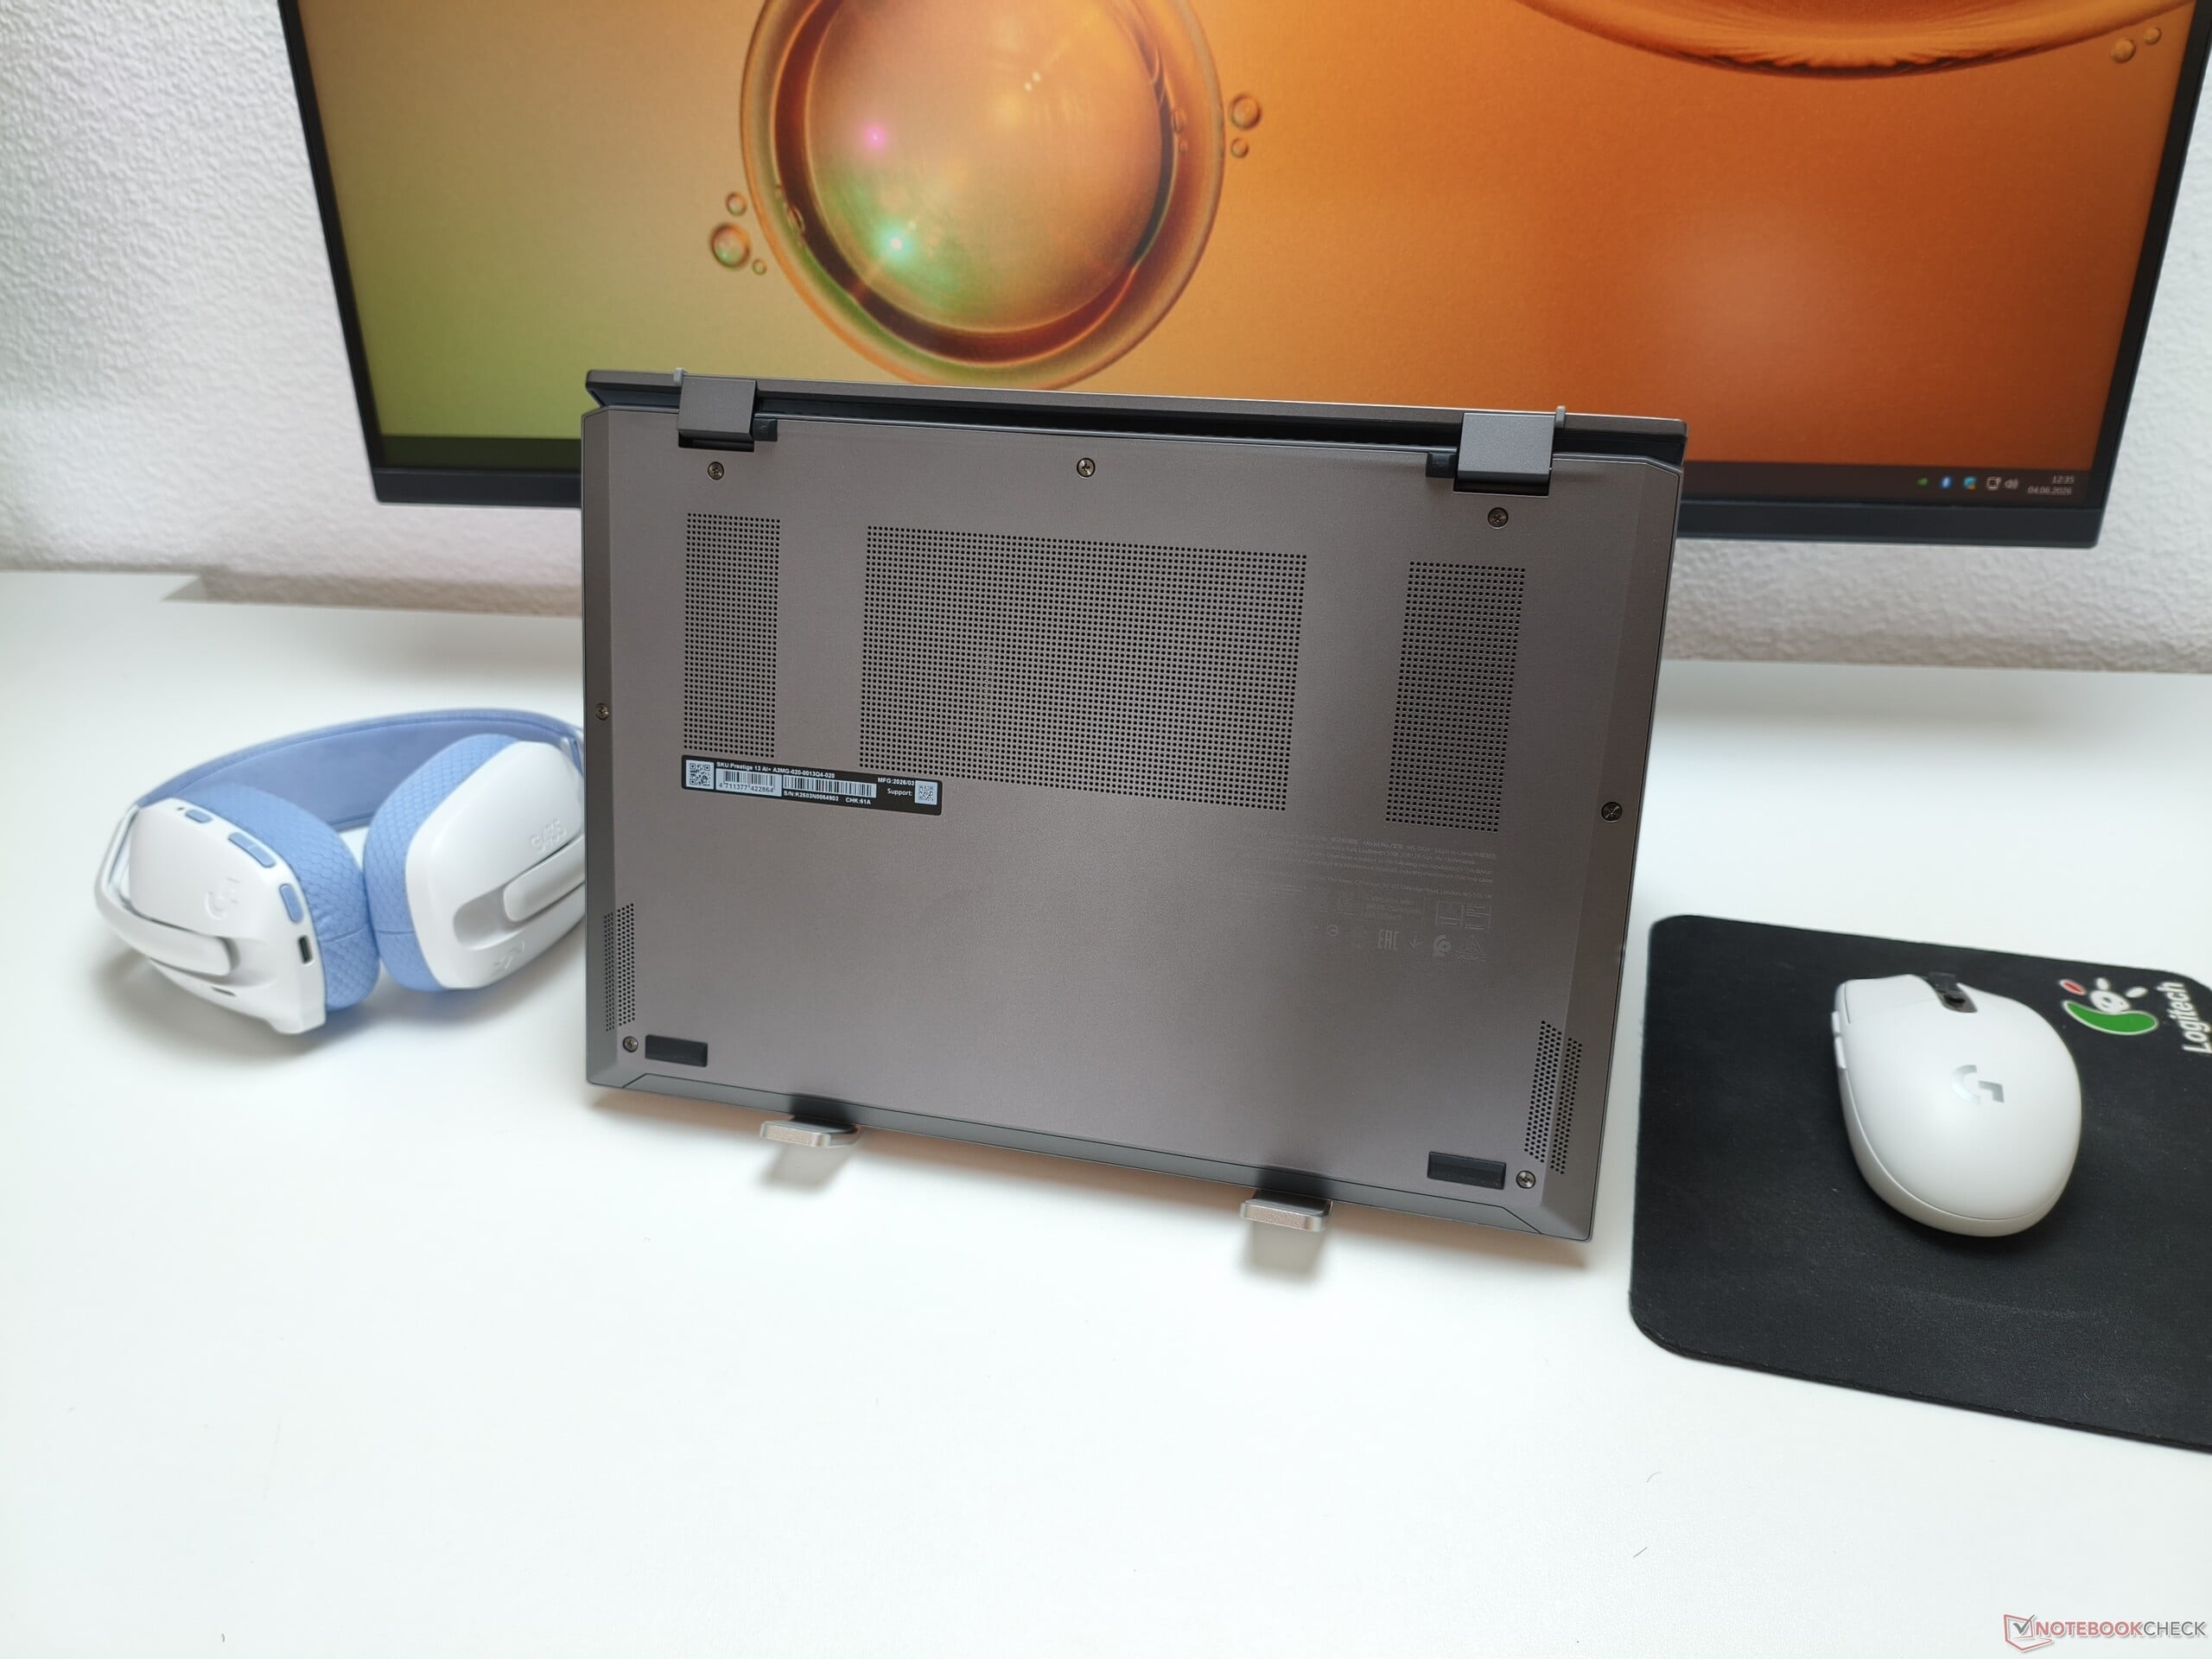
O gabinete cinza-prateado com design elegante é feito de magnésio-alumínio, que é um dos motivos pelos quais o dispositivo de 13 polegadas é tão leve. Embora os materiais não pareçam tão premium quanto o alumínio puro, eles parecem igualmente estáveis e são de qualidade superior ao chassi de plástico barato. Com uma altura de cerca de 1,6 cm, o modelo de 13 polegadas está alinhado com seus rivais, que variam de 1,4 a 1,7 cm. Não há nada a criticar em termos de acabamento, desde que o senhor ignore os dois parafusos do gabinete montados na lateral, que se projetam ligeiramente devido ao design. Um toque agradável: a tampa pode ser aberta em 180 graus.
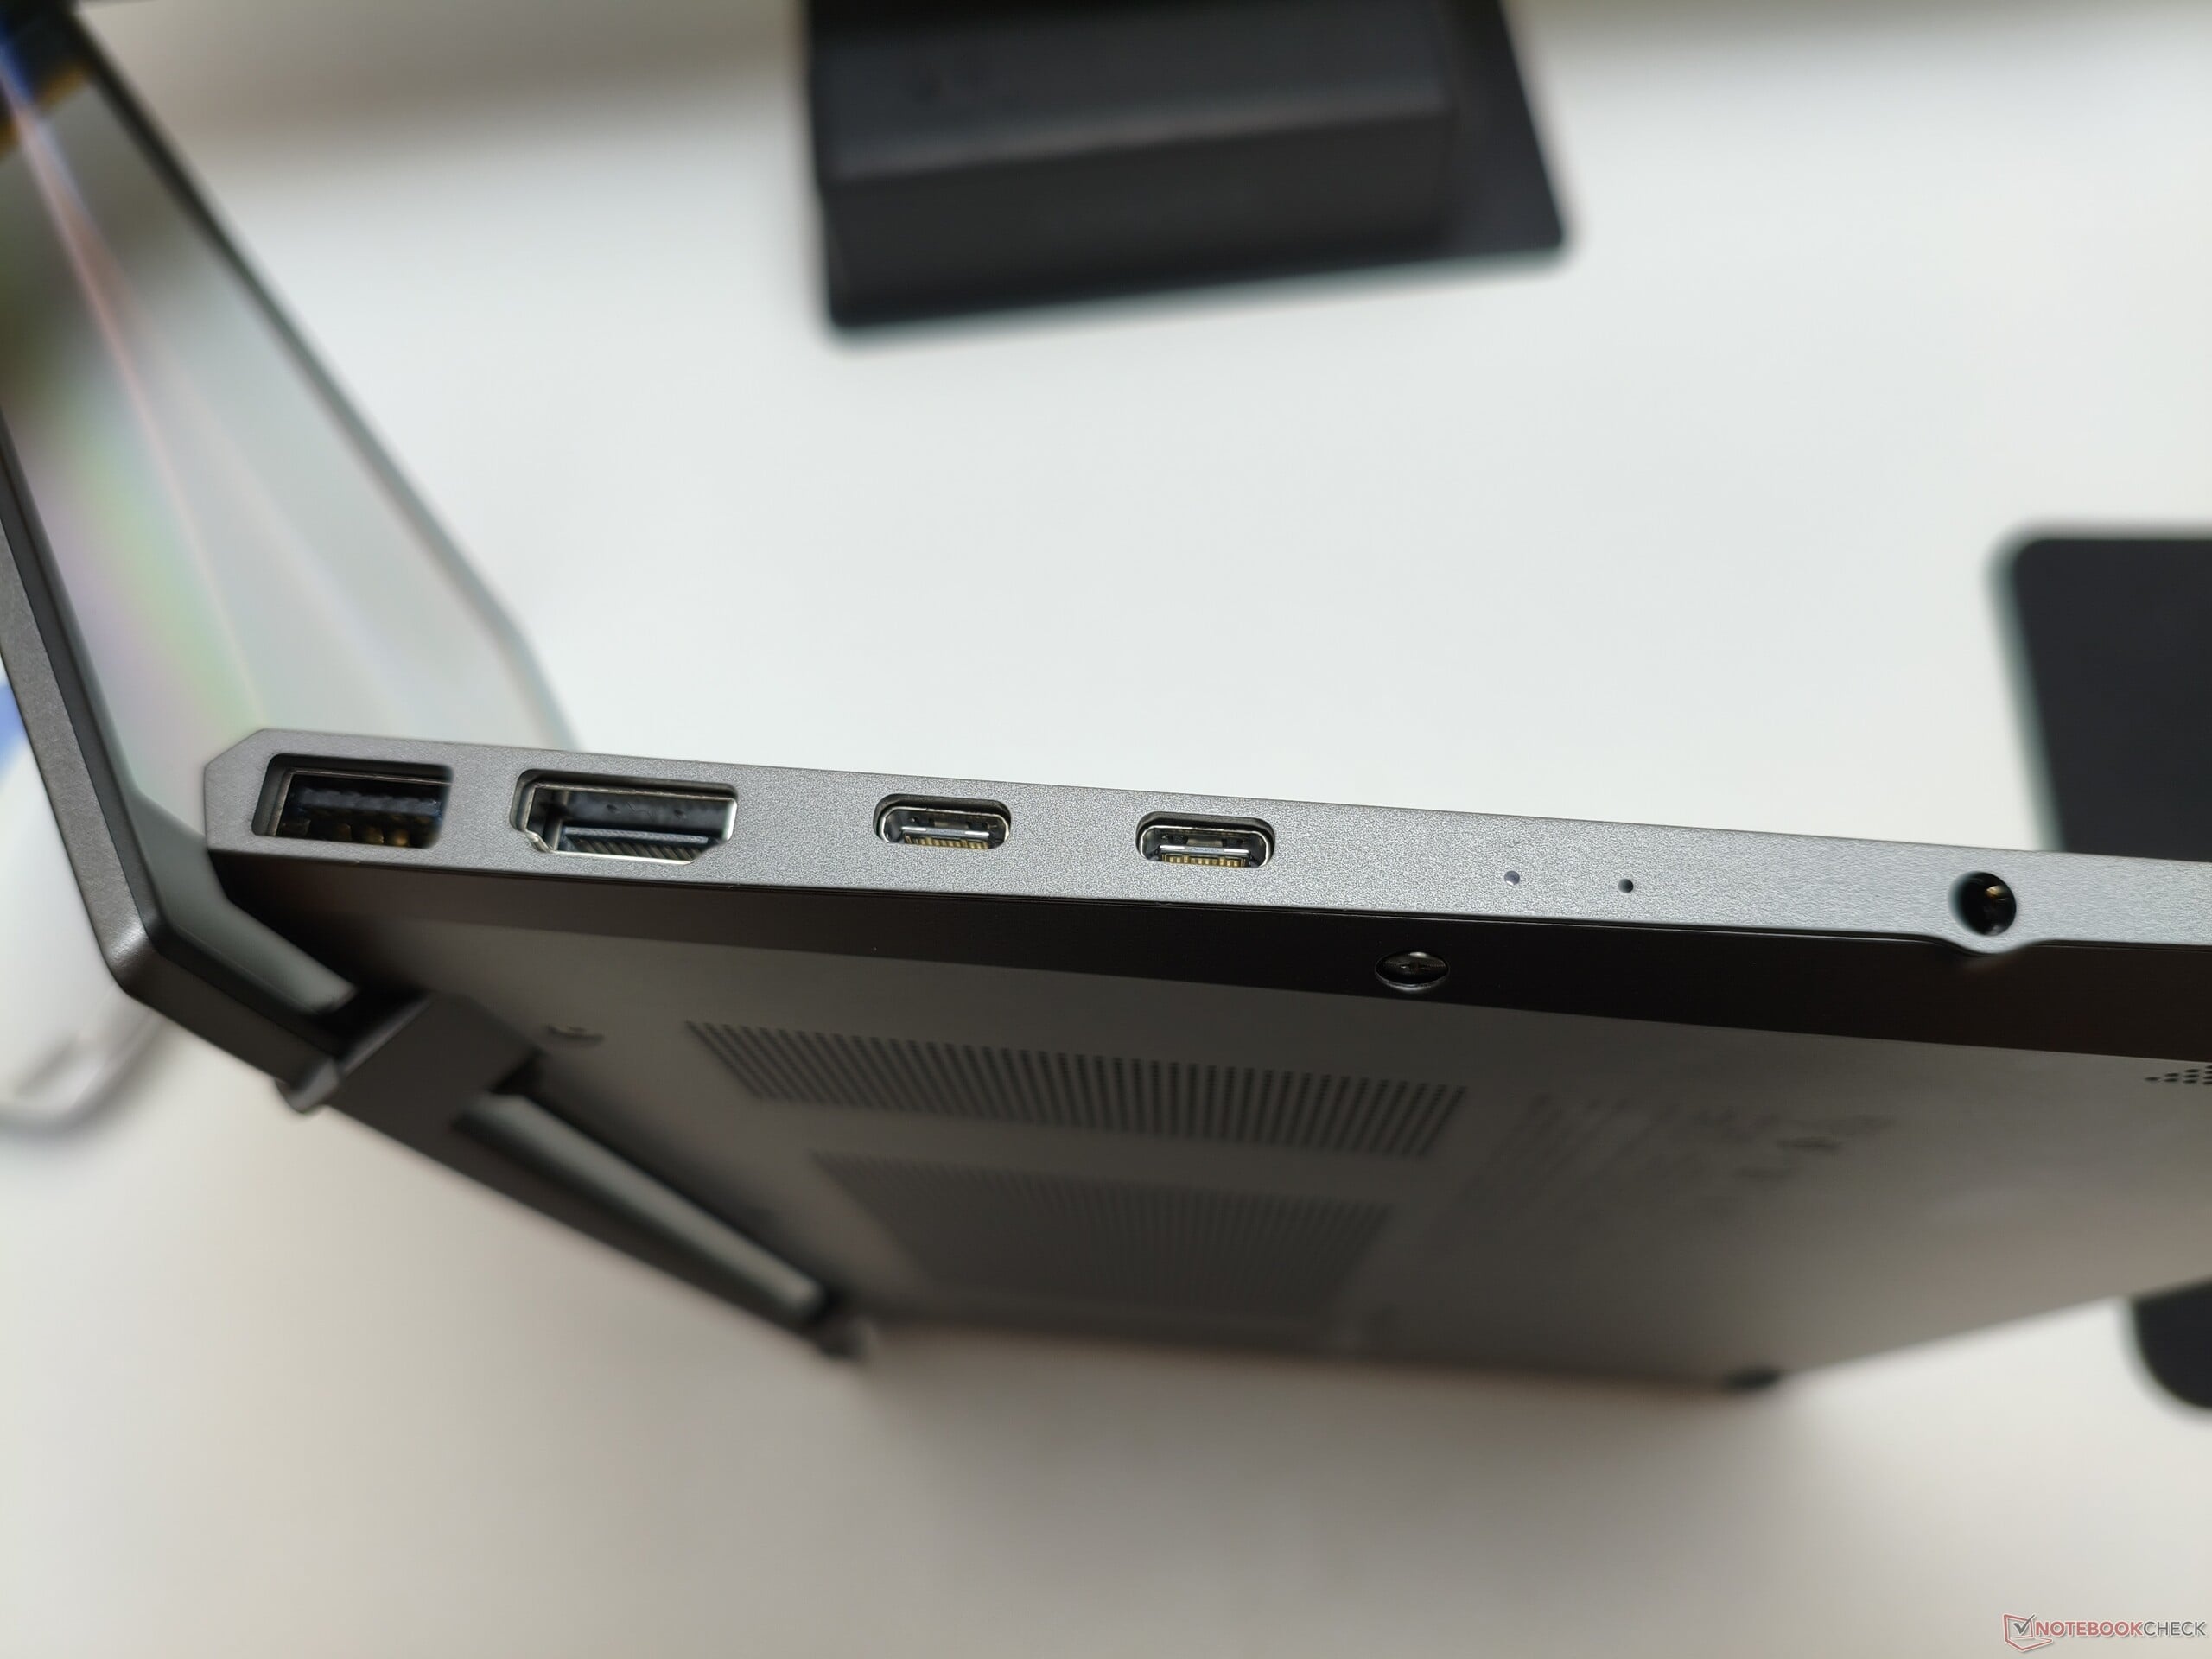
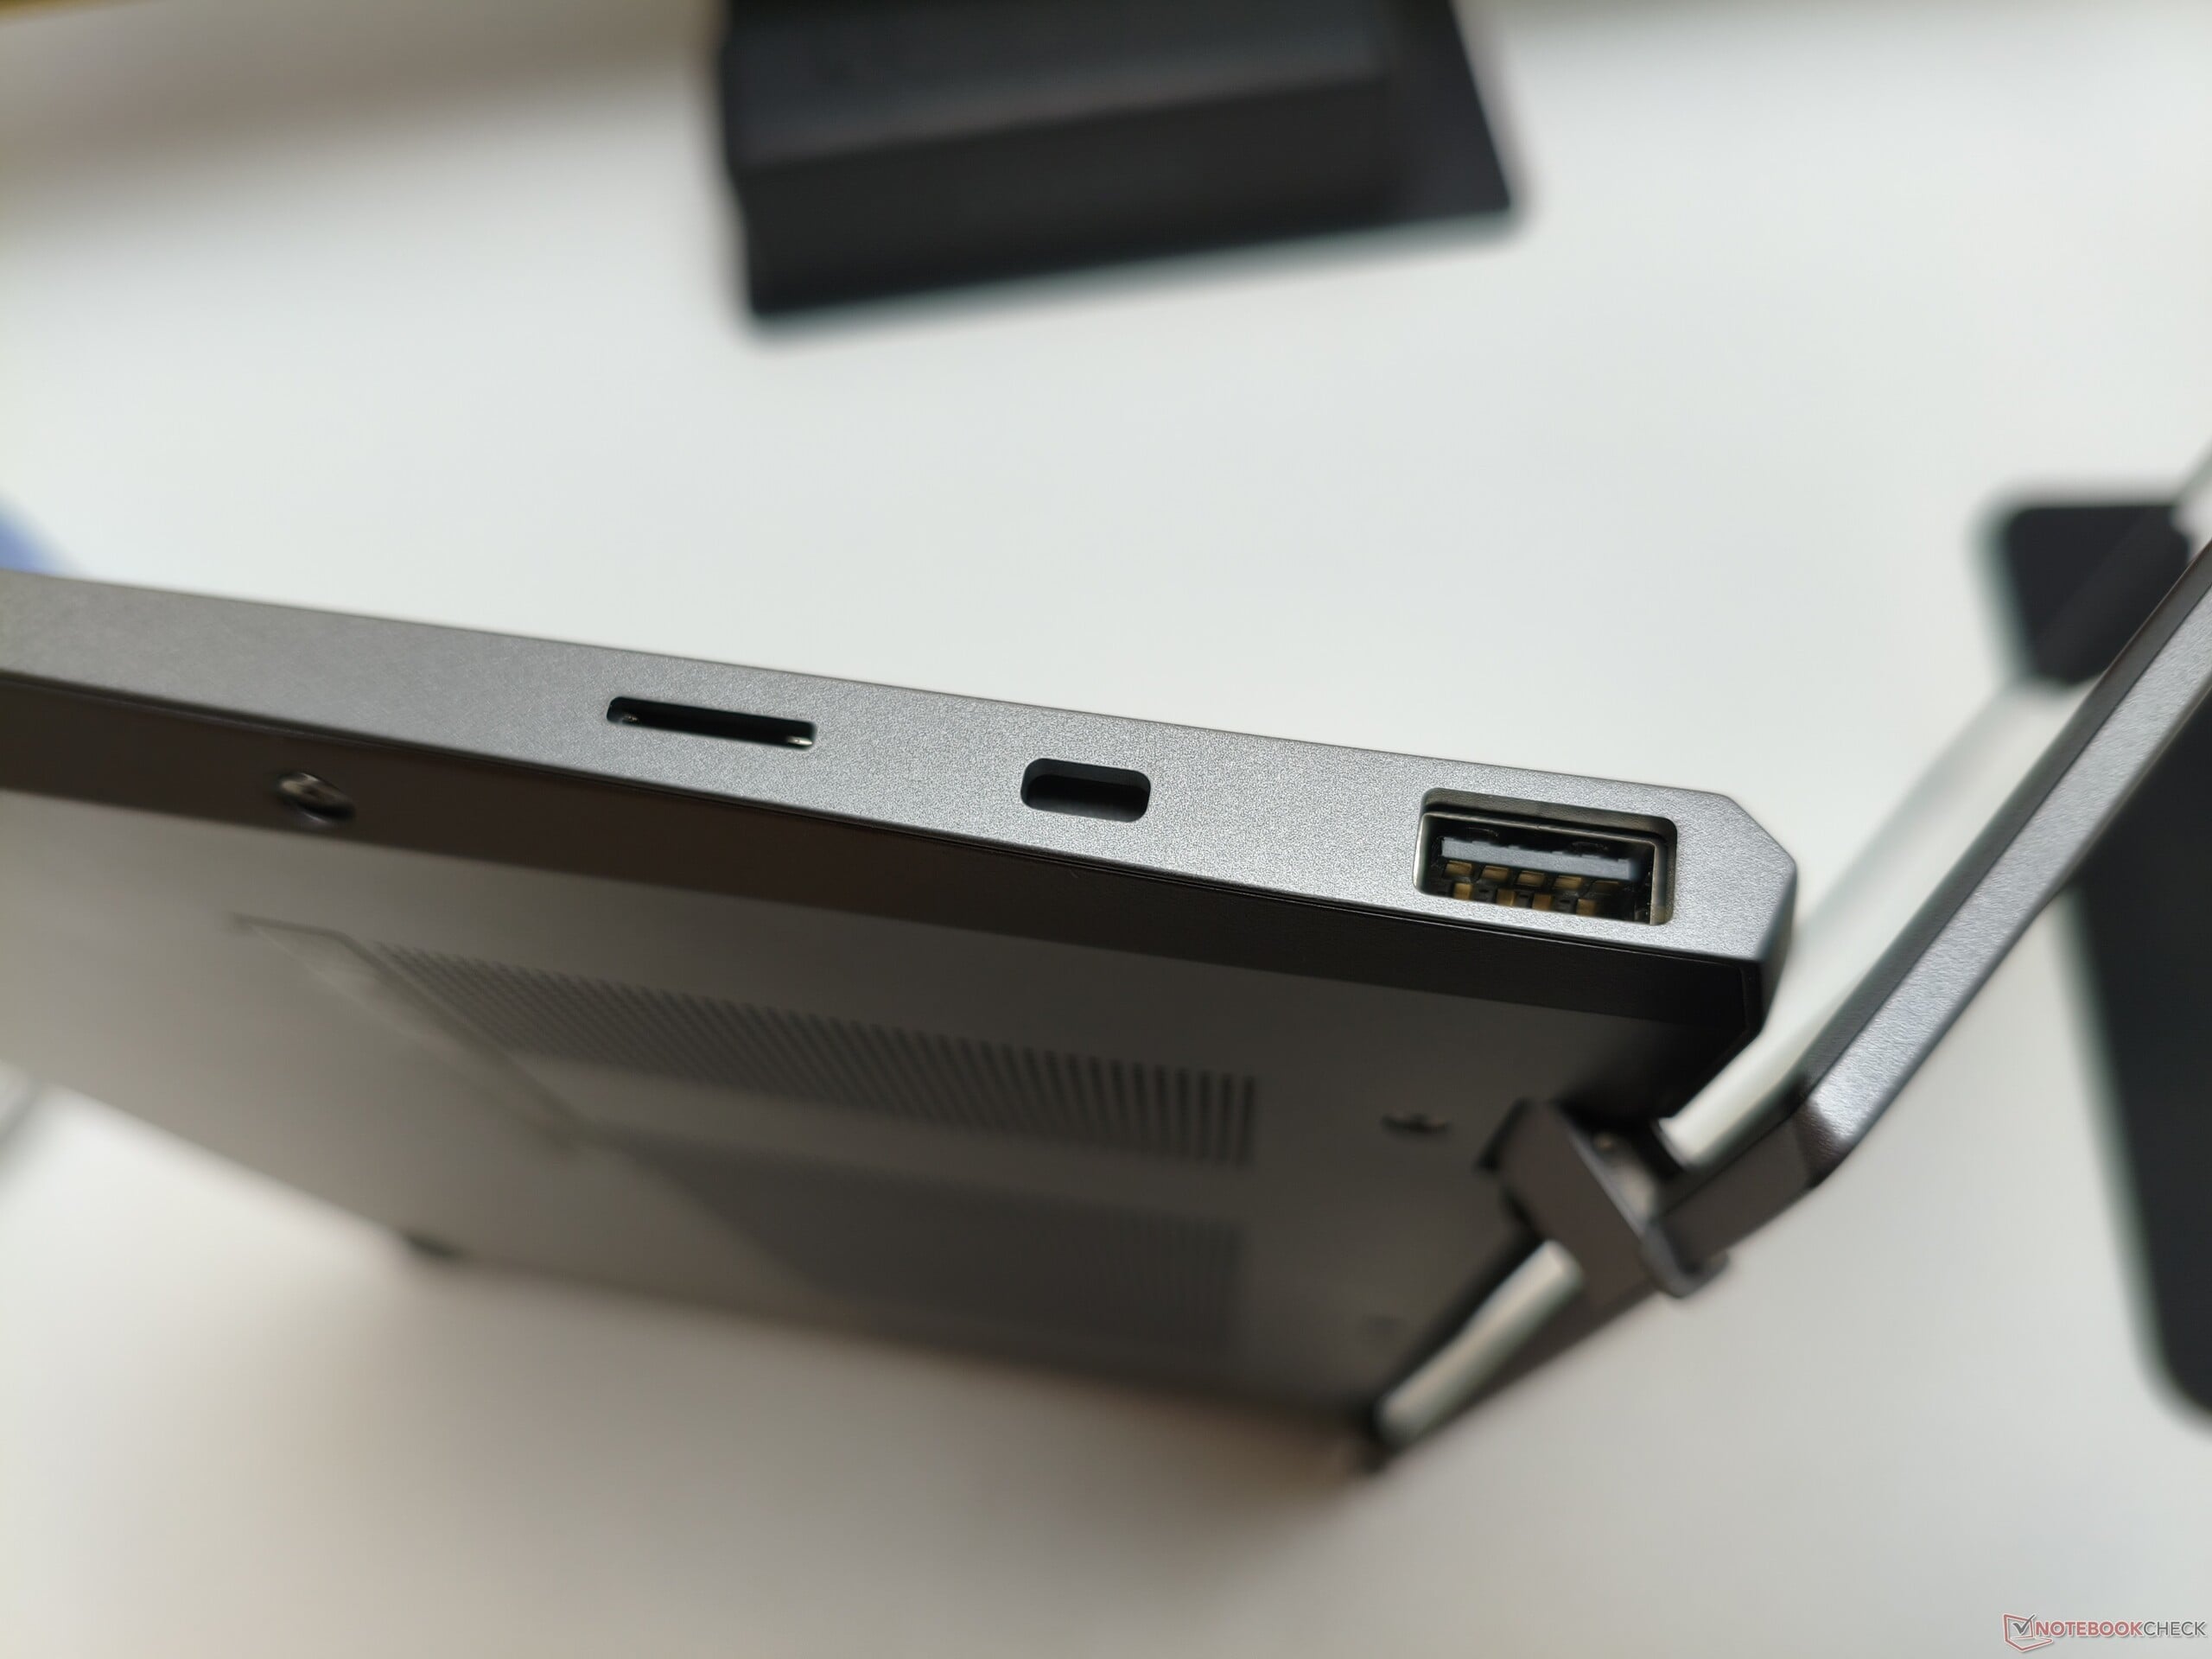
Quanto às portas, a MSI inclui um conector de áudio, uma saída HDMI 2.1, um leitor de cartão microSD agradavelmente rápido, um slot para travas Kensington e quatro portas USB. As duas portas Type-C suportam Thunderbolt 4, incluindo DisplayPort e Power Delivery. A webcam oferece um desempenho típico e medíocre de um laptop.
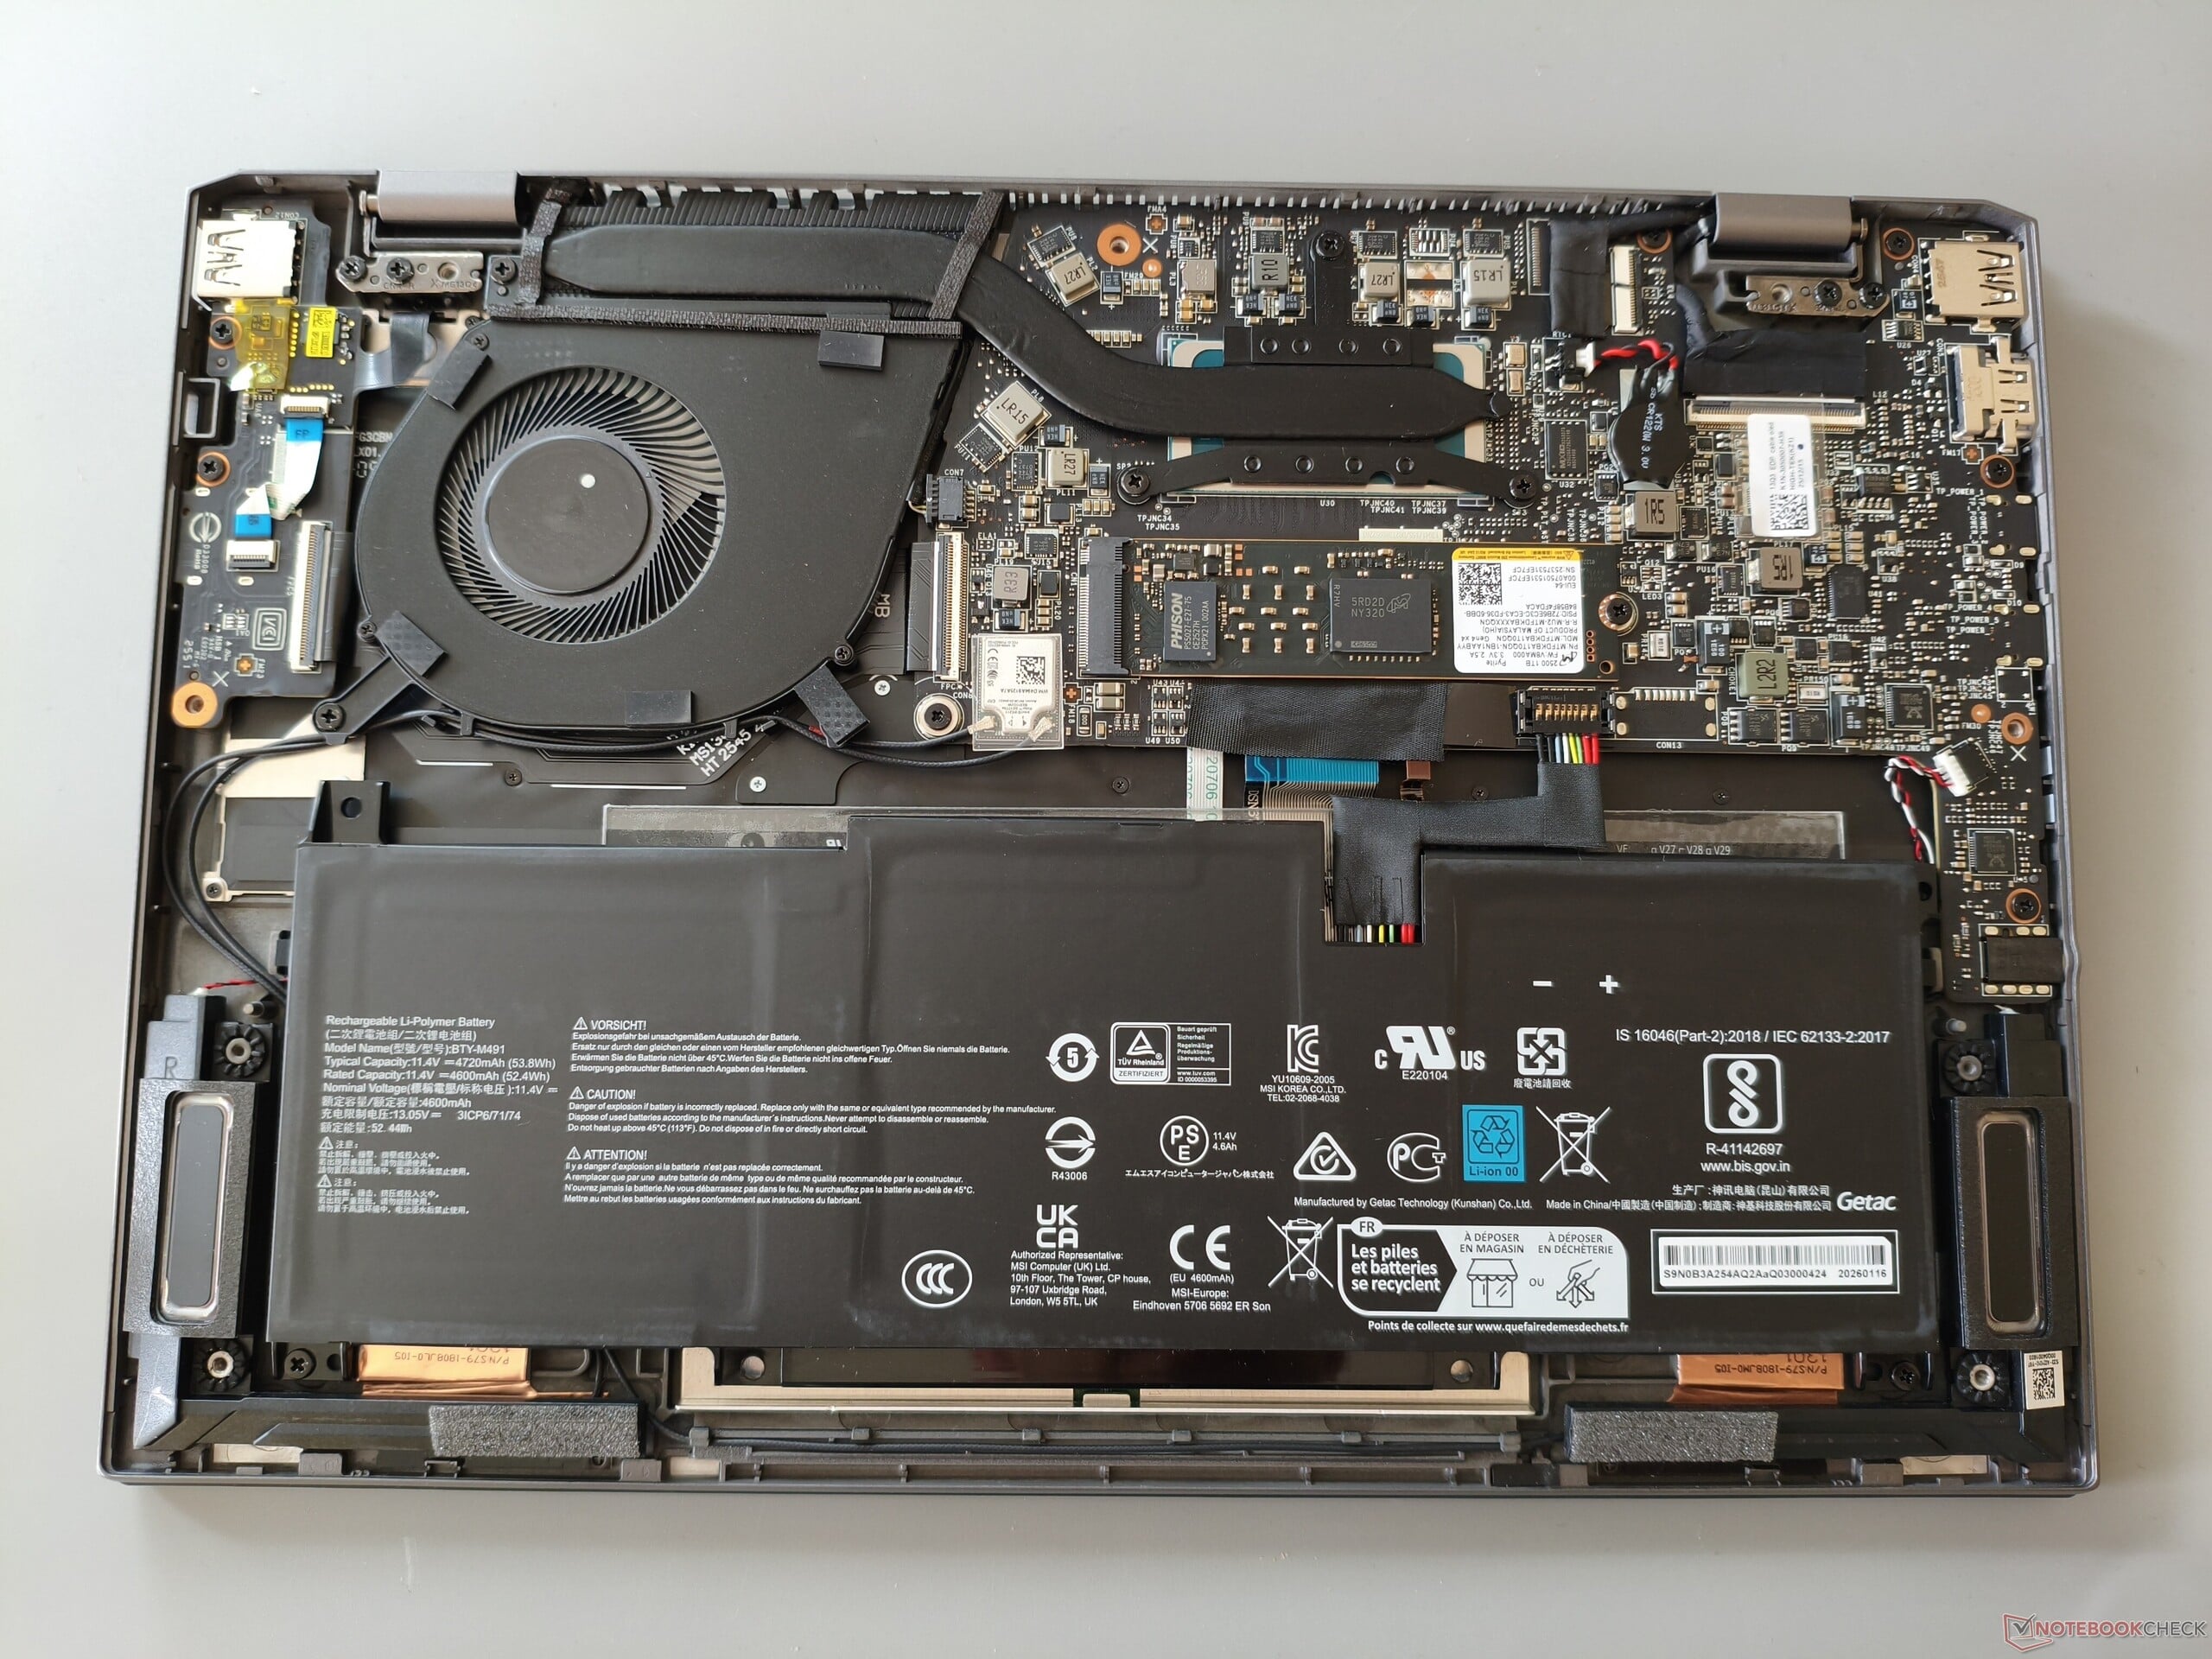
A tampa inferior pode ser removida depois de soltar sete parafusos Phillips. Sob o capô há um sistema de resfriamento com uma ventoinha e um tubo de calor. Há também um slot M.2 ocupado para SSDs, enquanto a bateria e o módulo sem fio rápido também estão acessíveis. A RAM, no entanto, não pode ser substituída porque é soldada.
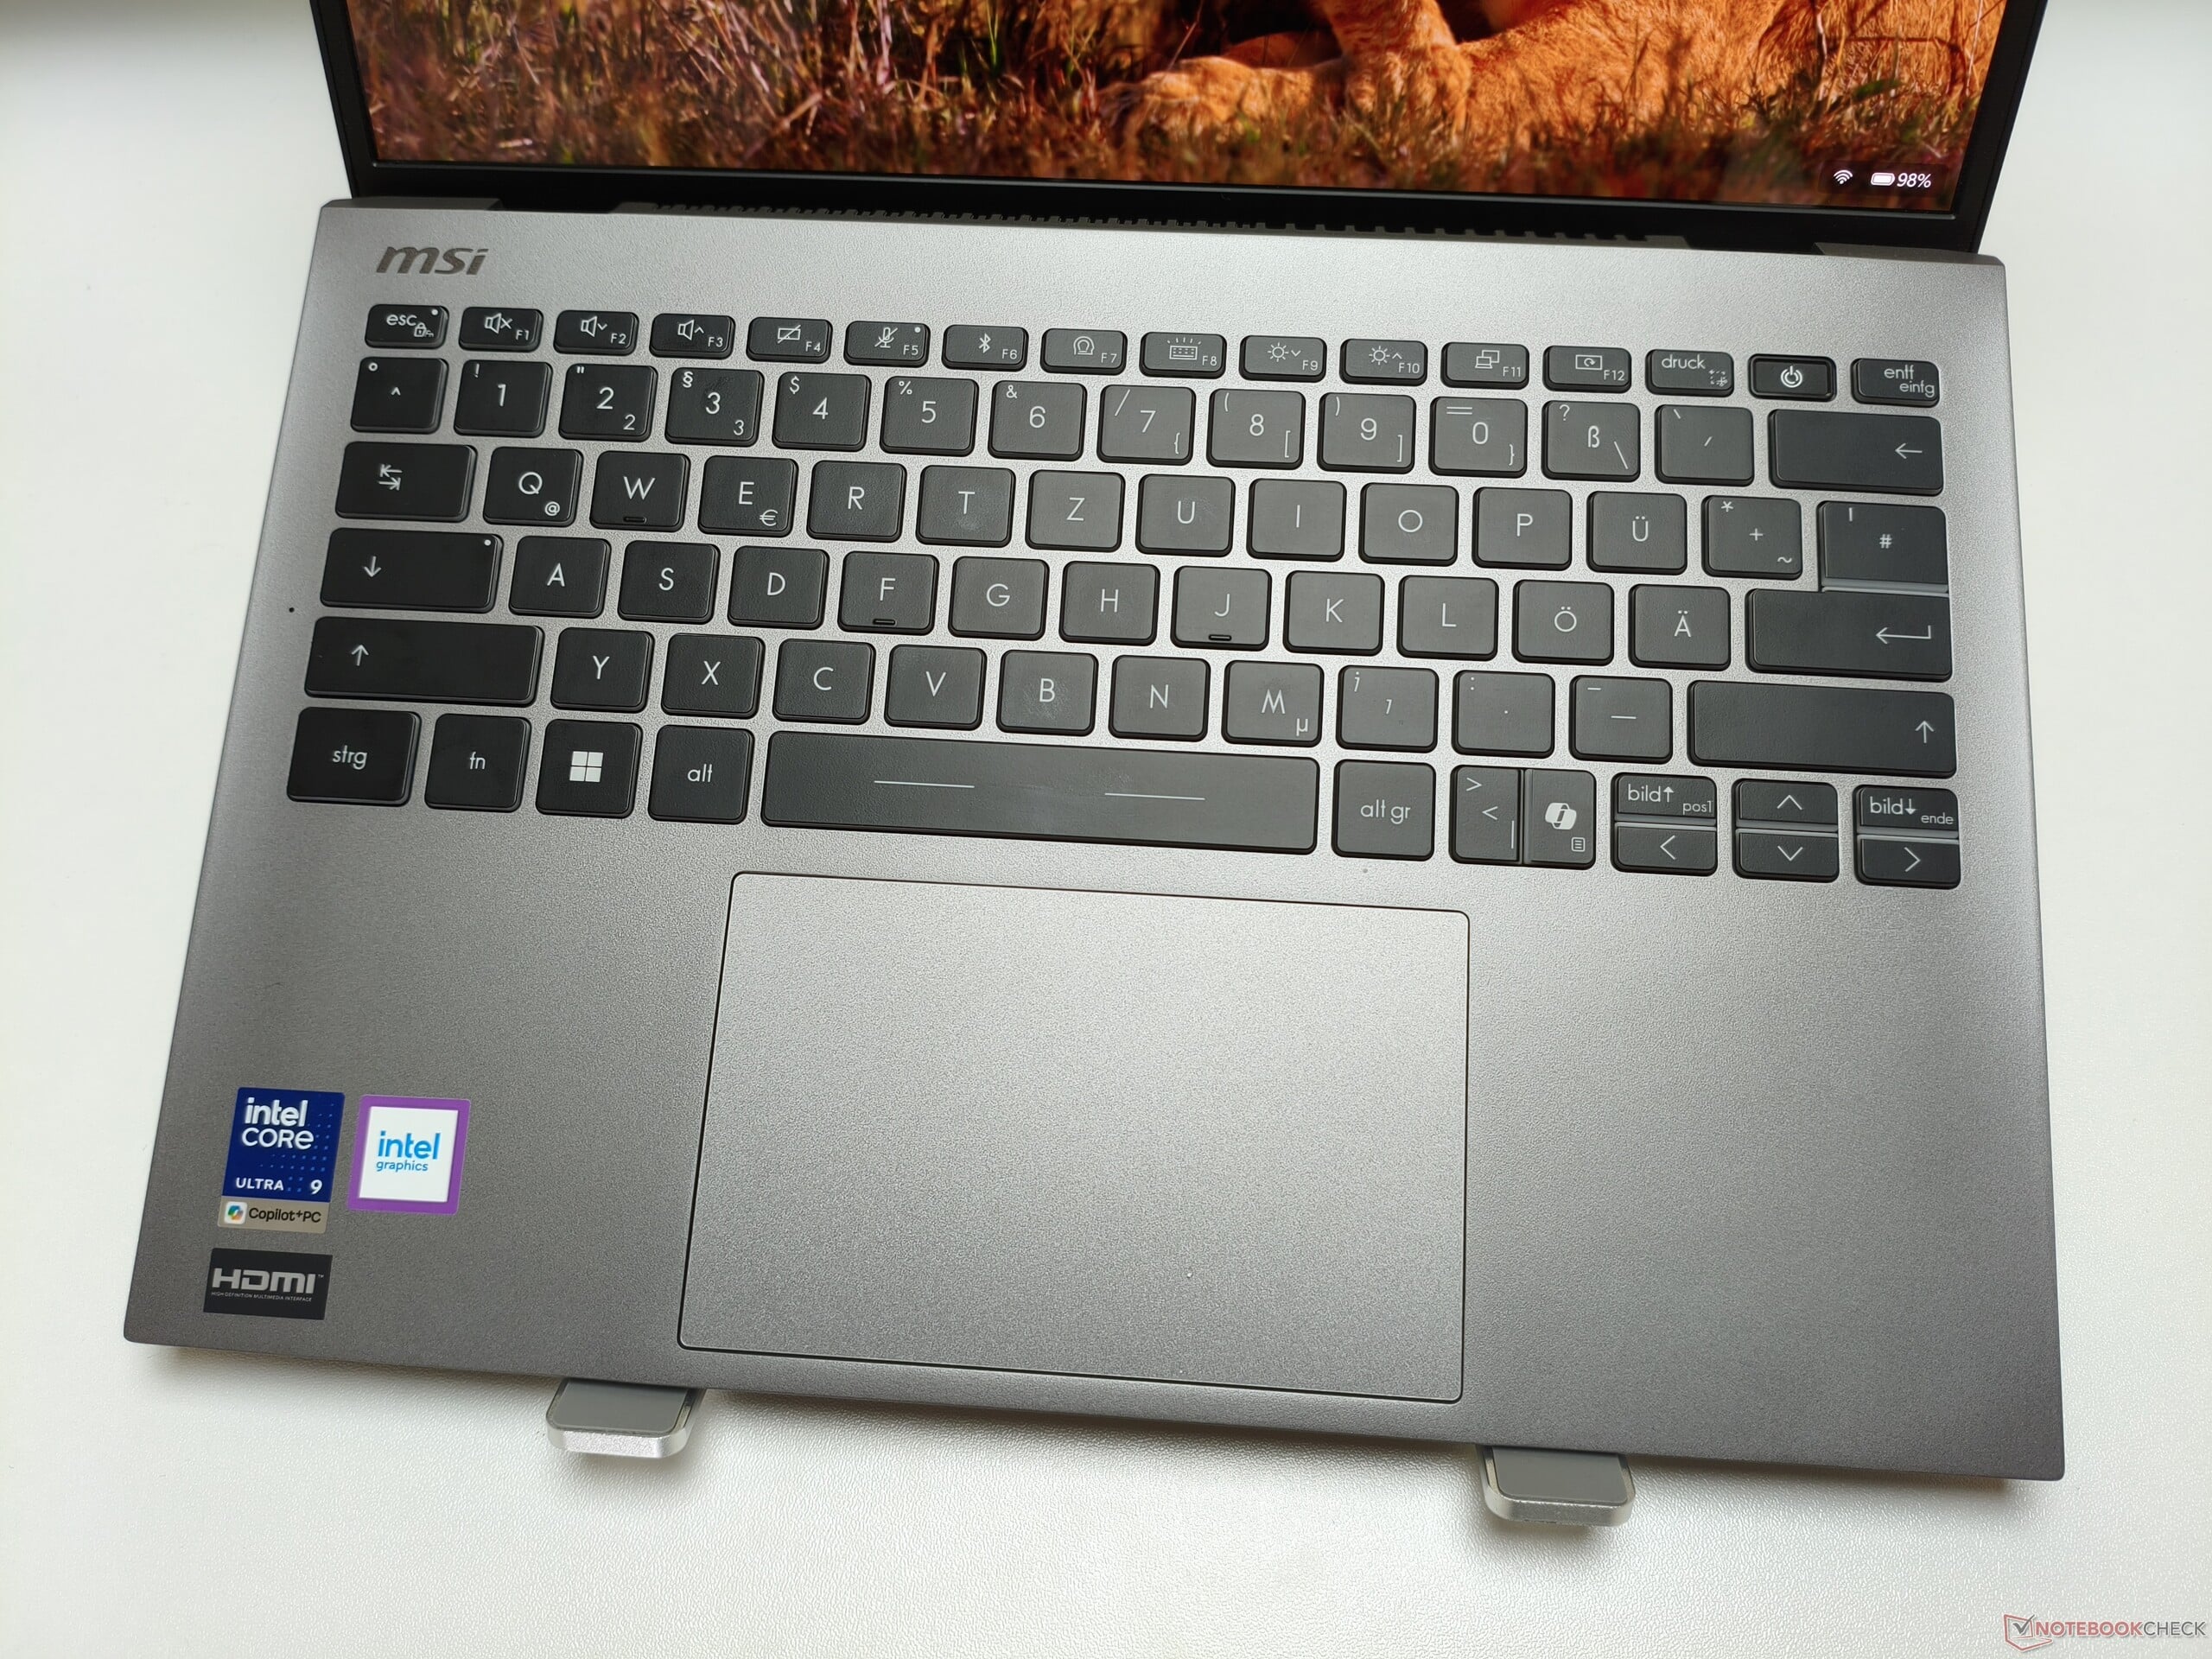
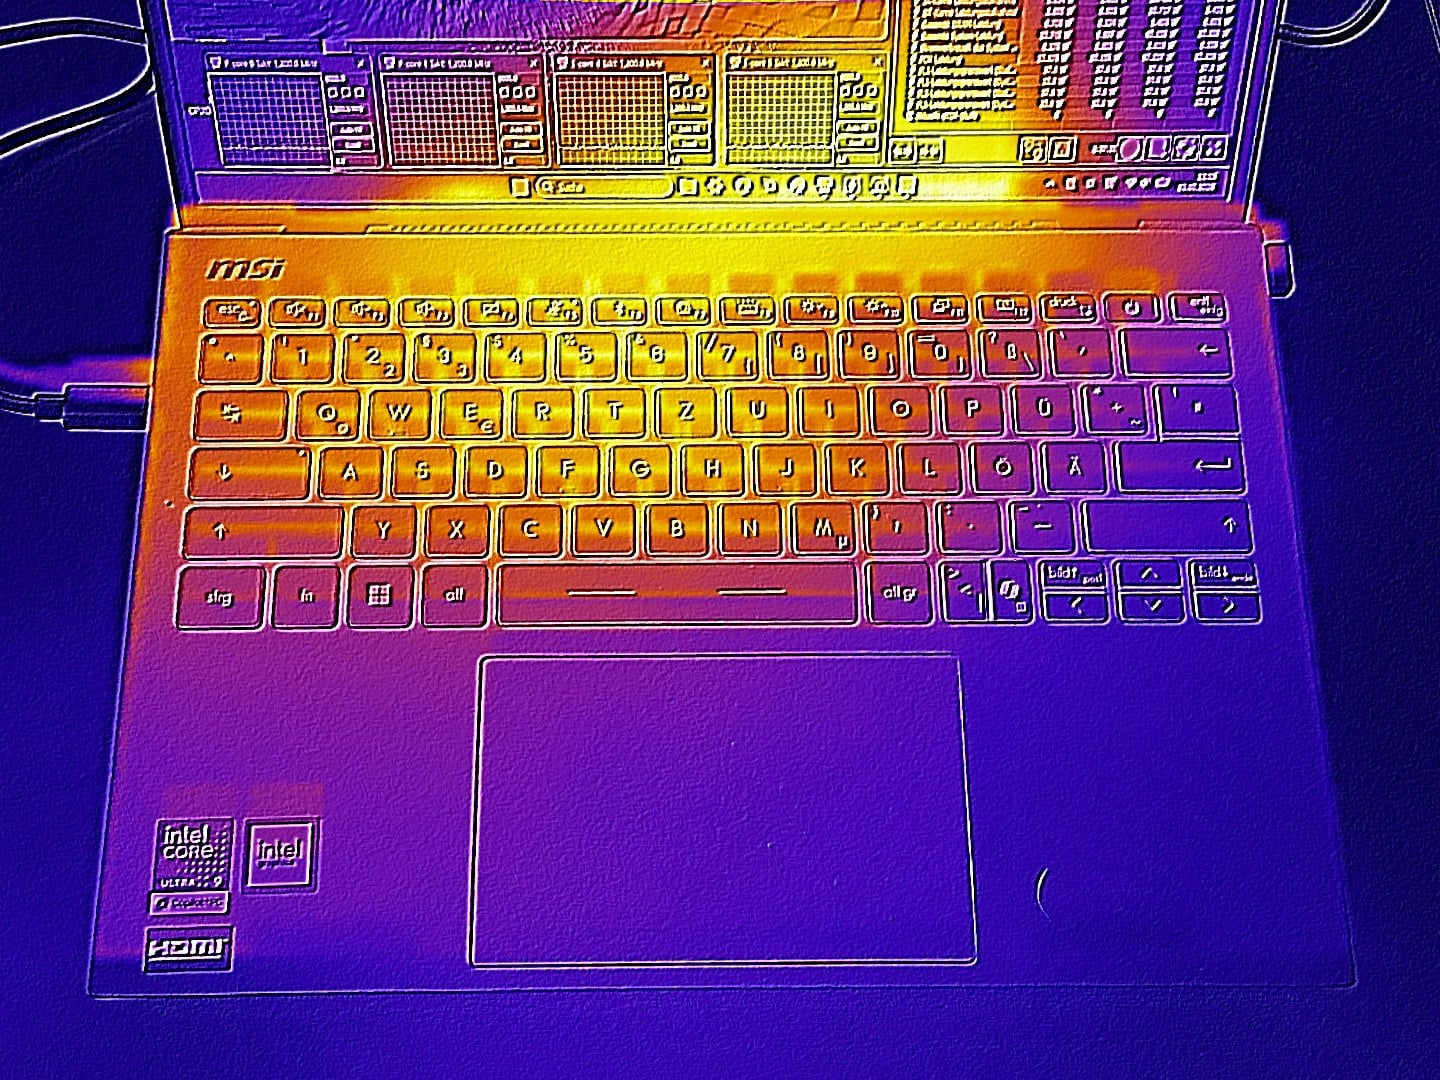
O teclado com luz de fundo branca oferece uma experiência de digitação decente, mas, como já esperamos dos notebooks MSI, sofre com um layout com o qual é preciso se acostumar e que, em nossa opinião, não é o ideal. Os pontos também são deduzidos por algumas teclas muito pequenas, incluindo as teclas de seta, a tecla ><| e a tecla Windows Copilot. O touchpad de aproximadamente 12 x 7,5 cm é agradavelmente suave e geralmente funciona de forma confiável, o que o torna melhor do que o teclado. Entretanto, os cliques, como em muitos laptops, poderiam ser um pouco menos estridentes.
| SD Card Reader | |
| average JPG Copy Test (av. of 3 runs) | |
| MSI Prestige 13 AI+ A3MG (AV PRO microSD 128 GB V60) | |
| Lenovo IdeaPad 5i 2-in-1 14IPH11 (AV PRO microSD 128 GB V60) | |
| Média da turma Subnotebook (23.7 - 188, n=9, últimos 2 anos) | |
| maximum AS SSD Seq Read Test (1GB) | |
| MSI Prestige 13 AI+ A3MG (AV PRO microSD 128 GB V60) | |
| Média da turma Subnotebook (24.9 - 195, n=8, últimos 2 anos) | |
| Lenovo IdeaPad 5i 2-in-1 14IPH11 (AV PRO microSD 128 GB V60) | |
| Networking | |
| iperf3 receive Wi-Fi6/7 RT-BE96U | |
| Média da turma Subnotebook (2236 - 3088, n=3, últimos 2 anos) | |
| MSI Prestige 13 AI+ A3MG | |
| Média Intel® Killer™ Wi-Fi 7 BE1775s (n=1) | |
| Lenovo IdeaPad 5i 2-in-1 14IPH11 | |
| iperf3 transmit Wi-Fi6/7 RT-BE96U | |
| Média da turma Subnotebook (2156 - 4549, n=3, últimos 2 anos) | |
| MSI Prestige 13 AI+ A3MG | |
| Média Intel® Killer™ Wi-Fi 7 BE1775s (n=1) | |
| Lenovo IdeaPad 5i 2-in-1 14IPH11 | |
Webcam


Tela
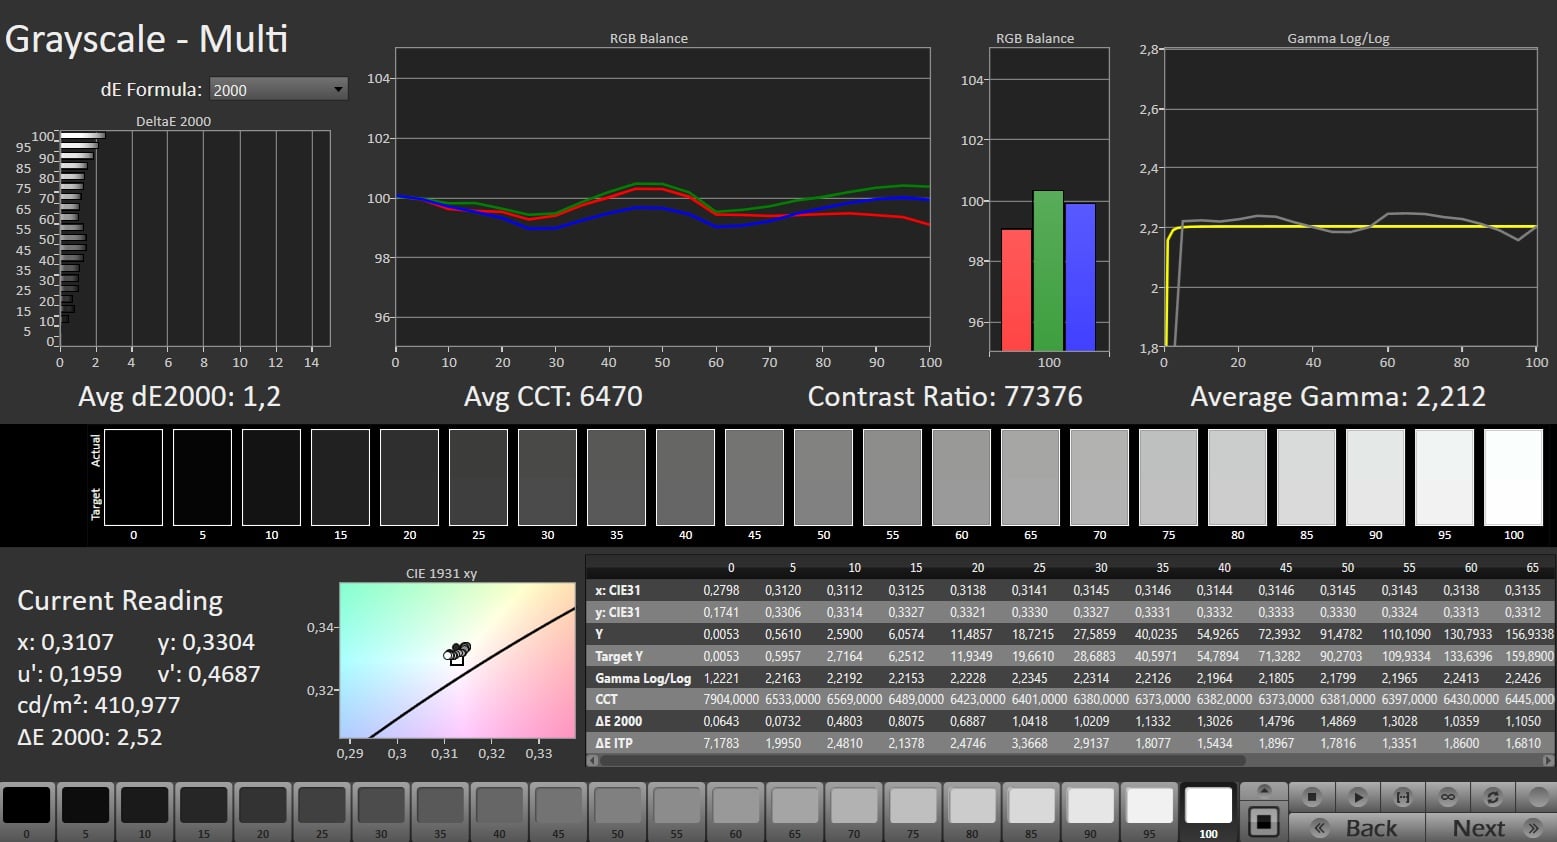
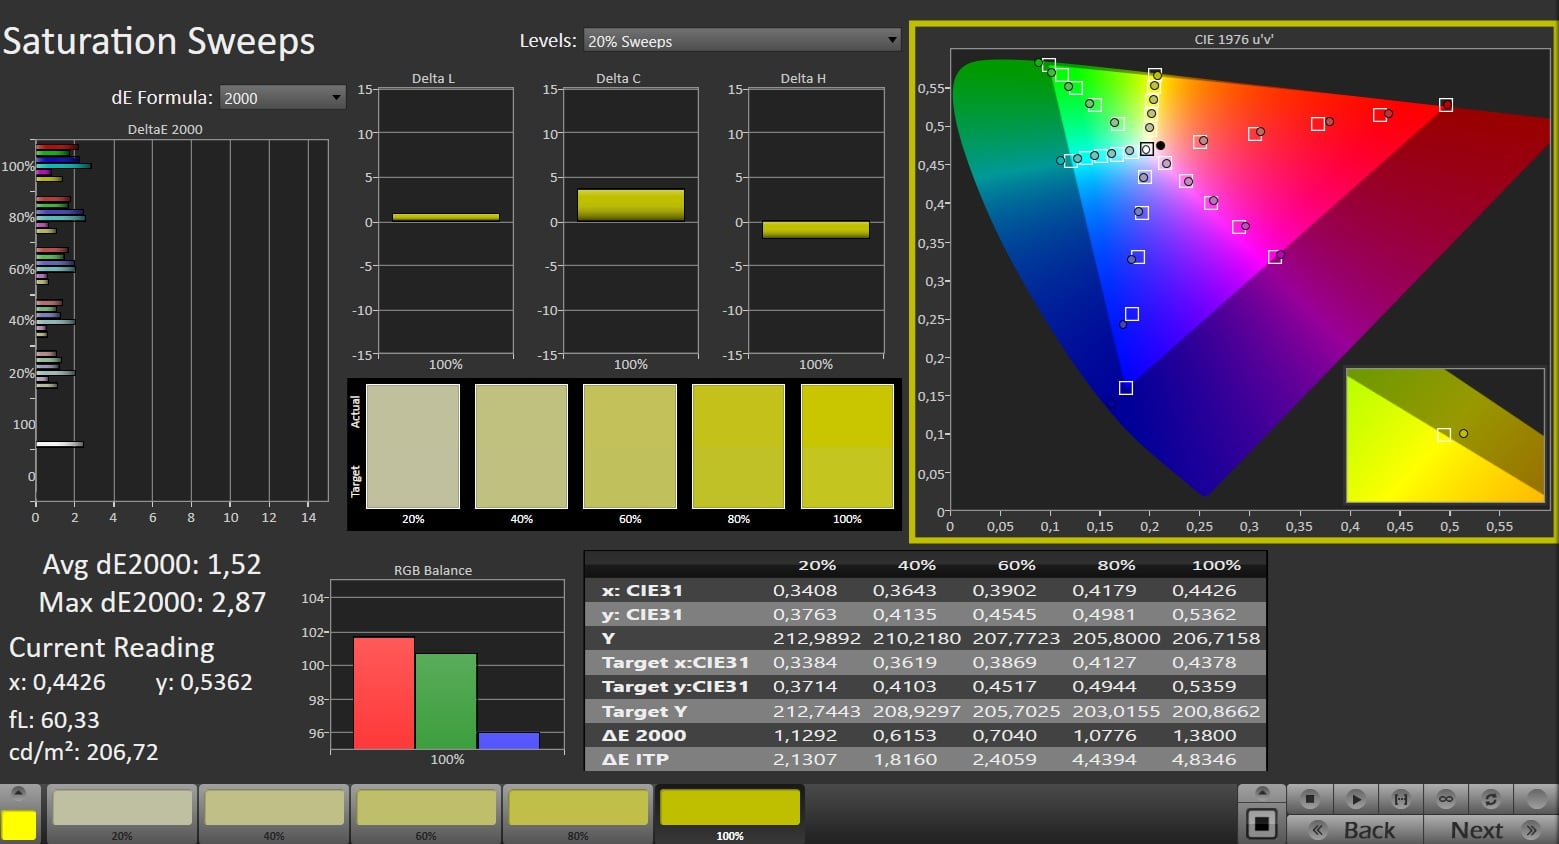
A MSI optou por um painel OLED com uma resolução muito nítida de 2880 x 1800, embora sua superfície reflexiva o torne bastante fraco para uso externo. Medimos um brilho médio de pouco menos de 400 cd/m², o que é sólido. Os valores restantes também atendem às expectativas de uma tela OLED. Graças ao excelente nível de preto, o contraste é extremamente alto e supera facilmente os painéis IPS clássicos.
Também não há nada a criticar quando se trata de tempos de resposta, precisão de cores e cobertura do espaço de cores: 100% sRGB e DCI-P3, além de 96% AdobeRGB. No entanto, usuários sensíveis podem ter problemas devido à cintilação detectada na tela. Uma frequência de 60 Hz no pior dos casos é bastante baixa.
| |||||||||||||||||||||||||
iluminação: 98 %
iluminação com acumulador: 394 cd/m²
Contraste: 78800:1 (Preto: 0.005 cd/m²)
ΔE ColorChecker Calman: 1.67 | ∀{0.5-29.43 Ø4.71}
ΔE Greyscale Calman: 1.2 | ∀{0.09-98 Ø4.96}
95.7% AdobeRGB 1998 (Argyll 3D)
100% sRGB (Argyll 3D)
99.9% Display P3 (Argyll 3D)
Gamma: 2.212
CCT: 6470 K
| MSI Prestige 13 AI+ A3MG ATNA33AA07-0, OLED, 2880x1800, 13.3", 60 Hz | Lenovo Yoga Slim 7 Ultra 14IPH11 LEN140WQ+, OLED, 2880x1800, 14", 120 Hz | Lenovo IdeaPad 5i 2-in-1 14IPH11 LEN140WUXGA, IPS, 1920x1200, 14", 60 Hz | Honor MagicBook Pro 14 2026 EDO14.55, OLED, 3120x2080, 14.6", 120 Hz | Asus ZenBook 14 OLED UM3406K, Ryzen AI 7 350 ATNA40CT02-0, OLED, 1920x1200, 14", 60 Hz | Asus Zenbook A14 UX3704NA ATNA40CT06-0, OLED, 1920x1200, 14", 60 Hz | |
|---|---|---|---|---|---|---|
| Display | -3% | -51% | -5% | 0% | -3% | |
| Display P3 Coverage (%) | 99.9 | 99.3 -1% | 42 -58% | 96.3 -4% | 99.9 0% | 99.5 0% |
| sRGB Coverage (%) | 100 | 100 0% | 60.9 -39% | 99.9 0% | 100 0% | 98.8 -1% |
| AdobeRGB 1998 Coverage (%) | 95.7 | 87.7 -8% | 43.4 -55% | 85 -11% | 96.4 1% | 88.9 -7% |
| Response Times | 16% | -1228% | 67% | -2% | 34% | |
| Response Time Grey 50% / Grey 80% * (ms) | 1.8 ? | 0.64 ? 64% | 26.8 ? -1389% | 0.55 ? 69% | 1.6 ? 11% | 1.22 ? 32% |
| Response Time Black / White * (ms) | 1.5 ? | 0.94 ? 37% | 17.5 ? -1067% | 0.51 ? 66% | 2 ? -33% | 1.26 ? 16% |
| PWM Frequency (Hz) | 60 ? | 479.46 ? | 120 ? | 480 | 480 ? | |
| PWM Amplitude * (%) | 33 | 50 -52% | 11 67% | 28 15% | 15 55% | |
| Screen | 5% | -938% | -6% | -66% | -1% | |
| Brightness middle (cd/m²) | 394 | 470.7 19% | 411 4% | 519 32% | 386 -2% | 404 3% |
| Brightness (cd/m²) | 395 | 488 24% | 397 1% | 526 33% | 387 -2% | 408 3% |
| Brightness Distribution (%) | 98 | 94 -4% | 91 -7% | 89 -9% | 97 -1% | 98 0% |
| Black Level * (cd/m²) | 0.005 | 0.32 -6300% | 0.01 -100% | 0.03 -500% | ||
| Contrast (:1) | 78800 | 1284 -98% | 51900 -34% | 12867 -84% | ||
| Colorchecker dE 2000 * | 1.67 | 2.21 -32% | 6.88 -312% | 1.1 34% | 1.55 7% | 1.1 34% |
| Colorchecker dE 2000 max. * | 3.9 | 5.02 -29% | 19.85 -409% | 2.2 44% | 3.39 13% | 3.3 15% |
| Greyscale dE 2000 * | 1.2 | 0.6 50% | 5.8 -383% | 1.8 -50% | 0.67 44% | 1.9 -58% |
| Gamma | 2.212 99% | 2.2 100% | 2.202 100% | 2.23 99% | 2.42 91% | 2.17 101% |
| CCT | 6470 100% | 6472 100% | 6359 102% | 6496 100% | 6505 100% | 6547 99% |
| Colorchecker dE 2000 calibrated * | 0.82 | 0.7 | 1.55 | |||
| Média Total (Programa/Configurações) | 6% /
6% | -739% /
-778% | 19% /
10% | -23% /
-38% | 10% /
8% |
* ... menor é melhor


Exibir tempos de resposta
| ↔ Tempo de resposta preto para branco | ||
|---|---|---|
| 1.5 ms ... ascensão ↗ e queda ↘ combinadas | ↗ 0.8 ms ascensão | 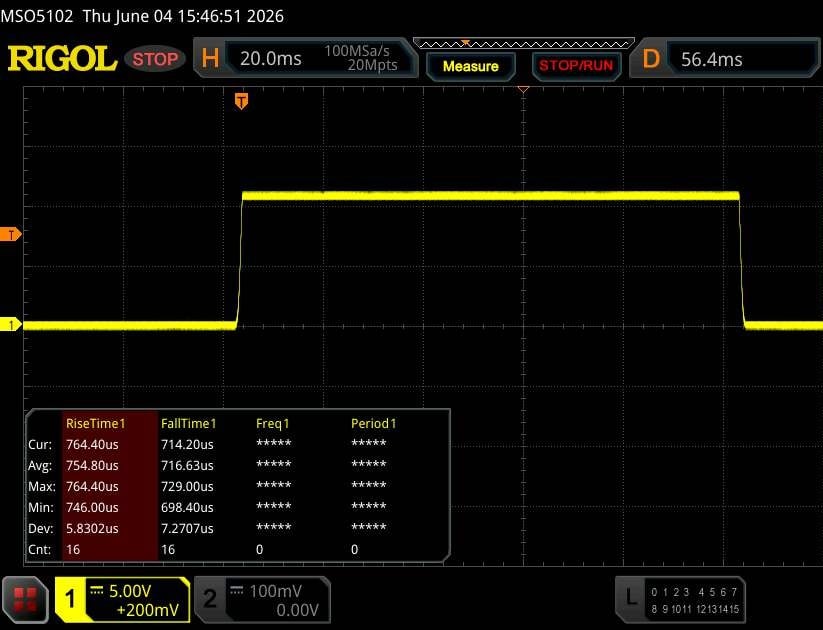 |
| ↘ 0.7 ms queda | ||
| A tela mostra taxas de resposta muito rápidas em nossos testes e deve ser muito adequada para jogos em ritmo acelerado. Em comparação, todos os dispositivos testados variam de 0.1 (mínimo) a 240 (máximo) ms. » 9 % de todos os dispositivos são melhores. Isso significa que o tempo de resposta medido é melhor que a média de todos os dispositivos testados (19.8 ms). | ||
| ↔ Tempo de resposta 50% cinza a 80% cinza | ||
| 1.8 ms ... ascensão ↗ e queda ↘ combinadas | ↗ 0.9 ms ascensão | 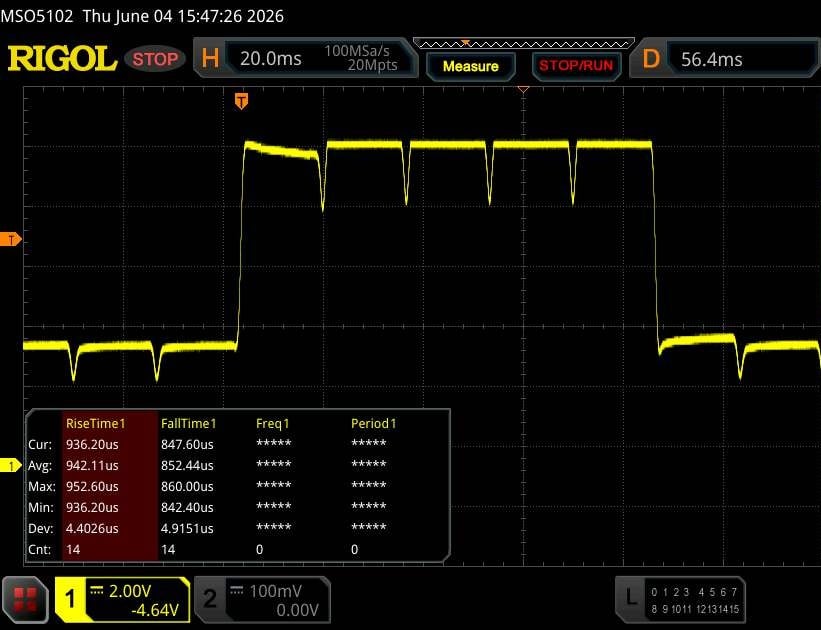 |
| ↘ 0.9 ms queda | ||
| A tela mostra taxas de resposta muito rápidas em nossos testes e deve ser muito adequada para jogos em ritmo acelerado. Em comparação, todos os dispositivos testados variam de 0.165 (mínimo) a 636 (máximo) ms. » 9 % de todos os dispositivos são melhores. Isso significa que o tempo de resposta medido é melhor que a média de todos os dispositivos testados (31 ms). | ||
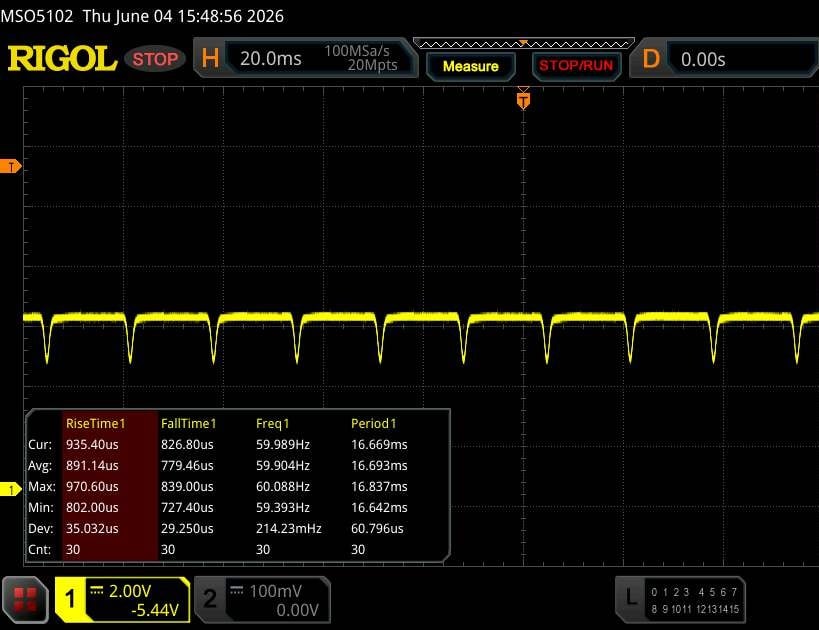
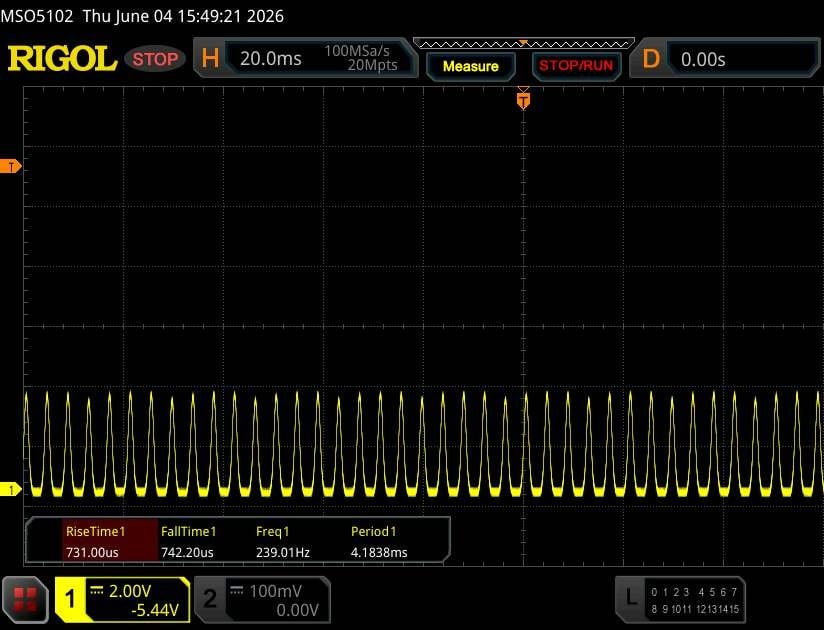
Cintilação da tela / PWM (modulação por largura de pulso)
| Tela tremeluzindo/PWM detectado | 60 Hz Amplitude: 33 % | ≤ 90 % configuração de brilho | |
A luz de fundo da tela pisca em 60 Hz (pior caso, por exemplo, utilizando PWM) Cintilação detectada em uma configuração de brilho de 90 % e abaixo. Não deve haver cintilação ou PWM acima desta configuração de brilho. A frequência de 60 Hz é muito baixa, portanto a oscilação pode causar fadiga ocular e dores de cabeça após uso prolongado. [pwm_comparison] Em comparação: 52 % de todos os dispositivos testados não usam PWM para escurecer a tela. Se PWM foi detectado, uma média de 7757 (mínimo: 5 - máximo: 343500) Hz foi medida. | |||
Desempenho
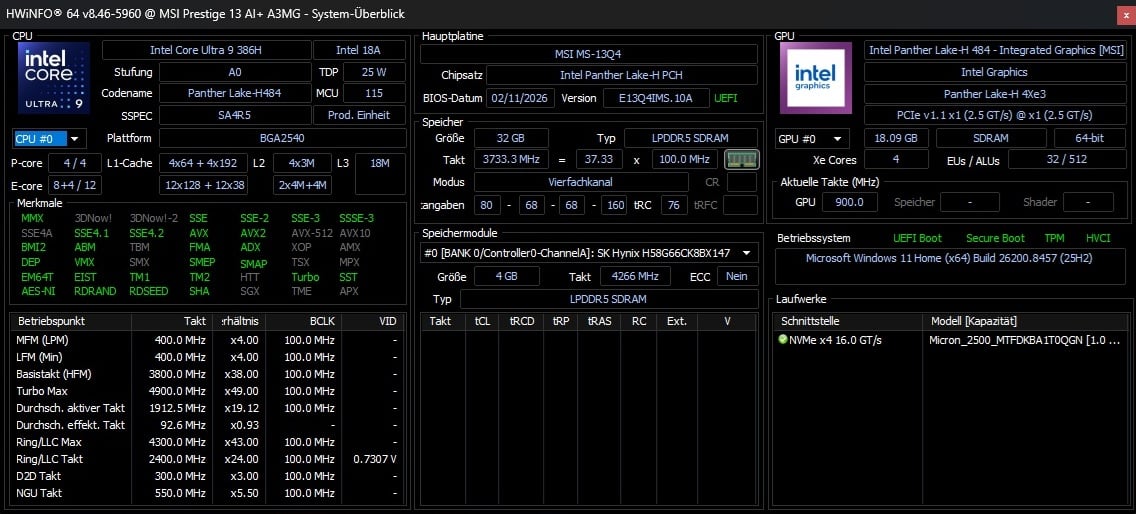
O Core Ultra 9 386H oferece desempenho de médio porte. Pelo preço de compra de cerca de 1.600 euros, os compradores também recebem um SSD de 1 TB e 32 GB de RAM LPDDR5X, o que continua razoável, considerando a atual crise de memória.
Condições de teste
Como é típico do fabricante, vários perfis estão disponíveis no MSI Center. Como o laptop tem a marca AI, todas as medições foram realizadas usando o AI Engine. O comportamento dos outros modos pode ser encontrado na tabela.
| Modo | AI Engine | Desempenho | Balanceado | ECO Silencioso |
| Ruído do Cyberpunk 2077 | 41 dB(A) | 40 dB(A) | 32 dB(A) | 31 dB(A) |
| Taxa de quadros do Cyberpunk 2077 (FHD/Ultra) | 19,1 fps | 19,3 fps | 16,2 fps | 10,1 fps |
| CPU PL1 | variável | 24 W | 15 W | 10 W |
| CPU PL2 | variável | 34 W | 25 W | 10 W |
| Cinebench R15 Multi Score | 2513 pontos | 2490 pontos | 1963 pontos | 1224 pontos |
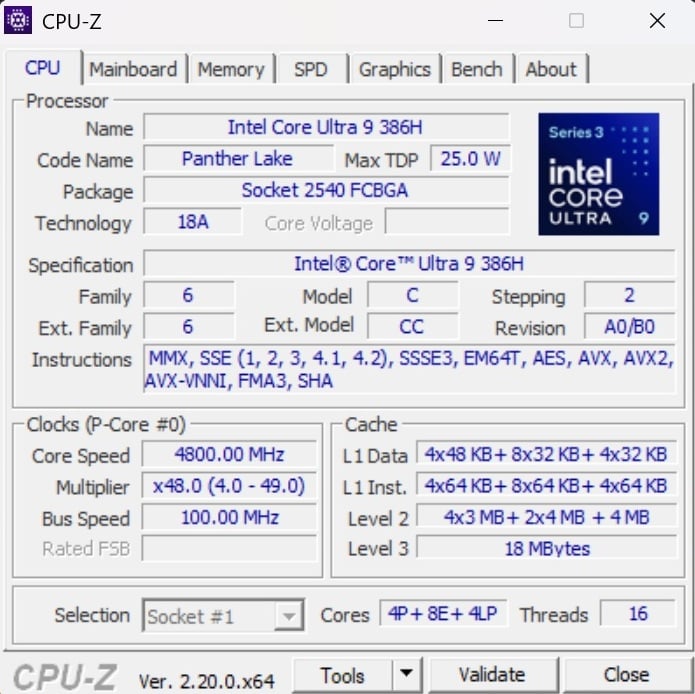
Processador
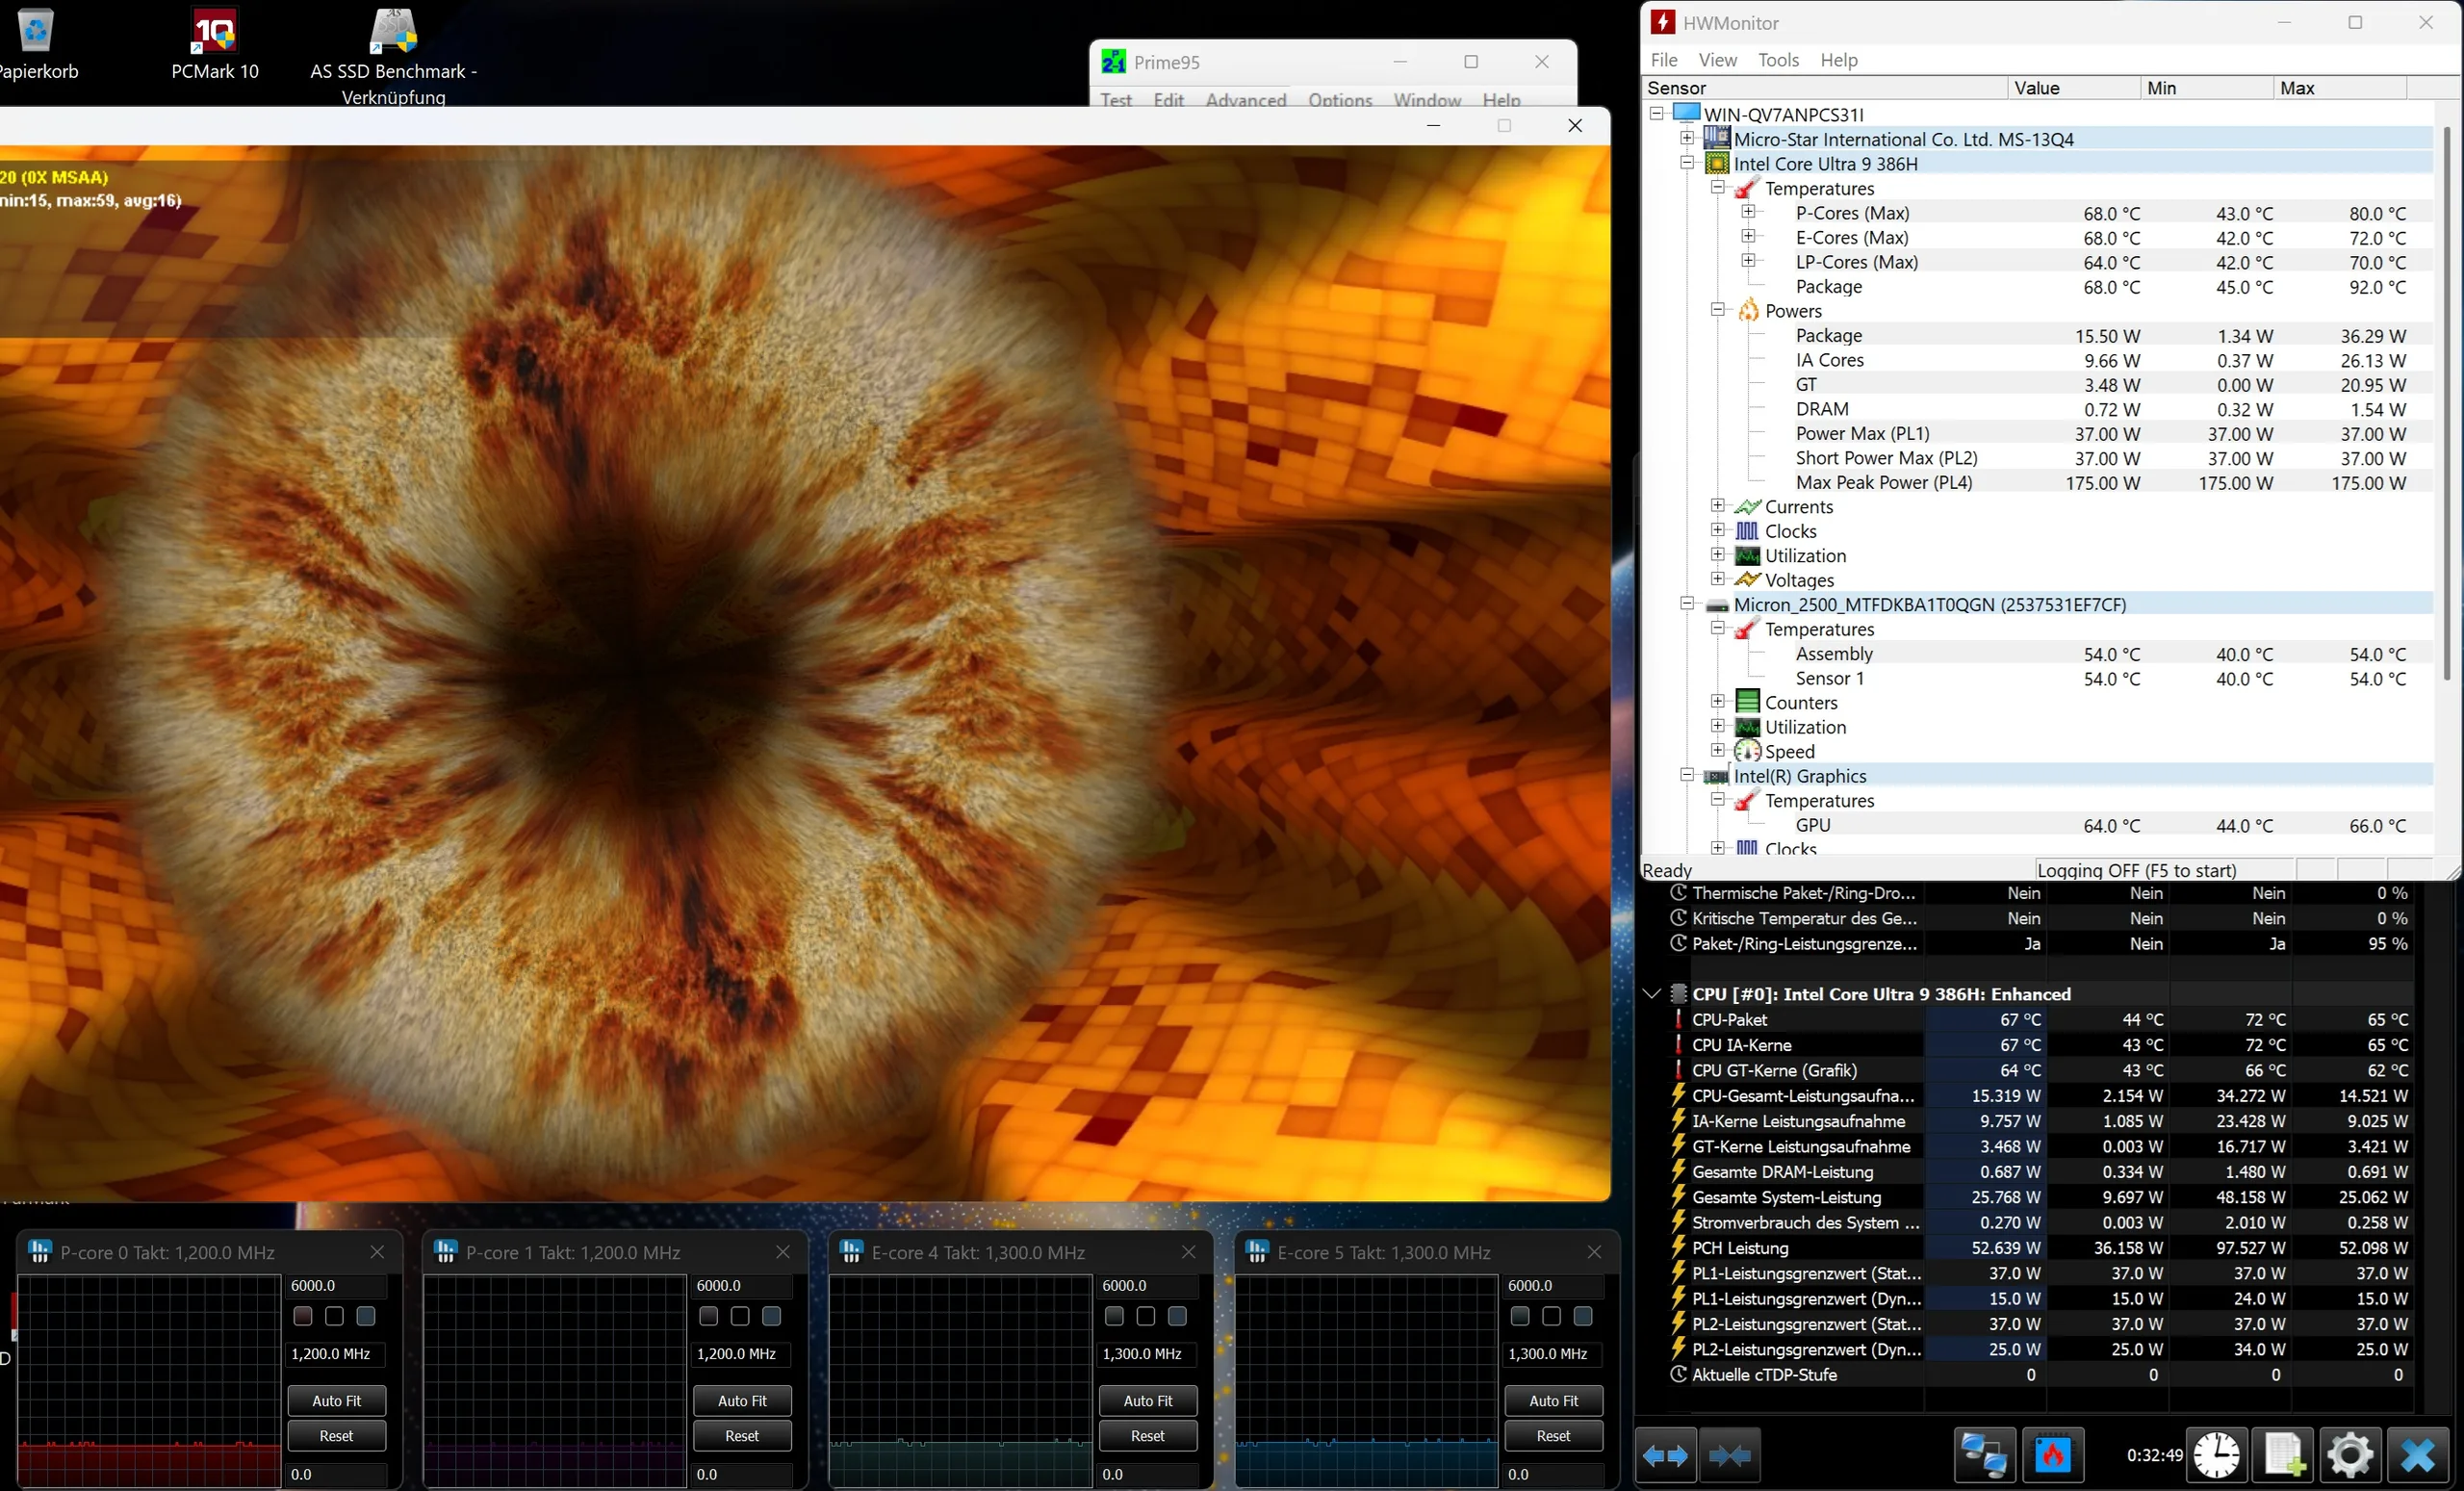
O Core Ultra 9 386H é um processador Panther Lake moderno com 16 núcleos e sem Hyper-Threading, e já o testamos várias vezes. Em nossa suíte de benchmark, o Prestige 13 AI+ fica apenas um pouco à frente dos dispositivos com o Ryzen AI 7 350 e Core Ultra 7 355 apesar de seu número maior de núcleos. Como mostra nosso loop Cinebench, o laptop infelizmente não consegue manter o desempenho da CPU mesmo após um curto período de carga, e o desempenho cai ligeiramente. A maioria dos rivais lida melhor com isso.
Cinebench R15 Teste de resistência múltipla
* ... menor é melhor
AIDA64: FP32 Ray-Trace | FPU Julia | CPU SHA3 | CPU Queen | FPU SinJulia | FPU Mandel | CPU AES | CPU ZLib | FP64 Ray-Trace | CPU PhotoWorxx
| Performance rating | |
| Média Intel Core Ultra 9 386H -1! | |
| Asus ZenBook 14 OLED UM3406K, Ryzen AI 7 350 | |
| Honor MagicBook Pro 14 2026 -1! | |
| Média da turma Subnotebook | |
| Asus Zenbook A14 UX3704NA -1! | |
| Lenovo Yoga Slim 7 Ultra 14IPH11 -1! | |
| MSI Prestige 13 AI+ A3MG -1! | |
| Lenovo IdeaPad 5i 2-in-1 14IPH11 -1! | |
| AIDA64 / FP32 Ray-Trace | |
| Asus ZenBook 14 OLED UM3406K, Ryzen AI 7 350 (v6.92.6600) | |
| Média Intel Core Ultra 9 386H (10001 - 21727, n=8) | |
| Honor MagicBook Pro 14 2026 (v8.20.8100) | |
| Média da turma Subnotebook (1135 - 32888, n=58, últimos 2 anos) | |
| Lenovo Yoga Slim 7 Ultra 14IPH11 (v8.20.8100) | |
| MSI Prestige 13 AI+ A3MG (v8.20.8100) | |
| Asus Zenbook A14 UX3704NA (v8.20.8100) | |
| Lenovo IdeaPad 5i 2-in-1 14IPH11 (v8.20.8100) | |
| AIDA64 / FPU Julia | |
| Média Intel Core Ultra 9 386H (53370 - 113595, n=8) | |
| Honor MagicBook Pro 14 2026 (v8.20.8100) | |
| Asus ZenBook 14 OLED UM3406K, Ryzen AI 7 350 (v6.92.6600) | |
| Média da turma Subnotebook (5218 - 123315, n=58, últimos 2 anos) | |
| Lenovo Yoga Slim 7 Ultra 14IPH11 (v8.20.8100) | |
| MSI Prestige 13 AI+ A3MG (v8.20.8100) | |
| Lenovo IdeaPad 5i 2-in-1 14IPH11 (v8.20.8100) | |
| Asus Zenbook A14 UX3704NA (v8.20.8100) | |
| AIDA64 / CPU SHA3 | |
| Média Intel Core Ultra 9 386H (2776 - 5604, n=8) | |
| Asus Zenbook A14 UX3704NA (v8.20.8100) | |
| Honor MagicBook Pro 14 2026 (v8.20.8100) | |
| Asus ZenBook 14 OLED UM3406K, Ryzen AI 7 350 (v6.92.6600) | |
| Média da turma Subnotebook (444 - 5287, n=58, últimos 2 anos) | |
| Lenovo Yoga Slim 7 Ultra 14IPH11 (v8.20.8100) | |
| MSI Prestige 13 AI+ A3MG (v8.20.8100) | |
| Lenovo IdeaPad 5i 2-in-1 14IPH11 (v8.20.8100) | |
| AIDA64 / CPU Queen | |
| Asus ZenBook 14 OLED UM3406K, Ryzen AI 7 350 (v6.92.6600) | |
| Média da turma Subnotebook (10579 - 95002, n=49, últimos 2 anos) | |
| AIDA64 / FPU SinJulia | |
| Asus ZenBook 14 OLED UM3406K, Ryzen AI 7 350 (v6.92.6600) | |
| Média Intel Core Ultra 9 386H (5314 - 7332, n=8) | |
| Média da turma Subnotebook (744 - 18418, n=58, últimos 2 anos) | |
| Honor MagicBook Pro 14 2026 (v8.20.8100) | |
| MSI Prestige 13 AI+ A3MG (v8.20.8100) | |
| Lenovo Yoga Slim 7 Ultra 14IPH11 (v8.20.8100) | |
| Asus Zenbook A14 UX3704NA (v8.20.8100) | |
| Lenovo IdeaPad 5i 2-in-1 14IPH11 (v8.20.8100) | |
| AIDA64 / FPU Mandel | |
| Média Intel Core Ultra 9 386H (28414 - 61578, n=8) | |
| Honor MagicBook Pro 14 2026 (v8.20.8100) | |
| Asus ZenBook 14 OLED UM3406K, Ryzen AI 7 350 (v6.92.6600) | |
| Média da turma Subnotebook (3341 - 65433, n=58, últimos 2 anos) | |
| Lenovo Yoga Slim 7 Ultra 14IPH11 (v8.20.8100) | |
| MSI Prestige 13 AI+ A3MG (v8.20.8100) | |
| Lenovo IdeaPad 5i 2-in-1 14IPH11 (v8.20.8100) | |
| Asus Zenbook A14 UX3704NA (v8.20.8100) | |
| AIDA64 / CPU AES | |
| Asus Zenbook A14 UX3704NA (v8.20.8100) | |
| Asus ZenBook 14 OLED UM3406K, Ryzen AI 7 350 (v6.92.6600) | |
| Média Intel Core Ultra 9 386H (46362 - 72112, n=8) | |
| Média da turma Subnotebook (638 - 96917, n=58, últimos 2 anos) | |
| Honor MagicBook Pro 14 2026 (v8.20.8100) | |
| MSI Prestige 13 AI+ A3MG (v8.20.8100) | |
| Lenovo Yoga Slim 7 Ultra 14IPH11 (v8.20.8100) | |
| Lenovo IdeaPad 5i 2-in-1 14IPH11 (v8.20.8100) | |
| AIDA64 / CPU ZLib | |
| Asus Zenbook A14 UX3704NA (v8.20.8100) | |
| Média Intel Core Ultra 9 386H (669 - 1271, n=8) | |
| Honor MagicBook Pro 14 2026 (v8.20.8100) | |
| Asus ZenBook 14 OLED UM3406K, Ryzen AI 7 350 (v6.92.6600) | |
| Média da turma Subnotebook (164.9 - 1379, n=58, últimos 2 anos) | |
| MSI Prestige 13 AI+ A3MG (v8.20.8100) | |
| Lenovo Yoga Slim 7 Ultra 14IPH11 (v8.20.8100) | |
| Lenovo IdeaPad 5i 2-in-1 14IPH11 (v8.20.8100) | |
| AIDA64 / FP64 Ray-Trace | |
| Asus ZenBook 14 OLED UM3406K, Ryzen AI 7 350 (v6.92.6600) | |
| Média Intel Core Ultra 9 386H (5138 - 11627, n=8) | |
| Honor MagicBook Pro 14 2026 (v8.20.8100) | |
| Média da turma Subnotebook (610 - 17495, n=58, últimos 2 anos) | |
| Lenovo Yoga Slim 7 Ultra 14IPH11 (v8.20.8100) | |
| Asus Zenbook A14 UX3704NA (v8.20.8100) | |
| MSI Prestige 13 AI+ A3MG (v8.20.8100) | |
| Lenovo IdeaPad 5i 2-in-1 14IPH11 (v8.20.8100) | |
| AIDA64 / CPU PhotoWorxx | |
| Média Intel Core Ultra 9 386H (54042 - 89891, n=8) | |
| Honor MagicBook Pro 14 2026 (v8.20.8100) | |
| MSI Prestige 13 AI+ A3MG (v8.20.8100) | |
| Lenovo Yoga Slim 7 Ultra 14IPH11 (v8.20.8100) | |
| Asus Zenbook A14 UX3704NA (v8.20.8100) | |
| Média da turma Subnotebook (6569 - 85600, n=58, últimos 2 anos) | |
| Asus ZenBook 14 OLED UM3406K, Ryzen AI 7 350 (v6.92.6600) | |
| Lenovo IdeaPad 5i 2-in-1 14IPH11 (v8.20.8100) | |
Desempenho do sistema
No entanto, os benchmarks do sistema colocam o modelo de 13 polegadas em terceiro lugar no campo de comparação, logo atrás do Honor MagicBook Pro 14. No uso diário, o laptop responde agradavelmente rápido.
PCMark 10: Score | Essentials | Productivity | Digital Content Creation
CrossMark: Overall | Productivity | Creativity | Responsiveness
WebXPRT 3: Overall
WebXPRT 4: Overall
Mozilla Kraken 1.1: Total
| Performance rating | |
| Asus Zenbook A14 UX3704NA -4! | |
| Honor MagicBook Pro 14 2026 | |
| Média Intel Core Ultra 9 386H, Intel Graphics 4 Xe3 Panther Lake iGPU | |
| MSI Prestige 13 AI+ A3MG | |
| Lenovo Yoga Slim 7 Ultra 14IPH11 | |
| Média da turma Subnotebook | |
| Asus ZenBook 14 OLED UM3406K, Ryzen AI 7 350 | |
| Lenovo IdeaPad 5i 2-in-1 14IPH11 | |
| PCMark 10 / Score | |
| Honor MagicBook Pro 14 2026 | |
| Média Intel Core Ultra 9 386H, Intel Graphics 4 Xe3 Panther Lake iGPU (7679 - 8639, n=3) | |
| Lenovo Yoga Slim 7 Ultra 14IPH11 | |
| MSI Prestige 13 AI+ A3MG | |
| Média da turma Subnotebook (4920 - 9939, n=45, últimos 2 anos) | |
| Asus ZenBook 14 OLED UM3406K, Ryzen AI 7 350 | |
| Lenovo IdeaPad 5i 2-in-1 14IPH11 | |
| PCMark 10 / Essentials | |
| MSI Prestige 13 AI+ A3MG | |
| Asus ZenBook 14 OLED UM3406K, Ryzen AI 7 350 | |
| Média Intel Core Ultra 9 386H, Intel Graphics 4 Xe3 Panther Lake iGPU (10375 - 10934, n=3) | |
| Honor MagicBook Pro 14 2026 | |
| Lenovo Yoga Slim 7 Ultra 14IPH11 | |
| Média da turma Subnotebook (8552 - 11646, n=45, últimos 2 anos) | |
| Lenovo IdeaPad 5i 2-in-1 14IPH11 | |
| PCMark 10 / Productivity | |
| Honor MagicBook Pro 14 2026 | |
| Lenovo Yoga Slim 7 Ultra 14IPH11 | |
| Média Intel Core Ultra 9 386H, Intel Graphics 4 Xe3 Panther Lake iGPU (12295 - 15282, n=3) | |
| MSI Prestige 13 AI+ A3MG | |
| Lenovo IdeaPad 5i 2-in-1 14IPH11 | |
| Asus ZenBook 14 OLED UM3406K, Ryzen AI 7 350 | |
| Média da turma Subnotebook (5435 - 16606, n=45, últimos 2 anos) | |
| PCMark 10 / Digital Content Creation | |
| Honor MagicBook Pro 14 2026 | |
| Média Intel Core Ultra 9 386H, Intel Graphics 4 Xe3 Panther Lake iGPU (9175 - 10562, n=3) | |
| Média da turma Subnotebook (5722 - 13779, n=45, últimos 2 anos) | |
| Lenovo Yoga Slim 7 Ultra 14IPH11 | |
| MSI Prestige 13 AI+ A3MG | |
| Asus ZenBook 14 OLED UM3406K, Ryzen AI 7 350 | |
| Lenovo IdeaPad 5i 2-in-1 14IPH11 | |
| CrossMark / Overall | |
| Média Intel Core Ultra 9 386H, Intel Graphics 4 Xe3 Panther Lake iGPU (1975 - 2143, n=3) | |
| MSI Prestige 13 AI+ A3MG | |
| Asus Zenbook A14 UX3704NA | |
| Honor MagicBook Pro 14 2026 | |
| Lenovo Yoga Slim 7 Ultra 14IPH11 | |
| Asus ZenBook 14 OLED UM3406K, Ryzen AI 7 350 | |
| Média da turma Subnotebook (365 - 2356, n=60, últimos 2 anos) | |
| Lenovo IdeaPad 5i 2-in-1 14IPH11 | |
| CrossMark / Productivity | |
| Média Intel Core Ultra 9 386H, Intel Graphics 4 Xe3 Panther Lake iGPU (1842 - 1955, n=3) | |
| MSI Prestige 13 AI+ A3MG | |
| Asus Zenbook A14 UX3704NA | |
| Honor MagicBook Pro 14 2026 | |
| Lenovo Yoga Slim 7 Ultra 14IPH11 | |
| Asus ZenBook 14 OLED UM3406K, Ryzen AI 7 350 | |
| Média da turma Subnotebook (364 - 2277, n=60, últimos 2 anos) | |
| Lenovo IdeaPad 5i 2-in-1 14IPH11 | |
| CrossMark / Creativity | |
| Média Intel Core Ultra 9 386H, Intel Graphics 4 Xe3 Panther Lake iGPU (2169 - 2477, n=3) | |
| MSI Prestige 13 AI+ A3MG | |
| Asus Zenbook A14 UX3704NA | |
| Honor MagicBook Pro 14 2026 | |
| Asus ZenBook 14 OLED UM3406K, Ryzen AI 7 350 | |
| Lenovo Yoga Slim 7 Ultra 14IPH11 | |
| Média da turma Subnotebook (372 - 2743, n=60, últimos 2 anos) | |
| Lenovo IdeaPad 5i 2-in-1 14IPH11 | |
| CrossMark / Responsiveness | |
| Asus Zenbook A14 UX3704NA | |
| Média Intel Core Ultra 9 386H, Intel Graphics 4 Xe3 Panther Lake iGPU (1667 - 1831, n=3) | |
| Honor MagicBook Pro 14 2026 | |
| MSI Prestige 13 AI+ A3MG | |
| Lenovo Yoga Slim 7 Ultra 14IPH11 | |
| Asus ZenBook 14 OLED UM3406K, Ryzen AI 7 350 | |
| Média da turma Subnotebook (312 - 1854, n=60, últimos 2 anos) | |
| Lenovo IdeaPad 5i 2-in-1 14IPH11 | |
| WebXPRT 3 / Overall | |
| Asus Zenbook A14 UX3704NA | |
| Média da turma Subnotebook (156 - 530, n=56, últimos 2 anos) | |
| MSI Prestige 13 AI+ A3MG | |
| Média Intel Core Ultra 9 386H, Intel Graphics 4 Xe3 Panther Lake iGPU (302 - 323, n=3) | |
| Lenovo Yoga Slim 7 Ultra 14IPH11 | |
| Honor MagicBook Pro 14 2026 | |
| Lenovo IdeaPad 5i 2-in-1 14IPH11 | |
| Asus ZenBook 14 OLED UM3406K, Ryzen AI 7 350 | |
| WebXPRT 4 / Overall | |
| Asus Zenbook A14 UX3704NA | |
| MSI Prestige 13 AI+ A3MG | |
| Média Intel Core Ultra 9 386H, Intel Graphics 4 Xe3 Panther Lake iGPU (282 - 309, n=3) | |
| Honor MagicBook Pro 14 2026 | |
| Lenovo Yoga Slim 7 Ultra 14IPH11 | |
| Média da turma Subnotebook (132 - 378, n=61, últimos 2 anos) | |
| Lenovo IdeaPad 5i 2-in-1 14IPH11 | |
| Asus ZenBook 14 OLED UM3406K, Ryzen AI 7 350 | |
| Mozilla Kraken 1.1 / Total | |
| Asus ZenBook 14 OLED UM3406K, Ryzen AI 7 350 | |
| Lenovo IdeaPad 5i 2-in-1 14IPH11 | |
| Média da turma Subnotebook (234 - 1104, n=61, últimos 2 anos) | |
| Lenovo Yoga Slim 7 Ultra 14IPH11 | |
| Honor MagicBook Pro 14 2026 | |
| Média Intel Core Ultra 9 386H, Intel Graphics 4 Xe3 Panther Lake iGPU (447 - 456, n=3) | |
| MSI Prestige 13 AI+ A3MG | |
| Asus Zenbook A14 UX3704NA | |
* ... menor é melhor
| PCMark 10 Score | 7679 pontos | |
Ajuda | ||
| AIDA64 / Memory Copy | |
| Honor MagicBook Pro 14 2026 | |
| Média Intel Core Ultra 9 386H (75437 - 129946, n=8) | |
| Lenovo Yoga Slim 7 Ultra 14IPH11 | |
| MSI Prestige 13 AI+ A3MG | |
| Média da turma Subnotebook (14554 - 131023, n=58, últimos 2 anos) | |
| Asus ZenBook 14 OLED UM3406K, Ryzen AI 7 350 | |
| Asus Zenbook A14 UX3704NA | |
| Lenovo IdeaPad 5i 2-in-1 14IPH11 | |
| AIDA64 / Memory Read | |
| Asus Zenbook A14 UX3704NA | |
| Média Intel Core Ultra 9 386H (81021 - 118858, n=8) | |
| Honor MagicBook Pro 14 2026 | |
| MSI Prestige 13 AI+ A3MG | |
| Lenovo Yoga Slim 7 Ultra 14IPH11 | |
| Média da turma Subnotebook (15948 - 127174, n=58, últimos 2 anos) | |
| Asus ZenBook 14 OLED UM3406K, Ryzen AI 7 350 | |
| Lenovo IdeaPad 5i 2-in-1 14IPH11 | |
| AIDA64 / Memory Write | |
| Honor MagicBook Pro 14 2026 | |
| Média Intel Core Ultra 9 386H (75959 - 135096, n=8) | |
| Lenovo Yoga Slim 7 Ultra 14IPH11 | |
| MSI Prestige 13 AI+ A3MG | |
| Asus ZenBook 14 OLED UM3406K, Ryzen AI 7 350 | |
| Média da turma Subnotebook (15709 - 135141, n=58, últimos 2 anos) | |
| Lenovo IdeaPad 5i 2-in-1 14IPH11 | |
| Asus Zenbook A14 UX3704NA | |
| AIDA64 / Memory Latency | |
| Lenovo IdeaPad 5i 2-in-1 14IPH11 | |
| MSI Prestige 13 AI+ A3MG | |
| Asus ZenBook 14 OLED UM3406K, Ryzen AI 7 350 | |
| Lenovo Yoga Slim 7 Ultra 14IPH11 | |
| Média Intel Core Ultra 9 386H (87.2 - 116.9, n=8) | |
| Média da turma Subnotebook (6.1 - 159.9, n=56, últimos 2 anos) | |
| Honor MagicBook Pro 14 2026 | |
* ... menor é melhor
Armazenamento
Da mesma forma que a CPU, o SSD também sofre quedas de velocidade sob cargas mais pesadas. Isso também afeta o Lenovo IdeaPad 5i 2 em 1 14. Por outro lado, a unidade NVMe integrada da Micron oferece bom desempenho, especialmente em leituras sequenciais.

* ... menor é melhor
Desempenho contínuo de leitura: Loop de leitura do DiskSpd, profundidade da fila 8
Desempenho da GPU
Enquanto a Graphics 2 Xe3 no laptop Lenovo mencionado anteriormente foi recentemente muito decepcionante, a Gráficos 4 Xe3 integrada no Core Ultra 9 386H, com 32 unidades de shader, pelo menos causa uma boa impressão para os padrões de iGPU. No entanto, o Prestige 13 AI+ fica um pouco aquém de seu potencial ao comparar os resultados do 3DMark com os notebooks baseados no Core Ultra 7 355, que também possui uma placa gráfica 4 Xe3.
| 3DMark 11 Performance | 7026 pontos | |
| 3DMark Ice Storm Standard Score | 143052 pontos | |
| 3DMark Cloud Gate Standard Score | 23108 pontos | |
| 3DMark Fire Strike Score | 5086 pontos | |
| 3DMark Time Spy Score | 2672 pontos | |
Ajuda | ||
Desempenho em jogos
Nosso conjunto de testes de jogos mostra que os jogos podem ser divididos em três categorias. Títulos pouco exigentes ou mais antigos, como F1 25 funcionam sem problemas, pelo menos na faixa Full HD, ou seja, 1920 x 1080 pixels, e, em alguns casos, até mesmo em configurações altas. Títulos com uso intensivo de CPU, como Crimson Desert e 007 First Lightpor outro lado, apresentam uma forte gagueira mesmo com as configurações mínimas. Os demais ficam em algum ponto intermediário e podem, pelo menos, ser levados a taxas de quadros utilizáveis com o aumento de escala XeSS. De modo geral, o desempenho em jogos está em linha com a Radeon 860M.
| Kingdom Come Deliverance 2 | |
| 1920x1080 Low Preset | |
| Média da turma Subnotebook (32.7 - 43.4, n=2, últimos 2 anos) | |
| MSI Prestige 13 AI+ A3MG | |
| Média Intel Graphics 4 Xe3 Panther Lake iGPU (n=1) | |
| Lenovo IdeaPad 5i 2-in-1 14IPH11 | |
| 1920x1080 Medium Preset | |
| Média da turma Subnotebook (23.7 - 31.3, n=2, últimos 2 anos) | |
| MSI Prestige 13 AI+ A3MG | |
| Média Intel Graphics 4 Xe3 Panther Lake iGPU (n=1) | |
| Lenovo IdeaPad 5i 2-in-1 14IPH11 | |
| 007 First Light | |
| 1920x1080 Low Settings AF:16x | |
| Média da turma Subnotebook (17 - 21, n=2, últimos 2 anos) | |
| MSI Prestige 13 AI+ A3MG | |
| Média Intel Graphics 4 Xe3 Panther Lake iGPU (n=1) | |
| Lenovo IdeaPad 5i 2-in-1 14IPH11 | |
| 1920x1080 Medium Settings AF:16x | |
| Média da turma Subnotebook (14.8 - 20.1, n=2, últimos 2 anos) | |
| MSI Prestige 13 AI+ A3MG | |
| Média Intel Graphics 4 Xe3 Panther Lake iGPU (n=1) | |
| Lenovo IdeaPad 5i 2-in-1 14IPH11 | |
Gráfico de ultra FPS do Cyberpunk 2077
| baixo | média | alto | ultra | |
|---|---|---|---|---|
| Dota 2 Reborn (2015) | 139.2 | 67.5 | 77.7 | 73 |
| X-Plane 11.11 (2018) | 44.6 | 33.5 | 30.1 | |
| Cyberpunk 2077 (2023) | 37.3 | 28.8 | 24.4 | 19.1 |
| Counter-Strike 2 (2023) | 78.8 | 59.1 | 33.4 | 20.9 |
| Kingdom Come Deliverance 2 (2025) | 32.7 | 23.7 | 18.8 | 12.6 |
| F1 25 (2025) | 62 | 53 | 39 | 10 |
| Call of Duty Black Ops 7 (2025) | 52 | 47 | 33 | 9 |
| Resident Evil Requiem (2026) | 25.3 | 18.8 | 16.2 | 8.21 |
| Crimson Desert (2026) | 16.5 | 13.9 | 13 | 12.4 |
| Pragmata (2026) | 27.7 | 20.8 | 16.6 | |
| 007 First Light (2026) | 17 | 14.8 | 13.6 | 12.8 |
Emissões e energia
Emissões de ruído
Embora o Prestige 13 AI+ seja um pouco mais perceptível do que seus rivais quando em marcha lenta, seus 31 a 42 dB(A) sob carga estão praticamente no mesmo nível da concorrência.
Barulho
| Ocioso |
| 26 / 27 / 28 dB |
| Carga |
| 31 / 42 dB |
 | ||
30 dB silencioso 40 dB(A) audível 50 dB(A) ruidosamente alto |
||
min: | ||
| MSI Prestige 13 AI+ A3MG Ultra 9 386H, Intel Graphics 4 Xe3 PTL | Lenovo Yoga Slim 7 Ultra 14IPH11 Ultra 7 355, Intel Graphics 4 Xe3 PTL | Lenovo IdeaPad 5i 2-in-1 14IPH11 Ultra 5 322, Intel Graphics 2 Xe3 PTL | Honor MagicBook Pro 14 2026 Ultra 5 338H, Arc B370 Panther Lake iGPU | Asus ZenBook 14 OLED UM3406K, Ryzen AI 7 350 Ryzen AI 7 350, Radeon 860M | Asus Zenbook A14 UX3704NA X2E-88-100, X2-90 | |
|---|---|---|---|---|---|---|
| Noise | -5% | -3% | 2% | 6% | -3% | |
| desligado / ambiente * (dB) | 25 | 23.1 8% | 24 4% | 25.7 -3% | 24 4% | 24.2 3% |
| Idle Minimum * (dB) | 26 | 25.4 2% | 24 8% | 25.7 1% | 24 8% | 24.2 7% |
| Idle Average * (dB) | 27 | 25.5 6% | 25 7% | 25.7 5% | 24 11% | 24.2 10% |
| Idle Maximum * (dB) | 28 | 25.5 9% | 26 7% | 25.7 8% | 24 14% | 24.2 14% |
| Load Average * (dB) | 31 | 44.4 -43% | 43 -39% | 30.2 3% | 31.75 -2% | 41.3 -33% |
| Cyberpunk 2077 ultra * (dB) | 41 | 43.4 -6% | 42 -2% | 39.4 4% | 39.25 4% | 41.3 -1% |
| Load Maximum * (dB) | 42 | 45.5 -8% | 44 -5% | 42.9 -2% | 42.16 -0% | 51.7 -23% |
* ... menor é melhor
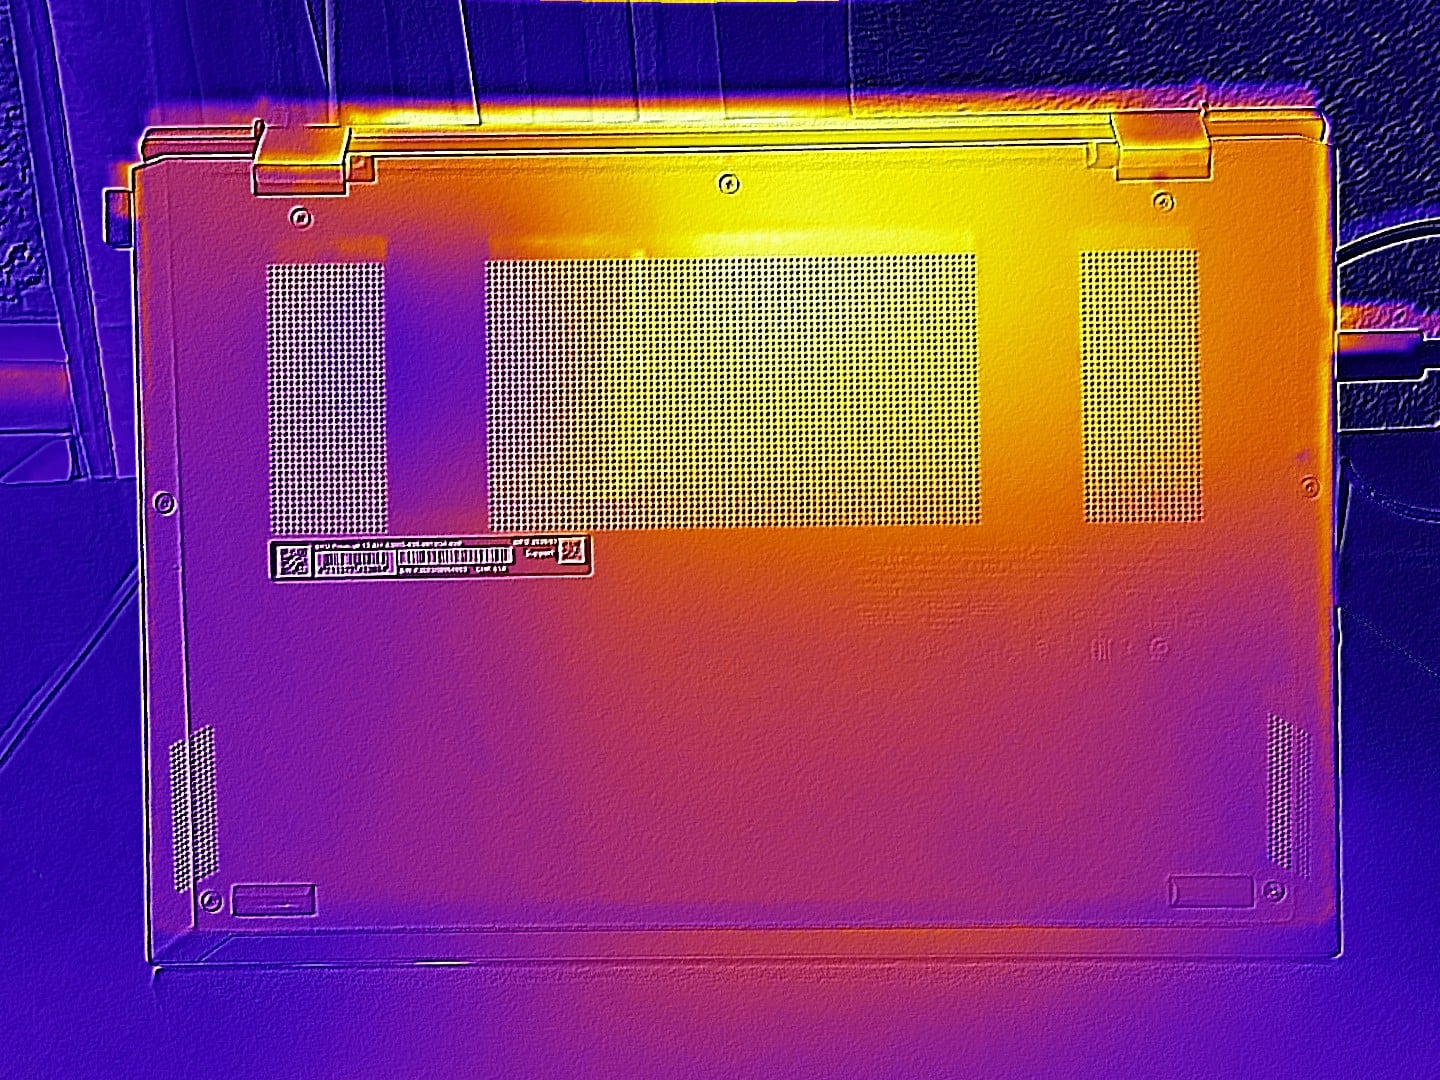
Temperatura
O gabinete não aquece excessivamente no modo 3D, atingindo um máximo de 42 °C na parte superior e até 41 °C na parte inferior. No teste de estresse com FurMark e Prime95, o processador se estabilizou em pouco menos de 70 °C, o que é um valor moderado.
(±) A temperatura máxima no lado superior é 42 °C / 108 F, em comparação com a média de 35.9 °C / 97 F , variando de 21.4 a 59 °C para a classe Subnotebook.
(±) A parte inferior aquece até um máximo de 41 °C / 106 F, em comparação com a média de 39.2 °C / 103 F
(+) Os apoios para as mãos e o touchpad são mais frios que a temperatura da pele, com um máximo de 29 °C / 84.2 F e, portanto, são frios ao toque.
(±) A temperatura média da área do apoio para as mãos de dispositivos semelhantes foi 28.2 °C / 82.8 F (-0.8 °C / -1.4 F).
| MSI Prestige 13 AI+ A3MG Ultra 9 386H, Intel Graphics 4 Xe3 PTL | Lenovo Yoga Slim 7 Ultra 14IPH11 Ultra 7 355, Intel Graphics 4 Xe3 PTL | Lenovo IdeaPad 5i 2-in-1 14IPH11 Ultra 5 322, Intel Graphics 2 Xe3 PTL | Honor MagicBook Pro 14 2026 Ultra 5 338H, Arc B370 Panther Lake iGPU | Asus ZenBook 14 OLED UM3406K, Ryzen AI 7 350 Ryzen AI 7 350, Radeon 860M | Asus Zenbook A14 UX3704NA X2E-88-100, X2-90 | |
|---|---|---|---|---|---|---|
| Heat | 25% | -22% | 10% | -7% | -6% | |
| Maximum Upper Side * (°C) | 42 | 33.6 20% | 47 -12% | 39.1 7% | 41 2% | 40.9 3% |
| Maximum Bottom * (°C) | 41 | 28.8 30% | 54 -32% | 35.7 13% | 47 -15% | 47.2 -15% |
| Idle Upper Side * (°C) | 25.2 | 25.2 | 29 | 24.5 | ||
| Idle Bottom * (°C) | 24.6 | 24.9 | 30 | 24 |
* ... menor é melhor
Alto-falantes
A qualidade do som do sistema 2.0 está abaixo da média. Além do volume máximo, os graves, em particular, poderiam ser melhores. A maioria dos concorrentes está em vantagem nesse quesito.
MSI Prestige 13 AI+ A3MG análise de áudio
(±) | o volume do alto-falante é médio, mas bom (###valor### dB)
Graves 100 - 315Hz
(±) | graves reduzidos - em média 14.9% menor que a mediana
(±) | a linearidade dos graves é média (13.9% delta para a frequência anterior)
Médios 400 - 2.000 Hz
(±) | médios mais altos - em média 7.1% maior que a mediana
(+) | médios são lineares (6% delta para frequência anterior)
Altos 2 - 16 kHz
(±) | máximos mais altos - em média 5.1% maior que a mediana
(+) | os máximos são lineares (6.2% delta da frequência anterior)
Geral 100 - 16.000 Hz
(±) | a linearidade do som geral é média (19.8% diferença em relação à mediana)
Comparado com a mesma classe
» 63% de todos os dispositivos testados nesta classe foram melhores, 7% semelhantes, 31% piores
» O melhor teve um delta de 5%, a média foi 18%, o pior foi 53%
Comparado com todos os dispositivos testados
» 51% de todos os dispositivos testados foram melhores, 7% semelhantes, 42% piores
» O melhor teve um delta de 4%, a média foi 23%, o pior foi 134%
Lenovo Yoga Slim 7 Ultra 14IPH11 análise de áudio
(+) | os alto-falantes podem tocar relativamente alto (###valor### dB)
Graves 100 - 315Hz
(±) | graves reduzidos - em média 6.7% menor que a mediana
(±) | a linearidade dos graves é média (9% delta para a frequência anterior)
Médios 400 - 2.000 Hz
(+) | médios equilibrados - apenas 3.7% longe da mediana
(+) | médios são lineares (5.8% delta para frequência anterior)
Altos 2 - 16 kHz
(+) | agudos equilibrados - apenas 2.4% longe da mediana
(+) | os máximos são lineares (2.4% delta da frequência anterior)
Geral 100 - 16.000 Hz
(+) | o som geral é linear (8.4% diferença em relação à mediana)
Comparado com a mesma classe
» 9% de todos os dispositivos testados nesta classe foram melhores, 2% semelhantes, 89% piores
» O melhor teve um delta de 5%, a média foi 17%, o pior foi 45%
Comparado com todos os dispositivos testados
» 2% de todos os dispositivos testados foram melhores, 1% semelhantes, 97% piores
» O melhor teve um delta de 4%, a média foi 23%, o pior foi 134%
Lenovo IdeaPad 5i 2-in-1 14IPH11 análise de áudio
(±) | o volume do alto-falante é médio, mas bom (###valor### dB)
Graves 100 - 315Hz
(±) | graves reduzidos - em média 14.1% menor que a mediana
(±) | a linearidade dos graves é média (10.8% delta para a frequência anterior)
Médios 400 - 2.000 Hz
(+) | médios equilibrados - apenas 4.6% longe da mediana
(+) | médios são lineares (3.6% delta para frequência anterior)
Altos 2 - 16 kHz
(+) | agudos equilibrados - apenas 4.2% longe da mediana
(+) | os máximos são lineares (6.1% delta da frequência anterior)
Geral 100 - 16.000 Hz
(±) | a linearidade do som geral é média (15.2% diferença em relação à mediana)
Comparado com a mesma classe
» 24% de todos os dispositivos testados nesta classe foram melhores, 5% semelhantes, 71% piores
» O melhor teve um delta de 6%, a média foi 20%, o pior foi 57%
Comparado com todos os dispositivos testados
» 22% de todos os dispositivos testados foram melhores, 4% semelhantes, 74% piores
» O melhor teve um delta de 4%, a média foi 23%, o pior foi 134%
Honor MagicBook Pro 14 2026 análise de áudio
(±) | o volume do alto-falante é médio, mas bom (###valor### dB)
Graves 100 - 315Hz
(±) | graves reduzidos - em média 12.8% menor que a mediana
(±) | a linearidade dos graves é média (8.9% delta para a frequência anterior)
Médios 400 - 2.000 Hz
(+) | médios equilibrados - apenas 4.5% longe da mediana
(+) | médios são lineares (5.2% delta para frequência anterior)
Altos 2 - 16 kHz
(+) | agudos equilibrados - apenas 1.1% longe da mediana
(+) | os máximos são lineares (3.9% delta da frequência anterior)
Geral 100 - 16.000 Hz
(+) | o som geral é linear (12.1% diferença em relação à mediana)
Comparado com a mesma classe
» 22% de todos os dispositivos testados nesta classe foram melhores, 3% semelhantes, 76% piores
» O melhor teve um delta de 5%, a média foi 17%, o pior foi 45%
Comparado com todos os dispositivos testados
» 10% de todos os dispositivos testados foram melhores, 2% semelhantes, 88% piores
» O melhor teve um delta de 4%, a média foi 23%, o pior foi 134%
Asus ZenBook 14 OLED UM3406K, Ryzen AI 7 350 análise de áudio
(±) | o volume do alto-falante é médio, mas bom (###valor### dB)
Graves 100 - 315Hz
(-) | quase nenhum baixo - em média 20.2% menor que a mediana
(±) | a linearidade dos graves é média (10.9% delta para a frequência anterior)
Médios 400 - 2.000 Hz
(+) | médios equilibrados - apenas 4.4% longe da mediana
(+) | médios são lineares (5.3% delta para frequência anterior)
Altos 2 - 16 kHz
(+) | agudos equilibrados - apenas 2% longe da mediana
(+) | os máximos são lineares (6% delta da frequência anterior)
Geral 100 - 16.000 Hz
(±) | a linearidade do som geral é média (20.2% diferença em relação à mediana)
Comparado com a mesma classe
» 64% de todos os dispositivos testados nesta classe foram melhores, 9% semelhantes, 27% piores
» O melhor teve um delta de 5%, a média foi 18%, o pior foi 53%
Comparado com todos os dispositivos testados
» 53% de todos os dispositivos testados foram melhores, 8% semelhantes, 39% piores
» O melhor teve um delta de 4%, a média foi 23%, o pior foi 134%
Asus Zenbook A14 UX3704NA análise de áudio
(+) | os alto-falantes podem tocar relativamente alto (###valor### dB)
Graves 100 - 315Hz
(±) | graves reduzidos - em média 14.8% menor que a mediana
(±) | a linearidade dos graves é média (9.1% delta para a frequência anterior)
Médios 400 - 2.000 Hz
(+) | médios equilibrados - apenas 2.9% longe da mediana
(+) | médios são lineares (4.7% delta para frequência anterior)
Altos 2 - 16 kHz
(+) | agudos equilibrados - apenas 3.2% longe da mediana
(+) | os máximos são lineares (3.9% delta da frequência anterior)
Geral 100 - 16.000 Hz
(+) | o som geral é linear (12.2% diferença em relação à mediana)
Comparado com a mesma classe
» 15% de todos os dispositivos testados nesta classe foram melhores, 5% semelhantes, 80% piores
» O melhor teve um delta de 5%, a média foi 18%, o pior foi 53%
Comparado com todos os dispositivos testados
» 10% de todos os dispositivos testados foram melhores, 2% semelhantes, 88% piores
» O melhor teve um delta de 4%, a média foi 23%, o pior foi 134%
Consumo de energia
Em conjunto, todos os valores mostram que o Prestige 13 AI+ é um dos notebooks mais eficientes no campo de teste, o que aponta para uma boa duração da bateria.
| desligado | |
| Ocioso | |
| Carga |
|
Key:
min: | |
| MSI Prestige 13 AI+ A3MG Ultra 9 386H, Intel Graphics 4 Xe3 PTL | Lenovo Yoga Slim 7 Ultra 14IPH11 Ultra 7 355, Intel Graphics 4 Xe3 PTL | Lenovo IdeaPad 5i 2-in-1 14IPH11 Ultra 5 322, Intel Graphics 2 Xe3 PTL | Honor MagicBook Pro 14 2026 Ultra 5 338H, Arc B370 Panther Lake iGPU | Asus ZenBook 14 OLED UM3406K, Ryzen AI 7 350 Ryzen AI 7 350, Radeon 860M | Asus Zenbook A14 UX3704NA X2E-88-100, X2-90 | Média da turma Subnotebook | |
|---|---|---|---|---|---|---|---|
| Power Consumption | -20% | -8% | -63% | -19% | -44% | -22% | |
| Idle Minimum * (Watt) | 3.5 | 3.2 9% | 4 -14% | 6.8 -94% | 3.8 -9% | 4.7 -34% | 3.76 ? -7% |
| Idle Average * (Watt) | 4 | 3.9 2% | 4.8 -20% | 8.2 -105% | 6.7 -68% | 7.1 -78% | 6.54 ? -64% |
| Idle Maximum * (Watt) | 6.4 | 12.3 -92% | 7.4 -16% | 9.1 -42% | 6.9 -8% | 7.4 -16% | 7.89 ? -23% |
| Load Average * (Watt) | 44 | 36.5 17% | 36 18% | 40.4 8% | 51.6 -17% | 39.6 10% | 42 ? 5% |
| Cyberpunk 2077 ultra * (Watt) | 41 | 51.1 -25% | 34 17% | 66.1 -61% | 35.7 13% | 65.3 -59% | |
| Load Maximum * (Watt) | 54 | 69 -28% | 71 -31% | 100.2 -86% | 66 -22% | 101.8 -89% | 64.8 ? -20% |
| Cyberpunk 2077 ultra external monitor * (Watt) | 50.6 | 66 | 45 | 31.4 |
* ... menor é melhor
Duração da bateria
A MSI equipa o dispositivo de 13 polegadas com uma bateria de pouco menos de 54 Wh, o que é um pouco pequeno em comparação com os 60 a 92 Wh da concorrência. No entanto, cerca de 12 horas em nosso teste de Wi-Fi com o brilho reduzido para 150 cd/m² ainda é impressionante.
| MSI Prestige 13 AI+ A3MG Ultra 9 386H, Intel Graphics 4 Xe3 PTL, 53.8 Wh | Lenovo Yoga Slim 7 Ultra 14IPH11 Ultra 7 355, Intel Graphics 4 Xe3 PTL, 75 Wh | Lenovo IdeaPad 5i 2-in-1 14IPH11 Ultra 5 322, Intel Graphics 2 Xe3 PTL, 60 Wh | Honor MagicBook Pro 14 2026 Ultra 5 338H, Arc B370 Panther Lake iGPU, 92 Wh | Asus ZenBook 14 OLED UM3406K, Ryzen AI 7 350 Ryzen AI 7 350, Radeon 860M, 75 Wh | Asus Zenbook A14 UX3704NA X2E-88-100, X2-90, 70 Wh | Média da turma Subnotebook | |
|---|---|---|---|---|---|---|---|
| Duração da bateria | -12% | 28% | 24% | 8% | 34% | 17% | |
| WiFi v1.3 (h) | 12 | 10.6 -12% | 15.3 28% | 14.9 24% | 13 8% | 16.1 34% | 14 ? 17% |
| H.264 (h) | 15.7 | 15.4 ? | |||||
| Load (h) | 2.3 | 1.969 ? |
Avaliação geral do Notebookcheck
O Prestige 13 AI+ A3MG apresenta-se como um laptop versátil extremamente portátil que impressiona acima de tudo pelo seu baixo peso. No entanto, um Core Ultra 7 355 também teria sido suficiente por um preço mais baixo, já que o Core Ultra 9 386H não consegue realizar todo o seu potencial.
MSI Prestige 13 AI+ A3MG
- 06/08/2026 v8
Florian Glaser
 Total Sustainability Score:
 Possíveis alternativas em comparação
Imagem | Modelo / Análises | Preço | Peso | Altura | Tela |
|---|---|---|---|---|---|
1. 84%  | MSI Prestige 13 AI+ A3MG Intel Core Ultra 9 386H ⎘ Intel Graphics 4 Xe3 Panther Lake iGPU ⎘ 32 GB Memória, 1024 GB SSD | Amazon: Preço de tabela: 1600 EUR | 888 g | 15.9 mm | 13.30" 2880x1800 255 PPI OLED |
2. 84.9%  | Lenovo Yoga Slim 7 Ultra 14IPH11 Intel Core Ultra 7 355 ⎘ Intel Graphics 4 Xe3 Panther Lake iGPU ⎘ 32 GB Memória, 1024 GB SSD | Amazon: Preço de tabela: 1700 USD | 978 g | 13.9 mm | 14.00" 2880x1800 243 PPI OLED |
3. 81.1% 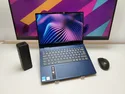 | Lenovo IdeaPad 5i 2-in-1 14IPH11 Intel Core Ultra 5 322 ⎘ Intel Graphics 2 Xe3 Panther Lake iGPU ⎘ 16 GB Memória | Amazon: 1. $899.00 Lenovo IdeaPad 5i 2-in-1 16"... 2. $440.99 Lenovo IdeaPad 5i 2-in-1 14"... 3. $458.00 Lenovo IdeaPad Flex 5i 2-in-... Preço de tabela: 800 EUR | 1.6 kg | 17.4 mm | 14.00" 1920x1200 162 PPI IPS |
4. 88.9%  | Honor MagicBook Pro 14 2026 Intel Core Ultra 5 338H ⎘ Intel Arc B370 10 Xe3 Panther Lake iGPU ⎘ 32 GB Memória, 1024 GB SSD | Amazon: | 1.4 kg | 15.9 mm | 14.60" 3120x2080 257 PPI OLED |
5. 86%  | Asus ZenBook 14 OLED UM3406K, Ryzen AI 7 350 AMD Ryzen AI 7 350 ⎘ AMD Radeon 860M ⎘ 32 GB Memória, 1024 GB SSD | Amazon: Preço de tabela: 1399 Euro | 1.2 kg | 14.9 mm | 14.00" 1920x1200 162 PPI OLED |
6. 87.5%  | Asus Zenbook A14 UX3704NA Qualcomm Snapdragon X2 Elite X2E-88-100 ⎘ Qualcomm Adreno X2-90 ⎘ 32 GB Memória, 1024 GB SSD | Amazon: 1. $1,049.00 ASUS Zenbook A14 14" FHD+ OL... 2. $1,519.99 ASUS Zenbook A14 Iceland Gra... 3. $799.99 ASUS Zenbook A14 Laptop 14" ... | 992 g | 15.9 mm | 14.00" 1920x1200 162 PPI OLED |
Transparência
A seleção dos dispositivos a serem analisados é feita pela nossa equipe editorial. A amostra de teste foi fornecida ao autor como empréstimo pelo fabricante ou varejista para fins desta revisão. O credor não teve influência nesta revisão, nem o fabricante recebeu uma cópia desta revisão antes da publicação. Não houve obrigação de publicar esta revisão. Como empresa de mídia independente, a Notebookcheck não está sujeita à autoridade de fabricantes, varejistas ou editores.
É assim que o Notebookcheck está testando
Todos os anos, o Notebookcheck analisa de forma independente centenas de laptops e smartphones usando procedimentos padronizados para garantir que todos os resultados sejam comparáveis. Desenvolvemos continuamente nossos métodos de teste há cerca de 20 anos e definimos padrões da indústria no processo. Em nossos laboratórios de teste, equipamentos de medição de alta qualidade são utilizados por técnicos e editores experientes. Esses testes envolvem um processo de validação em vários estágios. Nosso complexo sistema de classificação é baseado em centenas de medições e benchmarks bem fundamentados, o que mantém a objetividade.