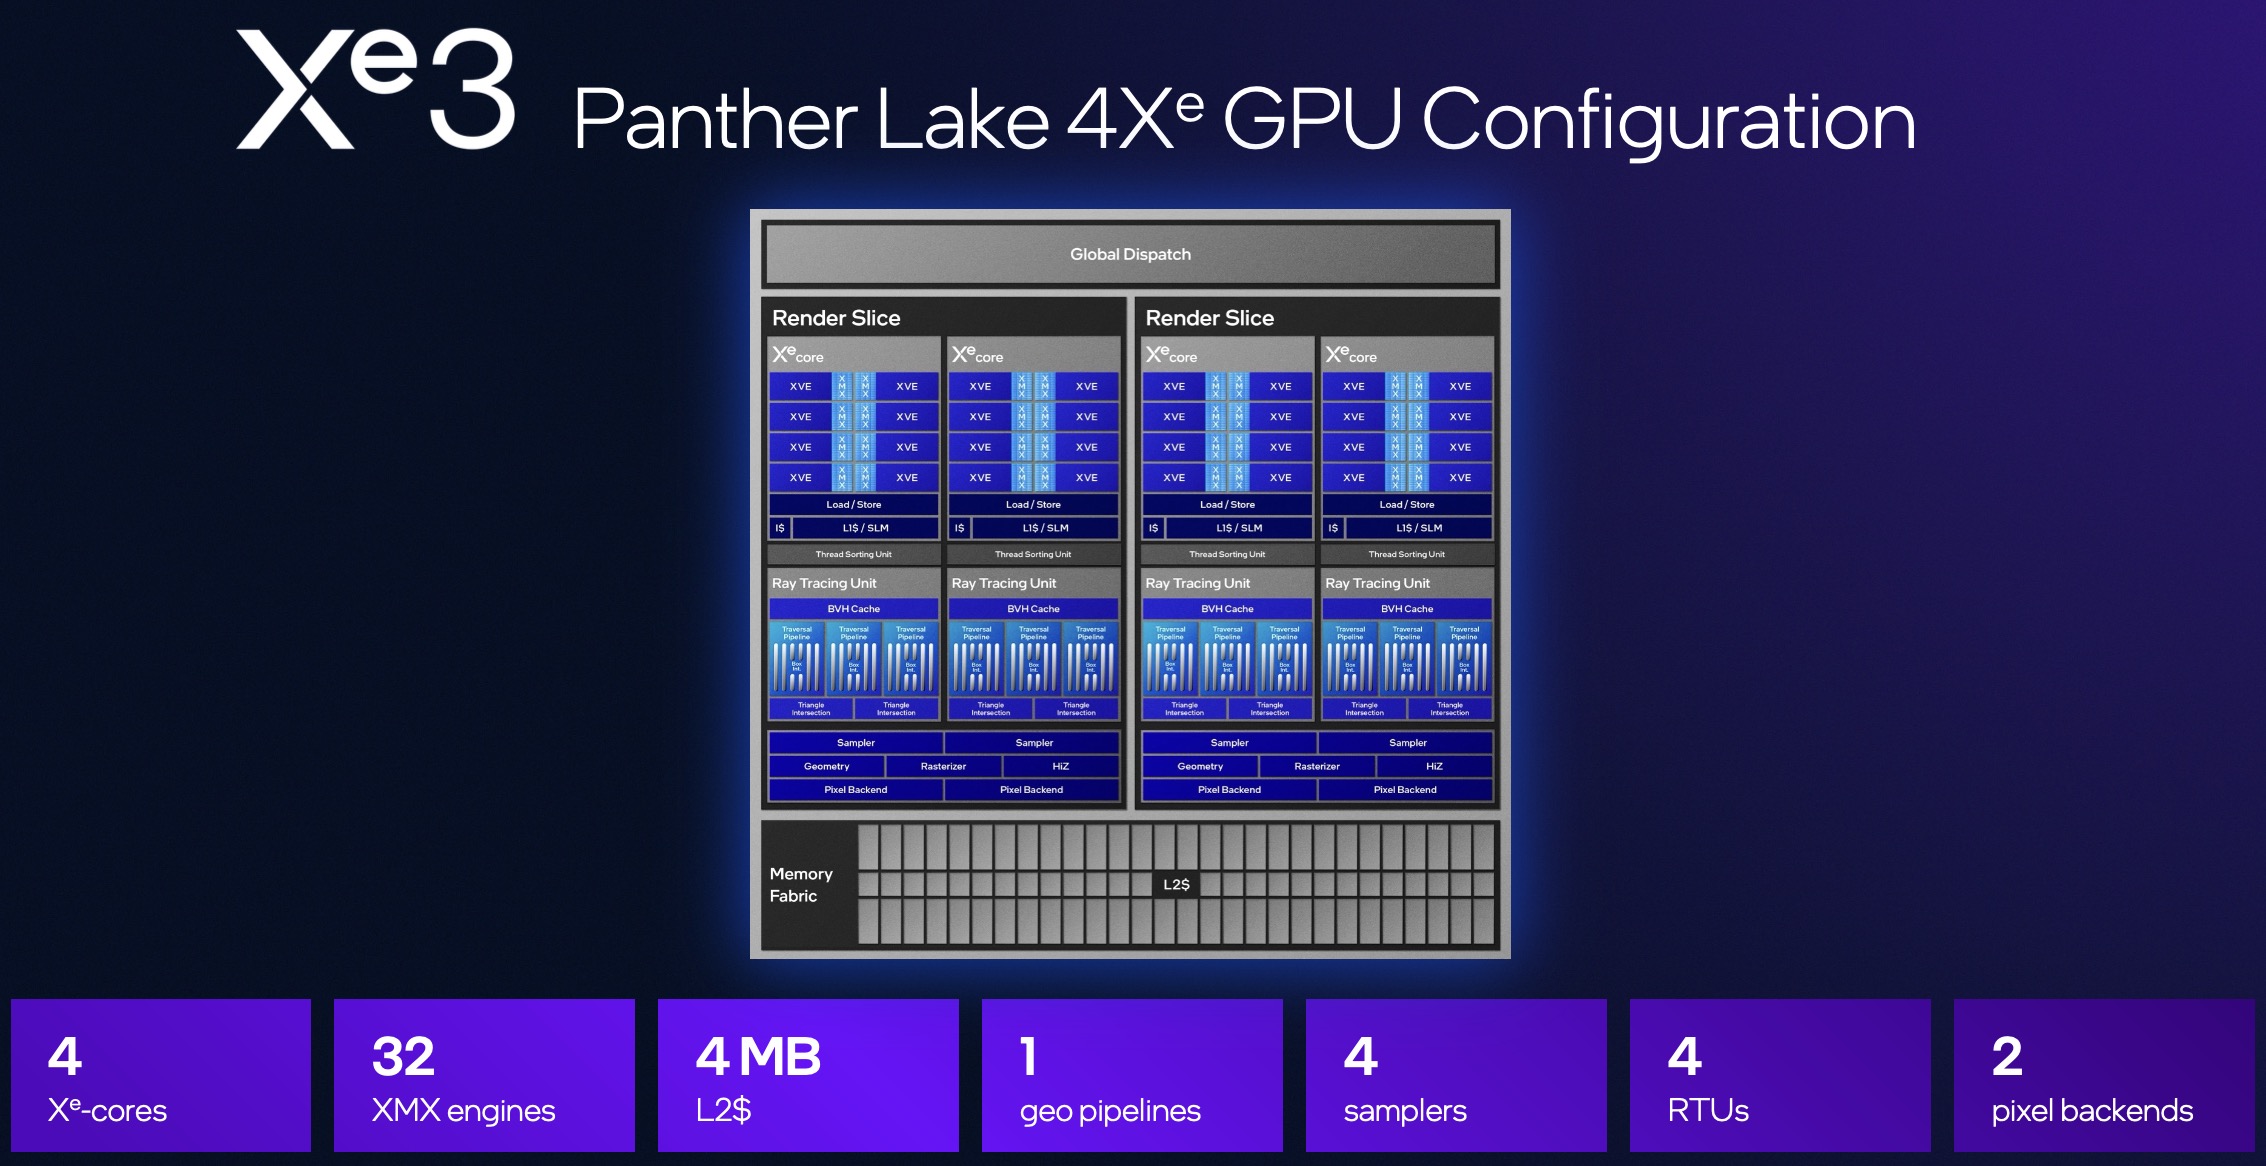
Análises de Portáteis com Intel Graphics 4 Xe3 Panther Lake iGPU Placa de vídeo
32 GB de memória RAM DDR5 e preço acessível: análise do notebook Lenovo ThinkBook 14 G9 IPL
Um laptop que custa mais de €1.000 dificilmente pode ser considerado um equipamento econômico, mas, no ano de 2026, talvez venha a ser visto dessa forma — especialmente se oferecer 32 GB de memória. O Lenovo ThinkBook 14 G9 IPL é um laptop com uma boa quantidade de RAM que muitas pessoas ainda podem adquirir, algo raro em tempos de crise de memória.
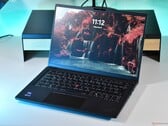
Intel Core Ultra 5 325, Intel Graphics 4 Xe3 PTL, 14", 1.4 kgAnálise do ThinkPad X1 2-em-1 11ª geração: o conversível mais atraente da Lenovo até o momento
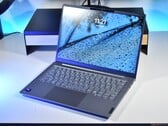
O ThinkPad X1 de 14 polegadas está de volta este ano, equipado com a plataforma Panther Lake e com um visual renovado. A lista de pequenas mudanças resulta em uma experiência do usuário visivelmente melhor, especialmente dependendo da configuração.
Intel Core Ultra 7 355, Intel Graphics 4 Xe3 PTL, 14", 1.3 kgAnálise do laptop MSI Prestige 13 AI+: O companheiro perfeito para viagens?
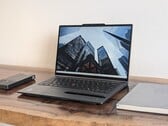
Com o Prestige 13 AI+, a MSI tem como alvo os usuários móveis que estão sempre em movimento e valorizam um laptop compacto e leve. Equipado com o novíssimo processador Panther Lake, o dispositivo de 13 polegadas foi projetado para conquistar os clientes que buscam o máximo de portabilidade.
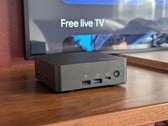
Intel Core Ultra 9 386H, Intel Graphics 4 Xe3 PTL, 13.3", 888 gAnálise do MSI Cubi NUC AI+ 3MG: Mini PC com até 128 GB de RAM
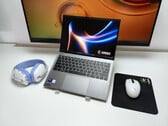
O mais novo minicomputador da MSI reduz o tamanho e o peso sem diminuir muitos recursos importantes. No entanto, há algumas concessões e limitações que merecem ser mencionadas.
Intel Core Ultra 9 386H, Intel Graphics 4 Xe3 PTL, 552 gUm novo campeão de reparabilidade: Análise do laptop Lenovo ThinkPad T14 Gen 7
O ThinkPad T14 é um dos mais vendidos do maior fabricante de PCs do mundo. O mais novo Lenovo ThinkPad T14 Gen 7 traz o Panther Lake da Intel, memória LPCAMM2 moderna e uma enorme atualização de reparabilidade. Infelizmente, o preço pode torná-lo menos atraente do que poderia ser.
Intel Core Ultra 5 325, Intel Graphics 4 Xe3 PTL, 14", 1.4 kgLenovo Yoga Slim 7 Ultra 14IPH11: Intel Core Ultra 7 355, 14.00", 1 kg
ánalise » Análise do Lenovo Yoga Slim 7 Ultra 14IPH11: A melhor alternativa ao XPS 14 até o momento
Samsung Galaxy Book6 Pro: Intel Core Ultra 7 356H, 16.00", 1.6 kg
ánalise » Samsung Galaxy Book6 Pro Laptop Review - Melhor que o novo XPS 16
Dell XPS 16 Core Ultra 5 325: Intel Core Ultra 5 325, 16.00", 1.7 kg
ánalise » Análise do Dell XPS 16: Dois passos à frente, um passo atrás
Dell XPS 14 Core Ultra 7 355: Intel Core Ultra 7 355, 14.00", 1.5 kg
ánalise » Análise do Dell XPS 14 Core Ultra 7 355: Ainda ótimo, mas nem de longe tão especial
Lenovo ThinkPad T14 G7: Intel Core Ultra 7 355, 14.00", 1.3 kg
ánalise externa » Lenovo ThinkPad T14 G7 - Reviews e Especificações
HP OmniBook Ultra AI 14-kd0000: Intel Core Ultra 7 356H, 14.00", 1.3 kg
ánalise externa » HP OmniBook Ultra AI 14-kd0000 - Reviews e Especificações
HP OmniBook 5 16-bm0000: Intel Core Ultra 7 355, 16.00", 1.7 kg
ánalise externa » HP OmniBook 5 16-bm0000 - Reviews e Especificações
Honor MagicBook 16 2026: Intel Core Ultra 5 325, 16.00", 1.6 kg
ánalise externa » Honor MagicBook 16 2026 - Avaliações e Especificações
Asus Vivobook 14 X1407AA: Intel Core Ultra 5 325, 14.00", 1.5 kg
ánalise externa » Asus Vivobook 14 X1407AA - Reviews e Especificações
HP OmniBook X 14-ka0000ng: Intel Core Ultra 5 325, 14.00", 1.3 kg
ánalise externa » HP OmniBook X 14-ka0000ng - Reviews e Especificações
Lenovo ThinkBook 14 G9 IPL: Intel Core Ultra 5 325, 14.00", 1.4 kg
ánalise externa » Lenovo ThinkBook 14 G9 IPL - Reviews e Especificações
Lenovo ThinkPad X1 Carbon G14: Intel Core Ultra 7 355, 14.00", 1 kg
ánalise externa » Lenovo ThinkPad X1 Carbon G14 - Reviews e Especificações
Microsoft Surface Laptop 8 13.8: Intel Core Ultra 5 335, 13.80", 1.4 kg
ánalise externa » Microsoft Surface Laptop 8 13.8
HP OmniBook X 14-ka: Intel Core Ultra 7 356H, 14.00", 1.3 kg
ánalise externa » HP OmniBook X 14-ka
Asus Vivobook 16 X1607AA: Intel Core Ultra 5 325, 16.00", 1.9 kg
ánalise externa » Asus Vivobook 16 X1607AA
Microsoft Surface Pro 13 (2026): Intel Core Ultra 5 335, 13.00", 0.9 kg
ánalise externa » Microsoft Surface Pro 13 (2026)
Lenovo Yoga 7 2-in-1 14IPH11: Intel Core Ultra 7 355, 14.00", 1.4 kg
ánalise externa » Lenovo Yoga 7 2-in-1 14IPH11
Lenovo Yoga Slim 7 Ultra 14IPH11: Intel Core Ultra 7 355, 14.00", 1 kg
ánalise externa » Lenovo Yoga Slim 7 Ultra 14IPH11
MSI Prestige 14 AI+ D3M: Intel Core Ultra 7 355, 14.00", 1.3 kg
ánalise externa » MSI Prestige 14 AI+ D3M
Samsung Galaxy Book6 Pro: Intel Core Ultra 7 356H, 16.00", 1.6 kg
ánalise externa » Samsung Galaxy Book6 Pro
Samsung Galaxy Book6 NP760VJG-KG5DE: Intel Core Ultra 7 355, 16.00", 1.8 kg
ánalise externa » Samsung Galaxy Book6 NP760VJG-KG5DE
MSI Prestige 14 Flip AI+ D3MTG: Intel Core Ultra 9 386H, 14.00", 1.4 kg
ánalise externa » MSI Prestige 14 Flip AI+ D3MTG
Acer Aspire 14 AI A14-I71M: Intel Core Ultra 9 386H, 14.00", 1.4 kg
ánalise externa » Acer Aspire 14 AI A14-I71M
MSI Prestige 13 AI+ A3MG: Intel Core Ultra 9 386H, 13.30", 0.9 kg
ánalise externa » MSI Prestige 13 AI+ A3MG
MSI Prestige 16 AI+ C3MG: Intel Core Ultra 7 355, 16.00", 1.6 kg
ánalise externa » MSI Prestige 16 AI+ C3MG
MSI Prestige 16 Flip AI+ C3MTG (2026): Intel Core Ultra 9 386H, 16.00", 1.7 kg
ánalise externa » MSI Prestige 16 Flip AI+ C3MTG (2026)
Asus ZenBook S14 UX5406AA: Intel Core Ultra 9 386H, 14.00", 1.2 kg
ánalise externa » Asus ZenBook S14 UX5406AA
Dell XPS 14 (2026) DA14260: Intel Core Ultra X7 358H, 14.00", 1.4 kg
ánalise externa » Dell XPS 14 (2026) DA14260
Lenovo Yoga Slim 7i 14IPH11: Intel Core Ultra 7 355, 14.00", 1 kg
ánalise externa » Lenovo Yoga Slim 7i 14IPH11
Dell XPS 16 (2026) DA16260: Intel Core Ultra 7 355, 16.00", 1.7 kg
ánalise externa » Dell XPS 16 (2026) DA16260
Lenovo ThinkBook 14 G9 IPL 21UX005PGE: Intel Core Ultra 5 325, 14.00", 1.4 kg
» Este laptop Lenovo de 14 polegadas mostra como os PCs com 32 GB de RAM estão ficando cada vez mais caros
» Nova era para o armazenamento: SSD para laptop fabricado na China é testado pela primeira vez em um laptop da Lenovo
» ThinkBook ou ThinkPad? Comparamos dois populares notebooks Lenovo de 14 polegadas
Lenovo ThinkPad X1 2-in-1 Gen 11: Intel Core Ultra 7 355, 14.00", 1.3 kg
» O carregamento da caneta do ThinkPad X1 2-em-1 de 11ª geração é interessante, mas as desvantagens são evidentes
» Apenas uma configuração do ThinkPad X1 2-em-1 11ª geração oferece melhorias significativas no desempenho gráfico
MSI Cubi NUC AI+ 3MG: Intel Core Ultra 9 386H, 0.6 kg
» O MSI Cubi AI+ 3MG é mais de 60% mais rápido do que antes, mas poderia ter sido ainda melhor
» O minúsculo PC MSI Cubi NUC AI+ 3MG suporta uma enorme quantidade de 128 GB de RAM removível
» MSI Cubi NUC AI+ 3MG vs. Cubi NUC AI+ 2MG: Melhorias em quase todos os aspectos
Lenovo ThinkPad T14 Gen 7 21WN00A0GE: Intel Core Ultra 5 325, 14.00", 1.4 kg
» Consequência da crise da RAM: O downgrade de tela da Lenovo no ThinkPad T14 Gen 7
» O Lunar Lake ainda é o rei da duração da bateria da Intel: ThinkPad T14 Gen 7 vs. T14 Gen 6
» O problema do teclado foi finalmente resolvido com o novo ThinkPad T14 Gen 7
» Uma mudança de design controversa: Comparação de fotos do Lenovo ThinkPad T14 Gen 7 vs T14 Gen 6
» ThinkPad T14 Gen 7: Estes recursos funcionam com o Linux - e estes não funcionam
Lenovo Yoga Slim 7 Ultra 14IPH11: Intel Core Ultra 7 355, 14.00", 1 kg
» A Lenovo continua enviando notebooks com telas de alta taxa de atualização definidas para 60 Hz. Aqui está a solução fácil
» O Lenovo Yoga Slim 7 Ultra 14 Aura é um dos notebooks mais leves com Core Ultra X7, mas há um porém
» O Lenovo Yoga Slim 7i Ultra Aura é inferior ao Dell XPS 14 em mais de US$ 300 e com o dobro de RAM
Samsung Galaxy Book6 Pro: Intel Core Ultra 7 356H, 16.00", 1.6 kg
» O Galaxy Book6 Pro da Samsung é um bom laptop multimídia, mas US$ 2.100 é muito caro
Dell XPS 16 Core Ultra 5 325: Intel Core Ultra 5 325, 16.00", 1.7 kg
» 2026 Dell XPS 16 funciona visivelmente mais quente do que o modelo de última geração
» O XPS 16 Panther Lake é tão eficiente que consome apenas 1,5 W quando está em marcha lenta, proporcionando uma duração de bateria incrivelmente longa
» Nossos primeiros benchmarks do Core Ultra 5 325 já chegaram e os resultados são praticamente idênticos aos do Core Ultra 7 355
Dell XPS 14 Core Ultra 7 355: Intel Core Ultra 7 355, 14.00", 1.5 kg
» A GPU Intel 4 Xe3 é mais de 50% mais lenta do que o carro-chefe Arc B390, de acordo com os primeiros benchmarks
» Os primeiros benchmarks do Core Ultra 7 355 já chegaram e não são nem de longe tão bons quanto os do Core Ultra X7
Samsung Galaxy Book6 NP760VJG-KG5DE: Intel Core Ultra 7 355, 16.00", 1.8 kg
» Samsung Galaxy Book6 Series Hands-On: Todos os modelos, preços e data de lançamento