Análise do laptop Predator Helios Neo 16: A Acer criou uma quimera para jogos
Em princípio, o Predator Helios Neo 16 da Acer, um laptop para jogos de médio porte, é uma versão reduzida doPredator Helios 16(não Neo). Alguns dos recursos do modelo Helio clássico foram mantidos, o que significa que ele pode se diferenciar da série básica Nitro da Acer série Nitro de nível básico da Acer.
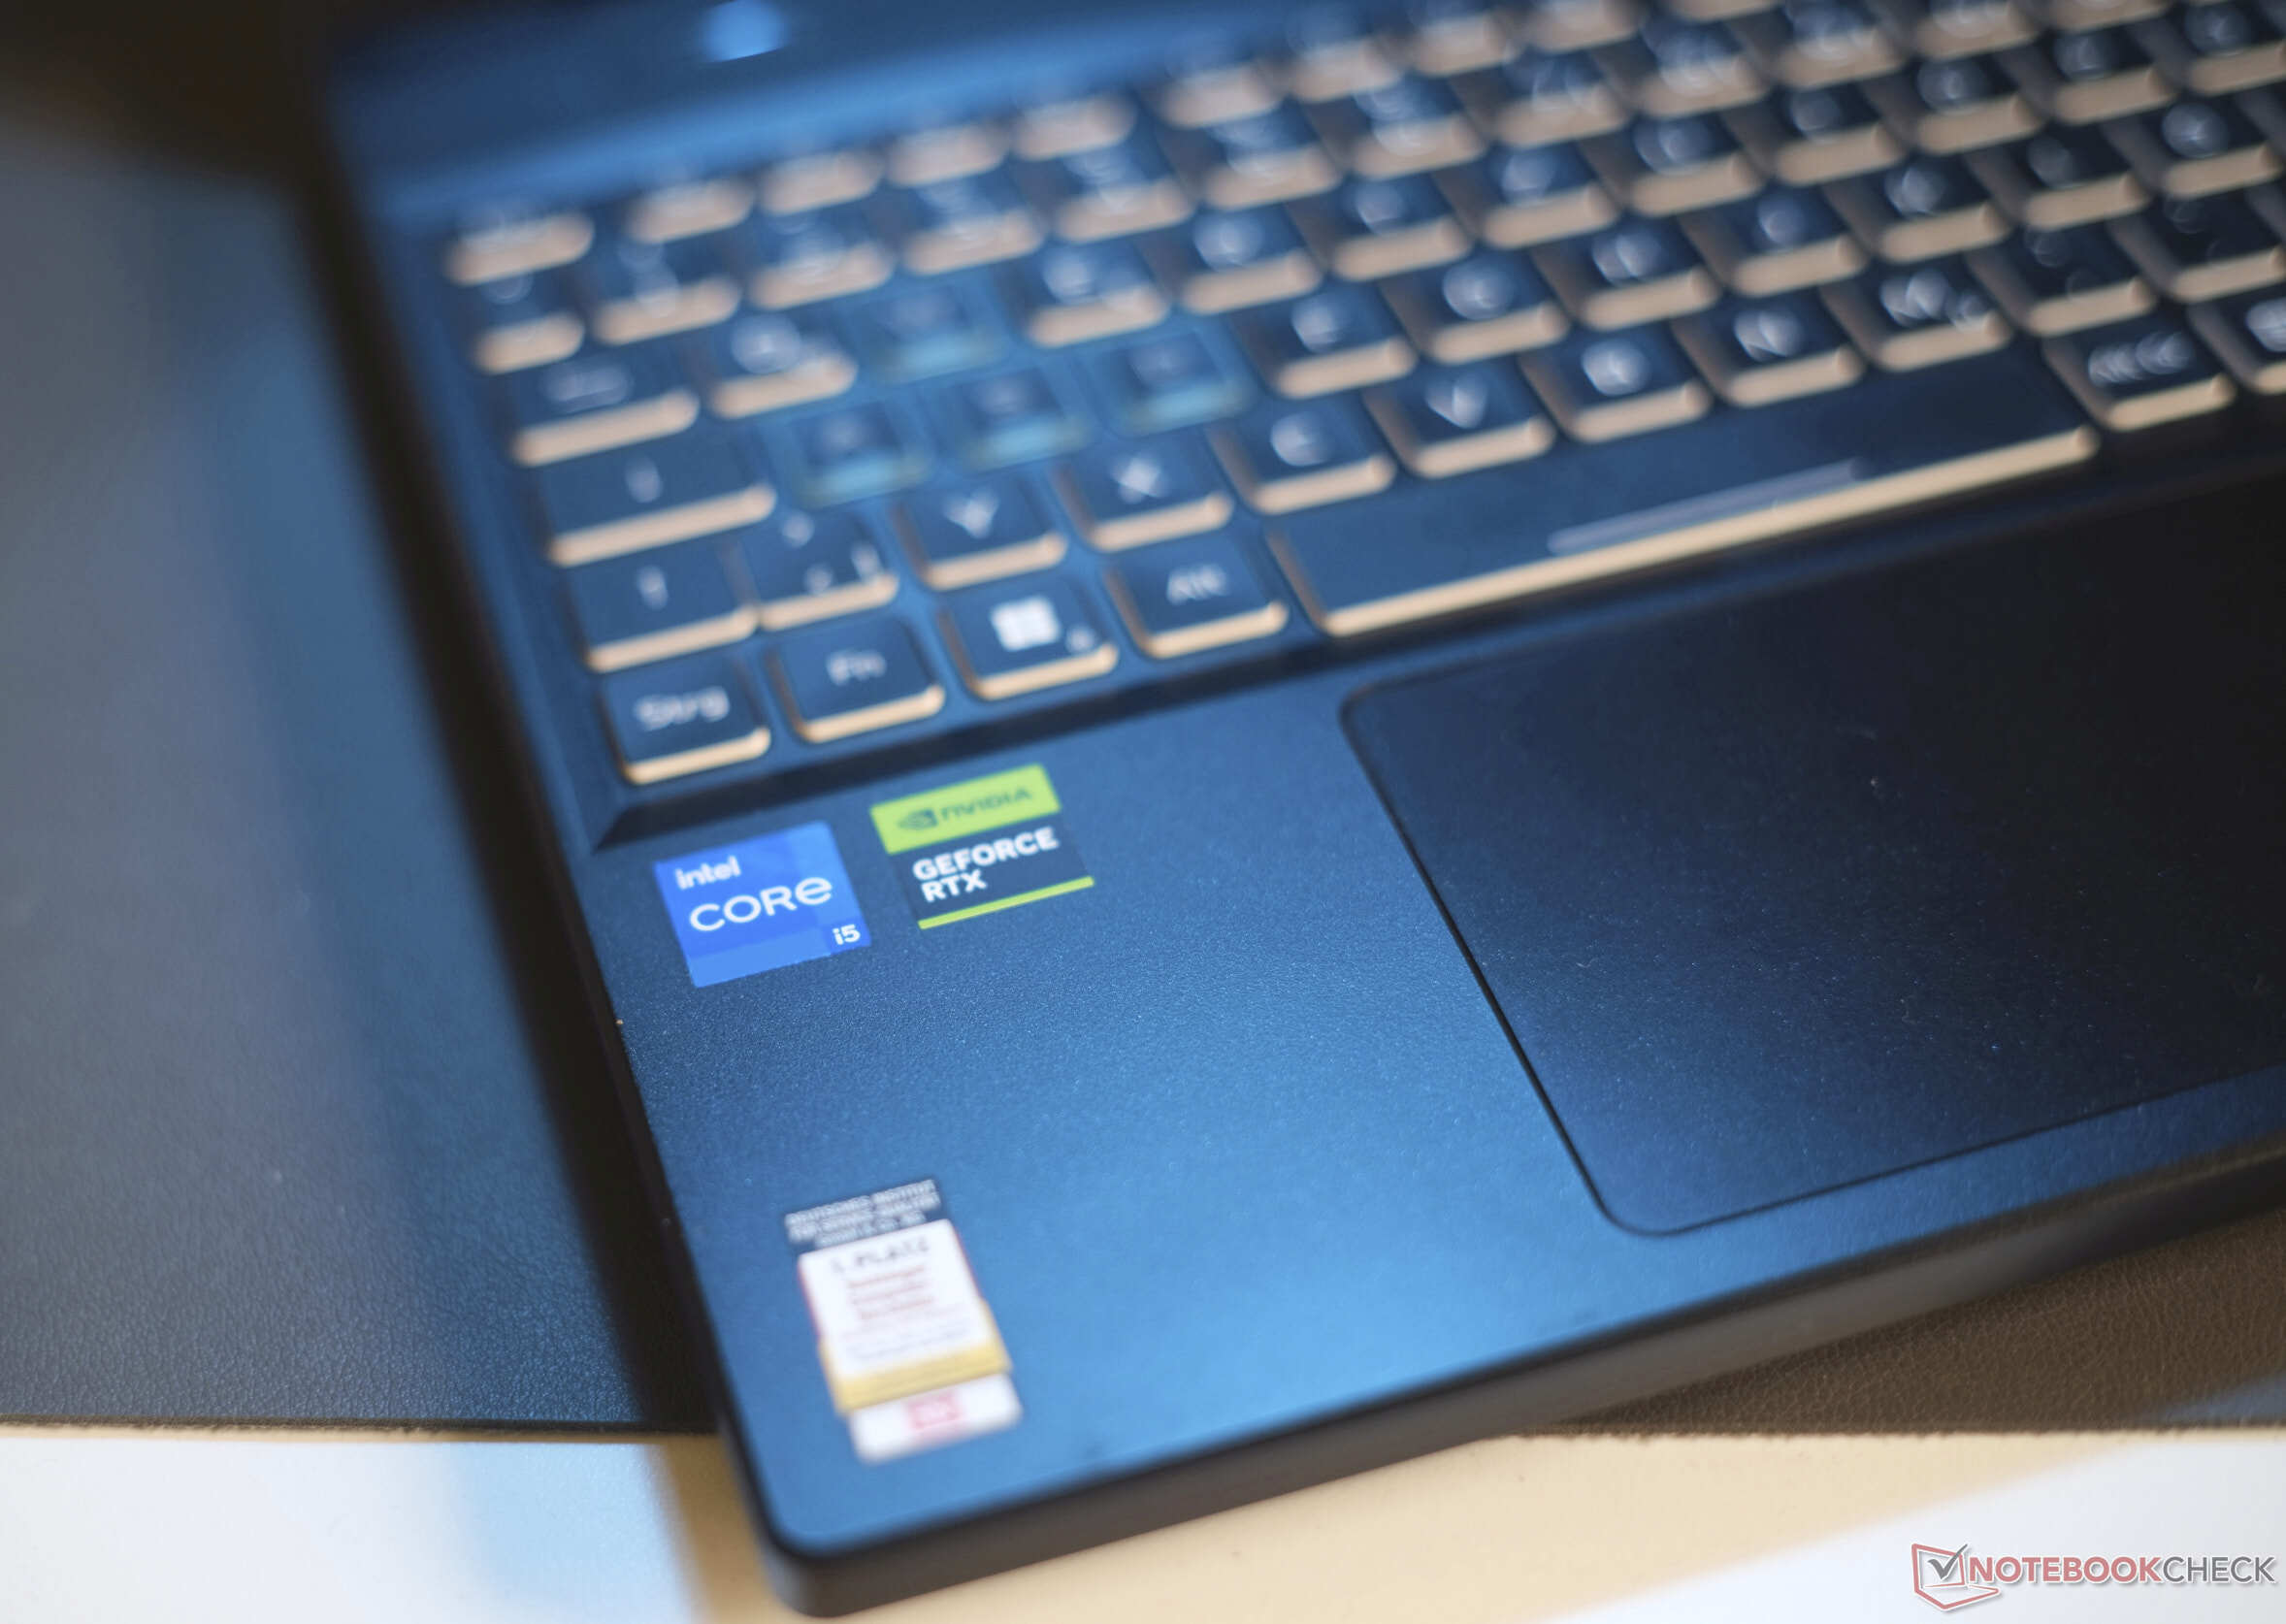
Mesmo assim, alguns de seus aspectos podem ser classificados como recursos de nível básico, como o RTX 4050 instalado - a um preço de US$ 1.069, isso é um pouco questionável. No entanto, o Intel Core i5-13500HX do notebook é uma poderosa CPU de classe de desktop que consome 55 watts. Esse e alguns de seus outros recursos normalmente não são encontrados em laptops realmente econômicos. Além disso, há variantes com um RTX 4060 ou um RTX 4070.
Durante esta avaliação, analisaremos se tudo isso é suficiente para fazer com que o laptop valha o preço. Seu principal concorrente é o Legion Pro 5 da Lenovo, mas outros concorrentes incluem o HP Victus 16, o XMG Apex 15 e o Dell G15.
Possíveis concorrentes em comparação
Avaliação | Data | Modelo | Peso | Altura | Size | Resolução | Preço |
|---|---|---|---|---|---|---|---|
| 86.6 % v7 (old) | 11/2023 | Acer Predator Helios Neo 16 NH.QLTEG.002 i5-13500HX, GeForce RTX 4050 Laptop GPU | 2.6 kg | 28.25 mm | 16.00" | 1920x1200 | |
| 89 % v7 (old) | 08/2023 | Lenovo Legion Pro 5 16ARX8 (R5 7645HX, RTX 4050) R5 7645HX, GeForce RTX 4050 Laptop GPU | 2.5 kg | 27.3 mm | 16.00" | 2560x1600 | |
| 87.3 % v7 (old) | 09/2023 | Lenovo LOQ 16IRH8 i7-13620H, GeForce RTX 4060 Laptop GPU | 2.7 kg | 25.9 mm | 16.00" | 2560x1600 | |
| 86.2 % v7 (old) | 10/2023 | Schenker XMG Apex 15 (Late 23) R7 7840HS, GeForce RTX 4050 Laptop GPU | 2.2 kg | 26.7 mm | 15.60" | 2560x1440 | |
| 85.6 % v7 (old) | 09/2023 | HP Victus 16-r0076TX i5-13500HX, GeForce RTX 4050 Laptop GPU | 2.3 kg | 22.9 mm | 16.10" | 1920x1080 | |
| 84.2 % v7 (old) | 06/2023 | Dell G15 5530 i7-13650HX, GeForce RTX 4060 Laptop GPU | 3 kg | 26.95 mm | 15.60" | 1920x1080 |
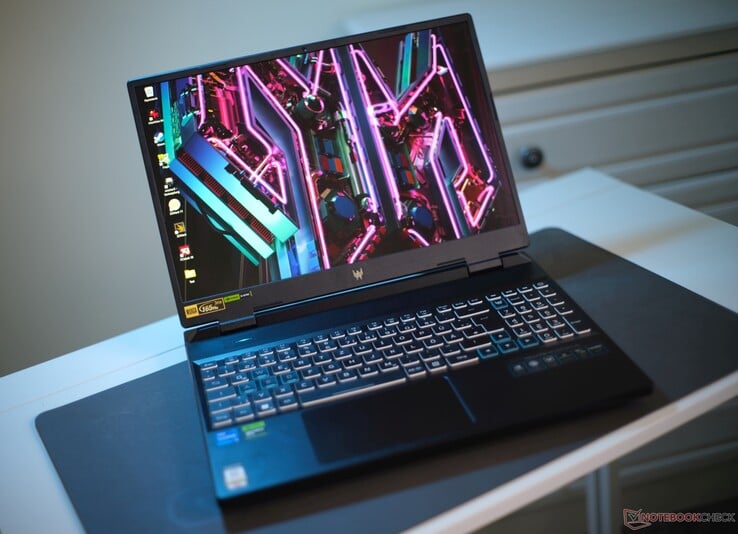
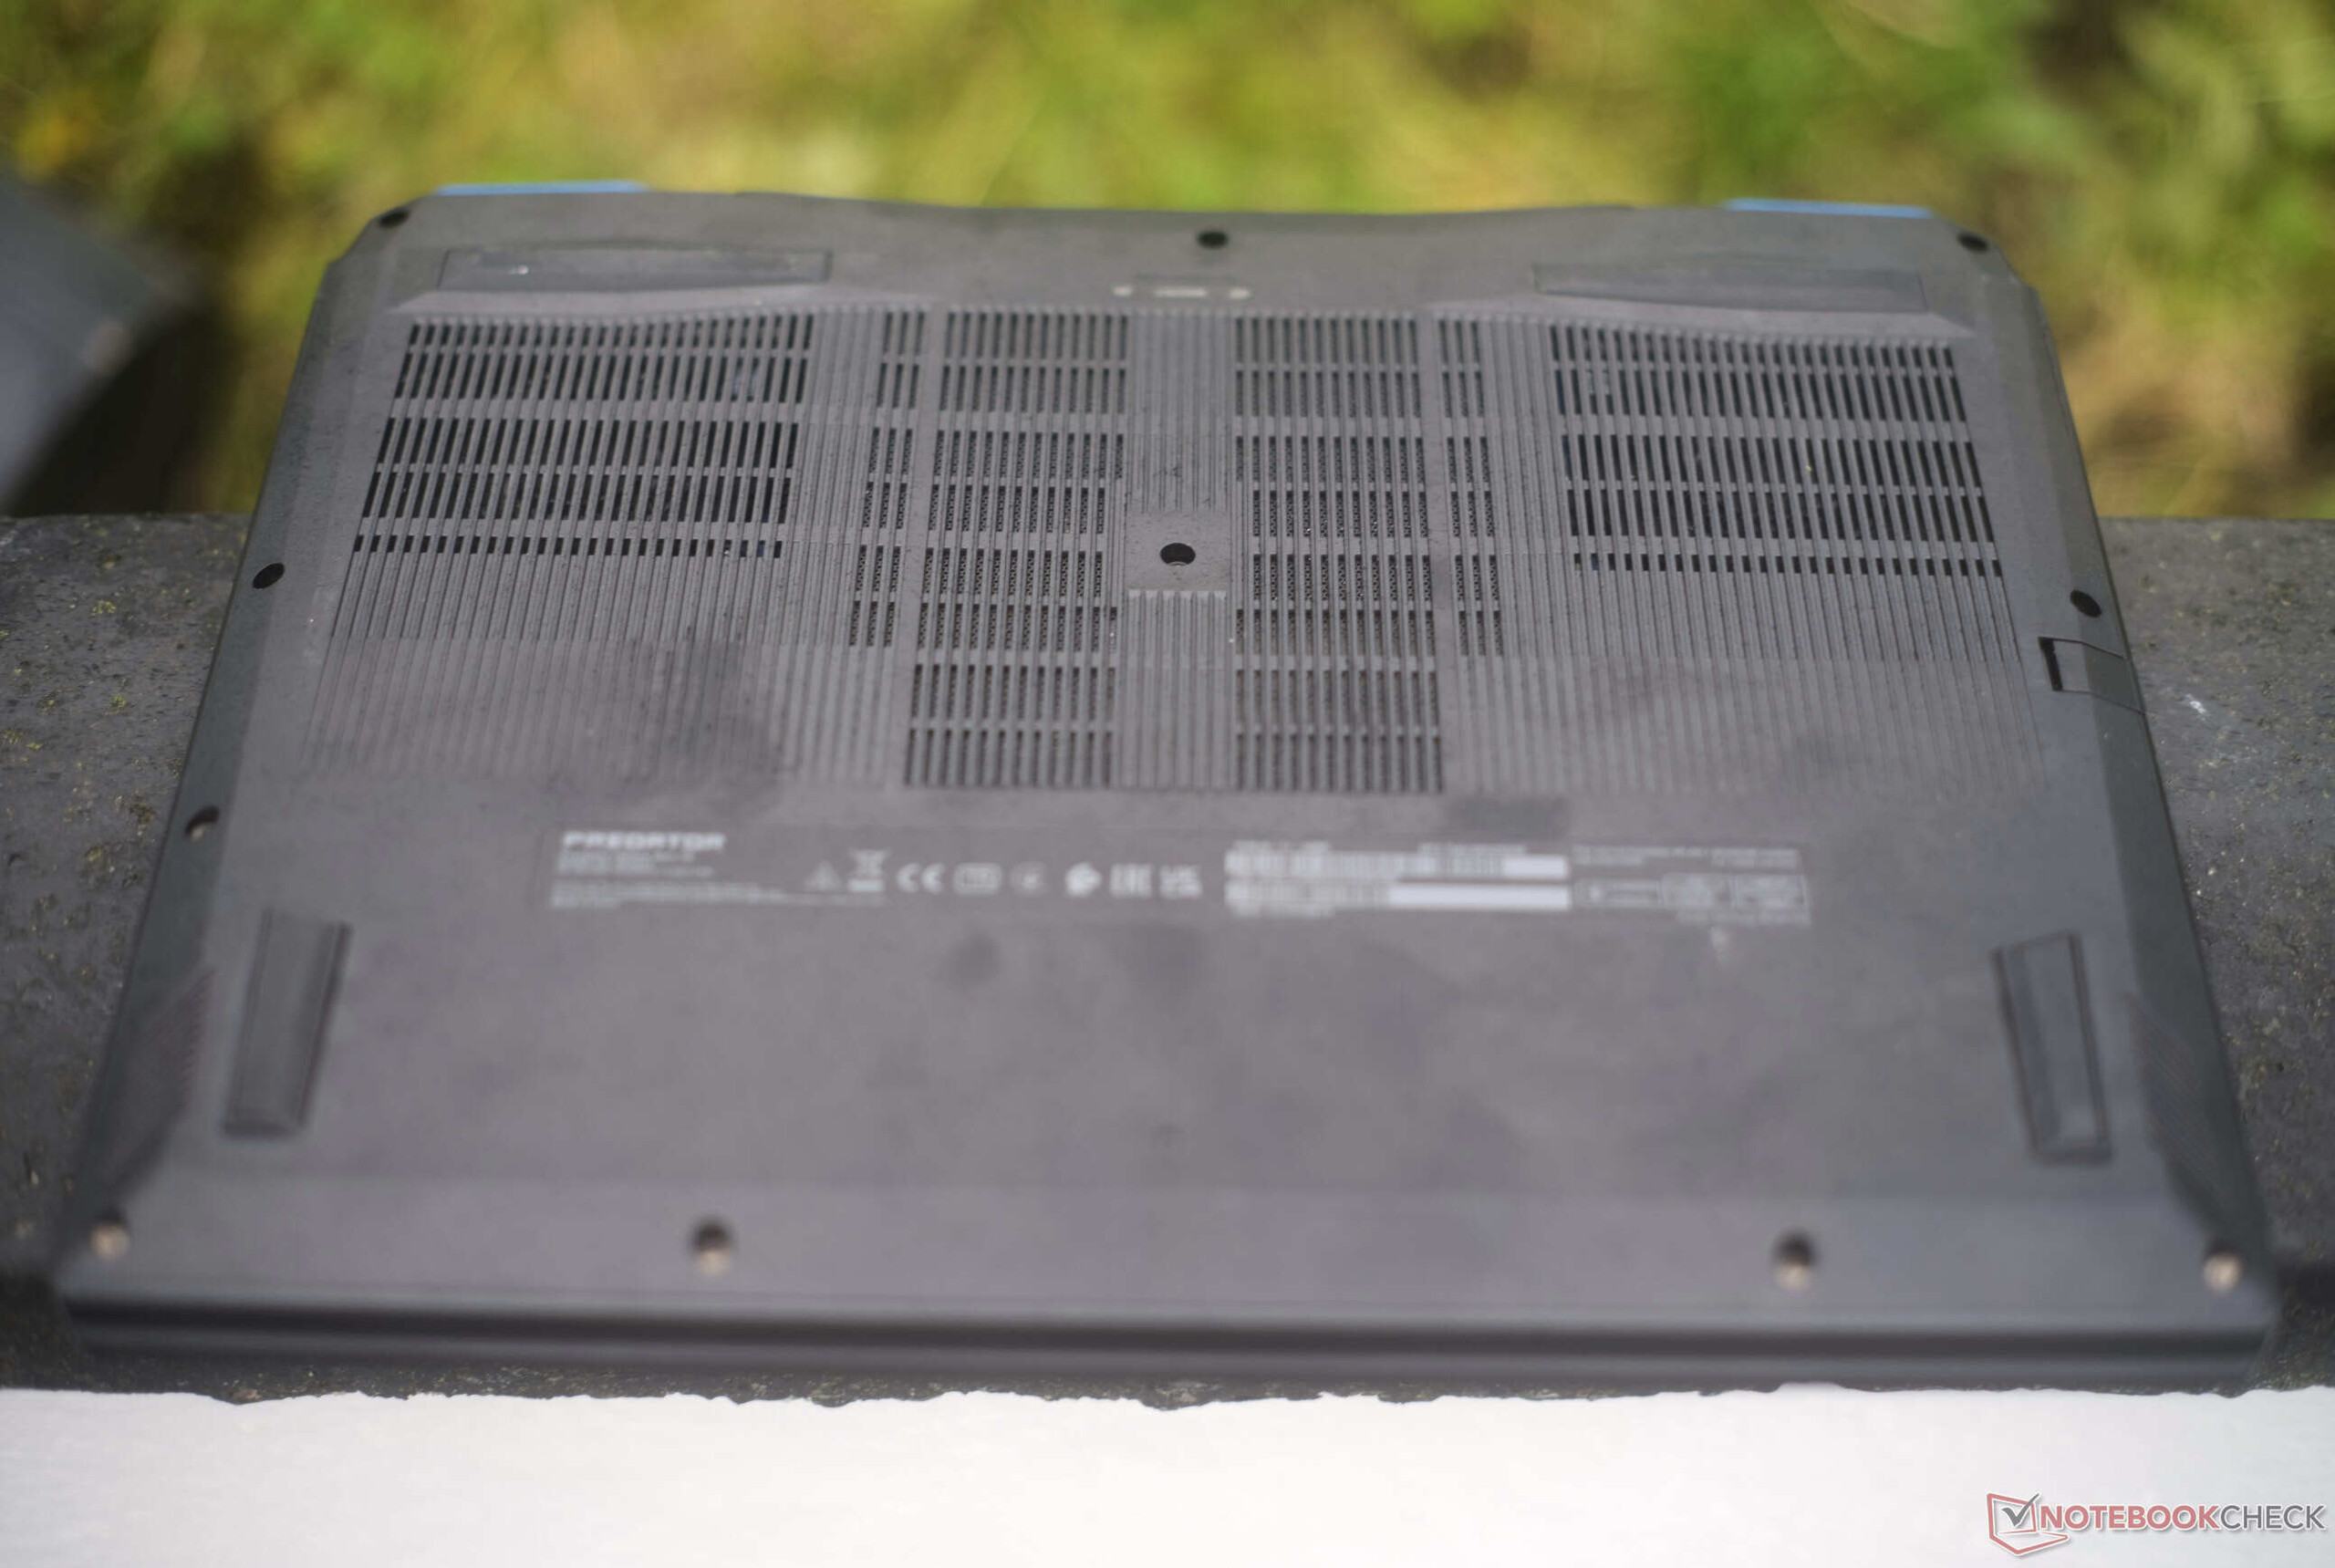
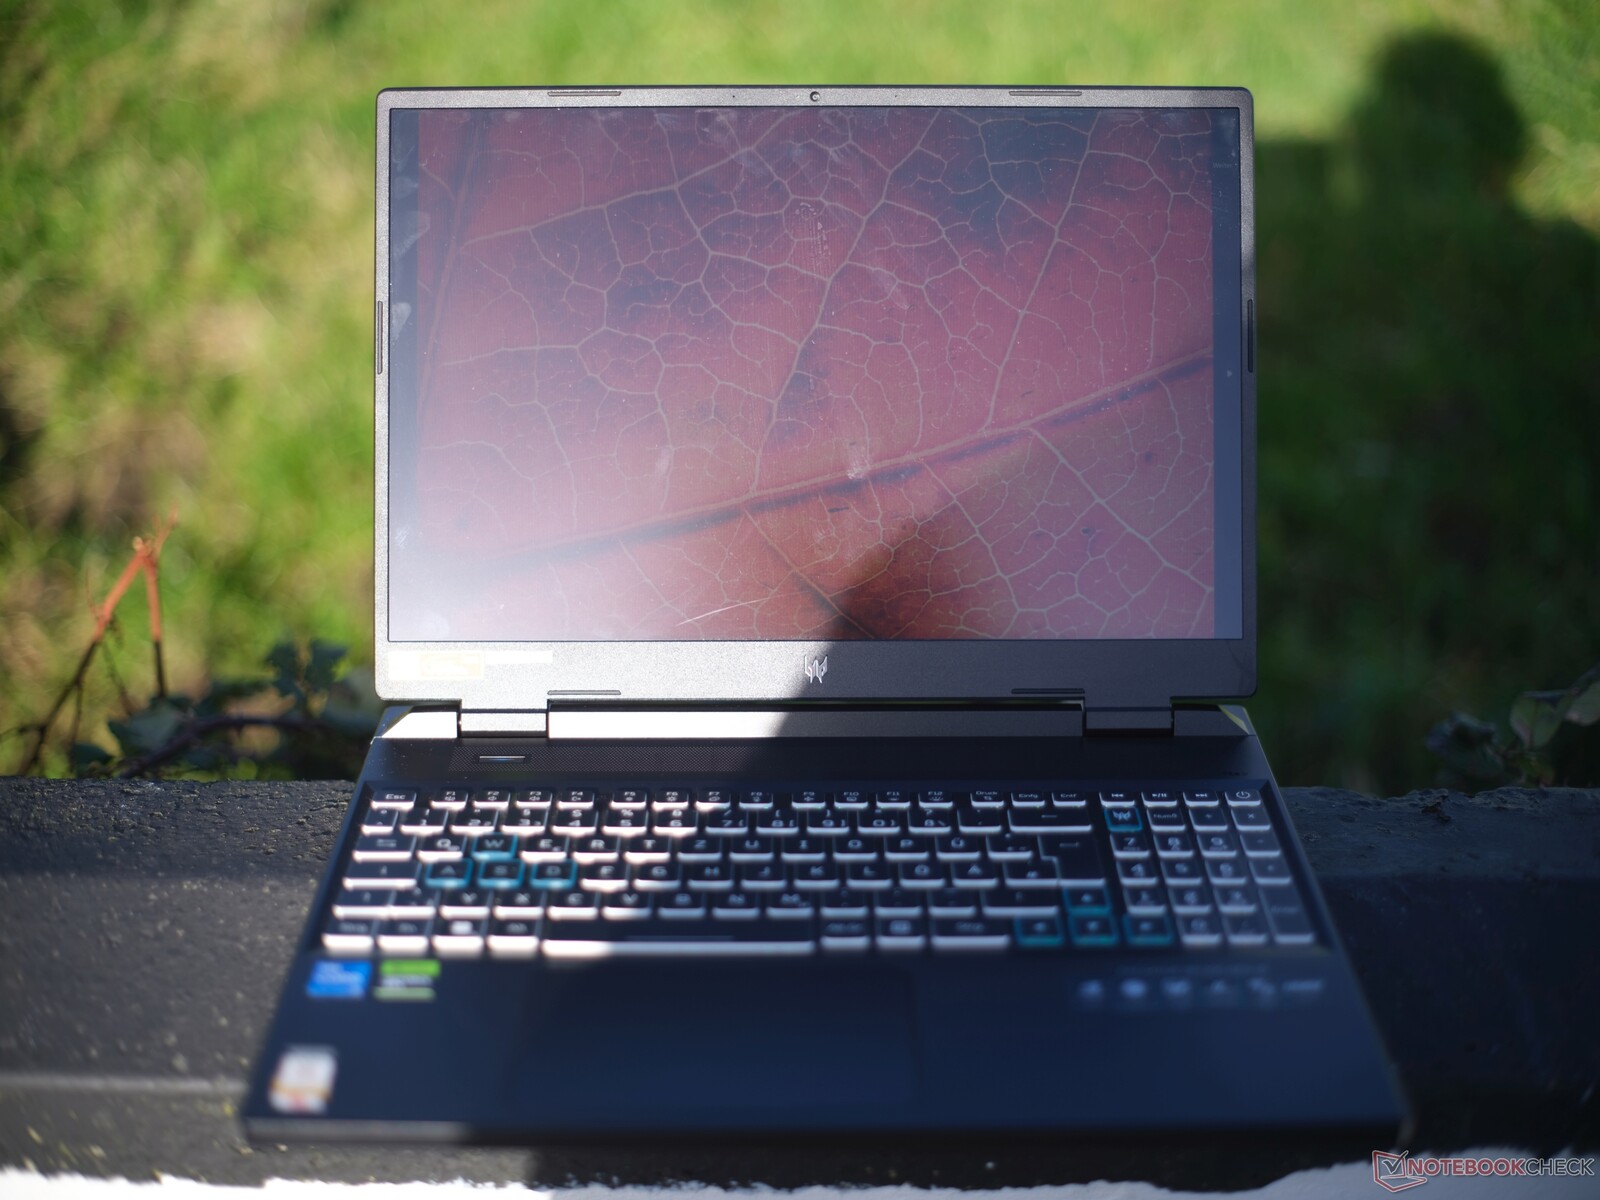
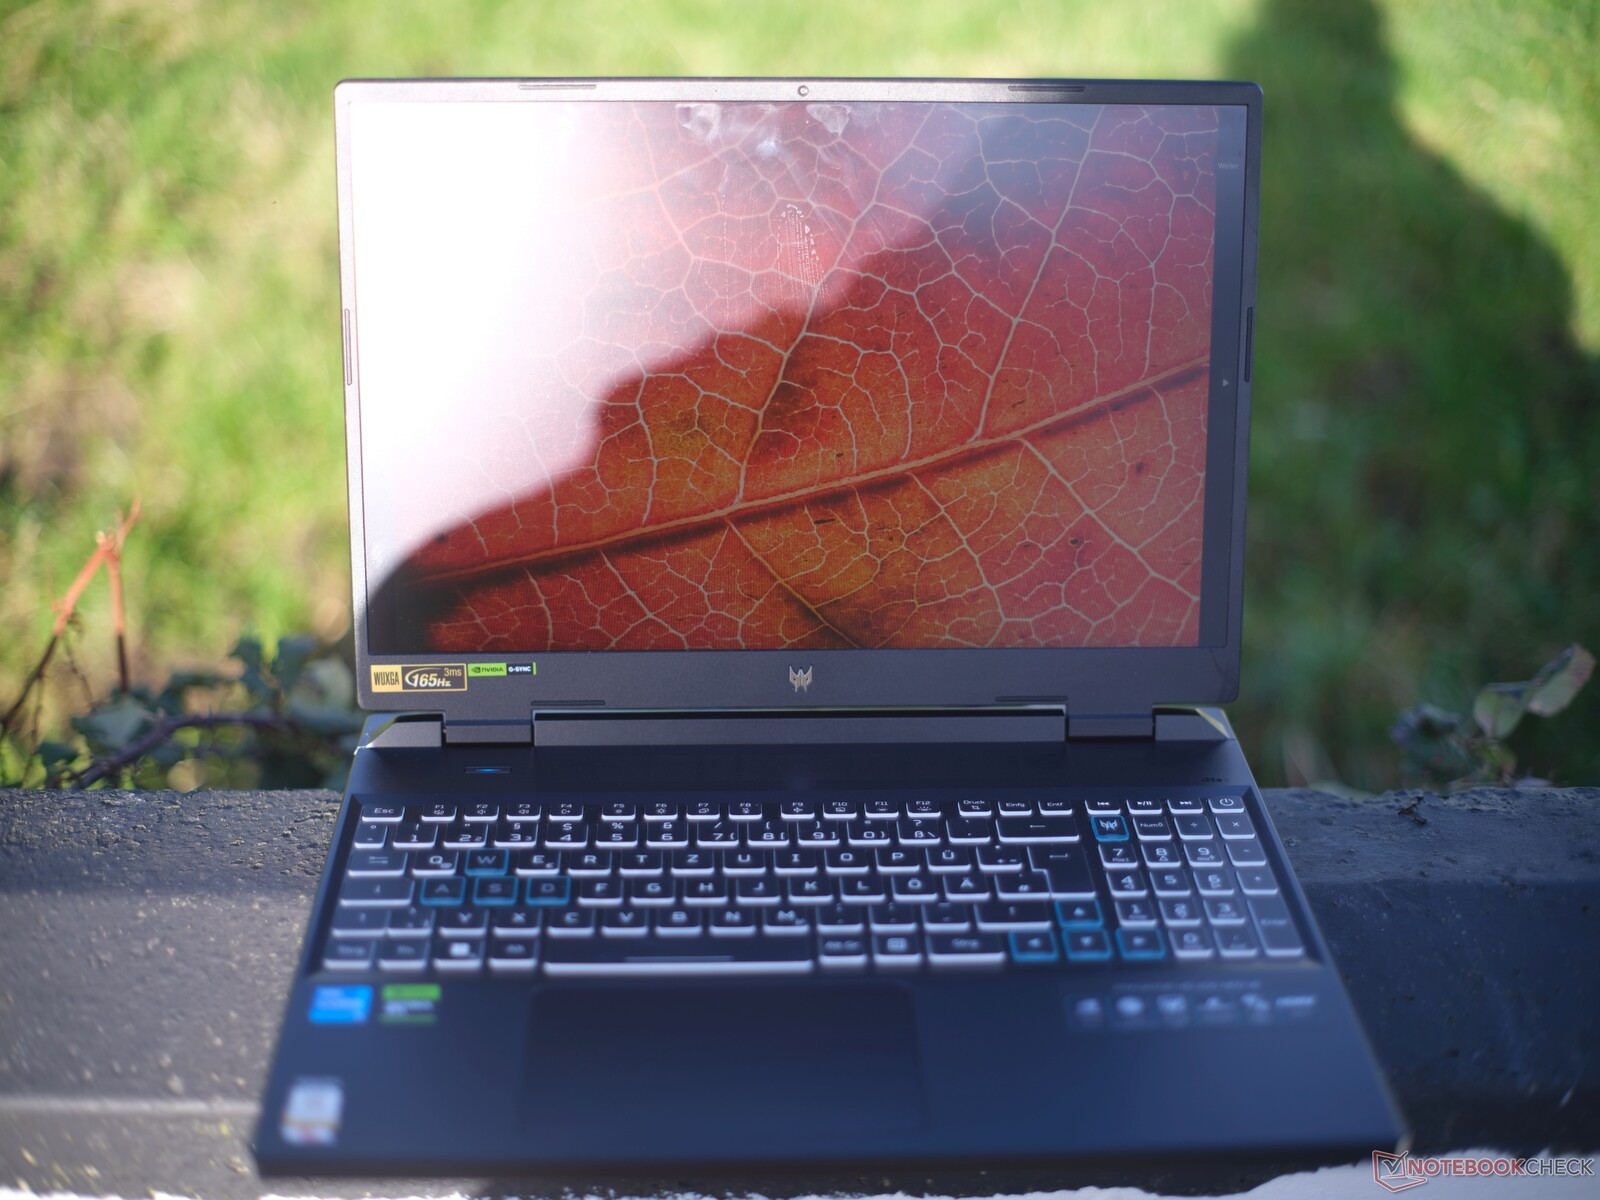
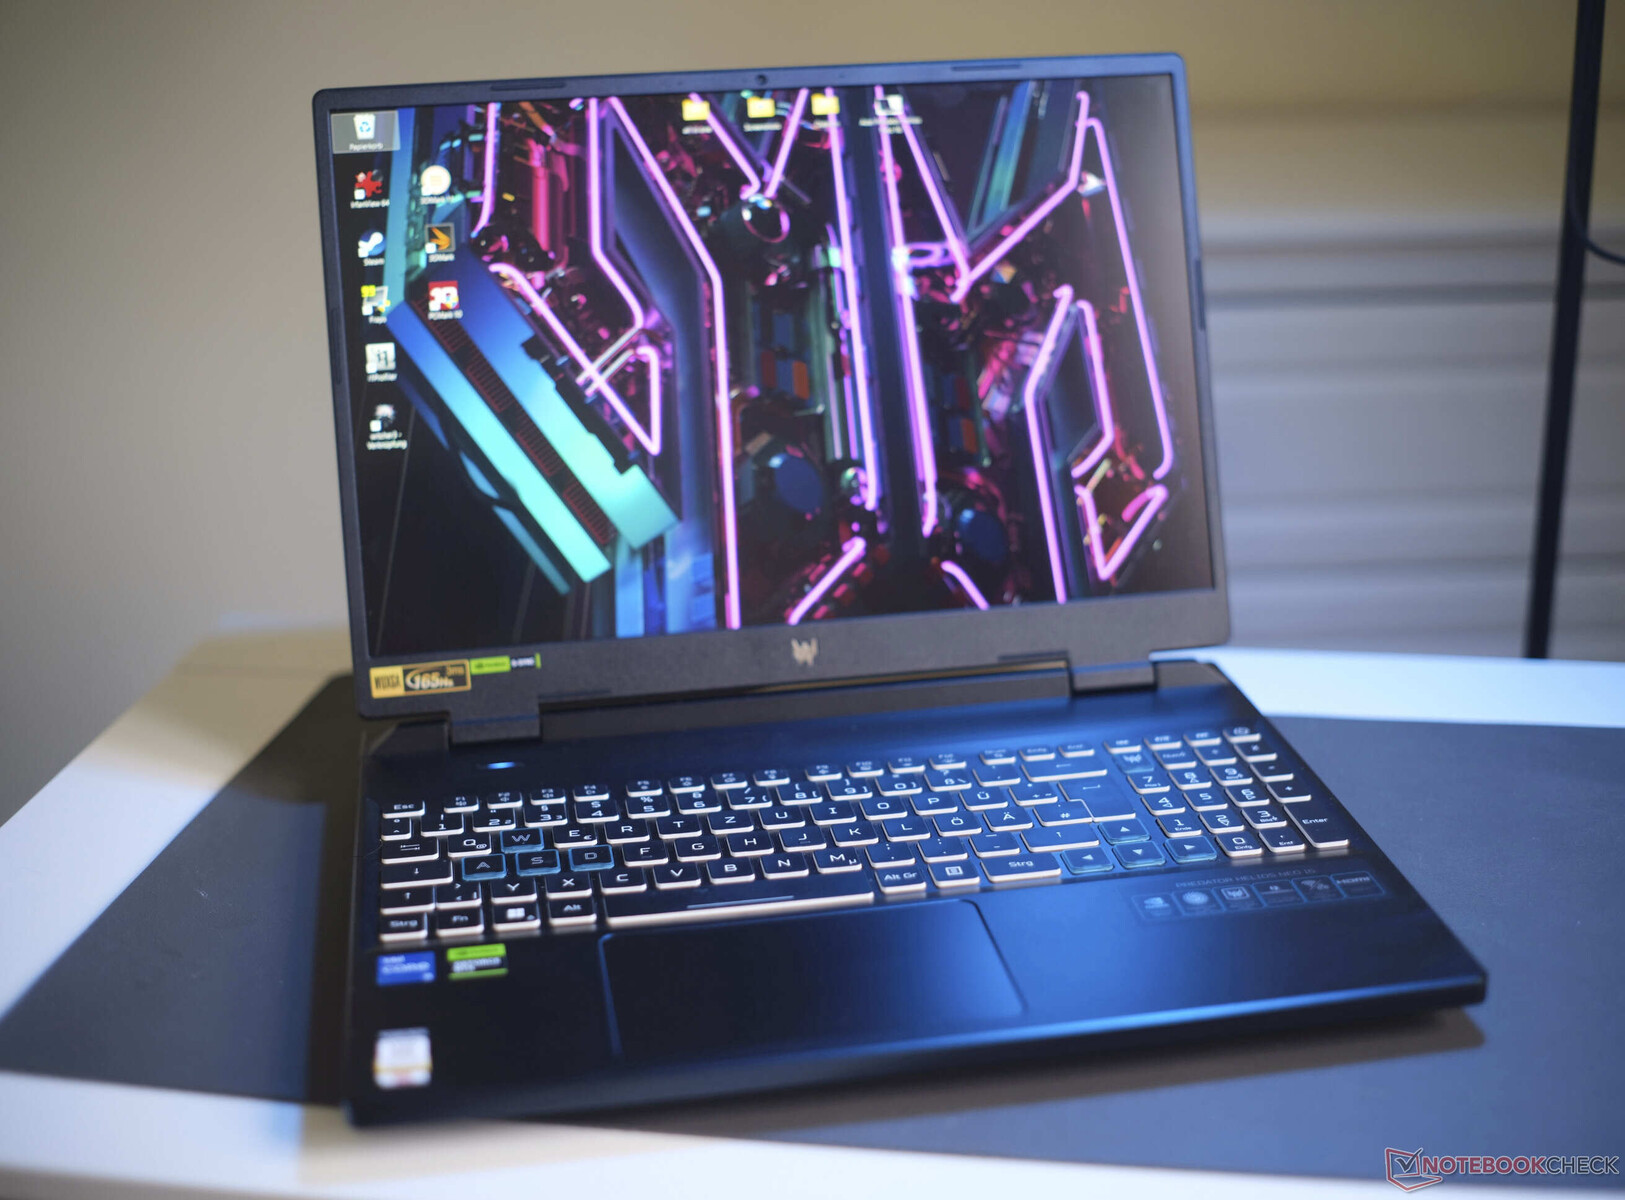
Case: O Helios Neo 16 se destaca por sua robustez e aparência
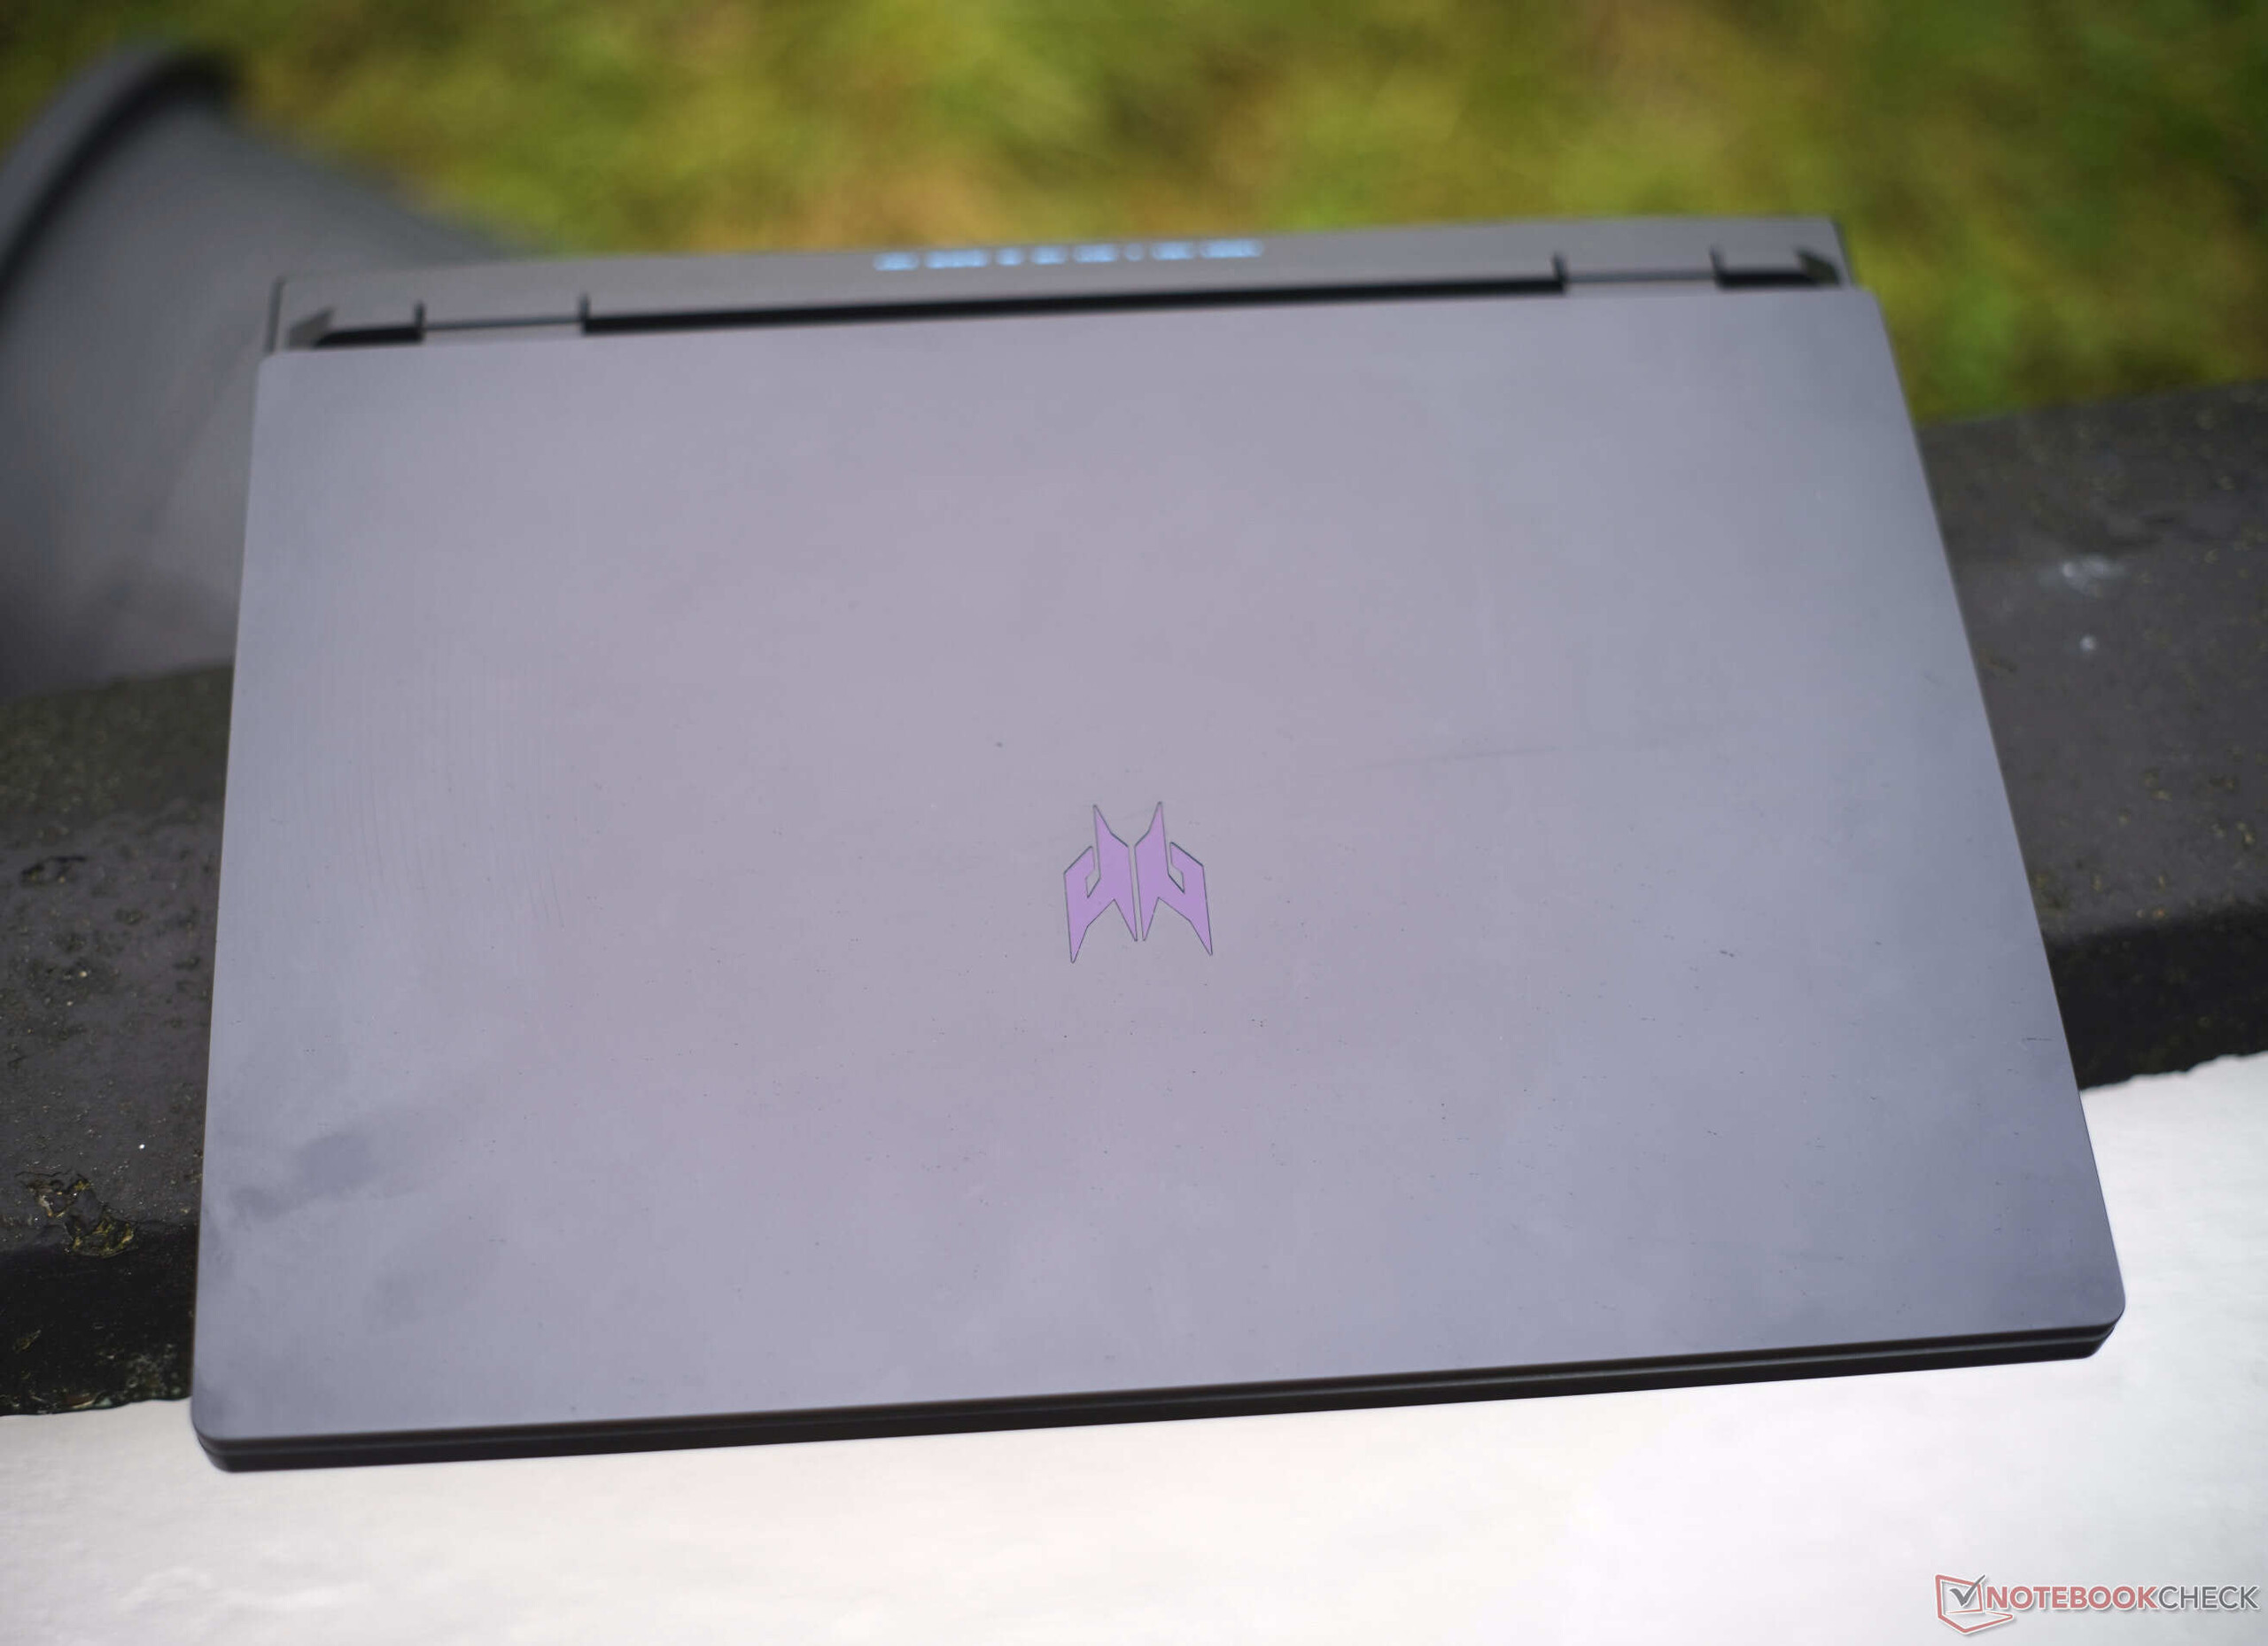
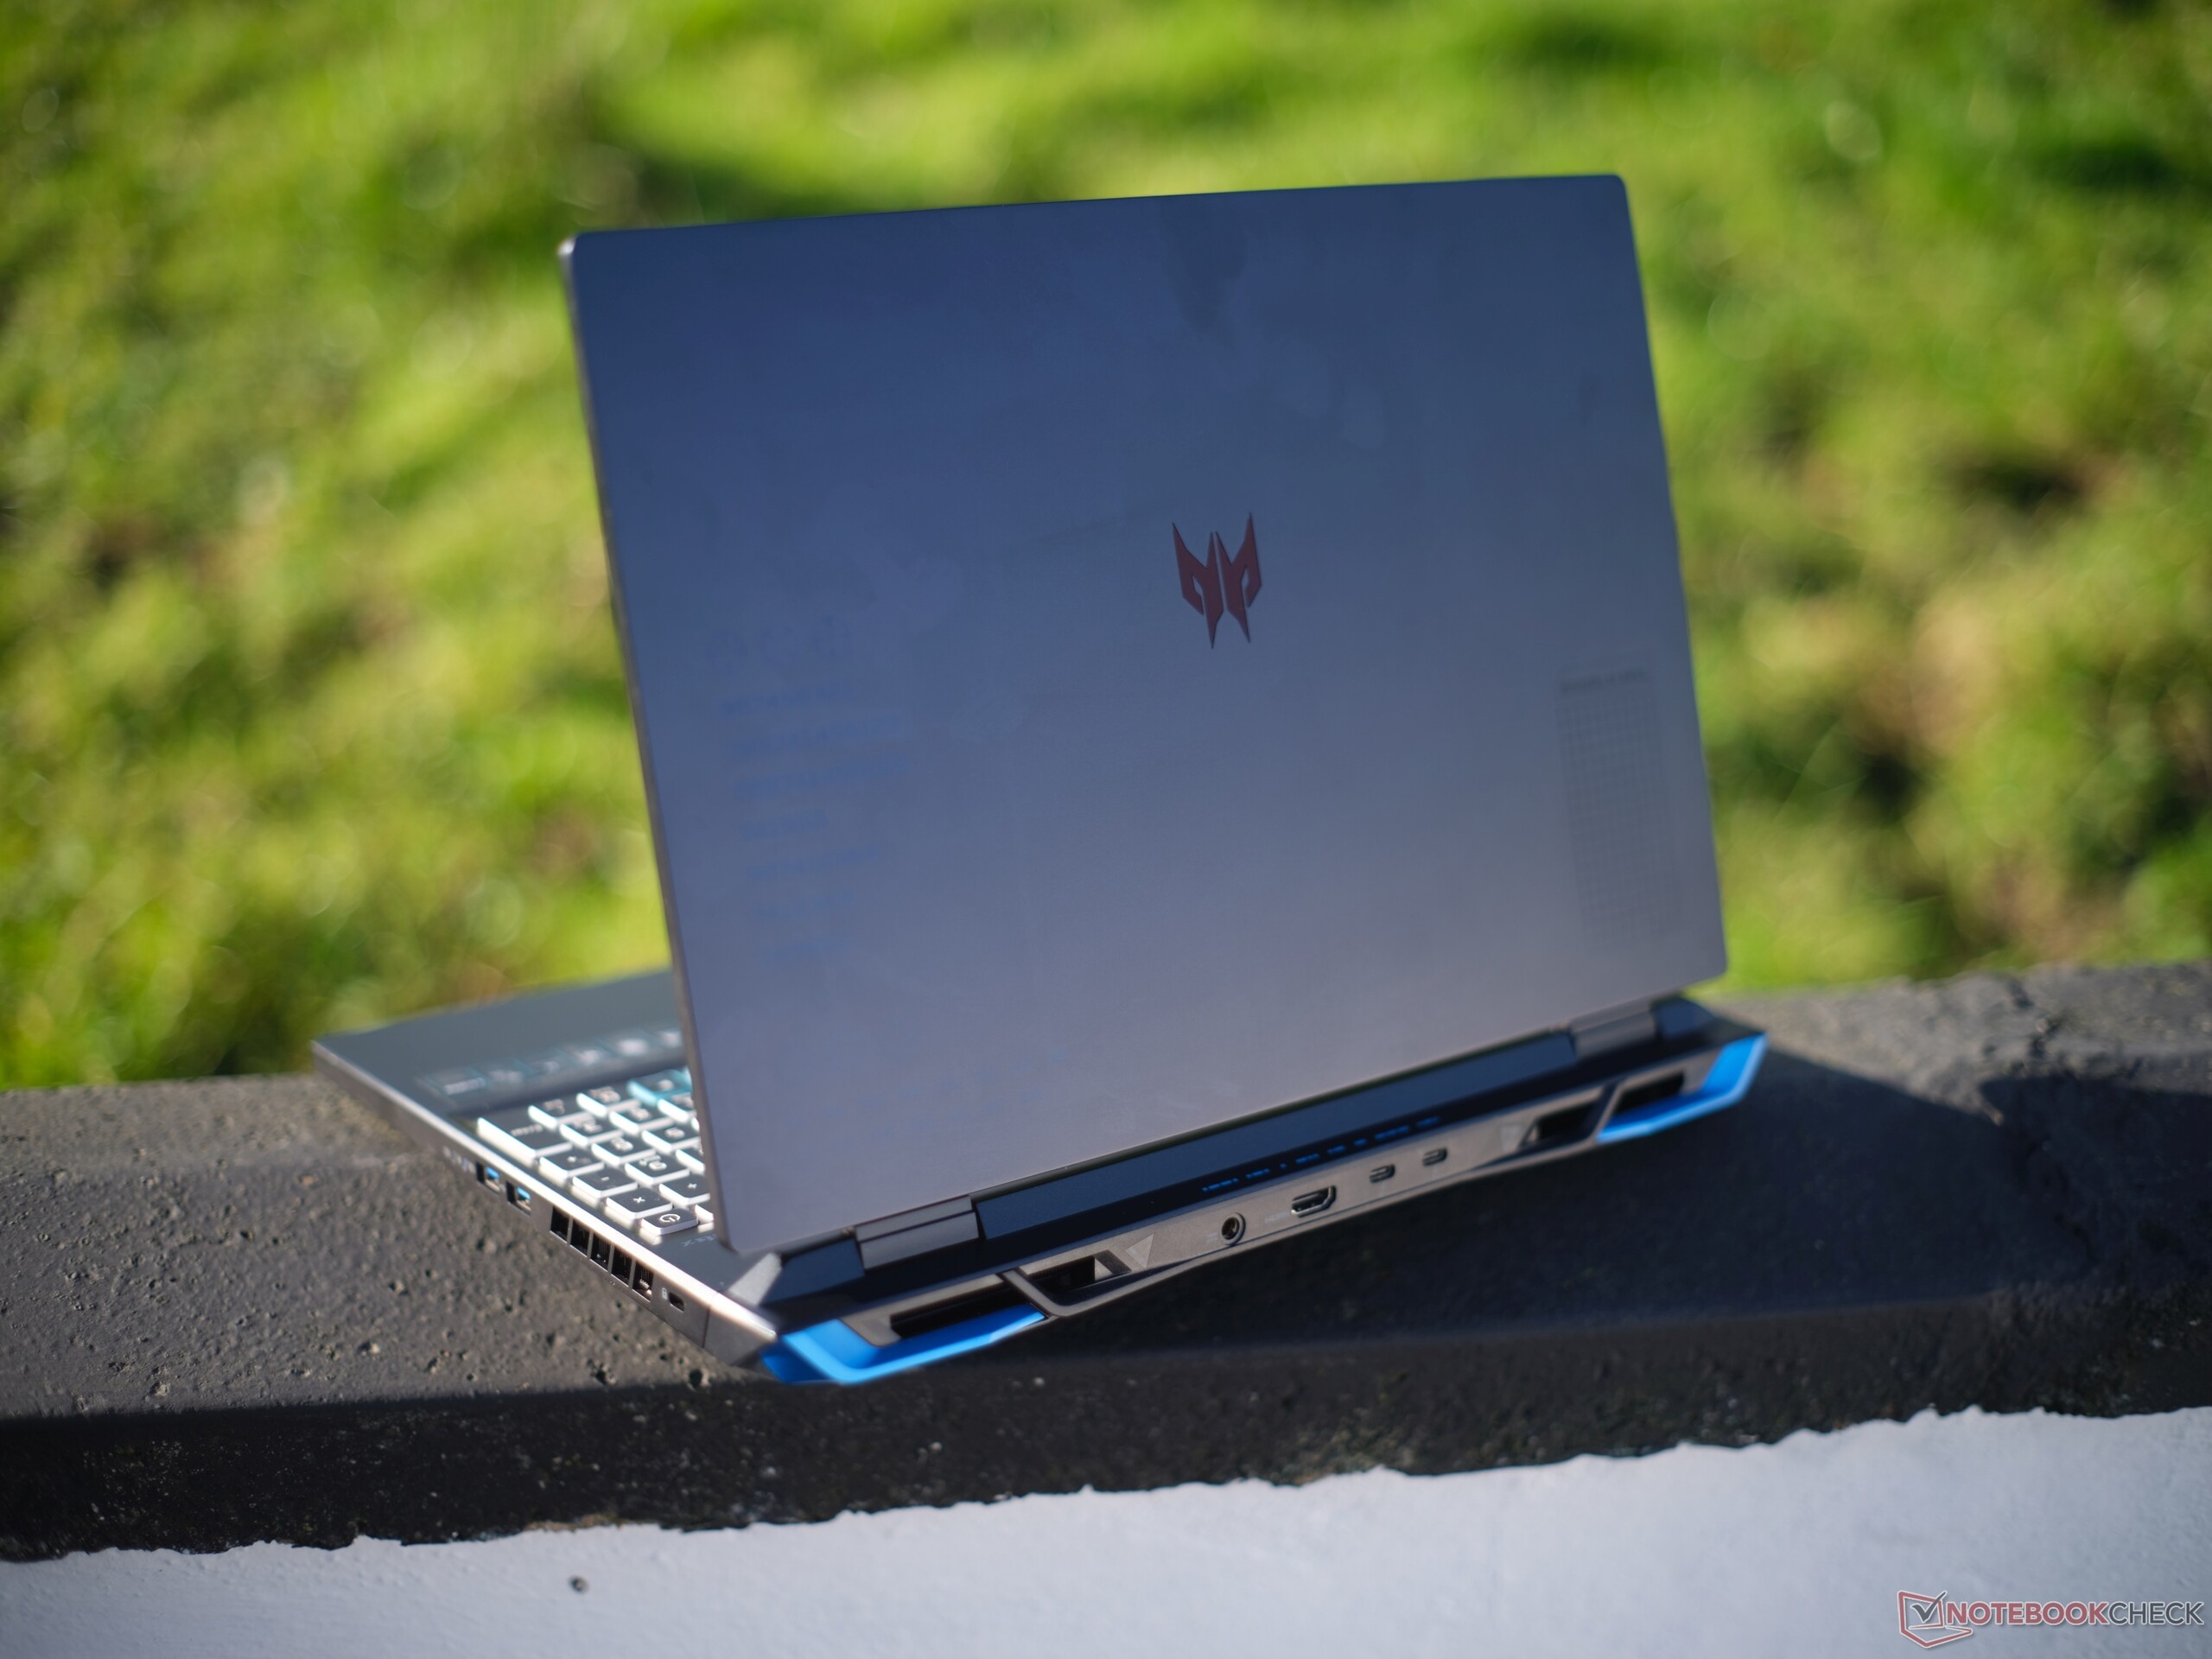
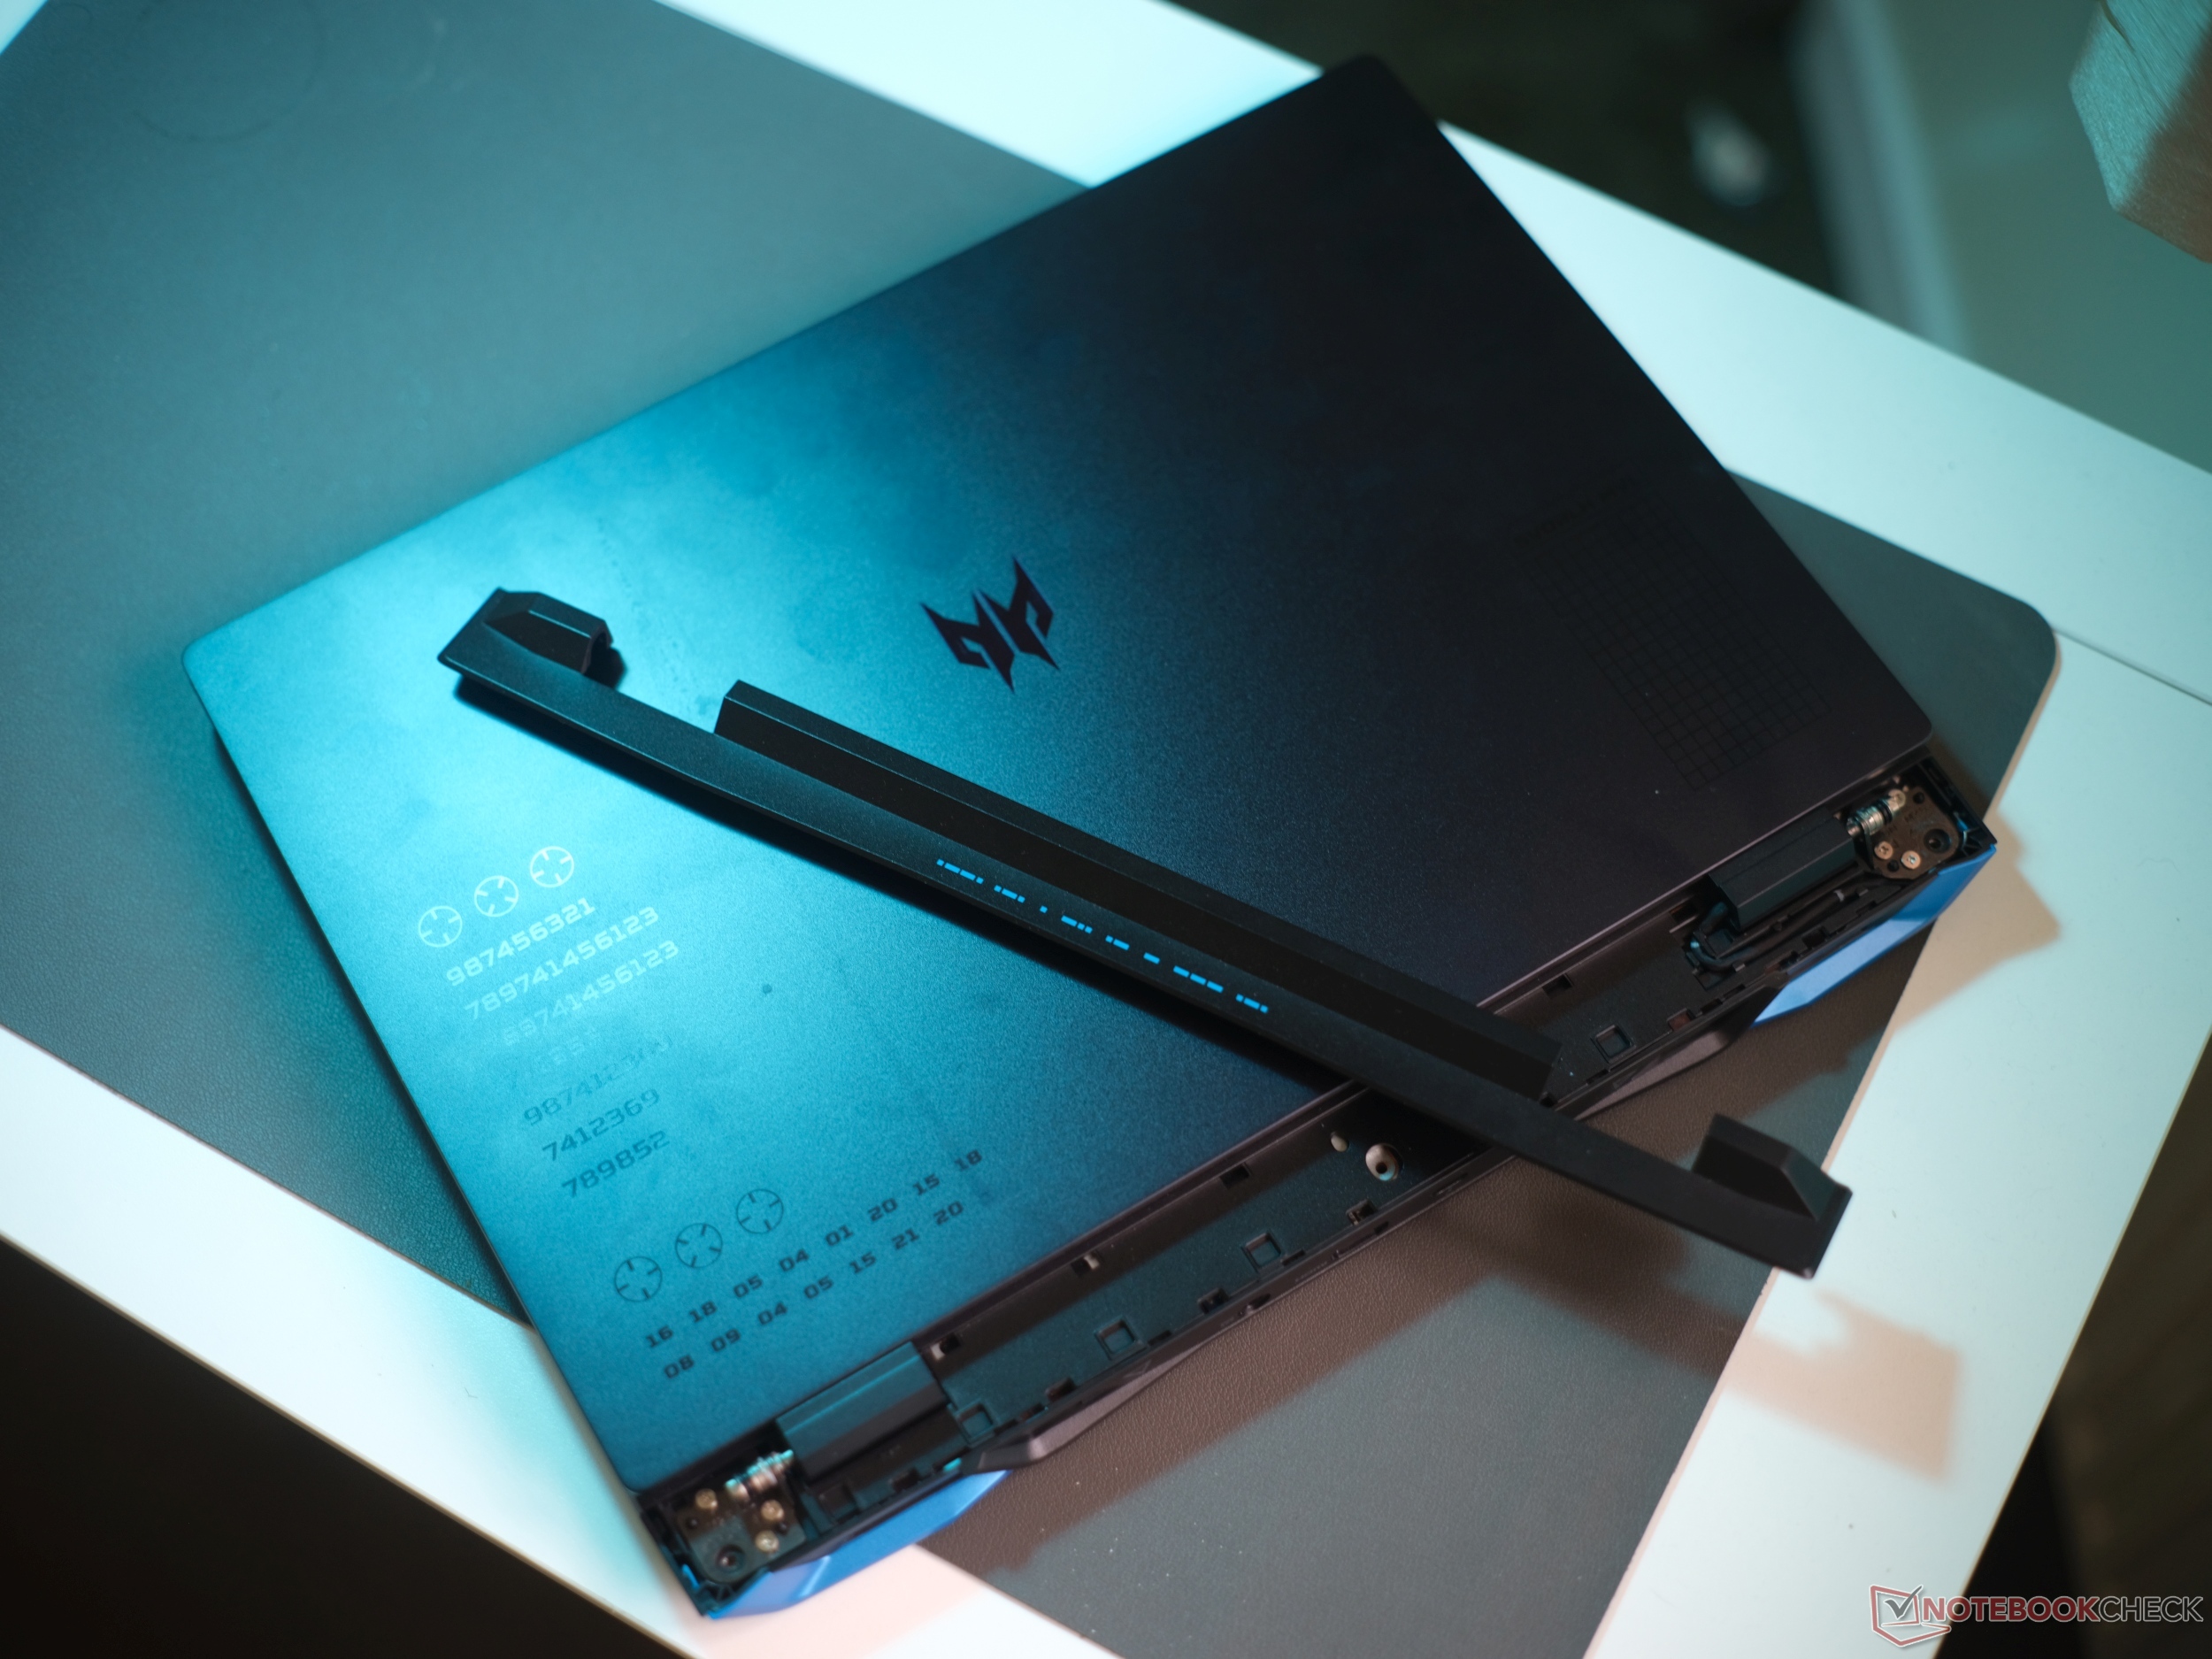
A estabilidade do gabinete do Predator Helios Neo é excelente, o que o diferencia de muitos outros gabinetes de jogos econômicos. A tampa de alumínio e a unidade de base de plástico são de um preto profundo (Obsidian Black) com um sutil brilho azul escuro.
Há alguns elementos gravados na tampa que, juntamente com as grades azuis da ventoinha na parte traseira, dão ao dispositivo uma aparência interessante, mas também um "efeito furtivo" menor. Uma clara desvantagem é o quanto suas superfícies atraem impressões digitais.
A tampa pode ser aberta com uma mão e até um máximo de ~150° - ao mesmo tempo, as dobradiças são bastante rígidas, o que significa que ela quase não balança quando o senhor a posiciona. Infelizmente, ele pode ser torcido com bastante facilidade (mesmo que isso não leve a nenhum erro de imagem), mas, por outro lado, a unidade base é muito estável. Em suma, o Helios Neo 16 nos deixou uma impressão de bom a muito bom, da mesma forma que a variante não Neo. A única diferença é que esse modelo não apresenta uma parte traseira iluminada nem uma grade de resfriamento substituível.

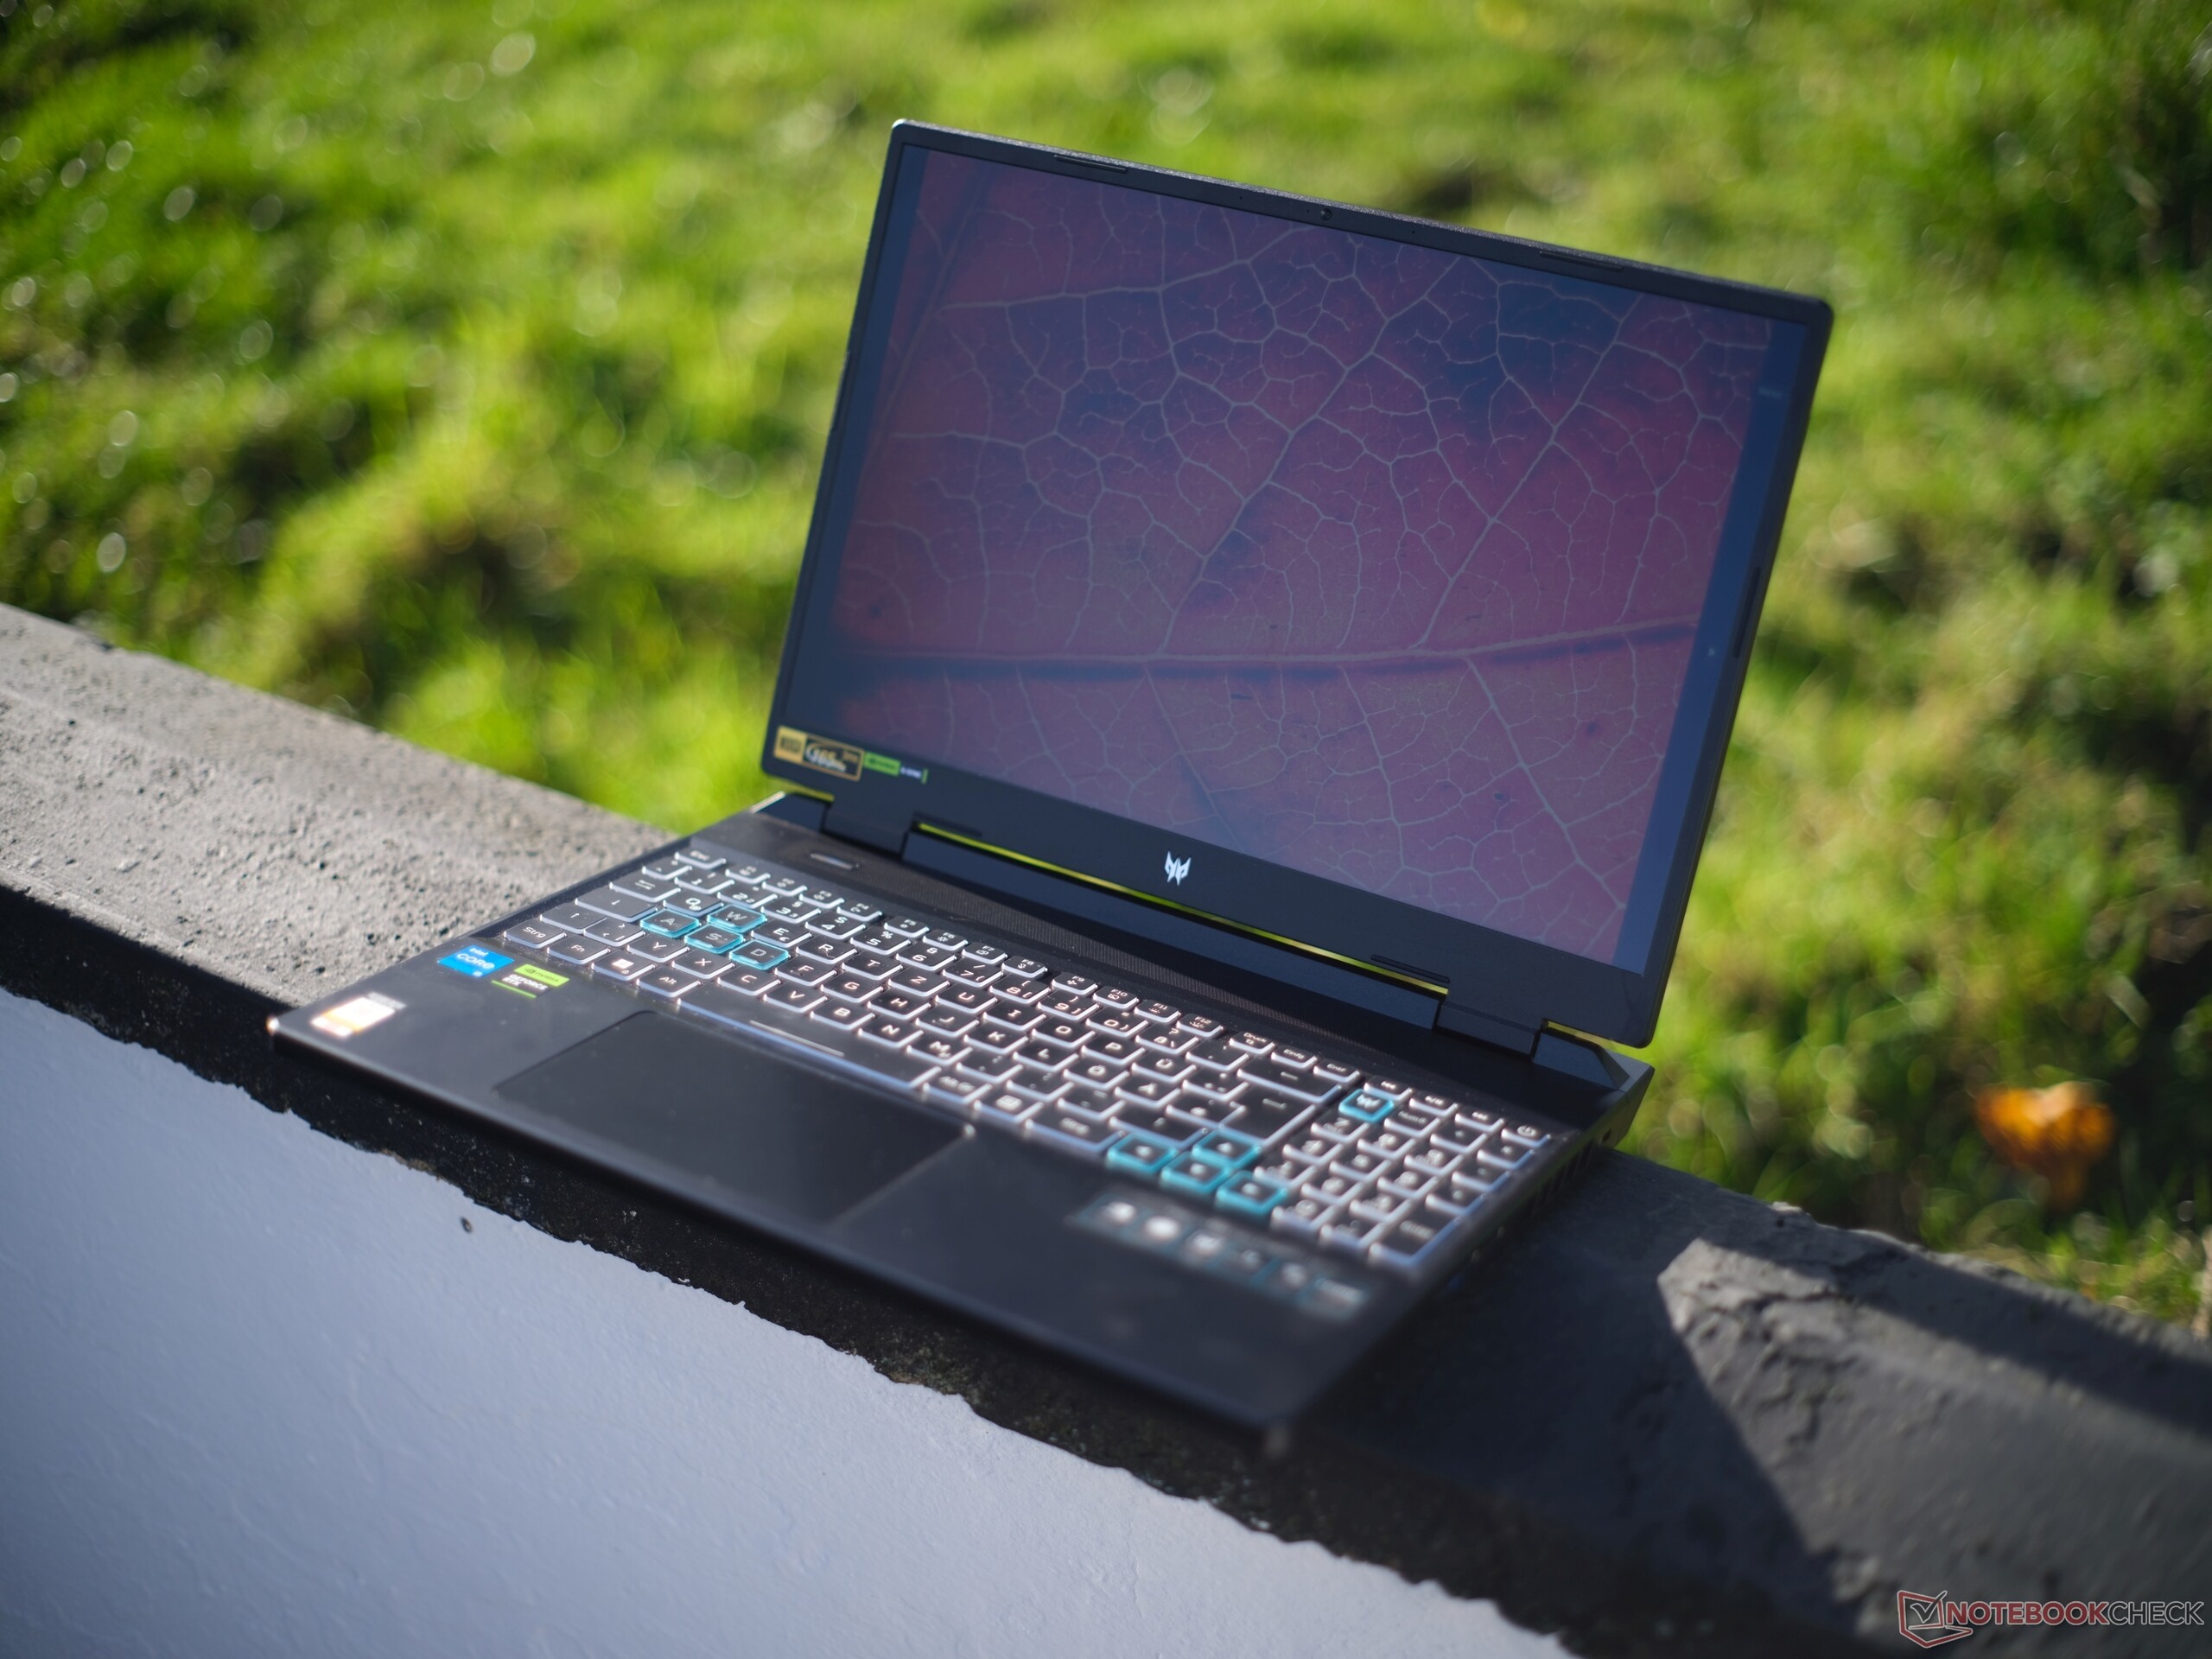
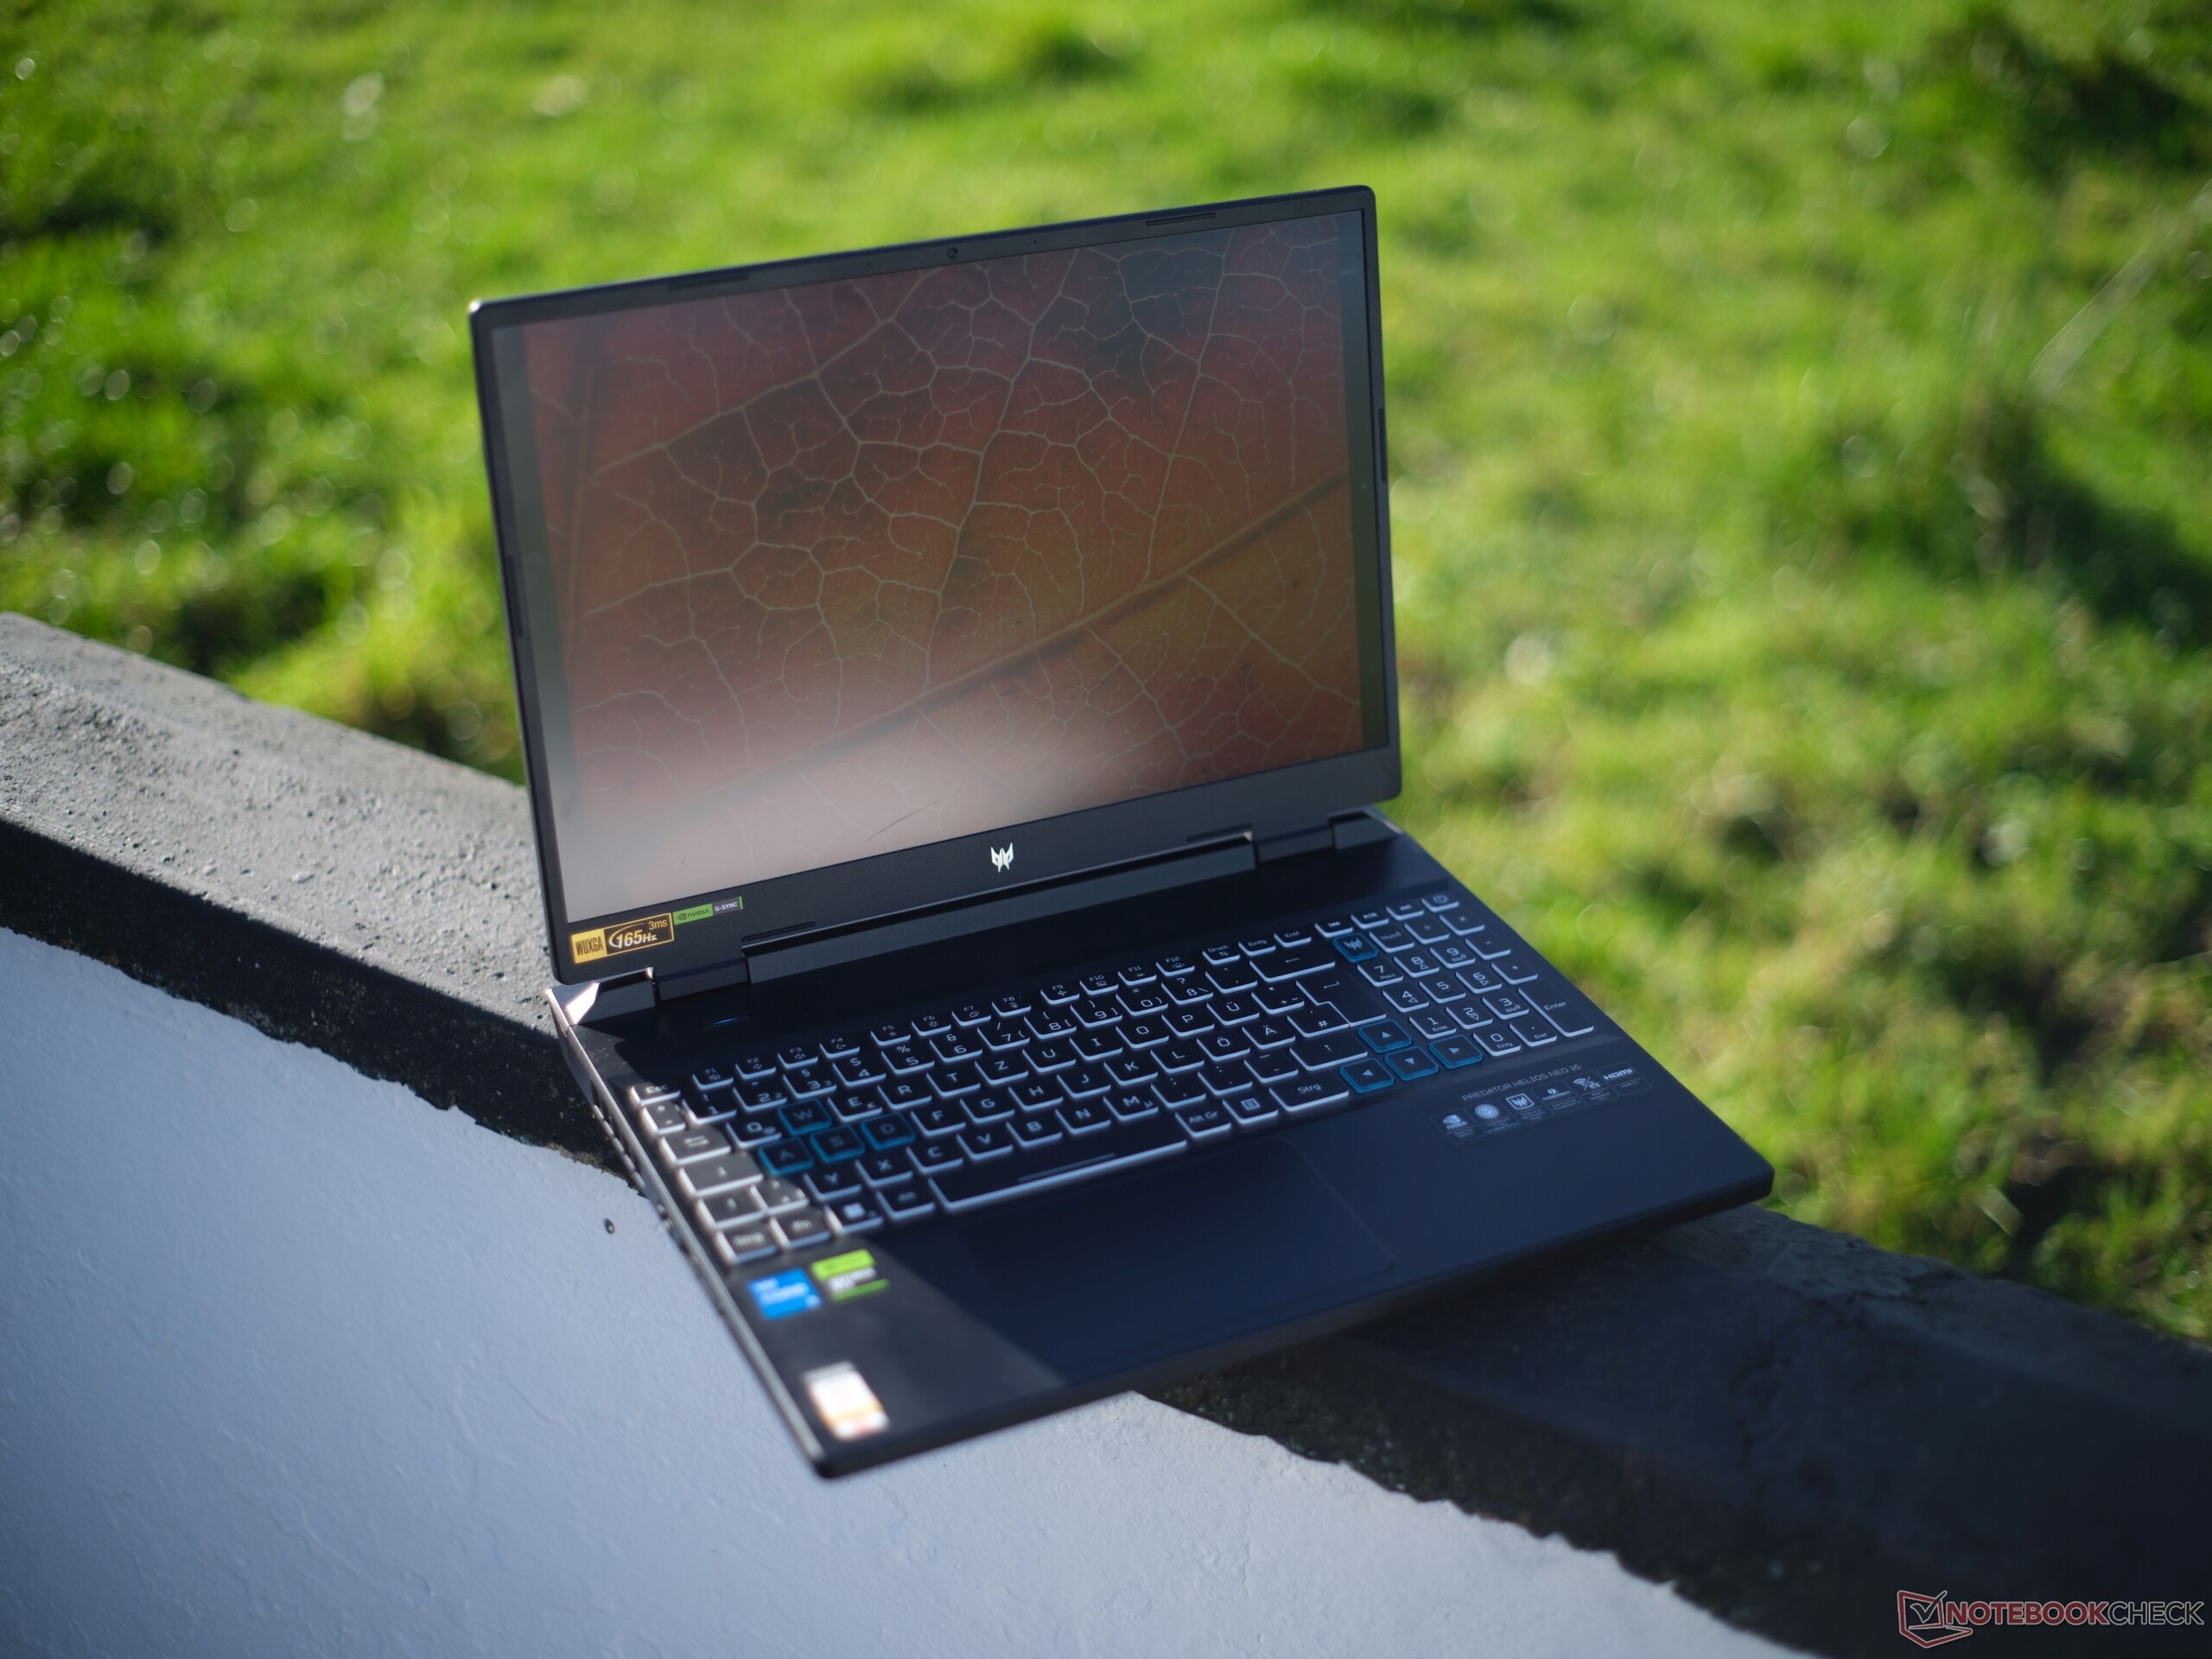
Com um peso de 2,6 kg e uma espessura de 28,25 mm, o Helios Neo está na média de um laptop para jogos de 16 polegadas. Em nosso campo de comparação, apenas oHP Victus 16tem valores mais baixos, pesando 2,3 kg com uma espessura de 22,9 mm. O XMG Apex 15 de 15,6 polegadas também é um pouco mais leve.
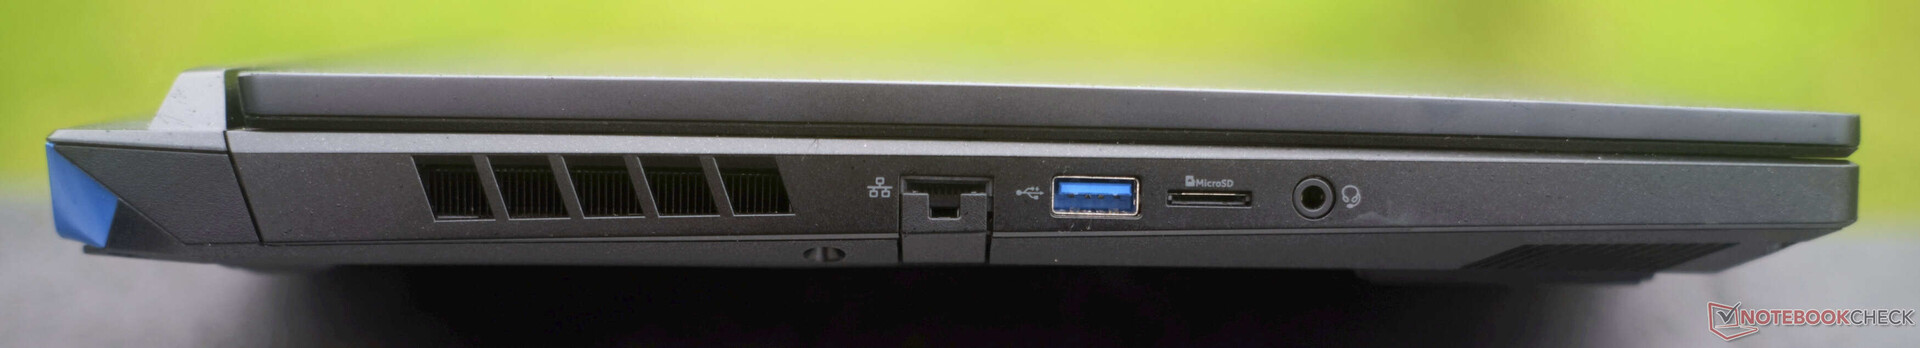
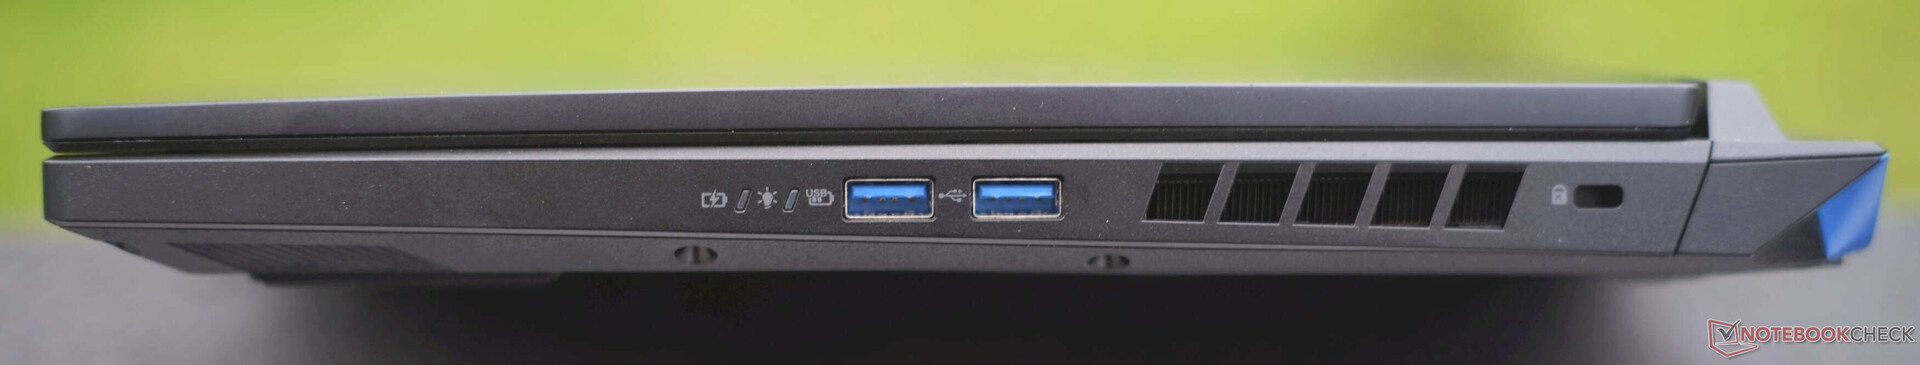
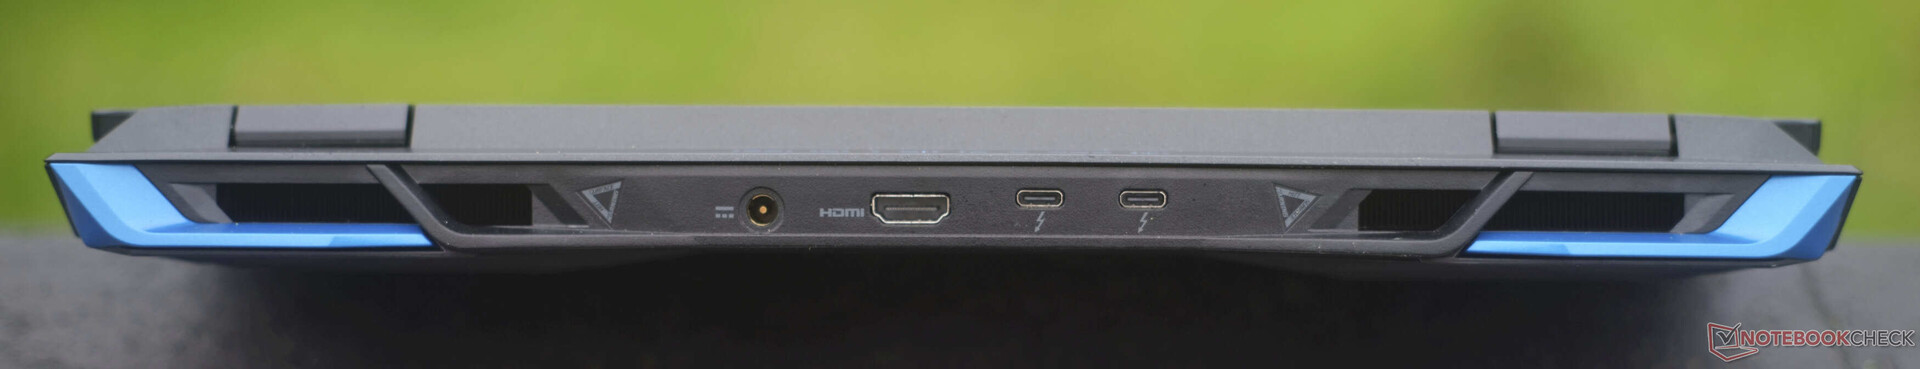
Conectividade: Muitas conexões, mas WiFi e Power Delivery lentos
O laptop para jogos da Acer possui 1x USB-A 3.1 (5 GBit/s), 2x USB-A 3.2 (10 GBit/s), bem como 2x Thunderbolt 4 incl. DisplayPort 1.4 e Power Delivery (65 watts) na parte traseira. Na parte traseira, há um Gigabit-RJ45, leitor de cartão microSD, conector de áudio de 3,5 mm, trava Kensington, conexão de energia, bem como uma porta HDMI 2.1 conectada diretamente à dGPU e que suporta 4K a 120 Hz com G-Sync simultâneo.
No final das contas, o Predator Helios Neo não tem nenhuma desvantagem em relação ao seu irmão mais caro,, com exceção do desempenho inferior de PD.
Leitor de cartão SD
As taxas de transferência do leitor de cartão microSD são médias quando usadas com nosso cartão de referência AV PRO microSD 128 GB V60. OLegion Slim 5,Acer Nitro 16,XMG Focus 15eGigabyte G5todos leem e copiam dados com taxas de transferência semelhantes. No entanto,Apex 15 da XMG da XMG é mais de duas vezes mais lento, enquanto oM16 R1 da Alienware da Alienware é duas vezes mais rápido.
| SD Card Reader | |
| average JPG Copy Test (av. of 3 runs) | |
| Alienware m16 R1 Intel (AV PRO microSD 128 GB V60) | |
| Média da turma Gaming (20.9 - 210, n=54, últimos 2 anos) | |
| Lenovo Legion Slim 5 14APH8 (Toshiba Exceria Pro SDXC 64 GB UHS-II) | |
| Acer Nitro 16 AN16-41-R7YE (AV PRO microSD 128 GB V60) | |
| Acer Predator Helios Neo 16 NH.QLTEG.002 | |
| Gigabyte G5 KF | |
| Schenker XMG Apex 15 (Late 23) (AV PRO microSD 128 GB V60) | |
| maximum AS SSD Seq Read Test (1GB) | |
| Alienware m16 R1 Intel (AV PRO microSD 128 GB V60) | |
| Média da turma Gaming (25.5 - 261, n=51, últimos 2 anos) | |
| Schenker XMG Focus 15 (E23) | |
| Gigabyte G5 KF | |
| Acer Predator Helios Neo 16 NH.QLTEG.002 | |
| Acer Nitro 16 AN16-41-R7YE (AV PRO microSD 128 GB V60) | |
| Lenovo Legion Slim 5 14APH8 (Toshiba Exceria Pro SDXC 64 GB UHS-II) | |
| Schenker XMG Apex 15 (Late 23) (AV PRO microSD 128 GB V60) | |
Comunicação
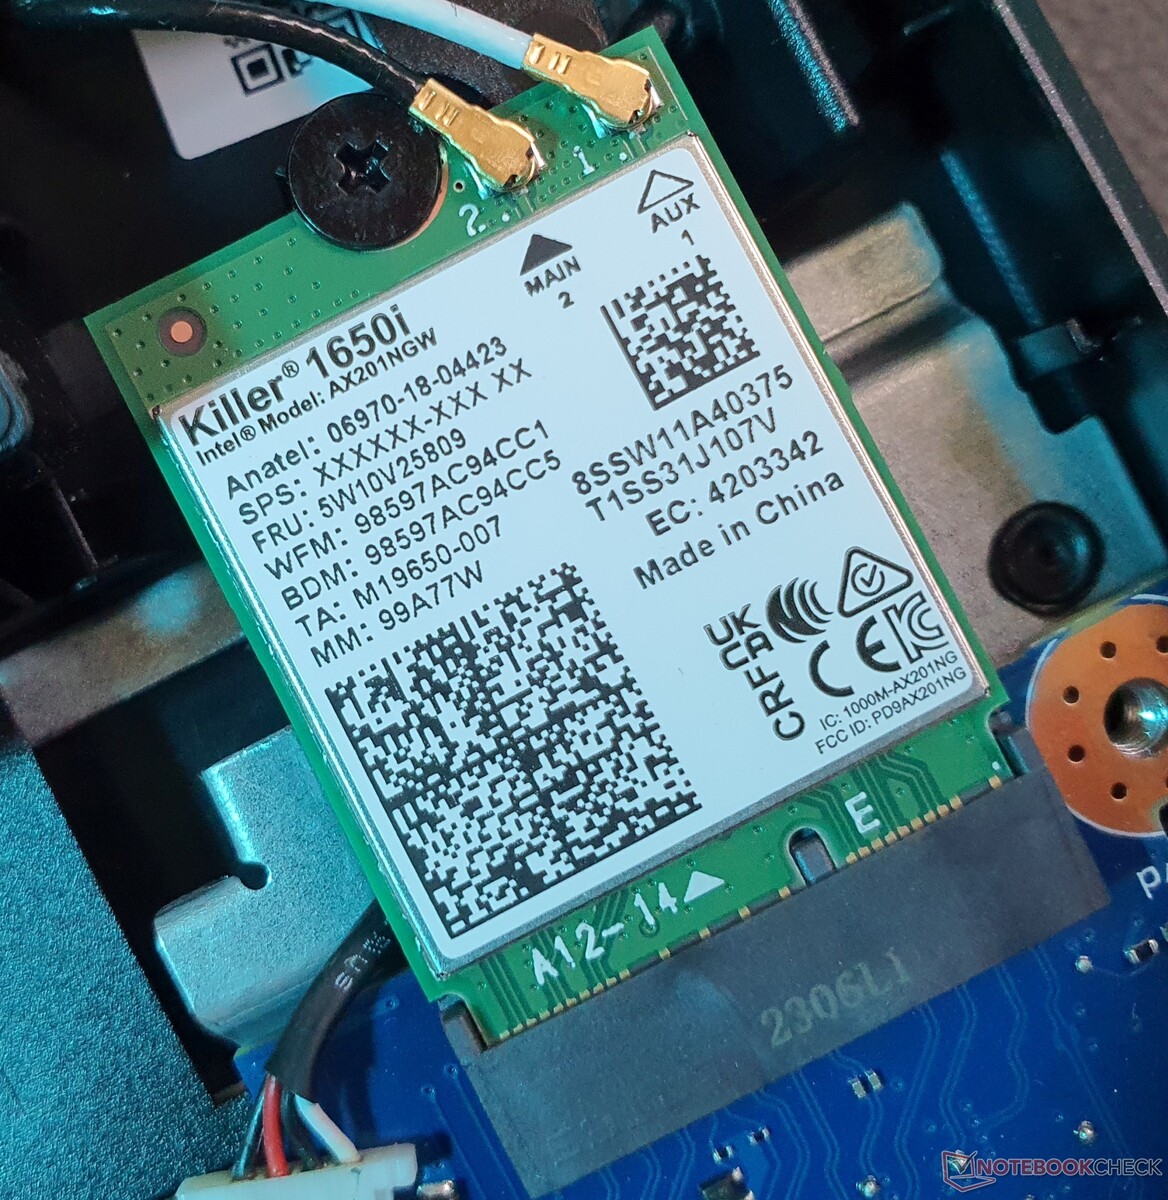
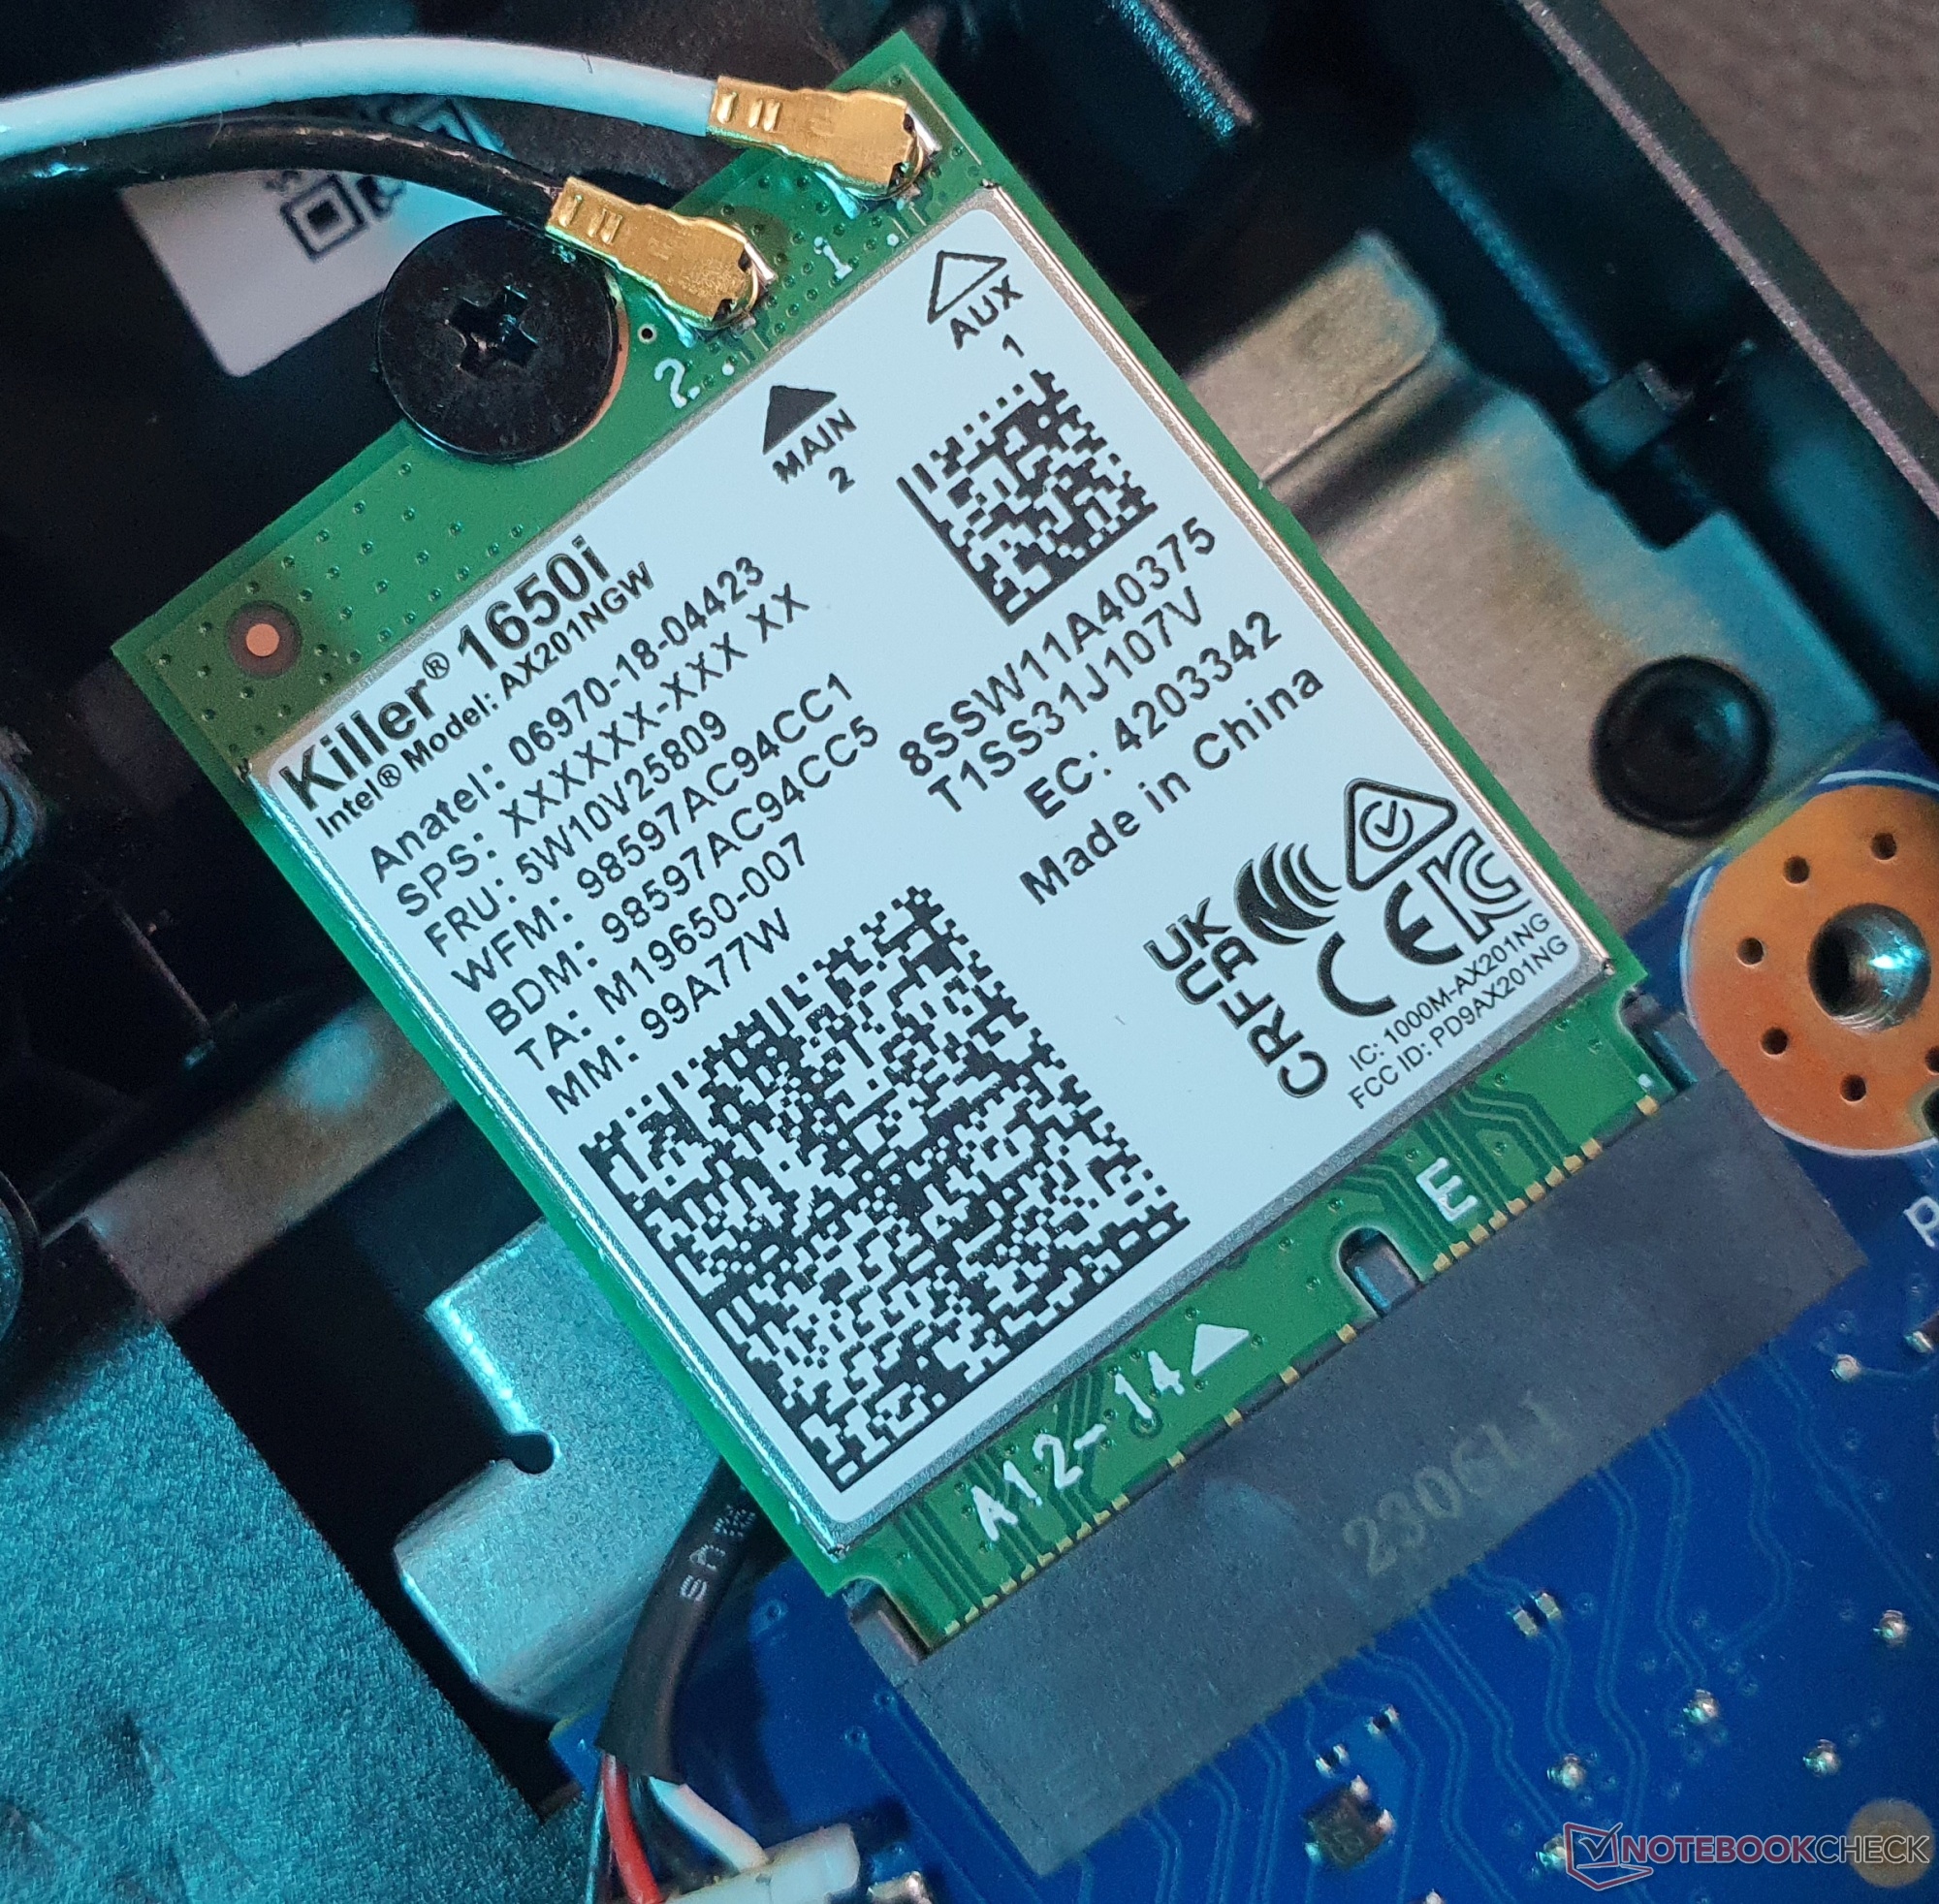
O módulo WLAN Intel Killer AX1650i instalado no laptop corresponde ao padrão WiFi 6 mais antigo e, com taxas de transferência de ~900 MBit/s, está em um nível de lentidão semelhante ao do chip Realtek no Lenovo LOQ 16.
O Helios 16por outro lado, atinge até 1,6 GBit/s usando o Intel Killer AX1675i (WiFi 6E), enquanto oLegion Pro 5 16 ficou por pouco no topo do nosso campo de comparação. O controlador Killer E2600 Gigabit da Intel cuida das conexões com fio, enquanto o Bluetooth 5.2 também está integrado.
Webcam


Em contraste com o Predator Helios 16a Acer só instalou uma webcam de 720p no Neo, o que consideramos uma verdadeira vergonha considerando seu preço. Por isso, a qualidade da imagem deixa muito a desejar, mesmo em condições ideais. O Windows Hello também não está incluído. No entanto, os microfones de matriz dupla proporcionam uma qualidade de som decente.


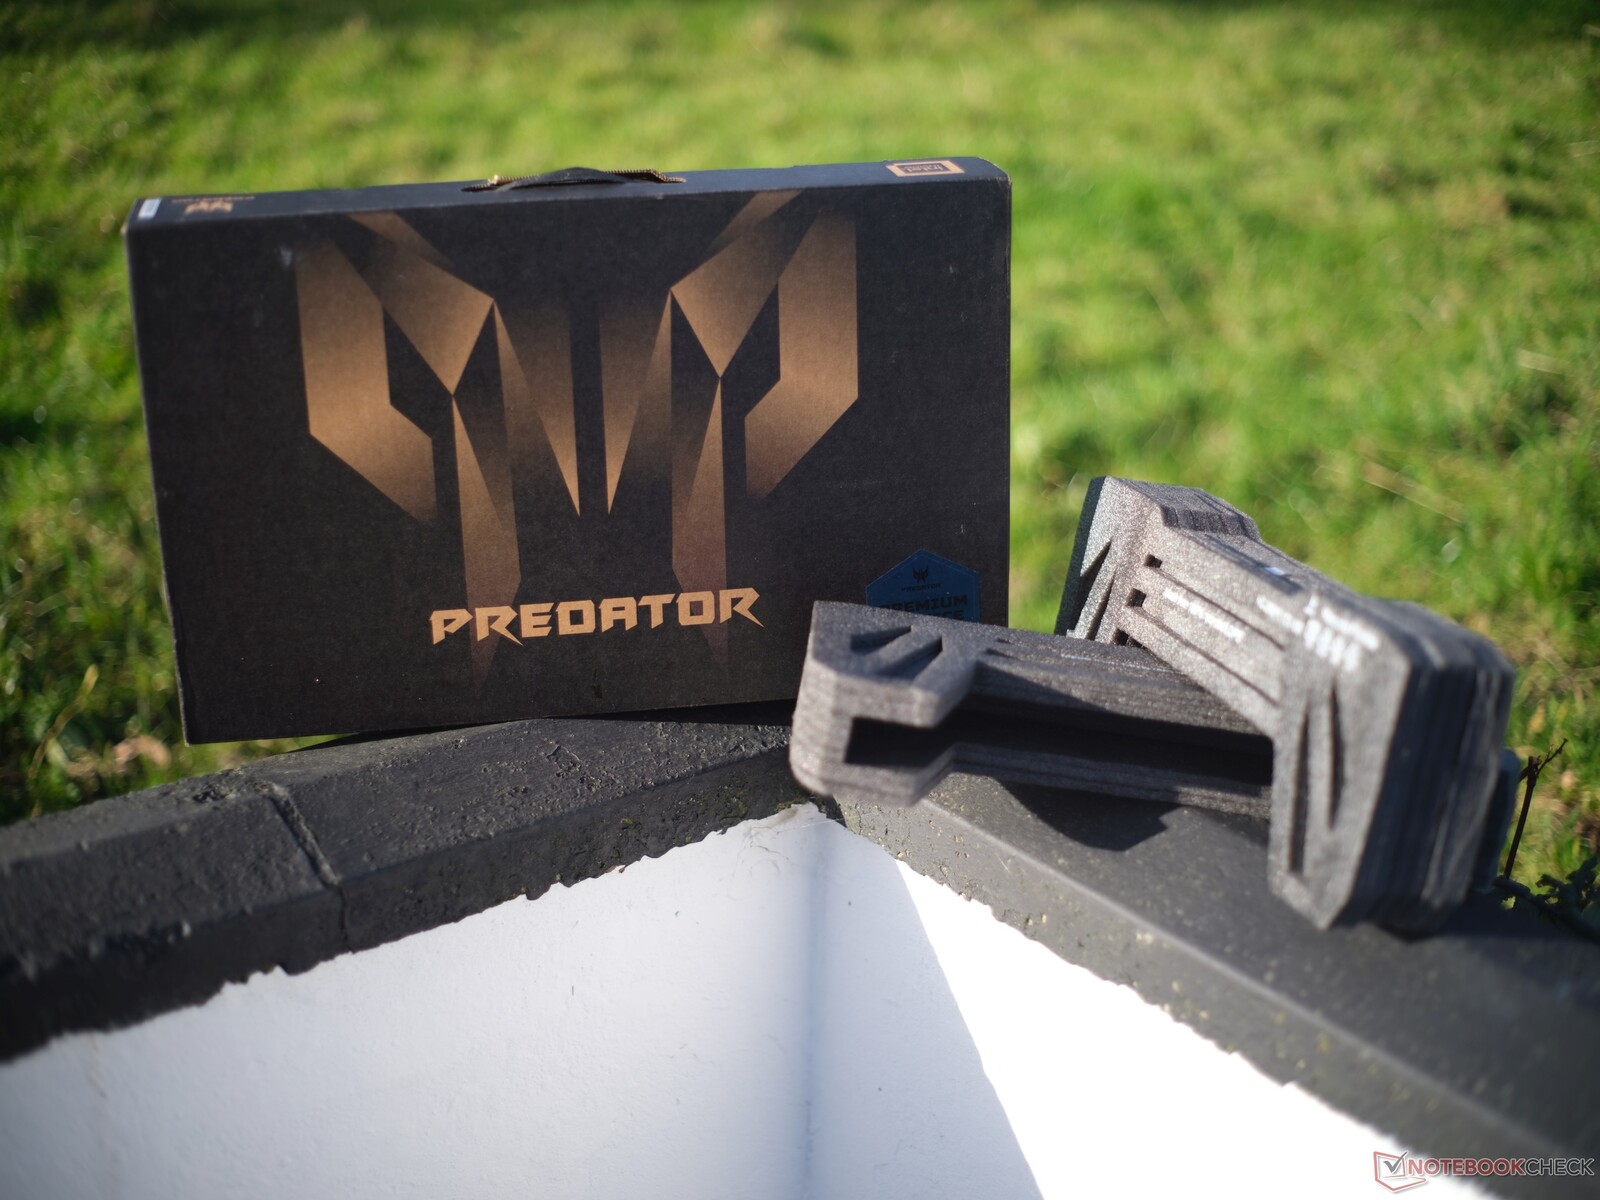
Acessórios
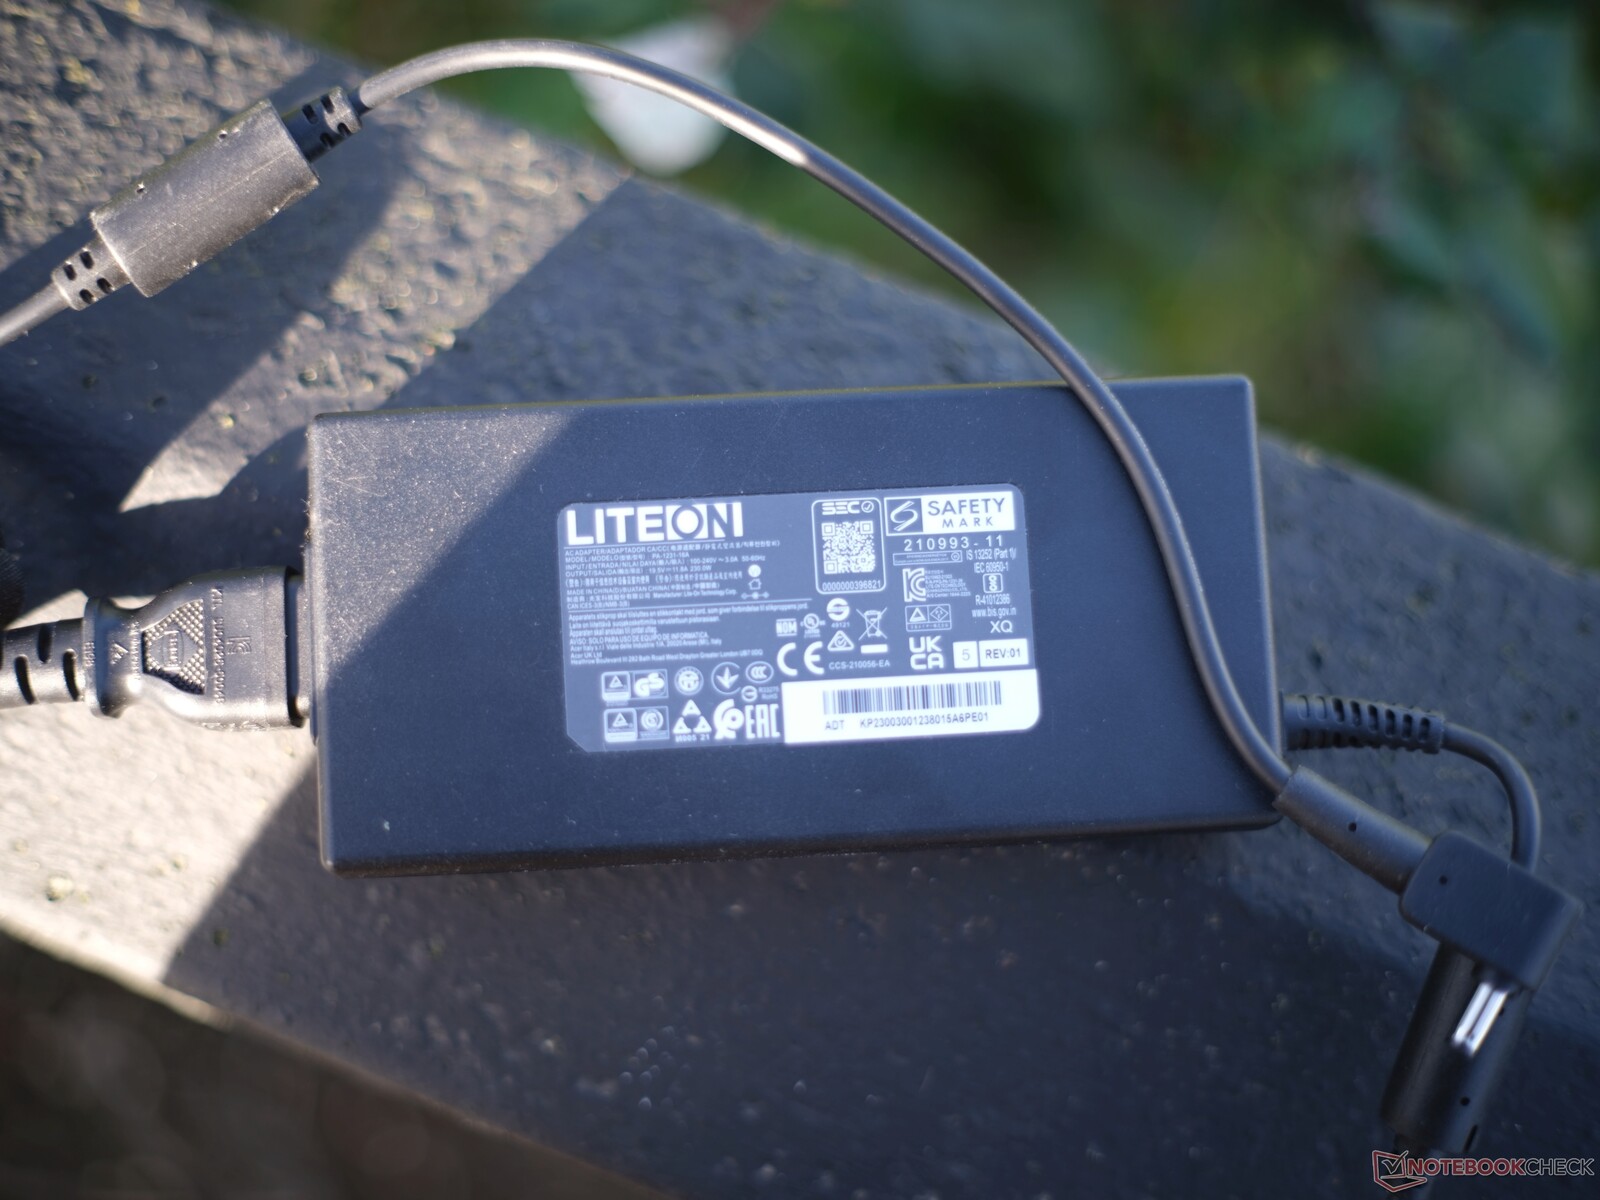
Além do próprio dispositivo, o escopo de entrega do laptop inclui apenas uma fonte de alimentação de 230 watts. Em geral, gostaríamos de ver uma embalagem mais ecológica, sem nenhum plástico, embora os materiais usados sejam, pelo menos, reciclados.
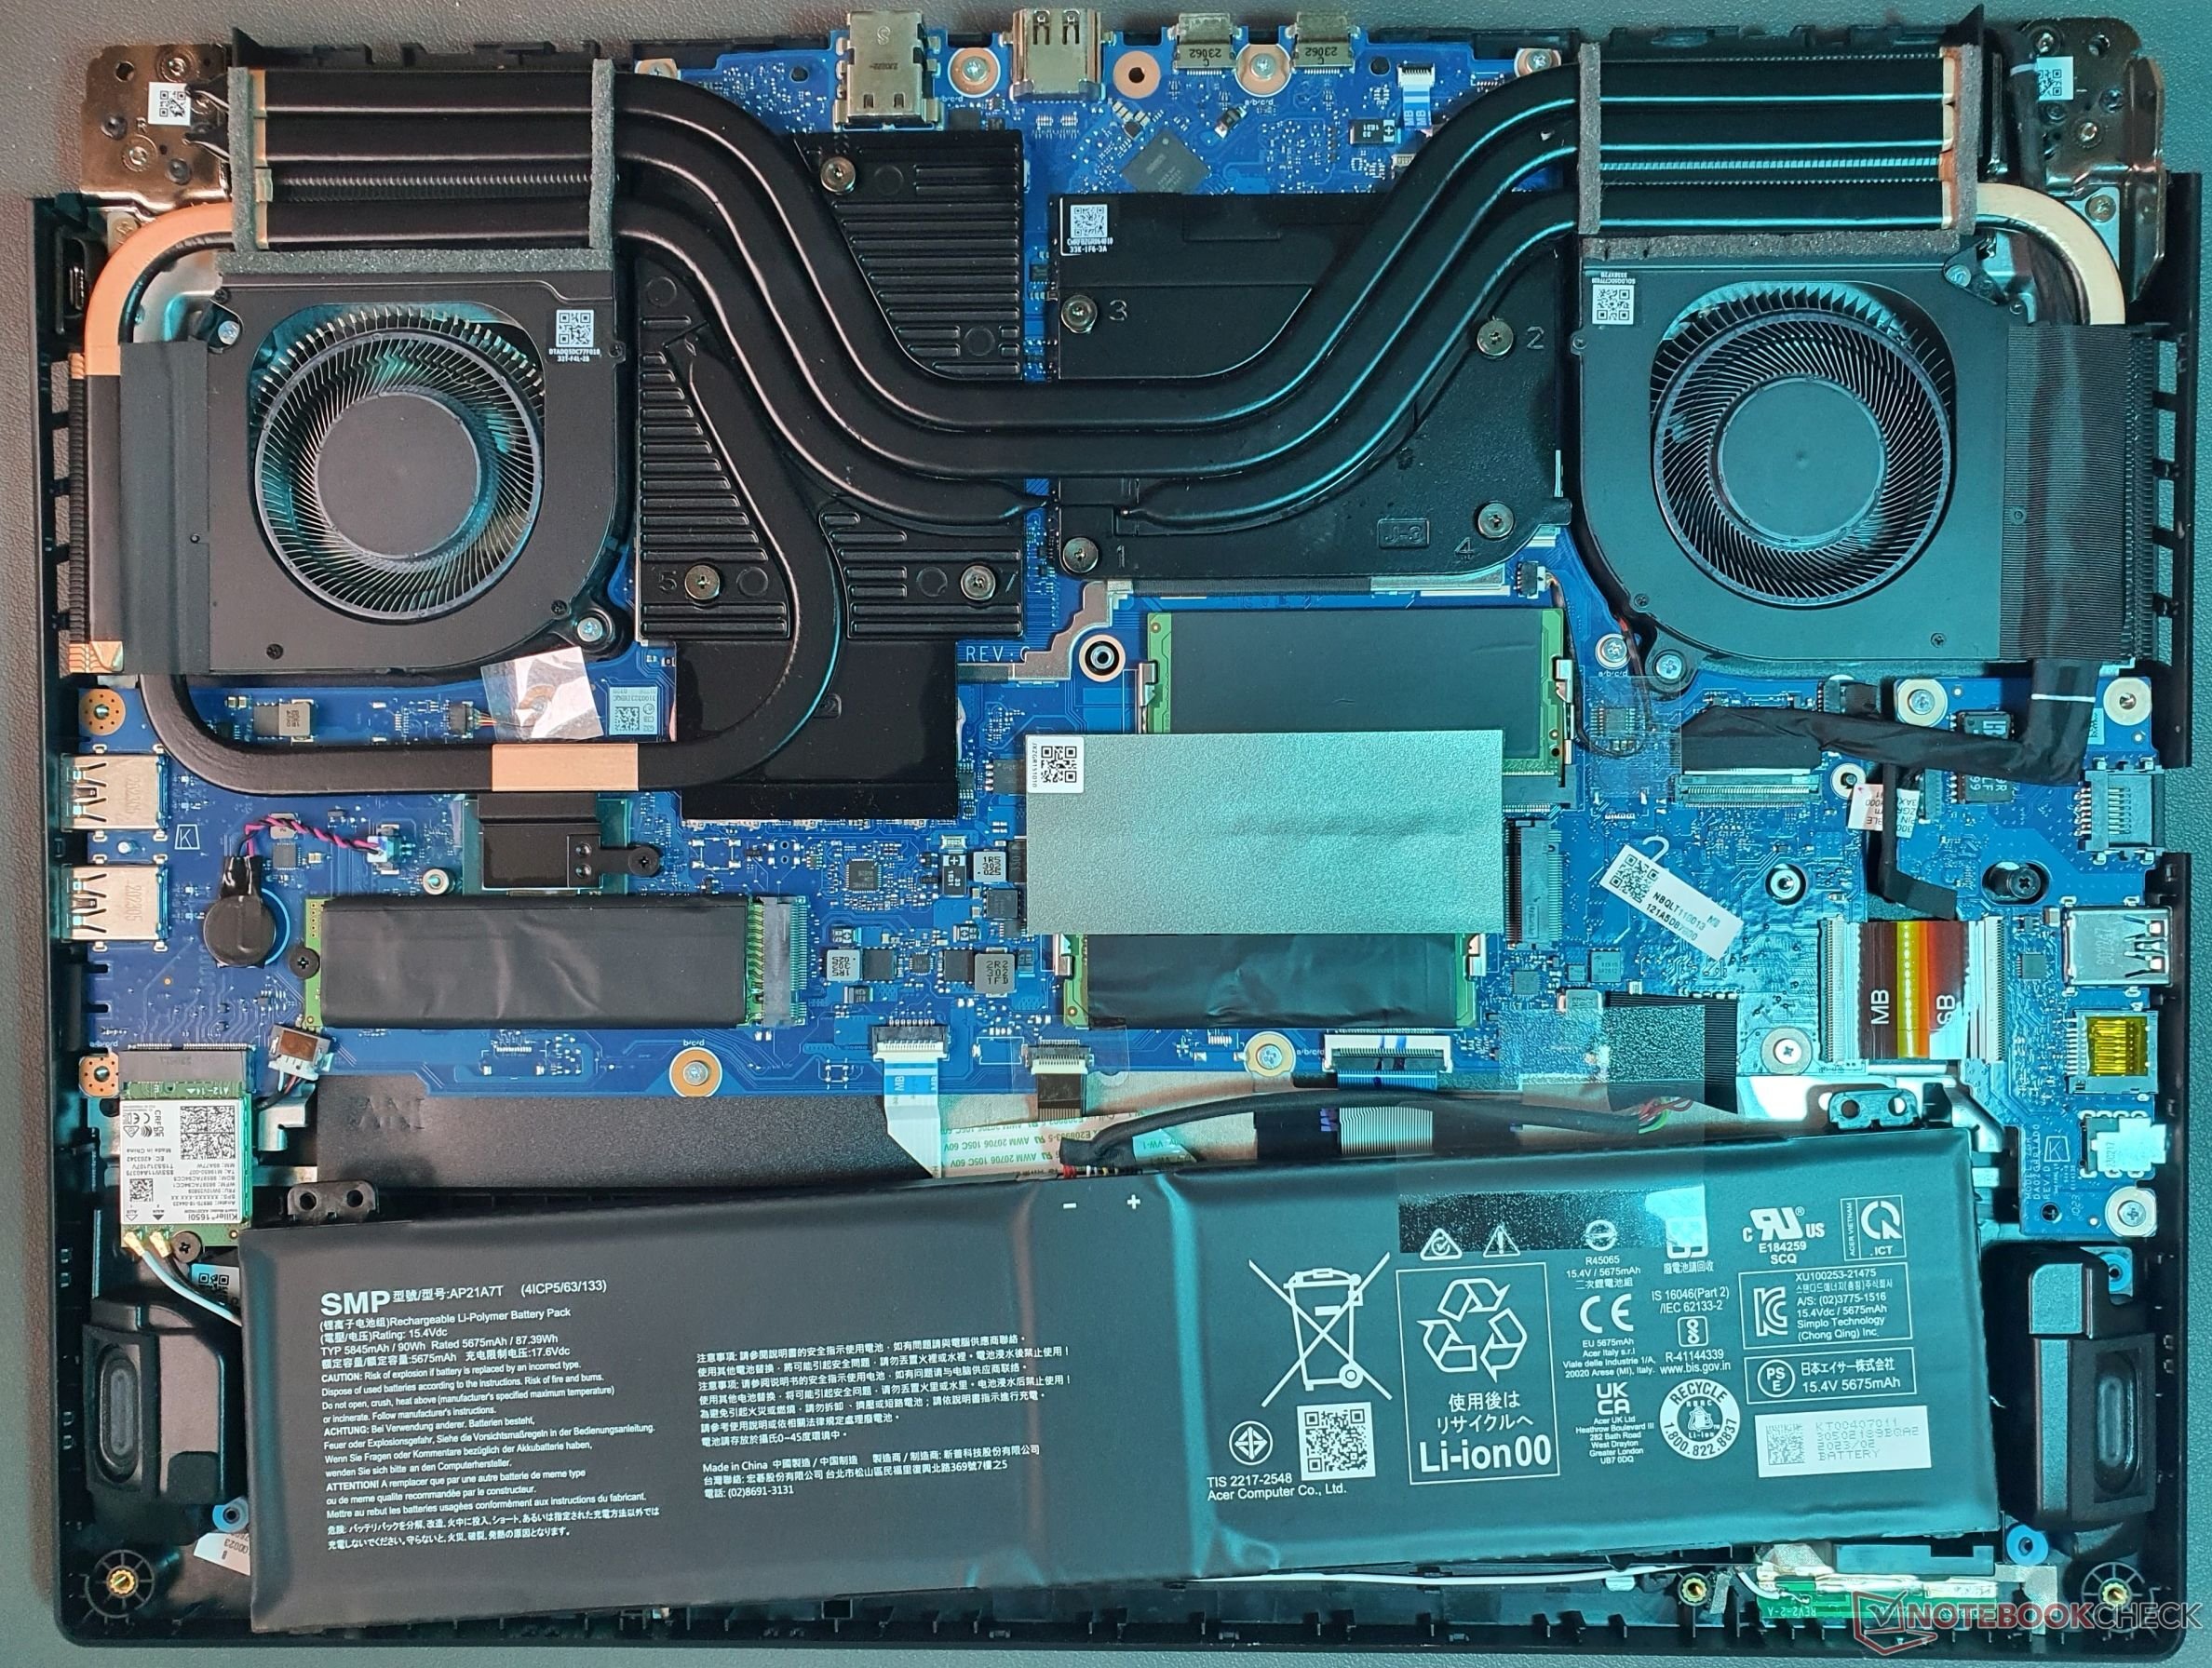
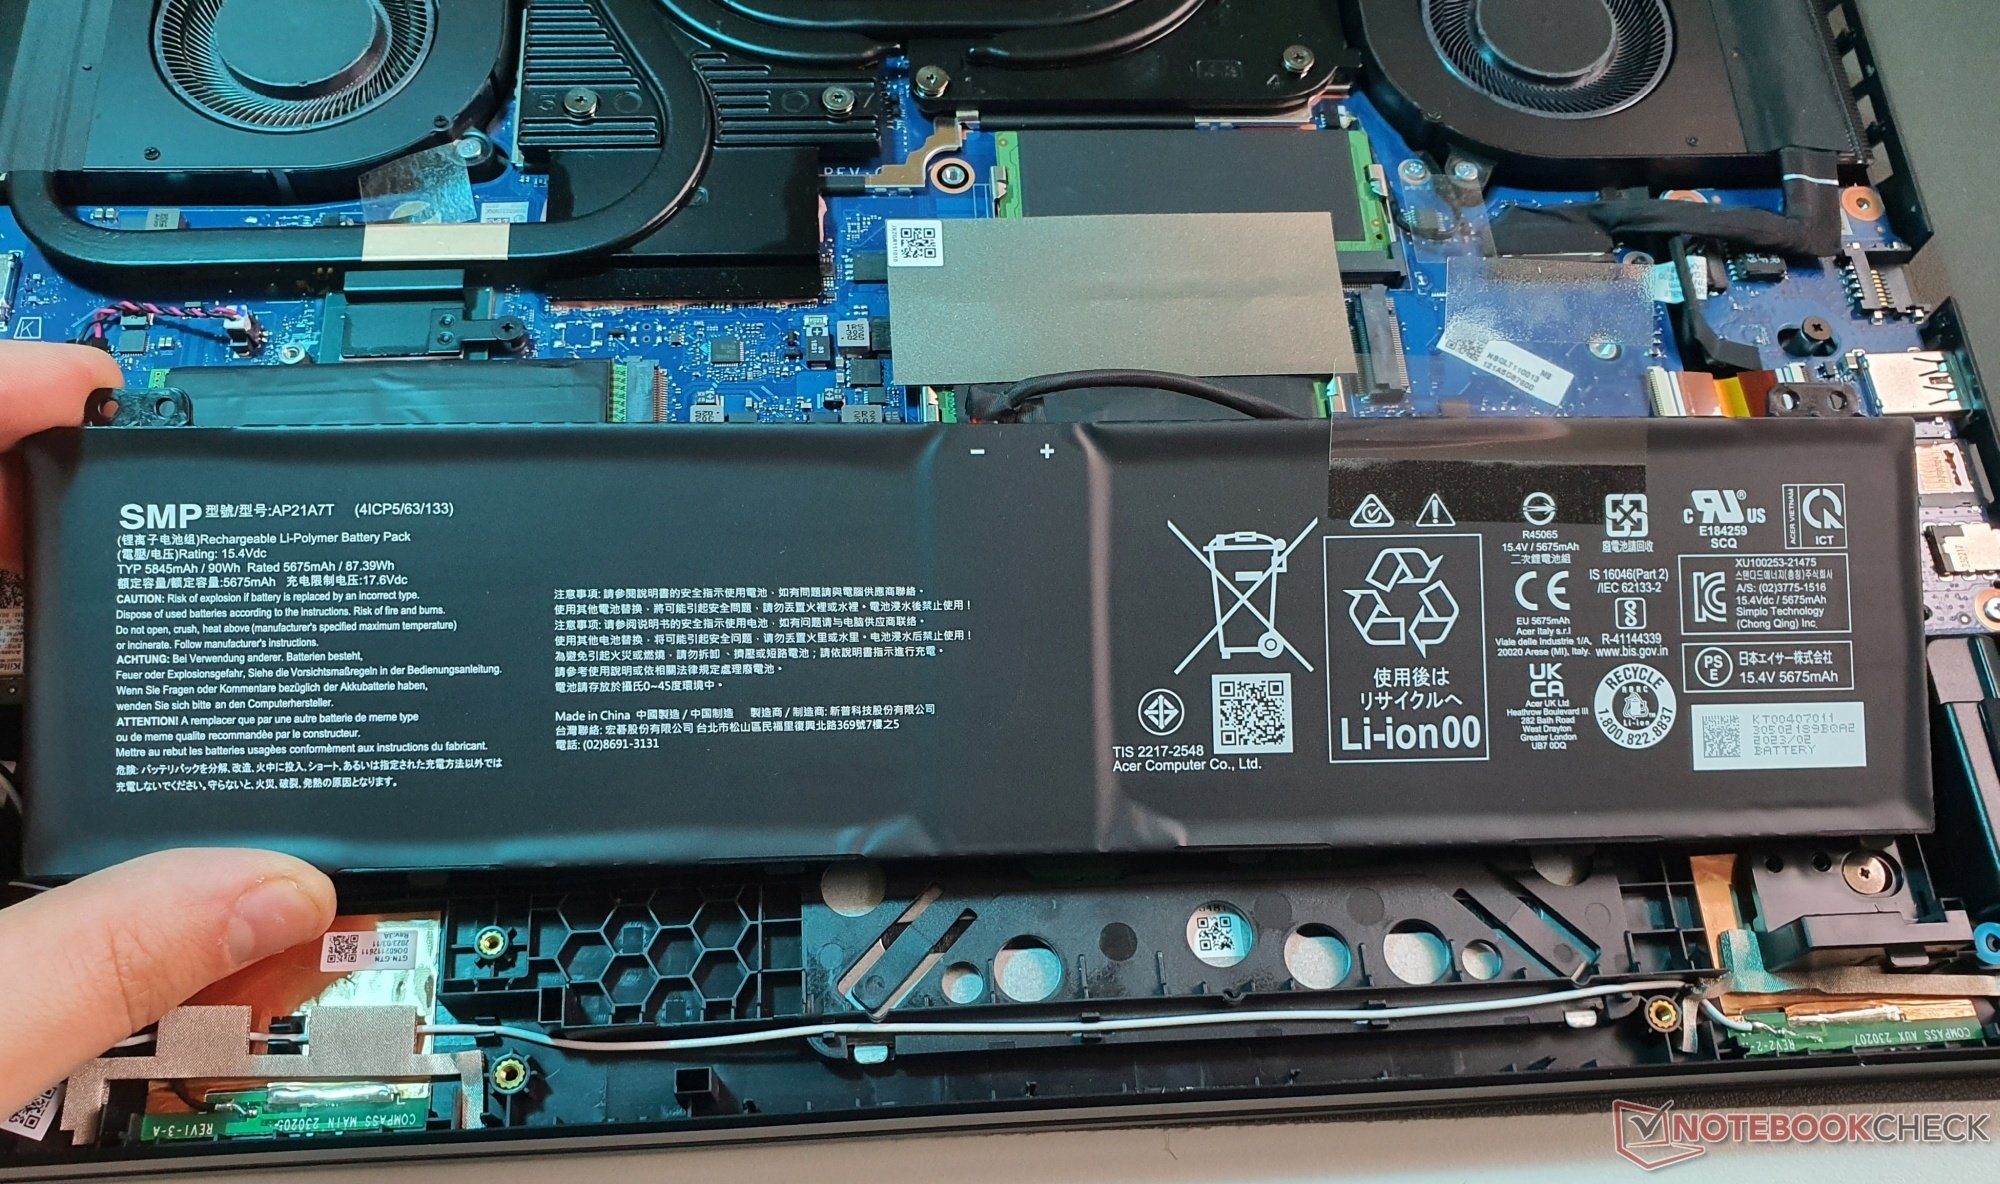
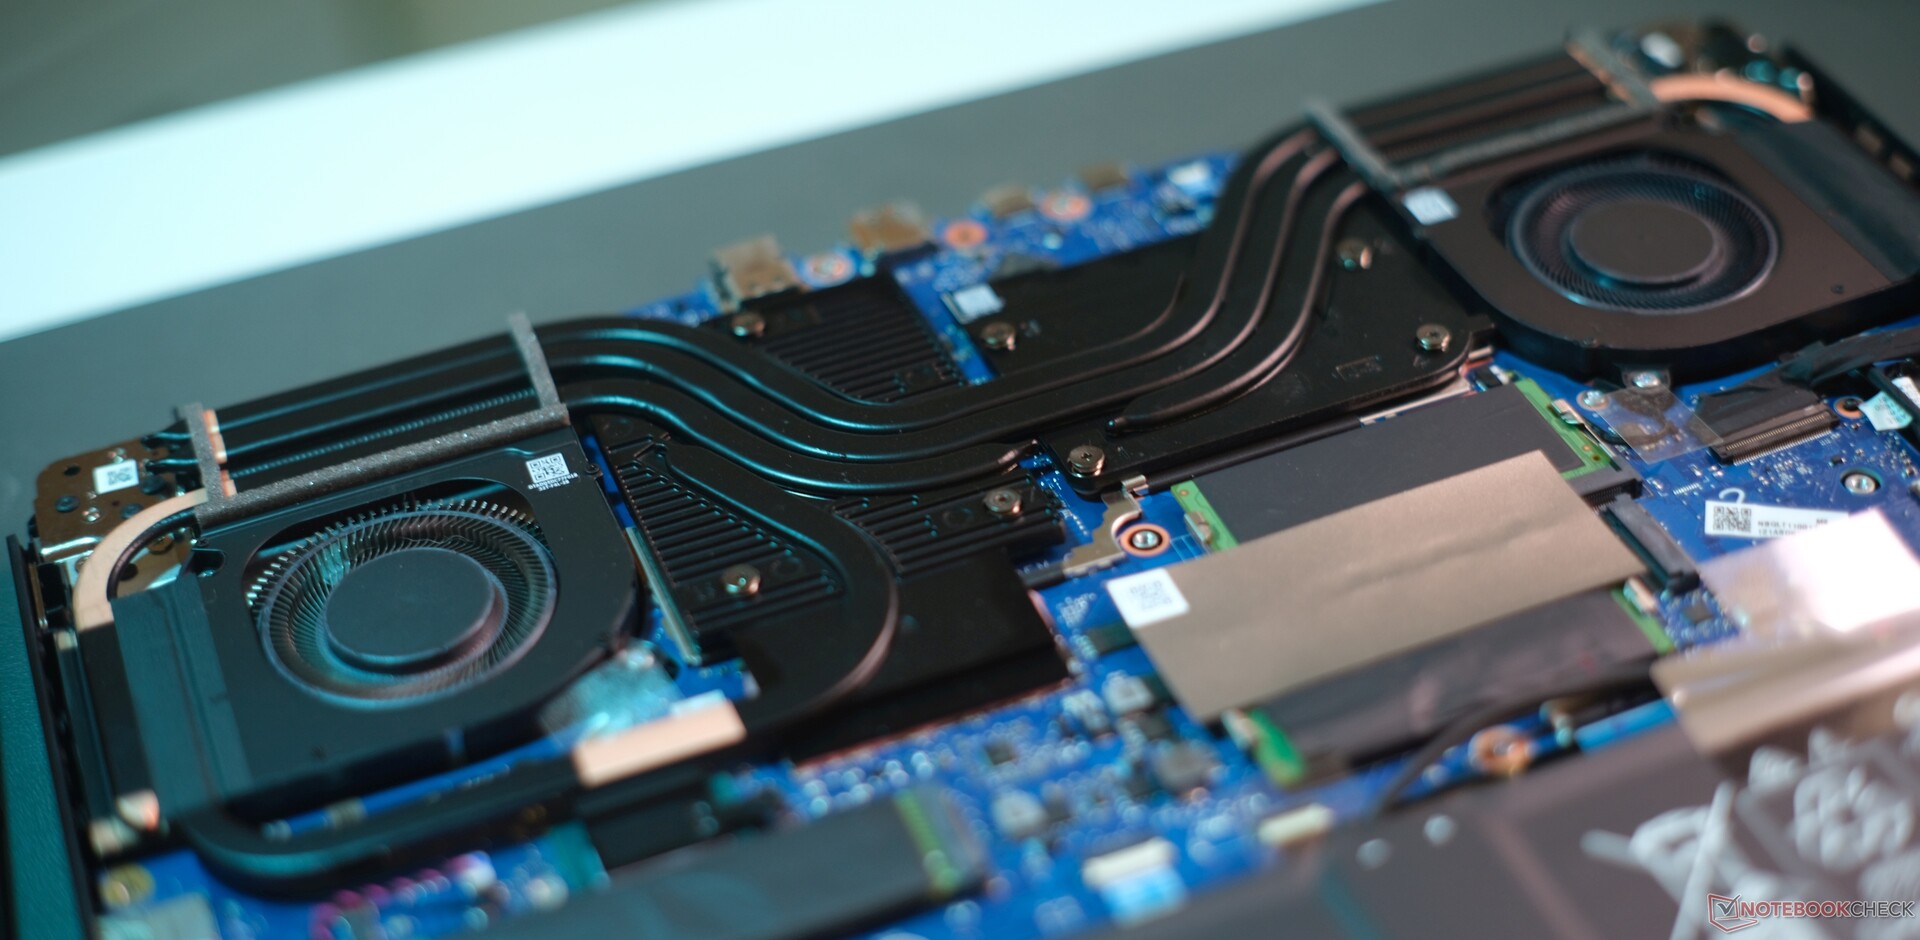
Manutenção
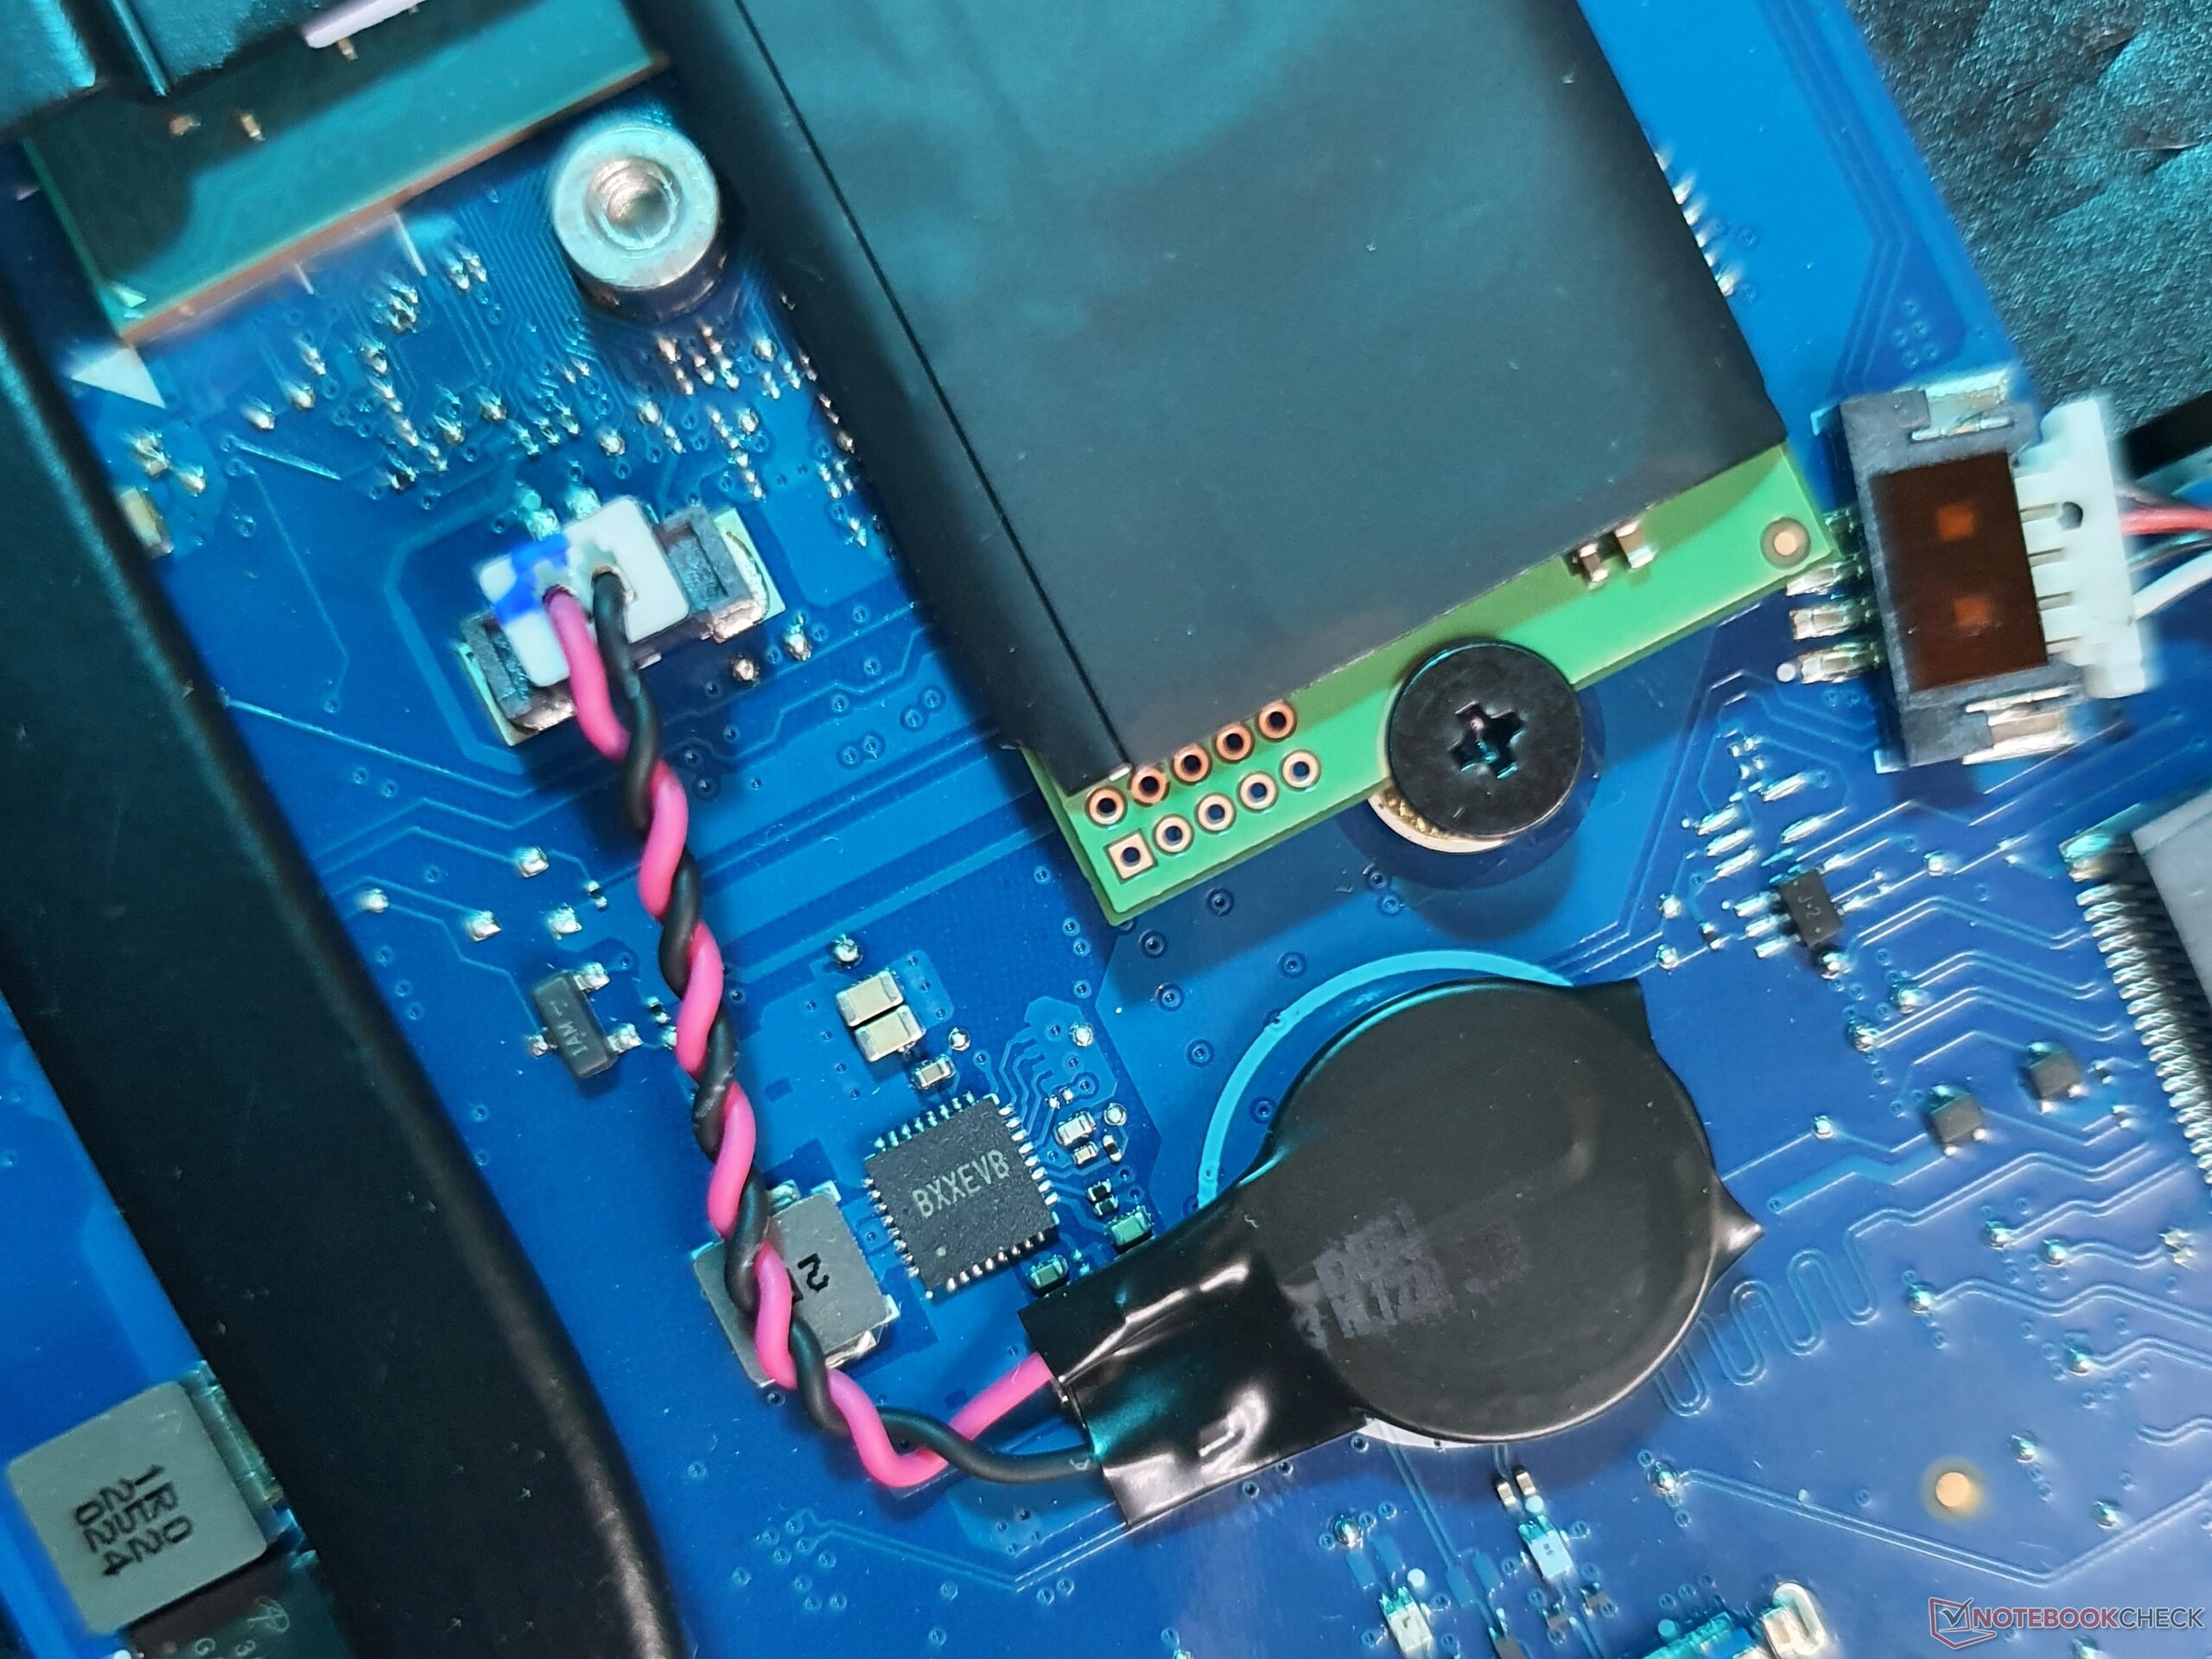
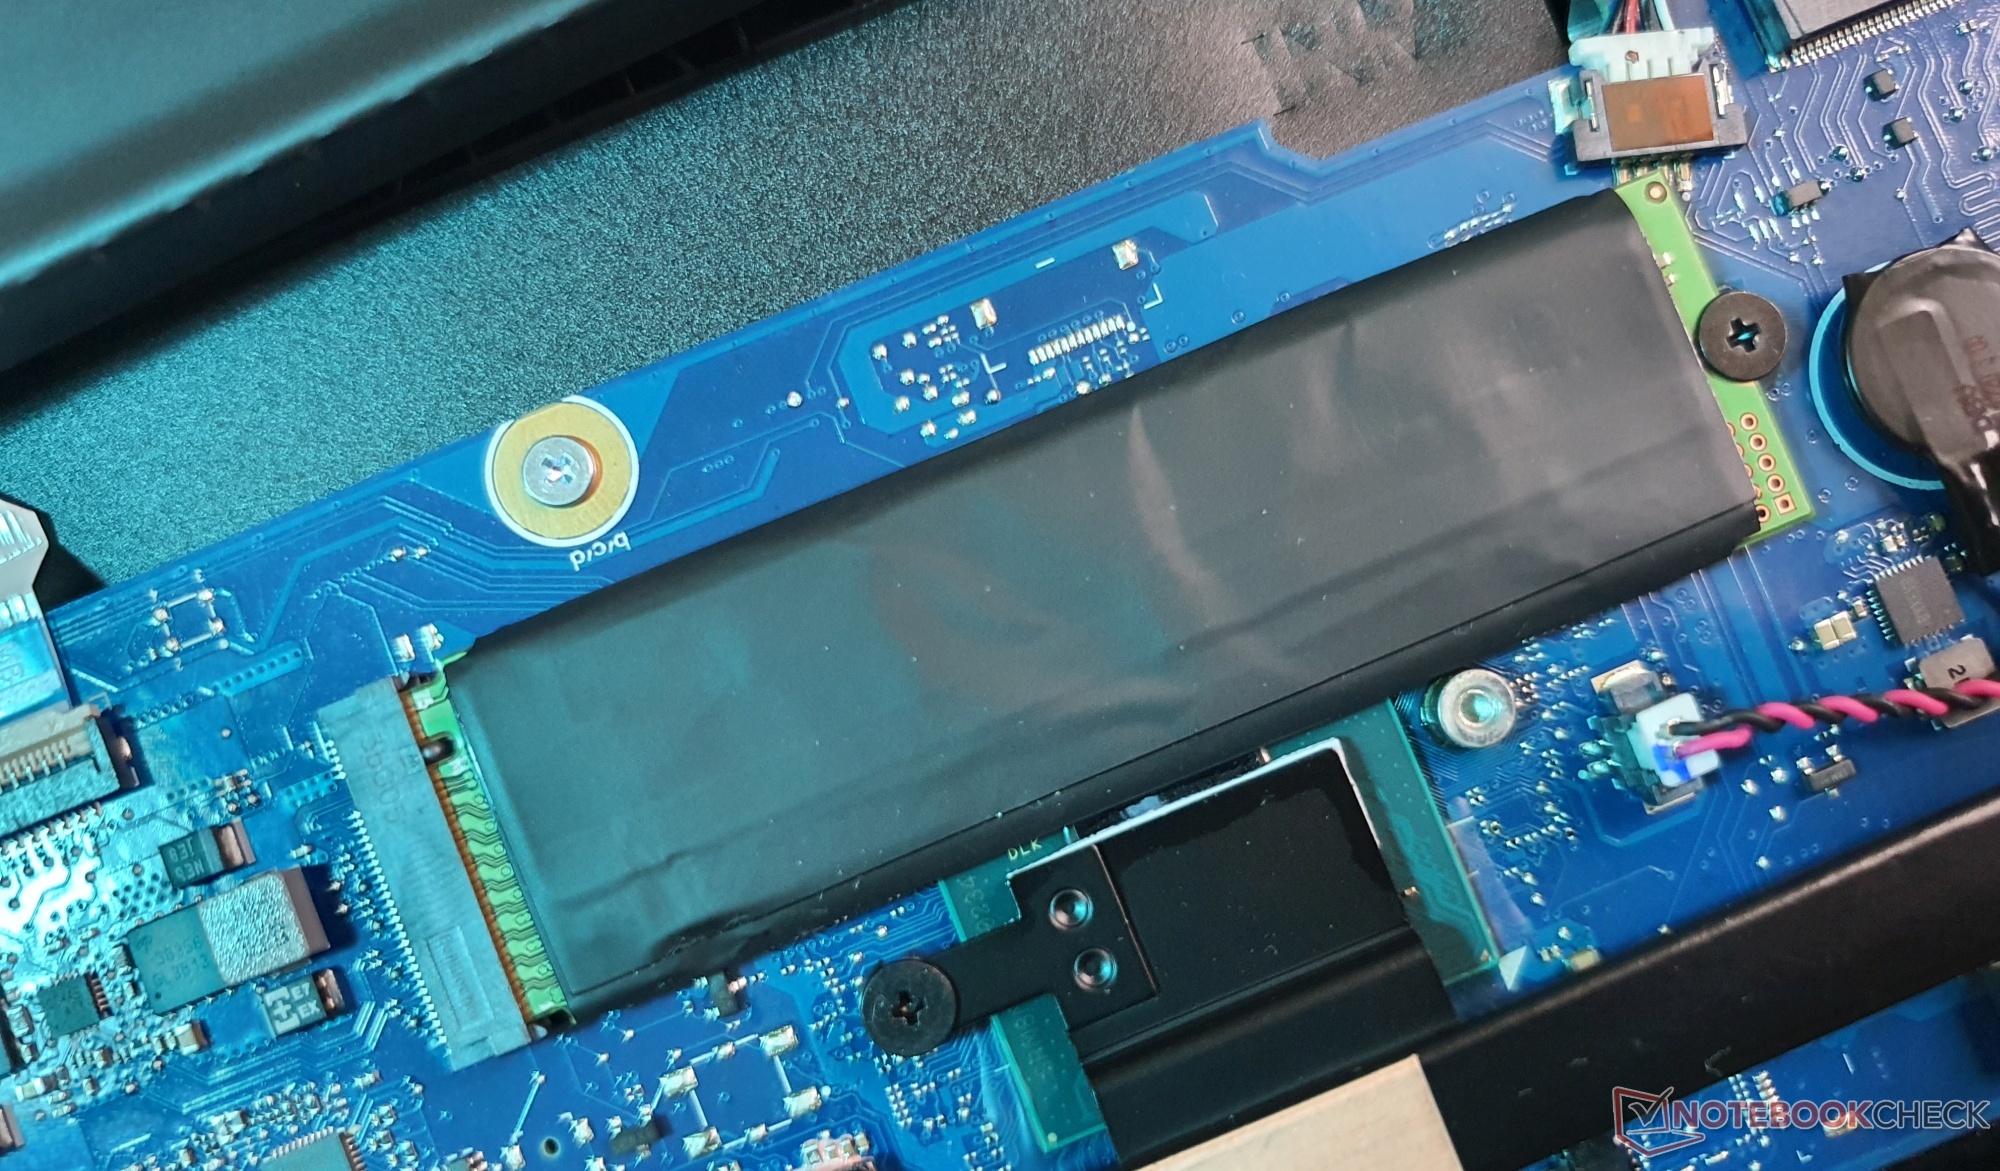
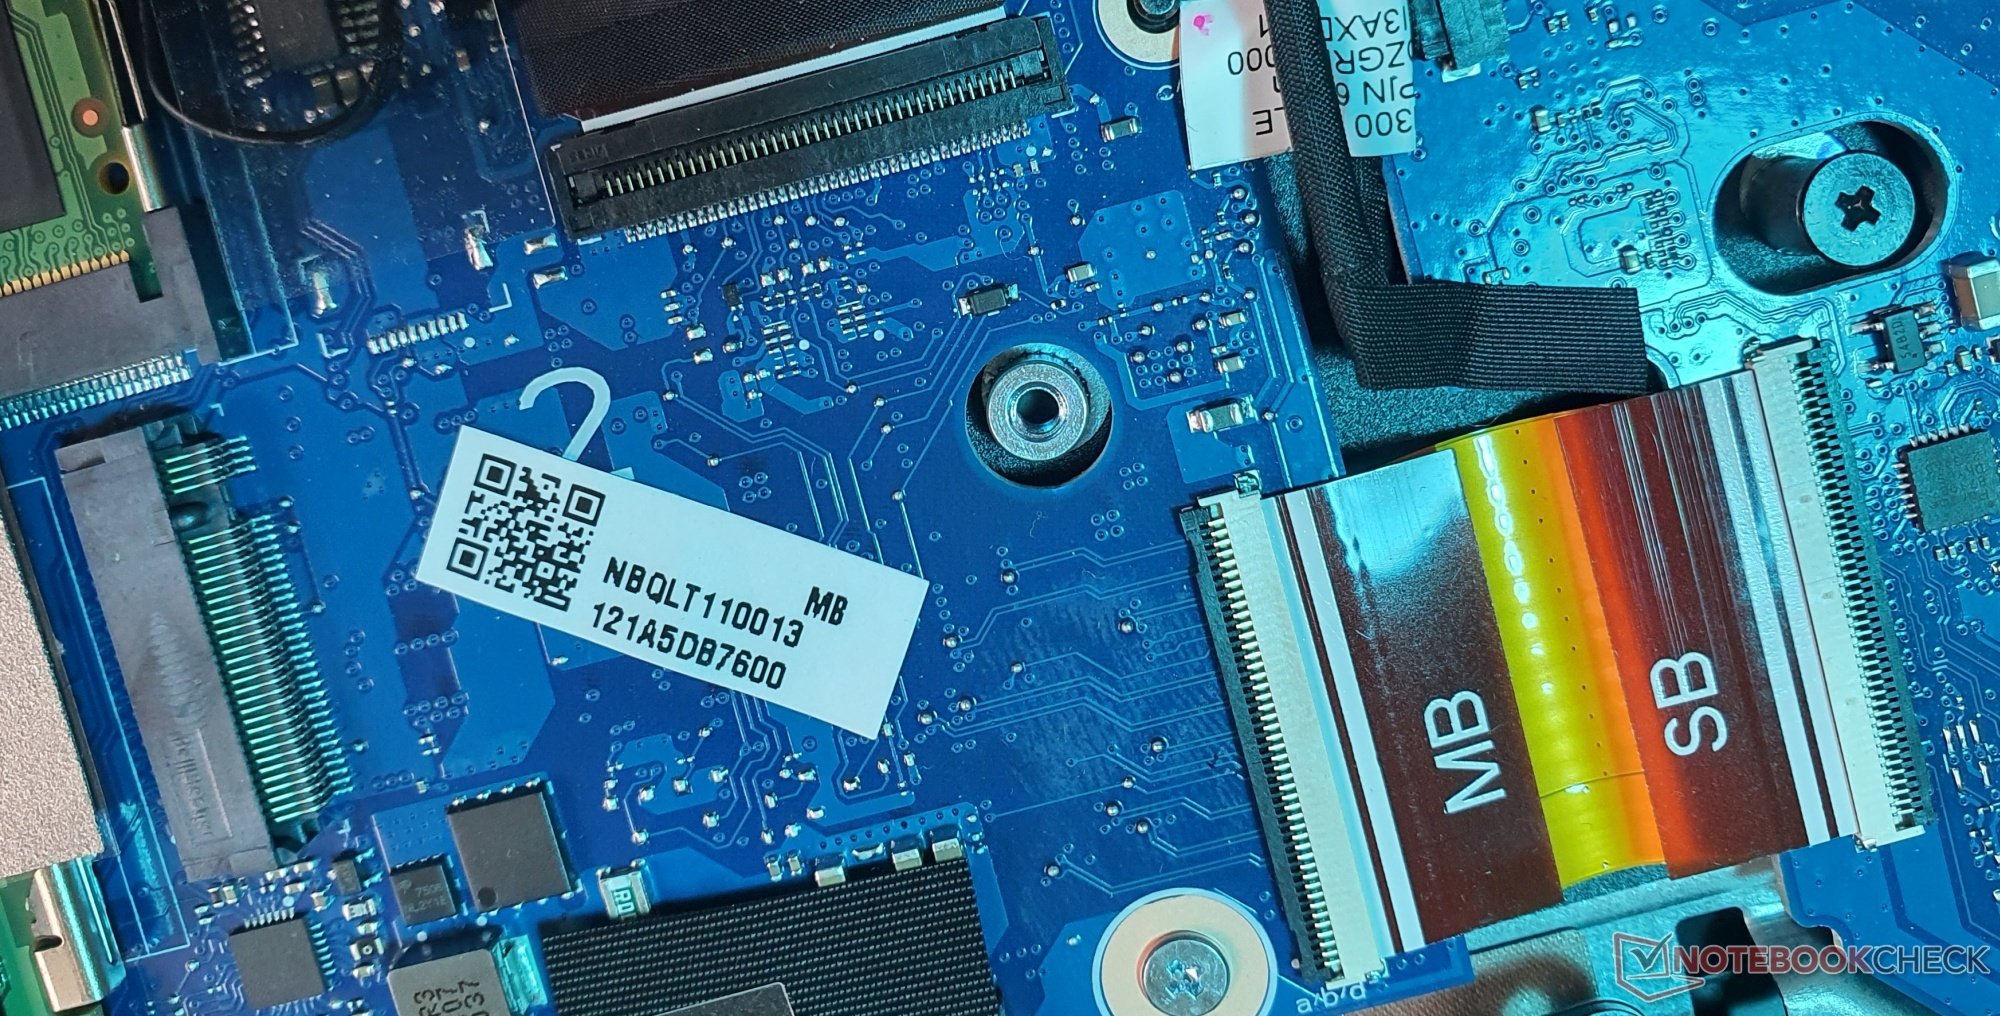
Depois de remover onze parafusos Phillips, o senhor pode acessar facilmente o interior do gabinete. Há dois bancos de memória e dois slots M.2-2280, que também suportam SSDs instalados em ambos os lados. O chip WiFi e a bateria do BIOS também podem ser substituídos. A bateria é mantida no lugar pelos parafusos do gabinete e pelo invólucro inferior, de modo que inicialmente parece que está solta no gabinete.
Garantia
A Acer oferece ao laptop uma garantia limitada de um ano, com planos de serviço estendidos disponíveis no site Acer Care Plus.
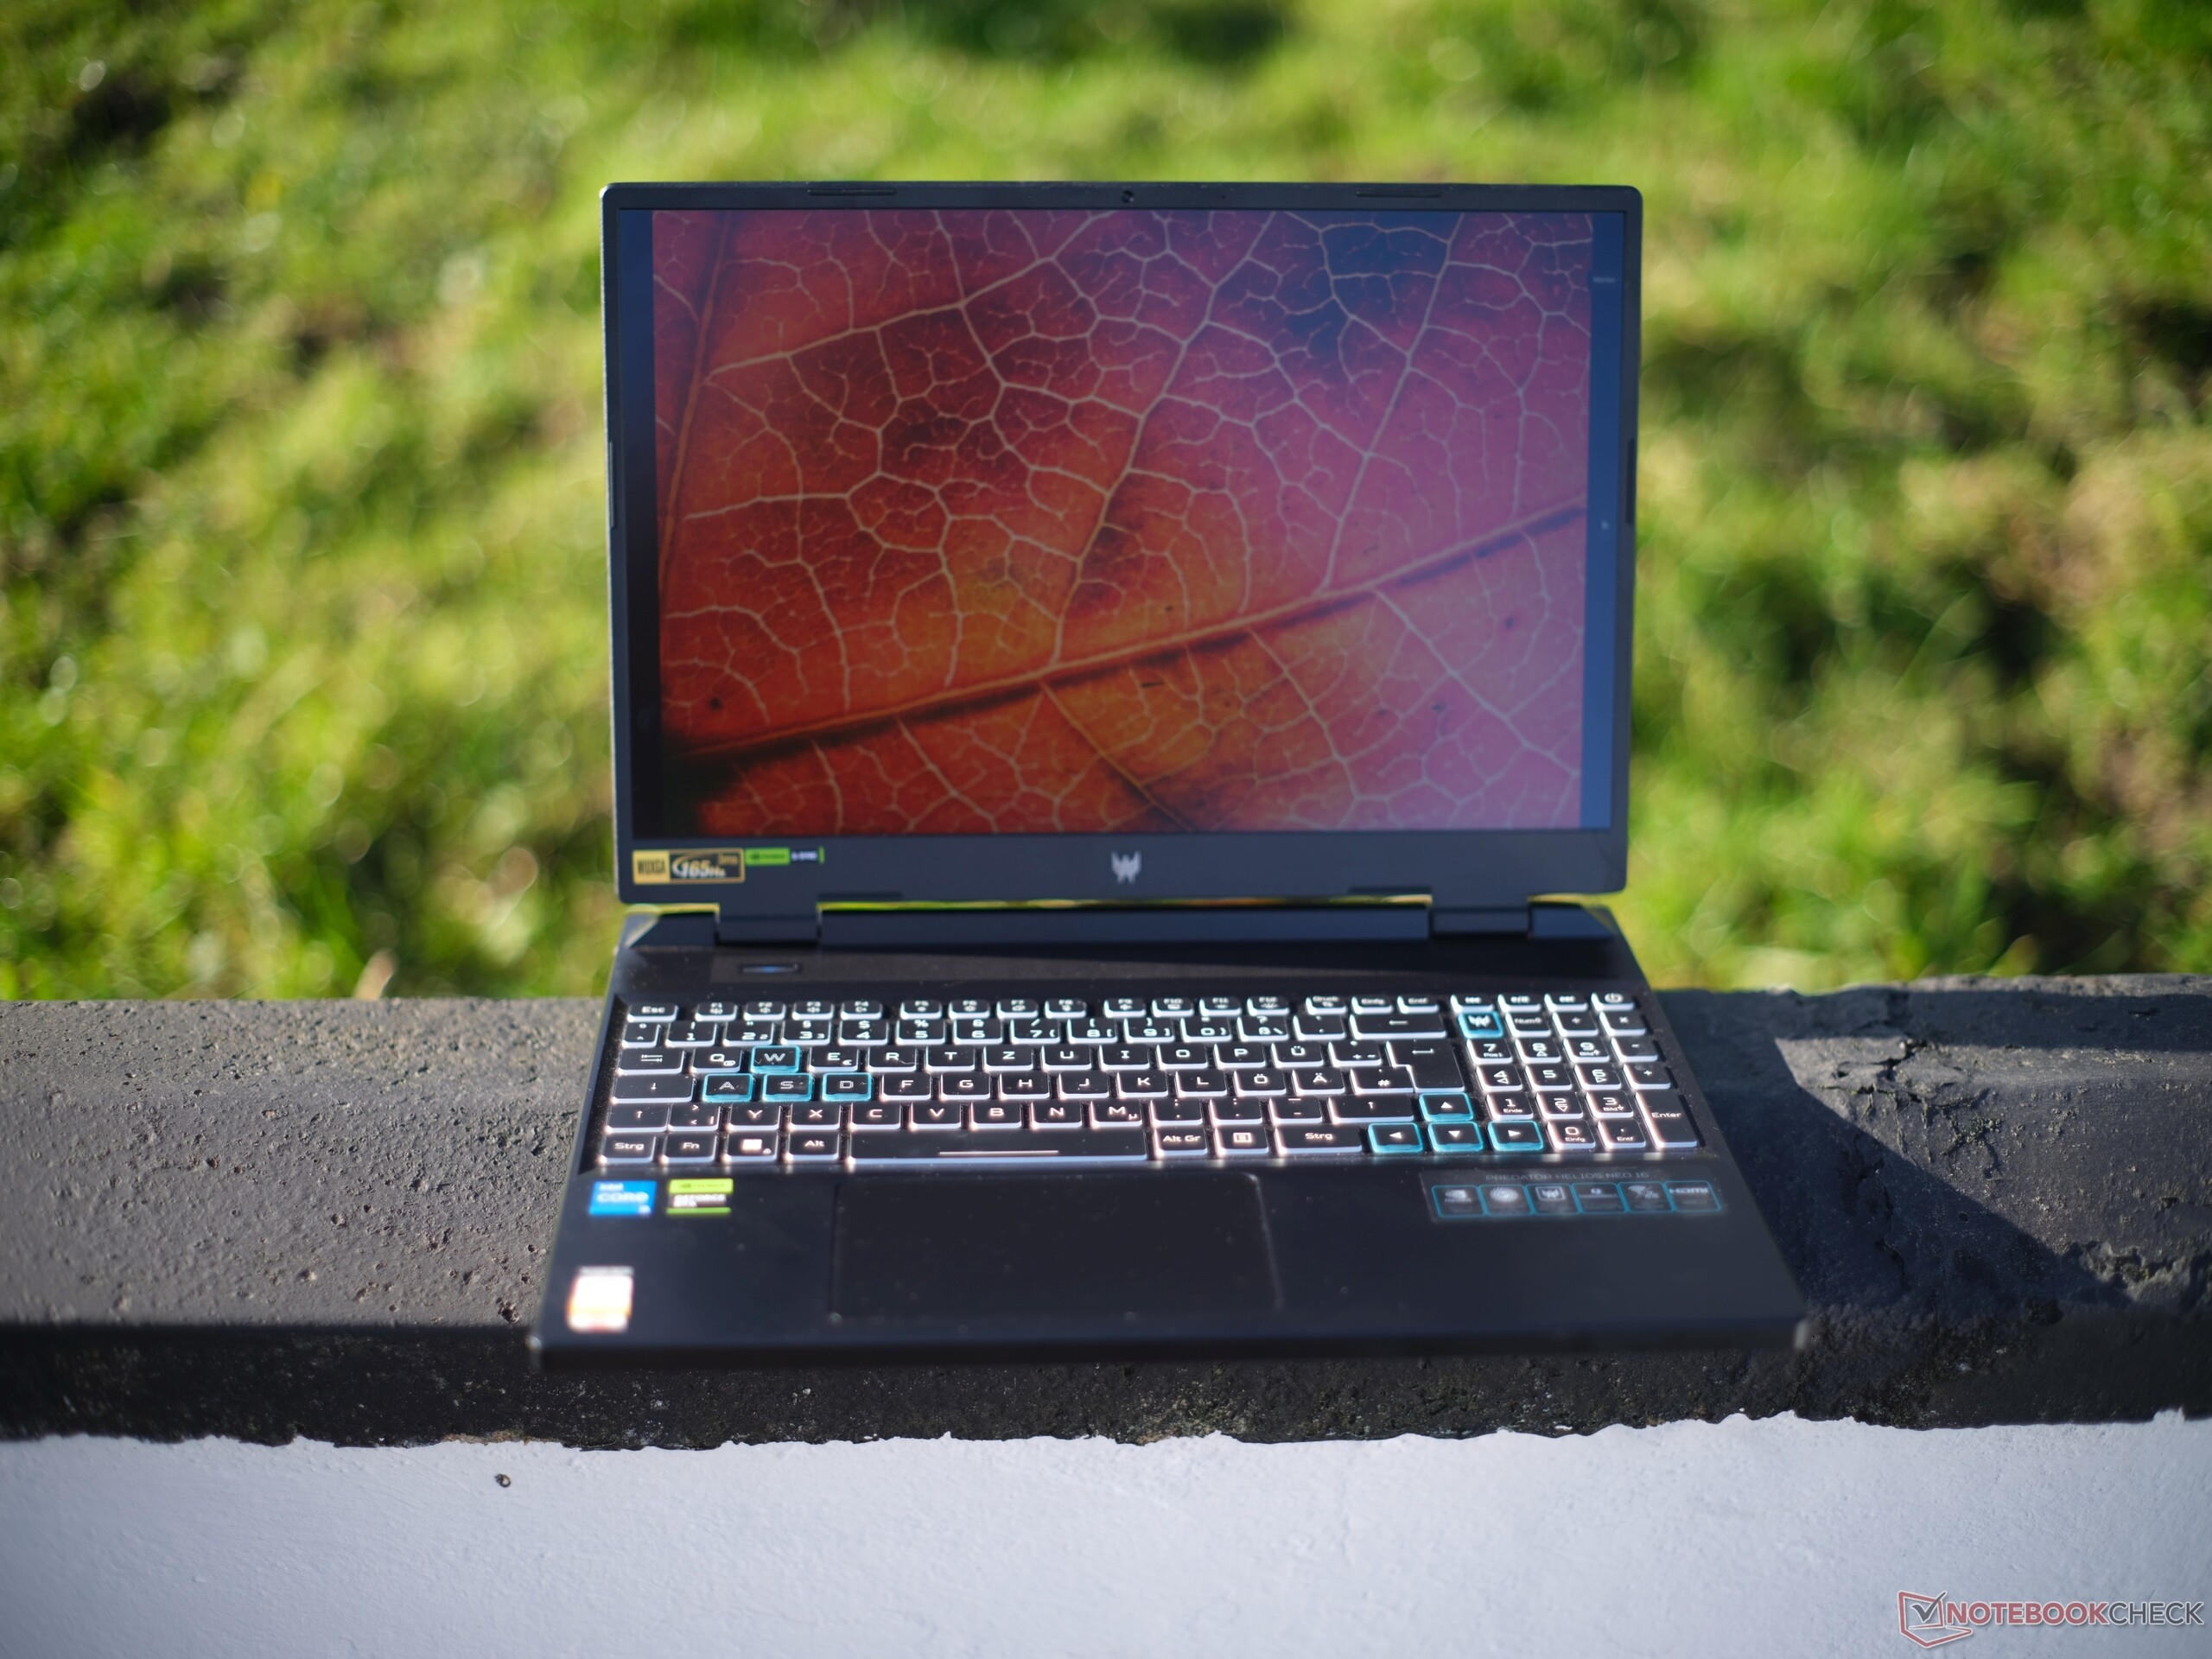
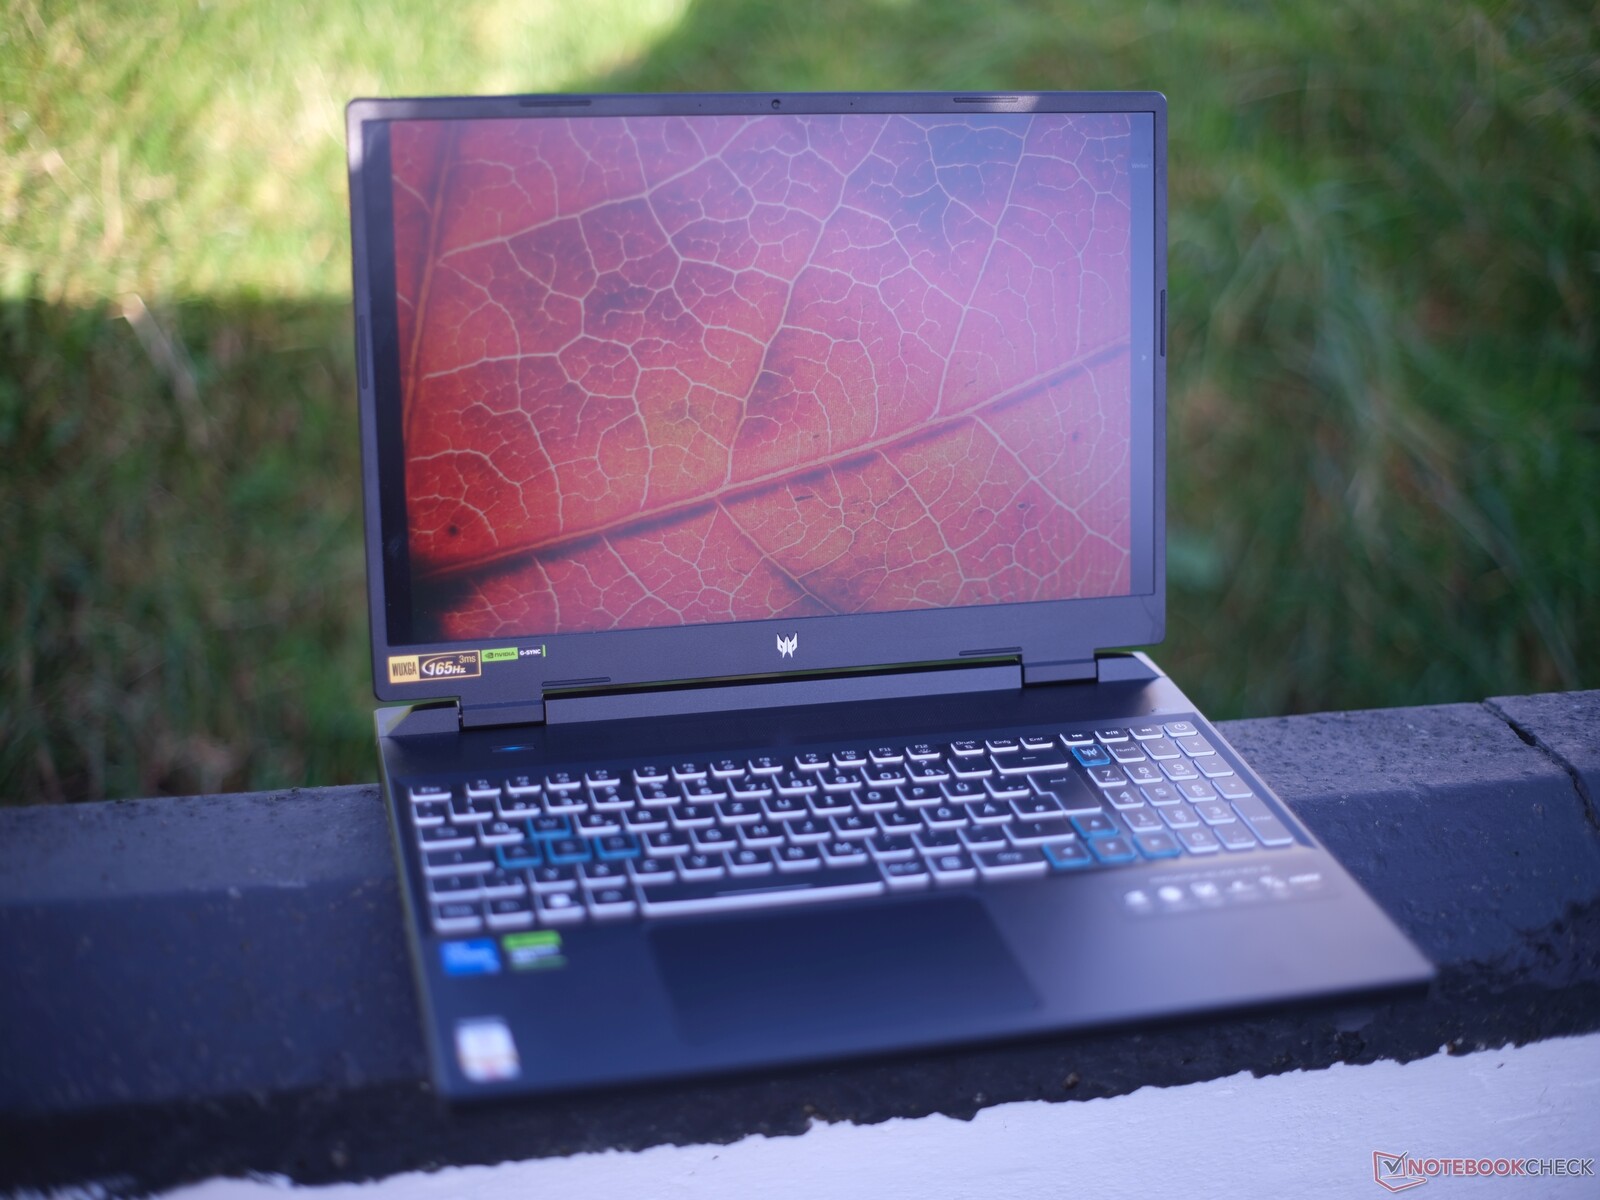
Input devices: Solid standard features with four-zone RGB lighting
Teclado
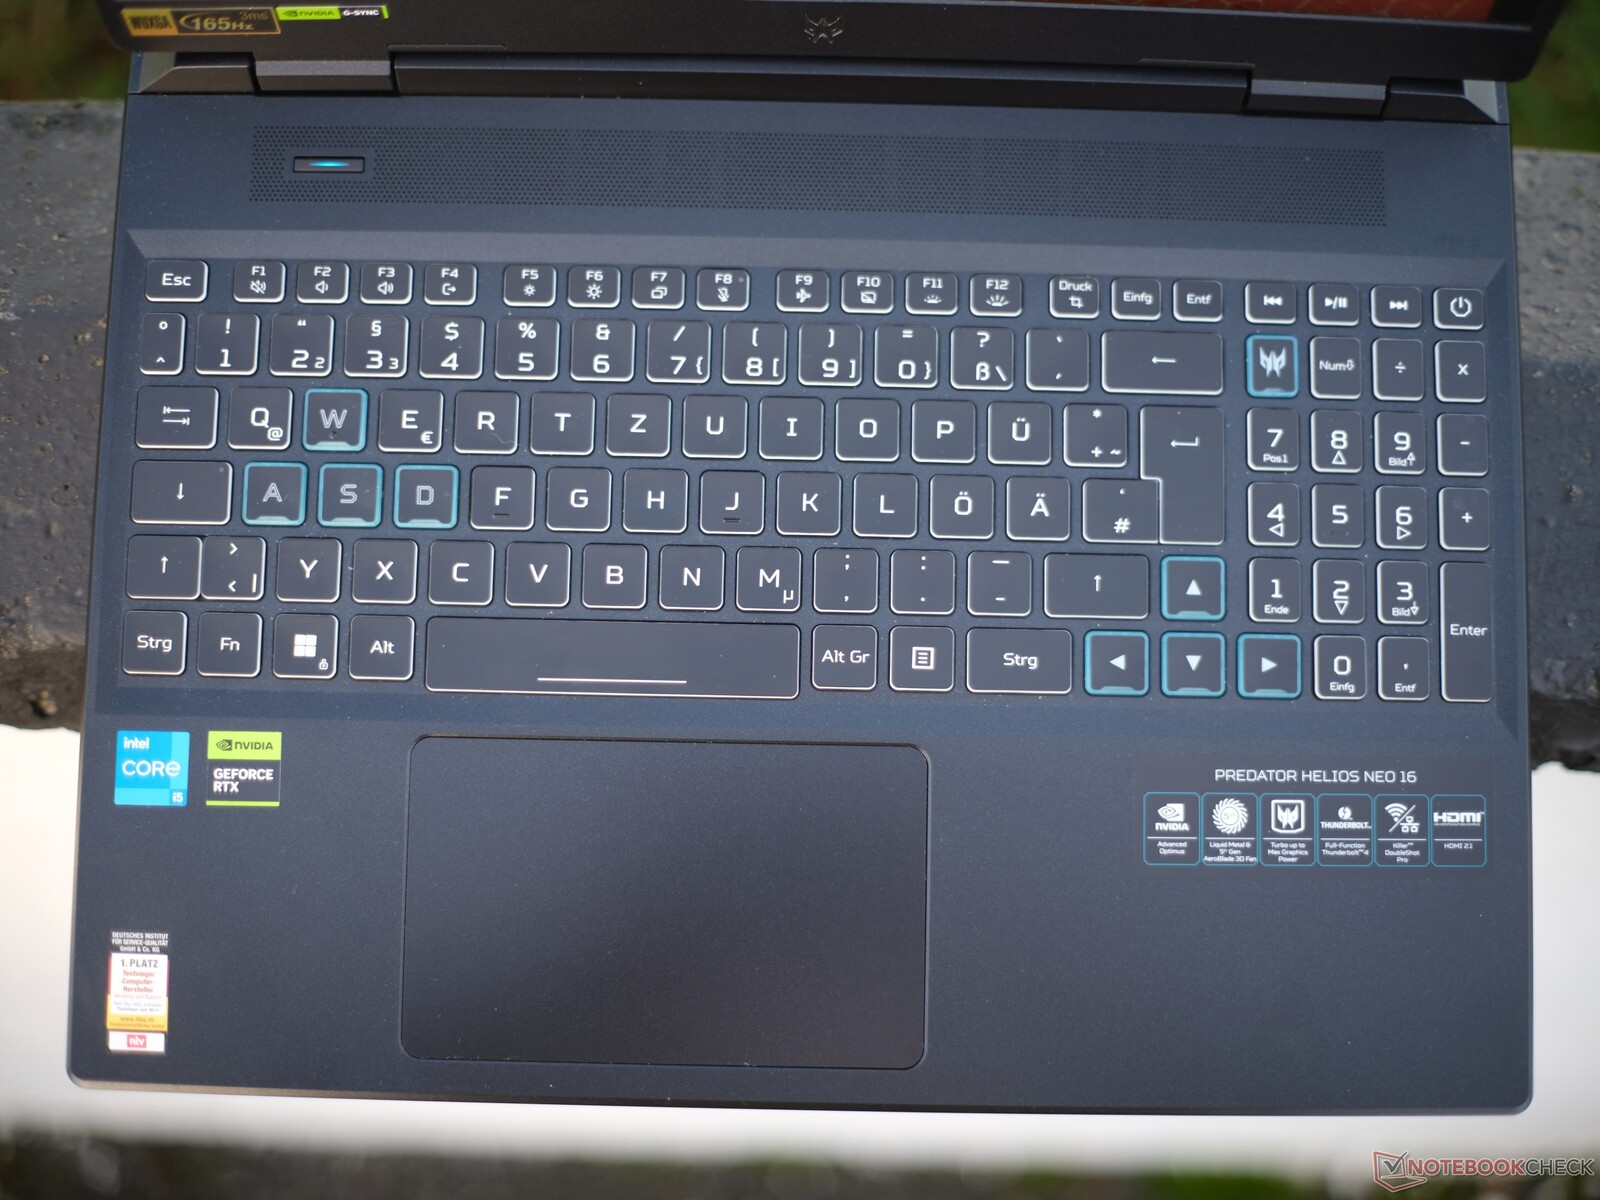
A Acer instalou um teclado chiclet de 6 linhas com teclas e espaçamento suficientemente grandes nesse dispositivo. Ele não tem quase nada em comum com o teclado do Helios 16, mas é semelhante, em termos de mecânica e aparência, aos teclados de muitos notebooks baratos para jogos, como oXMG Apex 15,Gigabyte G5ouLaptops para jogos Captiva Advanced. É exatamente o mesmo que no Acer Nitro 16.
A generosa elevação das teclas de 1,5 mm é acompanhada por um ponto de pressão claramente perceptível. No entanto, a resistência das teclas poderia ter sido um pouco mais clara. O teclado se deforma levemente durante a digitação (que, a propósito, é muito silenciosa), mas isso não é um problema no uso diário. O layout é realmente muito bom, mas a tecla shift direita é um pouco pequena demais devido ao fato de as teclas de seta serem de tamanho normal, enquanto a tecla shift esquerda é ainda menor.
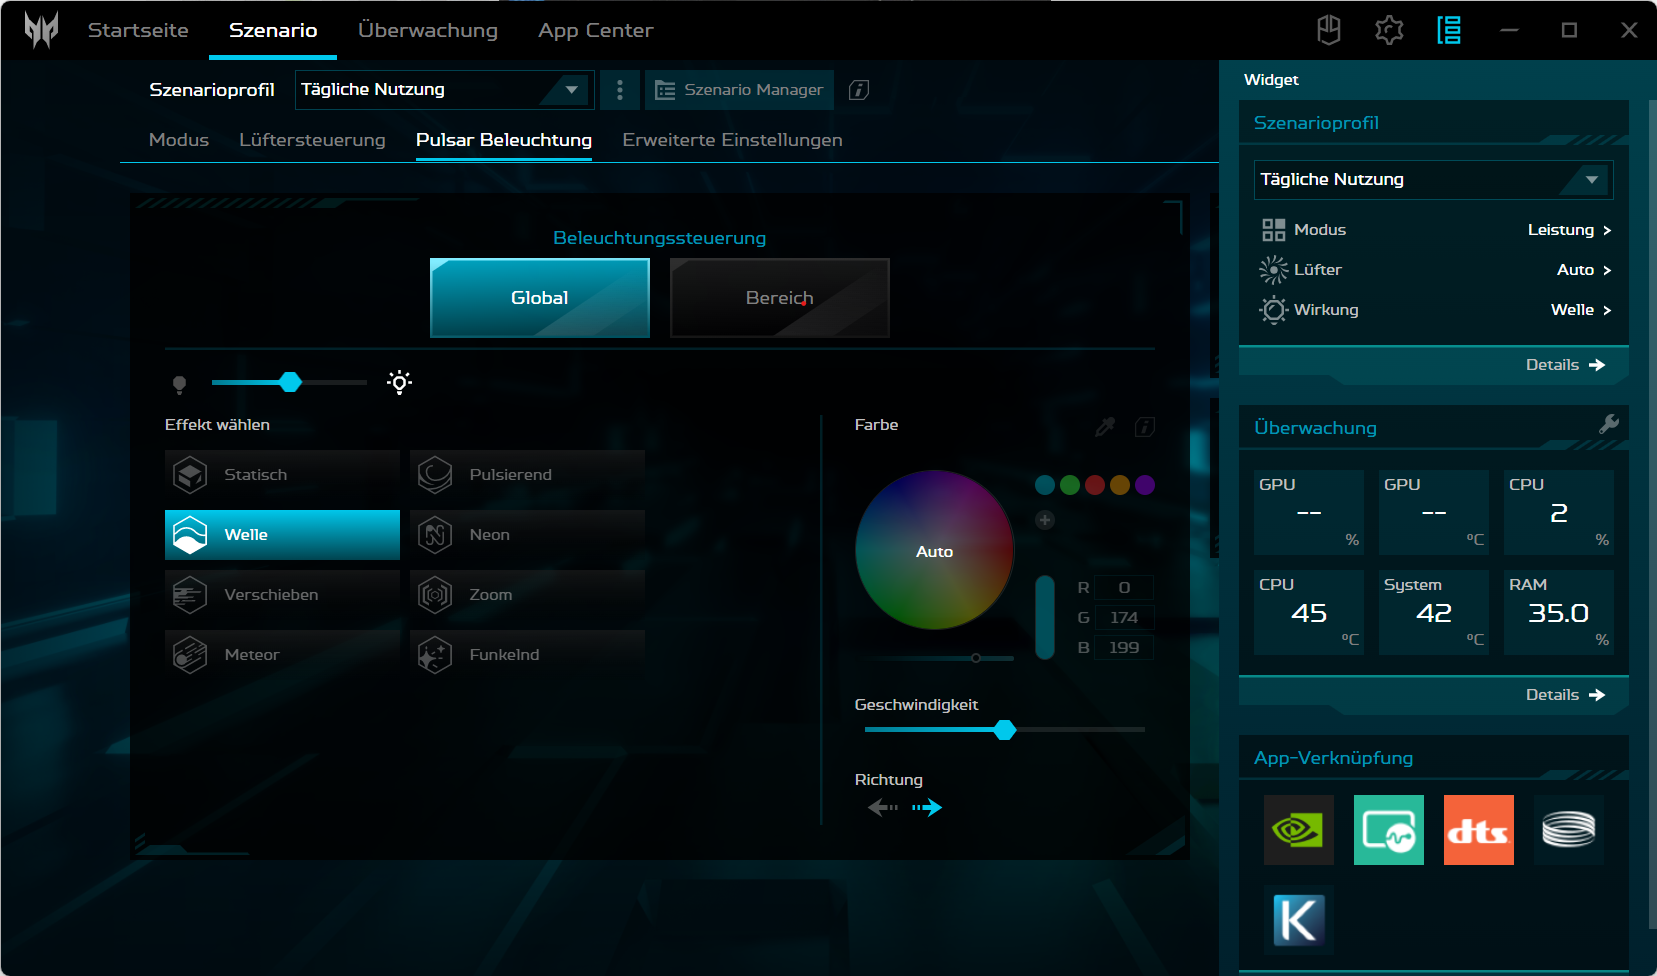
A Acer deu a esse teclado uma iluminação RGB de quatro zonas com quatro níveis de intensidade, enquanto a versão não Neo tem uma iluminação micro-LED particularmente uniforme. Enquanto o botão do logotipo no teclado numérico inicia o aplicativo Predator Sense, o botão permanentemente aceso no canto superior esquerdo é usado para alternar entre os modos de desempenho.
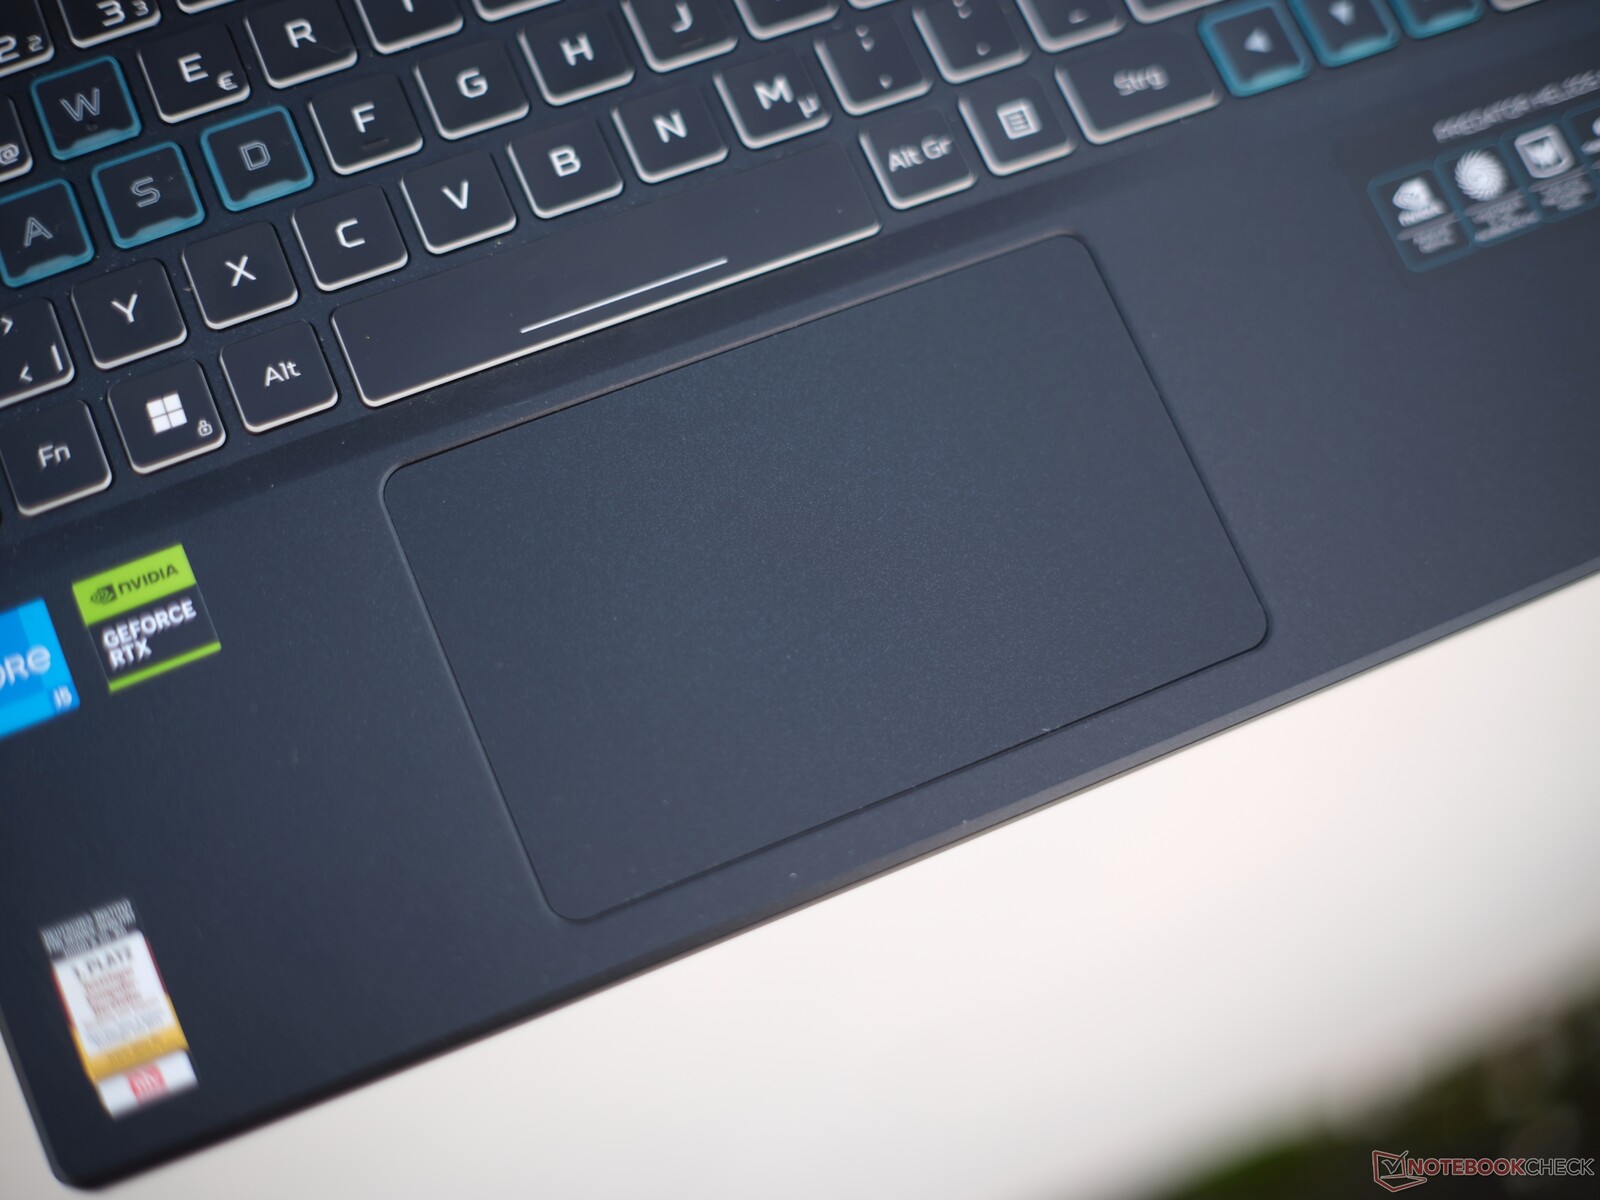
Touchpad
O touchpad de 12,6 x 8,3 mm funciona com muita precisão e é agradável e suave, embora seja feito de plástico e não de vidro como oHelios 16do Helios 16. É fácil rolar a tela e executar gestos multitoque. Os botões de clique integrados têm uma elevação curta e um clique satisfatório.
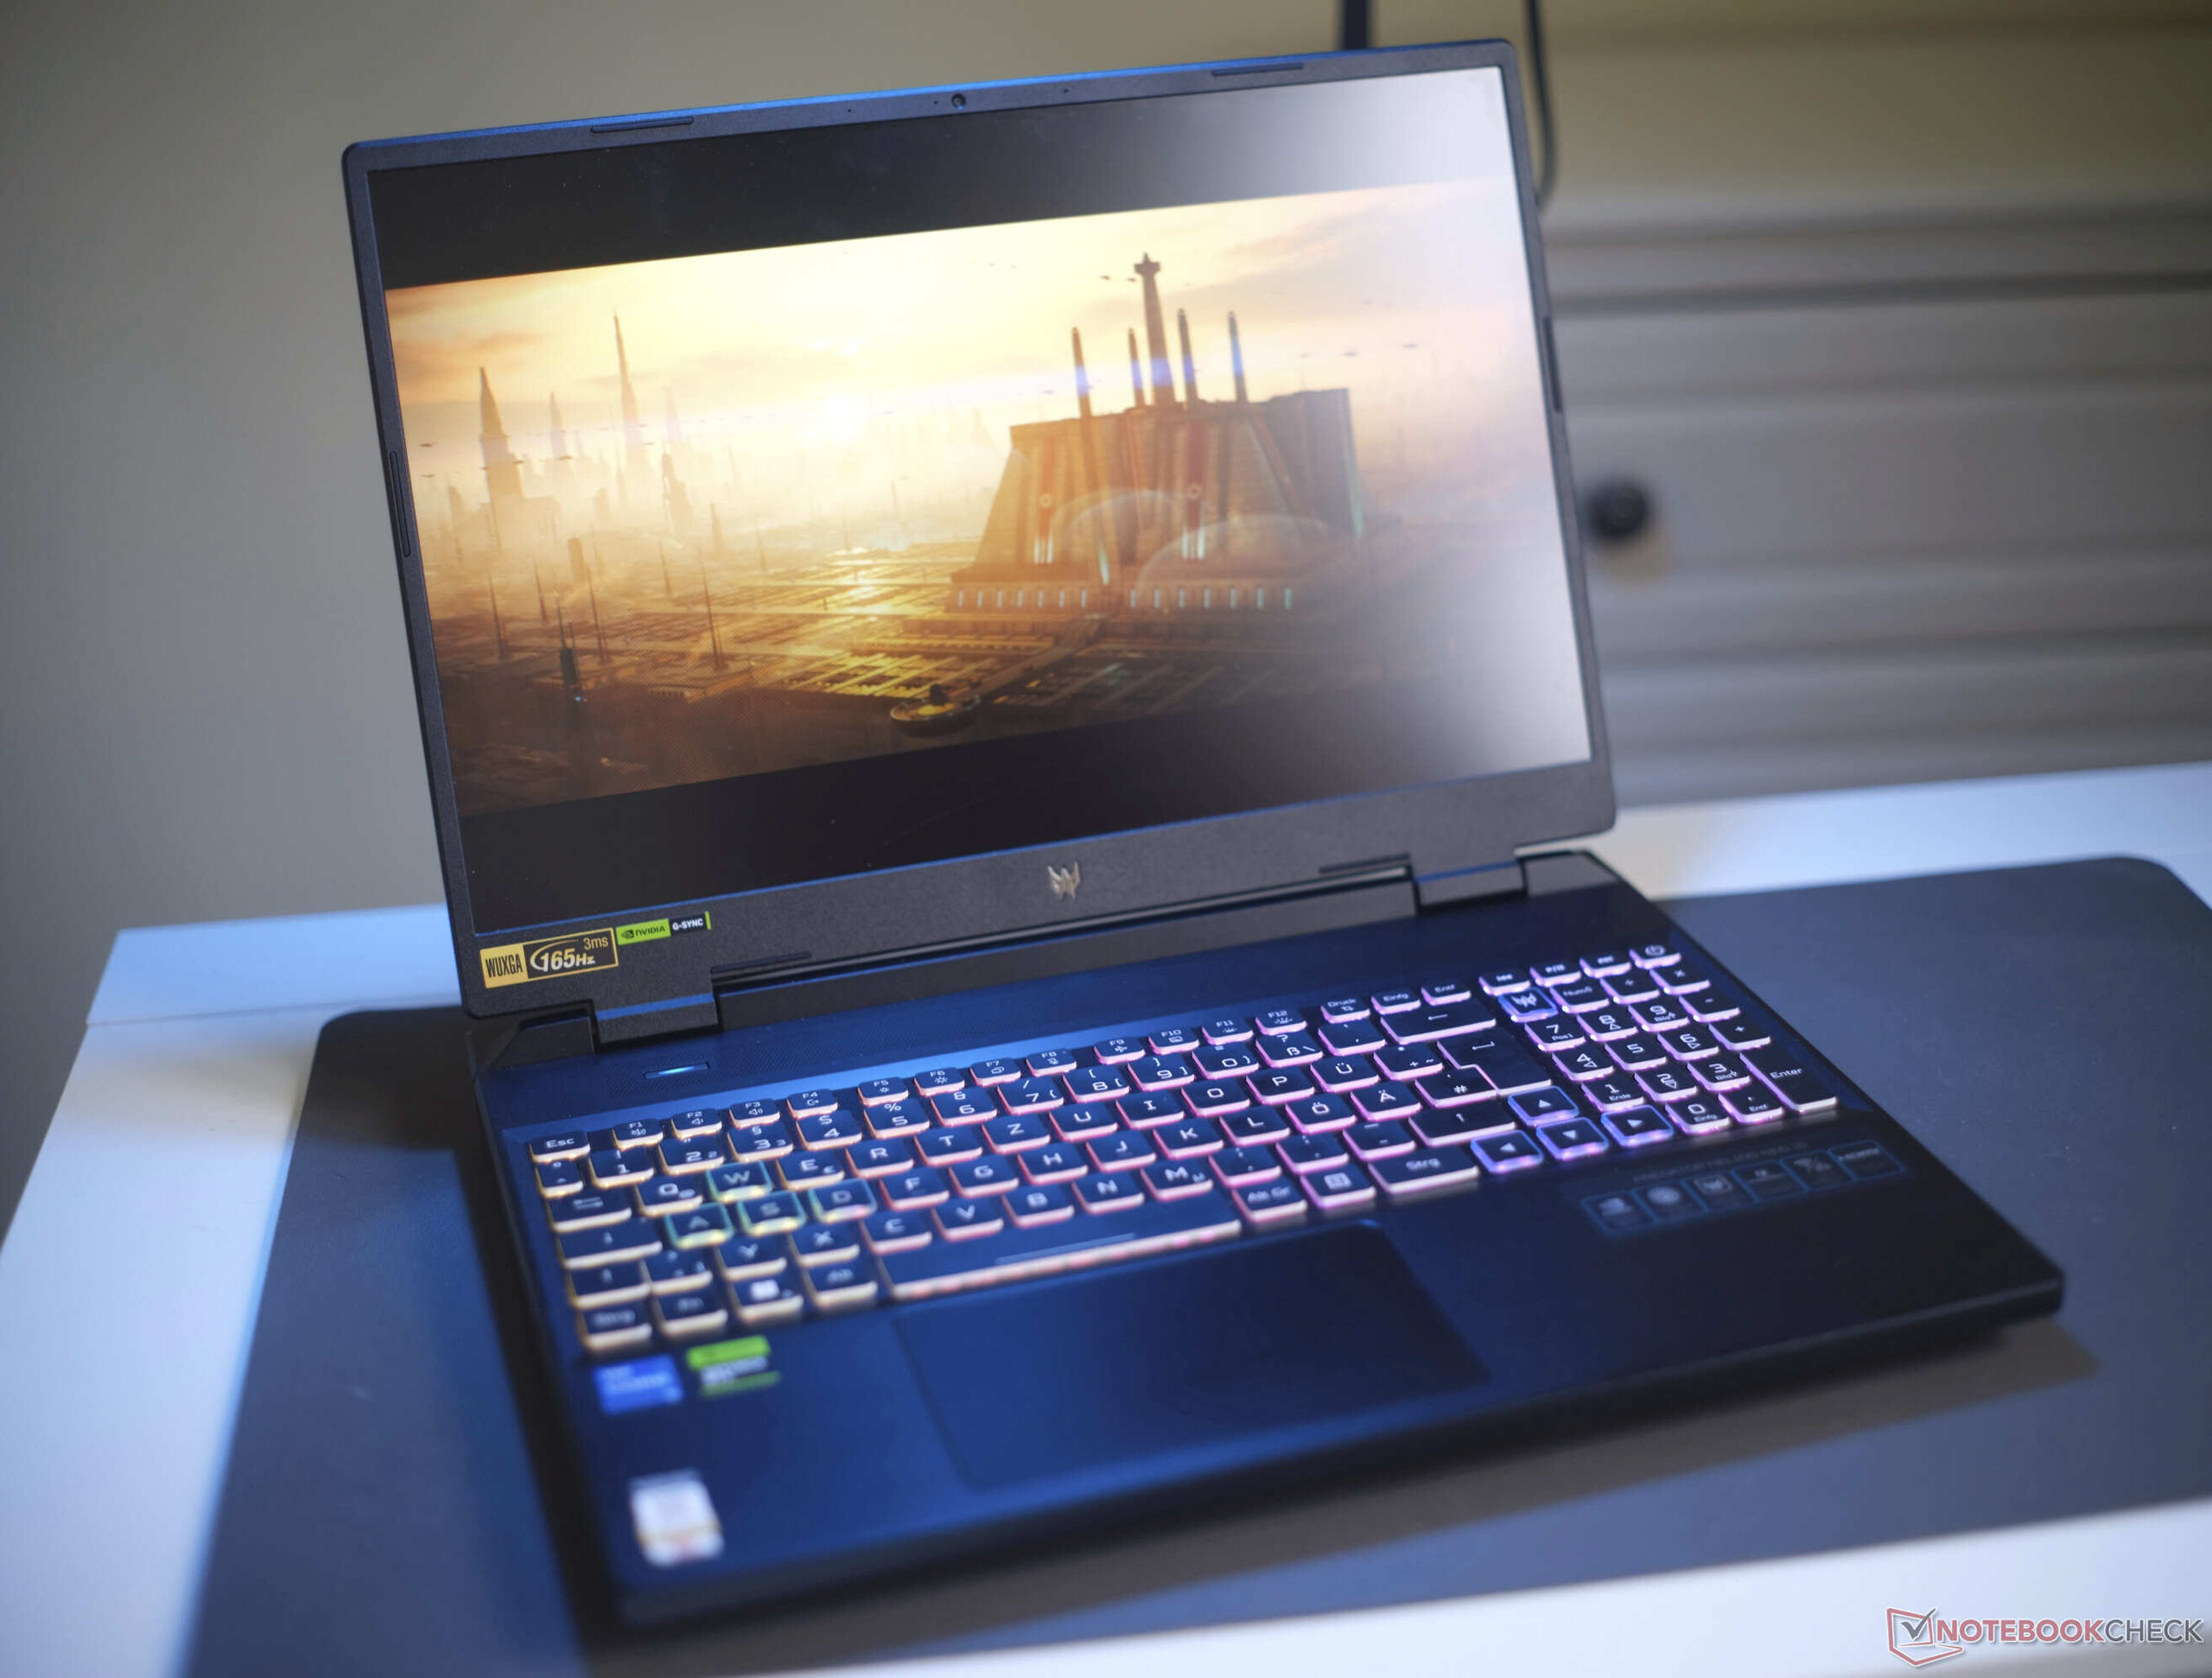
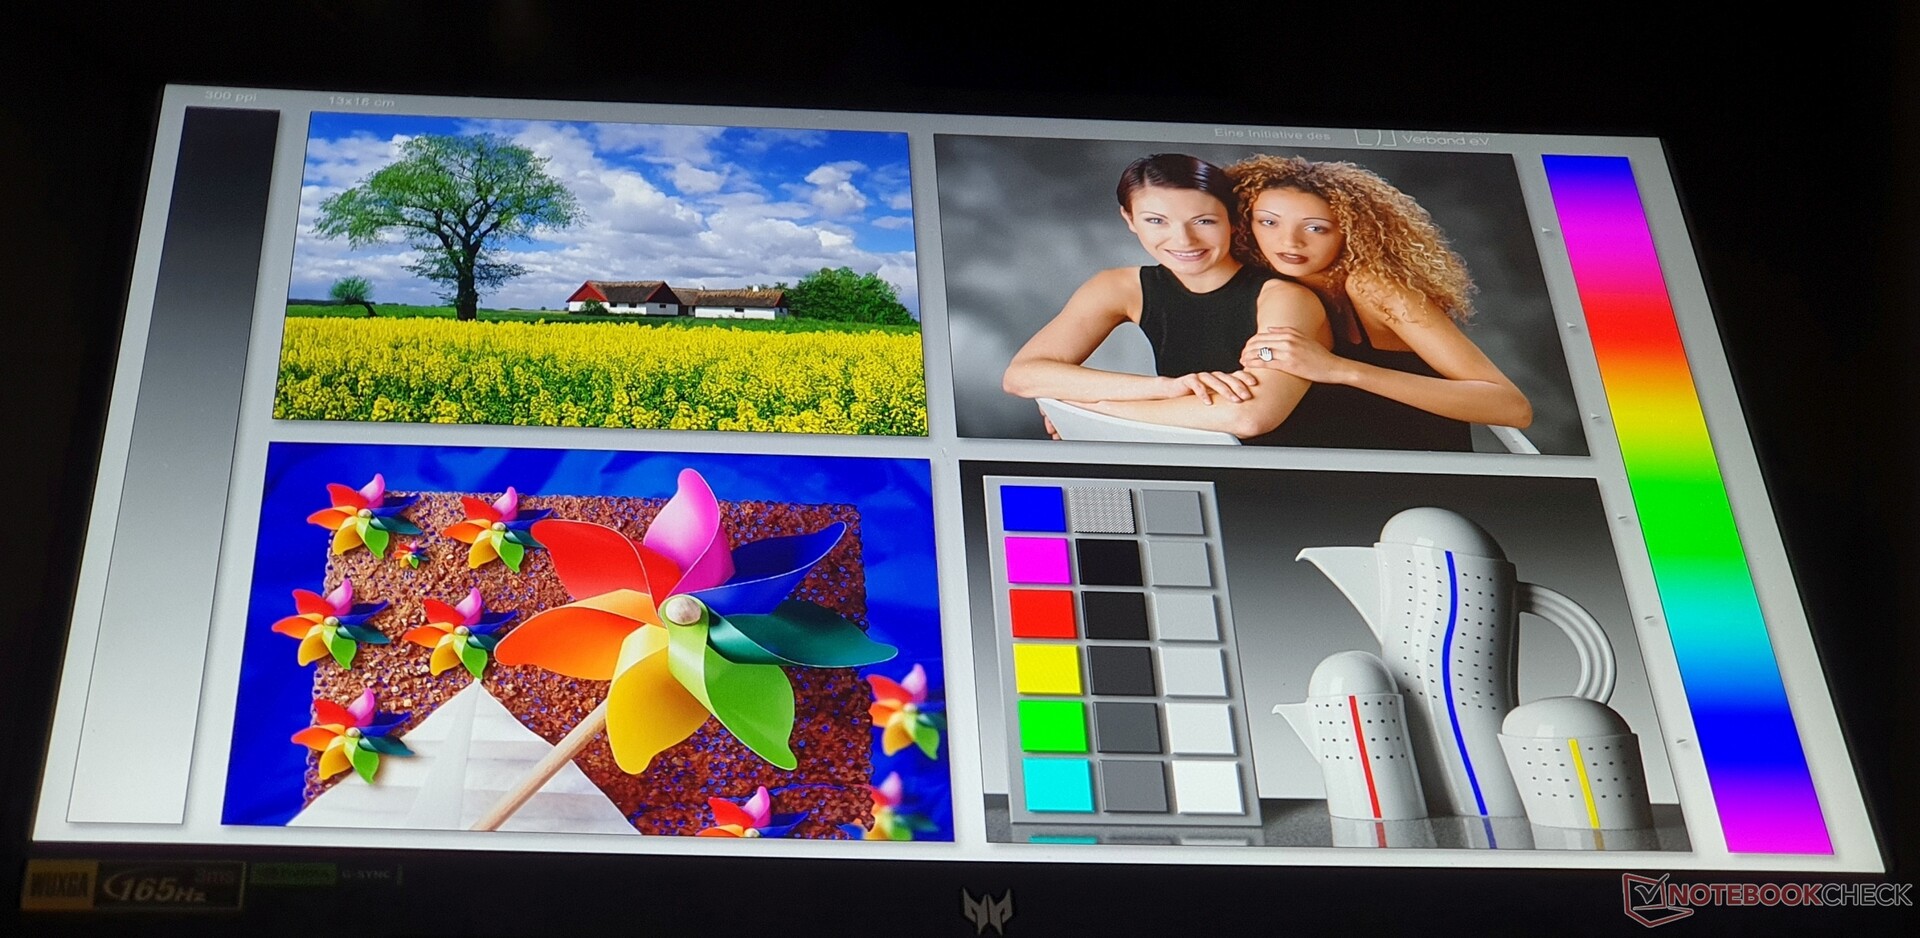
Tela: O Helios Neo 16 está bem equipado para jogos em Full HD
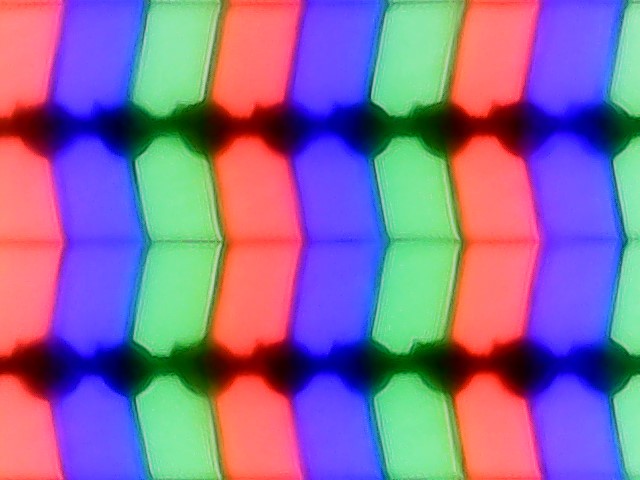
Nosso dispositivo de teste está equipado com uma tela IPS WUXGA fosca (FHD+) com uma proporção de 16:10, enquanto outras variantes oferecem uma opção QHD. Ambos os painéis têm uma taxa de atualização de 165 Hz.
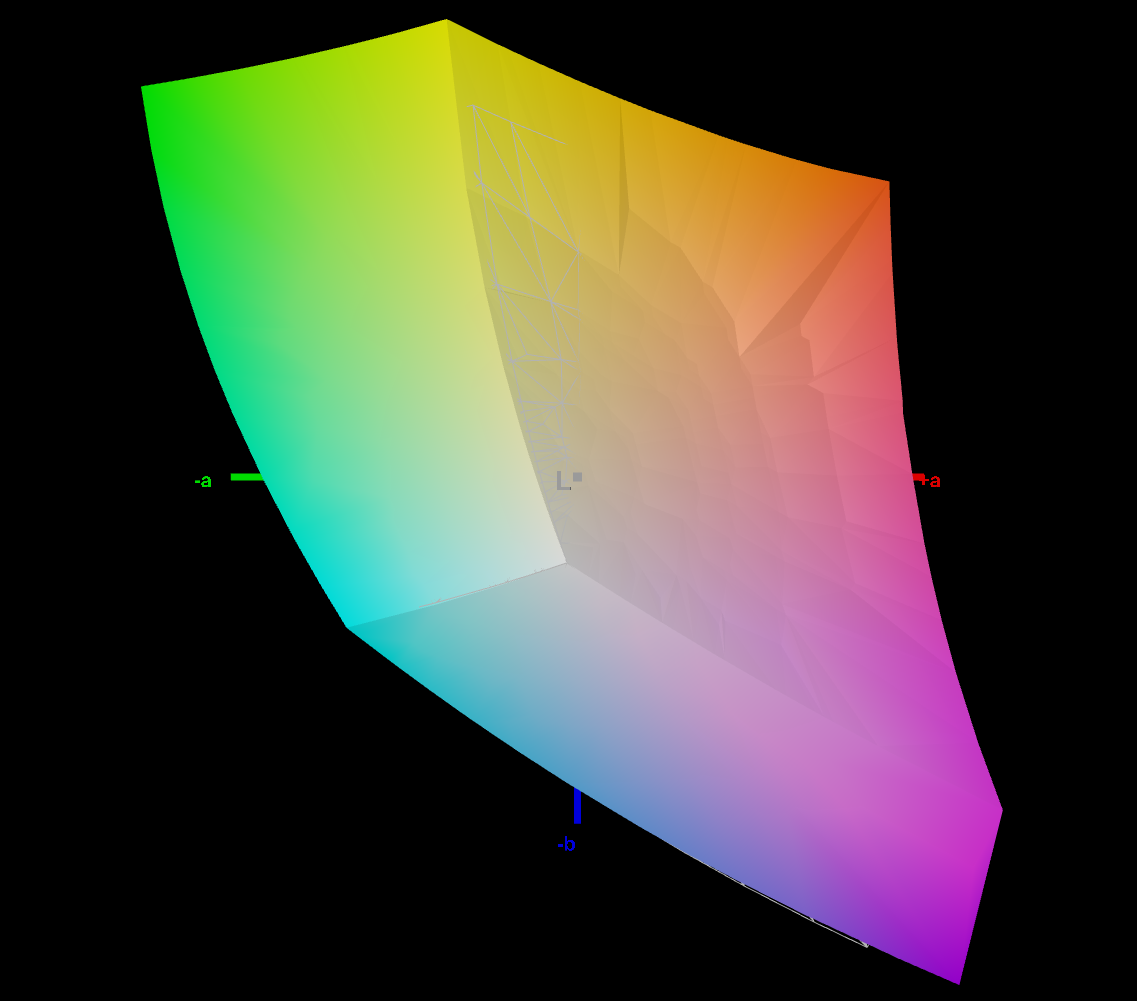
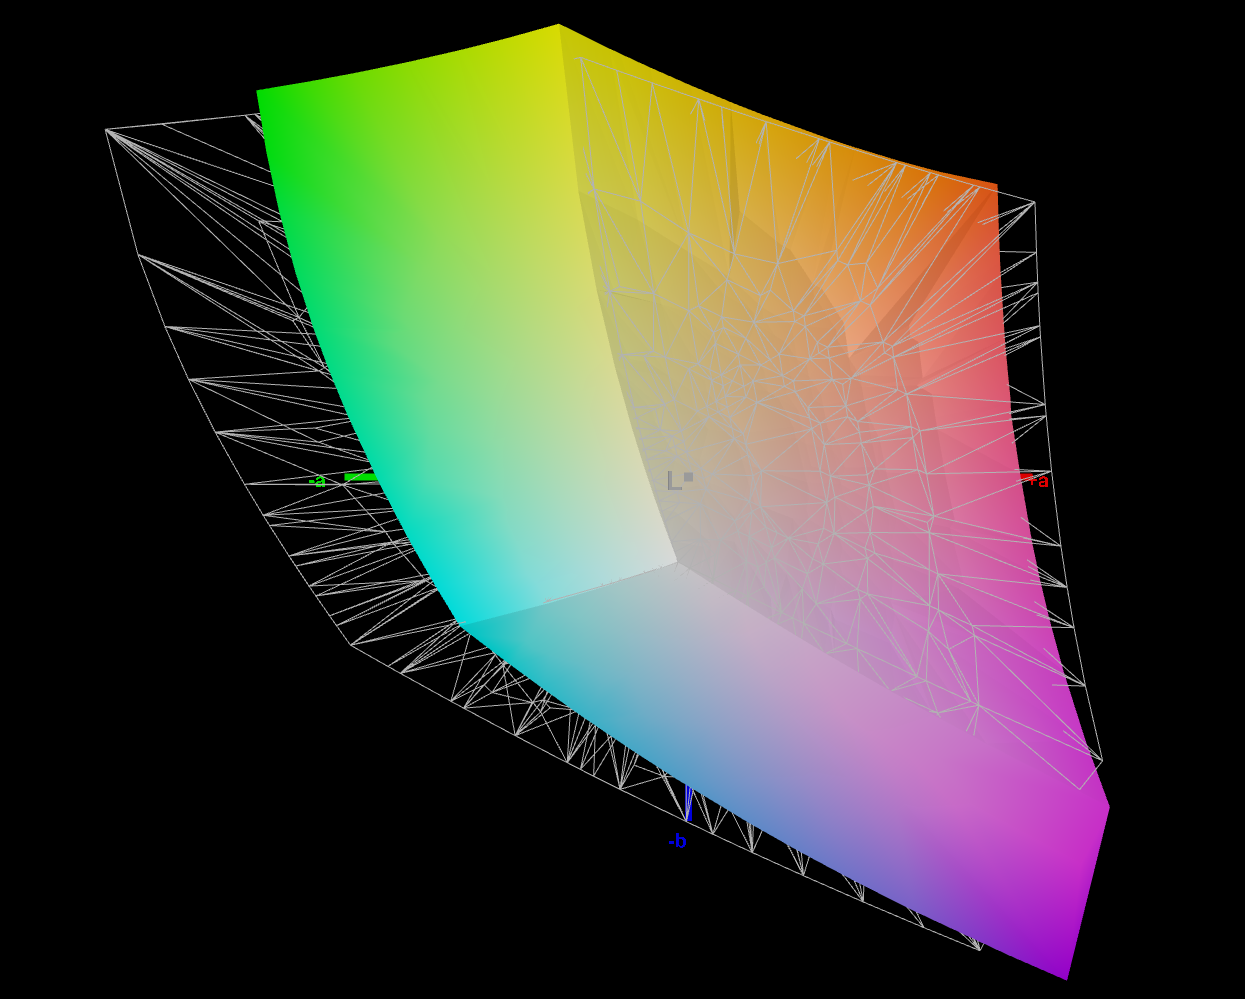
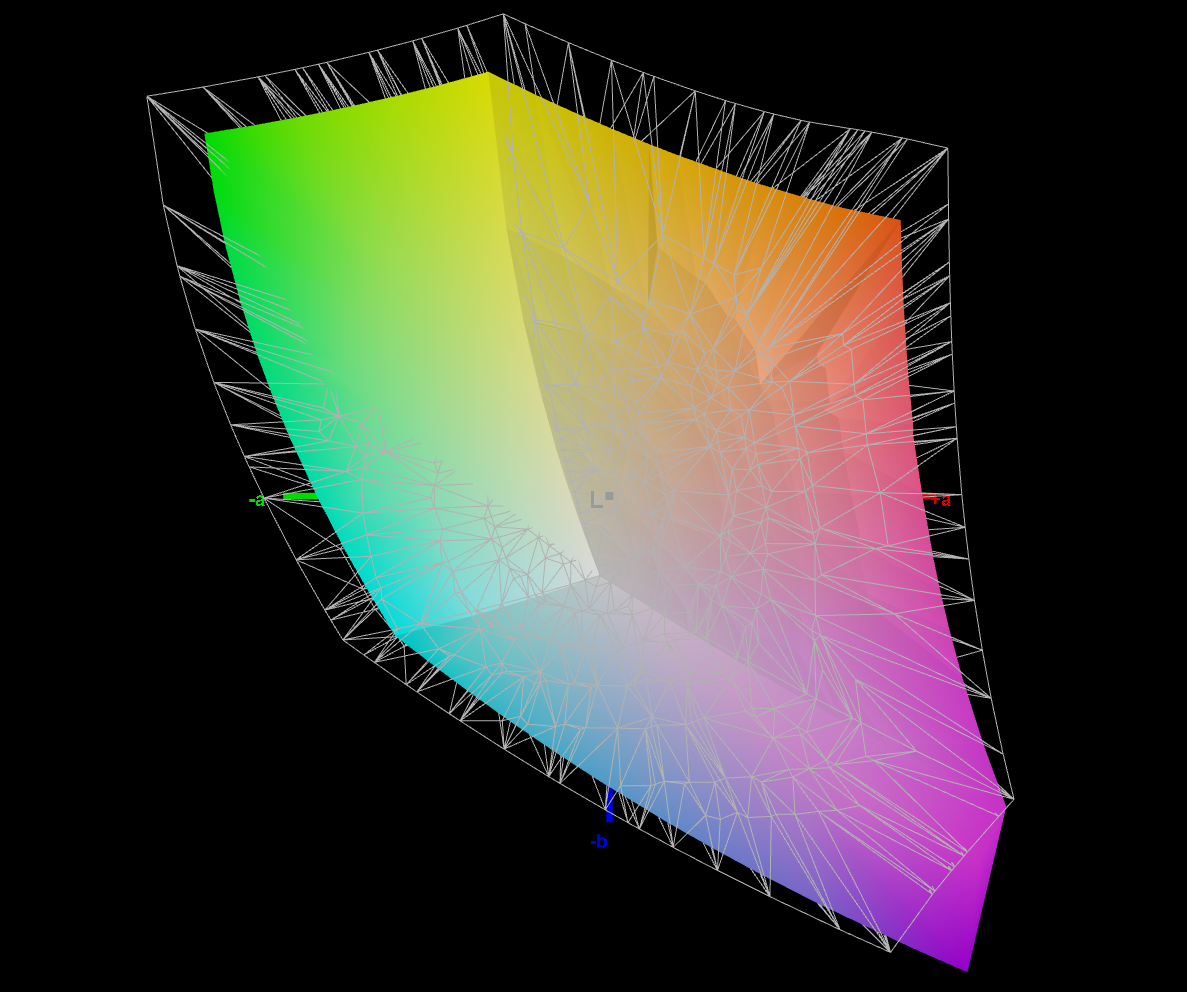
Em contraste com o Predator Helios 16, a opção QHD não cobre o espaço de cores DCI-P3, mas é limitada a 100% sRGB, como a variante FHD+ que testamos. 373 cd/m² é suficientemente brilhante - em nosso campo de comparação, apenas oLegion Pro 5 brilha mais com 516 cd/m², além disso, ele também oferece uma resolução mais alta por um preço semelhante (assim como oLOQ 16 e o XMG Apex 15).
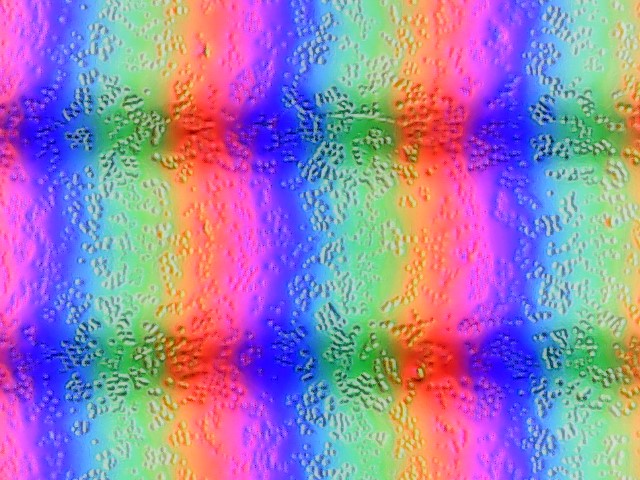
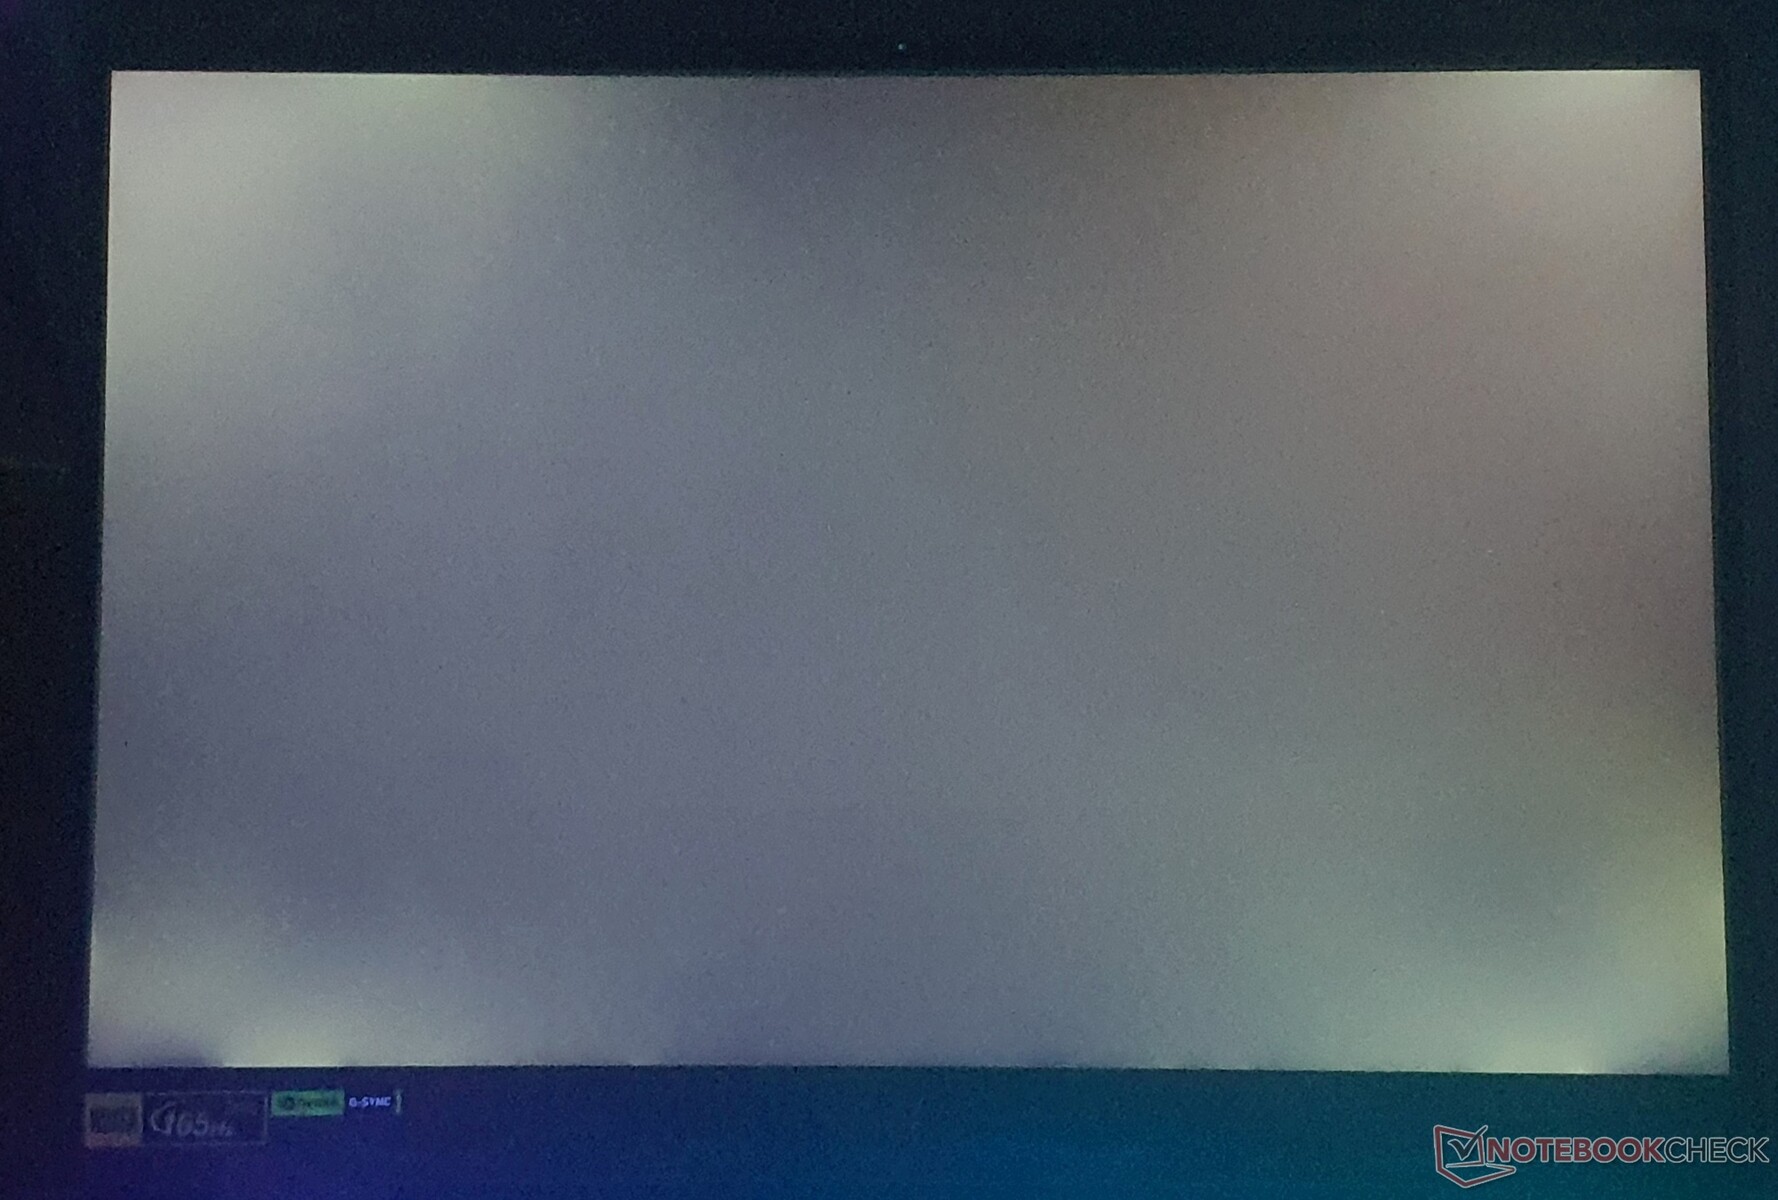
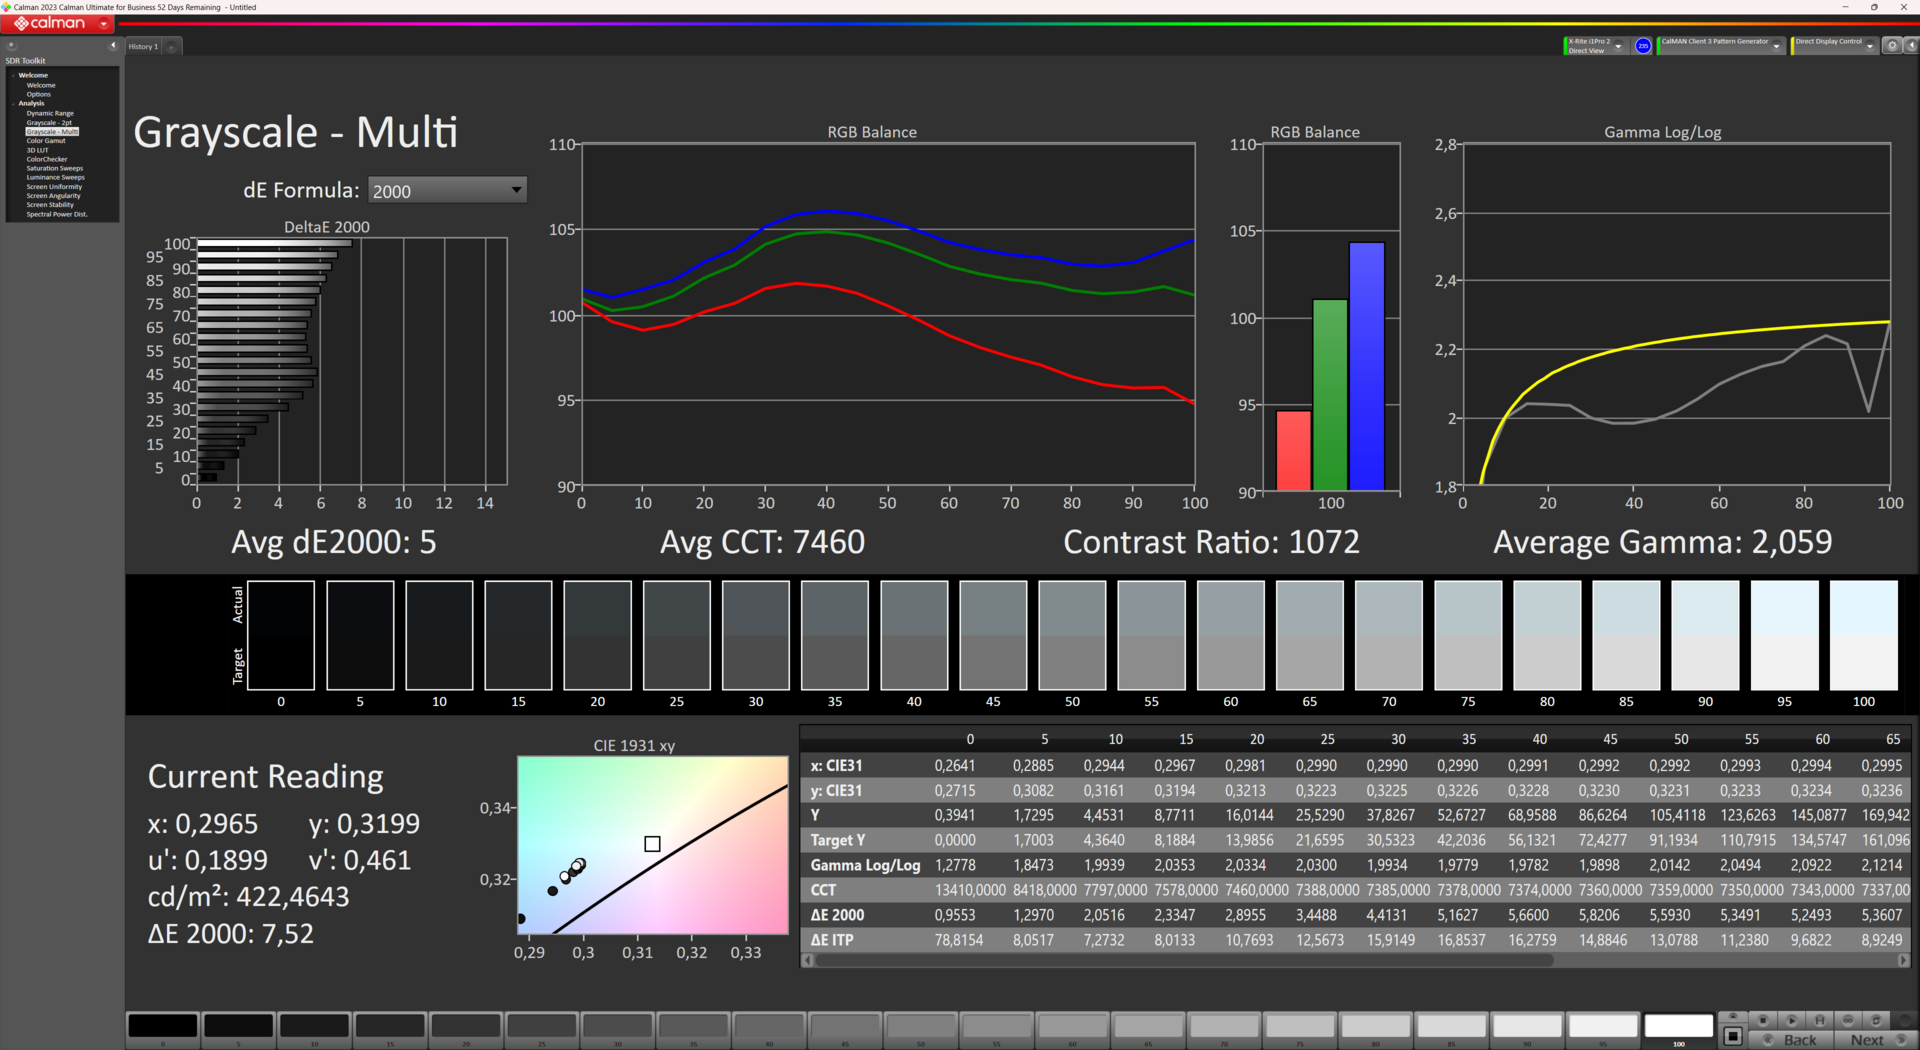
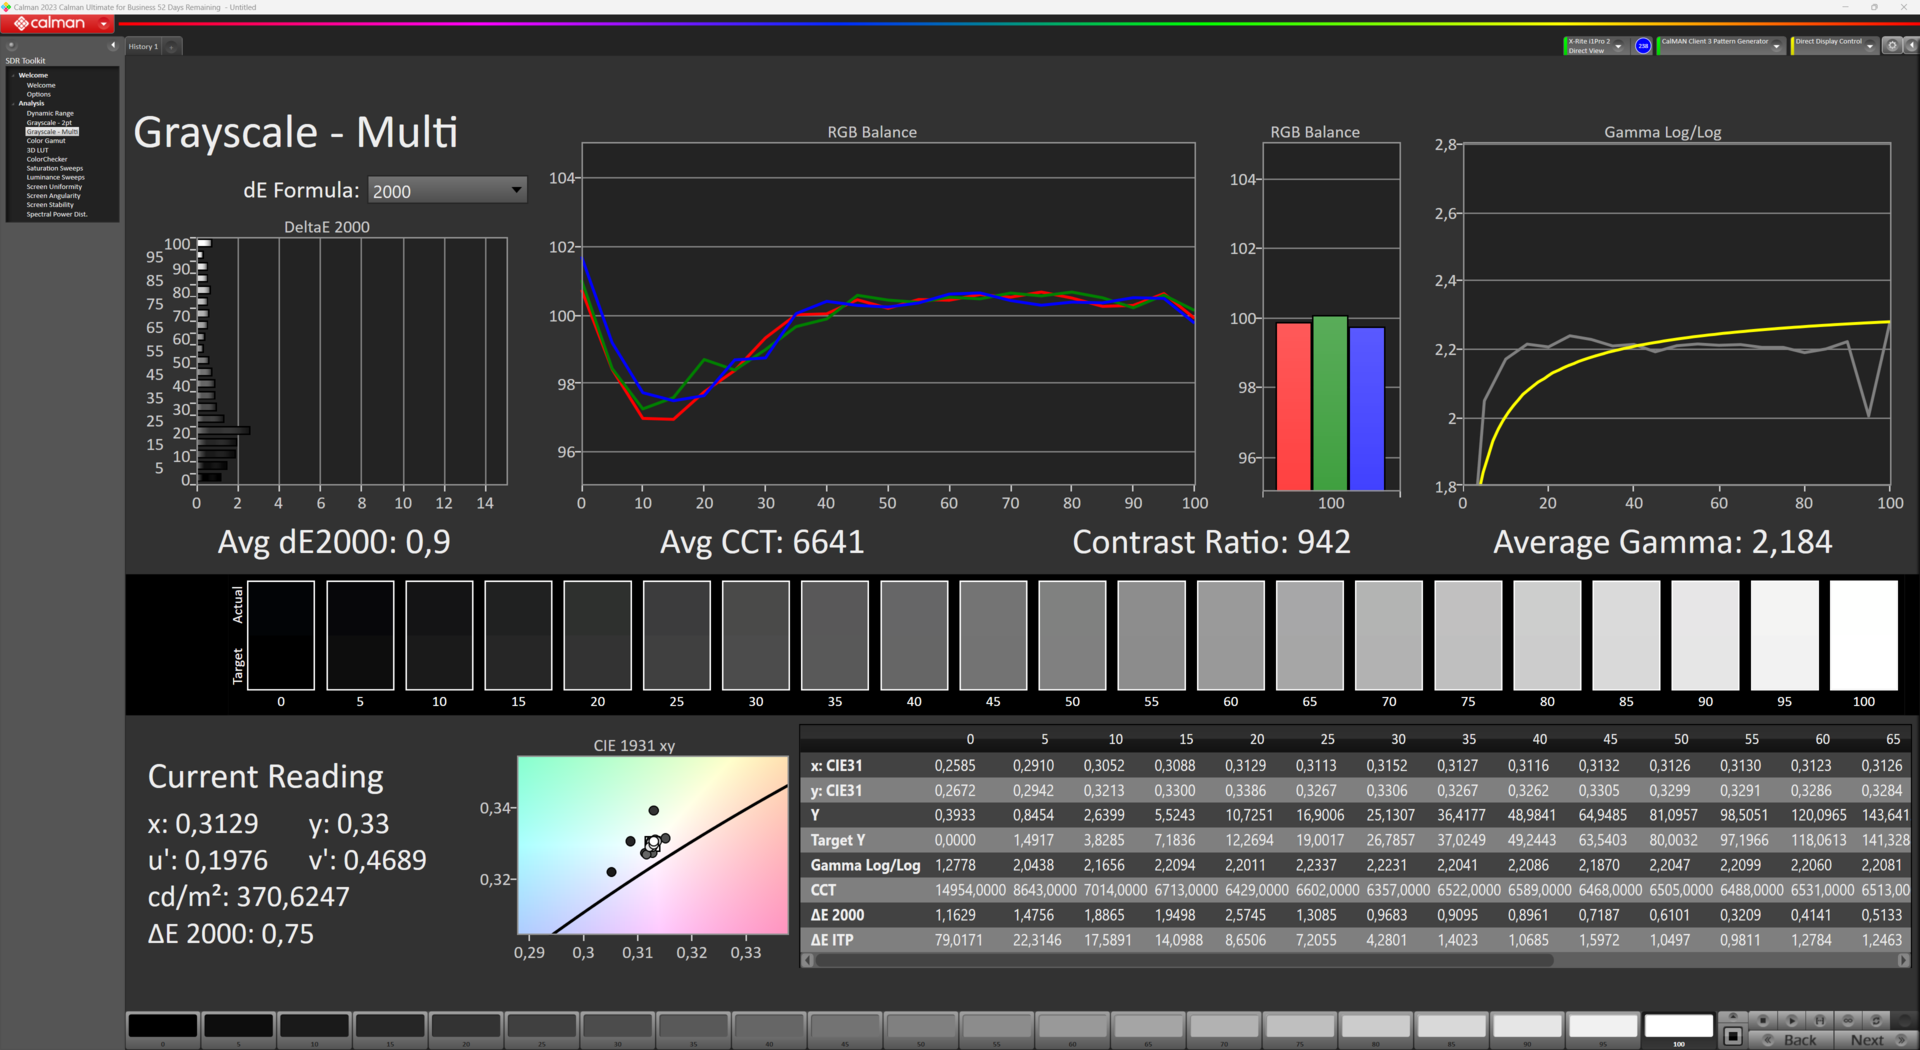
Ele atingiu níveis médios de contraste de 1.025:1, enquanto sua iluminação de 86% não é muito uniforme e notamos alguns halos claramente visíveis. O PWM, que pode causar desconforto ocular ou dores de cabeça, pelo menos não é usado nesse dispositivo.
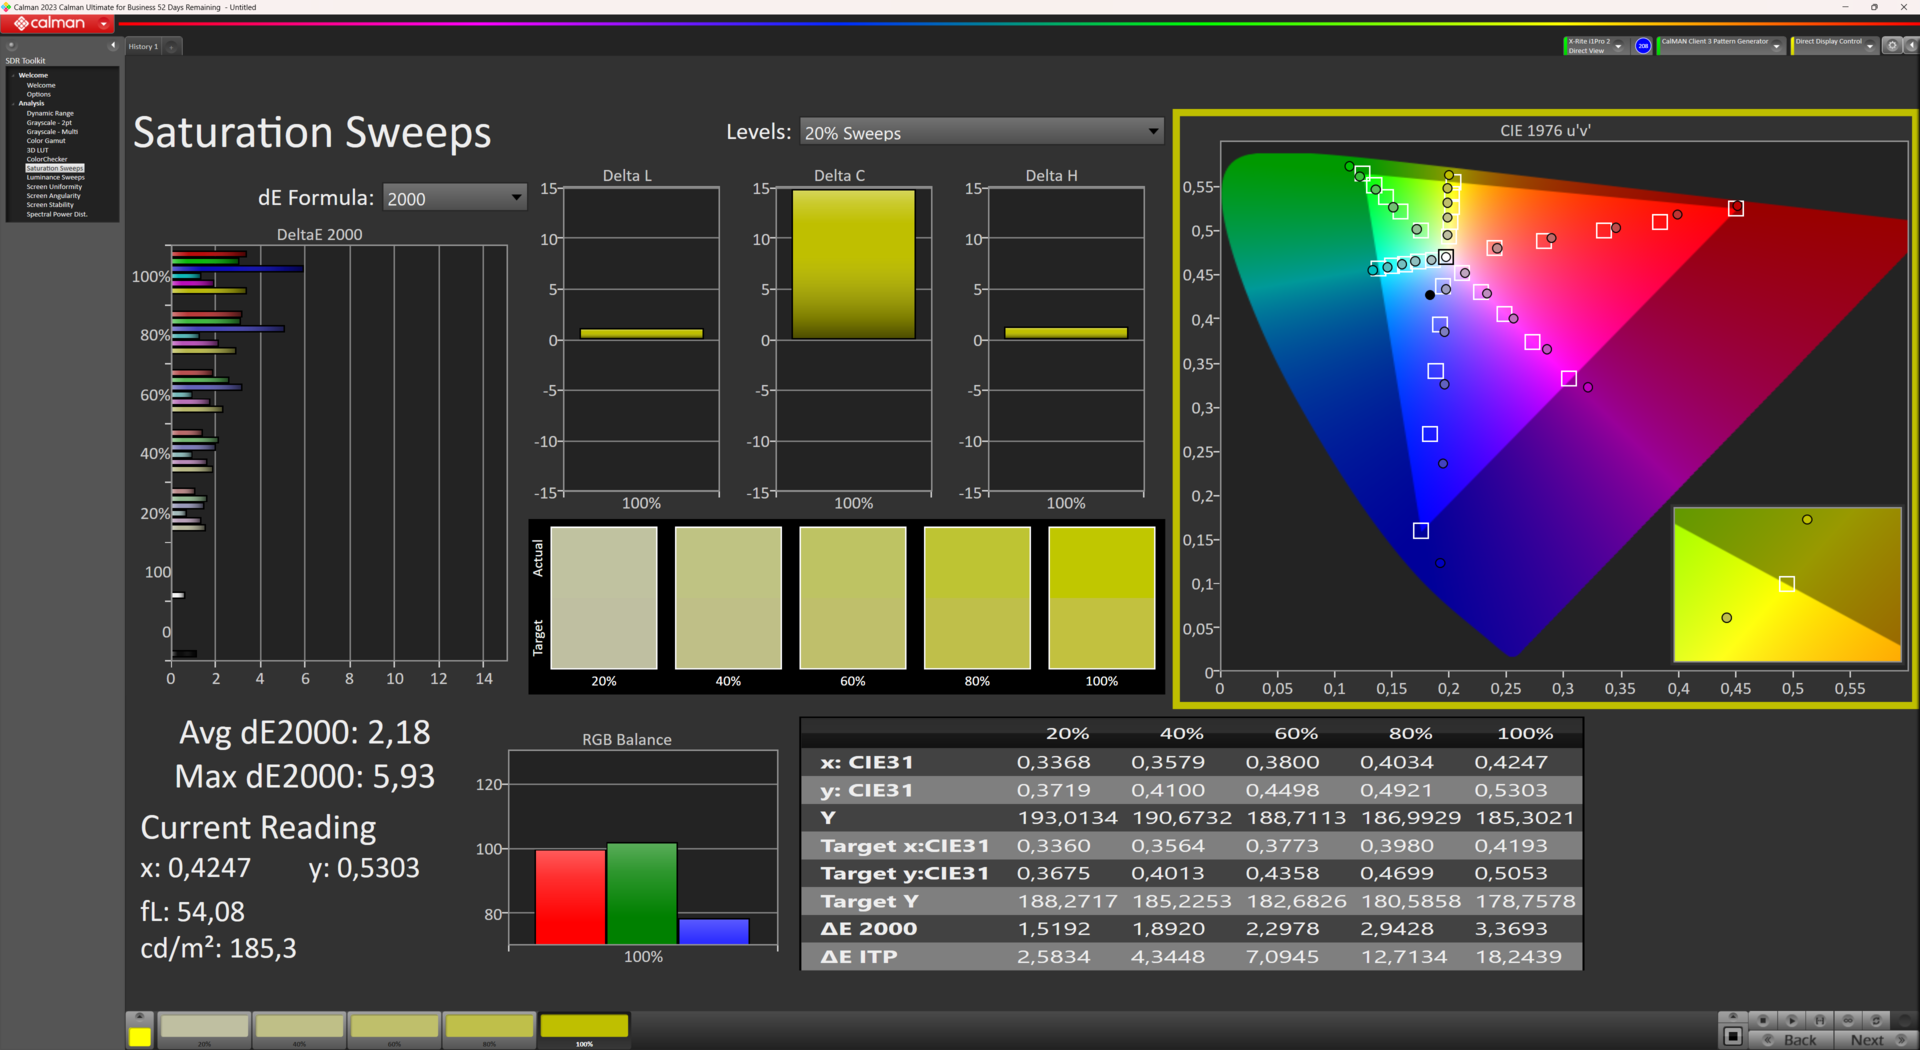
Os tempos de resposta da tela de 8 ms (cinza para cinza) e 8 ms (preto para branco) são curtos - apenas oDell G15 5530 se destaca com tempos de resposta de apenas 3,4 ms (cinza para cinza). O Nvidia G-Sync também é suportado. No geral, a tela parece bonita e colorida, o que provavelmente se deve à cobertura do espaço de cores DCI-P3 de pelo menos 80%.
| |||||||||||||||||||||||||
iluminação: 86 %
iluminação com acumulador: 422.2 cd/m²
Contraste: 1025:1 (Preto: 0.41 cd/m²)
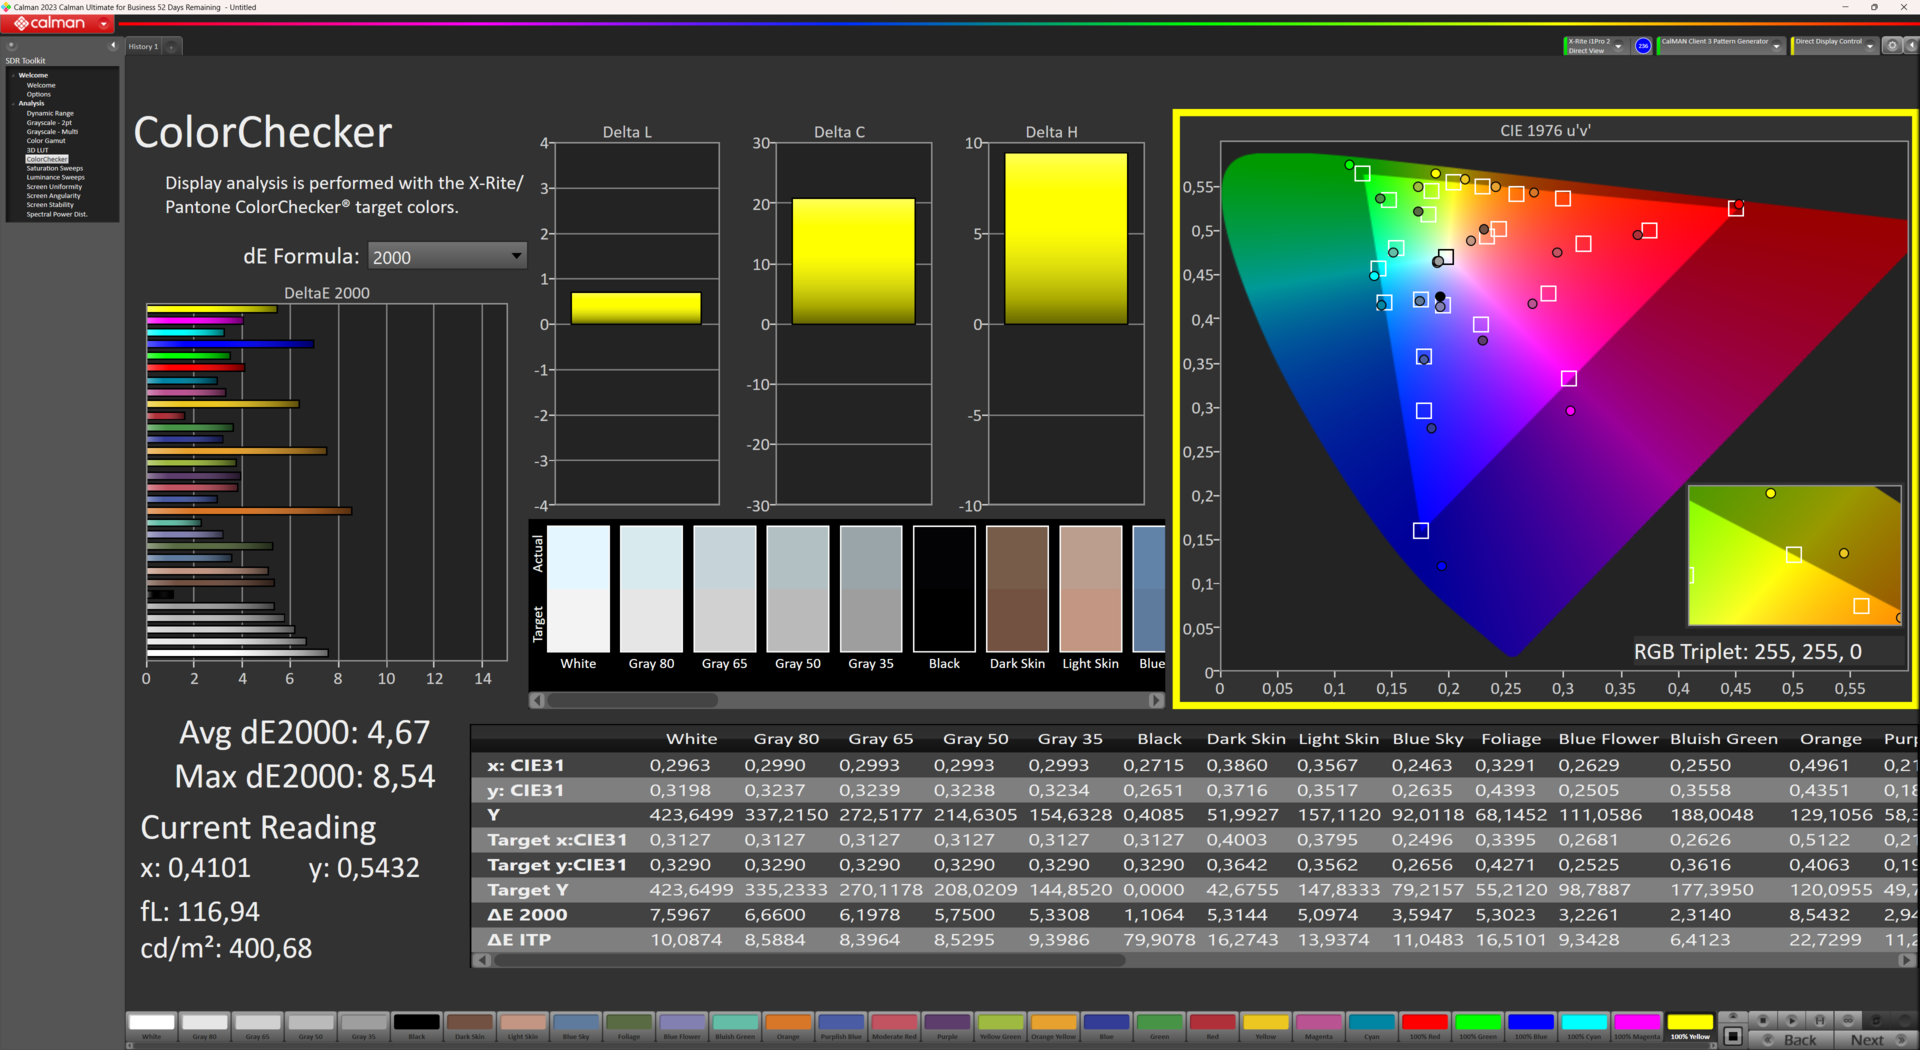
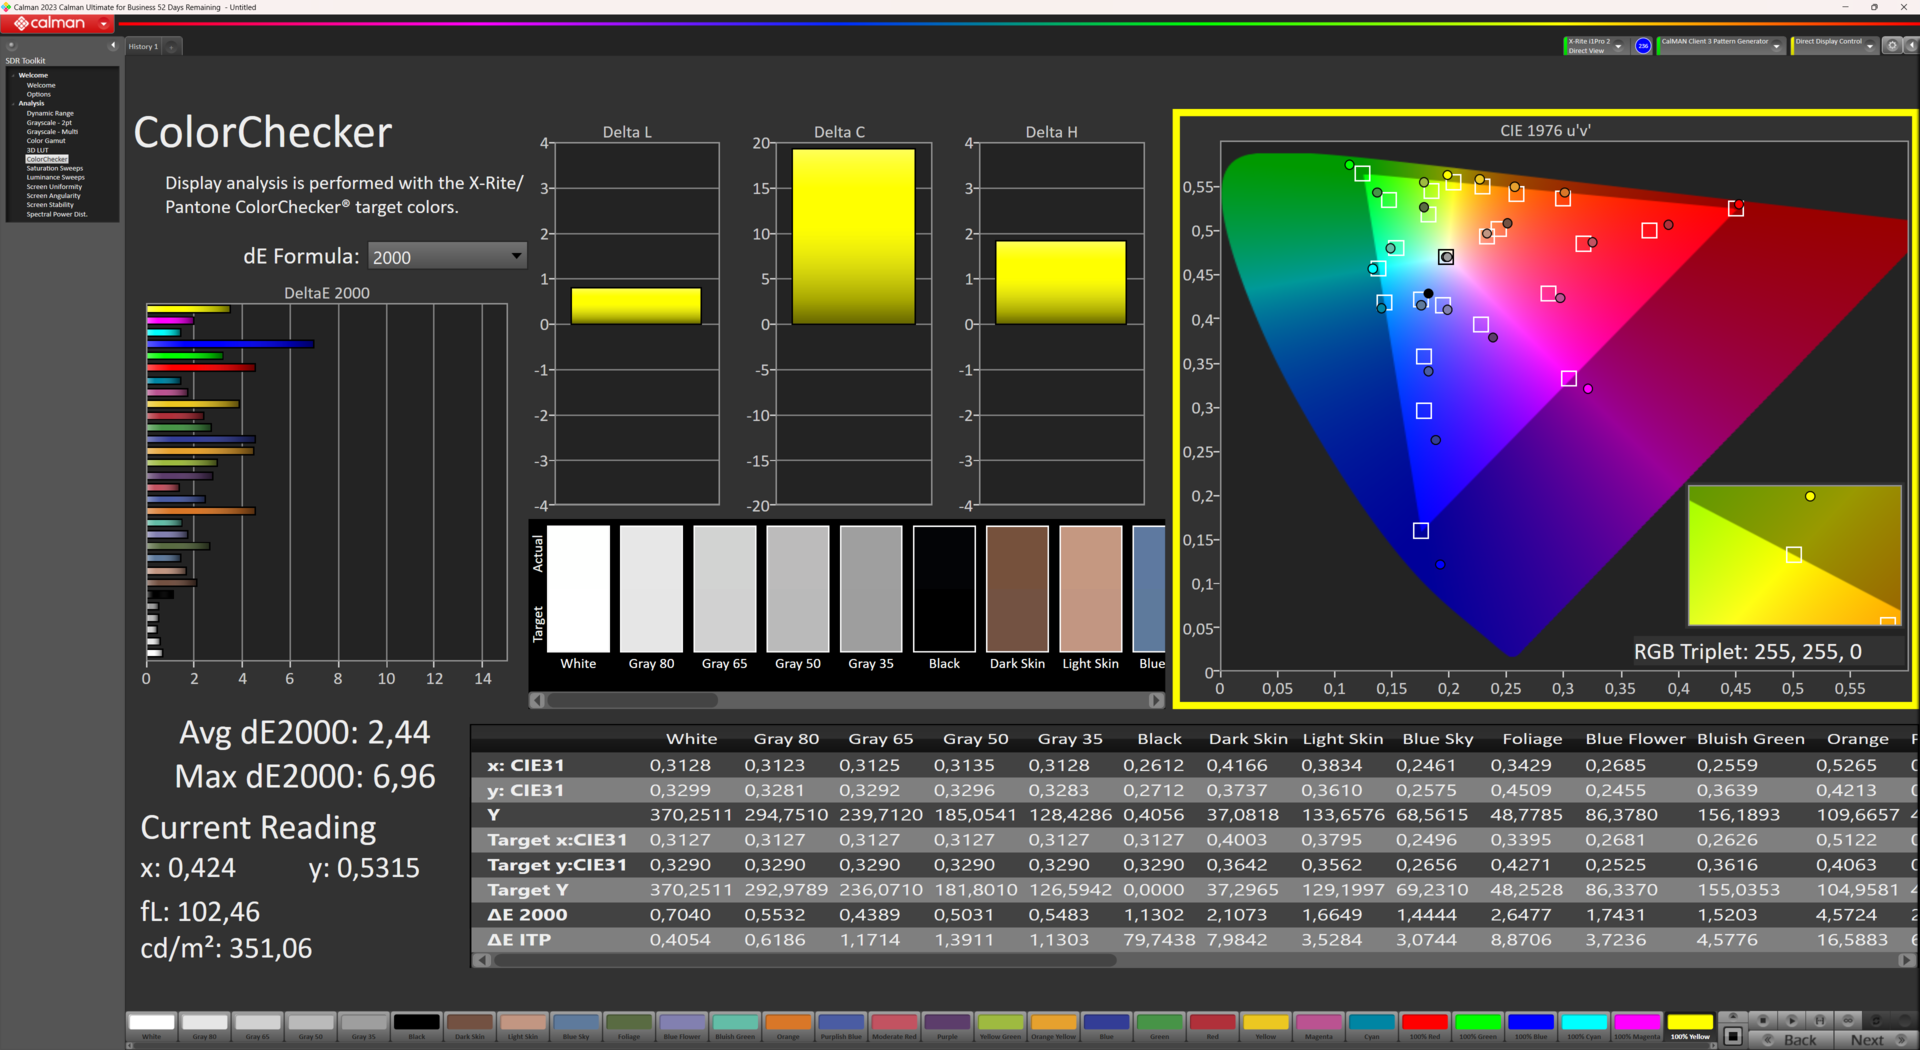
ΔE ColorChecker Calman: 4.67 | ∀{0.5-29.43 Ø4.71}
calibrated: 2.44
ΔE Greyscale Calman: 7.52 | ∀{0.09-98 Ø4.96}
71.36% AdobeRGB 1998 (Argyll 3D)
99.16% sRGB (Argyll 3D)
79.56% Display P3 (Argyll 3D)
Gamma: 2.184
CCT: 6641 K
| Acer Predator Helios Neo 16 NH.QLTEG.002 B160UAN01.Q, IPS, 1920x1200, 16" | Lenovo Legion Pro 5 16ARX8 (R5 7645HX, RTX 4050) CSOT T3 MNG007DA2-2, IPS, 2560x1600, 16" | Lenovo LOQ 16IRH8 AUOC1A5 (B160QAN03.L), IPS, 2560x1600, 16" | Schenker XMG Apex 15 (Late 23) BOE CQ NE156QHM-NY2, IPS, 2560x1440, 15.6" | HP Victus 16-r0076TX Chi Mei CMN1629, IPS, 1920x1080, 16.1" | Dell G15 5530 AUO B156HAN, IPS, 1920x1080, 15.6" | |
|---|---|---|---|---|---|---|
| Display | -2% | -3% | -7% | -6% | -2% | |
| Display P3 Coverage (%) | 79.56 | 71.6 -10% | 70.5 -11% | 67.5 -15% | 67.5 -15% | 73.1 -8% |
| sRGB Coverage (%) | 99.16 | 99.8 1% | 98.9 0% | 97.6 -2% | 97.5 -2% | 98.4 -1% |
| AdobeRGB 1998 Coverage (%) | 71.36 | 72.9 2% | 72.6 2% | 68.9 -3% | 69.7 -2% | 74.4 4% |
| Response Times | -8% | 9% | -38% | 14% | 46% | |
| Response Time Grey 50% / Grey 80% * (ms) | 8 ? | 12 ? -50% | 7.2 ? 10% | 13.2 ? -65% | 6.18 ? 23% | 3.39 ? 58% |
| Response Time Black / White * (ms) | 8 ? | 5.2 ? 35% | 7.4 ? 7% | 8.8 ? -10% | 7.62 ? 5% | 5.35 ? 33% |
| PWM Frequency (Hz) | 21620 ? | |||||
| Screen | 31% | 27% | 18% | 32% | 12% | |
| Brightness middle (cd/m²) | 420.2 | 543 29% | 407 -3% | 336 -20% | 290 -31% | 320 -24% |
| Brightness (cd/m²) | 373 | 516 38% | 369 -1% | 307 -18% | 275 -26% | 316 -15% |
| Brightness Distribution (%) | 86 | 87 1% | 85 -1% | 77 -10% | 82 -5% | 94 9% |
| Black Level * (cd/m²) | 0.41 | 0.58 -41% | 0.45 -10% | 0.38 7% | 0.21 49% | 0.21 49% |
| Contrast (:1) | 1025 | 936 -9% | 904 -12% | 884 -14% | 1381 35% | 1524 49% |
| Colorchecker dE 2000 * | 4.67 | 1.35 71% | 1.43 69% | 1.96 58% | 1.7 64% | 4.55 3% |
| Colorchecker dE 2000 max. * | 8.54 | 3.22 62% | 3.58 58% | 5.07 41% | 3.57 58% | 9.83 -15% |
| Colorchecker dE 2000 calibrated * | 2.44 | 1.31 46% | 1.07 56% | 1.27 48% | 0.93 62% | 1.51 38% |
| Greyscale dE 2000 * | 7.52 | 1.03 86% | 1.13 85% | 2.3 69% | 1.5 80% | 6.2 18% |
| Gamma | 2.184 101% | 2.38 92% | 2.5 88% | 2.017 109% | 2.1 105% | 2.07 106% |
| CCT | 6641 98% | 6452 101% | 6526 100% | 6644 98% | 6538 99% | 6479 100% |
| Média Total (Programa/Configurações) | 7% /
19% | 11% /
18% | -9% /
5% | 13% /
21% | 19% /
14% |
* ... menor é melhor
Como o espaço de cores sRGB é totalmente coberto, a edição profissional de imagens e vídeos que dependem de cores precisas é certamente possível, desde que sua resolução FHD+ bastante baixa não interfira nesses usos.
Em nosso campo de comparação, o Helios Neo 16 é o único laptop, além do Dell G15 5530, que excede o limite crítico DeltaE 3 (até o qual o olho humano pode perceber os desvios de cor) com um valor de 4,67 logo que sai da caixa.
Felizmente, seu valor DeltaE foi reduzido para apenas 2,44 após nossa calibração, embora os tons azuis ainda apresentem um desvio significativo com um valor de 7. A tonalidade ciano também poderia ser corrigida. Nosso perfil de cores calibrado pode ser baixado aqui.

Exibir tempos de resposta
| ↔ Tempo de resposta preto para branco | ||
|---|---|---|
| 8 ms ... ascensão ↗ e queda ↘ combinadas | ↗ 4.5 ms ascensão |  |
| ↘ 3.5 ms queda | ||
| A tela mostra taxas de resposta rápidas em nossos testes e deve ser adequada para jogos. Em comparação, todos os dispositivos testados variam de 0.1 (mínimo) a 240 (máximo) ms. » 22 % de todos os dispositivos são melhores. Isso significa que o tempo de resposta medido é melhor que a média de todos os dispositivos testados (19.8 ms). | ||
| ↔ Tempo de resposta 50% cinza a 80% cinza | ||
| 8 ms ... ascensão ↗ e queda ↘ combinadas | ↗ 4.5 ms ascensão |  |
| ↘ 3.5 ms queda | ||
| A tela mostra taxas de resposta rápidas em nossos testes e deve ser adequada para jogos. Em comparação, todos os dispositivos testados variam de 0.165 (mínimo) a 636 (máximo) ms. » 21 % de todos os dispositivos são melhores. Isso significa que o tempo de resposta medido é melhor que a média de todos os dispositivos testados (31 ms). | ||
Cintilação da tela / PWM (modulação por largura de pulso)
| Tela tremeluzindo / PWM não detectado |  | ||
[pwm_comparison] Em comparação: 52 % de todos os dispositivos testados não usam PWM para escurecer a tela. Se PWM foi detectado, uma média de 7757 (mínimo: 5 - máximo: 343500) Hz foi medida. | |||
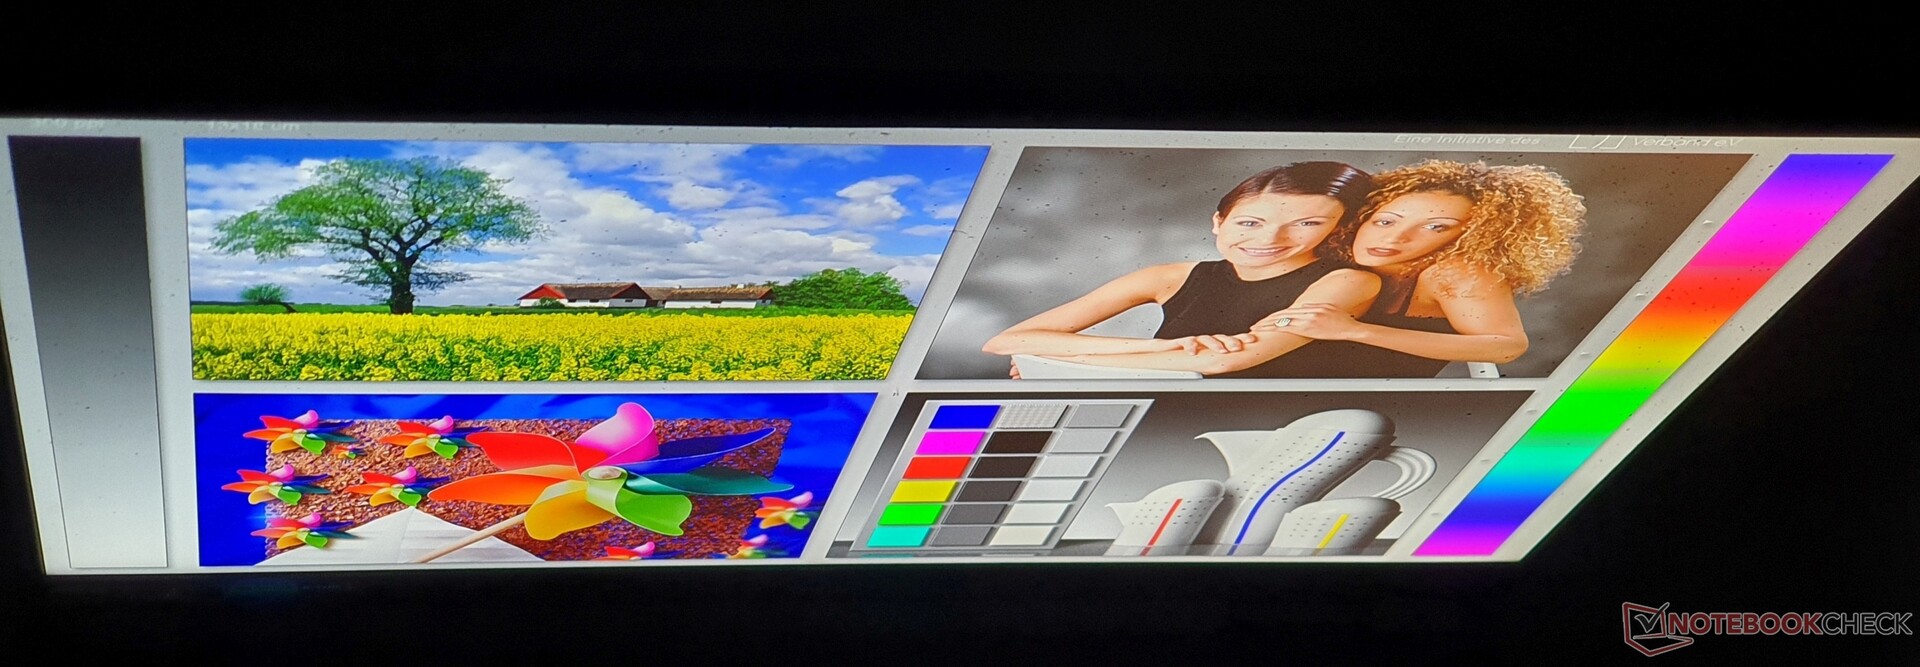
Graças à superfície fosca da tela do dispositivo e ao brilho de 373 cd/m², a tela permanece legível em ambientes externos, desde que o senhor não se sente sob a luz direta do sol.
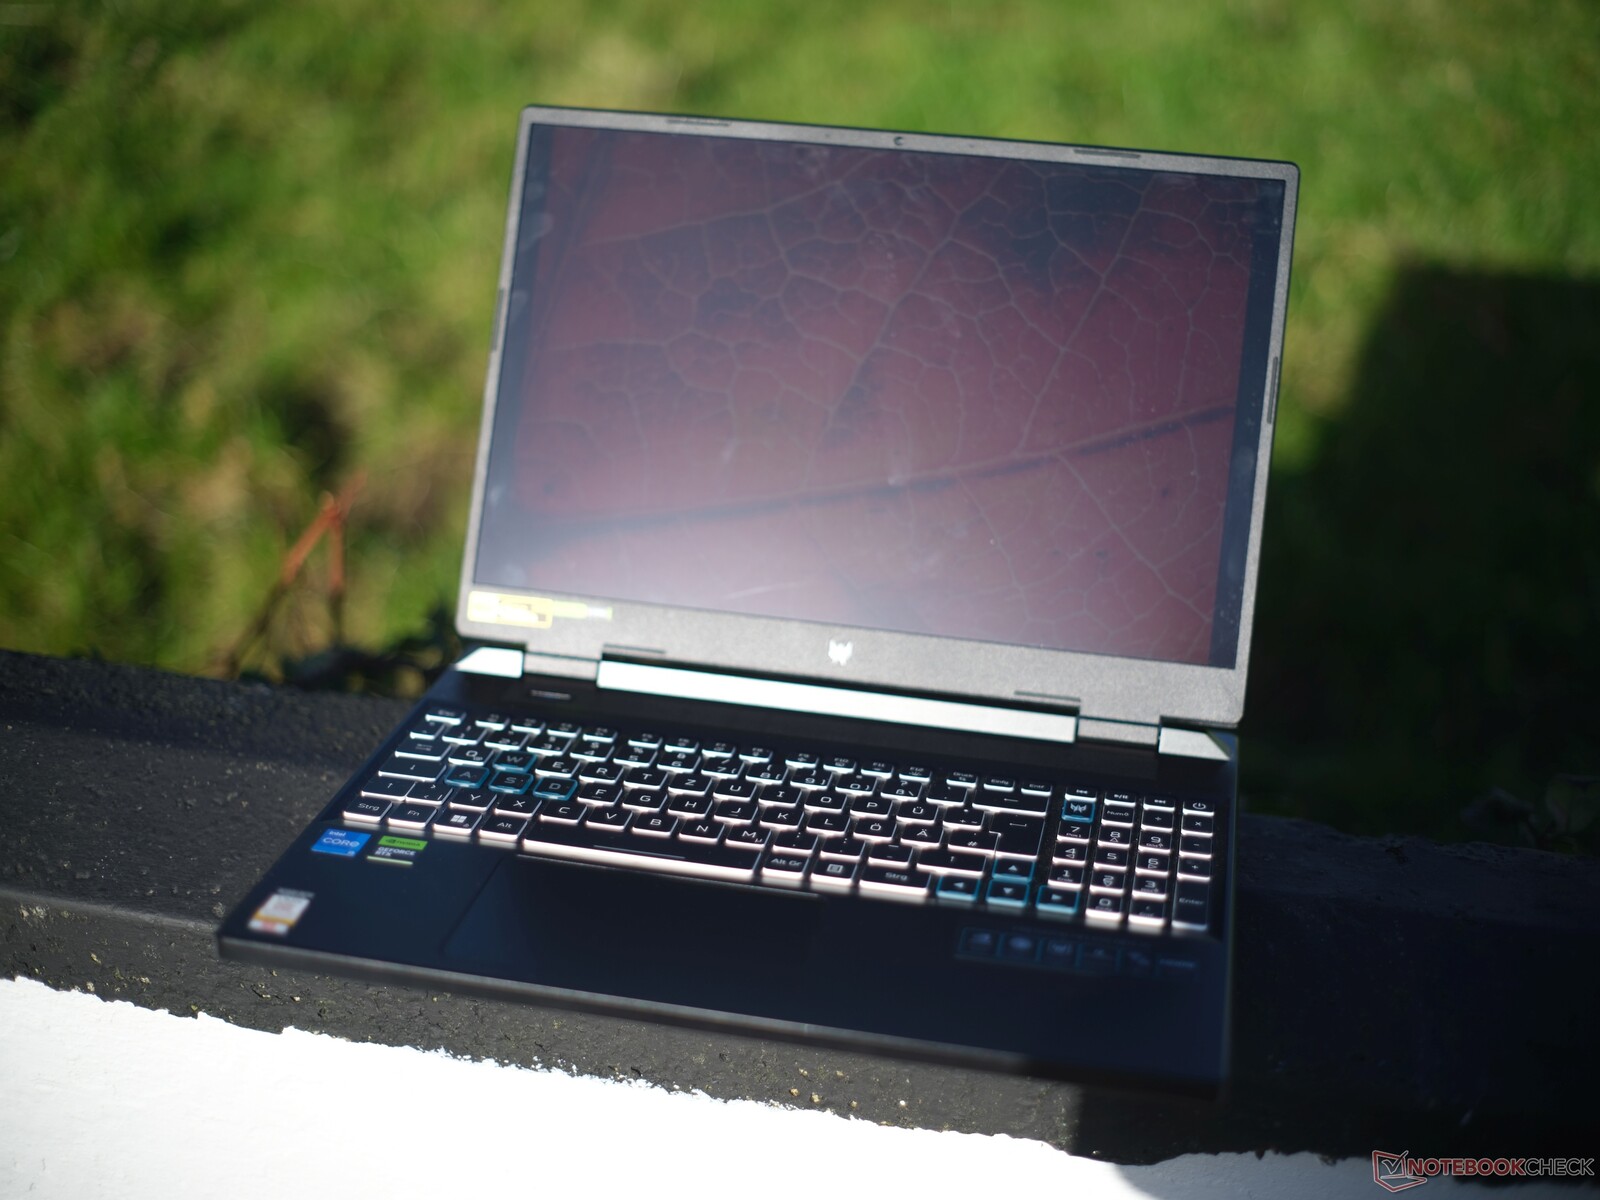
Como é típico das telas IPS, ela permanece legível mesmo em ângulos de visão extremos.


Desempenho: CPU de classe de desktop em um laptop de médio porte para jogos
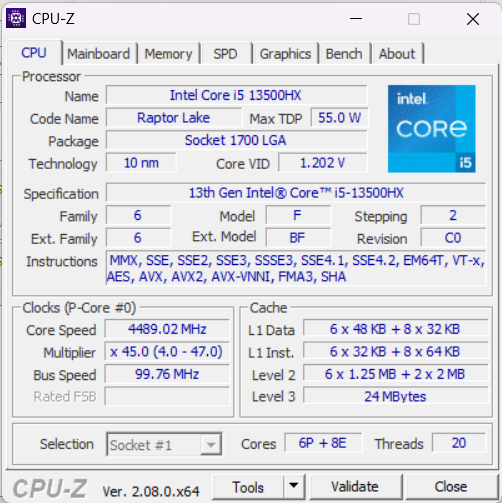
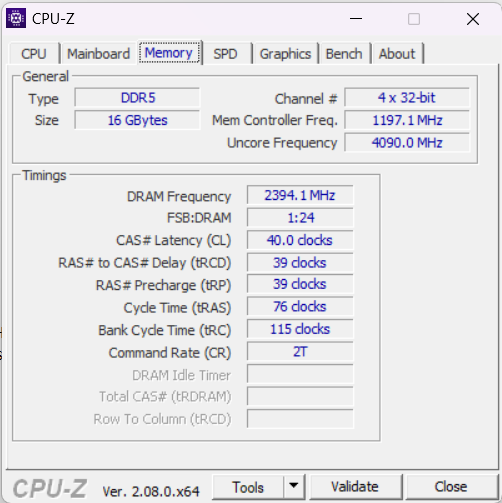
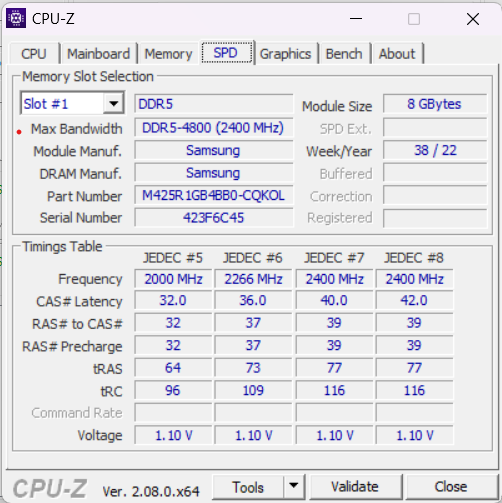
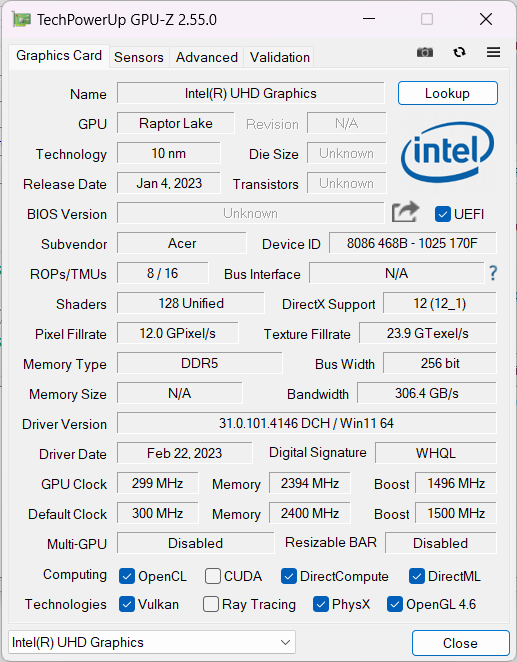
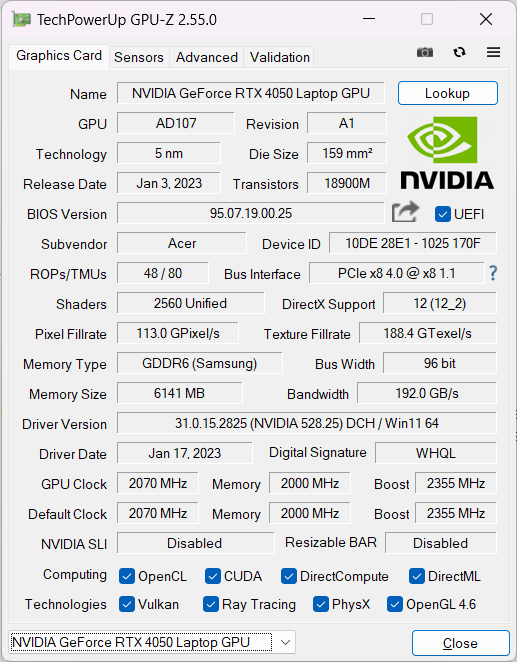
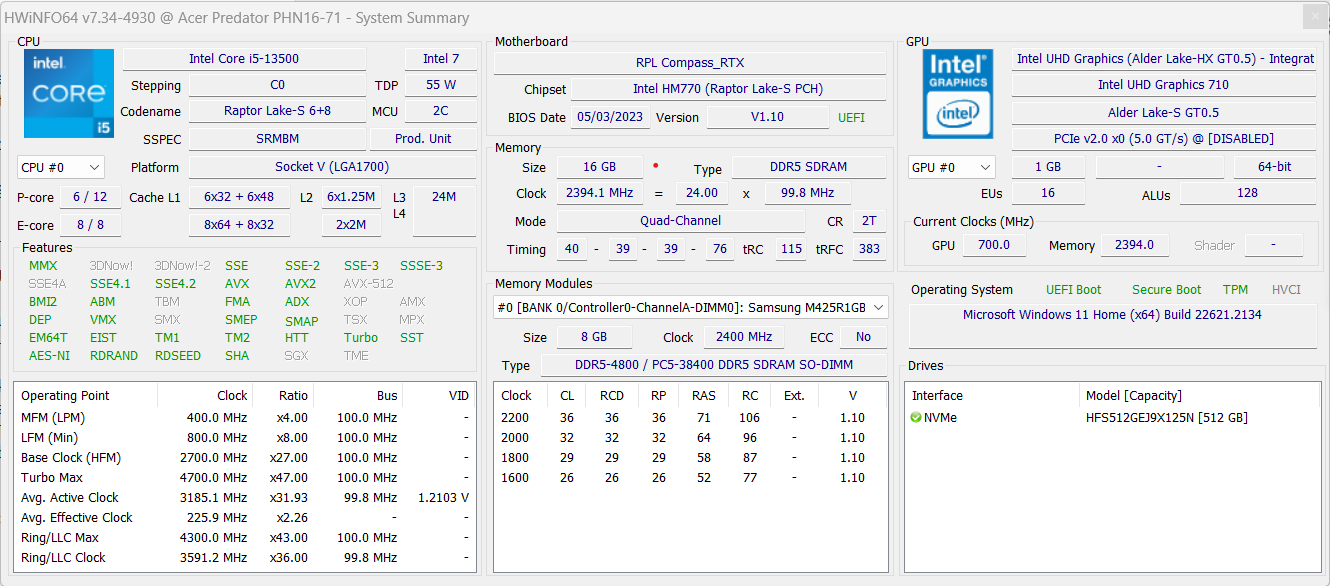
Estamos testando o Acer Predator Helios Neo 16 com um processador IntelCore i5-13500HX(6 núcleos P + 8 núcleos E), 16 GB de RAM DDR5-4800, um SSD de 512 GB e uma placa Nvidia GeForce RTX 4050com um TGP de 130 watts. Outras variantes podem ser encontradas, que têm até umCore i9-13900HX(8 núcleos P + 16 núcleos E) e até uma Nvidia GeForce RTX 4070.
O mercado-alvo da versão que testamos inclui gamers que desejam jogar novos jogos em resolução FHD+ nativa, mas que também ficarão satisfeitos com taxas de FPS de dois dígitos. Outras tarefas gráficas também são possíveis com esse modelo básico do Helios Neo 16, embora 8 GB de VRAM em vez de 6 GB seriam ideais para edição de vídeo 4K em particular.
Condições de teste
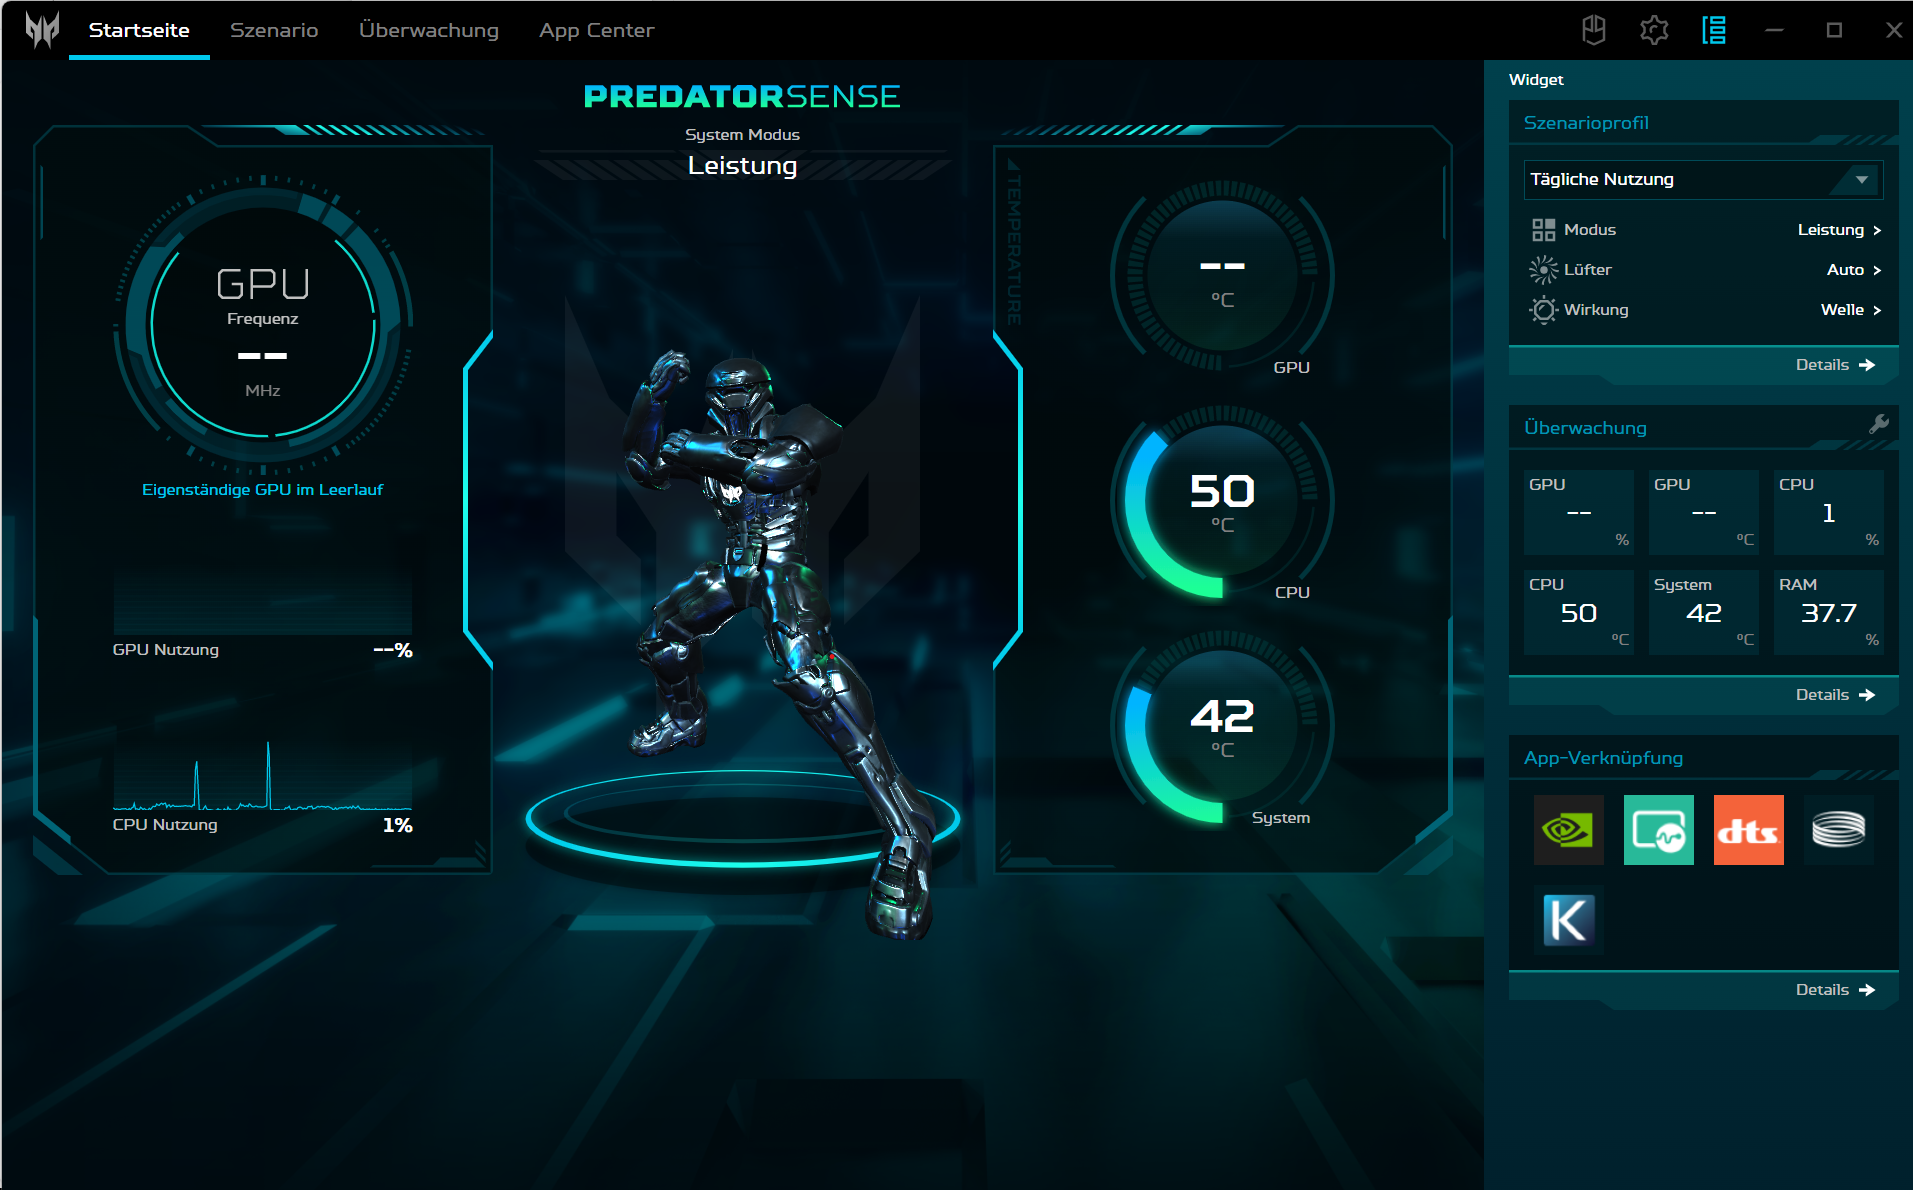
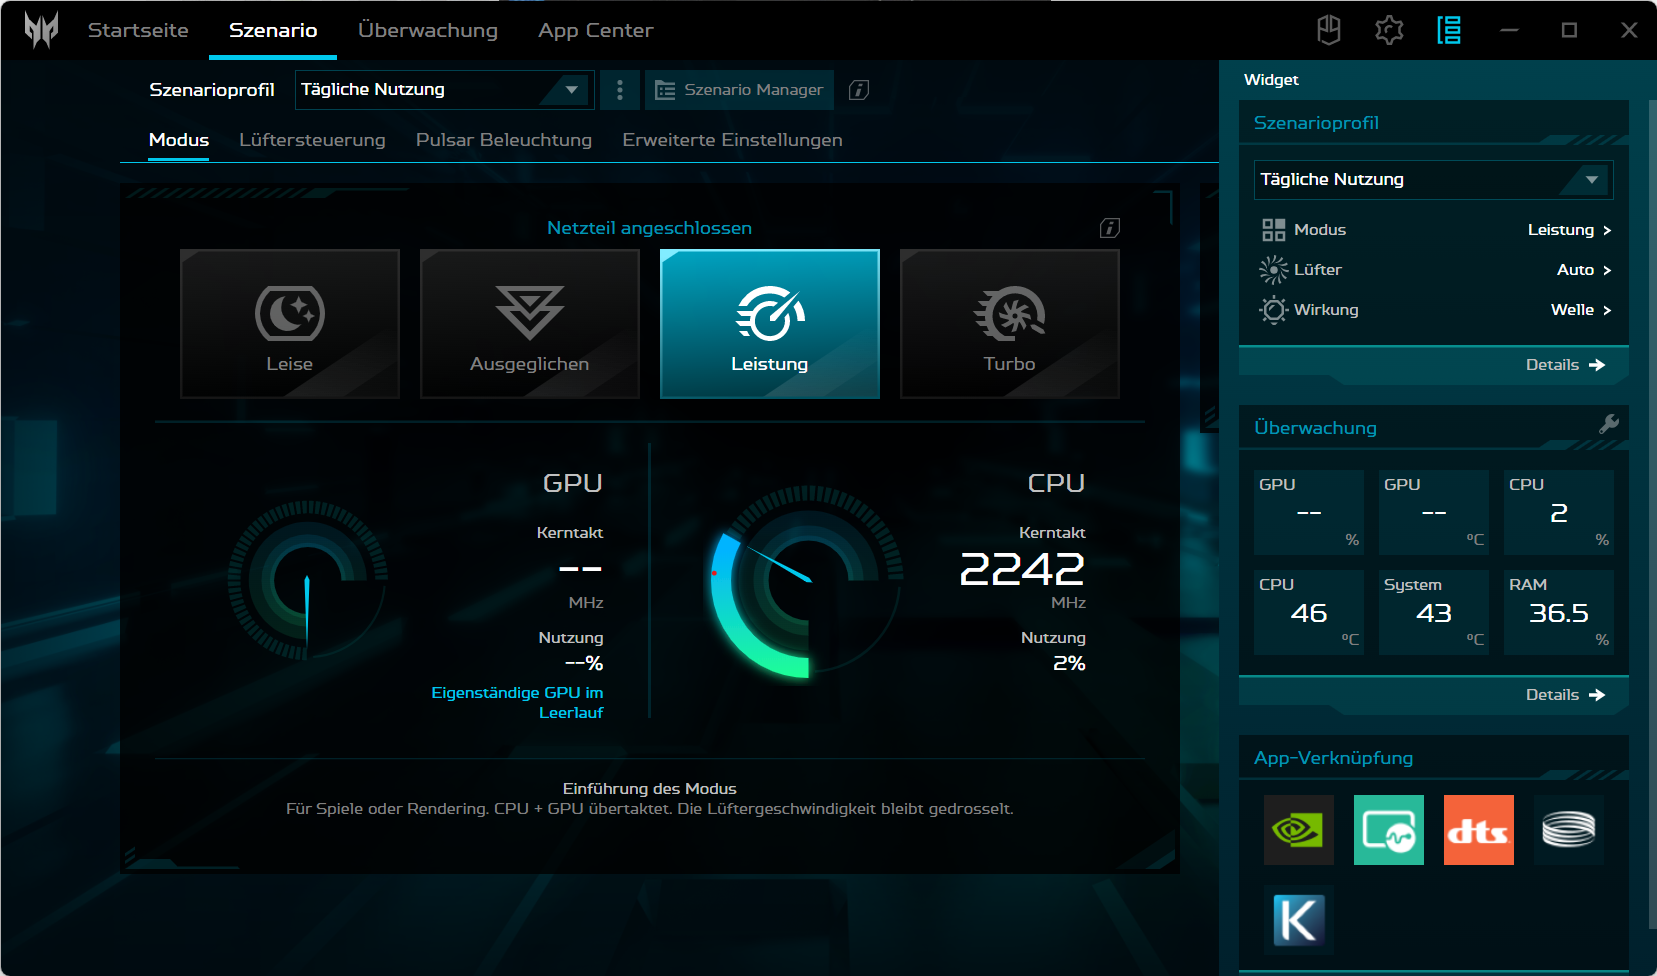
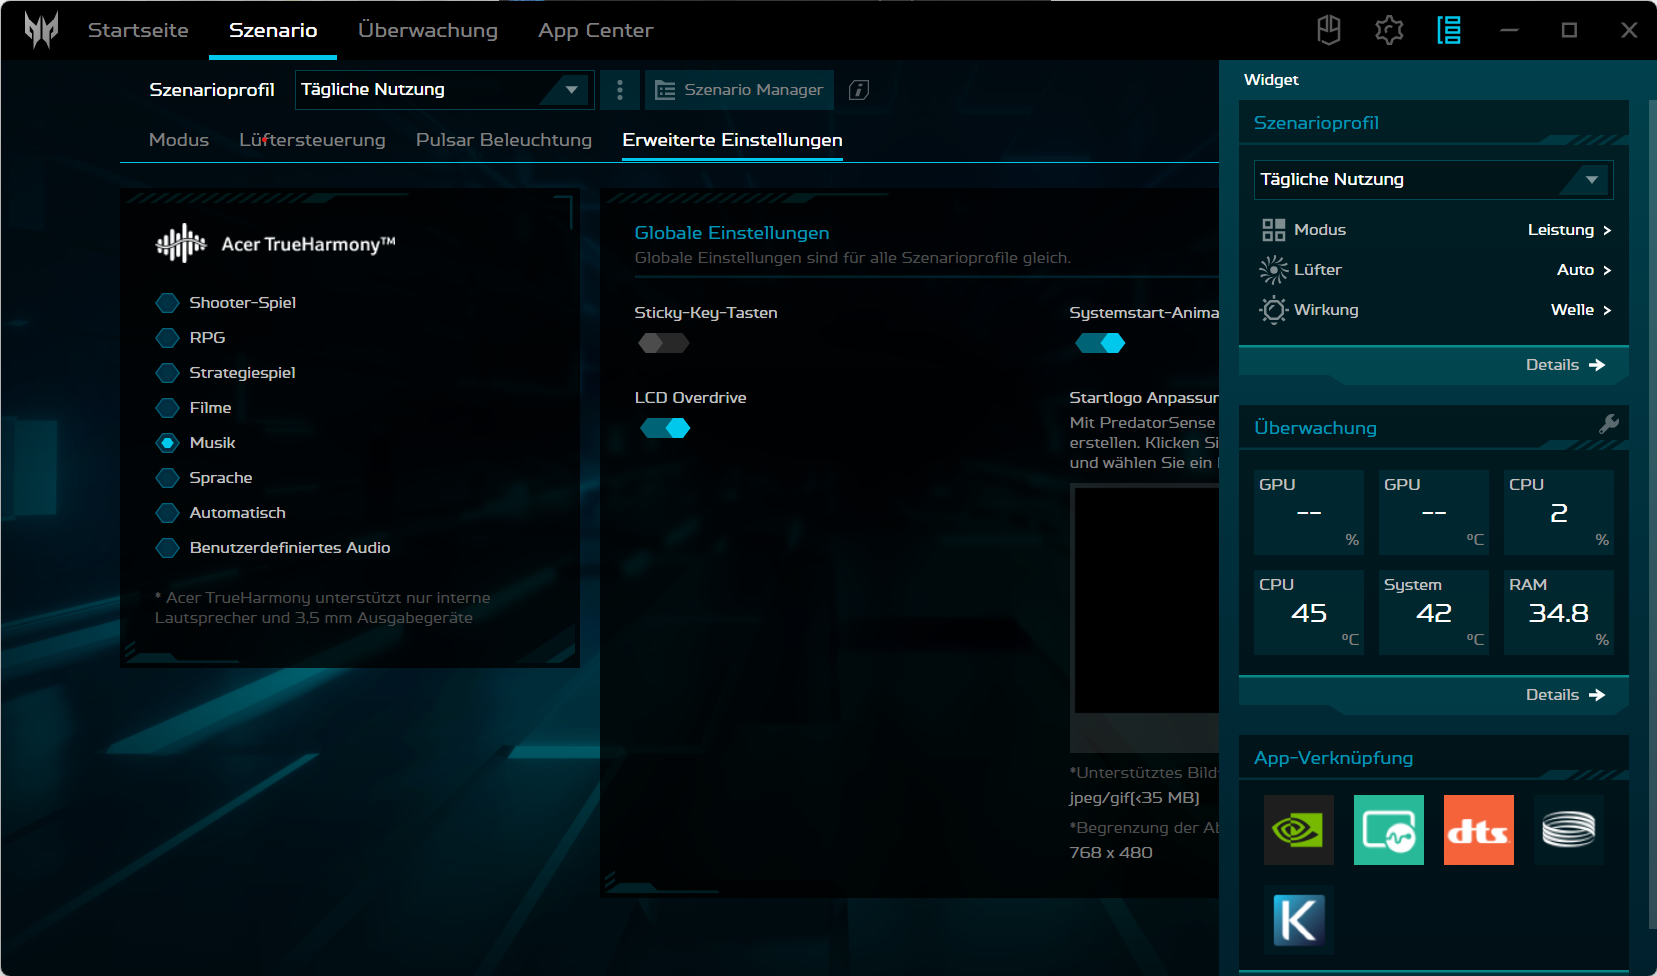
Quatro modos de desempenho estão disponíveis no software "Predator Sense" do centro de controle da Acer, que podem ser alternados por meio do botão à esquerda, acima do teclado. Realizamos nossos benchmarks relacionados ao desempenho no modo "desempenho", enquanto o sistema alternava automaticamente para o modo "equilibrado" no modo de bateria. O Predator Helios Neo 16 também deve ter um nível de carga de pelo menos 40% para que os modos de desempenho possam ser controlados.
A tabela a seguir mostra que o desempenho da GPU é perdido muito pouco no modo balanceado, enquanto as ventoinhas permanecem quase agradavelmente silenciosas. O modo turbo, por outro lado, é insuportavelmente barulhento e, portanto, só é útil para longas sessões de renderização de vídeo ou similares.
| Cenário | Turbo | Desempenho | Balanceado | Silencioso | Bateria |
|---|---|---|---|---|---|
| CPU PL2 | 147 W | 147 W | 147 W | 147 W | 27 W |
| CPU PL1 | 100 W | 80 W | 70 W | 45 W | 27 W |
| GPU @The Witcher 3 | 88 W | 86 W | 86 W | 56 W | 43 W |
| GPU @FurMark | 130 W | 130 W | 105 W | 80 W | 13 W |
| Desempenho (The Witcher 3 @FHD/Ultra) | 81 FPS | 79 FPS | 79 FPS | 46 FPS | 30 FPS |
Processador
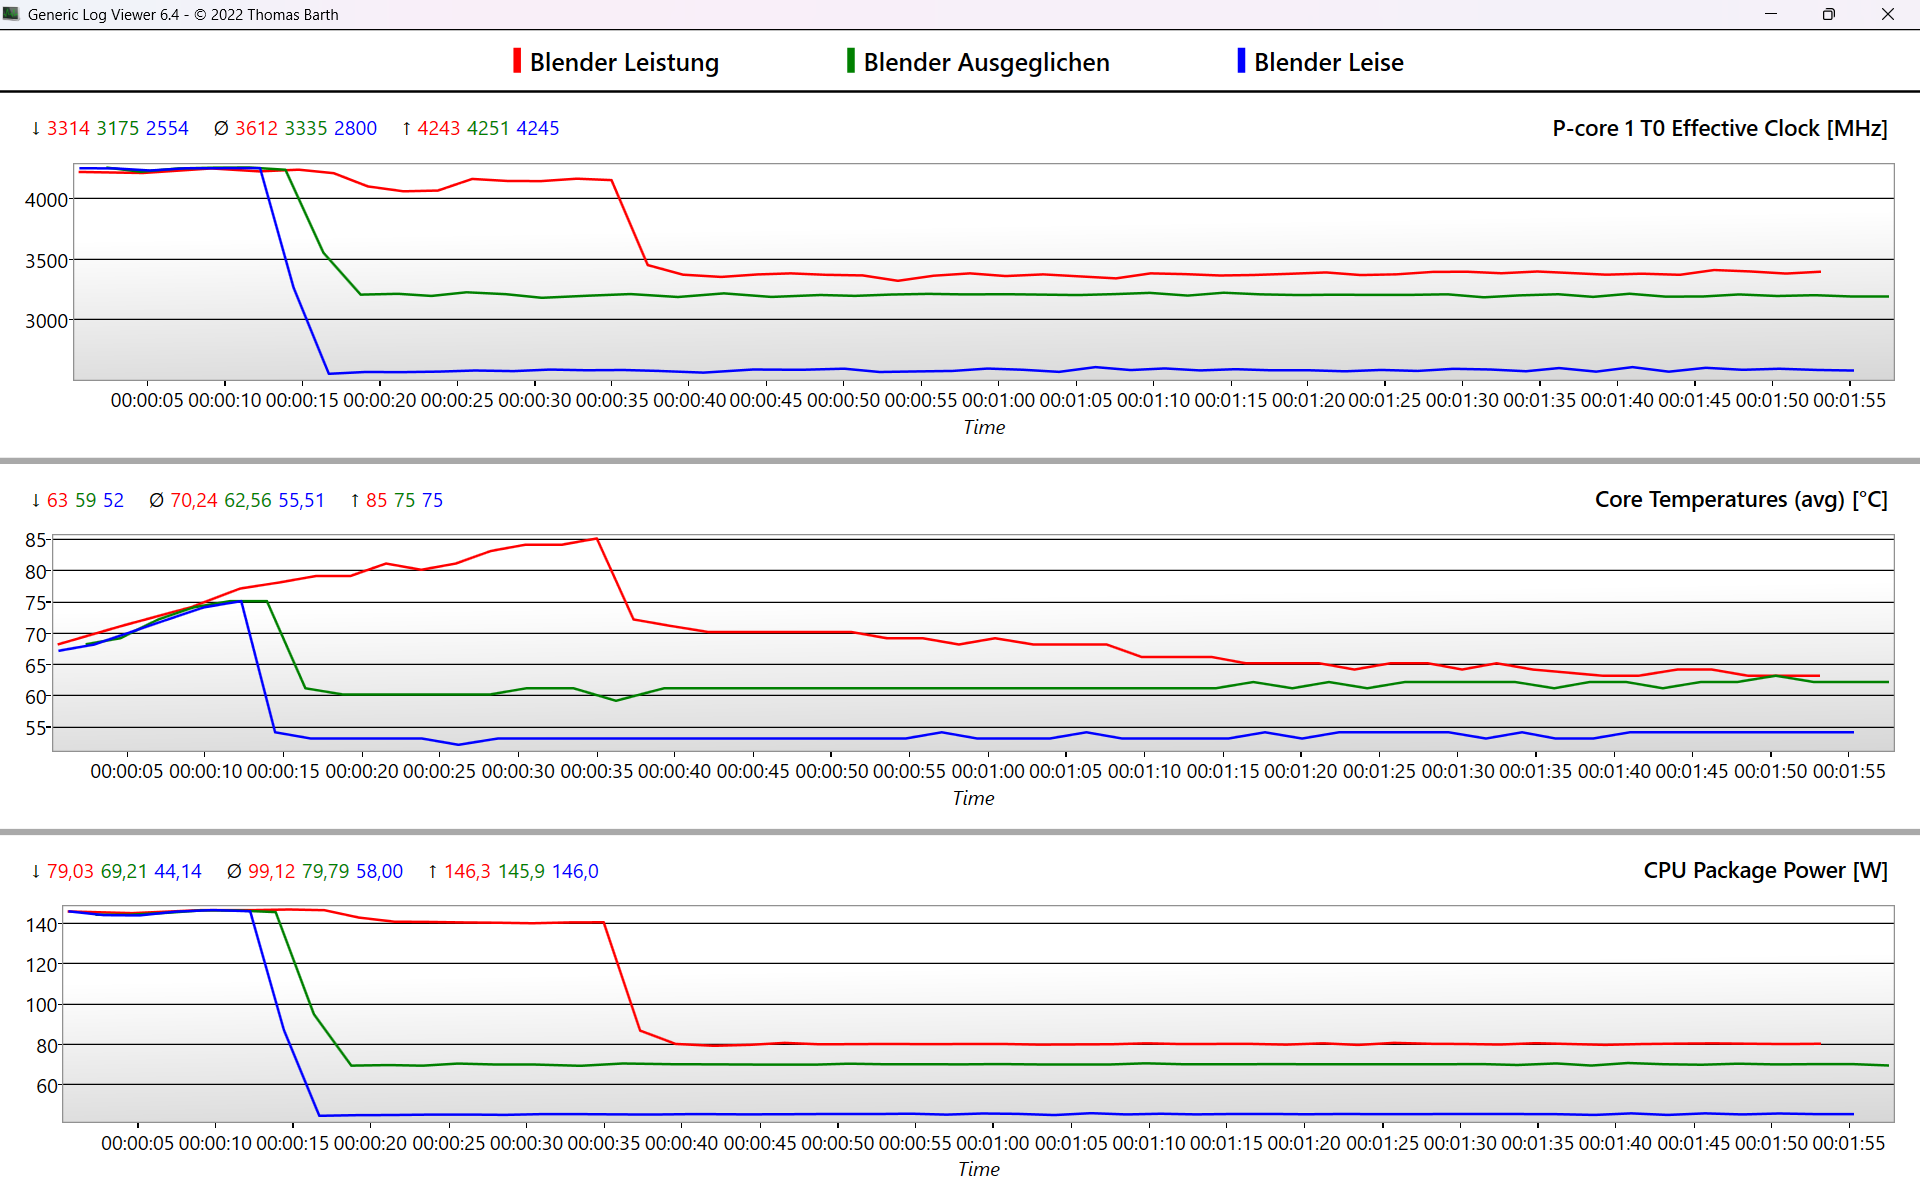
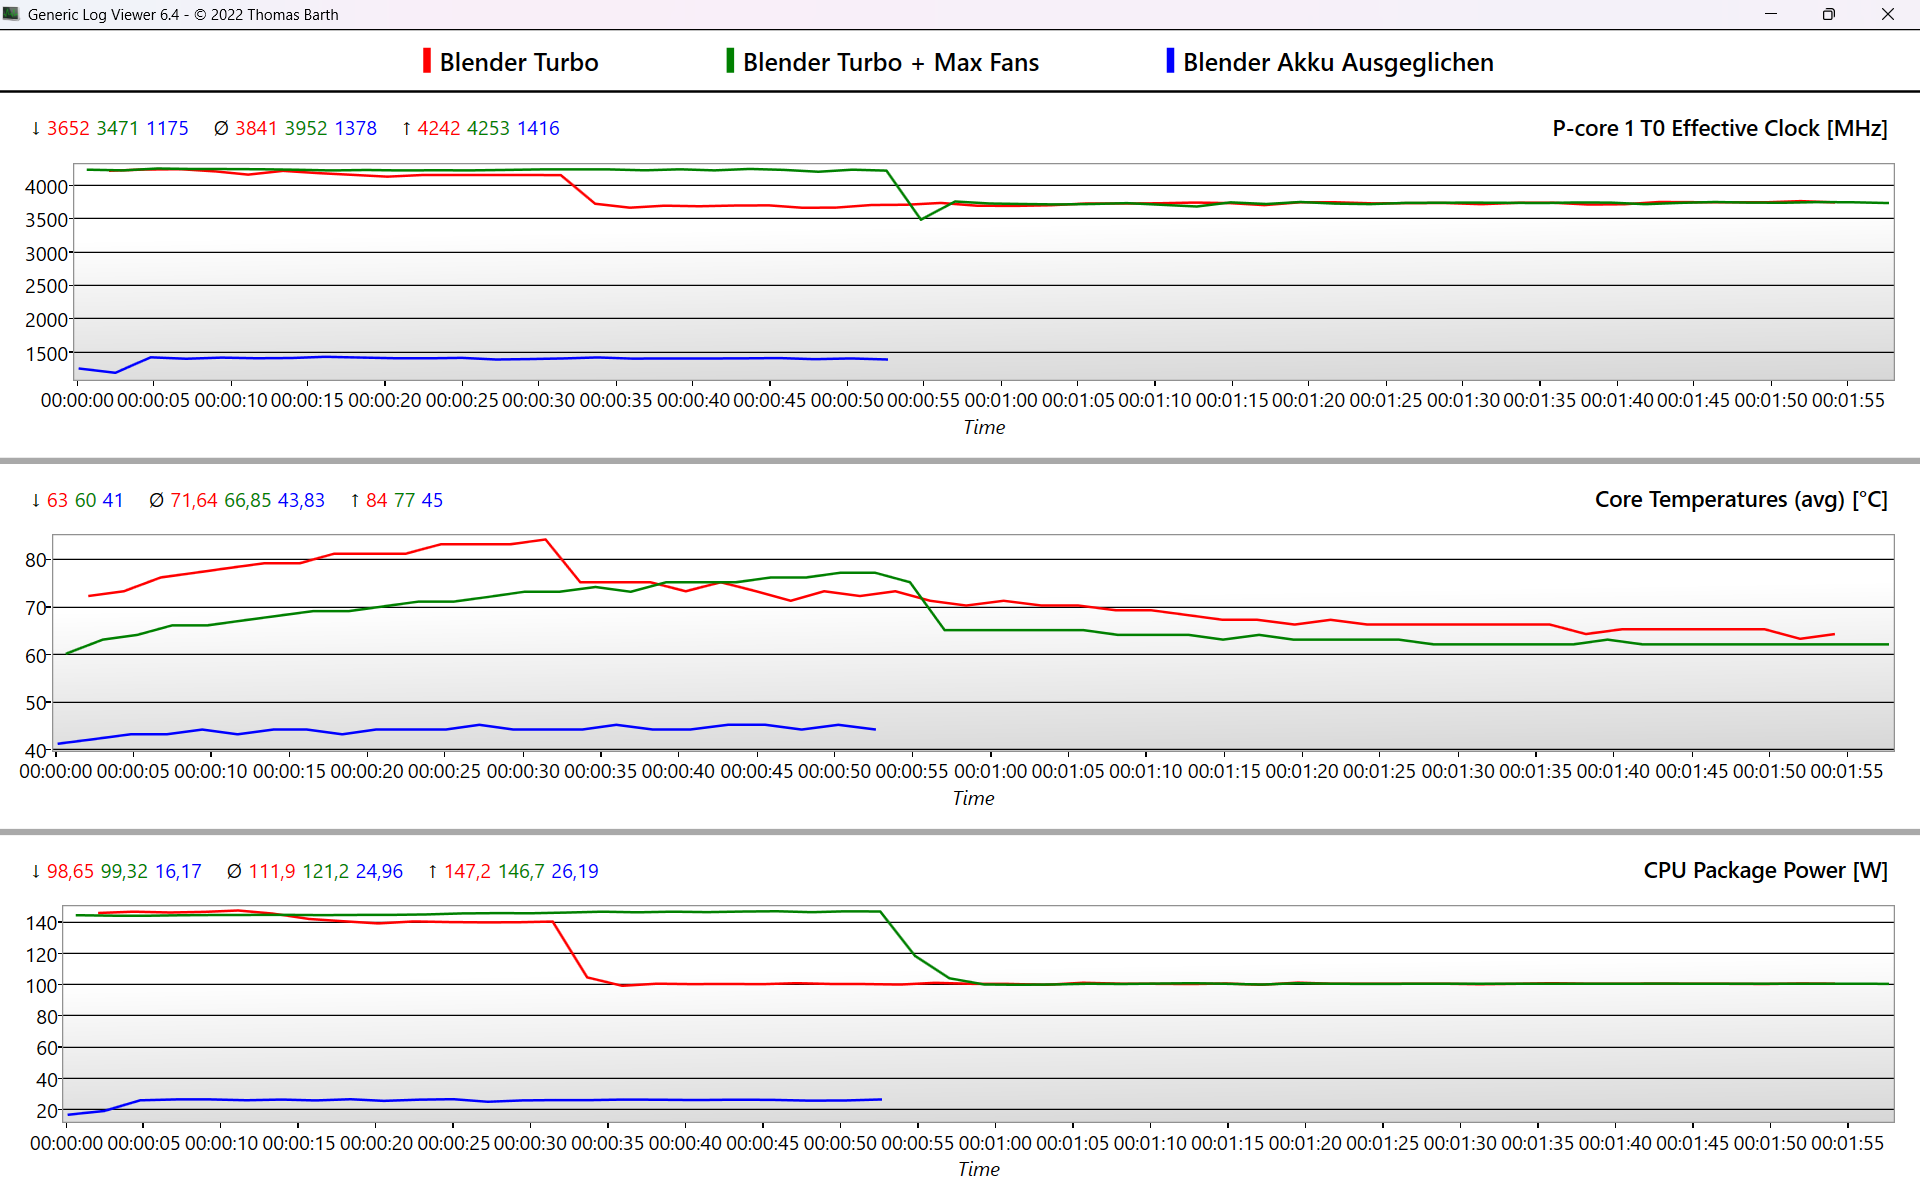
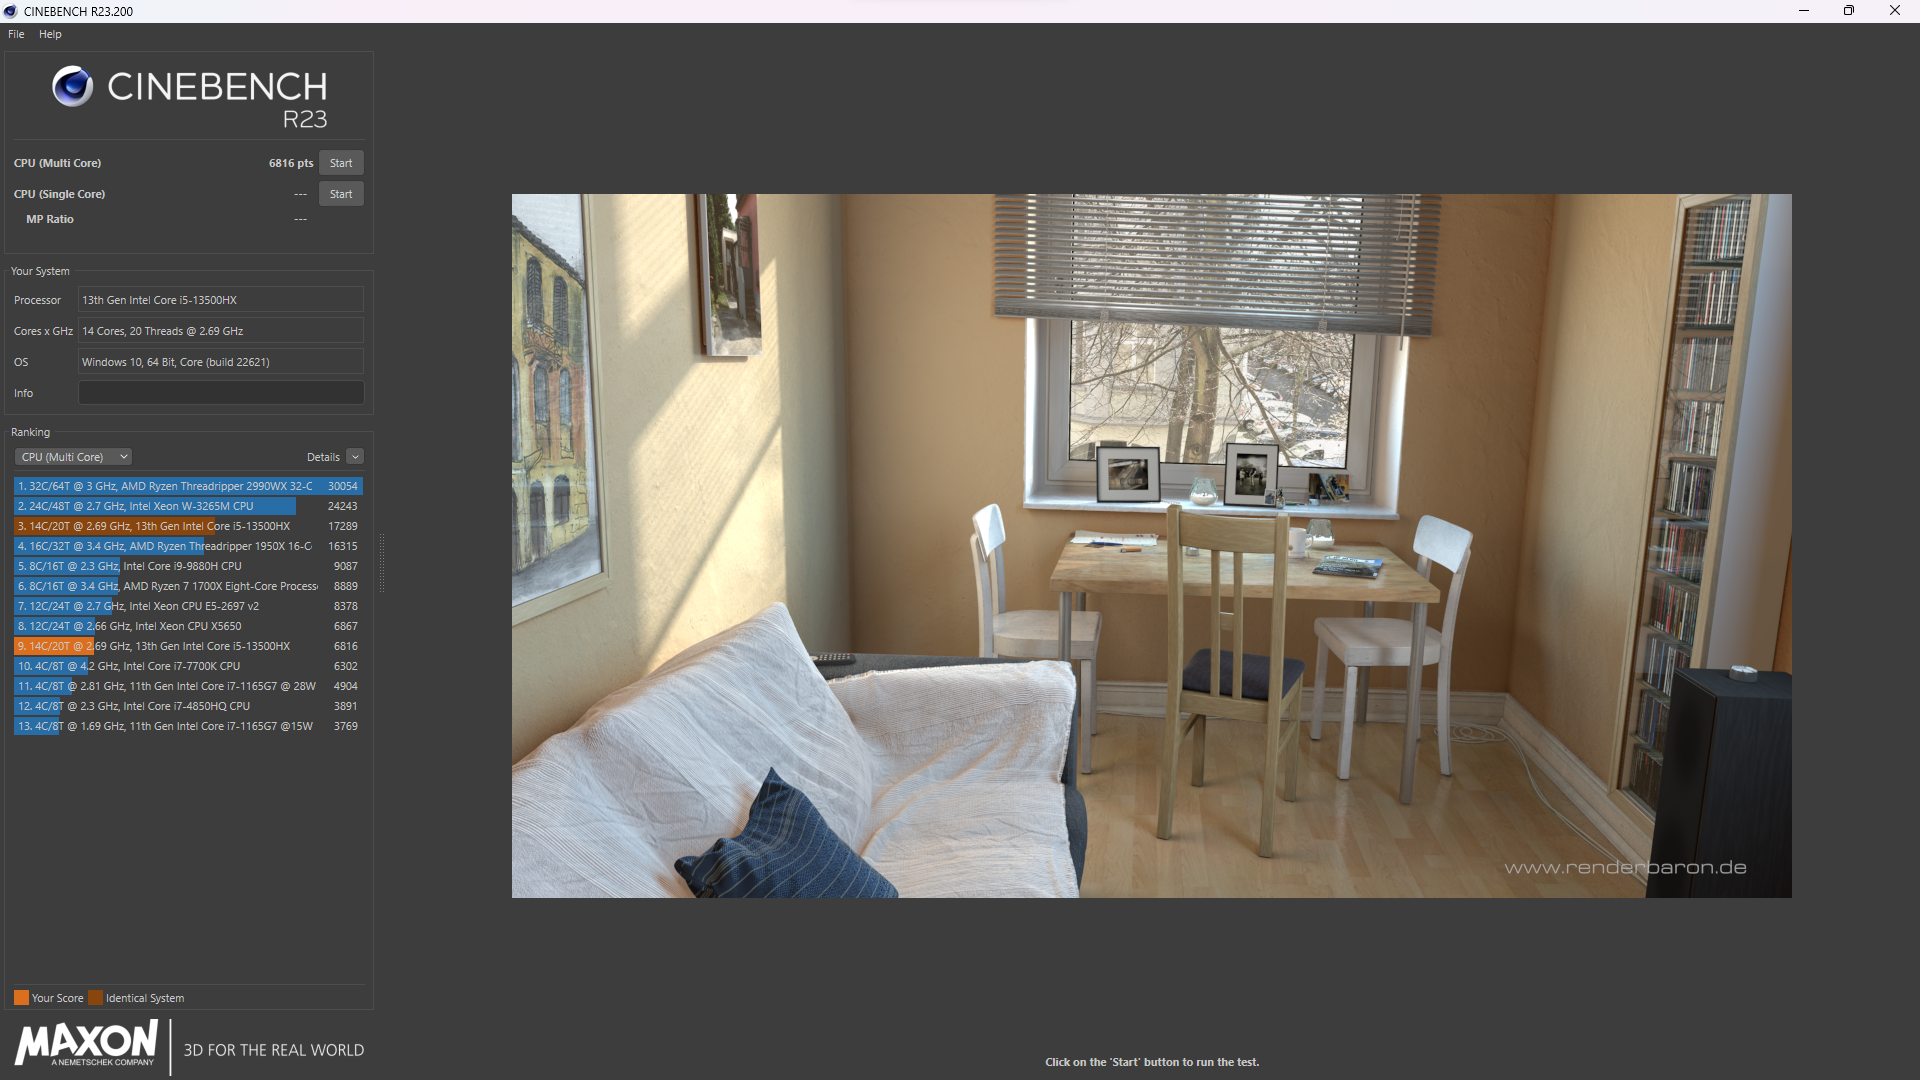
O laptop tem instalado o processador IntelCore i5-13500HX é um processador de classe desktop com 14 núcleos, 20 threads (6 núcleos P + 8 núcleos E) e um TDP de 55 watts. Os núcleos P inicialmente têm clock de cerca de 4,2 GHz e, como resultado, não atingem o Turbo máximo possível de 4,5 GHz. Após cerca de 30 segundos, as taxas de clock caem ligeiramente para 3,8 GHz (modo Turbo) ou 3,4 GHz (modo de desempenho).
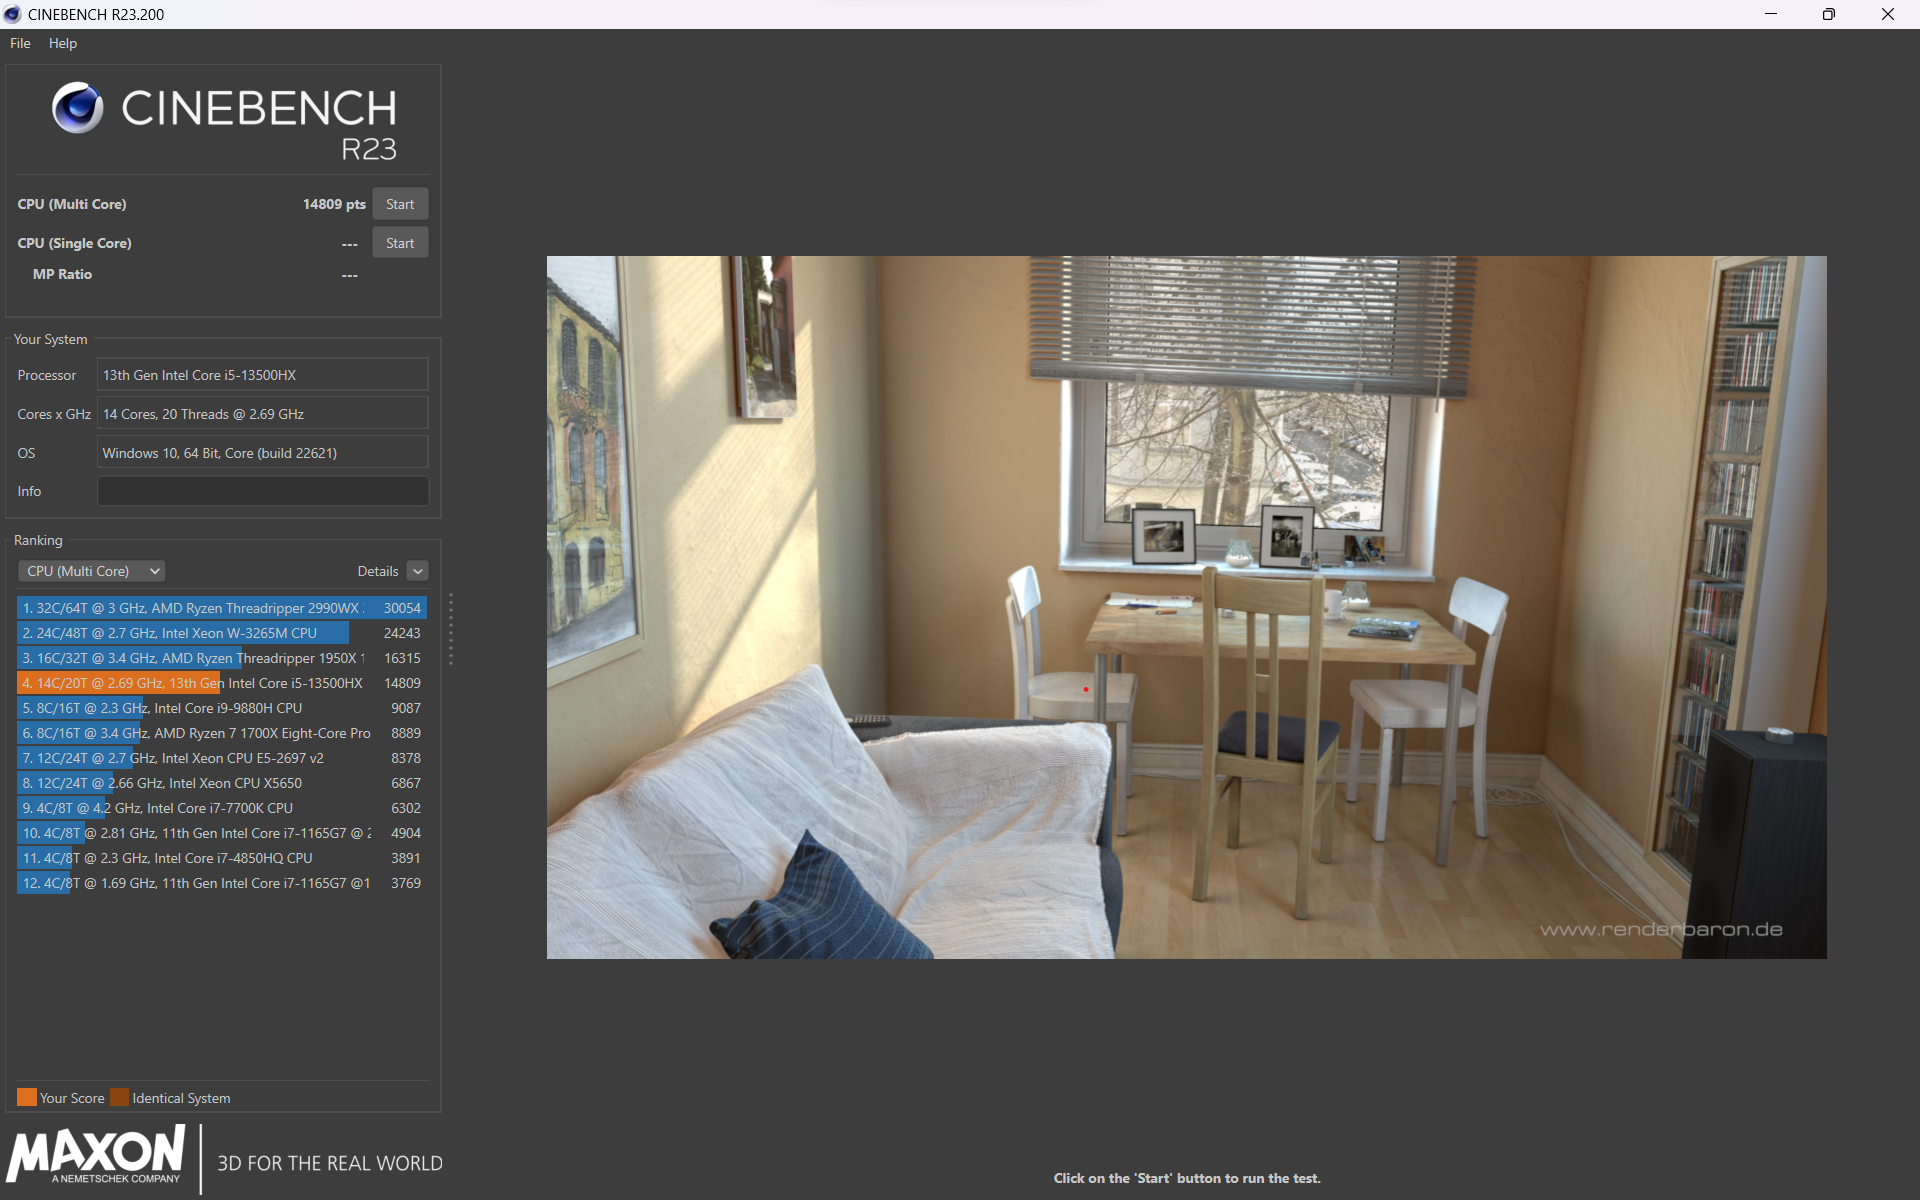
Quando se trata de desempenho de vários núcleos, o Helios Neo ficou 10 % atrás doDell G15 5530 com um Corei7-13650HX e 15 % atrás doHelios 16 com um Core i7-13700HX. O Corei7-12700H em seu predecessor direto, o Predator Helios 300foi superado em 12% e o AMD de oito núcleosRyzen 7 7840HS no SchenkerXMG Apex 15 foi superado em 20%.
A partir da quinta execução do Cinebench R15, seu desempenho foi reduzido em cerca de 17%, mas isso quase pode ser evitado com a ativação do modo Turbo alto. O processador opcional Corei9-13900HX disponível opcionalmente tem 24 núcleos completos e funciona 60% mais rápido em tarefas de vários núcleos no Helios 18. No modo de bateria, seu TDP é limitado a decepcionantes 27 watts, o que resulta em uma queda no desempenho de quase 60%.


Cinebench R15 Multi continuous test
Cinebench R23: Multi Core | Single Core
Cinebench R20: CPU (Multi Core) | CPU (Single Core)
Cinebench R15: CPU Multi 64Bit | CPU Single 64Bit
Blender: v2.79 BMW27 CPU
7-Zip 18.03: 7z b 4 | 7z b 4 -mmt1
Geekbench 5.5: Multi-Core | Single-Core
HWBOT x265 Benchmark v2.2: 4k Preset
LibreOffice : 20 Documents To PDF
R Benchmark 2.5: Overall mean
| Cinebench R20 / CPU (Multi Core) | |
| Acer Predator Helios 18 N23Q2 | |
| Média da turma Gaming (4029 - 16433, n=106, últimos 2 anos) | |
| Acer Predator Helios 16 PH16-71-731Q | |
| Dell G15 5530 | |
| Acer Predator Helios Neo 16 NH.QLTEG.002 | |
| Média Intel Core i5-13500HX (6978 - 7371, n=3) | |
| Schenker XMG Apex 15 (Late 23) | |
| Acer Predator Helios 300 (i7-12700H, RTX 3070 Ti) | |
| Lenovo LOQ 16IRH8 | |
| Lenovo Legion Pro 5 16ARX8 (R5 7645HX, RTX 4050) | |
| Acer Nitro 16 AN16-41-R7YE | |
| Cinebench R20 / CPU (Single Core) | |
| Acer Predator Helios 18 N23Q2 | |
| Média da turma Gaming (442 - 913, n=106, últimos 2 anos) | |
| Acer Predator Helios 16 PH16-71-731Q | |
| Dell G15 5530 | |
| Lenovo LOQ 16IRH8 | |
| Lenovo Legion Pro 5 16ARX8 (R5 7645HX, RTX 4050) | |
| Acer Predator Helios 300 (i7-12700H, RTX 3070 Ti) | |
| Schenker XMG Apex 15 (Late 23) | |
| Acer Predator Helios Neo 16 NH.QLTEG.002 | |
| Média Intel Core i5-13500HX (648 - 695, n=3) | |
| Acer Nitro 16 AN16-41-R7YE | |
| Cinebench R15 / CPU Single 64Bit | |
| Média da turma Gaming (188.8 - 350, n=106, últimos 2 anos) | |
| Acer Predator Helios 18 N23Q2 | |
| Lenovo Legion Pro 5 16ARX8 (R5 7645HX, RTX 4050) | |
| Schenker XMG Apex 15 (Late 23) | |
| Dell G15 5530 | |
| Acer Predator Helios 16 PH16-71-731Q | |
| Lenovo LOQ 16IRH8 | |
| Acer Predator Helios 300 (i7-12700H, RTX 3070 Ti) | |
| Acer Predator Helios Neo 16 NH.QLTEG.002 | |
| Média Intel Core i5-13500HX (242 - 263, n=3) | |
| Acer Nitro 16 AN16-41-R7YE | |
| HWBOT x265 Benchmark v2.2 / 4k Preset | |
| Acer Predator Helios 18 N23Q2 | |
| Média da turma Gaming (11.5 - 44.4, n=105, últimos 2 anos) | |
| Acer Predator Helios 16 PH16-71-731Q | |
| Dell G15 5530 | |
| Média Intel Core i5-13500HX (20.3 - 20.9, n=3) | |
| Acer Predator Helios Neo 16 NH.QLTEG.002 | |
| Schenker XMG Apex 15 (Late 23) | |
| Lenovo Legion Pro 5 16ARX8 (R5 7645HX, RTX 4050) | |
| Lenovo LOQ 16IRH8 | |
| Acer Predator Helios 300 (i7-12700H, RTX 3070 Ti) | |
| Acer Nitro 16 AN16-41-R7YE | |
| LibreOffice / 20 Documents To PDF | |
| Acer Predator Helios 300 (i7-12700H, RTX 3070 Ti) | |
| Lenovo Legion Pro 5 16ARX8 (R5 7645HX, RTX 4050) | |
| Média da turma Gaming (33.2 - 88.8, n=105, últimos 2 anos) | |
| Acer Predator Helios 18 N23Q2 | |
| Dell G15 5530 | |
| Acer Nitro 16 AN16-41-R7YE | |
| Lenovo LOQ 16IRH8 | |
| Acer Predator Helios Neo 16 NH.QLTEG.002 | |
| Schenker XMG Apex 15 (Late 23) | |
| Média Intel Core i5-13500HX (42.5 - 45, n=2) | |
| Acer Predator Helios 16 PH16-71-731Q | |
* ... menor é melhor
AIDA64: FP32 Ray-Trace | FPU Julia | CPU SHA3 | CPU Queen | FPU SinJulia | FPU Mandel | CPU AES | CPU ZLib | FP64 Ray-Trace | CPU PhotoWorxx
| Performance rating | |
| Média da turma Gaming | |
| Schenker XMG Apex 15 (Late 23) | |
| Dell G15 5530 | |
| Acer Predator Helios Neo 16 NH.QLTEG.002 | |
| Média Intel Core i5-13500HX | |
| Lenovo Legion Pro 5 16ARX8 (R5 7645HX, RTX 4050) | |
| HP Victus 16-r0076TX | |
| Lenovo LOQ 16IRH8 | |
| AIDA64 / FP32 Ray-Trace | |
| Média da turma Gaming (10227 - 85542, n=105, últimos 2 anos) | |
| Schenker XMG Apex 15 (Late 23) | |
| Lenovo Legion Pro 5 16ARX8 (R5 7645HX, RTX 4050) | |
| Dell G15 5530 | |
| Média Intel Core i5-13500HX (15888 - 16544, n=3) | |
| Acer Predator Helios Neo 16 NH.QLTEG.002 | |
| HP Victus 16-r0076TX | |
| Lenovo LOQ 16IRH8 | |
| AIDA64 / FPU Julia | |
| Média da turma Gaming (51376 - 238426, n=105, últimos 2 anos) | |
| Schenker XMG Apex 15 (Late 23) | |
| Lenovo Legion Pro 5 16ARX8 (R5 7645HX, RTX 4050) | |
| Dell G15 5530 | |
| HP Victus 16-r0076TX | |
| Média Intel Core i5-13500HX (80761 - 85623, n=3) | |
| Acer Predator Helios Neo 16 NH.QLTEG.002 | |
| Lenovo LOQ 16IRH8 | |
| AIDA64 / CPU SHA3 | |
| Média da turma Gaming (2180 - 10115, n=105, últimos 2 anos) | |
| Dell G15 5530 | |
| Schenker XMG Apex 15 (Late 23) | |
| Média Intel Core i5-13500HX (3868 - 4017, n=3) | |
| HP Victus 16-r0076TX | |
| Acer Predator Helios Neo 16 NH.QLTEG.002 | |
| Lenovo Legion Pro 5 16ARX8 (R5 7645HX, RTX 4050) | |
| Lenovo LOQ 16IRH8 | |
| AIDA64 / CPU Queen | |
| Média da turma Gaming (49785 - 173351, n=90, últimos 2 anos) | |
| Dell G15 5530 | |
| Acer Predator Helios Neo 16 NH.QLTEG.002 | |
| Média Intel Core i5-13500HX (105168 - 107075, n=3) | |
| Schenker XMG Apex 15 (Late 23) | |
| HP Victus 16-r0076TX | |
| Lenovo Legion Pro 5 16ARX8 (R5 7645HX, RTX 4050) | |
| Lenovo LOQ 16IRH8 | |
| AIDA64 / FPU SinJulia | |
| Schenker XMG Apex 15 (Late 23) | |
| Média da turma Gaming (4424 - 33636, n=105, últimos 2 anos) | |
| Lenovo Legion Pro 5 16ARX8 (R5 7645HX, RTX 4050) | |
| Dell G15 5530 | |
| Média Intel Core i5-13500HX (10334 - 10793, n=3) | |
| Acer Predator Helios Neo 16 NH.QLTEG.002 | |
| HP Victus 16-r0076TX | |
| Lenovo LOQ 16IRH8 | |
| AIDA64 / FPU Mandel | |
| Média da turma Gaming (25115 - 128721, n=105, últimos 2 anos) | |
| Schenker XMG Apex 15 (Late 23) | |
| Lenovo Legion Pro 5 16ARX8 (R5 7645HX, RTX 4050) | |
| Dell G15 5530 | |
| Média Intel Core i5-13500HX (39805 - 41418, n=3) | |
| Acer Predator Helios Neo 16 NH.QLTEG.002 | |
| HP Victus 16-r0076TX | |
| Lenovo LOQ 16IRH8 | |
| AIDA64 / CPU AES | |
| Schenker XMG Apex 15 (Late 23) | |
| Acer Predator Helios Neo 16 NH.QLTEG.002 | |
| Média da turma Gaming (39258 - 247074, n=105, últimos 2 anos) | |
| Média Intel Core i5-13500HX (79903 - 154368, n=3) | |
| Dell G15 5530 | |
| HP Victus 16-r0076TX | |
| Lenovo LOQ 16IRH8 | |
| Lenovo Legion Pro 5 16ARX8 (R5 7645HX, RTX 4050) | |
| AIDA64 / CPU ZLib | |
| Média da turma Gaming (574 - 2531, n=105, últimos 2 anos) | |
| Dell G15 5530 | |
| Acer Predator Helios Neo 16 NH.QLTEG.002 | |
| Média Intel Core i5-13500HX (1104 - 1233, n=3) | |
| HP Victus 16-r0076TX | |
| Schenker XMG Apex 15 (Late 23) | |
| Lenovo Legion Pro 5 16ARX8 (R5 7645HX, RTX 4050) | |
| Lenovo LOQ 16IRH8 | |
| AIDA64 / FP64 Ray-Trace | |
| Média da turma Gaming (5509 - 45446, n=105, últimos 2 anos) | |
| Schenker XMG Apex 15 (Late 23) | |
| Lenovo Legion Pro 5 16ARX8 (R5 7645HX, RTX 4050) | |
| Dell G15 5530 | |
| Média Intel Core i5-13500HX (8587 - 9008, n=3) | |
| Acer Predator Helios Neo 16 NH.QLTEG.002 | |
| HP Victus 16-r0076TX | |
| Lenovo LOQ 16IRH8 | |
| AIDA64 / CPU PhotoWorxx | |
| Média da turma Gaming (12271 - 89891, n=105, últimos 2 anos) | |
| Média Intel Core i5-13500HX (36861 - 42683, n=3) | |
| Dell G15 5530 | |
| HP Victus 16-r0076TX | |
| Acer Predator Helios Neo 16 NH.QLTEG.002 | |
| Schenker XMG Apex 15 (Late 23) | |
| Lenovo LOQ 16IRH8 | |
| Lenovo Legion Pro 5 16ARX8 (R5 7645HX, RTX 4050) | |
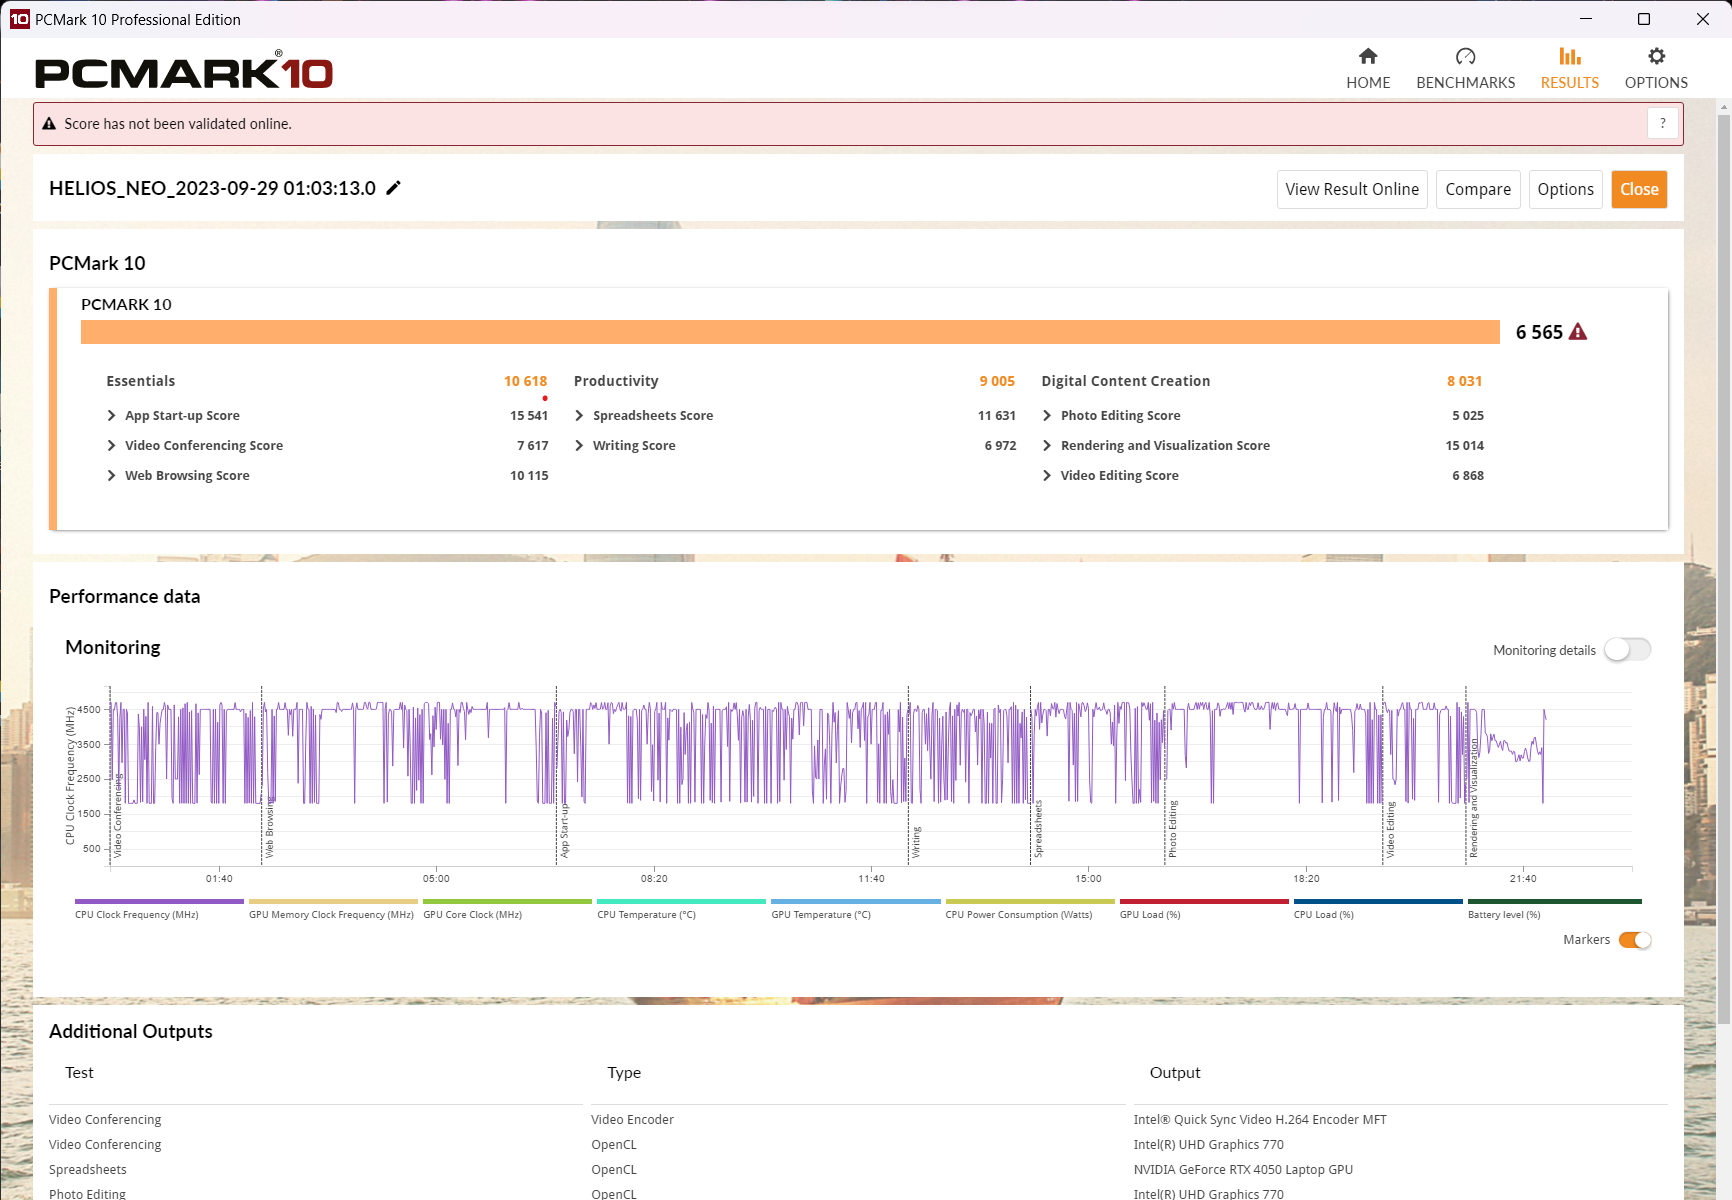
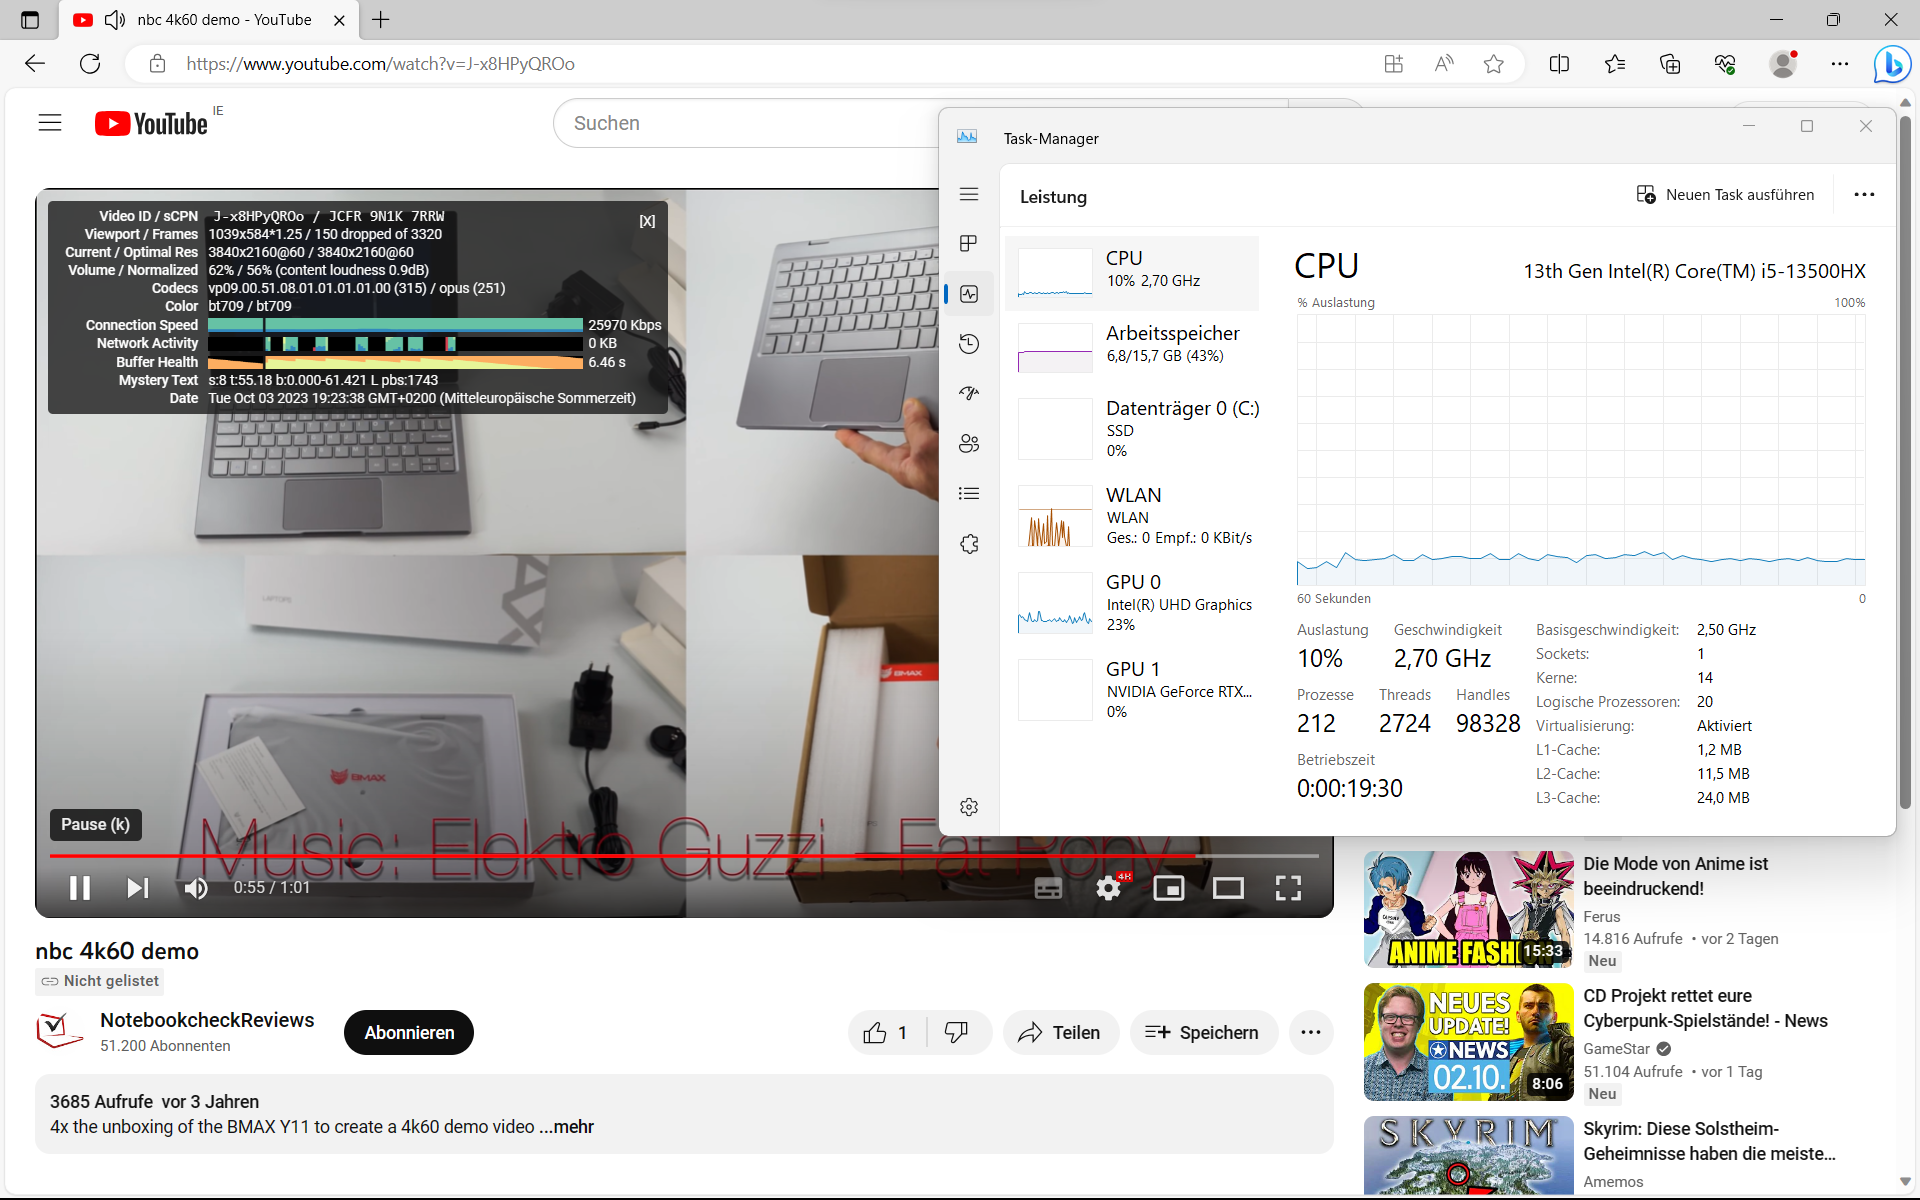
Desempenho do sistema
O laptop para jogos da Acer é muito ágil durante as tarefas diárias. Navegar na Web enquanto o YouTube 4K é reproduzido parece um feriado para o sistema Intel HX. Durante o benchmark PCMark 10, o Predator Helios Neo ficou atrás dos sistemas AMD LenovoLegion Pro 5 e SchenkerXMG Apex 15 em cerca de 30%, especialmente no que se refere à criação de conteúdo. No entanto, o Neo quase alcançou a primeira posição durante o teste Crossmark.
Seu desempenho de navegação na Web, por exemplo, usando o Mozilla Kraken 1.1 e o WebXPRT, é muito bom graças ao forte desempenho de núcleo único do laptop, mas não tão bom quanto o do Legion Pro 5.
CrossMark: Overall | Productivity | Creativity | Responsiveness
Mozilla Kraken 1.1: Total
Octane V2: Total Score
Speedometer 2.0: Result 2.0
Jetstream 2: 2.0 Total
WebXPRT 3: Overall
WebXPRT 4: Overall
| PCMark 10 / Score | |
| Média da turma Gaming (5828 - 12414, n=93, últimos 2 anos) | |
| Lenovo Legion Pro 5 16ARX8 (R5 7645HX, RTX 4050) | |
| Schenker XMG Apex 15 (Late 23) | |
| Dell G15 5530 | |
| Lenovo LOQ 16IRH8 | |
| Acer Predator Helios Neo 16 NH.QLTEG.002 | |
| Média Intel Core i5-13500HX, NVIDIA GeForce RTX 4050 Laptop GPU (6125 - 6565, n=2) | |
| HP Victus 16-r0076TX | |
| PCMark 10 / Essentials | |
| Lenovo Legion Pro 5 16ARX8 (R5 7645HX, RTX 4050) | |
| Dell G15 5530 | |
| Schenker XMG Apex 15 (Late 23) | |
| Média da turma Gaming (8810 - 11935, n=97, últimos 2 anos) | |
| Acer Predator Helios Neo 16 NH.QLTEG.002 | |
| Média Intel Core i5-13500HX, NVIDIA GeForce RTX 4050 Laptop GPU (9625 - 10618, n=2) | |
| Lenovo LOQ 16IRH8 | |
| HP Victus 16-r0076TX | |
| PCMark 10 / Productivity | |
| Média da turma Gaming (6845 - 25323, n=95, últimos 2 anos) | |
| Lenovo Legion Pro 5 16ARX8 (R5 7645HX, RTX 4050) | |
| Schenker XMG Apex 15 (Late 23) | |
| Dell G15 5530 | |
| Acer Predator Helios Neo 16 NH.QLTEG.002 | |
| Média Intel Core i5-13500HX, NVIDIA GeForce RTX 4050 Laptop GPU (8471 - 9005, n=2) | |
| Lenovo LOQ 16IRH8 | |
| HP Victus 16-r0076TX | |
| PCMark 10 / Digital Content Creation | |
| Média da turma Gaming (7602 - 19954, n=95, últimos 2 anos) | |
| Schenker XMG Apex 15 (Late 23) | |
| Lenovo Legion Pro 5 16ARX8 (R5 7645HX, RTX 4050) | |
| Lenovo LOQ 16IRH8 | |
| Dell G15 5530 | |
| Acer Predator Helios Neo 16 NH.QLTEG.002 | |
| Média Intel Core i5-13500HX, NVIDIA GeForce RTX 4050 Laptop GPU (7649 - 8031, n=2) | |
| HP Victus 16-r0076TX | |
| CrossMark / Overall | |
| Média da turma Gaming (1366 - 2409, n=94, últimos 2 anos) | |
| Acer Predator Helios Neo 16 NH.QLTEG.002 | |
| Lenovo LOQ 16IRH8 | |
| Lenovo Legion Pro 5 16ARX8 (R5 7645HX, RTX 4050) | |
| Dell G15 5530 | |
| Média Intel Core i5-13500HX, NVIDIA GeForce RTX 4050 Laptop GPU (1701 - 1964, n=2) | |
| Schenker XMG Apex 15 (Late 23) | |
| HP Victus 16-r0076TX | |
| CrossMark / Productivity | |
| Lenovo Legion Pro 5 16ARX8 (R5 7645HX, RTX 4050) | |
| Acer Predator Helios Neo 16 NH.QLTEG.002 | |
| Lenovo LOQ 16IRH8 | |
| Média da turma Gaming (1386 - 2254, n=94, últimos 2 anos) | |
| Dell G15 5530 | |
| Média Intel Core i5-13500HX, NVIDIA GeForce RTX 4050 Laptop GPU (1585 - 1878, n=2) | |
| Schenker XMG Apex 15 (Late 23) | |
| HP Victus 16-r0076TX | |
| CrossMark / Creativity | |
| Média da turma Gaming (1343 - 2786, n=94, últimos 2 anos) | |
| Dell G15 5530 | |
| Lenovo LOQ 16IRH8 | |
| Lenovo Legion Pro 5 16ARX8 (R5 7645HX, RTX 4050) | |
| Acer Predator Helios Neo 16 NH.QLTEG.002 | |
| Média Intel Core i5-13500HX, NVIDIA GeForce RTX 4050 Laptop GPU (1912 - 2022, n=2) | |
| Schenker XMG Apex 15 (Late 23) | |
| HP Victus 16-r0076TX | |
| CrossMark / Responsiveness | |
| Acer Predator Helios Neo 16 NH.QLTEG.002 | |
| Lenovo LOQ 16IRH8 | |
| Lenovo Legion Pro 5 16ARX8 (R5 7645HX, RTX 4050) | |
| Média Intel Core i5-13500HX, NVIDIA GeForce RTX 4050 Laptop GPU (1478 - 2053, n=2) | |
| Média da turma Gaming (1226 - 2334, n=94, últimos 2 anos) | |
| Dell G15 5530 | |
| Schenker XMG Apex 15 (Late 23) | |
| HP Victus 16-r0076TX | |
| Mozilla Kraken 1.1 / Total | |
| HP Victus 16-r0076TX | |
| Média Intel Core i5-13500HX, NVIDIA GeForce RTX 4050 Laptop GPU (521 - 550, n=3) | |
| Acer Predator Helios Neo 16 NH.QLTEG.002 | |
| Schenker XMG Apex 15 (Late 23) | |
| Dell G15 5530 | |
| Lenovo LOQ 16IRH8 | |
| Lenovo LOQ 16IRH8 | |
| Lenovo Legion Pro 5 16ARX8 (R5 7645HX, RTX 4050) | |
| Média da turma Gaming (391 - 590, n=100, últimos 2 anos) | |
| Octane V2 / Total Score | |
| Média da turma Gaming (93292 - 139447, n=27, últimos 2 anos) | |
| Schenker XMG Apex 15 (Late 23) | |
| Acer Predator Helios Neo 16 NH.QLTEG.002 | |
| Média Intel Core i5-13500HX, NVIDIA GeForce RTX 4050 Laptop GPU (n=1) | |
| Lenovo Legion Pro 5 16ARX8 (R5 7645HX, RTX 4050) | |
| Speedometer 2.0 / Result 2.0 | |
| Média da turma Gaming (29 - 736, n=27, últimos 2 anos) | |
| Média Intel Core i5-13500HX, NVIDIA GeForce RTX 4050 Laptop GPU (n=1) | |
| Acer Predator Helios Neo 16 NH.QLTEG.002 | |
| Schenker XMG Apex 15 (Late 23) | |
| Jetstream 2 / 2.0 Total | |
| Média da turma Gaming (334 - 516, n=27, últimos 2 anos) | |
| Acer Predator Helios Neo 16 NH.QLTEG.002 | |
| Média Intel Core i5-13500HX, NVIDIA GeForce RTX 4050 Laptop GPU (n=1) | |
| Schenker XMG Apex 15 (Late 23) | |
| Lenovo Legion Pro 5 16ARX8 (R5 7645HX, RTX 4050) | |
| WebXPRT 3 / Overall | |
| Lenovo Legion Pro 5 16ARX8 (R5 7645HX, RTX 4050) | |
| Lenovo LOQ 16IRH8 | |
| Lenovo LOQ 16IRH8 | |
| Média da turma Gaming (220 - 532, n=98, últimos 2 anos) | |
| Schenker XMG Apex 15 (Late 23) | |
| Acer Predator Helios Neo 16 NH.QLTEG.002 | |
| Dell G15 5530 | |
| Média Intel Core i5-13500HX, NVIDIA GeForce RTX 4050 Laptop GPU (255 - 294, n=3) | |
| HP Victus 16-r0076TX | |
| WebXPRT 4 / Overall | |
| Média da turma Gaming (165 - 354, n=98, últimos 2 anos) | |
| Dell G15 5530 | |
| Lenovo Legion Pro 5 16ARX8 (R5 7645HX, RTX 4050) | |
| Média Intel Core i5-13500HX, NVIDIA GeForce RTX 4050 Laptop GPU (240 - 257, n=3) | |
| HP Victus 16-r0076TX | |
| Acer Predator Helios Neo 16 NH.QLTEG.002 | |
* ... menor é melhor
| PCMark 10 Score | 6565 pontos | |
Ajuda | ||
* ... menor é melhor
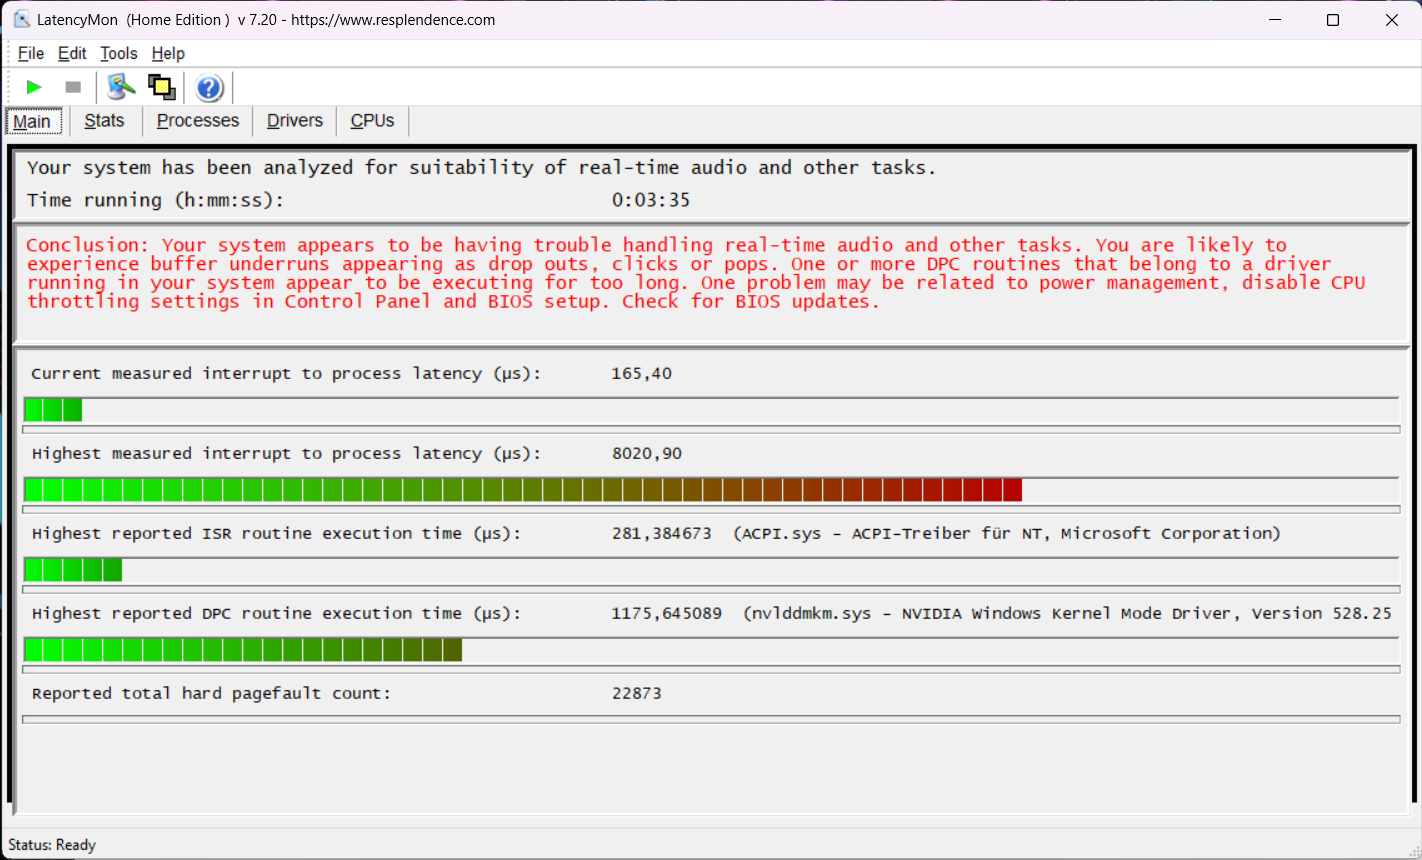
Latência DPC
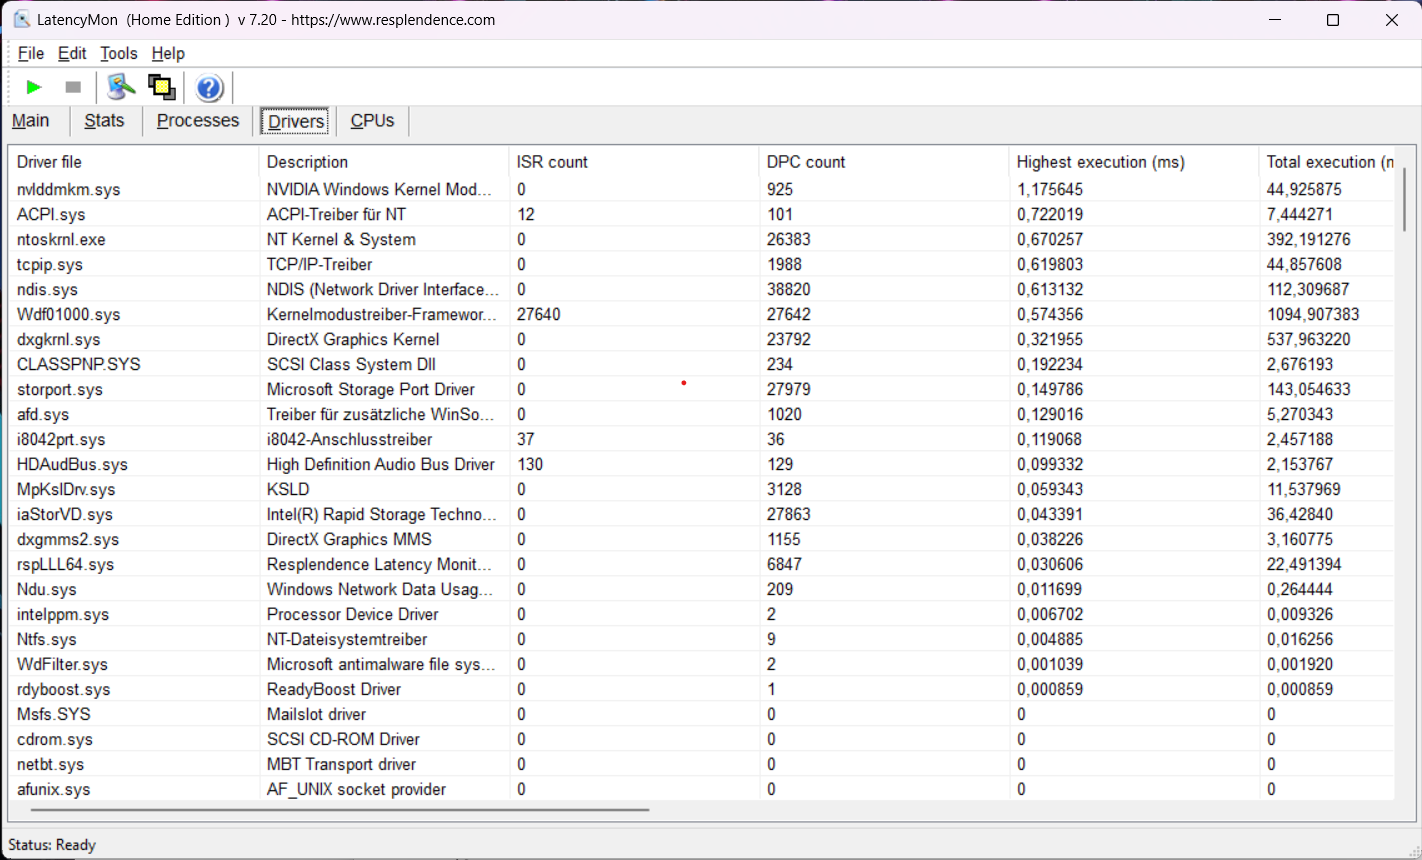
As latências DPC muito altas do dispositivo Acer, de 8.021 µs (testadas várias vezes), impedem o uso de software multimídia em tempo real. O principal motivo para isso é o driver gráfico da Nvidia. As atualizações do driver e do BIOS podem melhorar ou piorar o resultado.
| DPC Latencies / LatencyMon - interrupt to process latency (max), Web, Youtube, Prime95 | |
| Acer Predator Helios Neo 16 NH.QLTEG.002 | |
| Dell G15 5530 | |
| HP Victus 16-r0076TX | |
| Lenovo LOQ 16IRH8 | |
| Lenovo Legion Pro 5 16ARX8 (R5 7645HX, RTX 4050) | |
| Schenker XMG Apex 15 (Late 23) | |
* ... menor é melhor
Dispositivos de armazenamento
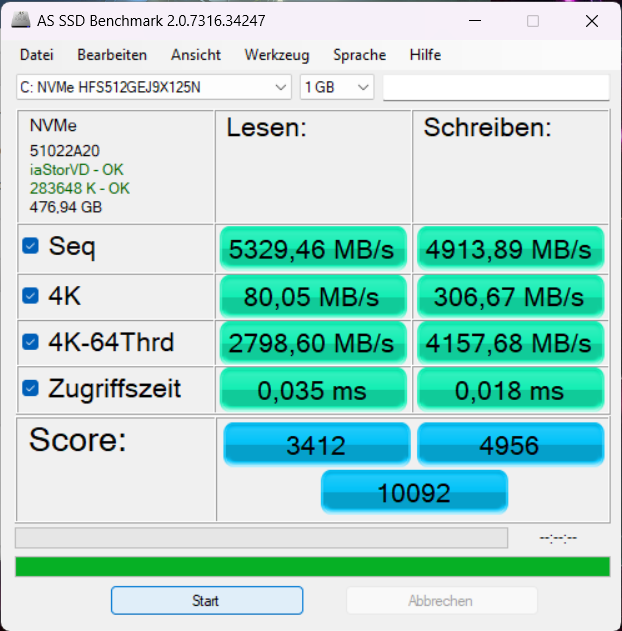
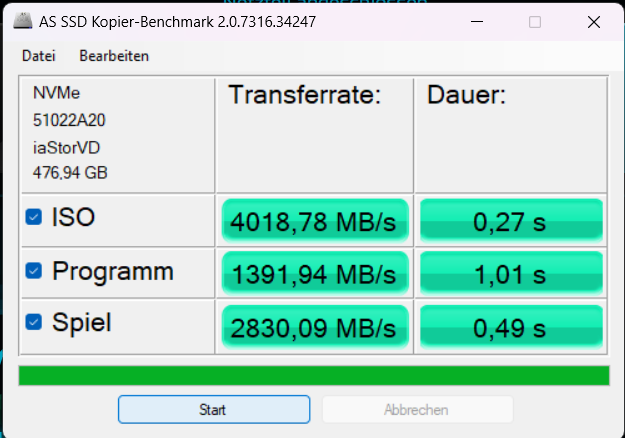
O SSD PCIe 4.0 da SK Hynix instalado tem uma capacidade de 512 GB. Suas taxas de transferência de até 5.330 MB/s (leituras sequenciais) são altas, assim como suas taxas de gravação e valores de 4K. Isso coloca o Helios Neo 16 em primeiro lugar entre os dispositivos de comparação em nossa classificação de desempenho.
Entretanto, após algum tempo, ocorre um estrangulamento cíclico induzido termicamente, como pode ser visto no gráfico "DiskSpd Read Loop" abaixo. São suportados até dois SSDs M.2 internos (também de dupla face).
| Acer Predator Helios Neo 16 NH.QLTEG.002 SK hynix HFS512GEJ9X125N | Lenovo Legion Pro 5 16ARX8 (R5 7645HX, RTX 4050) SK hynix PC801 HFS512GEJ9X115N | Lenovo LOQ 16IRH8 Solidigm SSDPFINW512GZL | Schenker XMG Apex 15 (Late 23) Samsung 990 Pro 1 TB | HP Victus 16-r0076TX SK hynix PC801 HFS512GEJ9X101N BF | Dell G15 5530 SSTC CL4-3D512-Q11 | |
|---|---|---|---|---|---|---|
| AS SSD | -11% | -59% | -18% | -27% | -142% | |
| Seq Read (MB/s) | 5329.5 | 5872 10% | 2603 -51% | 5586.1 5% | 5149.98 -3% | 2603.73 -51% |
| Seq Write (MB/s) | 4913.9 | 4253 -13% | 1427 -71% | 5512.25 12% | 3064.93 -38% | 494.63 -90% |
| 4K Read (MB/s) | 80.05 | 70.52 -12% | 64.4 -20% | 65.32 -18% | 62.73 -22% | 36.37 -55% |
| 4K Write (MB/s) | 306.67 | 251.8 -18% | 237 -23% | 193.71 -37% | 219.1 -29% | 188.64 -38% |
| 4K-64 Read (MB/s) | 2798.6 | 2755 -2% | 451 -84% | 2970.82 6% | 902.17 -68% | 932.26 -67% |
| 4K-64 Write (MB/s) | 4157.7 | 2647 -36% | 1265 -70% | 3872.46 -7% | 2901.89 -30% | 276.64 -93% |
| Access Time Read * (ms) | 0.035 | 0.039 -11% | 0.055 -57% | 0.038 -9% | 0.036 -3% | 0.103 -194% |
| Access Time Write * (ms) | 0.018 | 0.017 6% | 0.036 -100% | 0.02 -11% | 0.018 -0% | 0.182 -911% |
| Score Read (Points) | 3412 | 3413 0% | 776 -77% | 3595 5% | 1480 -57% | 1229 -64% |
| Score Write (Points) | 4956 | 3324 -33% | 1645 -67% | 4617 -7% | 3427 -31% | 515 -90% |
| Score Total (Points) | 10092 | 8397 -17% | 2782 -72% | 10039 -1% | 5574 -45% | 2271 -77% |
| Copy ISO MB/s (MB/s) | 4018.8 | 2397.08 -40% | 1100.94 -73% | 3765 -6% | 488.98 -88% | |
| Copy Program MB/s (MB/s) | 1391.9 | 751.31 -46% | 579.88 -58% | 1030 -26% | 296.26 -79% | |
| Copy Game MB/s (MB/s) | 2830.1 | 1329.99 -53% | 1006.61 -64% | 2124 -25% | 452.22 -84% | |
| DiskSpd | -1% | -48% | 5% | -29% | -64% | |
| seq read (MB/s) | 3283 | 4770 45% | 2171 -34% | 3181 -3% | 4378 33% | 2726 -17% |
| seq write (MB/s) | 4923 | 4938 0% | 1640 -67% | 5612 14% | 3325 -32% | 535 -89% |
| seq q8 t1 read (MB/s) | 6309 | 7328 16% | 3507 -44% | 7148 13% | 7109 13% | 2985 -53% |
| seq q8 t1 write (MB/s) | 4968 | 4936 -1% | 1645 -67% | 6887 39% | 5027 1% | 539 -89% |
| 4k q1 t1 read (MB/s) | 78.3 | 75.5 -4% | 82.1 5% | 68 -13% | 61.5 -21% | 34 -57% |
| 4k q1 t1 write (MB/s) | 393 | 296 -25% | 288 -27% | 231 -41% | 157.3 -60% | 224 -43% |
| 4k q32 t16 read (MB/s) | 4255 | 3794 -11% | 478 -89% | 4920 16% | 954 -78% | 1054 -75% |
| 4k q32 t16 write (MB/s) | 3869 | 2679 -31% | 1631 -58% | 4336 12% | 527 -86% | 507 -87% |
| Média Total (Programa/Configurações) | -6% /
-7% | -54% /
-55% | -7% /
-10% | -28% /
-28% | -103% /
-113% |
* ... menor é melhor
* ... menor é melhor
Reading continuous performance: DiskSpd Read Loop, Queue Depth 8
Placa de vídeo
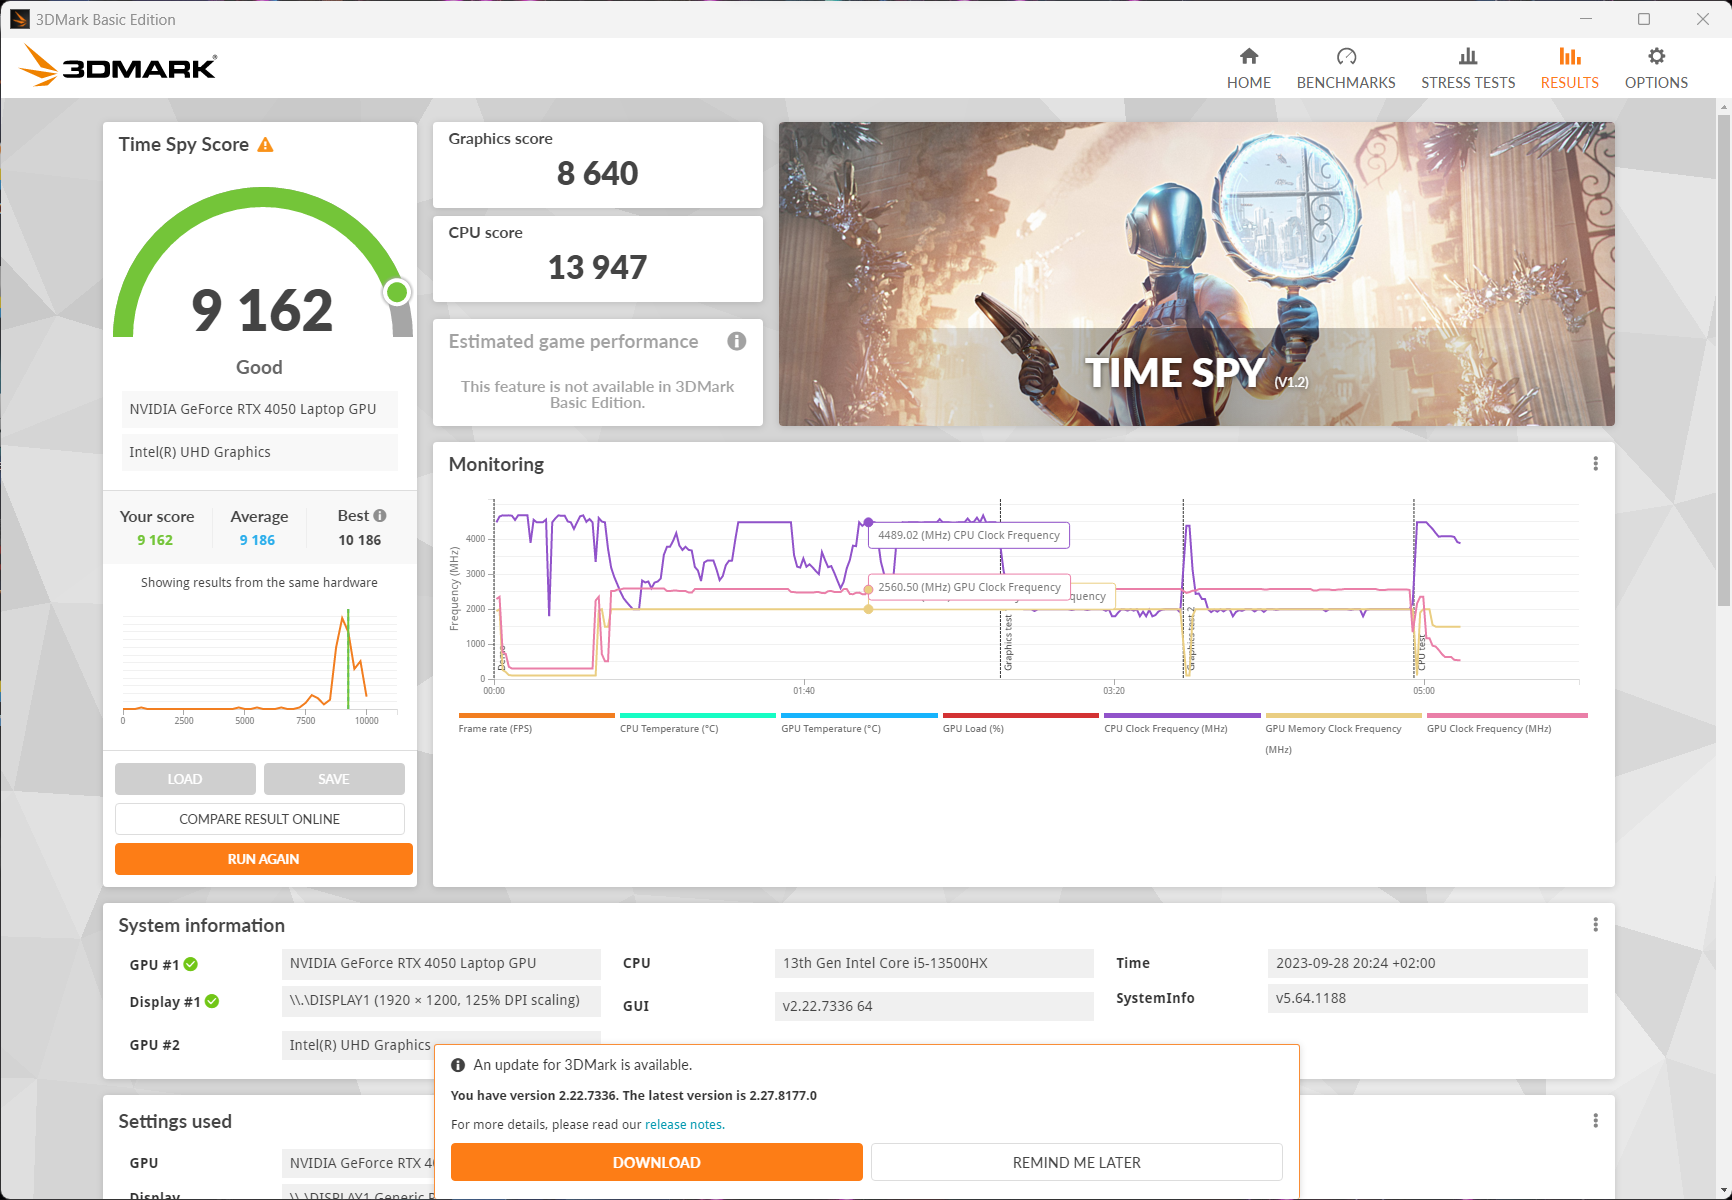
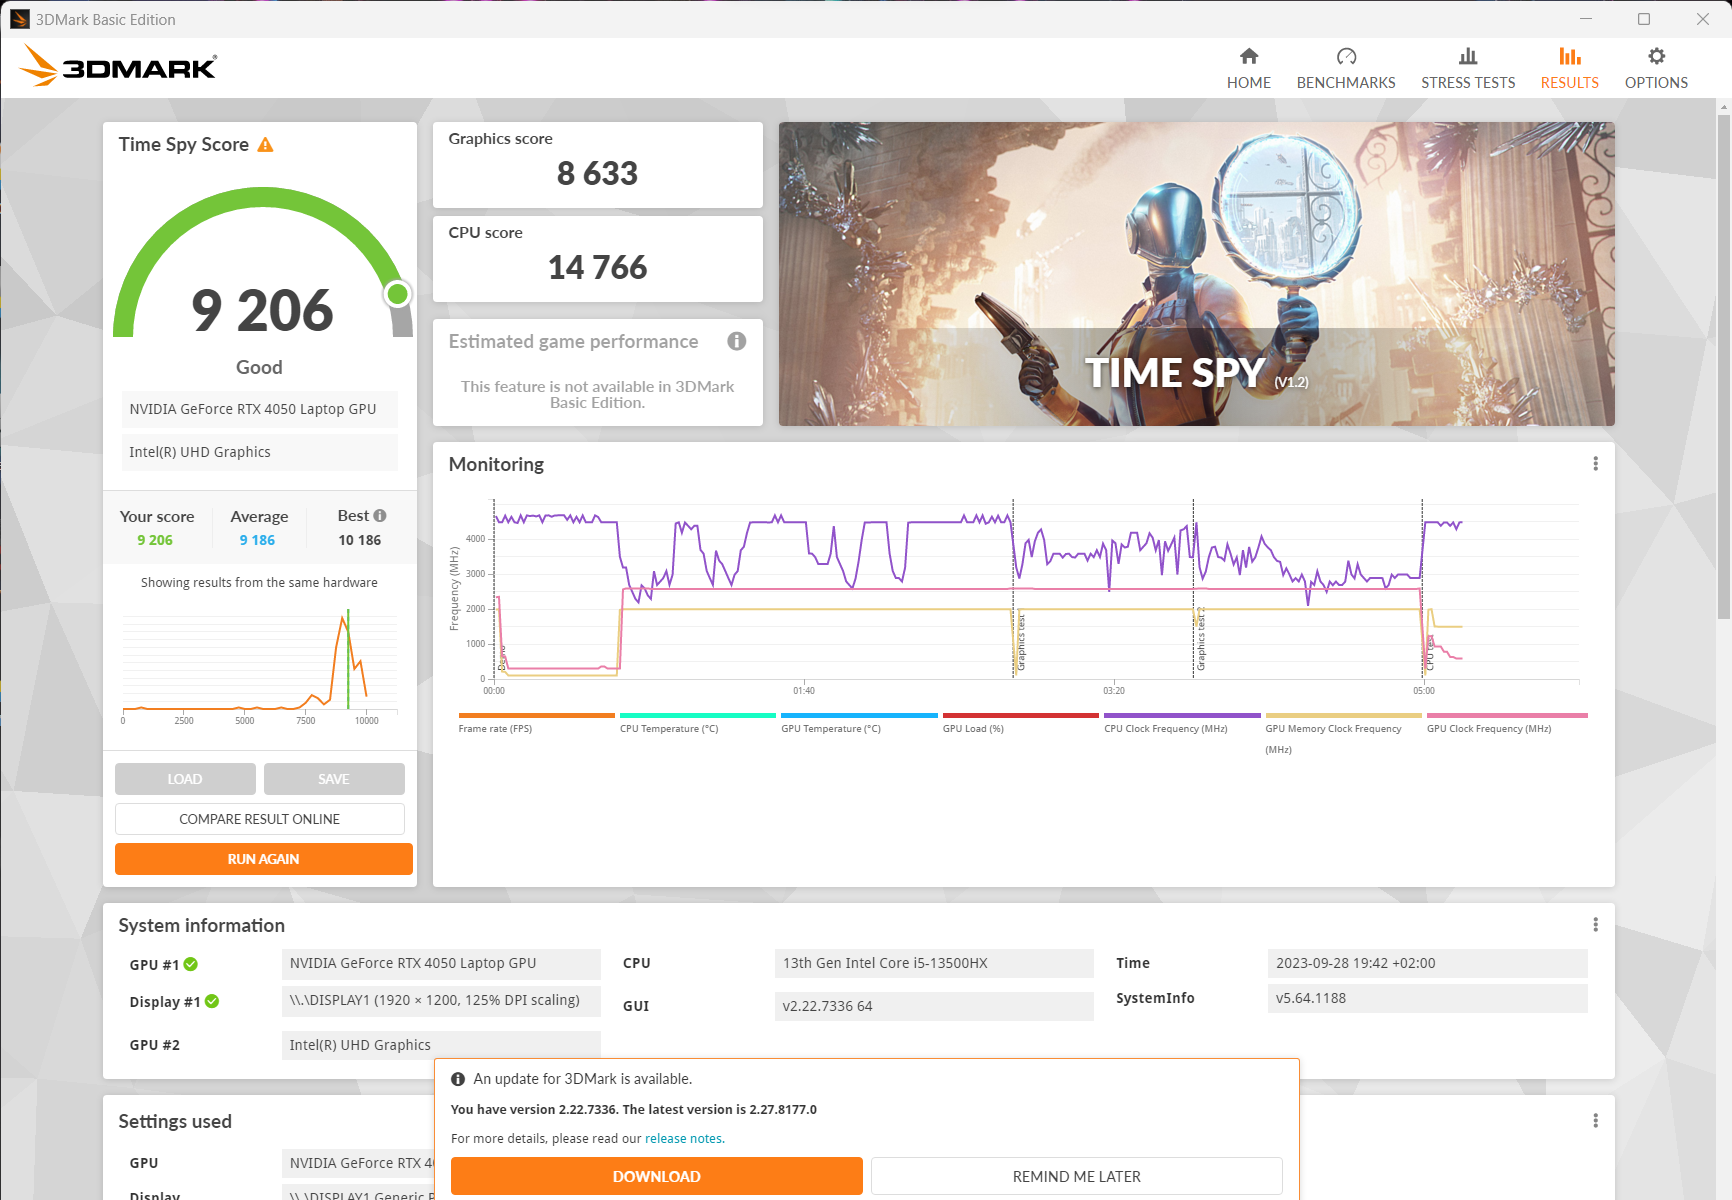
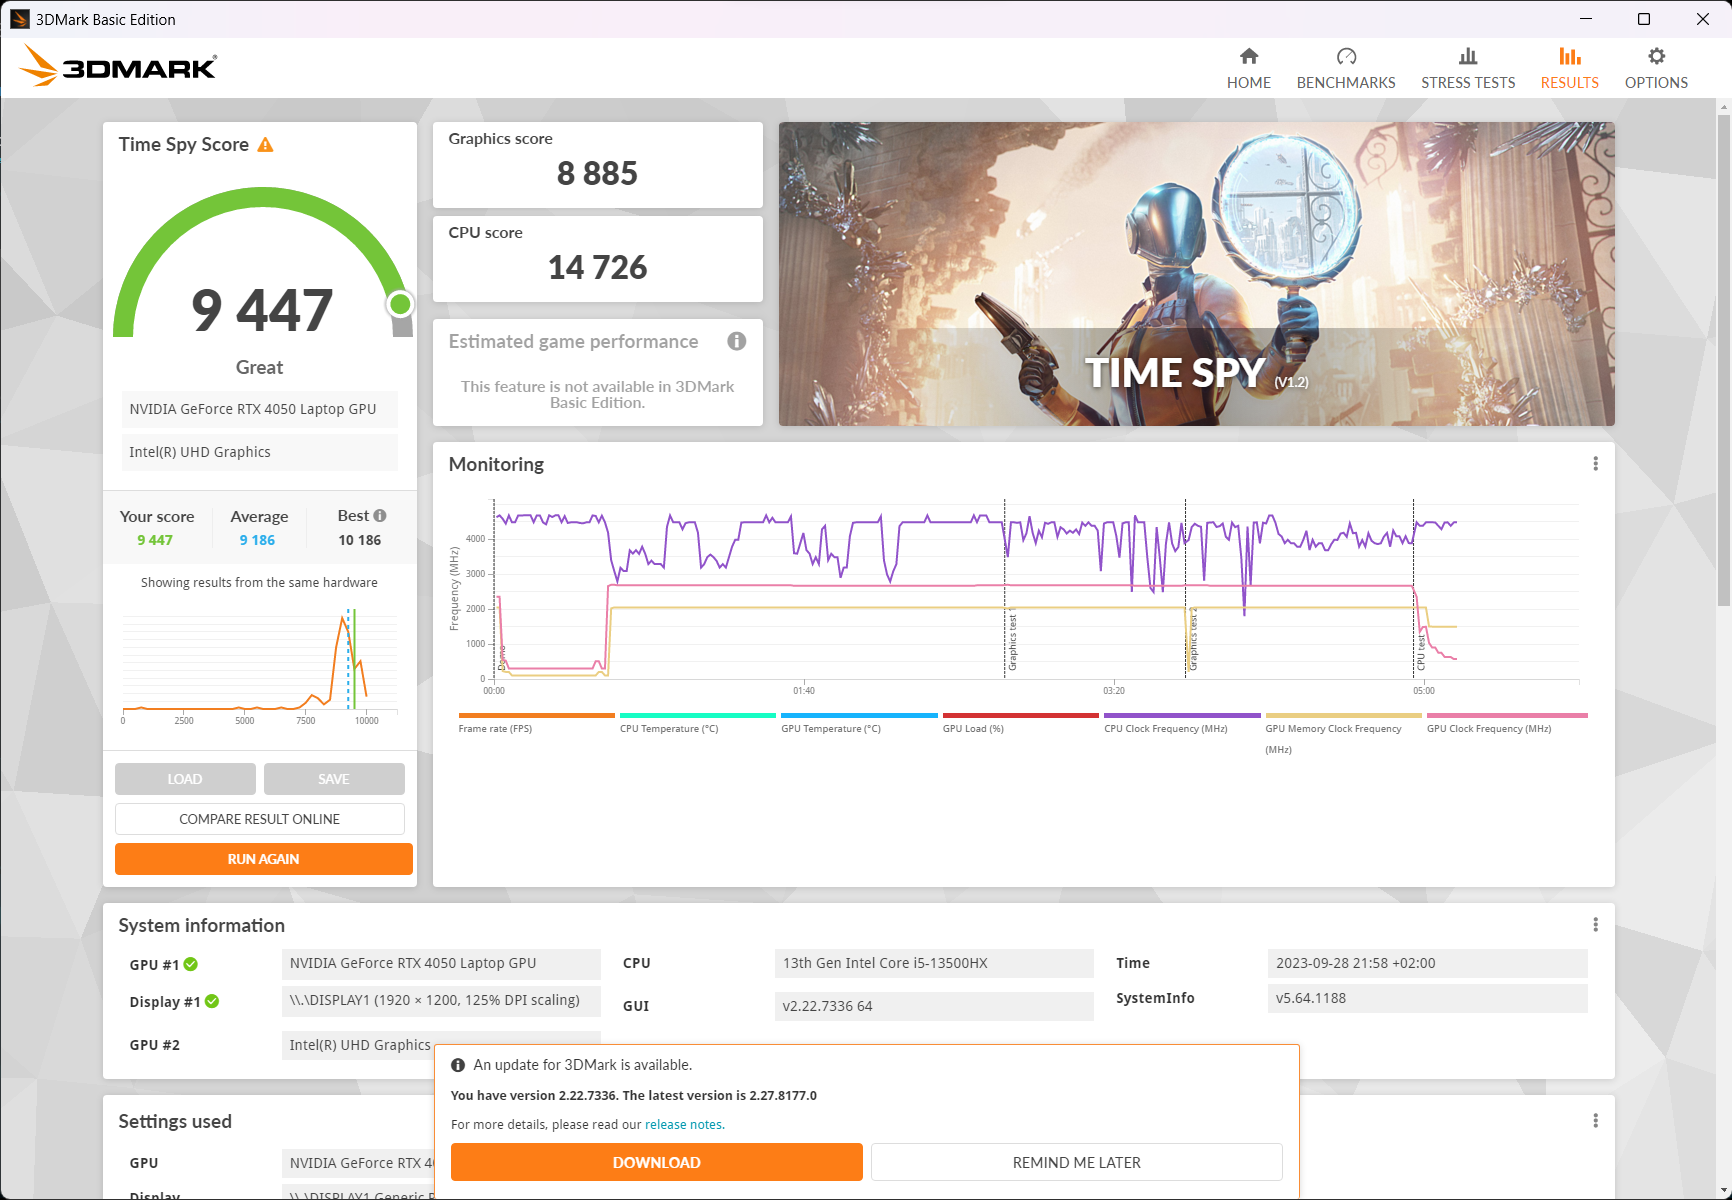
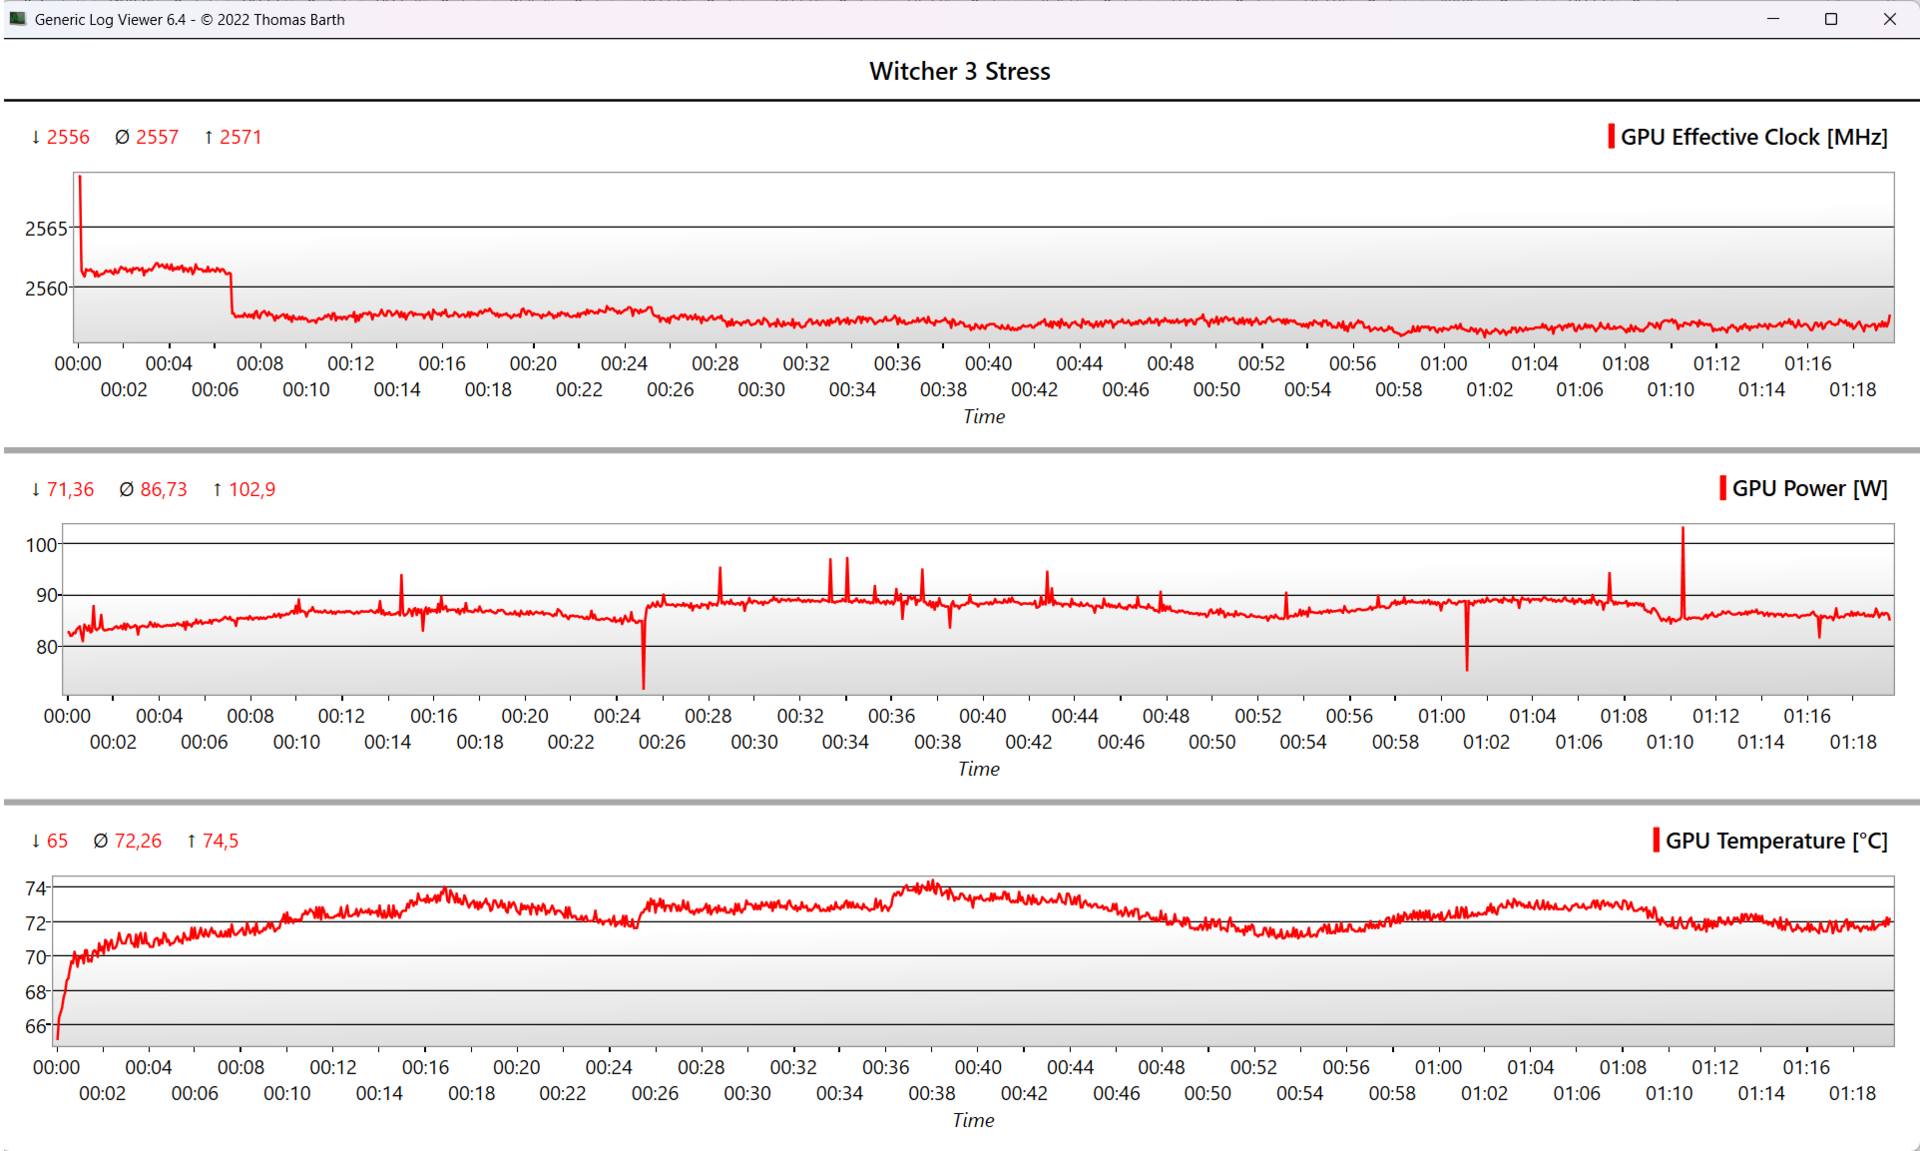
AGeForce RTX 4050 é uma GPU de nível básico com 6 GB de VRAM, que consome um máximo de 130 watts (115 watts + 15 watts de Dynamic Boost) no Helios Neo 16. No entanto, sua taxa de clock máxima de 2.570 MHz já é atingida em 85 watts a 90 watts. Somente o teste de estresse FurMark pode usar os 130 watts totais, enquanto a GPU do laptop nunca precisa de mais de 88 watts ao executar jogos.
Isso coloca o desempenho do dispositivo no mesmo nível de outros notebooks para jogos com a mesma GPU, como oLegion Pro 5 16, SchenkerXMG Apex 15e oHP Victus 16. Nos benchmarks sintéticos, umaRTX 4060também obteve resultados semelhantes (10 % de vantagem), como noLenovo LOQ 16 e noHelios 16 (não Neo). Seus resultados de benchmark sintéticos foram metade dos bons no modo de bateria.
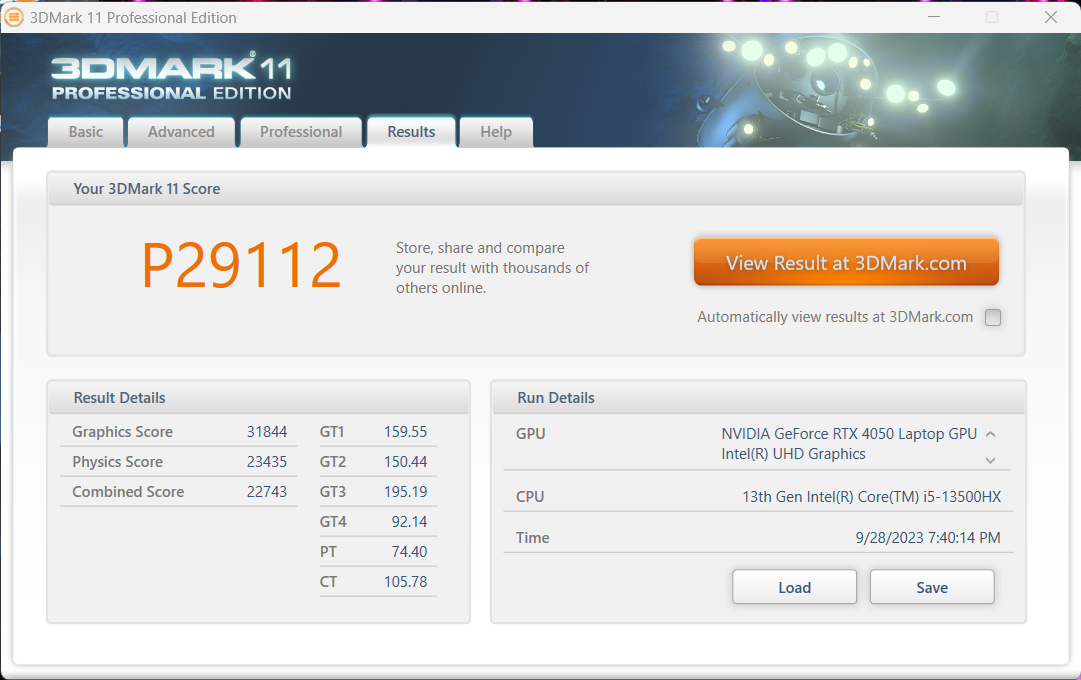
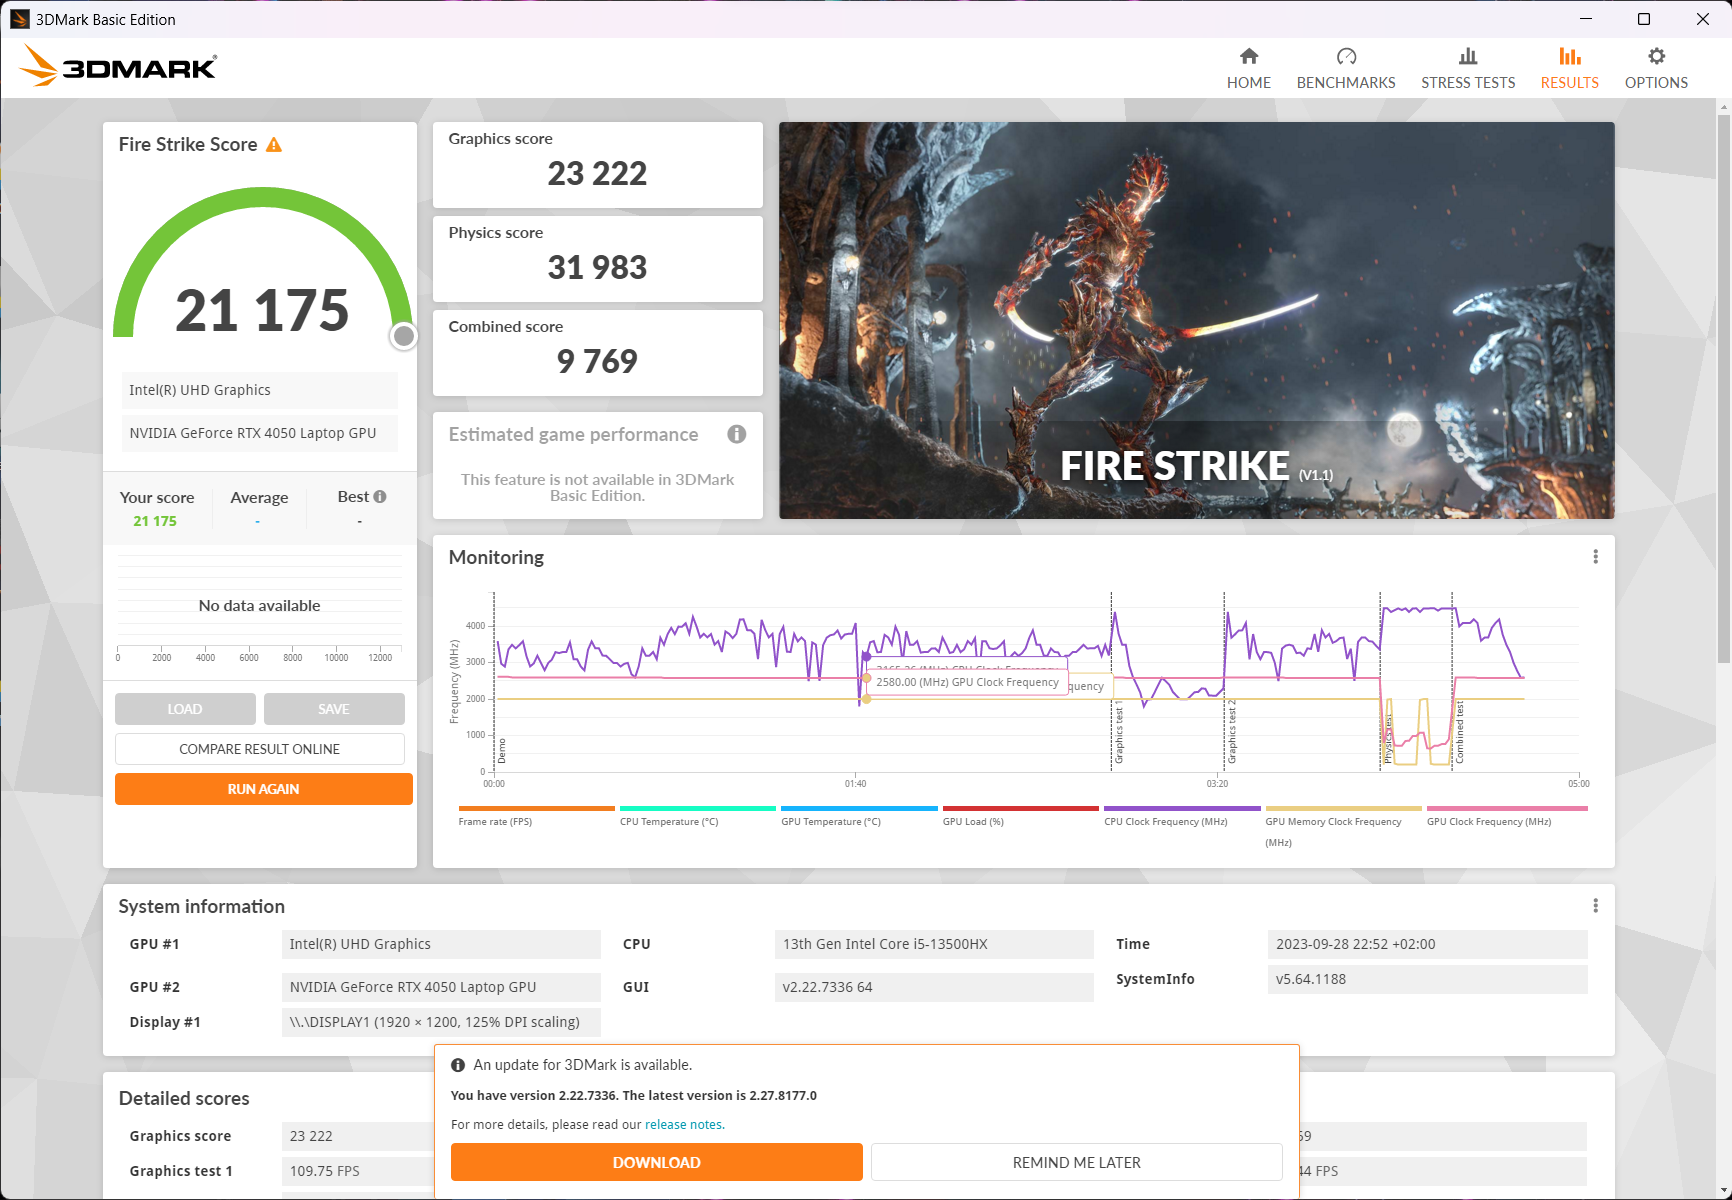
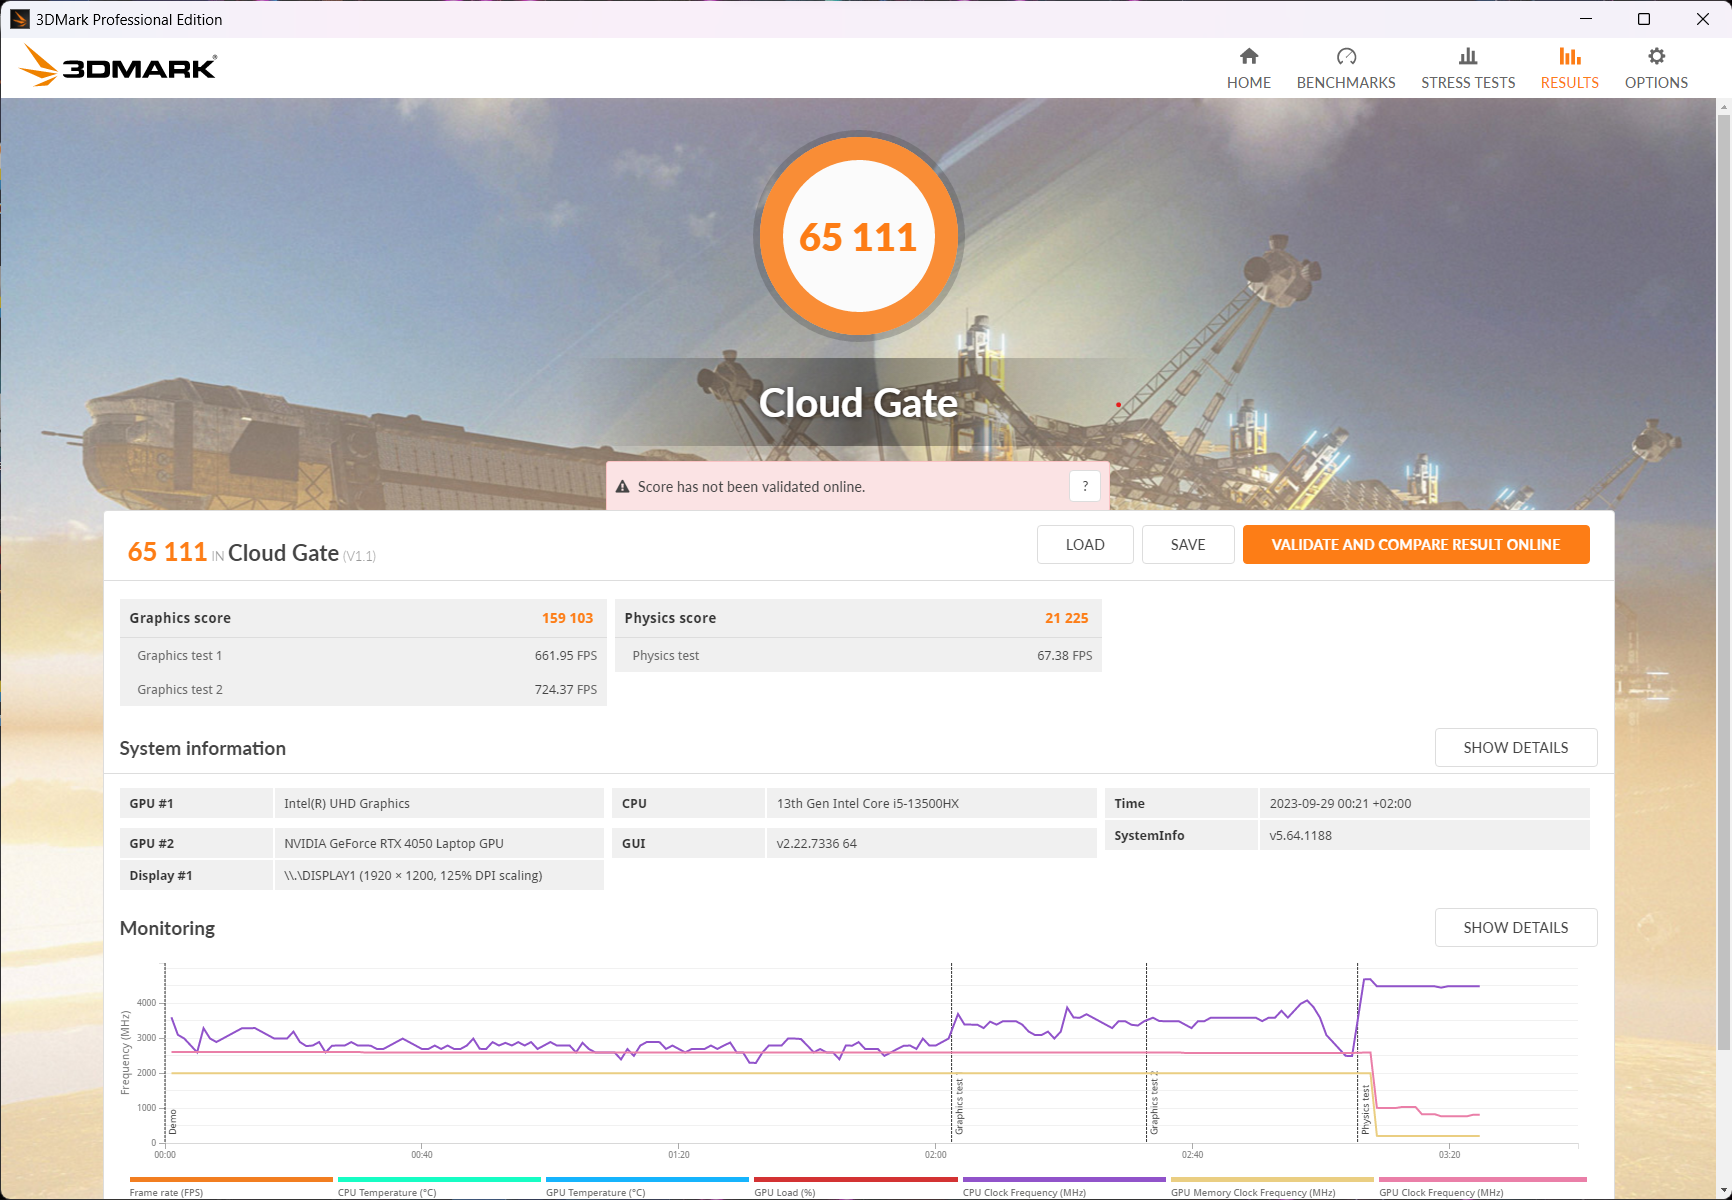
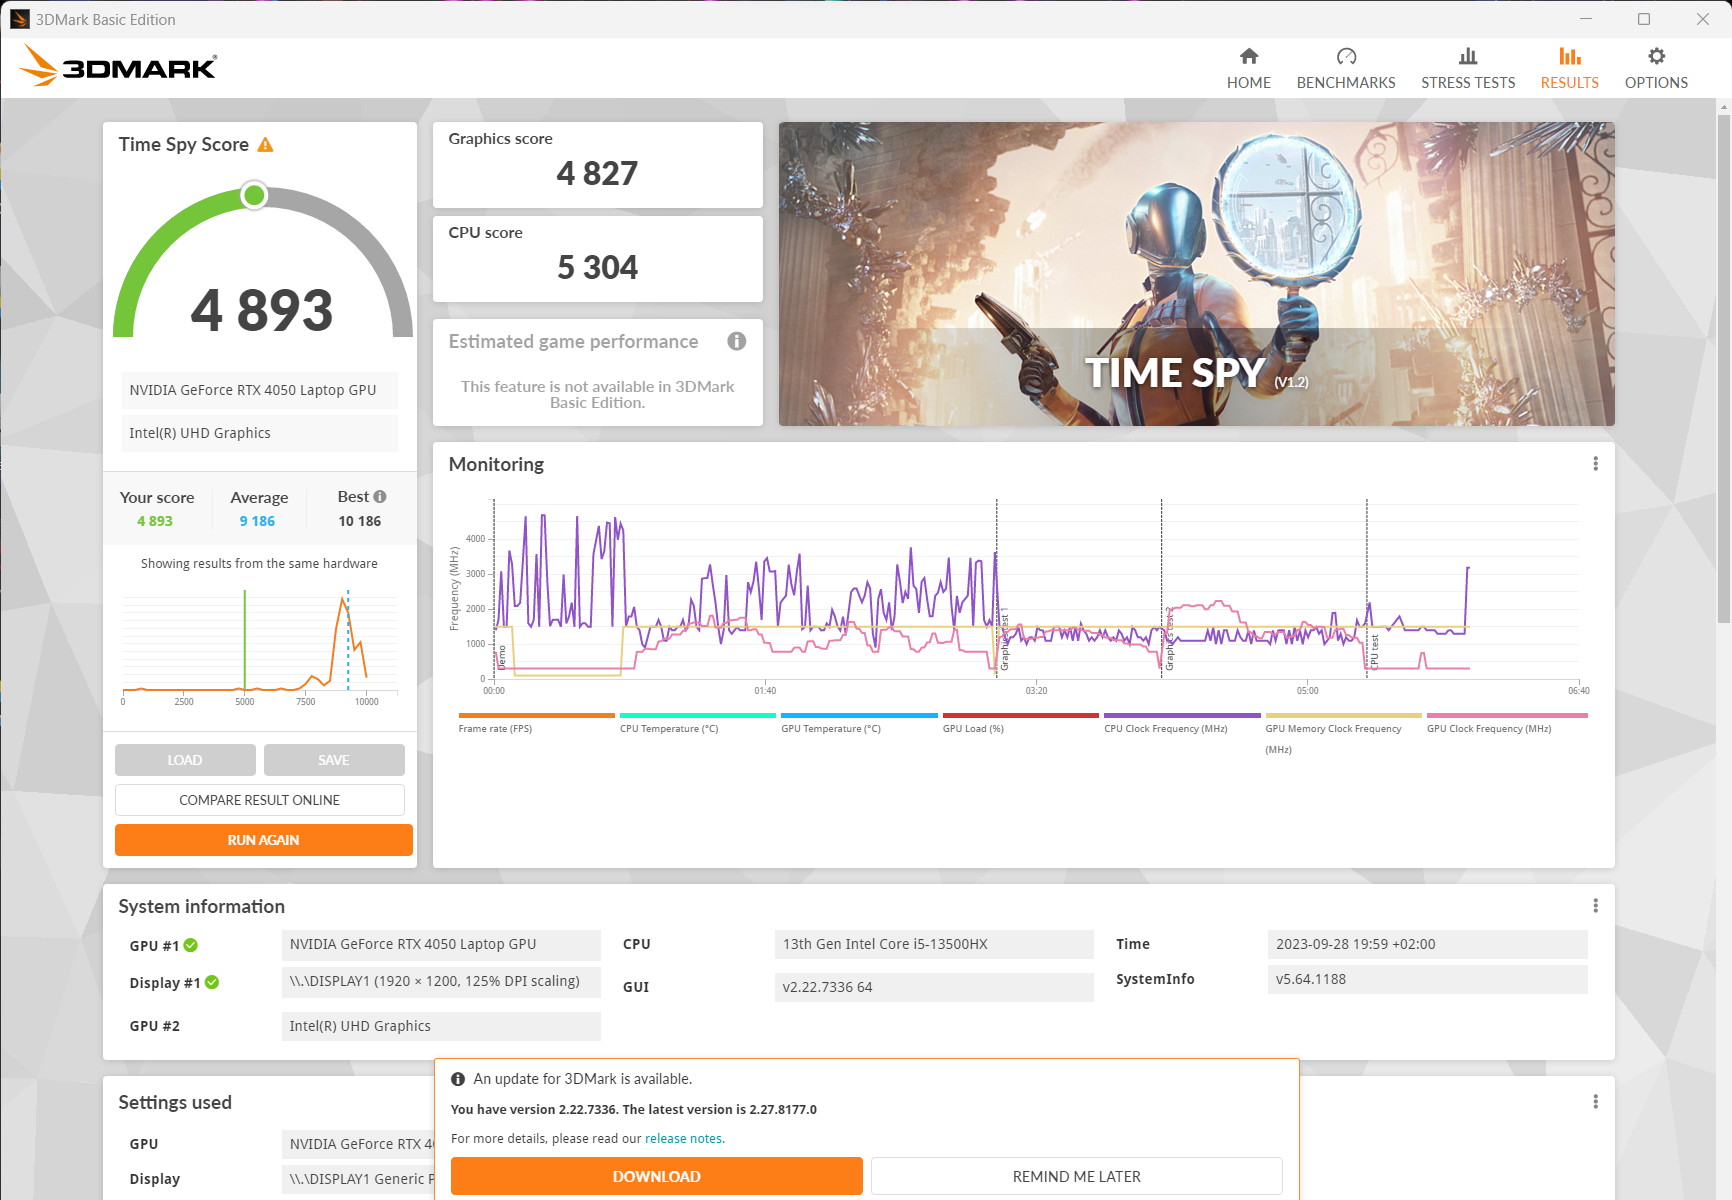
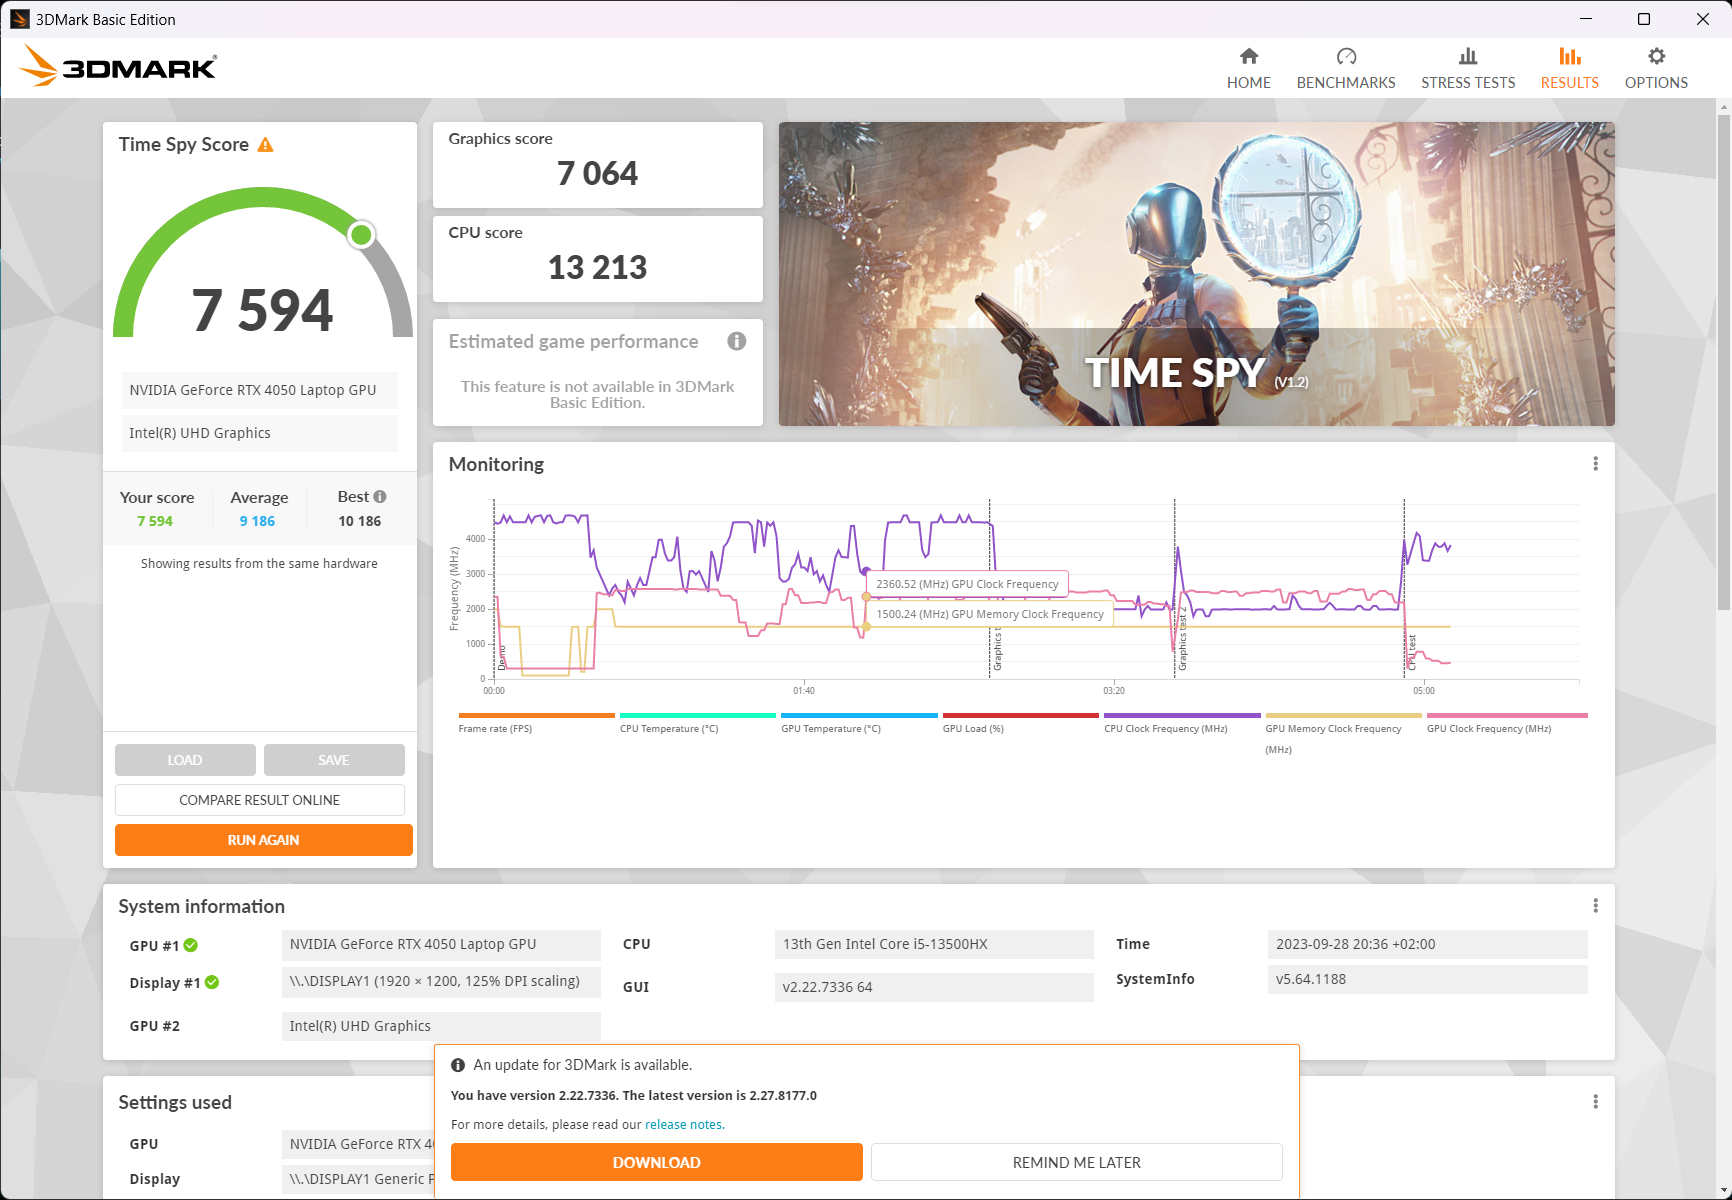
| 3DMark 11 Performance | 29112 pontos | |
| 3DMark Cloud Gate Standard Score | 65111 pontos | |
| 3DMark Fire Strike Score | 21175 pontos | |
| 3DMark Time Spy Score | 9206 pontos | |
Ajuda | ||
* ... menor é melhor
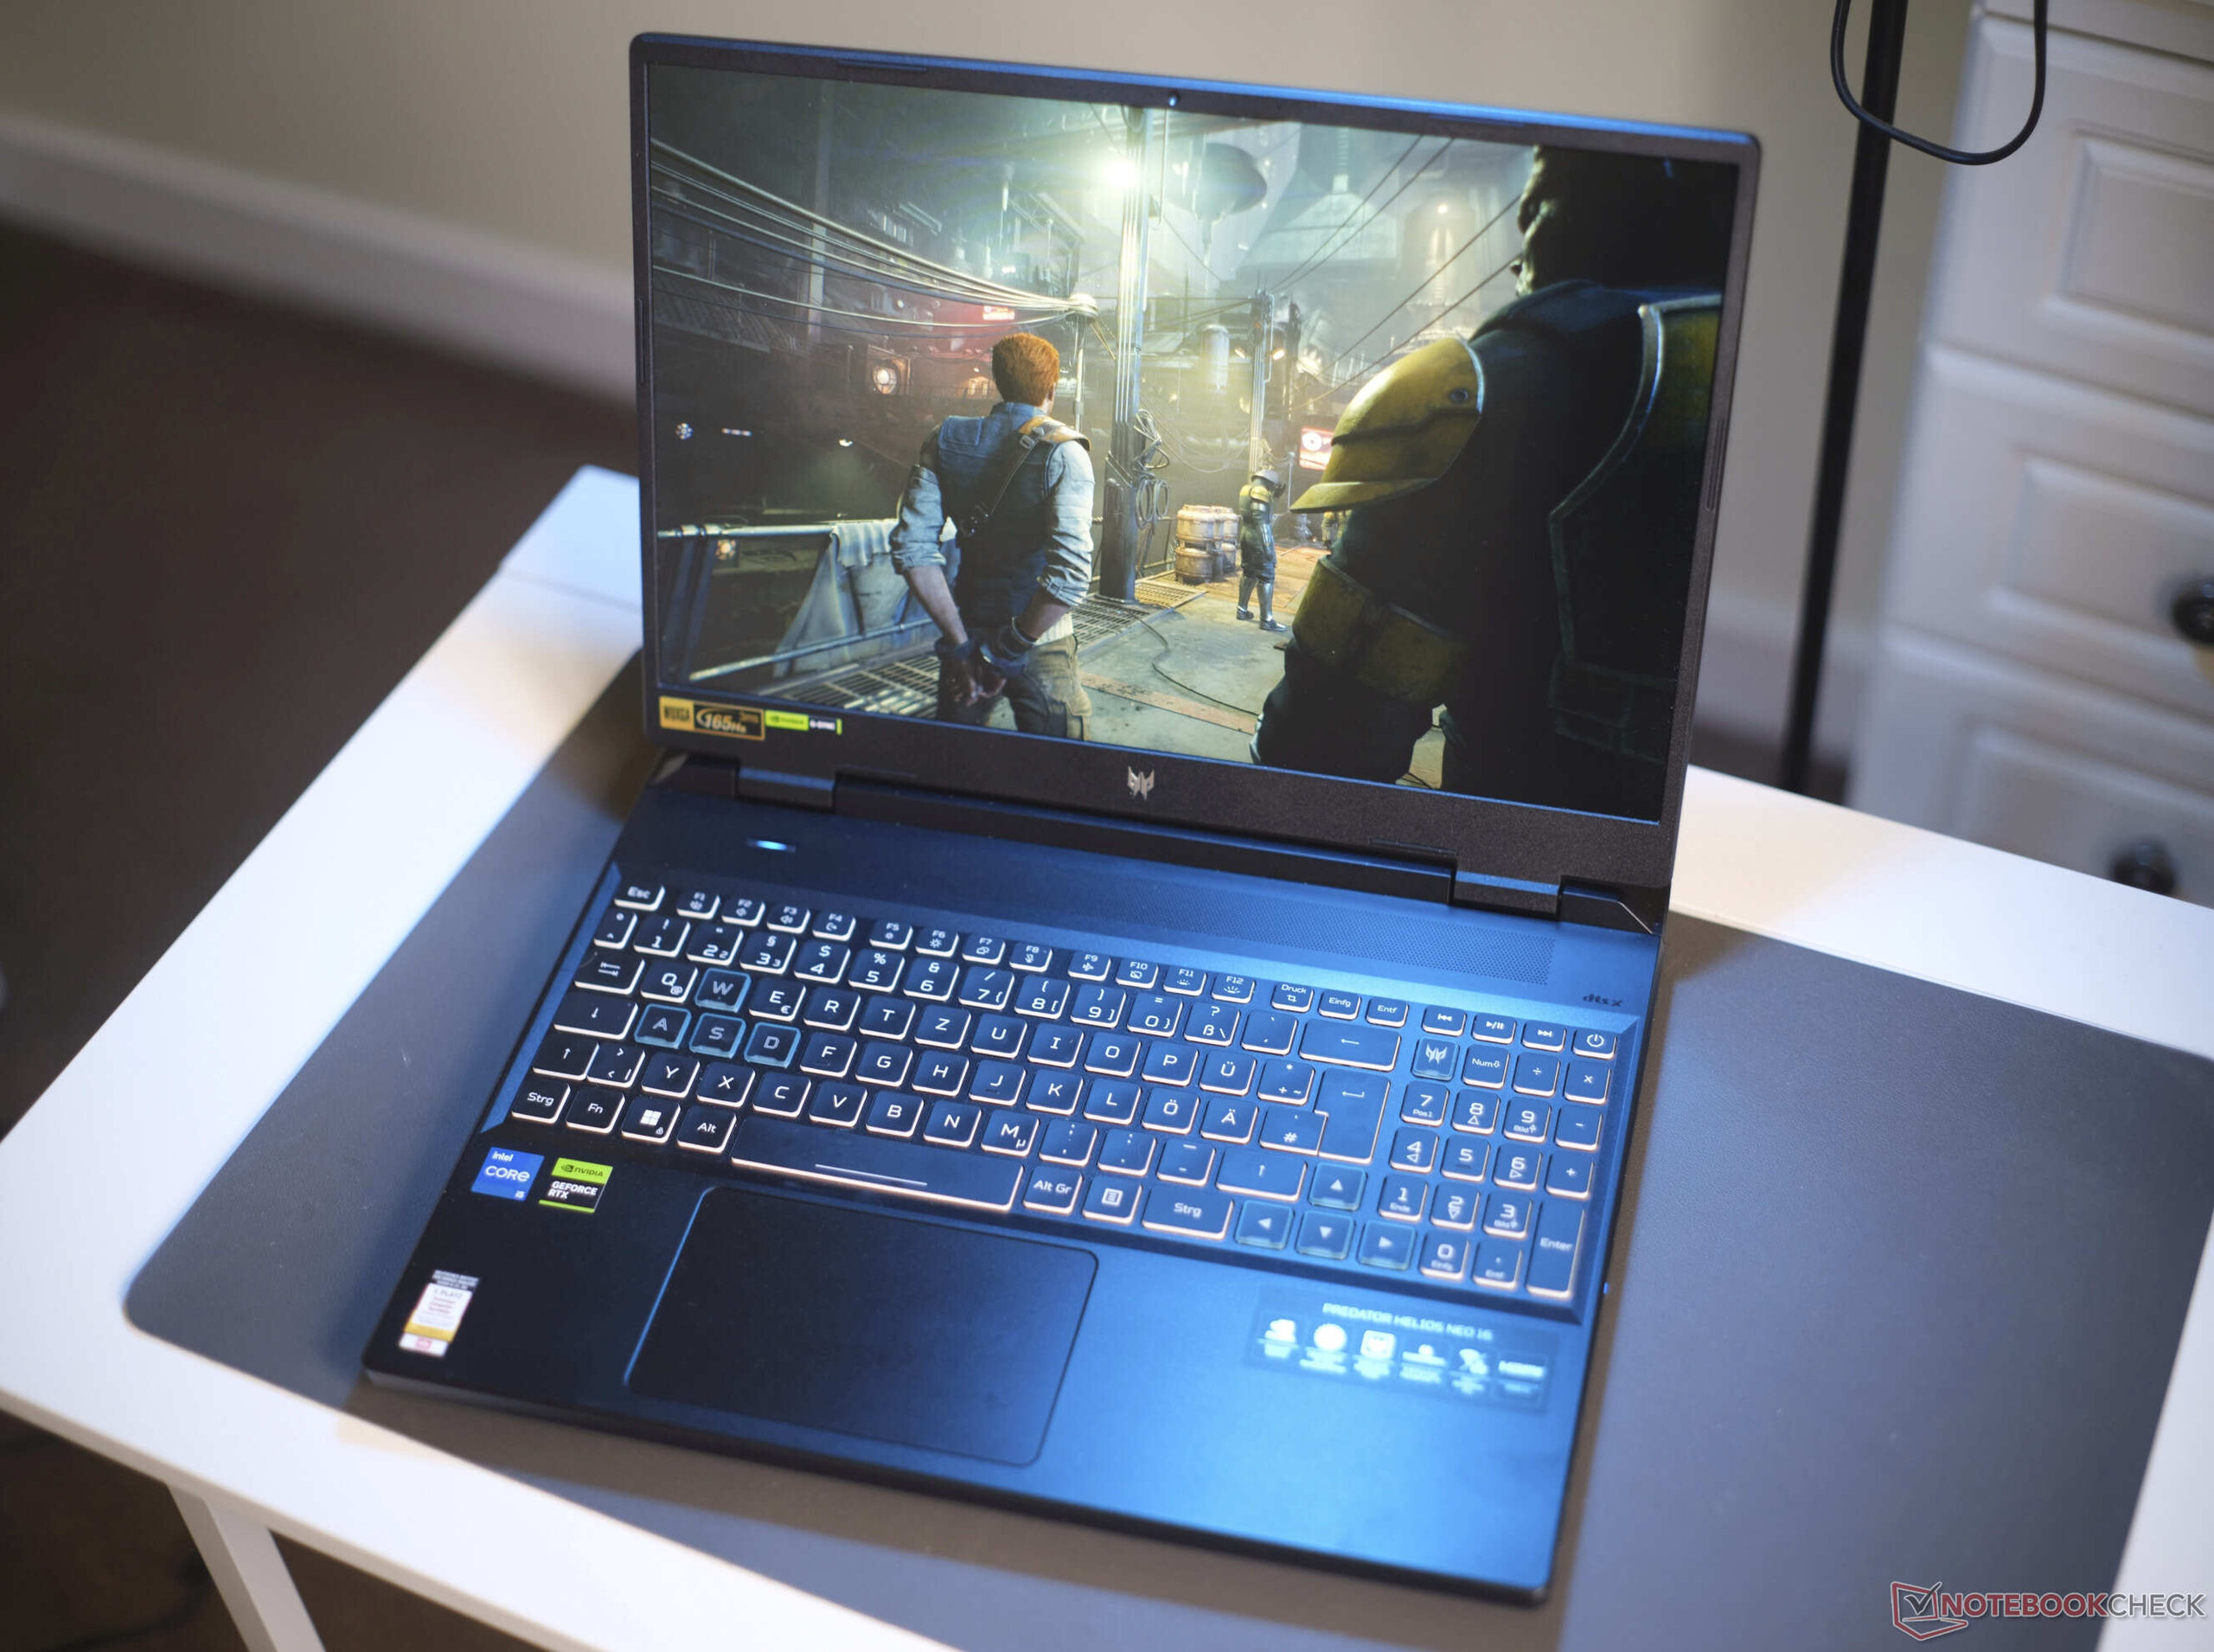
Desempenho em jogos
Em nossa classificação de desempenho, oLegion Pro 5 16 foi cerca de 7% superior ao Helios Neo 16, enquanto oDell G15 5530 e o LenovoLOQ 16 apresentaram, cada um, desempenho cerca de 15% melhor com umaRTX 4060. Dependendo do jogo, a diferença para a RTX 4060 aumentou - até 30% para God of War e 20% para Hogwarts Legacy.
Recomendamos o uso do modo balanceado, pois apenas 2 a 3% do desempenho 3D é perdido com um ruído de ventilador significativamente mais baixo. No modo de bateria, o desempenho foi apenas um terço do desempenho.
| Sons of the Forest | |
| 1920x1080 Ultra Preset AA:T | |
| Lenovo Legion Pro 5 16ARX8 (R5 7645HX, RTX 4050) | |
| Média NVIDIA GeForce RTX 4050 Laptop GPU (61.9 - 76, n=4) | |
| Acer Predator Helios Neo 16 NH.QLTEG.002 | |
| 1920x1080 High Preset AA:T | |
| Lenovo Legion Pro 5 16ARX8 (R5 7645HX, RTX 4050) | |
| Acer Predator Helios Neo 16 NH.QLTEG.002 | |
| Média NVIDIA GeForce RTX 4050 Laptop GPU (63.5 - 76, n=4) | |
Witcher 3 FPS diagram
| baixo | média | alto | ultra | |
|---|---|---|---|---|
| GTA V (2015) | 186.7 | 185.1 | 176.3 | 96.5 |
| The Witcher 3 (2015) | 286 | 154.4 | 81 | |
| Dota 2 Reborn (2015) | 180.9 | 167.9 | 156.4 | 147 |
| Final Fantasy XV Benchmark (2018) | 215 | 118.6 | 84.6 | |
| X-Plane 11.11 (2018) | 152.4 | 134.7 | 106.1 | |
| Strange Brigade (2018) | 476 | 211 | 171.9 | 149.4 |
| F1 2021 (2021) | 291 | 222 | 119.5 | |
| God of War (2022) | 86.8 | 71.1 | 50.1 | |
| Hogwarts Legacy (2023) | 64 | 53.1 | 51.1 | |
| Sons of the Forest (2023) | 78.8 | 74.5 | 70 | |
| Star Wars Jedi Survivor (2023) | 58 | 53.6 | 50.7 | |
| F1 23 (2023) | 262 | 208 | 150.7 | 44.5 |
Emissões: Metal líquido no interior do Helios Neo 16 de médio porte
Emissões de ruído
O Acer Predator Helios Neo 16 permanece praticamente silencioso em todos os modos de desempenho - não apenas no modo inativo, mas também ao navegar na Web e executar tarefas simples de escritório, embora a ventoinha sempre emita um zumbido silencioso.
Sob carga pura da CPU, os níveis de ruído aumentam para 37,7 dB(A), o que ainda não é excessivamente irritante. O modo balanceado é recomendado para jogos - ao usar esse modo, as emissões de ruído do laptop são quase agradáveis. O Legion Pro 5 16por outro lado, atinge apenas 43,8 dB(A), o que não é muito bom para jogos. O Dell G15 5530 também é bastante silencioso, especialmente sob carga média. Não conseguimos detectar nenhum ruído eletrônico no nosso modelo.
Barulho
| Ocioso |
| 25.9 / 25.9 / 29.3 dB |
| Carga |
| 37.7 / 62.7 dB |
 | ||
30 dB silencioso 40 dB(A) audível 50 dB(A) ruidosamente alto |
||
min: | ||
| Acer Predator Helios Neo 16 NH.QLTEG.002 GeForce RTX 4050 Laptop GPU, i5-13500HX, SK hynix HFS512GEJ9X125N | Lenovo Legion Pro 5 16ARX8 (R5 7645HX, RTX 4050) GeForce RTX 4050 Laptop GPU, R5 7645HX, SK hynix PC801 HFS512GEJ9X115N | Lenovo LOQ 16IRH8 GeForce RTX 4060 Laptop GPU, i7-13620H, Solidigm SSDPFINW512GZL | HP Victus 16-r0076TX GeForce RTX 4050 Laptop GPU, i5-13500HX, SK hynix PC801 HFS512GEJ9X101N BF | Dell G15 5530 GeForce RTX 4060 Laptop GPU, i7-13650HX, SSTC CL4-3D512-Q11 | Schenker XMG Apex 15 (Late 23) GeForce RTX 4050 Laptop GPU, R7 7840HS, Samsung 990 Pro 1 TB | |
|---|---|---|---|---|---|---|
| Noise | 13% | 2% | 10% | 12% | 1% | |
| desligado / ambiente * (dB) | 25.9 | 23 11% | 23 11% | 21.57 17% | 20.41 21% | 24 7% |
| Idle Minimum * (dB) | 25.9 | 23 11% | 23 11% | 23.68 9% | 26.85 -4% | 25 3% |
| Idle Average * (dB) | 25.9 | 23 11% | 23 11% | 23.68 9% | 26.85 -4% | 29 -12% |
| Idle Maximum * (dB) | 29.3 | 24.42 17% | 27.66 6% | 23.68 19% | 26.85 8% | 33 -13% |
| Load Average * (dB) | 37.7 | 34.94 7% | 53.62 -42% | 39.44 -5% | 27.65 27% | 36 5% |
| Load Maximum * (dB) | 62.7 | 50 20% | 53.5 15% | 55.37 12% | 47.86 24% | 53 15% |
| Witcher 3 ultra * (dB) | 43.79 | 53.5 | 55.4 | 47.9 | 48 |
* ... menor é melhor
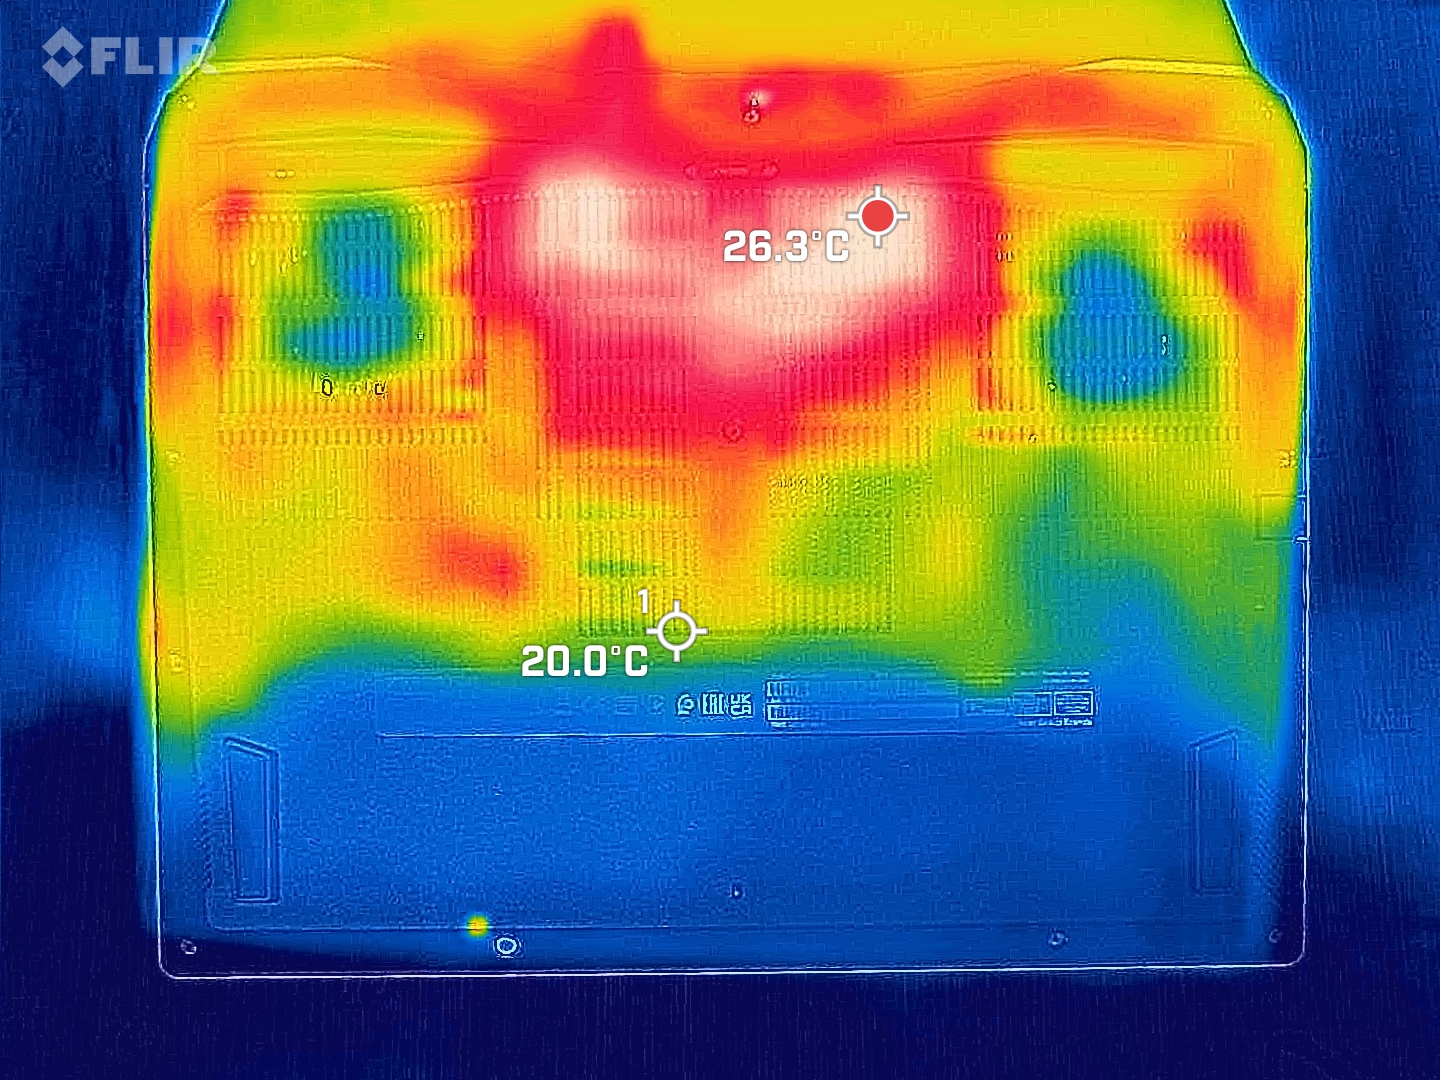
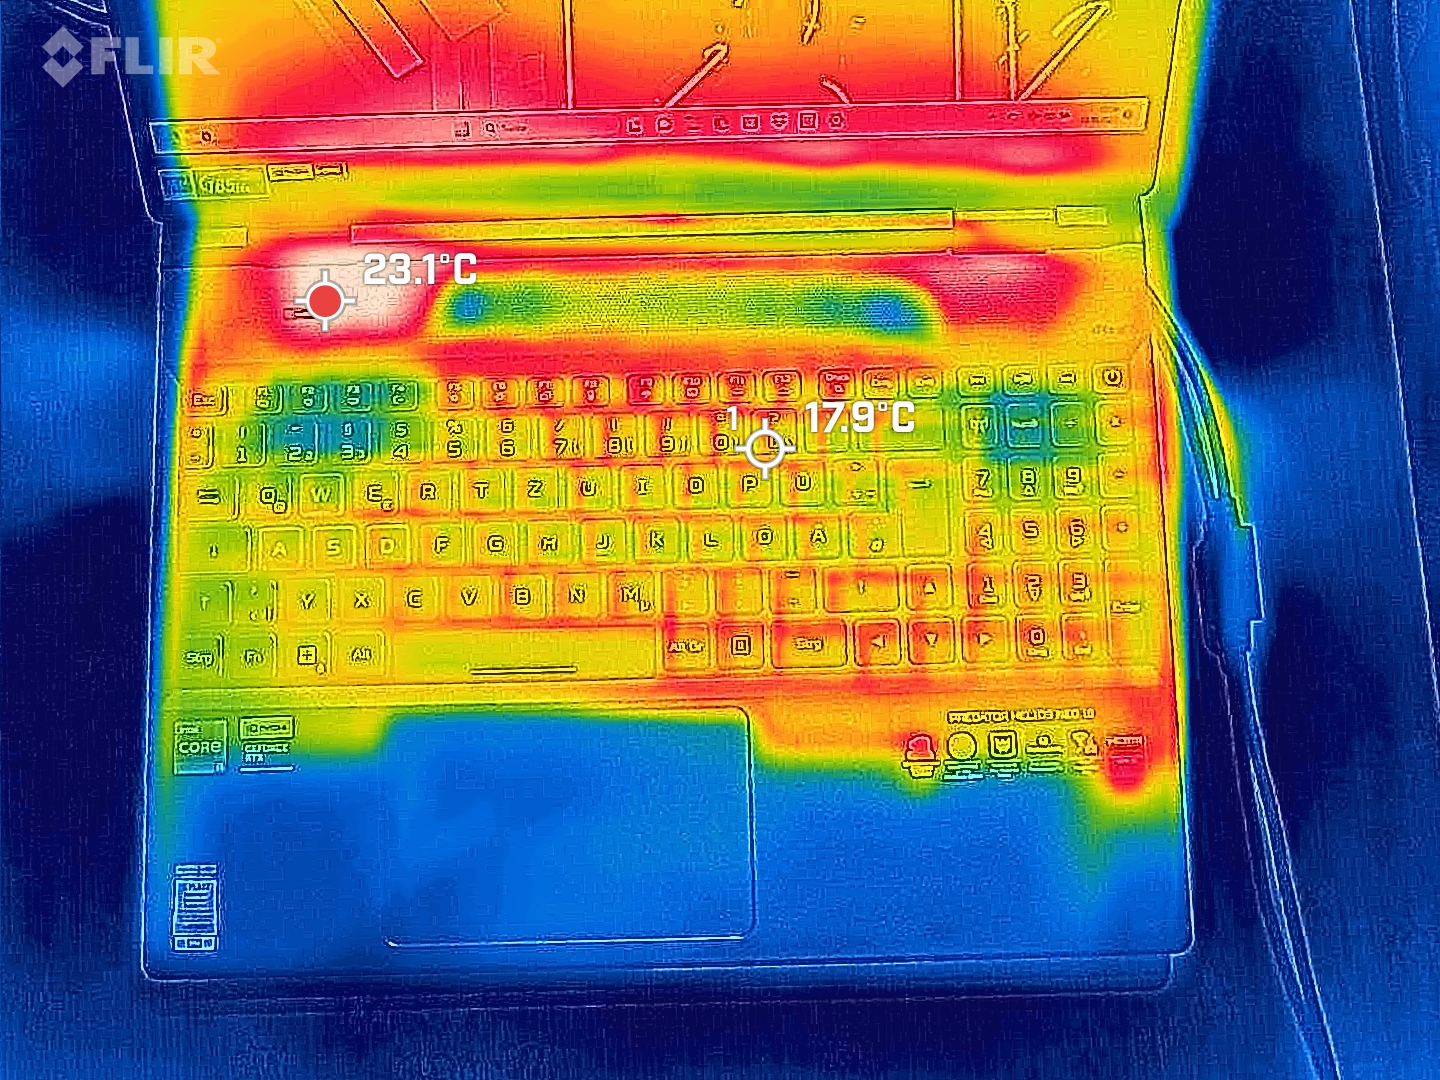
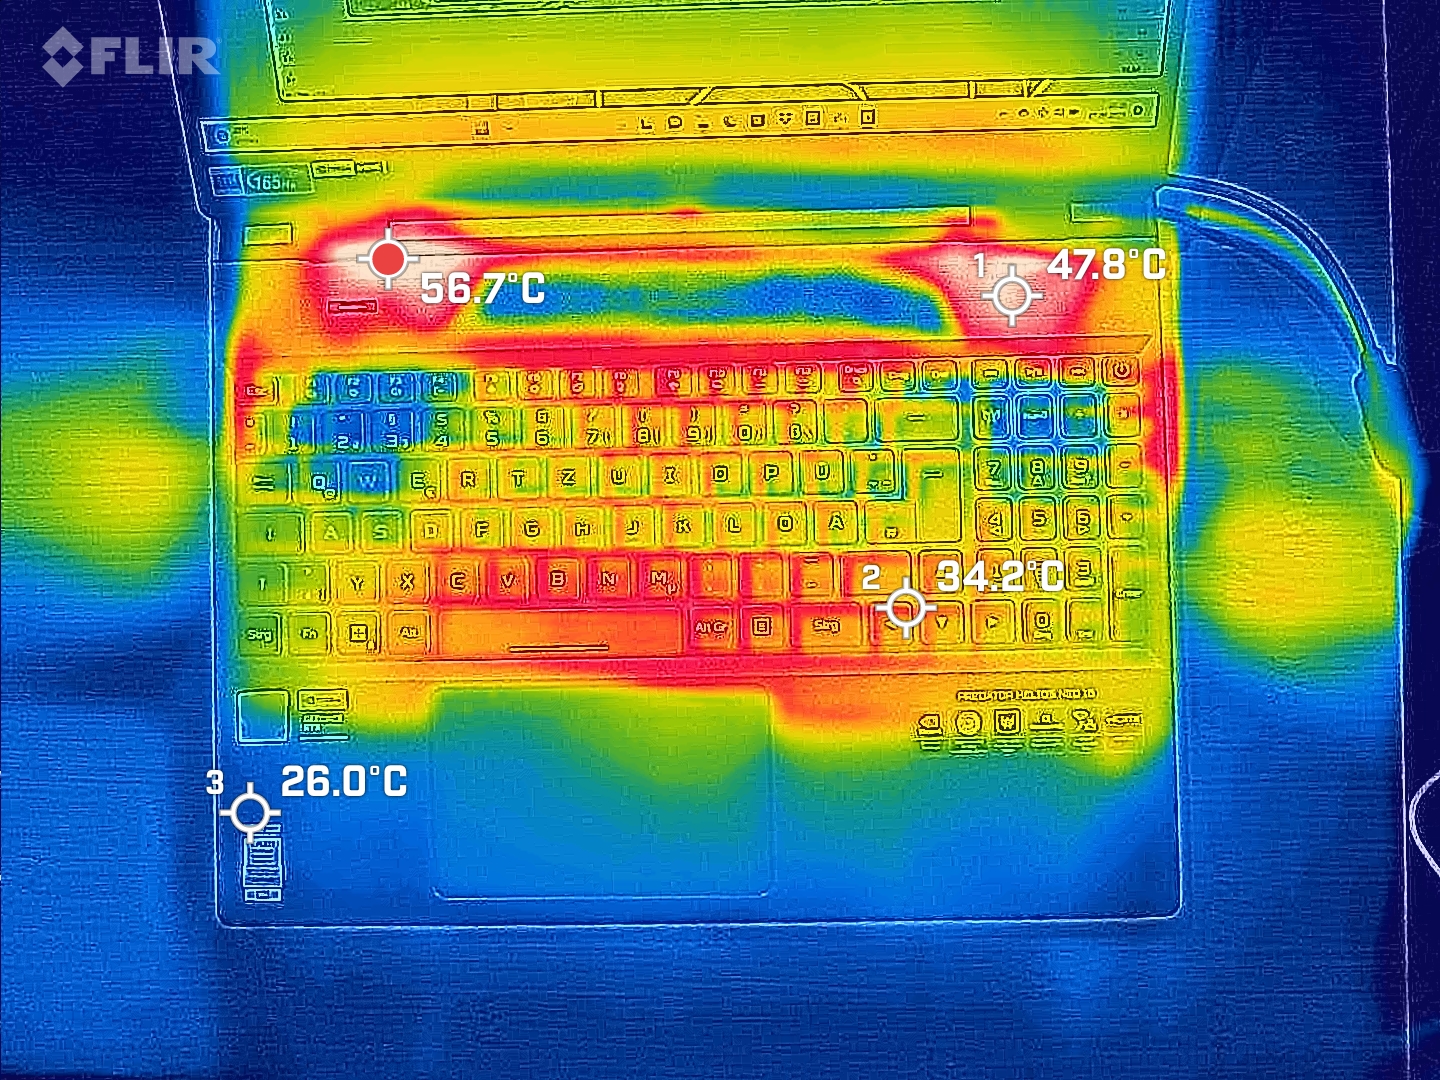
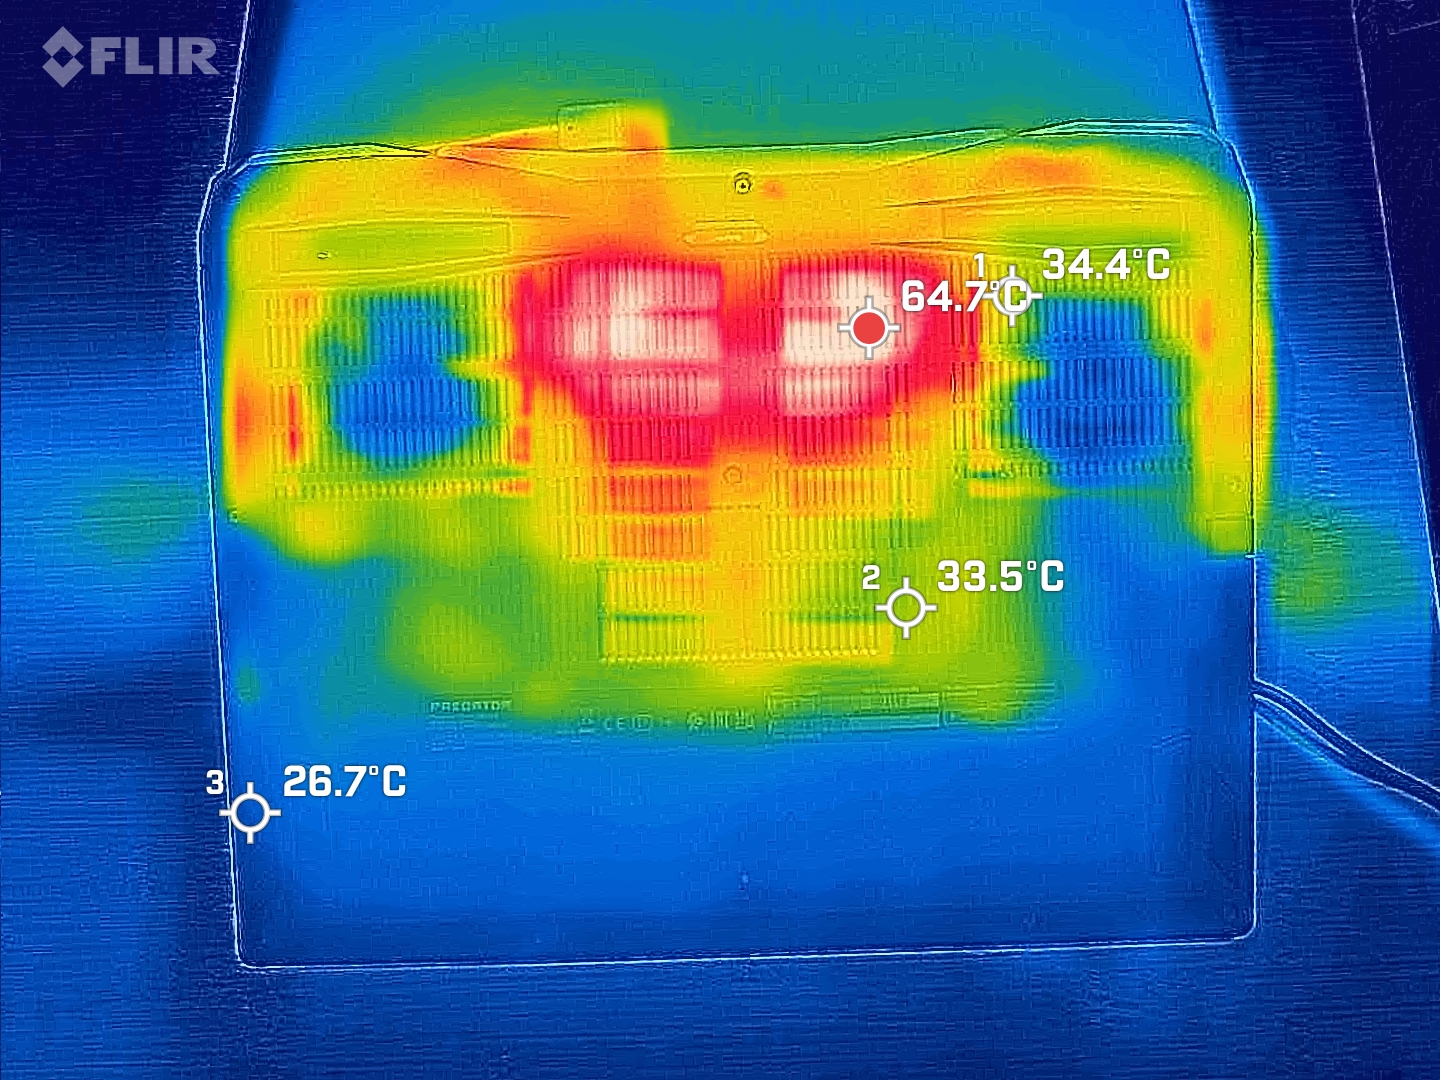
Temperatura
No geral, o laptop para jogos da Acer permanece razoavelmente frio, com suas superfícies atingindo apenas 25 a 35 °C sob carga total. No entanto, notamos alguns pontos quentes com temperaturas de até 56 °C: à esquerda, acima do teclado, e na parte traseira, na parte superior central. Esse último pode ser desconfortável ao jogar com o laptop posicionado no colo, por exemplo.
(-) A temperatura máxima no lado superior é 55.7 °C / 132 F, em comparação com a média de 40.4 °C / 105 F , variando de 21.2 a 68.8 °C para a classe Gaming.
(-) A parte inferior aquece até um máximo de 55 °C / 131 F, em comparação com a média de 43.2 °C / 110 F
(+) Em uso inativo, a temperatura média para o lado superior é 24.1 °C / 75 F, em comparação com a média do dispositivo de 33.9 °C / ### class_avg_f### F.
(+) Os apoios para as mãos e o touchpad são mais frios que a temperatura da pele, com um máximo de 26.1 °C / 79 F e, portanto, são frios ao toque.
(+) A temperatura média da área do apoio para as mãos de dispositivos semelhantes foi 28.8 °C / 83.8 F (+2.7 °C / 4.8 F).
| Acer Predator Helios Neo 16 NH.QLTEG.002 Intel Core i5-13500HX, NVIDIA GeForce RTX 4050 Laptop GPU | Lenovo Legion Pro 5 16ARX8 (R5 7645HX, RTX 4050) AMD Ryzen 5 7645HX, NVIDIA GeForce RTX 4050 Laptop GPU | Lenovo LOQ 16IRH8 Intel Core i7-13620H, NVIDIA GeForce RTX 4060 Laptop GPU | Schenker XMG Apex 15 (Late 23) AMD Ryzen 7 7840HS, NVIDIA GeForce RTX 4050 Laptop GPU | HP Victus 16-r0076TX Intel Core i5-13500HX, NVIDIA GeForce RTX 4050 Laptop GPU | Dell G15 5530 Intel Core i7-13650HX, NVIDIA GeForce RTX 4060 Laptop GPU | |
|---|---|---|---|---|---|---|
| Heat | -15% | -2% | -7% | -0% | -16% | |
| Maximum Upper Side * (°C) | 55.7 | 45 19% | 48 14% | 52 7% | 48 14% | 54 3% |
| Maximum Bottom * (°C) | 55 | 54 2% | 59 -7% | 47 15% | 48 13% | 62.2 -13% |
| Idle Upper Side * (°C) | 26 | 36 -38% | 28 -8% | 33 -27% | 29.6 -14% | 33.4 -28% |
| Idle Bottom * (°C) | 26.6 | 38 -43% | 28 -5% | 33 -24% | 30.2 -14% | 33.4 -26% |
* ... menor é melhor
Teste de estresse
Durante nosso teste de estresse combinado (FurMark + Prime95), a taxa de clock dos núcleos P caiu de 4 GHz para apenas 2 GHz após um minuto e começou a flutuar em torno de 2,25 GHz a partir do minuto 5, o que está acima do clock base de 1,8 GHz.
A CPU atingiu até 92 °C, mas oscilou tanto que, mesmo depois de uma hora, ocasionalmente ainda caía abaixo da marca de 80 °C. Seu consumo médio de energia é de 58 watts, enquanto oHelios 16 (não Neo) com umi7-13700HX consome 100 watts, apesar de ter (quase) o mesmo sistema de resfriamento. A taxa de clock da GPU passou rapidamente de 2.560 MHz (clock máximo) para cerca de 2.350 MHz e atingiu temperaturas de até 87 °C.
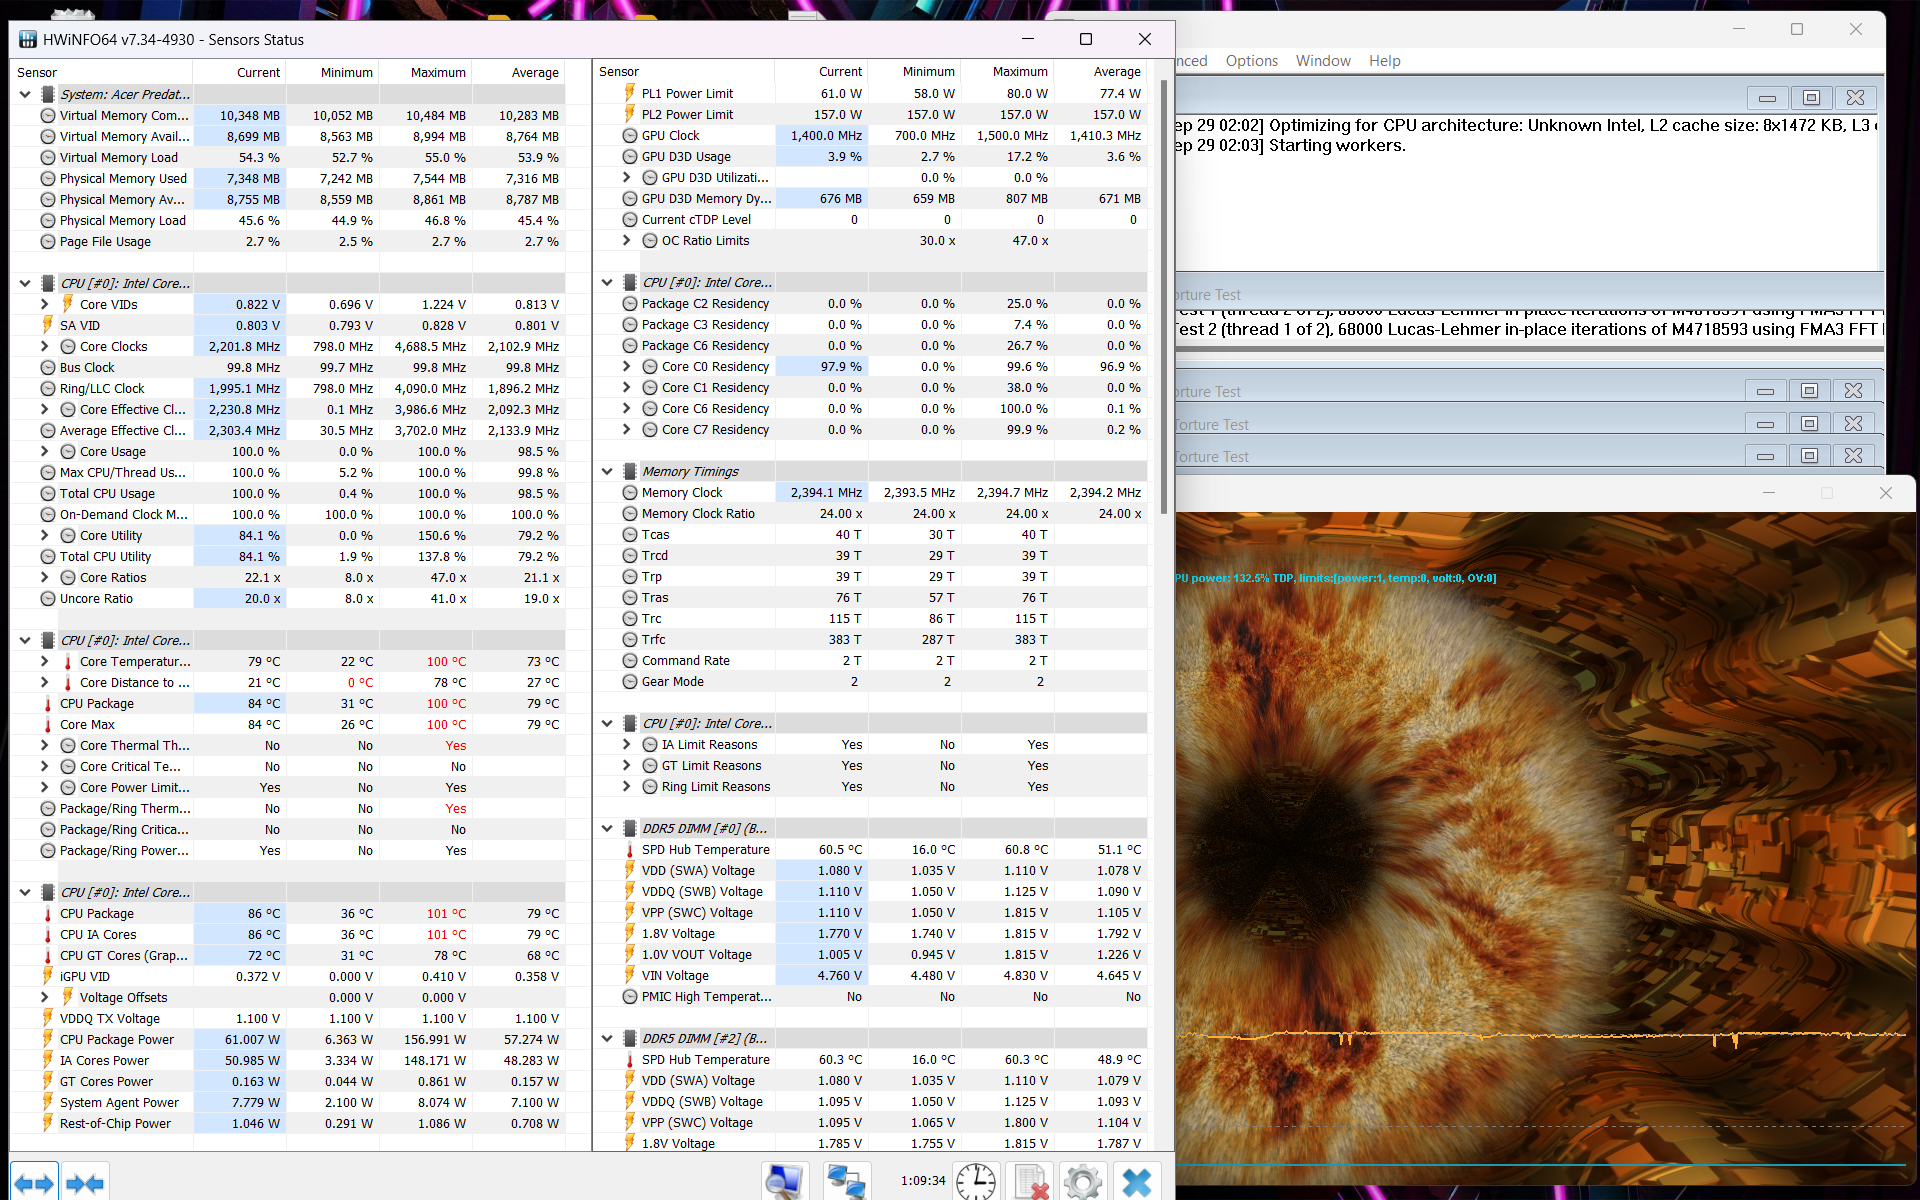
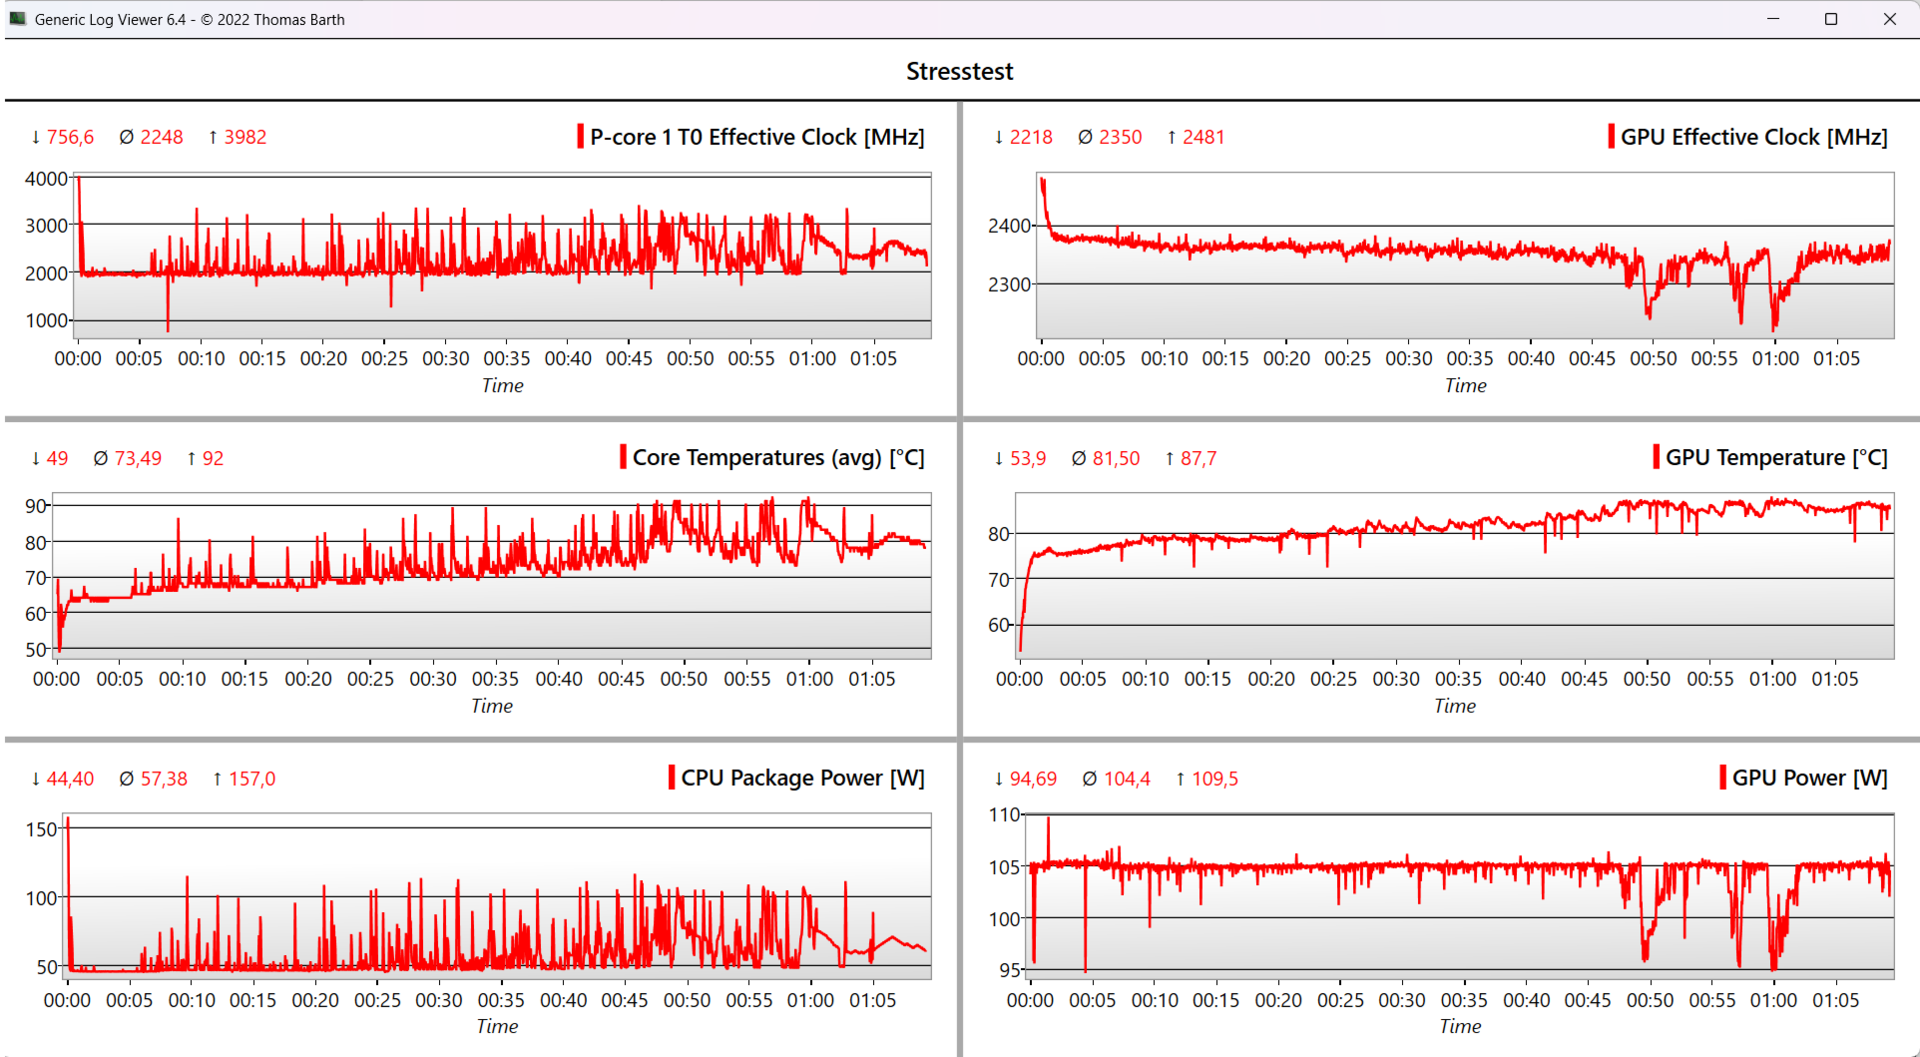
| Relógio da CPU (GHz) | Relógio da GPU (MHz) | Temperatura média da CPU (°C) | Temperatura média da GPU (°C) | |
| Prime95+FurMark | 2,25 | 2.350 | 74 | 82 |
Alto-falantes
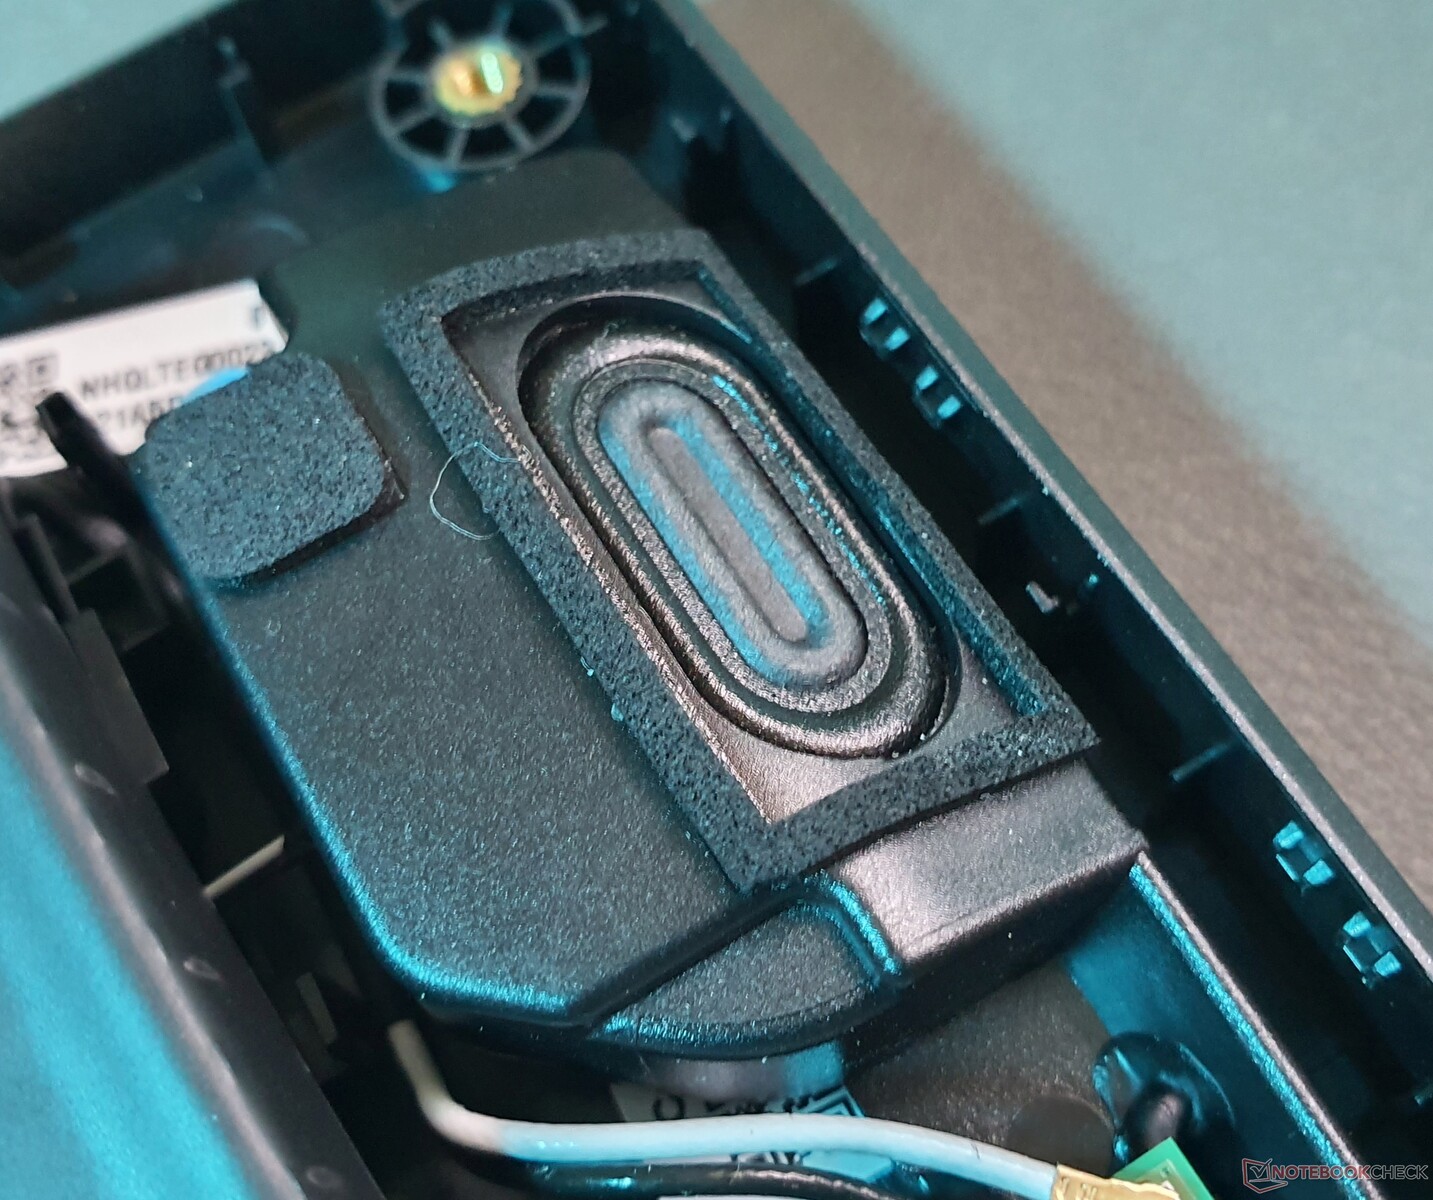
Os alto-falantes estéreo de 2 watts voltados para baixo do dispositivo produzem médios e agudos equilibrados, mas os graves estão quase totalmente ausentes. Seu volume máximo de 78,5 dB(A) também é médio. Os laptops para jogos em nosso campo de comparação também não oferecem um som melhor.
Portanto, recomenda-se o uso de um fone de ouvido ou sistema de som conectado via conector de áudio ou Bluetooth para uma experiência sonora envolvente.
Acer Predator Helios Neo 16 NH.QLTEG.002 análise de áudio
(±) | o volume do alto-falante é médio, mas bom (###valor### dB)
Graves 100 - 315Hz
(-) | quase nenhum baixo - em média 24.6% menor que a mediana
(±) | a linearidade dos graves é média (12.3% delta para a frequência anterior)
Médios 400 - 2.000 Hz
(+) | médios equilibrados - apenas 2.4% longe da mediana
(+) | médios são lineares (5.7% delta para frequência anterior)
Altos 2 - 16 kHz
(+) | agudos equilibrados - apenas 1.9% longe da mediana
(+) | os máximos são lineares (3.3% delta da frequência anterior)
Geral 100 - 16.000 Hz
(±) | a linearidade do som geral é média (17.4% diferença em relação à mediana)
Comparado com a mesma classe
» 48% de todos os dispositivos testados nesta classe foram melhores, 12% semelhantes, 40% piores
» O melhor teve um delta de 6%, a média foi 18%, o pior foi 132%
Comparado com todos os dispositivos testados
» 33% de todos os dispositivos testados foram melhores, 8% semelhantes, 58% piores
» O melhor teve um delta de 4%, a média foi 23%, o pior foi 134%
Lenovo Legion Pro 5 16ARX8 (R5 7645HX, RTX 4050) análise de áudio
(±) | o volume do alto-falante é médio, mas bom (###valor### dB)
Graves 100 - 315Hz
(-) | quase nenhum baixo - em média 20.9% menor que a mediana
(±) | a linearidade dos graves é média (11.7% delta para a frequência anterior)
Médios 400 - 2.000 Hz
(±) | médios mais altos - em média 6.8% maior que a mediana
(+) | médios são lineares (5.7% delta para frequência anterior)
Altos 2 - 16 kHz
(+) | agudos equilibrados - apenas 2.8% longe da mediana
(±) | a linearidade dos máximos é média (7.5% delta para frequência anterior)
Geral 100 - 16.000 Hz
(±) | a linearidade do som geral é média (21.5% diferença em relação à mediana)
Comparado com a mesma classe
» 77% de todos os dispositivos testados nesta classe foram melhores, 5% semelhantes, 18% piores
» O melhor teve um delta de 6%, a média foi 18%, o pior foi 132%
Comparado com todos os dispositivos testados
» 61% de todos os dispositivos testados foram melhores, 7% semelhantes, 32% piores
» O melhor teve um delta de 4%, a média foi 23%, o pior foi 134%
Gerenciamento de energia: A CPU de classe desktop cobra seu preço no laptop para jogos
Consumo de energia
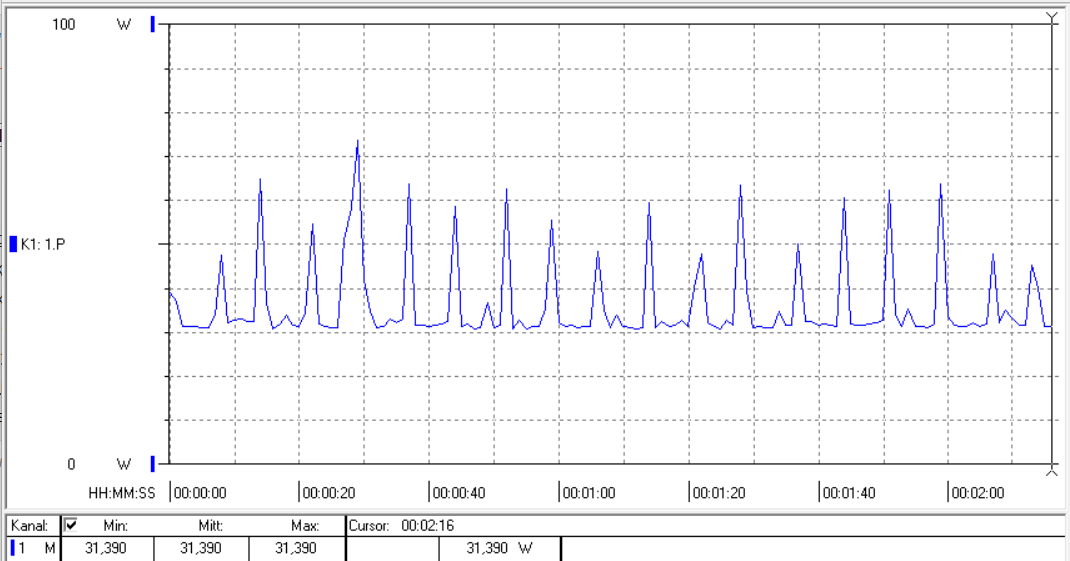
O consumo de energia ocioso de 15,5 watts do laptop para jogos não é surpreendente, considerando a CPU de classe de desktop instalada. Outros sistemas HX (TDP de 55 watts), sejam da Intel ou da AMD, geralmente consomem até 20 watts. Os sistemas AMD HS (TDP de 35 watts), como oXMG Apex 15 (que consome apenas 10 watts no modo inativo) geralmente têm uma vantagem correspondente.
Um consumo de 145 watts durante os jogos é relativamente baixo, mas não quando se considera que aRTX 4050 já atinge seu clock máximo em ~87 watts. Somente no teste de estresse não diário ele atingiu um pico de até 239 watts, que a fonte de alimentação de 230 watts ainda consegue administrar.
| desligado | |
| Ocioso | |
| Carga |
|
Key:
min: | |
| Acer Predator Helios Neo 16 NH.QLTEG.002 i5-13500HX, GeForce RTX 4050 Laptop GPU, SK hynix HFS512GEJ9X125N, IPS, 1920x1200, 16" | Lenovo Legion Pro 5 16ARX8 (R5 7645HX, RTX 4050) R5 7645HX, GeForce RTX 4050 Laptop GPU, SK hynix PC801 HFS512GEJ9X115N, IPS, 2560x1600, 16" | Lenovo LOQ 16IRH8 i7-13620H, GeForce RTX 4060 Laptop GPU, Solidigm SSDPFINW512GZL, IPS, 2560x1600, 16" | Schenker XMG Apex 15 (Late 23) R7 7840HS, GeForce RTX 4050 Laptop GPU, Samsung 990 Pro 1 TB, IPS, 2560x1440, 15.6" | HP Victus 16-r0076TX i5-13500HX, GeForce RTX 4050 Laptop GPU, SK hynix PC801 HFS512GEJ9X101N BF, IPS, 1920x1080, 16.1" | Dell G15 5530 i7-13650HX, GeForce RTX 4060 Laptop GPU, SSTC CL4-3D512-Q11, IPS, 1920x1080, 15.6" | Média NVIDIA GeForce RTX 4050 Laptop GPU | Média da turma Gaming | |
|---|---|---|---|---|---|---|---|---|
| Power Consumption | 4% | -6% | 31% | -9% | 7% | 15% | -10% | |
| Idle Minimum * (Watt) | 11.95 | 13 -9% | 17.2 -44% | 6 50% | 16.12 -35% | 8.4 30% | 9.95 ? 17% | 13 ? -9% |
| Idle Average * (Watt) | 32 | 17.4 46% | 19.3 40% | 11 66% | 20.47 36% | 14.98 53% | 15.8 ? 51% | 19 ? 41% |
| Idle Maximum * (Watt) | 15.5 | 21.8 -41% | 21.2 -37% | 14 10% | 22.11 -43% | 15.56 -0% | 20.1 ? -30% | 24.6 ? -59% |
| Load Average * (Watt) | 97.5 | 96.4 1% | 90 8% | 65 33% | 94.8 3% | 96.8 1% | 88 ? 10% | 110.7 ? -14% |
| Witcher 3 ultra * (Watt) | 144.9 | 125 14% | 168 -16% | 136.5 6% | 166.9 -15% | 186 -28% | ||
| Load Maximum * (Watt) | 239 | 204 15% | 211 12% | 195 18% | 237 1% | 271.42 -14% | 176.3 ? 26% | 259 ? -8% |
* ... menor é melhor
Power consumption Witcher 3 / stress test
Power consumption with external monitor
Tempos de execução

Com uma duração de 4 horas e 16 minutos, o Helios Neo 16 não tem muita resistência, mesmo no contexto de dispositivos para jogos. Sua taxa de atualização é definida automaticamente de forma variável entre 83 Hz e 120 Hz.
OHP Victus 16 (9 horas) e o AMDXMG Apex 15 (7 horas) oferecem tempos de execução de bateria significativamente mais longos, apesar de o último ter uma bateria menor de 63 Wh.
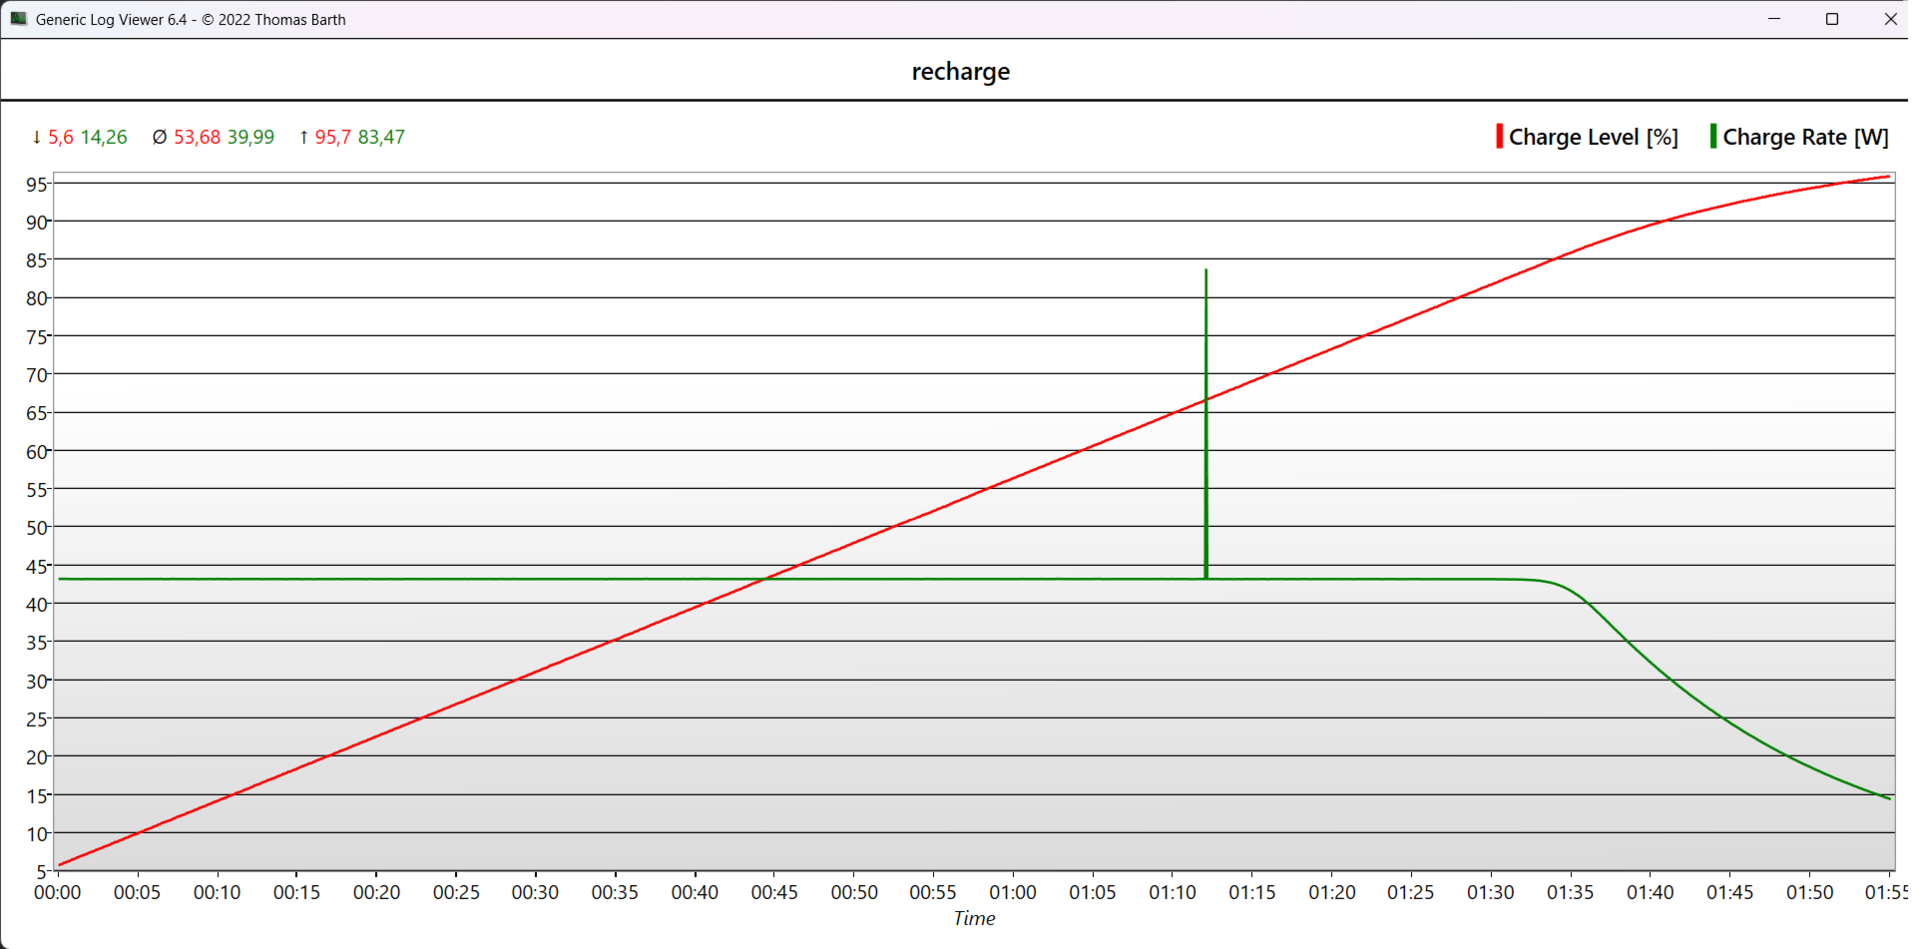
É necessária uma hora inteira para carregar a bateria até 50% e uma carga completa leva duas horas. O carregamento via USB-C leva ainda mais tempo.
| Acer Predator Helios Neo 16 NH.QLTEG.002 i5-13500HX, GeForce RTX 4050 Laptop GPU, 90 Wh | Lenovo Legion Pro 5 16ARX8 (R5 7645HX, RTX 4050) R5 7645HX, GeForce RTX 4050 Laptop GPU, 80 Wh | Acer Predator Helios 16 PH16-71-731Q i7-13700HX, GeForce RTX 4060 Laptop GPU, 90 Wh | Lenovo LOQ 16IRH8 i7-13620H, GeForce RTX 4060 Laptop GPU, 80 Wh | Schenker XMG Apex 15 (Late 23) R7 7840HS, GeForce RTX 4050 Laptop GPU, 62.32 Wh | HP Victus 16-r0076TX i5-13500HX, GeForce RTX 4050 Laptop GPU, 83 Wh | Dell G15 5530 i7-13650HX, GeForce RTX 4060 Laptop GPU, 86 Wh | Média da turma Gaming | |
|---|---|---|---|---|---|---|---|---|
| Duração da bateria | 3% | -7% | 6% | 23% | 27% | -4% | 21% | |
| H.264 (h) | 7.2 | 5.4 -25% | 4.8 -33% | 6.4 -11% | 8.3 15% | 7.7 7% | 6.8 -6% | 8.32 ? 16% |
| WiFi v1.3 (h) | 4.3 | 5.6 30% | 5.6 30% | 6.3 47% | 7.1 65% | 8.9 107% | 6.5 51% | 7.11 ? 65% |
| Load (h) | 1.8 | 1.5 -17% | 1.5 -17% | 1.6 -11% | 1.2 -33% | 0.8 -56% | 1.502 ? -17% | |
| Witcher 3 ultra (h) | 0.8 | 1.5 | 1.5 | 0.8 |
Pro
Contra
Veredicto: O jogador de médio porte com uma RTX 4050 não é muito promissor
O Predator Helios Neo 16 da Acer é uma quimera que consiste em um sólido laptop para jogos de médio porte e alguns recursos de nível básico. Em particular, o último inclui aRTX 4050instalado em nosso dispositivo de teste, mas seu painel Full HD, que pode oferecer valores decentes, é bastante padrão. O mesmo pode ser dito do teclado, que também pode ser encontrado em muitos outros notebooks econômicos para jogos.
A Acer combinou tudo isso com um poderoso processador Intel Corei5-13500HXde classe desktop, incluindo uma solução de resfriamento de metal líquido, um gabinete elegante, robusto e bem construído, bem como muitas opções de conectividade, que incluem uma verdadeira conexão HDMI 2.1 para a dGPU e duas portas Thunderbolt 4. Completam a configuração o Advanced Optimus e o G-Sync.
Infelizmente, não temos certeza se essa combinação (em conexão com seu MRSP de US$ 1.069) pode encontrar seu mercado-alvo. Ela exigiria antes umaRTX 4060ou umaRTX 4070para valer a pena, o que geralmente só pode ser encontrado na Neo 16 por um custo adicional. Também em contraste com oHelios 16esse modelo não tem a opção de escolher um i9-13900HX, um painel QHD com 100% de cobertura sRGB ou uma opção Mini LED. Além disso, a webcam de 720p é um grande diferencial e, em vista do preço do laptop, é um verdadeiro motivo de crítica. Sua curta autonomia de 4 horas e meia também não é das melhores.
O Acer Predator Helios Neo 16 é uma versão reduzida do sólido Helios 16. Em teoria, essa é uma boa ideia, mas só funcionaria se a diferença de preço entre os dois não fosse tão pequena.
Seu potente sistema de resfriamento foi adotado quase 1:1 do Helios 16, o que resulta em baixas temperaturas internas e baixas emissões de ruído (no máximo, ao usar o modo balanceado), e não à custa de nenhum desempenho. Por outro lado, suas grandes restrições de energia da GPU e da CPU no modo de bateria são um pouco exageradas.
Achamos totalmente bizarro que o senhor possa adquirir o Helios 16 normal com a mesma configuração, mas com mais recursos, pelo mesmo preço. Como alternativa, talvez valha a pena dar uma olhada noLegion Pro 5 16(Intel), que custa um pouco mais, mas se beneficia de um painel QHD de 240 Hz, uma RTX 4060 mais potente, um teclado confortável, bem como um resfriamento mais silencioso ao jogar. Por outro lado, se o senhor estiver procurando um verdadeiro gamer econômico, talvez seja melhor dar uma olhada noLenovo LOQ 16que apresenta um AMDRyzen 9 7940HSum painel QHD e uma RTX 4050 (US$ 1.200) ou uma RTX 4060 (US$ 1.400).
Preço e disponibilidade
A versão do Acer Predator Helios 16 que testamos, com um Intel Core i5-13500HX, RTX 4050 e uma tela FHD+, pode ser encontrada na Amazon por US$ 1.069.
Acer Predator Helios Neo 16 NH.QLTEG.002
- 11/02/2023 v7 (old)
Marvin Gollor
Transparência
A seleção dos dispositivos a serem analisados é feita pela nossa equipe editorial. A amostra de teste foi fornecida ao autor como empréstimo pelo fabricante ou varejista para fins desta revisão. O credor não teve influência nesta revisão, nem o fabricante recebeu uma cópia desta revisão antes da publicação. Não houve obrigação de publicar esta revisão. Como empresa de mídia independente, a Notebookcheck não está sujeita à autoridade de fabricantes, varejistas ou editores.
É assim que o Notebookcheck está testando
Todos os anos, o Notebookcheck analisa de forma independente centenas de laptops e smartphones usando procedimentos padronizados para garantir que todos os resultados sejam comparáveis. Desenvolvemos continuamente nossos métodos de teste há cerca de 20 anos e definimos padrões da indústria no processo. Em nossos laboratórios de teste, equipamentos de medição de alta qualidade são utilizados por técnicos e editores experientes. Esses testes envolvem um processo de validação em vários estágios. Nosso complexo sistema de classificação é baseado em centenas de medições e benchmarks bem fundamentados, o que mantém a objetividade.Price comparison

