
Veredicto: Um passo à frente, dois passos atrás
O antigo ThinkPad P16 era maior e mais pesado do que a concorrência. O modelo mais recente, o Lenovo ThinkPad P16 Gen 3, no entanto, parece uma correção exagerada: Ele é muito mais móvel, mas faz sacrifícios em termos de desempenho, com o TGP de 105 W da GPU e o carregador de 180 W que vêm à mente. Isso não é algo que esperamos dessa linha de produtos que tem o desempenho como seu principal objetivo.
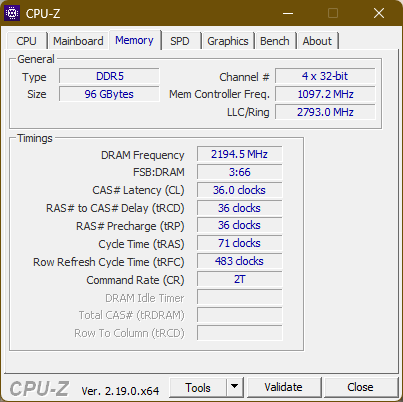
O desempenho geral ainda é alto, e o ThinkPad P16 G3 tem muitas qualidades excelentes que o tornam um bom cavalo de batalha. Especialmente notável é a capacidade de expansão, pois é possível colocar até 192 GB de RAM e três SSDs de 2280 nesse laptop. Para uso de CAD ou IA local, este é um ótimo laptop.
Pro
Contra
Índice
- Veredicto: Um passo à frente, dois passos atrás
- Especificações: Core Ultra 9 e RTX Pro 3000 Blackwell
- O caso: Um começo completamente novo para o ThinkPad P16
- Conectividade
- Dispositivos de entrada
- Tela
- Desempenho
- Emissões
- Gerenciamento de energia
- Classificação do Notebookcheck
- Concorrentes potenciais em comparação
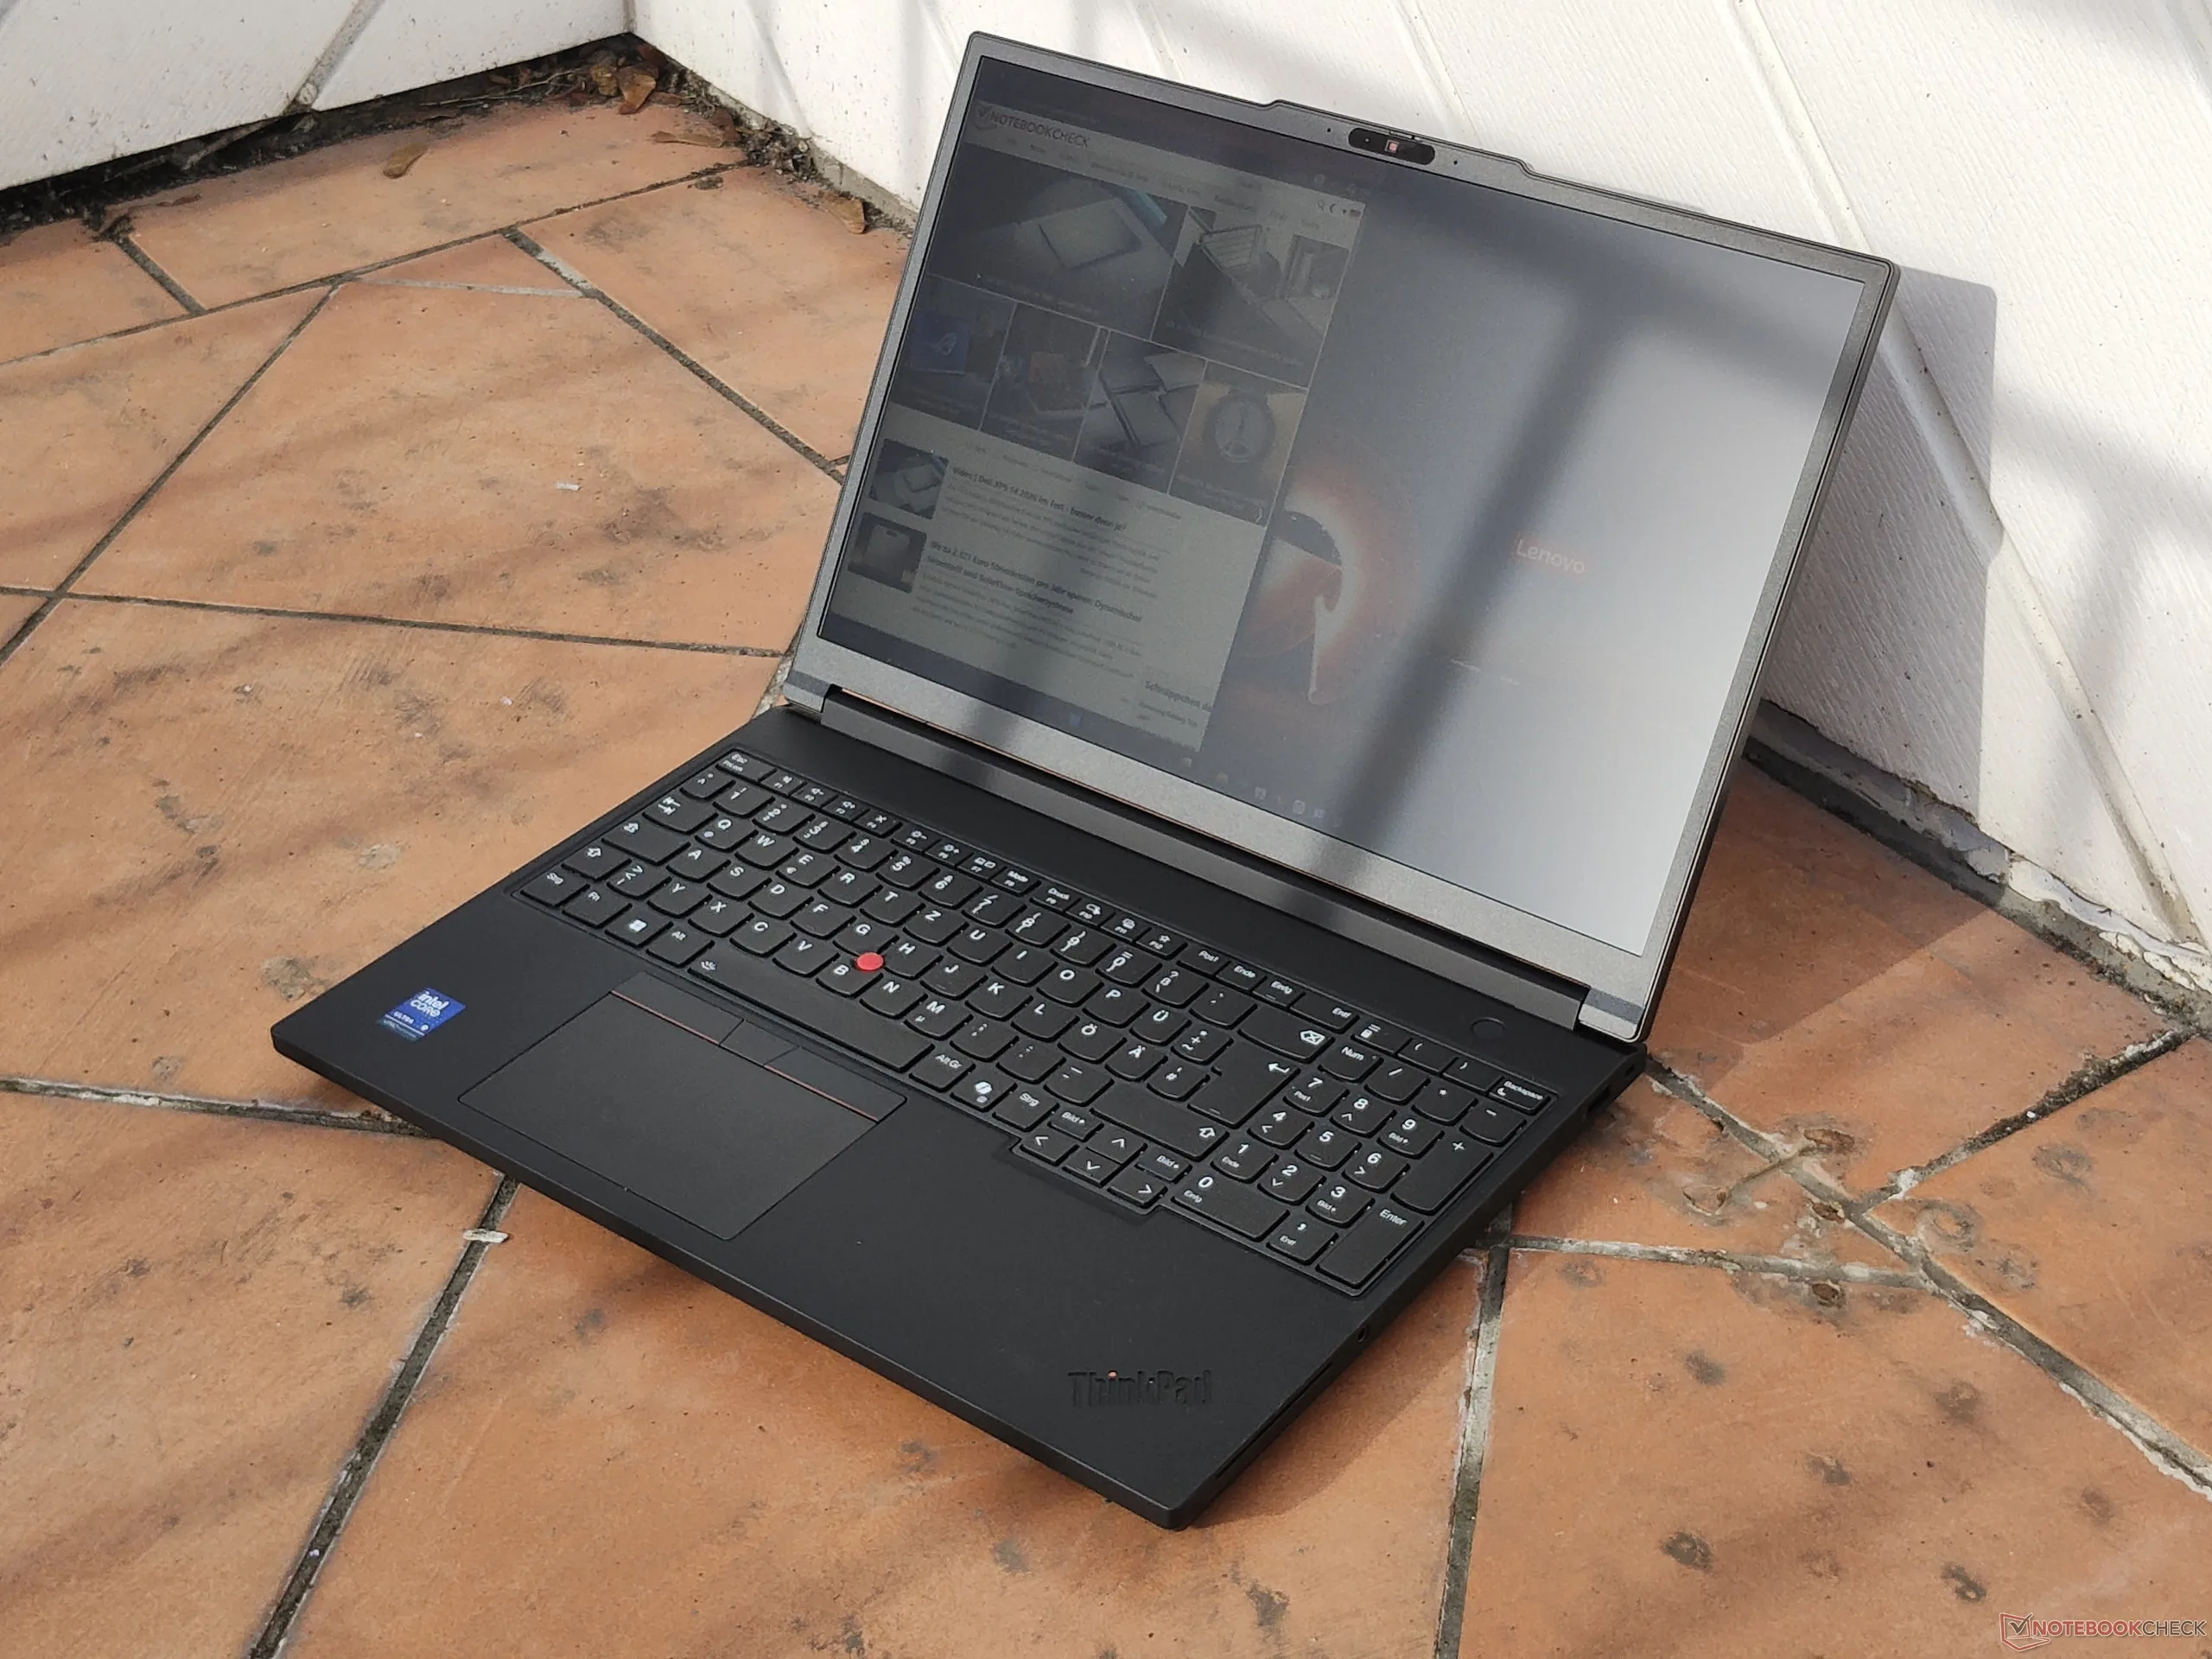
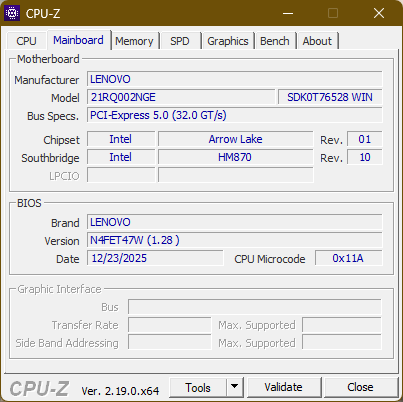
A Lenovo chama suas estações de trabalho móveis de série ThinkPad P - com P significando potência ou desempenho. Nosso dispositivo de análise, o Lenovo ThinkPad P16 Gen 3, representa isso mais do que qualquer outro modelo da série. Ele prioriza o desempenho em relação a outros aspectos, como a mobilidade. Esse é o laptop ThinkPad mais pesado, mais espesso, mas também mais poderoso da linha, com mais opções de configuração e potencial de atualização. Se comprar um P16 Gen 3, o senhor precisa dessa potência - e tem muito dinheiro. Seja em CAD ou IA local, ou mesmo atuando como um servidor portátil, o ThinkPad P16 é o modelo que deve dar conta do recado.
Especificações: Core Ultra 9 e RTX Pro 3000 Blackwell
O caso: Um começo completamente novo para o ThinkPad P16
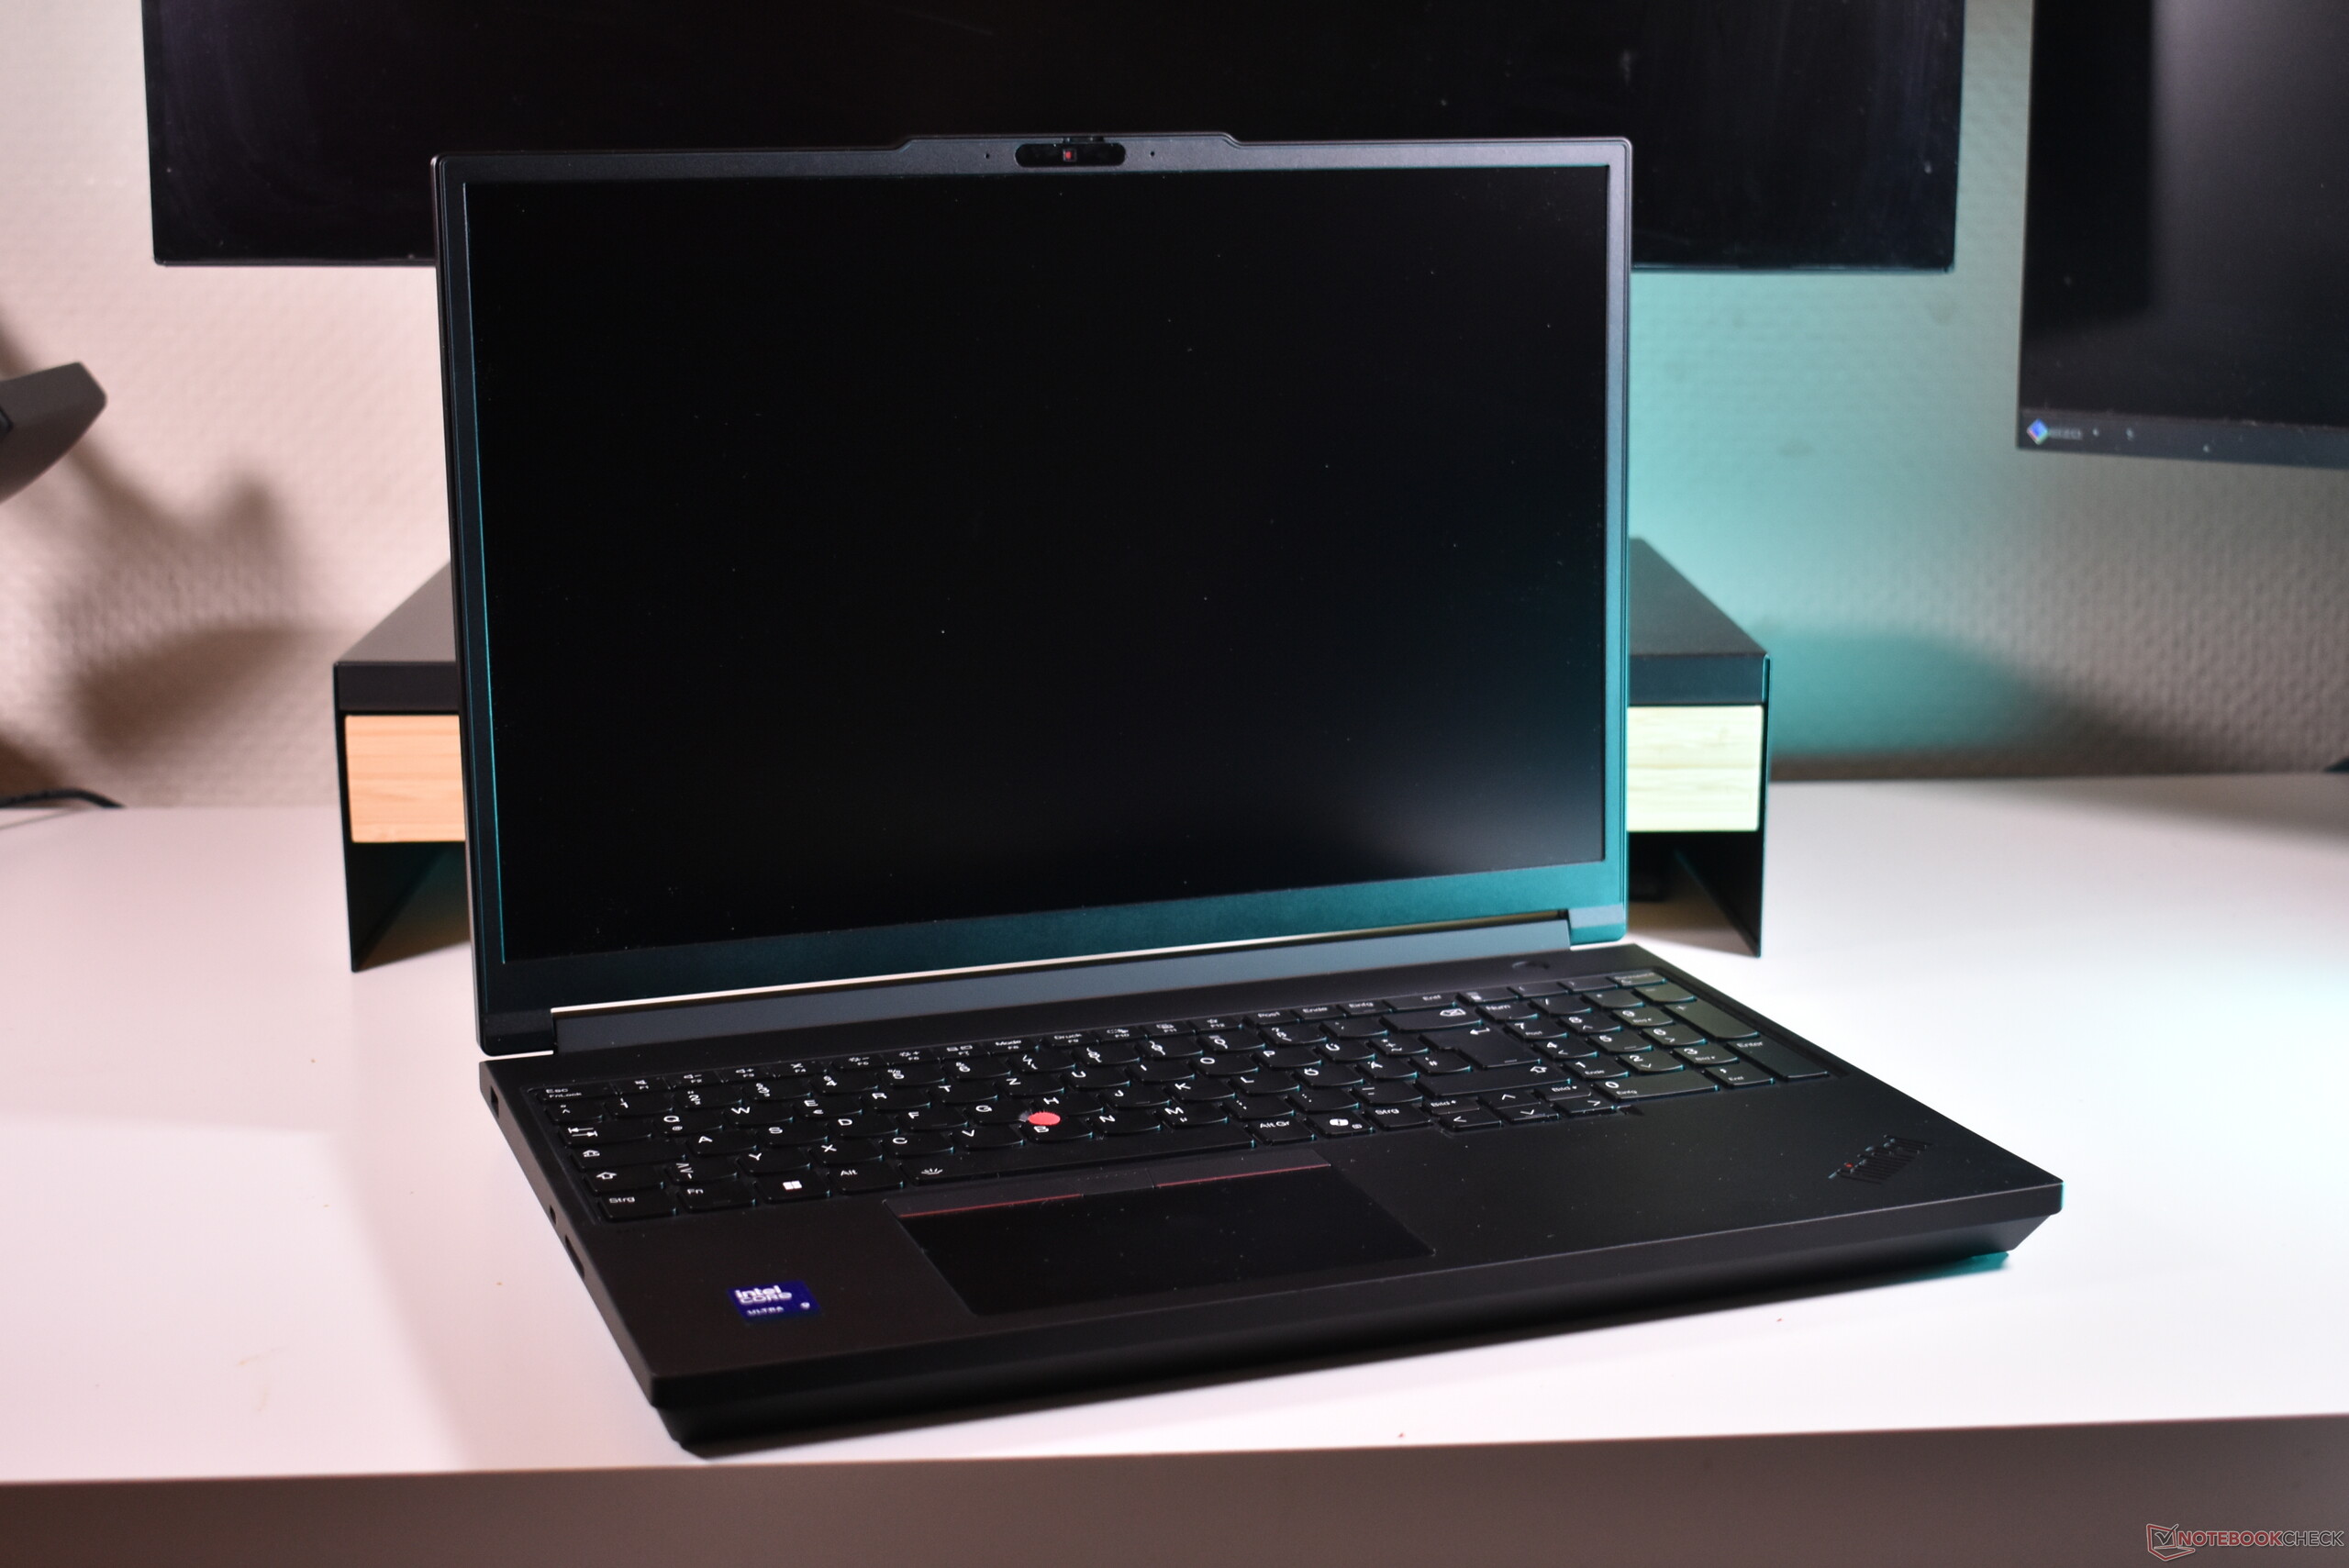
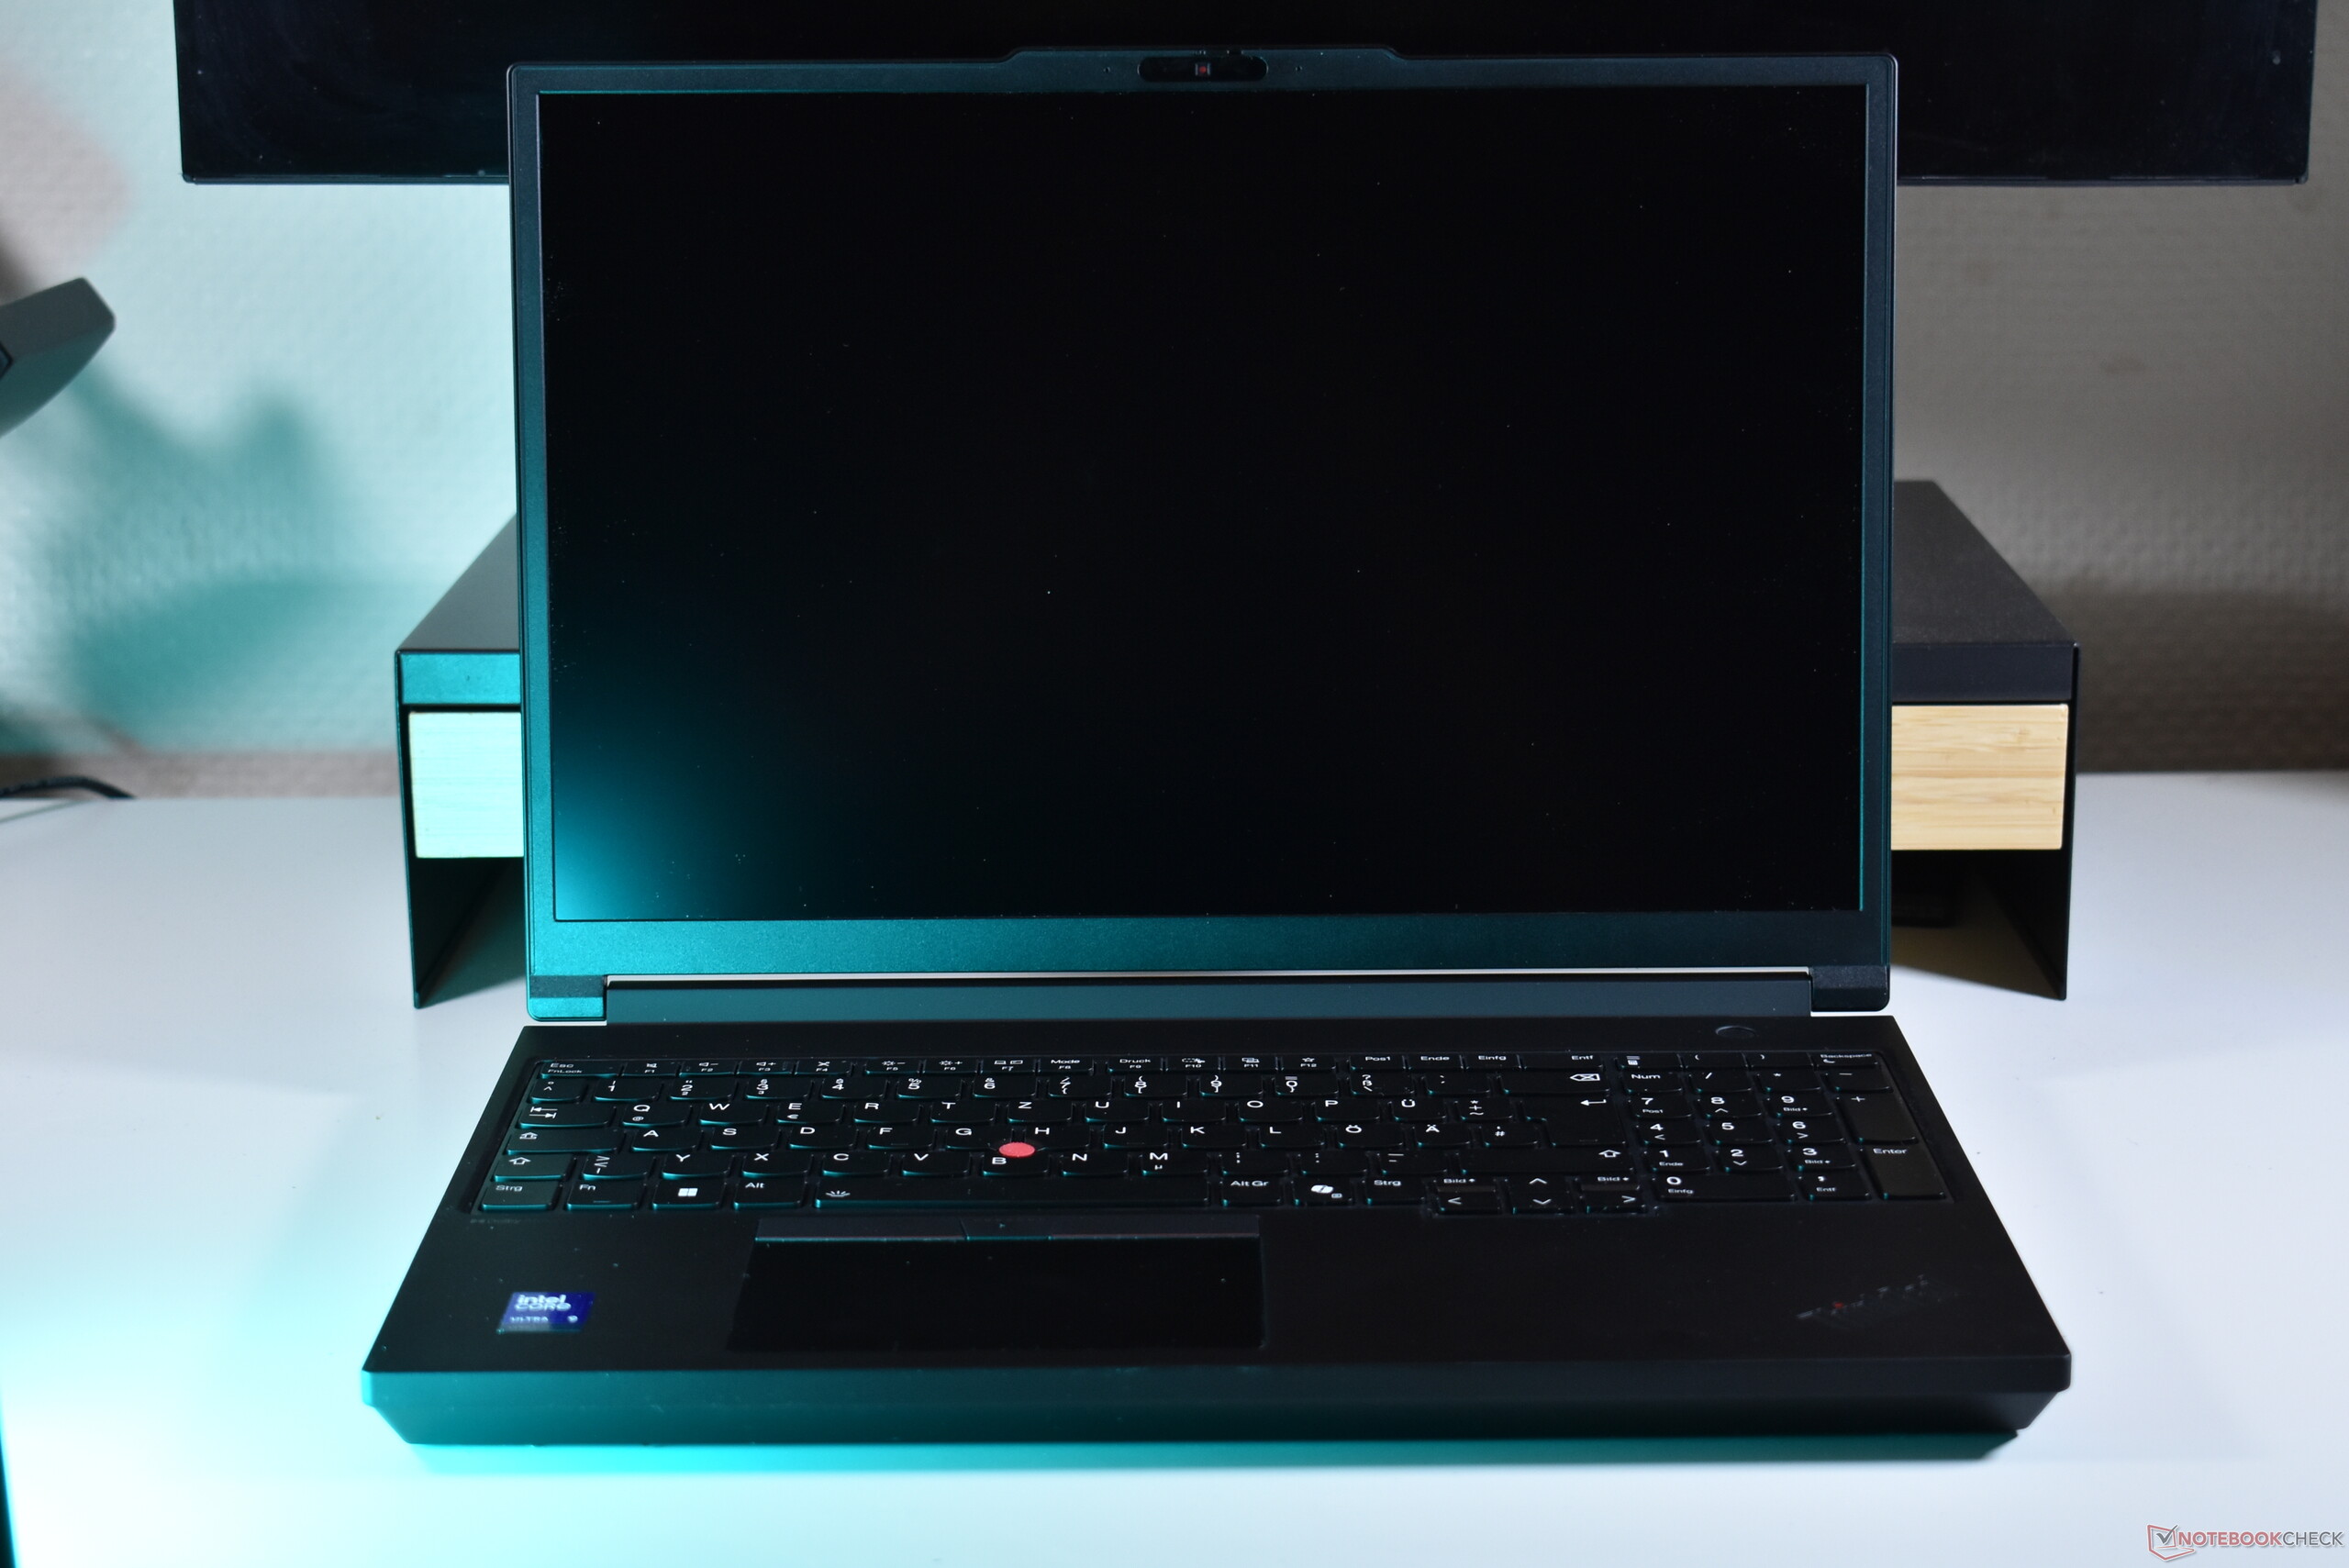
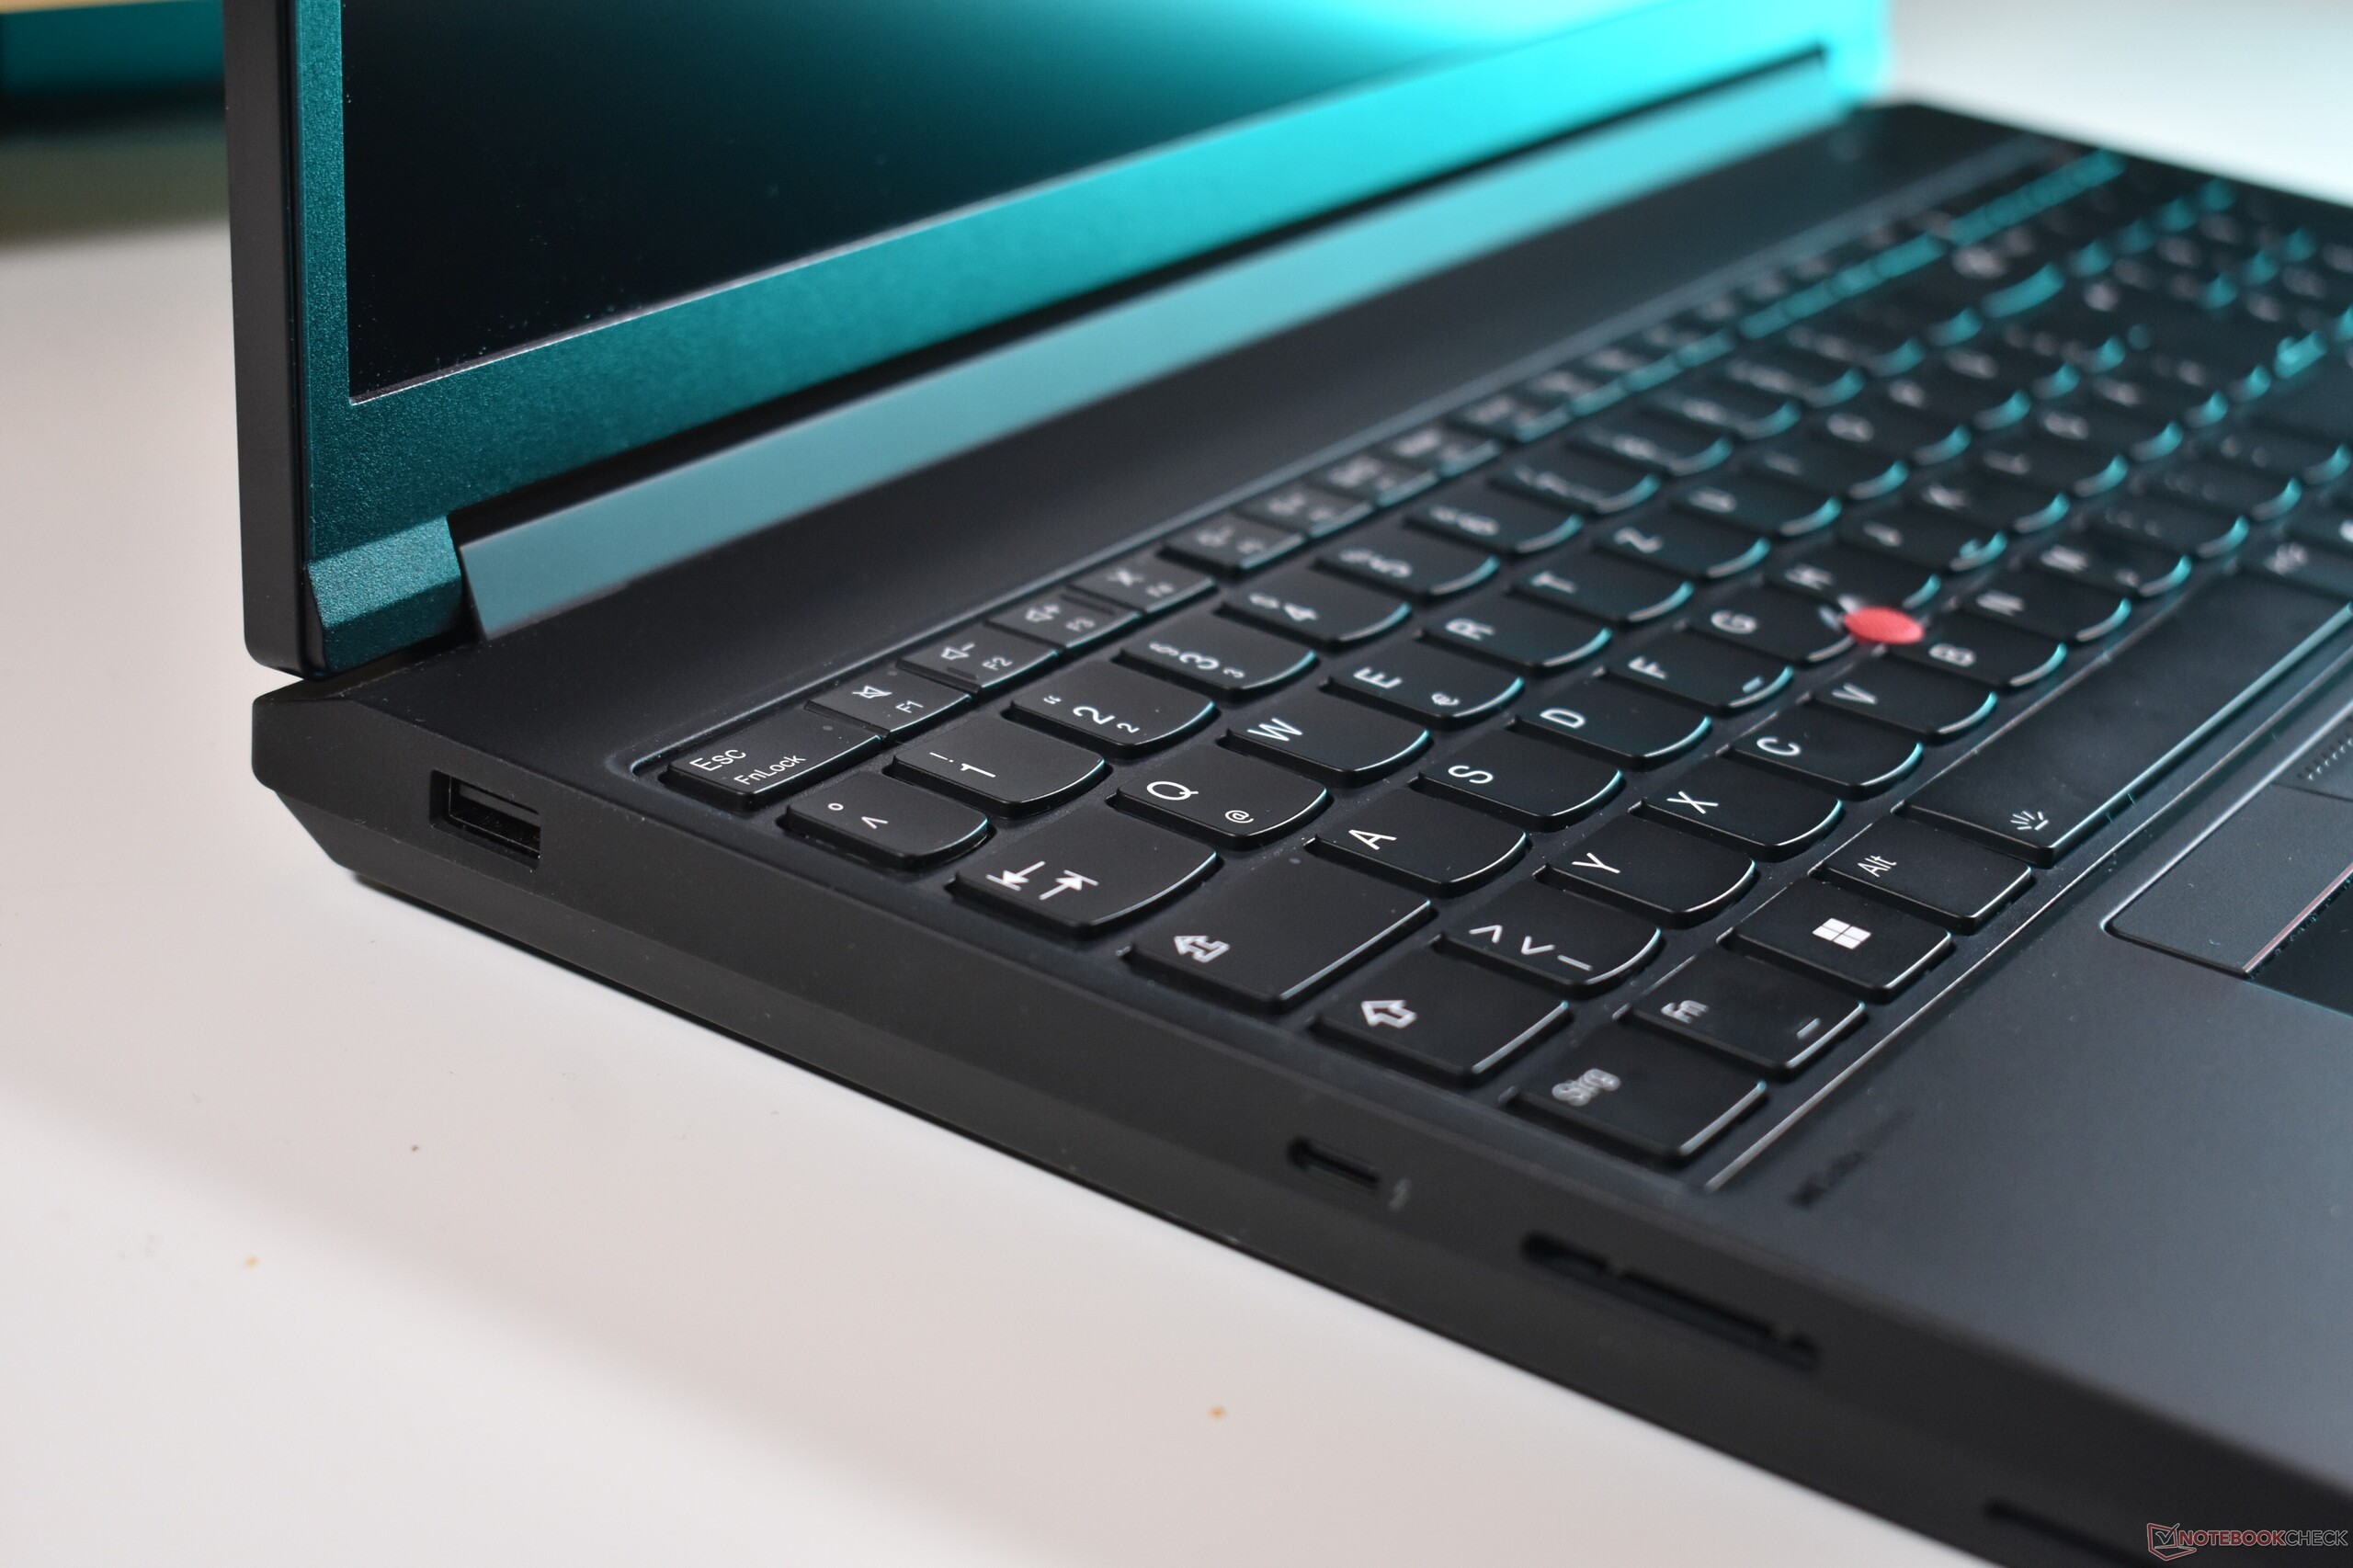
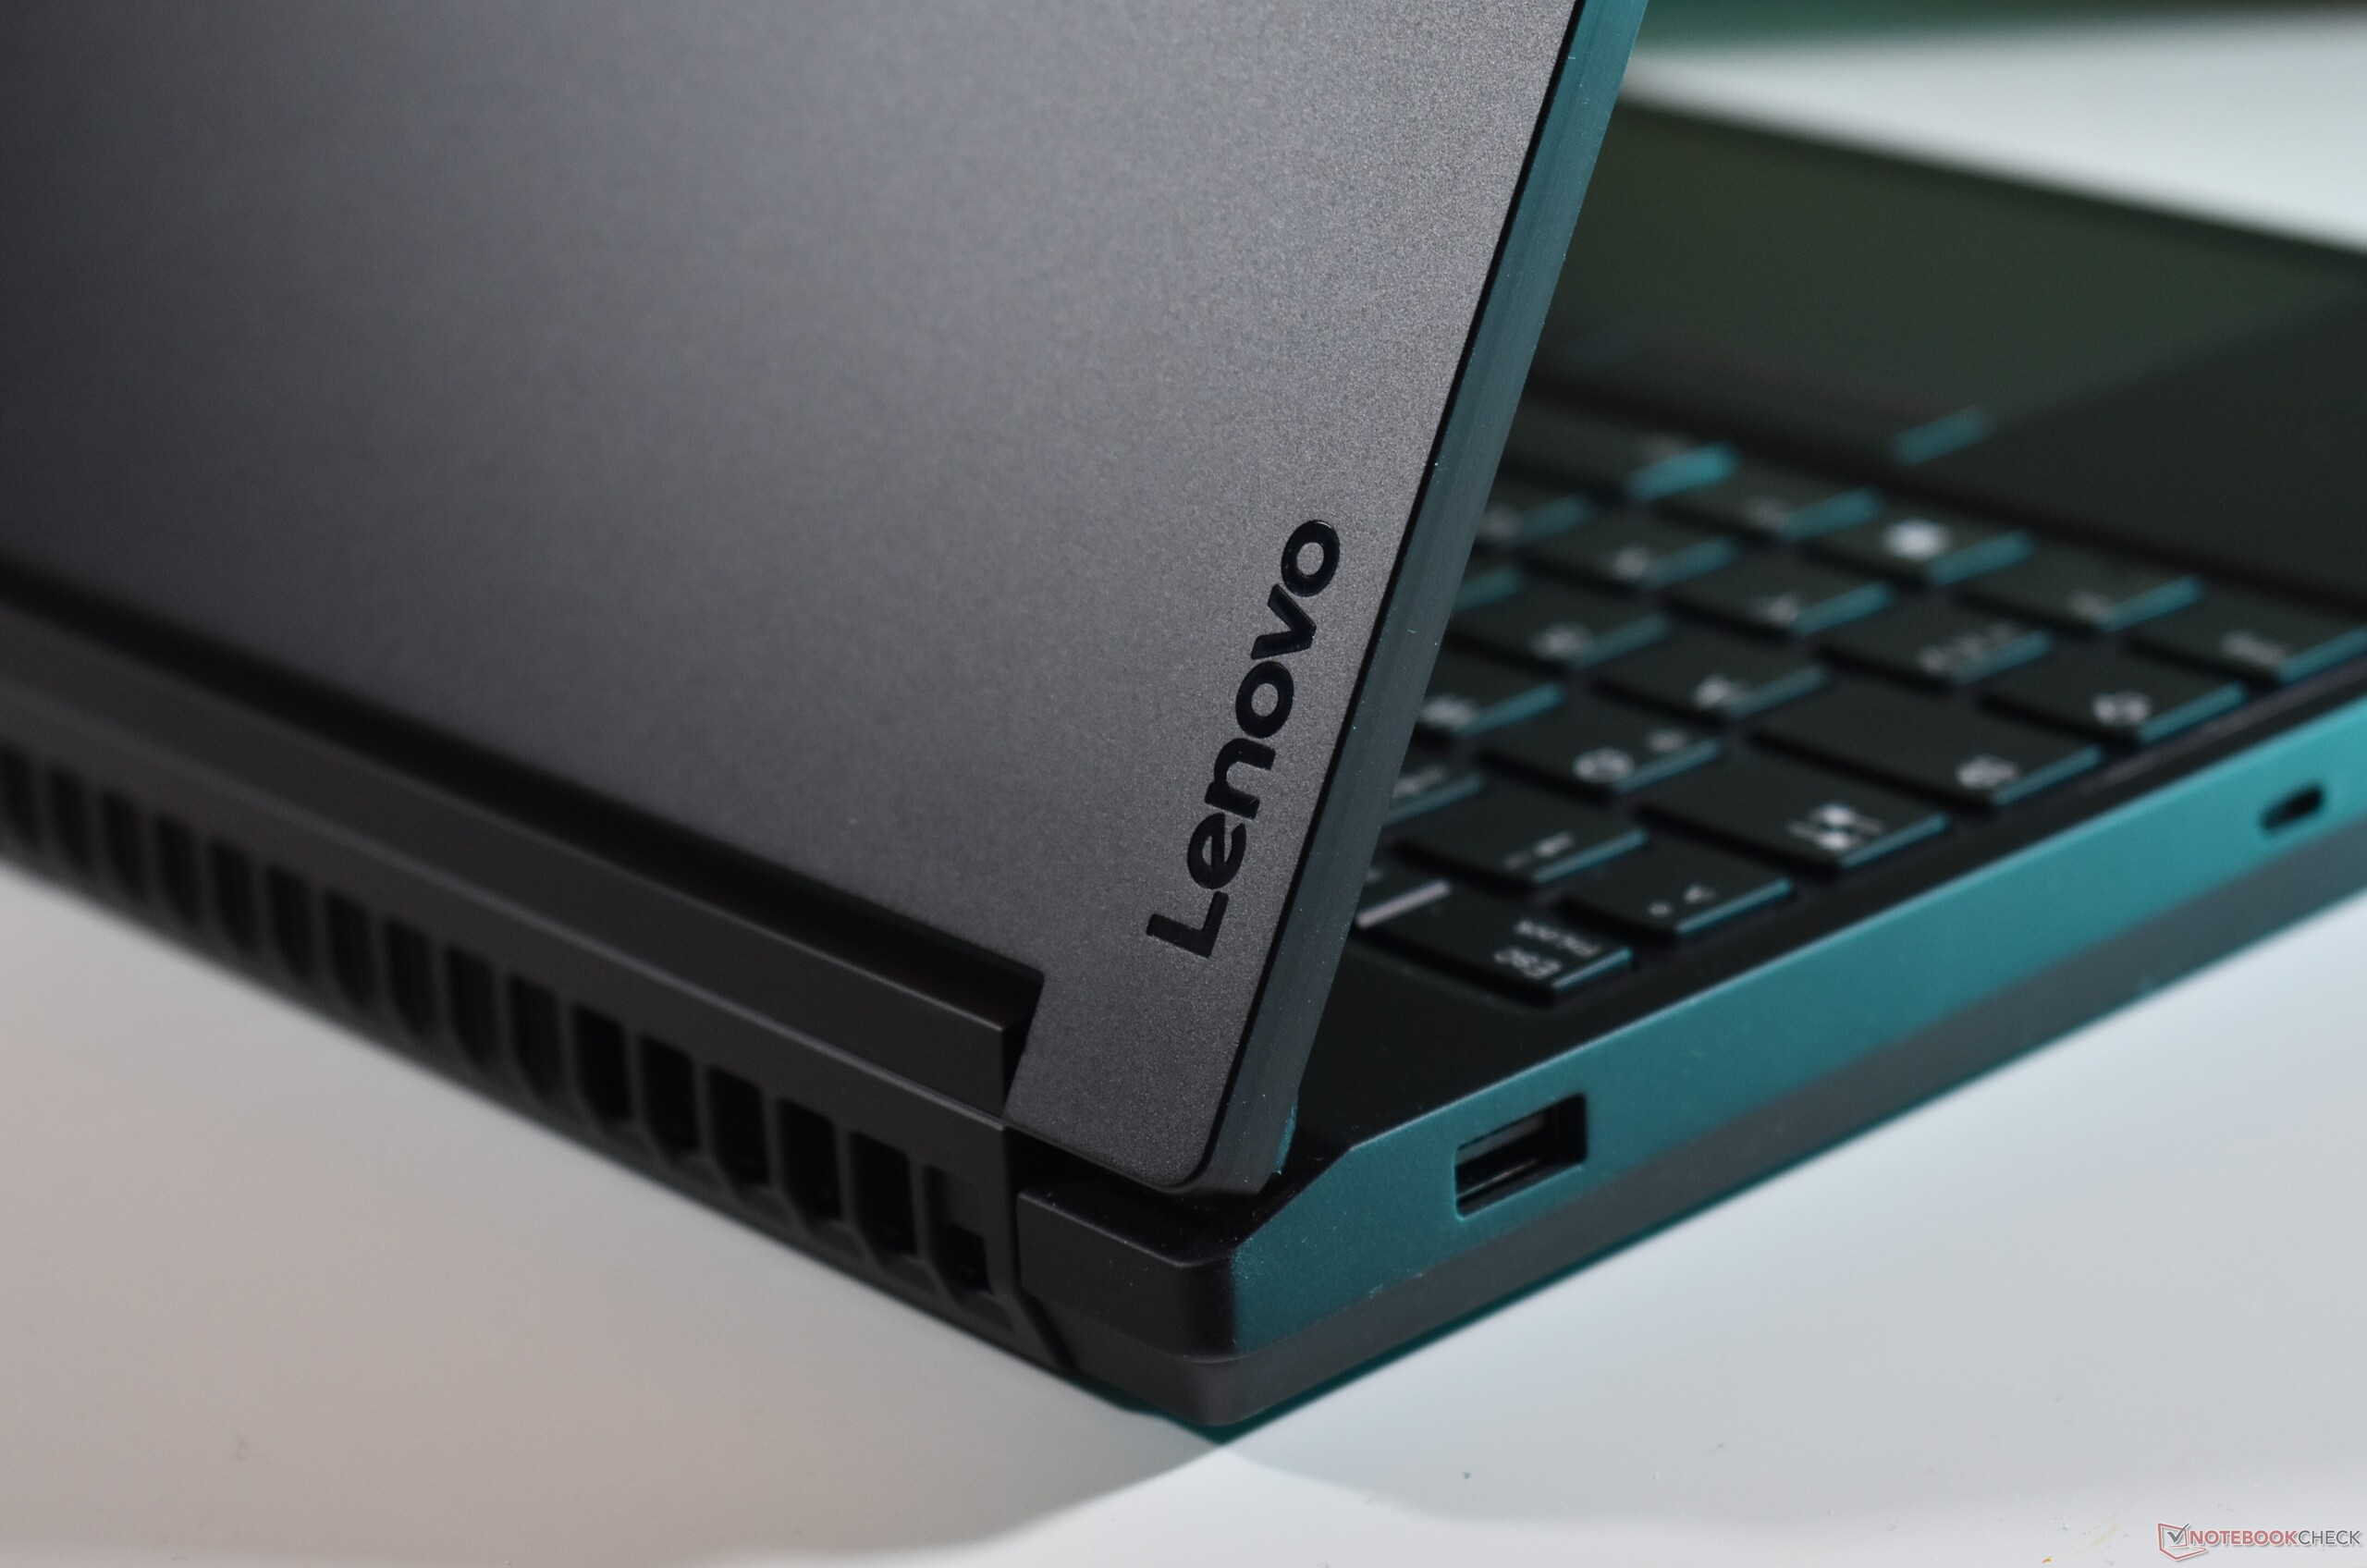
Com o original ThinkPad P16 Gen 1 e o ThinkPad P16 Gen 2a Lenovo tomou uma nova e ousada direção em suas estações de trabalho: Cinza em vez de preto, arredondado em vez de quadrado. Tudo isso está fora de moda no novo Lenovo ThinkPad P16 Gen 3. Ele é quadrado e preto como um ThinkPad clássico. Mas não é uma rejeição completa do antigo design do P16: A Lenovo mantém a tampa superior de alumínio, embora agora em preto anodizado. A metade inferior de metal do chassi usa o típico revestimento preto do ThinkPad, que é suave e ligeiramente emborrachado. A novidade deste ano é a dobradiça de peça única mais larga, que é onde a Lenovo coloca as antenas Wi-Fi. A tela quase não oscila e abre 180 graus. É possível abrir com uma mão.
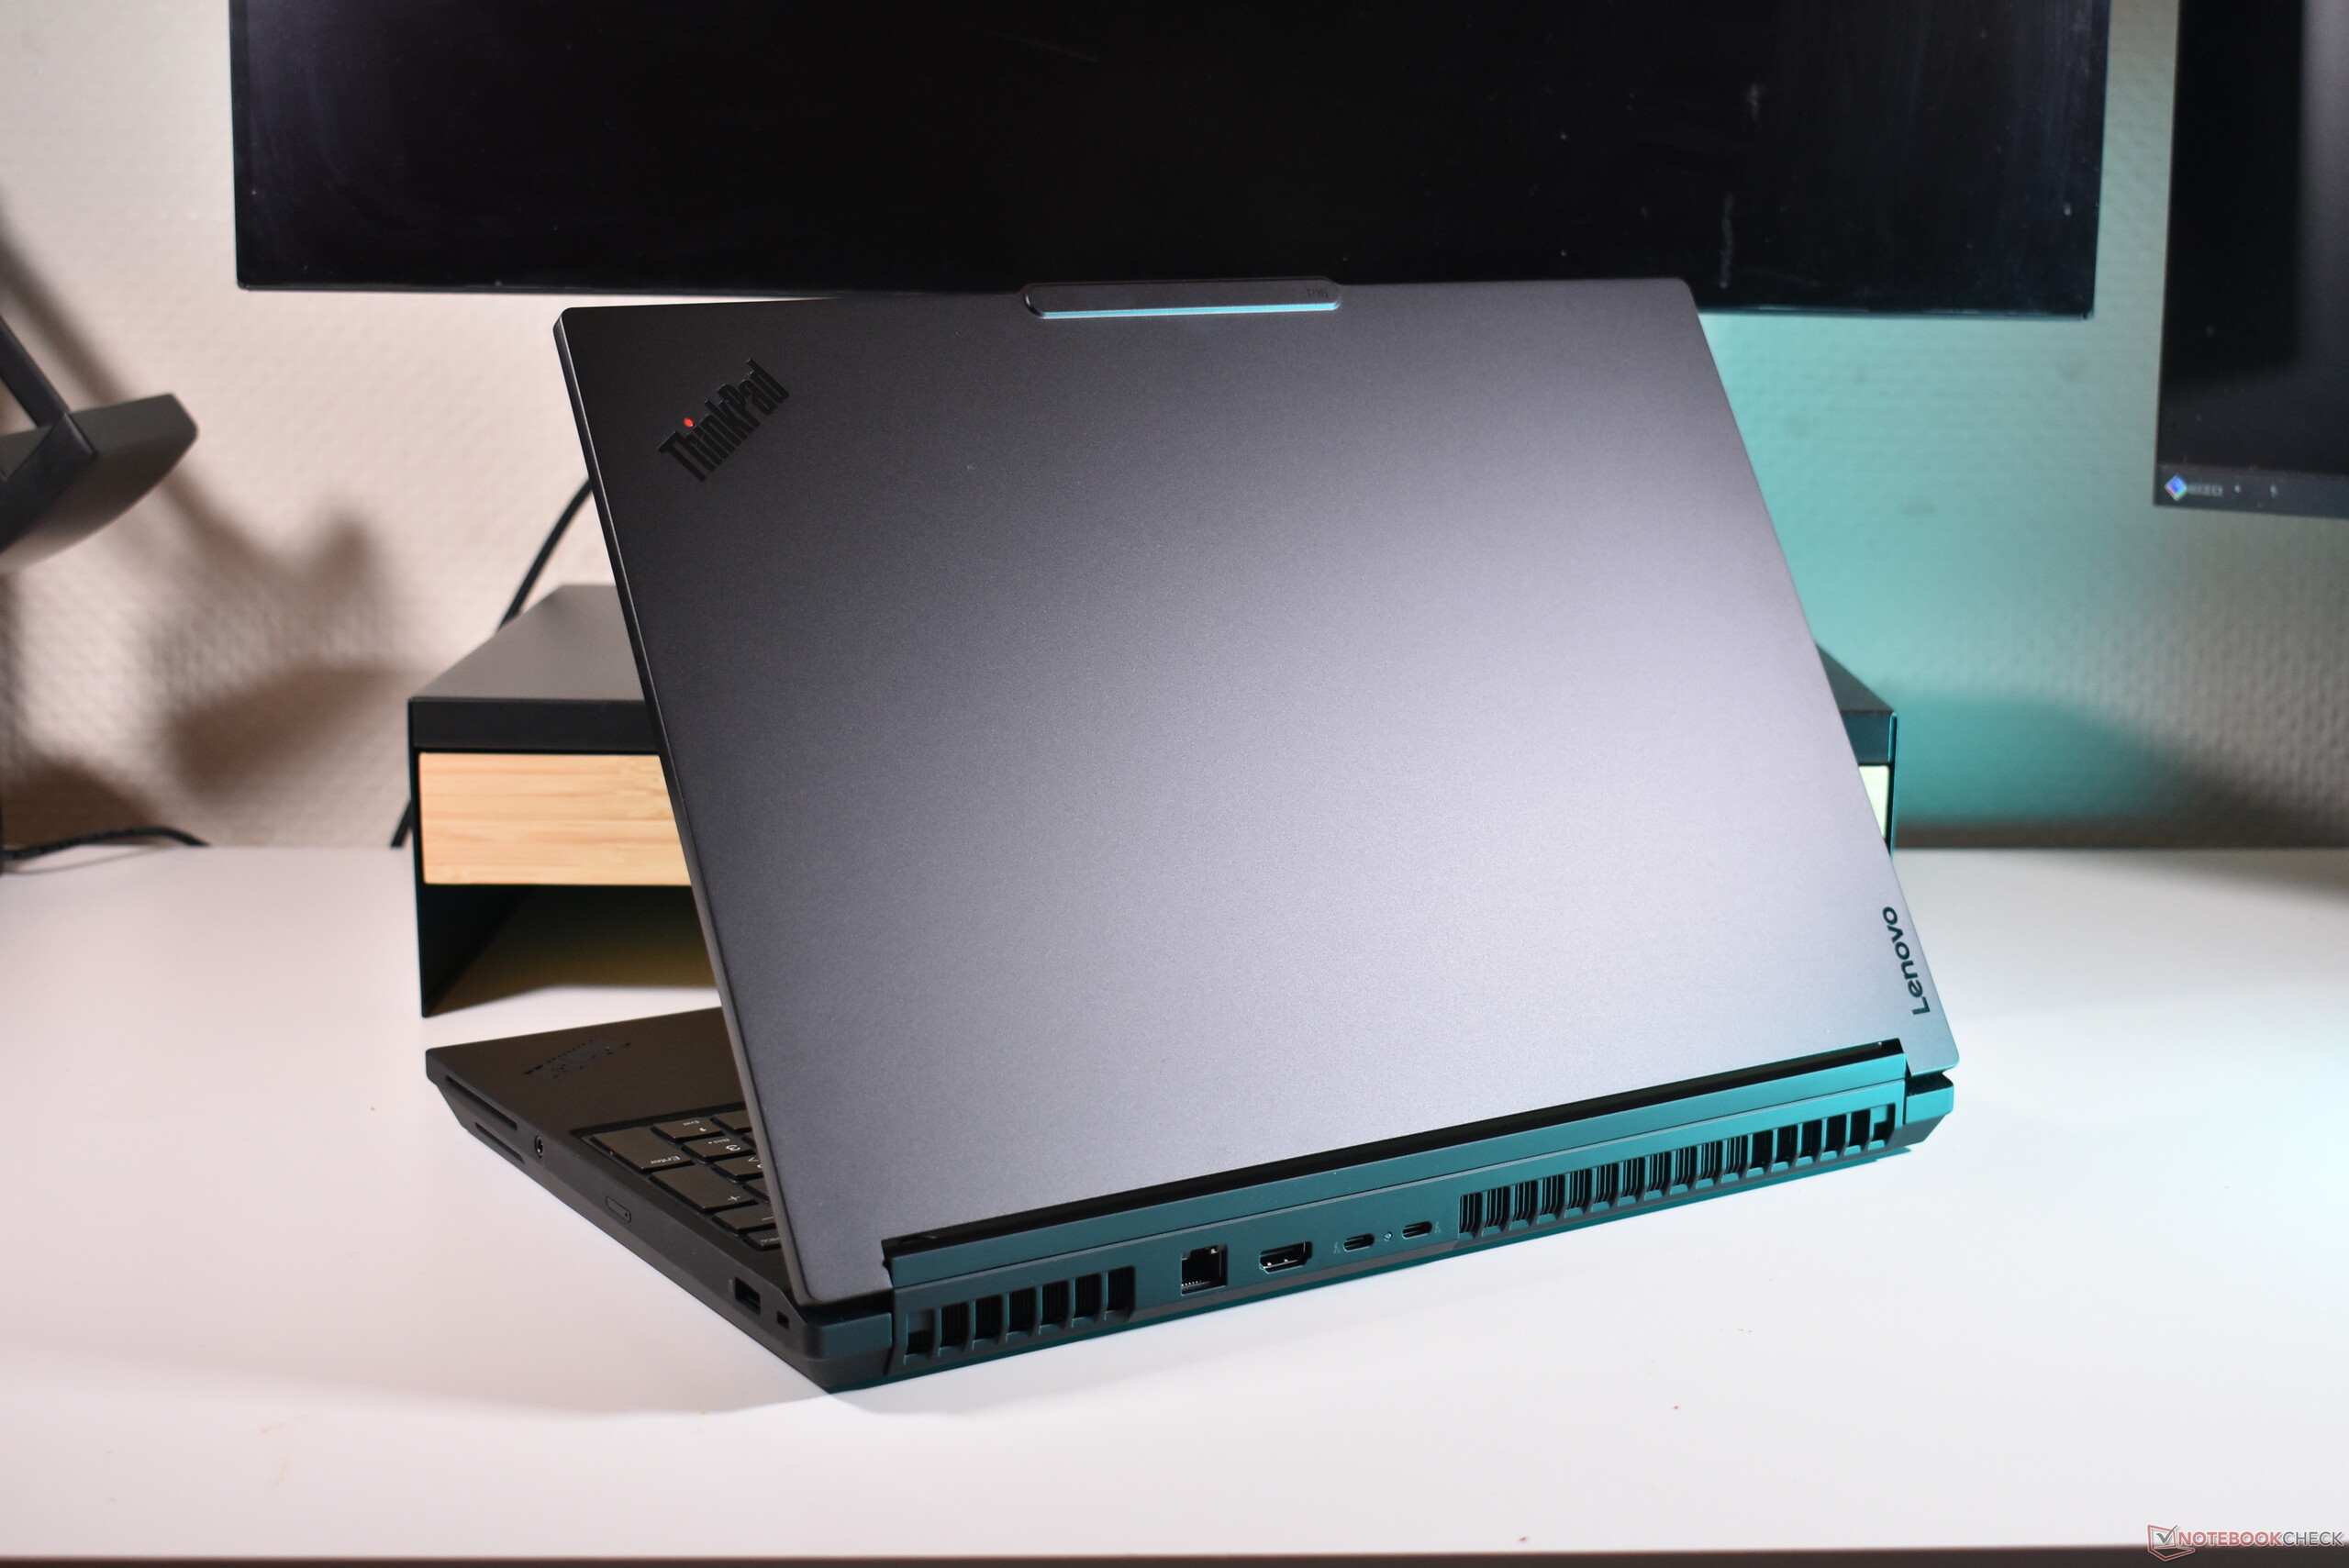
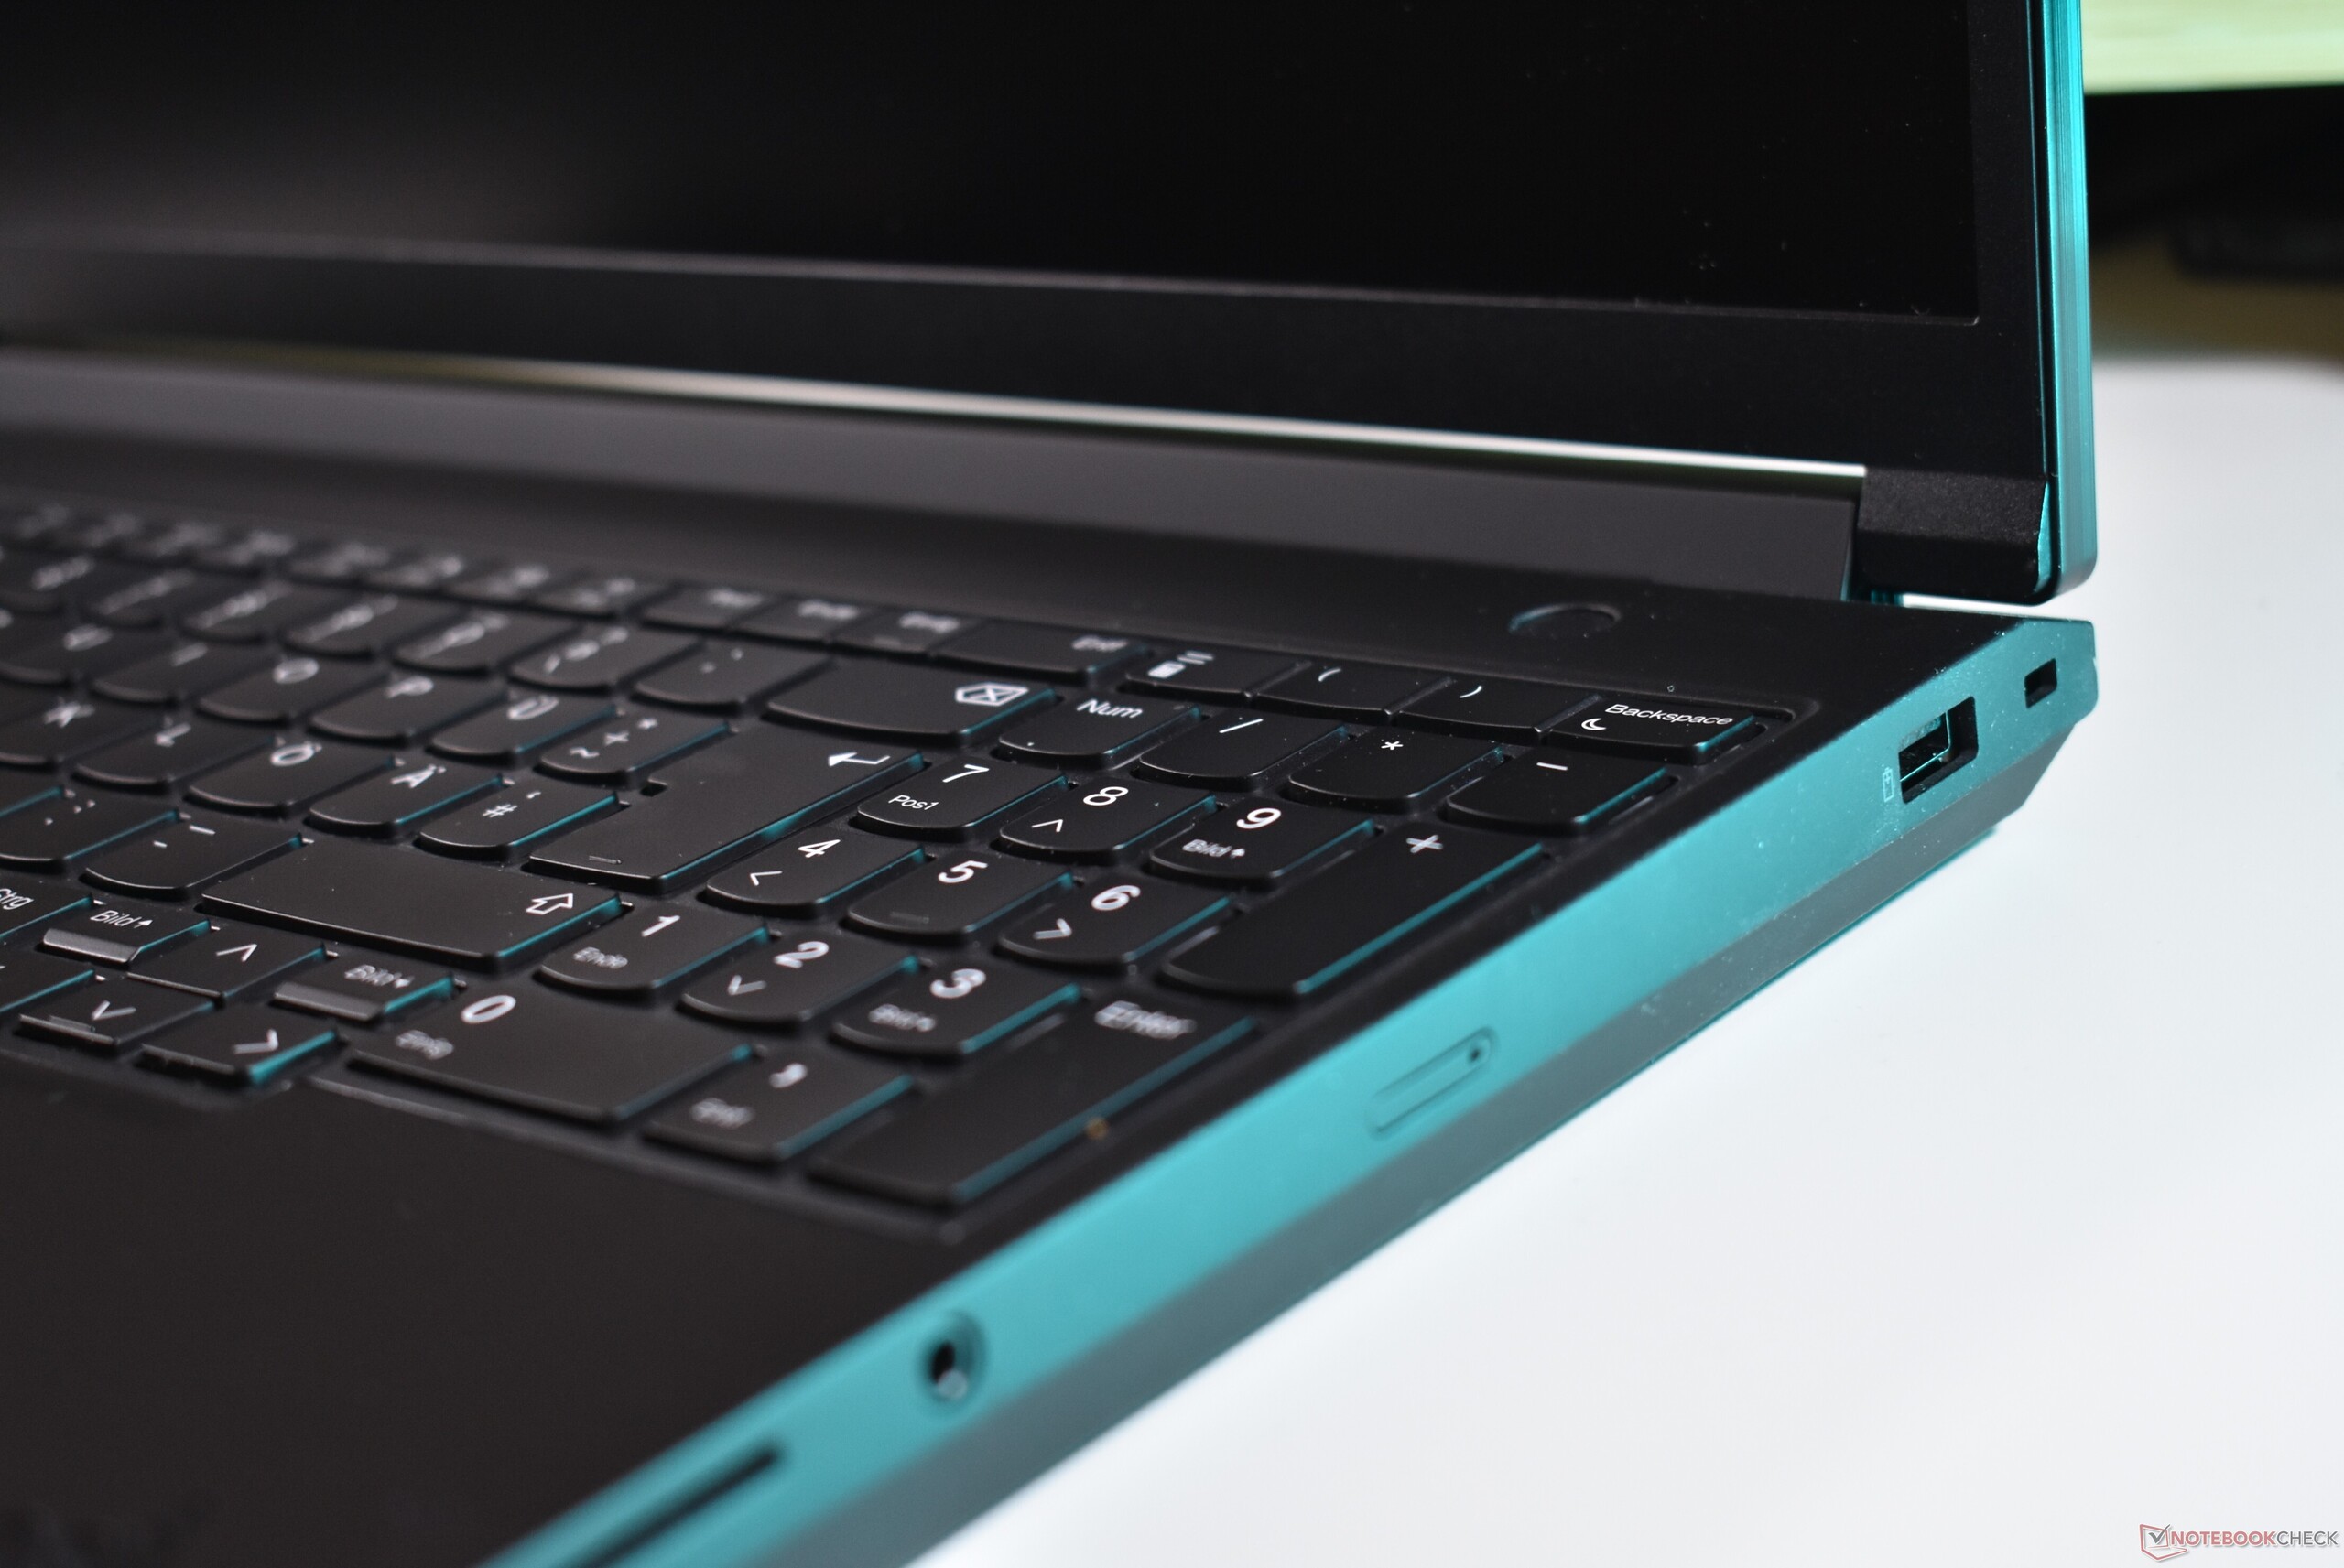

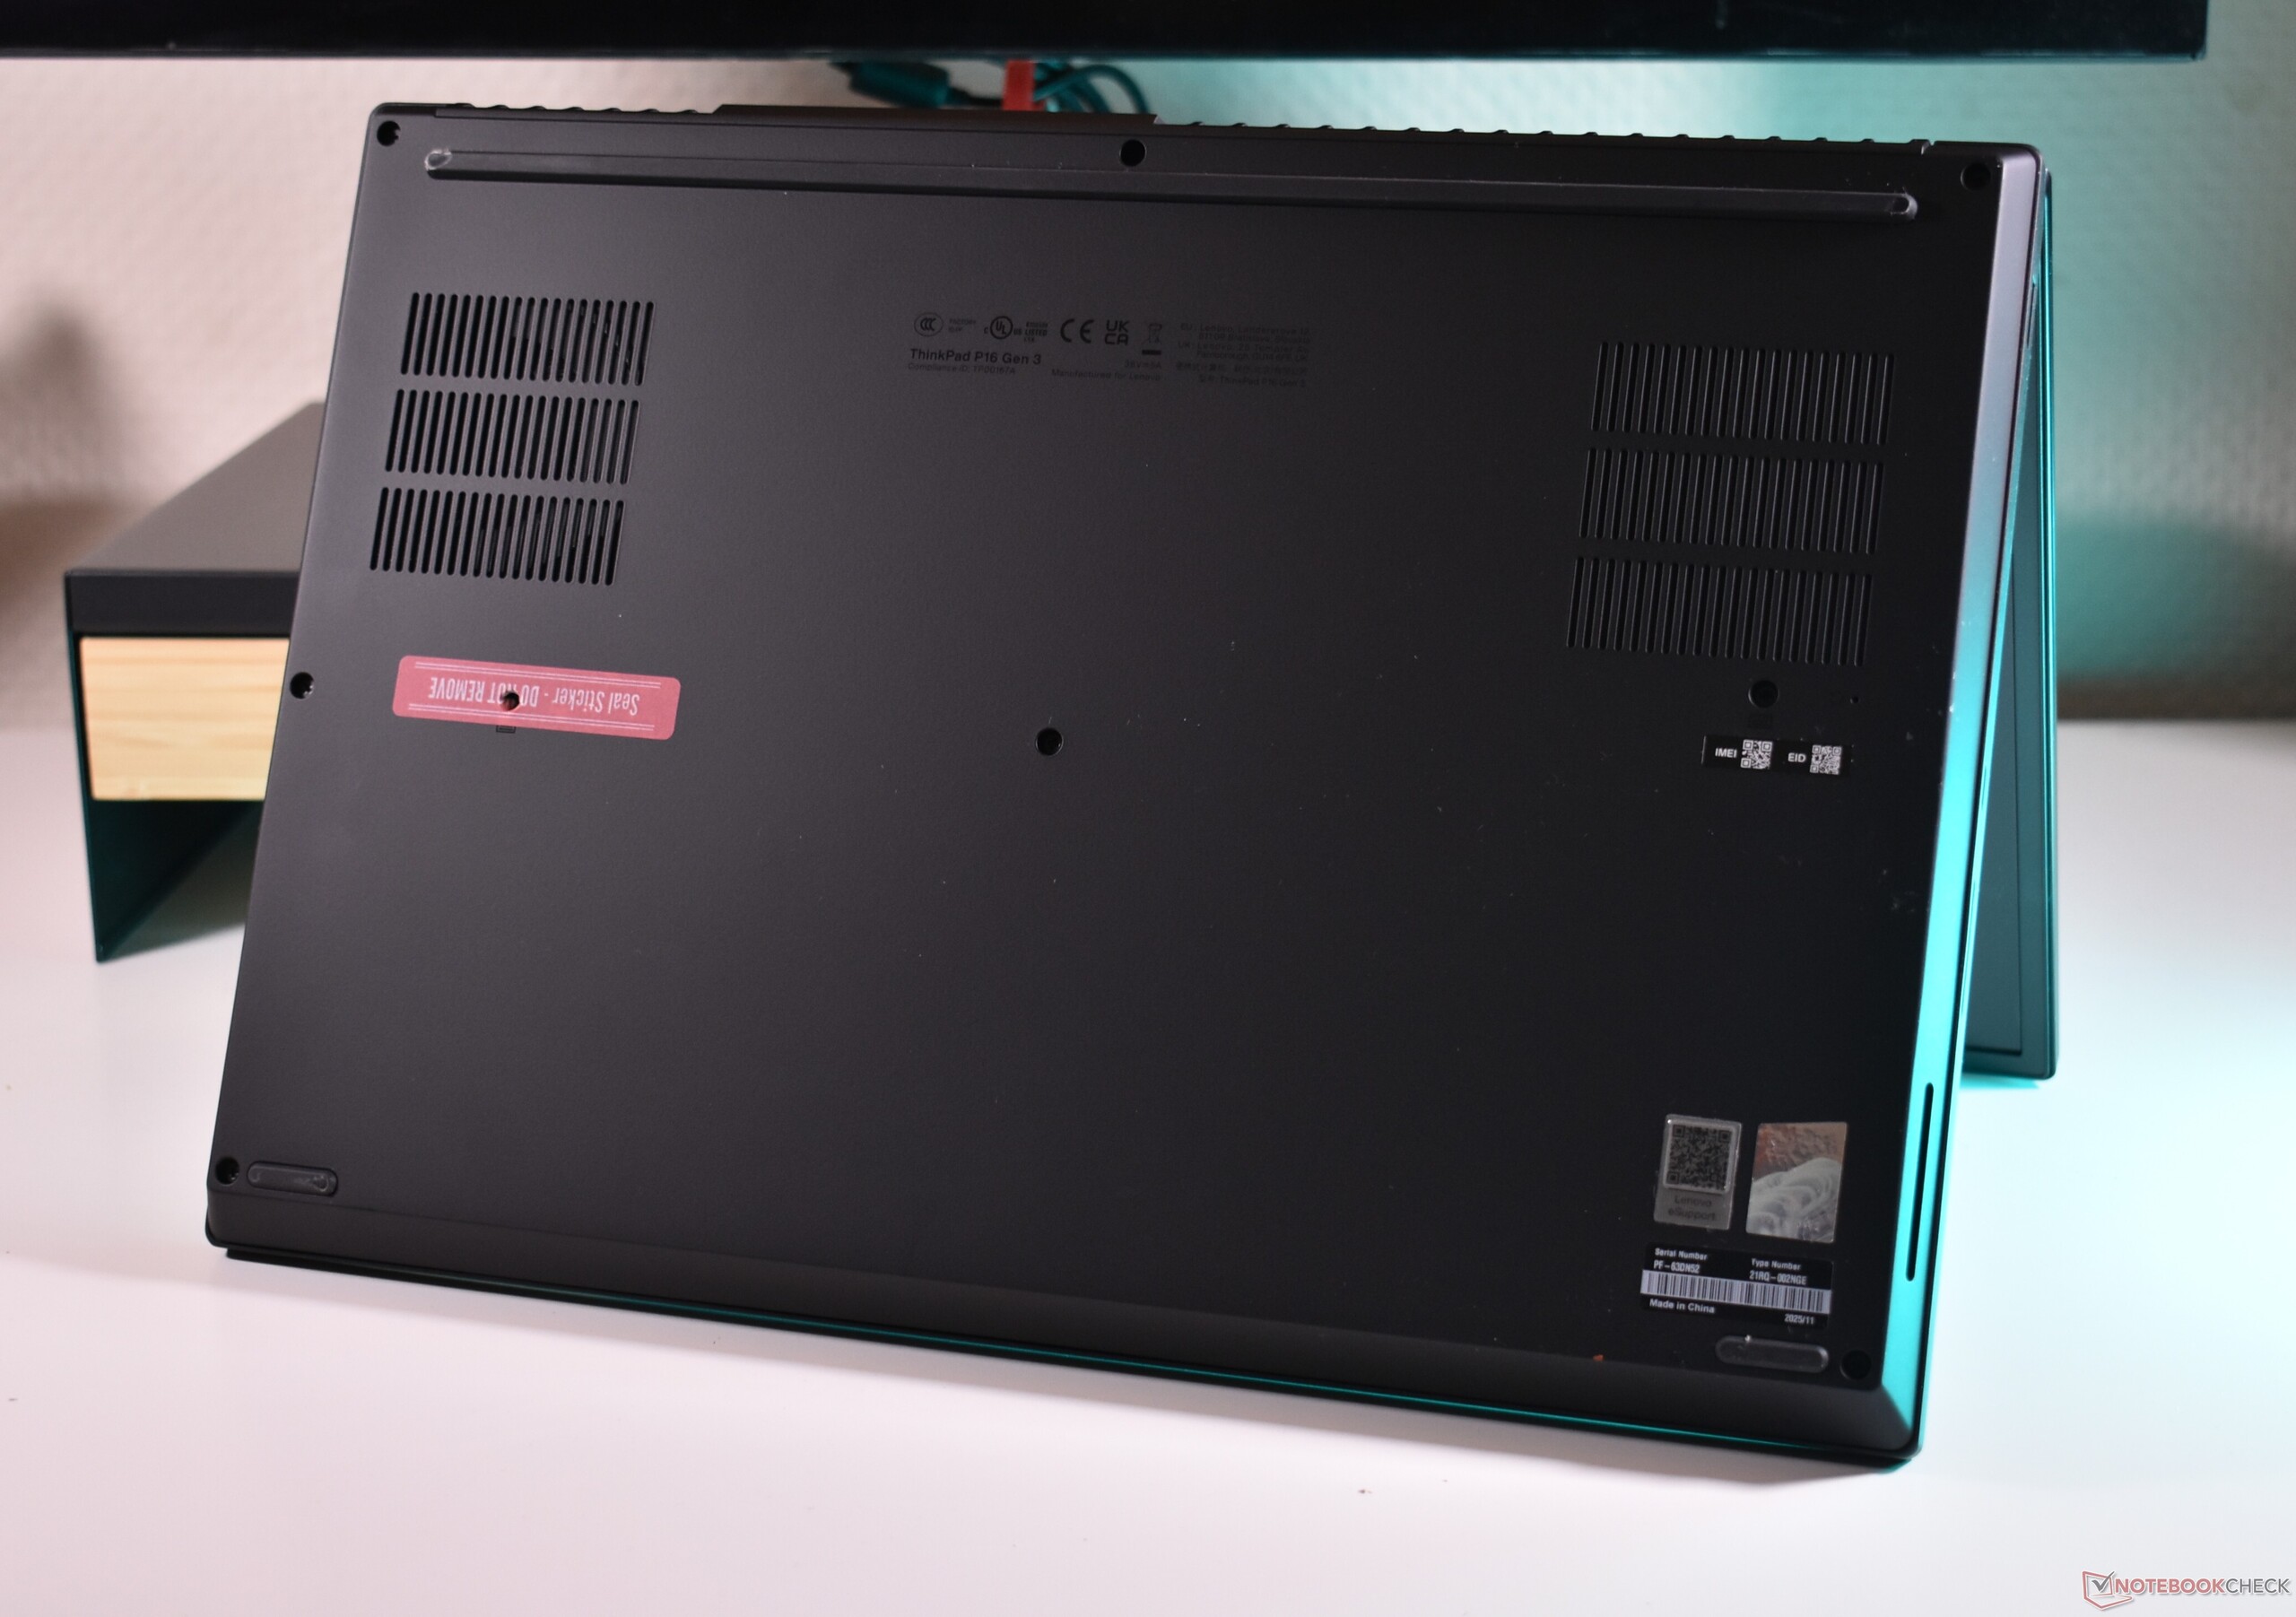
O P16 mais novo é visivelmente mais leve e compacto do que a versão anterior. Ele ainda é pesado e grande, mas não é mais o maior e mais pesado entre os notebooks de 16 polegadas para estações de trabalho completas. Claramente, a otimização da mobilidade foi uma das prioridades da Lenovo.
Conectividade
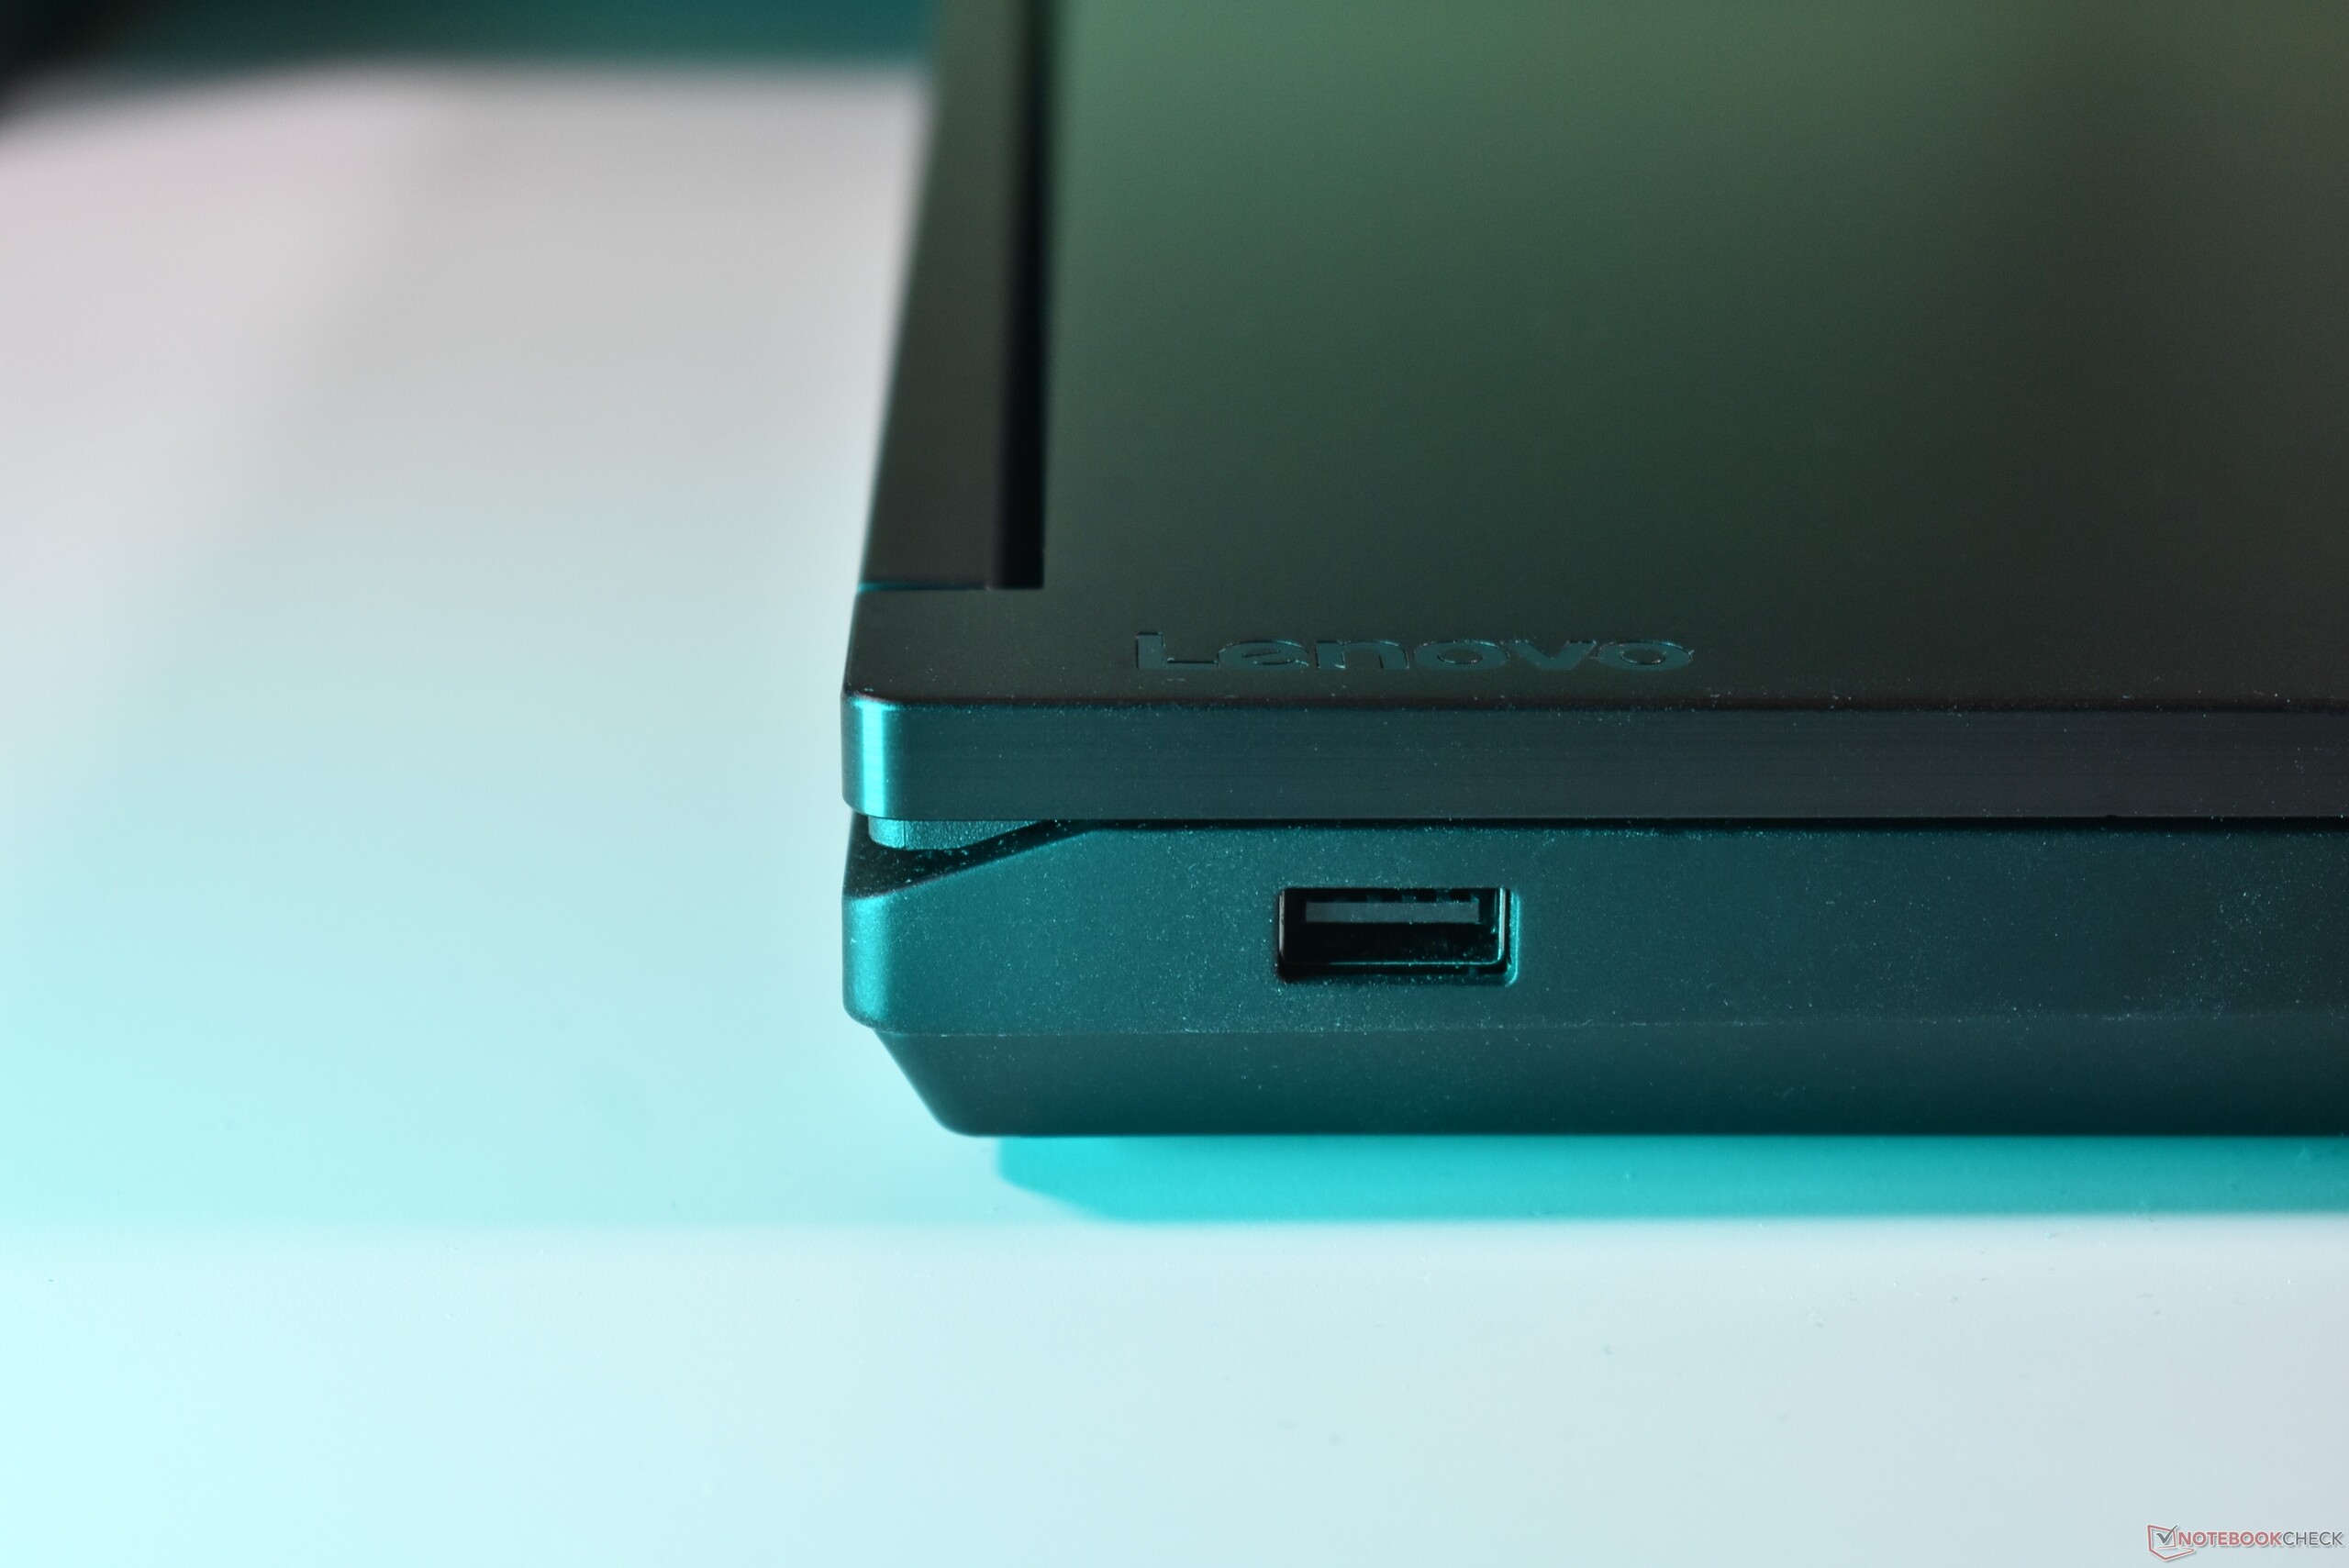
A principal novidade são as portas Thunderbolt 5 na parte traseira. Além disso, o terceiro USB-C agora suporta Thunderbolt 4. Além disso, a Lenovo optou por trazer de volta a RJ45-Ethernet, que suporta velocidades de 2,5 GBit. O ThinkPad P16 agora carrega via USB-C.


Leitor de cartão SD
| SD Card Reader | |
| average JPG Copy Test (av. of 3 runs) | |
| Lenovo ThinkPad T16g Gen 3 RTX 5080 (ADATA SD8.0 Express 512 GB) | |
| Lenovo ThinkPad T16g Gen 3 RTX 5080 (Angelbird AV Pro V60) | |
| Média da turma Workstation (49.6 - 681, n=14, últimos 2 anos) | |
| HP ZBook Fury 16 G11 (Toshiba Exceria Pro SDXC 64 GB UHS-II) | |
| Lenovo ThinkPad P1 Gen 8 (Toshiba Exceria Pro SDXC 64 GB UHS-II) | |
| Lenovo ThinkPad P16 Gen 3 (AV Pro V60) | |
| Dell Pro Max 16 Plus (Toshiba Exceria Pro SDXC 64 GB UHS-II) | |
| Lenovo ThinkPad P16 G2 21FA000FGE | |
| maximum AS SSD Seq Read Test (1GB) | |
| Lenovo ThinkPad T16g Gen 3 RTX 5080 (ADATA SD8.0 Express 512 GB) | |
| Lenovo ThinkPad T16g Gen 3 RTX 5080 (Angelbird AV Pro V60) | |
| Média da turma Workstation (87.6 - 1455, n=14, últimos 2 anos) | |
| Lenovo ThinkPad P16 Gen 3 (AV Pro V60) | |
| HP ZBook Fury 16 G11 (Toshiba Exceria Pro SDXC 64 GB UHS-II) | |
| Dell Pro Max 16 Plus (Toshiba Exceria Pro SDXC 64 GB UHS-II) | |
| Lenovo ThinkPad P1 Gen 8 (Toshiba Exceria Pro SDXC 64 GB UHS-II) | |
| Lenovo ThinkPad P16 G2 21FA000FGE | |
Comunicação


Manutenção


Dispositivos de entrada
Teclado
Enquanto o restante do laptop muda, o teclado retroiluminado com LEDs brancos de dois estágios permanece o mesmo de antes. As teclas arredondadas e ligeiramente côncavas proporcionam uma aterrissagem suave, porém definida, com uma boa distância de deslocamento de 1,5 mm. O layout é espaçoso e, com o teclado numérico dedicado, é ideal para processar números. De modo geral, é um prazer usar o teclado e ele está entre os melhores da linha atual do ThinkPad.

Touchpad
Além da mudança de cor de prata para preto, o touchpad permanece idêntico ao anterior ThinkPad P16 G2. A superfície de mylar do clickpad mecânico de placa de mergulho mede 11,5 x 6,5 cm, tem um clique amortecido agradável e, embora não pareça tão agradável quanto o vidro, a superfície é lisa, o que o torna muito fácil de usar. Igualmente bom, se não ainda melhor, é o ThinkPad TrackPoint com seus três botões dedicados.


Tela
Os compradores do Lenovo ThinkPad P16 Gen 3 podem escolher entre três opções diferentes de tela:
- WUXGA (1.920 x 1.200), IPS, 500 cd/m², 100 % sRGB, fosco, 60 Hz
- 3.2K (3.200 x 2.000), Tandem OLED, 600 cd/m² (SDR) / 1500 cd/m² de pico (HDR), 100% DCI P3, semibrilho, 40 - 120 Hz VRR, Dolby Vision
- 4K-WQUXGA (3.840 x 2.400), IPS, 800 cd/m², 100 % DCI P3, fosco, Dolby Vision, 60 Hz
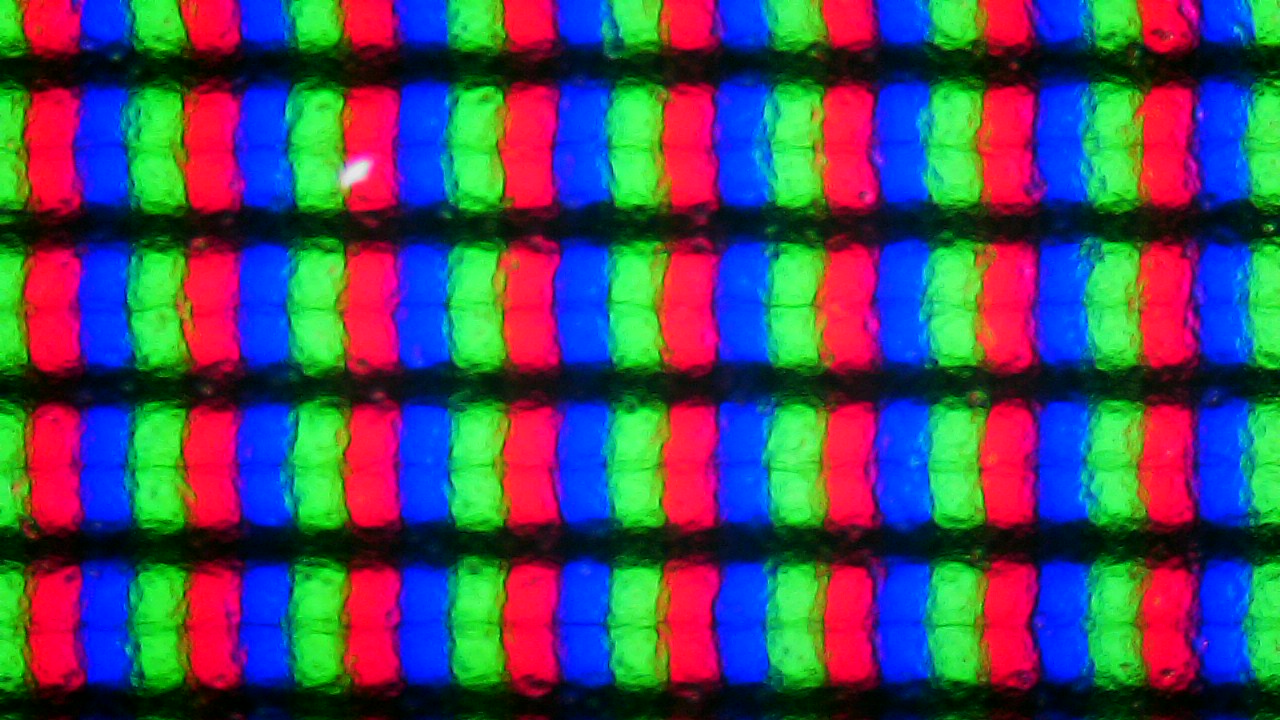
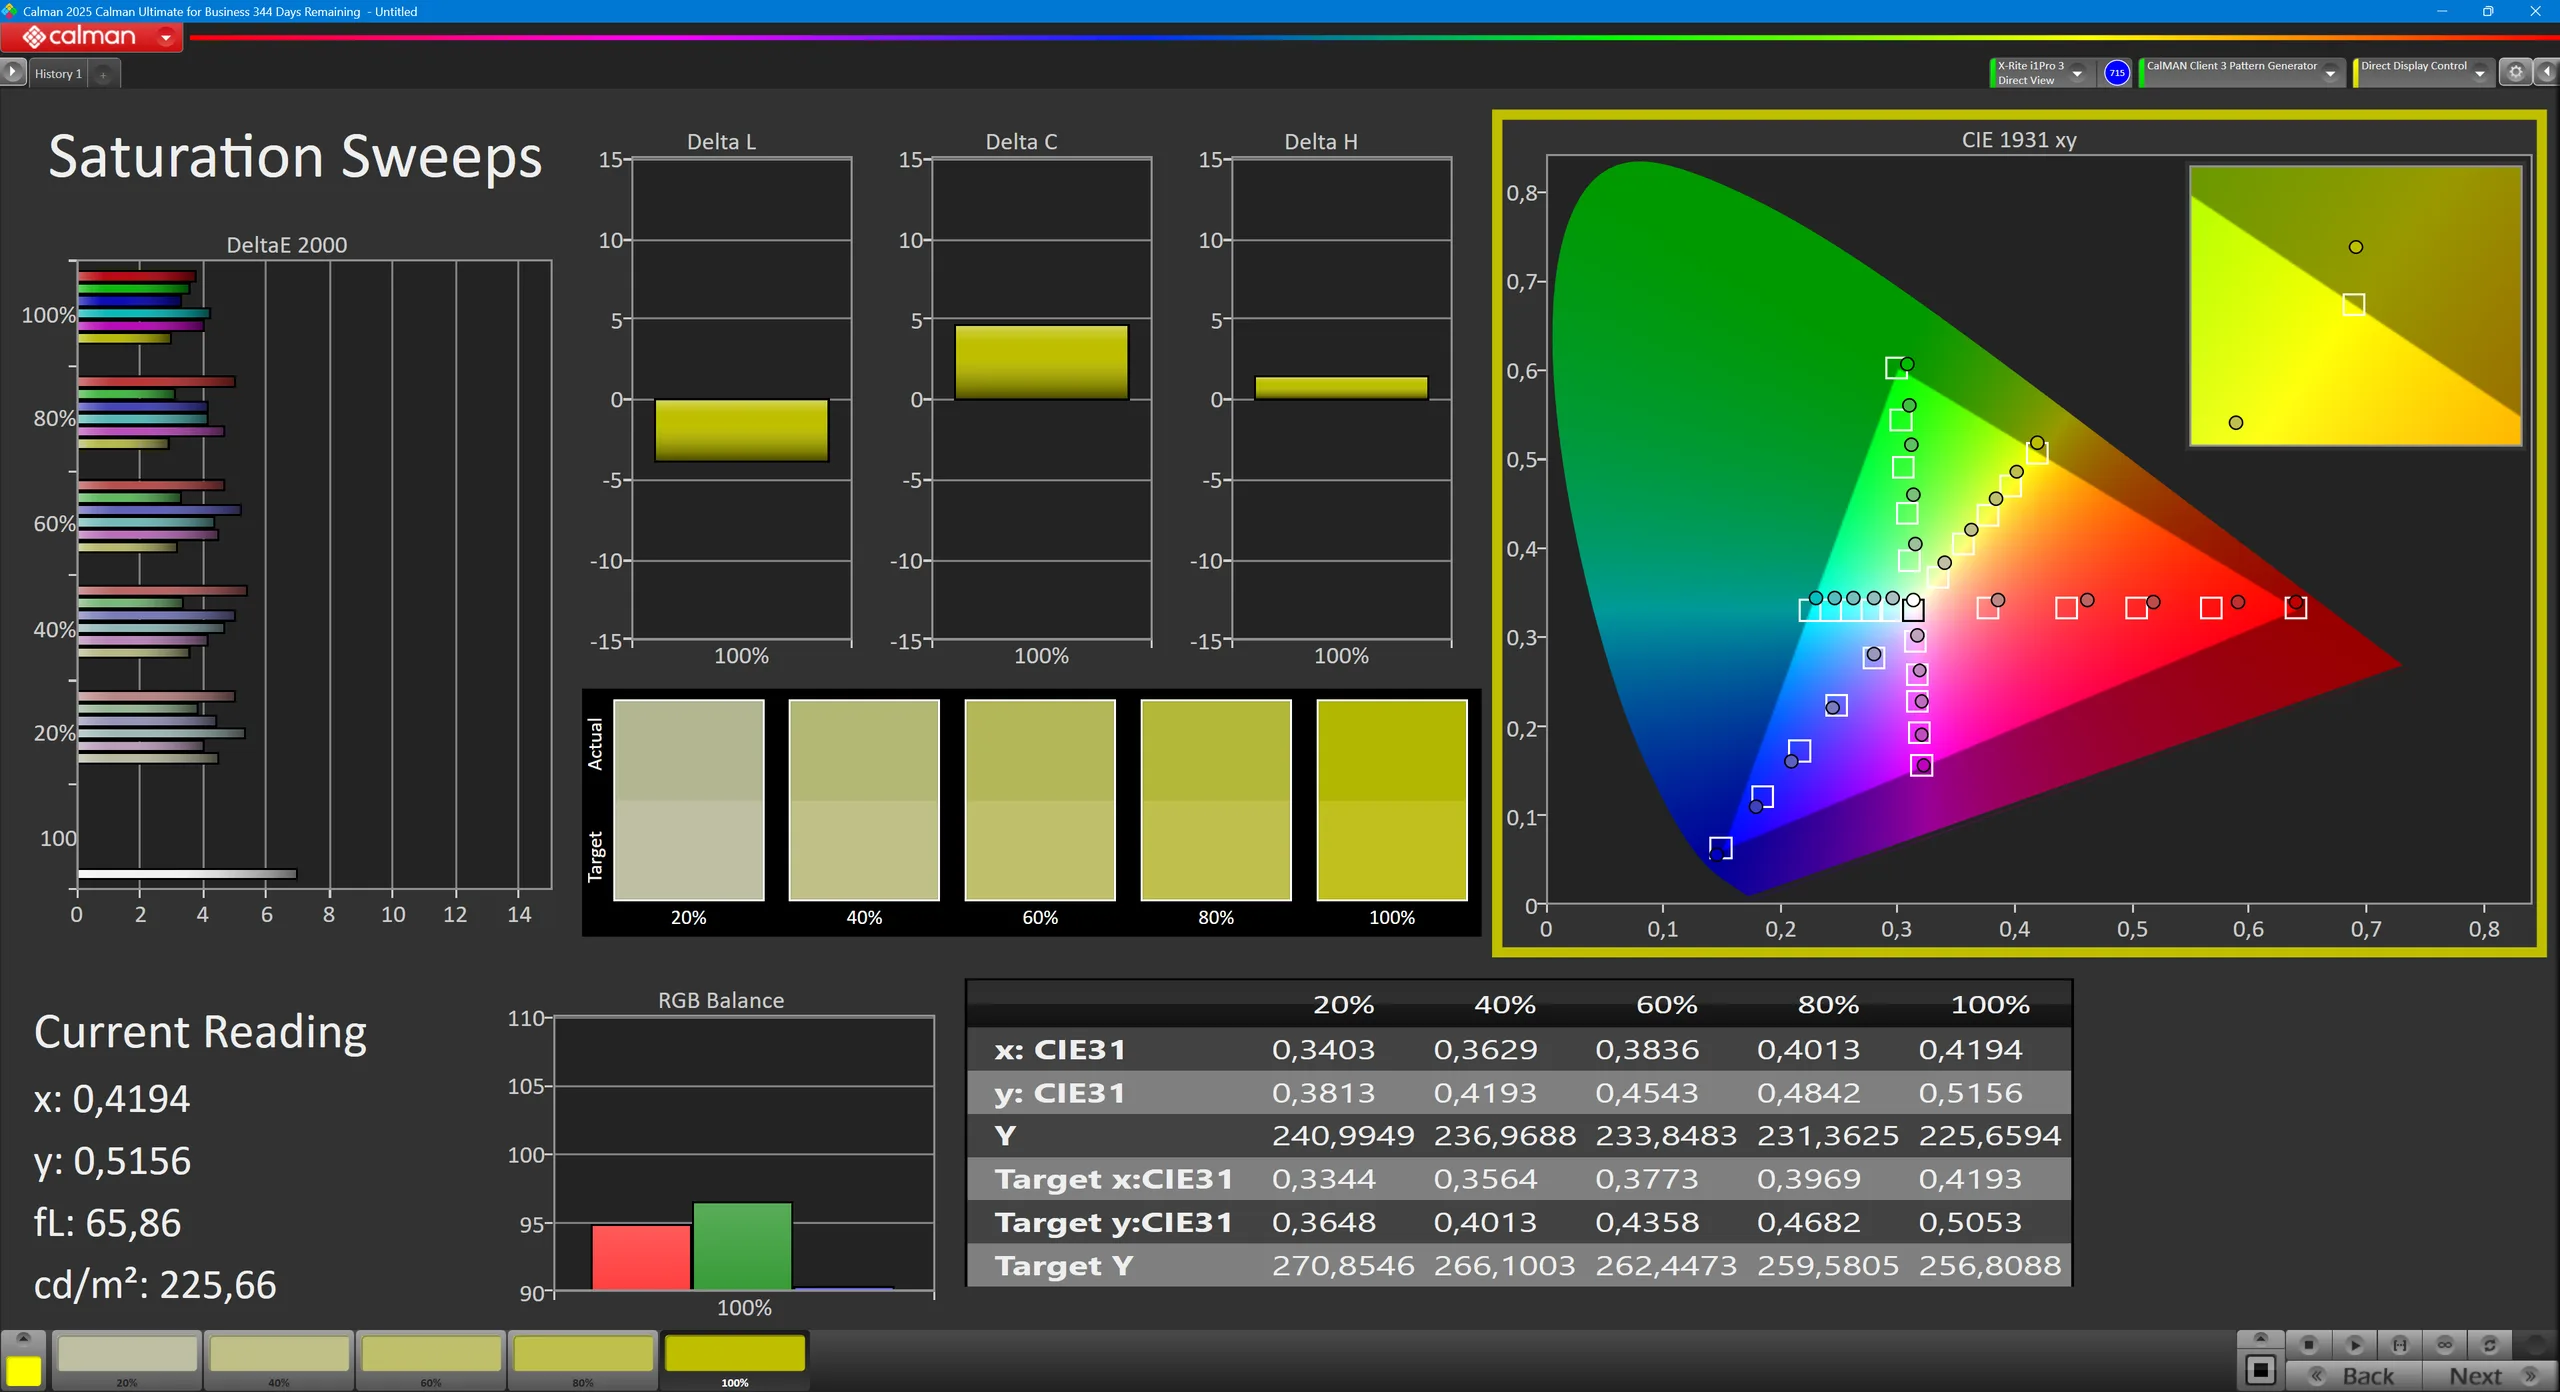
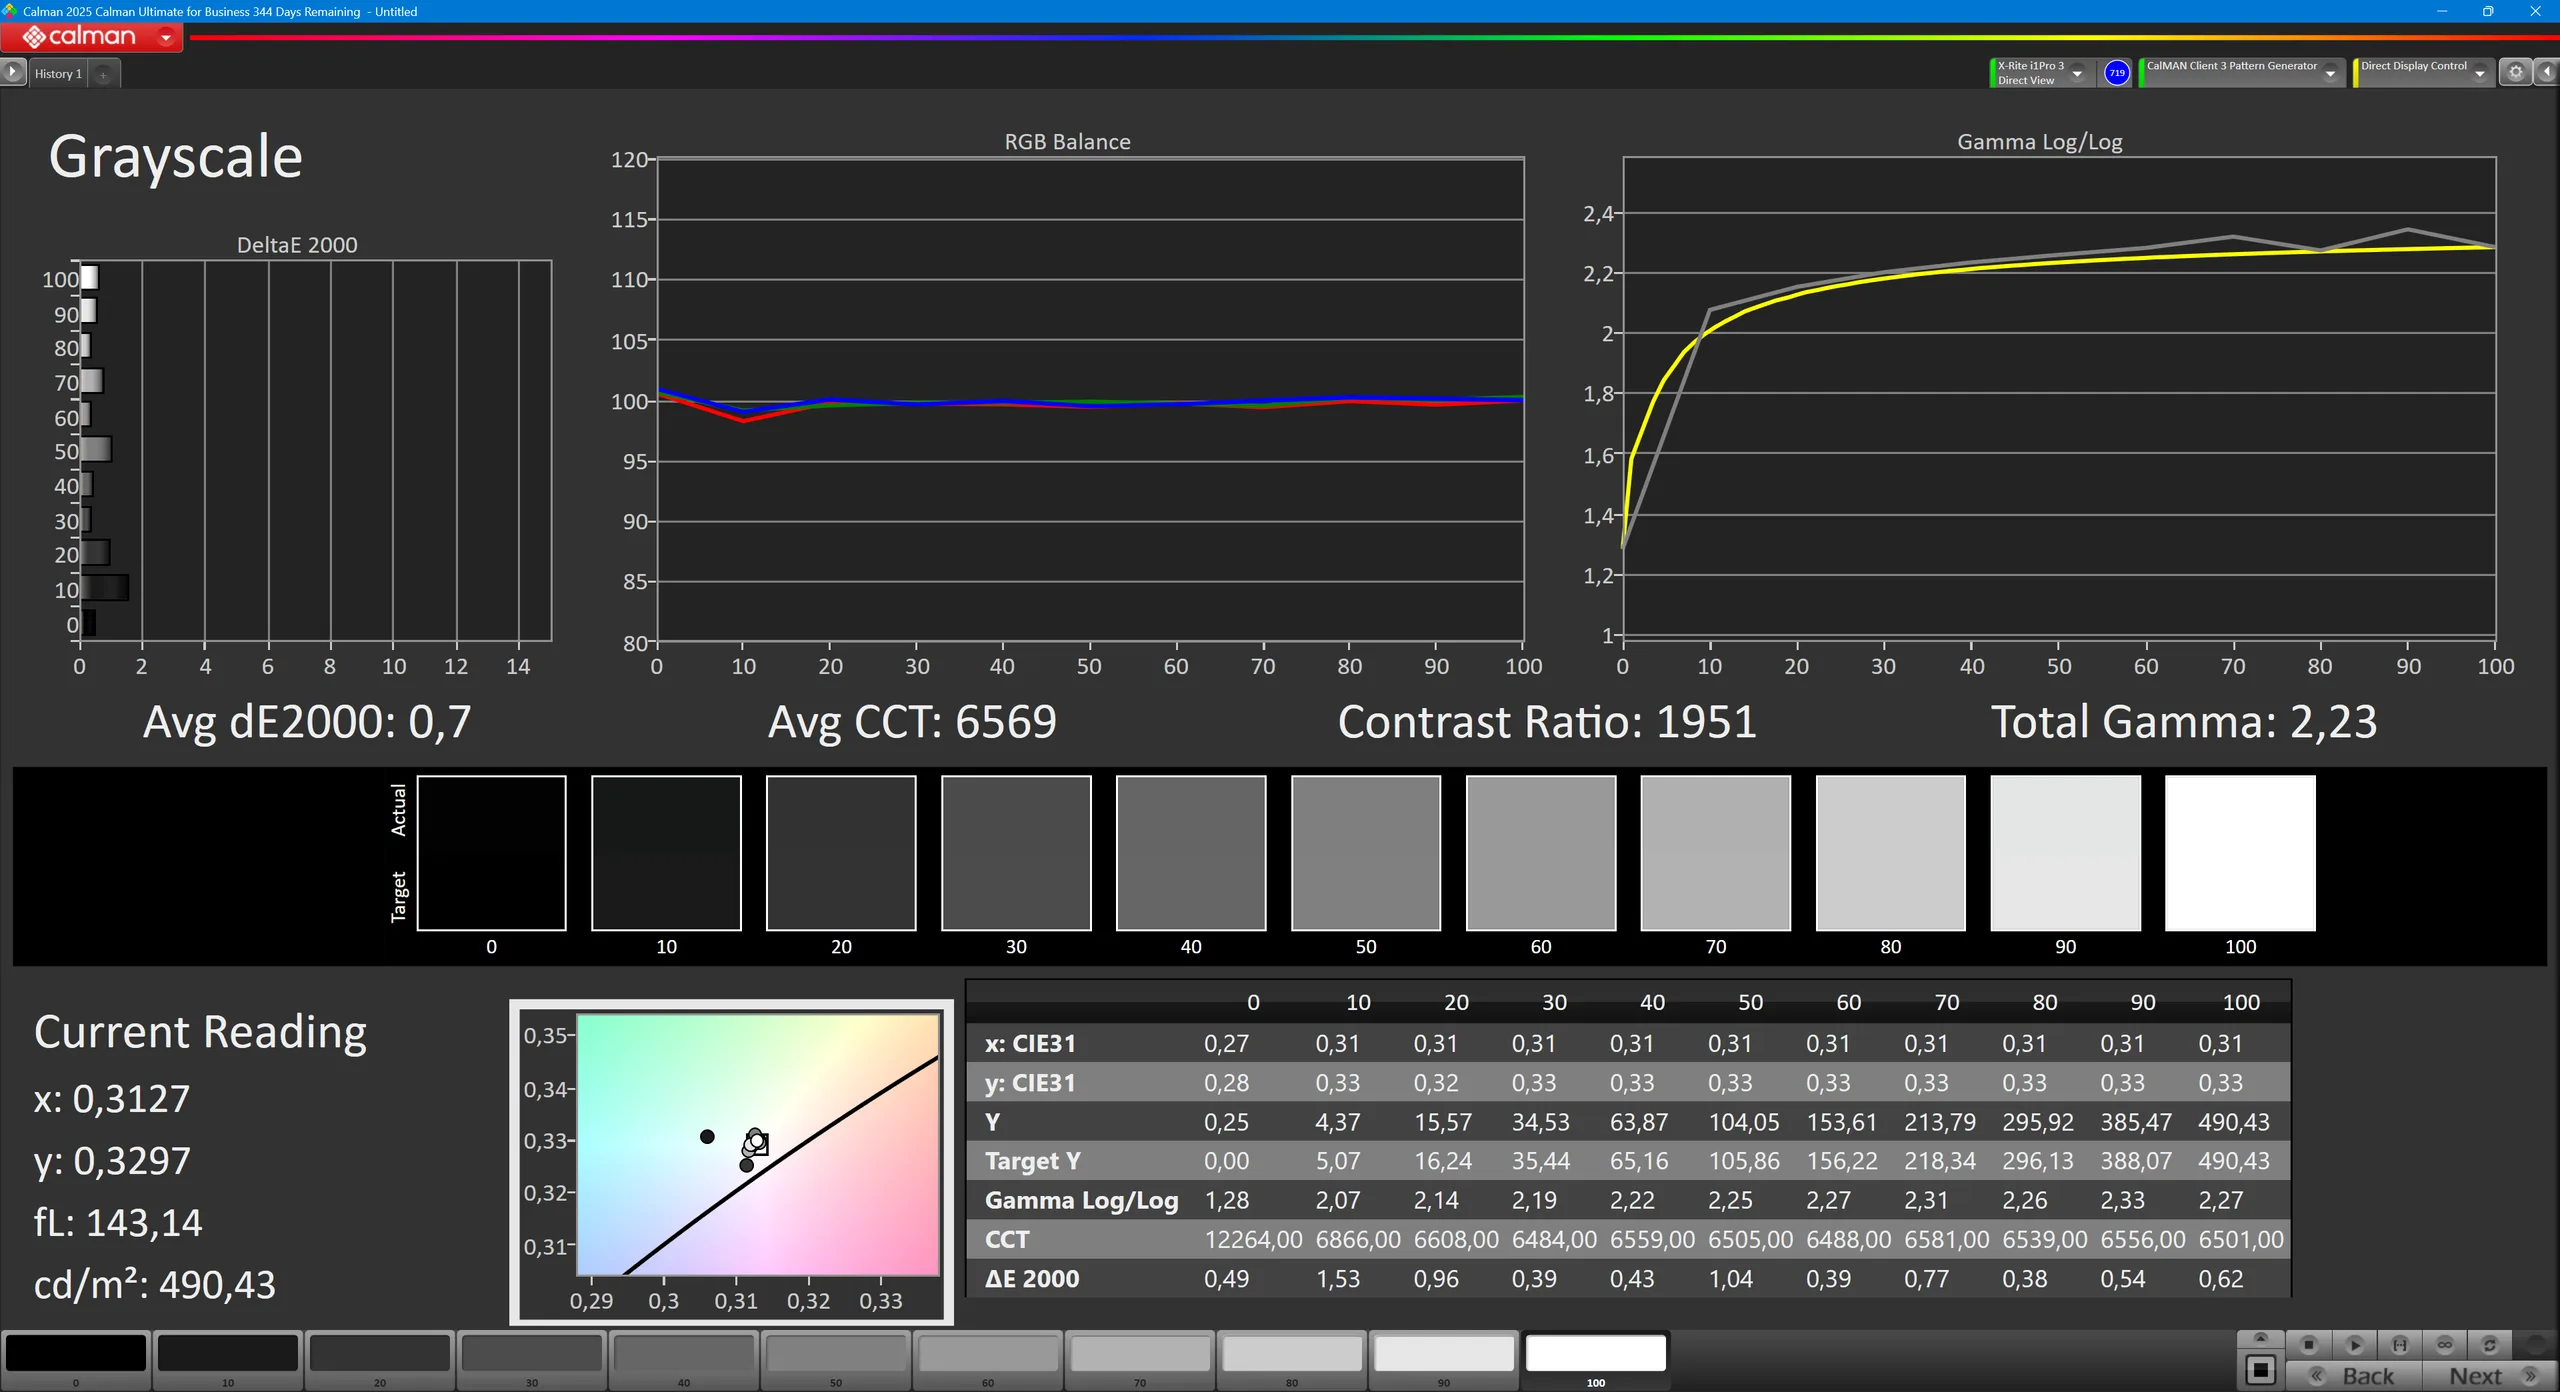
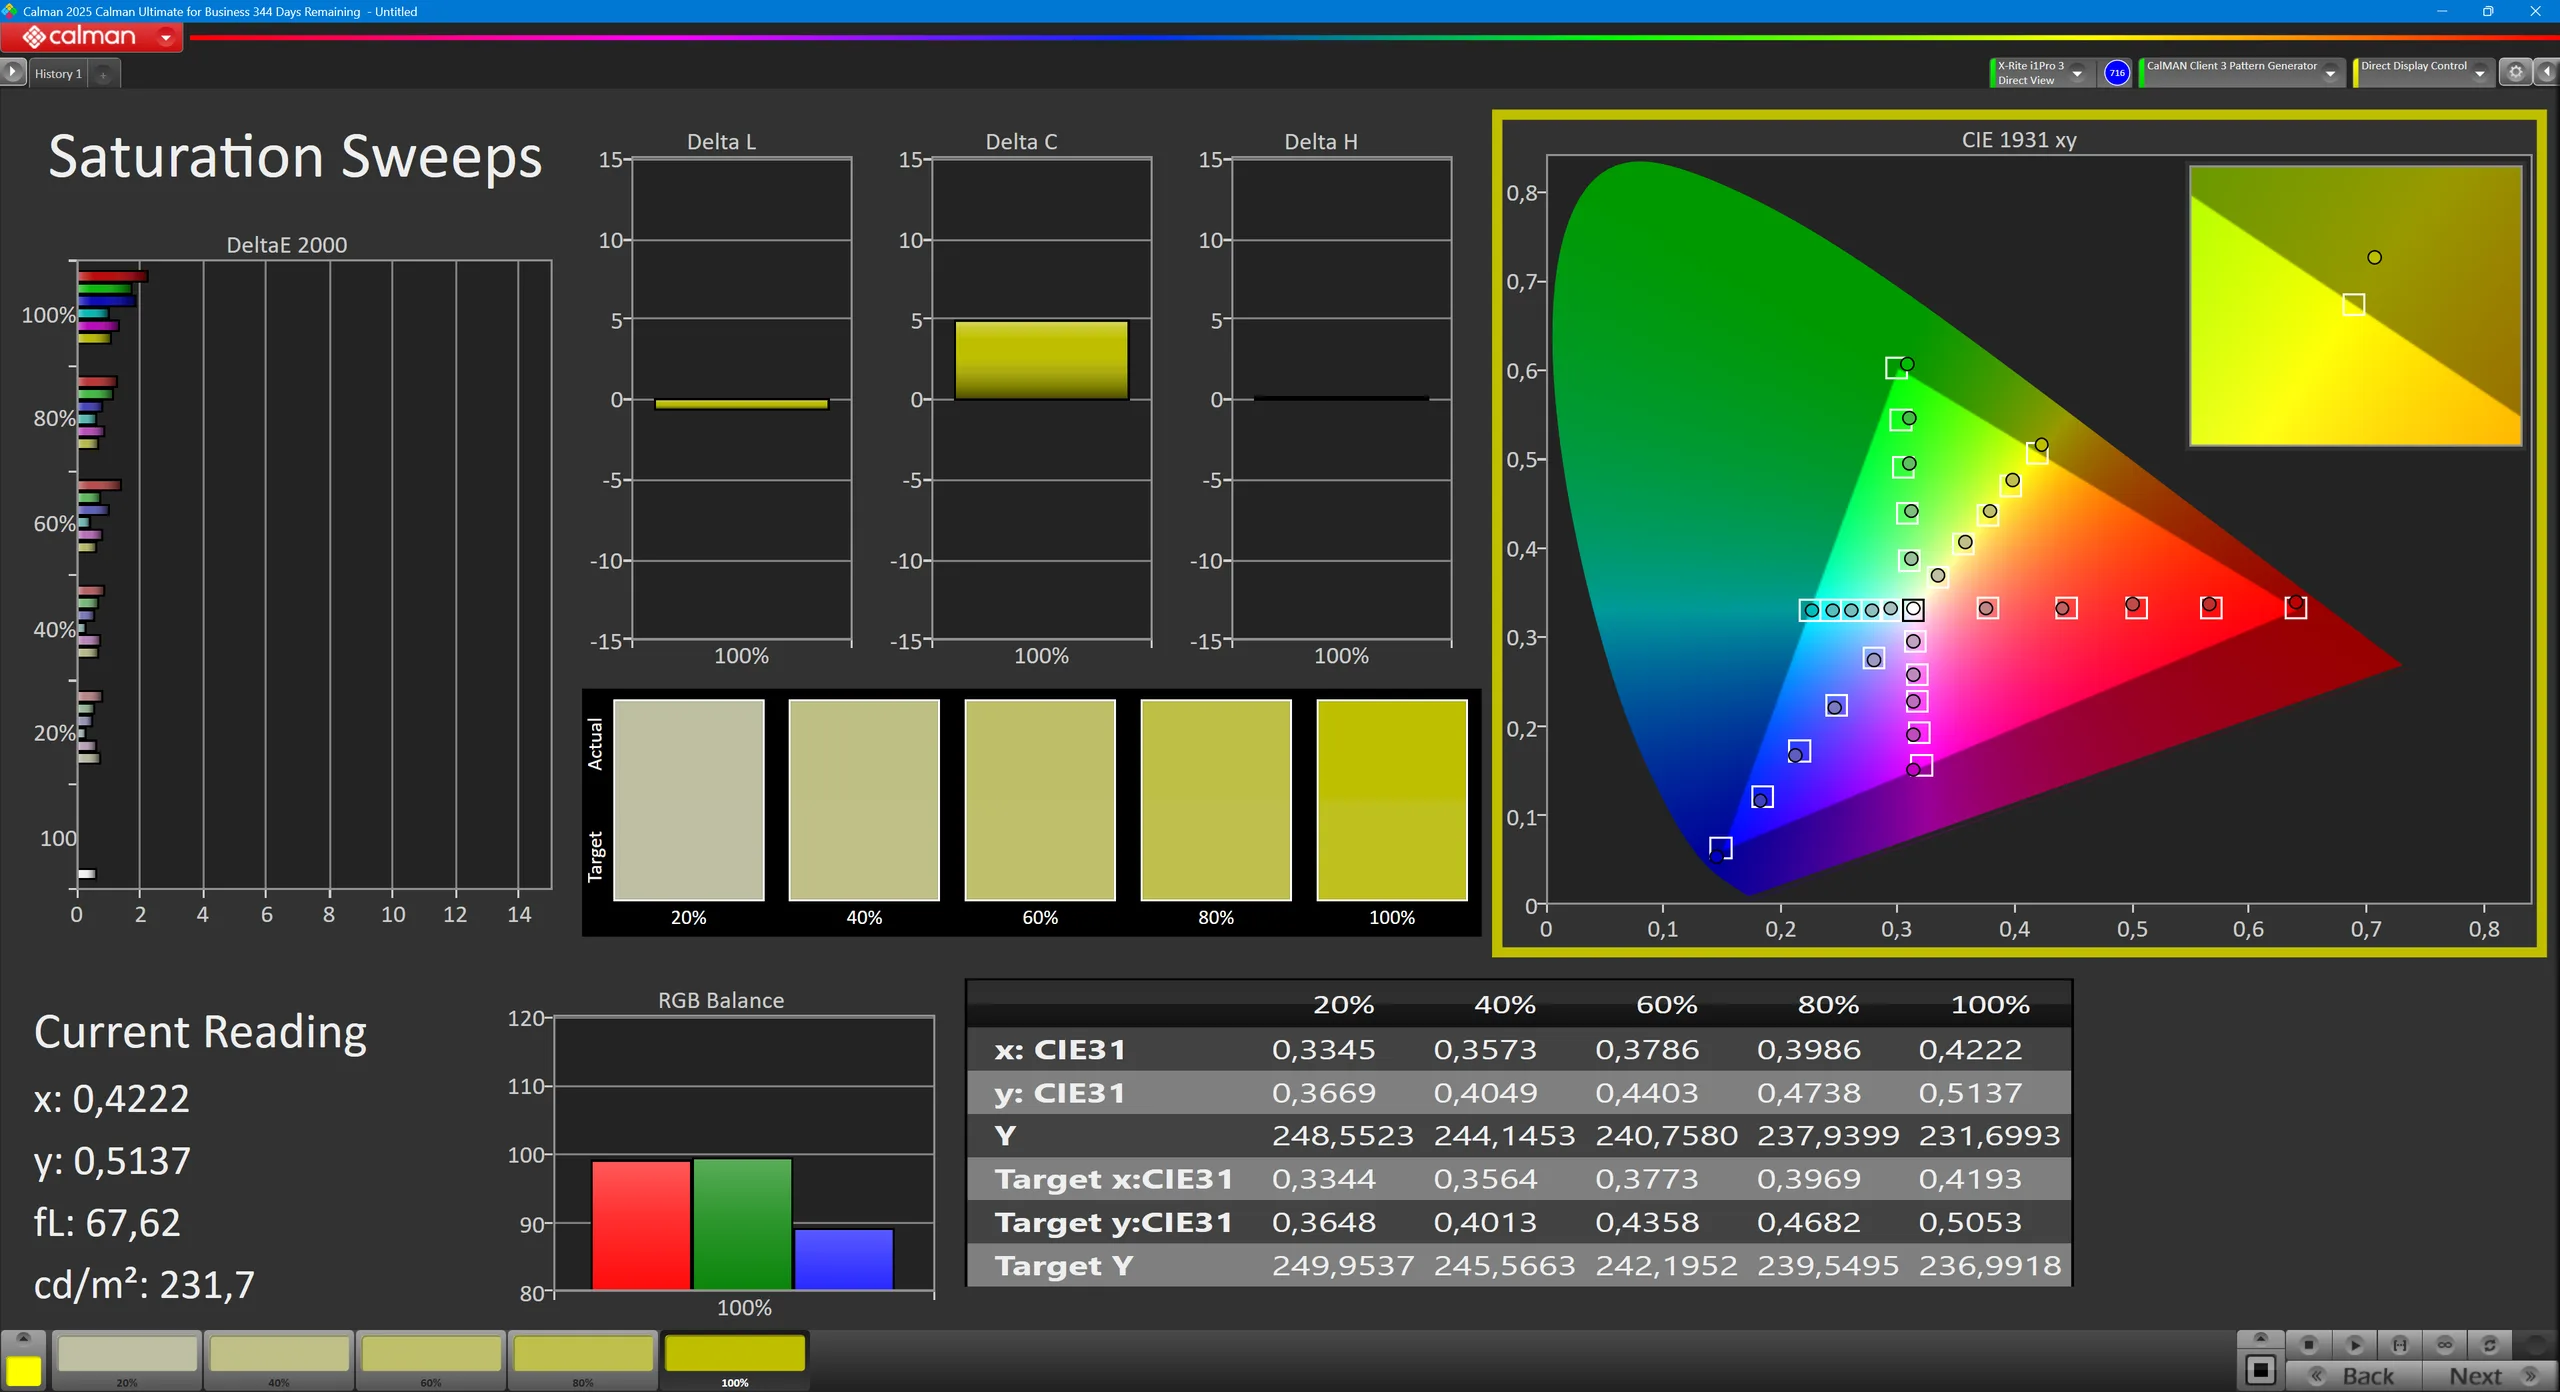
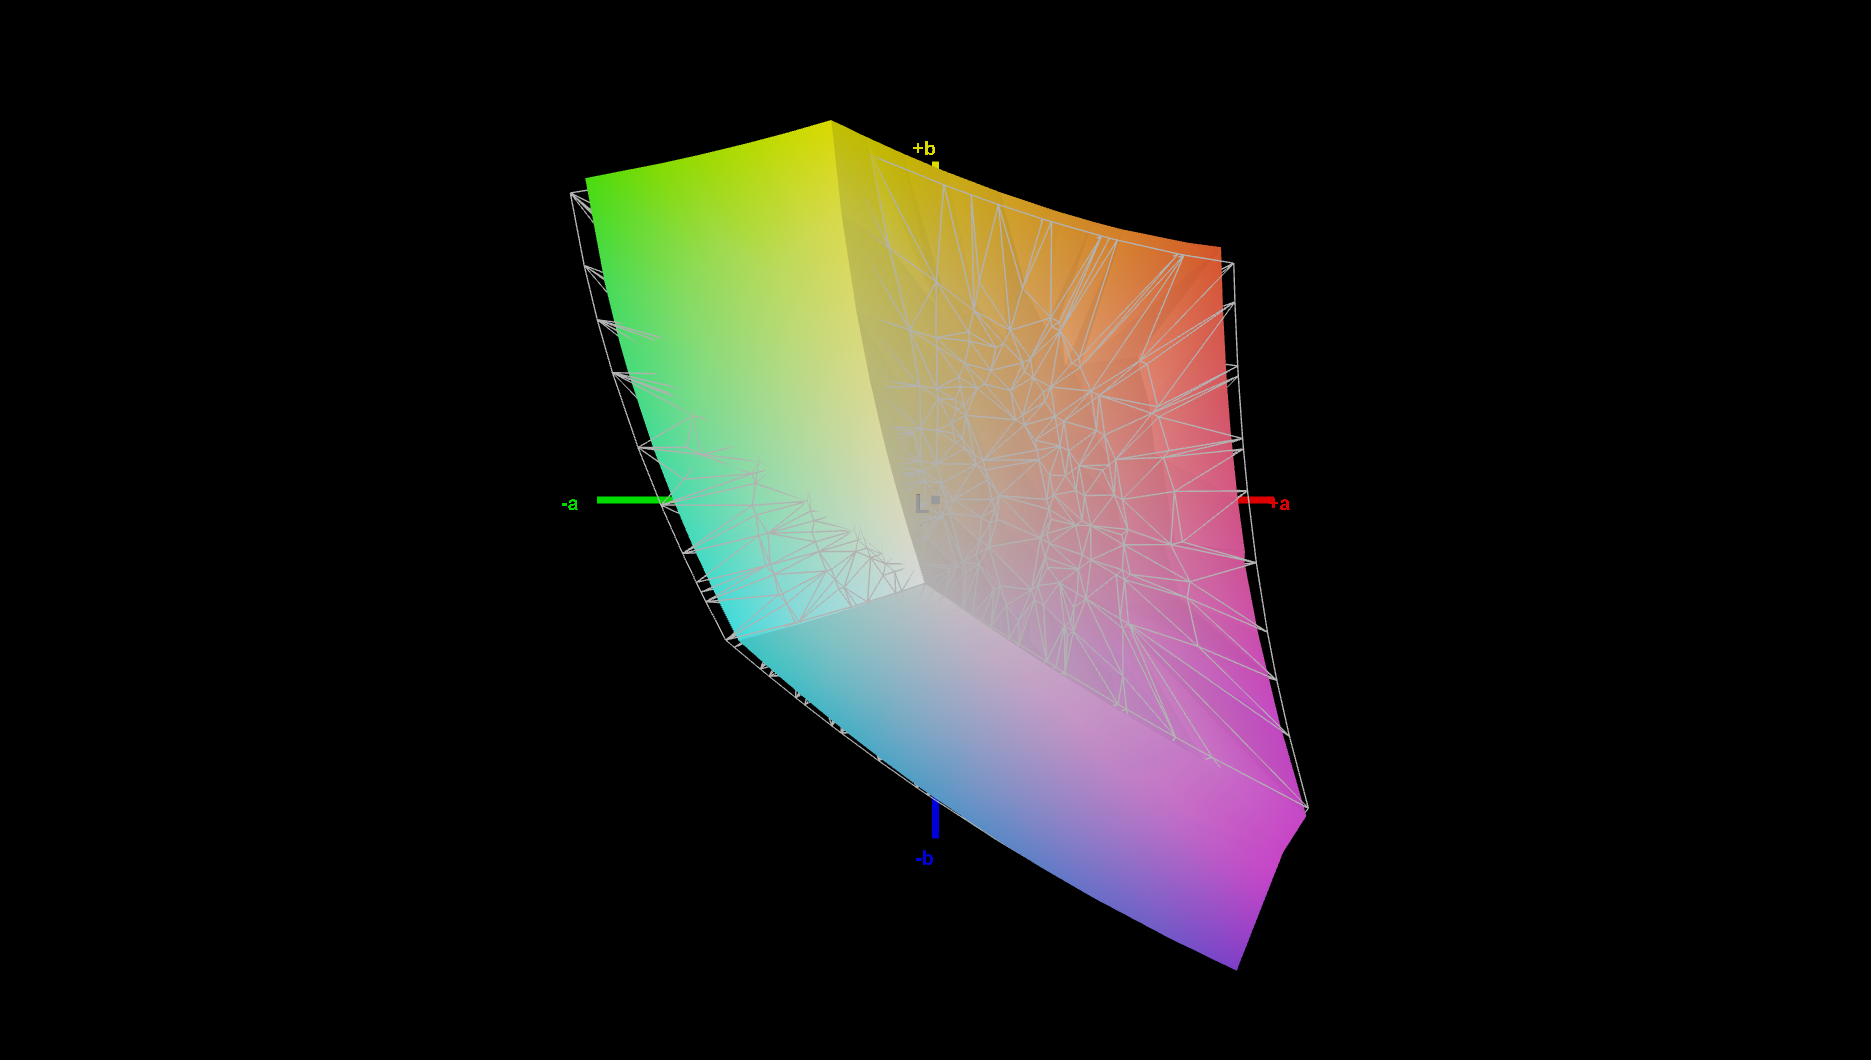
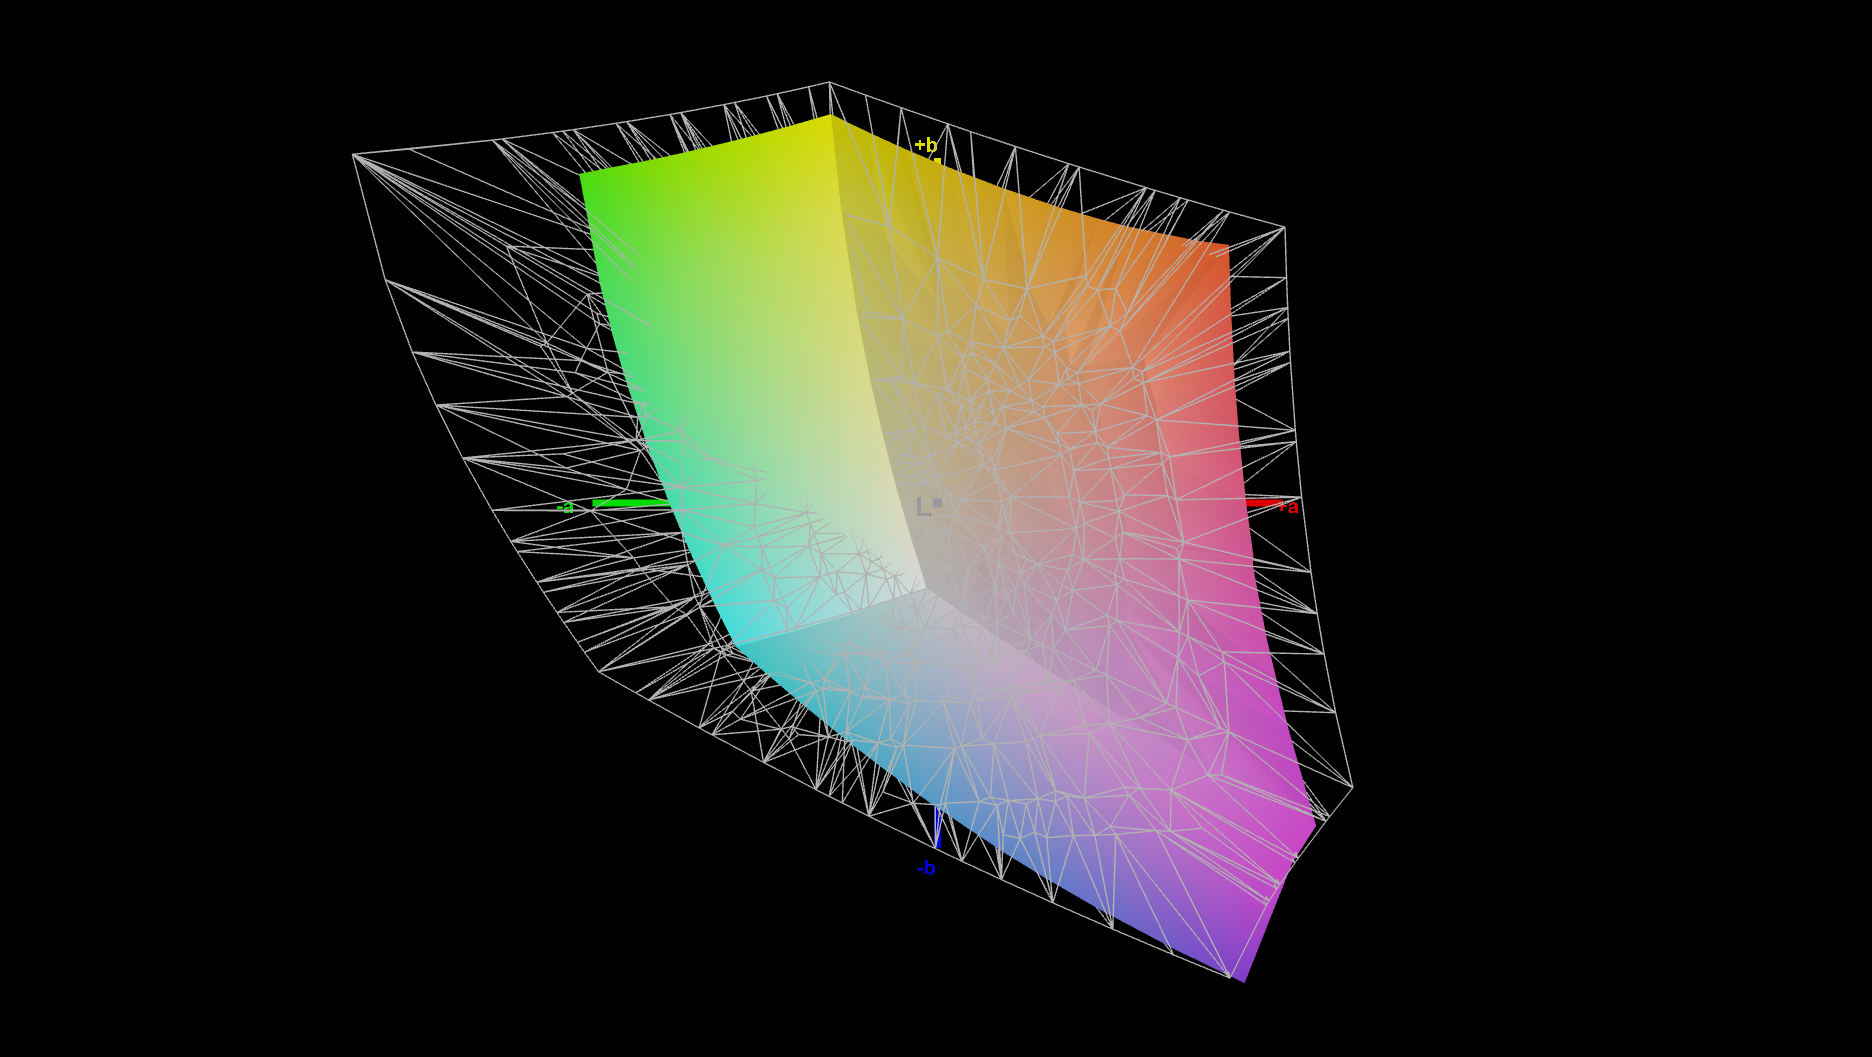
A opção de tela básica da nossa amostra analisada é adequada para trabalho de escritório e outras tarefas em que não é necessária uma ampla gama de cores. Para uso em multimídia, ela não é a melhor, também devido à lenta taxa de atualização de 60 Hz. Pelo menos não há PWM. Gostaríamos que a resolução fosse maior, pois WUXGA não é tão bom para uma estação de trabalho de 16 polegadas tão cara.
| |||||||||||||||||||||||||
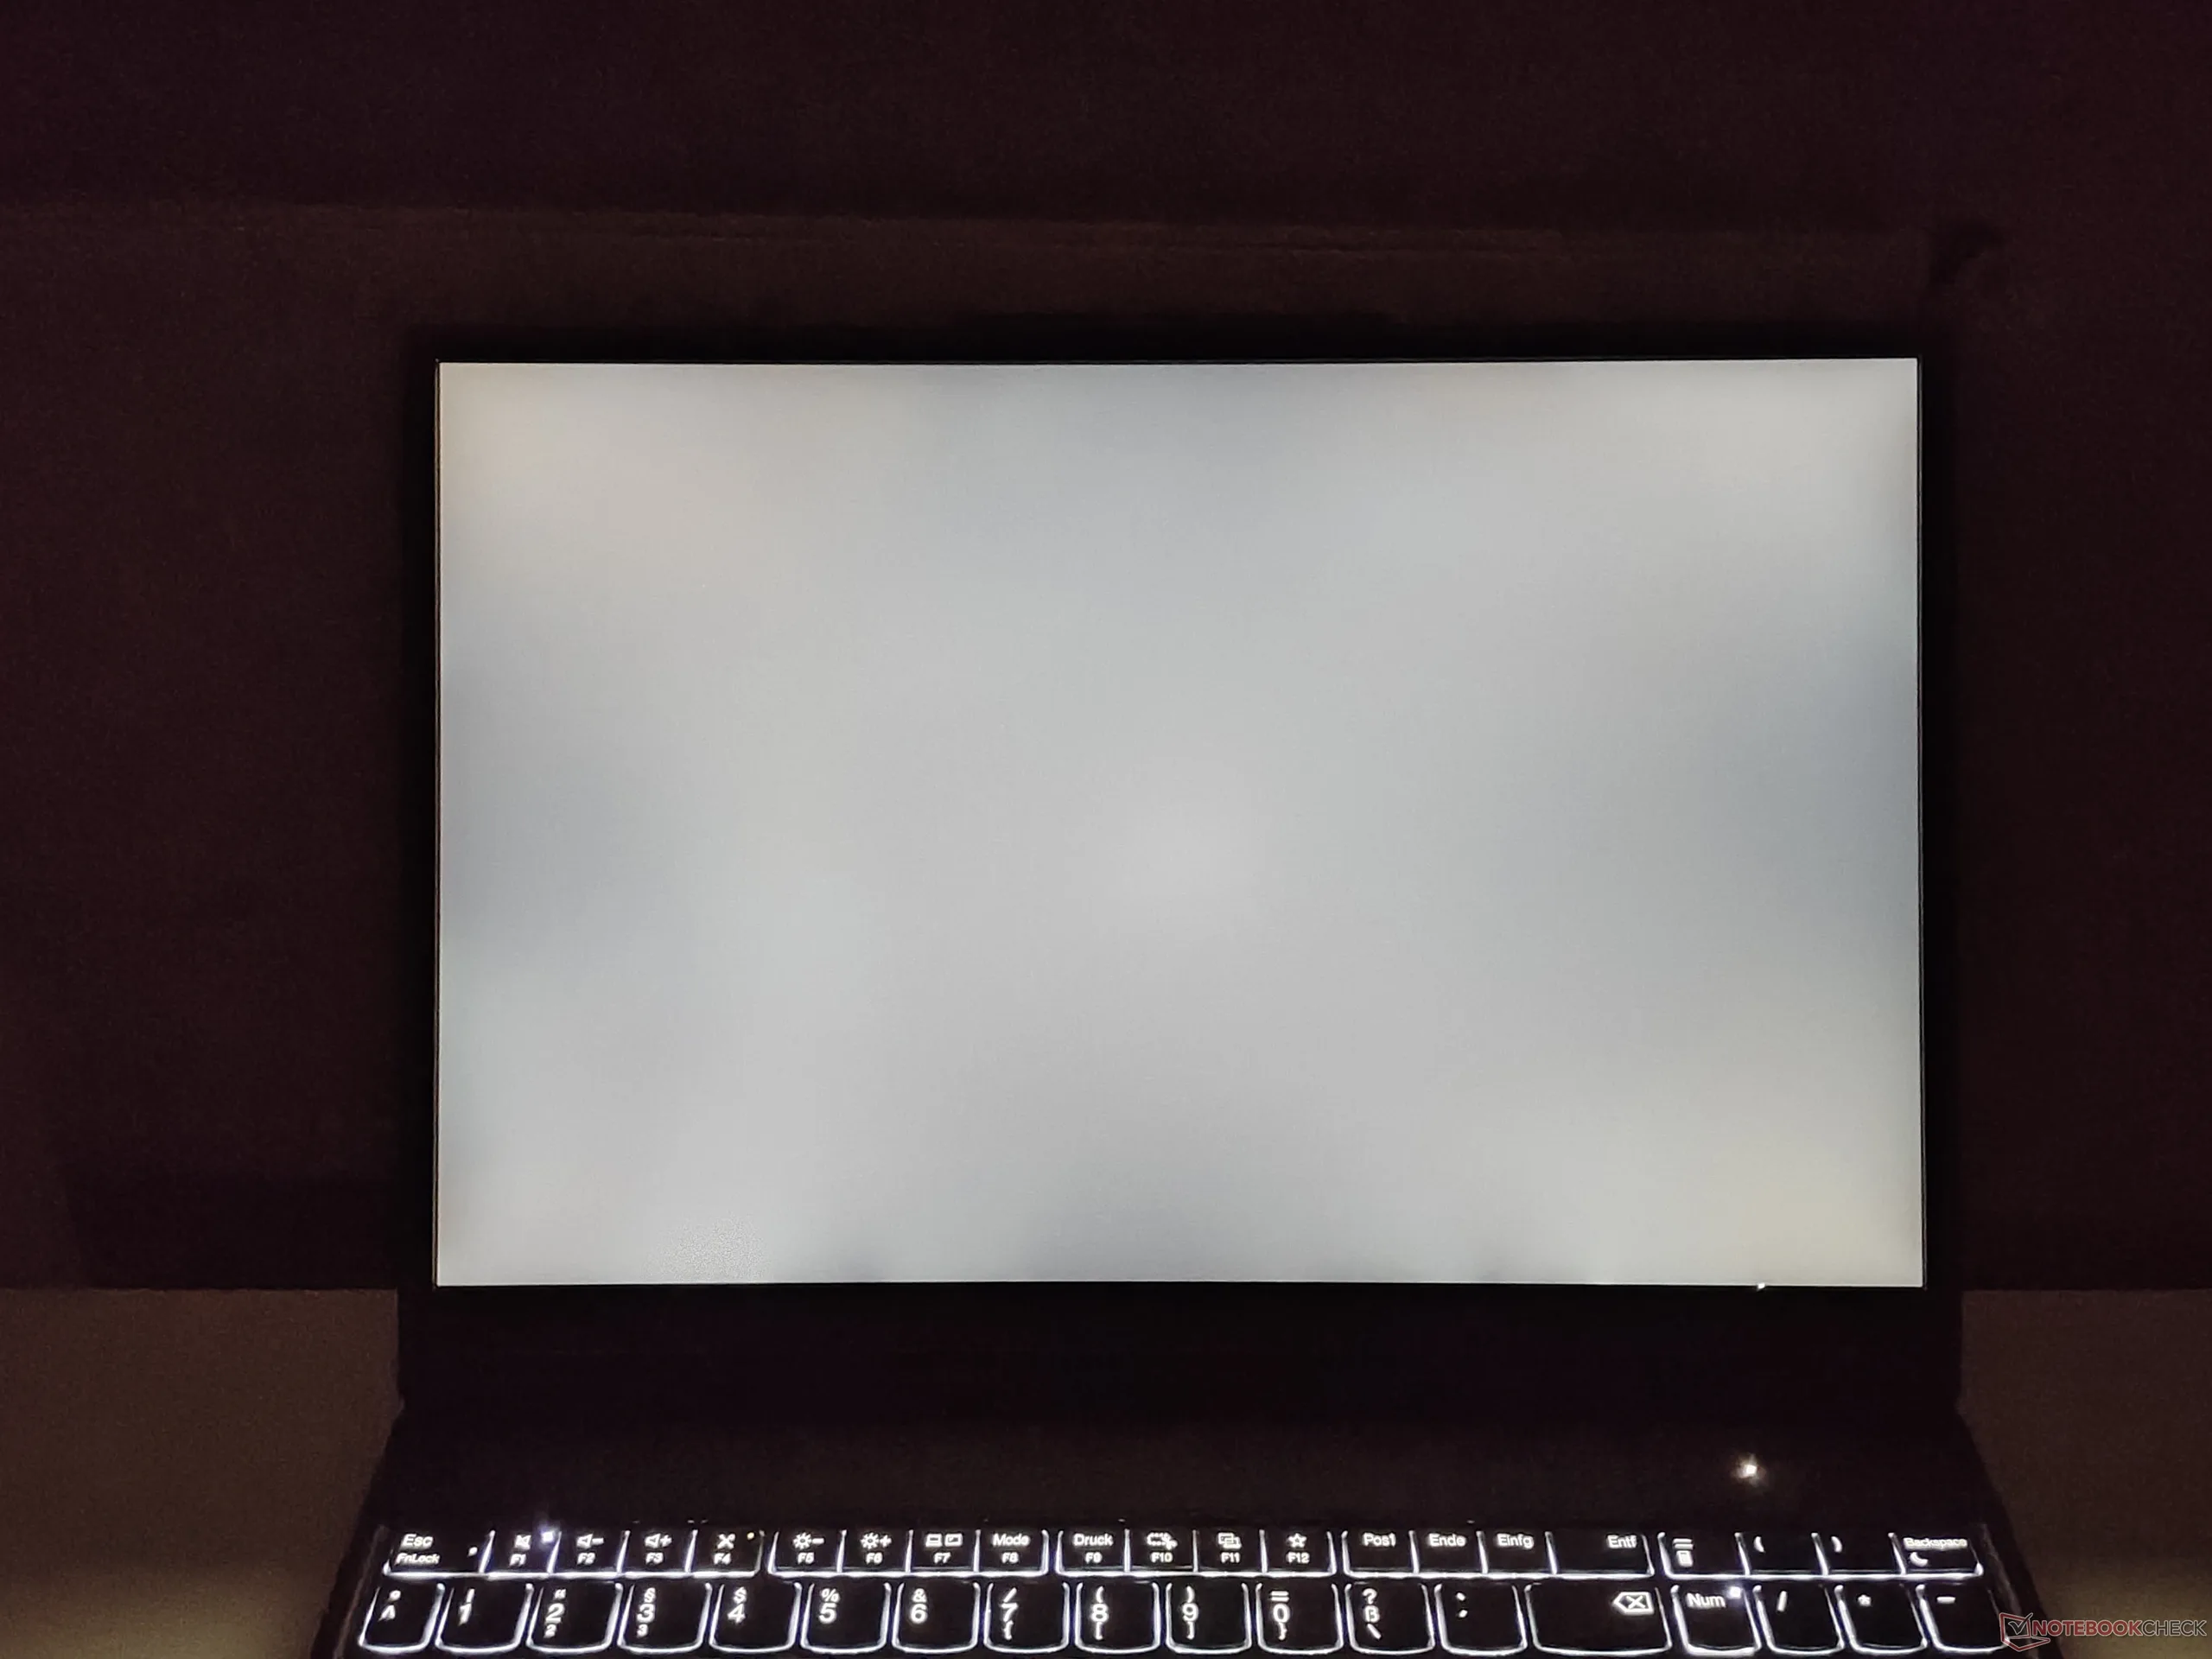
iluminação: 88 %
iluminação com acumulador: 532 cd/m²
Contraste: 1716:1 (Preto: 0.31 cd/m²)
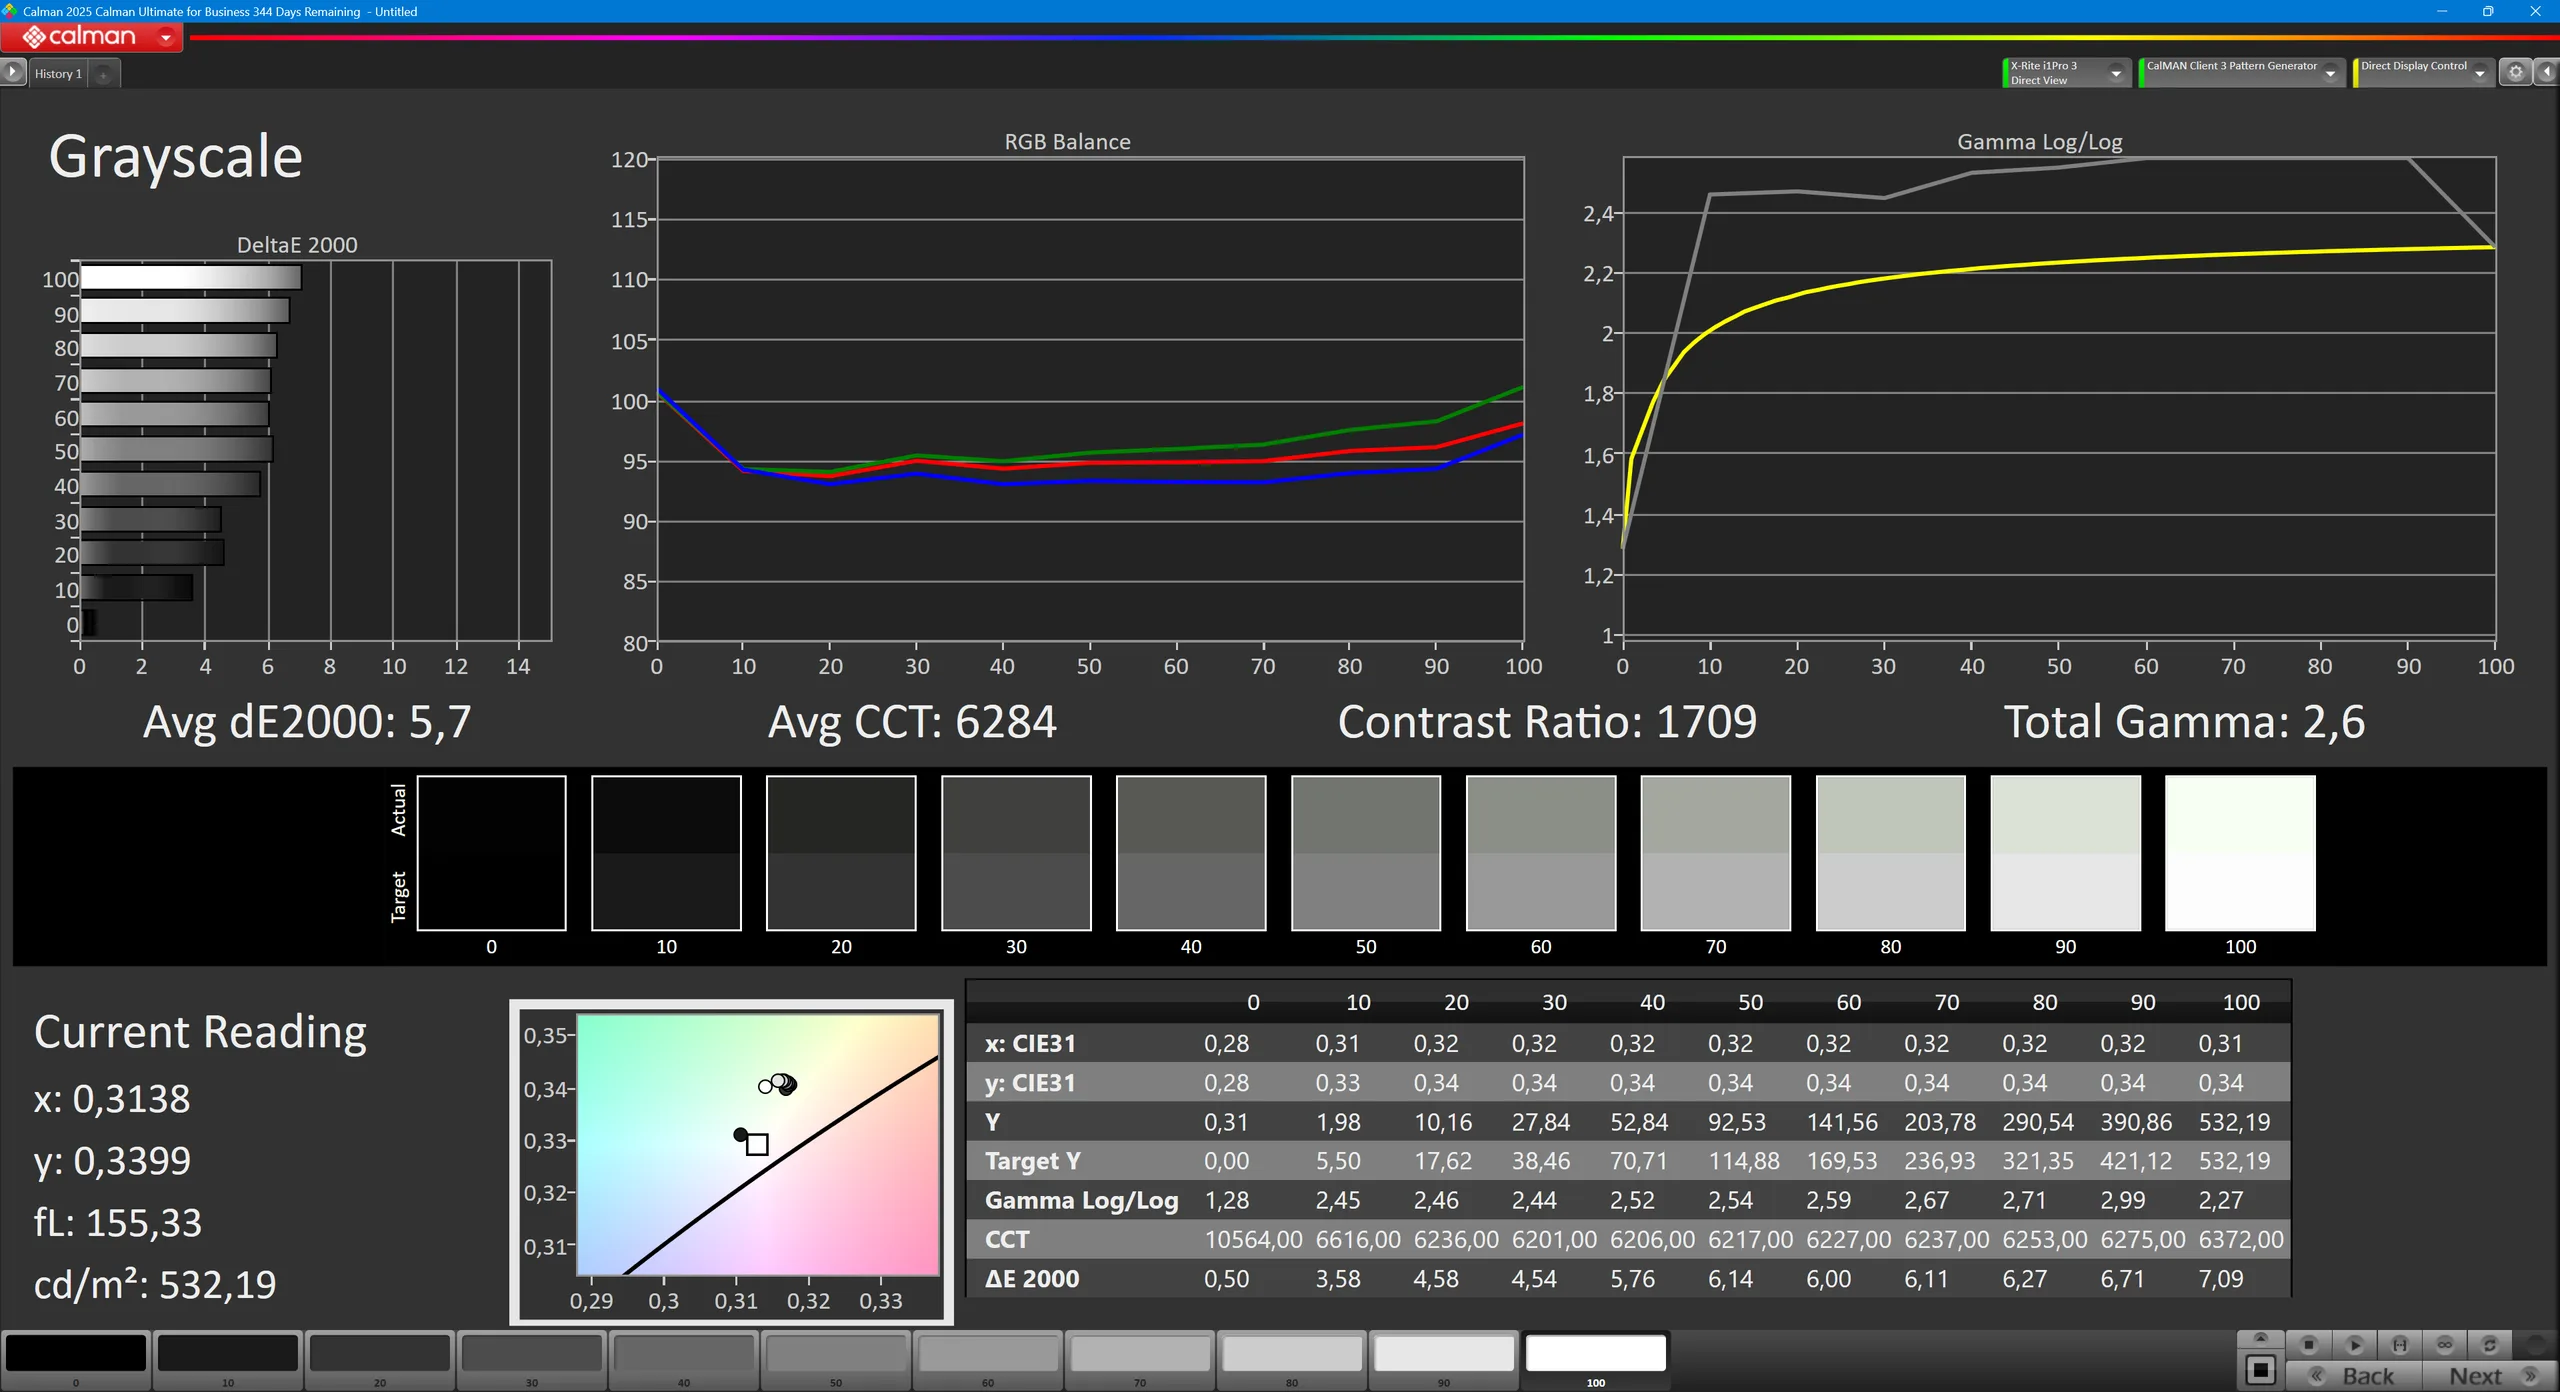
ΔE ColorChecker Calman: 4.4 | ∀{0.5-29.43 Ø4.71}
calibrated: 1.1
ΔE Greyscale Calman: 5.7 | ∀{0.09-98 Ø4.96}
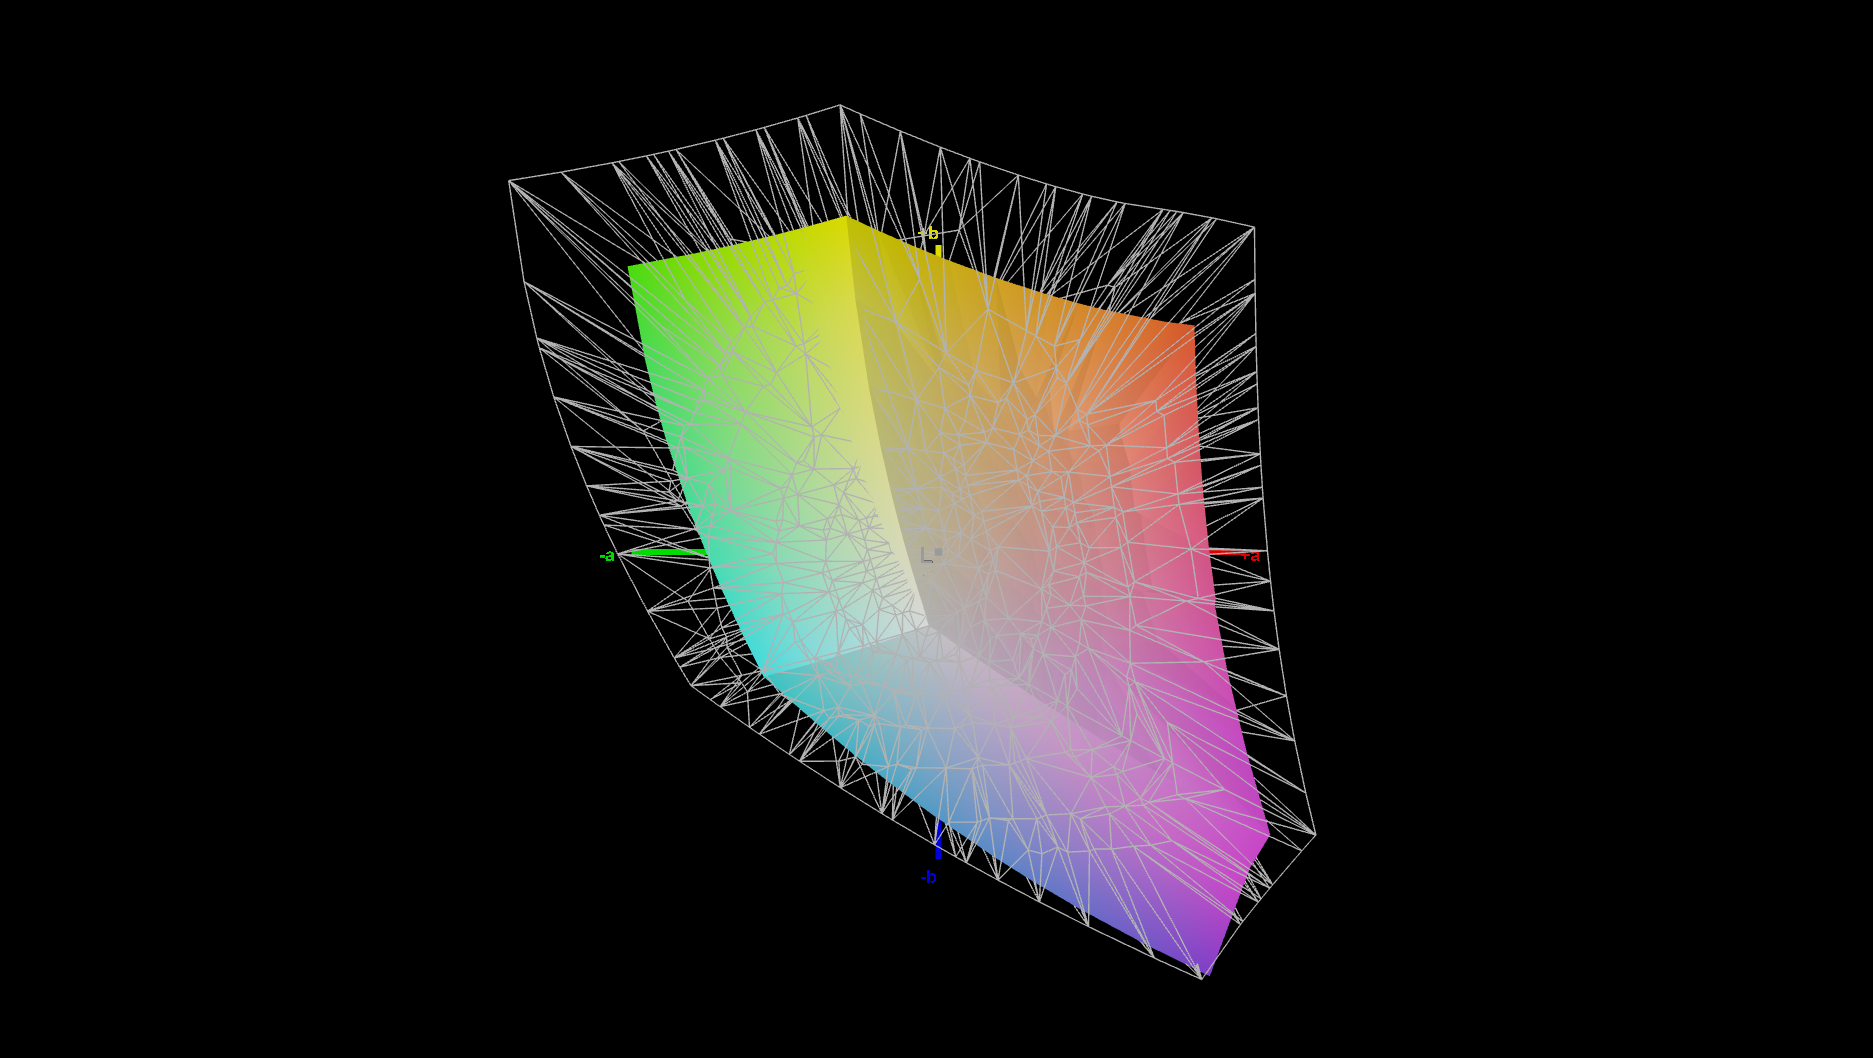
66.6% AdobeRGB 1998 (Argyll 3D)
95.2% sRGB (Argyll 3D)
64.9% Display P3 (Argyll 3D)
Gamma: 2.6
CCT: 6284 K
| Lenovo ThinkPad P16 Gen 3 N160JCA-GT1, IPS LED, 1920x1200, 16", 60 Hz | Lenovo ThinkPad P16 G2 21FA000FGE MNG007DA1-9, IPS LED, 2560x1600, 16", 165 Hz | Dell Pro Max 16 Plus Samsung 160HC01, OLED, 3840x2400, 16", 120 Hz | HP ZBook Fury 16 G11 AUO87A8, IPS, 3840x2400, 16", 120 Hz | Lenovo ThinkPad T16g Gen 3 RTX 5080 ATNA60KA02-0, OLED, 3200x2000, 16", 120 Hz | Lenovo ThinkPad P1 Gen 8 Samsung ATNA60KA02-0, Tandem OLED, 3200x2000, 16", 120 Hz | |
|---|---|---|---|---|---|---|
| Display | 8% | 29% | 29% | 30% | 34% | |
| Display P3 Coverage (%) | 64.9 | 71 9% | 97.3 50% | 98.4 52% | 98.8 52% | 98.8 52% |
| sRGB Coverage (%) | 95.2 | 99.2 4% | 100 5% | 99.9 5% | 100 5% | 100 5% |
| AdobeRGB 1998 Coverage (%) | 66.6 | 73.2 10% | 88.8 33% | 86 29% | 88.9 33% | 97.5 46% |
| Response Times | 52% | 97% | 59% | 97% | 97% | |
| Response Time Grey 50% / Grey 80% * (ms) | 29.8 ? | 12.8 ? 57% | 0.63 ? 98% | 11.4 ? 62% | 1.51 ? 95% | 0.57 ? 98% |
| Response Time Black / White * (ms) | 18.7 ? | 10.1 ? 46% | 0.89 ? 95% | 8.4 ? 55% | 0.44 ? 98% | 0.73 ? 96% |
| PWM Frequency (Hz) | 479.9 ? | 1200 ? | 1199 | |||
| PWM Amplitude * (%) | 28 | 22 | 18 | |||
| Screen | -5% | 29% | -1% | 43% | 37% | |
| Brightness middle (cd/m²) | 532 | 510 -4% | 530.9 0% | 457.6 -14% | 585 10% | 561.8 6% |
| Brightness (cd/m²) | 497 | 517 4% | 540 9% | 466 -6% | 590 19% | 566 14% |
| Brightness Distribution (%) | 88 | 89 1% | 95 8% | 83 -6% | 98 11% | 99 13% |
| Black Level * (cd/m²) | 0.31 | 0.37 -19% | 0.43 -39% | |||
| Contrast (:1) | 1716 | 1378 -20% | 1064 -38% | |||
| Colorchecker dE 2000 * | 4.4 | 2.6 41% | 2.42 45% | 2.78 37% | 0.9 80% | 1.29 71% |
| Colorchecker dE 2000 max. * | 6.9 | 5.2 25% | 5.76 17% | 5.53 20% | 2.7 61% | 2.96 57% |
| Colorchecker dE 2000 calibrated * | 1.1 | 2.3 -109% | 0.7 36% | 1.37 -25% | 0.81 26% | |
| Greyscale dE 2000 * | 5.7 | 3.6 37% | 0.8 86% | 2 65% | 1.4 75% | 1.4 75% |
| Gamma | 2.6 85% | 2.26 97% | 2.23 99% | 2.28 96% | 2.18 101% | 2.23 99% |
| CCT | 6284 103% | 5969 109% | 6488 100% | 6806 96% | 6442 101% | 6319 103% |
| Média Total (Programa/Configurações) | 18% /
6% | 52% /
40% | 29% /
14% | 57% /
49% | 56% /
47% |
* ... menor é melhor


Exibir tempos de resposta
| ↔ Tempo de resposta preto para branco | ||
|---|---|---|
| 18.7 ms ... ascensão ↗ e queda ↘ combinadas | ↗ 10.4 ms ascensão | 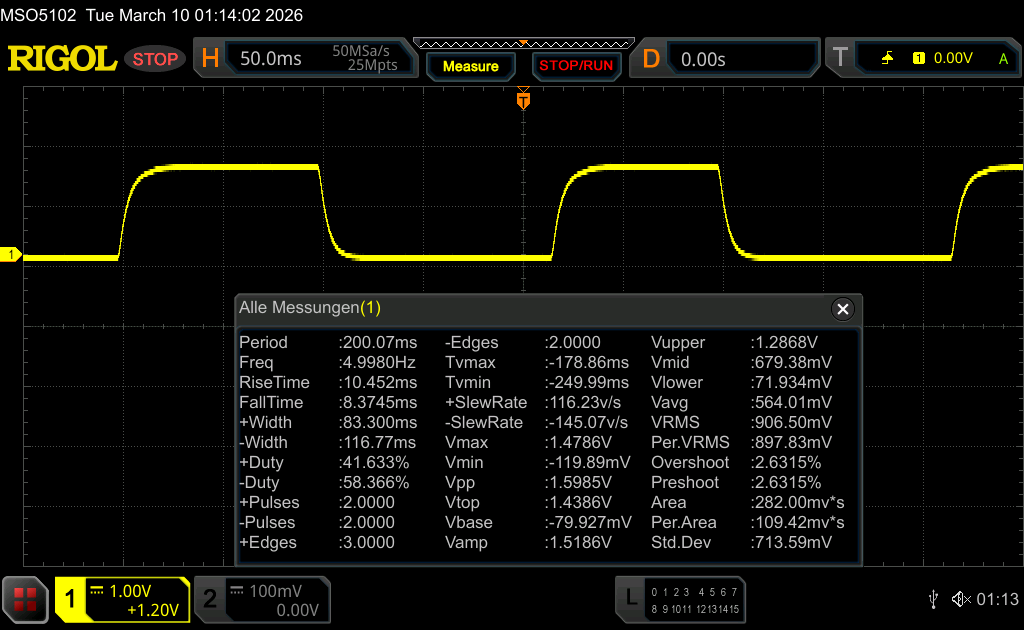 |
| ↘ 8.3 ms queda | ||
| A tela mostra boas taxas de resposta em nossos testes, mas pode ser muito lenta para jogadores competitivos. Em comparação, todos os dispositivos testados variam de 0.1 (mínimo) a 240 (máximo) ms. » 42 % de todos os dispositivos são melhores. Isso significa que o tempo de resposta medido é semelhante à média de todos os dispositivos testados (19.8 ms). | ||
| ↔ Tempo de resposta 50% cinza a 80% cinza | ||
| 29.8 ms ... ascensão ↗ e queda ↘ combinadas | ↗ 13.7 ms ascensão | 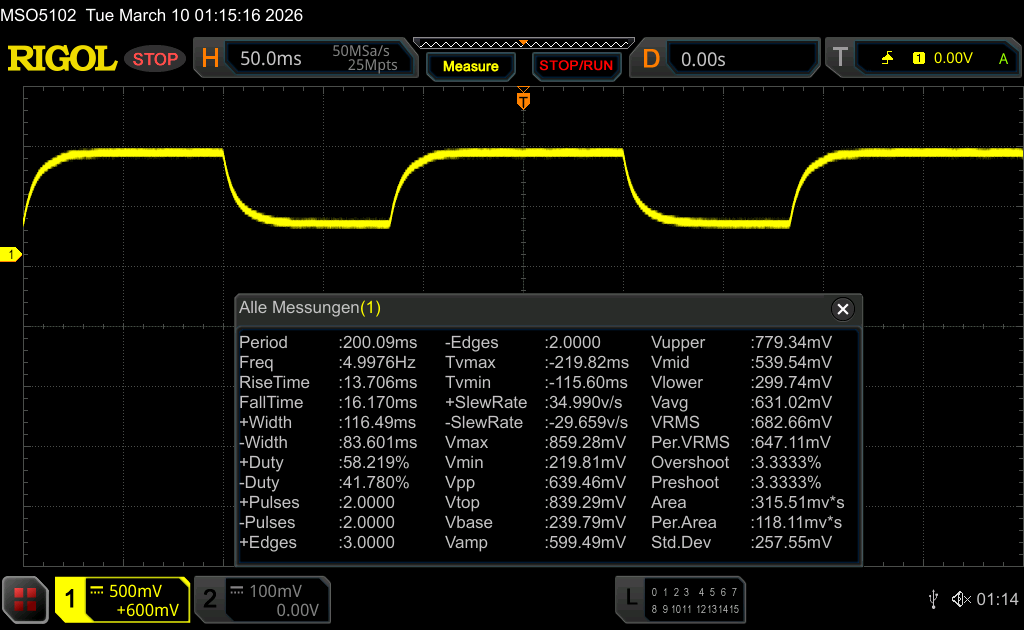 |
| ↘ 16.1 ms queda | ||
| A tela mostra taxas de resposta relativamente lentas em nossos testes e pode ser muito lenta para os jogadores. Em comparação, todos os dispositivos testados variam de 0.165 (mínimo) a 636 (máximo) ms. » 40 % de todos os dispositivos são melhores. Isso significa que o tempo de resposta medido é semelhante à média de todos os dispositivos testados (31 ms). | ||
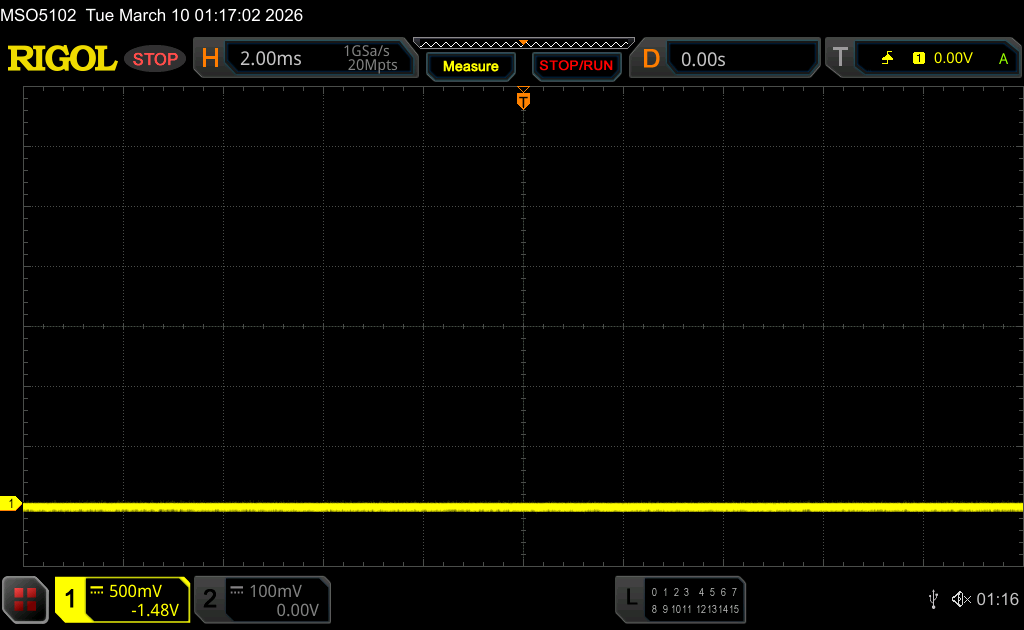
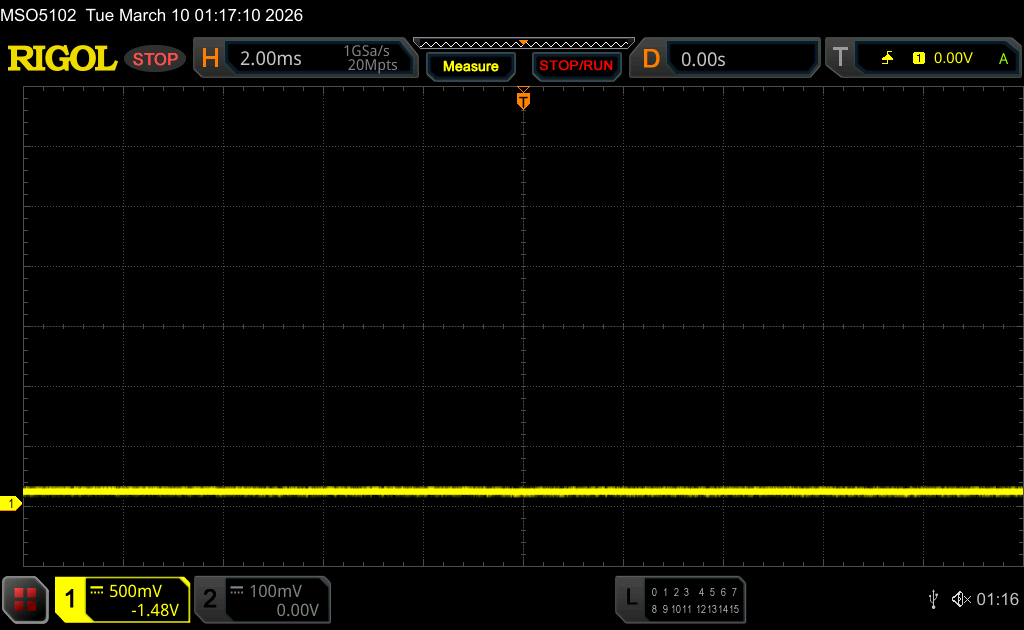
Cintilação da tela / PWM (modulação por largura de pulso)
| Tela tremeluzindo / PWM não detectado | 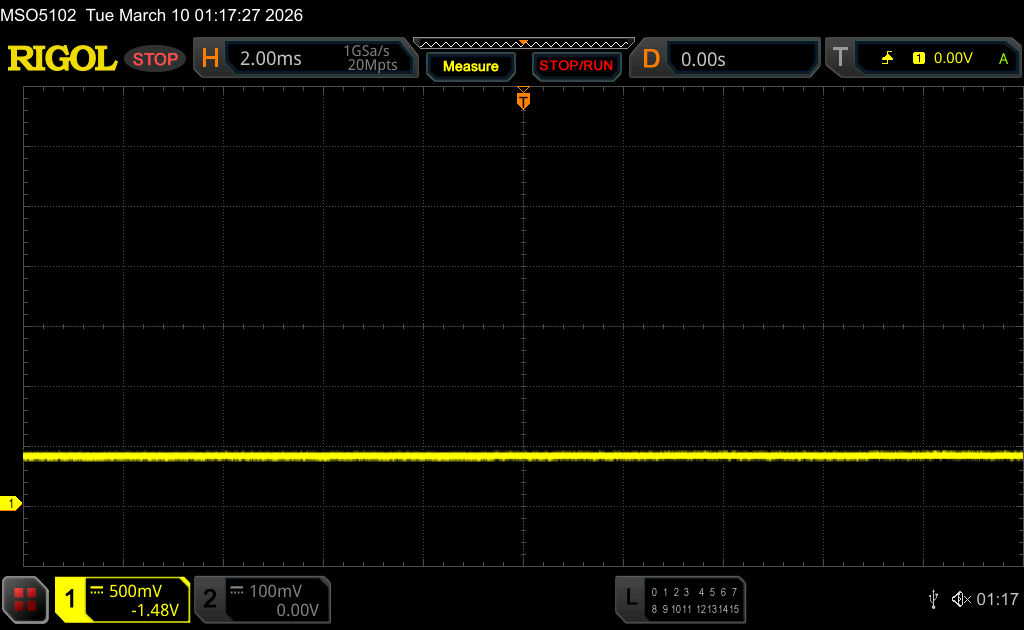 | ||
[pwm_comparison] Em comparação: 52 % de todos os dispositivos testados não usam PWM para escurecer a tela. Se PWM foi detectado, uma média de 7747 (mínimo: 5 - máximo: 343500) Hz foi medida. | |||


Desempenho

Condições de teste
- Melhor duração da bateria: PL1 45 W / PL2 160 W
- Equilibrada: PL1 100 W / PL2 160 W
- Melhor desempenho: PL1 110 W /PL2 160 W
Todos os nossos benchmarks foram realizados no modo "Melhor desempenho".
Processador
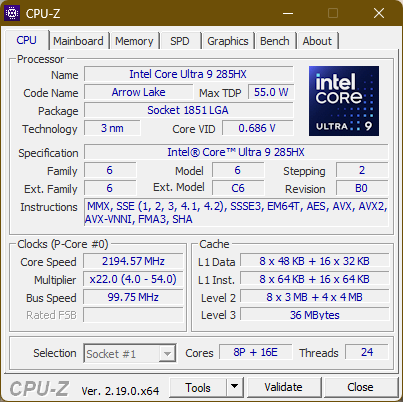
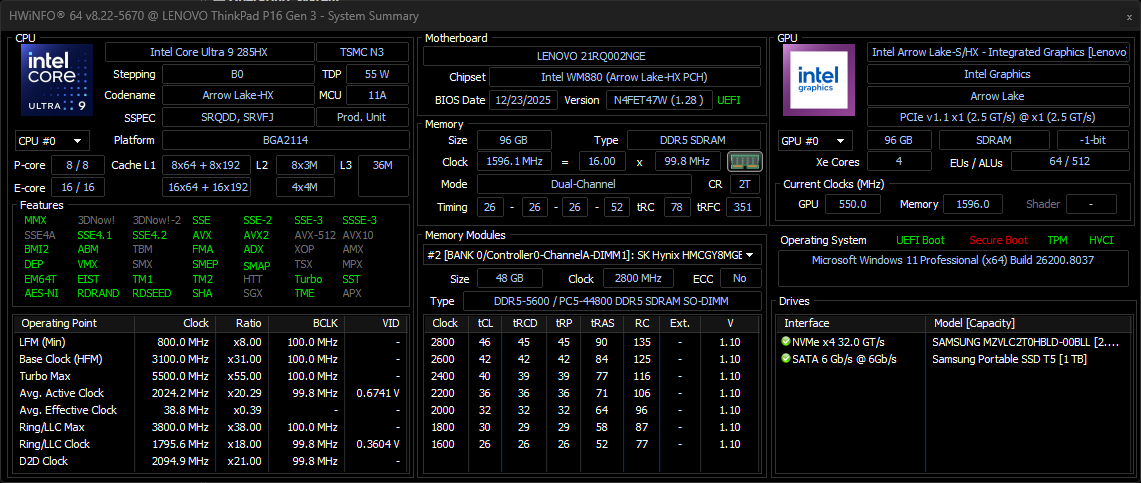
O Intel Core Ultra 285HX é um poderoso processador "Arrow Lake", baseado na mais recente série de CPUs para desktop da Intel. Com um total de 24 núcleos, oito dos quais podem atingir até 5,5 GHz, essa é uma das CPUs Intel mais rápidas para laptops. É possível fazer mais comparações com outros processadores em nossa lista de CPUs.
Em média, o ThinkPad P16 Gen 3 é 43% mais rápido do que o ThinkPad P16 Gen 2 quando se trata do desempenho do processador. Apesar desse grande avanço no desempenho, a CPU tem um desempenho ligeiramente abaixo da média para esse chip.
Quando o laptop funciona com a energia da bateria, o desempenho é reduzido em 26%, para 27728 pontos no teste Cinebench R23 Multicore.
Cinebench R15 Multi Loop
Cinebench R23: Multi Core | Single Core
Cinebench R20: CPU (Multi Core) | CPU (Single Core)
Cinebench R15: CPU Multi 64Bit | CPU Single 64Bit
Blender: v2.79 BMW27 CPU
7-Zip 18.03: 7z b 4 | 7z b 4 -mmt1
Geekbench 6.7: Multi-Core | Single-Core
Geekbench 5.5: Multi-Core | Single-Core
HWBOT x265 Benchmark v2.2: 4k Preset
LibreOffice : 20 Documents To PDF
R Benchmark 2.5: Overall mean
| CPU Performance rating | |
| Média Intel Core Ultra 9 285HX | |
| Lenovo ThinkPad T16g Gen 3 RTX 5080 | |
| Dell Pro Max 16 Plus | |
| Lenovo ThinkPad P16 Gen 3 | |
| HP ZBook Fury 16 G11 | |
| Média da turma Workstation | |
| Lenovo ThinkPad P1 Gen 8 | |
| Lenovo ThinkPad P16 G2 21FA000FGE -2! | |
| Cinebench R23 / Multi Core | |
| Lenovo ThinkPad T16g Gen 3 RTX 5080 | |
| Média Intel Core Ultra 9 285HX (34955 - 40117, n=6) | |
| Dell Pro Max 16 Plus | |
| Lenovo ThinkPad P16 Gen 3 | |
| HP ZBook Fury 16 G11 | |
| Média da turma Workstation (14621 - 38520, n=23, últimos 2 anos) | |
| Lenovo ThinkPad P1 Gen 8 | |
| Lenovo ThinkPad P16 G2 21FA000FGE | |
| Cinebench R23 / Single Core | |
| Lenovo ThinkPad P16 Gen 3 | |
| Lenovo ThinkPad T16g Gen 3 RTX 5080 | |
| Média Intel Core Ultra 9 285HX (2057 - 2303, n=6) | |
| HP ZBook Fury 16 G11 | |
| Dell Pro Max 16 Plus | |
| Média da turma Workstation (1712 - 2228, n=23, últimos 2 anos) | |
| Lenovo ThinkPad P1 Gen 8 | |
| Lenovo ThinkPad P16 G2 21FA000FGE | |
| Cinebench R20 / CPU (Multi Core) | |
| Lenovo ThinkPad T16g Gen 3 RTX 5080 | |
| Média Intel Core Ultra 9 285HX (13152 - 15751, n=6) | |
| Dell Pro Max 16 Plus | |
| Lenovo ThinkPad P16 Gen 3 | |
| HP ZBook Fury 16 G11 | |
| Média da turma Workstation (5760 - 15043, n=23, últimos 2 anos) | |
| Lenovo ThinkPad P1 Gen 8 | |
| Lenovo ThinkPad P16 G2 21FA000FGE | |
| Cinebench R20 / CPU (Single Core) | |
| Lenovo ThinkPad P16 Gen 3 | |
| Lenovo ThinkPad T16g Gen 3 RTX 5080 | |
| Média Intel Core Ultra 9 285HX (799 - 884, n=6) | |
| HP ZBook Fury 16 G11 | |
| Dell Pro Max 16 Plus | |
| Média da turma Workstation (671 - 857, n=23, últimos 2 anos) | |
| Lenovo ThinkPad P1 Gen 8 | |
| Lenovo ThinkPad P16 G2 21FA000FGE | |
| Cinebench R15 / CPU Multi 64Bit | |
| Lenovo ThinkPad T16g Gen 3 RTX 5080 | |
| Média Intel Core Ultra 9 285HX (5427 - 6232, n=6) | |
| Lenovo ThinkPad P16 Gen 3 | |
| Dell Pro Max 16 Plus | |
| HP ZBook Fury 16 G11 | |
| Média da turma Workstation (2489 - 5810, n=23, últimos 2 anos) | |
| Lenovo ThinkPad P1 Gen 8 | |
| Lenovo ThinkPad P16 G2 21FA000FGE | |
| Cinebench R15 / CPU Single 64Bit | |
| Lenovo ThinkPad T16g Gen 3 RTX 5080 | |
| Média Intel Core Ultra 9 285HX (307 - 340, n=6) | |
| Lenovo ThinkPad P16 Gen 3 | |
| Dell Pro Max 16 Plus | |
| Lenovo ThinkPad P1 Gen 8 | |
| HP ZBook Fury 16 G11 | |
| Média da turma Workstation (191.4 - 328, n=23, últimos 2 anos) | |
| Lenovo ThinkPad P16 G2 21FA000FGE | |
| Blender / v2.79 BMW27 CPU | |
| Lenovo ThinkPad P1 Gen 8 | |
| Lenovo ThinkPad P16 G2 21FA000FGE | |
| Média da turma Workstation (91 - 222, n=23, últimos 2 anos) | |
| HP ZBook Fury 16 G11 | |
| Lenovo ThinkPad P16 Gen 3 | |
| Dell Pro Max 16 Plus | |
| Lenovo ThinkPad T16g Gen 3 RTX 5080 | |
| Média Intel Core Ultra 9 285HX (83 - 103, n=6) | |
| 7-Zip 18.03 / 7z b 4 | |
| Média Intel Core Ultra 9 285HX (99260 - 128778, n=6) | |
| Dell Pro Max 16 Plus | |
| Lenovo ThinkPad T16g Gen 3 RTX 5080 | |
| HP ZBook Fury 16 G11 | |
| Lenovo ThinkPad P16 Gen 3 | |
| Média da turma Workstation (60489 - 116969, n=23, últimos 2 anos) | |
| Lenovo ThinkPad P16 G2 21FA000FGE | |
| Lenovo ThinkPad P1 Gen 8 | |
| 7-Zip 18.03 / 7z b 4 -mmt1 | |
| HP ZBook Fury 16 G11 | |
| Lenovo ThinkPad T16g Gen 3 RTX 5080 | |
| Média Intel Core Ultra 9 285HX (6422 - 6822, n=6) | |
| Dell Pro Max 16 Plus | |
| Lenovo ThinkPad P16 Gen 3 | |
| Lenovo ThinkPad P16 G2 21FA000FGE | |
| Média da turma Workstation (5126 - 6960, n=23, últimos 2 anos) | |
| Lenovo ThinkPad P1 Gen 8 | |
| Geekbench 6.7 / Multi-Core | |
| Dell Pro Max 16 Plus | |
| Média Intel Core Ultra 9 285HX (18212 - 22104, n=6) | |
| Lenovo ThinkPad T16g Gen 3 RTX 5080 | |
| Lenovo ThinkPad P16 Gen 3 | |
| Lenovo ThinkPad P1 Gen 8 | |
| Média da turma Workstation (12721 - 20887, n=23, últimos 2 anos) | |
| HP ZBook Fury 16 G11 | |
| Geekbench 6.7 / Single-Core | |
| Lenovo ThinkPad T16g Gen 3 RTX 5080 | |
| Média Intel Core Ultra 9 285HX (2907 - 3088, n=6) | |
| Lenovo ThinkPad P16 Gen 3 | |
| HP ZBook Fury 16 G11 | |
| Dell Pro Max 16 Plus | |
| Média da turma Workstation (2389 - 3065, n=23, últimos 2 anos) | |
| Lenovo ThinkPad P1 Gen 8 | |
| Geekbench 5.5 / Multi-Core | |
| Dell Pro Max 16 Plus | |
| Média Intel Core Ultra 9 285HX (18992 - 27010, n=6) | |
| Lenovo ThinkPad T16g Gen 3 RTX 5080 | |
| Lenovo ThinkPad P16 Gen 3 | |
| HP ZBook Fury 16 G11 | |
| Média da turma Workstation (11542 - 25554, n=23, últimos 2 anos) | |
| Lenovo ThinkPad P1 Gen 8 | |
| Lenovo ThinkPad P16 G2 21FA000FGE | |
| Geekbench 5.5 / Single-Core | |
| Lenovo ThinkPad T16g Gen 3 RTX 5080 | |
| Média Intel Core Ultra 9 285HX (2121 - 2232, n=6) | |
| Lenovo ThinkPad P16 Gen 3 | |
| Dell Pro Max 16 Plus | |
| Média da turma Workstation (1783 - 2183, n=23, últimos 2 anos) | |
| HP ZBook Fury 16 G11 | |
| Lenovo ThinkPad P1 Gen 8 | |
| Lenovo ThinkPad P16 G2 21FA000FGE | |
| HWBOT x265 Benchmark v2.2 / 4k Preset | |
| Média Intel Core Ultra 9 285HX (35.3 - 44.3, n=6) | |
| Lenovo ThinkPad T16g Gen 3 RTX 5080 | |
| Dell Pro Max 16 Plus | |
| Lenovo ThinkPad P16 Gen 3 | |
| Média da turma Workstation (17.8 - 40.5, n=23, últimos 2 anos) | |
| HP ZBook Fury 16 G11 | |
| Lenovo ThinkPad P1 Gen 8 | |
| Lenovo ThinkPad P16 G2 21FA000FGE | |
| LibreOffice / 20 Documents To PDF | |
| Lenovo ThinkPad P16 G2 21FA000FGE | |
| HP ZBook Fury 16 G11 | |
| Média da turma Workstation (37.1 - 74.7, n=23, últimos 2 anos) | |
| Lenovo ThinkPad T16g Gen 3 RTX 5080 | |
| Média Intel Core Ultra 9 285HX (38 - 49.1, n=6) | |
| Dell Pro Max 16 Plus | |
| Lenovo ThinkPad P16 Gen 3 | |
| Lenovo ThinkPad P1 Gen 8 | |
| R Benchmark 2.5 / Overall mean | |
| Lenovo ThinkPad P16 G2 21FA000FGE | |
| Lenovo ThinkPad P1 Gen 8 | |
| Média da turma Workstation (0.3825 - 0.603, n=23, últimos 2 anos) | |
| Dell Pro Max 16 Plus | |
| Média Intel Core Ultra 9 285HX (0.4012 - 0.4444, n=6) | |
| Lenovo ThinkPad P16 Gen 3 | |
| Lenovo ThinkPad T16g Gen 3 RTX 5080 | |
| HP ZBook Fury 16 G11 | |
* ... menor é melhor
AIDA64: FP32 Ray-Trace | FPU Julia | CPU SHA3 | CPU Queen | FPU SinJulia | FPU Mandel | CPU AES | CPU ZLib | FP64 Ray-Trace | CPU PhotoWorxx
| Performance rating | |
| Média Intel Core Ultra 9 285HX | |
| Lenovo ThinkPad T16g Gen 3 RTX 5080 | |
| Dell Pro Max 16 Plus | |
| Lenovo ThinkPad P16 Gen 3 | |
| Média da turma Workstation | |
| HP ZBook Fury 16 G11 | |
| Lenovo ThinkPad P1 Gen 8 | |
| Lenovo ThinkPad P16 G2 21FA000FGE | |
| AIDA64 / FP32 Ray-Trace | |
| Lenovo ThinkPad T16g Gen 3 RTX 5080 (v6.92.6600) | |
| Média Intel Core Ultra 9 285HX (29076 - 42341, n=6) | |
| Dell Pro Max 16 Plus (v6.92.6600) | |
| Lenovo ThinkPad P16 Gen 3 (v6.92.6600) | |
| Média da turma Workstation (16730 - 61611, n=23, últimos 2 anos) | |
| Lenovo ThinkPad P1 Gen 8 (v6.92.6600) | |
| HP ZBook Fury 16 G11 (v6.92.6600) | |
| Lenovo ThinkPad P16 G2 21FA000FGE (v6.75.6100) | |
| AIDA64 / FPU Julia | |
| Média Intel Core Ultra 9 285HX (161276 - 210885, n=6) | |
| Lenovo ThinkPad T16g Gen 3 RTX 5080 (v6.92.6600) | |
| Lenovo ThinkPad P16 Gen 3 (v6.92.6600) | |
| Dell Pro Max 16 Plus (v6.92.6600) | |
| Média da turma Workstation (89597 - 186971, n=23, últimos 2 anos) | |
| Lenovo ThinkPad P1 Gen 8 (v6.92.6600) | |
| HP ZBook Fury 16 G11 (v6.92.6600) | |
| Lenovo ThinkPad P16 G2 21FA000FGE (v6.75.6100) | |
| AIDA64 / CPU SHA3 | |
| Lenovo ThinkPad T16g Gen 3 RTX 5080 (v6.92.6600) | |
| Média Intel Core Ultra 9 285HX (7757 - 9815, n=6) | |
| Lenovo ThinkPad P16 Gen 3 (v6.92.6600) | |
| Dell Pro Max 16 Plus (v6.92.6600) | |
| Média da turma Workstation (4178 - 8975, n=23, últimos 2 anos) | |
| Lenovo ThinkPad P1 Gen 8 (v6.92.6600) | |
| HP ZBook Fury 16 G11 (v6.92.6600) | |
| Lenovo ThinkPad P16 G2 21FA000FGE (v6.75.6100) | |
| AIDA64 / CPU Queen | |
| Lenovo ThinkPad T16g Gen 3 RTX 5080 (v6.92.6600) | |
| HP ZBook Fury 16 G11 (v6.92.6600) | |
| Lenovo ThinkPad P16 Gen 3 (v6.92.6600) | |
| Média Intel Core Ultra 9 285HX (134345 - 141681, n=6) | |
| Dell Pro Max 16 Plus (v6.92.6600) | |
| Lenovo ThinkPad P16 G2 21FA000FGE (v6.75.6100) | |
| Média da turma Workstation (60778 - 144411, n=23, últimos 2 anos) | |
| Lenovo ThinkPad P1 Gen 8 (v6.92.6600) | |
| AIDA64 / FPU SinJulia | |
| Média da turma Workstation (8165 - 29343, n=23, últimos 2 anos) | |
| Lenovo ThinkPad T16g Gen 3 RTX 5080 (v6.92.6600) | |
| HP ZBook Fury 16 G11 (v6.92.6600) | |
| Média Intel Core Ultra 9 285HX (12559 - 14431, n=6) | |
| Dell Pro Max 16 Plus (v6.92.6600) | |
| Lenovo ThinkPad P16 Gen 3 (v6.92.6600) | |
| Lenovo ThinkPad P16 G2 21FA000FGE (v6.75.6100) | |
| Lenovo ThinkPad P1 Gen 8 (v6.92.6600) | |
| AIDA64 / FPU Mandel | |
| Lenovo ThinkPad T16g Gen 3 RTX 5080 (v6.92.6600) | |
| Média Intel Core Ultra 9 285HX (84053 - 108922, n=6) | |
| Lenovo ThinkPad P16 Gen 3 (v6.92.6600) | |
| Dell Pro Max 16 Plus (v6.92.6600) | |
| Média da turma Workstation (44497 - 98153, n=23, últimos 2 anos) | |
| Lenovo ThinkPad P1 Gen 8 (v6.92.6600) | |
| HP ZBook Fury 16 G11 (v6.92.6600) | |
| Lenovo ThinkPad P16 G2 21FA000FGE (v6.75.6100) | |
| AIDA64 / CPU AES | |
| Lenovo ThinkPad T16g Gen 3 RTX 5080 (v6.92.6600) | |
| Média Intel Core Ultra 9 285HX (119553 - 134195, n=6) | |
| Lenovo ThinkPad P16 Gen 3 (v6.92.6600) | |
| Dell Pro Max 16 Plus (v6.92.6600) | |
| Média da turma Workstation (73133 - 187841, n=23, últimos 2 anos) | |
| HP ZBook Fury 16 G11 (v6.92.6600) | |
| Lenovo ThinkPad P16 G2 21FA000FGE (v6.75.6100) | |
| Lenovo ThinkPad P1 Gen 8 (v6.92.6600) | |
| AIDA64 / CPU ZLib | |
| Lenovo ThinkPad T16g Gen 3 RTX 5080 (v6.92.6600) | |
| Média Intel Core Ultra 9 285HX (1886 - 2267, n=6) | |
| Lenovo ThinkPad P16 Gen 3 (v6.92.6600) | |
| Dell Pro Max 16 Plus (v6.92.6600) | |
| Média da turma Workstation (929 - 2148, n=23, últimos 2 anos) | |
| HP ZBook Fury 16 G11 (v6.92.6600) | |
| Lenovo ThinkPad P1 Gen 8 (v6.92.6600) | |
| Lenovo ThinkPad P16 G2 21FA000FGE (v6.75.6100) | |
| AIDA64 / FP64 Ray-Trace | |
| Lenovo ThinkPad T16g Gen 3 RTX 5080 (v6.92.6600) | |
| Média Intel Core Ultra 9 285HX (15059 - 22312, n=6) | |
| Dell Pro Max 16 Plus (v6.92.6600) | |
| Média da turma Workstation (8545 - 32891, n=23, últimos 2 anos) | |
| Lenovo ThinkPad P16 Gen 3 (v6.92.6600) | |
| Lenovo ThinkPad P1 Gen 8 (v6.92.6600) | |
| HP ZBook Fury 16 G11 (v6.92.6600) | |
| Lenovo ThinkPad P16 G2 21FA000FGE (v6.75.6100) | |
| AIDA64 / CPU PhotoWorxx | |
| Dell Pro Max 16 Plus (v6.92.6600) | |
| Lenovo ThinkPad P1 Gen 8 (v6.92.6600) | |
| Média da turma Workstation (37151 - 93684, n=23, últimos 2 anos) | |
| Média Intel Core Ultra 9 285HX (39232 - 62611, n=6) | |
| Lenovo ThinkPad T16g Gen 3 RTX 5080 (v6.92.6600) | |
| Lenovo ThinkPad P16 Gen 3 (v6.92.6600) | |
| HP ZBook Fury 16 G11 (v6.92.6600) | |
| Lenovo ThinkPad P16 G2 21FA000FGE (v6.75.6100) | |
Desempenho do sistema
PCMark 10: Score | Essentials | Productivity | Digital Content Creation
CrossMark: Overall | Productivity | Creativity | Responsiveness
WebXPRT 3: Overall
WebXPRT 4: Overall
Mozilla Kraken 1.1: Total
| Performance rating | |
| Lenovo ThinkPad T16g Gen 3 RTX 5080 | |
| Lenovo ThinkPad P16 Gen 3 | |
| Média Intel Core Ultra 9 285HX, NVIDIA RTX PRO 3000 Blackwell Generation Laptop | |
| Dell Pro Max 16 Plus -4! | |
| Lenovo ThinkPad P1 Gen 8 | |
| HP ZBook Fury 16 G11 | |
| Média da turma Workstation | |
| Lenovo ThinkPad P16 G2 21FA000FGE -1! | |
| PCMark 10 / Score | |
| Lenovo ThinkPad T16g Gen 3 RTX 5080 | |
| Lenovo ThinkPad P16 Gen 3 | |
| Média Intel Core Ultra 9 285HX, NVIDIA RTX PRO 3000 Blackwell Generation Laptop (n=1) | |
| Lenovo ThinkPad P1 Gen 8 | |
| Média da turma Workstation (6563 - 10409, n=19, últimos 2 anos) | |
| HP ZBook Fury 16 G11 | |
| Lenovo ThinkPad P16 G2 21FA000FGE | |
| PCMark 10 / Essentials | |
| Lenovo ThinkPad P16 G2 21FA000FGE | |
| Lenovo ThinkPad P1 Gen 8 | |
| Média da turma Workstation (9622 - 11157, n=19, últimos 2 anos) | |
| Lenovo ThinkPad P16 Gen 3 | |
| Média Intel Core Ultra 9 285HX, NVIDIA RTX PRO 3000 Blackwell Generation Laptop (n=1) | |
| Lenovo ThinkPad T16g Gen 3 RTX 5080 | |
| HP ZBook Fury 16 G11 | |
| PCMark 10 / Productivity | |
| Lenovo ThinkPad T16g Gen 3 RTX 5080 | |
| Lenovo ThinkPad P16 Gen 3 | |
| Média Intel Core Ultra 9 285HX, NVIDIA RTX PRO 3000 Blackwell Generation Laptop (n=1) | |
| Lenovo ThinkPad P1 Gen 8 | |
| Média da turma Workstation (8789 - 20616, n=19, últimos 2 anos) | |
| HP ZBook Fury 16 G11 | |
| Lenovo ThinkPad P16 G2 21FA000FGE | |
| PCMark 10 / Digital Content Creation | |
| Lenovo ThinkPad T16g Gen 3 RTX 5080 | |
| Lenovo ThinkPad P16 Gen 3 | |
| Média Intel Core Ultra 9 285HX, NVIDIA RTX PRO 3000 Blackwell Generation Laptop (n=1) | |
| HP ZBook Fury 16 G11 | |
| Média da turma Workstation (8108 - 15631, n=19, últimos 2 anos) | |
| Lenovo ThinkPad P1 Gen 8 | |
| Lenovo ThinkPad P16 G2 21FA000FGE | |
| CrossMark / Overall | |
| Lenovo ThinkPad T16g Gen 3 RTX 5080 | |
| Dell Pro Max 16 Plus | |
| Lenovo ThinkPad P16 Gen 3 | |
| Média Intel Core Ultra 9 285HX, NVIDIA RTX PRO 3000 Blackwell Generation Laptop (n=1) | |
| HP ZBook Fury 16 G11 | |
| Lenovo ThinkPad P1 Gen 8 | |
| Média da turma Workstation (1307 - 2267, n=22, últimos 2 anos) | |
| Lenovo ThinkPad P16 G2 21FA000FGE | |
| CrossMark / Productivity | |
| Lenovo ThinkPad T16g Gen 3 RTX 5080 | |
| Lenovo ThinkPad P16 Gen 3 | |
| Média Intel Core Ultra 9 285HX, NVIDIA RTX PRO 3000 Blackwell Generation Laptop (n=1) | |
| Dell Pro Max 16 Plus | |
| HP ZBook Fury 16 G11 | |
| Lenovo ThinkPad P1 Gen 8 | |
| Média da turma Workstation (1130 - 2122, n=22, últimos 2 anos) | |
| Lenovo ThinkPad P16 G2 21FA000FGE | |
| CrossMark / Creativity | |
| Dell Pro Max 16 Plus | |
| Lenovo ThinkPad T16g Gen 3 RTX 5080 | |
| Lenovo ThinkPad P16 Gen 3 | |
| Média Intel Core Ultra 9 285HX, NVIDIA RTX PRO 3000 Blackwell Generation Laptop (n=1) | |
| HP ZBook Fury 16 G11 | |
| Média da turma Workstation (1657 - 2725, n=22, últimos 2 anos) | |
| Lenovo ThinkPad P1 Gen 8 | |
| Lenovo ThinkPad P16 G2 21FA000FGE | |
| CrossMark / Responsiveness | |
| Lenovo ThinkPad T16g Gen 3 RTX 5080 | |
| Lenovo ThinkPad P16 Gen 3 | |
| Média Intel Core Ultra 9 285HX, NVIDIA RTX PRO 3000 Blackwell Generation Laptop (n=1) | |
| Dell Pro Max 16 Plus | |
| HP ZBook Fury 16 G11 | |
| Lenovo ThinkPad P1 Gen 8 | |
| Média da turma Workstation (993 - 2096, n=22, últimos 2 anos) | |
| Lenovo ThinkPad P16 G2 21FA000FGE | |
| WebXPRT 3 / Overall | |
| Lenovo ThinkPad T16g Gen 3 RTX 5080 | |
| Lenovo ThinkPad P16 Gen 3 | |
| Média Intel Core Ultra 9 285HX, NVIDIA RTX PRO 3000 Blackwell Generation Laptop (n=1) | |
| Lenovo ThinkPad P1 Gen 8 | |
| Dell Pro Max 16 Plus | |
| Lenovo ThinkPad P16 G2 21FA000FGE | |
| HP ZBook Fury 16 G11 | |
| Média da turma Workstation (260 - 360, n=23, últimos 2 anos) | |
| WebXPRT 4 / Overall | |
| Lenovo ThinkPad P16 Gen 3 | |
| Média Intel Core Ultra 9 285HX, NVIDIA RTX PRO 3000 Blackwell Generation Laptop (n=1) | |
| Lenovo ThinkPad T16g Gen 3 RTX 5080 | |
| Dell Pro Max 16 Plus | |
| HP ZBook Fury 16 G11 | |
| Lenovo ThinkPad P1 Gen 8 | |
| Média da turma Workstation (189.2 - 326, n=23, últimos 2 anos) | |
| Mozilla Kraken 1.1 / Total | |
| Lenovo ThinkPad P16 G2 21FA000FGE | |
| Lenovo ThinkPad P1 Gen 8 | |
| Média da turma Workstation (411 - 538, n=23, últimos 2 anos) | |
| HP ZBook Fury 16 G11 | |
| Dell Pro Max 16 Plus | |
| Lenovo ThinkPad T16g Gen 3 RTX 5080 | |
| Lenovo ThinkPad P16 Gen 3 | |
| Média Intel Core Ultra 9 285HX, NVIDIA RTX PRO 3000 Blackwell Generation Laptop (n=1) | |
* ... menor é melhor
| PCMark 10 Score | 10149 pontos | |
Ajuda | ||
| AIDA64 / Memory Copy | |
| Lenovo ThinkPad P1 Gen 8 | |
| Dell Pro Max 16 Plus | |
| Média da turma Workstation (56003 - 164795, n=23, últimos 2 anos) | |
| Média Intel Core Ultra 9 285HX (63431 - 93933, n=6) | |
| Lenovo ThinkPad T16g Gen 3 RTX 5080 | |
| Lenovo ThinkPad P16 Gen 3 | |
| HP ZBook Fury 16 G11 | |
| Lenovo ThinkPad P16 G2 21FA000FGE | |
| AIDA64 / Memory Read | |
| Dell Pro Max 16 Plus | |
| Média Intel Core Ultra 9 285HX (67084 - 97565, n=6) | |
| Média da turma Workstation (55795 - 121563, n=23, últimos 2 anos) | |
| Lenovo ThinkPad P1 Gen 8 | |
| Lenovo ThinkPad P16 Gen 3 | |
| Lenovo ThinkPad T16g Gen 3 RTX 5080 | |
| HP ZBook Fury 16 G11 | |
| Lenovo ThinkPad P16 G2 21FA000FGE | |
| AIDA64 / Memory Write | |
| Dell Pro Max 16 Plus | |
| Média da turma Workstation (55663 - 214520, n=23, últimos 2 anos) | |
| Média Intel Core Ultra 9 285HX (64112 - 89691, n=6) | |
| Lenovo ThinkPad P16 Gen 3 | |
| Lenovo ThinkPad T16g Gen 3 RTX 5080 | |
| Lenovo ThinkPad P1 Gen 8 | |
| Lenovo ThinkPad P16 G2 21FA000FGE | |
| HP ZBook Fury 16 G11 | |
| AIDA64 / Memory Latency | |
| Lenovo ThinkPad P16 Gen 3 | |
| Lenovo ThinkPad T16g Gen 3 RTX 5080 | |
| Lenovo ThinkPad P1 Gen 8 | |
| Média Intel Core Ultra 9 285HX (104.8 - 151.7, n=6) | |
| Média da turma Workstation (84.5 - 165.2, n=23, últimos 2 anos) | |
| Dell Pro Max 16 Plus | |
| Lenovo ThinkPad P16 G2 21FA000FGE | |
| HP ZBook Fury 16 G11 | |
* ... menor é melhor
Latência DPC
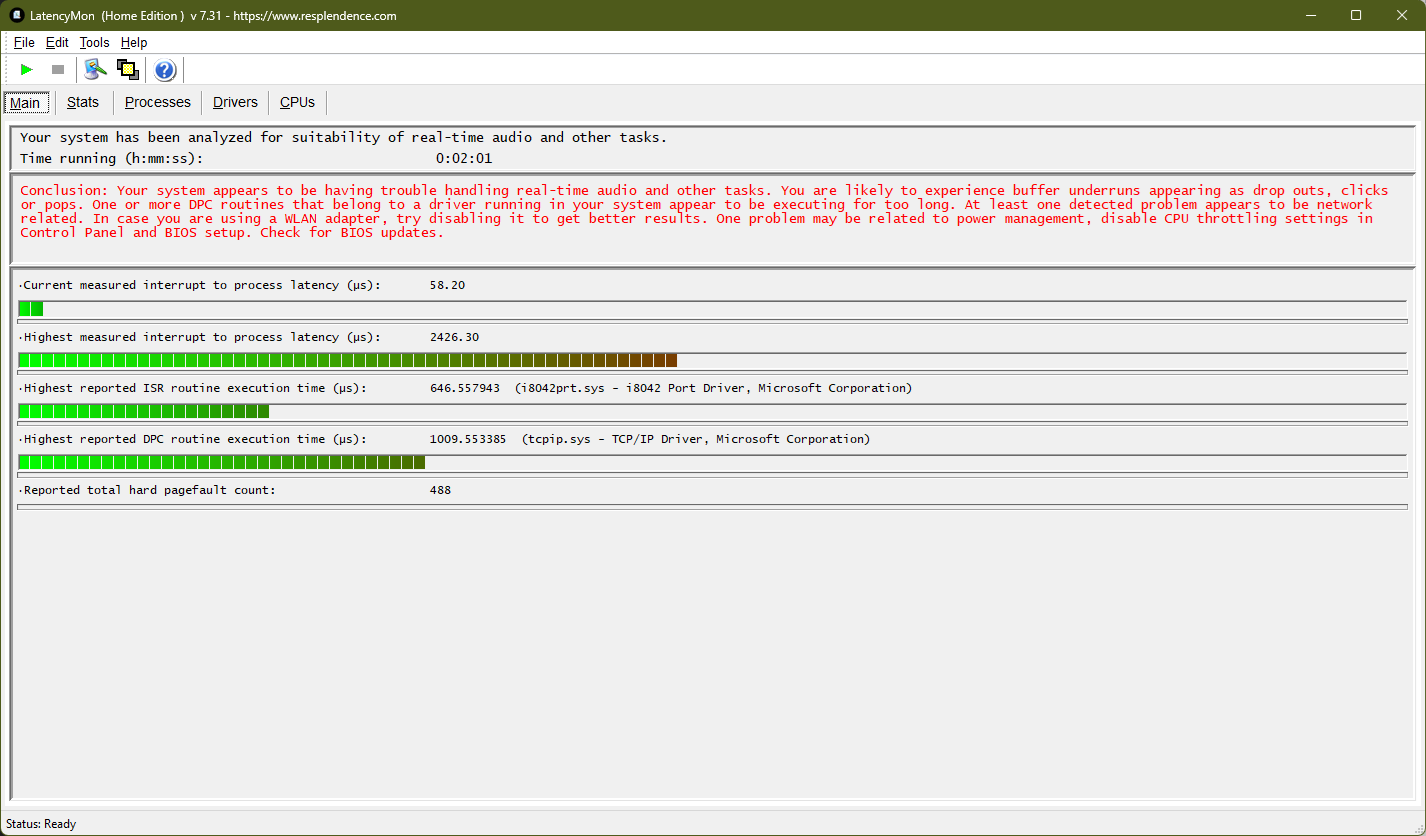
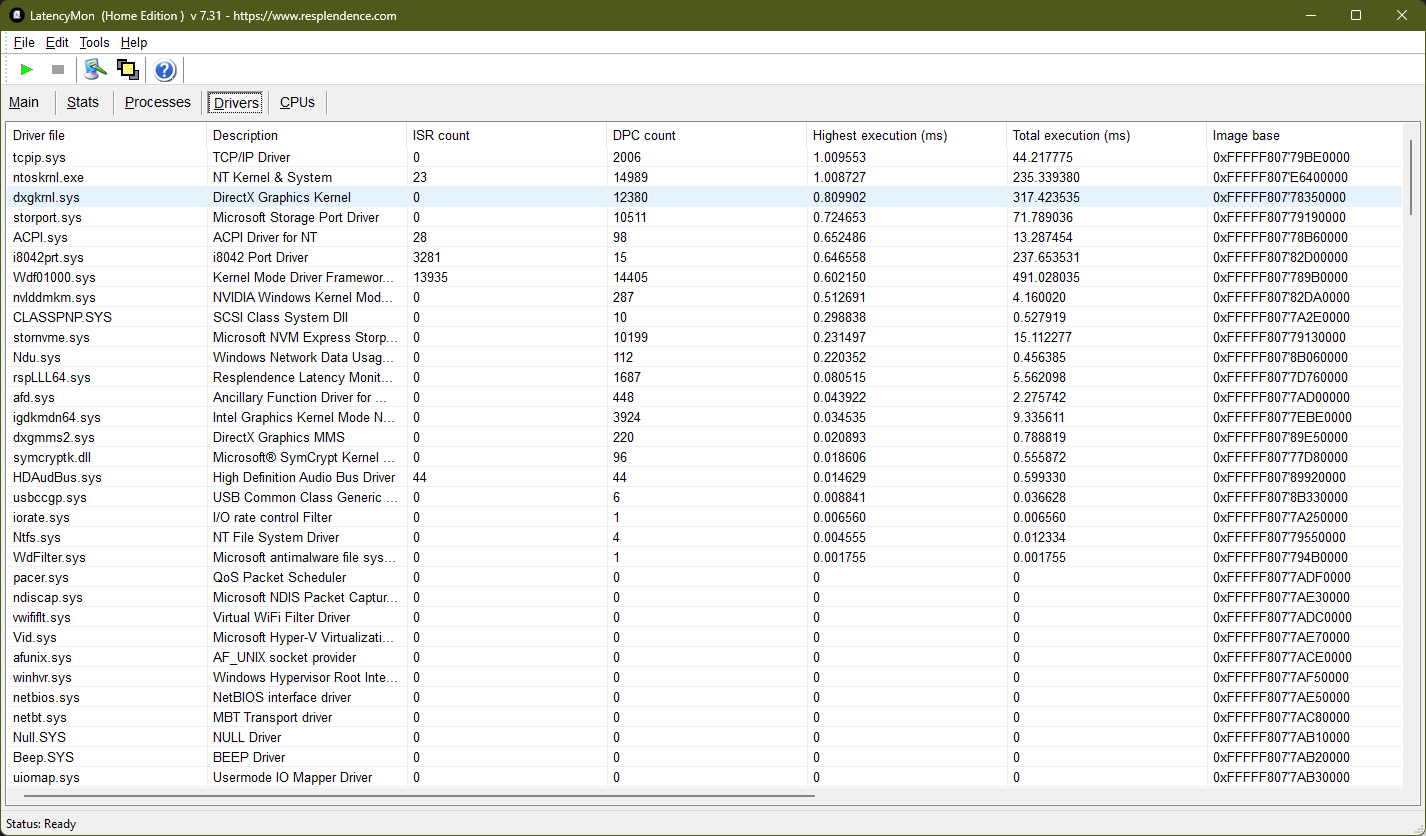
| DPC Latencies / LatencyMon - interrupt to process latency (max), Web, Youtube, Prime95 | |
| HP ZBook Fury 16 G11 | |
| Lenovo ThinkPad P1 Gen 8 | |
| Dell Pro Max 16 Plus | |
| Lenovo ThinkPad P16 Gen 3 | |
| Lenovo ThinkPad T16g Gen 3 RTX 5080 | |
| Lenovo ThinkPad P16 G2 21FA000FGE | |
* ... menor é melhor
Dispositivos de armazenamento
A Lenovo usa um SSD PCIe 5.0 rápido fabricado pela Samsung, o PM9E1, que tem capacidade de 2 TB. O SSD M.2 2280 tem um bom desempenho em nossos benchmarks, superando a maioria das outras estações de trabalho. Entretanto, o desempenho é um pouco prejudicado sob carga.
O ThinkPad tem dois compartimentos adicionais NVMe 4.0 M.2 2280 sob o teclado, o que permite uma grande expansão do armazenamento.

* ... menor é melhor
Limitação de disco: Loop de leitura do DiskSpd, profundidade da fila 8
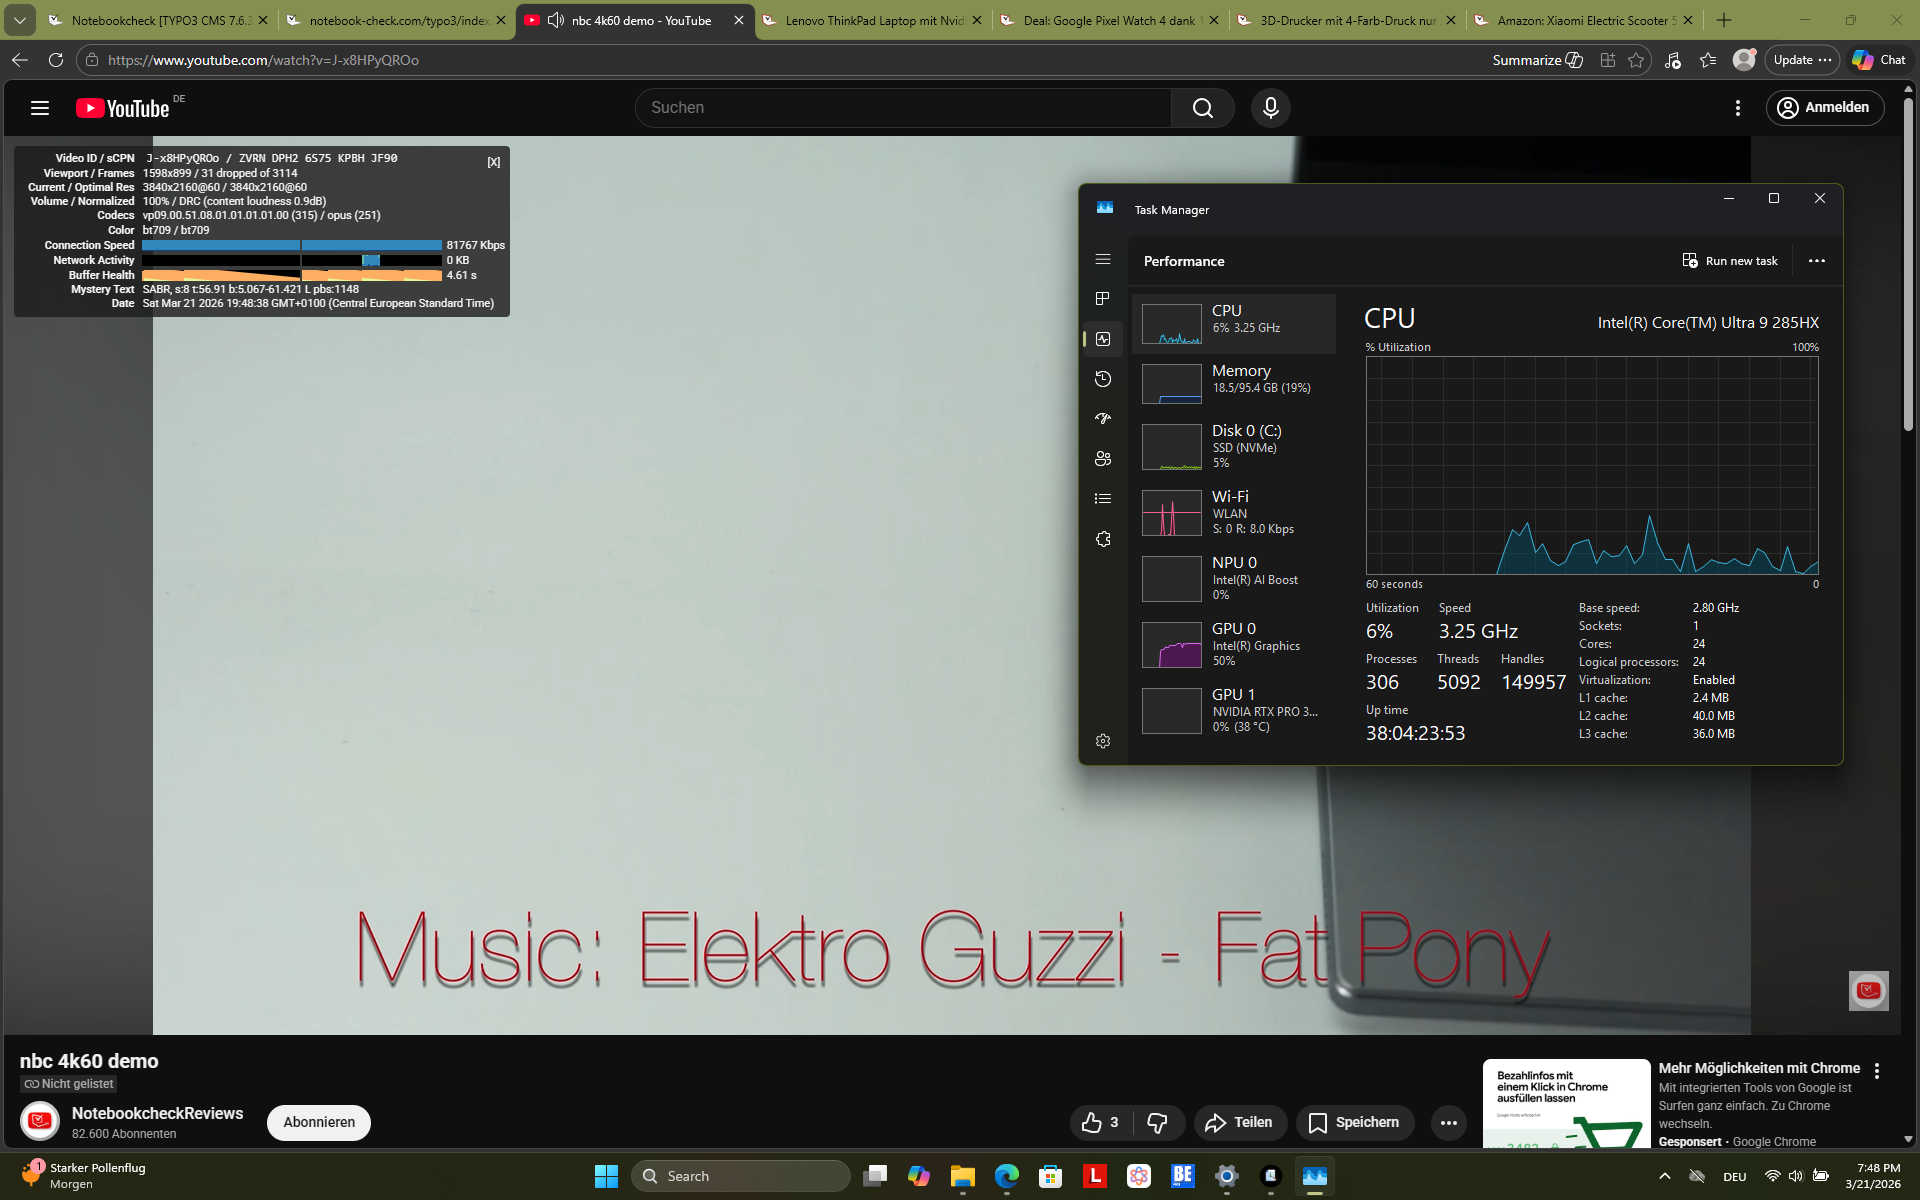
Desempenho da GPU
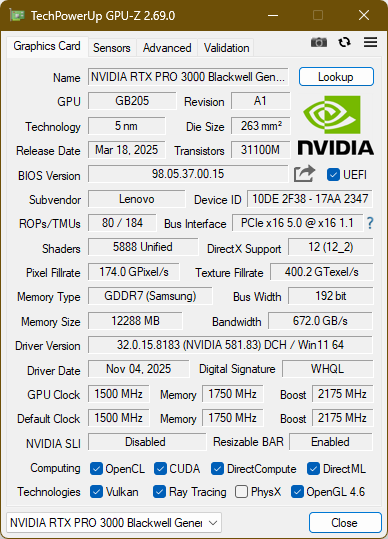
A Lenovo usa a Nvidia RTX Pro 3000 Blackwelluma GPU profissional e certificada por ISV da Nvidia. Essa placa de vídeo é comparável com a Nvidia GeForce RTX 5070 Ti. No ThinkPad P16 Gen 3, a Lenovo limita a 105 W, muito longe dos 175 W da TGP RTX 5000 Pro do Dell Pro Max 16 Plus. Consequentemente, o desempenho é prejudicado, ficando cerca de 24% atrás do concorrente nos testes profissionais (SPECviewperf) e de consumidor (3DMark).
No geral, o desempenho da GPU é reduzido quando o P16 Gen 3 funciona com a energia da bateria, com apenas 37978 pontos no teste de GPU 3DMark 11, uma redução de 23%.
| 3DMark 06 Standard Score | 63693 pontos | |
| 3DMark Vantage P Result | 116321 pontos | |
| 3DMark 11 Performance | 39176 pontos | |
| 3DMark Cloud Gate Standard Score | 65135 pontos | |
| 3DMark Fire Strike Score | 31208 pontos | |
| 3DMark Time Spy Score | 14579 pontos | |
Ajuda | ||
* ... menor é melhor
Desempenho em jogos
| Cyberpunk 2077 - 1920x1080 Ultra Preset (FSR off) | |
| Dell Pro Max 16 Plus | |
| Lenovo ThinkPad T16g Gen 3 RTX 5080 | |
| Lenovo ThinkPad P16 Gen 3 | |
| HP ZBook Fury 16 G11 | |
| Média da turma Workstation (21.5 - 152.4, n=23, últimos 2 anos) | |
| Lenovo ThinkPad P1 Gen 8 | |
| Baldur's Gate 3 - 1920x1080 Ultra Preset AA:T | |
| Dell Pro Max 16 Plus | |
| Lenovo ThinkPad T16g Gen 3 RTX 5080 | |
| Lenovo ThinkPad P16 Gen 3 | |
| HP ZBook Fury 16 G11 | |
| Lenovo ThinkPad P1 Gen 8 | |
| Média da turma Workstation (23.7 - 205, n=24, últimos 2 anos) | |
| Final Fantasy XV Benchmark - 1920x1080 High Quality | |
| Dell Pro Max 16 Plus | |
| Lenovo ThinkPad T16g Gen 3 RTX 5080 | |
| Lenovo ThinkPad P16 Gen 3 | |
| HP ZBook Fury 16 G11 | |
| Lenovo ThinkPad P1 Gen 8 | |
| Média da turma Workstation (26.4 - 197.6, n=23, últimos 2 anos) | |
| Lenovo ThinkPad P16 G2 21FA000FGE | |
Gráfico de ultra FPS do Cyberpunk 2077
| baixo | média | alto | ultra | QHD | 4K DLSS | 4K FSR | 4K | |
|---|---|---|---|---|---|---|---|---|
| GTA V (2015) | 183.5 | 182.6 | 176.4 | 131.7 | 116.7 | |||
| Dota 2 Reborn (2015) | 204 | 181.7 | 167.3 | 157 | 128.7 | |||
| Final Fantasy XV Benchmark (2018) | 204 | 164 | 132 | 111 | 63.8 | |||
| X-Plane 11.11 (2018) | 136.1 | 118.7 | 92.1 | 73.5 | ||||
| Strange Brigade (2018) | 524 | 380 | 321 | 290 | 204 | 108.7 | ||
| Baldur's Gate 3 (2023) | 172.4 | 147.8 | 128.9 | 126.8 | 91.9 | 75.8 | 75.4 | 49.4 |
| Cyberpunk 2077 (2023) | 138.7 | 137 | 112.7 | 102.5 | 70.7 | 37.7 | 30.8 | |
| Kingdom Come Deliverance 2 (2025) | 166.7 | 131.2 | 106.4 | 80.2 | 56.3 | 44.8 | 30 | |
| Civilization 7 (2025) | 287 | 183.6 | 163.2 | 116.9 | 88.7 | 62.4 | ||
| Assassin's Creed Shadows (2025) | 79 | 74 | 62 | 47 | 39 | 37 | 26 | |
| The Elder Scrolls IV Oblivion Remastered (2025) | 87.8 | 81.6 | 76.4 | 35.3 | 23.6 | 21.6 | 24.3 | 13.3 |
| Doom: The Dark Ages (2025) | 98.2 | 80.3 | 73.4 | 69.7 | 46.9 | 35.1 | 24.9 | |
| F1 25 (2025) | 189.1 | 176.5 | 165.8 | 33.8 | 20.1 | 17.7 | 9.25 | |
| Borderlands 4 (2025) | 71.5 | 59 | 46.6 | 32.5 | 22 | 64.6 | 11.5 | |
| The Outer Worlds 2 (2025) | 101.1 | 97.1 | 83.4 | 50.3 | 32.6 | 27.2 | 17 | |
| ARC Raiders (2025) | 167.6 | 137 | 121.7 | 84.4 | 57.5 | 55.7 | 31.3 | |
| Anno 117: Pax Romana (2025) | 129 | 103.8 | 78 | 41.5 | 29 | 26 | 15.9 |
Emissões
Ruído do sistema
As ventoinhas duplas do notebook ThinkPad são quase sempre silenciosas durante o uso no escritório, mas podem ficar muito altas sob carga - mais de 50 dB(a) são muito audíveis, mesmo em salas diferentes.
Não conseguimos detectar o ruído da bobina no ThinkPad P16 Gen 3.
Barulho
| Ocioso |
| 23.6 / 27.2 / 27.2 dB |
| Carga |
| 42.7 / 53.9 dB |
 | ||
30 dB silencioso 40 dB(A) audível 50 dB(A) ruidosamente alto |
||
min: | ||
| Lenovo ThinkPad P16 Gen 3 Ultra 9 285HX, RTX PRO 3000 Blackwell Generation Laptop | Lenovo ThinkPad P16 G2 21FA000FGE i7-13700HX, RTX 2000 Ada Generation Laptop | Dell Pro Max 16 Plus Ultra 9 285HX, RTX PRO 5000 Blackwell Generation Laptop | HP ZBook Fury 16 G11 i9-14900HX, RTX 3500 Ada Generation Laptop | Lenovo ThinkPad T16g Gen 3 RTX 5080 Ultra 9 275HX, GeForce RTX 5080 Laptop | Lenovo ThinkPad P1 Gen 8 Ultra 7 255H, RTX PRO 2000 Blackwell Generation Laptop | |
|---|---|---|---|---|---|---|
| Noise | 1% | -6% | 5% | -1% | 14% | |
| desligado / ambiente * (dB) | 23.6 | 23.5 -0% | 23.2 2% | 23.2 2% | 24.7 -5% | 23.1 2% |
| Idle Minimum * (dB) | 23.6 | 23.5 -0% | 26.7 -13% | 23.2 2% | 24.7 -5% | 23.1 2% |
| Idle Average * (dB) | 27.2 | 29.2 -7% | 30.5 -12% | 23.2 15% | 28.9 -6% | 23.1 15% |
| Idle Maximum * (dB) | 27.2 | 29.5 -8% | 34 -25% | 29.5 -8% | 28.9 -6% | 23.1 15% |
| Load Average * (dB) | 42.7 | 32.7 23% | 39.8 7% | 43 -1% | 30.4 29% | 27.3 36% |
| Cyberpunk 2077 ultra * (dB) | 53.9 | 54.3 -1% | 48.2 11% | 57.7 -7% | ||
| Load Maximum * (dB) | 53.9 | 56.6 -5% | 54.3 -1% | 48.2 11% | 57.7 -7% | 47.9 11% |
| Witcher 3 ultra * (dB) | 50.6 |
* ... menor é melhor
Temperatura
Como o ThinkPad P16 Gen 3 é mais compacto do que seu antecessor, não nos surpreende que ele também esquente um pouco mais. O máximo geral é de 50,8 graus Celsius ou 123 F, com o apoio para as mãos também ficando um pouco quente ao toque.
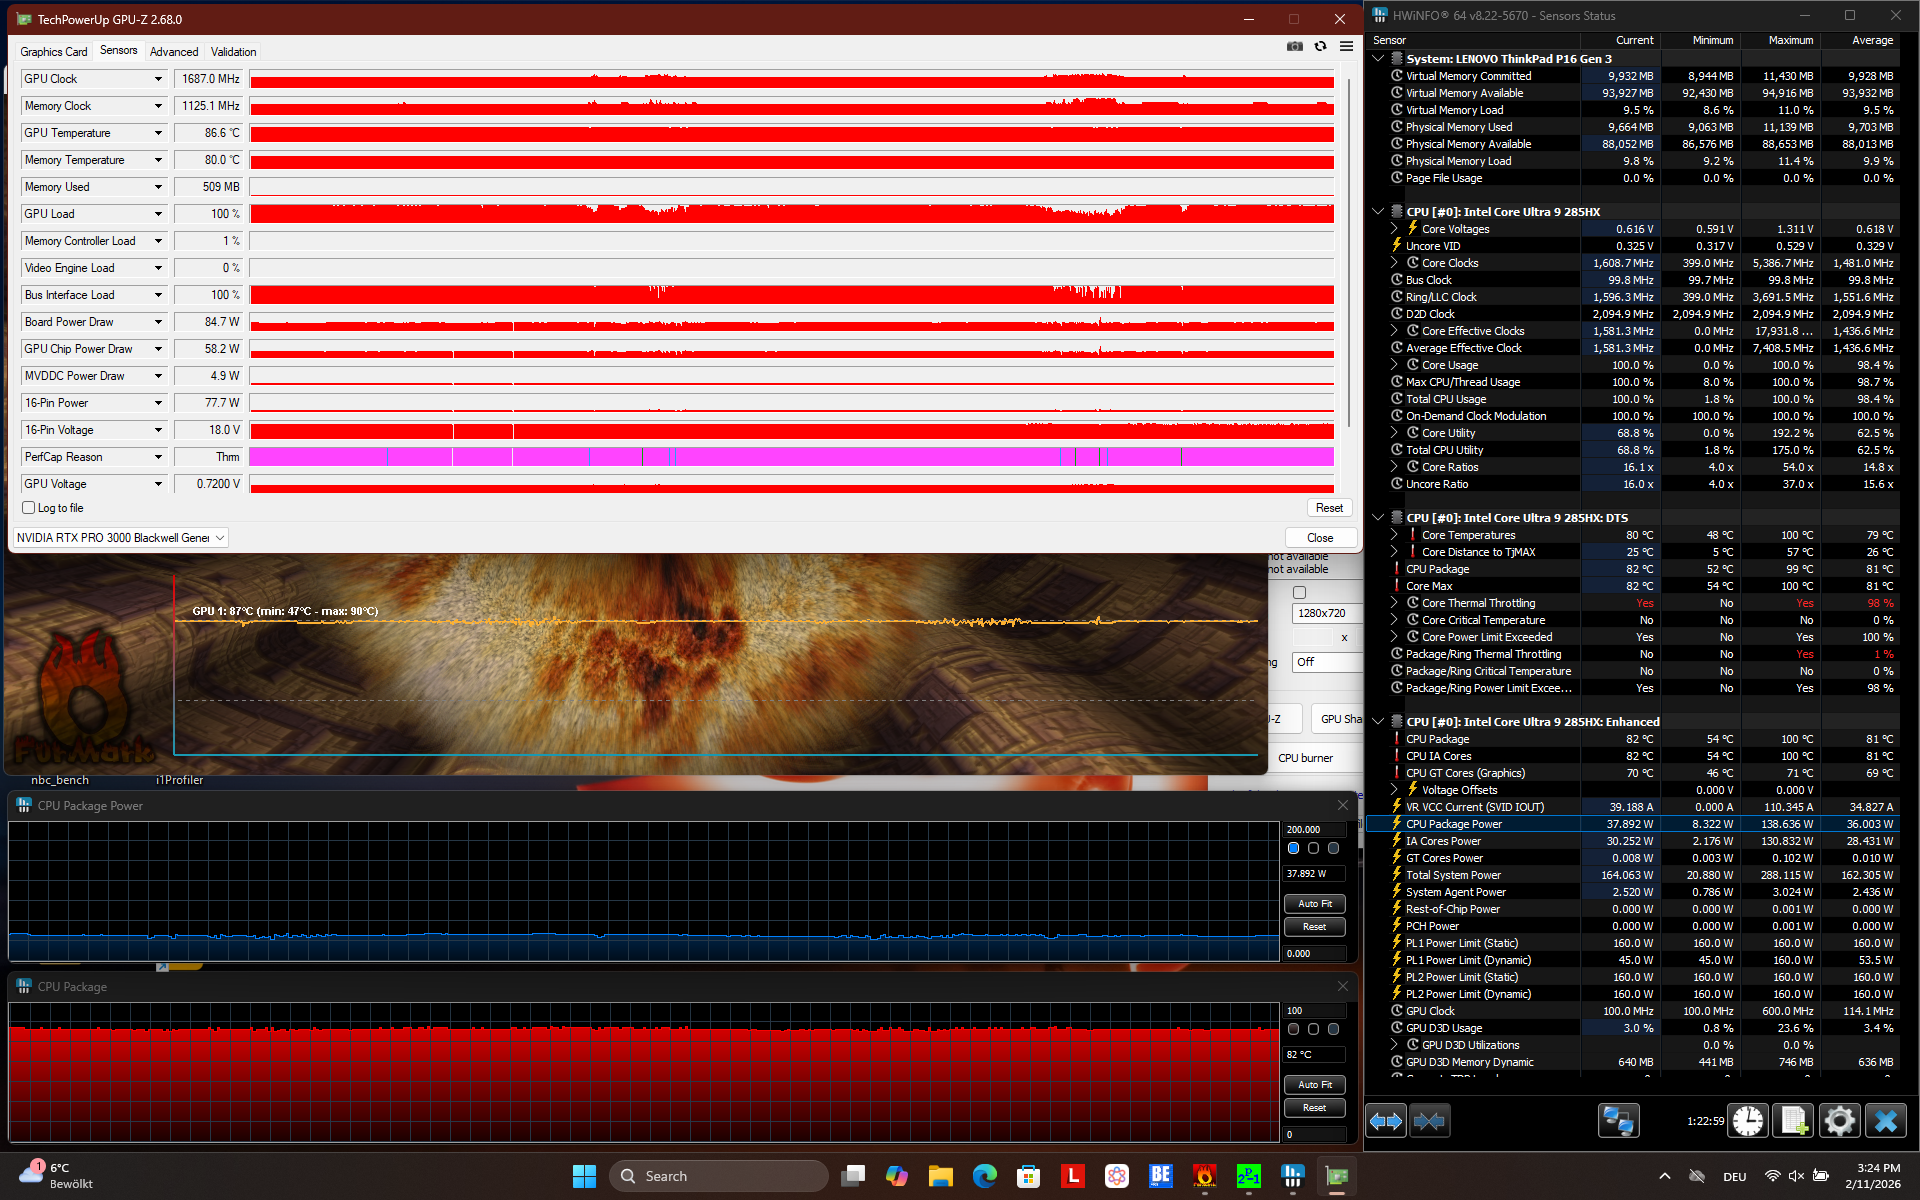
Nem a GPU nem a CPU conseguem manter o consumo máximo de energia sob carga combinada. A CPU é limitada a 37 W e a GPU a 85 W.
(-) A temperatura máxima no lado superior é 50.8 °C / 123 F, em comparação com a média de 38.2 °C / 101 F , variando de 22.2 a 69.8 °C para a classe Workstation.
(-) A parte inferior aquece até um máximo de 48 °C / 118 F, em comparação com a média de 41.1 °C / 106 F
(+) Em uso inativo, a temperatura média para o lado superior é 26.9 °C / 80 F, em comparação com a média do dispositivo de 32 °C / ### class_avg_f### F.
(±) 3: The average temperature for the upper side is 35 °C / 95 F, compared to the average of 32 °C / 90 F for the class Workstation.
(+) Os apoios para as mãos e o touchpad estão atingindo a temperatura máxima da pele (32.4 °C / 90.3 F) e, portanto, não estão quentes.
(-) A temperatura média da área do apoio para as mãos de dispositivos semelhantes foi 27.8 °C / 82 F (-4.6 °C / -8.3 F).
| Lenovo ThinkPad P16 Gen 3 Ultra 9 285HX, RTX PRO 3000 Blackwell Generation Laptop | Lenovo ThinkPad P16 G2 21FA000FGE i7-13700HX, RTX 2000 Ada Generation Laptop | Dell Pro Max 16 Plus Ultra 9 285HX, RTX PRO 5000 Blackwell Generation Laptop | HP ZBook Fury 16 G11 i9-14900HX, RTX 3500 Ada Generation Laptop | Lenovo ThinkPad T16g Gen 3 RTX 5080 Ultra 9 275HX, GeForce RTX 5080 Laptop | Lenovo ThinkPad P1 Gen 8 Ultra 7 255H, RTX PRO 2000 Blackwell Generation Laptop | |
|---|---|---|---|---|---|---|
| Heat | 10% | -1% | -10% | 6% | 6% | |
| Maximum Upper Side * (°C) | 50.8 | 47.2 7% | 40.4 20% | 42.2 17% | 43.9 14% | 45 11% |
| Maximum Bottom * (°C) | 48 | 39.5 18% | 45.6 5% | 48 -0% | 45.4 5% | 33 31% |
| Idle Upper Side * (°C) | 30.1 | 28.1 7% | 32.8 -9% | 37 -23% | 27.7 8% | 30.6 -2% |
| Idle Bottom * (°C) | 27.5 | 25.3 8% | 33 -20% | 36.8 -34% | 28.6 -4% | 31.6 -15% |
* ... menor é melhor
Alto-falantes
Apesar de seu tamanho minúsculo, os alto-falantes do P16 G3, localizados na lateral do dispositivo, têm bom desempenho - são altos e até mesmo fornecem os mesmos graves, o que os torna adequados para ouvir música.
Lenovo ThinkPad P16 Gen 3 análise de áudio
(+) | os alto-falantes podem tocar relativamente alto (###valor### dB)
Graves 100 - 315Hz
(±) | graves reduzidos - em média 9.9% menor que a mediana
(±) | a linearidade dos graves é média (13% delta para a frequência anterior)
Médios 400 - 2.000 Hz
(+) | médios equilibrados - apenas 4% longe da mediana
(+) | médios são lineares (4% delta para frequência anterior)
Altos 2 - 16 kHz
(+) | agudos equilibrados - apenas 2.2% longe da mediana
(+) | os máximos são lineares (4.8% delta da frequência anterior)
Geral 100 - 16.000 Hz
(+) | o som geral é linear (10% diferença em relação à mediana)
Comparado com a mesma classe
» 6% de todos os dispositivos testados nesta classe foram melhores, 3% semelhantes, 91% piores
» O melhor teve um delta de 7%, a média foi 17%, o pior foi 35%
Comparado com todos os dispositivos testados
» 4% de todos os dispositivos testados foram melhores, 1% semelhantes, 94% piores
» O melhor teve um delta de 4%, a média foi 23%, o pior foi 134%
Lenovo ThinkPad P1 Gen 8 análise de áudio
(+) | os alto-falantes podem tocar relativamente alto (###valor### dB)
Graves 100 - 315Hz
(±) | graves reduzidos - em média 9.8% menor que a mediana
(±) | a linearidade dos graves é média (11.2% delta para a frequência anterior)
Médios 400 - 2.000 Hz
(+) | médios equilibrados - apenas 2.9% longe da mediana
(+) | médios são lineares (2.8% delta para frequência anterior)
Altos 2 - 16 kHz
(+) | agudos equilibrados - apenas 3% longe da mediana
(+) | os máximos são lineares (4.7% delta da frequência anterior)
Geral 100 - 16.000 Hz
(+) | o som geral é linear (8.3% diferença em relação à mediana)
Comparado com a mesma classe
» 1% de todos os dispositivos testados nesta classe foram melhores, 1% semelhantes, 97% piores
» O melhor teve um delta de 7%, a média foi 17%, o pior foi 35%
Comparado com todos os dispositivos testados
» 2% de todos os dispositivos testados foram melhores, 1% semelhantes, 97% piores
» O melhor teve um delta de 4%, a média foi 23%, o pior foi 134%
Gerenciamento de energia
Consumo de energia
O consumo de energia é menor em comparação com o ThinkPad P16 anterior. O consumo de energia sob carga excedeu 180 W, indicando que o dispositivo pode esgotar sua bateria, mesmo quando conectado a um carregador.
| desligado | |
| Ocioso | |
| Carga |
|
Key:
min: | |
| Lenovo ThinkPad P16 Gen 3 Ultra 9 285HX, RTX PRO 3000 Blackwell Generation Laptop, Samsung PM9E1 MZVLC2T0HBLD, IPS LED, 1920x1200, 16" | Lenovo ThinkPad P16 G2 21FA000FGE i7-13700HX, RTX 2000 Ada Generation Laptop, SK hynix PC801 HFS001TEJ9X162N, IPS LED, 2560x1600, 16" | Dell Pro Max 16 Plus Ultra 9 285HX, RTX PRO 5000 Blackwell Generation Laptop, SK hynix PCB01 HFS001TFM9X186N, OLED, 3840x2400, 16" | HP ZBook Fury 16 G11 i9-14900HX, RTX 3500 Ada Generation Laptop, SK hynix PC801 HFS001TEJ9X101N, IPS, 3840x2400, 16" | Lenovo ThinkPad T16g Gen 3 RTX 5080 Ultra 9 275HX, GeForce RTX 5080 Laptop, Samsung PM9E1 MZVLC2T0HBLD, OLED, 3200x2000, 16" | Lenovo ThinkPad P1 Gen 8 Ultra 7 255H, RTX PRO 2000 Blackwell Generation Laptop, Samsung PM9E1 1 TB MZVLC1T0HFLU, Tandem OLED, 3200x2000, 16" | Média NVIDIA RTX PRO 3000 Blackwell Generation Laptop | Média da turma Workstation | |
|---|---|---|---|---|---|---|---|---|
| Power Consumption | -7% | -135% | -15% | -12% | -10% | 0% | -3% | |
| Idle Minimum * (Watt) | 7.8 | 9.3 -19% | 35.1 -350% | 8.6 -10% | 9.9 -27% | 15.4 -97% | 7.8 ? -0% | 9.11 ? -17% |
| Idle Average * (Watt) | 12.6 | 14.1 -12% | 39.2 -211% | 14.8 -17% | 17.1 -36% | 16.5 -31% | 12.6 ? -0% | 13.8 ? -10% |
| Idle Maximum * (Watt) | 16.5 | 15.5 6% | 56 -239% | 15.7 5% | 17.7 -7% | 23.1 -40% | 16.5 ? -0% | 17.9 ? -8% |
| Load Average * (Watt) | 118.7 | 133.6 -13% | 130.2 -10% | 129.4 -9% | 125.6 -6% | 86.6 27% | 118.7 ? -0% | 96 ? 19% |
| Cyberpunk 2077 ultra external monitor * (Watt) | 161.3 | 213 -32% | 192.6 -19% | 166.8 -3% | 121.8 24% | |||
| Cyberpunk 2077 ultra * (Watt) | 159.6 | 229 -43% | 199.4 -25% | 160.5 -1% | 123.1 23% | |||
| Load Maximum * (Watt) | 181.4 | 179.6 1% | 285.2 -57% | 236.1 -30% | 182.8 -1% | 143.6 21% | 181.4 ? -0% | 180.3 ? 1% |
| Witcher 3 ultra * (Watt) | 144.9 |
* ... menor é melhor
Consumo de energia Cyberpunk / Teste de estresse
Consumo de energia do monitor externo
Duração da bateria
Com uma grande bateria de 99 Wh e uma tela WUXGA eficiente em termos de energia, o ThinkPad P16 Gen 3 se sai bem em nossos testes de bateria: 11.6 horas no teste de navegação na Web com Wi-Fi (150 cd/m²) são melhores do que todas as outras estações de trabalho na comparação.
| Lenovo ThinkPad P16 Gen 3 Ultra 9 285HX, RTX PRO 3000 Blackwell Generation Laptop, 99 Wh | Lenovo ThinkPad P16 G2 21FA000FGE i7-13700HX, RTX 2000 Ada Generation Laptop, 94 Wh | Dell Pro Max 16 Plus Ultra 9 285HX, RTX PRO 5000 Blackwell Generation Laptop, 96 Wh | HP ZBook Fury 16 G11 i9-14900HX, RTX 3500 Ada Generation Laptop, 95 Wh | Lenovo ThinkPad T16g Gen 3 RTX 5080 Ultra 9 275HX, GeForce RTX 5080 Laptop, 99.9 Wh | Lenovo ThinkPad P1 Gen 8 Ultra 7 255H, RTX PRO 2000 Blackwell Generation Laptop, 90 Wh | Média da turma Workstation | |
|---|---|---|---|---|---|---|---|
| Duração da bateria | -26% | -69% | -42% | -19% | -53% | -23% | |
| WiFi v1.3 (h) | 11.6 | 8.6 -26% | 3.6 -69% | 6.7 -42% | 9.4 -19% | 5.5 -53% | 8.55 ? -26% |
| Load (h) | 1.8 | 1.441 ? -20% |
Classificação do Notebookcheck
O ThinkPad P16 Gen 3 é uma estação de trabalho móvel potente e altamente expansível com excelente qualidade de construção, dispositivos de entrada, opções de portas e uma tela brilhante e fosca, além de boa duração da bateria. Curiosamente, o desempenho é a maior desvantagem, pois poderia ser ainda melhor.
Lenovo ThinkPad P16 Gen 3
- 04/22/2026 v8
Benjamin Herzig
 Total Sustainability Score:
 Concorrentes potenciais em comparação
Imagem | Modelo / Análises | Preço | Peso | Altura | Tela |
|---|---|---|---|---|---|
1. 89%  | Lenovo ThinkPad P16 Gen 3 Intel Core Ultra 9 285HX ⎘ NVIDIA RTX PRO 3000 Blackwell Generation Laptop ⎘ 96 GB Memória, 2048 GB SSD | Amazon: Preço de tabela: 4000 Euro | 2.7 kg | 30 mm | 16.00" 1920x1200 142 PPI IPS LED |
2. 90.2% v7 (old)  | Lenovo ThinkPad P16 G2 21FA000FGE Intel Core i7-13700HX ⎘ NVIDIA RTX 2000 Ada Generation Laptop ⎘ 32 GB Memória, 1024 GB SSD | Amazon: Preço de tabela: 2750 Euro | 3 kg | 30.23 mm | 16.00" 2560x1600 189 PPI IPS LED |
3. 88.4%  | Dell Pro Max 16 Plus Intel Core Ultra 9 285HX ⎘ NVIDIA RTX PRO 5000 Blackwell Generation Laptop ⎘ 128 GB Memória, SSD | Amazon: Preço de tabela: 5000 USD | 2.8 kg | 30.9 mm | 16.00" 3840x2400 283 PPI OLED |
4. 85.9%  | HP ZBook Fury 16 G11 Intel Core i9-14900HX ⎘ NVIDIA RTX 3500 Ada Generation Laptop ⎘ 64 GB Memória, 1024 GB SSD | Amazon: Preço de tabela: 3300 USD | 2.6 kg | 28.5 mm | 16.00" 3840x2400 283 PPI IPS |
5. 87.3%  | Lenovo ThinkPad T16g Gen 3 RTX 5080 Intel Core Ultra 9 275HX ⎘ NVIDIA GeForce RTX 5080 Laptop ⎘ 64 GB Memória, 2048 GB SSD | Amazon: 1. $3,599.99 Lenovo ThinkPad P16 Gen 3 La... 2. $5,699.00 Lenovo ThinkPad P16 Gen 3 In... 3. $1,599.99 Lenovo ThinkPad E16 Gen 3 Bu... Preço de tabela: 4800€ | 2.6 kg | 29.8 mm | 16.00" 3200x2000 236 PPI OLED |
6. 91.6%  | Lenovo ThinkPad P1 Gen 8 Intel Core Ultra 7 255H ⎘ NVIDIA RTX PRO 2000 Blackwell Generation Laptop ⎘ 32 GB Memória, 1024 GB SSD | Amazon: Preço de tabela: 2000 USD | 1.9 kg | 20.6 mm | 16.00" 3200x2000 236 PPI Tandem OLED |
Transparência
A seleção dos dispositivos a serem analisados é feita pela nossa equipe editorial. A amostra de teste foi fornecida ao autor como empréstimo pelo fabricante ou varejista para fins desta revisão. O credor não teve influência nesta revisão, nem o fabricante recebeu uma cópia desta revisão antes da publicação. Não houve obrigação de publicar esta revisão. Como empresa de mídia independente, a Notebookcheck não está sujeita à autoridade de fabricantes, varejistas ou editores.
É assim que o Notebookcheck está testando
Todos os anos, o Notebookcheck analisa de forma independente centenas de laptops e smartphones usando procedimentos padronizados para garantir que todos os resultados sejam comparáveis. Desenvolvemos continuamente nossos métodos de teste há cerca de 20 anos e definimos padrões da indústria no processo. Em nossos laboratórios de teste, equipamentos de medição de alta qualidade são utilizados por técnicos e editores experientes. Esses testes envolvem um processo de validação em vários estágios. Nosso complexo sistema de classificação é baseado em centenas de medições e benchmarks bem fundamentados, o que mantém a objetividade.
