Veredicto - Elevação dos padrões
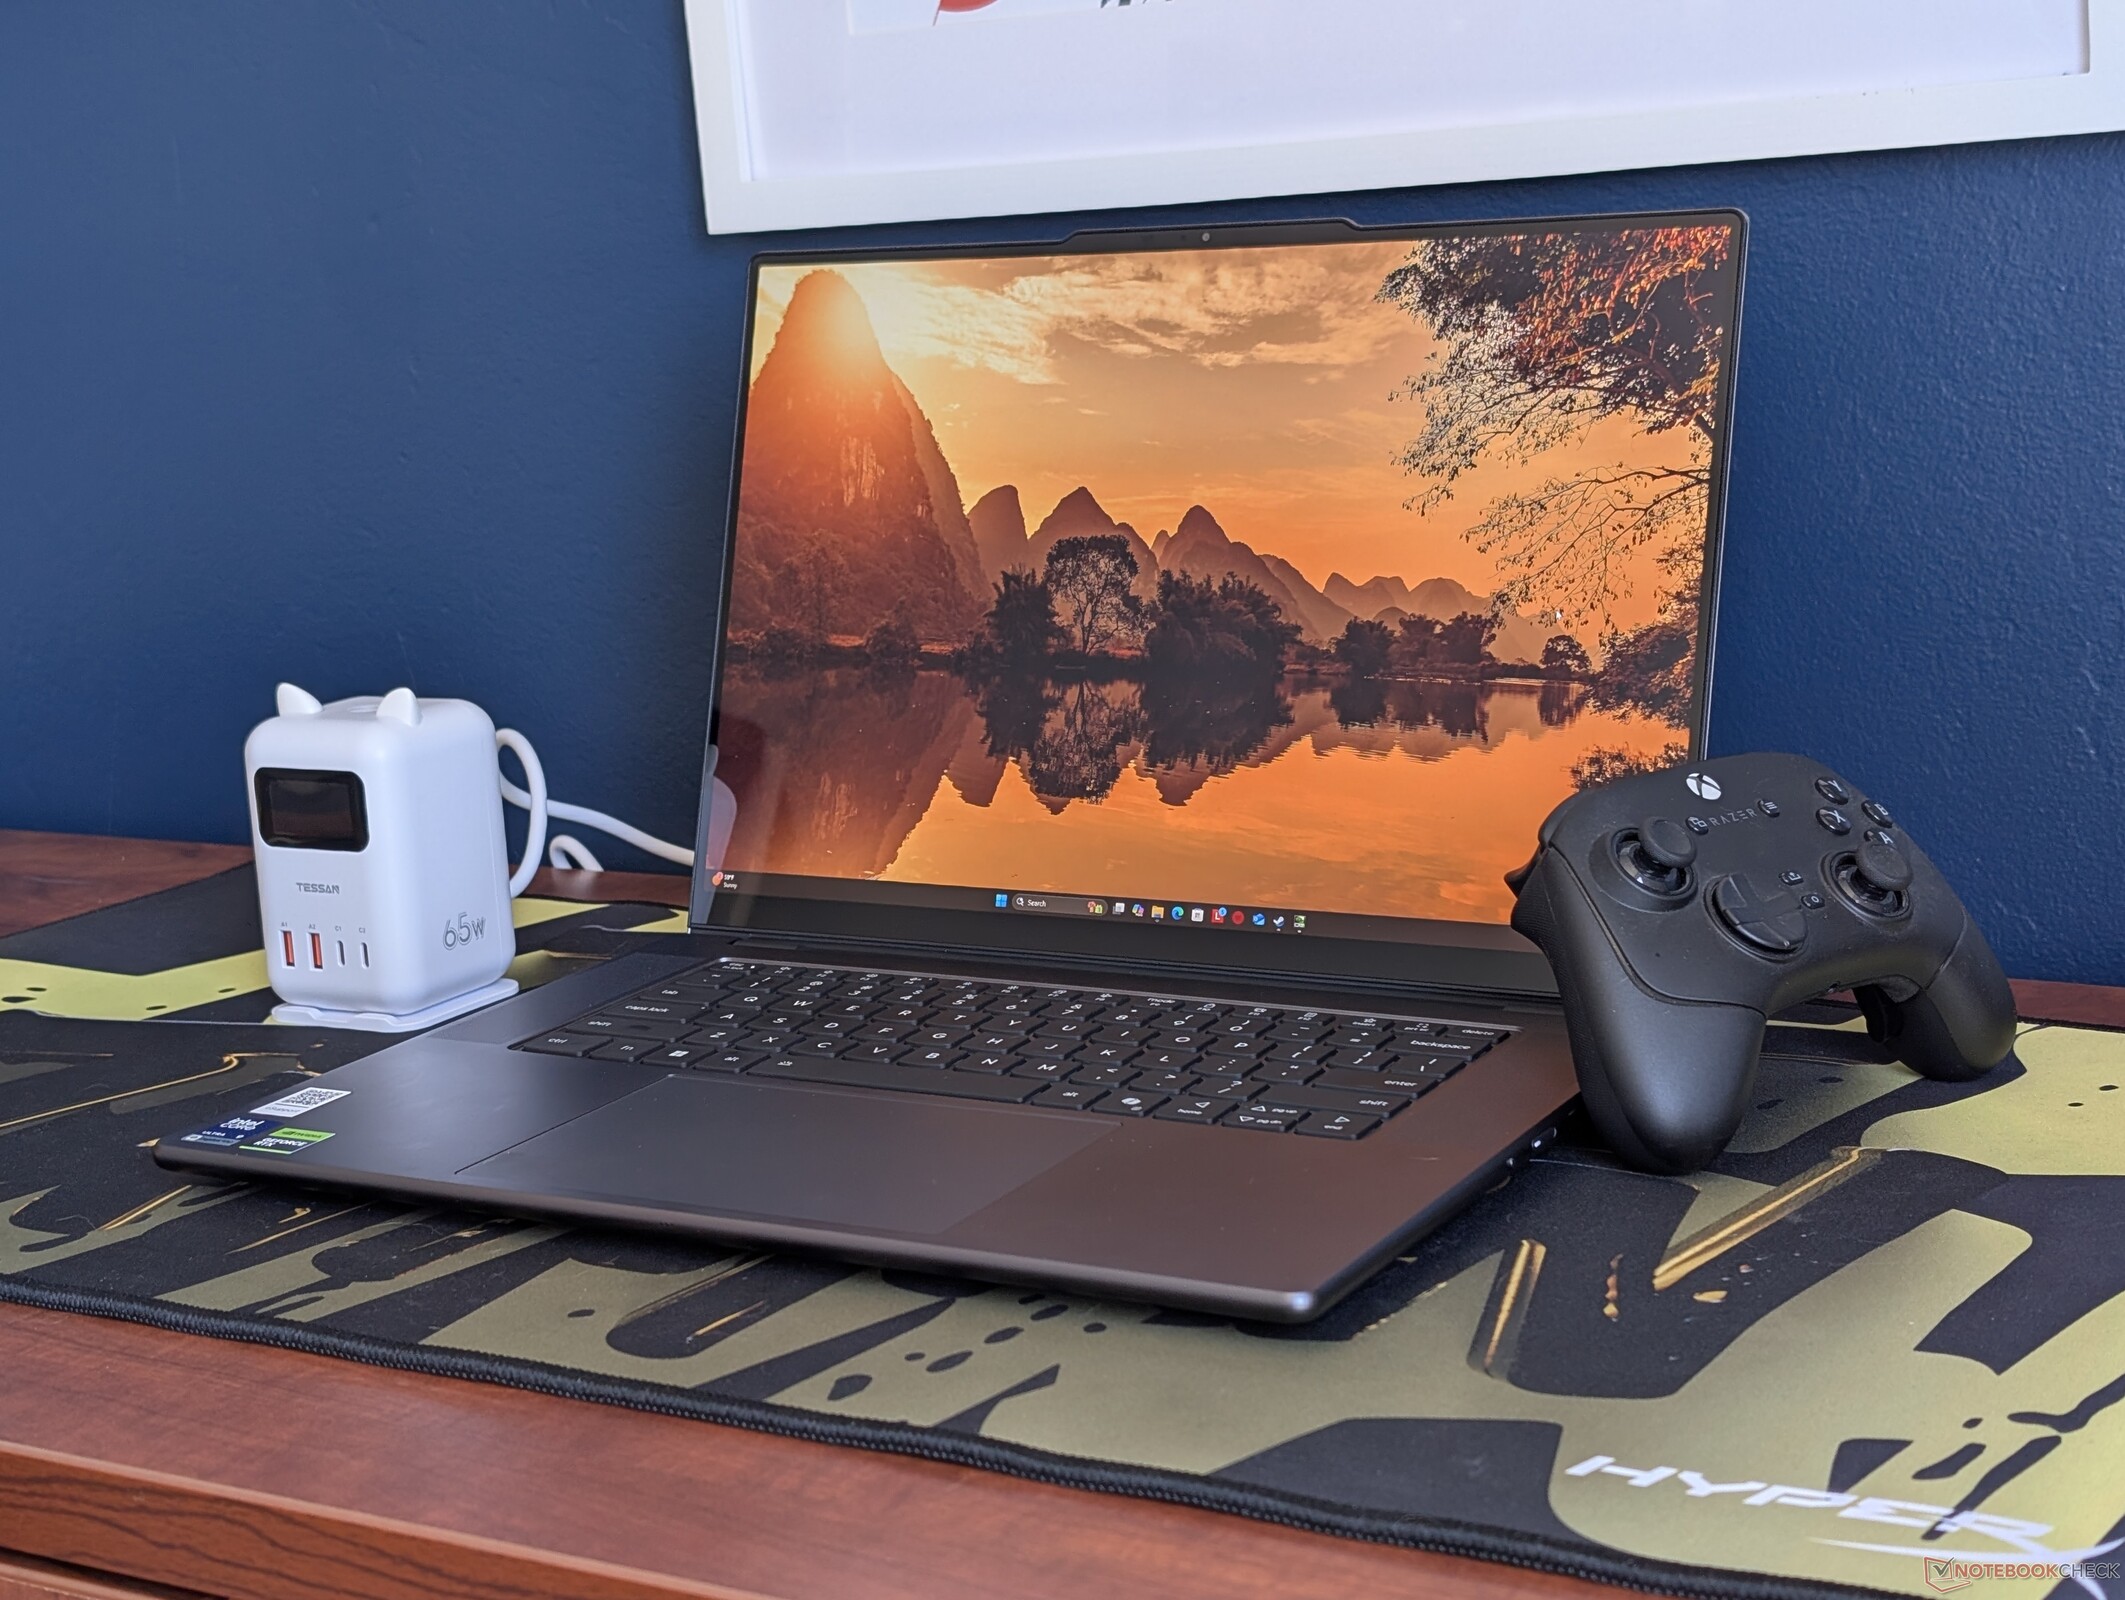
Ao contrário de muitos clamshells tradicionais no mercado, o Lenovo Pro 9 16 G11 Aura vem com nada menos que uma CPU Core Ultra 9, GPU GeForce RTX e uma tela sensível ao toque OLED para uma experiência de usuário de primeira linha, independentemente do nível de configuração. Ele oferece uma das telas sensíveis ao toque mais brilhantes em sua classe de tamanho e, aparentemente, preenche todos os requisitos que se pode exigir de uma potência multimídia, incluindo um leitor de cartão integrado, uma seleção saudável de portas, áudio excelente e suporte para vários SSDs internos. Não podemos dizer o mesmo sobre o novo Dell XPS 16 que omitiu alguns desses recursos em sua última reformulação.
Apesar de apreciarmos o fato de o modelo 2026 ser um pouco mais fino e mais leve do que o modelo modelo 2025ele não oferece muitas melhorias de desempenho, pois o novo Core Ultra 9 386H tem quase o mesmo desempenho que o Core Ultra 9 285H do ano passado. As opções de GPU e tela permanecem as mesmas, sem nenhuma melhoria na experiência do usuário. A retirada do teclado numérico em favor de grades de alto-falante maiores também pode afetar determinados cenários de uso que dependem dele.
As desvantagens mais notáveis do modelo são o ruído da ventoinha no modo Desempenho e o peso mais pesado e a duração mais curta da bateria em relação aos concorrentes, apesar da atualização da capacidade da bateria. A inclusão de tantos recursos e portas evidentemente tem suas consequências quando se trata de portabilidade. Os usuários que conseguem sobreviver sem gráficos discretos ou uma tela OLED sofisticada encontrarão o Panther Lake XPS 16 ou o MSI Prestige 16 são alternativas muito mais silenciosas, elegantes e fáceis de transportar. Por outro lado, se o senhor realmente precisa de gráficos discretos, esse Lenovo "faz tudo" ainda é uma das nossas máquinas multimídia de 16 polegadas favoritas há dois anos consecutivos.
Pro
Contra
Preço e disponibilidade
O Lenovo Pro 9 16IPH11 está sendo enviado a partir de US$ 2.800 para a configuração básica RTX 5050 de 1800p até mais de US$ 3.100 para a configuração RTX 5060 de 2000p, conforme analisado.
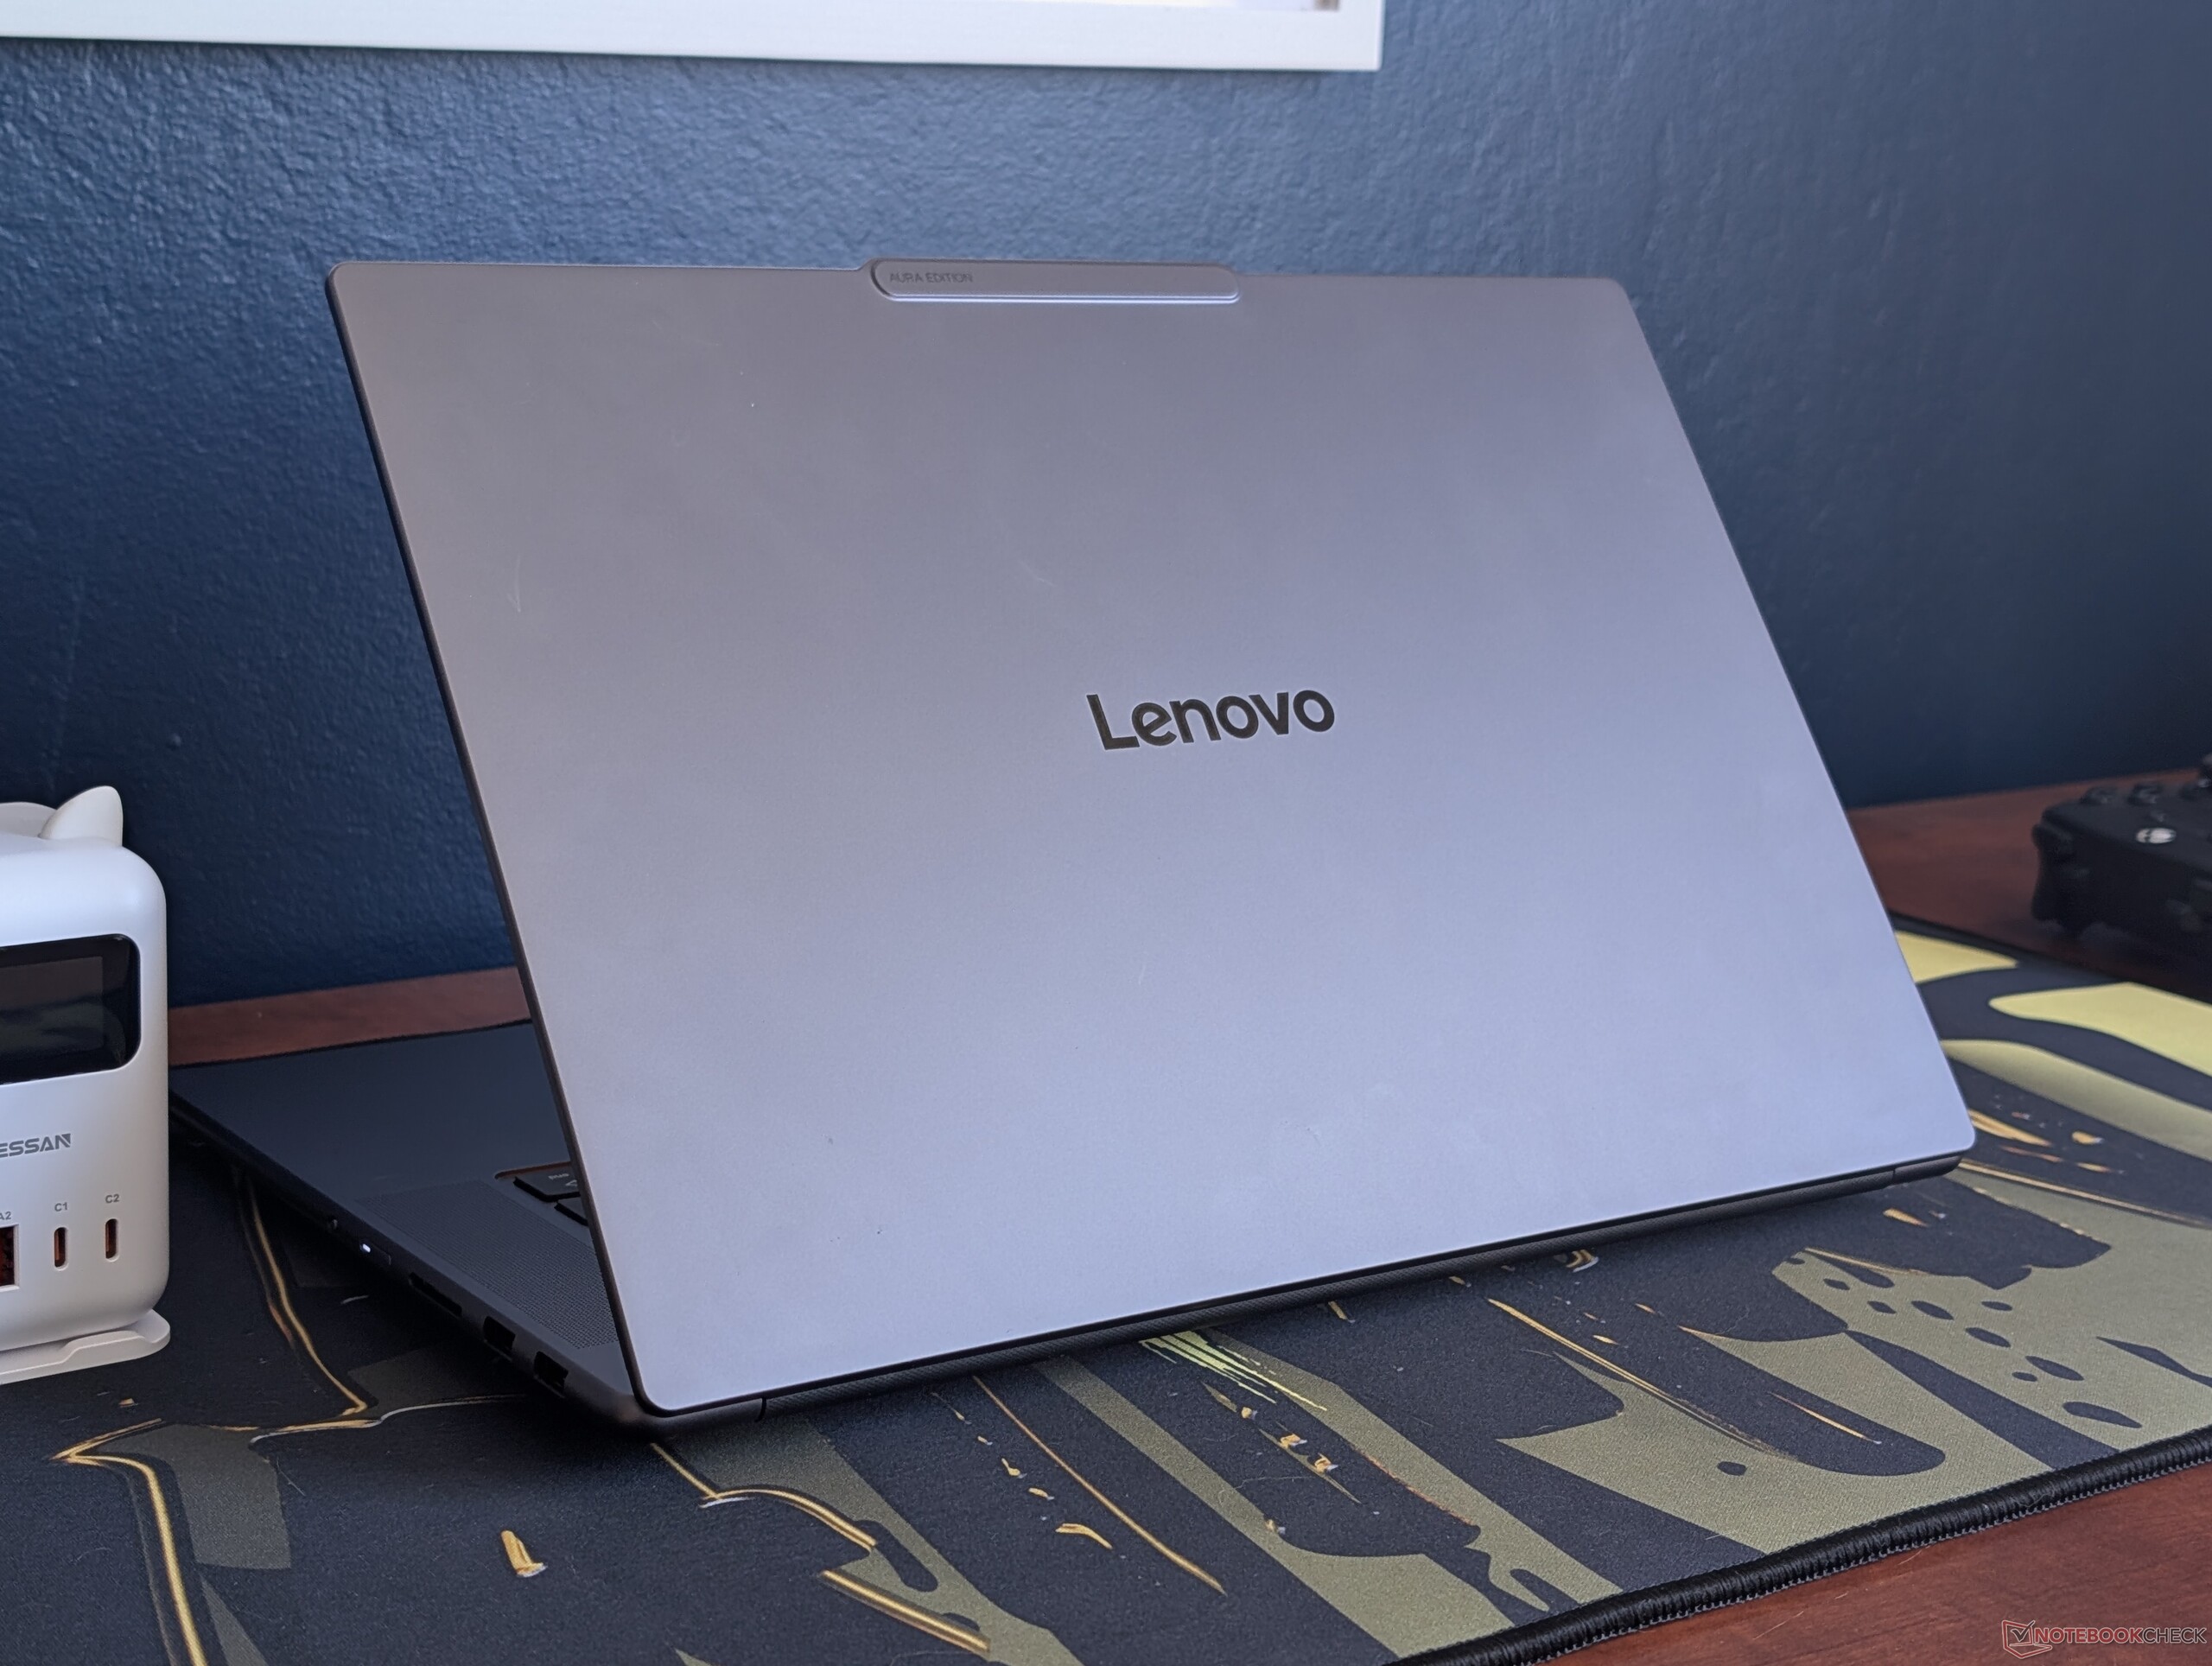
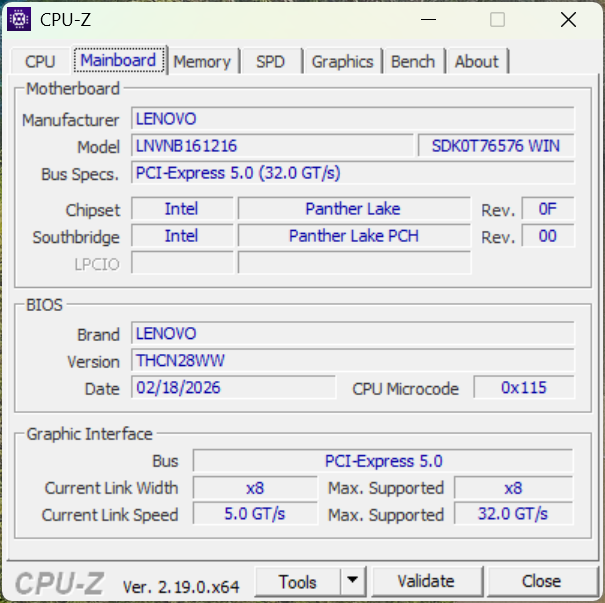
O Lenovo Pro 9 16IPH11 (comercializado como Lenovo Pro 9i Aura Edition 16 G11) sucede diretamente o Yoga Pro 9i 16IAH G10 Aura do ano passado. O fabricante abandonou o nome Yoga e renovou o design externo.
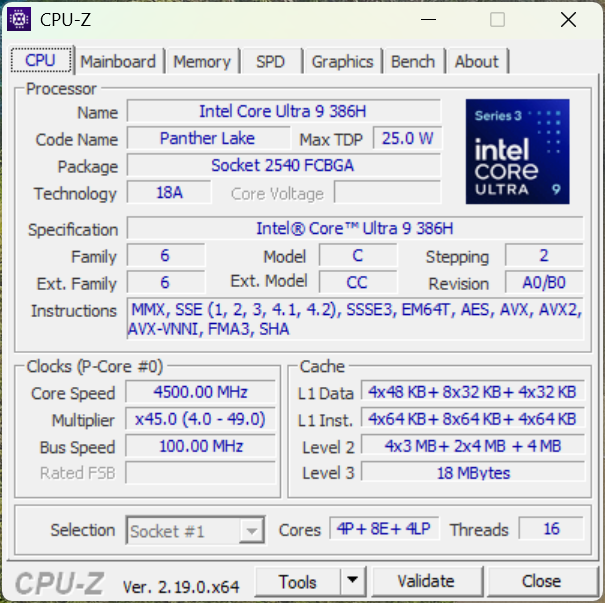
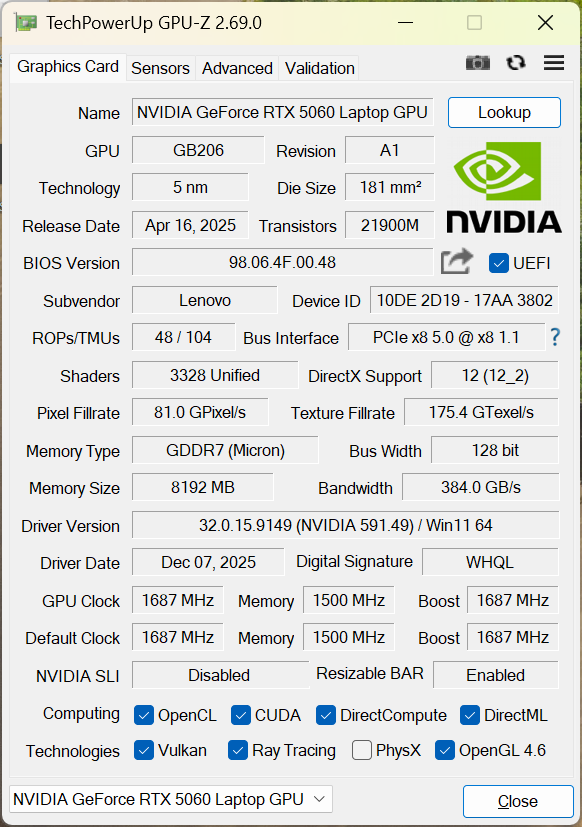
Nossa unidade de teste é a configuração superior equipada com a GPU GeForce RTX 5060 de 100 W e a tela touchscreen OLED Tandem de 3200 x 2000 por aproximadamente US$ 3100. As SKUs mais baratas vêm com a RTX 5050 ou 2880 x 1800 OLED, mas todas as opções vêm com a mesma CPU Core Ultra 9 386H Panther Lake.
Esse modelo principal da Lenovo compete diretamente com outras máquinas multimídia de 16 polegadas de ponta, incluindo o MSI Prestige 16 AI Evo, Asus ZenBook 16 seriese o novo Dell XPS 16.
Mais análises da Lenovo:
Especificações
Caso
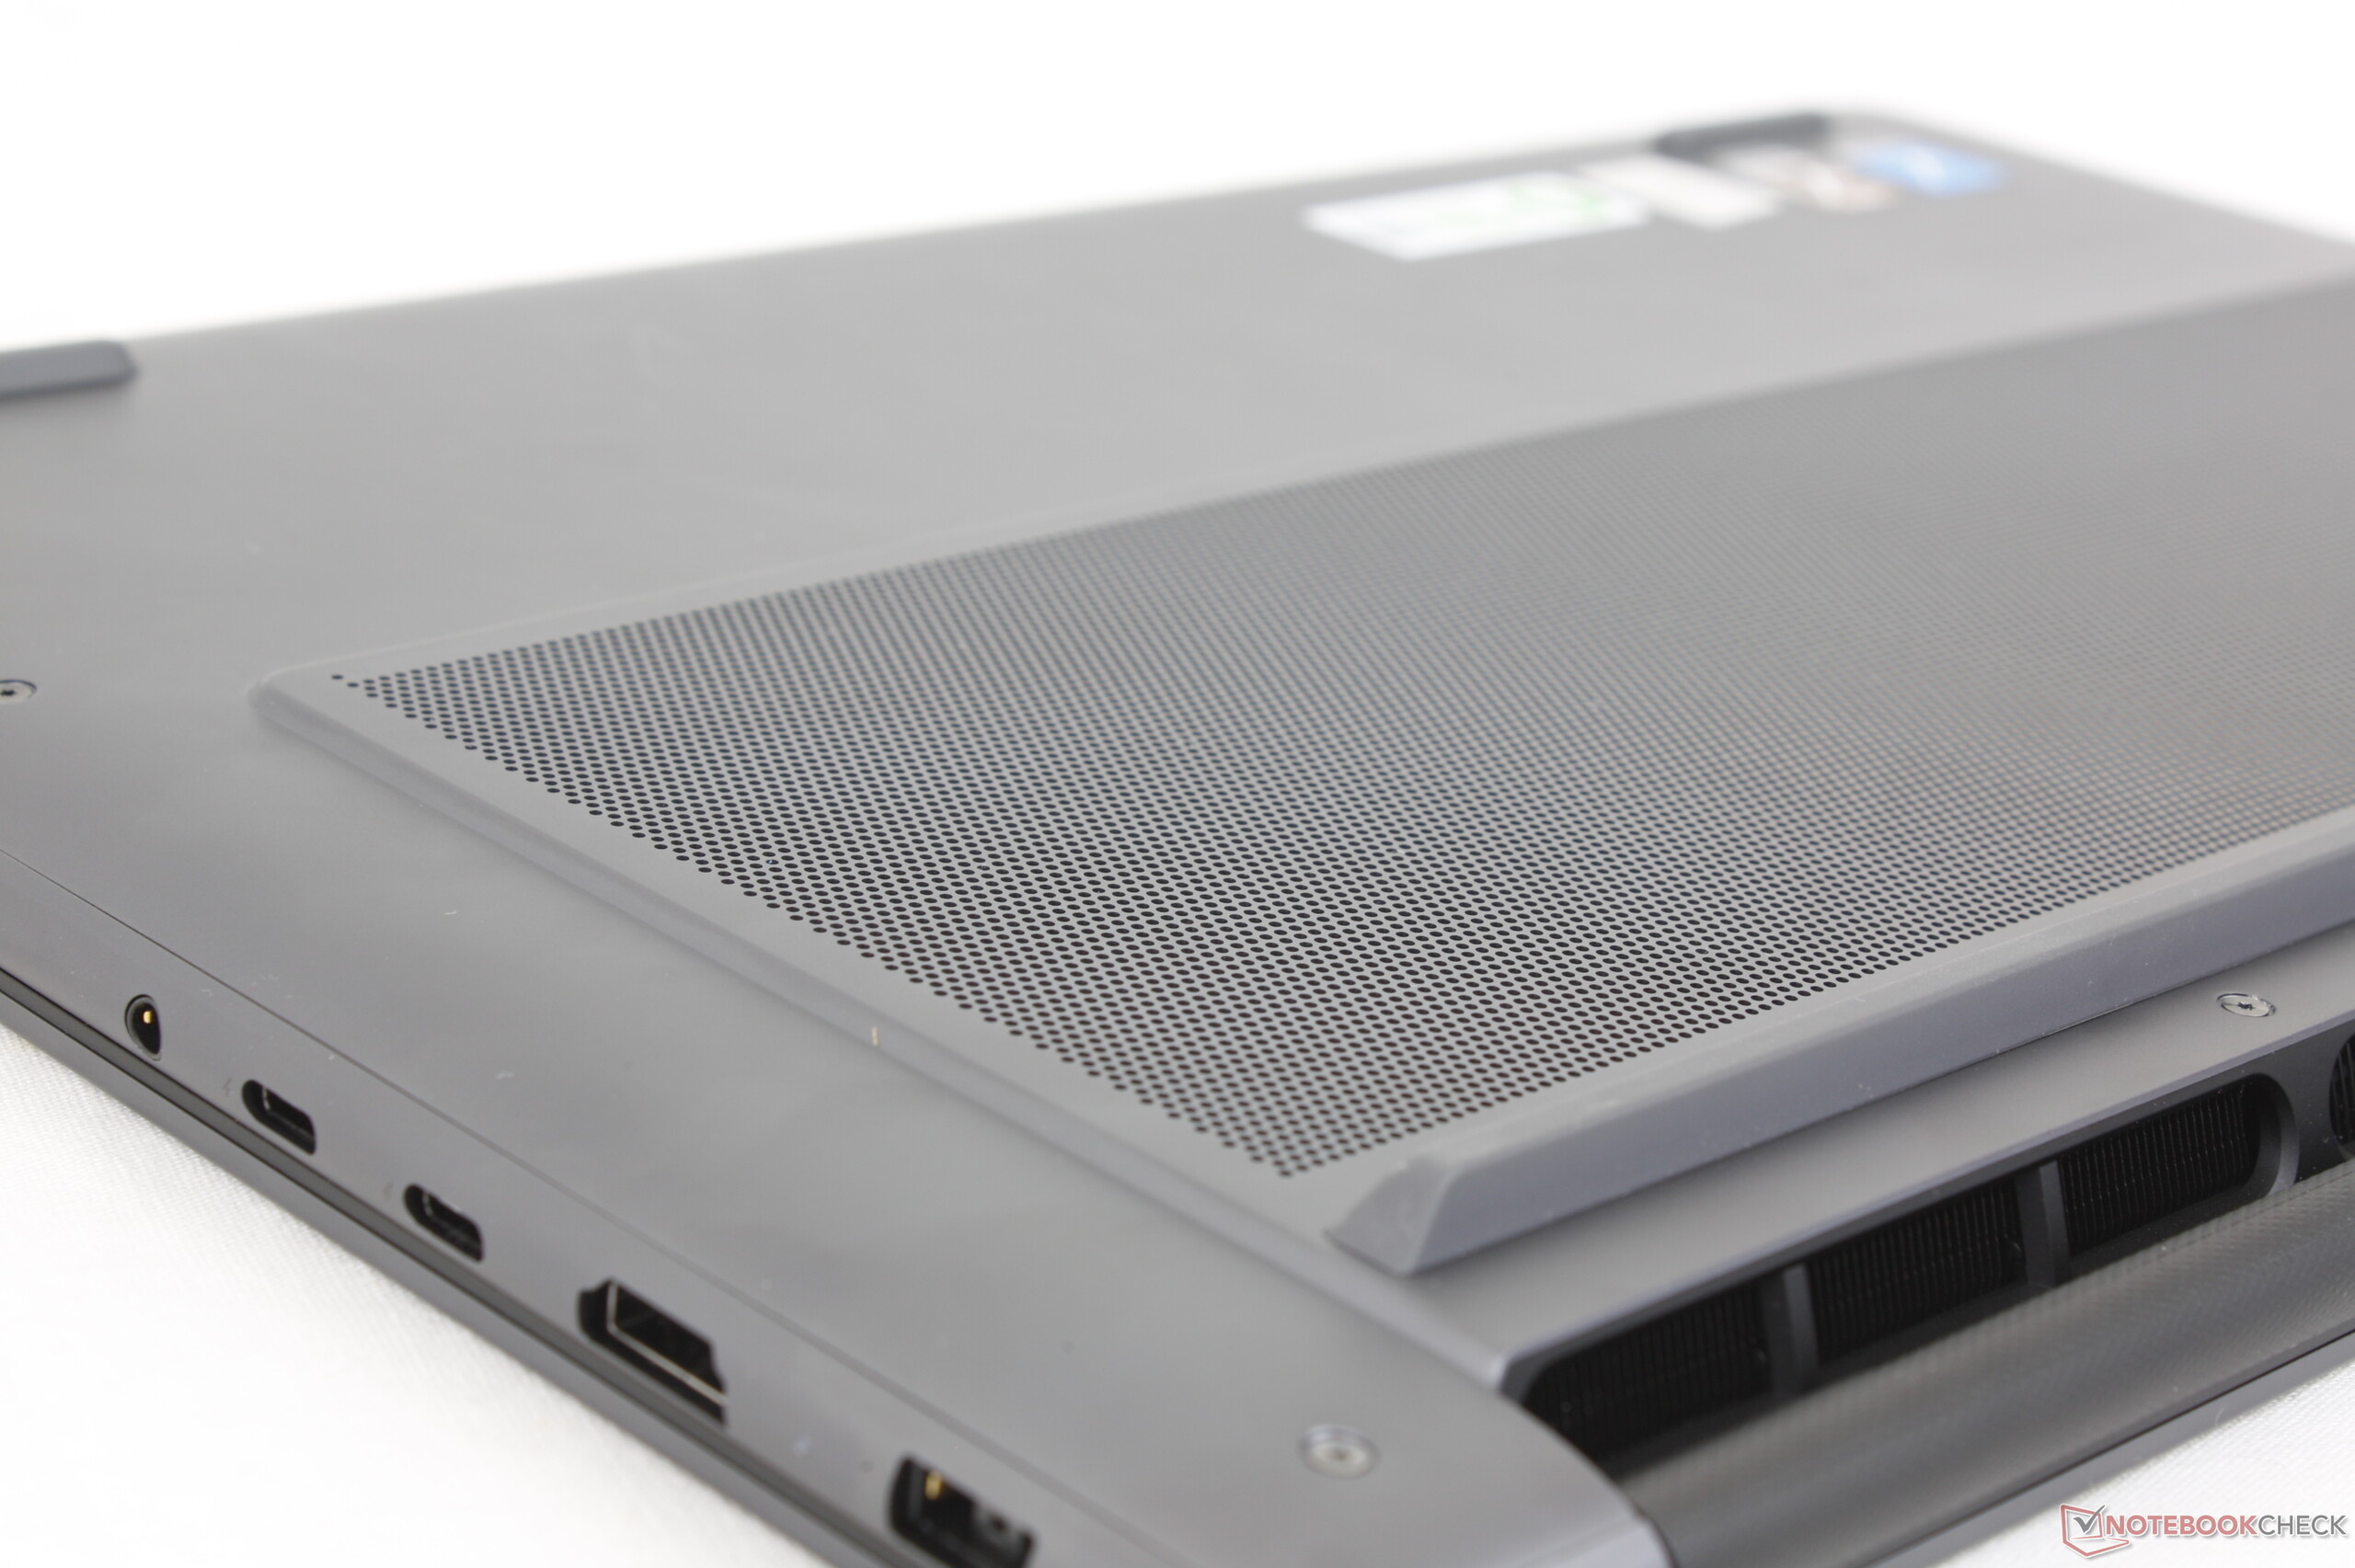
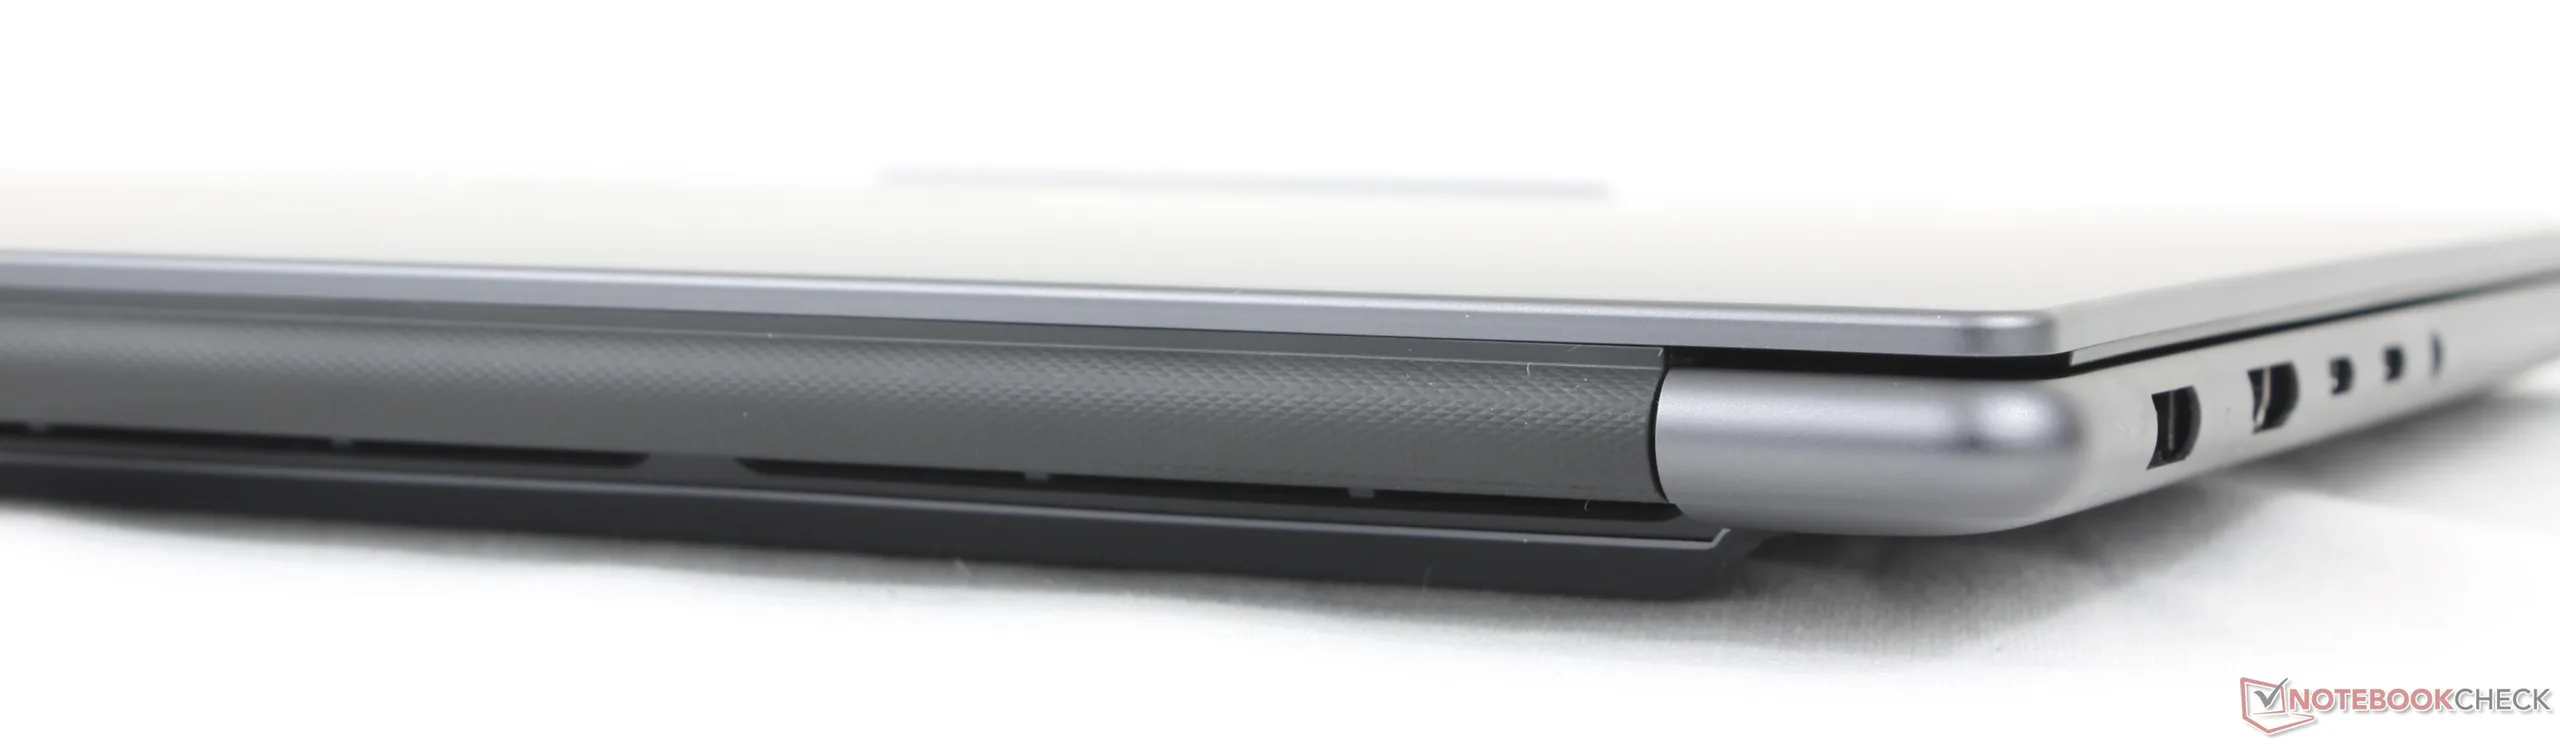
A Lenovo fez várias alterações externas em relação ao design do ano passado. A mais notável é a remoção do teclado numérico em favor de grades de alto-falantes maiores ao longo das laterais do teclado. Além disso, a tampa inferior do D não é mais totalmente plana, pois as grades de ventilação agora estão ligeiramente elevadas. O rótulo "Yoga" gravado a laser, que era tão proeminente no modelo do ano passado, também foi removido, pois a Lenovo quer enfatizar o nome "Pro".
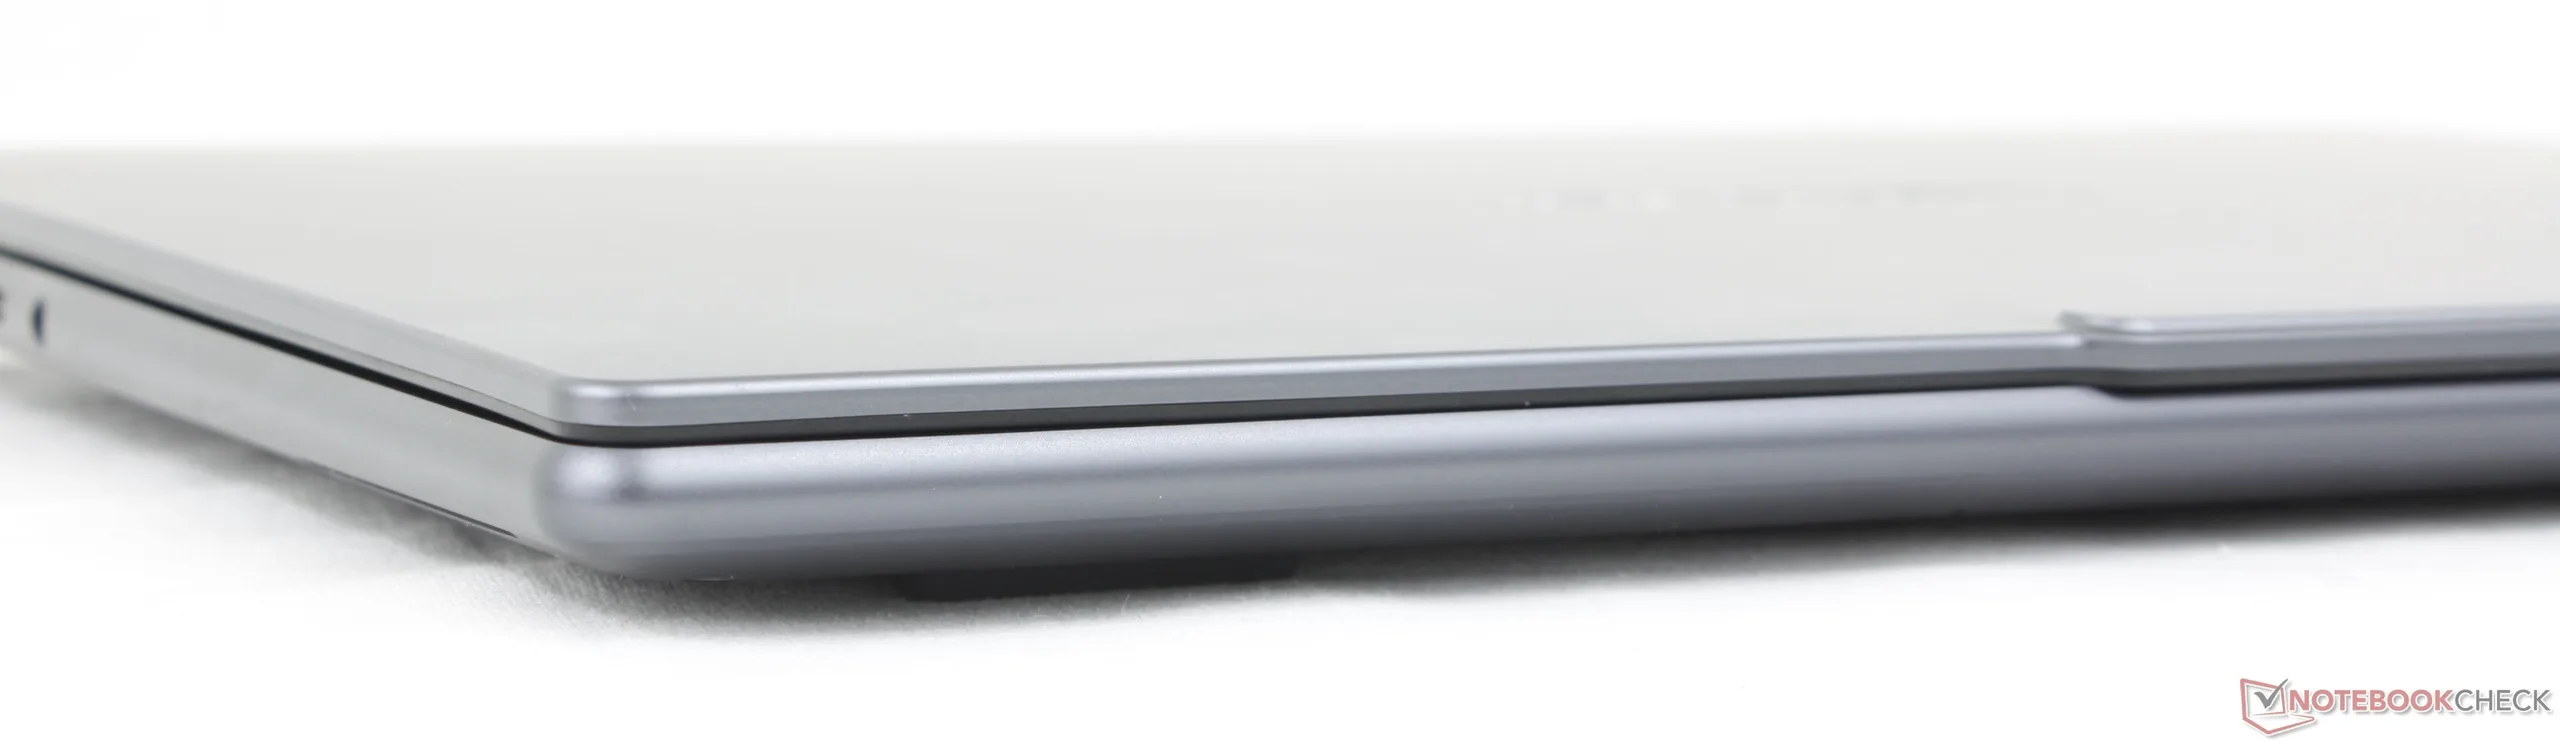
O novo modelo é um pouco mais fino, menor e mais leve do que a geração anterior, mas com os mesmos materiais de alumínio anodizado para um nível semelhante de qualidade.
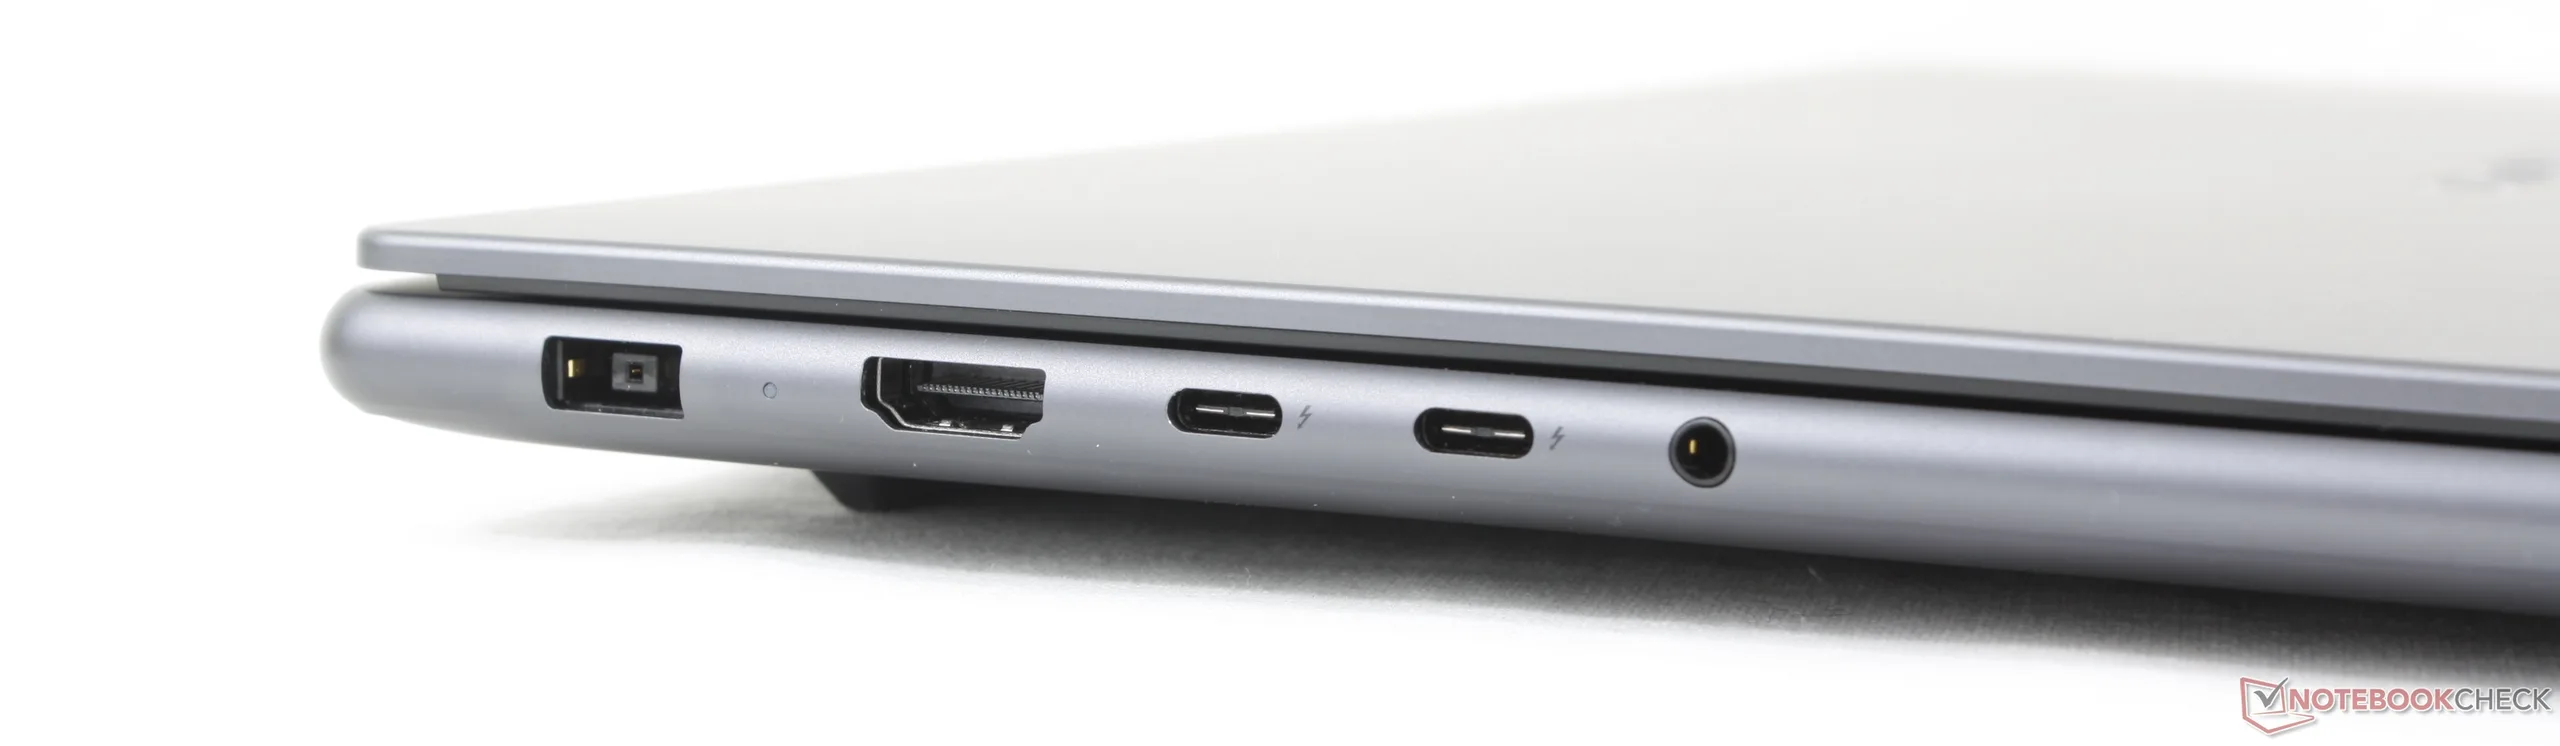
Conectividade
Apesar de todas as mudanças físicas mencionadas acima, as portas permanecem as mesmas de antes.
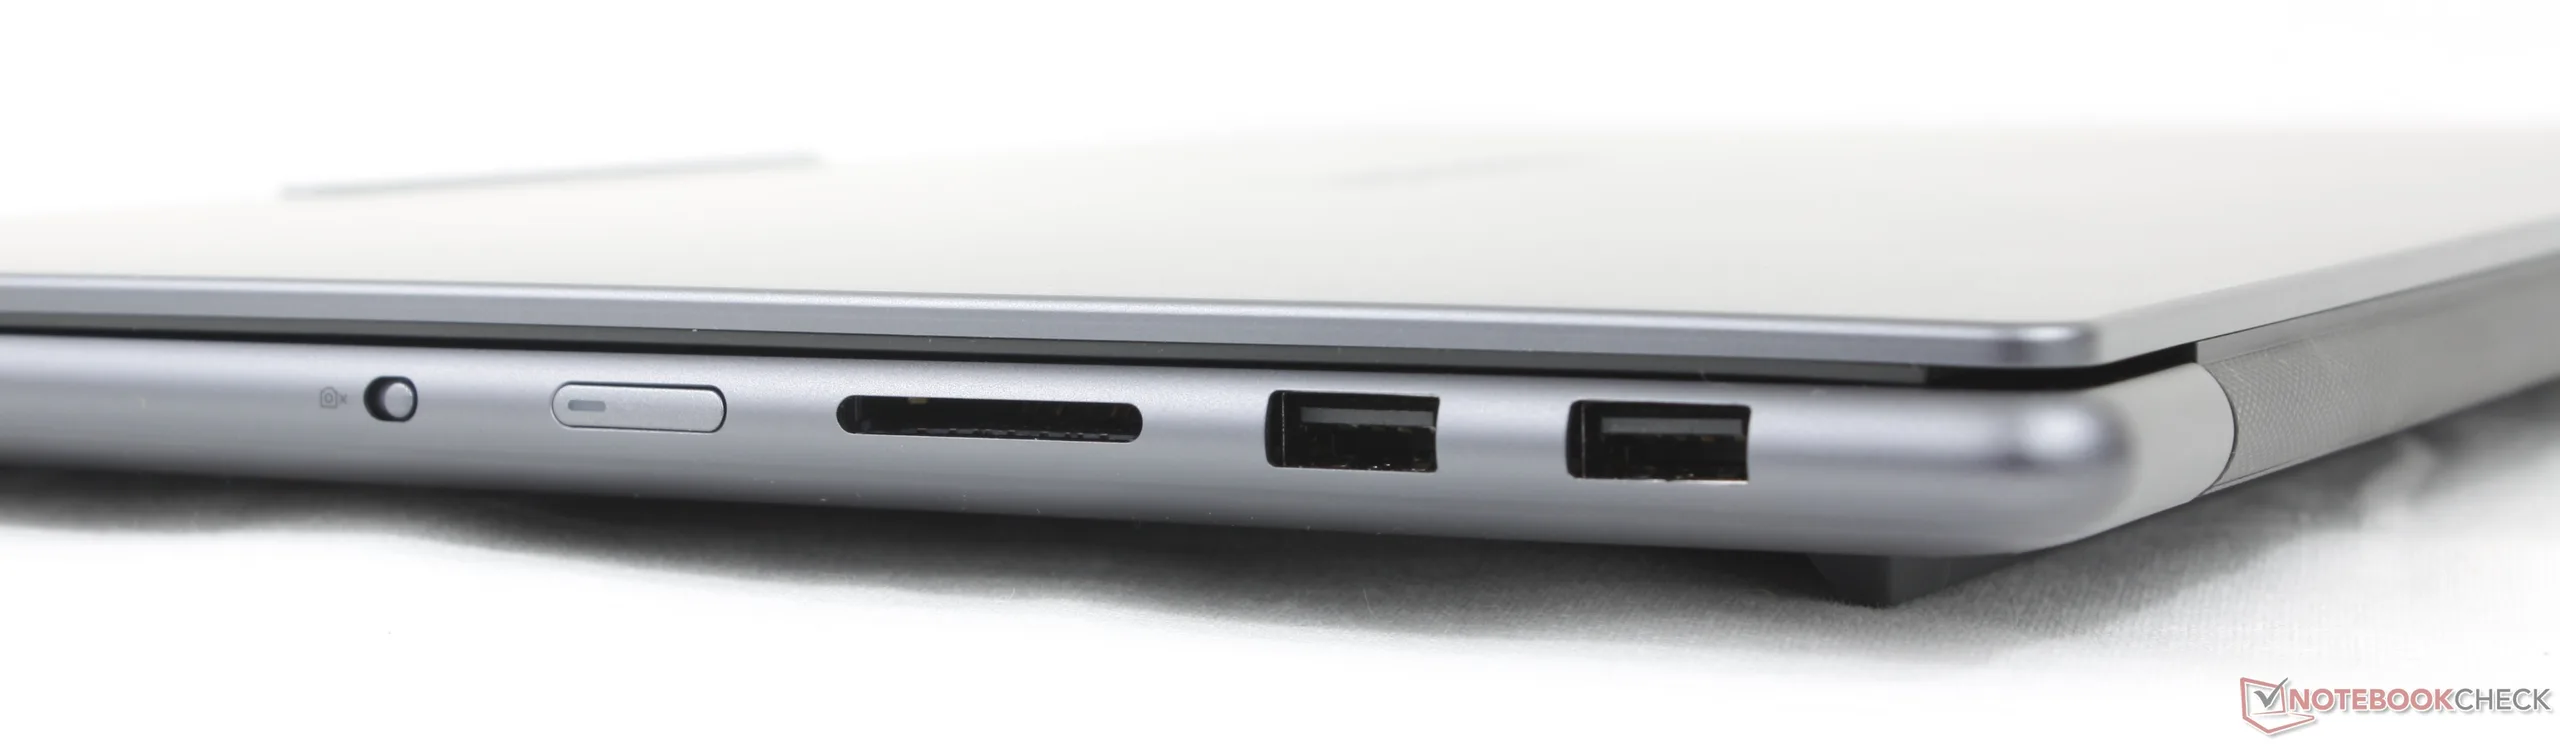
Leitor de cartão SD
| SD Card Reader | |
| average JPG Copy Test (av. of 3 runs) | |
| Lenovo Pro 9 16IPH11 (Toshiba Exceria Pro SDXC 64 GB UHS-II) | |
| Asus ProArt P16 H7606WP (Angelbird AV Pro V60) | |
| MSI Prestige 16 AI Evo B2HMG (Angelbird AV Pro V60) | |
| Lenovo Yoga Pro 9 16IAH10 RTX 5050 (Angelbird AV Pro V60) | |
| maximum AS SSD Seq Read Test (1GB) | |
| Asus ProArt P16 H7606WP (Angelbird AV Pro V60) | |
| Lenovo Pro 9 16IPH11 (Toshiba Exceria Pro SDXC 64 GB UHS-II) | |
| Lenovo Yoga Pro 9 16IAH10 RTX 5050 (Angelbird AV Pro V60) | |
| MSI Prestige 16 AI Evo B2HMG (Angelbird AV Pro V60) | |
Comunicação
Webcam


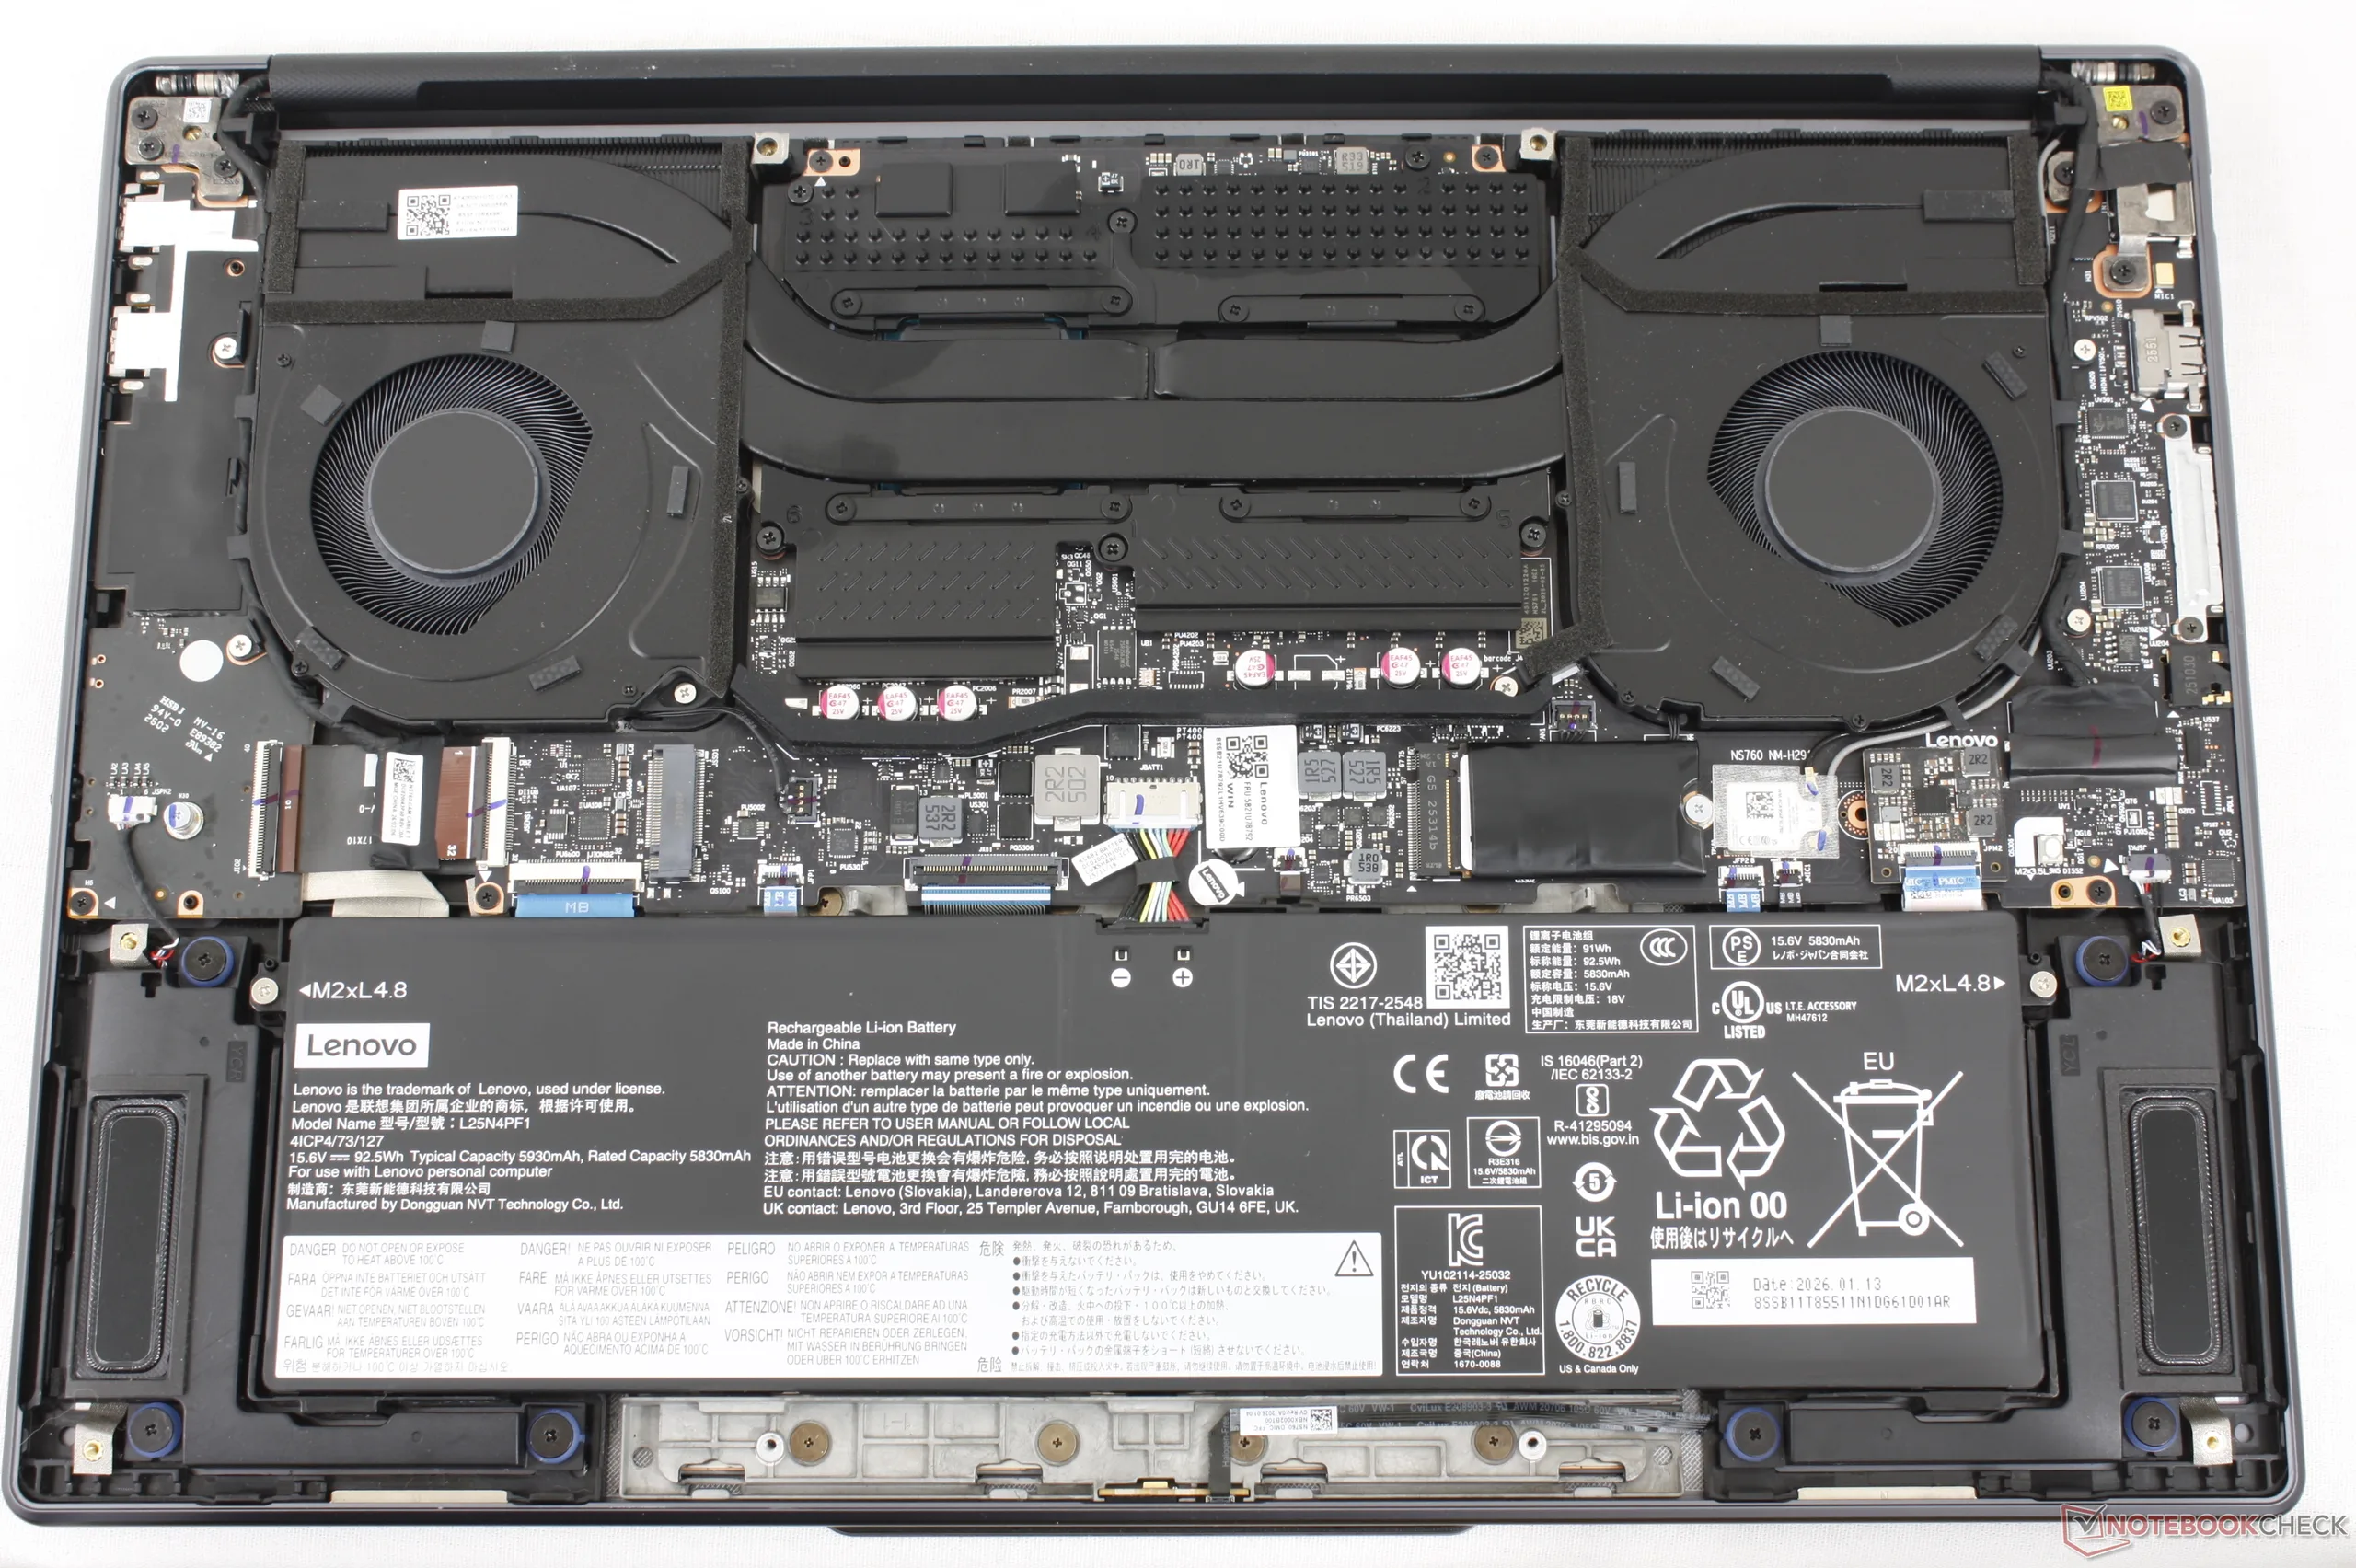
Manutenção
Os componentes internos sofreram pequenas alterações. A mais notável é a capacidade um pouco maior da bateria (84 Wh para 93 Wh), mas as opções de upgrade de SSD são as mesmas de antes.

Sustentabilidade
A Lenovo não fornece nenhum detalhe sobre os materiais reciclados usados durante a fabricação. Por outro lado, a embalagem não contém plásticos e é totalmente reciclável.
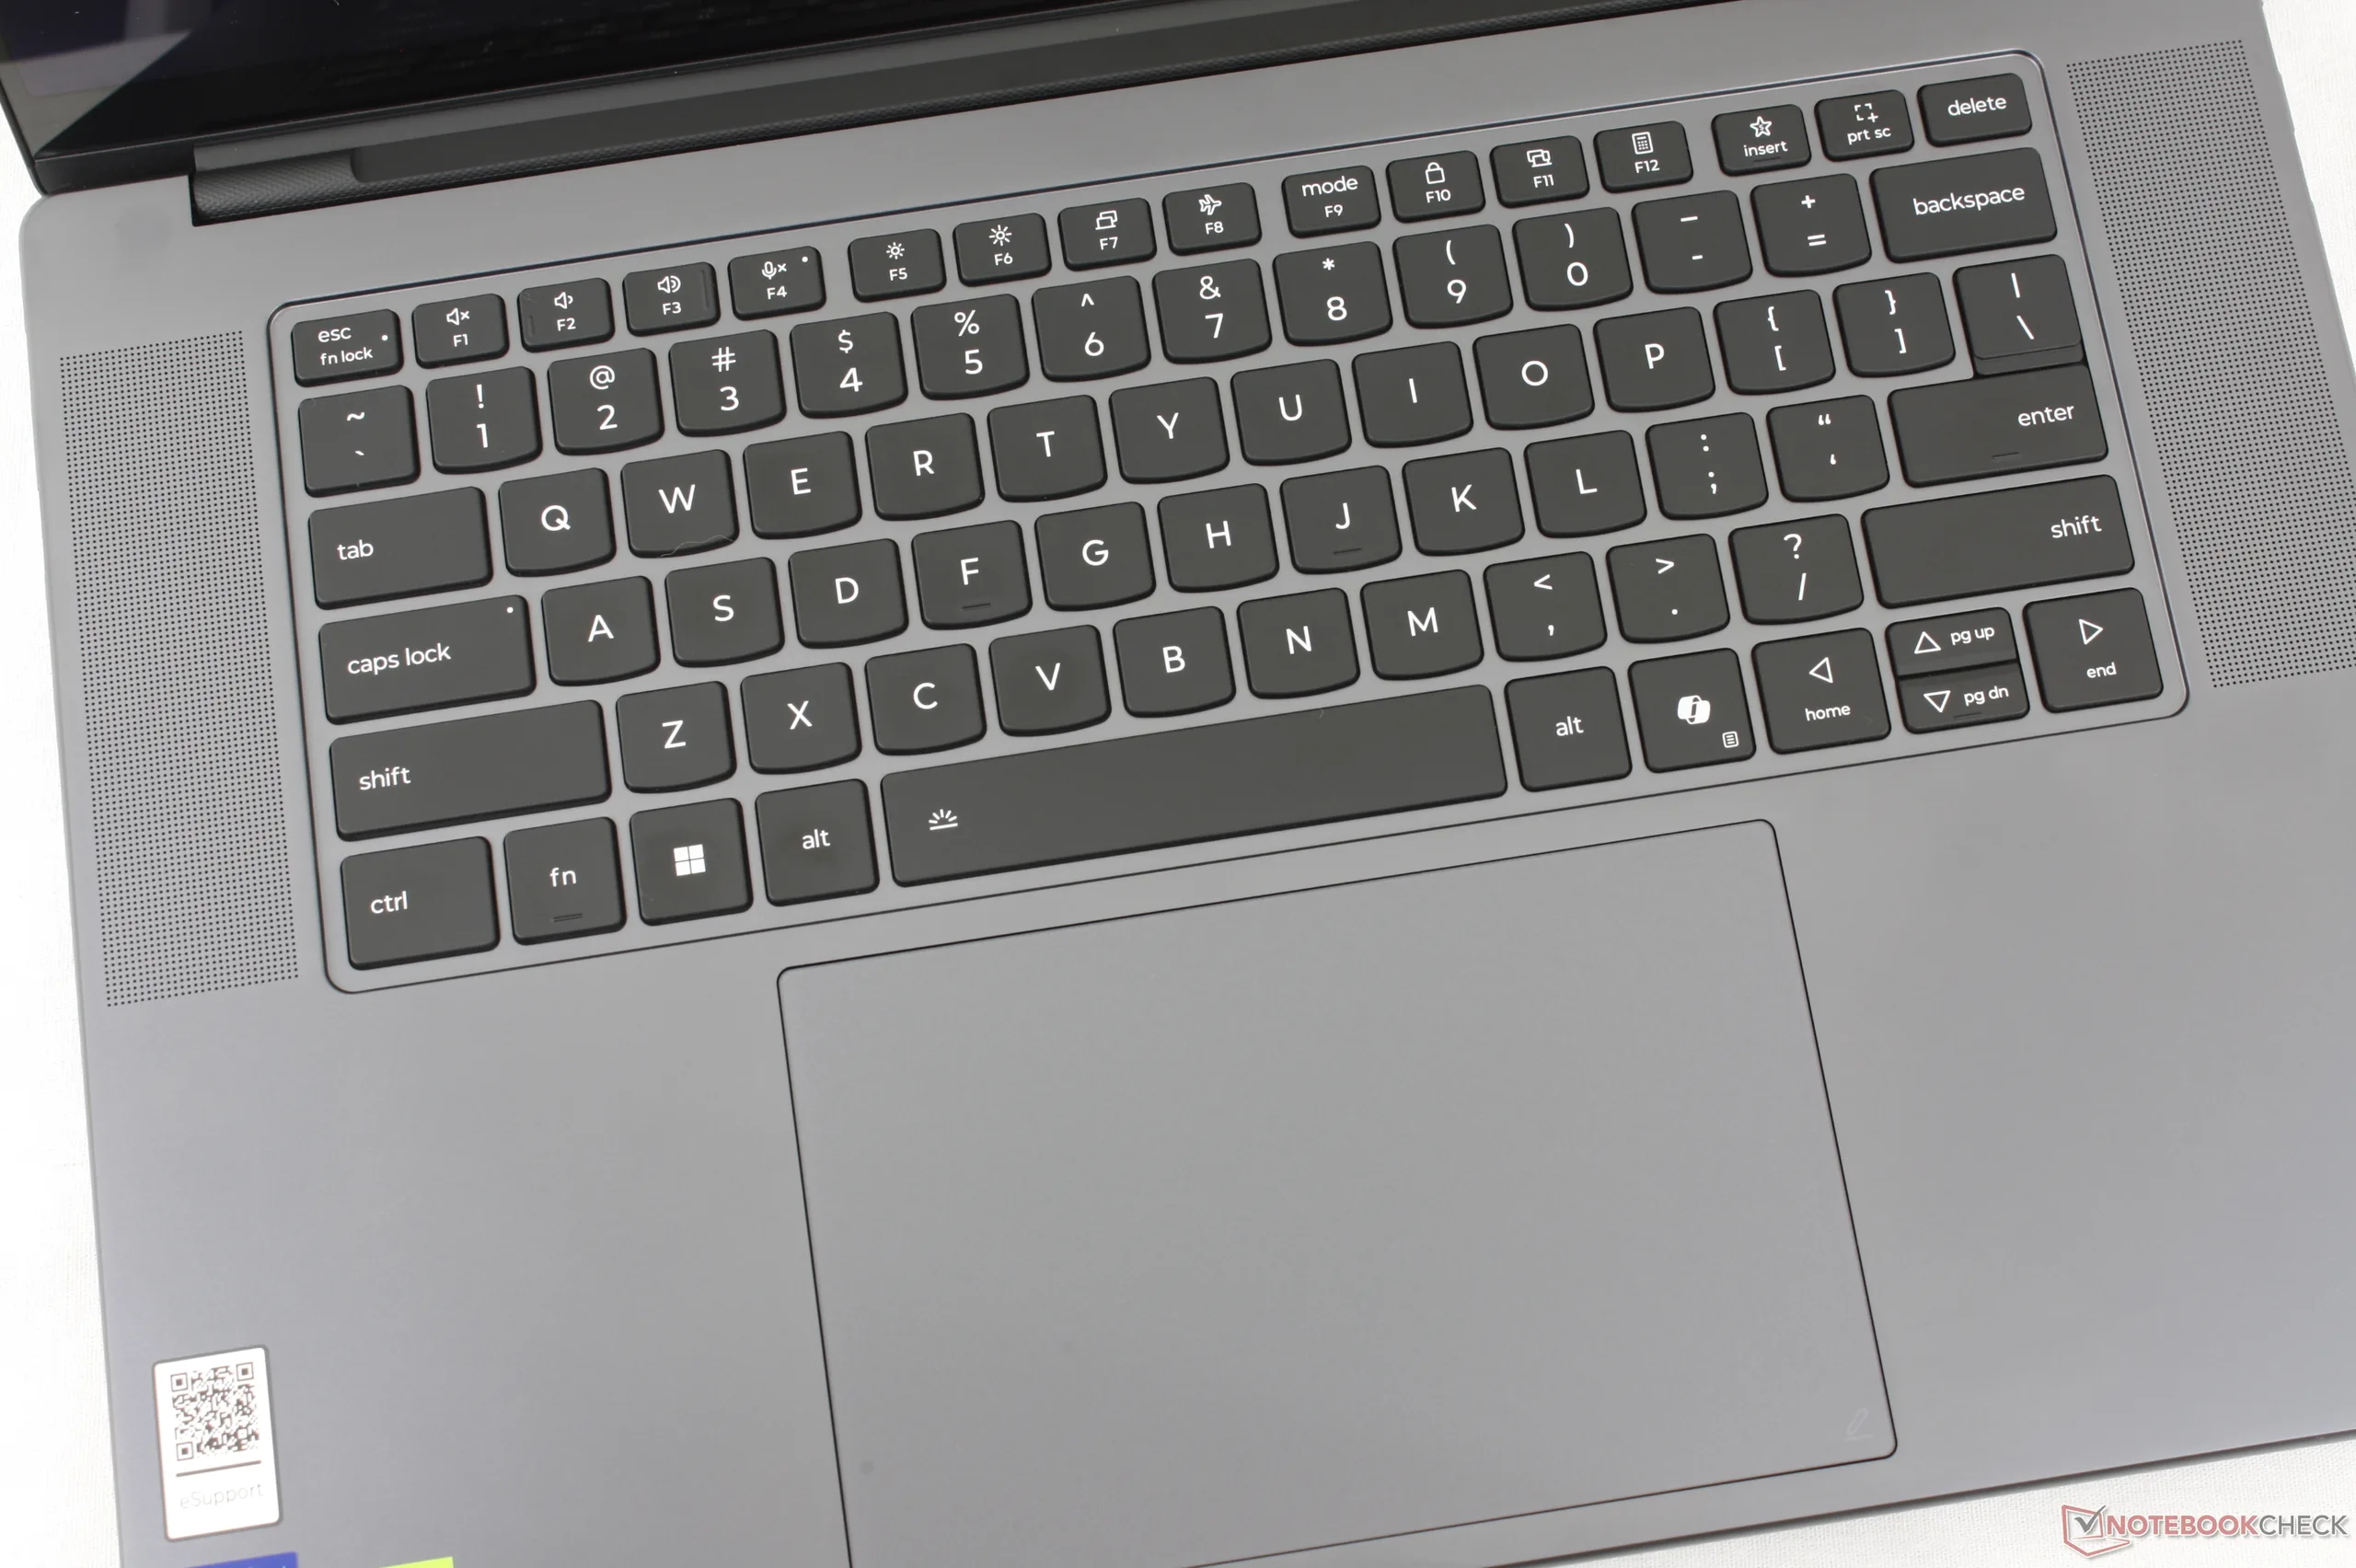
Dispositivos de entrada
A fonte e a impressão das teclas foram alteradas em relação ao modelo do ano passado para serem maiores, centralizadas e, em geral, mais fáceis de ver. A sensação das teclas é a mesma, incluindo o curso de 1,5 mm e o feedback relativamente nítido para uma experiência de digitação semelhante, apesar da falta de um teclado numérico.
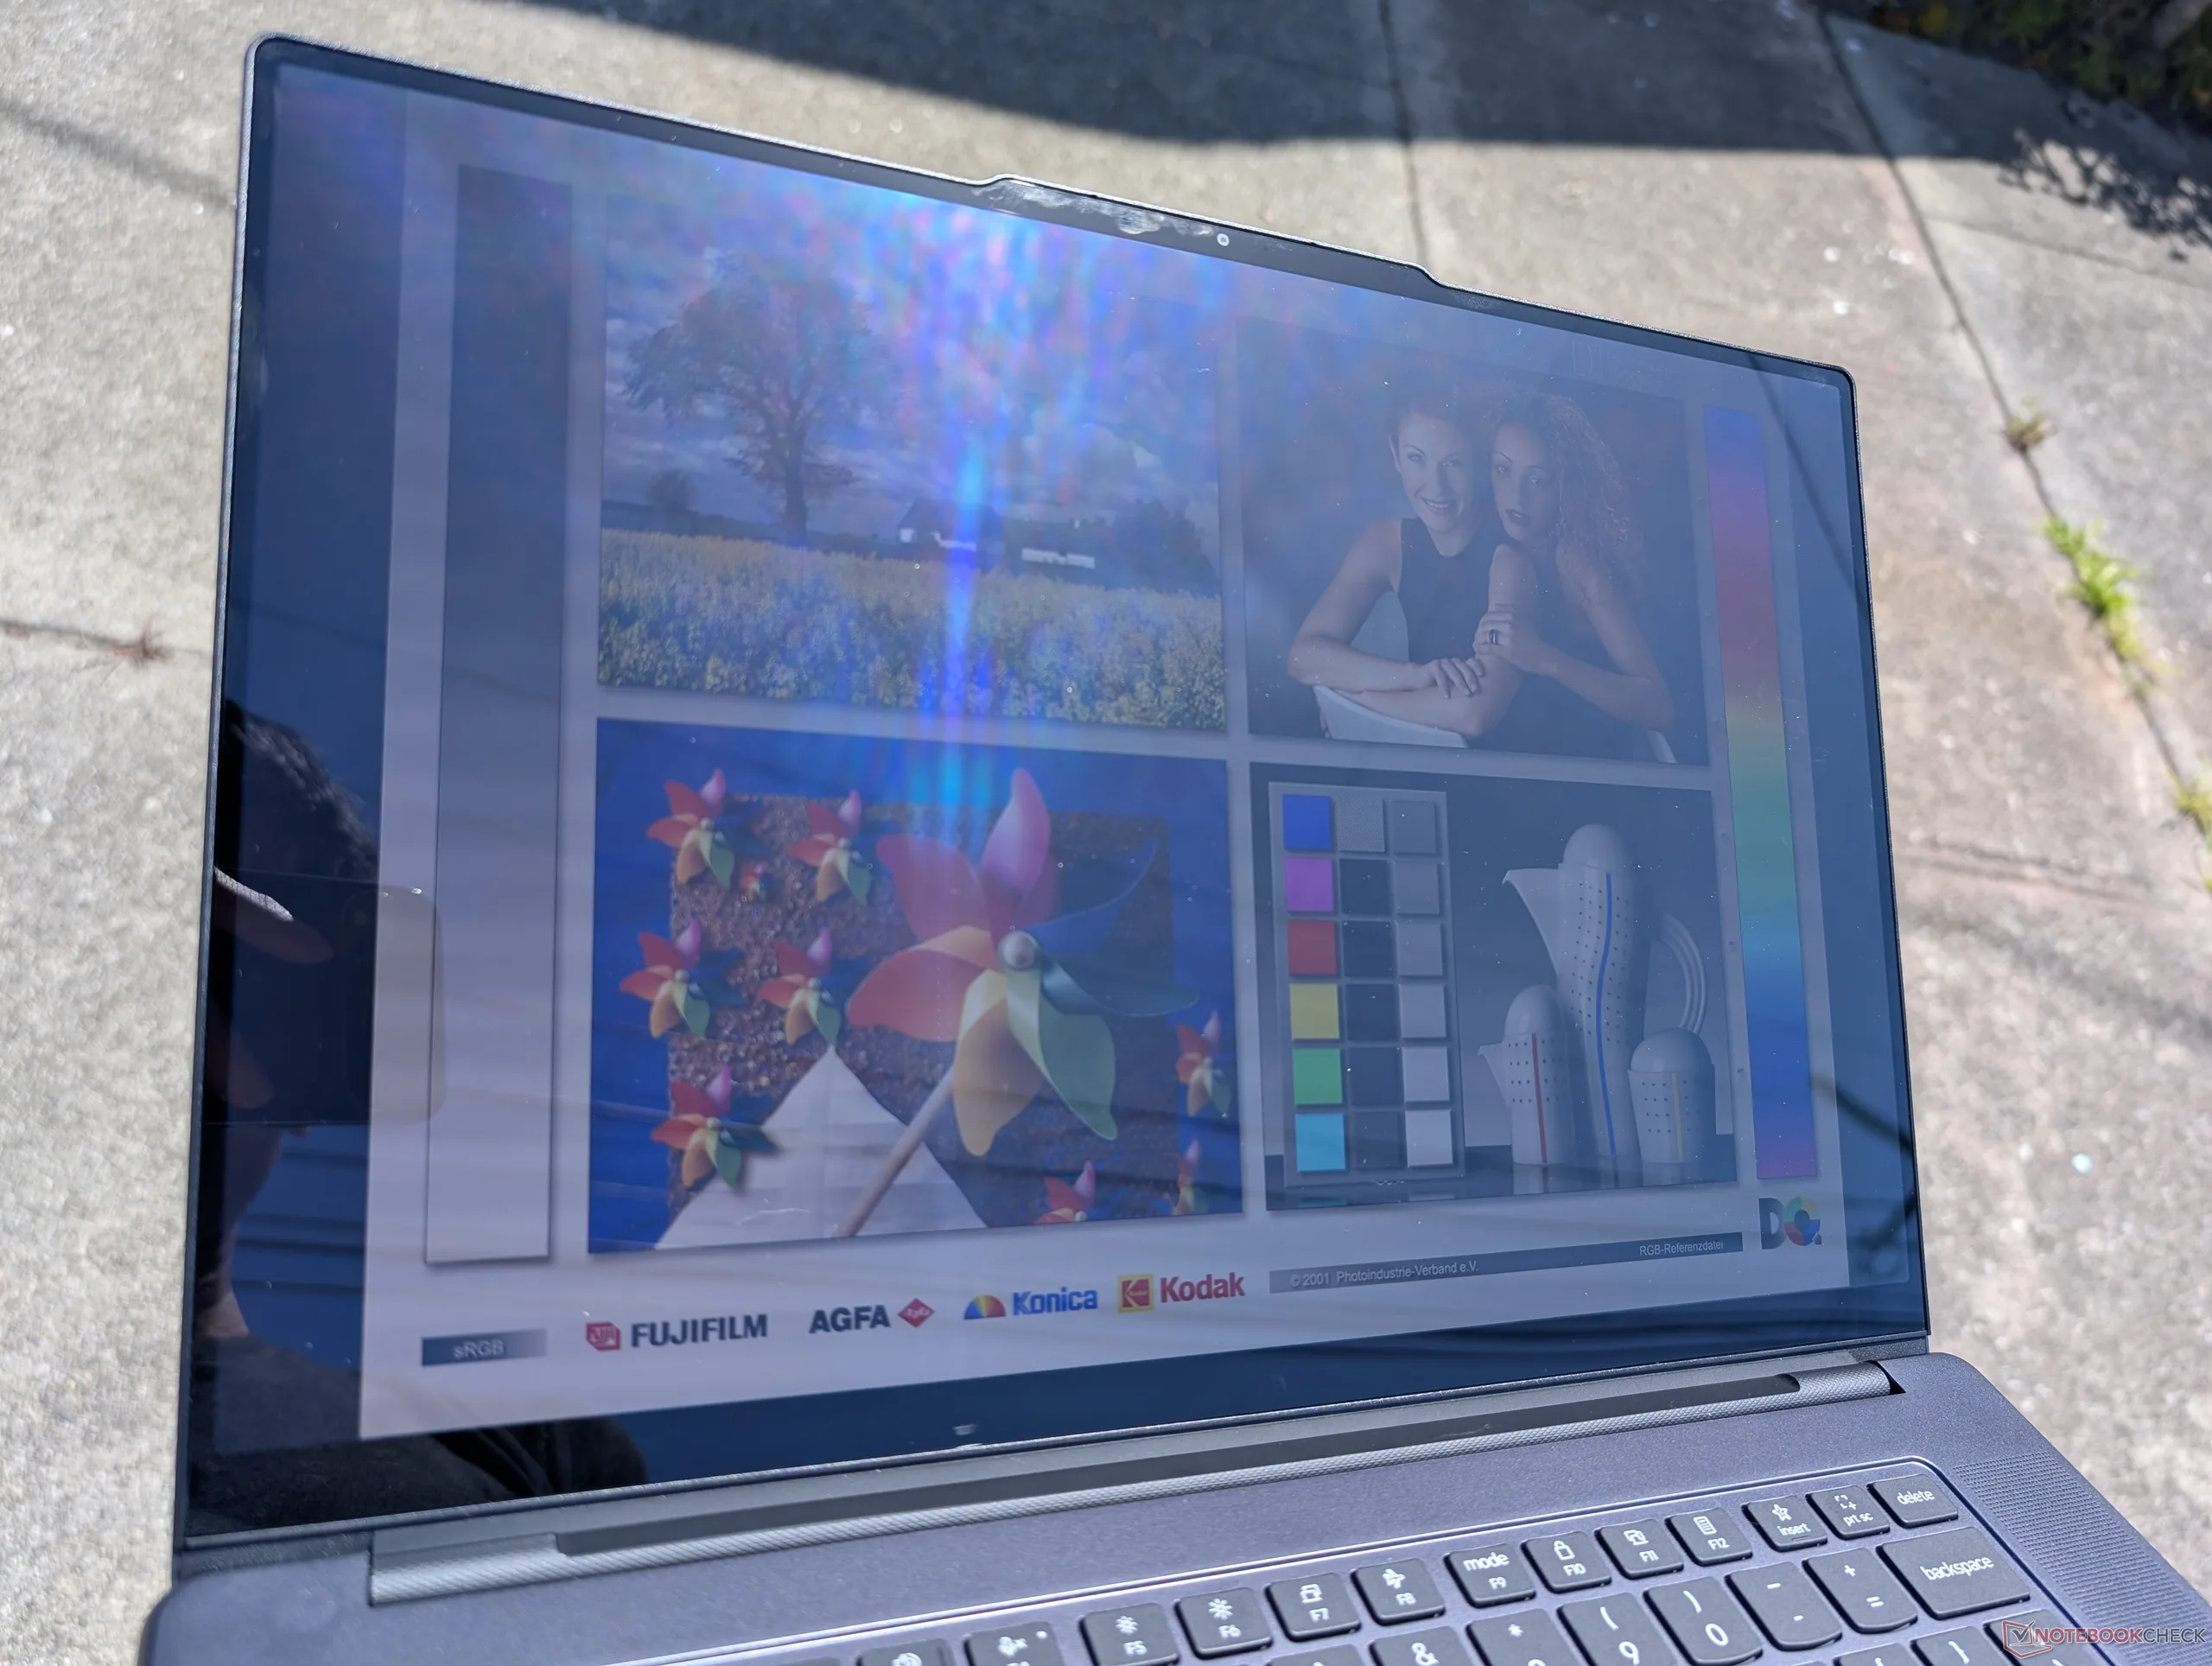
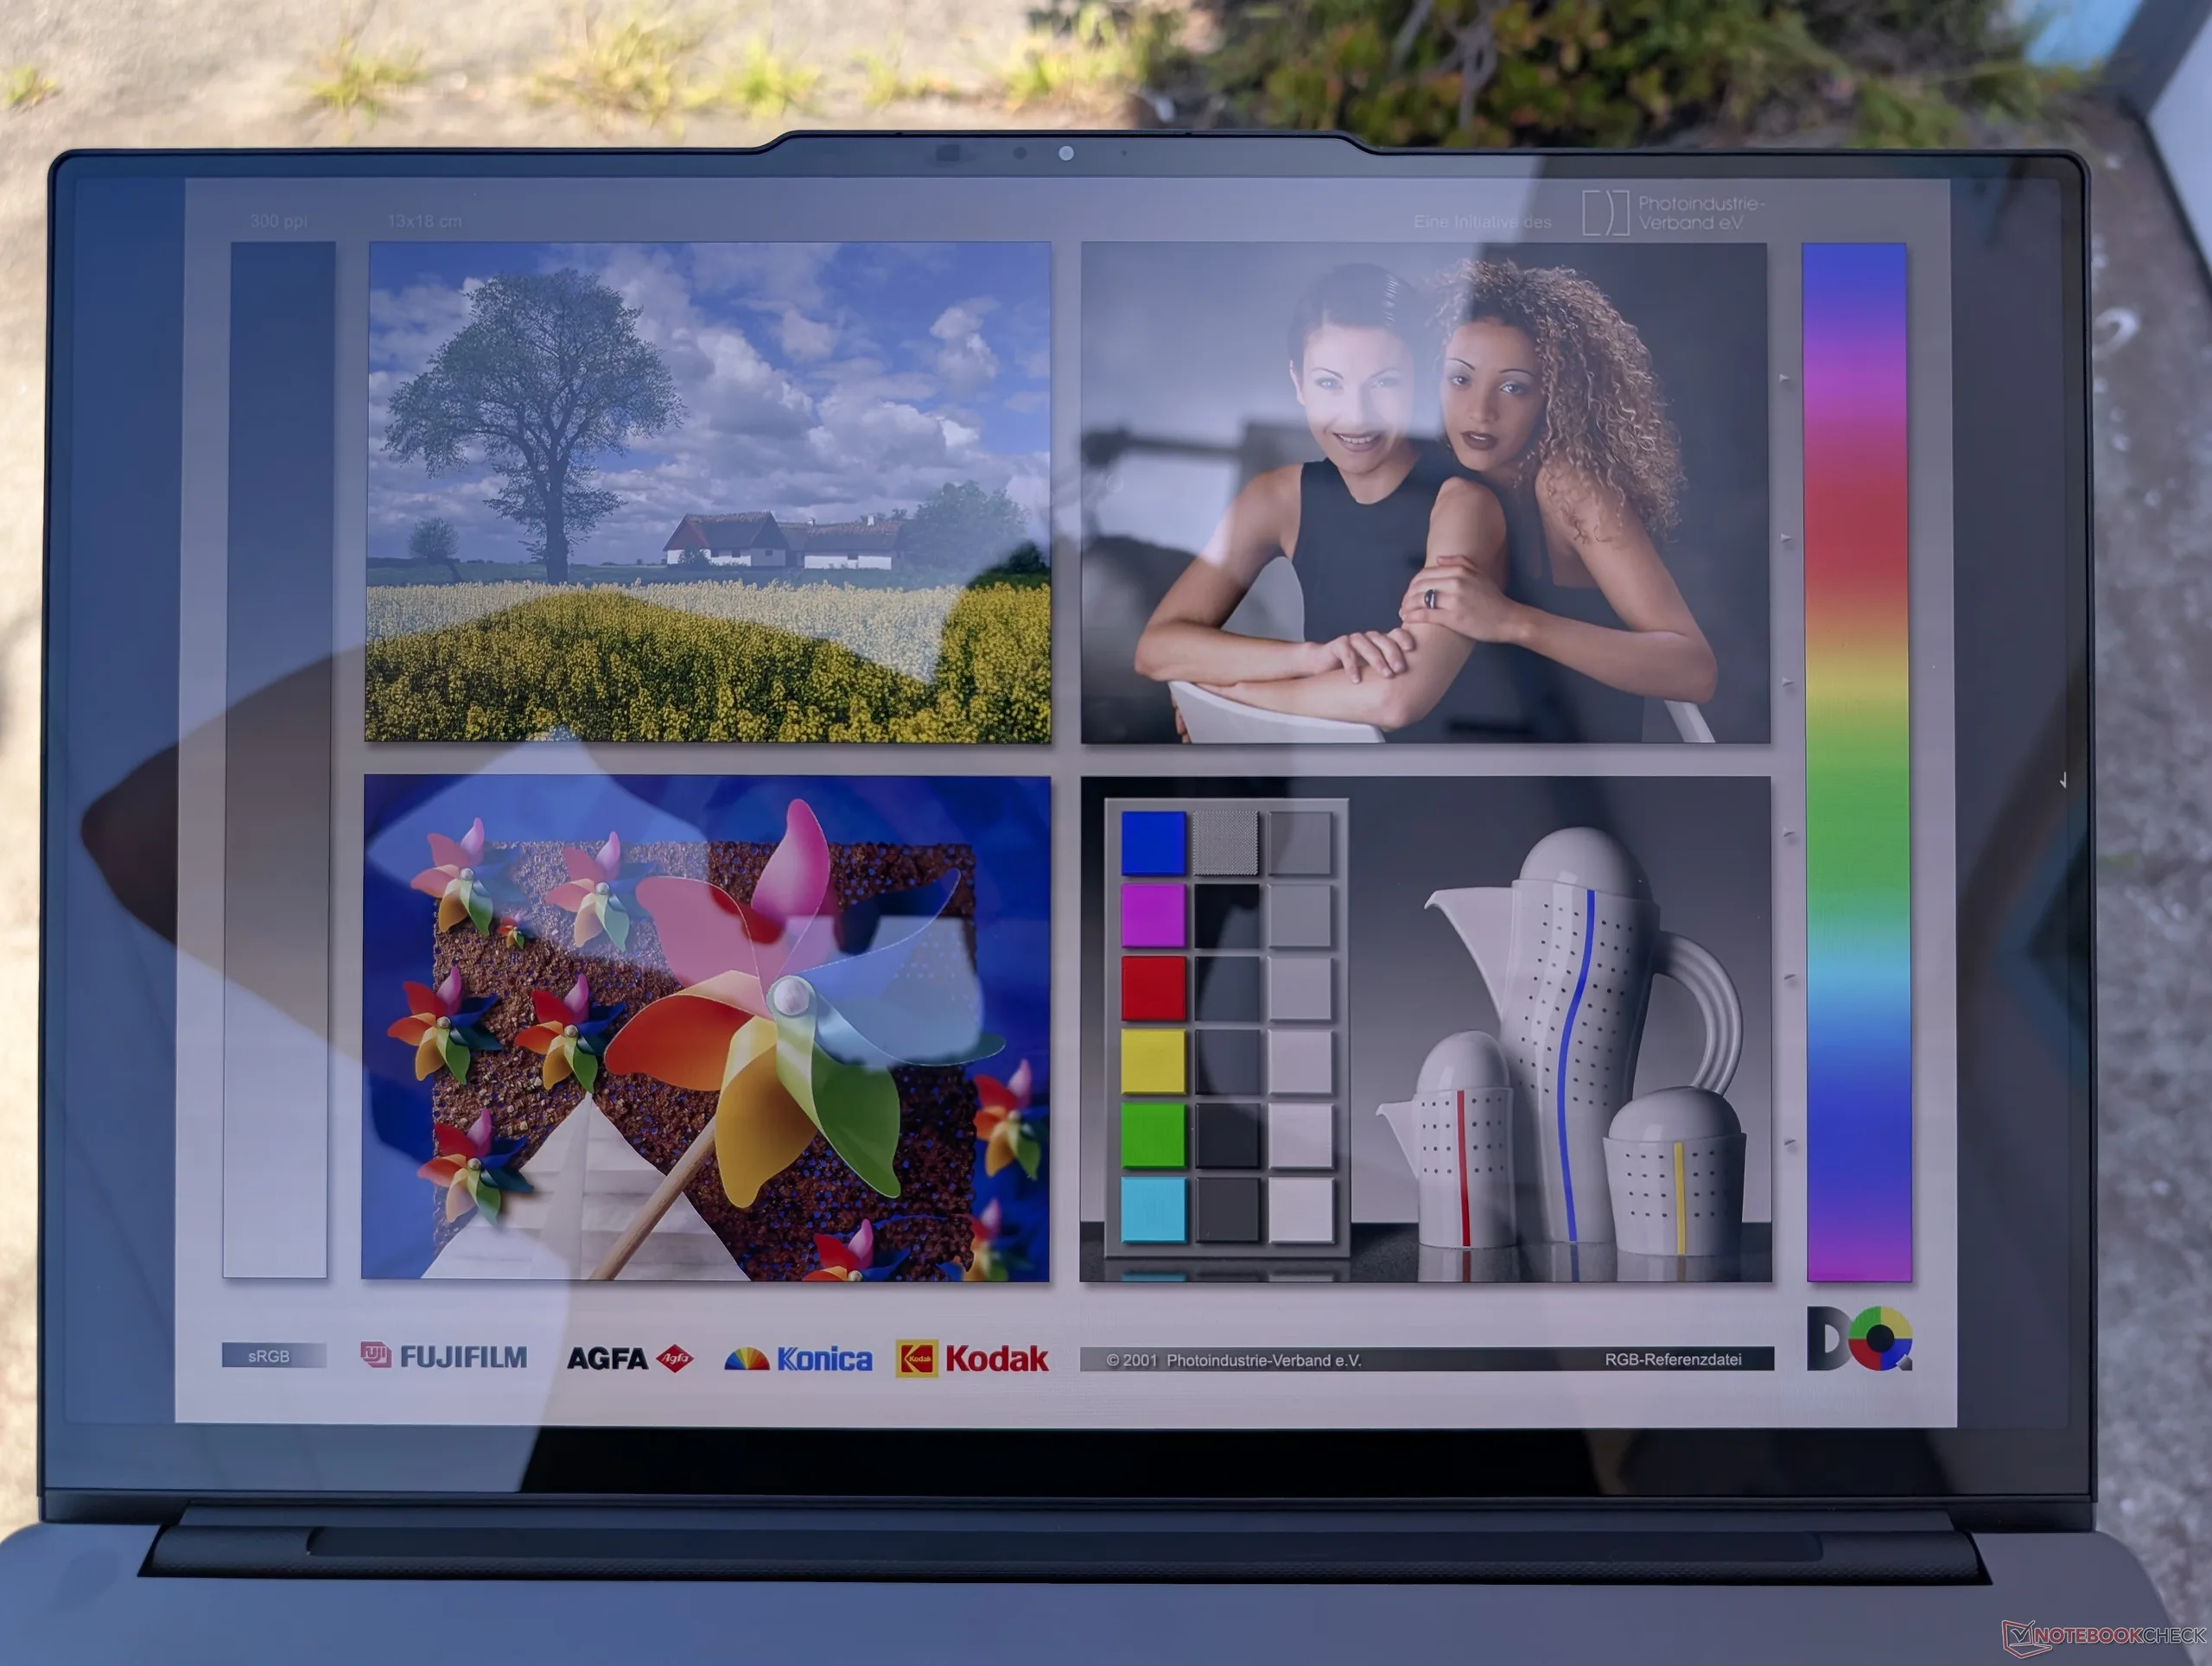
Tela
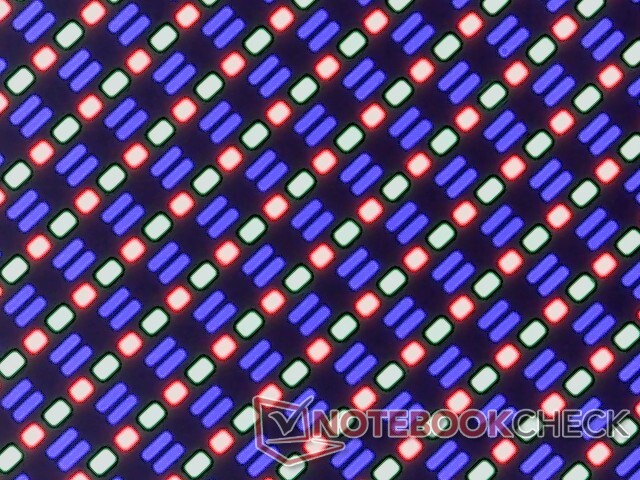
As duas opções de tela sensível ao toque permanecem as mesmas de antes:
- 2880 x 1800, OLED, 500 nits SDR (1100 nits HDR), 100% DCI-P3, 120 Hz, Gorilla Glass 3
- 3200 x 2000, Tandem OLED, 1000 nits SDR (1600 nits HDR), 100% DCI-P3, 120 Hz, Gorilla Glass 3
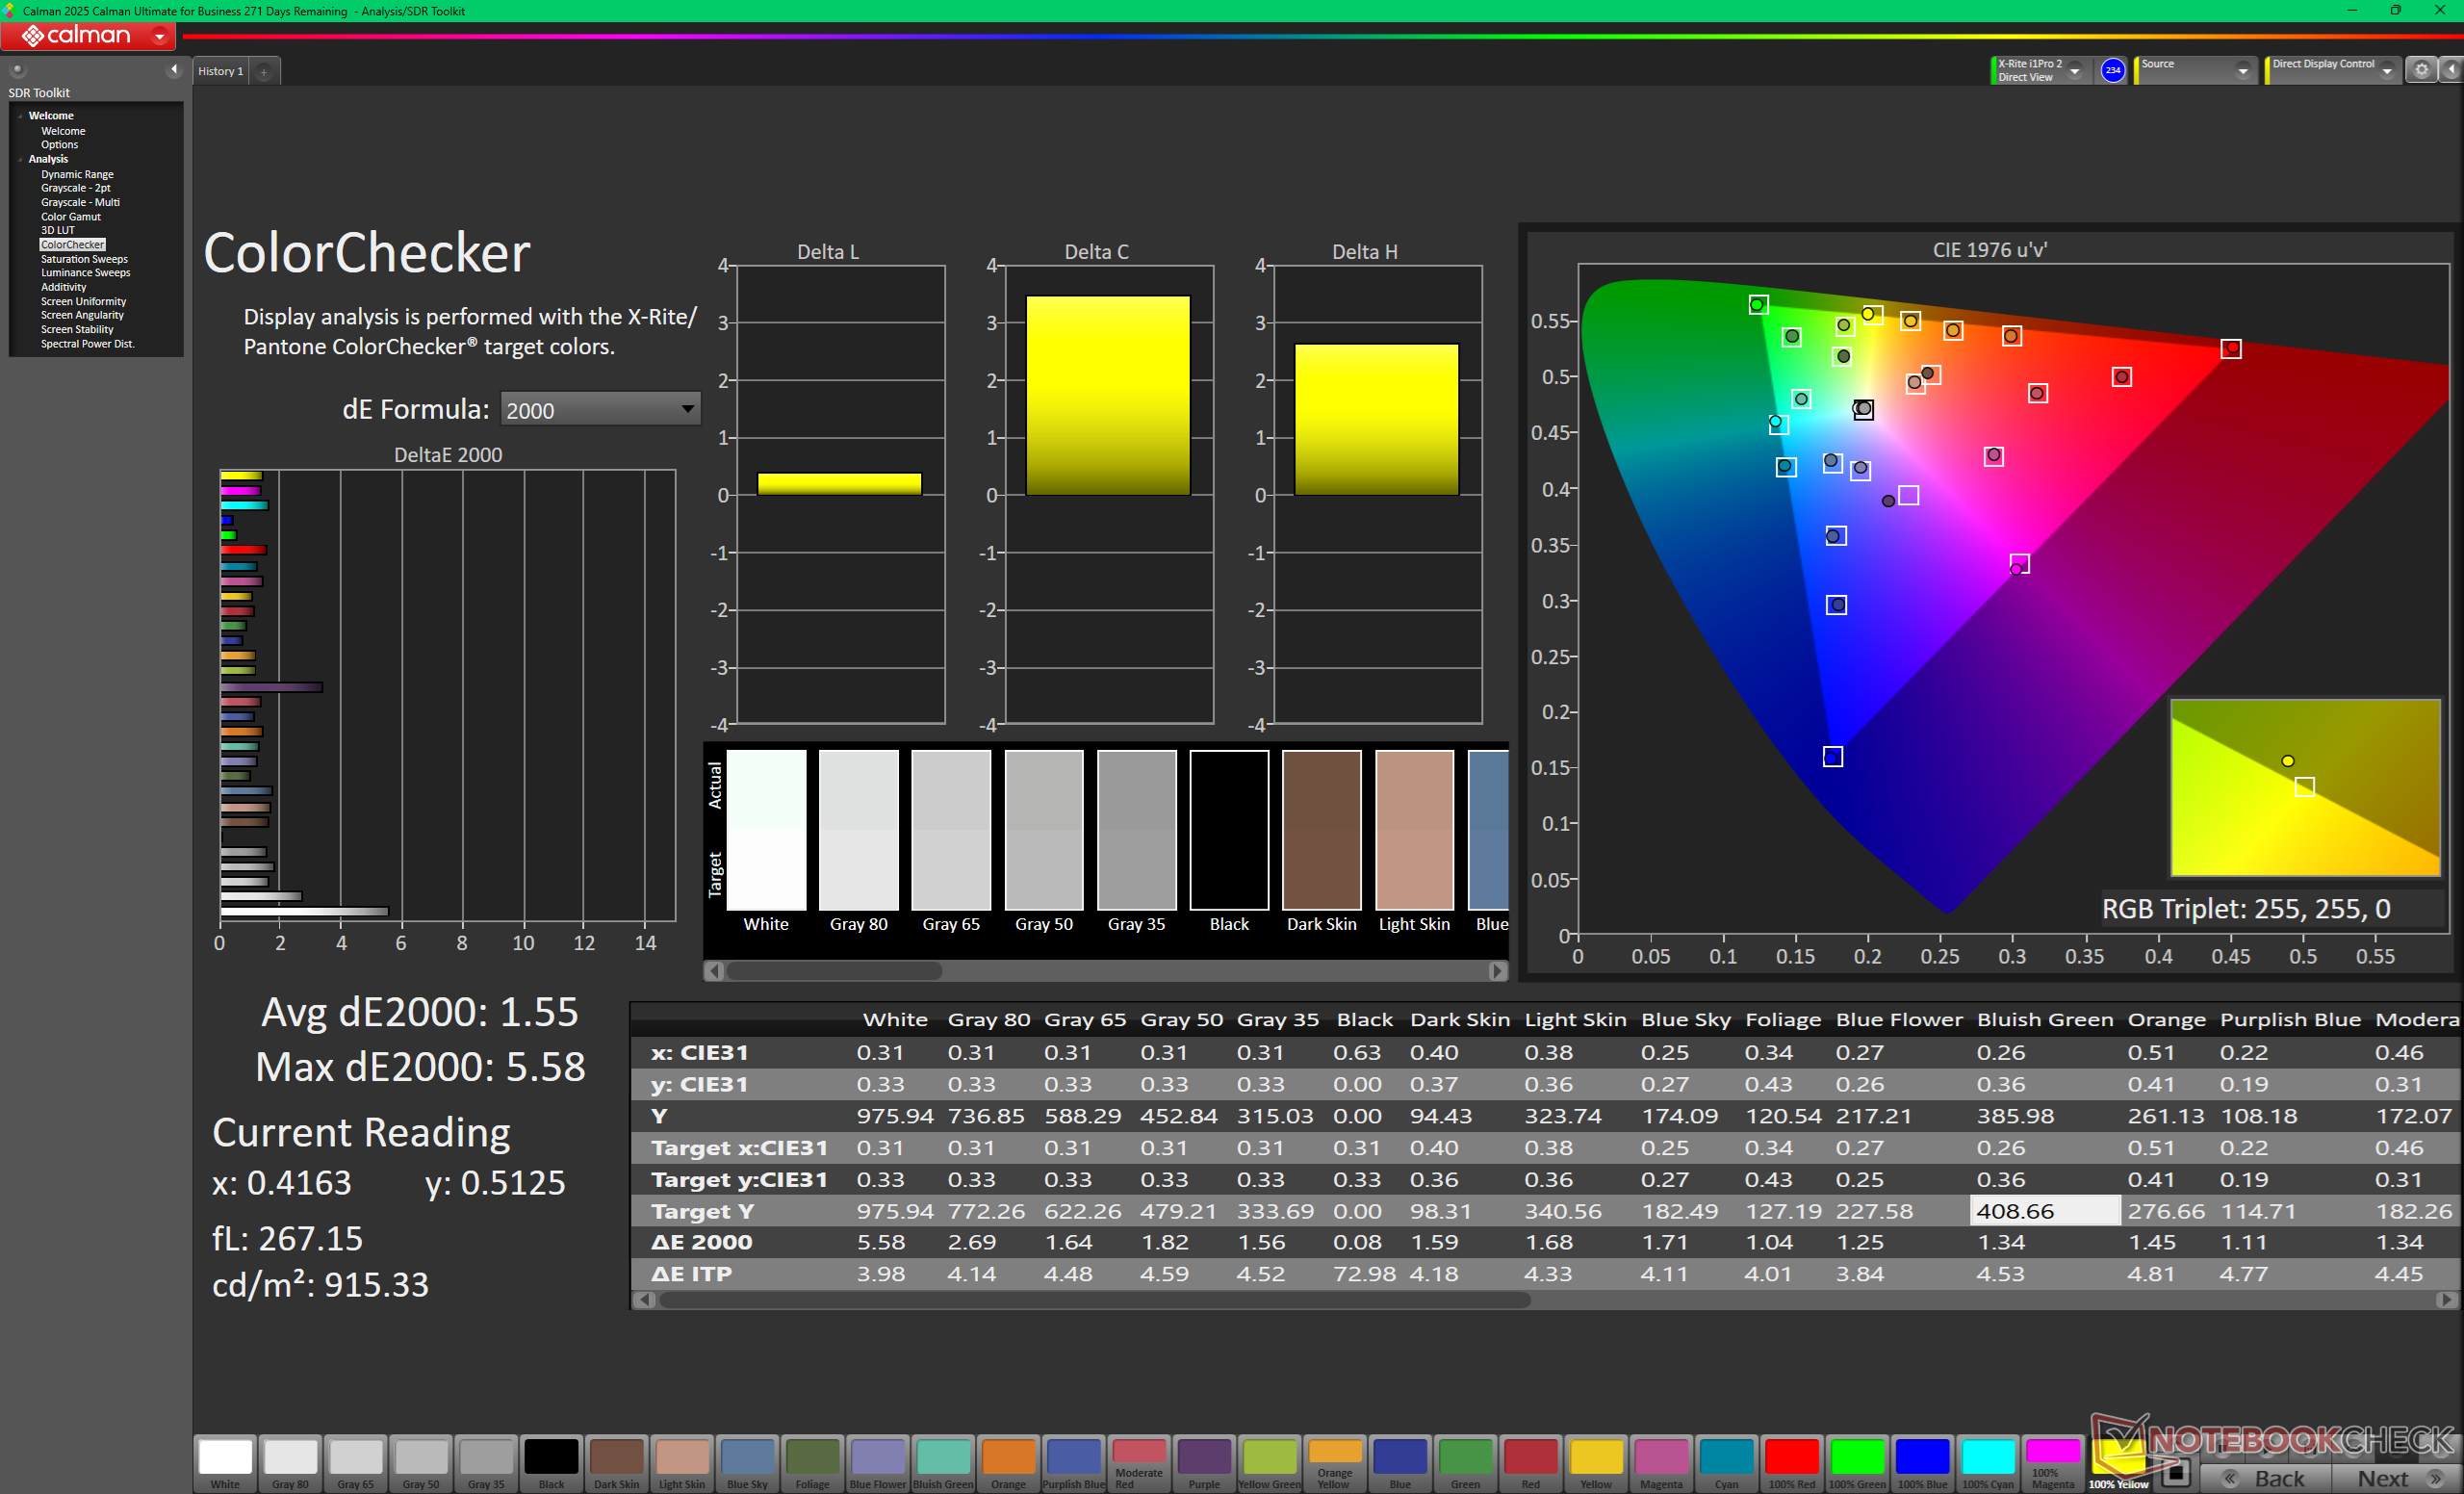
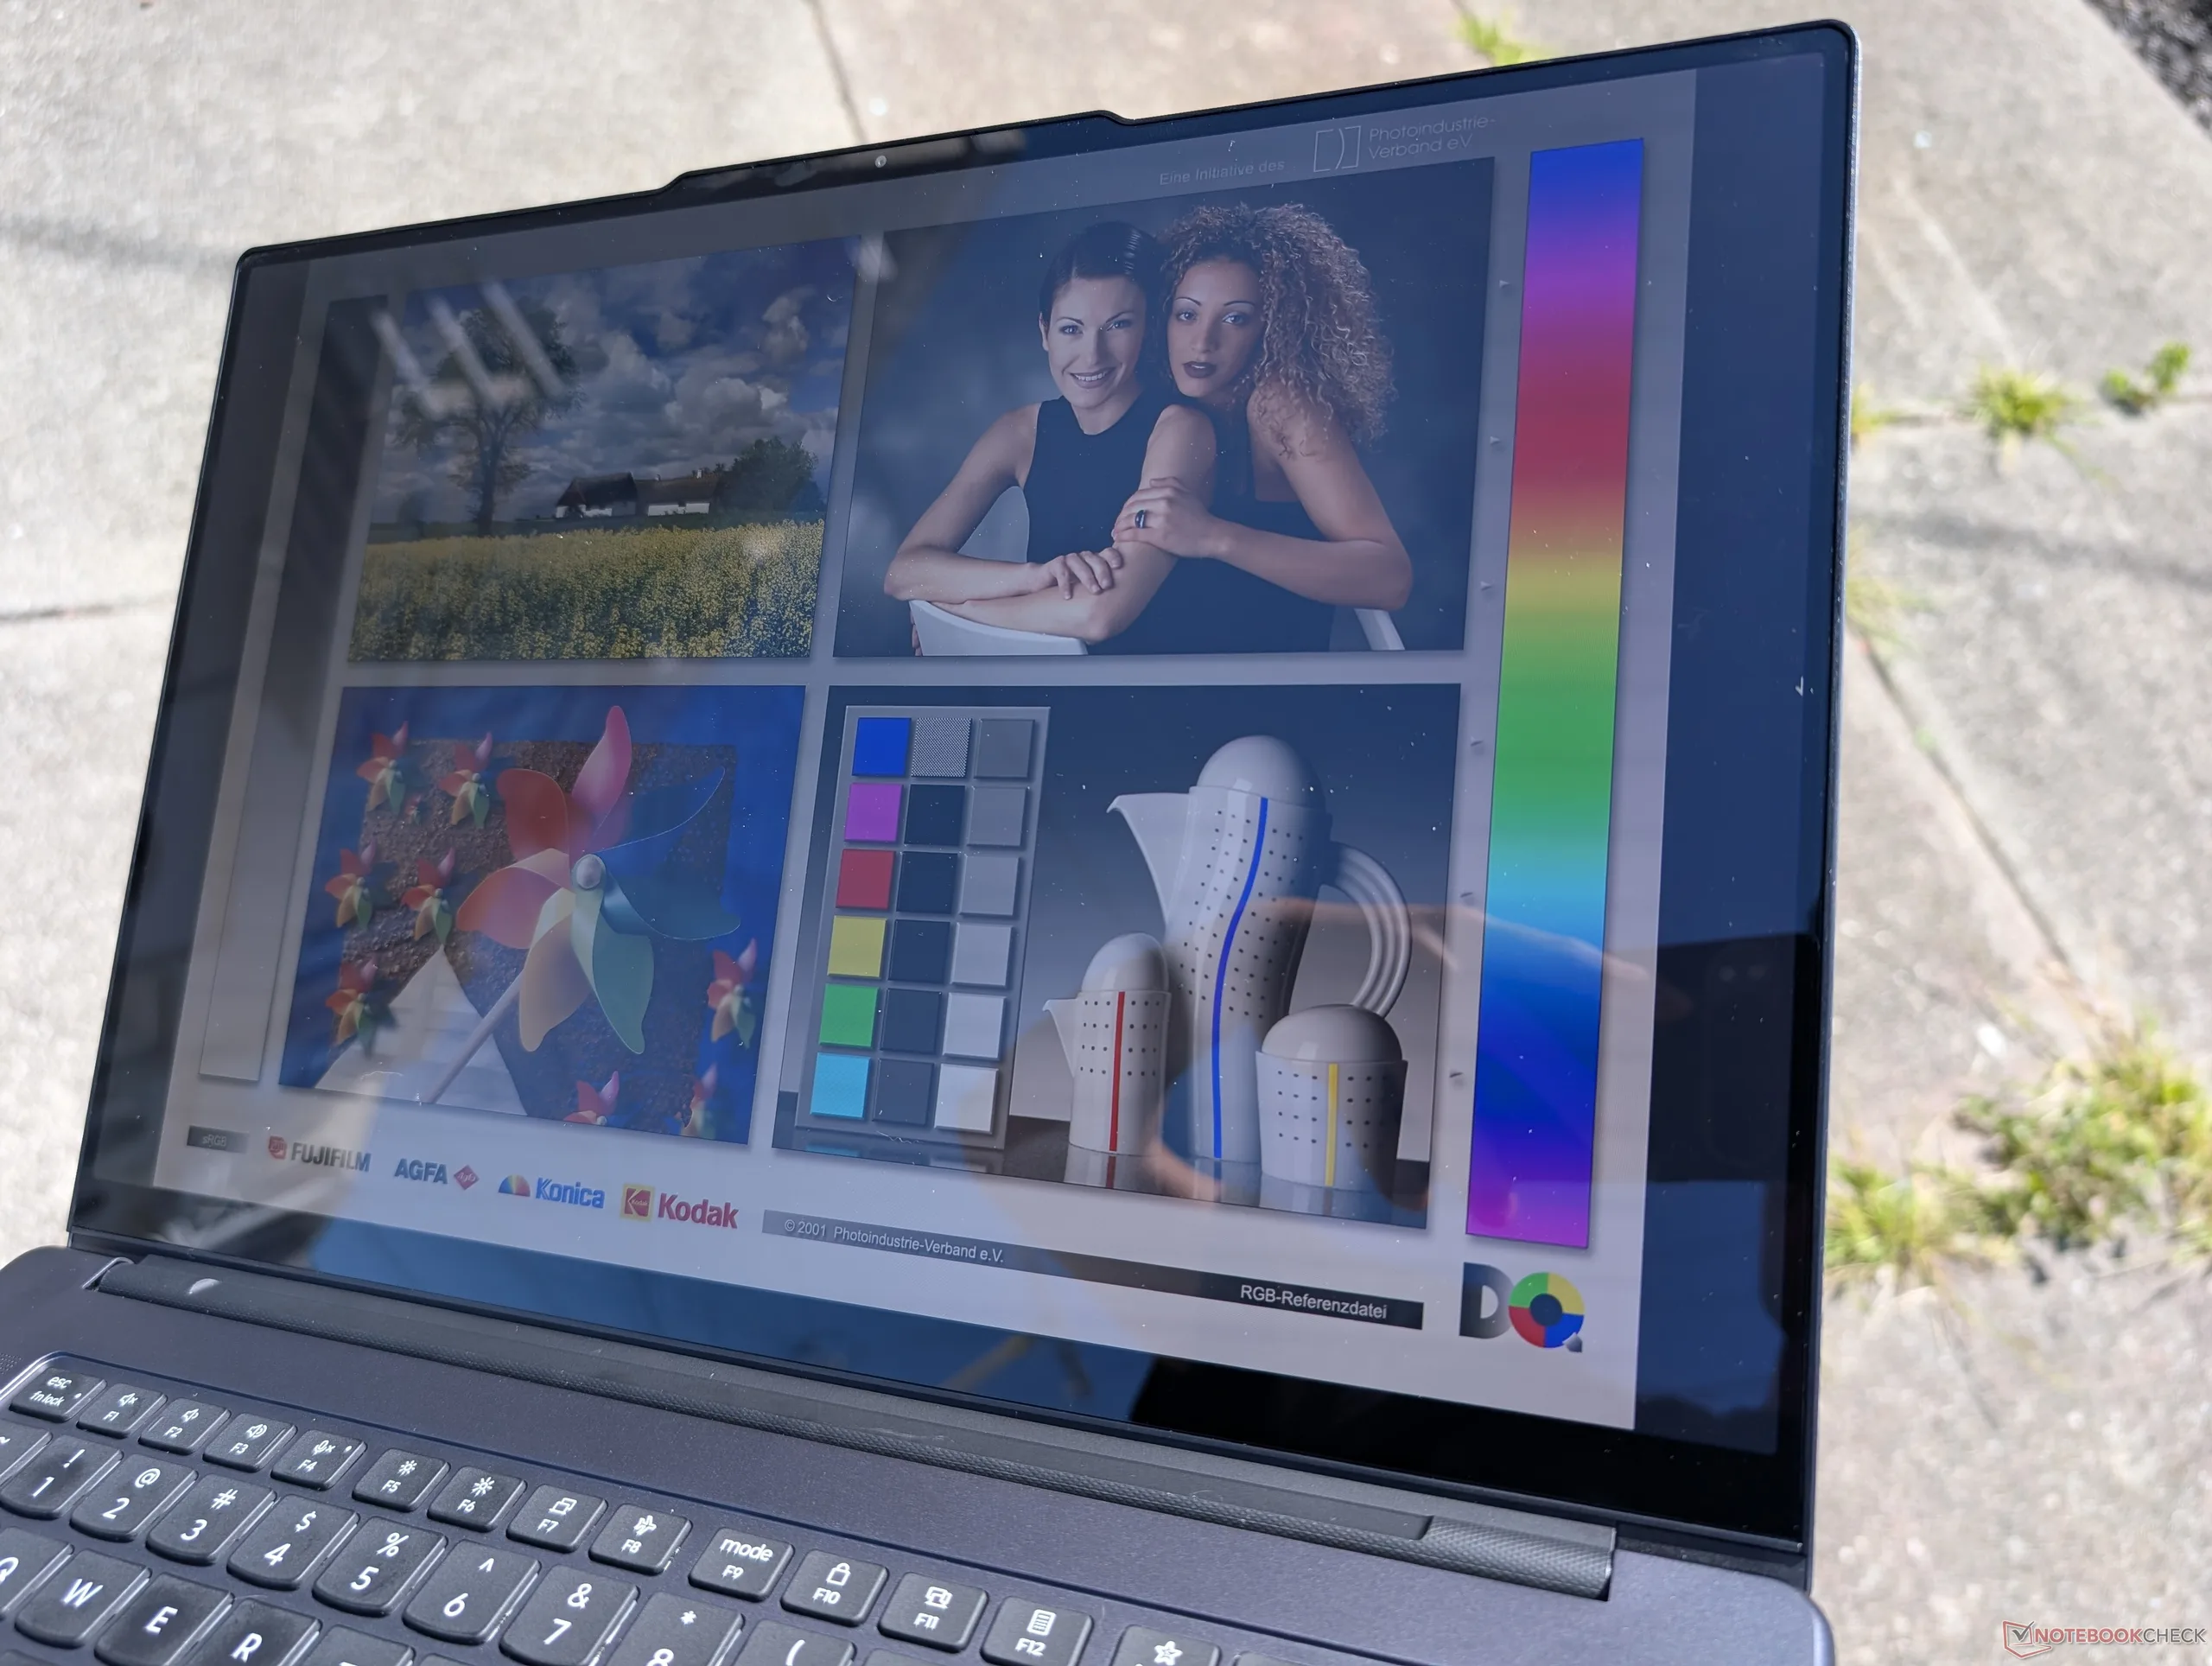
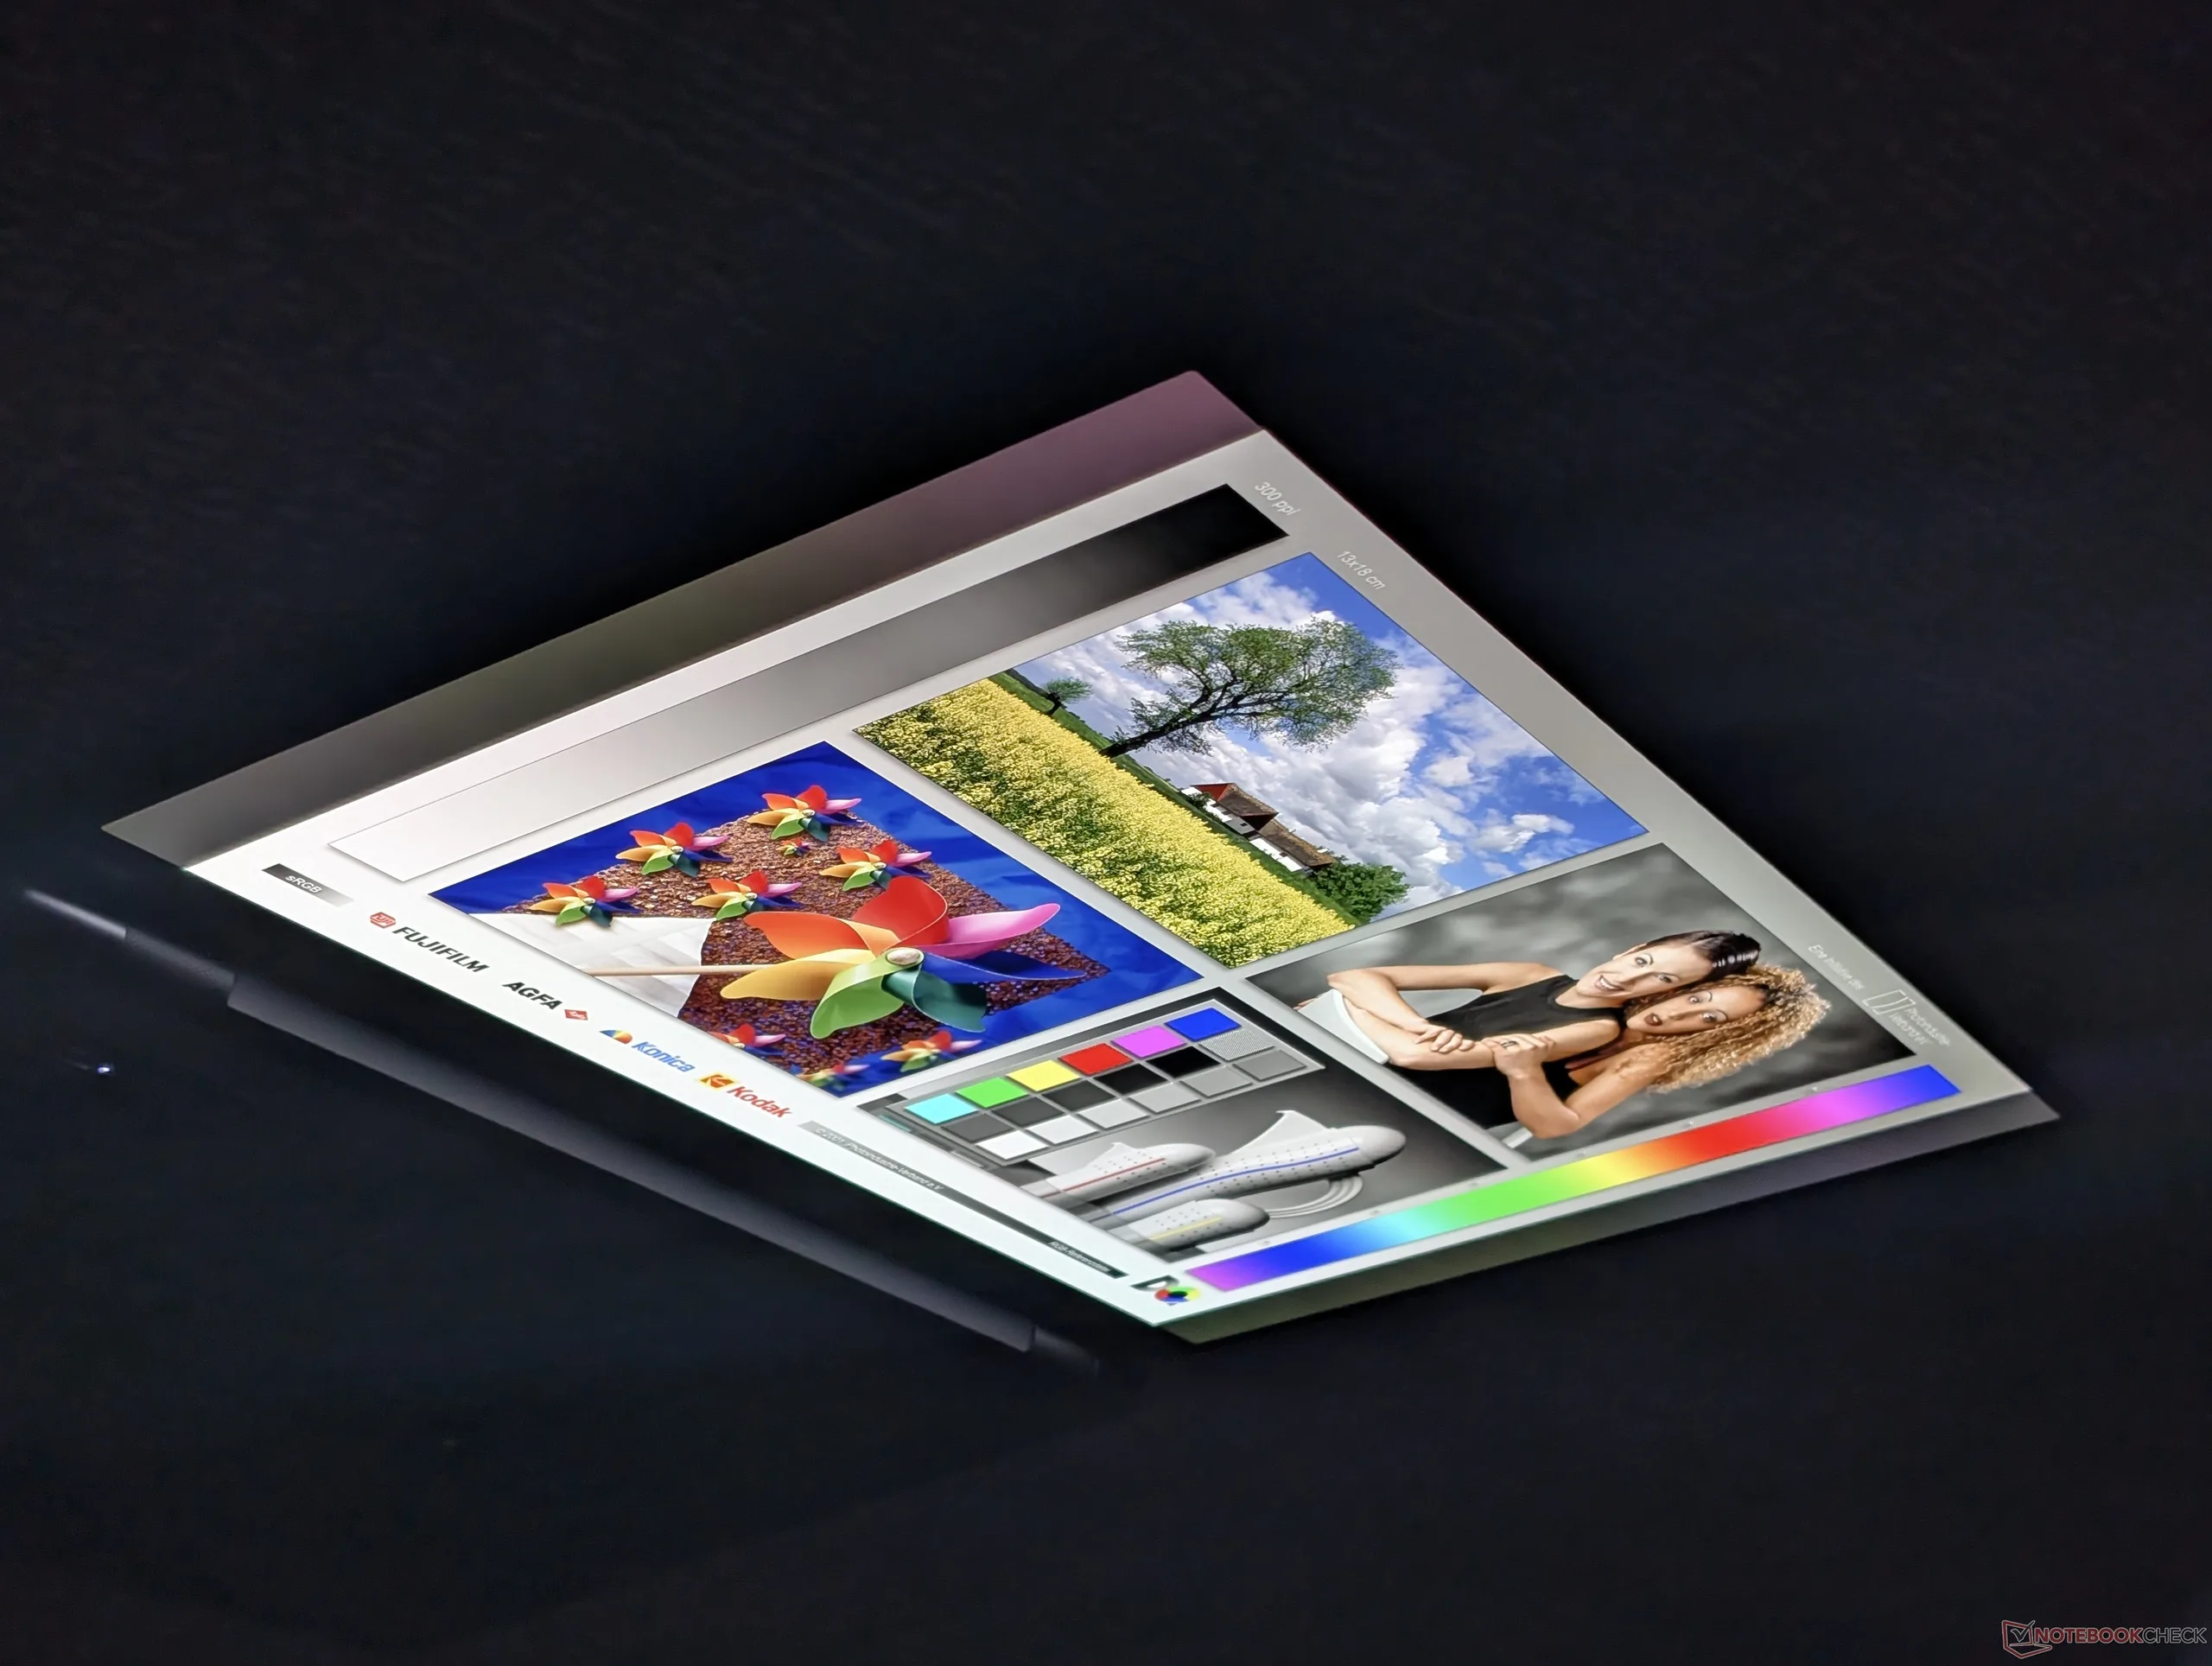
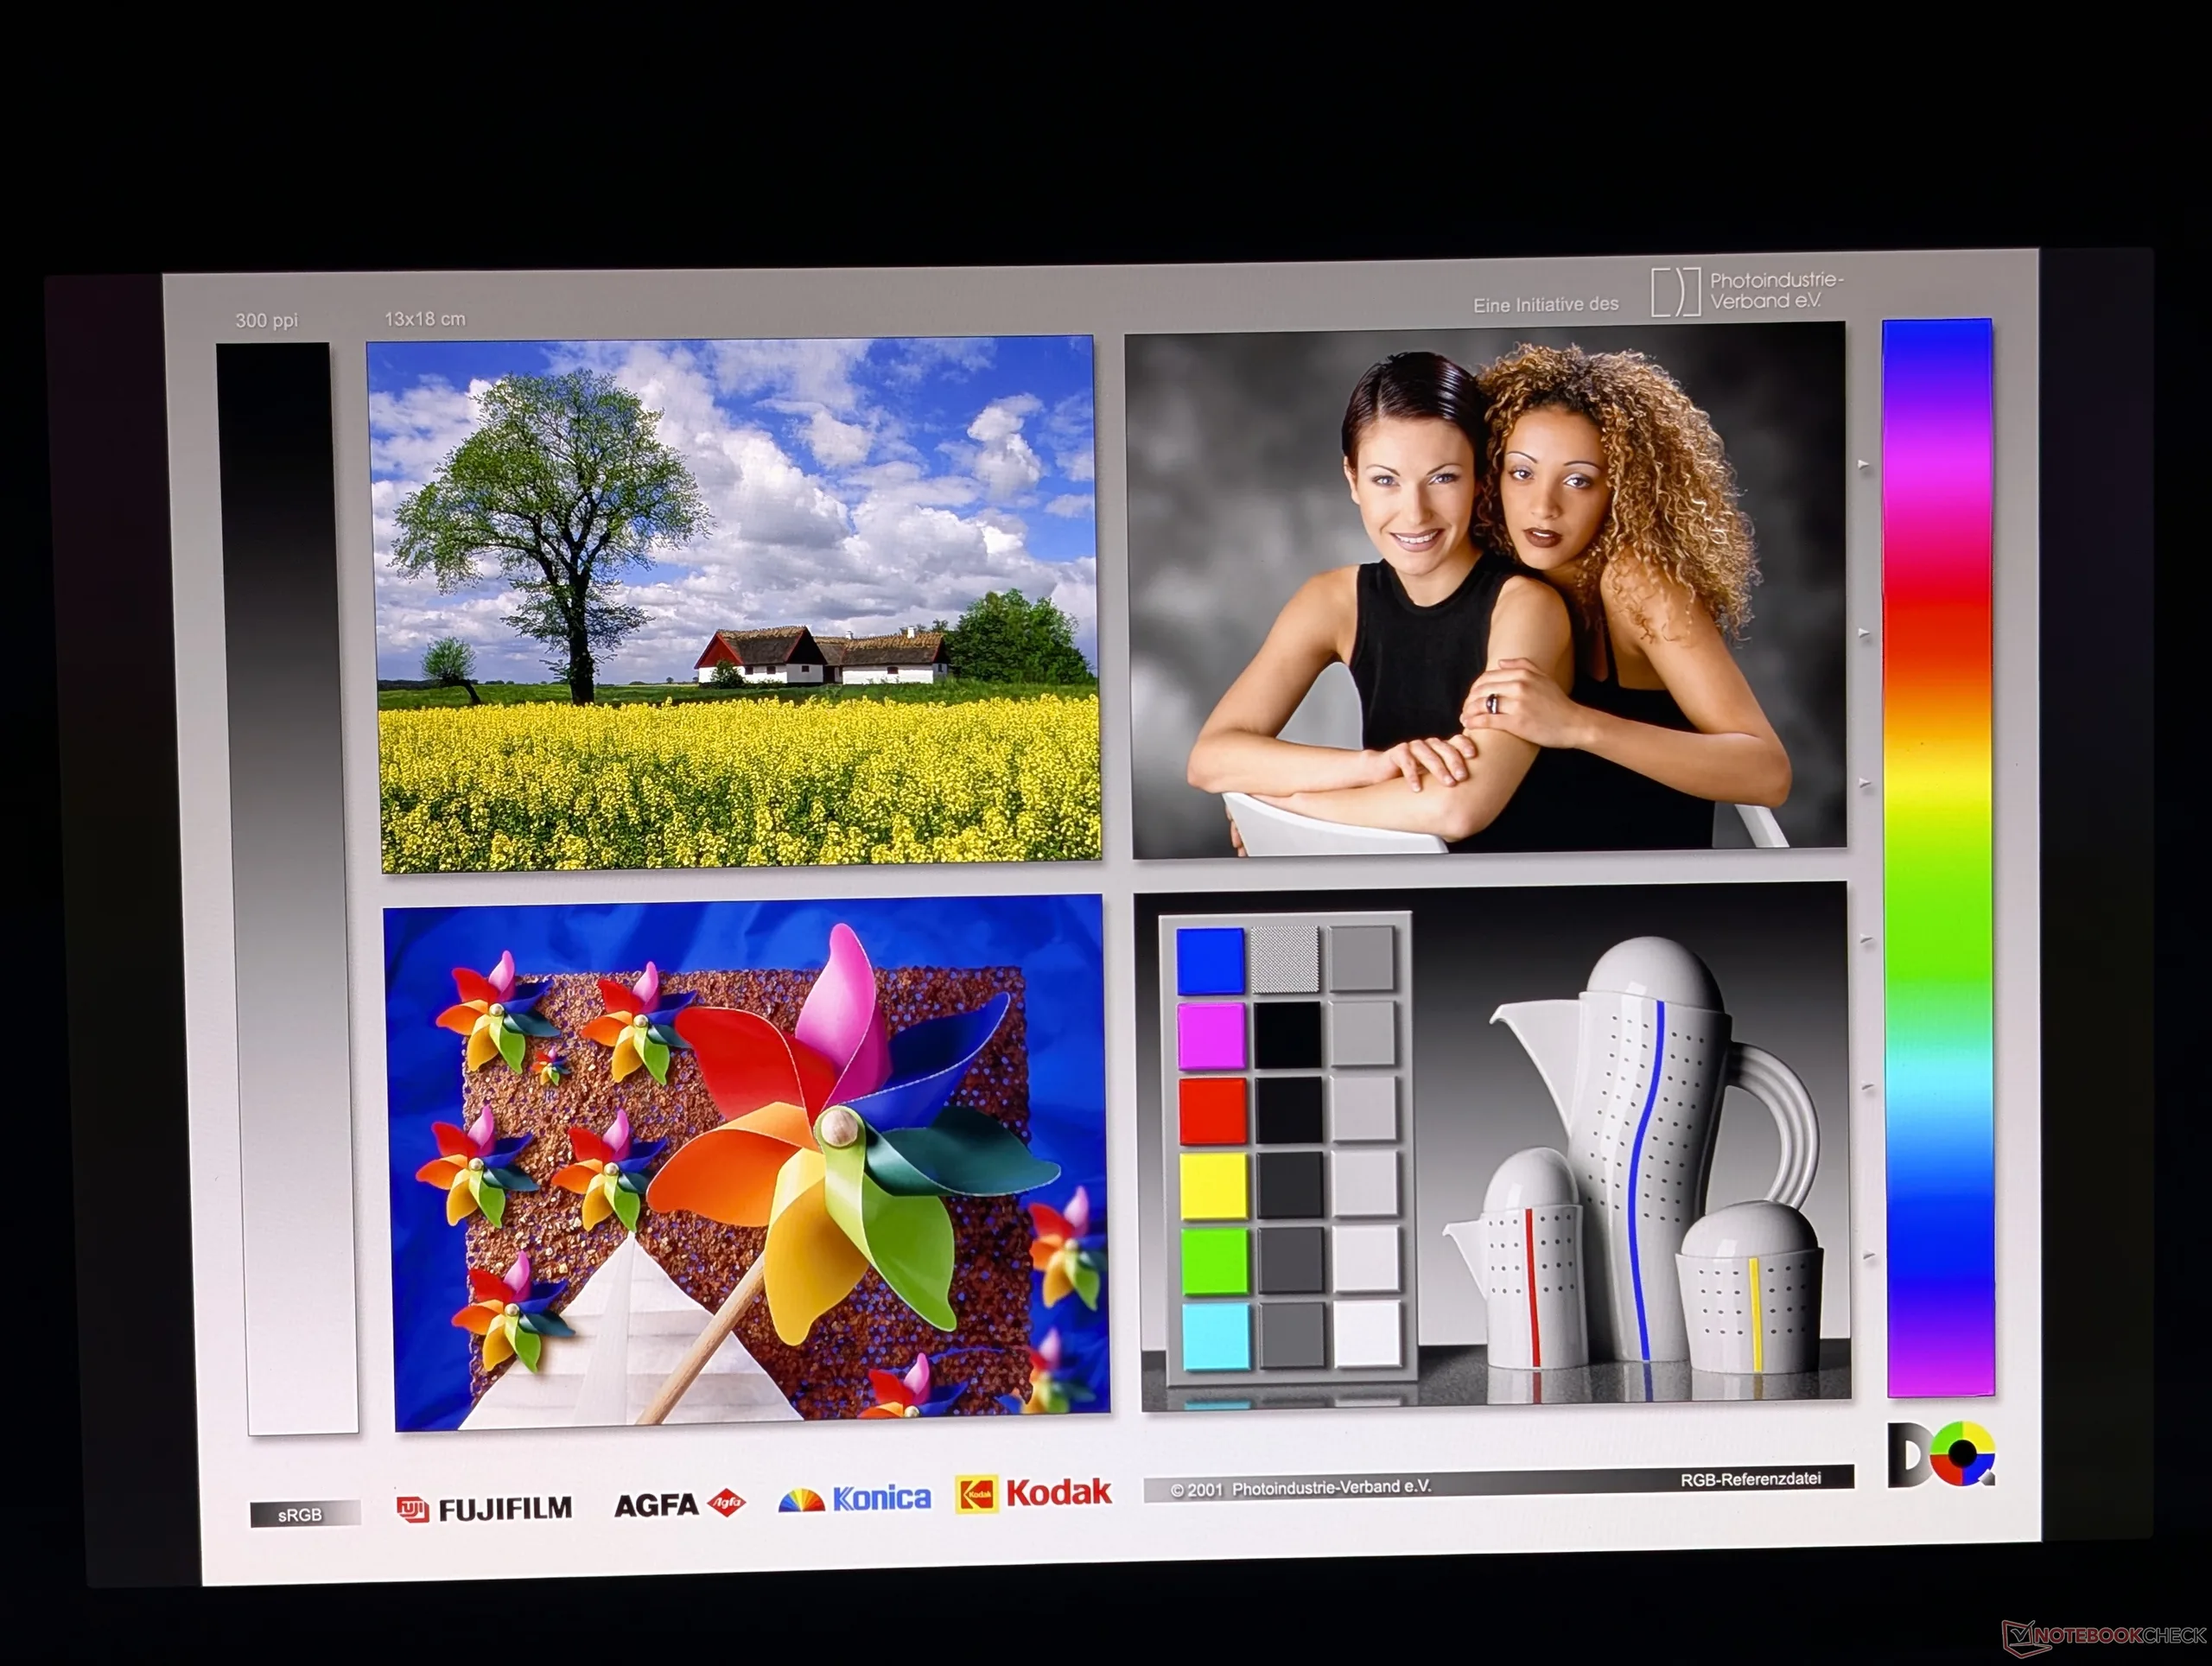
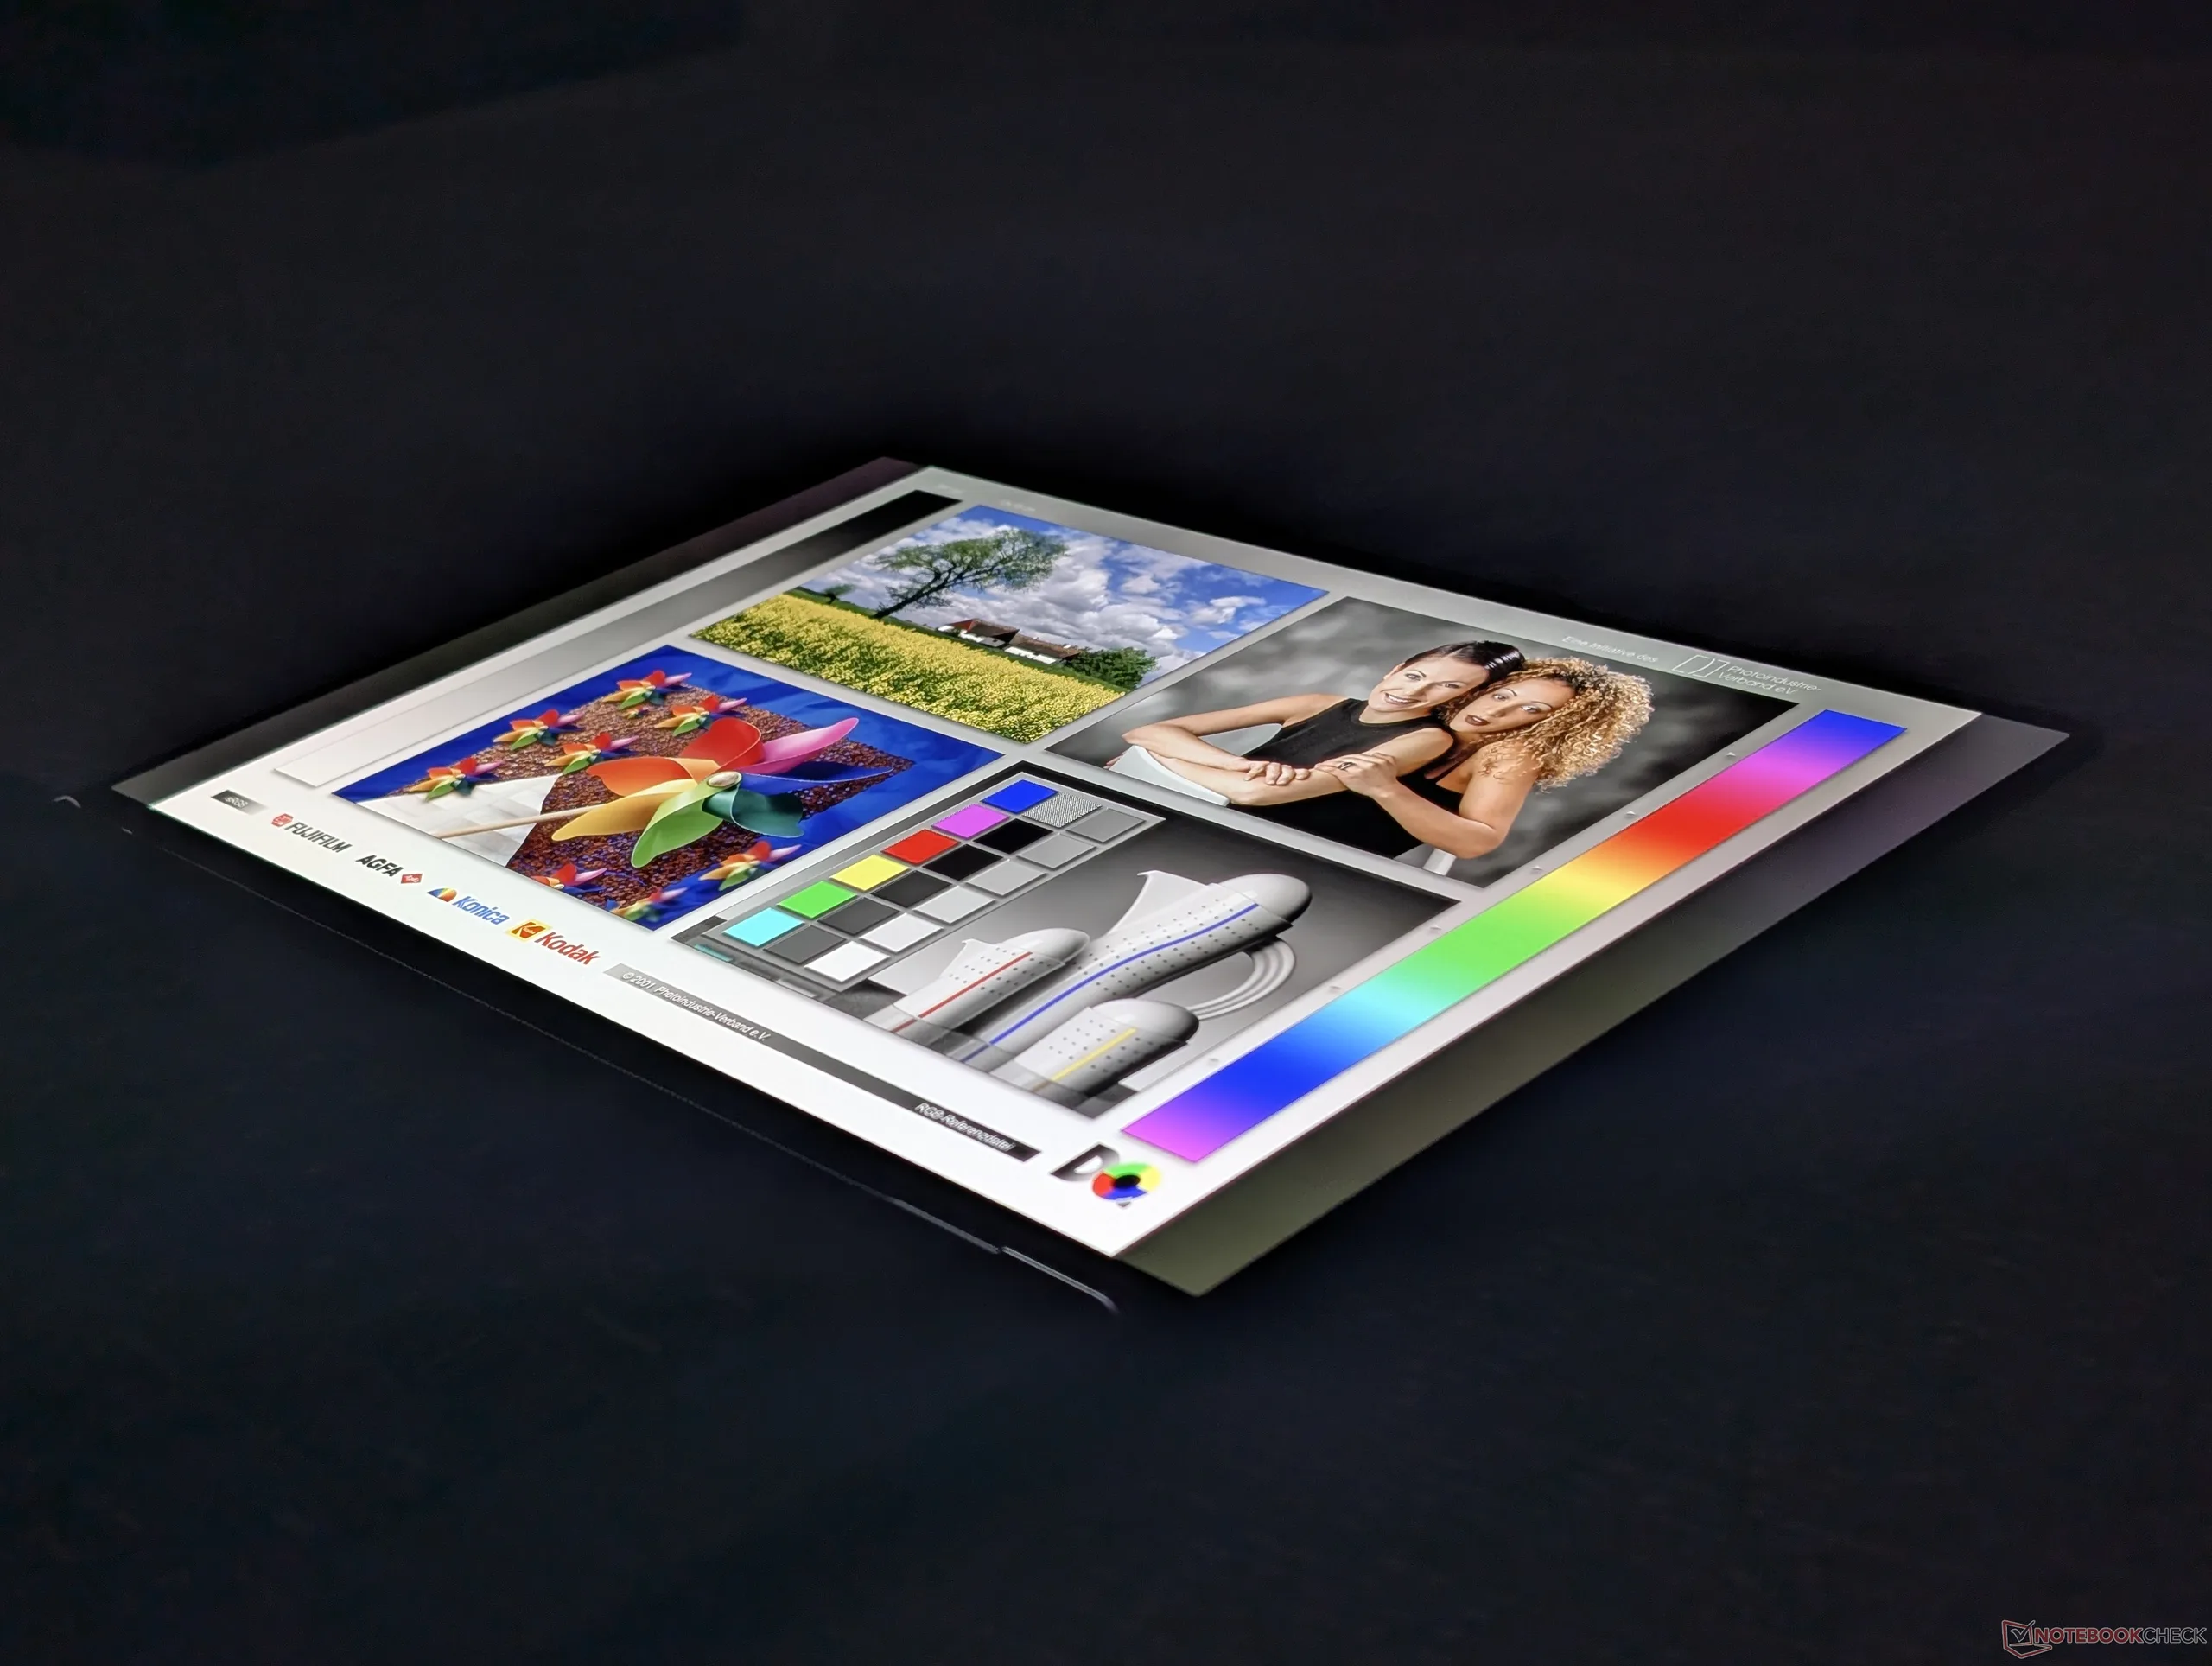
A tela OLED em tandem da nossa unidade é exatamente o mesmo painel Samsung ATNA60KA04-0 encontrado no 2025 Yoga Pro 9i 16 para a mesma experiência de visualização. Nossas próprias medições revelam um brilho central máximo de 931 nits no modo SDR e 1480 nits no modo HDR, o que faz dessa uma das telas mais brilhantes de qualquer laptop de 16 polegadas.
Lembre-se de que, embora o Advanced Optimus seja suportado, o G-Sync continua sendo omitido, pois a série Pro 9 não se destina principalmente a jogos.
| |||||||||||||||||||||||||
iluminação: 94 %
iluminação com acumulador: 930.9 cd/m²
Contraste: ∞:1 (Preto: 0 cd/m²)
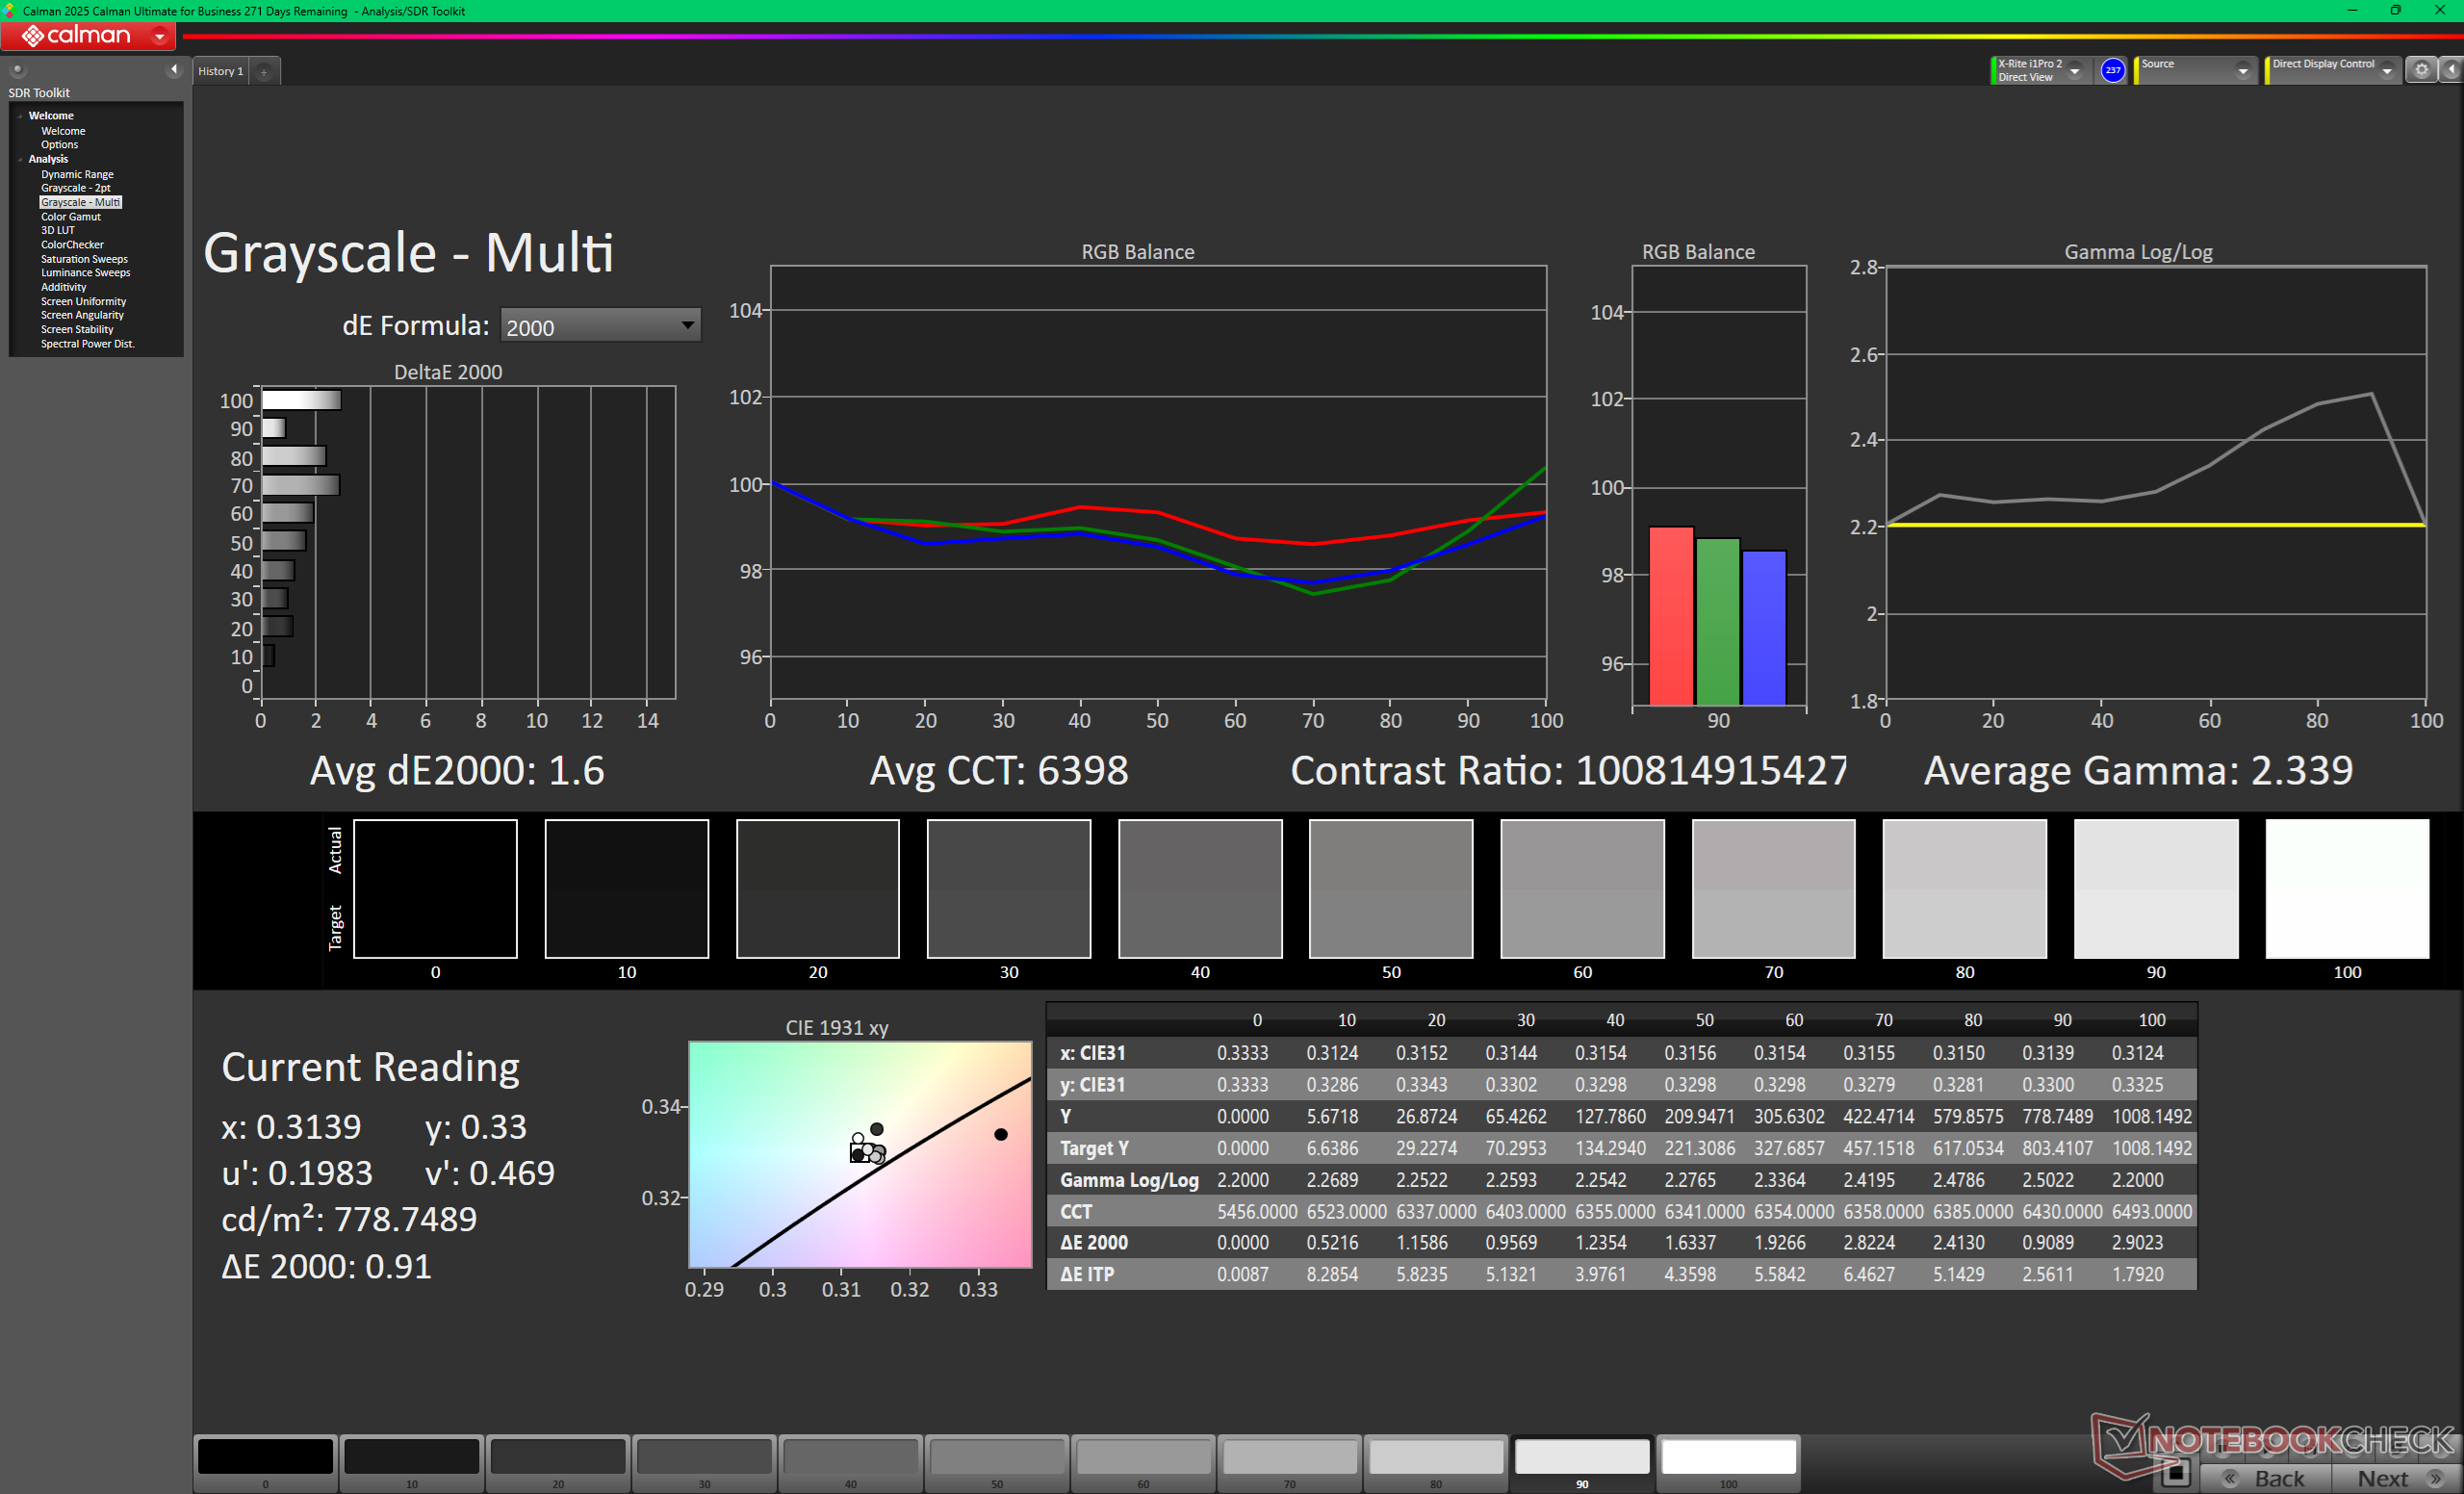
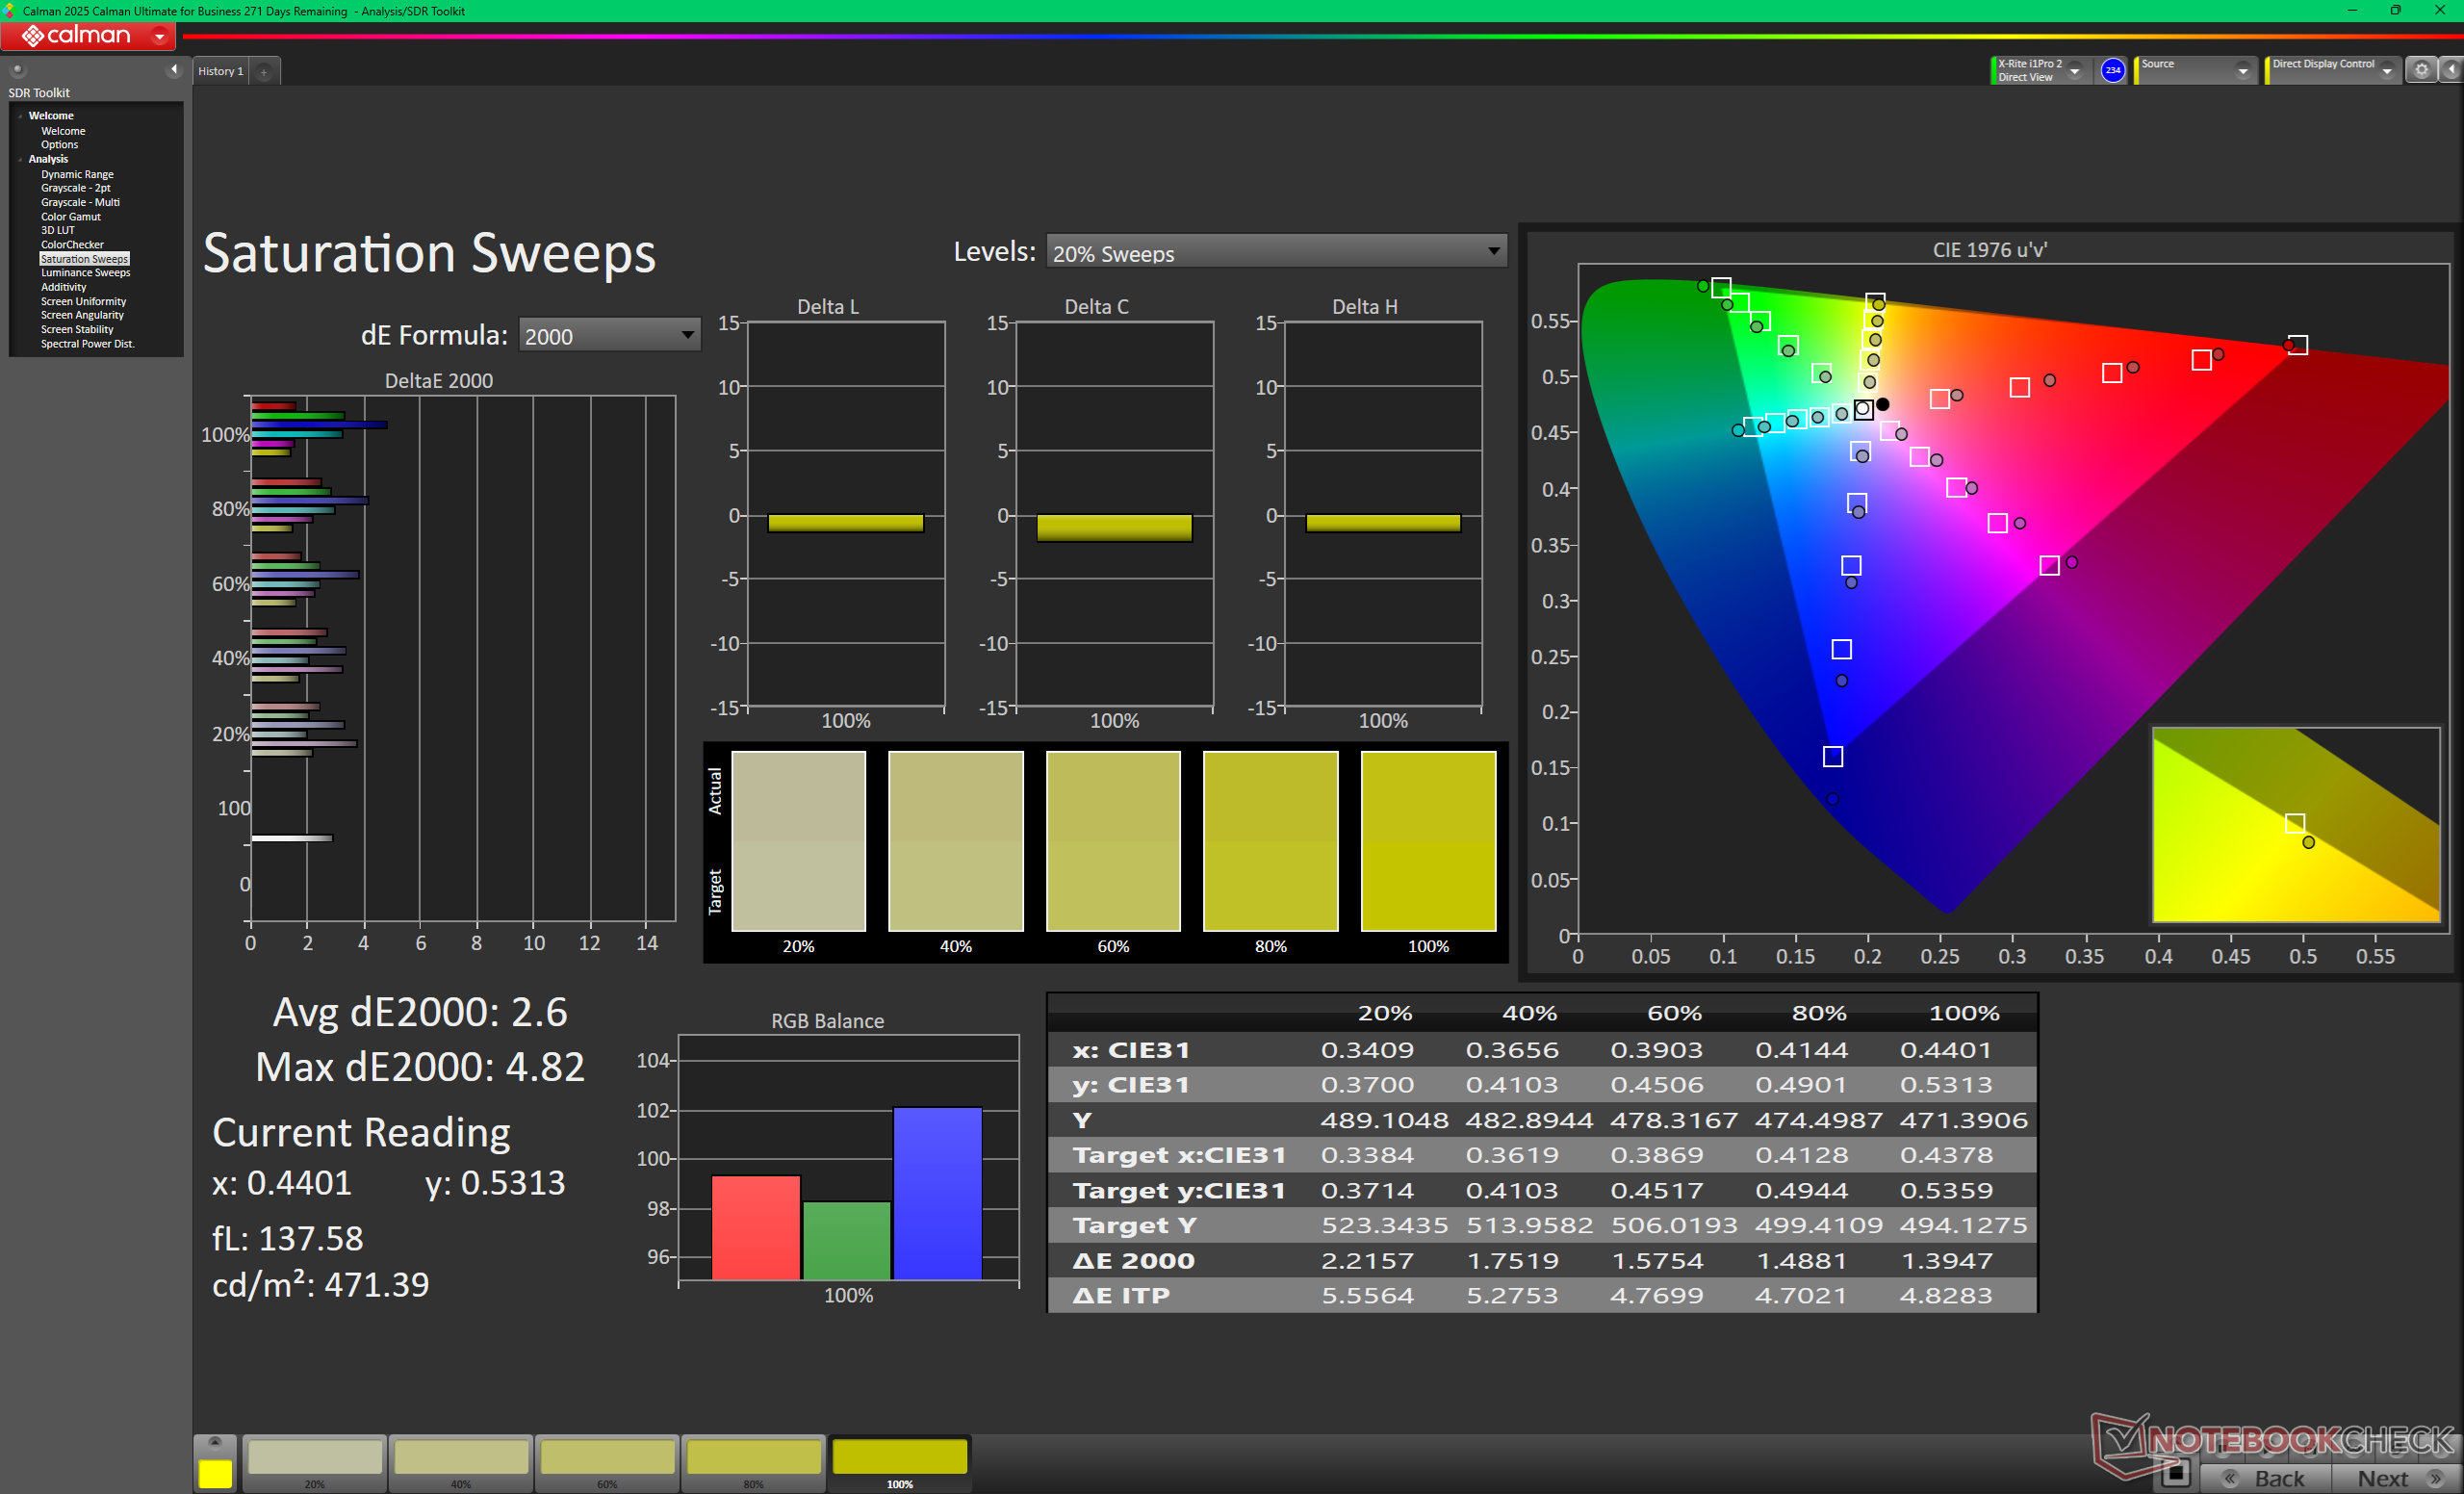
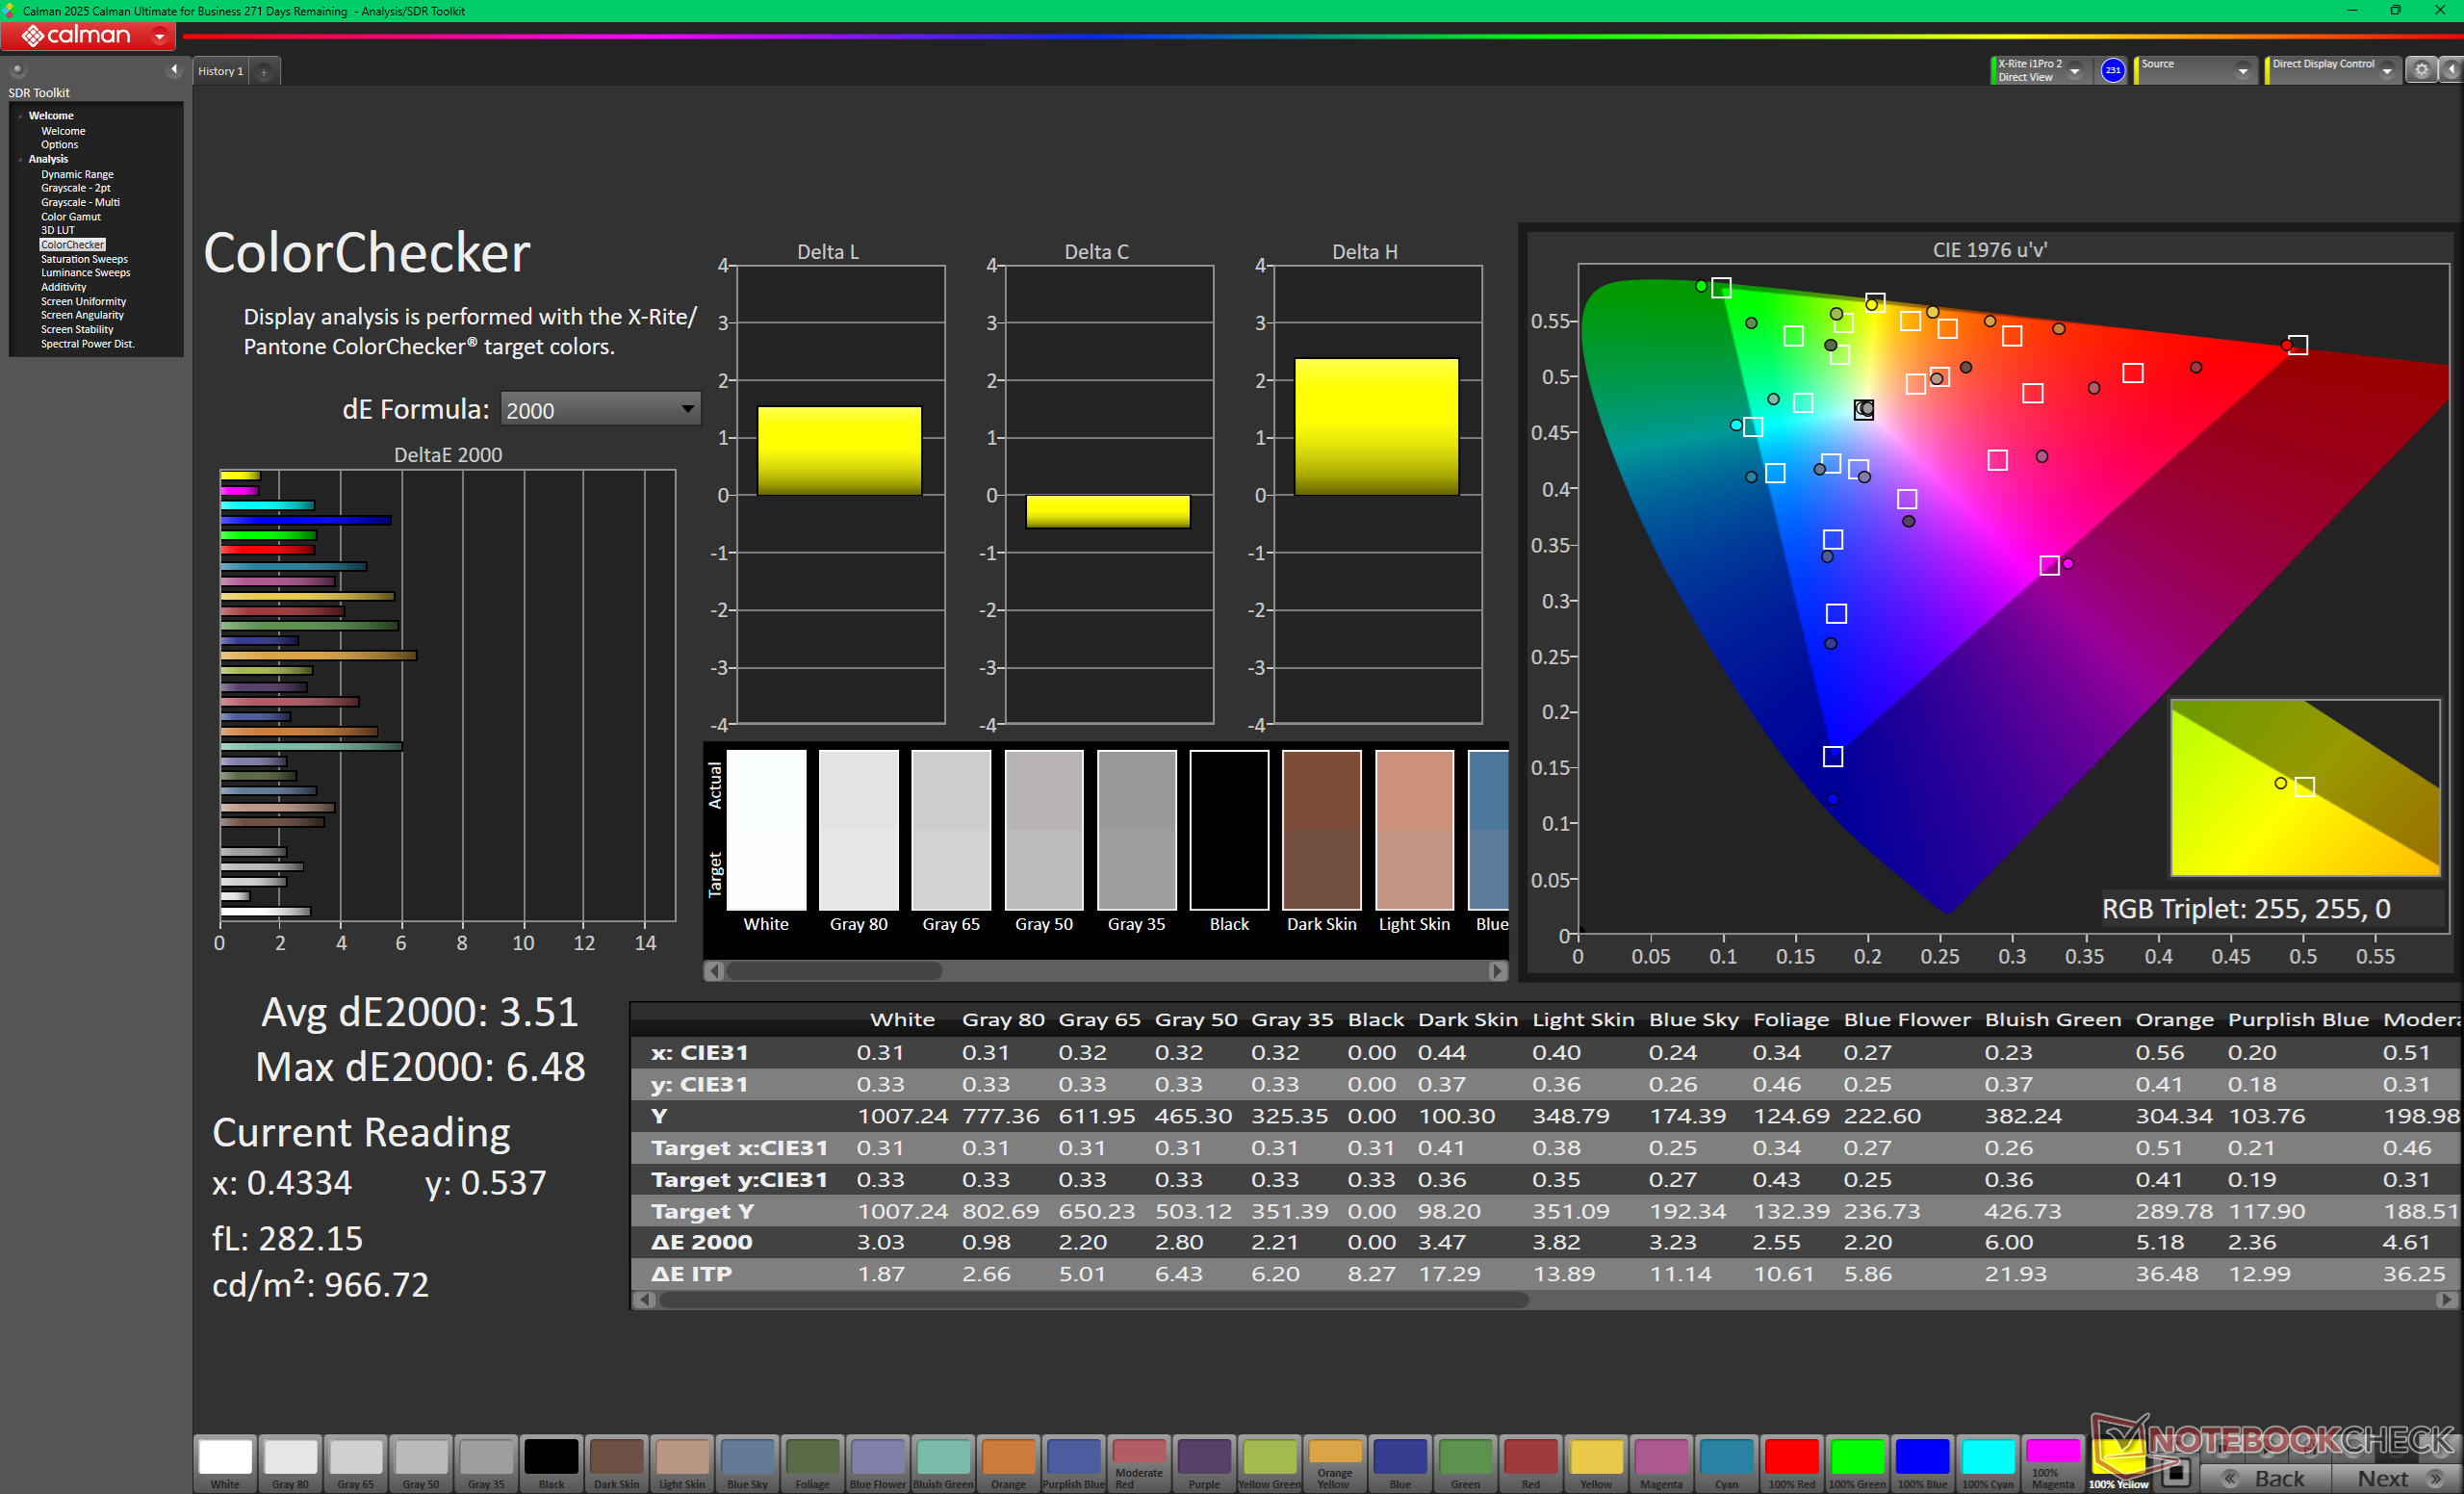
ΔE ColorChecker Calman: 3.51 | ∀{0.5-29.43 Ø4.71}
calibrated: 1.55
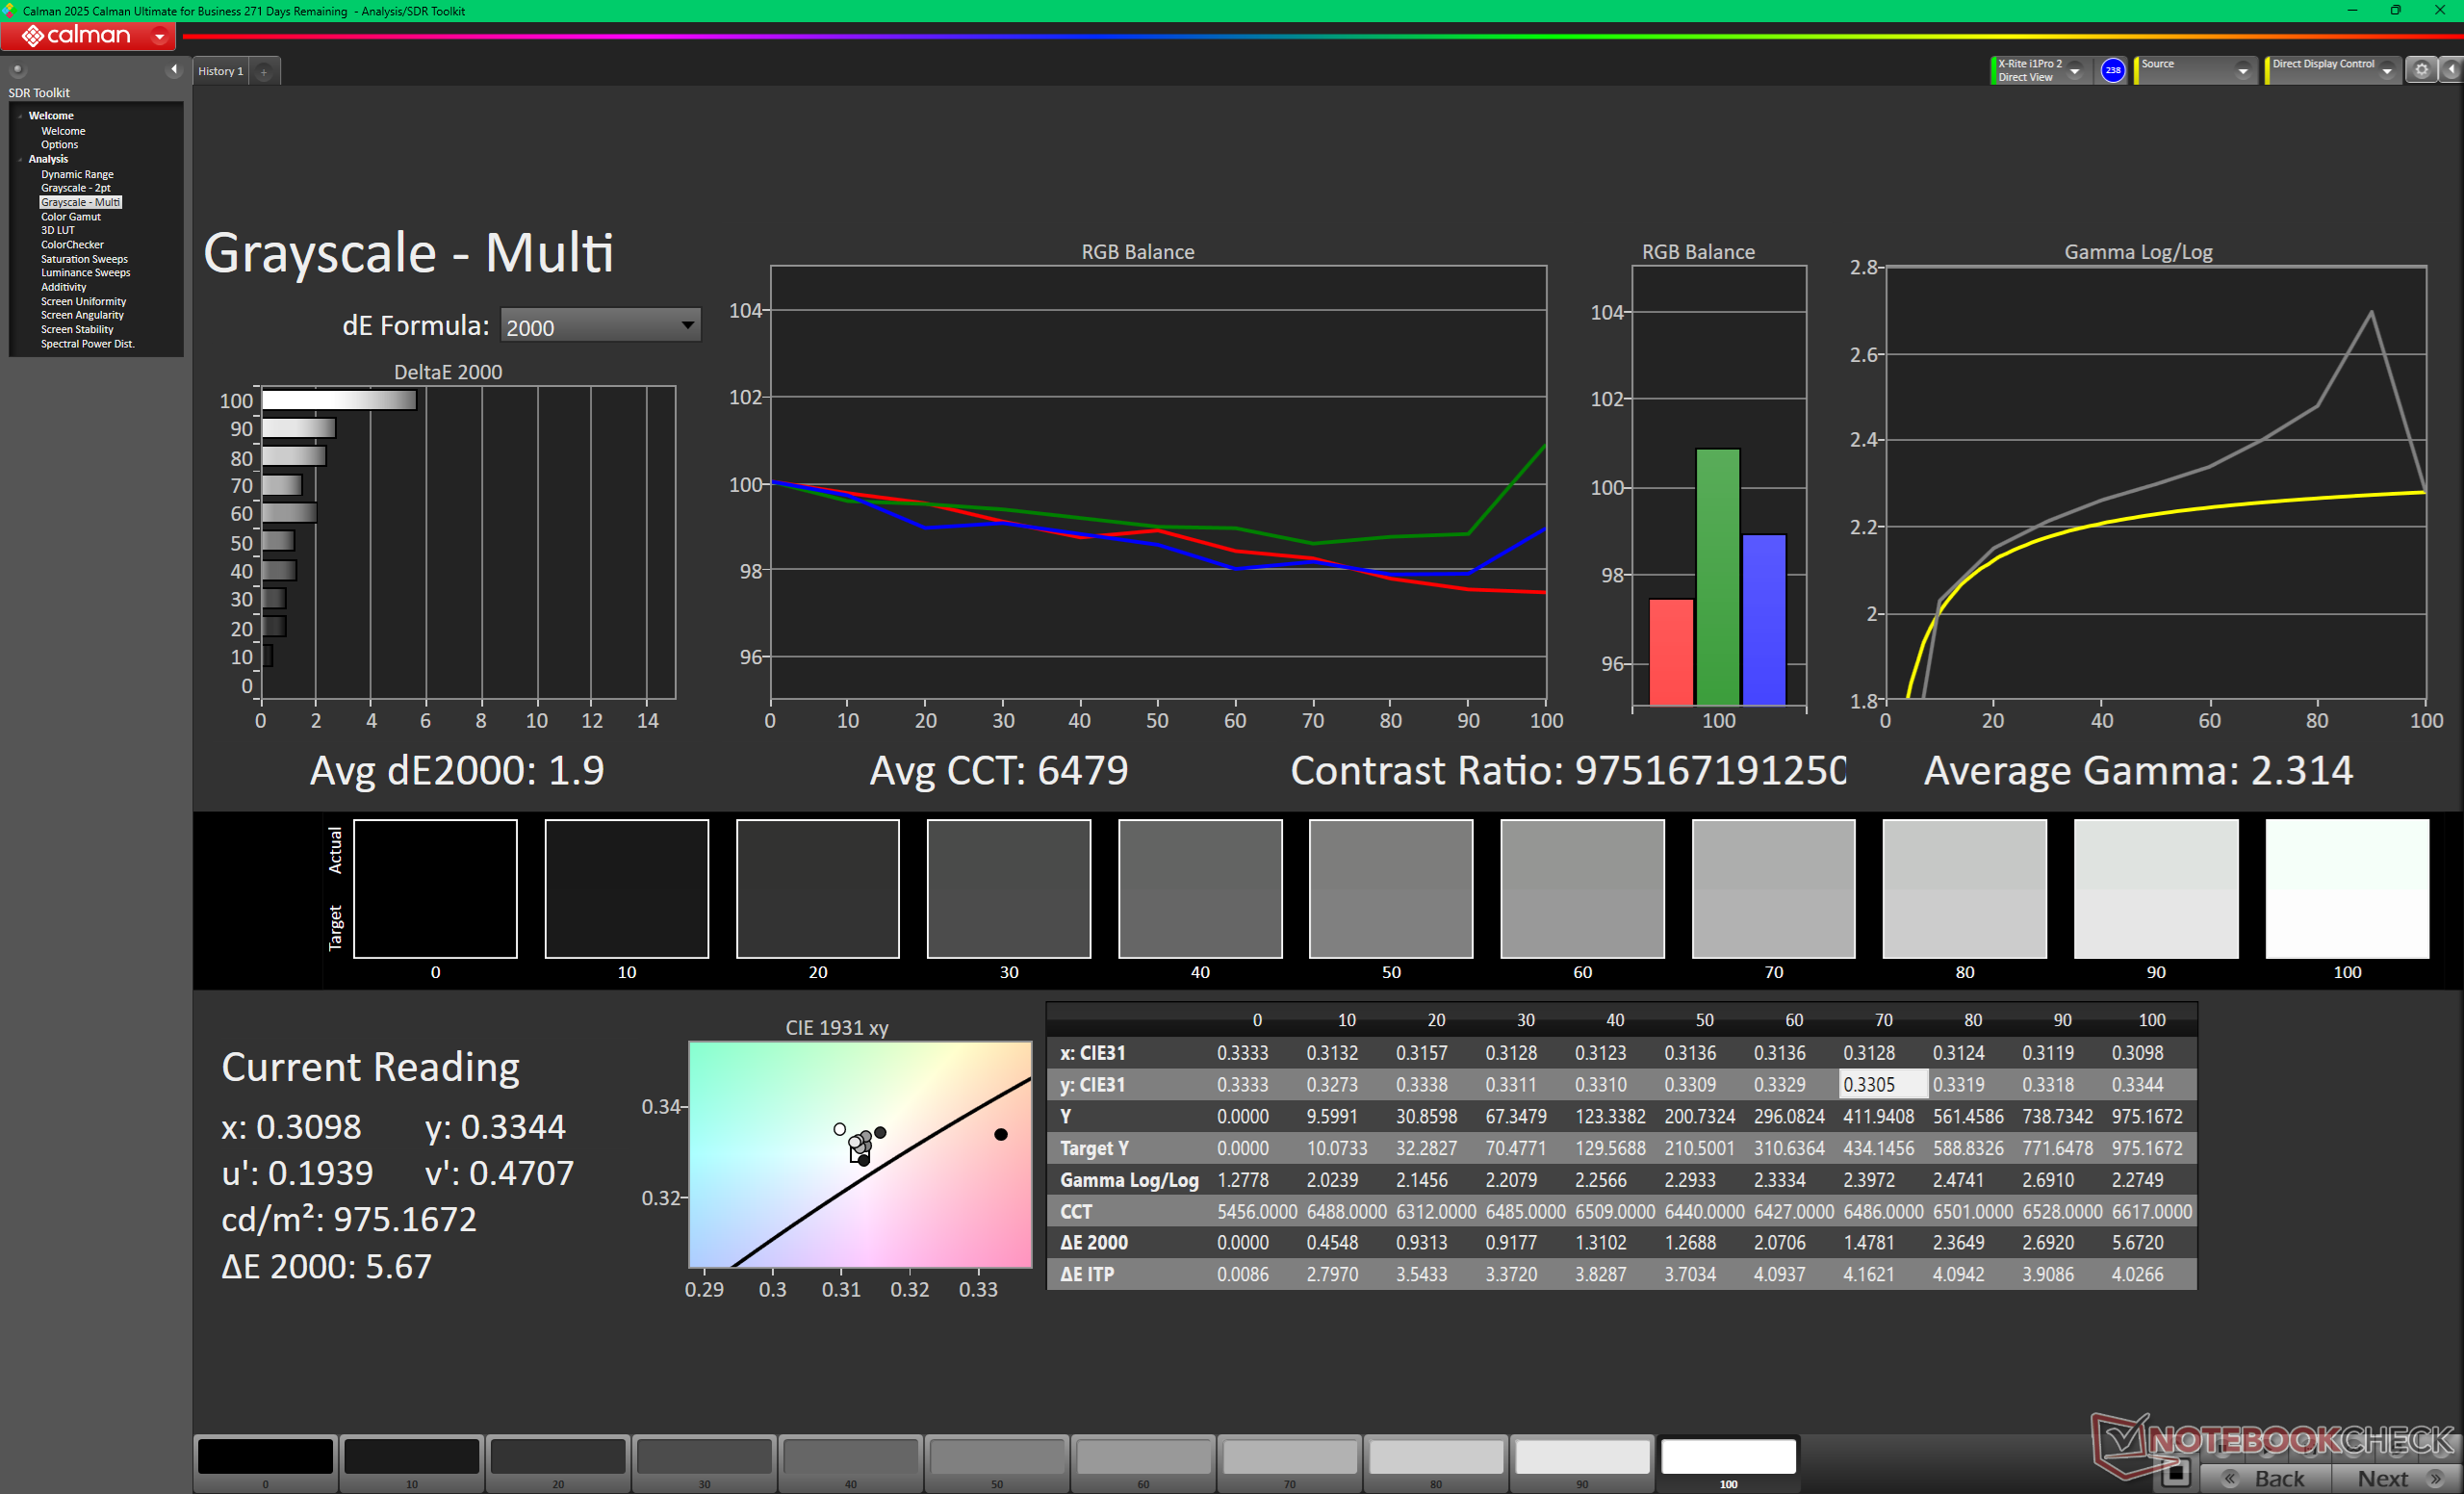
ΔE Greyscale Calman: 1.6 | ∀{0.09-98 Ø4.96}
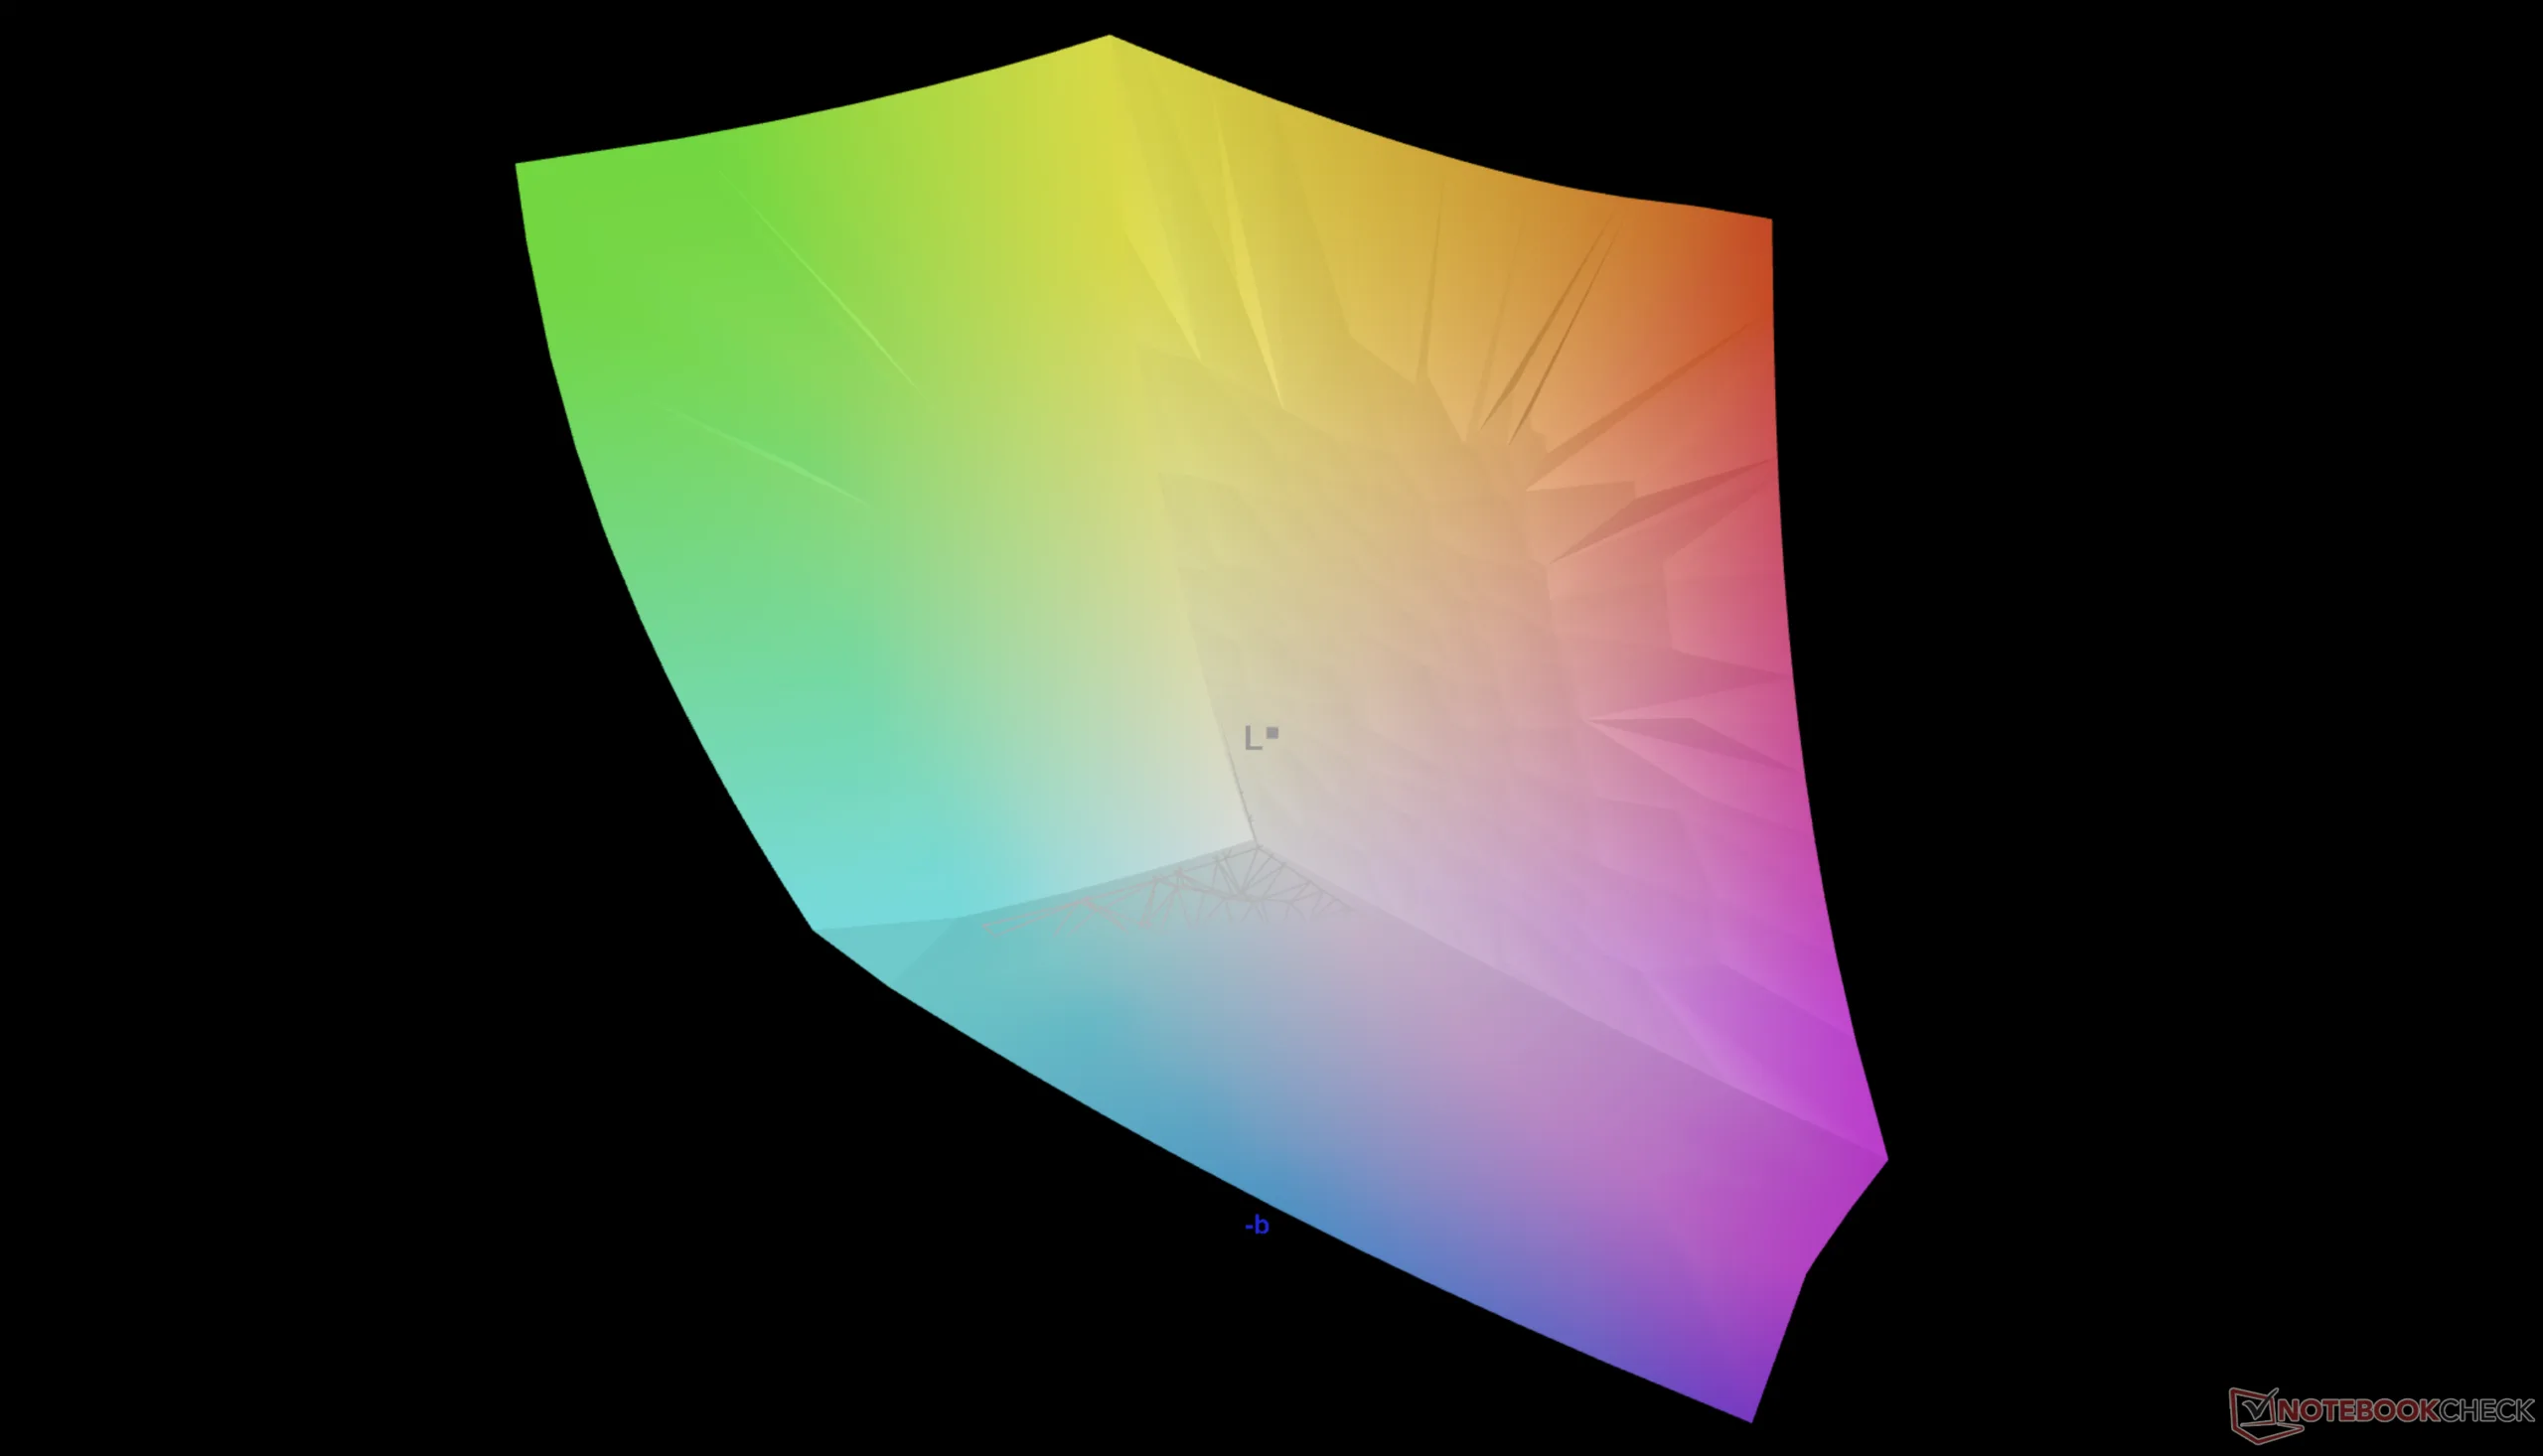
95.7% AdobeRGB 1998 (Argyll 3D)
100% sRGB (Argyll 3D)
98.8% Display P3 (Argyll 3D)
Gamma: 2.34
CCT: 6398 K
| Lenovo Pro 9 16IPH11 Samsung ATNA60KA04-0, Tandem OLED, 3200x2000, 16", 120 Hz | Lenovo Yoga Pro 9 16IAH10 RTX 5050 ATNA60HR04-0, OLED, 2880x1800, 16", 120 Hz | Dell XPS 16 Core Ultra X7 358H LG Philips 160WV1, OLED, 3200x2000, 16", 120 Hz | MSI Prestige 16 AI Evo B2HMG B160QAN03_R, IPS, 2560x1600, 16", 60 Hz | HP Omen Transcend 16-u1095ng ATNA60DL02-0 (SDC41A4), OLED, 2560x1600, 16", 240 Hz | Asus ProArt P16 H7606WP ATNA60CL10-0, OLED, 2880x1800, 16", 120 Hz | |
|---|---|---|---|---|---|---|
| Display | 1% | -5% | 1% | -2% | ||
| Display P3 Coverage (%) | 98.8 | 99.5 1% | 96.4 -2% | 99.8 1% | 99.5 1% | |
| sRGB Coverage (%) | 100 | 100 0% | 99.7 0% | 100 0% | 100 0% | |
| AdobeRGB 1998 Coverage (%) | 95.7 | 96.5 1% | 84.3 -12% | 97 1% | 89.5 -6% | |
| Response Times | -131% | -39% | -5878% | 71% | -17% | |
| Response Time Grey 50% / Grey 80% * (ms) | 0.58 ? | 0.65 ? -12% | 51.5 ? -8779% | 0.2 ? 66% | 0.63 ? -9% | |
| Response Time Black / White * (ms) | 0.79 ? | 0.87 ? -10% | 24.3 ? -2976% | 0.2 ? 75% | 0.63 ? 20% | |
| PWM Frequency (Hz) | 1173.2 | 1200 | 240.2 ? | 120 ? | 480 ? | |
| PWM Amplitude * (%) | 16 | 37 -131% | 31 -94% | 26 -63% | ||
| Screen | -26% | -15% | -92% | -29% | 8% | |
| Brightness middle (cd/m²) | 930.9 | 471.7 -49% | 395.4 -58% | 471 -49% | 390 -58% | 362 -61% |
| Brightness (cd/m²) | 947 | 474 -50% | 392 -59% | 455 -52% | 392 -59% | 363 -62% |
| Brightness Distribution (%) | 94 | 98 4% | 95 1% | 92 -2% | 98 4% | 99 5% |
| Black Level * (cd/m²) | 0.2 | 0.02 | ||||
| Colorchecker dE 2000 * | 3.51 | 3.53 -1% | 3.69 -5% | 5.8 -65% | 1.94 45% | 0.8 77% |
| Colorchecker dE 2000 max. * | 6.48 | 6.31 3% | 7.94 -23% | 10.8 -67% | 4.26 34% | 1.8 72% |
| Colorchecker dE 2000 calibrated * | 1.55 | 0.68 56% | 1.9 -23% | 4.21 -172% | ||
| Greyscale dE 2000 * | 1.6 | 2.6 -63% | 1.9 -19% | 7.8 -388% | 1.5 6% | 1.3 19% |
| Gamma | 2.34 94% | 2.24 98% | 2.28 96% | 2.07 106% | 2.221 99% | 2.2 100% |
| CCT | 6398 102% | 6292 103% | 6274 104% | 7262 90% | 6395 102% | 6741 96% |
| Contrast (:1) | 2355 | 19500 | ||||
| Média Total (Programa/Configurações) | -79% /
-41% | -18% /
-17% | -1992% /
-1035% | 14% /
-5% | -4% /
-1% |
* ... menor é melhor

Exibir tempos de resposta
| ↔ Tempo de resposta preto para branco | ||
|---|---|---|
| 0.79 ms ... ascensão ↗ e queda ↘ combinadas | ↗ 0.37 ms ascensão | 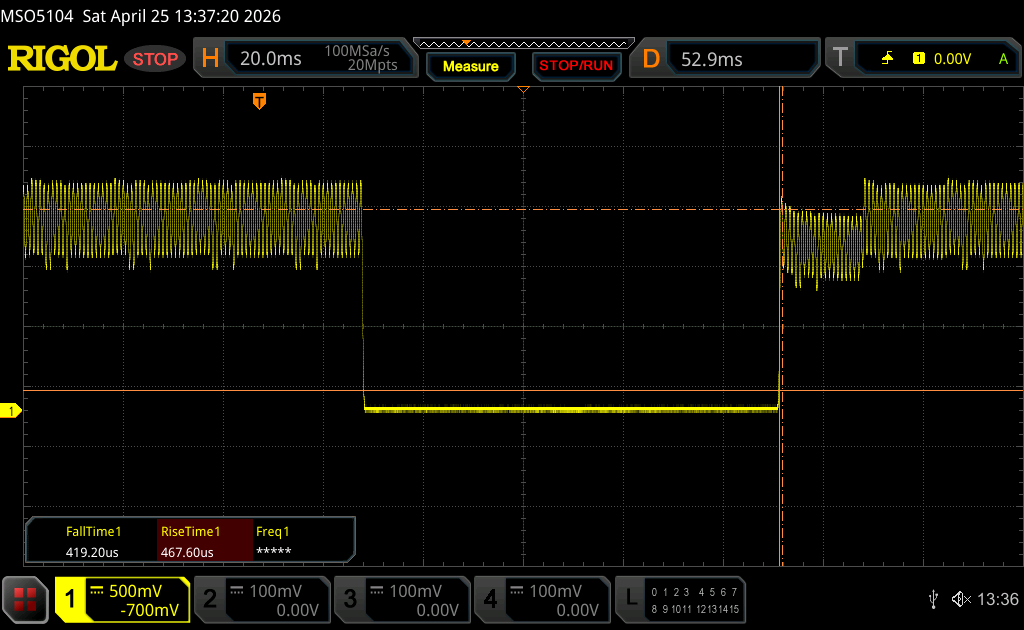 |
| ↘ 0.42 ms queda | ||
| A tela mostra taxas de resposta muito rápidas em nossos testes e deve ser muito adequada para jogos em ritmo acelerado. Em comparação, todos os dispositivos testados variam de 0.1 (mínimo) a 240 (máximo) ms. » 2 % de todos os dispositivos são melhores. Isso significa que o tempo de resposta medido é melhor que a média de todos os dispositivos testados (19.8 ms). | ||
| ↔ Tempo de resposta 50% cinza a 80% cinza | ||
| 0.58 ms ... ascensão ↗ e queda ↘ combinadas | ↗ 0.3 ms ascensão | 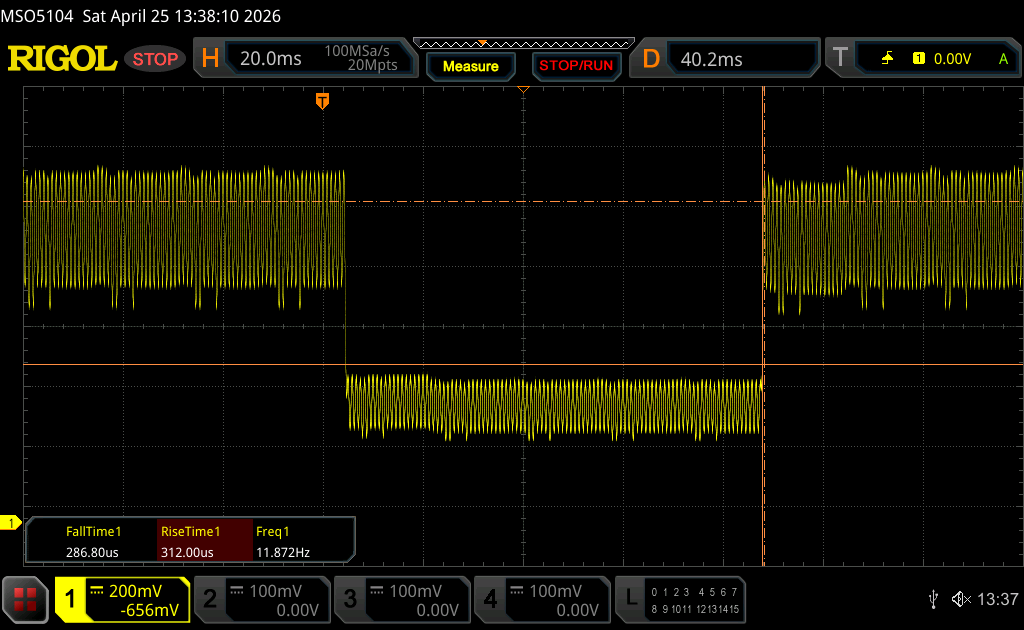 |
| ↘ 0.28 ms queda | ||
| A tela mostra taxas de resposta muito rápidas em nossos testes e deve ser muito adequada para jogos em ritmo acelerado. Em comparação, todos os dispositivos testados variam de 0.165 (mínimo) a 636 (máximo) ms. » 1 % de todos os dispositivos são melhores. Isso significa que o tempo de resposta medido é melhor que a média de todos os dispositivos testados (31 ms). | ||
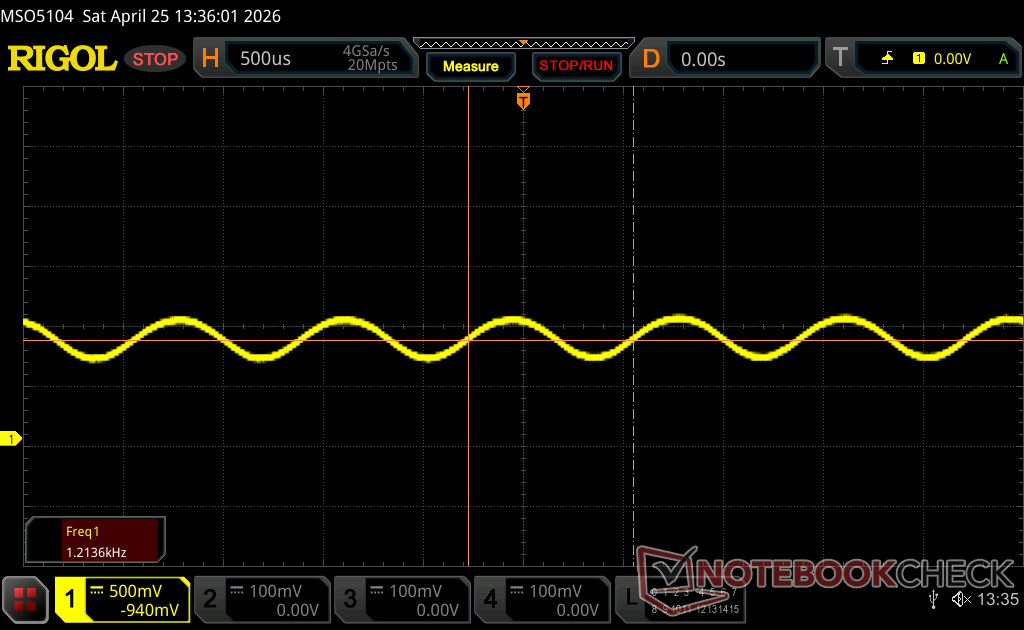
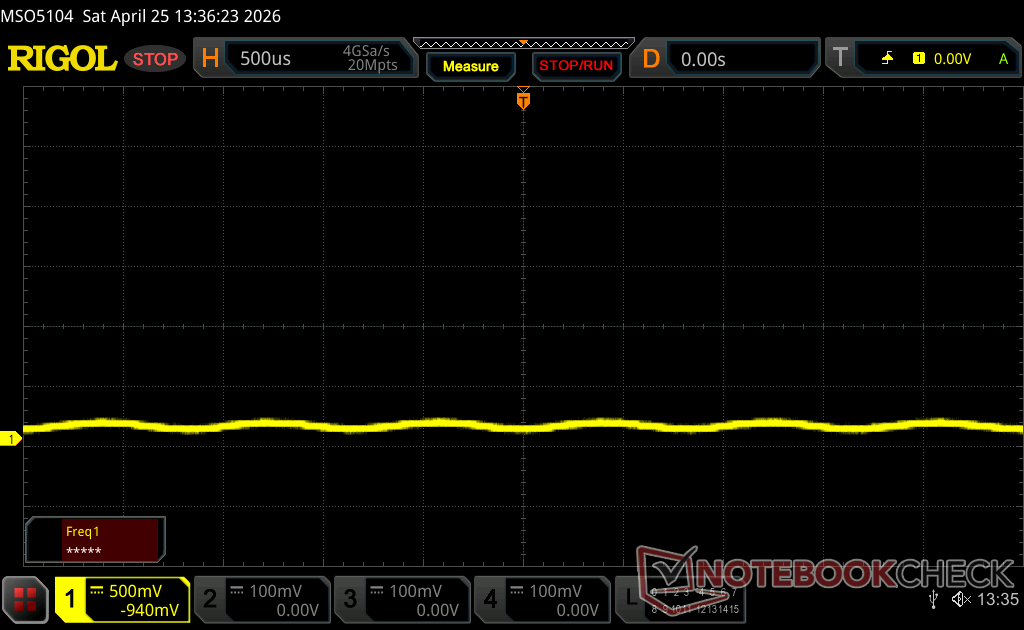
Cintilação da tela / PWM (modulação por largura de pulso)
| Tela tremeluzindo/PWM detectado | 1173.2 Hz Amplitude: 16 % | 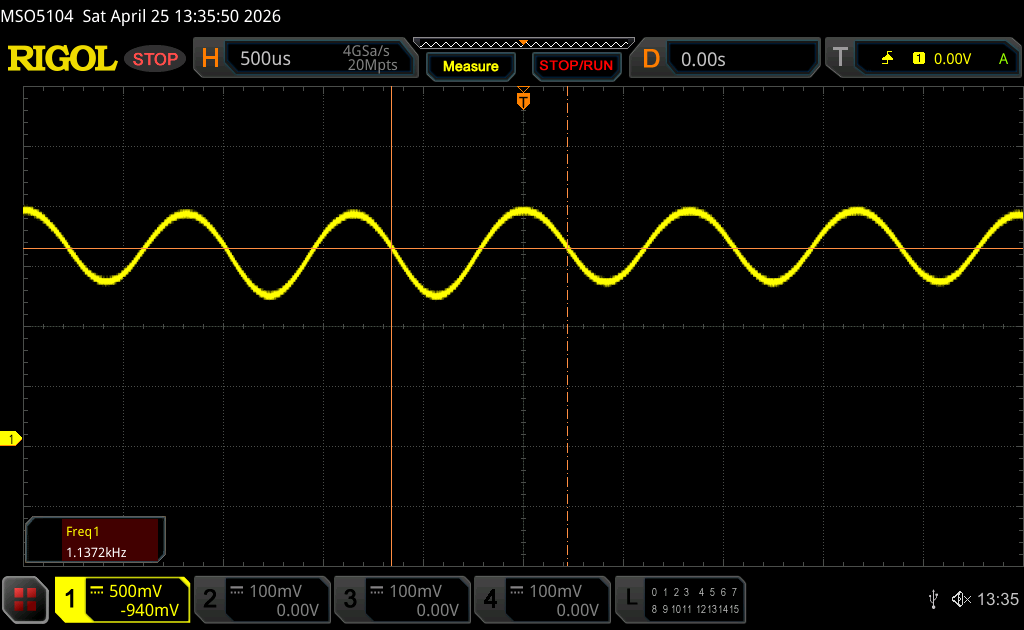 | |
A luz de fundo da tela pisca em 1173.2 Hz (pior caso, por exemplo, utilizando PWM) . A frequência de 1173.2 Hz é bastante alta, então a maioria dos usuários sensíveis ao PWM não deve notar nenhuma oscilação. [pwm_comparison] Em comparação: 52 % de todos os dispositivos testados não usam PWM para escurecer a tela. Se PWM foi detectado, uma média de 7757 (mínimo: 5 - máximo: 343500) Hz foi medida. | |||


Desempenho
Condições de teste
Configuramos o Windows para o modo de desempenho e o modo de gráficos discretos antes de executar os benchmarks abaixo.
Processador
O novo Core Ultra 9 386H infelizmente oferece pouca ou nenhuma vantagem de desempenho em relação à geração anterior Core Ultra 9 285H da geração anterior, conforme demonstrado em nossos gráficos de comparação abaixo. Na verdade, a nova CPU apresenta até mesmo menos cache L2 e L3 do que sua antecessora. Entretanto, ela compensa isso com maior eficiência de fabricação (1,8 nm vs. 5 nm) e desempenho mais rápido da NPU integrada (50 vs. 13 TOPS).
Cinebench R15 Multi Loop
Cinebench R23: Multi Core | Single Core
Cinebench R20: CPU (Multi Core) | CPU (Single Core)
Cinebench R15: CPU Multi 64Bit | CPU Single 64Bit
Blender: v2.79 BMW27 CPU
7-Zip 18.03: 7z b 4 | 7z b 4 -mmt1
Geekbench 6.7: Multi-Core | Single-Core
Geekbench 5.5: Multi-Core | Single-Core
HWBOT x265 Benchmark v2.2: 4k Preset
LibreOffice : 20 Documents To PDF
R Benchmark 2.5: Overall mean
* ... menor é melhor
AIDA64: FP32 Ray-Trace | FPU Julia | CPU SHA3 | CPU Queen | FPU SinJulia | FPU Mandel | CPU AES | CPU ZLib | FP64 Ray-Trace | CPU PhotoWorxx | CPU CheckMate
| Performance rating | |
| Asus ProArt P16 H7606WP -1! | |
| Lenovo Pro 9 16IPH11 -1! | |
| Lenovo Yoga Pro 9 16IAH10 RTX 5050 -1! | |
| HP Omen Transcend 16-u1095ng -1! | |
| Média Intel Core Ultra 9 386H -1! | |
| Dell XPS 16 Core Ultra X7 358H -1! | |
| MSI Prestige 16 AI Evo B2HMG -1! | |
| AIDA64 / FP32 Ray-Trace | |
| Asus ProArt P16 H7606WP (v6.92.6600) | |
| Lenovo Yoga Pro 9 16IAH10 RTX 5050 (v6.92.6600) | |
| Lenovo Pro 9 16IPH11 (v8.20.8100) | |
| MSI Prestige 16 AI Evo B2HMG (v6.92.6600) | |
| Média Intel Core Ultra 9 386H (10001 - 21727, n=8) | |
| HP Omen Transcend 16-u1095ng (v6.92.6600) | |
| Dell XPS 16 Core Ultra X7 358H (v8.20.8100) | |
| AIDA64 / FPU Julia | |
| Asus ProArt P16 H7606WP (v6.92.6600) | |
| Lenovo Yoga Pro 9 16IAH10 RTX 5050 (v6.92.6600) | |
| Lenovo Pro 9 16IPH11 (v8.20.8100) | |
| Média Intel Core Ultra 9 386H (53370 - 113595, n=8) | |
| MSI Prestige 16 AI Evo B2HMG (v6.92.6600) | |
| HP Omen Transcend 16-u1095ng (v6.92.6600) | |
| Dell XPS 16 Core Ultra X7 358H (v8.20.8100) | |
| AIDA64 / CPU SHA3 | |
| Asus ProArt P16 H7606WP (v6.92.6600) | |
| Lenovo Pro 9 16IPH11 (v8.20.8100) | |
| Lenovo Yoga Pro 9 16IAH10 RTX 5050 (v6.92.6600) | |
| Média Intel Core Ultra 9 386H (2776 - 5604, n=8) | |
| MSI Prestige 16 AI Evo B2HMG (v6.92.6600) | |
| HP Omen Transcend 16-u1095ng (v6.92.6600) | |
| Dell XPS 16 Core Ultra X7 358H (v8.20.8100) | |
| AIDA64 / CPU Queen | |
| HP Omen Transcend 16-u1095ng (v6.92.6600) | |
| Asus ProArt P16 H7606WP (v6.92.6600) | |
| MSI Prestige 16 AI Evo B2HMG (v6.92.6600) | |
| Lenovo Yoga Pro 9 16IAH10 RTX 5050 (v6.92.6600) | |
| AIDA64 / FPU SinJulia | |
| Asus ProArt P16 H7606WP (v6.92.6600) | |
| HP Omen Transcend 16-u1095ng (v6.92.6600) | |
| Lenovo Yoga Pro 9 16IAH10 RTX 5050 (v6.92.6600) | |
| MSI Prestige 16 AI Evo B2HMG (v6.92.6600) | |
| Lenovo Pro 9 16IPH11 (v8.20.8100) | |
| Dell XPS 16 Core Ultra X7 358H (v8.20.8100) | |
| Média Intel Core Ultra 9 386H (5314 - 7332, n=8) | |
| AIDA64 / FPU Mandel | |
| Asus ProArt P16 H7606WP (v6.92.6600) | |
| Lenovo Yoga Pro 9 16IAH10 RTX 5050 (v6.92.6600) | |
| Lenovo Pro 9 16IPH11 (v8.20.8100) | |
| Média Intel Core Ultra 9 386H (28414 - 61578, n=8) | |
| MSI Prestige 16 AI Evo B2HMG (v6.92.6600) | |
| Dell XPS 16 Core Ultra X7 358H (v8.20.8100) | |
| HP Omen Transcend 16-u1095ng (v6.92.6600) | |
| AIDA64 / CPU AES | |
| Asus ProArt P16 H7606WP (v6.92.6600) | |
| HP Omen Transcend 16-u1095ng (v6.92.6600) | |
| Lenovo Yoga Pro 9 16IAH10 RTX 5050 (v6.92.6600) | |
| Lenovo Pro 9 16IPH11 (v8.20.8100) | |
| MSI Prestige 16 AI Evo B2HMG (v6.92.6600) | |
| Média Intel Core Ultra 9 386H (46362 - 72112, n=8) | |
| Dell XPS 16 Core Ultra X7 358H (v8.20.8100) | |
| AIDA64 / CPU ZLib | |
| Asus ProArt P16 H7606WP (v6.92.6600) | |
| HP Omen Transcend 16-u1095ng (v6.92.6600) | |
| Lenovo Yoga Pro 9 16IAH10 RTX 5050 (v6.92.6600) | |
| Lenovo Pro 9 16IPH11 (v8.20.8100) | |
| Média Intel Core Ultra 9 386H (669 - 1271, n=8) | |
| MSI Prestige 16 AI Evo B2HMG (v6.92.6600) | |
| Dell XPS 16 Core Ultra X7 358H (v8.20.8100) | |
| AIDA64 / FP64 Ray-Trace | |
| Asus ProArt P16 H7606WP (v6.92.6600) | |
| Lenovo Yoga Pro 9 16IAH10 RTX 5050 (v6.92.6600) | |
| Lenovo Pro 9 16IPH11 (v8.20.8100) | |
| MSI Prestige 16 AI Evo B2HMG (v6.92.6600) | |
| Média Intel Core Ultra 9 386H (5138 - 11627, n=8) | |
| HP Omen Transcend 16-u1095ng (v6.92.6600) | |
| Dell XPS 16 Core Ultra X7 358H (v8.20.8100) | |
| AIDA64 / CPU PhotoWorxx | |
| Dell XPS 16 Core Ultra X7 358H (v8.20.8100) | |
| Média Intel Core Ultra 9 386H (54042 - 89891, n=8) | |
| Lenovo Pro 9 16IPH11 (v8.20.8100) | |
| Lenovo Yoga Pro 9 16IAH10 RTX 5050 (v6.92.6600) | |
| MSI Prestige 16 AI Evo B2HMG (v6.92.6600) | |
| HP Omen Transcend 16-u1095ng (v6.92.6600) | |
| Asus ProArt P16 H7606WP (v6.92.6600) | |
| AIDA64 / CPU CheckMate | |
| Lenovo Pro 9 16IPH11 (v8.20.8100) | |
| Média Intel Core Ultra 9 386H (4051 - 4858, n=7) | |
| Dell XPS 16 Core Ultra X7 358H (v8.20.8100) | |
Desempenho do sistema
PCMark 10: Score | Essentials | Productivity | Digital Content Creation
CrossMark: Overall | Productivity | Creativity | Responsiveness
WebXPRT 3: Overall
WebXPRT 4: Overall
Mozilla Kraken 1.1: Total
Geekbench AI: Half Precision GPU 1.7 | Single Precision GPU 1.7 | Quantized GPU 1.7
| Performance rating | |
| Média Intel Core Ultra 9 386H, NVIDIA GeForce RTX 5060 Laptop | |
| Lenovo Pro 9 16IPH11 | |
| Lenovo Yoga Pro 9 16IAH10 RTX 5050 | |
| MSI Prestige 16 AI Evo B2HMG -3! | |
| Dell XPS 16 Core Ultra X7 358H | |
| Asus ProArt P16 H7606WP -3! | |
| HP Omen Transcend 16-u1095ng -8! | |
| PCMark 10 / Score | |
| Dell XPS 16 Core Ultra X7 358H | |
| Lenovo Yoga Pro 9 16IAH10 RTX 5050 | |
| Lenovo Pro 9 16IPH11 | |
| Média Intel Core Ultra 9 386H, NVIDIA GeForce RTX 5060 Laptop (9465 - 9484, n=2) | |
| Asus ProArt P16 H7606WP | |
| HP Omen Transcend 16-u1095ng | |
| MSI Prestige 16 AI Evo B2HMG | |
| PCMark 10 / Essentials | |
| MSI Prestige 16 AI Evo B2HMG | |
| Dell XPS 16 Core Ultra X7 358H | |
| Média Intel Core Ultra 9 386H, NVIDIA GeForce RTX 5060 Laptop (10759 - 10841, n=2) | |
| Lenovo Yoga Pro 9 16IAH10 RTX 5050 | |
| Lenovo Pro 9 16IPH11 | |
| Asus ProArt P16 H7606WP | |
| HP Omen Transcend 16-u1095ng | |
| PCMark 10 / Productivity | |
| Lenovo Yoga Pro 9 16IAH10 RTX 5050 | |
| Dell XPS 16 Core Ultra X7 358H | |
| Lenovo Pro 9 16IPH11 | |
| Média Intel Core Ultra 9 386H, NVIDIA GeForce RTX 5060 Laptop (15199 - 15447, n=2) | |
| HP Omen Transcend 16-u1095ng | |
| MSI Prestige 16 AI Evo B2HMG | |
| Asus ProArt P16 H7606WP | |
| PCMark 10 / Digital Content Creation | |
| Asus ProArt P16 H7606WP | |
| Média Intel Core Ultra 9 386H, NVIDIA GeForce RTX 5060 Laptop (13928 - 13963, n=2) | |
| Lenovo Pro 9 16IPH11 | |
| Dell XPS 16 Core Ultra X7 358H | |
| Lenovo Yoga Pro 9 16IAH10 RTX 5050 | |
| MSI Prestige 16 AI Evo B2HMG | |
| HP Omen Transcend 16-u1095ng | |
| CrossMark / Overall | |
| MSI Prestige 16 AI Evo B2HMG | |
| Média Intel Core Ultra 9 386H, NVIDIA GeForce RTX 5060 Laptop (2108 - 2164, n=2) | |
| Dell XPS 16 Core Ultra X7 358H | |
| Lenovo Pro 9 16IPH11 | |
| Lenovo Yoga Pro 9 16IAH10 RTX 5050 | |
| Asus ProArt P16 H7606WP | |
| CrossMark / Productivity | |
| MSI Prestige 16 AI Evo B2HMG | |
| Média Intel Core Ultra 9 386H, NVIDIA GeForce RTX 5060 Laptop (1917 - 1973, n=2) | |
| Lenovo Pro 9 16IPH11 | |
| Dell XPS 16 Core Ultra X7 358H | |
| Lenovo Yoga Pro 9 16IAH10 RTX 5050 | |
| Asus ProArt P16 H7606WP | |
| CrossMark / Creativity | |
| Dell XPS 16 Core Ultra X7 358H | |
| Lenovo Pro 9 16IPH11 | |
| Média Intel Core Ultra 9 386H, NVIDIA GeForce RTX 5060 Laptop (2442 - 2500, n=2) | |
| MSI Prestige 16 AI Evo B2HMG | |
| Lenovo Yoga Pro 9 16IAH10 RTX 5050 | |
| Asus ProArt P16 H7606WP | |
| CrossMark / Responsiveness | |
| MSI Prestige 16 AI Evo B2HMG | |
| Média Intel Core Ultra 9 386H, NVIDIA GeForce RTX 5060 Laptop (1682 - 1988, n=2) | |
| Dell XPS 16 Core Ultra X7 358H | |
| Lenovo Pro 9 16IPH11 | |
| Lenovo Yoga Pro 9 16IAH10 RTX 5050 | |
| Asus ProArt P16 H7606WP | |
| WebXPRT 3 / Overall | |
| MSI Prestige 16 AI Evo B2HMG | |
| HP Omen Transcend 16-u1095ng | |
| Asus ProArt P16 H7606WP | |
| Lenovo Pro 9 16IPH11 | |
| Lenovo Yoga Pro 9 16IAH10 RTX 5050 | |
| Média Intel Core Ultra 9 386H, NVIDIA GeForce RTX 5060 Laptop (310 - 326, n=2) | |
| Dell XPS 16 Core Ultra X7 358H | |
| WebXPRT 4 / Overall | |
| MSI Prestige 16 AI Evo B2HMG | |
| Lenovo Yoga Pro 9 16IAH10 RTX 5050 | |
| Lenovo Pro 9 16IPH11 | |
| Dell XPS 16 Core Ultra X7 358H | |
| Média Intel Core Ultra 9 386H, NVIDIA GeForce RTX 5060 Laptop (298 - 302, n=2) | |
| Asus ProArt P16 H7606WP | |
| Mozilla Kraken 1.1 / Total | |
| Dell XPS 16 Core Ultra X7 358H | |
| Asus ProArt P16 H7606WP | |
| Média Intel Core Ultra 9 386H, NVIDIA GeForce RTX 5060 Laptop (442 - 446, n=2) | |
| Lenovo Pro 9 16IPH11 | |
| HP Omen Transcend 16-u1095ng | |
| Lenovo Yoga Pro 9 16IAH10 RTX 5050 | |
| MSI Prestige 16 AI Evo B2HMG | |
| Geekbench AI / Half Precision GPU 1.7 | |
| Lenovo Yoga Pro 9 16IAH10 RTX 5050 | |
| Lenovo Pro 9 16IPH11 | |
| Média Intel Core Ultra 9 386H, NVIDIA GeForce RTX 5060 Laptop (n=1) | |
| Dell XPS 16 Core Ultra X7 358H | |
| Geekbench AI / Single Precision GPU 1.7 | |
| Lenovo Pro 9 16IPH11 | |
| Média Intel Core Ultra 9 386H, NVIDIA GeForce RTX 5060 Laptop (n=1) | |
| Lenovo Yoga Pro 9 16IAH10 RTX 5050 | |
| Dell XPS 16 Core Ultra X7 358H | |
| Geekbench AI / Quantized GPU 1.7 | |
| Lenovo Pro 9 16IPH11 | |
| Média Intel Core Ultra 9 386H, NVIDIA GeForce RTX 5060 Laptop (n=1) | |
| Lenovo Yoga Pro 9 16IAH10 RTX 5050 | |
| Dell XPS 16 Core Ultra X7 358H | |
* ... menor é melhor
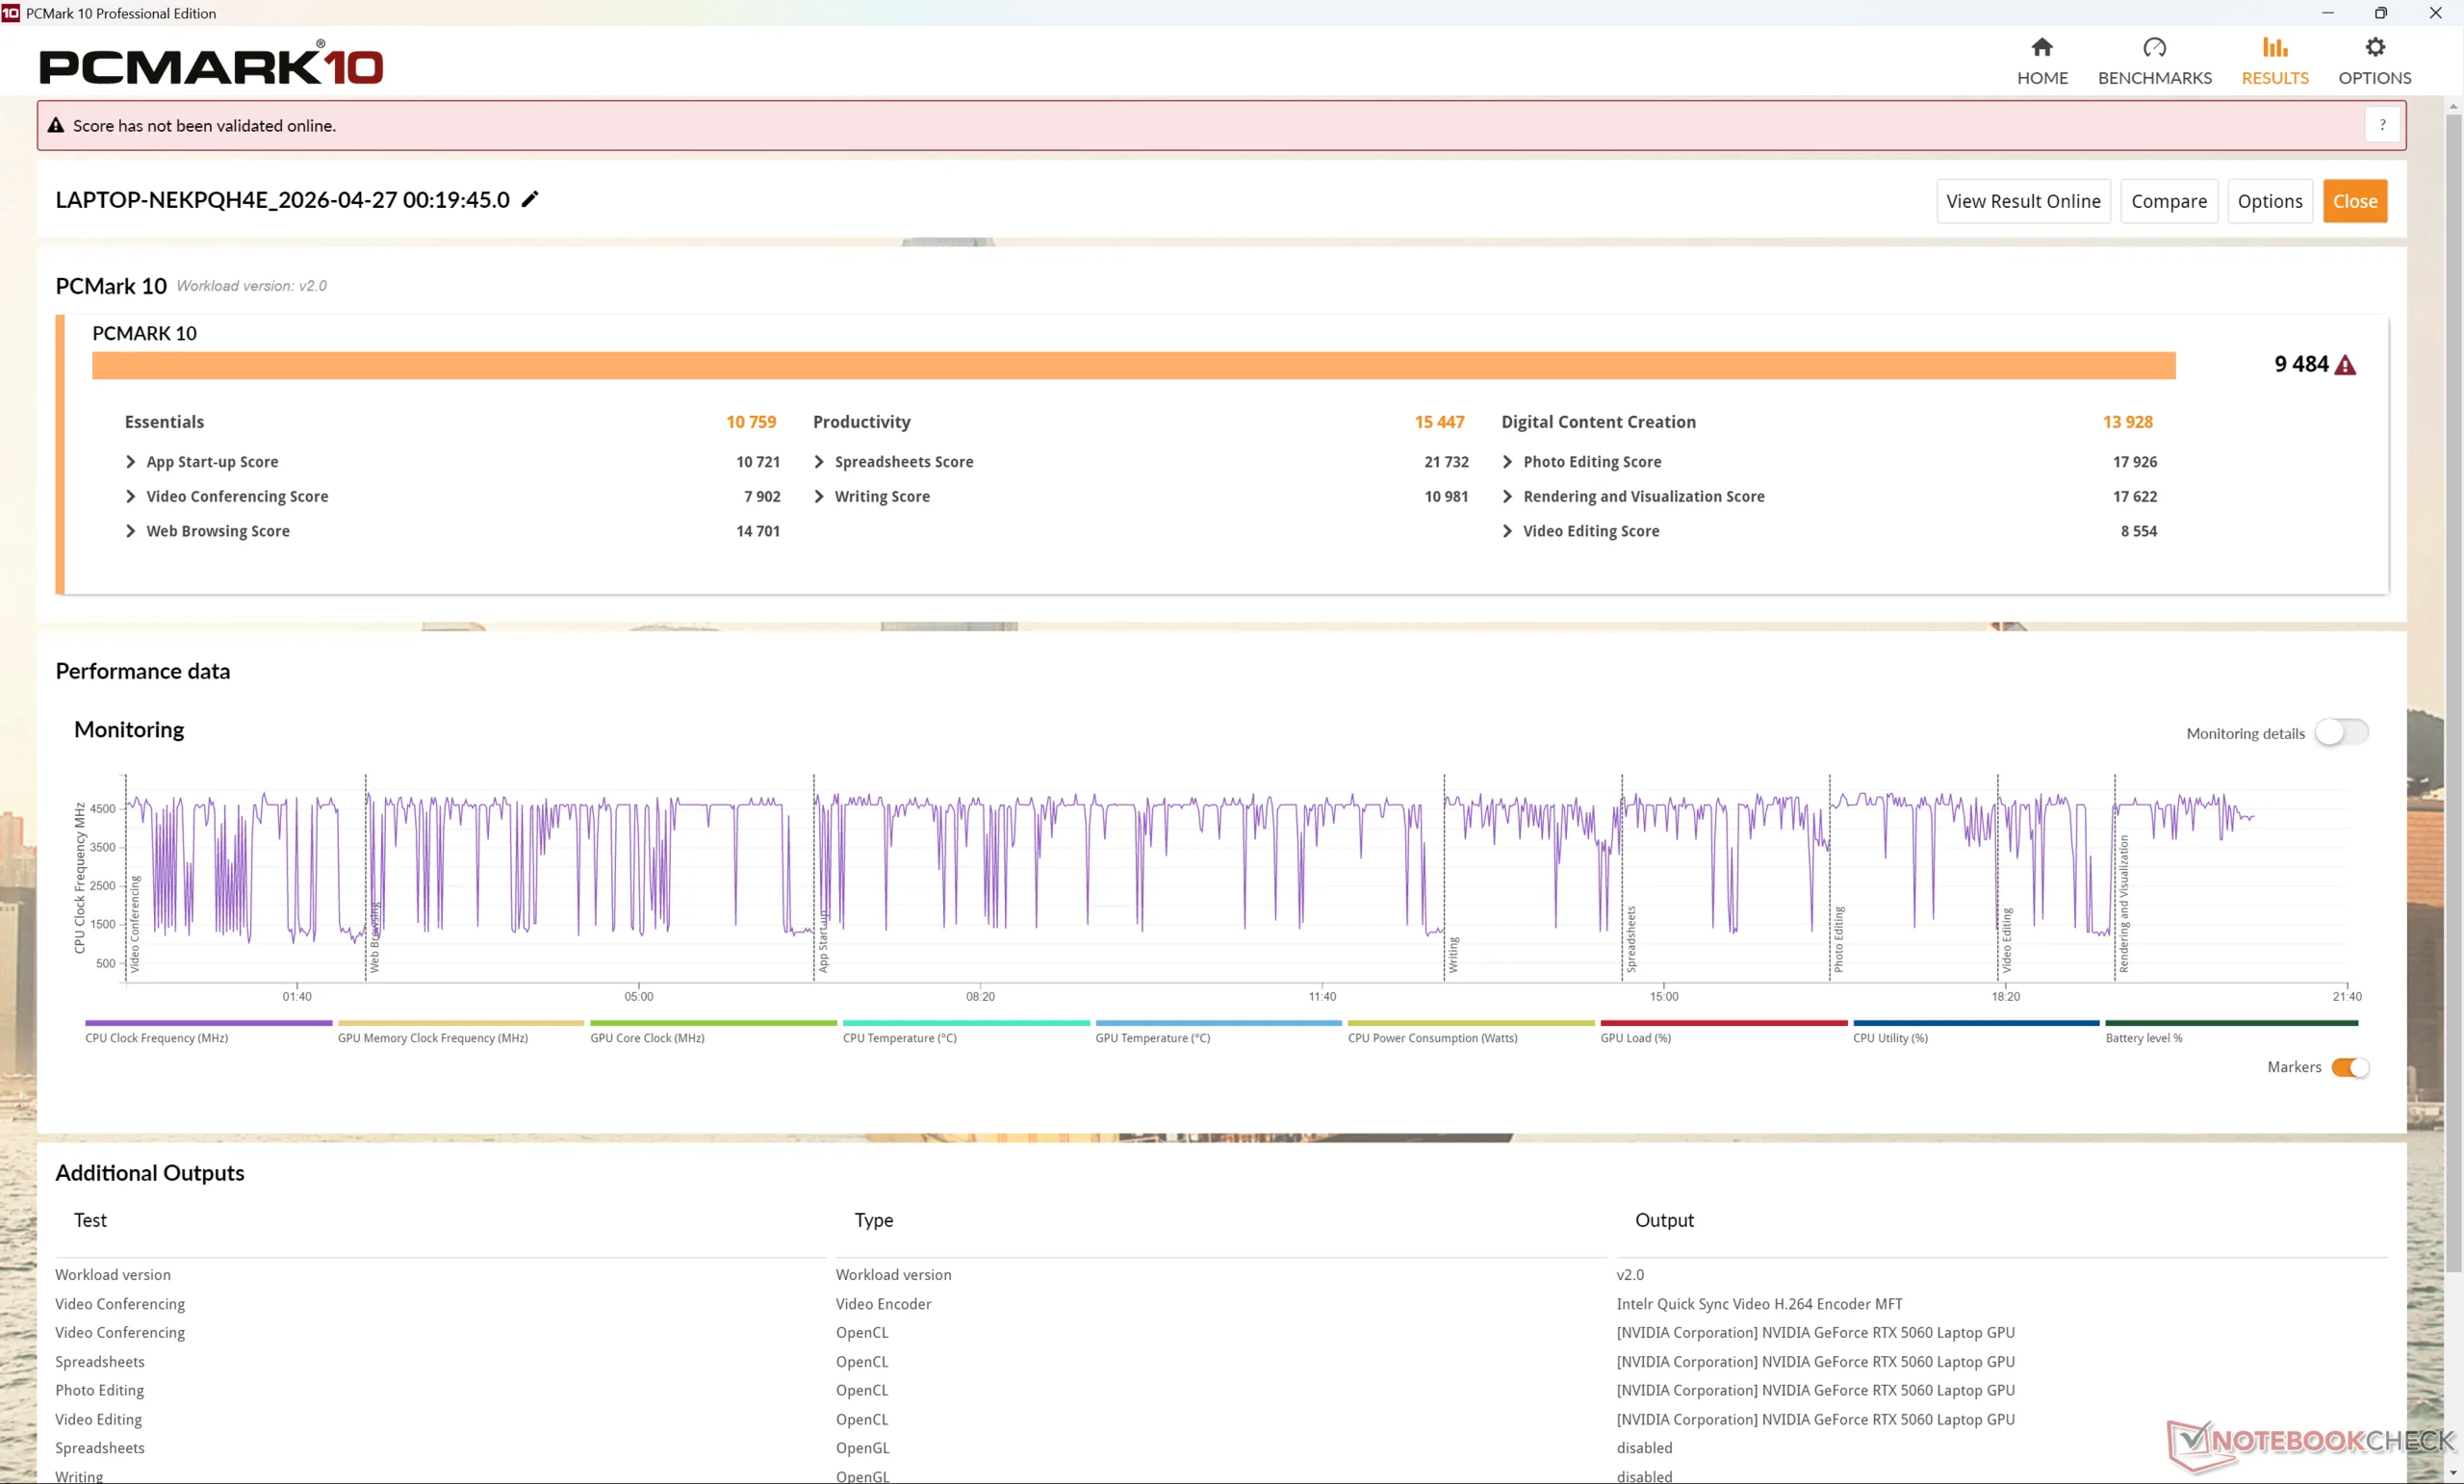
| PCMark 10 Score | 9484 pontos | |
Ajuda | ||
| AIDA64 / Memory Copy | |
| Dell XPS 16 Core Ultra X7 358H | |
| Média Intel Core Ultra 9 386H (75437 - 129946, n=8) | |
| Lenovo Pro 9 16IPH11 | |
| Lenovo Yoga Pro 9 16IAH10 RTX 5050 | |
| MSI Prestige 16 AI Evo B2HMG | |
| Asus ProArt P16 H7606WP | |
| HP Omen Transcend 16-u1095ng | |
| AIDA64 / Memory Read | |
| Dell XPS 16 Core Ultra X7 358H | |
| Média Intel Core Ultra 9 386H (81021 - 118858, n=8) | |
| Lenovo Pro 9 16IPH11 | |
| Asus ProArt P16 H7606WP | |
| Lenovo Yoga Pro 9 16IAH10 RTX 5050 | |
| HP Omen Transcend 16-u1095ng | |
| MSI Prestige 16 AI Evo B2HMG | |
| AIDA64 / Memory Write | |
| Dell XPS 16 Core Ultra X7 358H | |
| Média Intel Core Ultra 9 386H (75959 - 135096, n=8) | |
| Lenovo Yoga Pro 9 16IAH10 RTX 5050 | |
| Lenovo Pro 9 16IPH11 | |
| Asus ProArt P16 H7606WP | |
| HP Omen Transcend 16-u1095ng | |
| MSI Prestige 16 AI Evo B2HMG | |
| AIDA64 / Memory Latency | |
| MSI Prestige 16 AI Evo B2HMG | |
| Lenovo Yoga Pro 9 16IAH10 RTX 5050 | |
| Asus ProArt P16 H7606WP | |
| Lenovo Pro 9 16IPH11 | |
| Média Intel Core Ultra 9 386H (87.2 - 116.9, n=8) | |
| HP Omen Transcend 16-u1095ng | |
| Dell XPS 16 Core Ultra X7 358H | |
* ... menor é melhor
Latência DPC
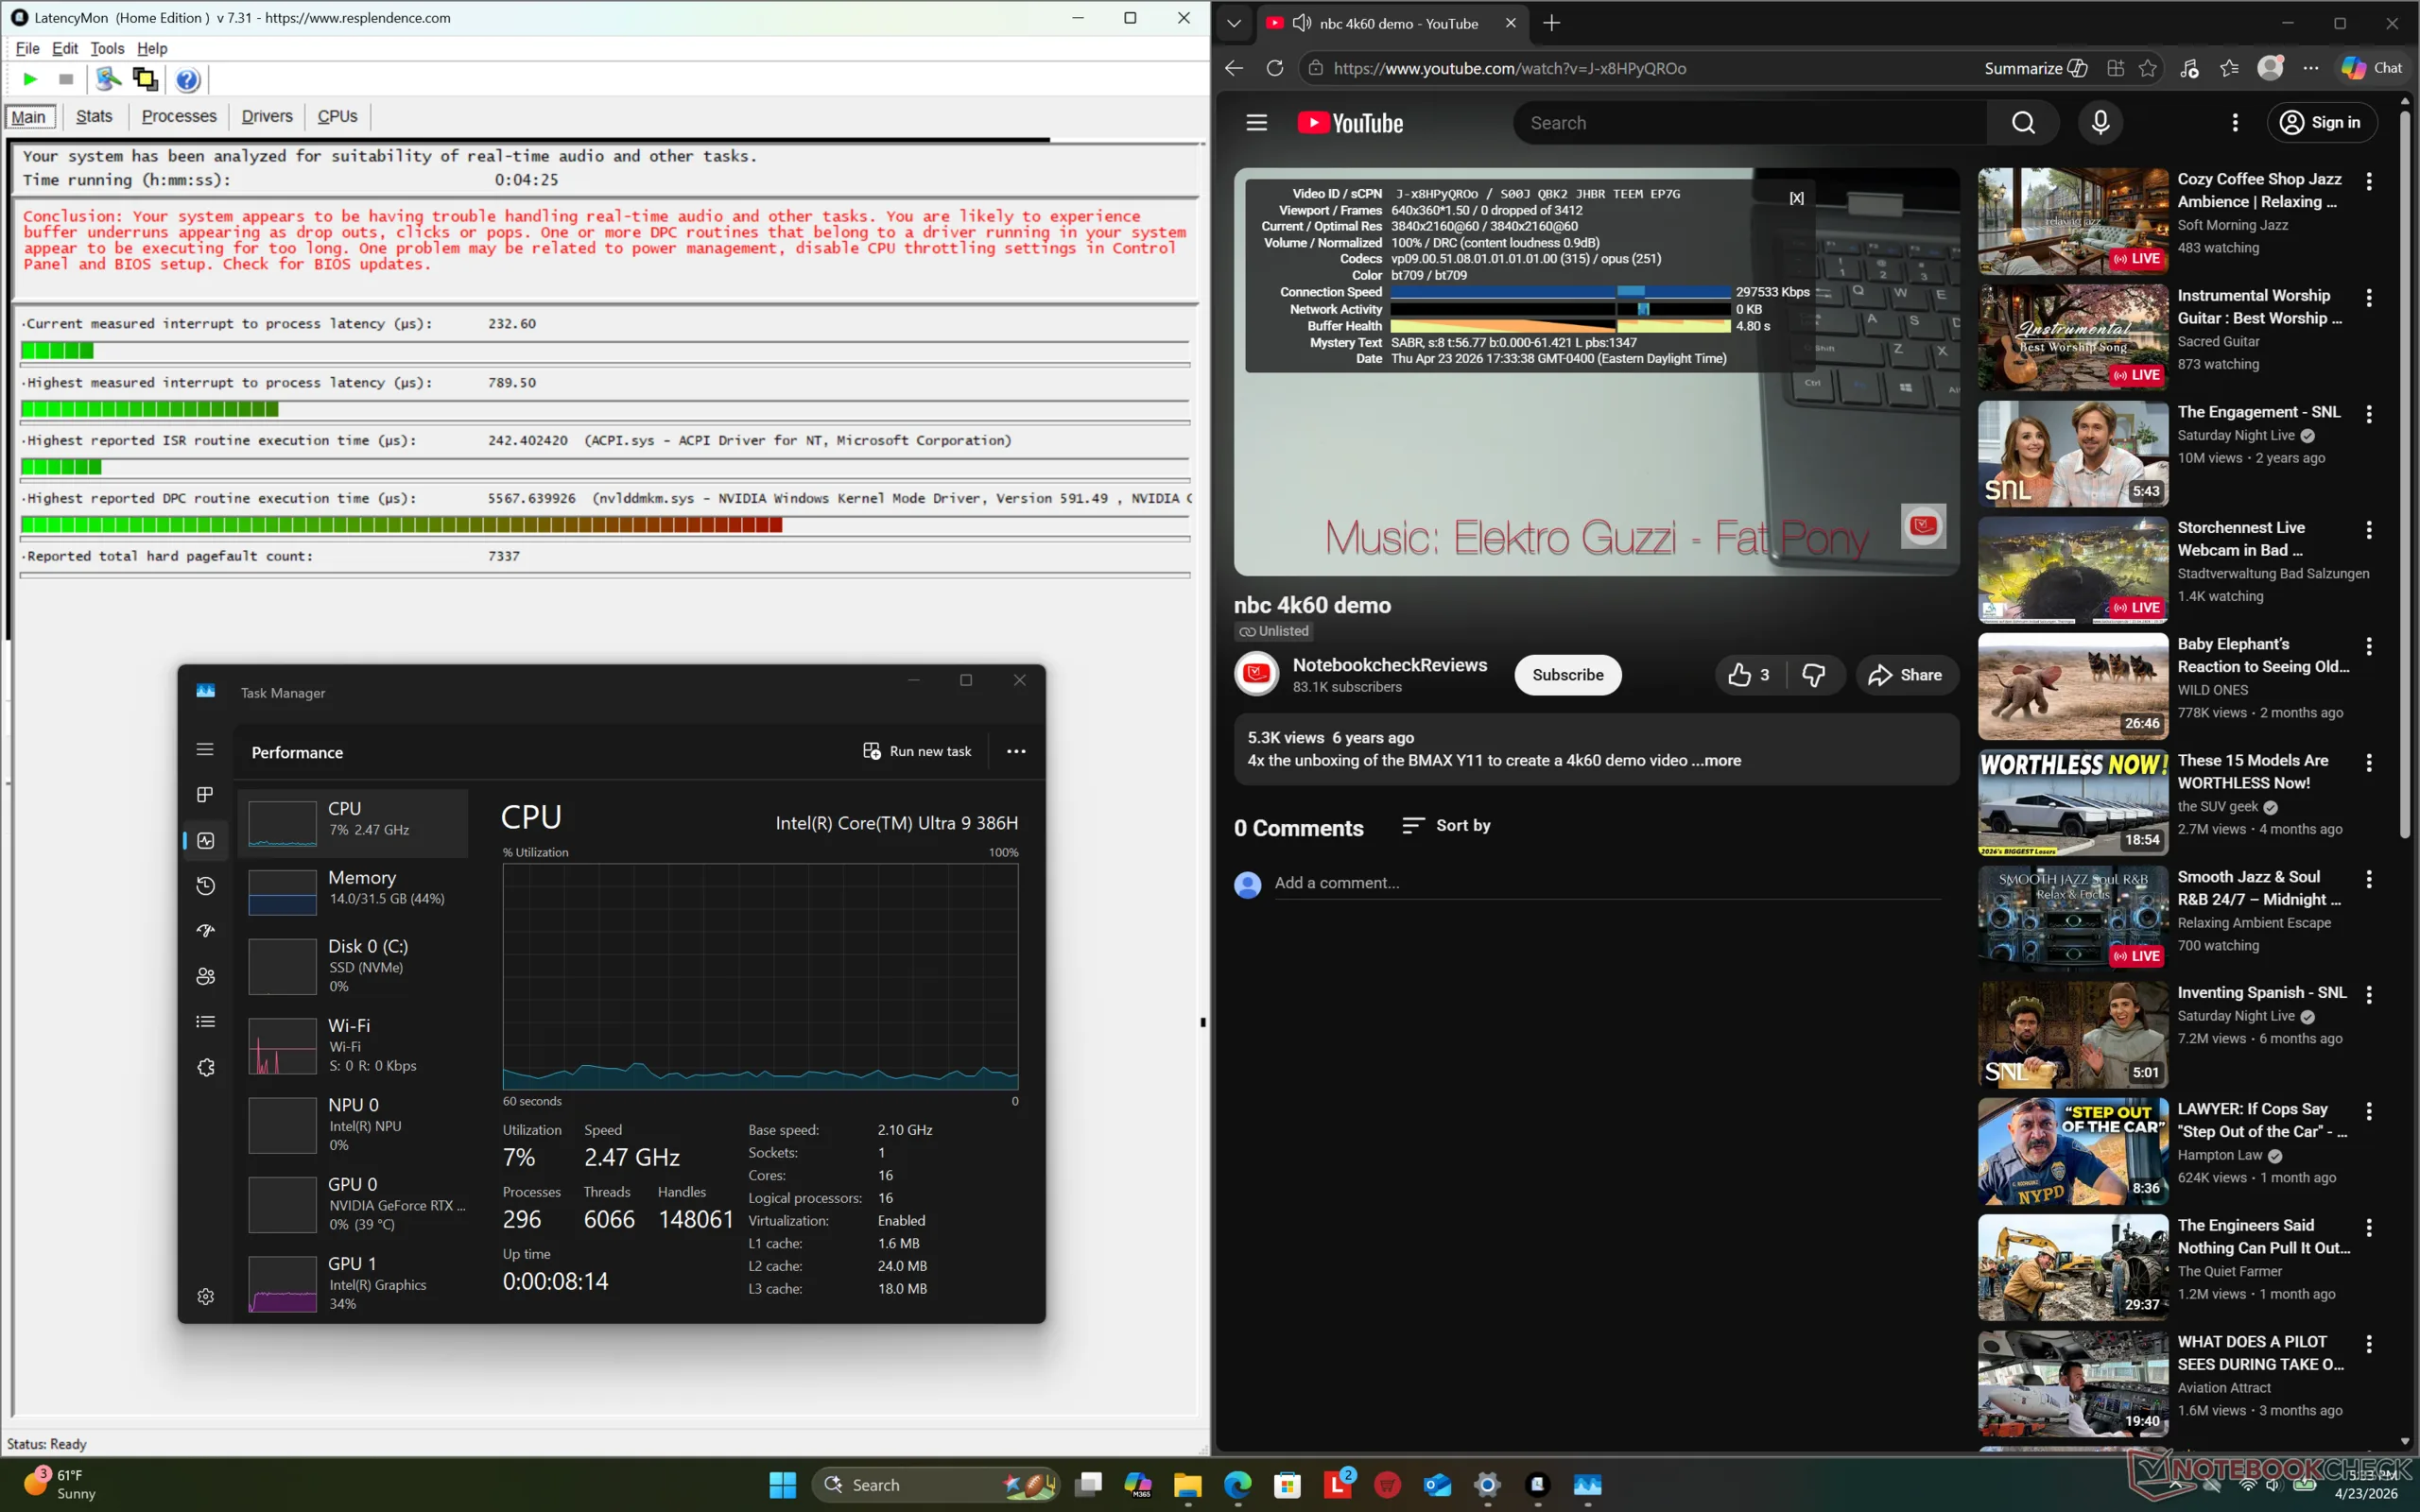
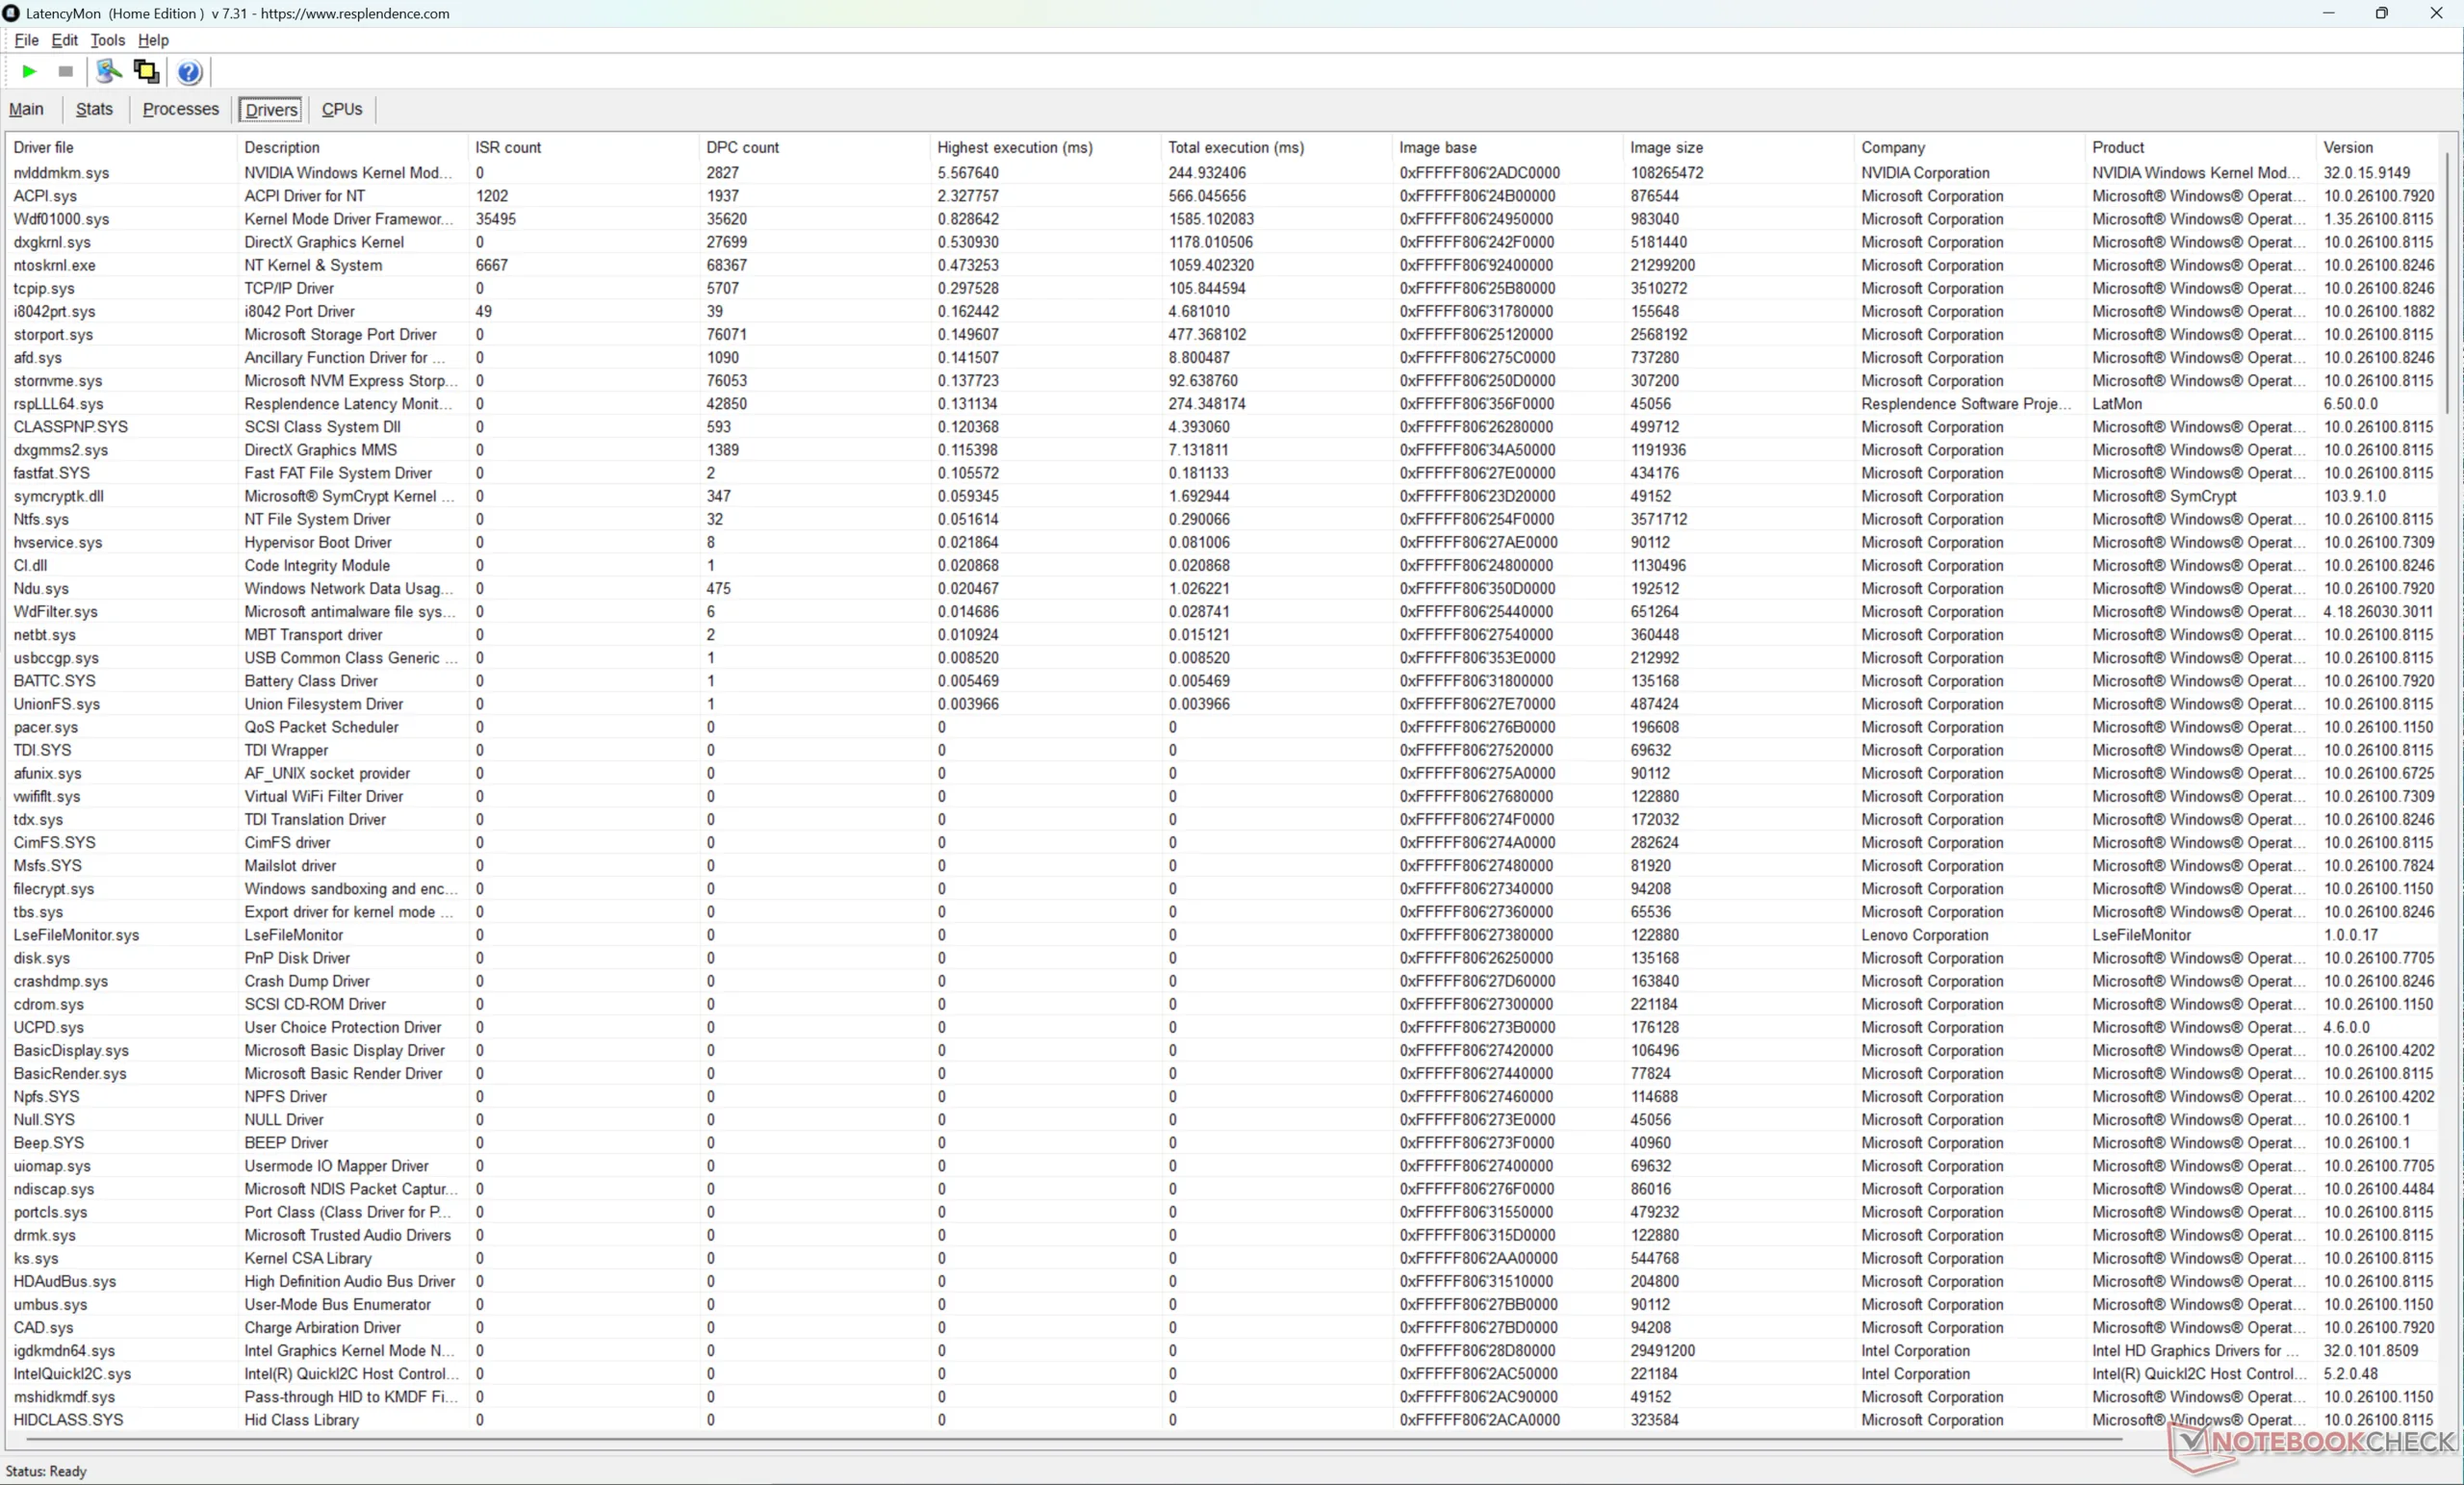
| DPC Latencies / LatencyMon - interrupt to process latency (max), Web, Youtube, Prime95 | |
| Lenovo Yoga Pro 9 16IAH10 RTX 5050 | |
| MSI Prestige 16 AI Evo B2HMG | |
| HP Omen Transcend 16-u1095ng | |
| Lenovo Pro 9 16IPH11 | |
| Asus ProArt P16 H7606WP | |
| Dell XPS 16 Core Ultra X7 358H | |
* ... menor é melhor
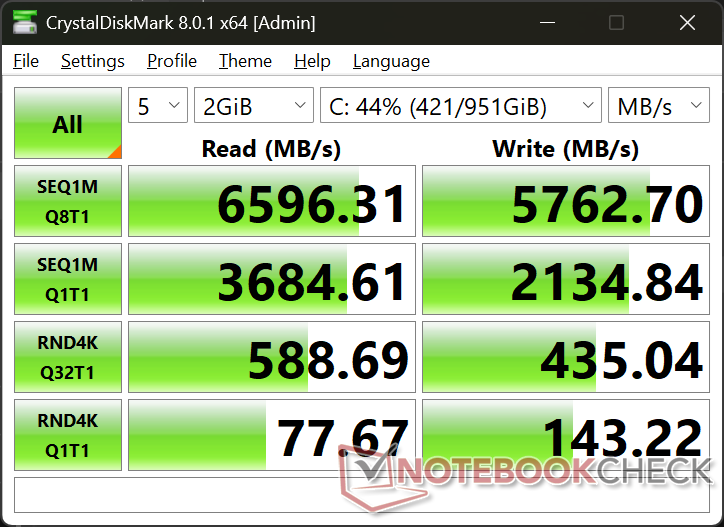
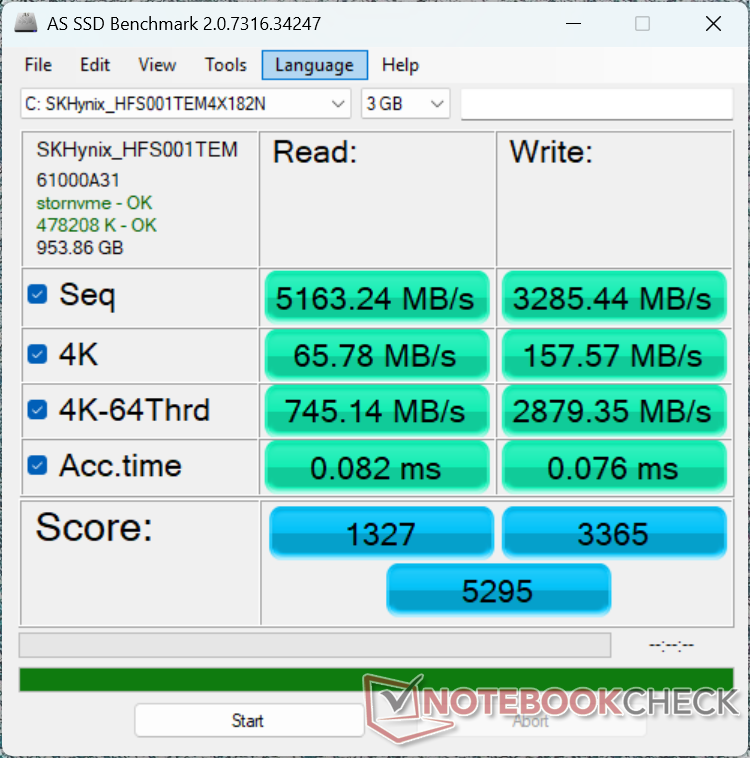
Dispositivos de armazenamento
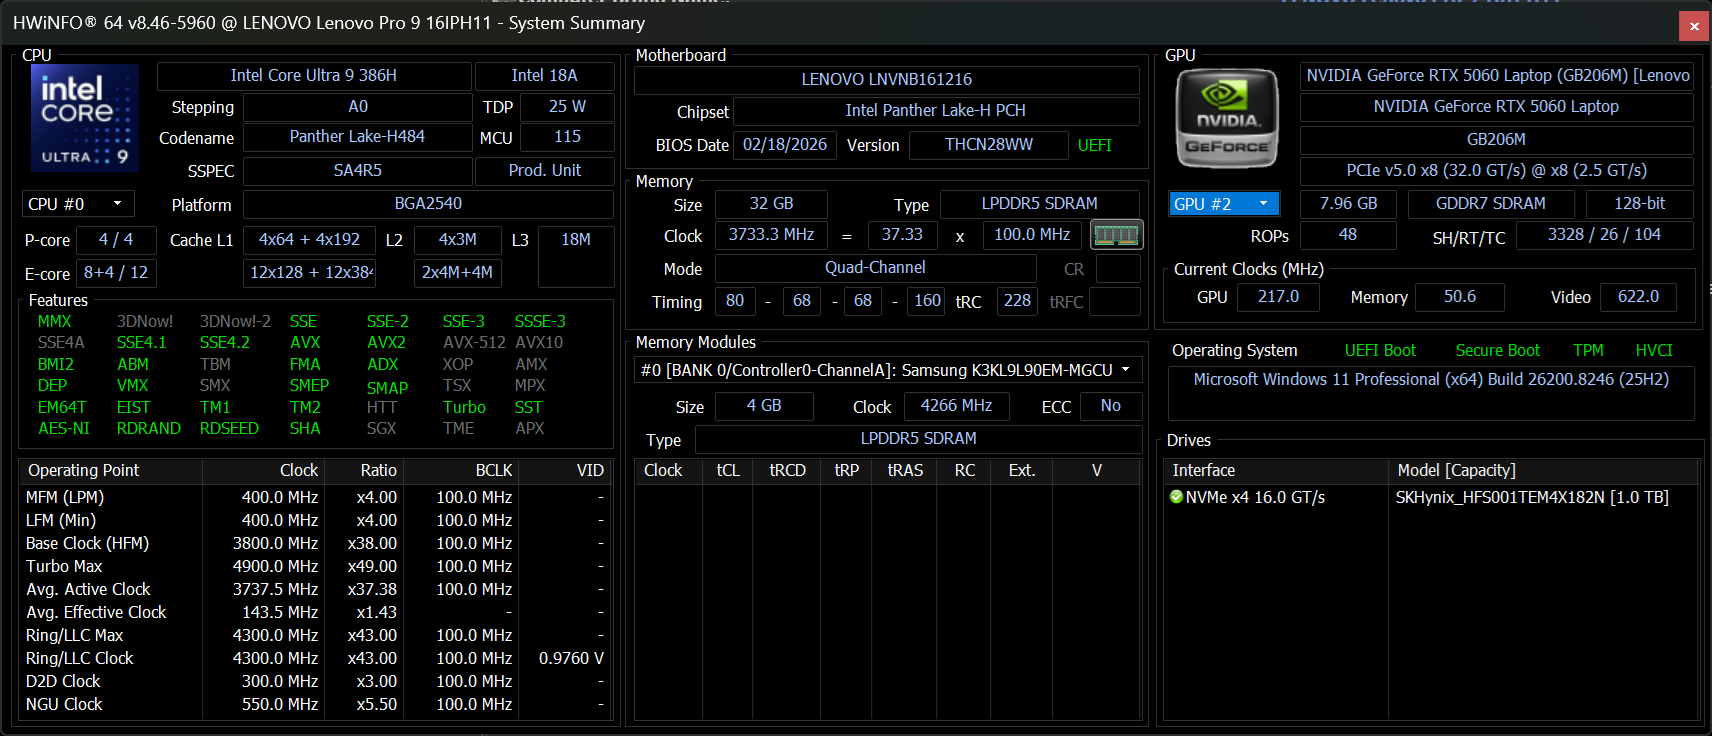
O sistema suporta até dois SSDs NVMe PCIe4 x4 sem problemas de limitação. Observe que não há suporte para velocidades de SSD PCIe5 e que um dos dois SSDs M.2 deve ser da variedade 2242 mais curta.

| Drive Performance rating - Percent | |
| MSI Prestige 16 AI Evo B2HMG | |
| HP Omen Transcend 16-u1095ng | |
| Lenovo Yoga Pro 9 16IAH10 RTX 5050 | |
| Asus ProArt P16 H7606WP | |
| Lenovo Pro 9 16IPH11 | |
| Dell XPS 16 Core Ultra X7 358H | |
* ... menor é melhor
Limitação de disco: Loop de leitura do DiskSpd, profundidade da fila 8
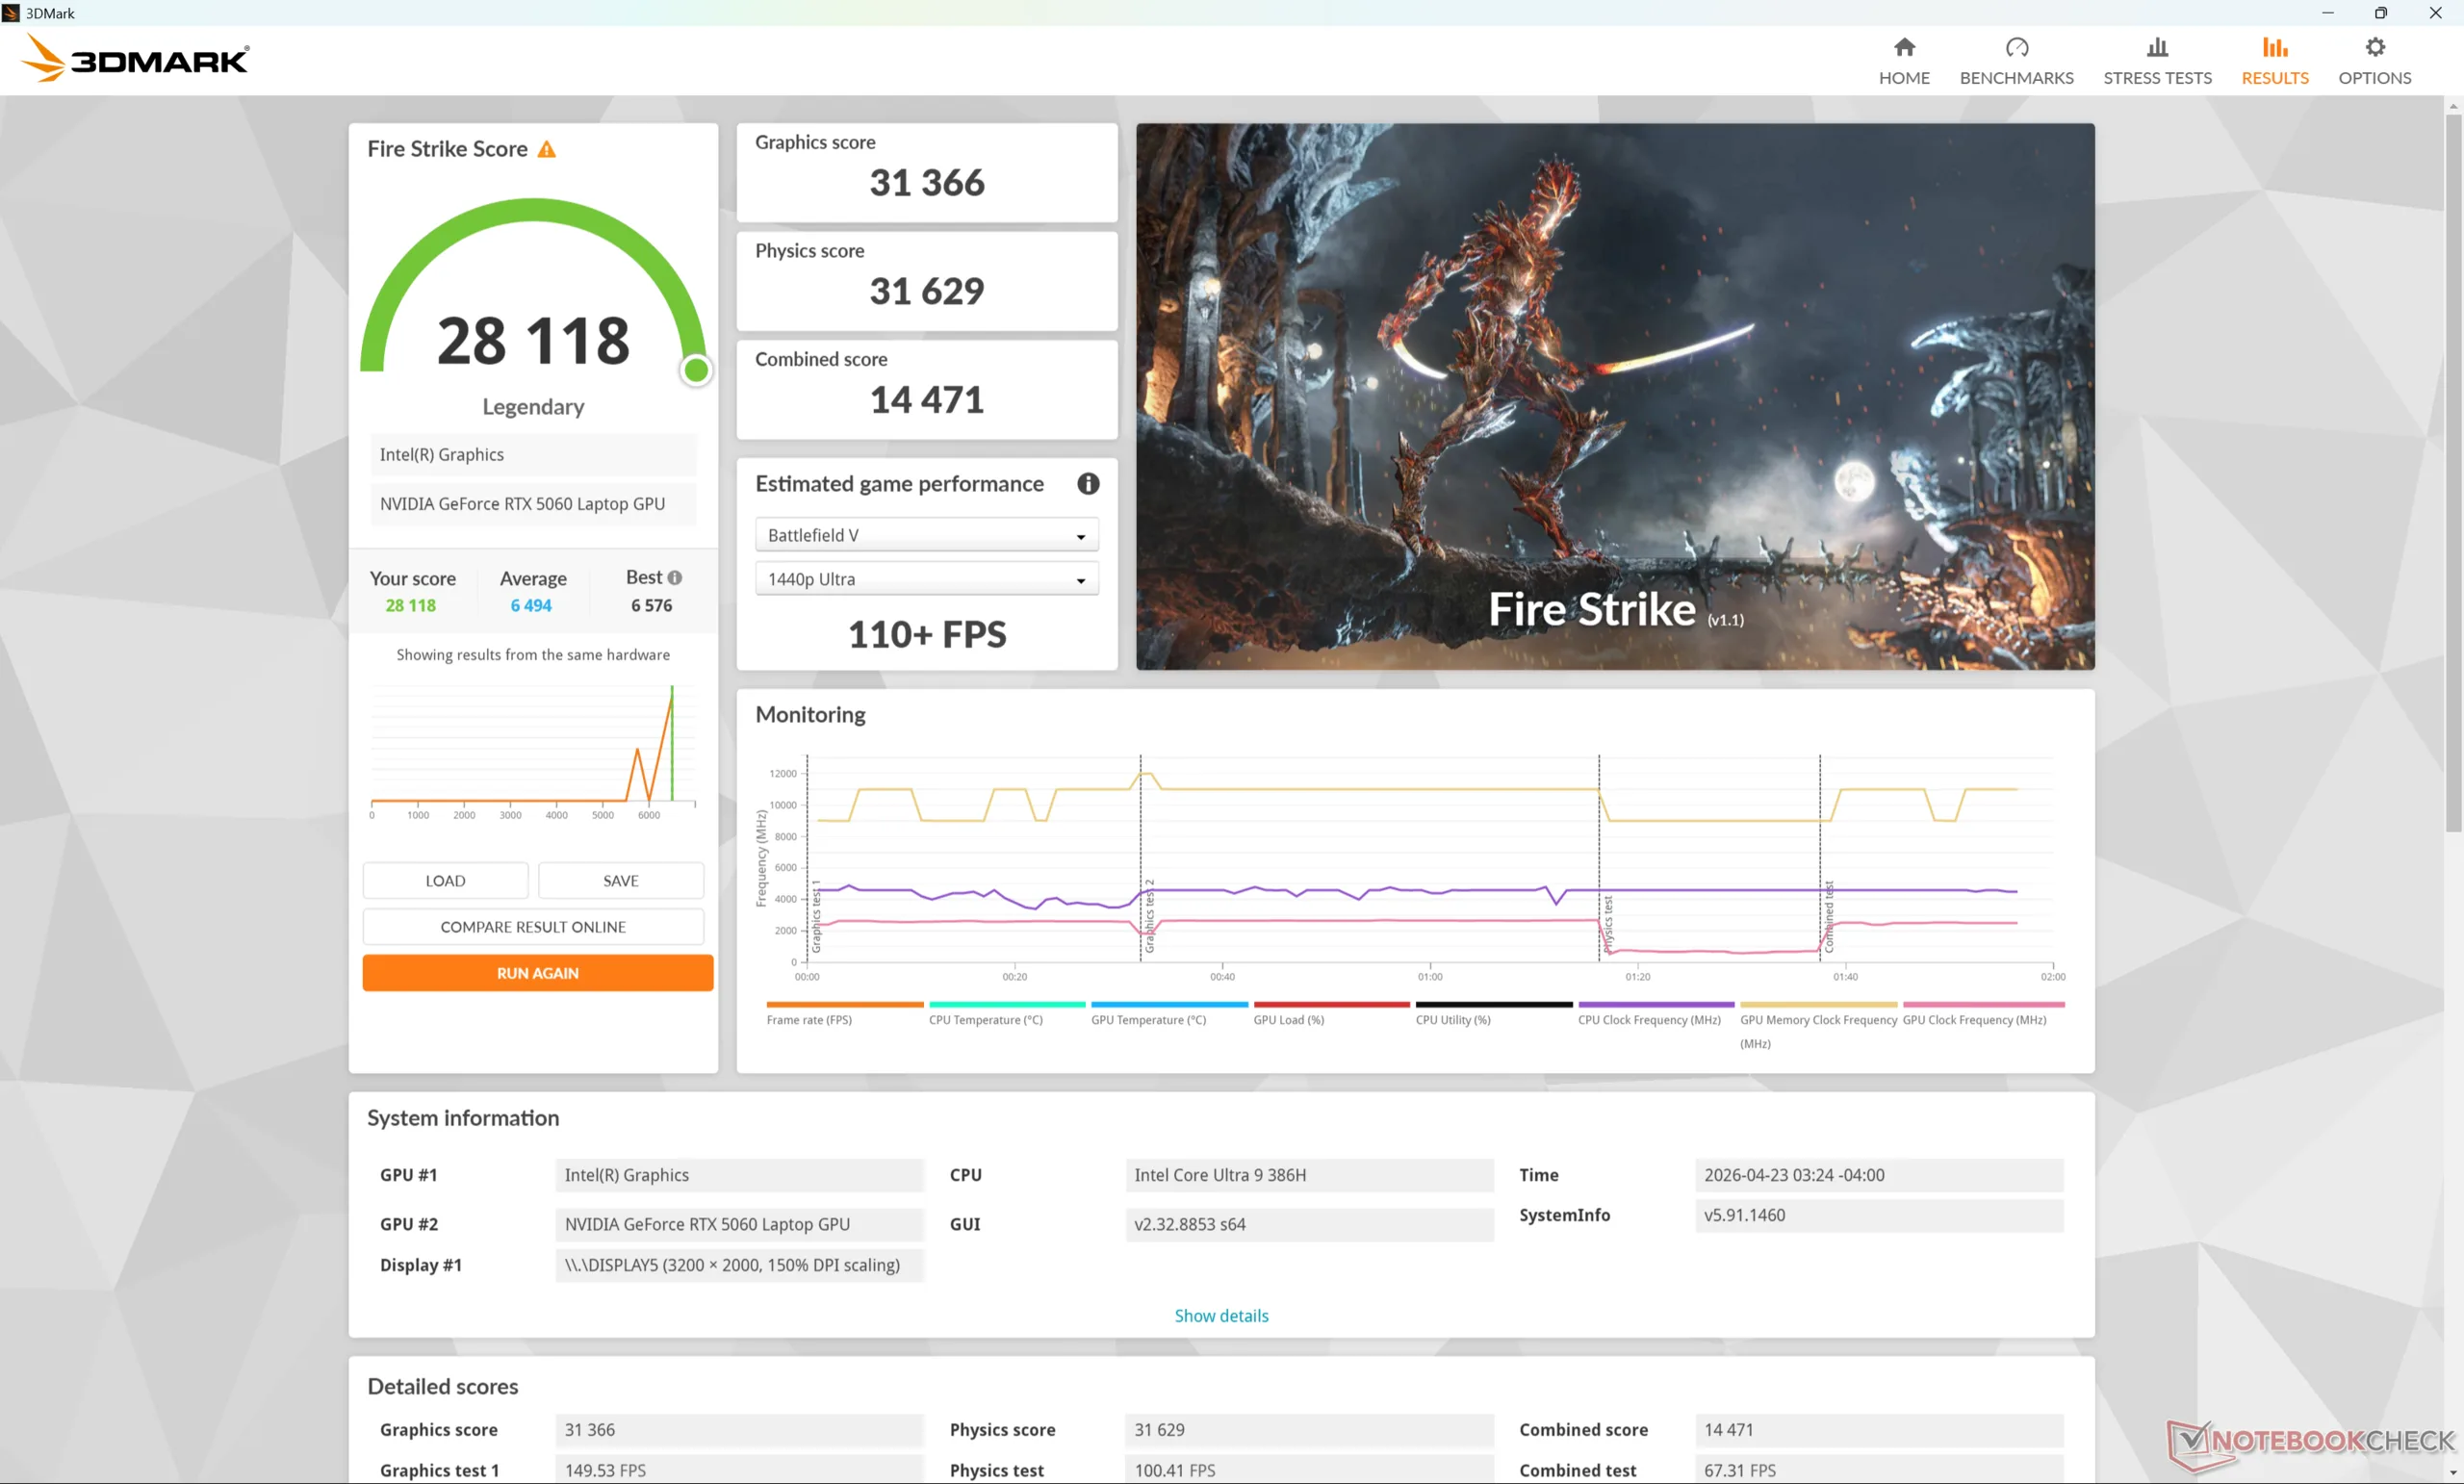
Desempenho da GPU
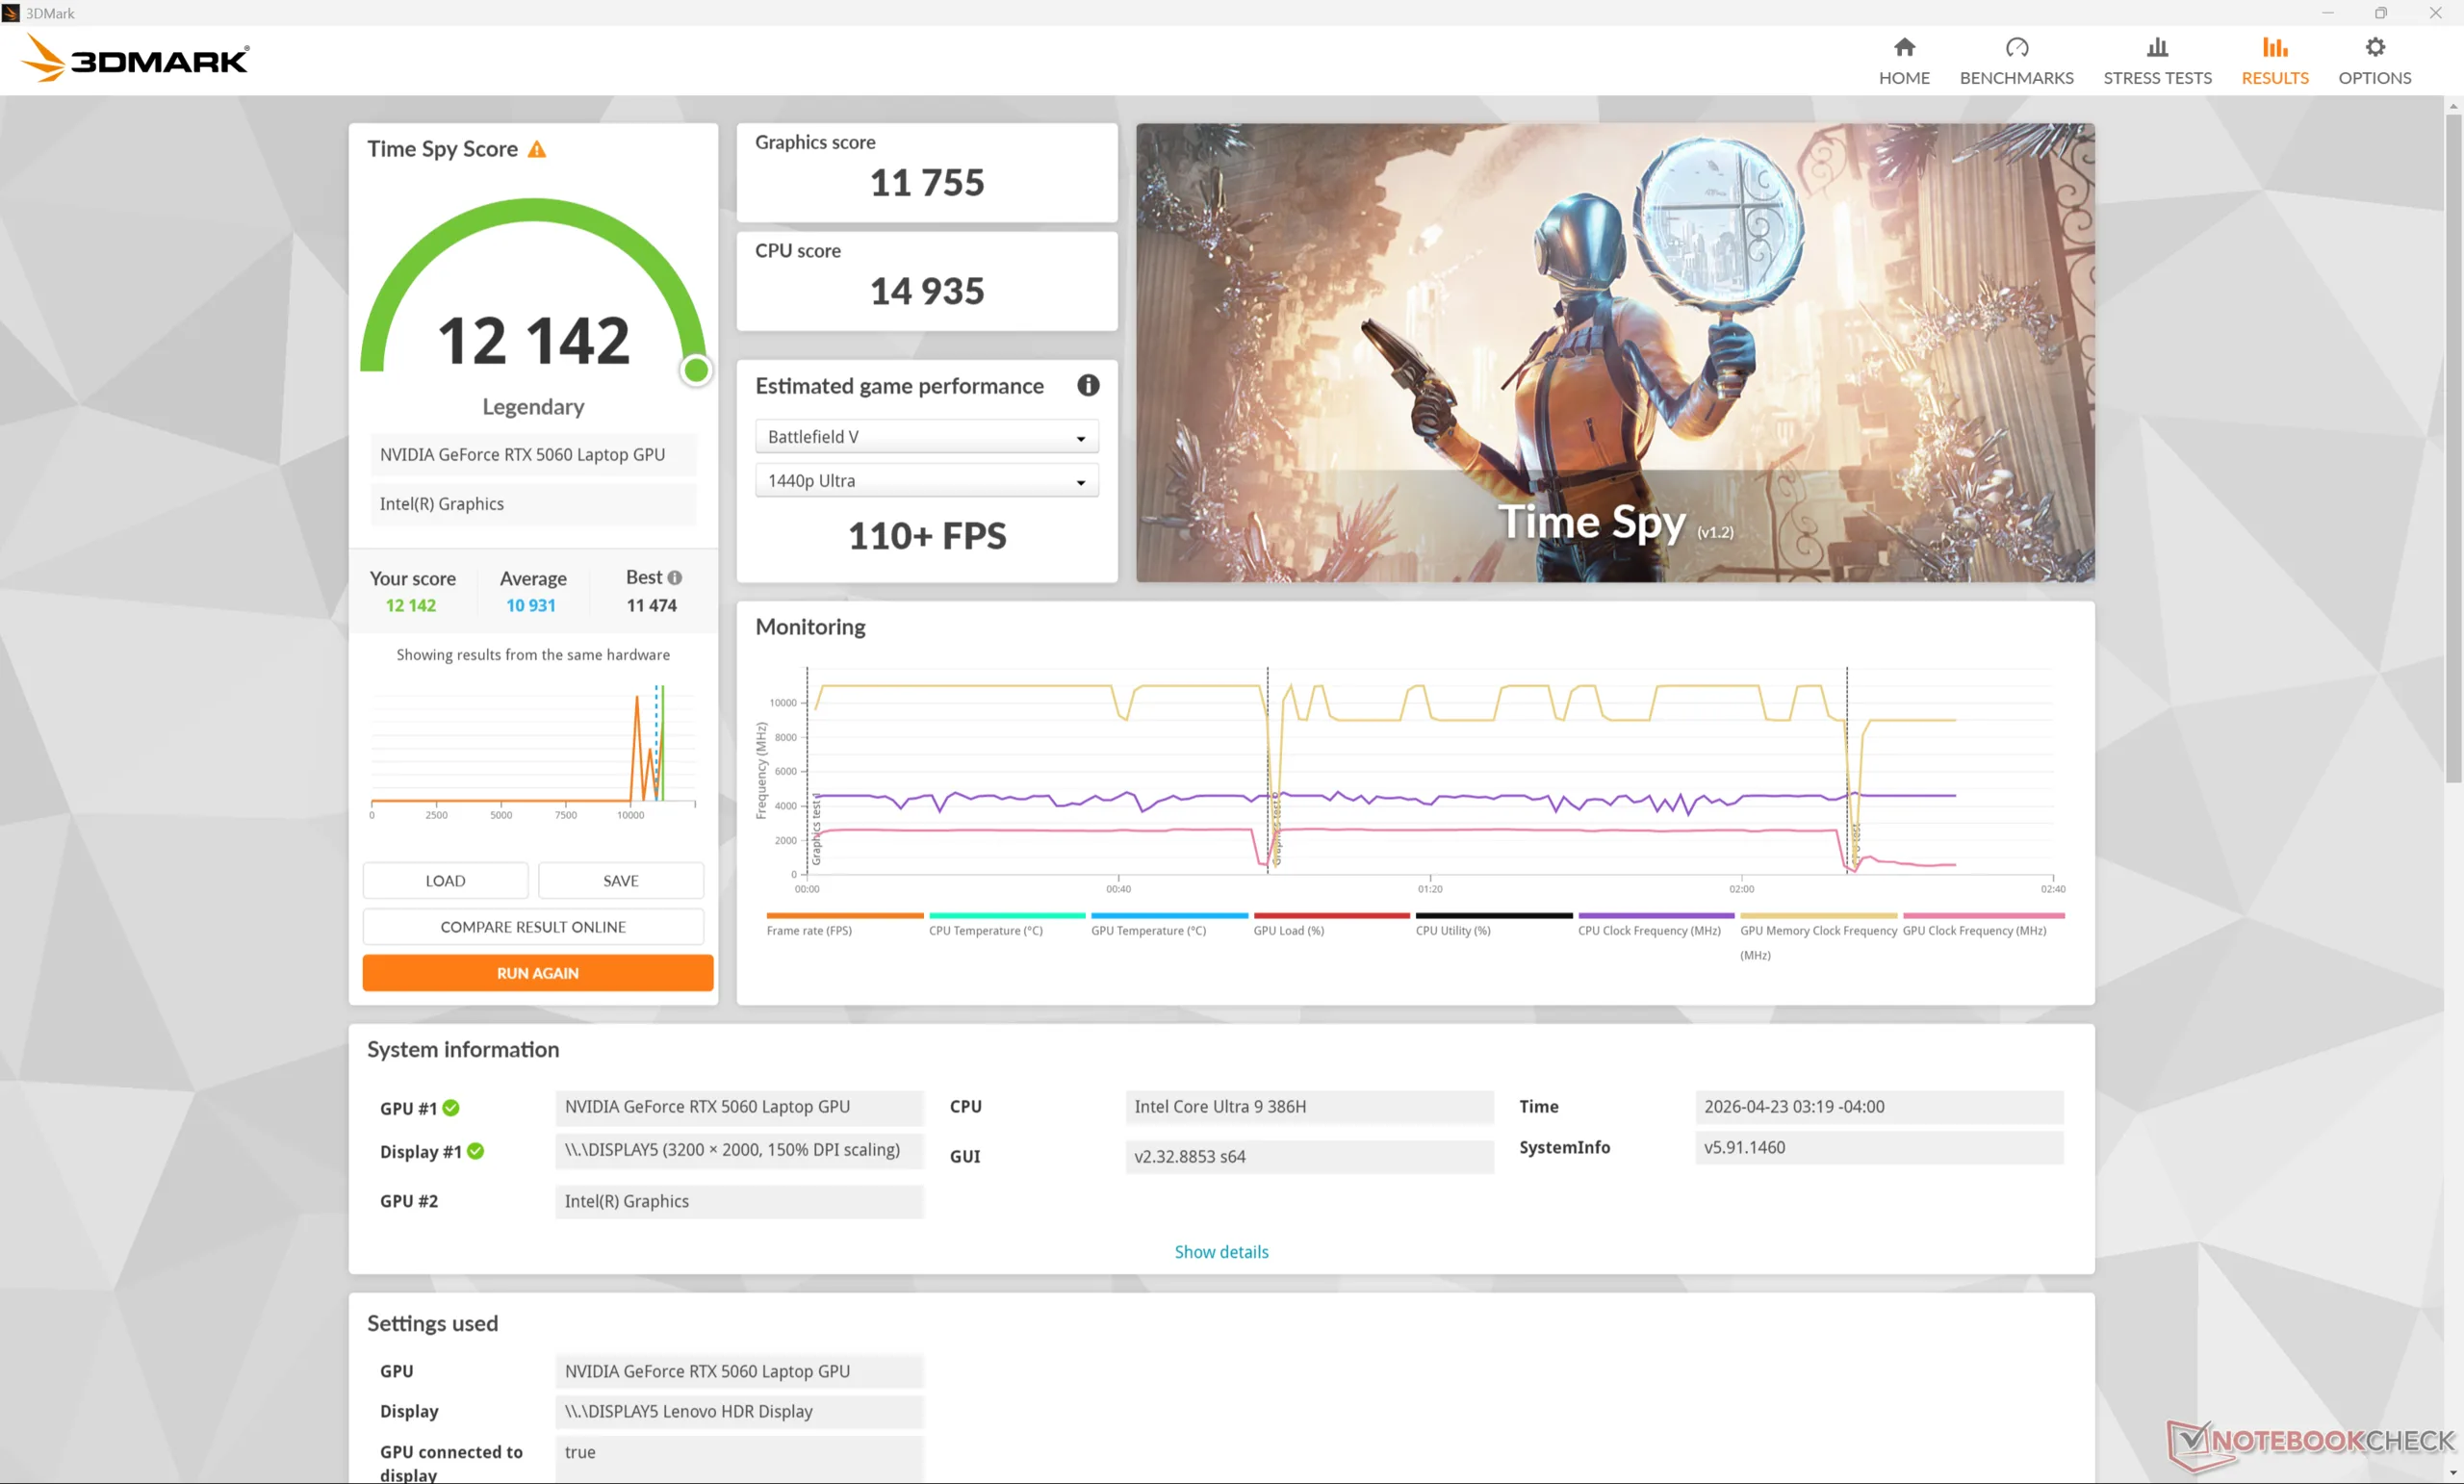
O móvel GeForce RTX 5060 móvel está funcionando onde esperamos que esteja em relação a outros notebooks com a mesma GPU. O desempenho gráfico bruto está um pouco atrás do desempenho otimizado para jogos Legion 7 16 AGP11 equipado com a mesma RTX 5060 por apenas alguns pontos percentuais.
A execução do sistema no modo Balanced em vez do modo Performance afetaria o desempenho gráfico em até 10%, conforme mostrado em nossa tabela de resultados Time Spy abaixo.
Espera-se que o downgrade para a configuração RTX 5050 a partir de nossa RTX 5060 reduza o desempenho gráfico em até 20 a 25 por cento.
| Perfil de energia | Pontuação de gráficos | Pontuação de física | Pontuação combinada |
| Modo de desempenho | 11755 | 14935 | 12142 |
| Modo equilibrado | 10676 (-9%) | 15025 (-0%) | 11160 (-8%) |
| Energia da bateria | 9886 (-16%) | 12811 (-14%) | 10236 (-16%) |
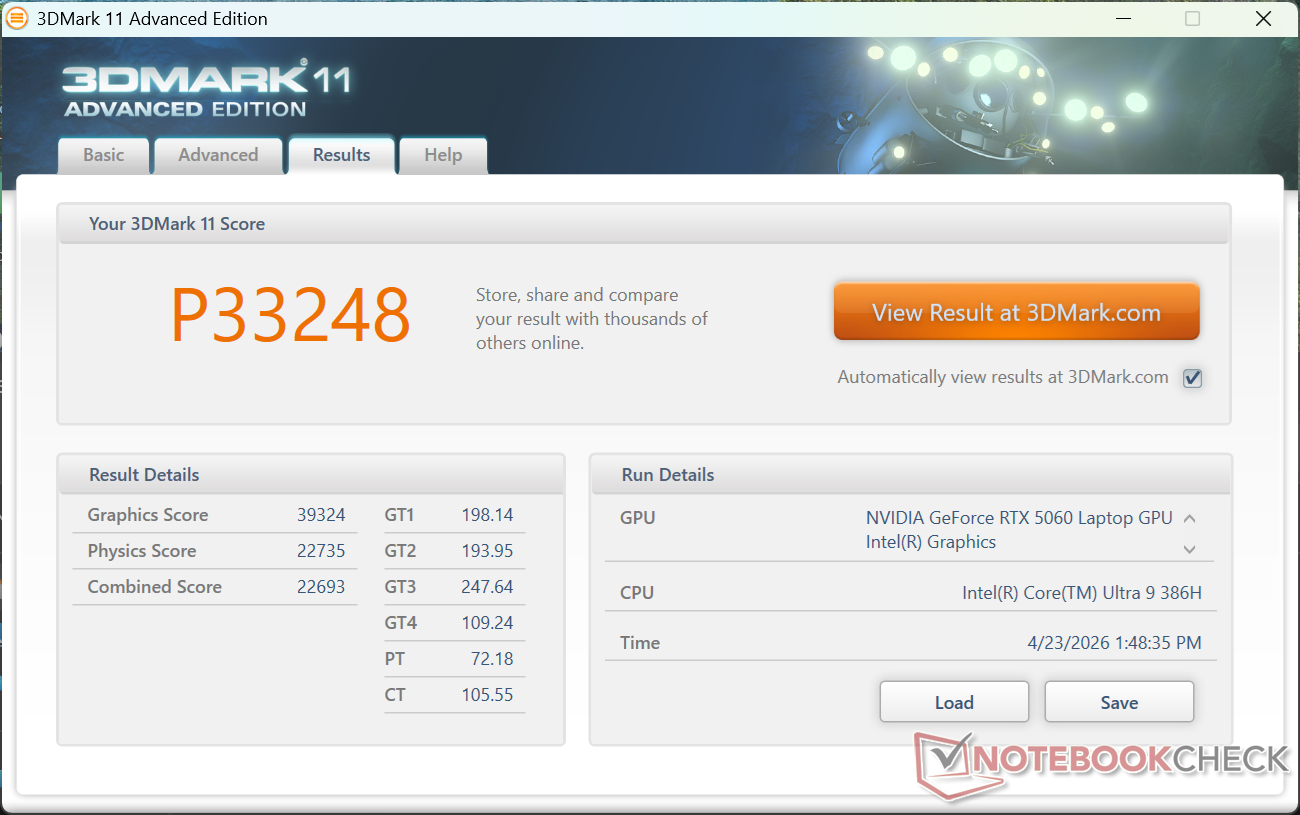
| 3DMark 11 Performance | 33248 pontos | |
| 3DMark Cloud Gate Standard Score | 61799 pontos | |
| 3DMark Fire Strike Score | 28118 pontos | |
| 3DMark Time Spy Score | 12142 pontos | |
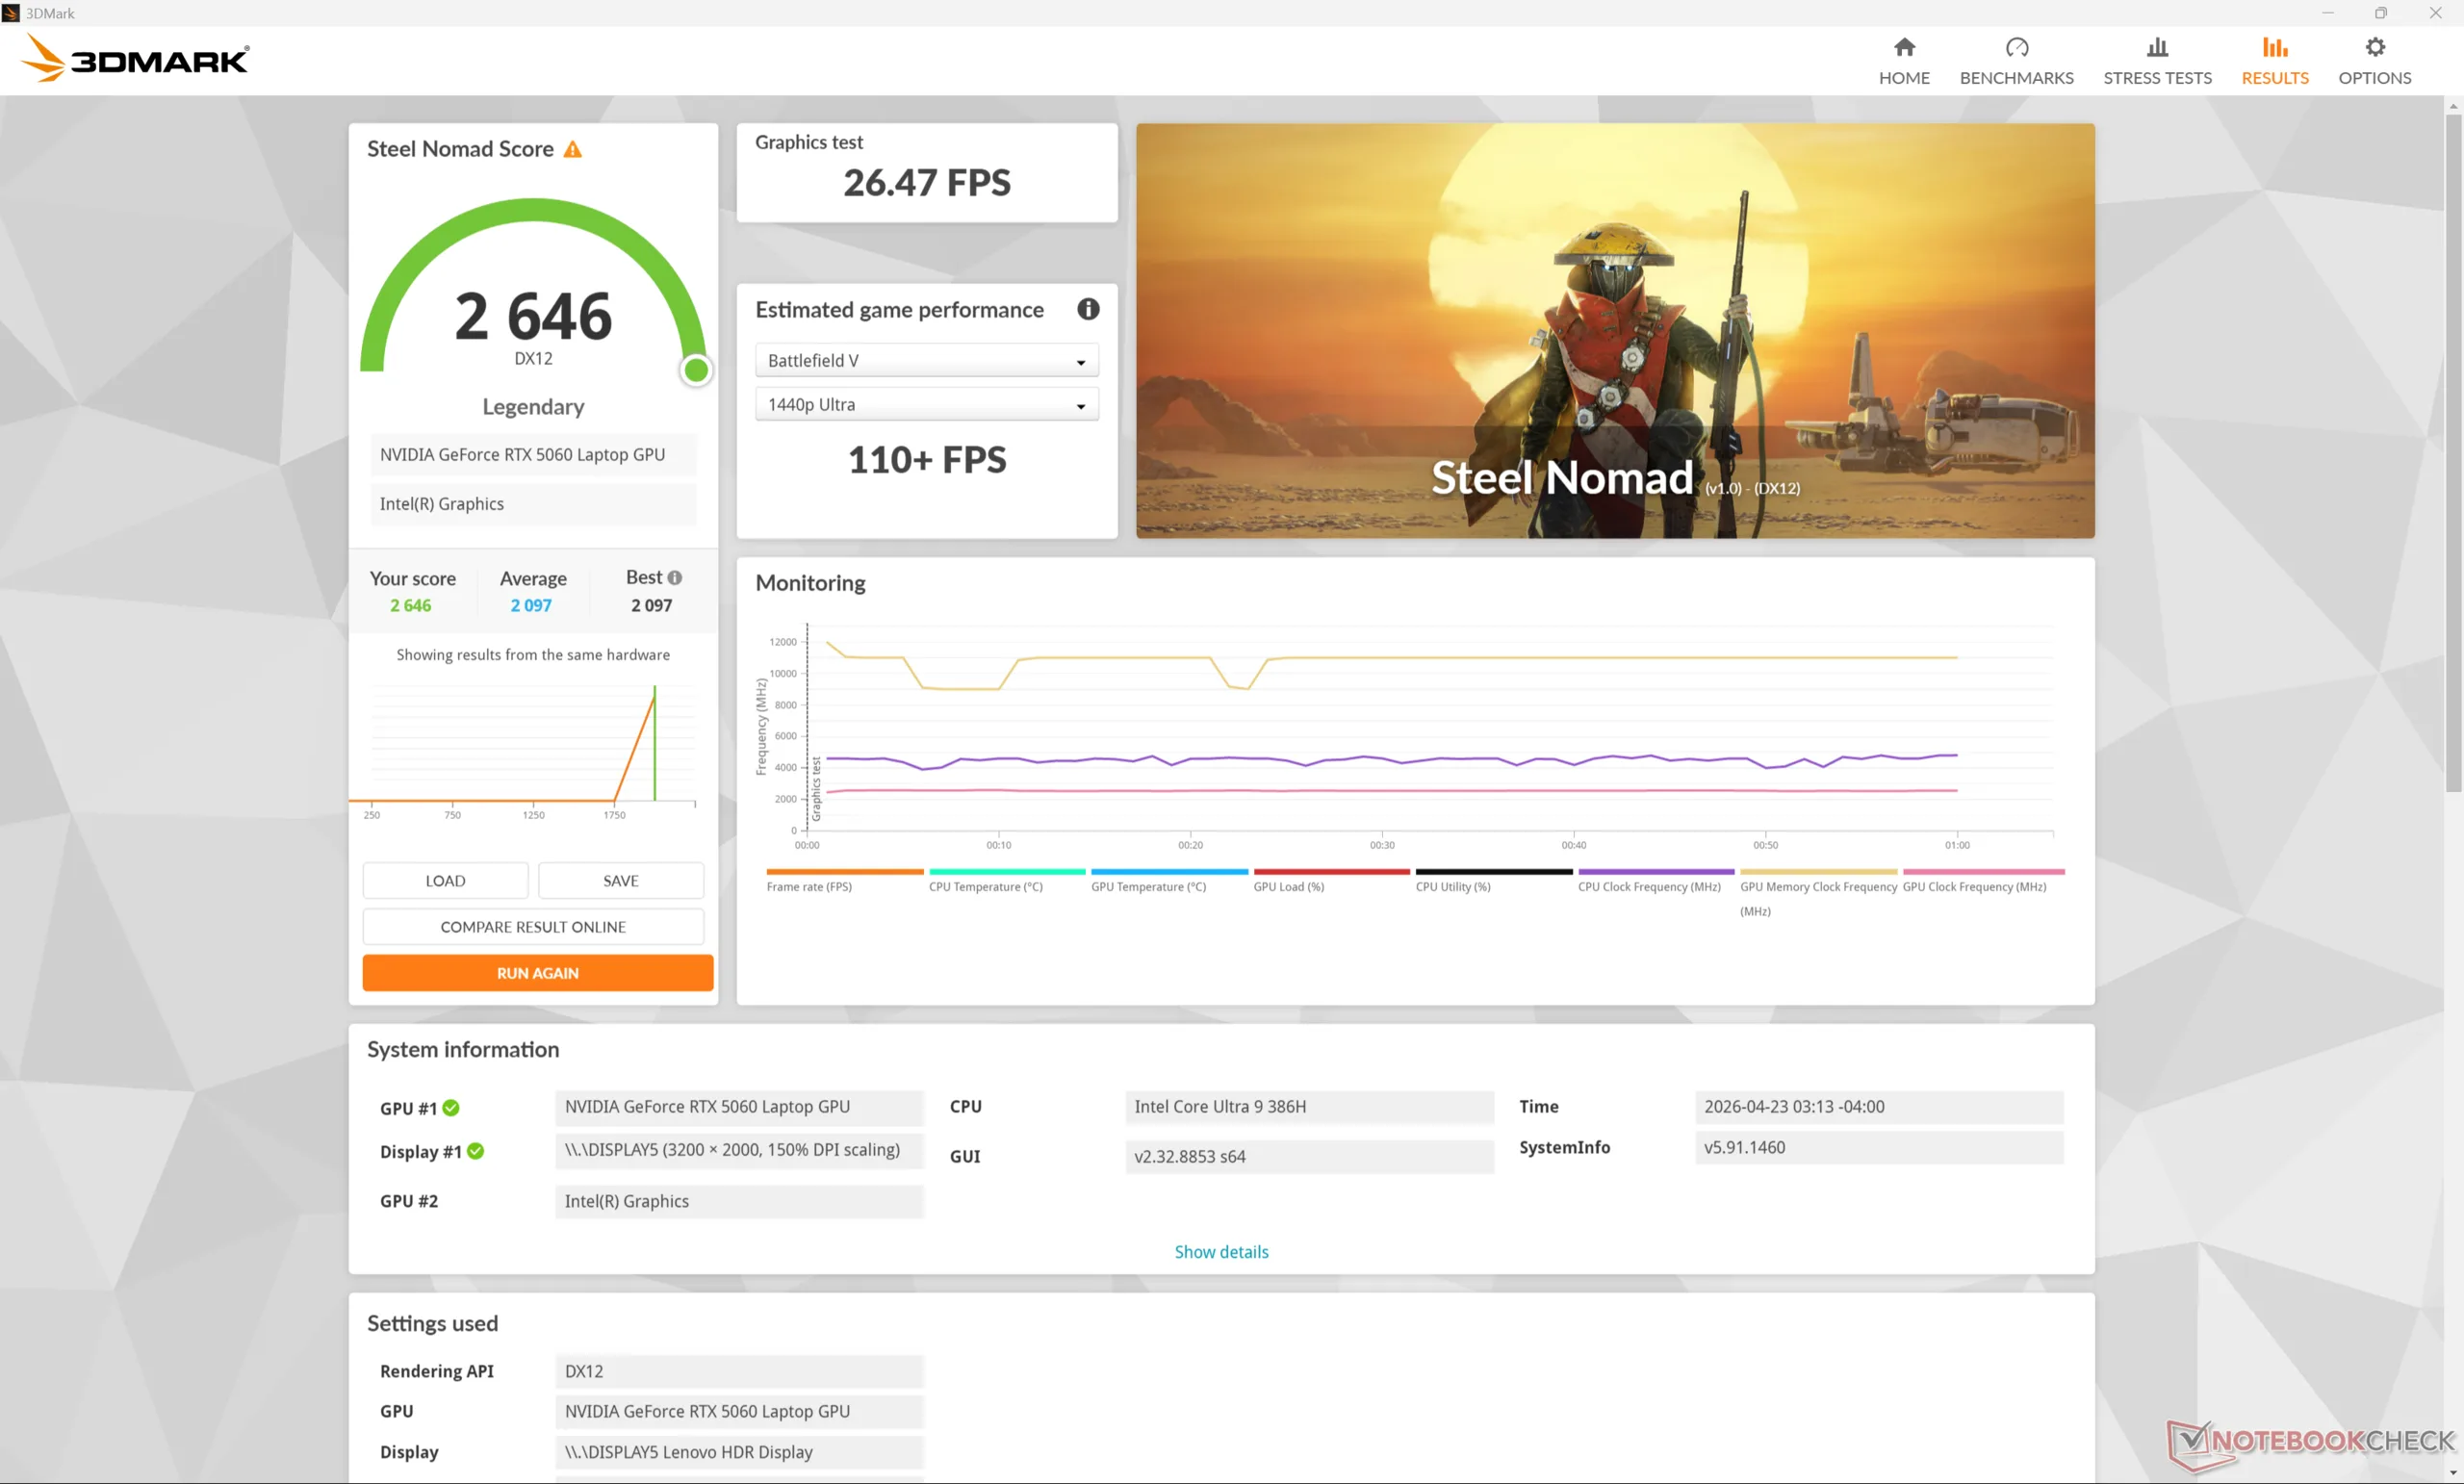
| 3DMark Steel Nomad Score | 2646 pontos | |
Ajuda | ||
* ... menor é melhor
| Cyberpunk 2077 - 1920x1080 Ultra Preset (FSR off) | |
| Asus ProArt P16 H7606WP | |
| Lenovo Pro 9 16IPH11 | |
| Lenovo Yoga Pro 9 16IAH10 RTX 5050 | |
| Dell XPS 16 Core Ultra X7 358H | |
| MSI Prestige 16 AI Evo B2HMG | |
| Baldur's Gate 3 - 1920x1080 Ultra Preset AA:T | |
| Asus ProArt P16 H7606WP | |
| Lenovo Pro 9 16IPH11 | |
| Lenovo Yoga Pro 9 16IAH10 RTX 5050 | |
| Dell XPS 16 Core Ultra X7 358H | |
| MSI Prestige 16 AI Evo B2HMG | |
| GTA V - 1920x1080 Highest AA:4xMSAA + FX AF:16x | |
| Lenovo Pro 9 16IPH11 | |
| Lenovo Yoga Pro 9 16IAH10 RTX 5050 | |
| Asus ProArt P16 H7606WP | |
| HP Omen Transcend 16-u1095ng | |
| Dell XPS 16 Core Ultra X7 358H | |
| MSI Prestige 16 AI Evo B2HMG | |
| Final Fantasy XV Benchmark - 1920x1080 High Quality | |
| Asus ProArt P16 H7606WP | |
| Lenovo Pro 9 16IPH11 | |
| Lenovo Yoga Pro 9 16IAH10 RTX 5050 | |
| HP Omen Transcend 16-u1095ng | |
| Dell XPS 16 Core Ultra X7 358H | |
| MSI Prestige 16 AI Evo B2HMG | |
| Strange Brigade - 1920x1080 ultra AA:ultra AF:16 | |
| Asus ProArt P16 H7606WP | |
| Lenovo Pro 9 16IPH11 | |
| HP Omen Transcend 16-u1095ng | |
| Lenovo Yoga Pro 9 16IAH10 RTX 5050 | |
| Dell XPS 16 Core Ultra X7 358H | |
| MSI Prestige 16 AI Evo B2HMG | |
| Dota 2 Reborn - 1920x1080 ultra (3/3) best looking | |
| HP Omen Transcend 16-u1095ng | |
| Lenovo Yoga Pro 9 16IAH10 RTX 5050 | |
| Lenovo Pro 9 16IPH11 | |
| Asus ProArt P16 H7606WP | |
| Dell XPS 16 Core Ultra X7 358H | |
| MSI Prestige 16 AI Evo B2HMG | |
| X-Plane 11.11 - 1920x1080 high (fps_test=3) | |
| HP Omen Transcend 16-u1095ng | |
| Lenovo Yoga Pro 9 16IAH10 RTX 5050 | |
| Asus ProArt P16 H7606WP | |
| Dell XPS 16 Core Ultra X7 358H | |
| MSI Prestige 16 AI Evo B2HMG | |
| Black Myth: Wukong | |
| 1920x1080 high TSR 100 | |
| Média NVIDIA GeForce RTX 5060 Laptop (50 - 58, n=2) | |
| Lenovo Pro 9 16IPH11 | |
| Dell XPS 16 Core Ultra X7 358H | |
| 1920x1080 cinematic TSR 100 | |
| Média NVIDIA GeForce RTX 5060 Laptop (28 - 32, n=3) | |
| Lenovo Pro 9 16IPH11 | |
| Dell XPS 16 Core Ultra X7 358H | |
| 2560x1440 cinematic TSR 100 | |
| Média NVIDIA GeForce RTX 5060 Laptop (21 - 23, n=3) | |
| Lenovo Pro 9 16IPH11 | |
| 2560x1440 cinematic DLSS 68 | |
| Média NVIDIA GeForce RTX 5060 Laptop (32 - 36, n=2) | |
| Lenovo Pro 9 16IPH11 | |
| 2560x1440 cinematic RT: Very High DLSS 68 FG | |
| Lenovo Pro 9 16IPH11 | |
| Média NVIDIA GeForce RTX 5060 Laptop (31 - 37, n=2) | |
| F1 24 | |
| 1920x1080 Ultra High Preset AA:T AF:16x | |
| Asus ProArt P16 H7606WP | |
| Lenovo Legion 7 16 AGP11 | |
| Média NVIDIA GeForce RTX 5060 Laptop (68.2 - 77.5, n=8) | |
| Lenovo Pro 9 16IPH11 | |
| Lenovo Yoga Pro 9 16IAH10 RTX 5050 | |
| Dell XPS 16 Core Ultra X7 358H | |
| MSI Venture 16 AI A2HMTG | |
| 2560x1440 Ultra High Preset AA:T AF:16x | |
| Asus ProArt P16 H7606WP | |
| Lenovo Legion 7 16 AGP11 | |
| Média NVIDIA GeForce RTX 5060 Laptop (39 - 49.1, n=8) | |
| Lenovo Pro 9 16IPH11 | |
| Lenovo Yoga Pro 9 16IAH10 RTX 5050 | |
| 2560x1440 Ultra High Preset + Quality DLSS AF:16x | |
| Lenovo Legion 7 16 AGP11 | |
| Lenovo Pro 9 16IPH11 | |
| Média NVIDIA GeForce RTX 5060 Laptop (65 - 74.5, n=7) | |
| Lenovo Yoga Pro 9 16IAH10 RTX 5050 | |
| Monster Hunter Wilds | |
| 1920x1080 high, no upscaling | |
| Lenovo Pro 9 16IPH11 | |
| Média NVIDIA GeForce RTX 5060 Laptop (49.7 - 58.8, n=2) | |
| 1920x1080 ultra, RT: high, no upscaling | |
| Lenovo Pro 9 16IPH11 | |
| Média NVIDIA GeForce RTX 5060 Laptop (16.6 - 36.5, n=3) | |
| 2560x1440 ultra, RT: high, no upscaling | |
| Lenovo Pro 9 16IPH11 | |
| Média NVIDIA GeForce RTX 5060 Laptop (13.9 - 20.9, n=2) | |
Gráfico de ultra FPS do Cyberpunk 2077
| baixo | média | alto | ultra | QHD DLSS | QHD | |
|---|---|---|---|---|---|---|
| GTA V (2015) | 185.8 | 183.5 | 179.4 | 133.6 | 110.7 | |
| Dota 2 Reborn (2015) | 172.5 | 156.7 | 151.6 | 142.4 | ||
| Final Fantasy XV Benchmark (2018) | 187.9 | 170.4 | 124.1 | 92.3 | ||
| X-Plane 11.11 (2018) | 113 | 102.9 | ||||
| Strange Brigade (2018) | 482 | 314 | 214 | 217 | 125.5 | |
| Baldur's Gate 3 (2023) | 164.6 | 137.8 | 119.9 | 117.8 | 117.5 | 79.4 |
| Cyberpunk 2077 (2023) | 132.3 | 108.2 | 92.3 | 83.3 | 63.2 | 53.4 |
| F1 24 (2024) | 249 | 249 | 207 | 69.5 | 69.3 | 42.8 |
| Black Myth: Wukong (2024) | 85 | 64 | 50 | 28 | 32 | 21 |
| Monster Hunter Wilds (2025) | 74.2 | 63 | 58.8 | 34.8 | 20.9 |
Emissões
Ruído do sistema
O teto e o comportamento do ruído do ventilador são muito parecidos com os do Yoga Pro 9 16IAH10 do ano passado, já que não houve grandes mudanças na placa-mãe. Talvez o mais importante seja o fato de que o ruído da ventoinha ao executar o Cyberpunk 2077 ficaria em torno de 41 dB(A) no modo Equilibrado ou 50 dB(A) no modo Desempenho. A já mencionada queda de 10% no desempenho gráfico ao jogar no modo Balanced pode ser um compromisso razoável para as ventoinhas muito mais silenciosas.
Barulho
| Ocioso |
| 23.5 / 24 / 24 dB |
| Carga |
| 32.3 / 50.1 dB |
 | ||
30 dB silencioso 40 dB(A) audível 50 dB(A) ruidosamente alto |
||
min: | ||
| Lenovo Pro 9 16IPH11 Ultra 9 386H, GeForce RTX 5060 Laptop | Lenovo Yoga Pro 9 16IAH10 RTX 5050 Ultra 9 285H, GeForce RTX 5050 Laptop | Dell XPS 16 Core Ultra X7 358H Ultra X7 358H, Arc B390 Panther Lake iGPU | MSI Prestige 16 AI Evo B2HMG Ultra 9 285H, Arc 140T | HP Omen Transcend 16-u1095ng i9-14900HX, GeForce RTX 4070 Laptop GPU | Asus ProArt P16 H7606WP Ryzen AI 9 HX 370, GeForce RTX 5070 Laptop | |
|---|---|---|---|---|---|---|
| Noise | -5% | 0% | 1% | -19% | -16% | |
| desligado / ambiente * (dB) | 23 | 24.6 -7% | 23.3 -1% | 23.6 -3% | 24 -4% | 23.5 -2% |
| Idle Minimum * (dB) | 23.5 | 24.6 -5% | 23.4 -0% | 23.6 -0% | 29 -23% | 26.7 -14% |
| Idle Average * (dB) | 24 | 24.6 -3% | 23.4 2% | 23.6 2% | 30 -25% | 26.7 -11% |
| Idle Maximum * (dB) | 24 | 26.8 -12% | 25.8 -8% | 26.2 -9% | 31 -29% | 31.1 -30% |
| Load Average * (dB) | 32.3 | 32.8 -2% | 38 -18% | 37.1 -15% | 45 -39% | 44.8 -39% |
| Cyberpunk 2077 ultra * (dB) | 50.1 | 51.8 -3% | 38.1 24% | 42.1 16% | 53.7 -7% | |
| Load Maximum * (dB) | 50.1 | 51.8 -3% | 48.6 3% | 42.1 16% | 47 6% | 53.7 -7% |
| Witcher 3 ultra * (dB) | 44 |
* ... menor é melhor
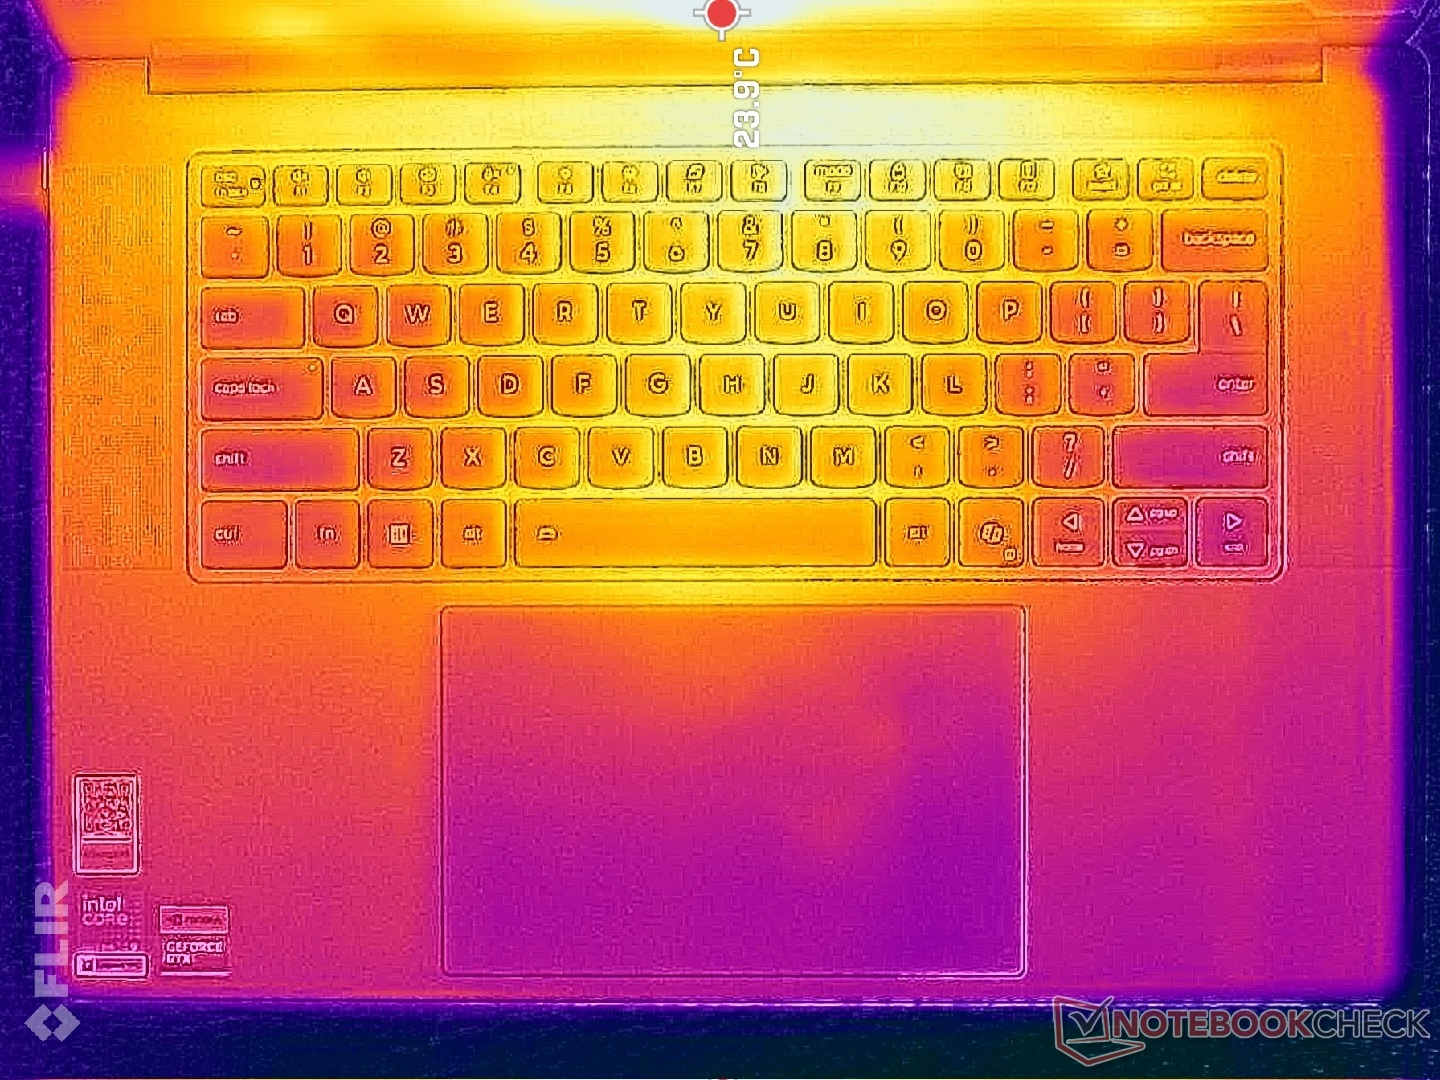
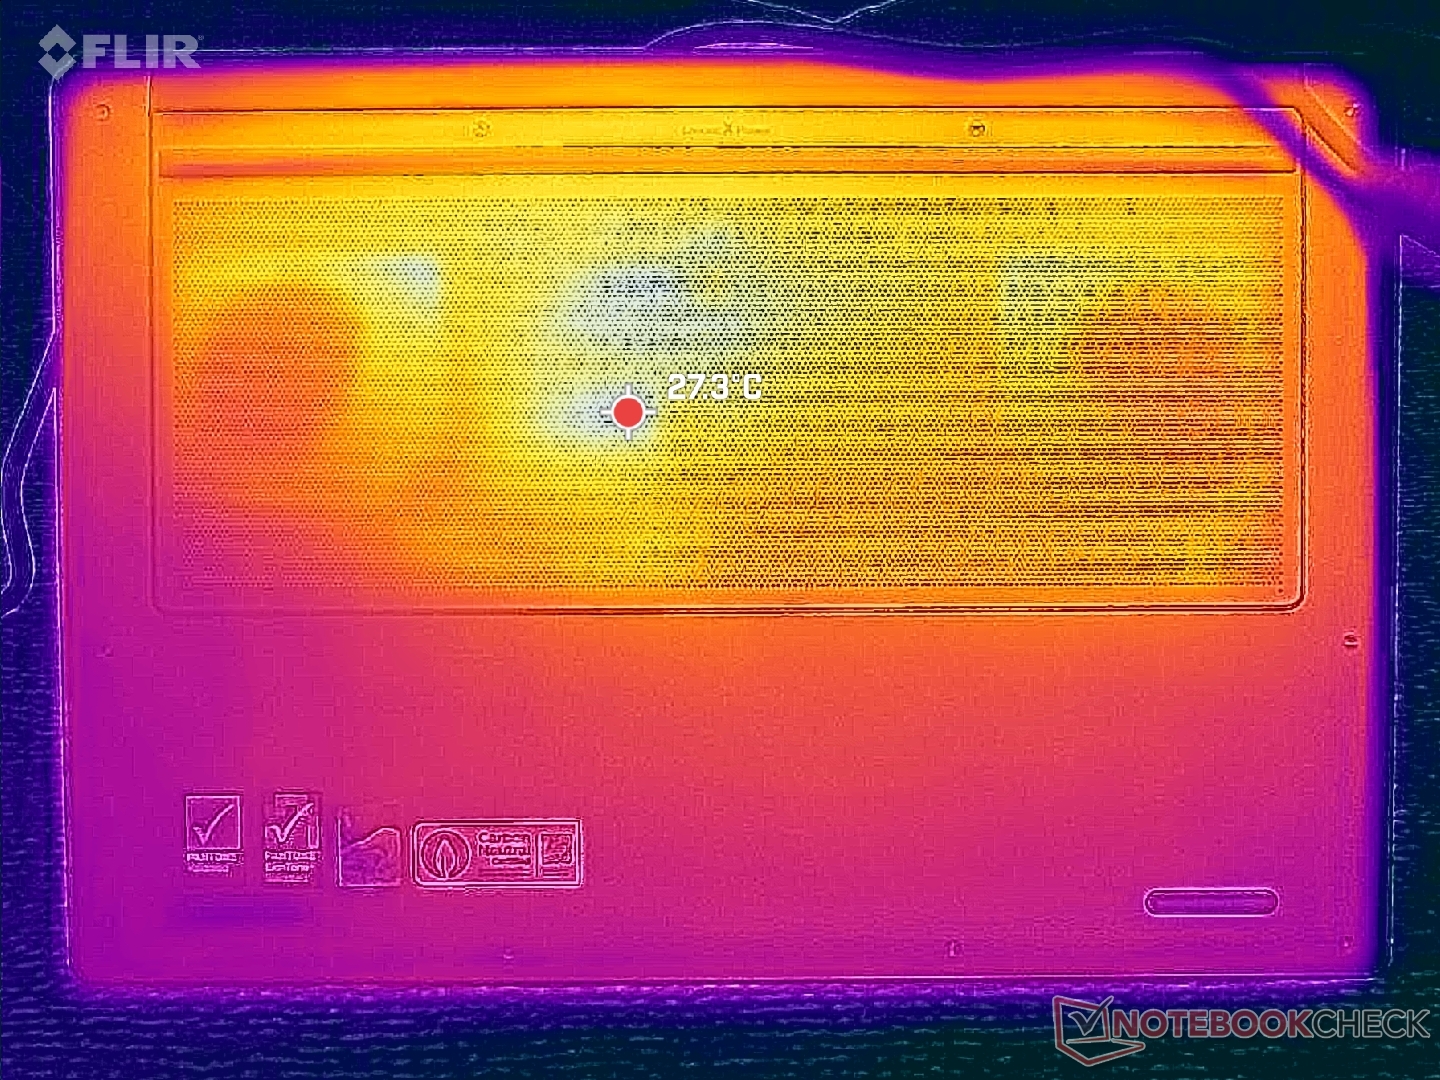
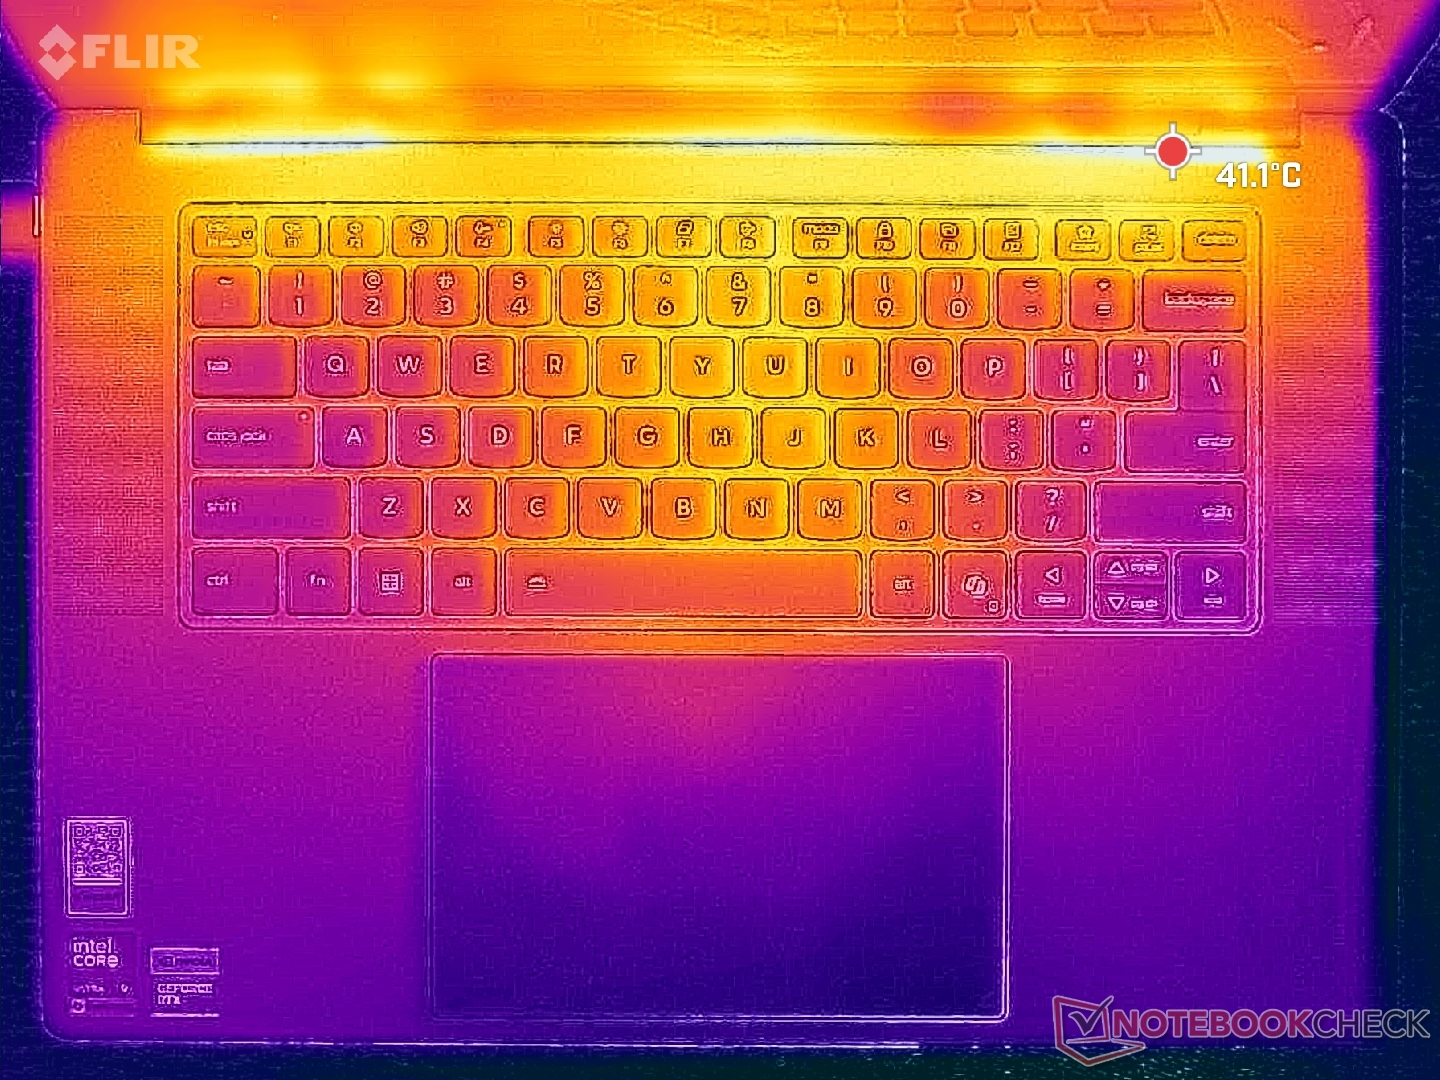
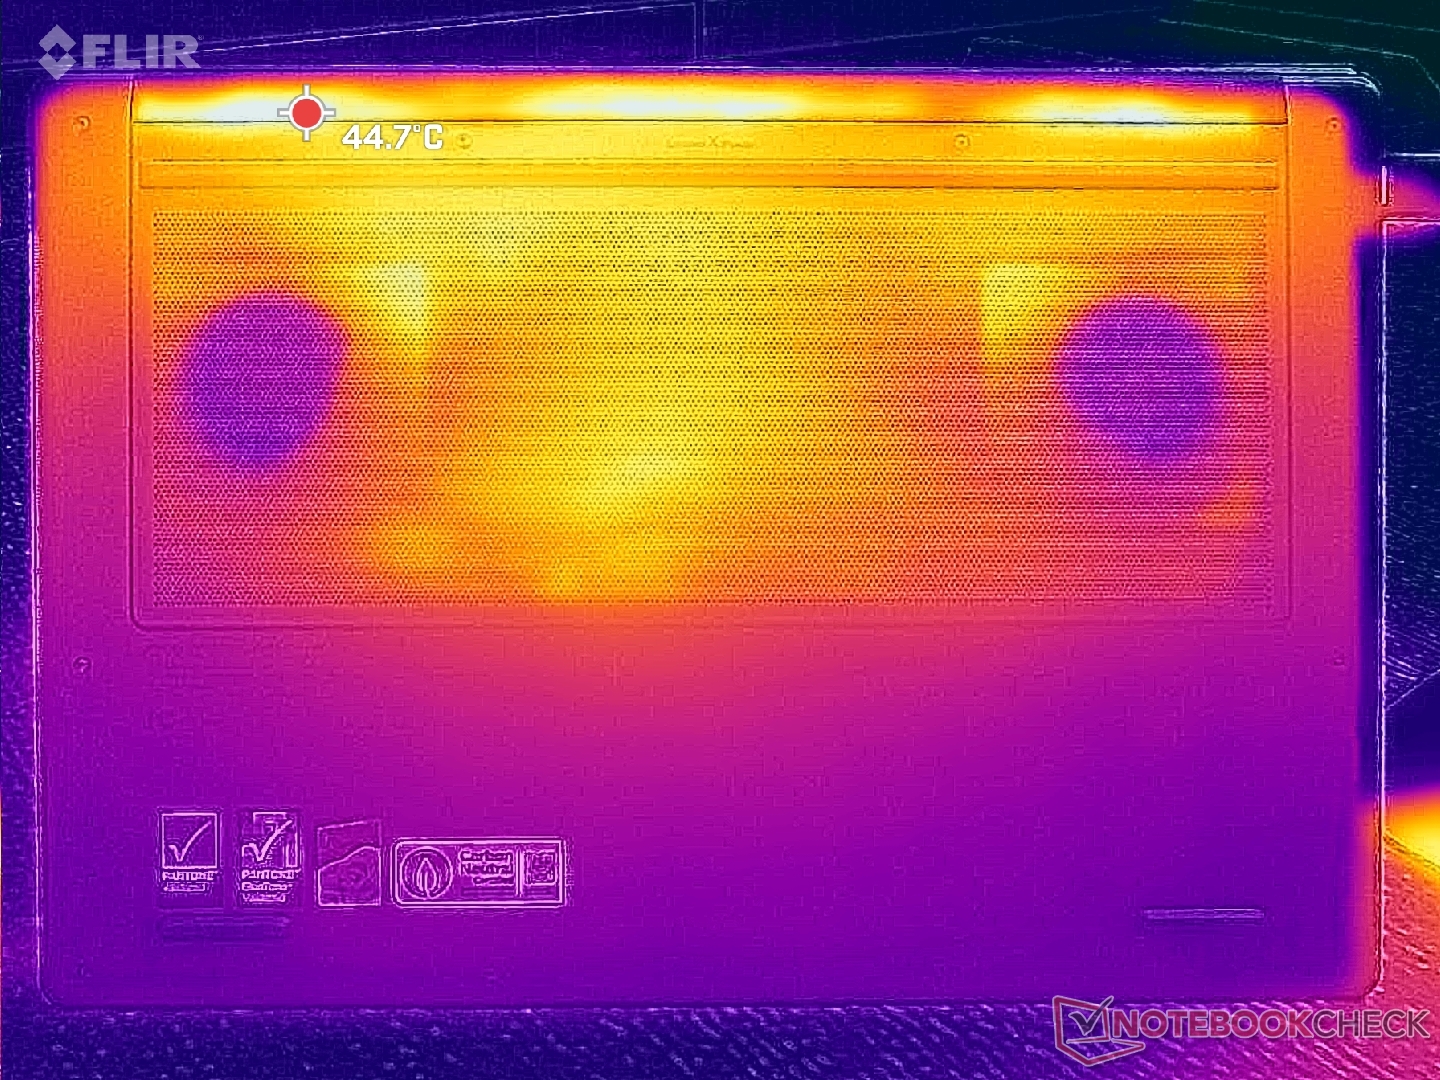
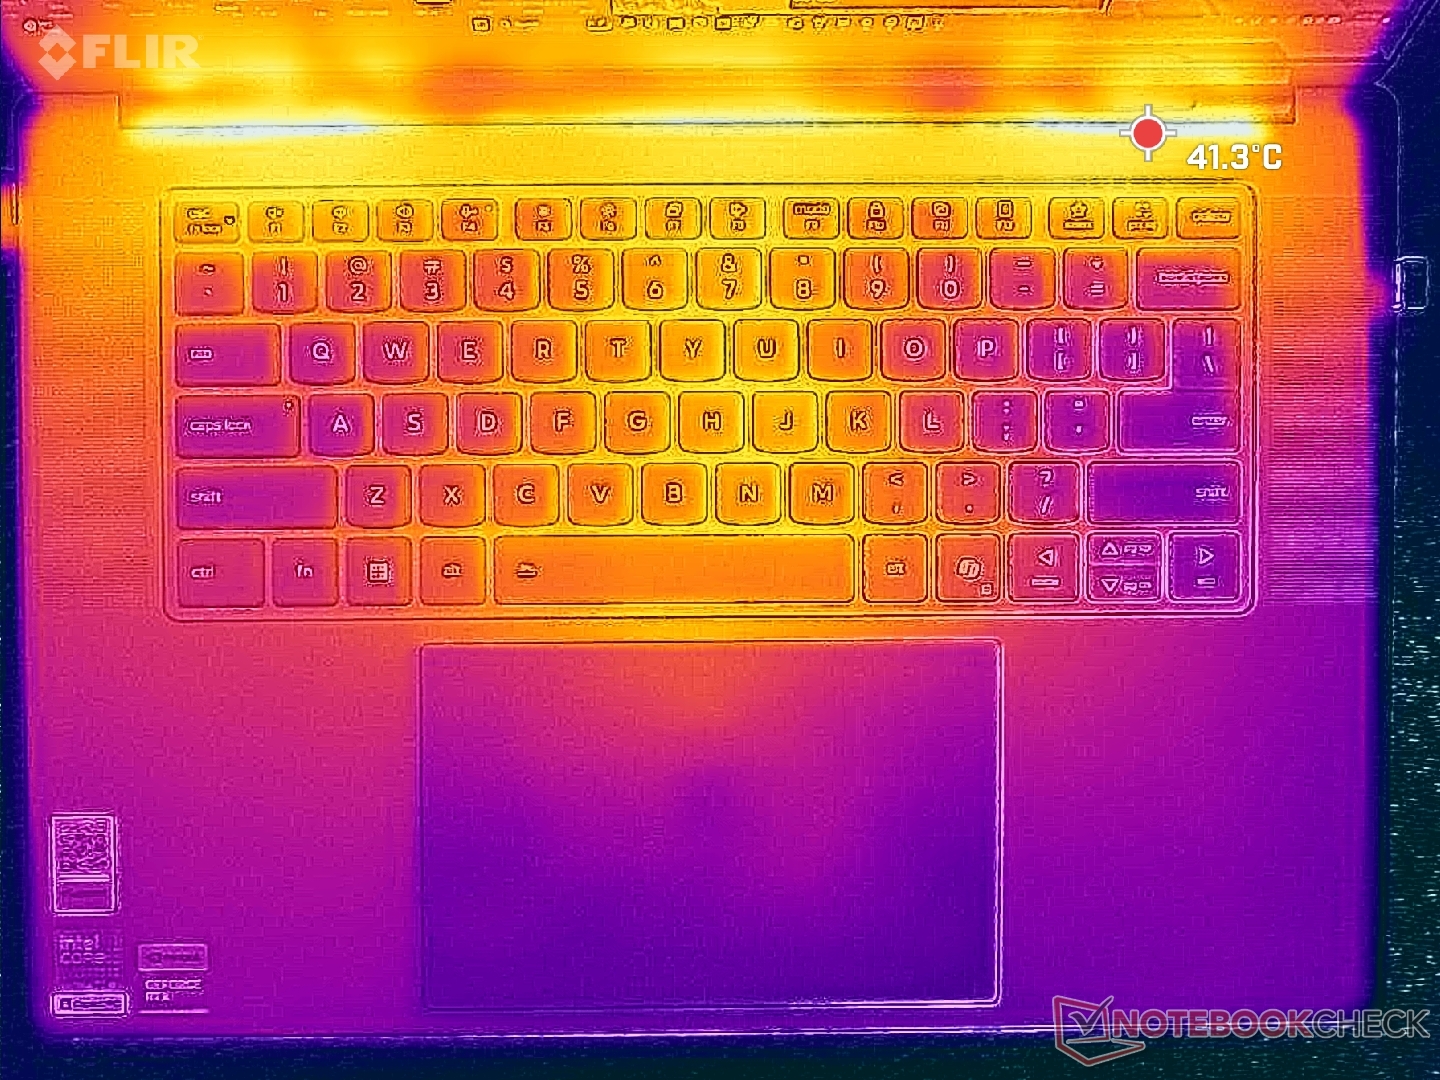
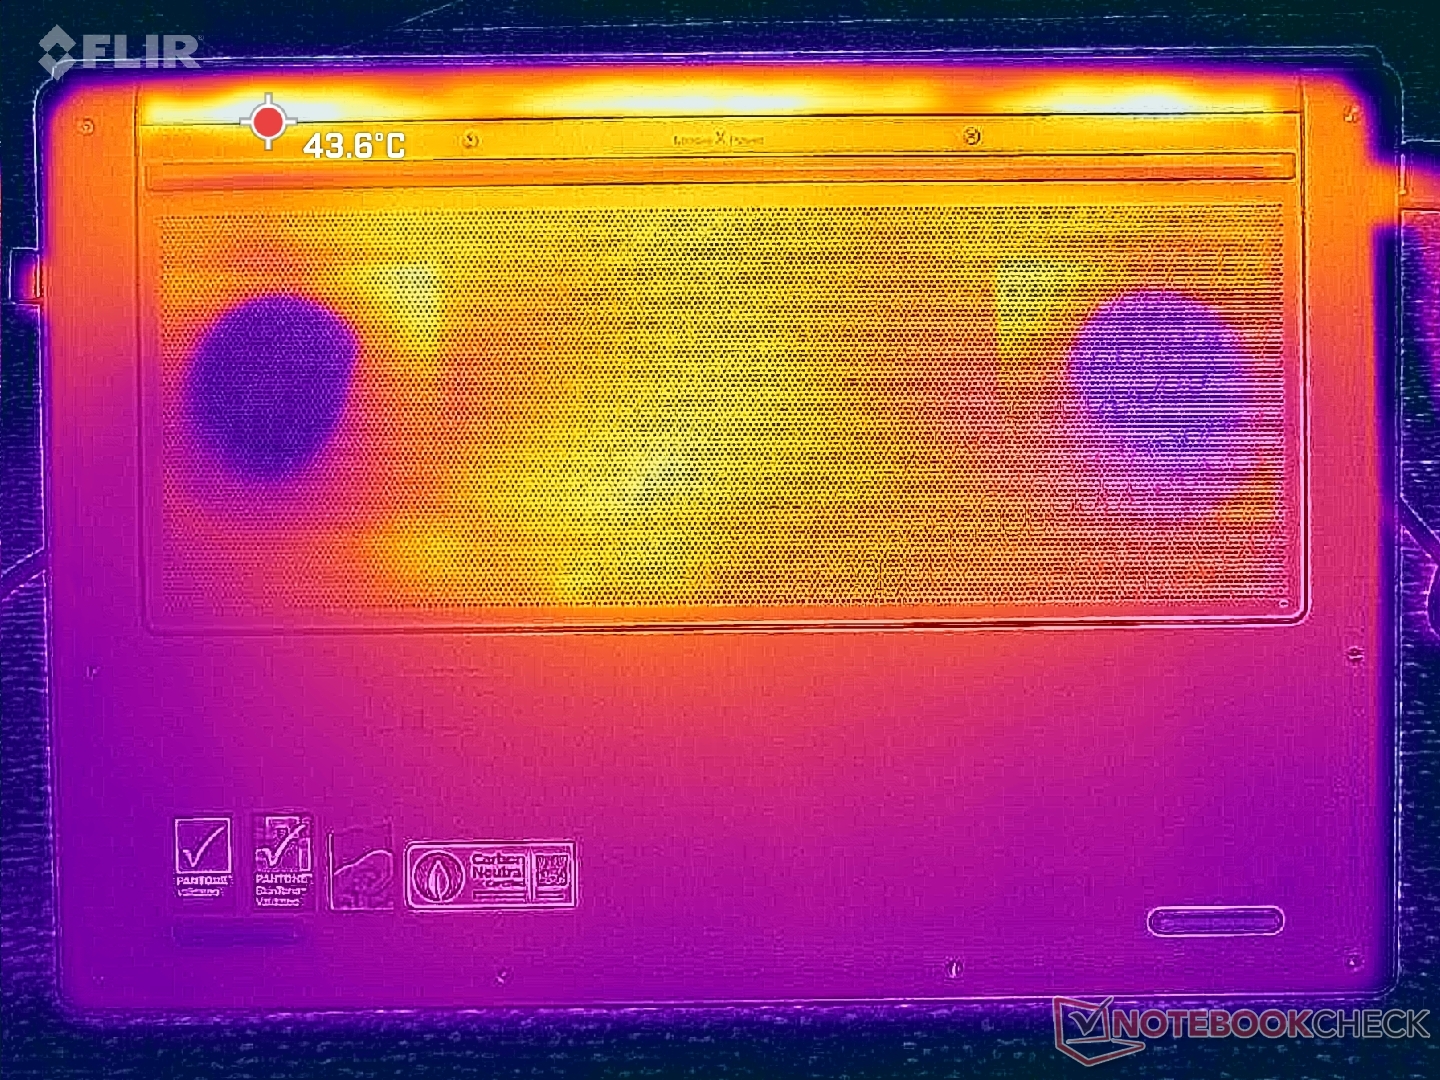
Temperatura
As temperaturas da superfície são visivelmente mais baixas, apesar das dimensões menores do que as do modelo anterior. Ao executar o Cyberpunk 2077, por exemplo, os pontos quentes em nossa unidade atingiram apenas 38 C e 41 C, em comparação com 42 C e 49 C no Yoga Pro 9i 16IAH G10 Aura com a mesma GPU Nvidia.
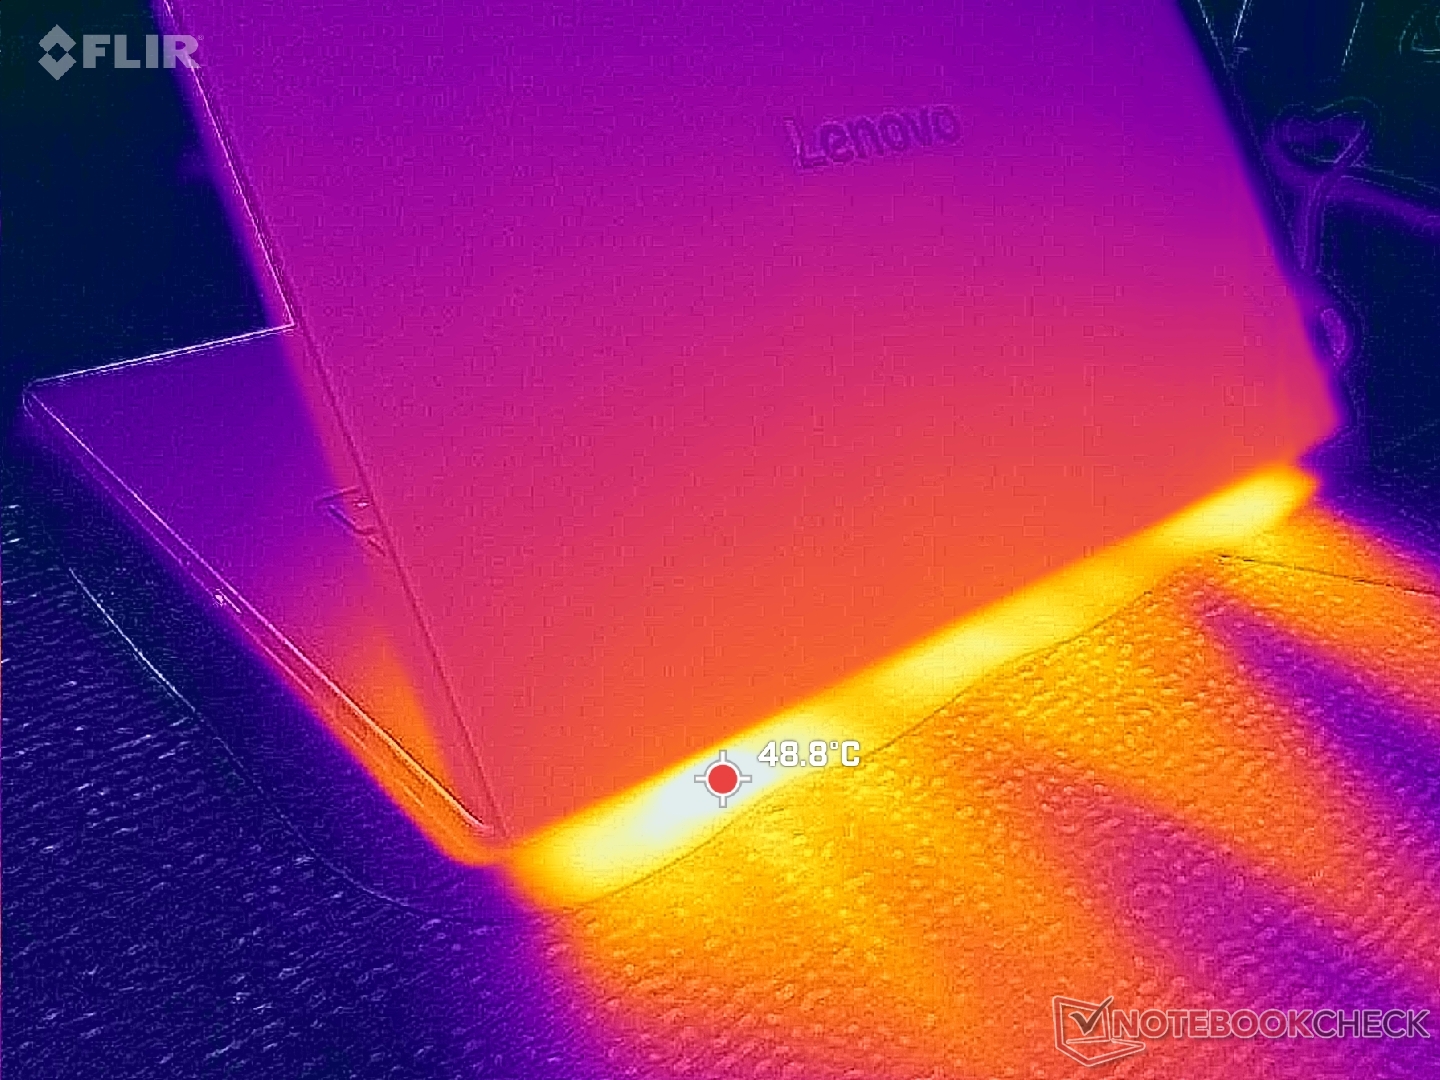
(+) A temperatura máxima no lado superior é 37.8 °C / 100 F, em comparação com a média de 36.8 °C / 98 F , variando de 21 a 71 °C para a classe Multimedia.
(+) A parte inferior aquece até um máximo de 38.2 °C / 101 F, em comparação com a média de 39.1 °C / 102 F
(+) Em uso inativo, a temperatura média para o lado superior é 27.1 °C / 81 F, em comparação com a média do dispositivo de 31.3 °C / ### class_avg_f### F.
(+) 3: The average temperature for the upper side is 31.7 °C / 89 F, compared to the average of 31.3 °C / 88 F for the class Multimedia.
(+) Os apoios para as mãos e o touchpad são mais frios que a temperatura da pele, com um máximo de 29.4 °C / 84.9 F e, portanto, são frios ao toque.
(±) A temperatura média da área do apoio para as mãos de dispositivos semelhantes foi 28.7 °C / 83.7 F (-0.7 °C / -1.2 F).
| Lenovo Pro 9 16IPH11 Ultra 9 386H, GeForce RTX 5060 Laptop | Lenovo Yoga Pro 9 16IAH10 RTX 5050 Ultra 9 285H, GeForce RTX 5050 Laptop | Dell XPS 16 Core Ultra X7 358H Ultra X7 358H, Arc B390 Panther Lake iGPU | MSI Prestige 16 AI Evo B2HMG Ultra 9 285H, Arc 140T | HP Omen Transcend 16-u1095ng i9-14900HX, GeForce RTX 4070 Laptop GPU | Asus ProArt P16 H7606WP Ryzen AI 9 HX 370, GeForce RTX 5070 Laptop | |
|---|---|---|---|---|---|---|
| Heat | 1% | 9% | -7% | -22% | -5% | |
| Maximum Upper Side * (°C) | 37.8 | 34.4 9% | 40.6 -7% | 48.1 -27% | 49 -30% | 47 -24% |
| Maximum Bottom * (°C) | 38.2 | 41.4 -8% | 39.8 -4% | 51.6 -35% | 63 -65% | 47.4 -24% |
| Idle Upper Side * (°C) | 30.4 | 28.6 6% | 23.2 24% | 25.9 15% | 30 1% | 26.1 14% |
| Idle Bottom * (°C) | 31 | 31.8 -3% | 23.8 23% | 25.2 19% | 29 6% | 26.4 15% |
* ... menor é melhor
Teste de estresse
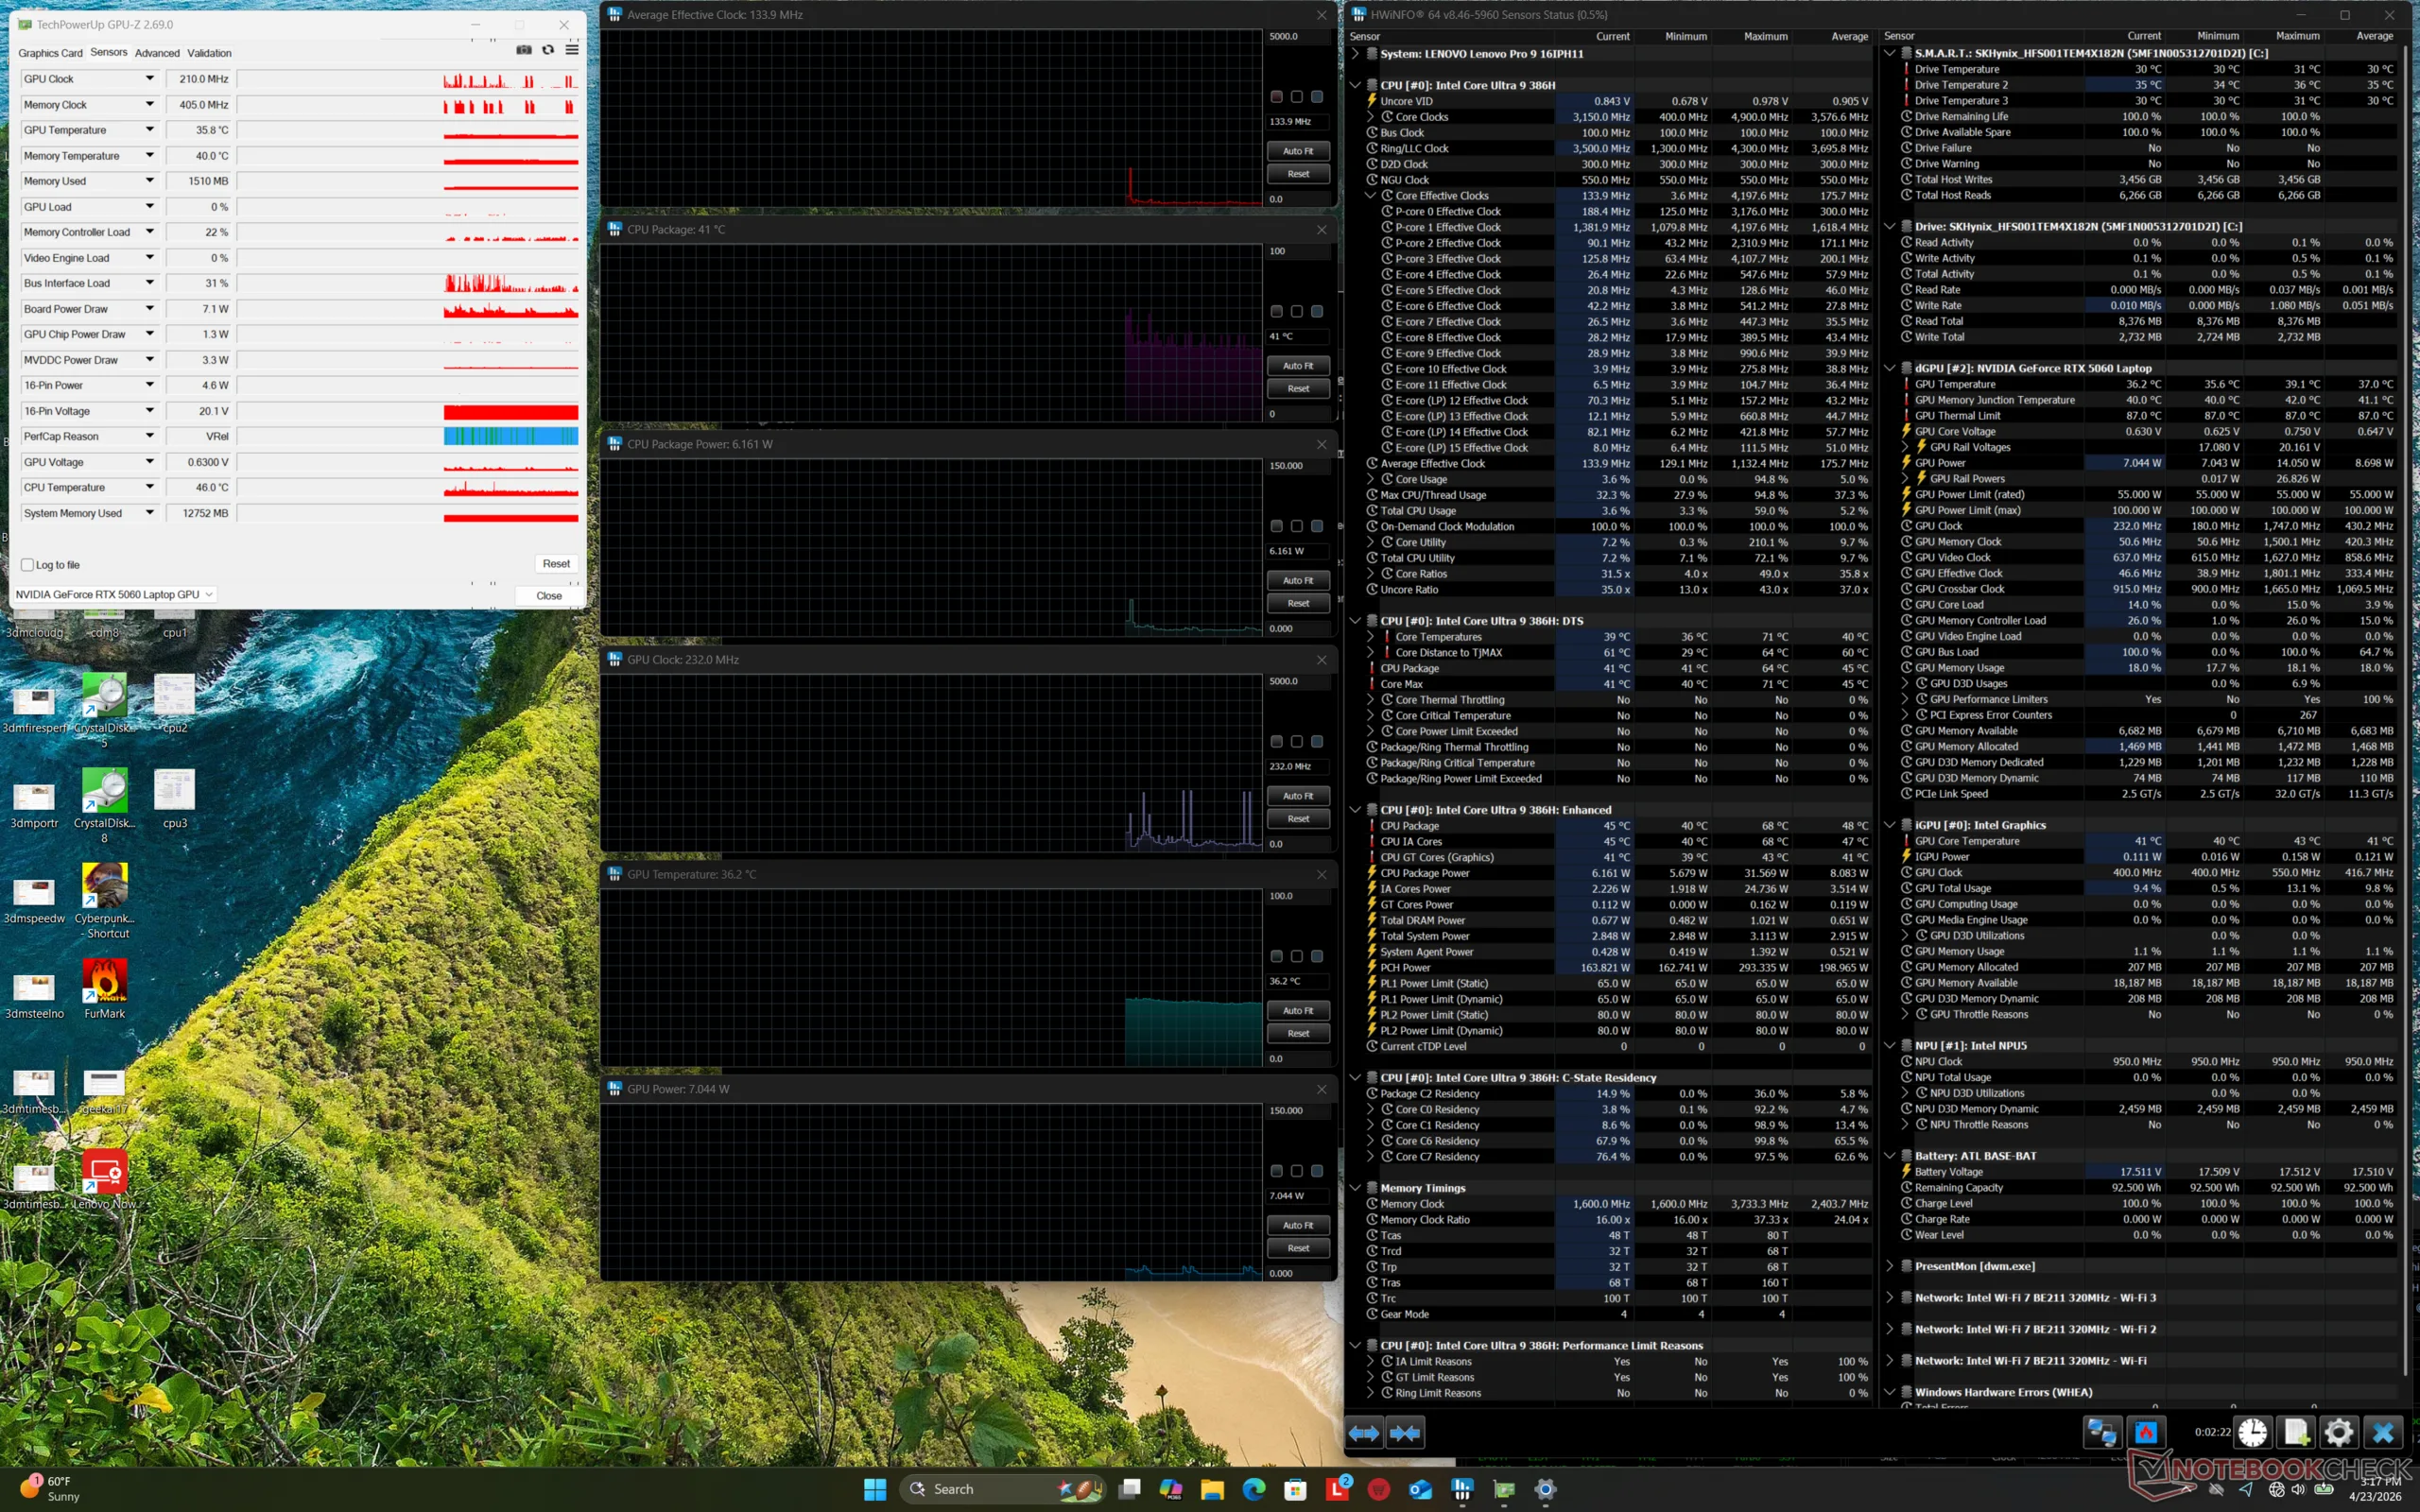
A CPU aumentava para 3,3 GHz, 98 C e 86 W ao iniciar o estresse do Prime95 antes de cair e se estabilizar em 3,0 GHz, 90 C e 62 W cerca de 30 segundos depois.
A temperatura do núcleo e as taxas de clock mudavam drasticamente entre os modos Balanced e Performance, como mostram as capturas de tela abaixo. Ao executar o Cyberpunk 2077, por exemplo, a GPU teria uma média de 2647 MHz, 75 °C e 91 W se configurada no modo Performance ou 2340 MHz, 68 °C e 67 W se configurada no modo Balanced. O desempenho geral mais lento no modo Balanced está alinhado com nossas observações do Time SPy na seção GPU acima.
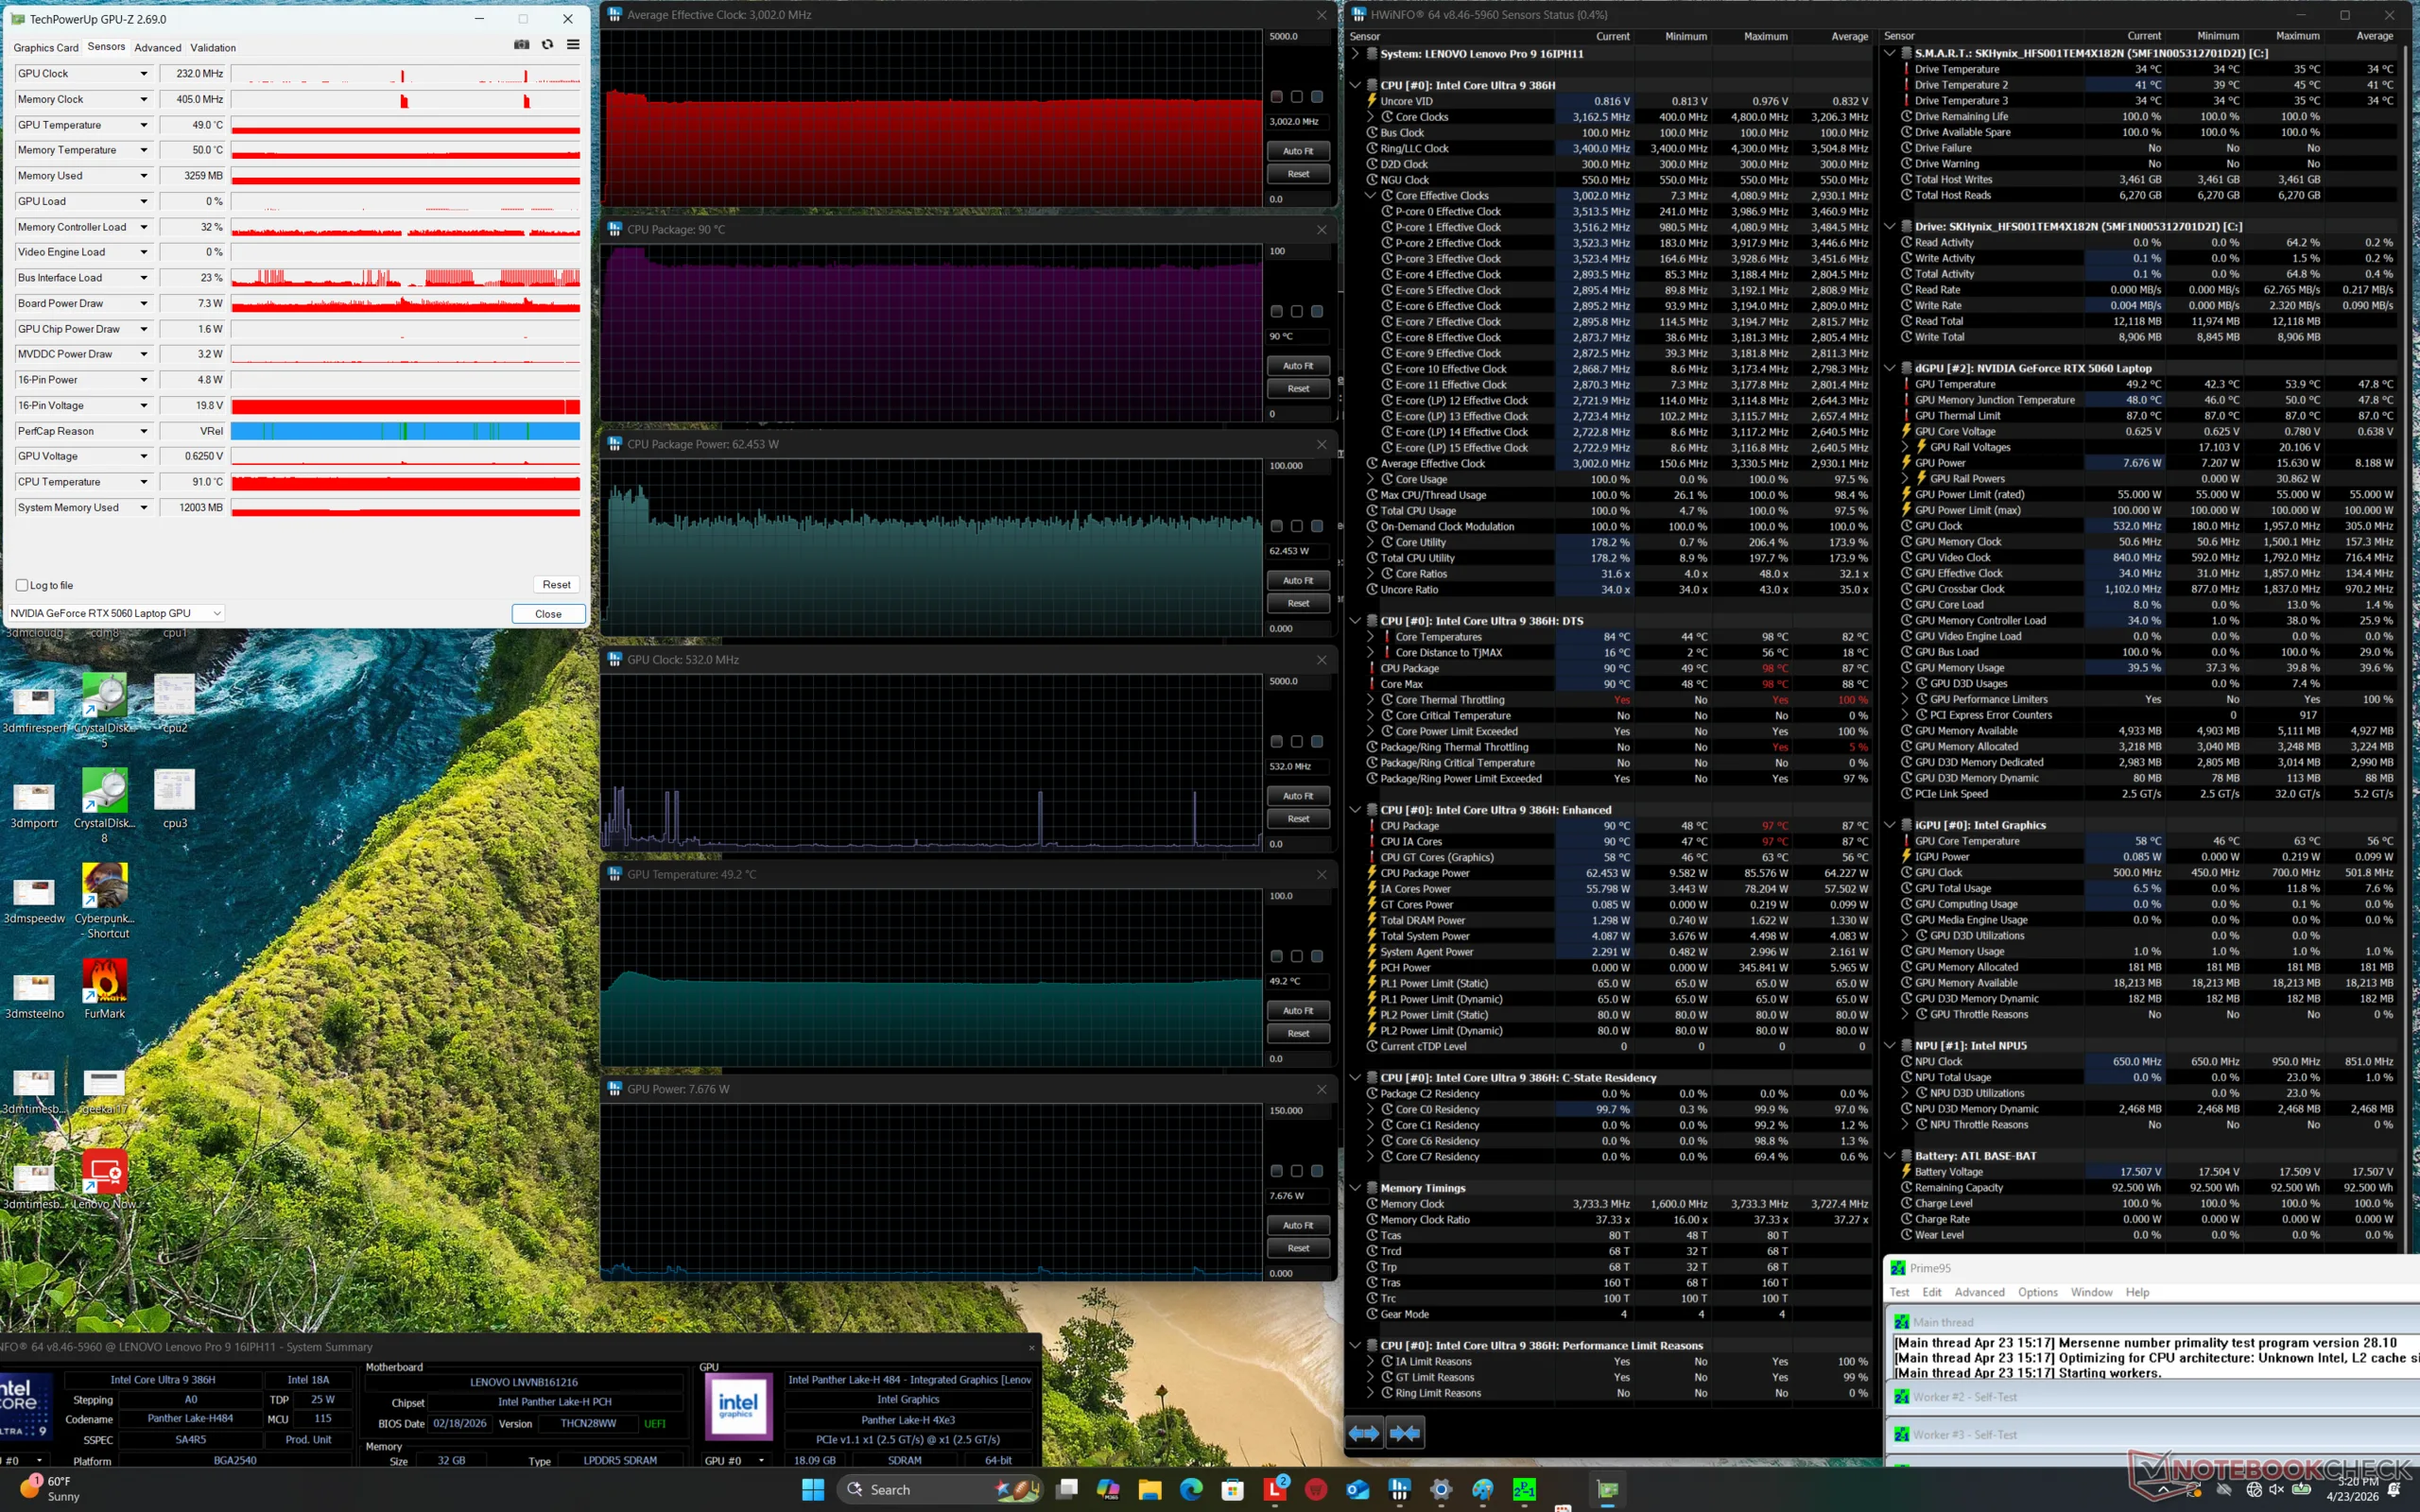
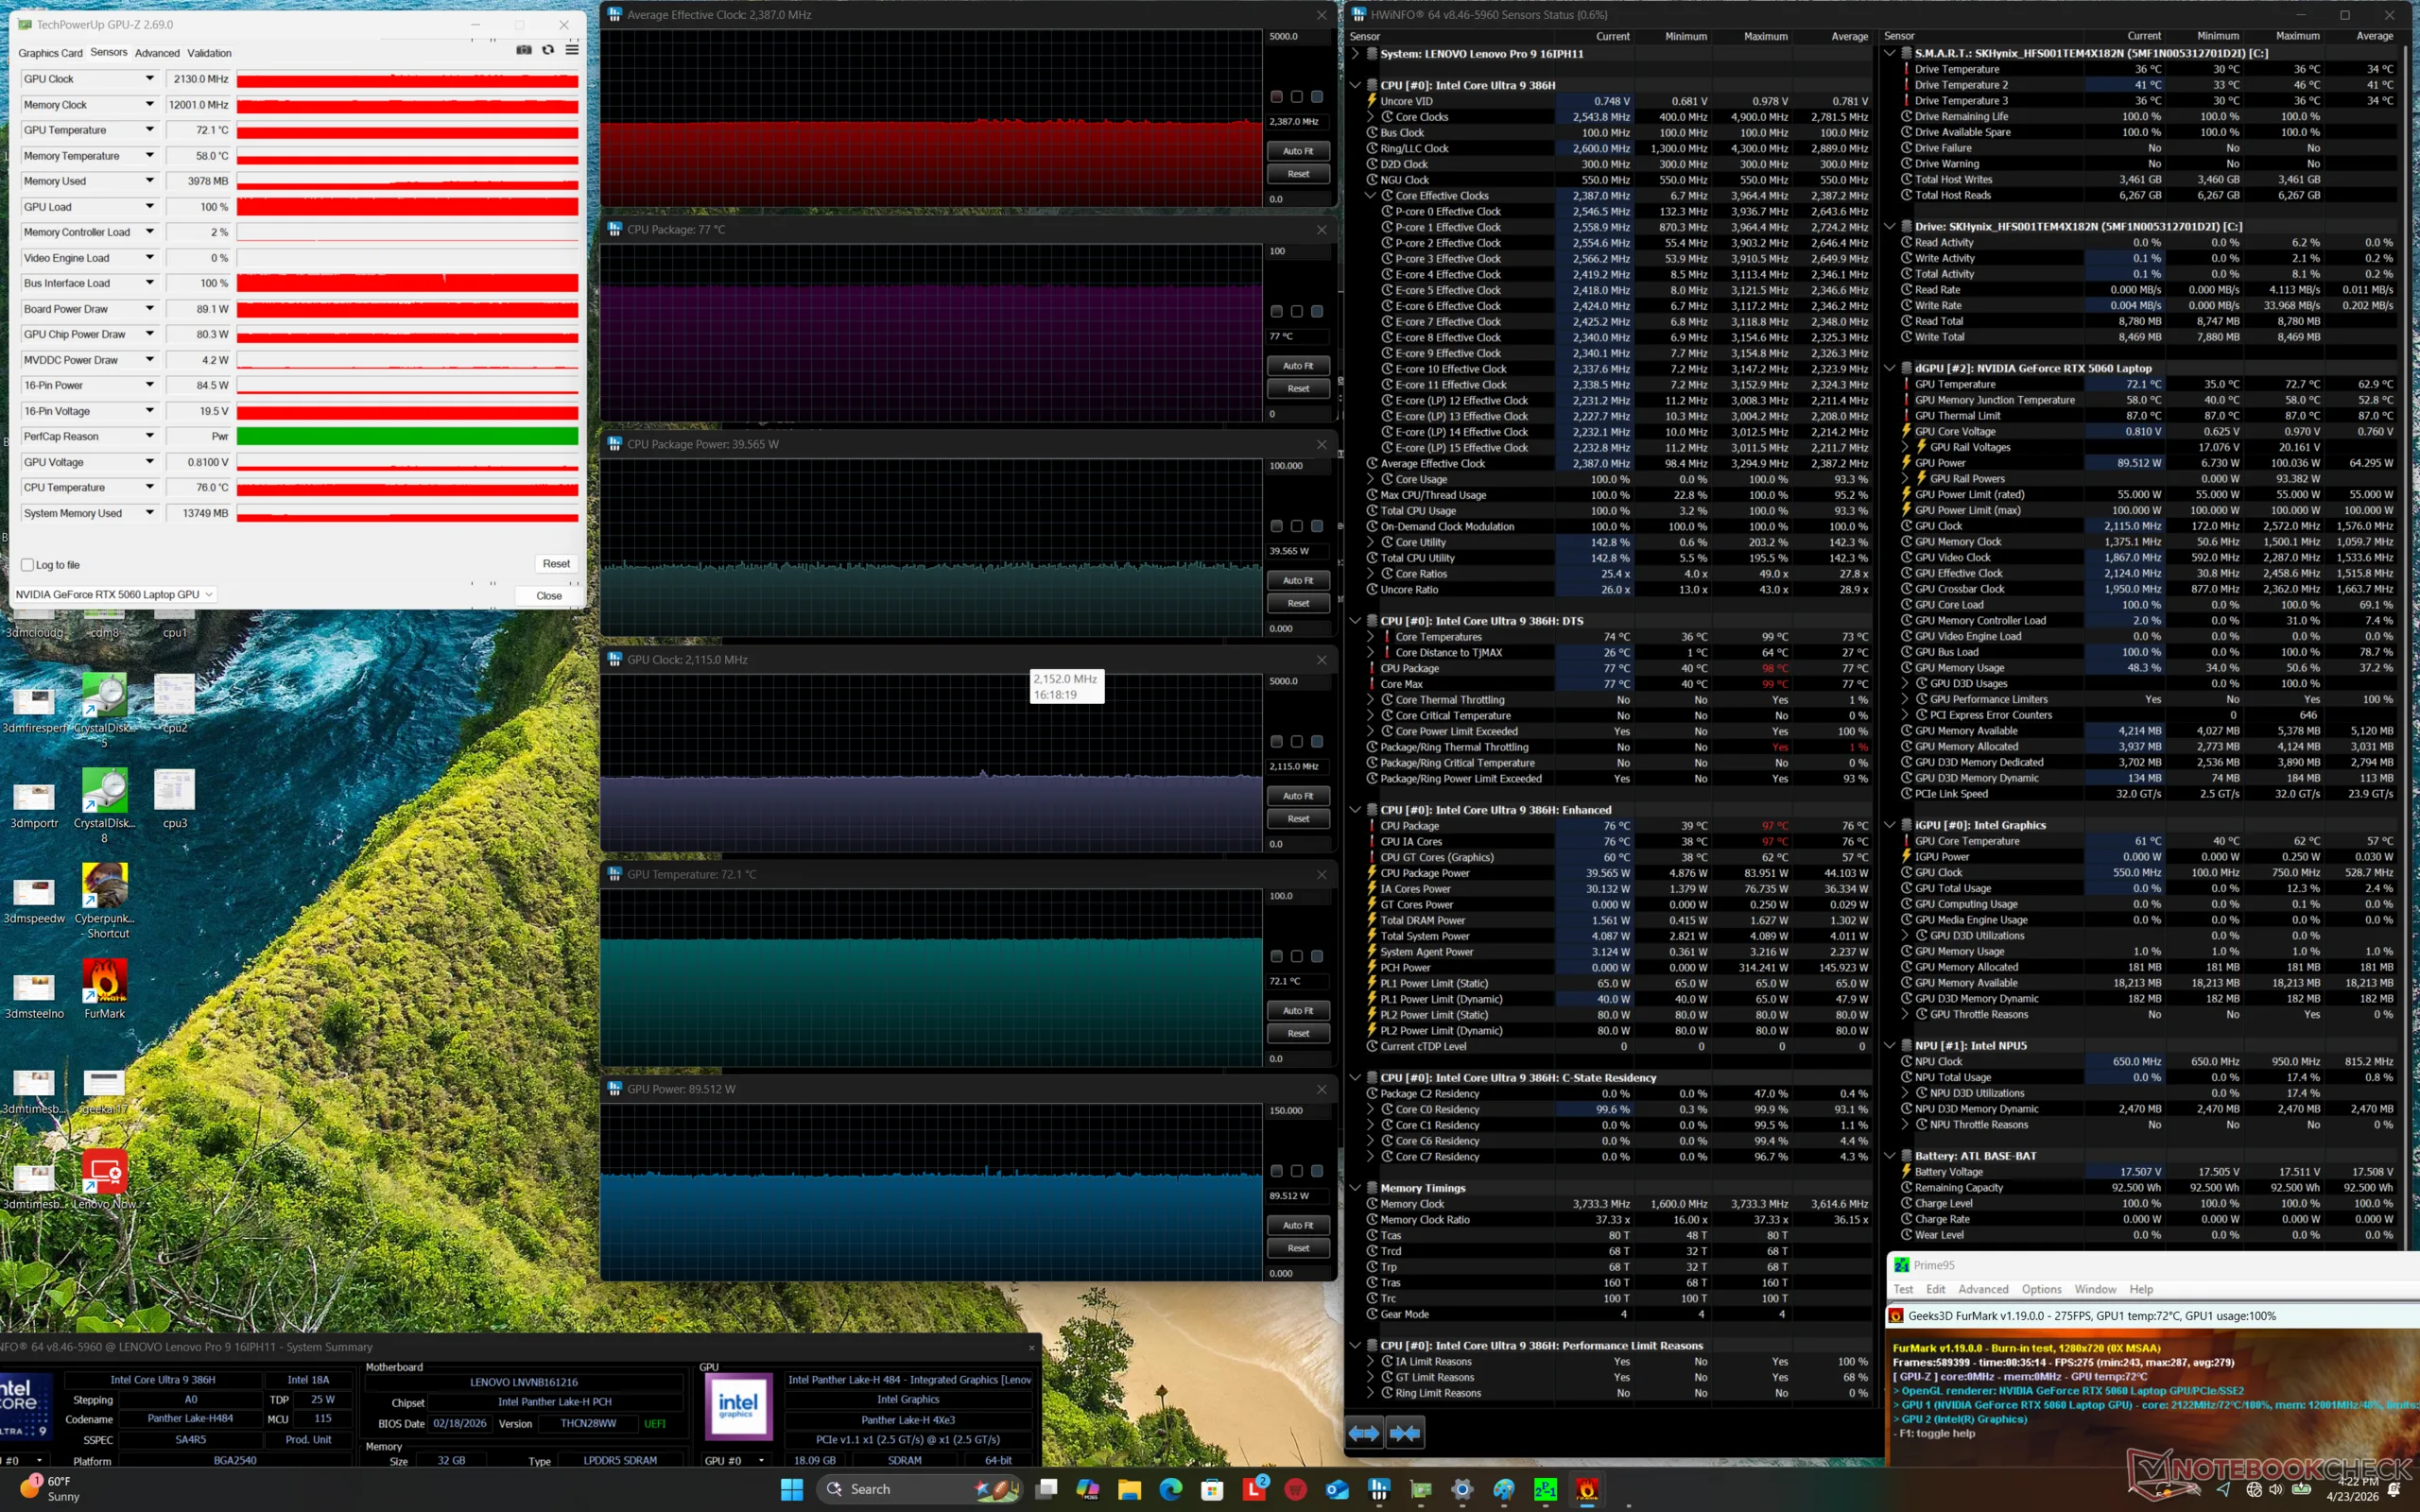
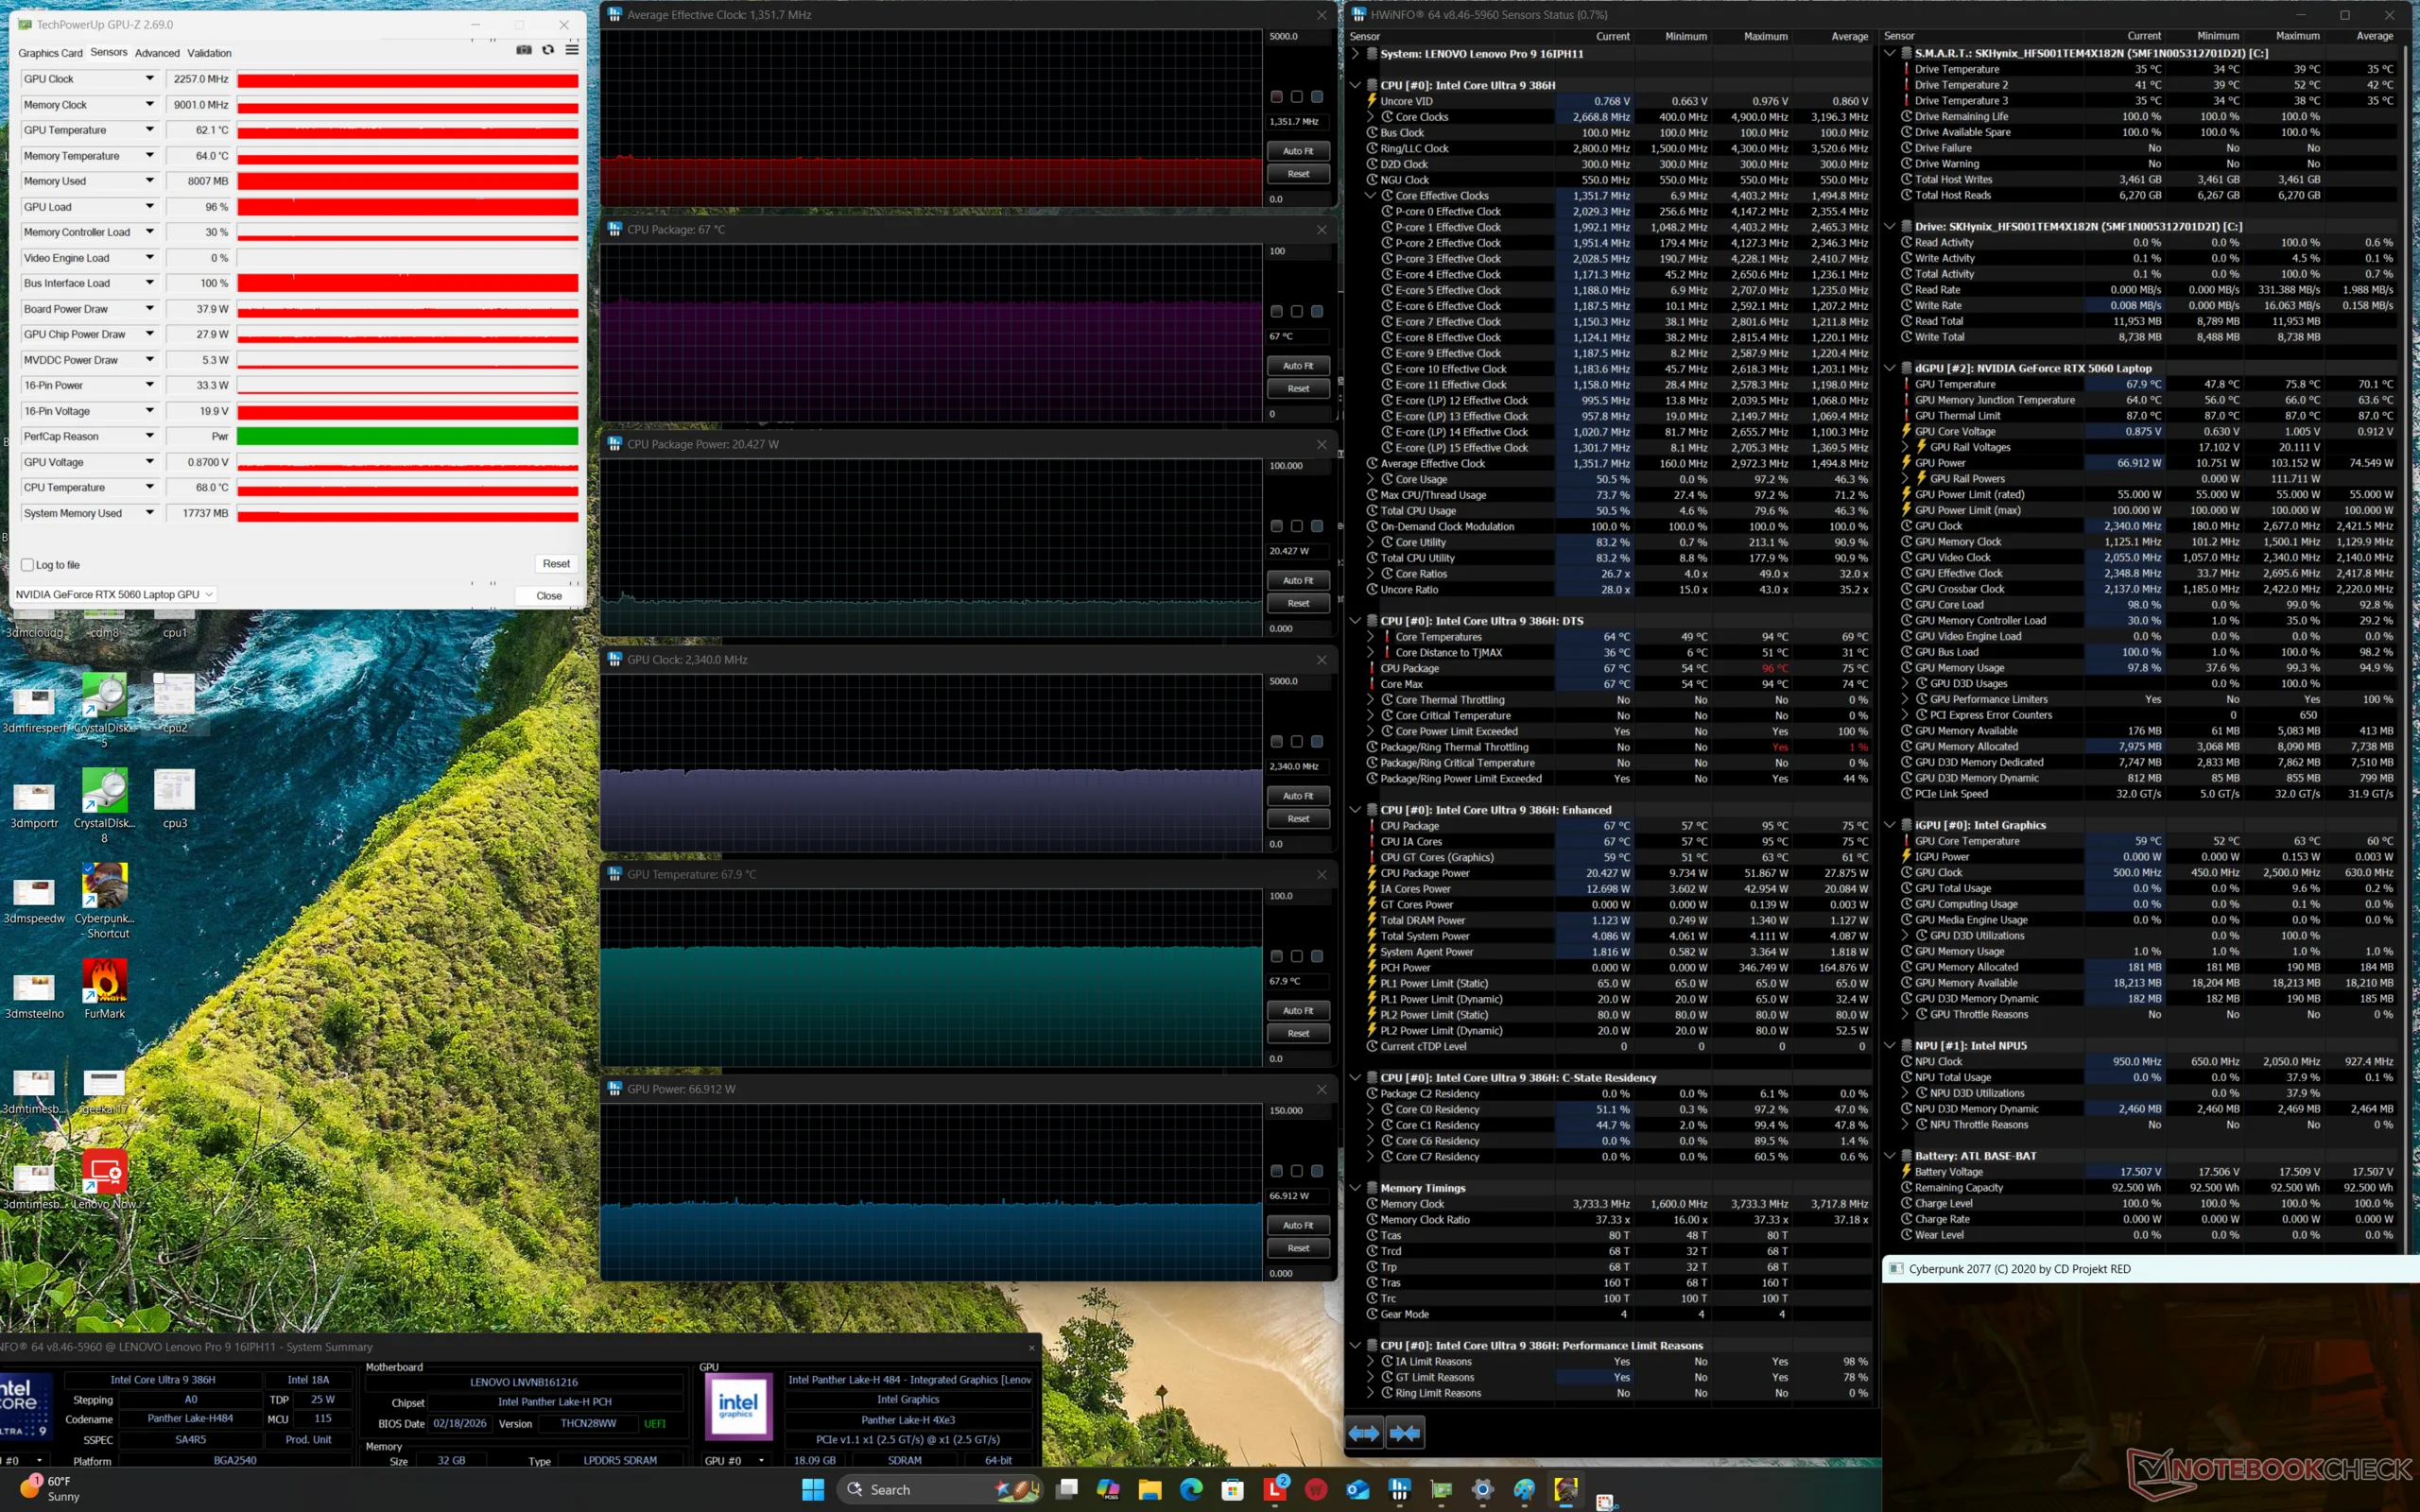
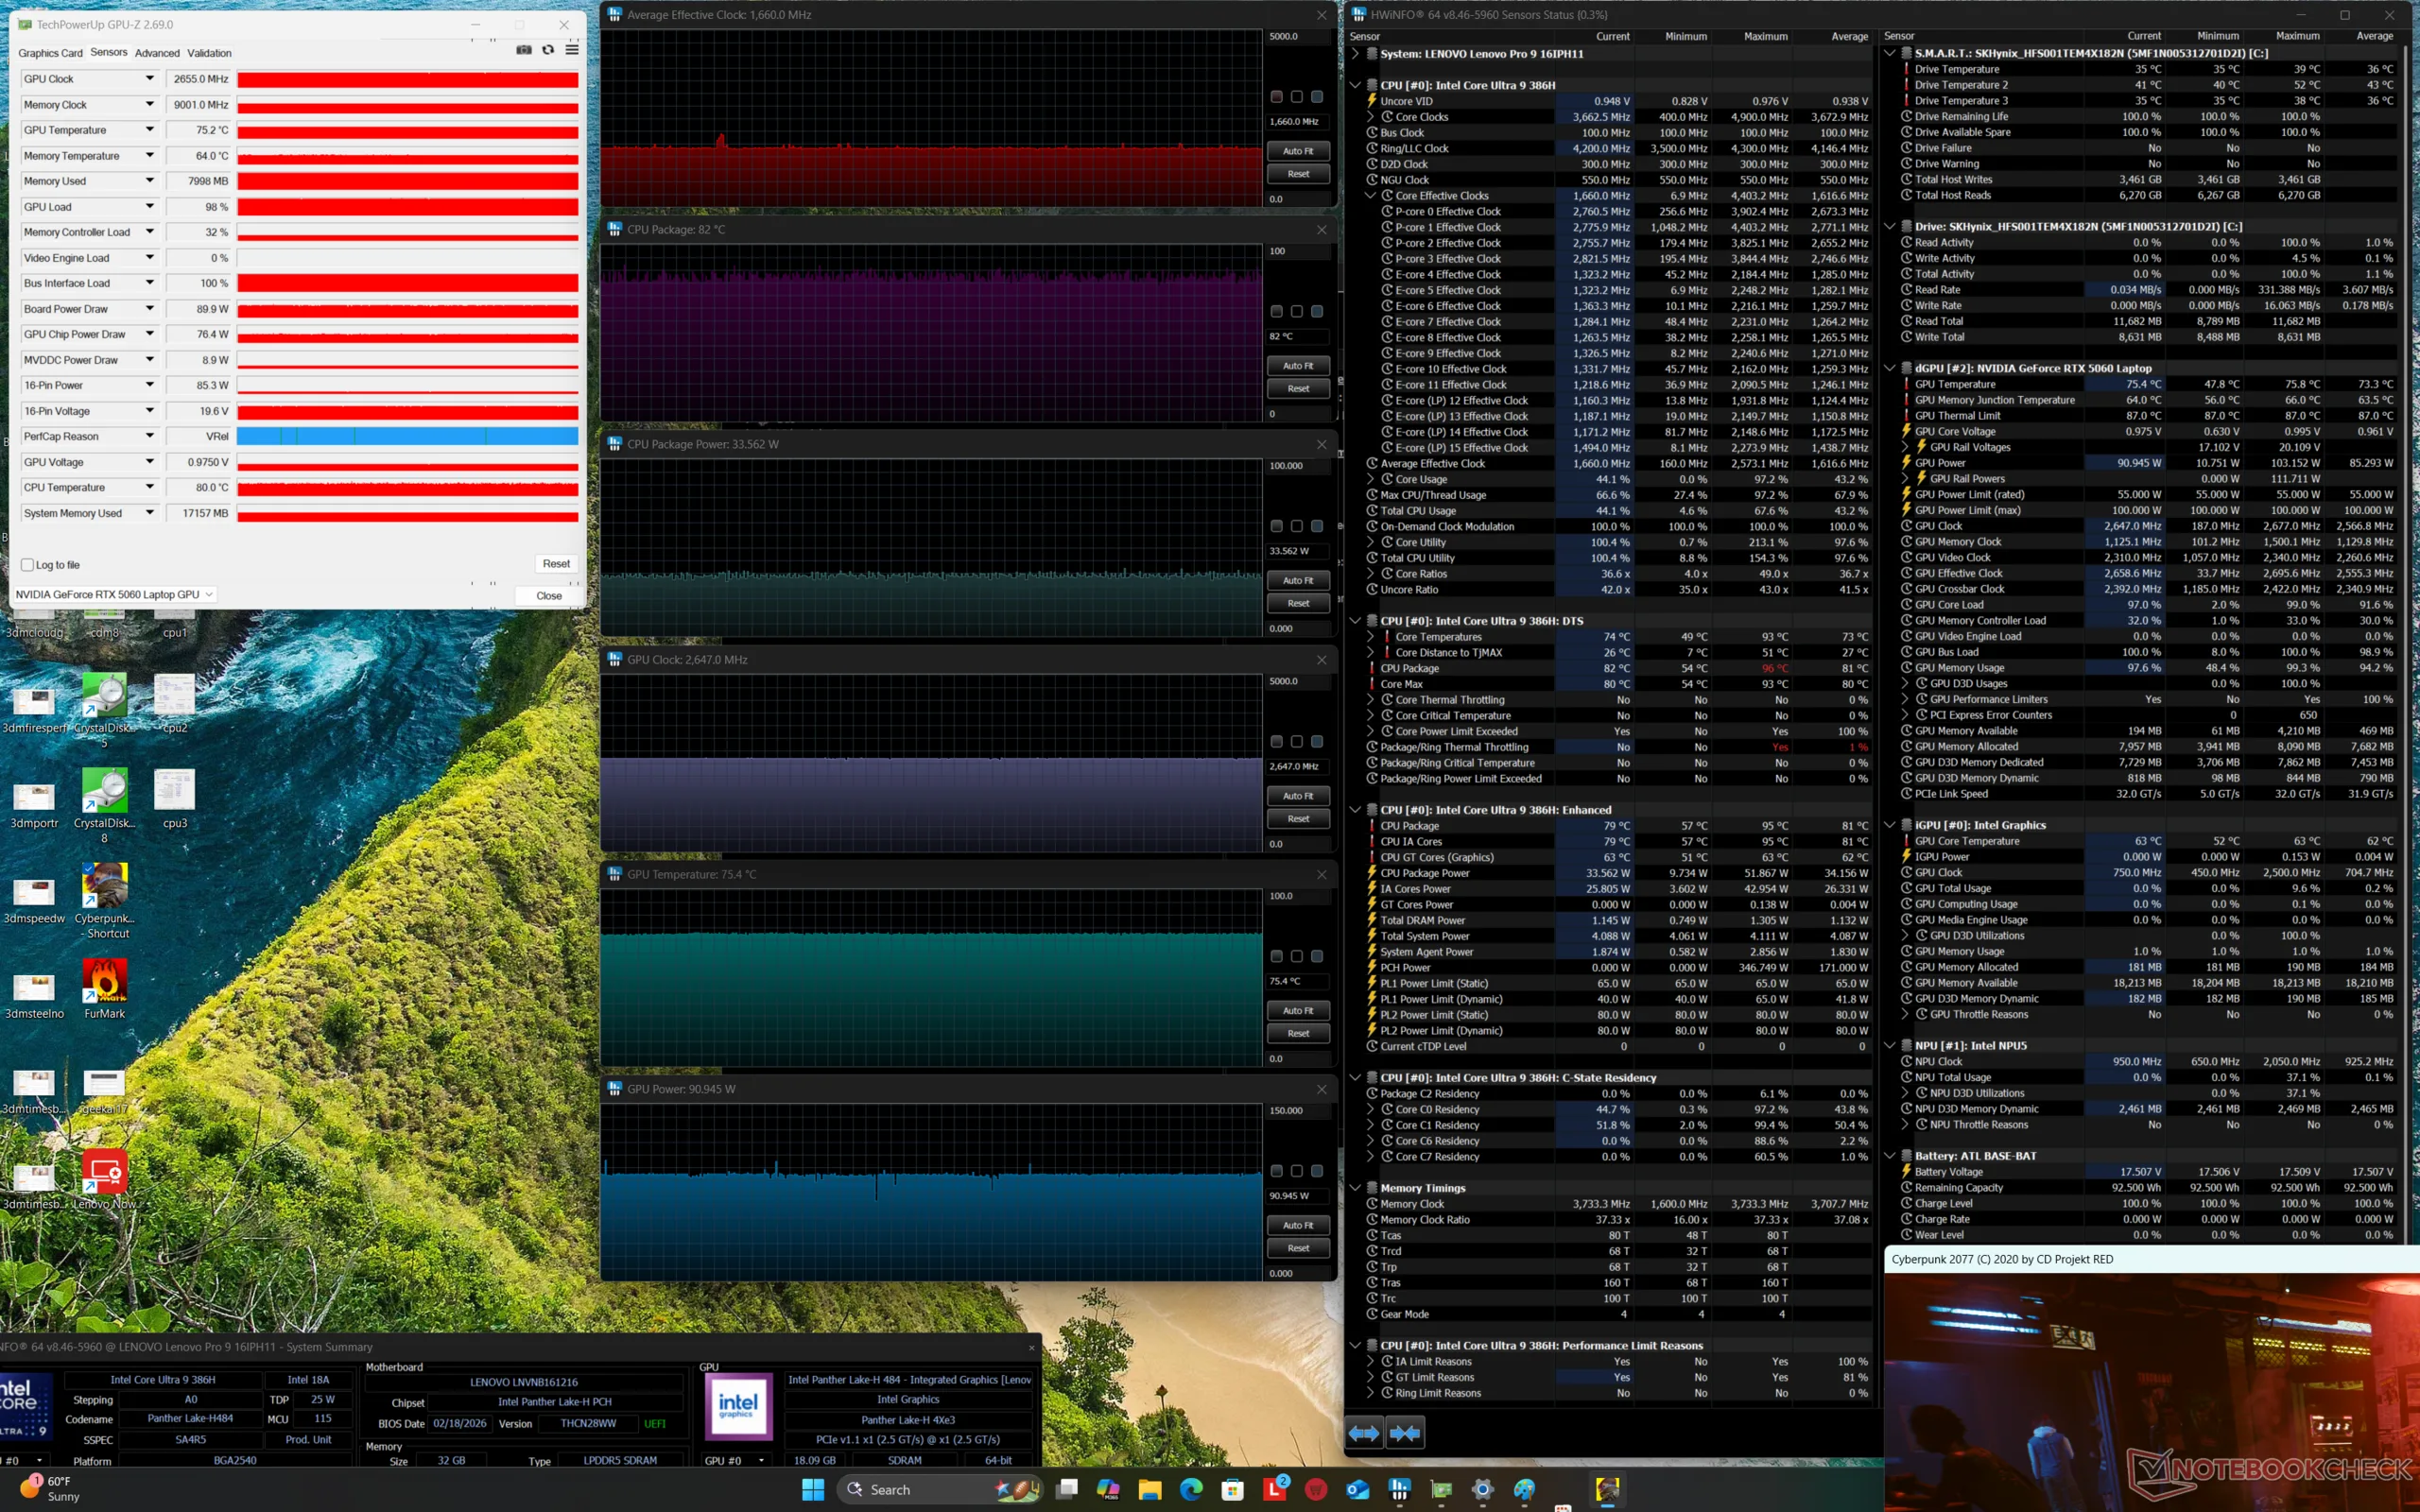
| Clock médio da CPU (GHz) | Clock da GPU (MHz) | Temperatura média da CPU (°C) | Temperatura média da GPU (°C) | |
| Sistema ocioso | -- | 232 | 41 | 36 |
| Estresse do Prime95 | 3.0 | -- | 90 | 49 |
| Prime95 + FurMark Stress | 2.4 | 2115 | 77 | 72 |
| Cyberpunk 2077 Stress (Modo balanceado) | 1.4 | 2340 | 67 | 68 |
| Estresse do Cyberpunk 2077 (modo de desempenho) | 1.7 | 2647 | 82 | 75 |
Alto-falantes
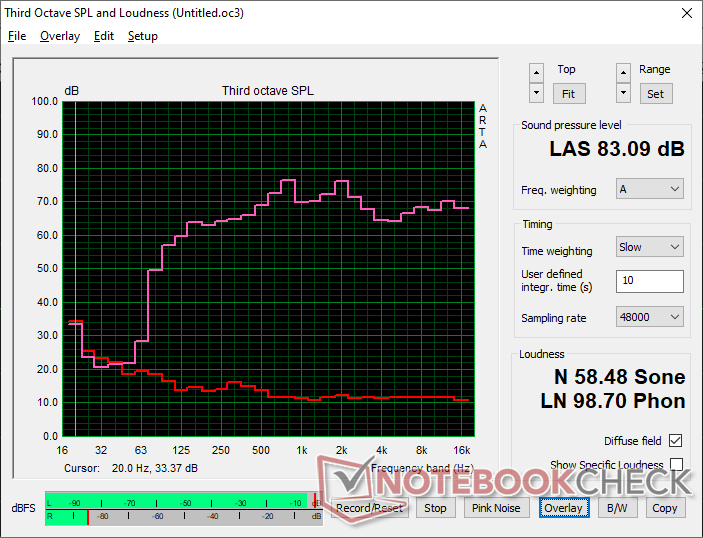
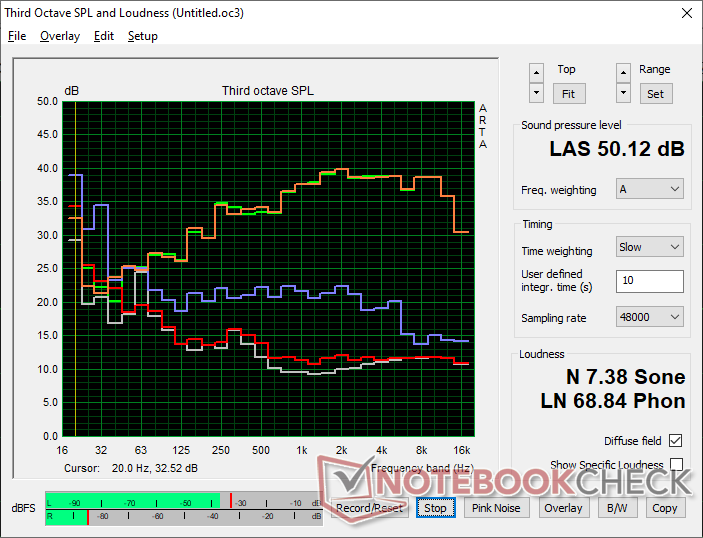
Lenovo Pro 9 16IPH11 análise de áudio
(+) | os alto-falantes podem tocar relativamente alto (###valor### dB)
Graves 100 - 315Hz
(±) | graves reduzidos - em média 5.7% menor que a mediana
(+) | o baixo é linear (5.1% delta para a frequência anterior)
Médios 400 - 2.000 Hz
(+) | médios equilibrados - apenas 4.2% longe da mediana
(+) | médios são lineares (5.4% delta para frequência anterior)
Altos 2 - 16 kHz
(+) | agudos equilibrados - apenas 1.8% longe da mediana
(+) | os máximos são lineares (4.4% delta da frequência anterior)
Geral 100 - 16.000 Hz
(+) | o som geral é linear (7.7% diferença em relação à mediana)
Comparado com a mesma classe
» 6% de todos os dispositivos testados nesta classe foram melhores, 2% semelhantes, 91% piores
» O melhor teve um delta de 5%, a média foi 17%, o pior foi 45%
Comparado com todos os dispositivos testados
» 1% de todos os dispositivos testados foram melhores, 0% semelhantes, 98% piores
» O melhor teve um delta de 4%, a média foi 23%, o pior foi 134%
Apple MacBook Pro 16 2021 M1 Pro análise de áudio
(+) | os alto-falantes podem tocar relativamente alto (###valor### dB)
Graves 100 - 315Hz
(+) | bons graves - apenas 3.8% longe da mediana
(+) | o baixo é linear (5.2% delta para a frequência anterior)
Médios 400 - 2.000 Hz
(+) | médios equilibrados - apenas 1.3% longe da mediana
(+) | médios são lineares (2.1% delta para frequência anterior)
Altos 2 - 16 kHz
(+) | agudos equilibrados - apenas 1.9% longe da mediana
(+) | os máximos são lineares (2.7% delta da frequência anterior)
Geral 100 - 16.000 Hz
(+) | o som geral é linear (4.6% diferença em relação à mediana)
Comparado com a mesma classe
» 0% de todos os dispositivos testados nesta classe foram melhores, 0% semelhantes, 100% piores
» O melhor teve um delta de 5%, a média foi 17%, o pior foi 45%
Comparado com todos os dispositivos testados
» 0% de todos os dispositivos testados foram melhores, 0% semelhantes, 100% piores
» O melhor teve um delta de 4%, a média foi 23%, o pior foi 134%
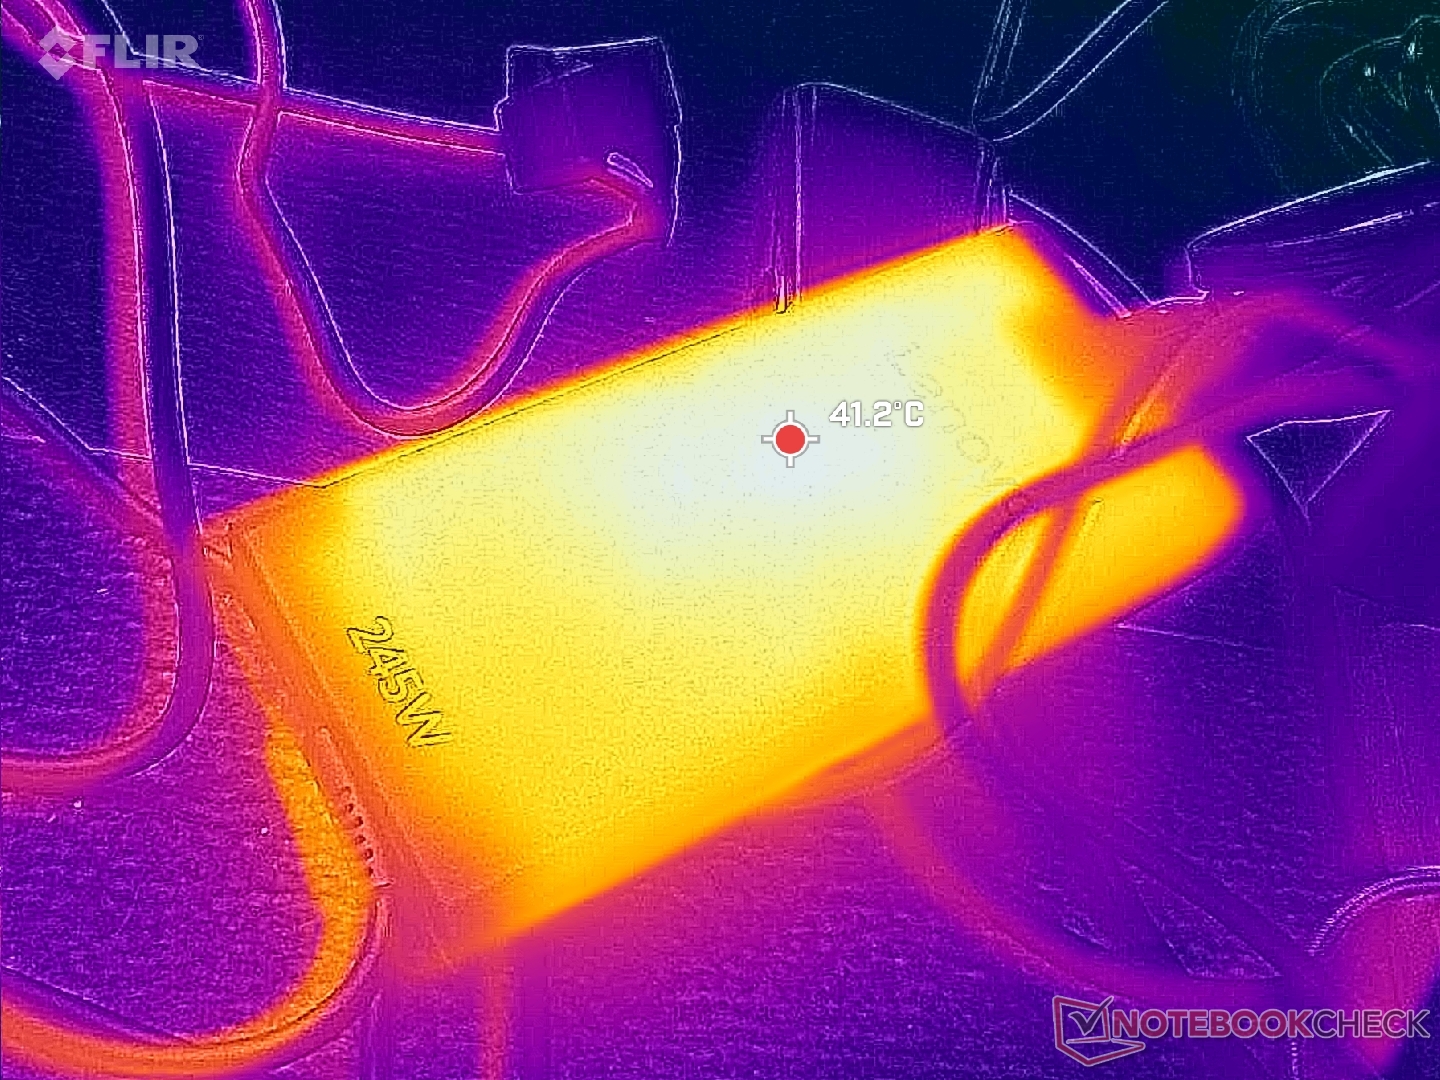
Gerenciamento de energia
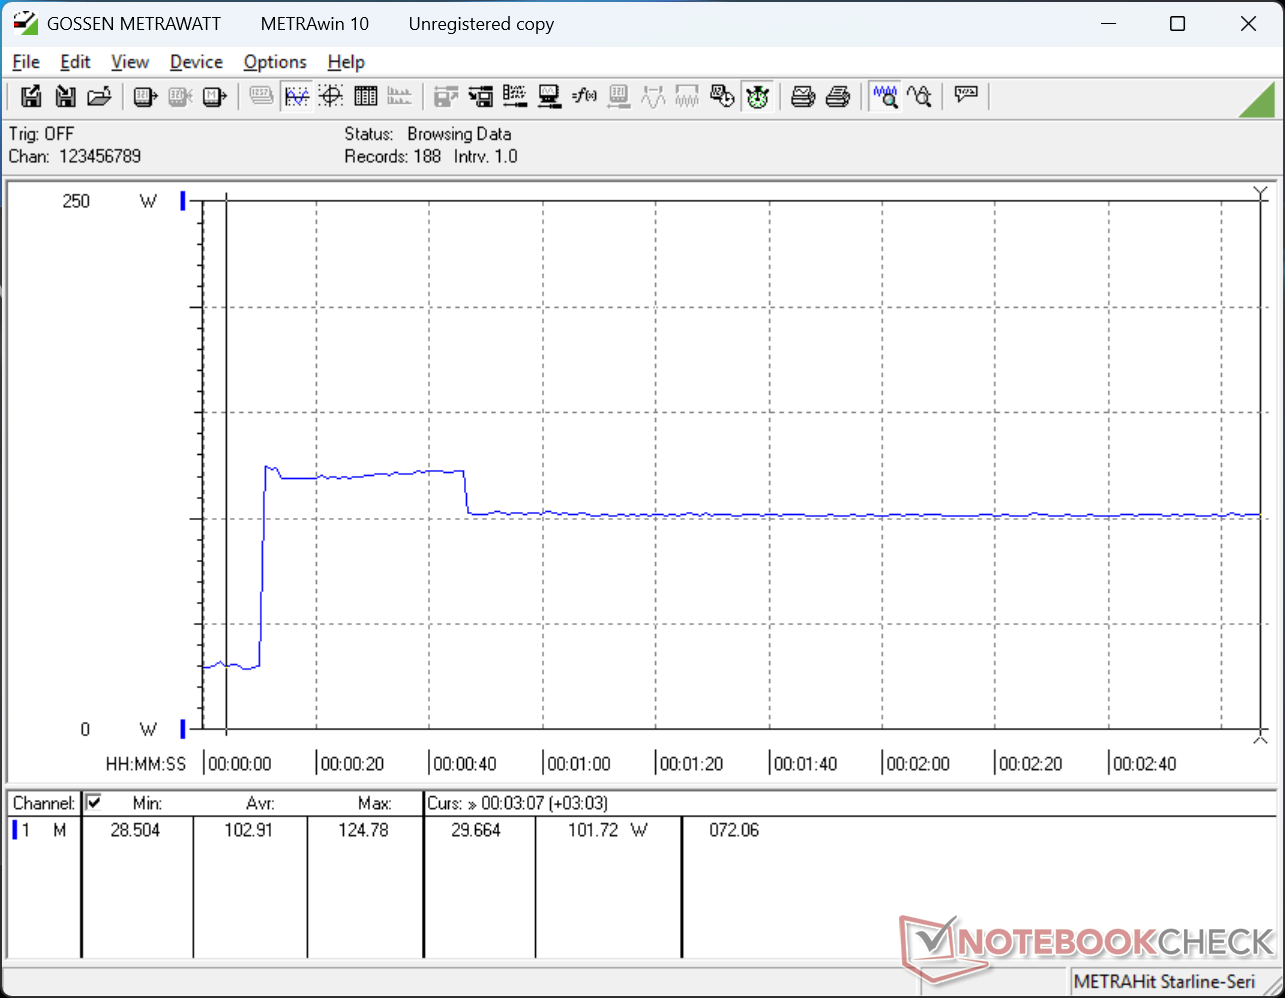
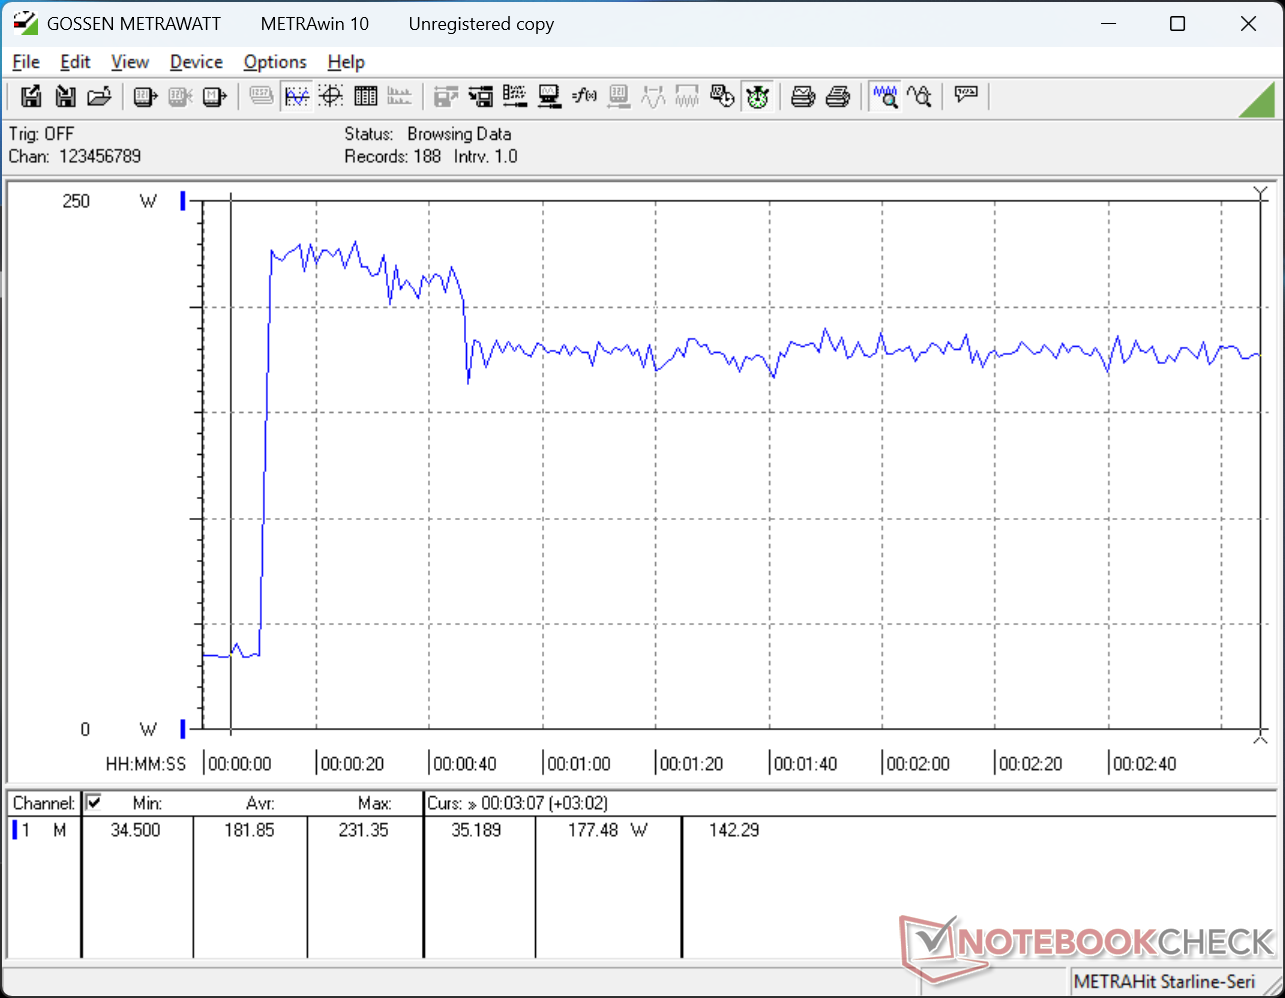
Consumo de energia
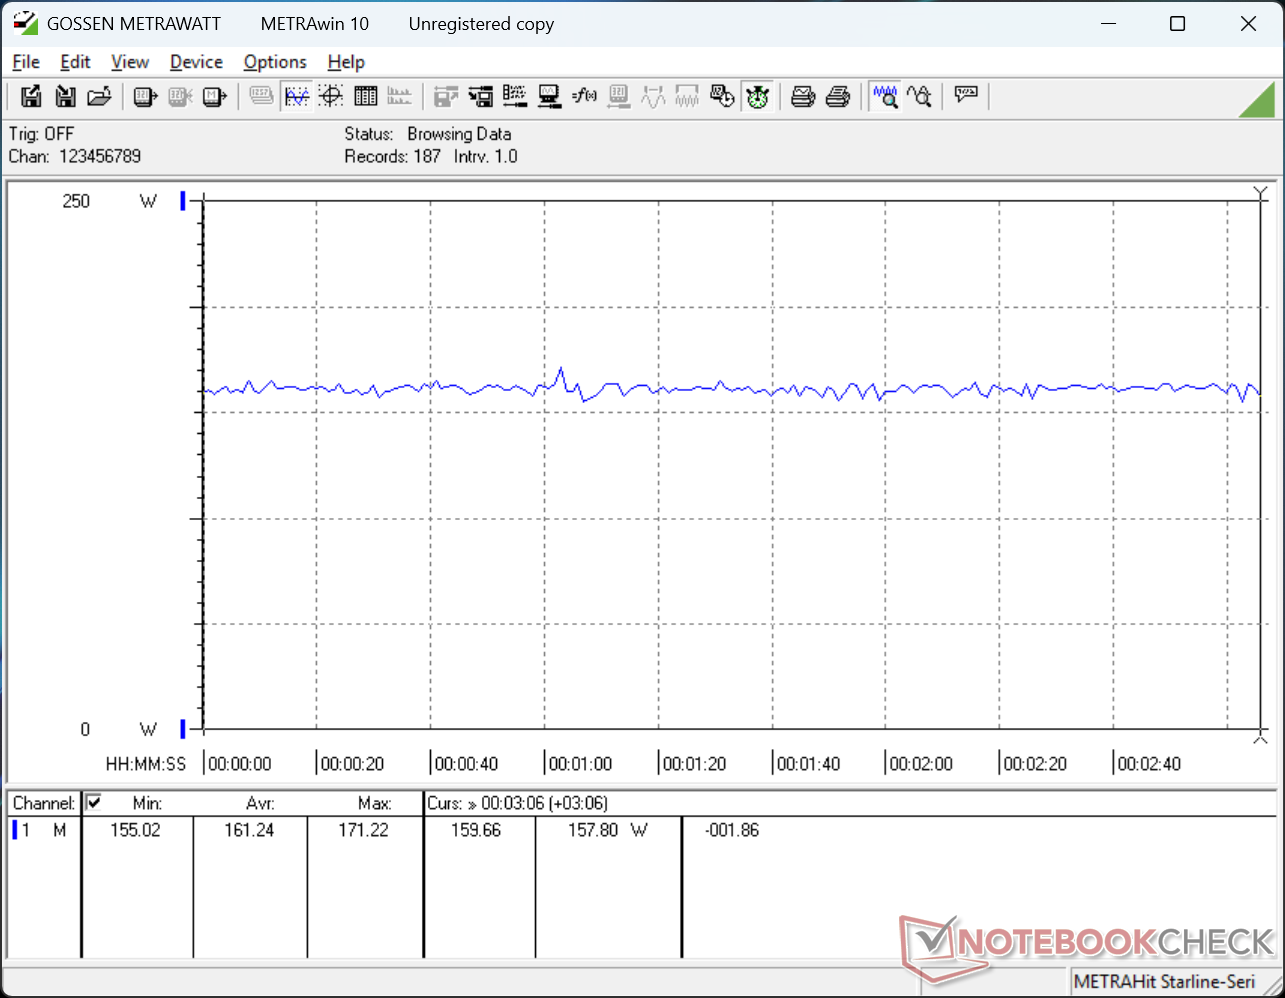
O sistema Lenovo é uma máquina muito exigente, com um mínimo alto de 15 W, mesmo quando está na configuração de brilho mais fraca com o Optimus ativo, até 46 W se estiver na configuração mais brilhante com a dGPU ativa. Ao executar cargas mais altas, como jogos, nossa unidade consumiria tanta energia quanto o Asus ProArt P16 equipado com a CPU Ryzen AI 9 HX 370 mais rápida e a GPU RTX 5070.

| desligado | |
| Ocioso | |
| Carga |
|
Key:
min: | |
| Lenovo Pro 9 16IPH11 Ultra 9 386H, GeForce RTX 5060 Laptop, SK hynix PVC10 HFS001TEM4X182N, Tandem OLED, 3200x2000, 16" | Lenovo Yoga Pro 9 16IAH10 RTX 5050 Ultra 9 285H, GeForce RTX 5050 Laptop, WD PC SN7100S SDFPMSL-1T00-1101, OLED, 2880x1800, 16" | Dell XPS 16 Core Ultra X7 358H Ultra X7 358H, Arc B390 Panther Lake iGPU, , OLED, 3200x2000, 16" | MSI Prestige 16 AI Evo B2HMG Ultra 9 285H, Arc 140T, Micron 2500 1TB MTFDKBA1T0QGN, IPS, 2560x1600, 16" | HP Omen Transcend 16-u1095ng i9-14900HX, GeForce RTX 4070 Laptop GPU, Kioxia XG8 KXG80ZNV1T02, OLED, 2560x1600, 16" | Asus ProArt P16 H7606WP Ryzen AI 9 HX 370, GeForce RTX 5070 Laptop, WD PC SN740 SDDPNQE-2T00, OLED, 2880x1800, 16" | |
|---|---|---|---|---|---|---|
| Power Consumption | 25% | 66% | 58% | 8% | 20% | |
| Idle Minimum * (Watt) | 15.1 | 6.8 55% | 4 74% | 4.4 71% | 10 34% | 9.9 34% |
| Idle Average * (Watt) | 30.4 | 20.1 34% | 4.4 86% | 9.2 70% | 18 41% | 13.6 55% |
| Idle Maximum * (Watt) | 46.2 | 21.6 53% | 10.2 78% | 9.5 79% | 32 31% | 14 70% |
| Load Average * (Watt) | 79.5 | 87.6 -10% | 44.2 44% | 66.9 16% | 128 -61% | 93.8 -18% |
| Cyberpunk 2077 ultra * (Watt) | 161.2 | 148.2 8% | 62.6 61% | 68.8 57% | 162.1 -1% | |
| Cyberpunk 2077 ultra external monitor * (Watt) | 160.7 | 147.9 8% | 62.4 61% | 67.4 58% | 158.3 1% | |
| Load Maximum * (Watt) | 231.4 | 173.5 25% | 94.6 59% | 102.9 56% | 242 -5% | 229 1% |
| Witcher 3 ultra * (Watt) | 148.4 |
* ... menor é melhor
Consumo de energia Cyberpunk / Teste de estresse
Consumo de energia do monitor externo
Duração da bateria
Os tempos de execução são relativamente curtos, mesmo quando configurado no modo Balanced com o iGPU ativo. A bateria relativamente grande de 93 Wh só consegue reunir 5,5 horas de navegação WLAN antes do desligamento automático, o que é várias horas mais curto do que muitos outros modelos multimídia, incluindo o Yoga Pro 9i 16IAH G10 Aura da própria Lenovo.
(Atualização de 3 de maio de 2026: A duração da bateria para navegação na Web via Wi-Fi foi testada novamente com o brilho da tela definido para 150 nits, taxa de atualização fixa de 60 Hz e gráficos da Nvidia definidos como Automático, apresentando resultados mais próximos do Yoga Pro 9i 16IAH G10 Aura do ano passado, com aproximadamente 10 horas. A pontuação final também foi atualizada para refletir o tempo de execução mais longo)
| Lenovo Pro 9 16IPH11 Ultra 9 386H, GeForce RTX 5060 Laptop, 92.5 Wh | Lenovo Yoga Pro 9 16IAH10 RTX 5050 Ultra 9 285H, GeForce RTX 5050 Laptop, 84 Wh | Dell XPS 16 Core Ultra X7 358H Ultra X7 358H, Arc B390 Panther Lake iGPU, 70 Wh | MSI Prestige 16 AI Evo B2HMG Ultra 9 285H, Arc 140T, 99.9 Wh | HP Omen Transcend 16-u1095ng i9-14900HX, GeForce RTX 4070 Laptop GPU, 97 Wh | Asus ProArt P16 H7606WP Ryzen AI 9 HX 370, GeForce RTX 5070 Laptop, 90 Wh | |
|---|---|---|---|---|---|---|
| Duração da bateria | 8% | 4% | 67% | -51% | -7% | |
| WiFi v1.3 (h) | 9.9 | 10.7 8% | 10.3 4% | 16.5 67% | 4.9 -51% | 9.2 -7% |
| H.264 (h) | 20.8 | |||||
| Load (h) | 2.4 |
Classificação do Notebookcheck
Uma máquina multimídia de ponta com muito desempenho e uma tela sensível ao toque OLED superbrilhante, mas com pouca duração da bateria.
Lenovo Pro 9 16IPH11
- 05/03/2026 v8
Allen Ngo
 Total Sustainability Score:
 Concorrentes potenciais em comparação
Imagem | Modelo / Análises | Preço | Peso | Altura | Tela |
|---|---|---|---|---|---|
1. 91%  | Lenovo Pro 9 16IPH11 Intel Core Ultra 9 386H ⎘ NVIDIA GeForce RTX 5060 Laptop ⎘ 32 GB Memória, 1024 GB SSD | Amazon: Preço de tabela: 3100 USD | 1.9 kg | 17.3 mm | 16.00" 3200x2000 236 PPI Tandem OLED |
2. 88.8%  | Lenovo Yoga Pro 9 16IAH10 RTX 5050 Intel Core Ultra 9 285H ⎘ NVIDIA GeForce RTX 5050 Laptop ⎘ 32 GB Memória, 1024 GB SSD | Amazon: Preço de tabela: 1800 USD | 2 kg | 17.9 mm | 16.00" 2880x1800 212 PPI OLED |
3. 87.2%  | Dell XPS 16 Core Ultra X7 358H Intel Core Ultra X7 358H ⎘ Intel Arc B390 12 Xe3 Panther Lake iGPU ⎘ 32 GB Memória | Amazon: 1. $1,977.99 Dell Premium 16 (Previously ... 2. $2,399.99 Dell Premium 16 (Previously ... 3. $2,595.99 Dell Premium 16 (XPS 16 2025... Preço de tabela: 2350 USD | 1.7 kg | 14.62 mm | 16.00" 3200x2000 236 PPI OLED |
4. 82.8%  | MSI Prestige 16 AI Evo B2HMG Intel Core Ultra 9 285H ⎘ Intel Arc Graphics 140T ⎘ 32 GB Memória, 1024 GB SSD | Amazon: 1. $1,149.49 msi Prestige 13 AI Evo Lapto... 2. $2,299.00 msi Prestige 16 Intel Evo AI... 3. $2,599.00 msi Prestige 16 AI Evo Busin... | 1.6 kg | 18.95 mm | 16.00" 2560x1600 189 PPI IPS |
5. 88.4% v7 (old)  | HP Omen Transcend 16-u1095ng Intel Core i9-14900HX ⎘ NVIDIA GeForce RTX 4070 Laptop GPU ⎘ 32 GB Memória, 1024 GB SSD | Amazon: Preço de tabela: 3000 EUR | 2.3 kg | 20 mm | 16.00" 2560x1600 189 PPI OLED |
6. 89.1%  | Asus ProArt P16 H7606WP AMD Ryzen AI 9 HX 370 ⎘ NVIDIA GeForce RTX 5070 Laptop ⎘ 64 GB Memória, 2048 GB SSD | Amazon: 1. $4,599.00 HIDevolution [2025] ASUS Pro... 2. $4,924.00 HIDevolution [2025] ASUS Pro... 3. $5,649.00 HIDevolution [2025] ASUS Pro... Preço de tabela: 3399€ | 1.8 kg | 17.3 mm | 16.00" 2880x1800 212 PPI OLED |
Transparência
A seleção dos dispositivos a serem analisados é feita pela nossa equipe editorial. A amostra de teste foi fornecida ao autor como empréstimo pelo fabricante ou varejista para fins desta revisão. O credor não teve influência nesta revisão, nem o fabricante recebeu uma cópia desta revisão antes da publicação. Não houve obrigação de publicar esta revisão. Como empresa de mídia independente, a Notebookcheck não está sujeita à autoridade de fabricantes, varejistas ou editores.
É assim que o Notebookcheck está testando
Todos os anos, o Notebookcheck analisa de forma independente centenas de laptops e smartphones usando procedimentos padronizados para garantir que todos os resultados sejam comparáveis. Desenvolvemos continuamente nossos métodos de teste há cerca de 20 anos e definimos padrões da indústria no processo. Em nossos laboratórios de teste, equipamentos de medição de alta qualidade são utilizados por técnicos e editores experientes. Esses testes envolvem um processo de validação em vários estágios. Nosso complexo sistema de classificação é baseado em centenas de medições e benchmarks bem fundamentados, o que mantém a objetividade.
