Veredicto - Simples, mas talvez simples demais
Como um minicomputador para empresas, o Cubi NUC 2MG é uma opção simples e confiável, sem estética chamativa. O alto-falante integrado, os microfones, o suporte a Co-Pilot+ e o recurso Power Link podem ser úteis em determinadas condições ou cenários de uso, enquanto a CPU Lunar Lake-V é geralmente mais fria e mais eficiente do que a atual safra de alternativas da AMD. Apreciamos particularmente o rápido leitor MicroSD integrado, pois muitos outros mini PCs não têm leitores de cartão.
Nossa principal reclamação sobre o Cubi 2MG é seu preço relativamente alto de US$ 900, quando mini PCs AMD mais rápidos, como o Beelink SER9 Pro ou o GMK NucBox K12 estão prontamente disponíveis por centenas de dólares a menos. Essas alternativas também vêm com recursos úteis, como RAM removível e suporte para mais SSDs internos. A MSI diz que oferece melhor suporte ao cliente e uma garantia mais longa de três anos como padrão para justificar o preço pedido, mas o desempenho por dólar é, no entanto, relativamente fraco.
O comportamento do ventilador também poderia ser melhorado. A menos que o usuário esteja no modo Silencioso, a ventoinha tende a pulsar e a ser mais perceptível, mesmo quando o usuário está executando cargas pouco exigentes. O ciclo das taxas de clock da GPU, embora não seja um problema para a maioria das configurações profissionais, ainda é estranho de se ver quando a maioria dos outros mini PCs não apresenta o mesmo problema.
Pro
Contra
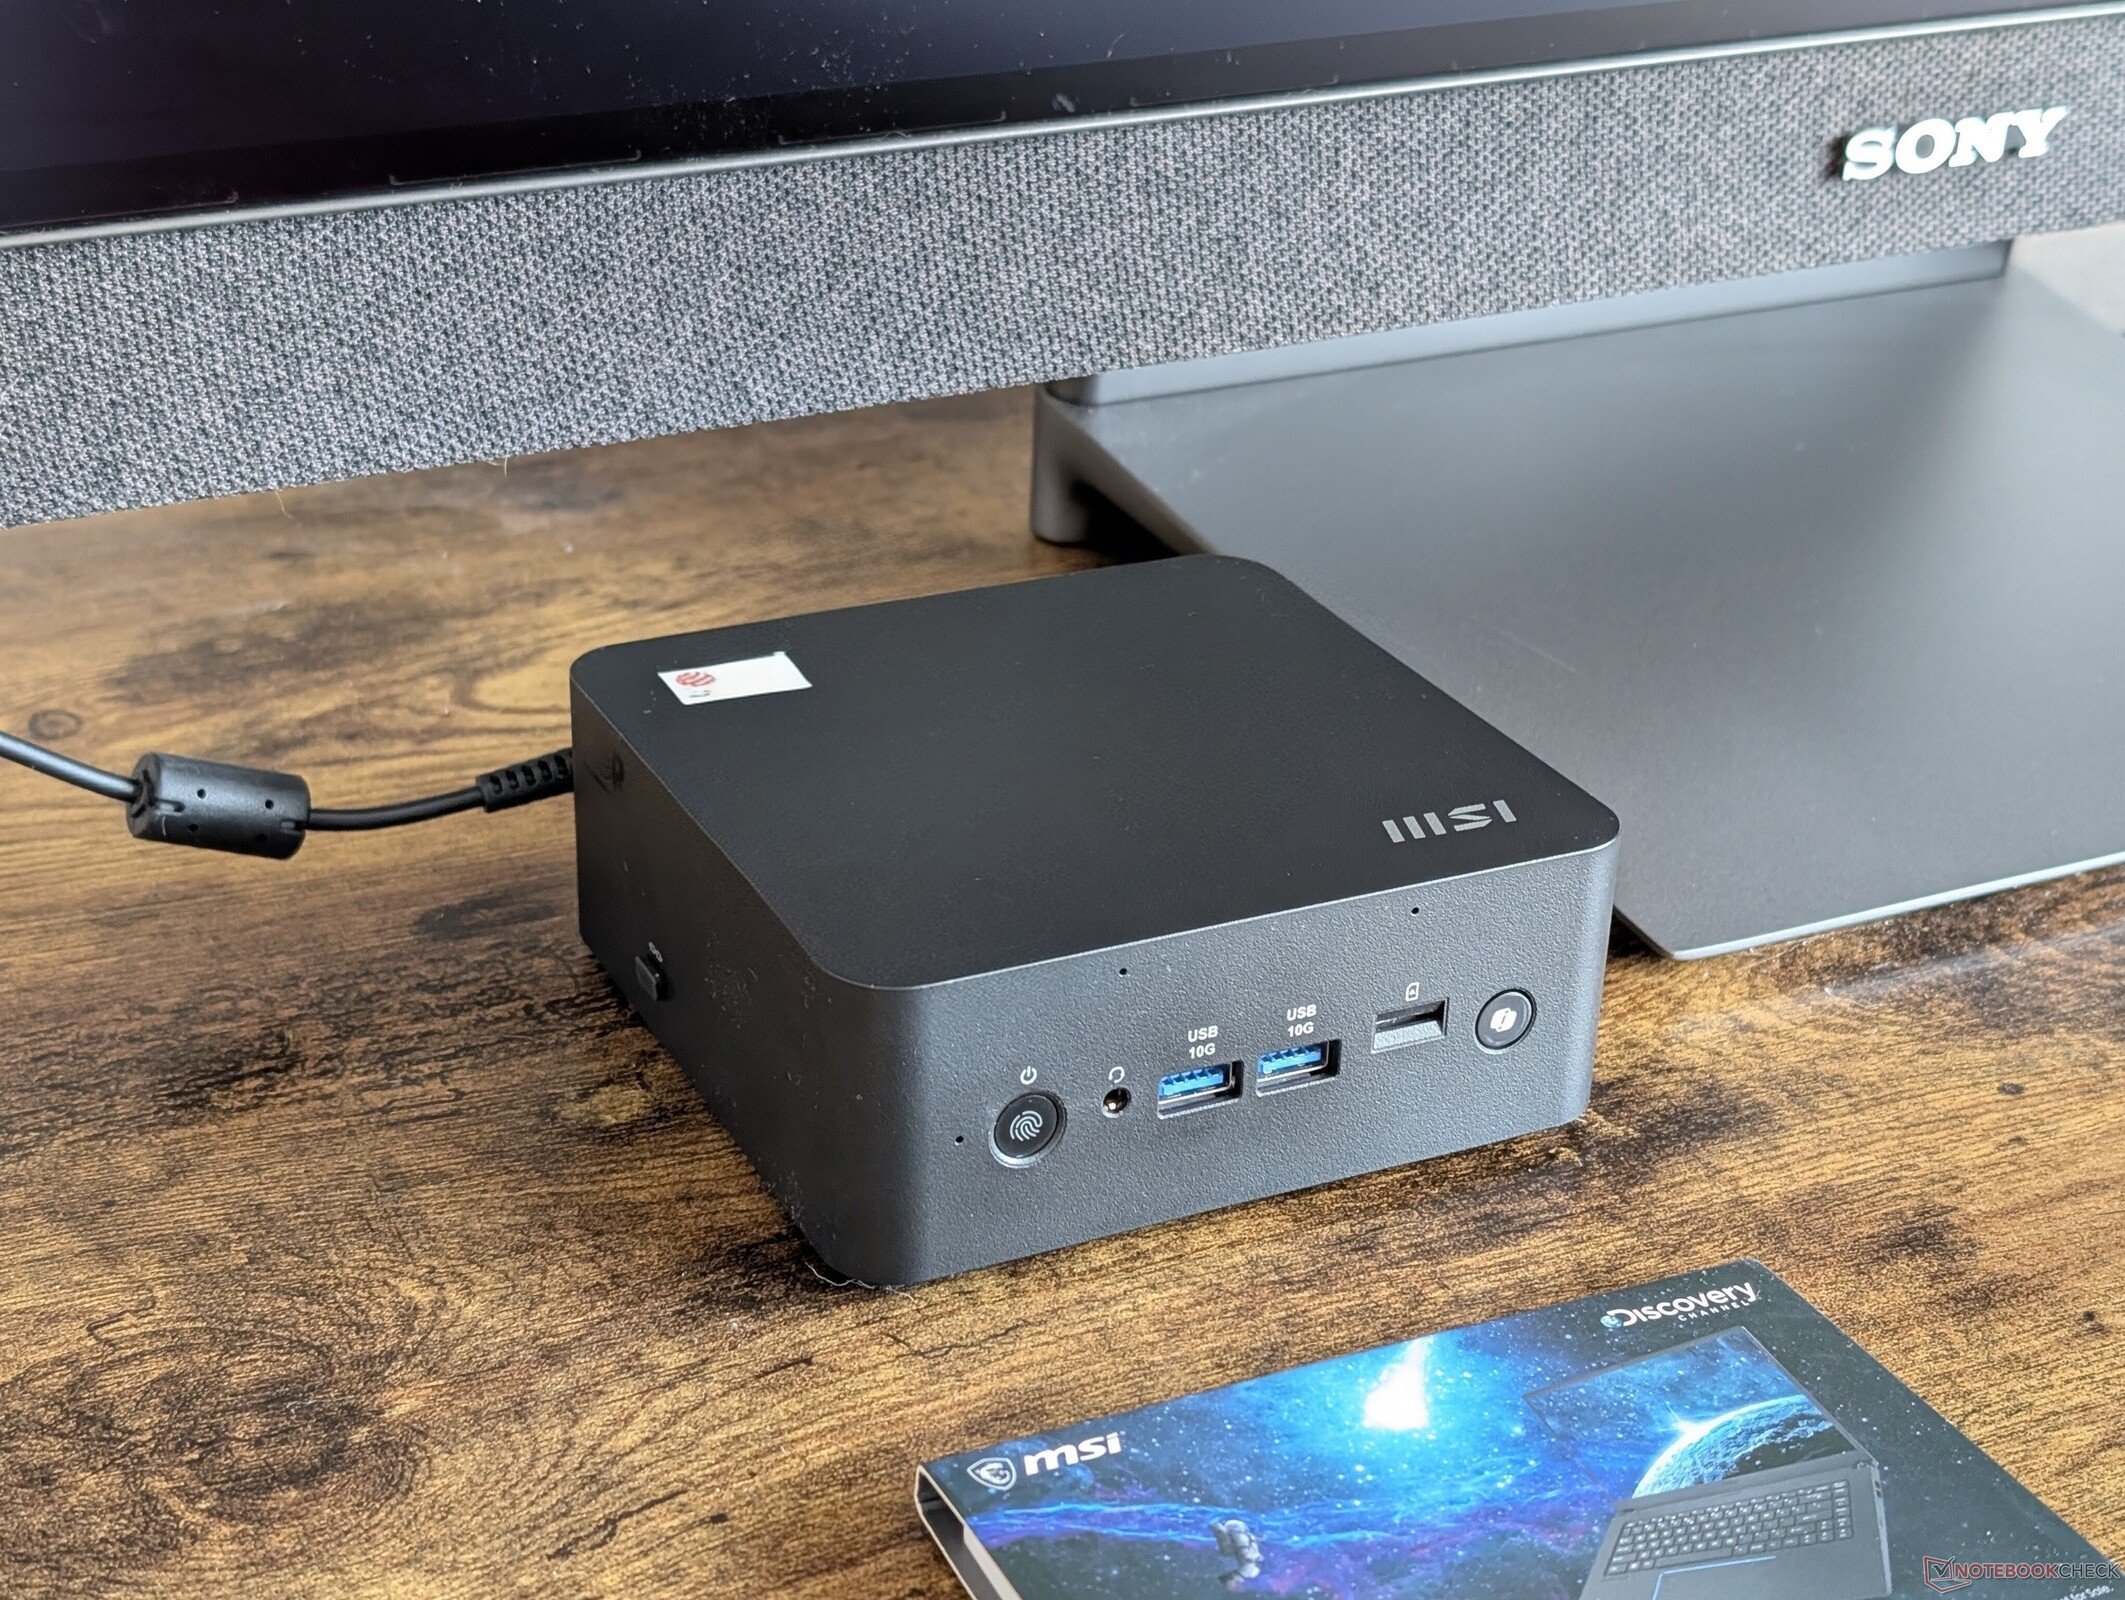
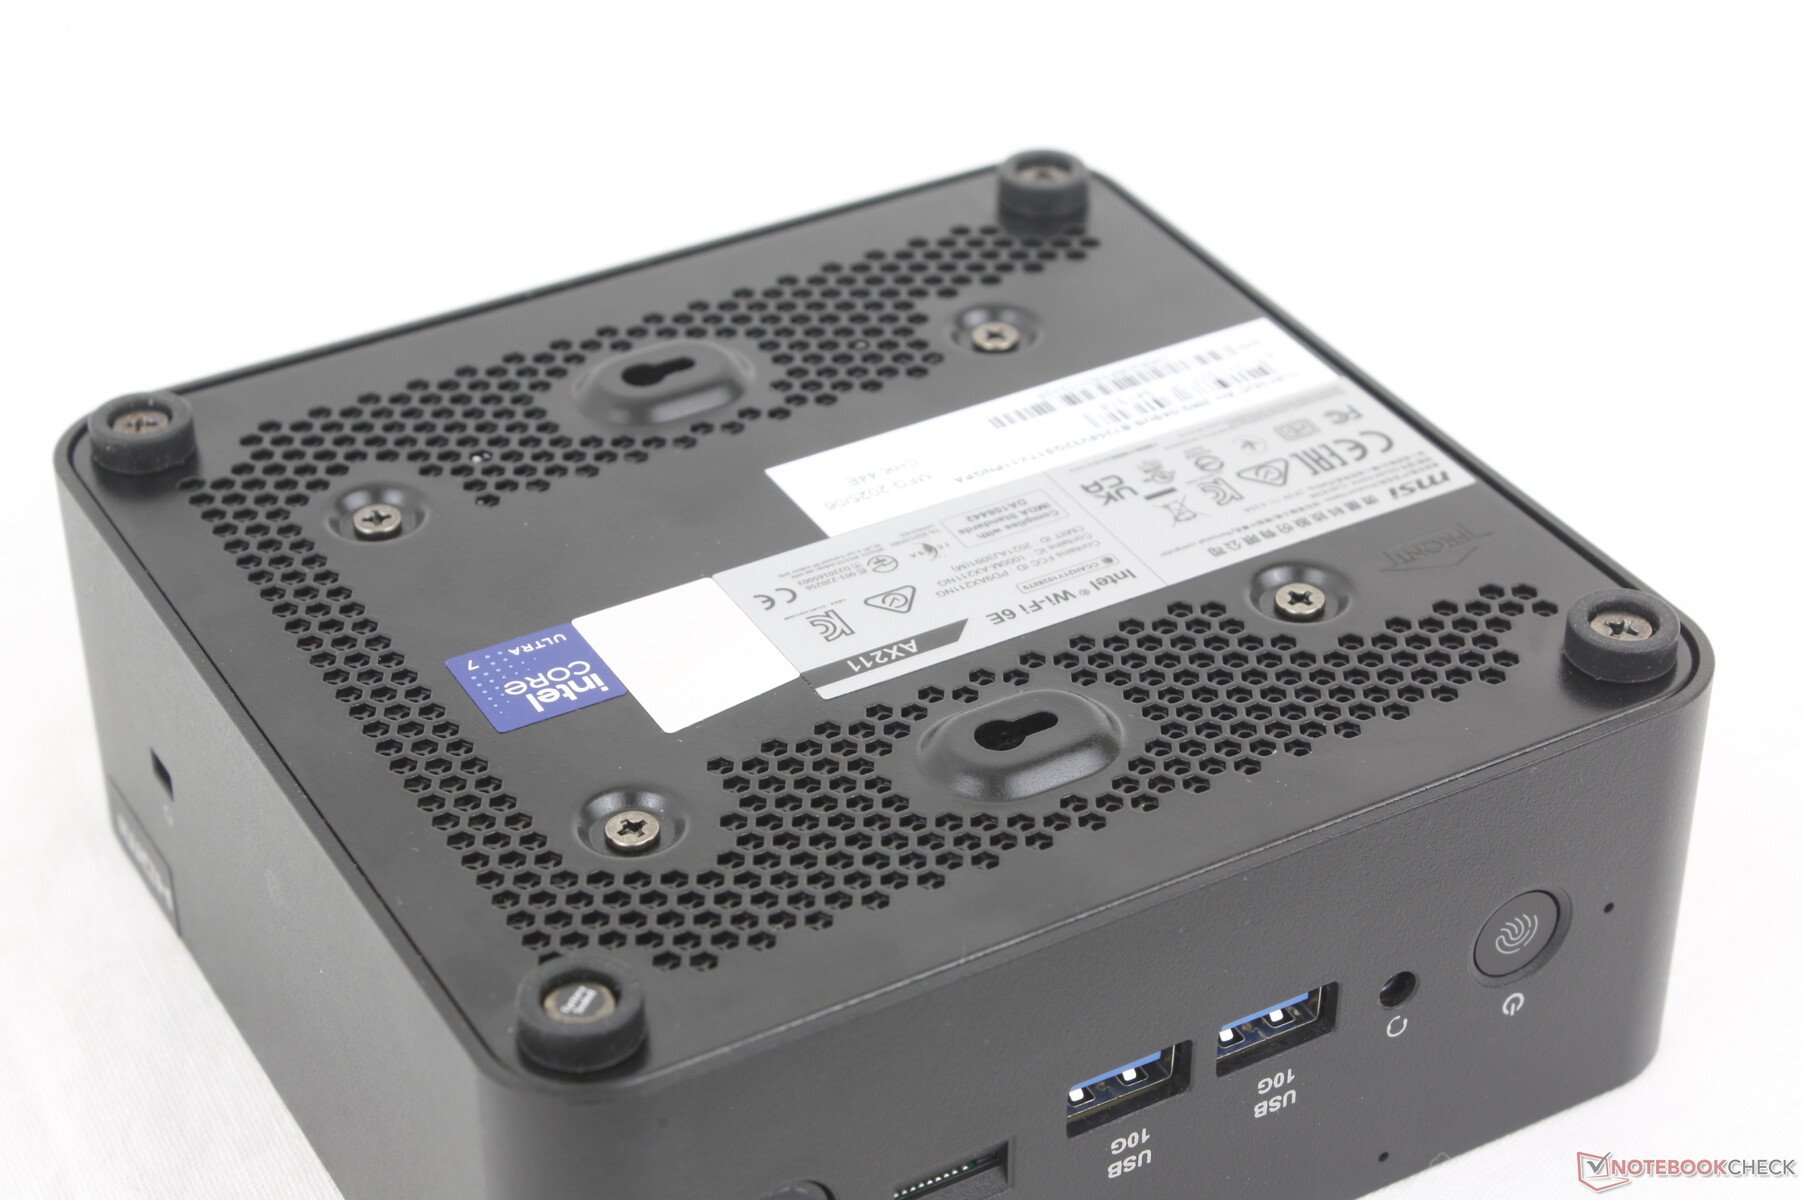
O Cubi NUC 2MG sucede o Cubi NUC 1M do ano passado Cubi NUC 1M. Ele substitui a CPU Raptor Lake-U Core Ultra 7 150U mais antiga pelas opções mais recentes do Lunar Lake-V e faz outras pequenas alterações auxiliares. A série Cubi é otimizada para ambientes comerciais e de varejo, em vez de escritórios domésticos ou aplicativos HTPC.
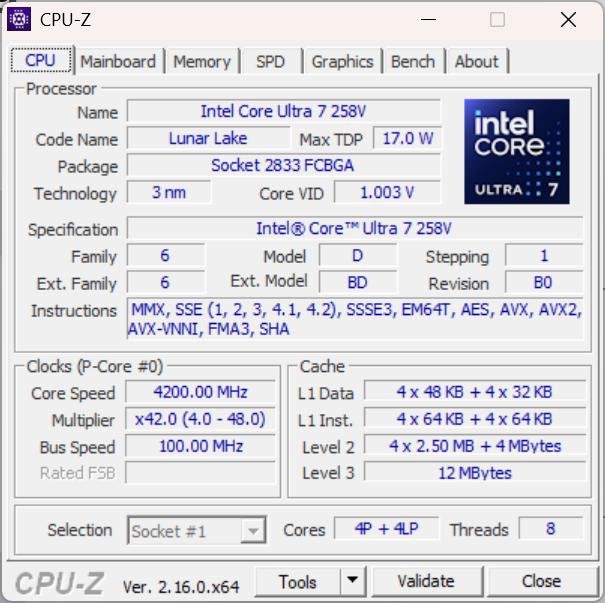
Nossa unidade de teste é uma configuração de médio porte com a CPU Core Ultra 7 258V, 32 GB de RAM soldada e SSD de 1 TB por aproximadamente US$ 900. As SKUs menores começam com o Core Ultra 5 226V, enquanto a opção mais avançada vem com o Core Ultra 9 288V. Uma versão branca está disponível em algumas regiões.
Mais análises da MSI:
Especificações
Caso
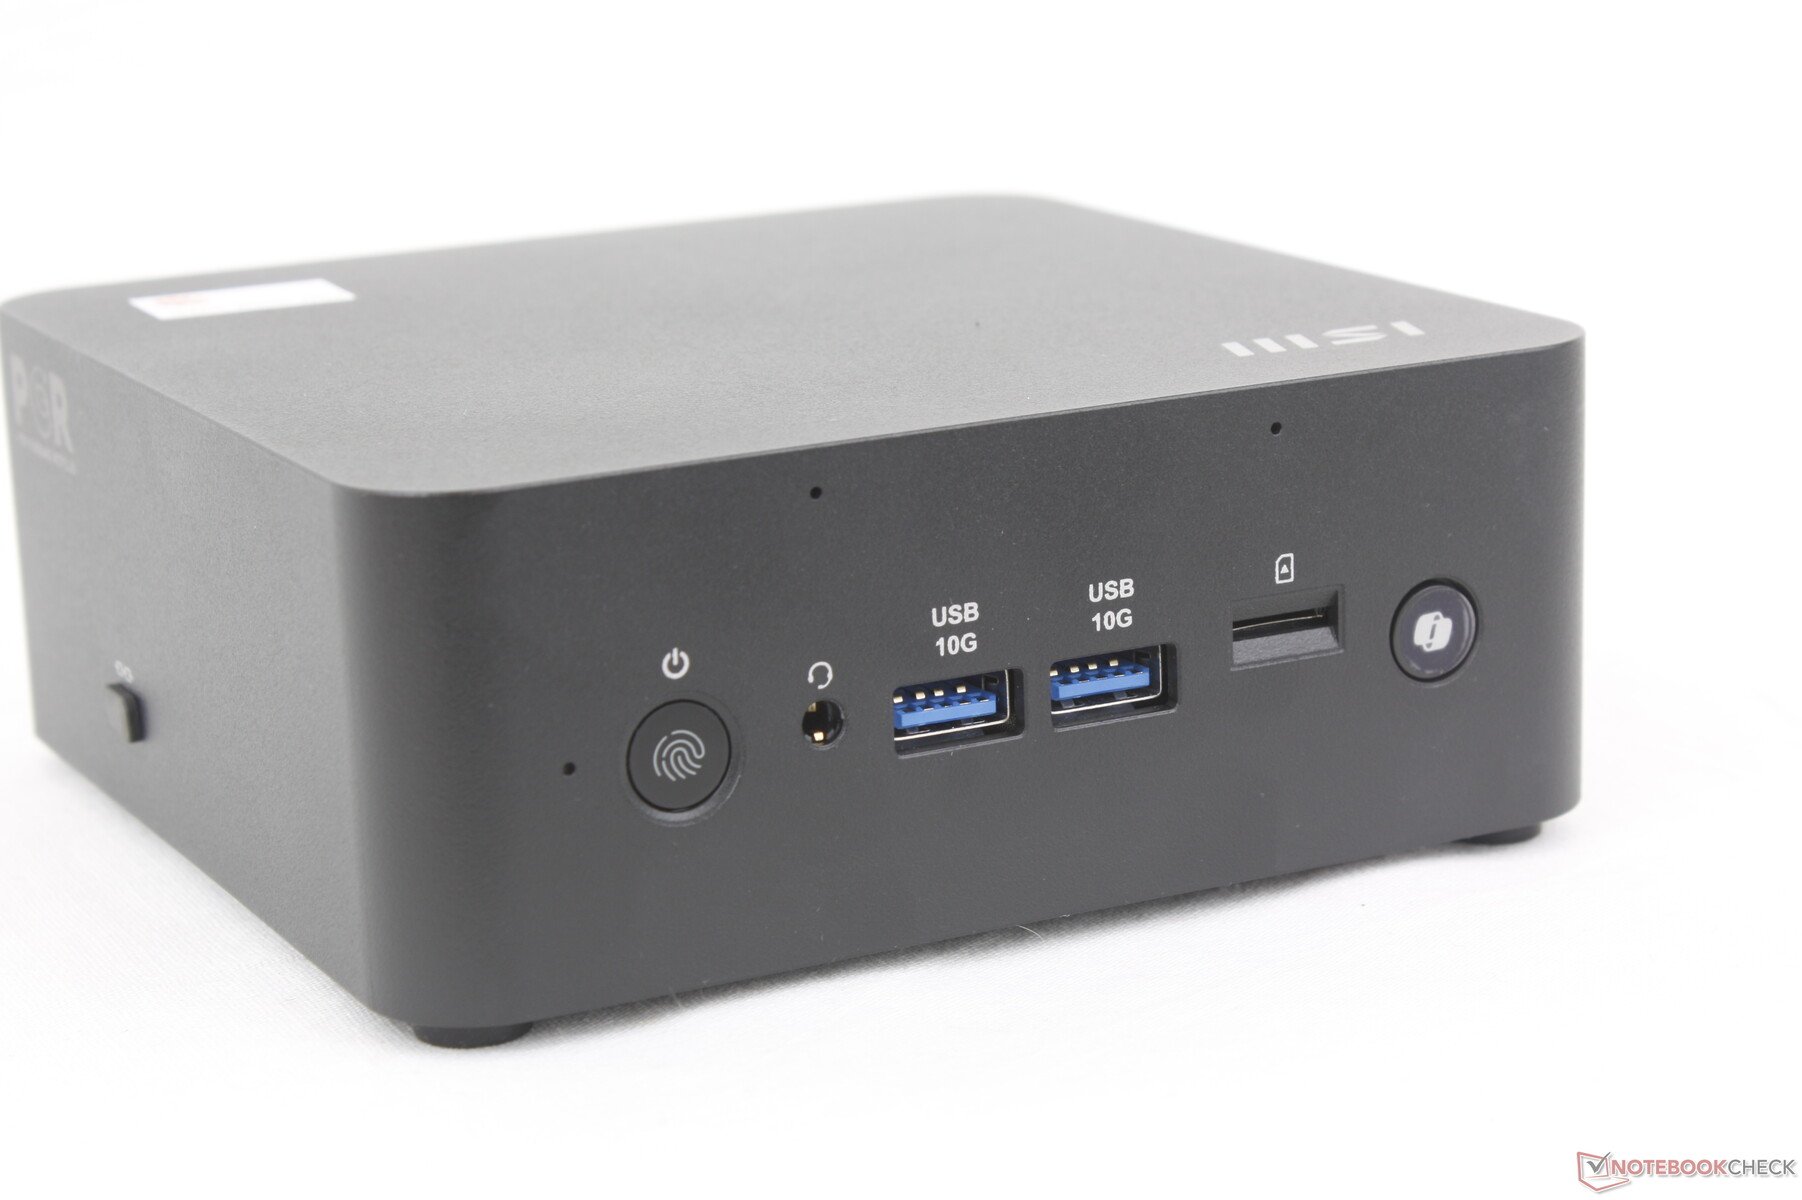
O chassi e as dimensões permanecem praticamente inalterados em relação ao Cubi 1M. A novidade do Cubi 2MG, no entanto, é o botão CoPilot dedicado na parte frontal da unidade. O problema com esse recurso é que o botão físico pode ser de difícil acesso, dependendo da posição do sistema na mesa.
Para maior comodidade, o Power Link é compatível com a ativação do dispositivo por meio de determinados monitores MSI. A lista de monitores compatíveis pode ser encontrada em aqui. Infelizmente, o Power Link ainda requer um adaptador CA para o mini PC e, portanto, não é uma verdadeira solução de "um cabo".
Conectividade
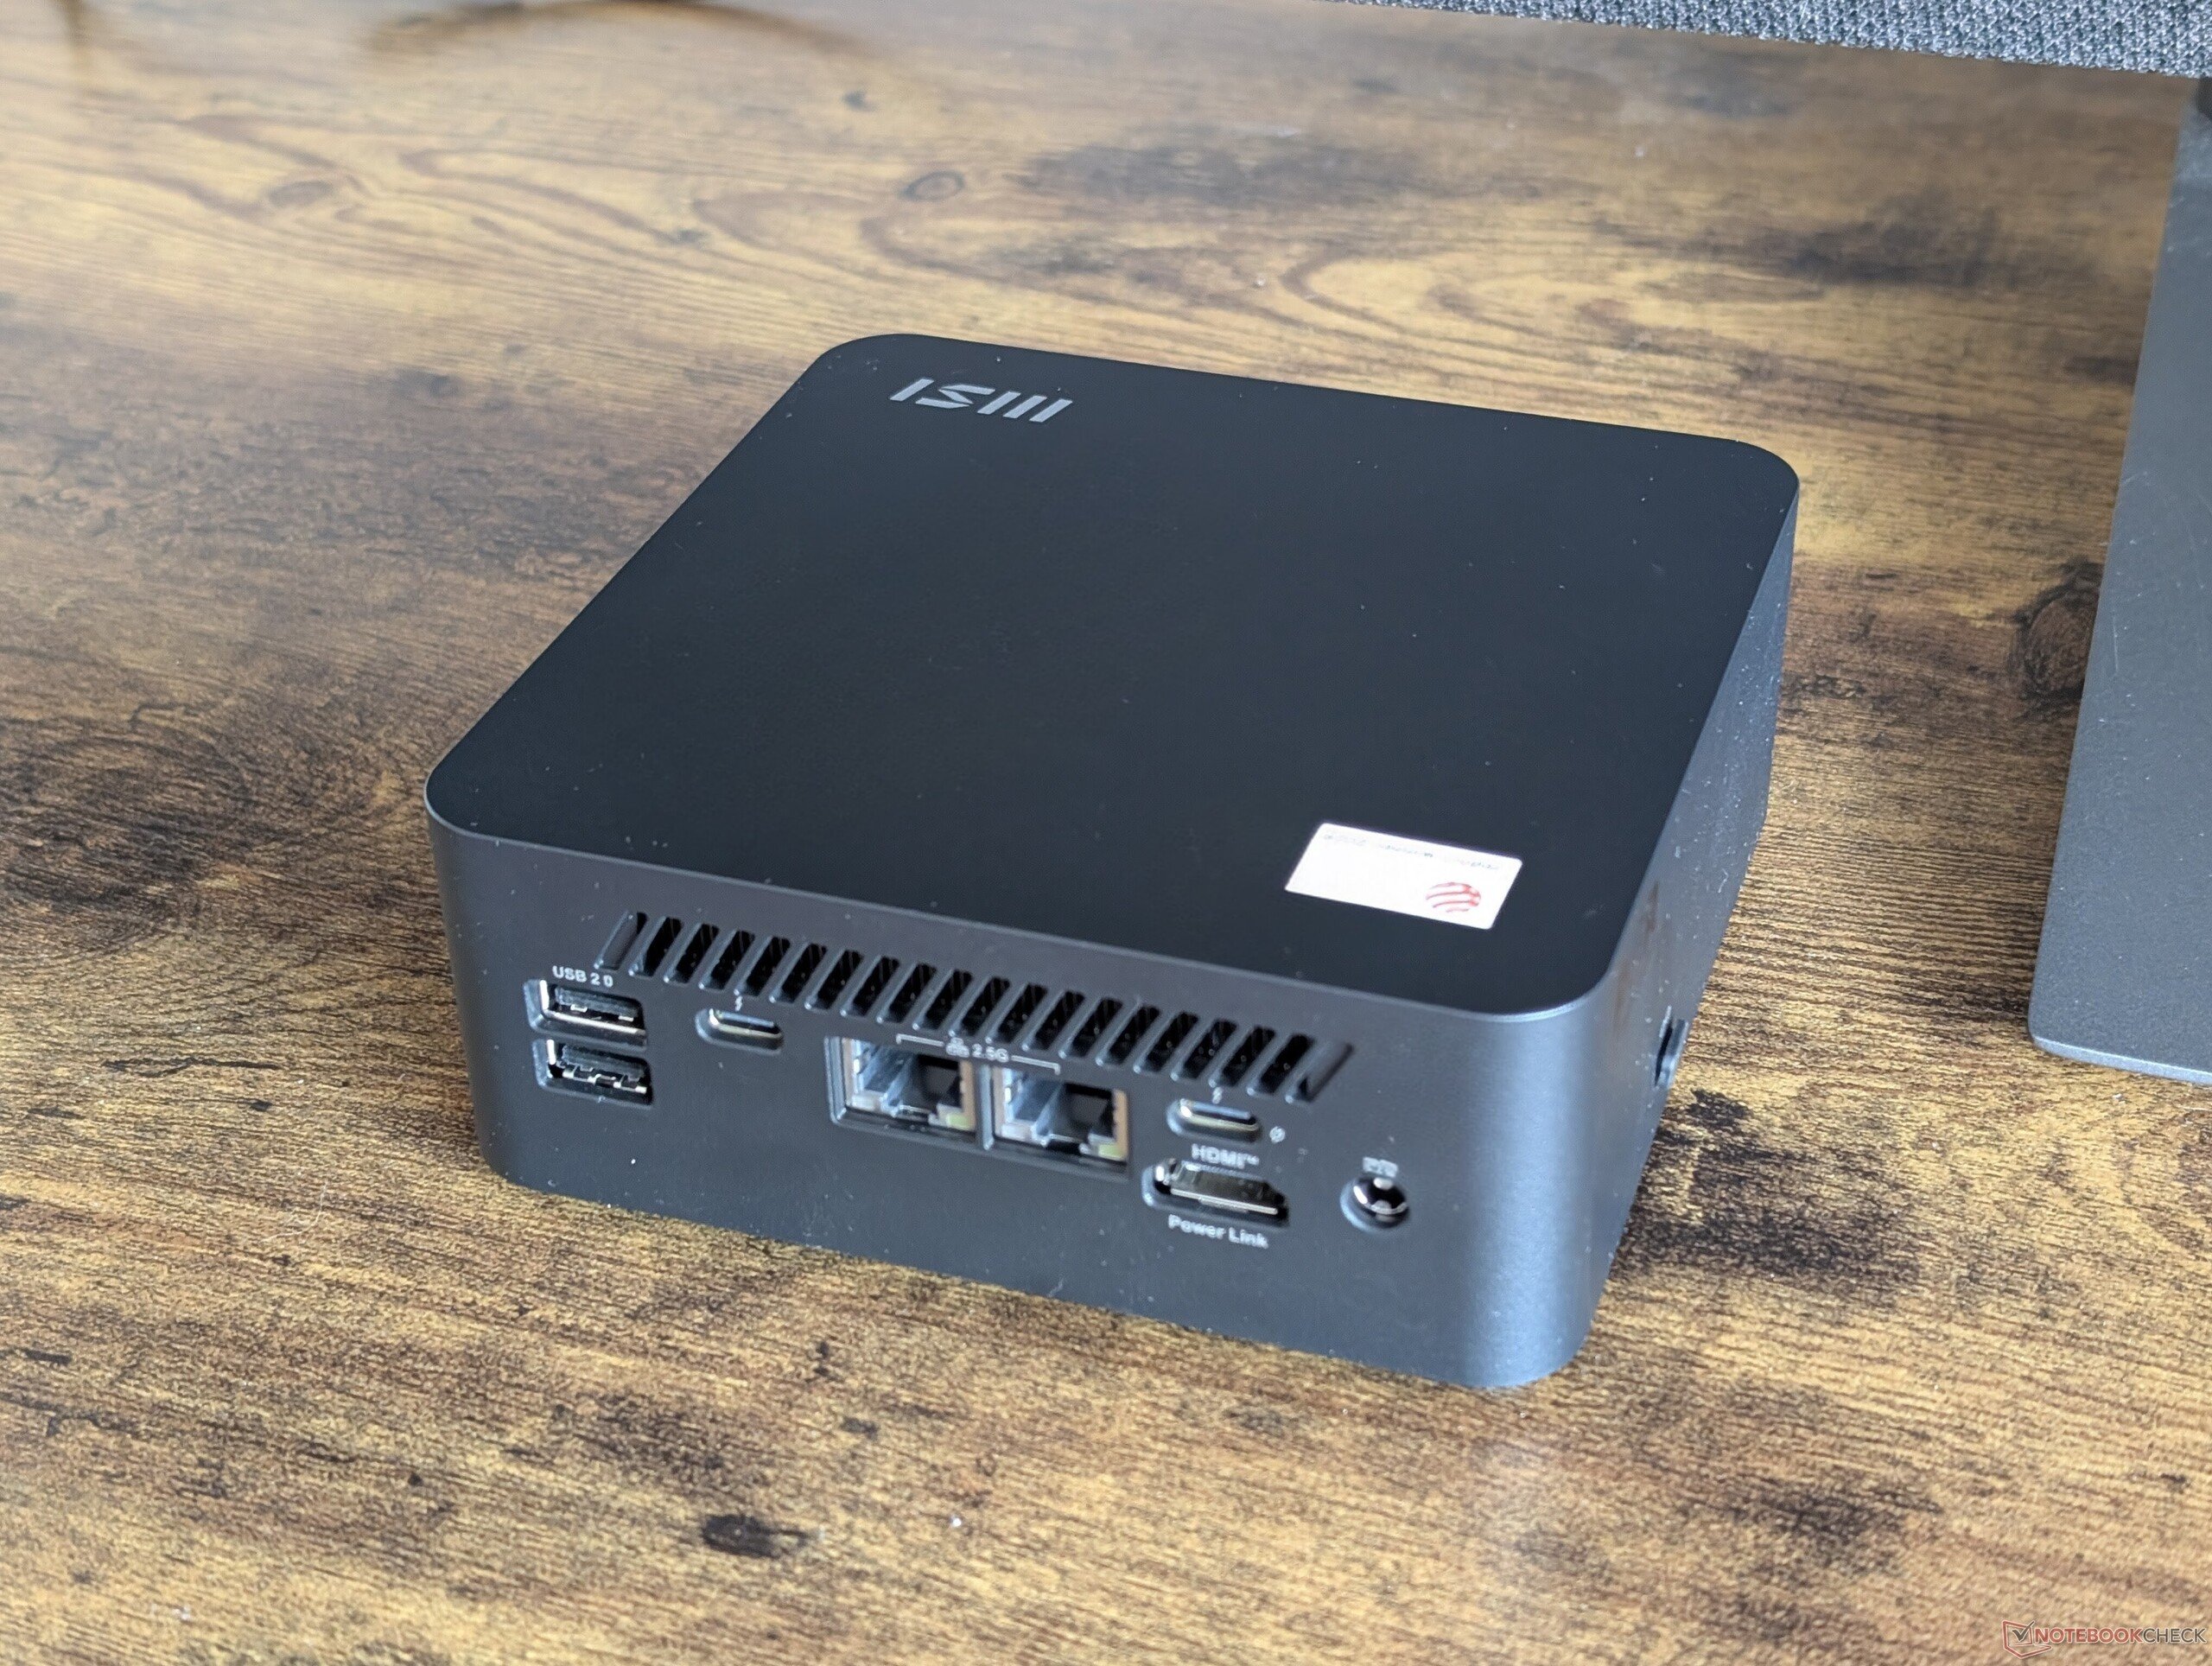
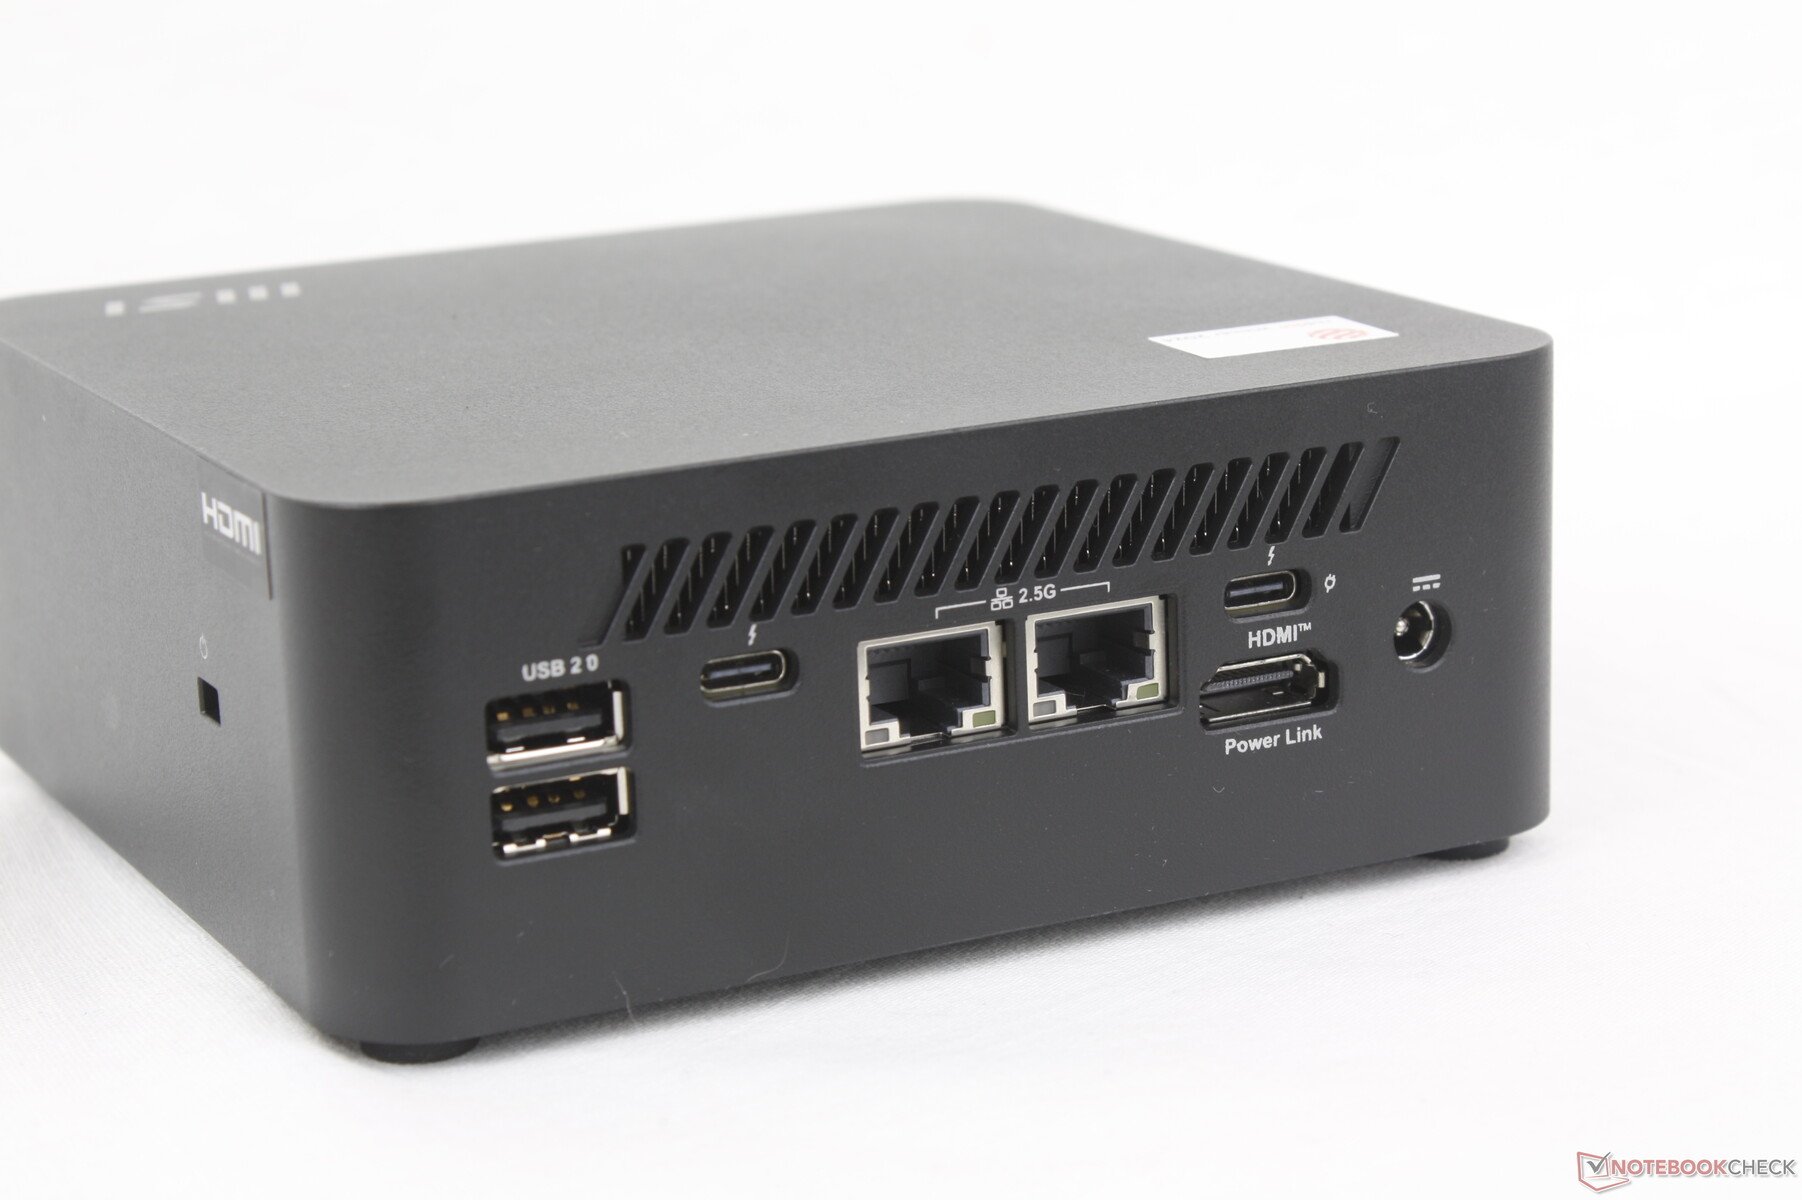
As opções de porta mudaram um pouco em relação ao Cubi 1M. Agora há apenas uma porta HDMI em vez de duas, além de menos portas USB 3.0.
Observe que, embora haja duas portas USB-C Thunderbolt 4, apenas uma das portas é compatível com Power Delivery-in de até 100 W, caso o adaptador CA principal não esteja disponível.
Leitor de cartão SD
| SD Card Reader | |
| average JPG Copy Test (av. of 3 runs) | |
| MSI Cubi NUC 1M (Angelbird AV Pro V60) | |
| MSI Cubi NUC AI+ 2MG (Angelbird AV Pro V60) | |
| maximum AS SSD Seq Read Test (1GB) | |
| MSI Cubi NUC AI+ 2MG (Angelbird AV Pro V60) | |
| MSI Cubi NUC 1M (Angelbird AV Pro V60) | |
Comunicação
| Networking | |
| iperf3 transmit AXE11000 | |
| MSI Cubi NUC AI+ 2MG | |
| GMK NucBox K12 | |
| Minisforum MS-A1 | |
| MSI Cubi NUC 1M | |
| Beelink SER9 Pro | |
| iperf3 receive AXE11000 | |
| MSI Cubi NUC AI+ 2MG | |
| Minisforum MS-A1 | |
| Beelink SER9 Pro | |
| GMK NucBox K12 | |
| MSI Cubi NUC 1M | |
| iperf3 transmit AXE11000 6GHz | |
| Minisforum MS-A1 | |
| MSI Cubi NUC 1M | |
| MSI Cubi NUC AI+ 2MG | |
| GMK NucBox K12 | |
| iperf3 receive AXE11000 6GHz | |
| Minisforum MS-A1 | |
| MSI Cubi NUC AI+ 2MG | |
| MSI Cubi NUC 1M | |
| GMK NucBox K12 | |
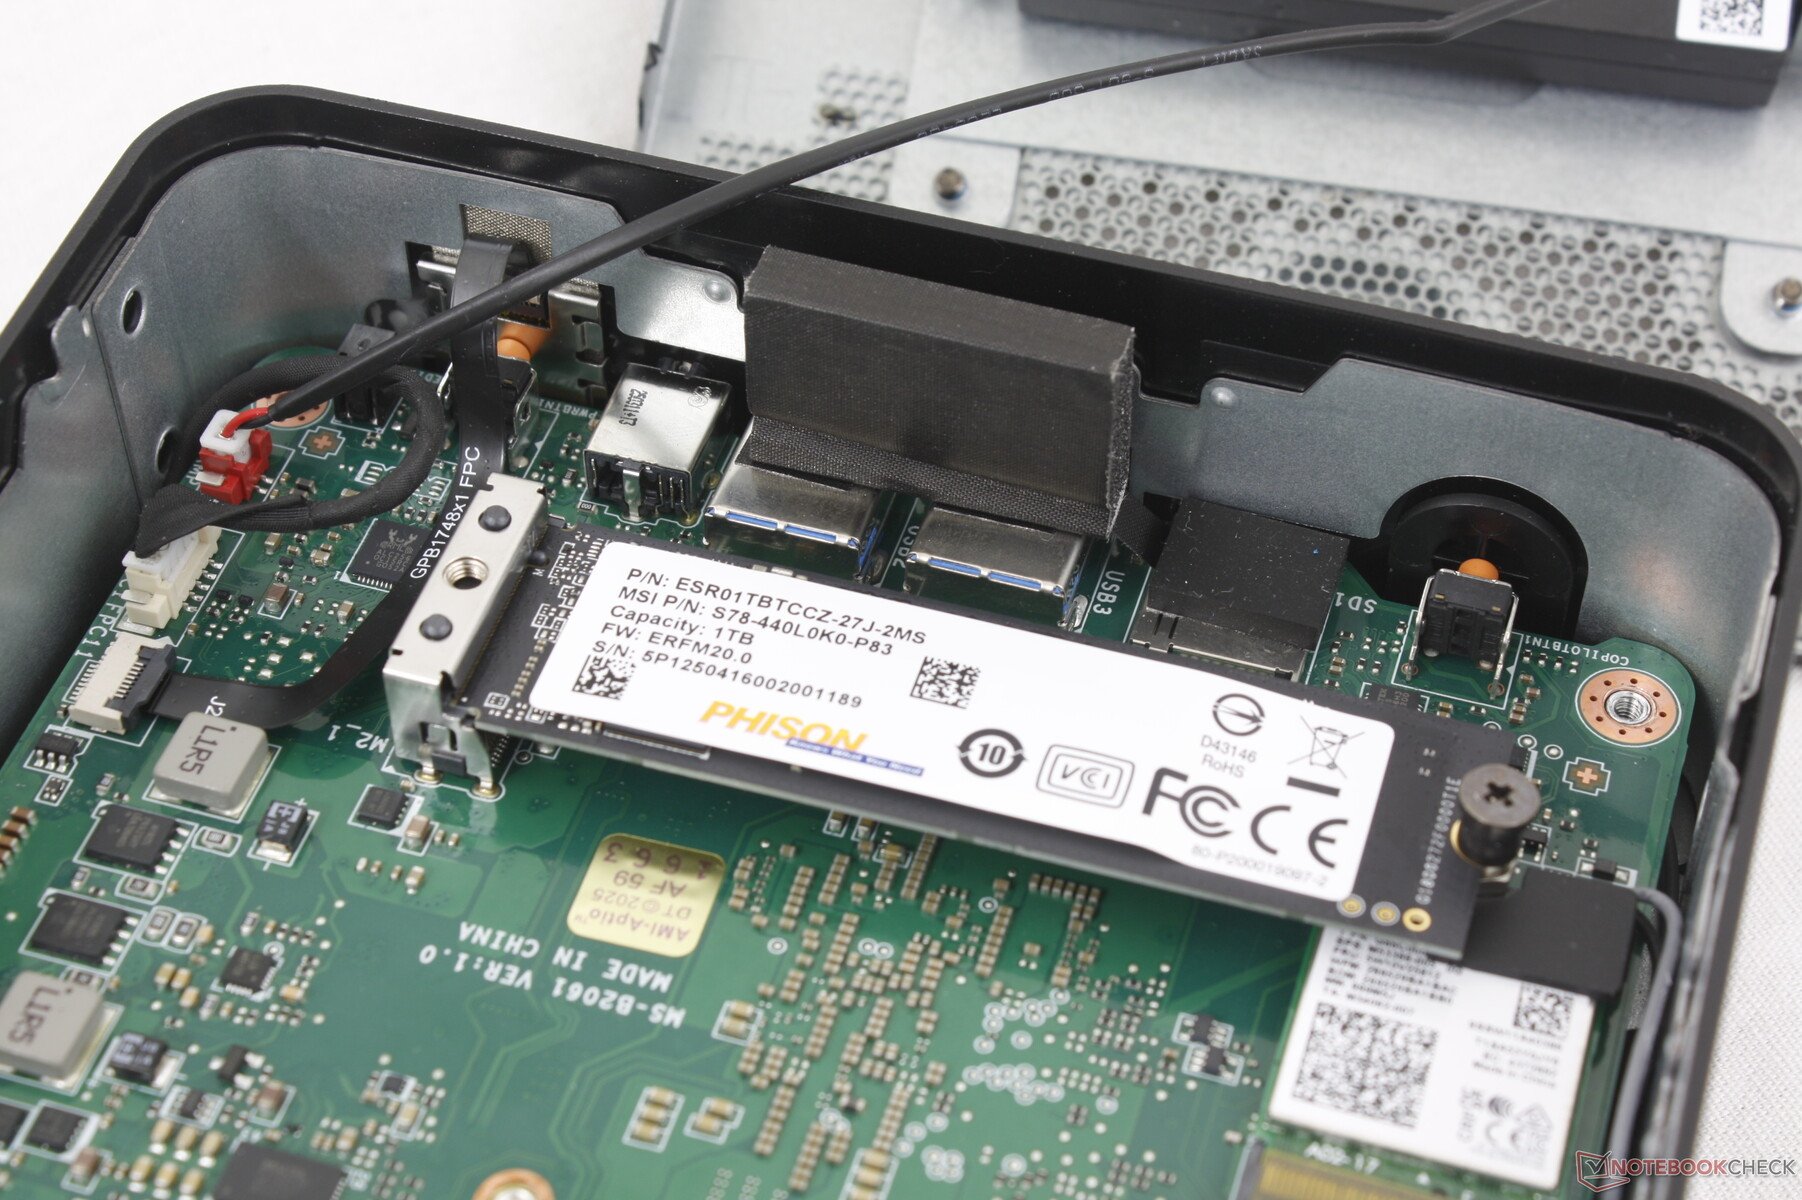
Manutenção
O painel inferior é facilmente removido com apenas uma chave de fenda Phillips para uma manutenção rápida. Infelizmente, apenas um SSD interno PCIe4 x4 M.2 2280 é suportado, sem RAM removível. Em contrapartida, o NucBox K12 mini PC suporta até três SSDs M.2 e dois módulos de RAM SODIMM removíveis.

Sustentabilidade
O chassi é composto por 37,25% de plástico reciclado pós-consumo, enquanto a embalagem interna é composta por caixas de papelão certificadas pelo FSC, fabricadas com polpa de madeira de origem sustentável.
Acessórios e garantia
A caixa de varejo inclui um suporte de montagem VESA removível e um prático botão liga/desliga com fio de 19 polegadas para ligar o PC se ele estiver situado em uma área de difícil acesso.
A garantia limitada de três anos do fabricante é padrão, em comparação com a garantia de um ano da maioria dos outros mini PCs nos EUA.
Desempenho
Condições de teste
Colocamos o MSI Center no modo Desempenho antes de executar os benchmarks abaixo.
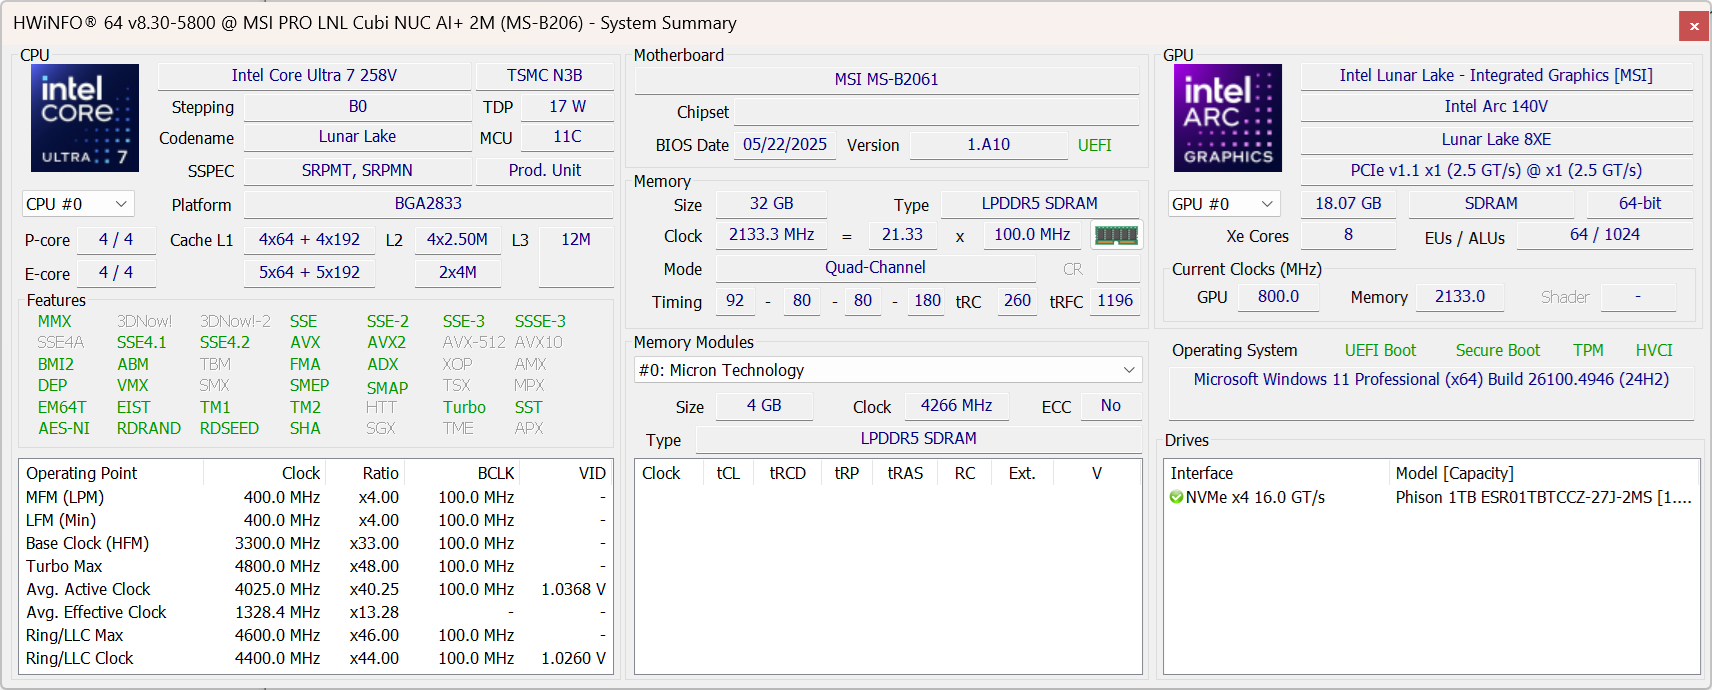
Processador
O Core Ultra 7 258V é quase 50% mais rápido do que o antigo Core 7 150U do Cubi NUC 1M do ano passado no que se refere ao desempenho multithread bruto. Ele também vem com uma NPU integrada, enquanto o Nuc 1M não tinha suporte para Co-Pilot+.
A atualização para o Core Ultra 9 288V Não deverá aumentar o desempenho por uma margem significativa, enquanto o downgrade para o Core Ultra 5 226V reduzirá o desempenho em apenas alguns pontos percentuais.
Cinebench R15 Multi Loop
Cinebench R23: Multi Core | Single Core
Cinebench R20: CPU (Multi Core) | CPU (Single Core)
Cinebench R15: CPU Multi 64Bit | CPU Single 64Bit
Blender: v2.79 BMW27 CPU
7-Zip 18.03: 7z b 4 | 7z b 4 -mmt1
Geekbench 6.7: Multi-Core | Single-Core
Geekbench 5.5: Multi-Core | Single-Core
HWBOT x265 Benchmark v2.2: 4k Preset
LibreOffice : 20 Documents To PDF
R Benchmark 2.5: Overall mean
| CPU Performance rating | |
| Minisforum MS-A1 | |
| Asus NUC 14 Pro+ | |
| Beelink SER9 Pro | |
| Intel NUC 13 Pro Kit NUC13ANK -2! | |
| MSI Cubi NUC AI+ 2MG | |
| Média Intel Core Ultra 7 258V | |
| MSI Cubi NUC 1M | |
| Ninkear M7, (16+512) | |
| GMK NucBox M5 | |
| Asus NUC 14 Essential | |
| BMAX B4 Turbo | |
| Cinebench R23 / Multi Core | |
| Asus NUC 14 Pro+ | |
| Minisforum MS-A1 | |
| Beelink SER9 Pro | |
| Intel NUC 13 Pro Kit NUC13ANK | |
| MSI Cubi NUC AI+ 2MG | |
| Média Intel Core Ultra 7 258V (7920 - 11097, n=25) | |
| MSI Cubi NUC 1M | |
| GMK NucBox M5 | |
| Ninkear M7, (16+512) | |
| Asus NUC 14 Essential | |
| BMAX B4 Turbo | |
| Cinebench R23 / Single Core | |
| MSI Cubi NUC AI+ 2MG | |
| Intel NUC 13 Pro Kit NUC13ANK | |
| MSI Cubi NUC 1M | |
| Média Intel Core Ultra 7 258V (1664 - 1957, n=25) | |
| Minisforum MS-A1 | |
| Asus NUC 14 Pro+ | |
| Beelink SER9 Pro | |
| Ninkear M7, (16+512) | |
| GMK NucBox M5 | |
| Asus NUC 14 Essential | |
| BMAX B4 Turbo | |
| Cinebench R20 / CPU (Multi Core) | |
| Asus NUC 14 Pro+ | |
| Minisforum MS-A1 | |
| Beelink SER9 Pro | |
| Intel NUC 13 Pro Kit NUC13ANK | |
| MSI Cubi NUC AI+ 2MG | |
| Média Intel Core Ultra 7 258V (3130 - 4314, n=24) | |
| Ninkear M7, (16+512) | |
| MSI Cubi NUC 1M | |
| GMK NucBox M5 | |
| Asus NUC 14 Essential | |
| BMAX B4 Turbo | |
| Cinebench R20 / CPU (Single Core) | |
| MSI Cubi NUC AI+ 2MG | |
| Intel NUC 13 Pro Kit NUC13ANK | |
| MSI Cubi NUC 1M | |
| Média Intel Core Ultra 7 258V (643 - 749, n=24) | |
| Minisforum MS-A1 | |
| Asus NUC 14 Pro+ | |
| Beelink SER9 Pro | |
| Ninkear M7, (16+512) | |
| GMK NucBox M5 | |
| Asus NUC 14 Essential | |
| BMAX B4 Turbo | |
| Cinebench R15 / CPU Multi 64Bit | |
| Asus NUC 14 Pro+ | |
| Minisforum MS-A1 | |
| Beelink SER9 Pro | |
| Intel NUC 13 Pro Kit NUC13ANK | |
| Média Intel Core Ultra 7 258V (1280 - 1656, n=24) | |
| MSI Cubi NUC AI+ 2MG | |
| Ninkear M7, (16+512) | |
| GMK NucBox M5 | |
| MSI Cubi NUC 1M | |
| Asus NUC 14 Essential | |
| BMAX B4 Turbo | |
| Cinebench R15 / CPU Single 64Bit | |
| MSI Cubi NUC AI+ 2MG | |
| Minisforum MS-A1 | |
| Média Intel Core Ultra 7 258V (258 - 298, n=24) | |
| Beelink SER9 Pro | |
| Intel NUC 13 Pro Kit NUC13ANK | |
| Asus NUC 14 Pro+ | |
| MSI Cubi NUC 1M | |
| Ninkear M7, (16+512) | |
| GMK NucBox M5 | |
| Asus NUC 14 Essential | |
| BMAX B4 Turbo | |
| Blender / v2.79 BMW27 CPU | |
| BMAX B4 Turbo | |
| Asus NUC 14 Essential | |
| MSI Cubi NUC 1M | |
| Ninkear M7, (16+512) | |
| GMK NucBox M5 | |
| Média Intel Core Ultra 7 258V (315 - 484, n=24) | |
| MSI Cubi NUC AI+ 2MG | |
| Intel NUC 13 Pro Kit NUC13ANK | |
| Beelink SER9 Pro | |
| Minisforum MS-A1 | |
| Asus NUC 14 Pro+ | |
| 7-Zip 18.03 / 7z b 4 | |
| Minisforum MS-A1 | |
| Beelink SER9 Pro | |
| Asus NUC 14 Pro+ | |
| Intel NUC 13 Pro Kit NUC13ANK | |
| Ninkear M7, (16+512) | |
| MSI Cubi NUC AI+ 2MG | |
| Média Intel Core Ultra 7 258V (24486 - 36724, n=24) | |
| GMK NucBox M5 | |
| MSI Cubi NUC 1M | |
| Asus NUC 14 Essential | |
| BMAX B4 Turbo | |
| 7-Zip 18.03 / 7z b 4 -mmt1 | |
| Minisforum MS-A1 | |
| Beelink SER9 Pro | |
| Intel NUC 13 Pro Kit NUC13ANK | |
| MSI Cubi NUC 1M | |
| MSI Cubi NUC AI+ 2MG | |
| Asus NUC 14 Pro+ | |
| Média Intel Core Ultra 7 258V (4769 - 5869, n=24) | |
| Ninkear M7, (16+512) | |
| GMK NucBox M5 | |
| Asus NUC 14 Essential | |
| BMAX B4 Turbo | |
| Geekbench 6.7 / Multi-Core | |
| Asus NUC 14 Pro+ | |
| Minisforum MS-A1 | |
| Beelink SER9 Pro | |
| Média Intel Core Ultra 7 258V (8964 - 11334, n=24) | |
| MSI Cubi NUC AI+ 2MG | |
| MSI Cubi NUC 1M | |
| GMK NucBox M5 | |
| Ninkear M7, (16+512) | |
| Asus NUC 14 Essential | |
| BMAX B4 Turbo | |
| Geekbench 6.7 / Single-Core | |
| MSI Cubi NUC AI+ 2MG | |
| Média Intel Core Ultra 7 258V (2593 - 2795, n=24) | |
| Minisforum MS-A1 | |
| MSI Cubi NUC 1M | |
| Beelink SER9 Pro | |
| Asus NUC 14 Pro+ | |
| Ninkear M7, (16+512) | |
| GMK NucBox M5 | |
| Asus NUC 14 Essential | |
| BMAX B4 Turbo | |
| Geekbench 5.5 / Multi-Core | |
| Asus NUC 14 Pro+ | |
| Minisforum MS-A1 | |
| Beelink SER9 Pro | |
| Intel NUC 13 Pro Kit NUC13ANK | |
| Média Intel Core Ultra 7 258V (7574 - 9918, n=24) | |
| MSI Cubi NUC 1M | |
| MSI Cubi NUC AI+ 2MG | |
| GMK NucBox M5 | |
| Ninkear M7, (16+512) | |
| Asus NUC 14 Essential | |
| BMAX B4 Turbo | |
| Geekbench 5.5 / Single-Core | |
| MSI Cubi NUC AI+ 2MG | |
| Minisforum MS-A1 | |
| Média Intel Core Ultra 7 258V (1891 - 2046, n=24) | |
| MSI Cubi NUC 1M | |
| Intel NUC 13 Pro Kit NUC13ANK | |
| Beelink SER9 Pro | |
| Asus NUC 14 Pro+ | |
| Ninkear M7, (16+512) | |
| GMK NucBox M5 | |
| Asus NUC 14 Essential | |
| BMAX B4 Turbo | |
| HWBOT x265 Benchmark v2.2 / 4k Preset | |
| Minisforum MS-A1 | |
| Beelink SER9 Pro | |
| Asus NUC 14 Pro+ | |
| Intel NUC 13 Pro Kit NUC13ANK | |
| MSI Cubi NUC AI+ 2MG | |
| Média Intel Core Ultra 7 258V (7.11 - 14.2, n=24) | |
| MSI Cubi NUC 1M | |
| Ninkear M7, (16+512) | |
| GMK NucBox M5 | |
| Asus NUC 14 Essential | |
| BMAX B4 Turbo | |
| LibreOffice / 20 Documents To PDF | |
| Asus NUC 14 Essential | |
| BMAX B4 Turbo | |
| Ninkear M7, (16+512) | |
| GMK NucBox M5 | |
| Asus NUC 14 Pro+ | |
| Beelink SER9 Pro | |
| Média Intel Core Ultra 7 258V (41.1 - 62.8, n=24) | |
| Minisforum MS-A1 | |
| MSI Cubi NUC AI+ 2MG | |
| Intel NUC 13 Pro Kit NUC13ANK | |
| MSI Cubi NUC 1M | |
| R Benchmark 2.5 / Overall mean | |
| BMAX B4 Turbo | |
| Asus NUC 14 Essential | |
| Ninkear M7, (16+512) | |
| GMK NucBox M5 | |
| Beelink SER9 Pro | |
| Média Intel Core Ultra 7 258V (0.443 - 0.542, n=24) | |
| MSI Cubi NUC AI+ 2MG | |
| Asus NUC 14 Pro+ | |
| Intel NUC 13 Pro Kit NUC13ANK | |
| MSI Cubi NUC 1M | |
| Minisforum MS-A1 | |
* ... menor é melhor
AIDA64: FP32 Ray-Trace | FPU Julia | CPU SHA3 | CPU Queen | FPU SinJulia | FPU Mandel | CPU AES | CPU ZLib | FP64 Ray-Trace | CPU PhotoWorxx
| Performance rating | |
| Minisforum MS-A1 | |
| Beelink SER9 Pro | |
| GMK NucBox K12 | |
| MSI Cubi NUC AI+ 2MG | |
| Média Intel Core Ultra 7 258V | |
| Ninkear M7, (16+512) | |
| MSI Cubi NUC 1M | |
| AIDA64 / FP32 Ray-Trace | |
| Minisforum MS-A1 | |
| Beelink SER9 Pro | |
| GMK NucBox K12 | |
| MSI Cubi NUC AI+ 2MG | |
| Média Intel Core Ultra 7 258V (8454 - 12781, n=26) | |
| Ninkear M7, (16+512) | |
| MSI Cubi NUC 1M | |
| AIDA64 / FPU Julia | |
| Minisforum MS-A1 | |
| Beelink SER9 Pro | |
| GMK NucBox K12 | |
| MSI Cubi NUC AI+ 2MG | |
| Média Intel Core Ultra 7 258V (40875 - 63401, n=26) | |
| Ninkear M7, (16+512) | |
| MSI Cubi NUC 1M | |
| AIDA64 / CPU SHA3 | |
| Minisforum MS-A1 | |
| Beelink SER9 Pro | |
| GMK NucBox K12 | |
| MSI Cubi NUC AI+ 2MG | |
| Média Intel Core Ultra 7 258V (1930 - 2817, n=26) | |
| Ninkear M7, (16+512) | |
| MSI Cubi NUC 1M | |
| AIDA64 / CPU Queen | |
| Minisforum MS-A1 | |
| Beelink SER9 Pro | |
| GMK NucBox K12 | |
| Ninkear M7, (16+512) | |
| MSI Cubi NUC 1M | |
| Média Intel Core Ultra 7 258V (48816 - 49818, n=24) | |
| MSI Cubi NUC AI+ 2MG | |
| AIDA64 / FPU SinJulia | |
| Minisforum MS-A1 | |
| Beelink SER9 Pro | |
| GMK NucBox K12 | |
| Ninkear M7, (16+512) | |
| MSI Cubi NUC AI+ 2MG | |
| MSI Cubi NUC 1M | |
| Média Intel Core Ultra 7 258V (3817 - 4440, n=26) | |
| AIDA64 / FPU Mandel | |
| Minisforum MS-A1 | |
| Beelink SER9 Pro | |
| GMK NucBox K12 | |
| MSI Cubi NUC AI+ 2MG | |
| Média Intel Core Ultra 7 258V (21670 - 33565, n=26) | |
| Ninkear M7, (16+512) | |
| MSI Cubi NUC 1M | |
| AIDA64 / CPU AES | |
| Minisforum MS-A1 | |
| Beelink SER9 Pro | |
| GMK NucBox K12 | |
| MSI Cubi NUC AI+ 2MG | |
| Média Intel Core Ultra 7 258V (30957 - 40753, n=26) | |
| Ninkear M7, (16+512) | |
| MSI Cubi NUC 1M | |
| AIDA64 / CPU ZLib | |
| Minisforum MS-A1 | |
| Beelink SER9 Pro | |
| GMK NucBox K12 | |
| MSI Cubi NUC AI+ 2MG | |
| Média Intel Core Ultra 7 258V (422 - 632, n=26) | |
| MSI Cubi NUC 1M | |
| Ninkear M7, (16+512) | |
| AIDA64 / FP64 Ray-Trace | |
| Minisforum MS-A1 | |
| Beelink SER9 Pro | |
| GMK NucBox K12 | |
| MSI Cubi NUC AI+ 2MG | |
| Média Intel Core Ultra 7 258V (4258 - 6930, n=26) | |
| Ninkear M7, (16+512) | |
| MSI Cubi NUC 1M | |
| AIDA64 / CPU PhotoWorxx | |
| MSI Cubi NUC AI+ 2MG | |
| Média Intel Core Ultra 7 258V (44223 - 59245, n=26) | |
| Beelink SER9 Pro | |
| Minisforum MS-A1 | |
| GMK NucBox K12 | |
| MSI Cubi NUC 1M | |
| Ninkear M7, (16+512) | |
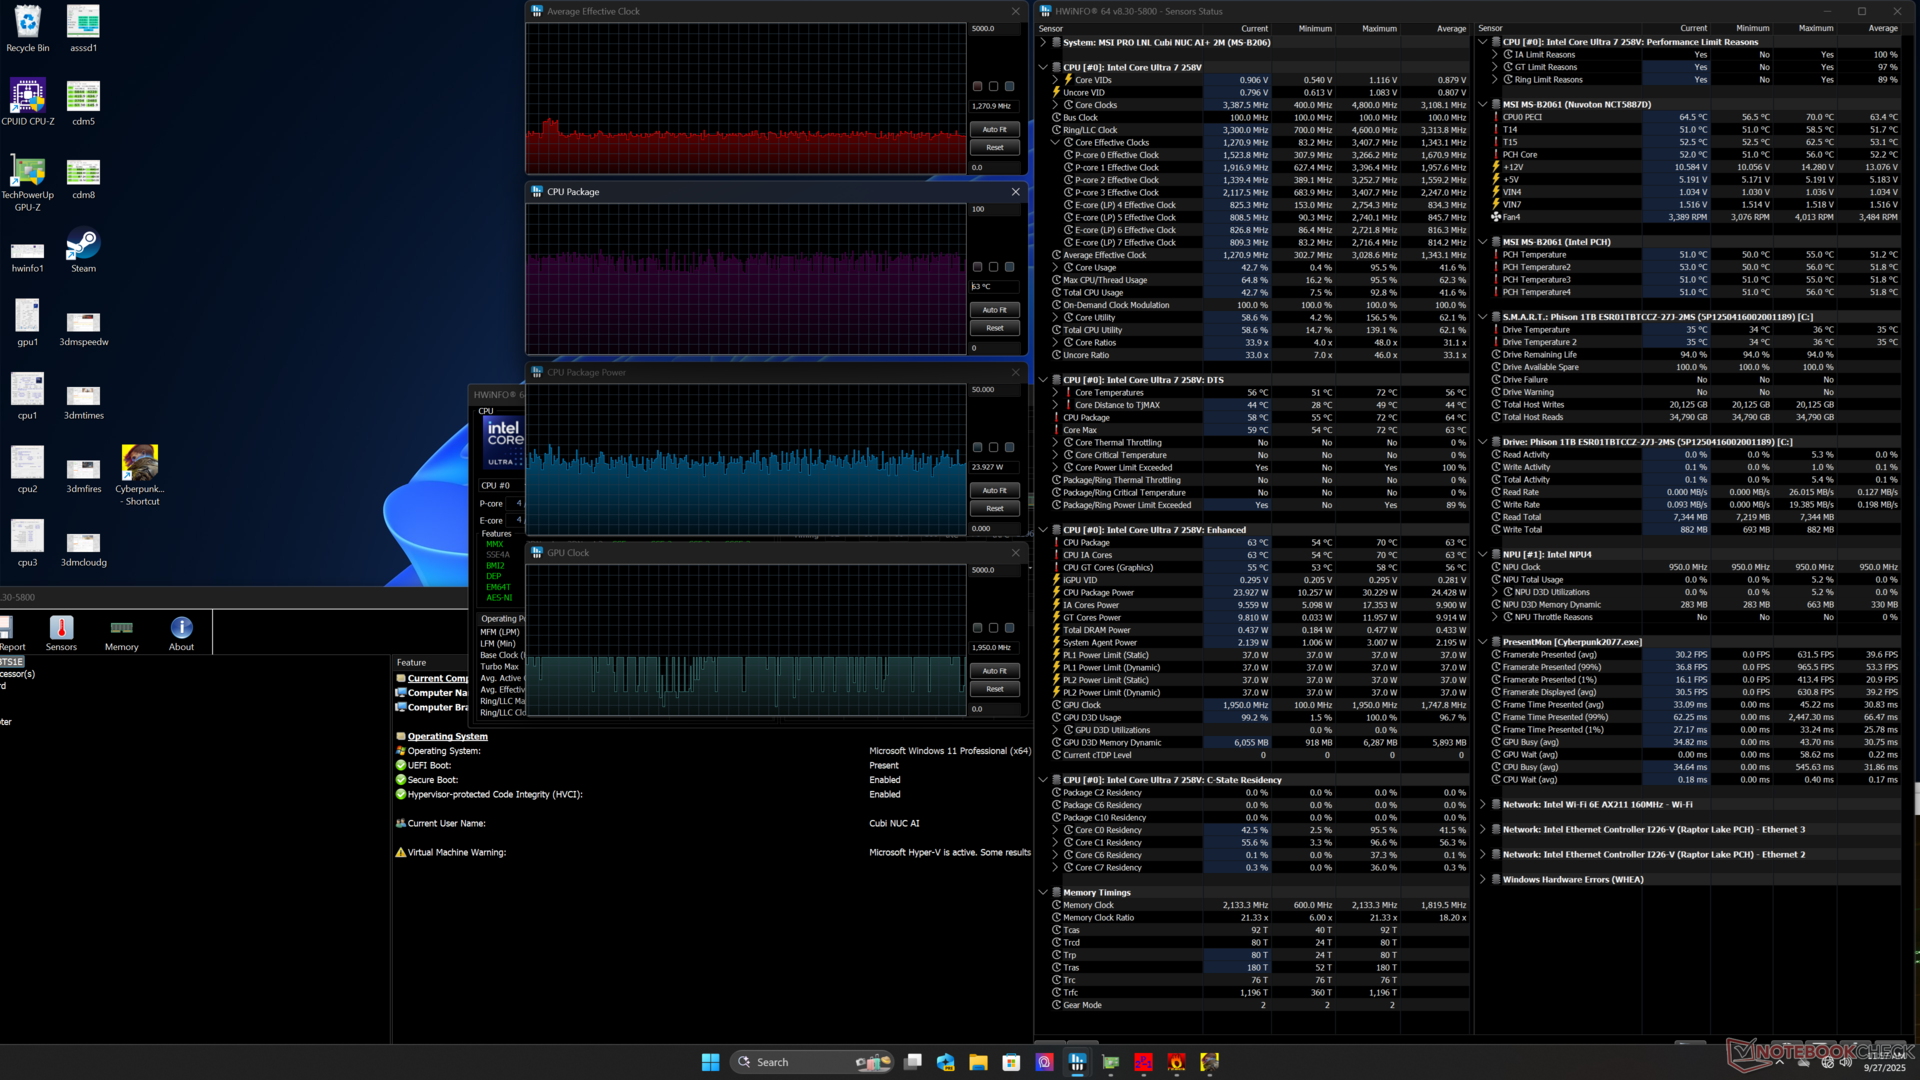
Teste de estresse
A CPU se estabilizaria em 3,2 GHz, 66 °C e cerca de 38 W ao executar o estresse do Prime95. Ao executar o Cyberpunk 2077 para representar o estresse típico dos jogos, no entanto, as taxas de clock da GPU alternavam entre 800 MHz e 1950 MHz, resultando em tempos de quadros instáveis durante os jogos, conforme mostrado na seção Desempenho da GPU abaixo, mesmo que a taxa média de quadros seja normal. Esse comportamento de gagueira ocorre tanto no modo balanceado quanto no modo de desempenho.
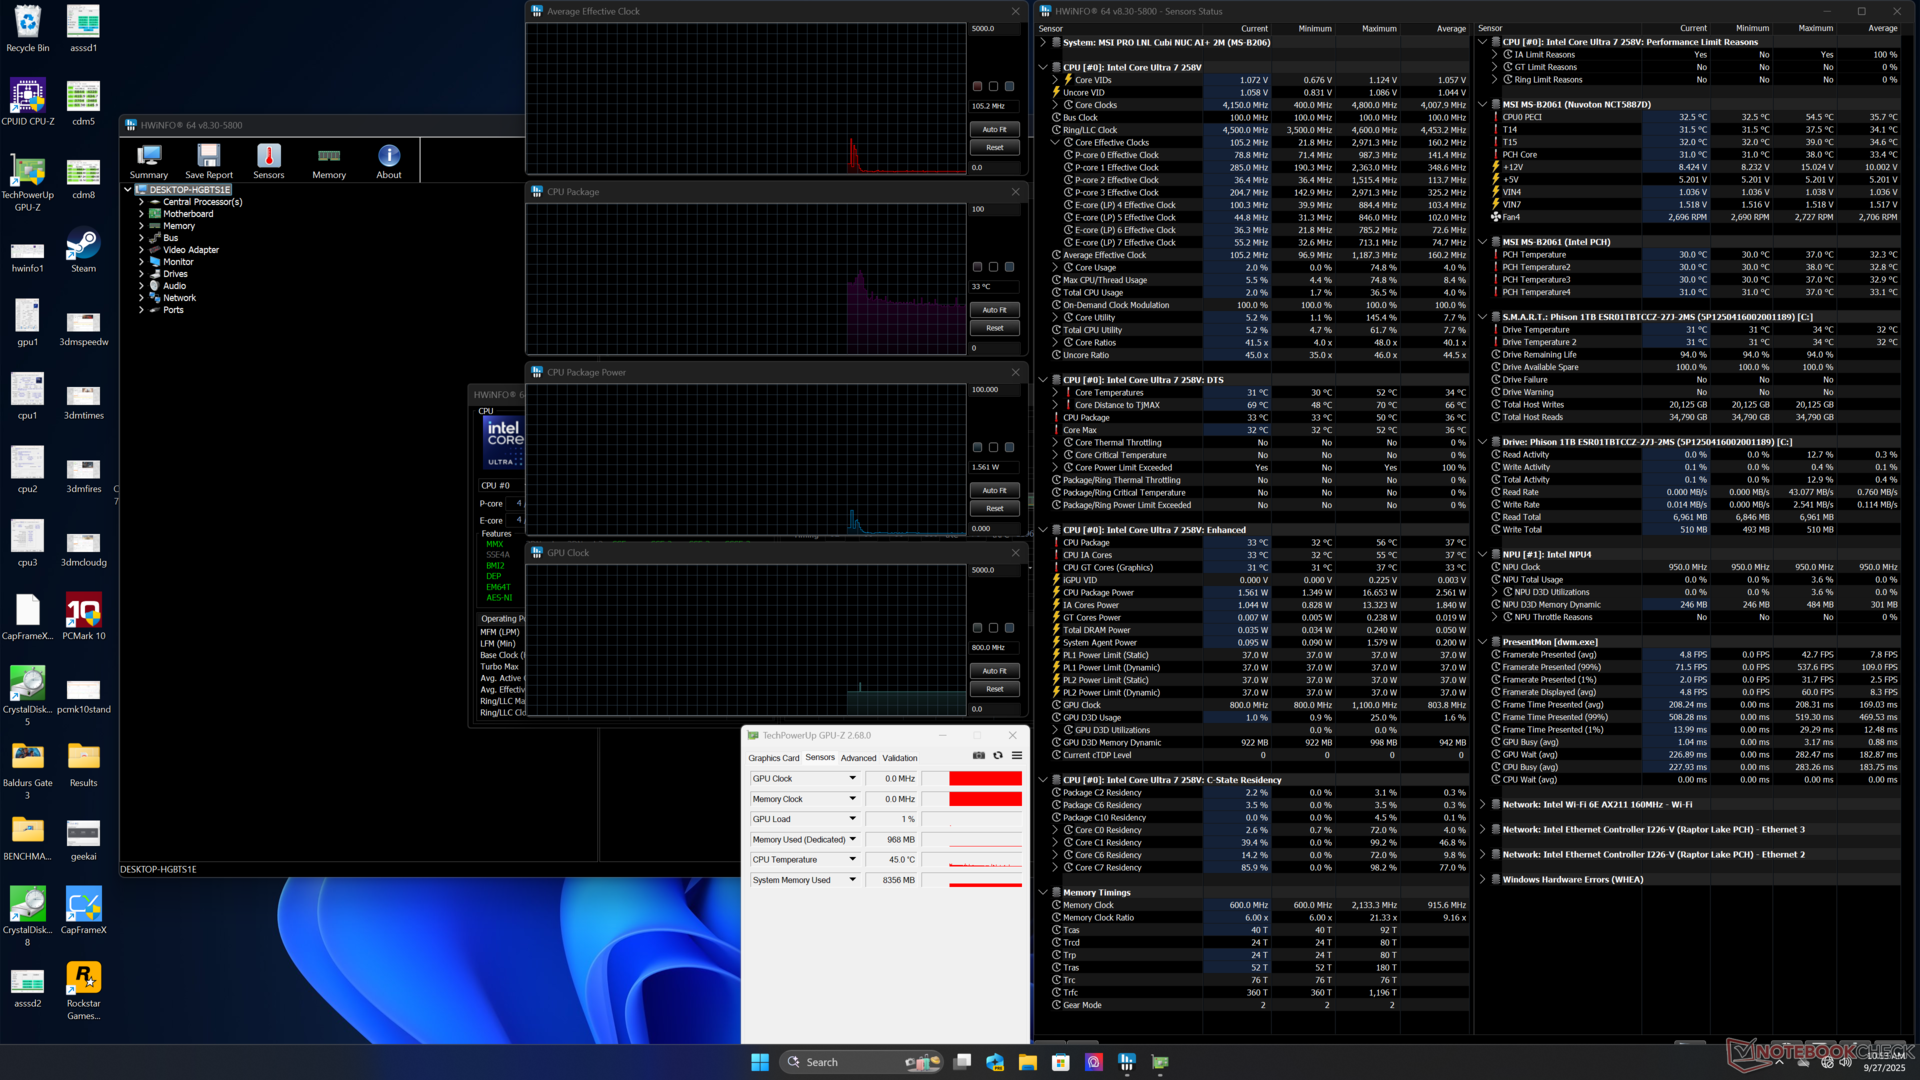
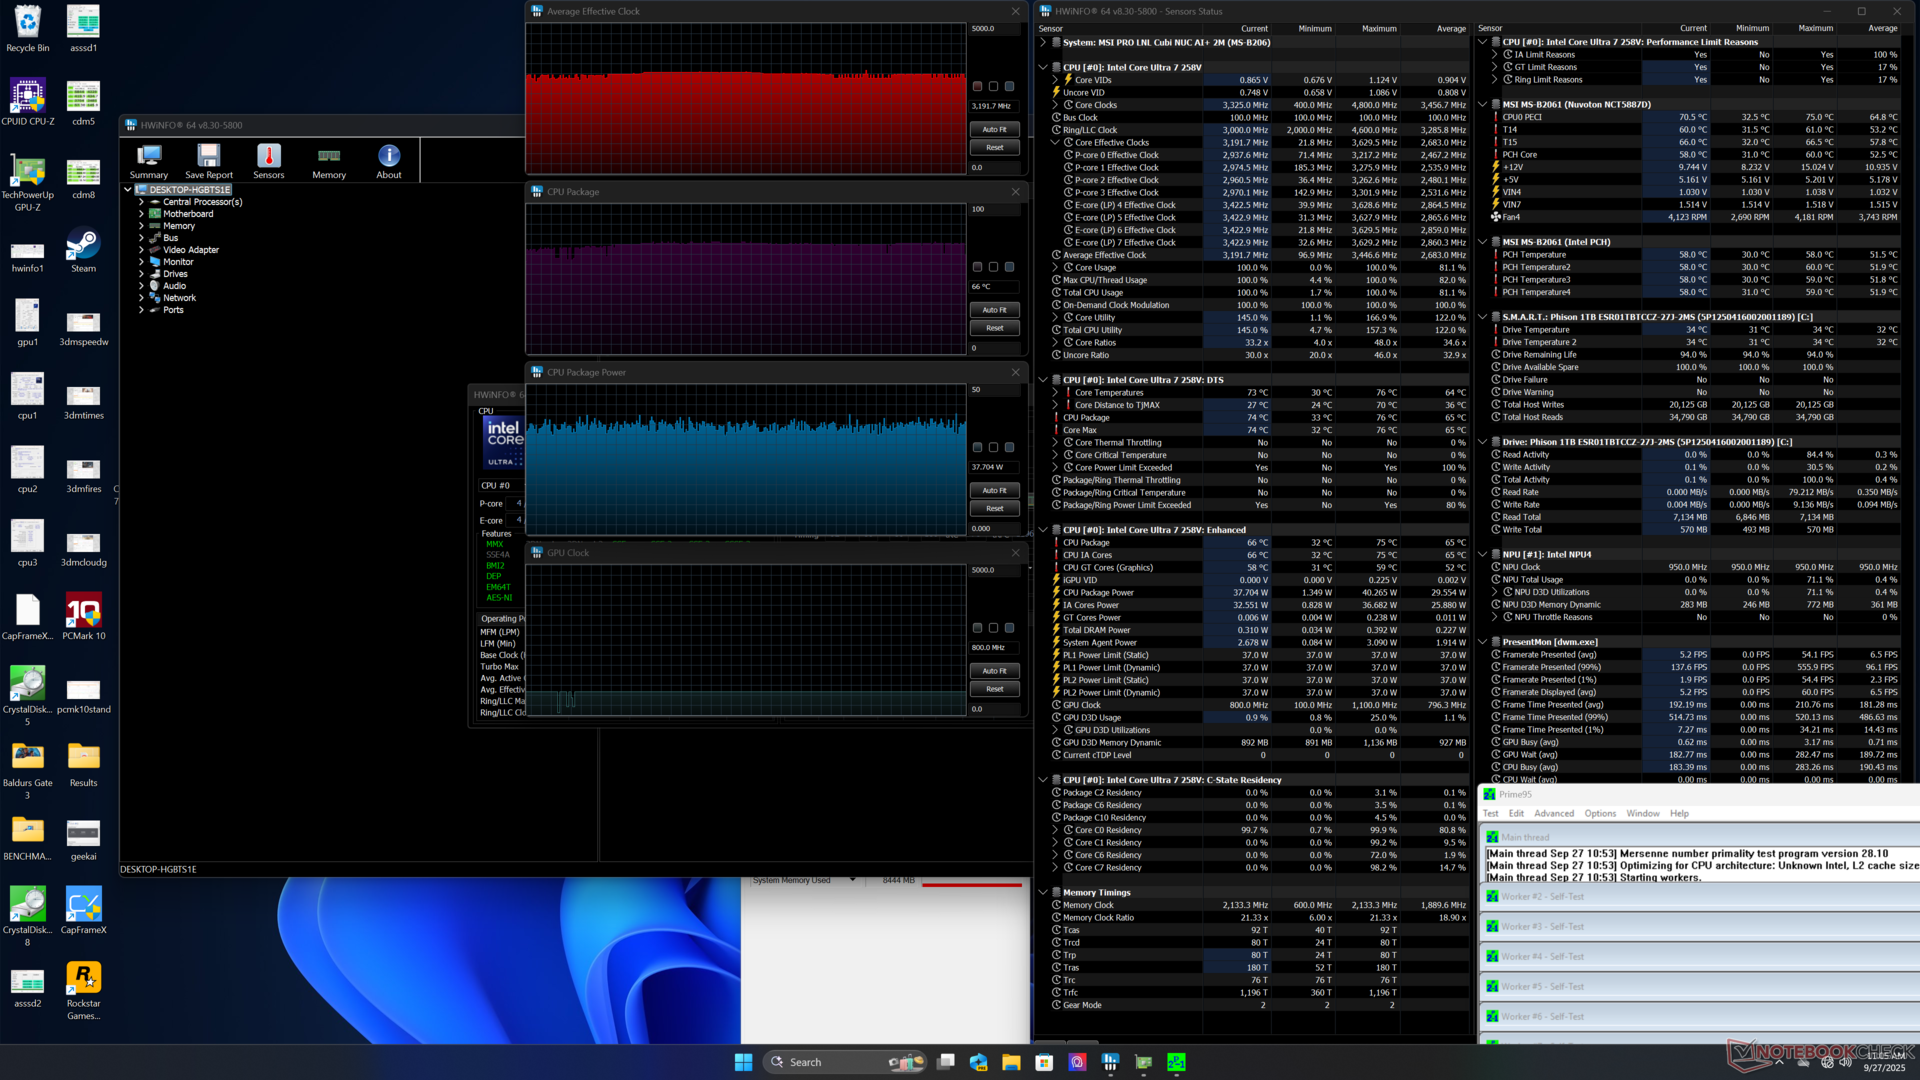
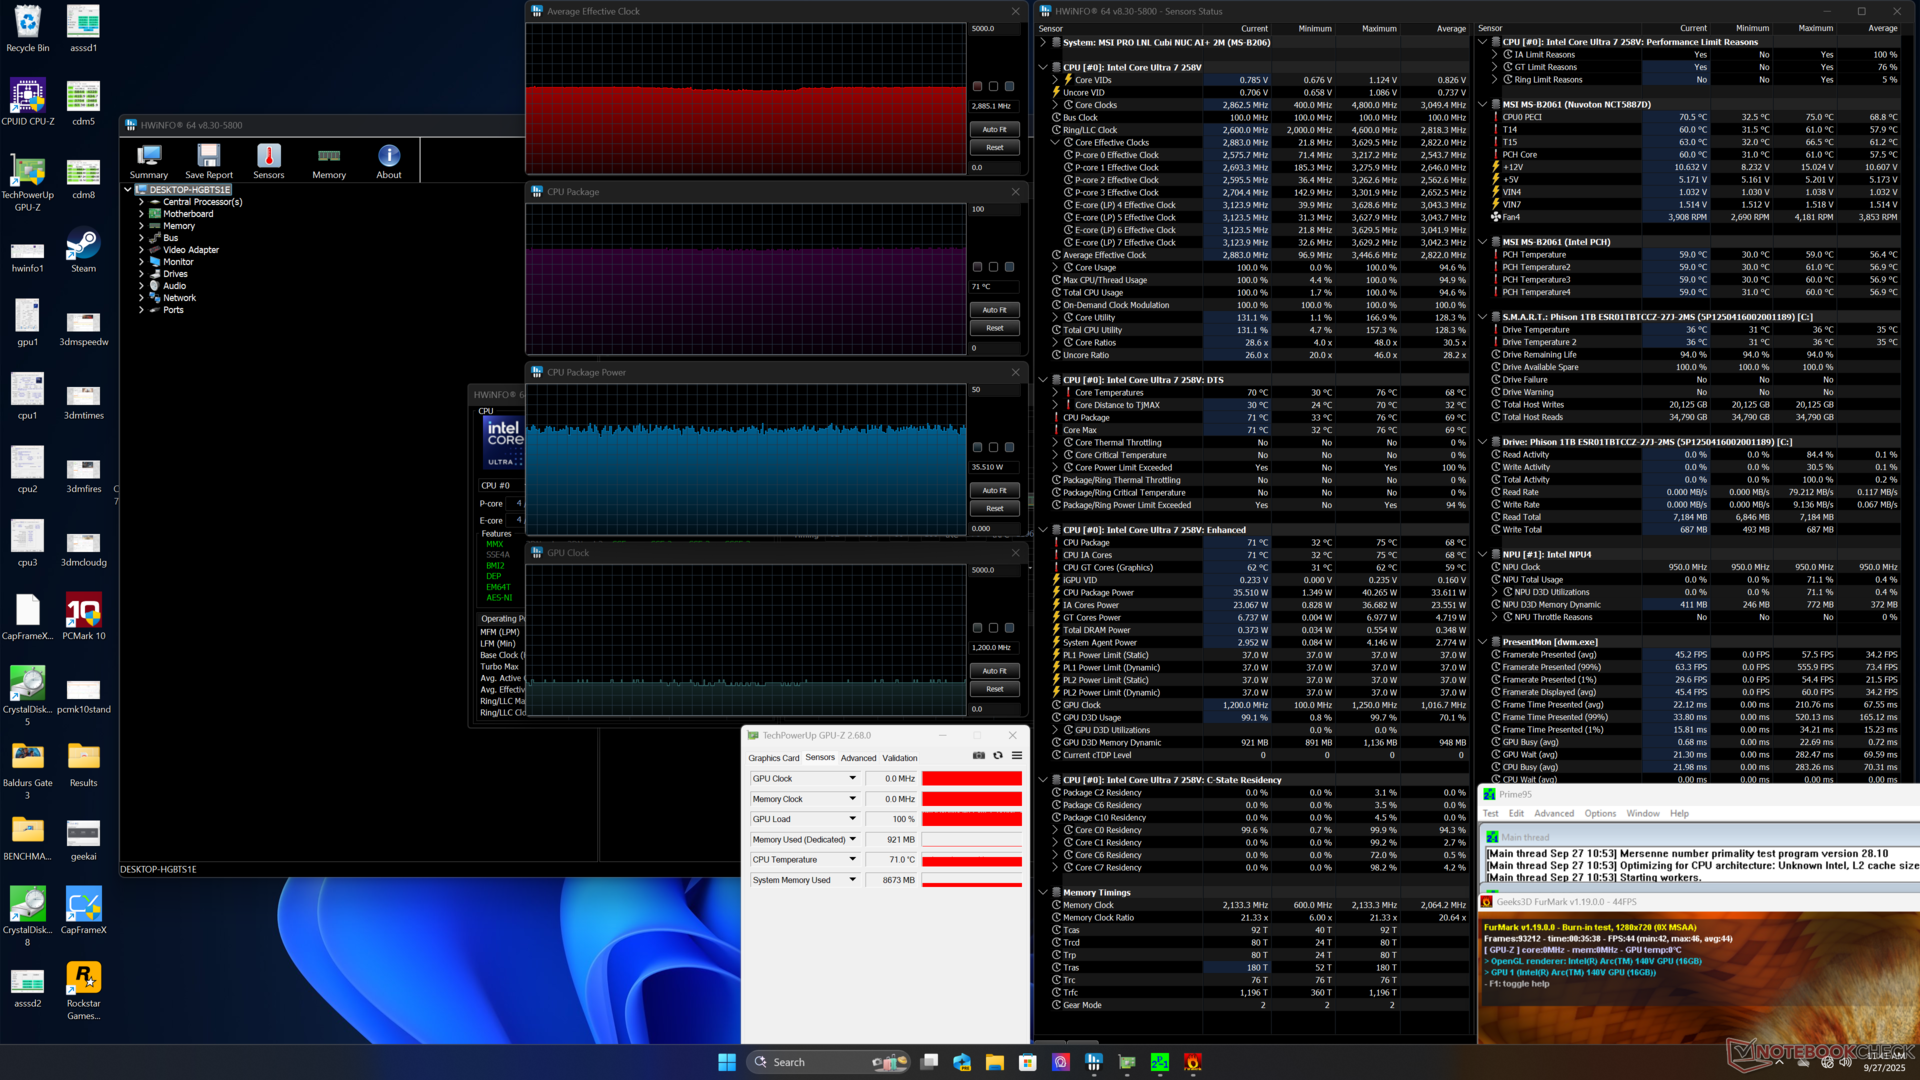
| Clock médio da CPU (GHz) | Clock da GPU (MHz) | Temperatura média da CPU (°C) | |
| Sistema ocioso | -- | -- | 33 |
| Estresse do Prime95 | 3.2 | -- | 66 |
| Prime95 + FurMark Stress | 2.9 | 1200 | 71 |
| Cyberpunk 2077 Stress | 1.3 | 800 - 1950 | 63 |
Desempenho do sistema
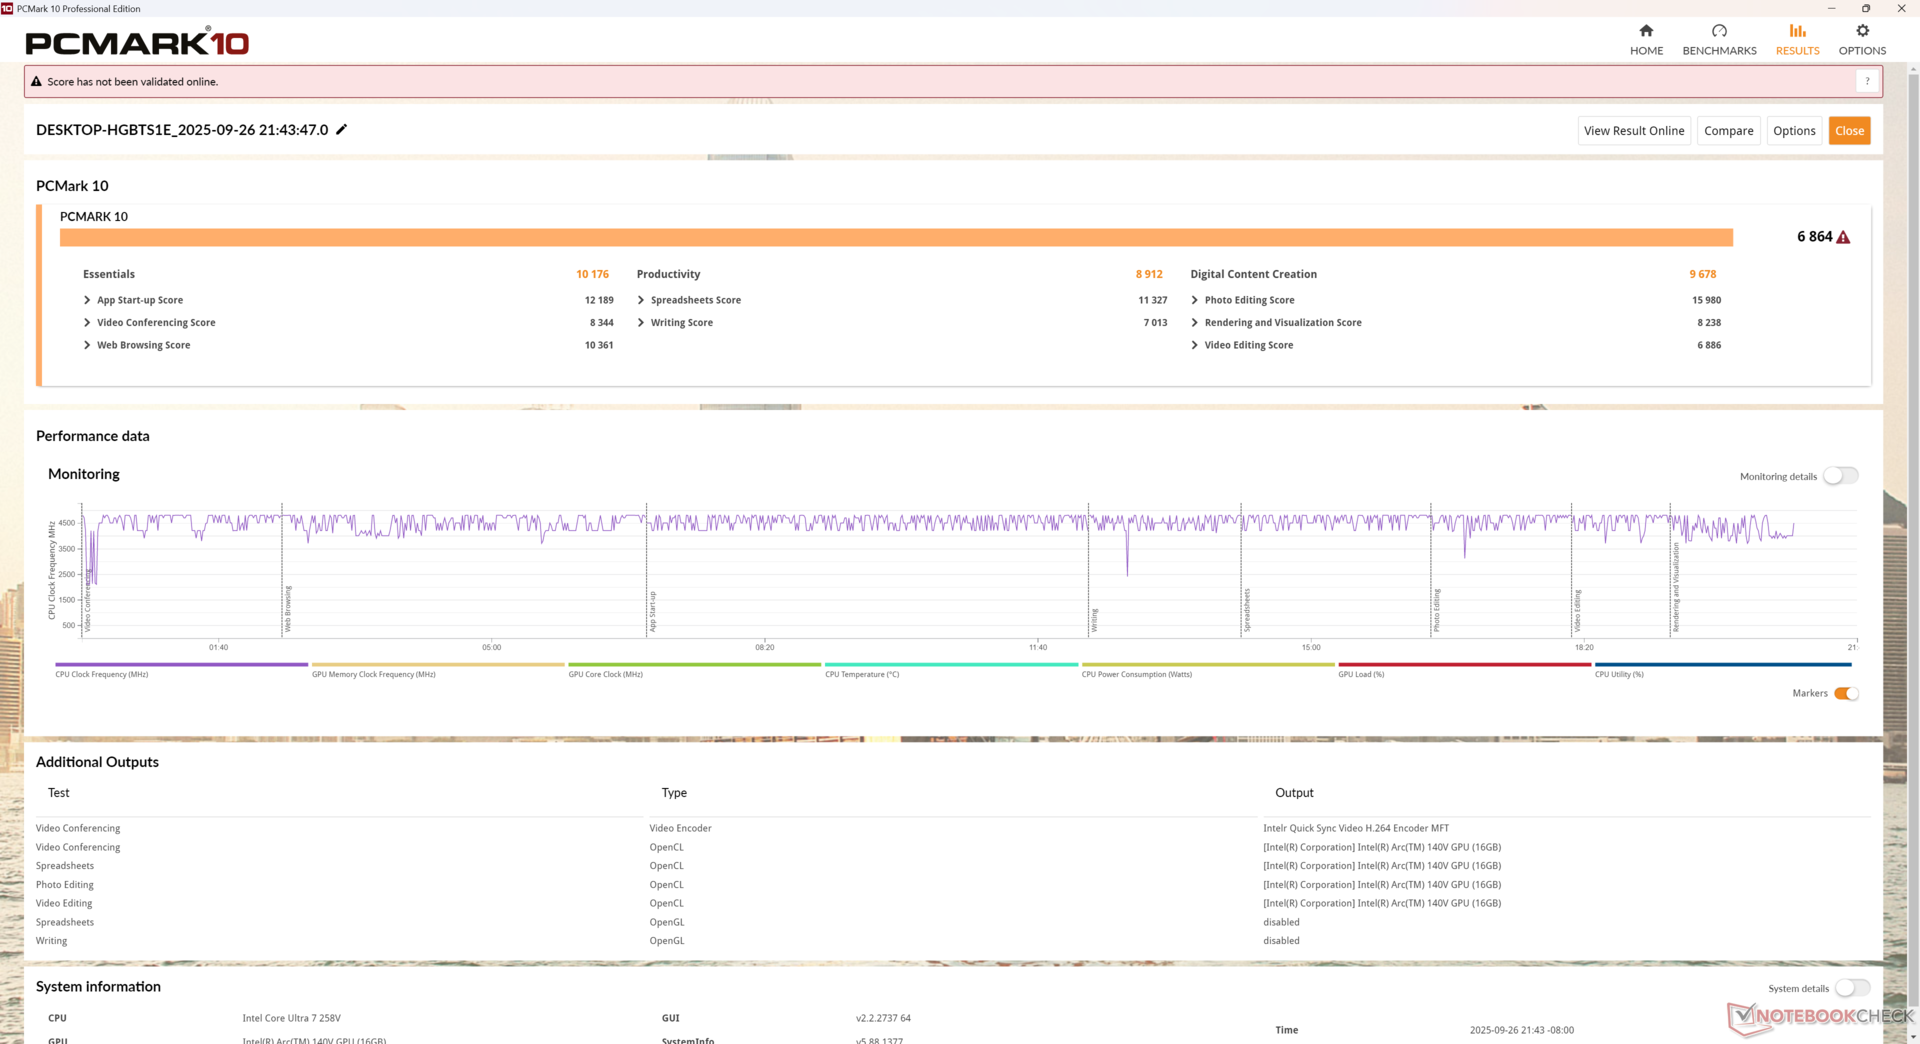
PCMark 10: Score | Essentials | Productivity | Digital Content Creation
CrossMark: Overall | Productivity | Creativity | Responsiveness
WebXPRT 3: Overall
WebXPRT 4: Overall
Mozilla Kraken 1.1: Total
| Performance rating | |
| Minisforum MS-A1 | |
| Beelink SER9 Pro | |
| GMK NucBox K12 | |
| Média Intel Core Ultra 7 258V, Intel Arc Graphics 140V | |
| MSI Cubi NUC 1M | |
| MSI Cubi NUC AI+ 2MG | |
| Ninkear M7, (16+512) | |
| PCMark 10 / Score | |
| Minisforum MS-A1 | |
| GMK NucBox K12 | |
| Média Intel Core Ultra 7 258V, Intel Arc Graphics 140V (6265 - 7420, n=23) | |
| Beelink SER9 Pro | |
| MSI Cubi NUC AI+ 2MG | |
| MSI Cubi NUC 1M | |
| Ninkear M7, (16+512) | |
| PCMark 10 / Essentials | |
| Minisforum MS-A1 | |
| MSI Cubi NUC 1M | |
| GMK NucBox K12 | |
| Beelink SER9 Pro | |
| Média Intel Core Ultra 7 258V, Intel Arc Graphics 140V (9295 - 11467, n=23) | |
| MSI Cubi NUC AI+ 2MG | |
| Ninkear M7, (16+512) | |
| PCMark 10 / Productivity | |
| Minisforum MS-A1 | |
| GMK NucBox K12 | |
| Beelink SER9 Pro | |
| Média Intel Core Ultra 7 258V, Intel Arc Graphics 140V (7357 - 13600, n=23) | |
| MSI Cubi NUC AI+ 2MG | |
| Ninkear M7, (16+512) | |
| MSI Cubi NUC 1M | |
| PCMark 10 / Digital Content Creation | |
| Minisforum MS-A1 | |
| Média Intel Core Ultra 7 258V, Intel Arc Graphics 140V (8160 - 10308, n=23) | |
| MSI Cubi NUC AI+ 2MG | |
| Beelink SER9 Pro | |
| GMK NucBox K12 | |
| MSI Cubi NUC 1M | |
| Ninkear M7, (16+512) | |
| CrossMark / Overall | |
| Minisforum MS-A1 | |
| Beelink SER9 Pro | |
| GMK NucBox K12 | |
| MSI Cubi NUC 1M | |
| Média Intel Core Ultra 7 258V, Intel Arc Graphics 140V (1275 - 1742, n=22) | |
| MSI Cubi NUC AI+ 2MG | |
| Ninkear M7, (16+512) | |
| CrossMark / Productivity | |
| Minisforum MS-A1 | |
| MSI Cubi NUC 1M | |
| Beelink SER9 Pro | |
| GMK NucBox K12 | |
| Média Intel Core Ultra 7 258V, Intel Arc Graphics 140V (1267 - 1684, n=22) | |
| MSI Cubi NUC AI+ 2MG | |
| Ninkear M7, (16+512) | |
| CrossMark / Creativity | |
| Minisforum MS-A1 | |
| Beelink SER9 Pro | |
| GMK NucBox K12 | |
| Média Intel Core Ultra 7 258V, Intel Arc Graphics 140V (1393 - 1977, n=22) | |
| MSI Cubi NUC AI+ 2MG | |
| MSI Cubi NUC 1M | |
| Ninkear M7, (16+512) | |
| CrossMark / Responsiveness | |
| MSI Cubi NUC 1M | |
| Beelink SER9 Pro | |
| Minisforum MS-A1 | |
| GMK NucBox K12 | |
| Média Intel Core Ultra 7 258V, Intel Arc Graphics 140V (999 - 1411, n=22) | |
| MSI Cubi NUC AI+ 2MG | |
| Ninkear M7, (16+512) | |
| WebXPRT 3 / Overall | |
| Minisforum MS-A1 | |
| MSI Cubi NUC AI+ 2MG | |
| MSI Cubi NUC 1M | |
| Beelink SER9 Pro | |
| GMK NucBox K12 | |
| Média Intel Core Ultra 7 258V, Intel Arc Graphics 140V (219 - 317, n=22) | |
| Ninkear M7, (16+512) | |
| WebXPRT 4 / Overall | |
| MSI Cubi NUC AI+ 2MG | |
| Minisforum MS-A1 | |
| MSI Cubi NUC 1M | |
| Média Intel Core Ultra 7 258V, Intel Arc Graphics 140V (199.5 - 291, n=22) | |
| Beelink SER9 Pro | |
| GMK NucBox K12 | |
| Ninkear M7, (16+512) | |
| Mozilla Kraken 1.1 / Total | |
| Ninkear M7, (16+512) | |
| GMK NucBox K12 | |
| Beelink SER9 Pro | |
| MSI Cubi NUC 1M | |
| Média Intel Core Ultra 7 258V, Intel Arc Graphics 140V (468 - 559, n=24) | |
| Minisforum MS-A1 | |
| MSI Cubi NUC AI+ 2MG | |
* ... menor é melhor
| PCMark 10 Score | 6864 pontos | |
Ajuda | ||
| AIDA64 / Memory Copy | |
| Média Intel Core Ultra 7 258V (104408 - 114336, n=24) | |
| MSI Cubi NUC AI+ 2MG | |
| Beelink SER9 Pro | |
| GMK NucBox K12 | |
| Minisforum MS-A1 | |
| MSI Cubi NUC 1M | |
| Ninkear M7, (16+512) | |
| AIDA64 / Memory Read | |
| MSI Cubi NUC AI+ 2MG | |
| Média Intel Core Ultra 7 258V (82846 - 89417, n=24) | |
| MSI Cubi NUC 1M | |
| Minisforum MS-A1 | |
| GMK NucBox K12 | |
| Beelink SER9 Pro | |
| Ninkear M7, (16+512) | |
| AIDA64 / Memory Write | |
| MSI Cubi NUC AI+ 2MG | |
| Média Intel Core Ultra 7 258V (108824 - 117989, n=24) | |
| Beelink SER9 Pro | |
| GMK NucBox K12 | |
| Minisforum MS-A1 | |
| MSI Cubi NUC 1M | |
| Ninkear M7, (16+512) | |
| AIDA64 / Memory Latency | |
| Beelink SER9 Pro | |
| Média Intel Core Ultra 7 258V (95 - 101.7, n=24) | |
| MSI Cubi NUC AI+ 2MG | |
| Ninkear M7, (16+512) | |
| GMK NucBox K12 | |
| Minisforum MS-A1 | |
| MSI Cubi NUC 1M | |
* ... menor é melhor
Latência DPC
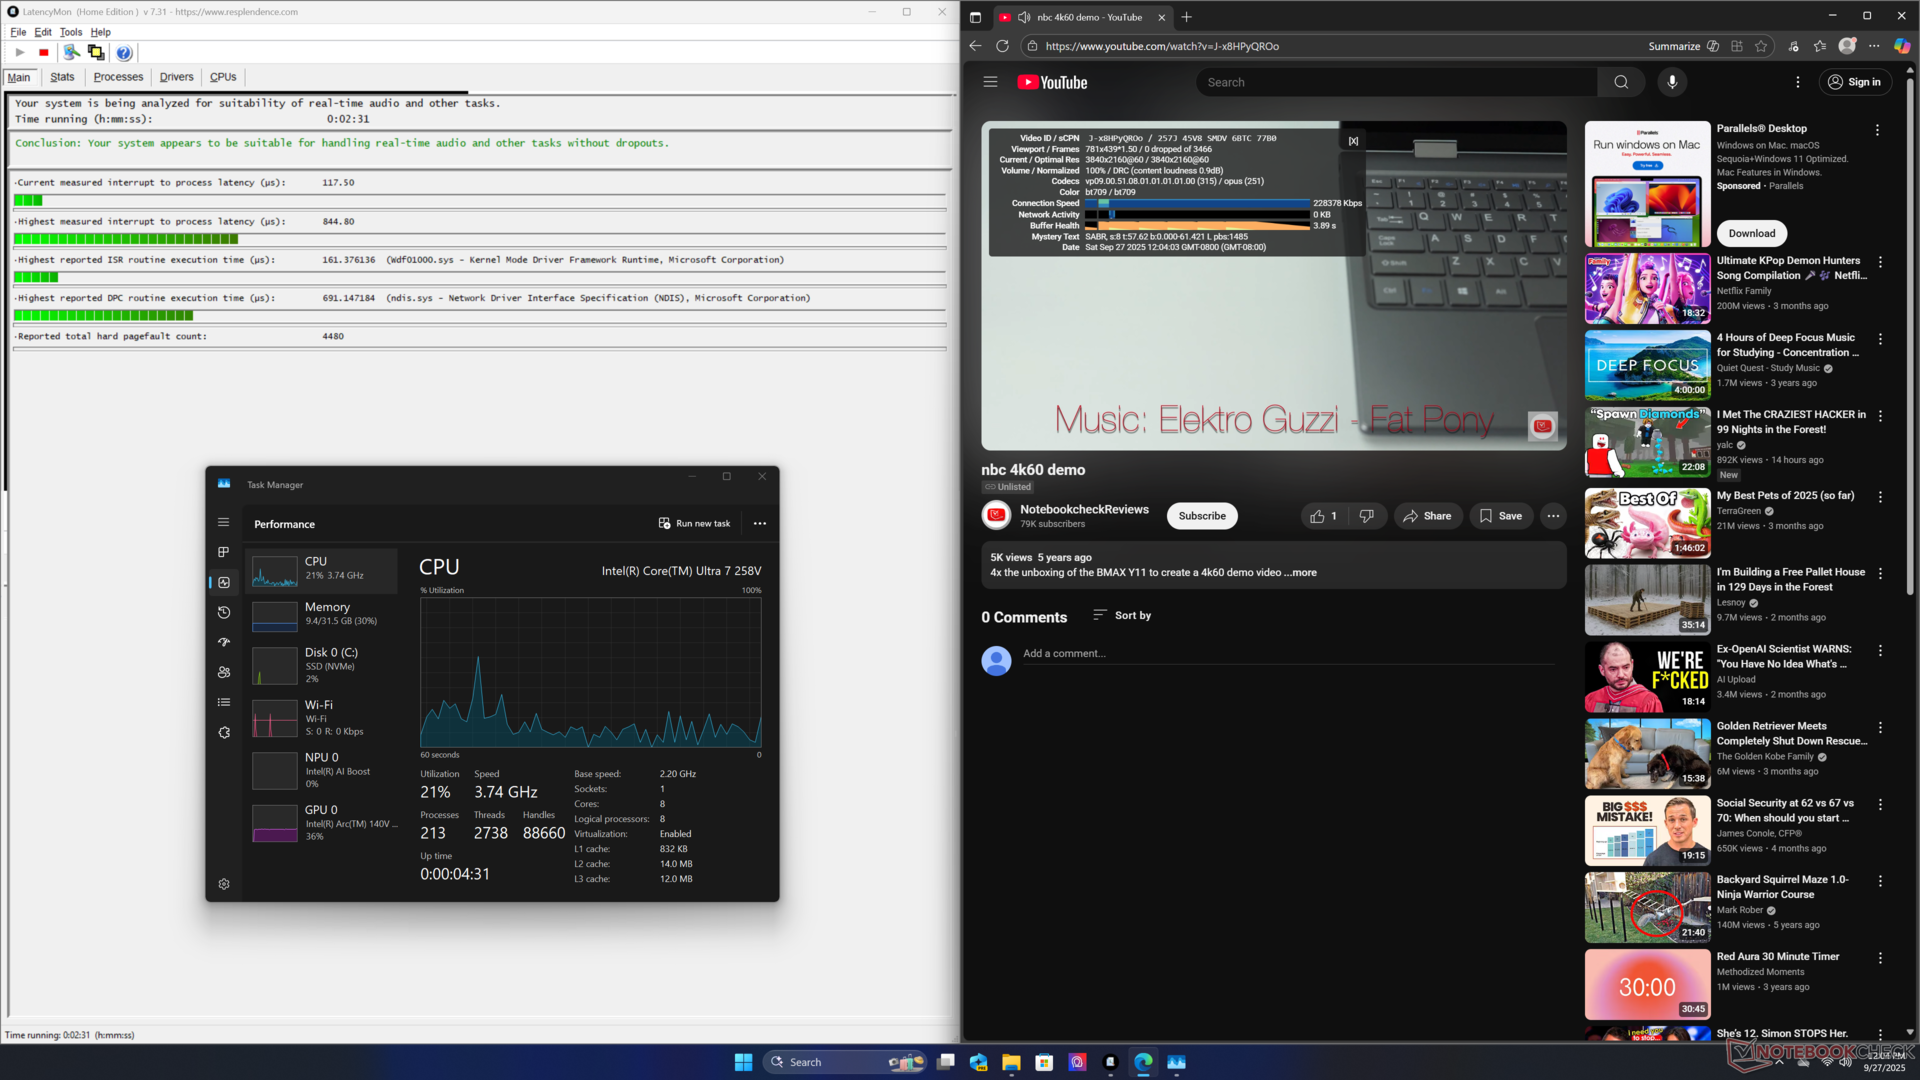
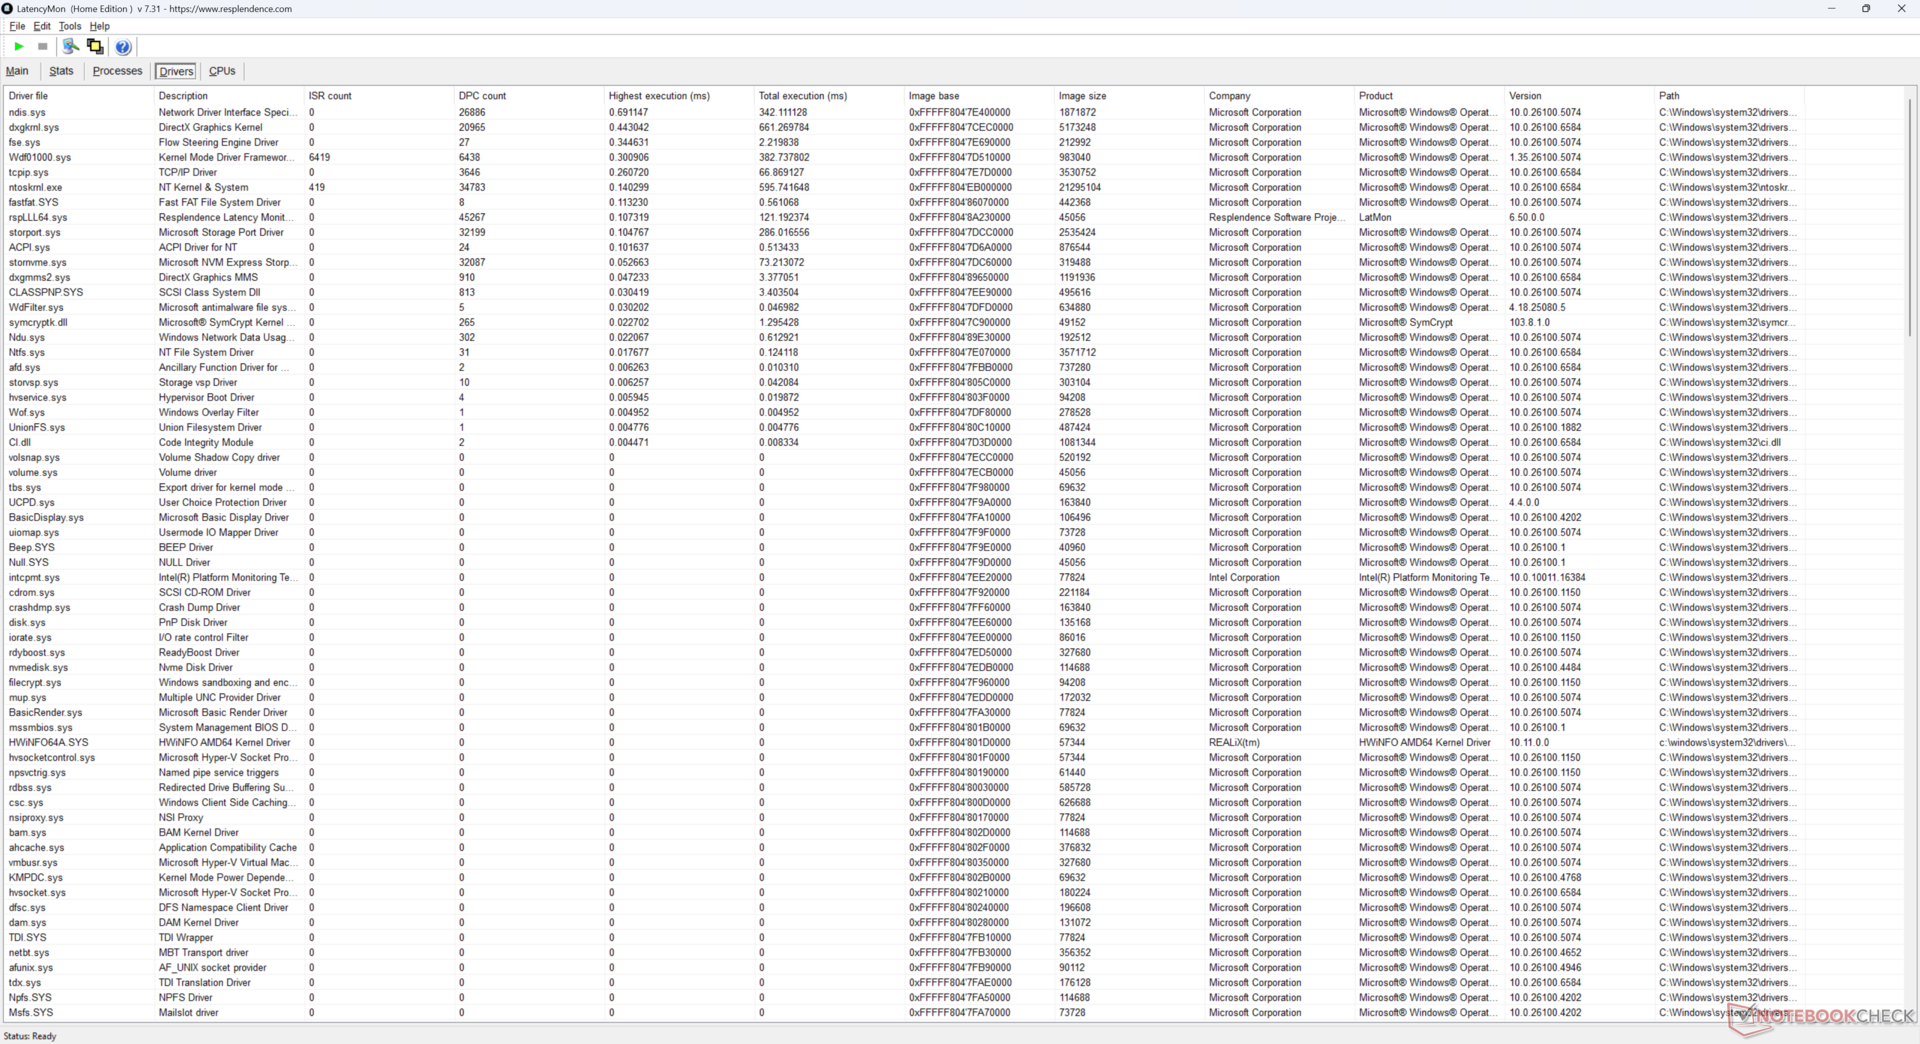
| DPC Latencies / LatencyMon - interrupt to process latency (max), Web, Youtube, Prime95 | |
| MSI Cubi NUC 1M | |
| Minisforum MS-A1 | |
| GMK NucBox K12 | |
| MSI Cubi NUC AI+ 2MG | |
| Beelink SER9 Pro | |
* ... menor é melhor
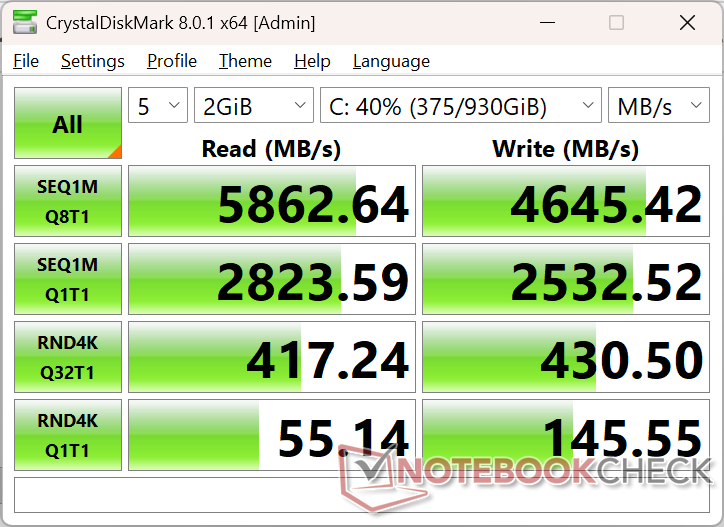
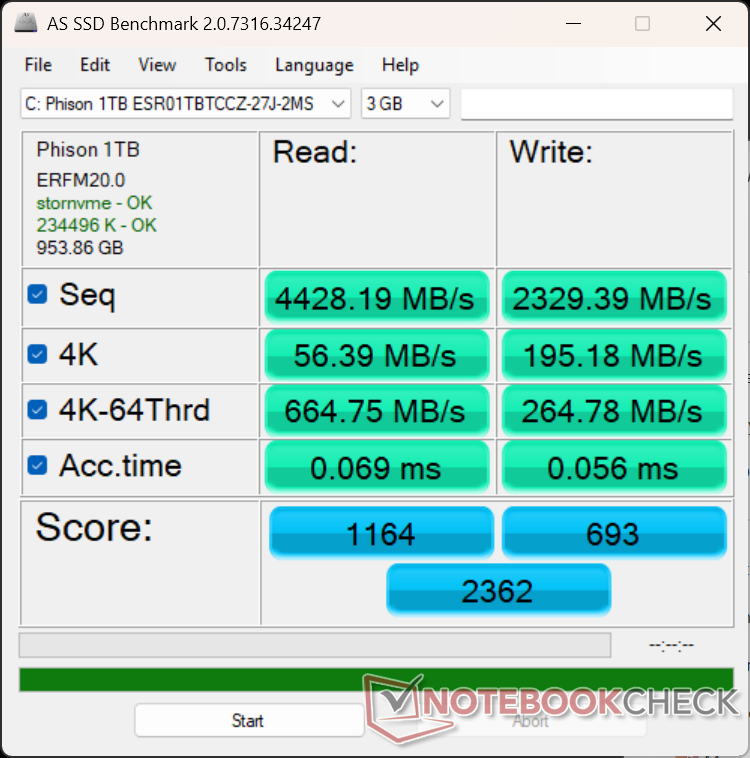
Dispositivos de armazenamento
Taxas de transferência de SSD com o phison primário de 1 TB são estáveis em quase 5900 MB/s, mesmo sob estresse prolongado, o que representa uma ligeira melhora em relação ao SSD da WD no Cubi 1M original.

| Drive Performance rating - Percent | |
| Minisforum MS-A1 | |
| MSI Cubi NUC 1M | |
| Beelink SER9 Pro | |
| MSI Cubi NUC AI+ 2MG | |
| GMK NucBox K12 | |
| Ninkear M7, (16+512) | |
* ... menor é melhor
Limitação de disco: Loop de leitura do DiskSpd, profundidade da fila 8
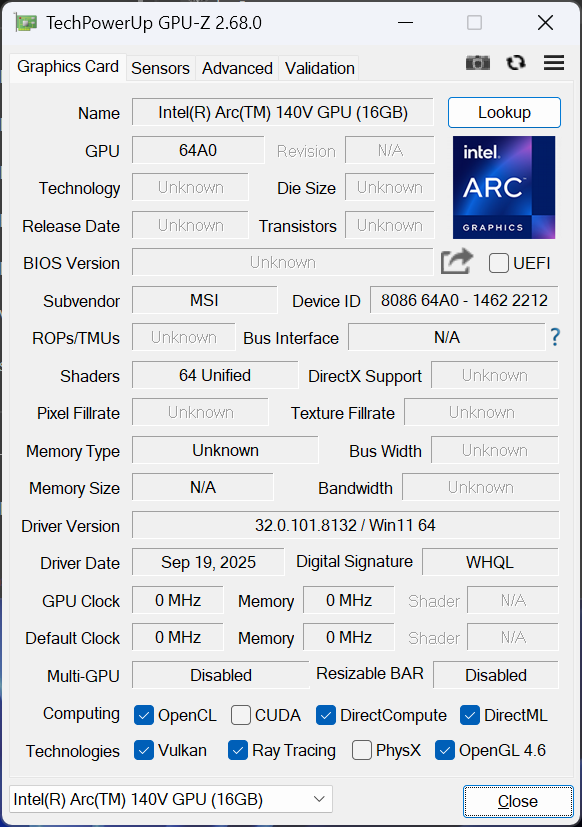
Desempenho da GPU
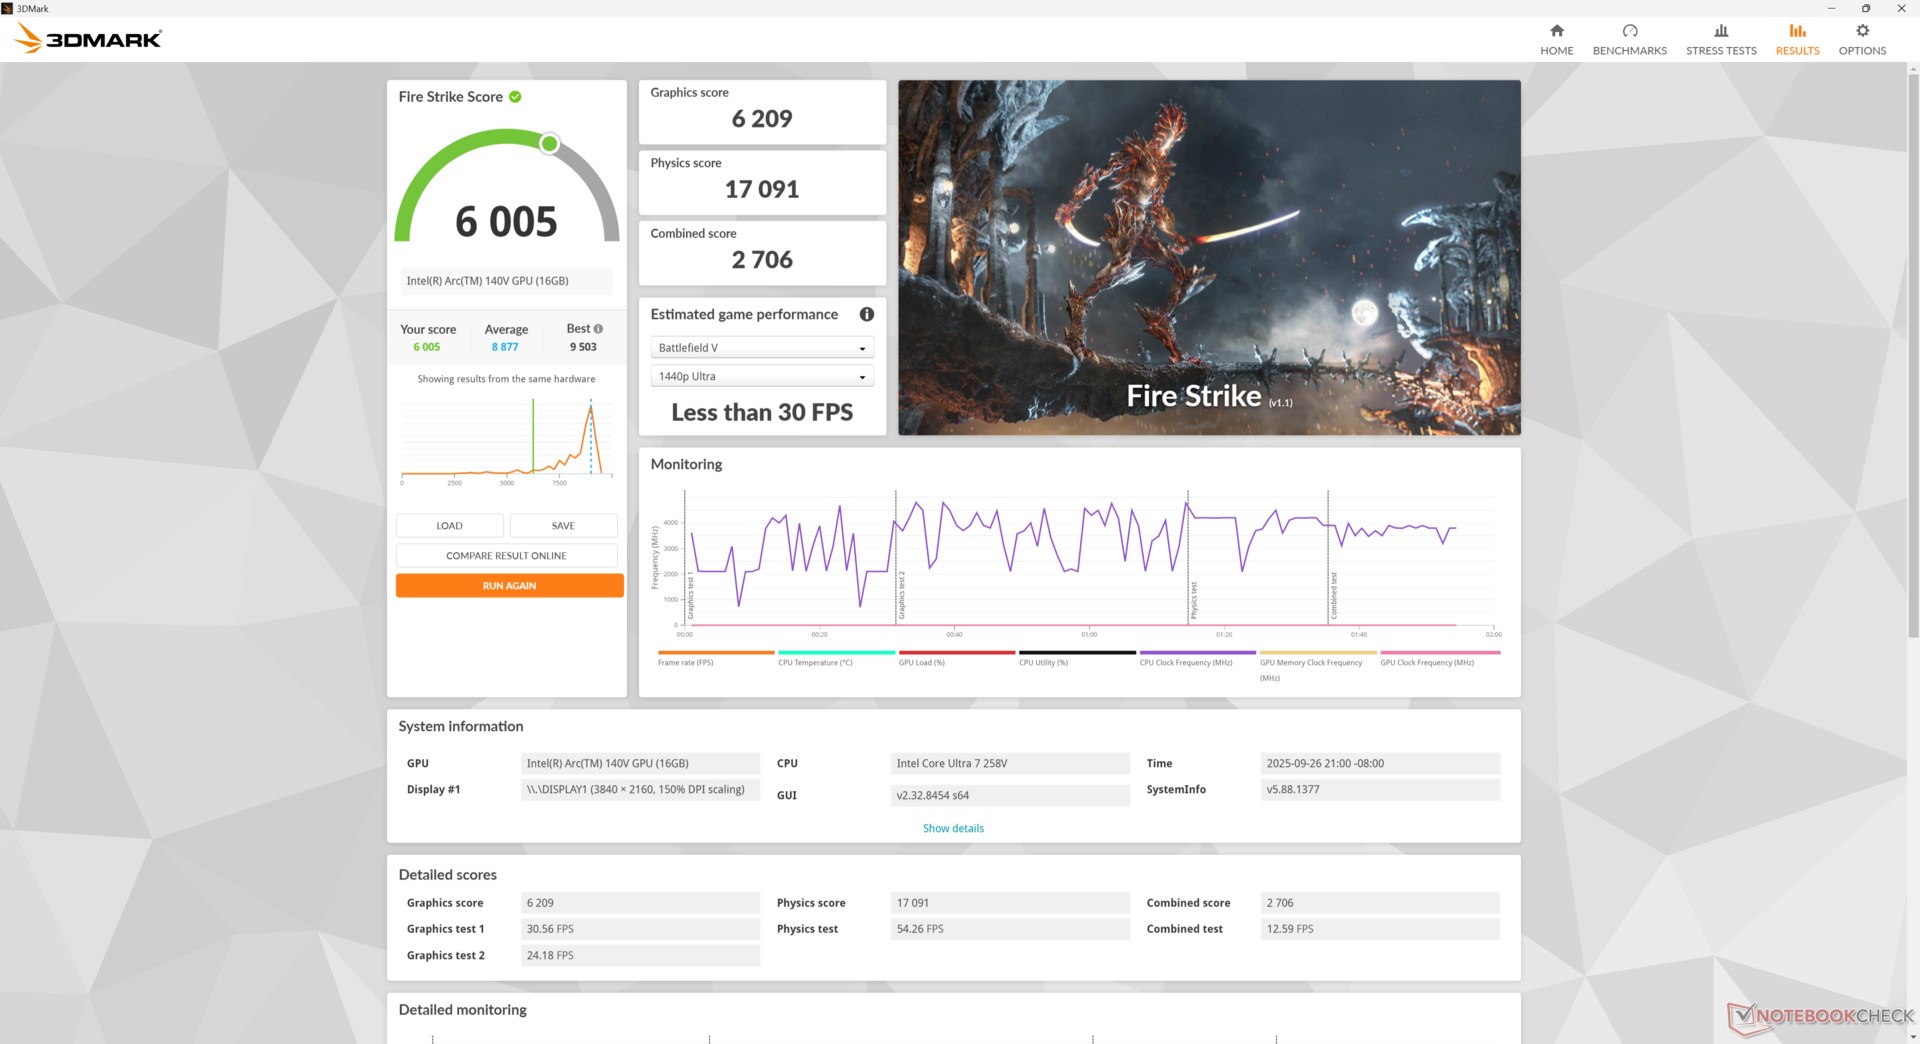
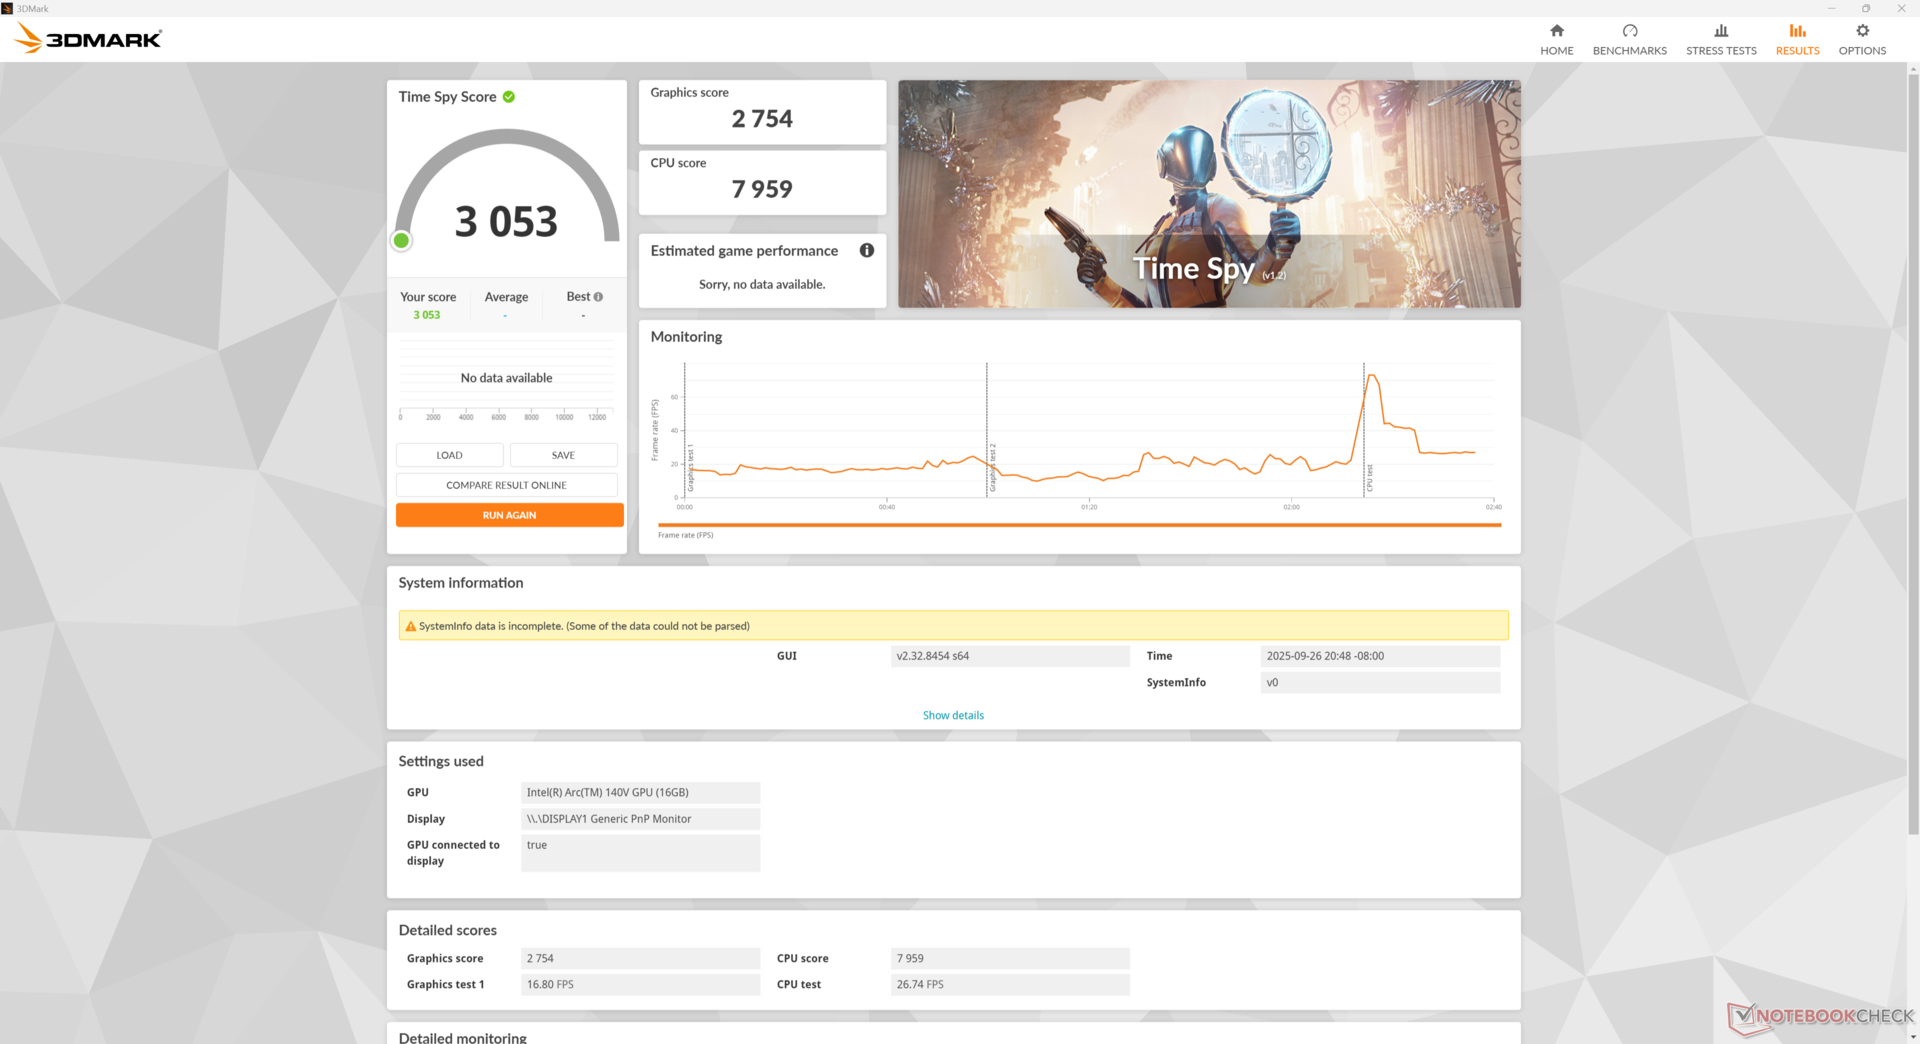
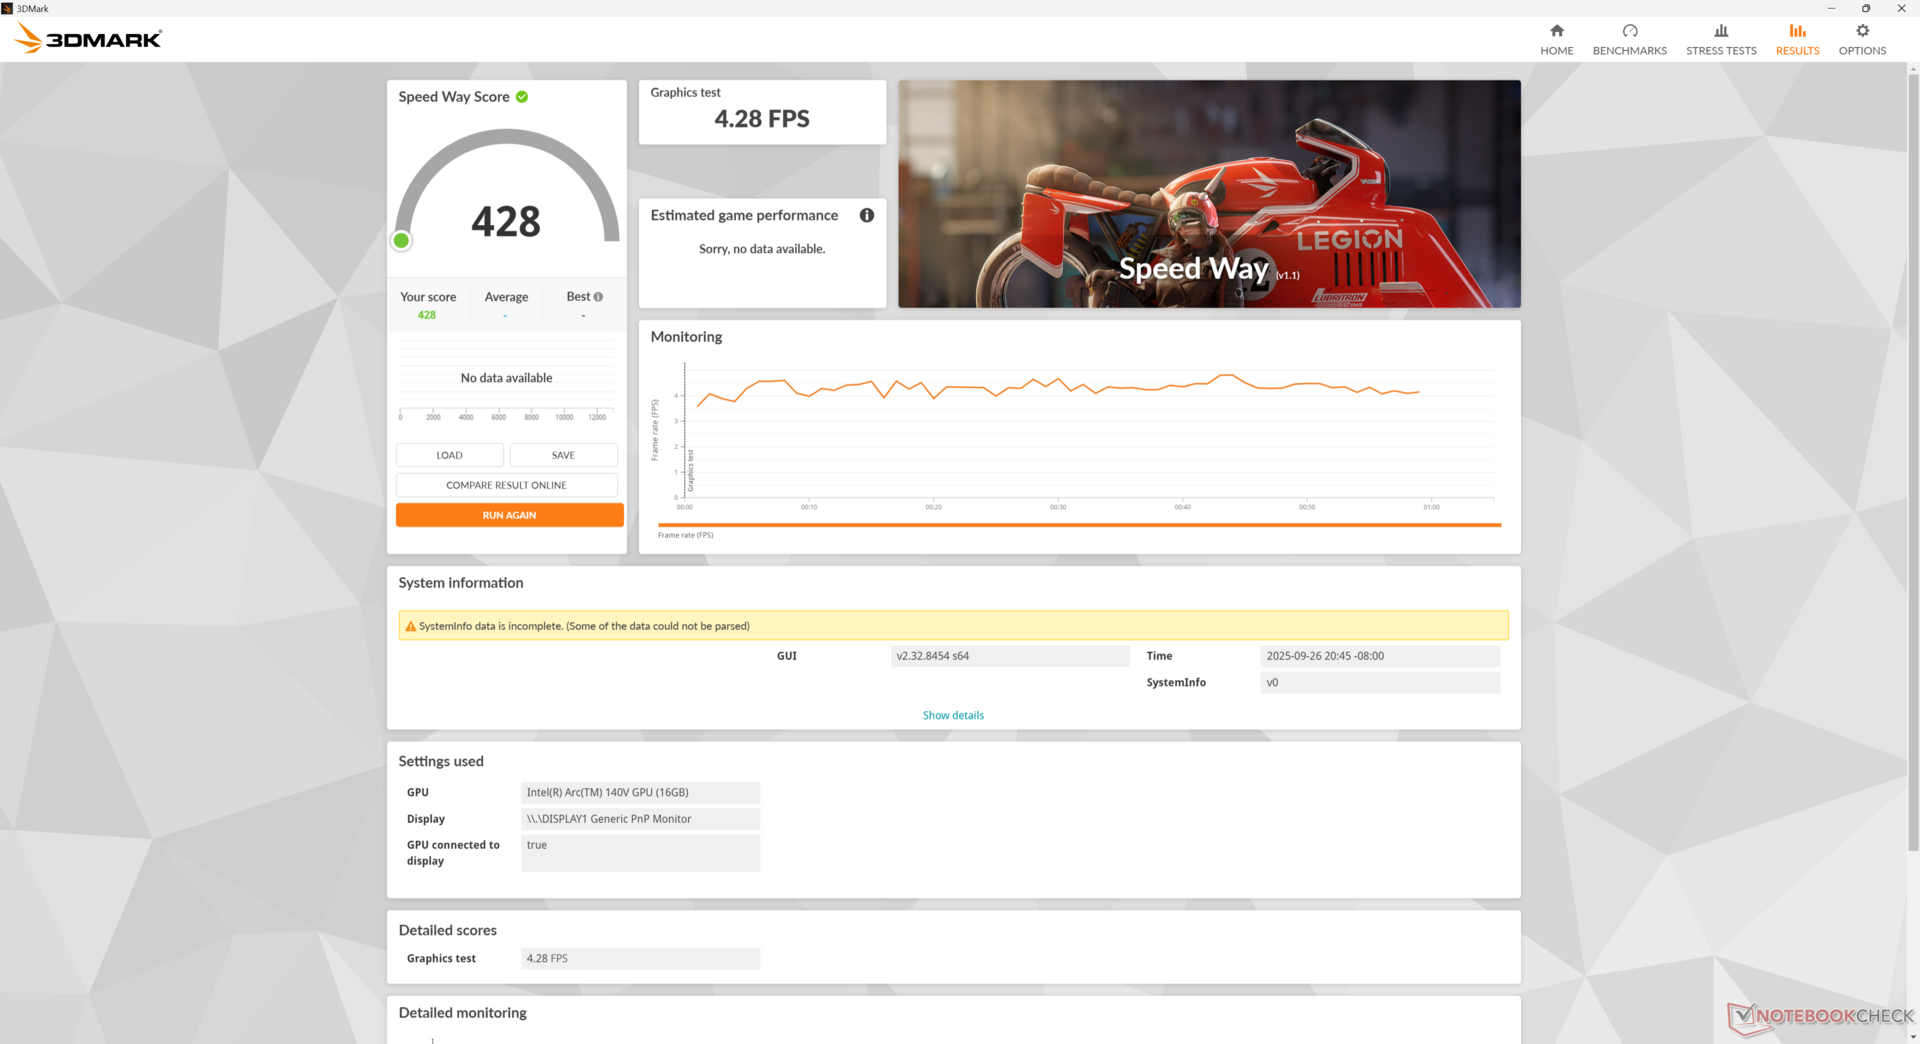
O Arc 140V no Cubi 2MG tem desempenho abaixo da média em cerca de 35%, de acordo com os benchmarks do 3DMark. Os resultados decepcionantes devem-se ao ciclo das taxas de clock da GPU e à gagueira, conforme mencionado na seção Teste de estresse acima.
Em cargas de trabalho da GPU em que as taxas de quadros estáveis podem não ser importantes, como com renderizadores ou oneAPI, o Cubi 2MG tem o desempenho esperado em relação a outros PCs com a mesma CPU e GPU. Portanto, a gagueira não deve ser um problema para a maioria dos profissionais-alvo.
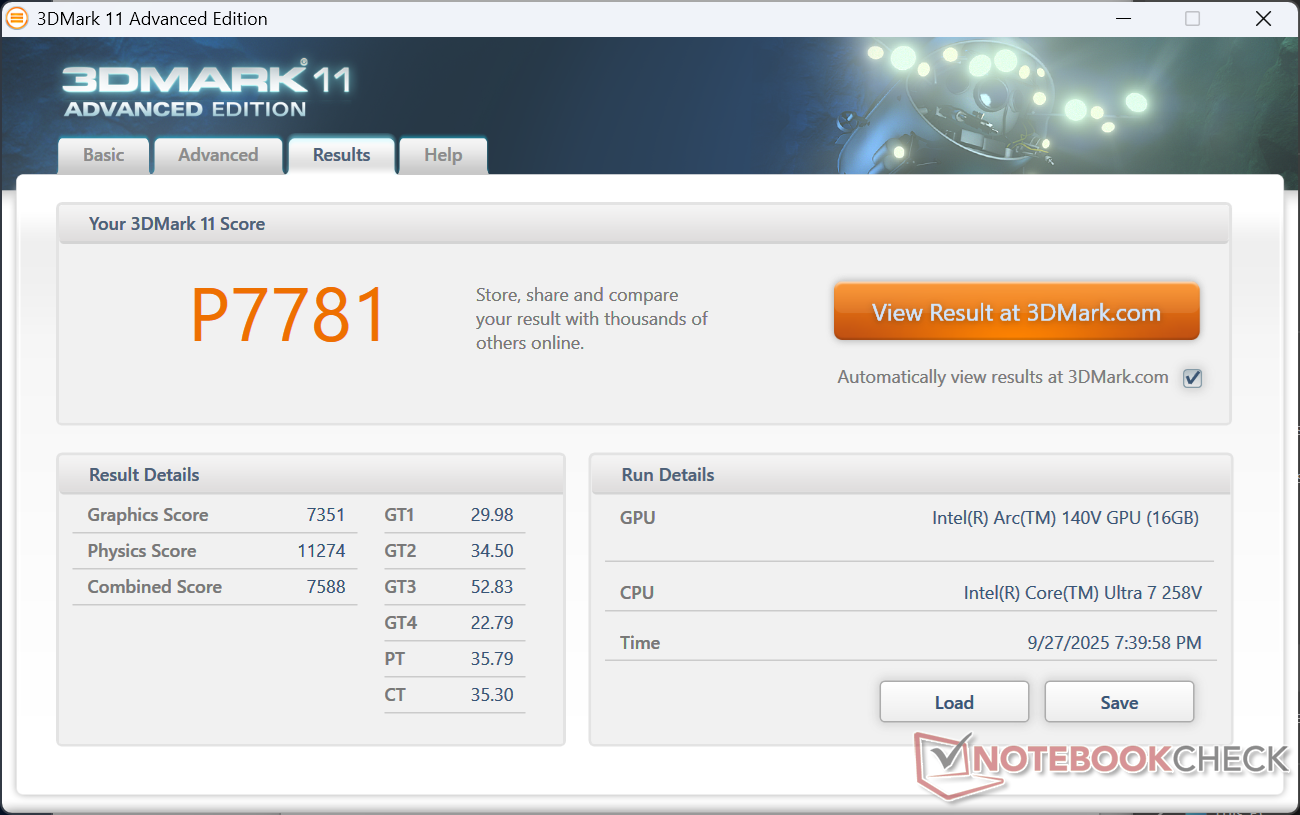
| 3DMark 11 Performance | 7781 pontos | |
| 3DMark Cloud Gate Standard Score | 31534 pontos | |
| 3DMark Fire Strike Score | 6005 pontos | |
| 3DMark Time Spy Score | 3053 pontos | |
Ajuda | ||
* ... menor é melhor
| Performance rating - Percent | |
| Beelink SER9 Pro | |
| Minisforum MS-A1 -1! | |
| GMK NucBox K12 | |
| MSI Cubi NUC AI+ 2MG | |
| MSI Cubi NUC 1M -2! | |
| Ninkear M7, (16+512) -2! | |
| Cyberpunk 2077 - 1920x1080 Ultra Preset (FSR off) | |
| GMK NucBox K12 | |
| Minisforum MS-A1 | |
| Beelink SER9 Pro | |
| MSI Cubi NUC AI+ 2MG | |
| MSI Cubi NUC 1M | |
| Ninkear M7, (16+512) | |
| Baldur's Gate 3 - 1920x1080 Ultra Preset AA:T | |
| Beelink SER9 Pro | |
| GMK NucBox K12 | |
| MSI Cubi NUC AI+ 2MG | |
| Minisforum MS-A1 | |
| GTA V - 1920x1080 Highest AA:4xMSAA + FX AF:16x | |
| Beelink SER9 Pro | |
| GMK NucBox K12 | |
| MSI Cubi NUC AI+ 2MG | |
| Minisforum MS-A1 | |
| MSI Cubi NUC 1M | |
| Ninkear M7, (16+512) | |
| Final Fantasy XV Benchmark - 1920x1080 High Quality | |
| Beelink SER9 Pro | |
| MSI Cubi NUC AI+ 2MG | |
| Minisforum MS-A1 | |
| GMK NucBox K12 | |
| MSI Cubi NUC 1M | |
| Ninkear M7, (16+512) | |
| Strange Brigade - 1920x1080 ultra AA:ultra AF:16 | |
| MSI Cubi NUC AI+ 2MG | |
| Beelink SER9 Pro | |
| GMK NucBox K12 | |
| MSI Cubi NUC 1M | |
| Dota 2 Reborn - 1920x1080 ultra (3/3) best looking | |
| Minisforum MS-A1 | |
| GMK NucBox K12 | |
| Beelink SER9 Pro | |
| MSI Cubi NUC AI+ 2MG | |
| MSI Cubi NUC 1M | |
| Ninkear M7, (16+512) | |
| X-Plane 11.11 - 1920x1080 high (fps_test=3) | |
| Minisforum MS-A1 | |
| GMK NucBox K12 | |
| Beelink SER9 Pro | |
| MSI Cubi NUC AI+ 2MG | |
| Ninkear M7, (16+512) | |
| F1 24 | |
| 1280x720 Ultra Low Preset AA:T | |
| MSI Cubi NUC AI+ 2MG | |
| Média Intel Arc Graphics 140V (n=1) | |
| 1920x1080 Low Preset AA:T AF:16x | |
| Minisforum MS-A1 | |
| Beelink SER9 Pro | |
| Média Intel Arc Graphics 140V (54 - 99, n=25) | |
| MSI Cubi NUC AI+ 2MG | |
| Asus NUC 14 Pro+ | |
| Ninkear M7, (16+512) | |
| 1920x1080 Medium Preset AA:T AF:16x | |
| Minisforum MS-A1 | |
| Média Intel Arc Graphics 140V (49.2 - 88.2, n=24) | |
| Beelink SER9 Pro | |
| Asus NUC 14 Pro+ | |
| Ninkear M7, (16+512) | |
| 1920x1080 High Preset AA:T AF:16x | |
| Minisforum MS-A1 | |
| Média Intel Arc Graphics 140V (34.4 - 66.4, n=27) | |
| Beelink SER9 Pro | |
| MSI Cubi NUC AI+ 2MG | |
| Asus NUC 14 Pro+ | |
| Ninkear M7, (16+512) | |
| 1920x1080 Ultra High Preset AA:T AF:16x | |
| Média Intel Arc Graphics 140V (14.6 - 22, n=25) | |
| MSI Cubi NUC AI+ 2MG | |
| Minisforum MS-A1 | |
| Beelink SER9 Pro | |
As taxas de quadros quando em marcha lenta no Cyberpunk 2077 em configurações Ultra de 1080p oscilavam entre 18 e 26, ao passo que repetir esse teste no NucBox K12 resultaria em uma taxa de quadros média mais estável de 23. Essa gagueira também ocorria ao executar outros jogos em nosso teste.
Gráfico de ultra FPS do Cyberpunk 2077
| baixo | média | alto | ultra | |
|---|---|---|---|---|
| GTA V (2015) | 160.4 | 152.4 | 63.6 | 26.6 |
| Dota 2 Reborn (2015) | 98.1 | 80.4 | 59.9 | 65.8 |
| Final Fantasy XV Benchmark (2018) | 71.3 | 39.1 | 28.7 | |
| X-Plane 11.11 (2018) | 51.8 | 41.7 | 36 | |
| Strange Brigade (2018) | 240 | 71.8 | 59.7 | 57.3 |
| Baldur's Gate 3 (2023) | 36.1 | 29.5 | 29 | 26.7 |
| Cyberpunk 2077 (2023) | 33.9 | 26.6 | 23.2 | 19.4 |
| F1 24 (2024) | 72 | 53.8 | 16.6 |
Emissões
Ruído do sistema
O ruído do ventilador fica em torno de 25 dB(A) no modo Silent ou 36 dB(A) relativamente alto no modo Performance. Em geral, o sistema é mais barulhento do que o observado no antigo Cubi 1M.
Barulho
| Ocioso |
| 28 / 36.1 / 36.1 dB |
| Carga |
| 38.9 / 49.2 dB |
 | ||
30 dB silencioso 40 dB(A) audível 50 dB(A) ruidosamente alto |
||
min: | ||
| MSI Cubi NUC AI+ 2MG Arc 140V, Core Ultra 7 258V, Phison 1 TB ESR01TBTCCZ-27J | MSI Cubi NUC 1M Iris Xe G7 96EUs, Core 7 150U, WD PC SN560 SDDPNQE-1T00 | GMK NucBox K12 Radeon 780M, Ryzen 7 H 255, Crucial P3 Plus CT1000P3PSSD8 | Beelink SER9 Pro Radeon 780M, Ryzen 7 H 255, Crucial P3 Plus CT1000P3PSSD8 | Ninkear M7, (16+512) Vega 7, R5 7430U, Faspeed P8-512G-SE | Minisforum MS-A1 Radeon 780M, R7 8700G, Kingston OM8PGP41024Q-A0 | |
|---|---|---|---|---|---|---|
| Noise | 7% | -4% | 12% | 19% | -3% | |
| desligado / ambiente * (dB) | 24.8 | 23.5 5% | 23.5 5% | 23 7% | 24.8 -0% | 24.8 -0% |
| Idle Minimum * (dB) | 28 | 29.9 -7% | 35.4 -26% | 29.1 -4% | 25.3 10% | 33.9 -21% |
| Idle Average * (dB) | 36.1 | 29.9 17% | 35.4 2% | 30.1 17% | 25.7 29% | 34 6% |
| Idle Maximum * (dB) | 36.1 | 32 11% | 39 -8% | 31.7 12% | 25.7 29% | 34 6% |
| Load Average * (dB) | 38.9 | 33.5 14% | 42.4 -9% | 33.7 13% | 33.6 14% | 41.1 -6% |
| Cyberpunk 2077 ultra * (dB) | 37 | 39.1 -6% | 40.4 -9% | 33.8 9% | 28.7 22% | 42.2 -14% |
| Load Maximum * (dB) | 49.2 | 40.5 18% | 41.4 16% | 35.2 28% | 34.3 30% | 46.2 6% |
| Witcher 3 ultra * (dB) | 28.8 |
* ... menor é melhor
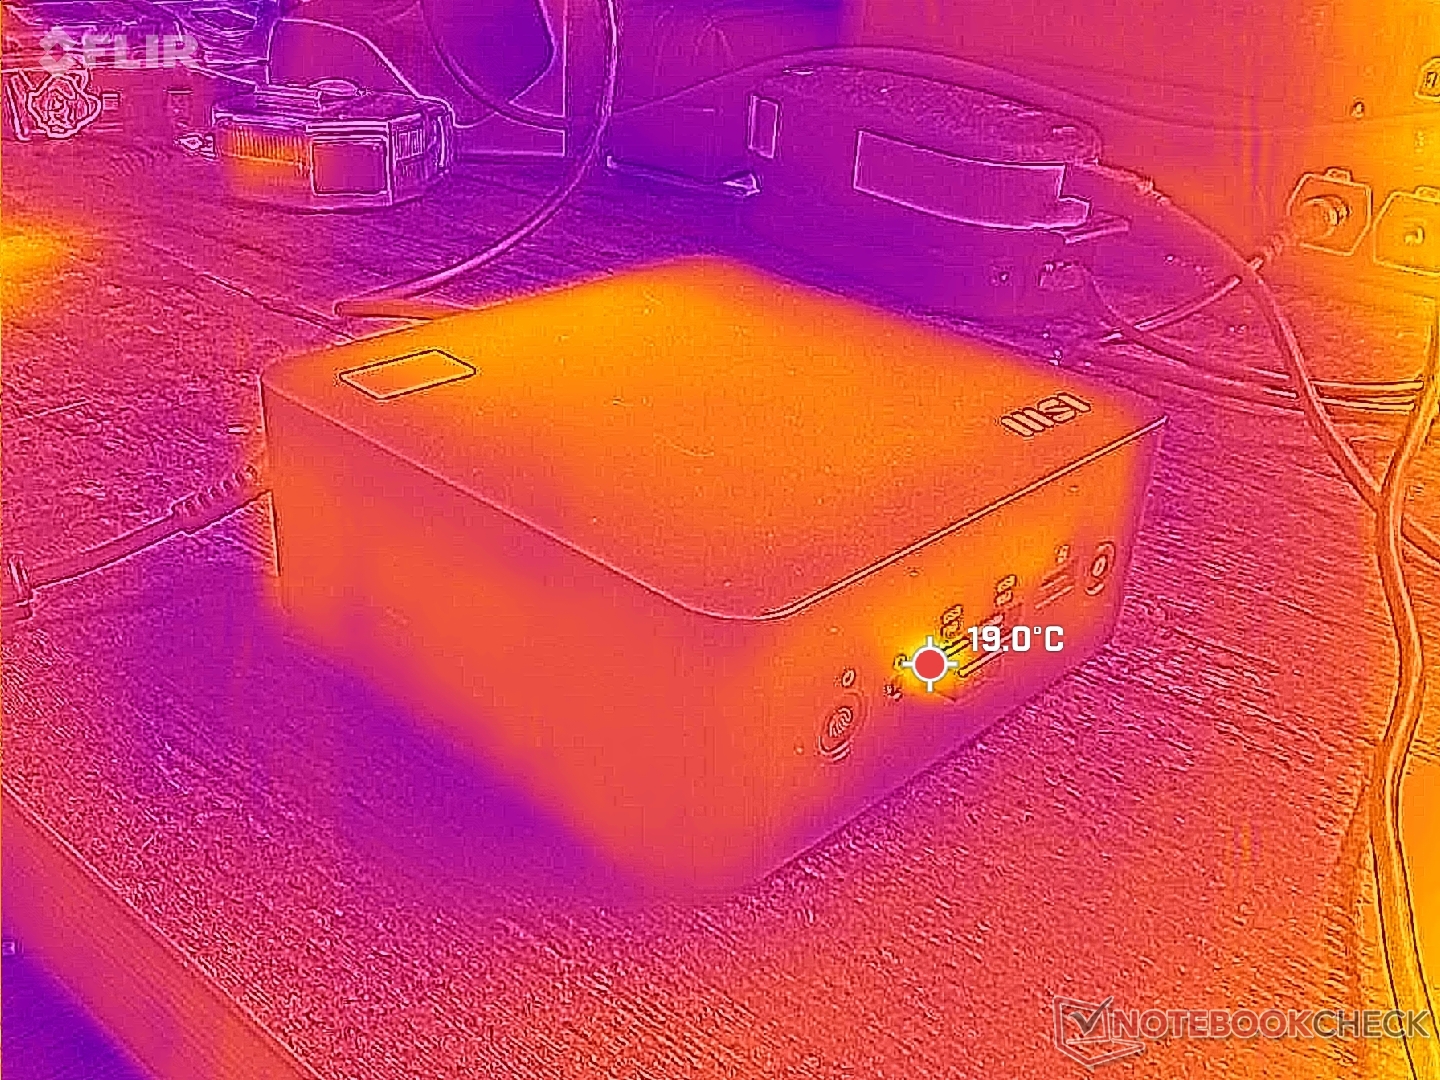
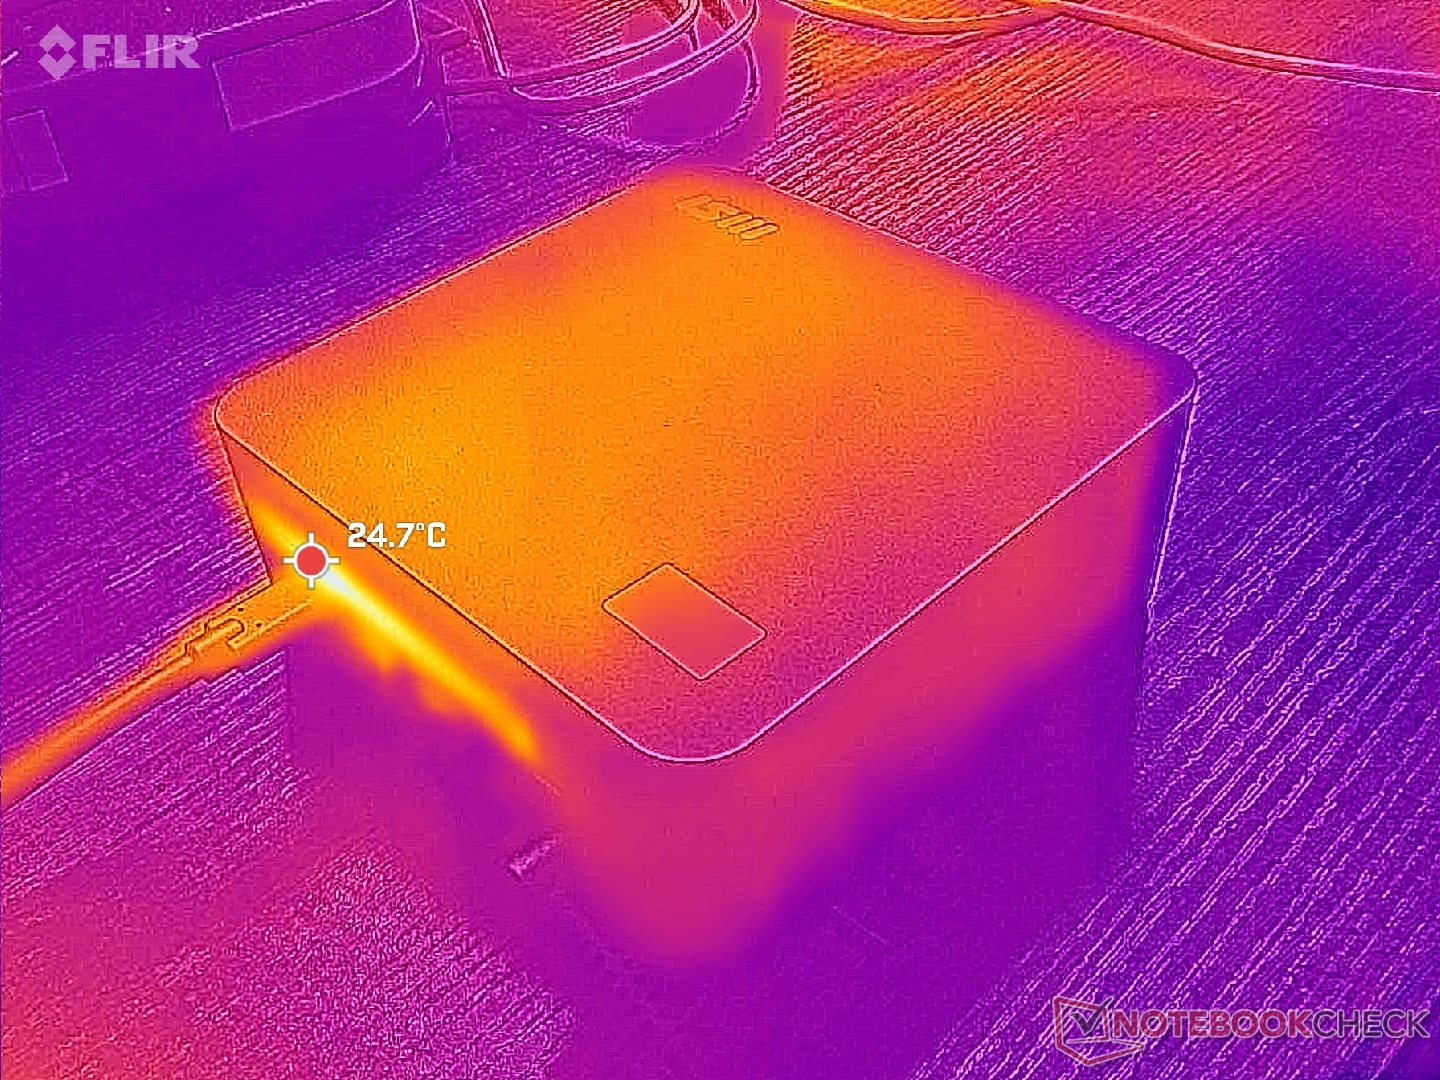
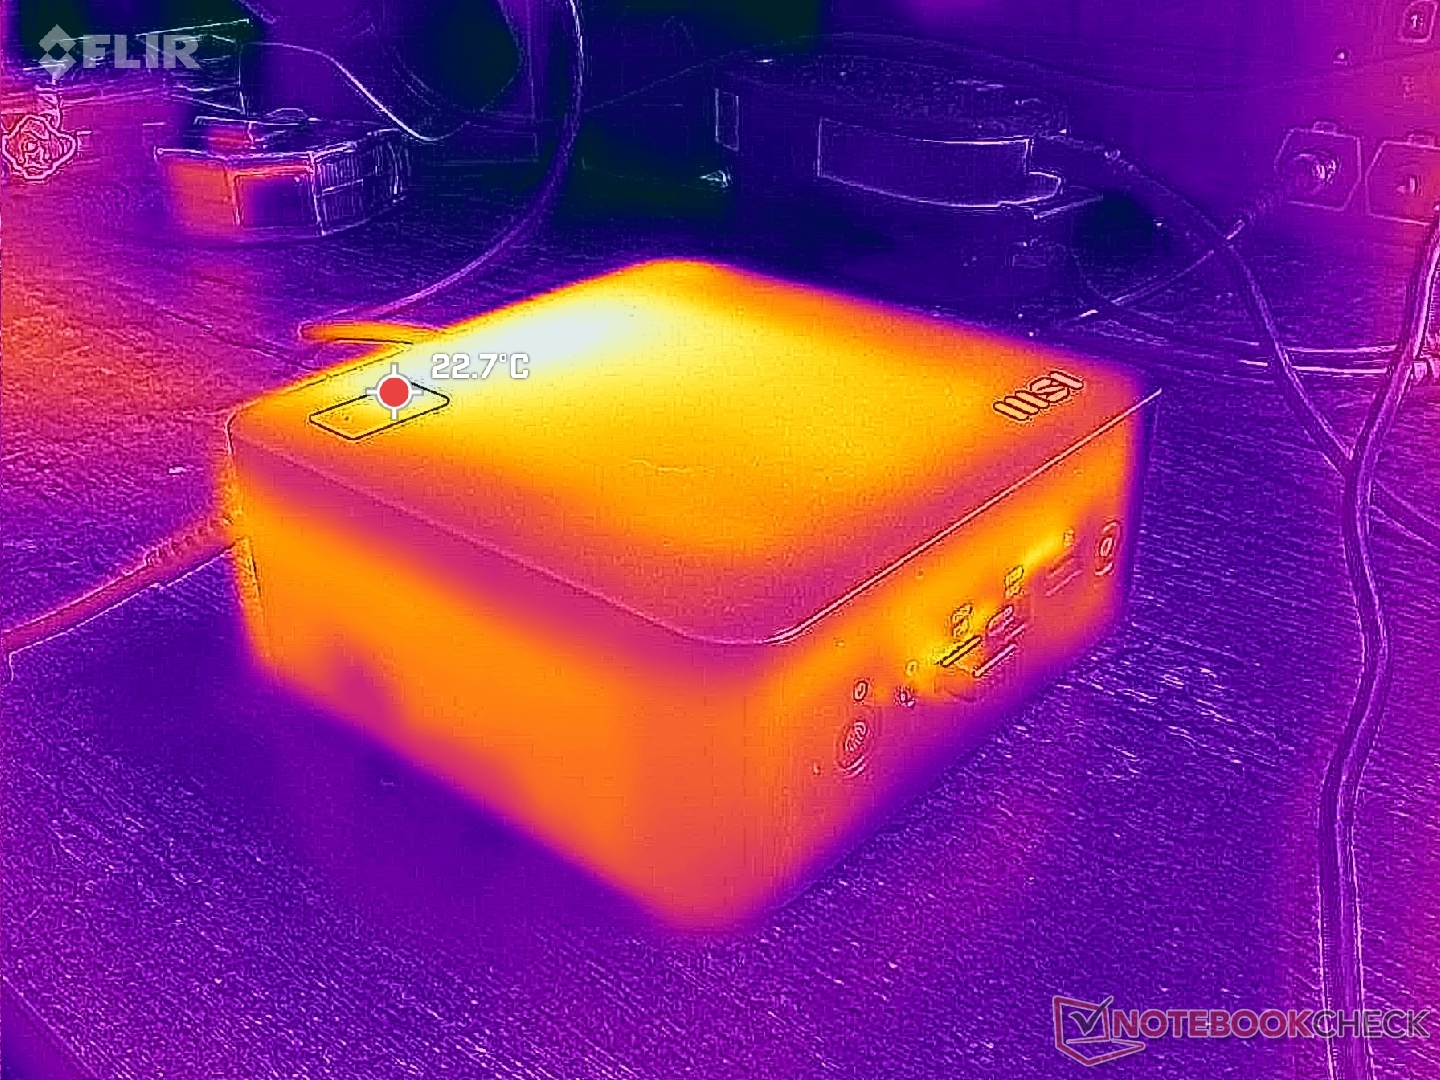
Temperatura
As temperaturas de superfície são pouco quentes, apenas 31 °C, mesmo ao executar aplicativos exigentes, em grande parte devido à construção de plástico e à CPU Intel de baixa potência.
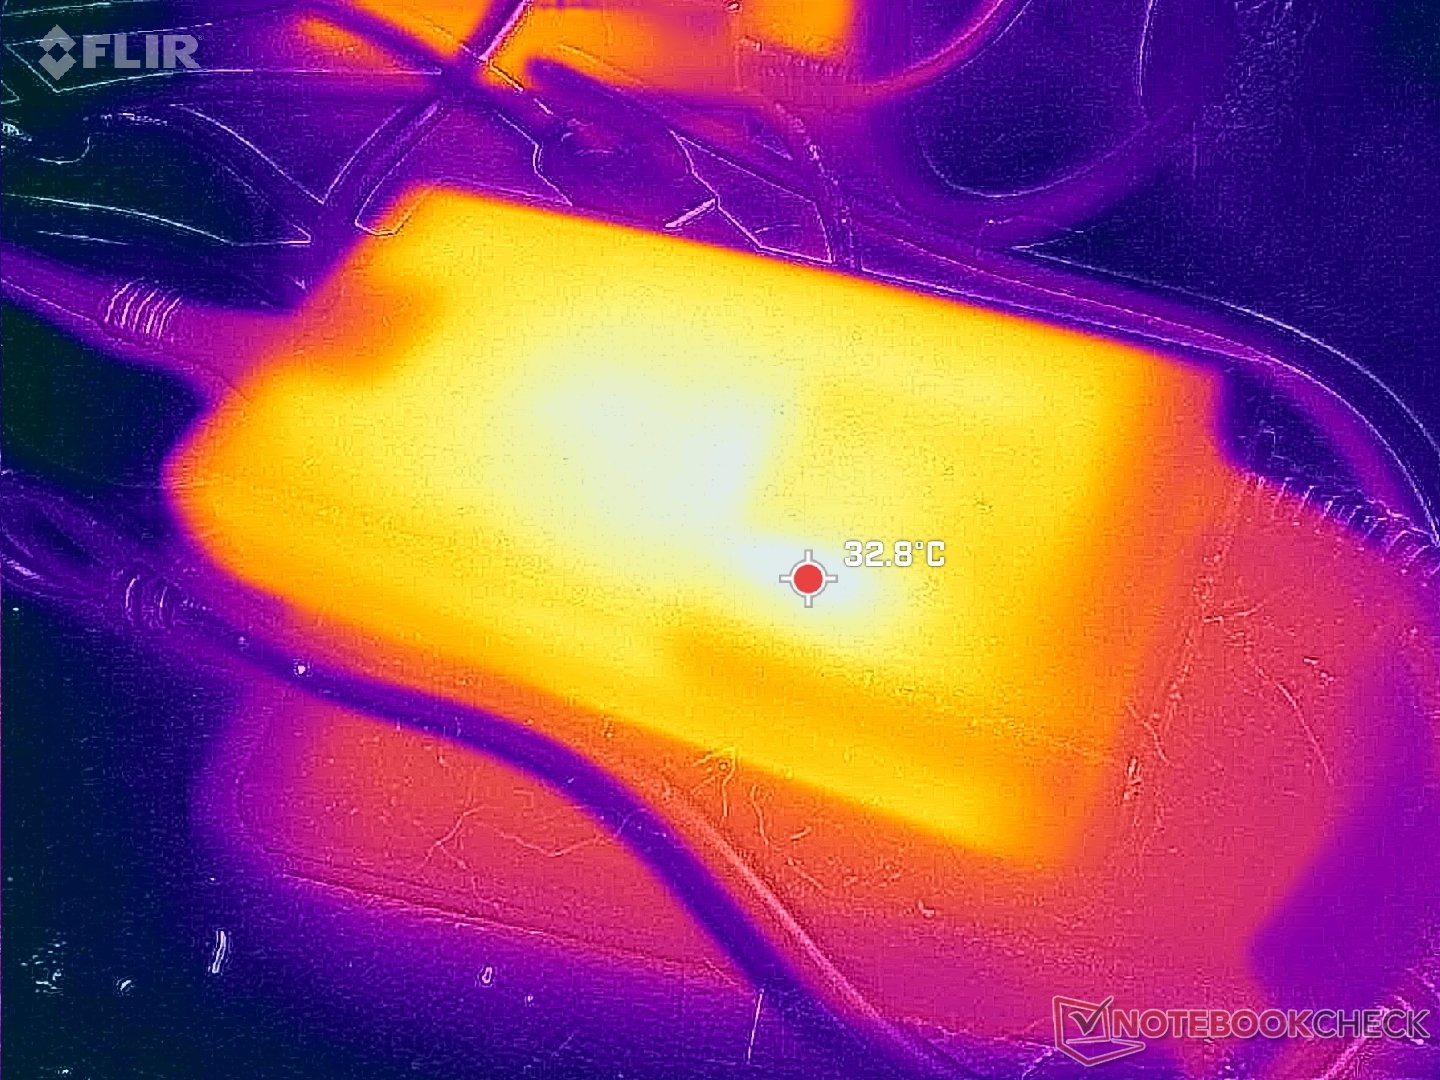
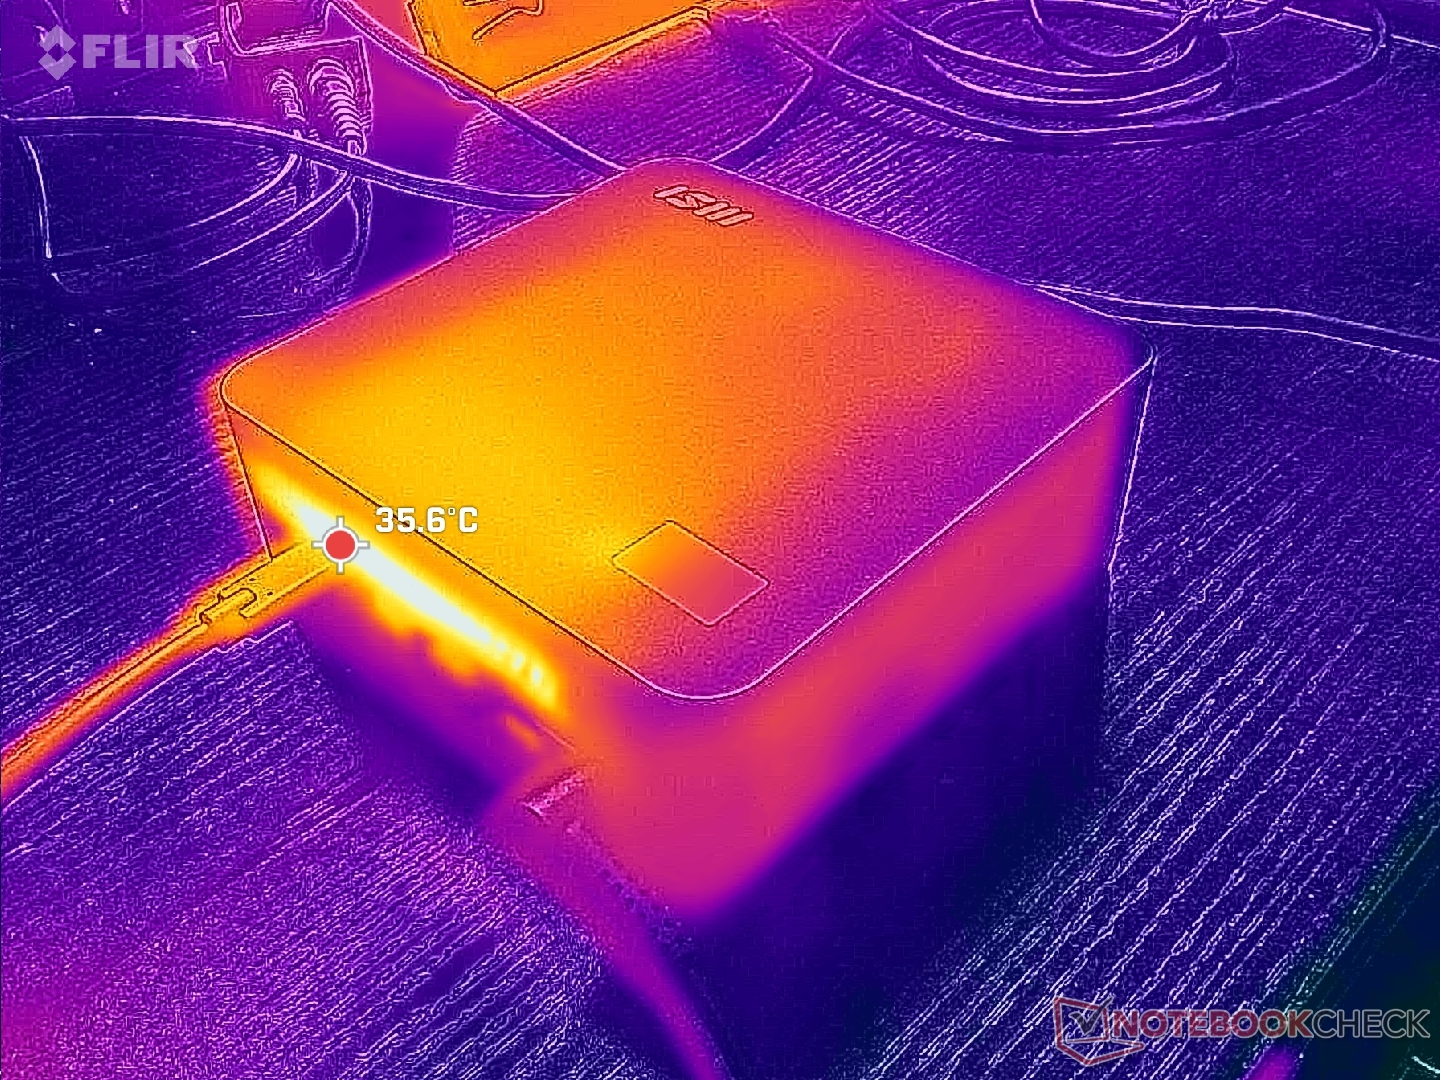
O pequeno adaptador CA de 120 W permaneceria relativamente frio a menos de 35 °C sob carga.
Alto-falantes
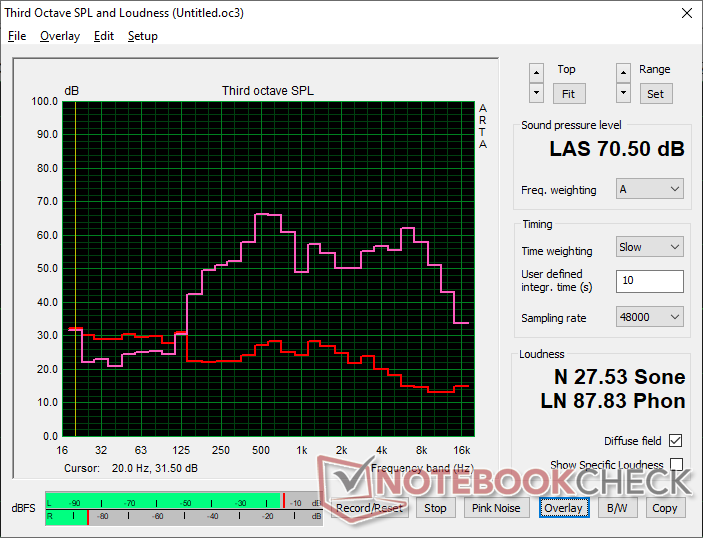
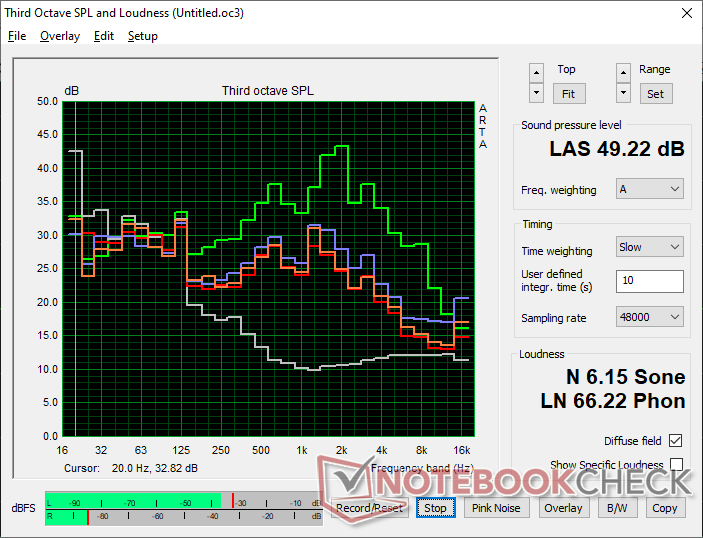
MSI Cubi NUC AI+ 2MG análise de áudio
(-) | alto-falantes não muito altos (###valor### dB)
Graves 100 - 315Hz
(±) | graves reduzidos - em média 10.4% menor que a mediana
(-) | graves não são lineares (16% delta para frequência anterior)
Médios 400 - 2.000 Hz
(±) | médios mais altos - em média 6.9% maior que a mediana
(-) | médios não são lineares (19.7% delta para frequência anterior)
Altos 2 - 16 kHz
(+) | agudos equilibrados - apenas 4.3% longe da mediana
(±) | a linearidade dos máximos é média (12.2% delta para frequência anterior)
Geral 100 - 16.000 Hz
(±) | a linearidade do som geral é média (29.5% diferença em relação à mediana)
Comparado com a mesma classe
» 75% de todos os dispositivos testados nesta classe foram melhores, 11% semelhantes, 14% piores
» O melhor teve um delta de 13%, a média foi 24%, o pior foi 64%
Comparado com todos os dispositivos testados
» 87% de todos os dispositivos testados foram melhores, 3% semelhantes, 10% piores
» O melhor teve um delta de 4%, a média foi 23%, o pior foi 134%
Apple MacBook Pro 16 2021 M1 Pro análise de áudio
(+) | os alto-falantes podem tocar relativamente alto (###valor### dB)
Graves 100 - 315Hz
(+) | bons graves - apenas 3.8% longe da mediana
(+) | o baixo é linear (5.2% delta para a frequência anterior)
Médios 400 - 2.000 Hz
(+) | médios equilibrados - apenas 1.3% longe da mediana
(+) | médios são lineares (2.1% delta para frequência anterior)
Altos 2 - 16 kHz
(+) | agudos equilibrados - apenas 1.9% longe da mediana
(+) | os máximos são lineares (2.7% delta da frequência anterior)
Geral 100 - 16.000 Hz
(+) | o som geral é linear (4.6% diferença em relação à mediana)
Comparado com a mesma classe
» 0% de todos os dispositivos testados nesta classe foram melhores, 0% semelhantes, 100% piores
» O melhor teve um delta de 5%, a média foi 17%, o pior foi 45%
Comparado com todos os dispositivos testados
» 0% de todos os dispositivos testados foram melhores, 0% semelhantes, 100% piores
» O melhor teve um delta de 4%, a média foi 23%, o pior foi 134%
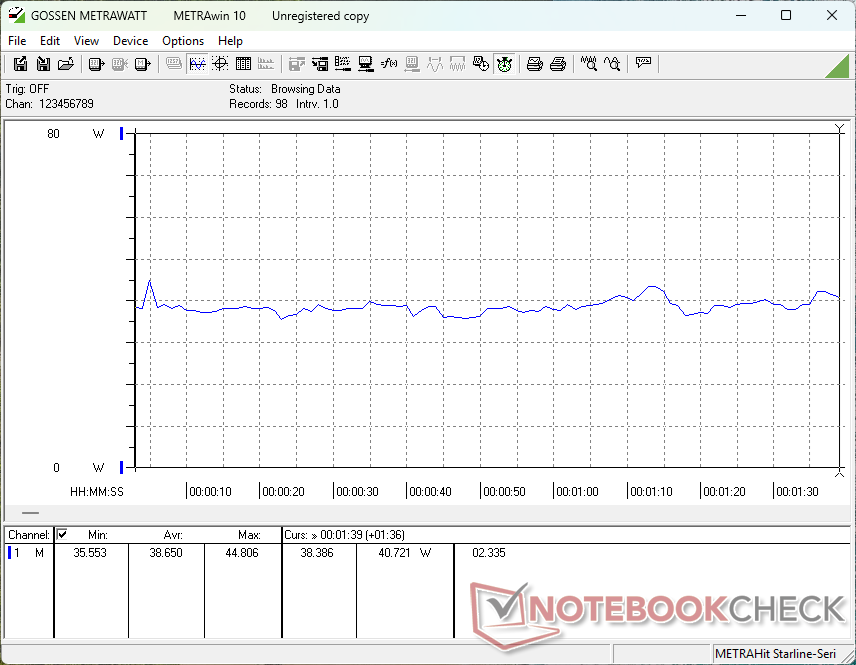
Gerenciamento de energia
Consumo de energia
O consumo geral é visivelmente menor do que o de um mini PC AMD série H, como o GMK NucBox K12 embora nosso Arc 140V integrado seja praticamente comparável ao Radeon 780M integrado da concorrência para jogos. O desempenho por watt geralmente favorece o MSI Cubi, embora ao custo do desempenho bruto do processador quando comparado a muitas alternativas AMD Zen 4 ou Zen 5.
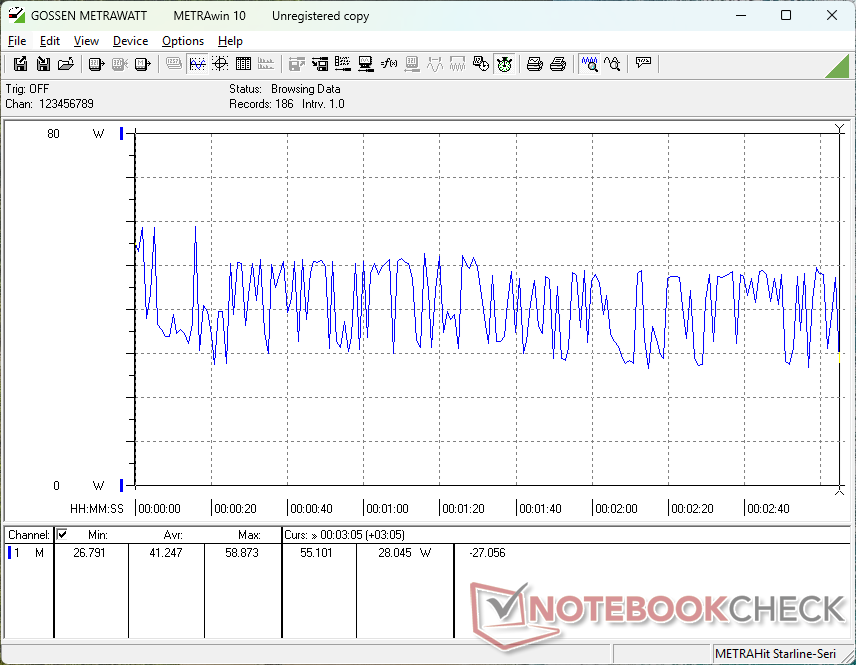
O consumo durante a execução do Cyberpunk 2077 oscilava entre 28 W e 49 W, aparentemente sem motivo, o que se alinha com nossas taxas de quadros instáveis e taxas de clock da GPU mencionadas acima.
| desligado | |
| Ocioso | |
| Carga |
|
Key:
min: | |
| MSI Cubi NUC AI+ 2MG Core Ultra 7 258V, Arc 140V, Phison 1 TB ESR01TBTCCZ-27J, , x, | MSI Cubi NUC 1M Core 7 150U, Iris Xe G7 96EUs, WD PC SN560 SDDPNQE-1T00, , x, | GMK NucBox K12 Ryzen 7 H 255, Radeon 780M, Crucial P3 Plus CT1000P3PSSD8, , x, | Beelink SER9 Pro Ryzen 7 H 255, Radeon 780M, Crucial P3 Plus CT1000P3PSSD8, , x, | Ninkear M7, (16+512) R5 7430U, Vega 7, Faspeed P8-512G-SE, , x, | Minisforum MS-A1 R7 8700G, Radeon 780M, Kingston OM8PGP41024Q-A0, , x, | |
|---|---|---|---|---|---|---|
| Power Consumption | -24% | -99% | -56% | -47% | -121% | |
| Idle Minimum * (Watt) | 2.9 | 6.4 -121% | 9.9 -241% | 7 -141% | 9.3 -221% | 8.8 -203% |
| Idle Average * (Watt) | 5.7 | 8.3 -46% | 10.1 -77% | 7.1 -25% | 10.7 -88% | 12.6 -121% |
| Idle Maximum * (Watt) | 10.2 | 10.4 -2% | 13.1 -28% | 7.5 26% | 12.6 -24% | 14 -37% |
| Load Average * (Watt) | 38.7 | 38.5 1% | 69.8 -80% | 62.3 -61% | 37.7 3% | 93.2 -141% |
| Cyberpunk 2077 ultra external monitor * (Watt) | 41.1 | 36.1 12% | 86.3 -110% | 80.1 -95% | 32.3 21% | 102.1 -148% |
| Load Maximum * (Watt) | 60 | 52.5 12% | 92.8 -55% | 82.9 -38% | 43.4 28% | 105.4 -76% |
* ... menor é melhor
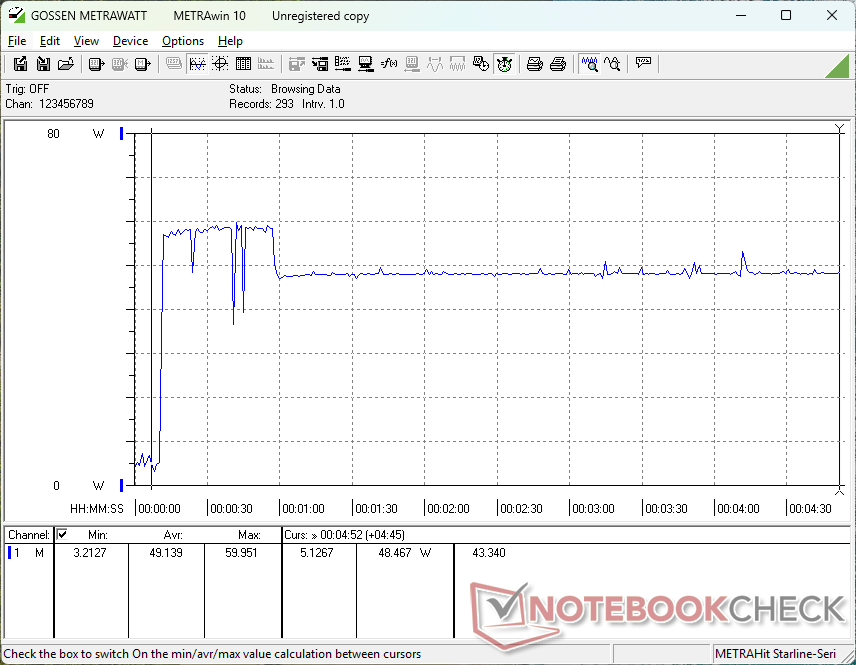
Consumo de energia Cyberpunk / Teste de estresse
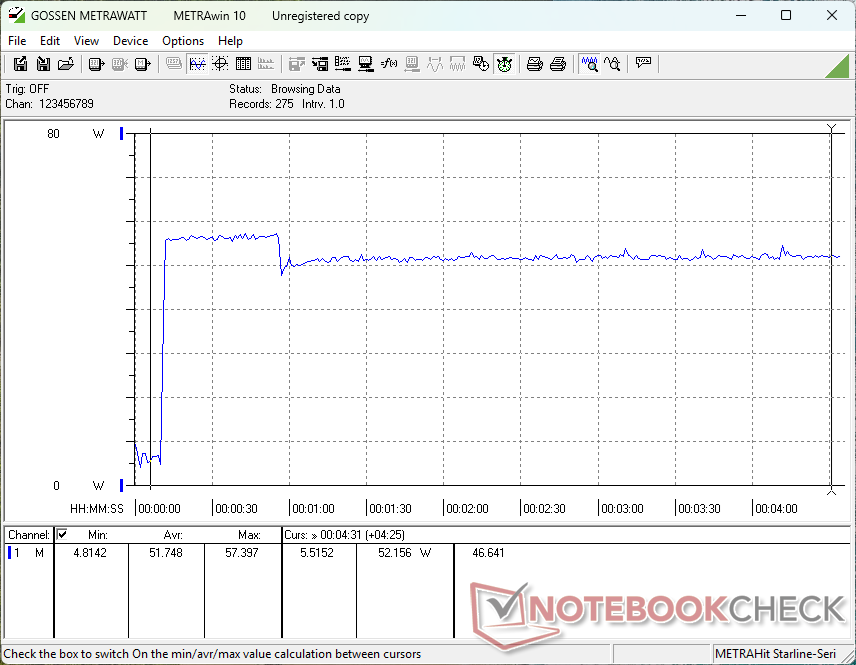
Consumo de energia do monitor externo
Classificação do Notebookcheck
Mini PC básico e confiável para empresas, mas pode ser considerado básico demais considerando o alto preço pedido.
MSI Cubi NUC AI+ 2MG
- 09/29/2025 v8
Allen Ngo
 Total Sustainability Score:
 Concorrentes potenciais em comparação
Imagem | Modelo / Análises | Preço | Peso | Altura | Tela |
|---|---|---|---|---|---|
1. 75.2%  | MSI Cubi NUC AI+ 2MG Intel Core Ultra 7 258V ⎘ Intel Arc Graphics 140V ⎘ 32 GB Memória, 1000 GB SSD | Amazon: Preço de tabela: 900 USD | 669 g | 50.1 mm | x |
2. 66.1% 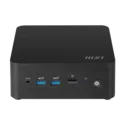 | MSI Cubi NUC 1M Intel Core 7 150U ⎘ Intel Iris Xe Graphics G7 96EUs ⎘ 16 GB Memória, 1024 GB SSD | Amazon: Preço de tabela: 950 USD | 660 g | 50.1 mm | x |
3. 73.7% 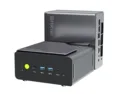 | GMK NucBox K12 AMD Ryzen 7 H 255 ⎘ AMD Radeon 780M ⎘ 32 GB Memória, 1024 GB SSD | Amazon: 1. $739.99 GMKtec Gaming Mini PC AMD Ry... 2. $29.99 19V~20V Charger for GMKtec M... | 938 g | 78 mm | x |
4. 80.2% 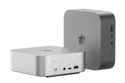 | Beelink SER9 Pro AMD Ryzen 7 H 255 ⎘ AMD Radeon 780M ⎘ 32 GB Memória, 1024 GB SSD | Amazon: Preço de tabela: 520 USD | 812 g | 44.7 mm | x |
5.  | Ninkear M7, (16+512) AMD Ryzen 5 7430U ⎘ AMD Radeon RX Vega 7 ⎘ 16 GB Memória, 512 GB SSD | Amazon: Preço de tabela: 399€ | 400 g | 36 mm | x |
6. 76.7% 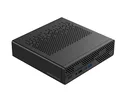 | Minisforum MS-A1 AMD Ryzen 7 8700G ⎘ AMD Radeon 780M ⎘ 32 GB Memória, 1024 GB SSD | Amazon: Preço de tabela: 829 EUR | 1.7 kg | 48 mm | x |
Transparência
A seleção dos dispositivos a serem analisados é feita pela nossa equipe editorial. A amostra de teste foi fornecida ao autor como empréstimo pelo fabricante ou varejista para fins desta revisão. O credor não teve influência nesta revisão, nem o fabricante recebeu uma cópia desta revisão antes da publicação. Não houve obrigação de publicar esta revisão. Como empresa de mídia independente, a Notebookcheck não está sujeita à autoridade de fabricantes, varejistas ou editores.
É assim que o Notebookcheck está testando
Todos os anos, o Notebookcheck analisa de forma independente centenas de laptops e smartphones usando procedimentos padronizados para garantir que todos os resultados sejam comparáveis. Desenvolvemos continuamente nossos métodos de teste há cerca de 20 anos e definimos padrões da indústria no processo. Em nossos laboratórios de teste, equipamentos de medição de alta qualidade são utilizados por técnicos e editores experientes. Esses testes envolvem um processo de validação em vários estágios. Nosso complexo sistema de classificação é baseado em centenas de medições e benchmarks bem fundamentados, o que mantém a objetividade.
