Análise do laptop Eurocom Raptor X17 Core i9-14900HX: gPU de 175 W para desempenho máximo

O Raptor X17 é um dos laptops mais rápidos disponíveis na Eurocom. O modelo deste ano foi atualizado com as opções mais recentes do Raptor Lake-HX, mas com a mesma GPU e o mesmo chassi do ano passado. Portanto, recomendamos que você confira nossas análises sobre o 2023 Raptor X17 e Schenker Key 17 Pro para obter mais informações sobre os recursos físicos do laptop, pois nossos comentários ainda se aplicam.
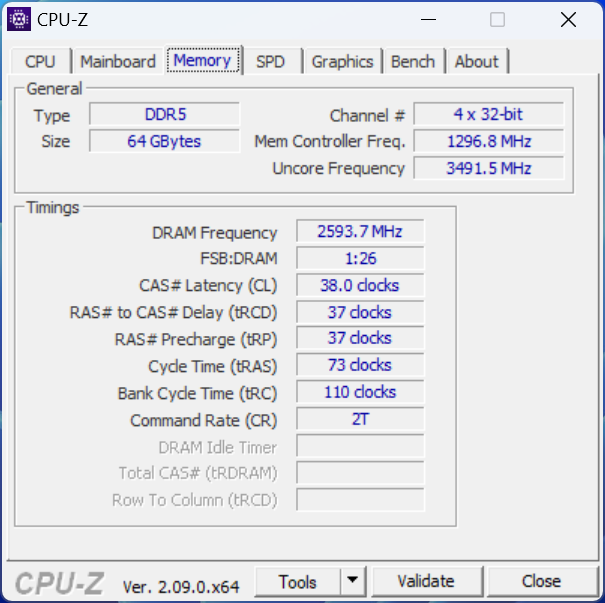
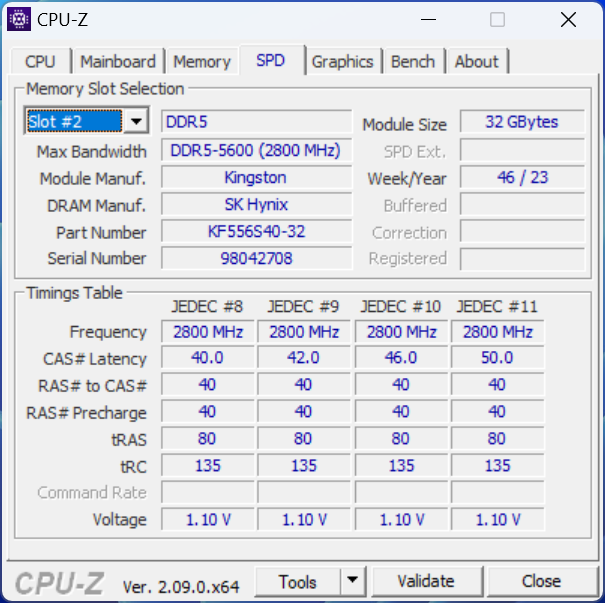
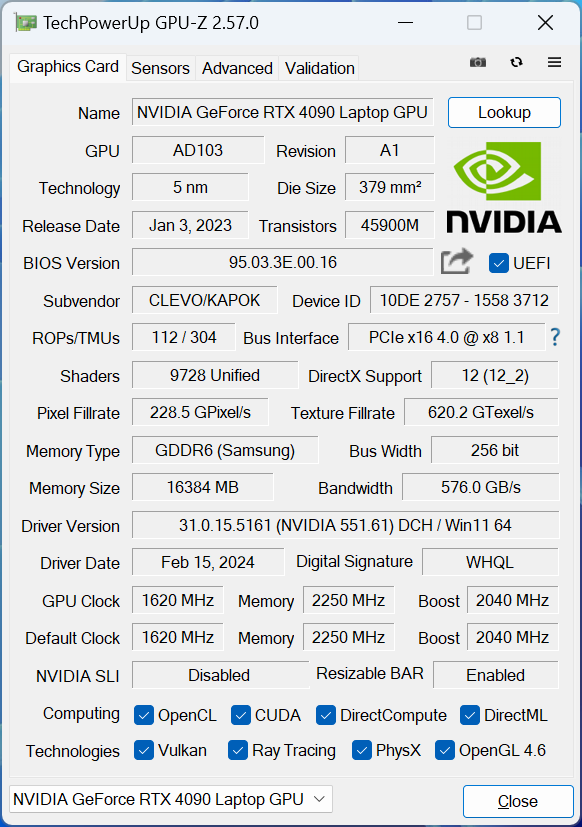
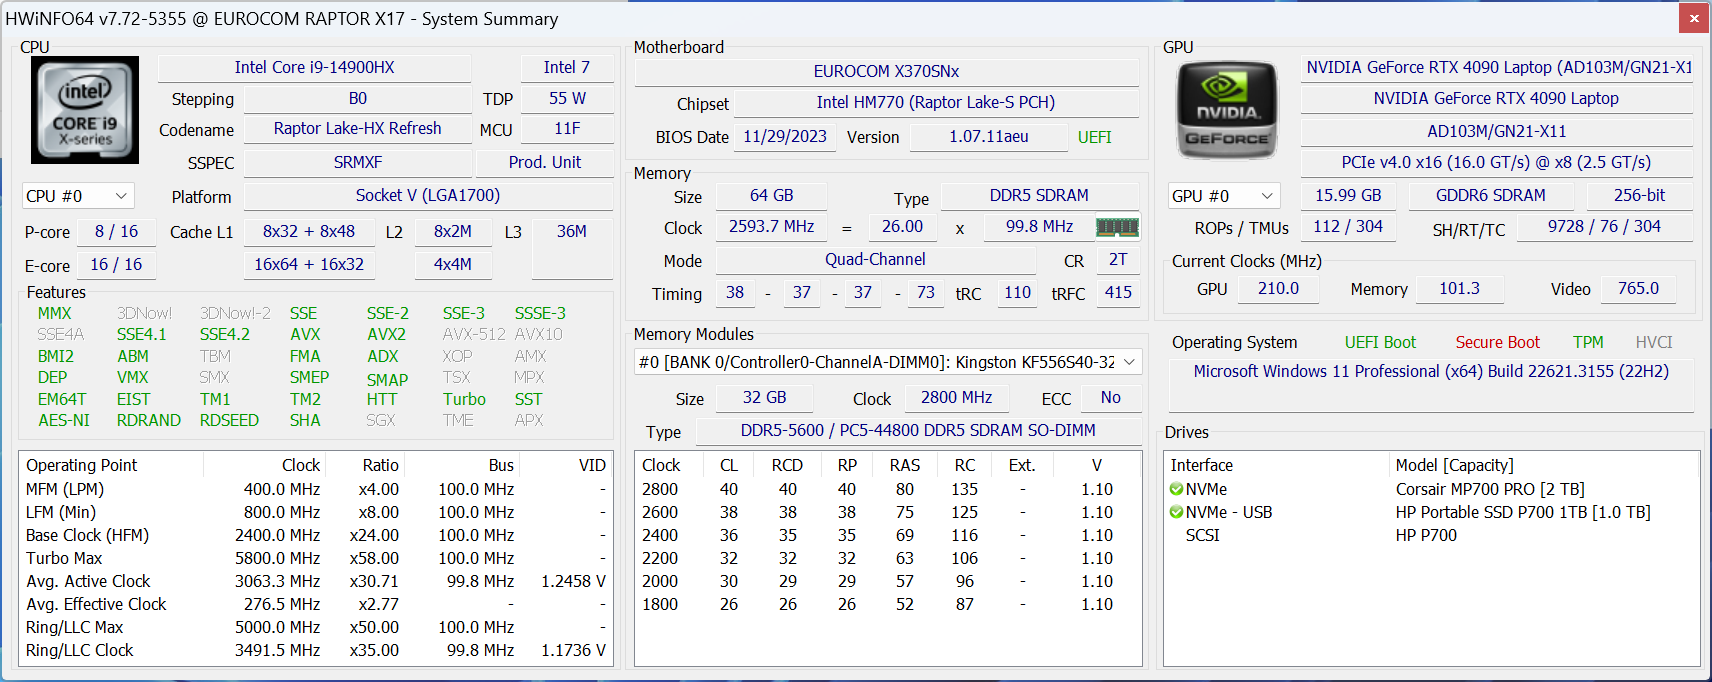
Nossa unidade de teste Raptor X17 2024 vem com o Core i9-14900HX, SSD PCIe5 e tela 4K 144 Hz para contrastar com o Core i9-13900HX, SSD PCIe4 e tela 2K 240 Hz do nosso modelo 2023. O GeForce RTX 4090 de 175 W permanece o mesmo.
As alternativas ao Raptor X17 incluem outros notebooks para jogos de alto desempenho, como o Asus ROG Strix Scar 17, MSI Titan 18 HXou Alienware m18 R2. Vale a pena observar que o Raptor X17 é um dos poucos notebooks para jogos RTX 4090 no mercado com uma tela 16:9 de 17,3 polegadas.
Mais análises da Eurocom:
Possíveis concorrentes em comparação
Avaliação | Data | Modelo | Peso | Altura | Size | Resolução | Preço |
|---|---|---|---|---|---|---|---|
| 85.2 % v7 (old) | 03/2024 | Eurocom Raptor X17 Core i9-14900HX i9-14900HX, GeForce RTX 4090 Laptop GPU | 3.4 kg | 24.9 mm | 17.30" | 3840x2160 | |
| 82.8 % v7 (old) | 05/2023 | Eurocom Raptor X17 i9-13900HX, GeForce RTX 4090 Laptop GPU | 3.5 kg | 24.9 mm | 17.30" | 2560x1440 | |
| 85.6 % v7 (old) | 01/2024 | Asus TUF Gaming A17 FA707XI-NS94 R9 7940HS, GeForce RTX 4070 Laptop GPU | 2.5 kg | 25.4 mm | 17.30" | 1920x1080 | |
| 88.3 % v7 (old) | 04/2023 | Asus ROG Strix Scar 17 G733PY-XS96 R9 7945HX, GeForce RTX 4090 Laptop GPU | 2.9 kg | 28.3 mm | 17.30" | 2560x1440 | |
v (old) | MSI Raider GE78 HX 13VI i9-13980HX, GeForce RTX 4090 Laptop GPU | 17.30" | 2560x1600 | ||||
| 88.8 % v7 (old) | 01/2024 | MSI Titan 18 HX A14VIG i9-14900HX, GeForce RTX 4090 Laptop GPU | 3.6 kg | 32.1 mm | 18.00" | 3840x2400 |
Comunicação
Webcam


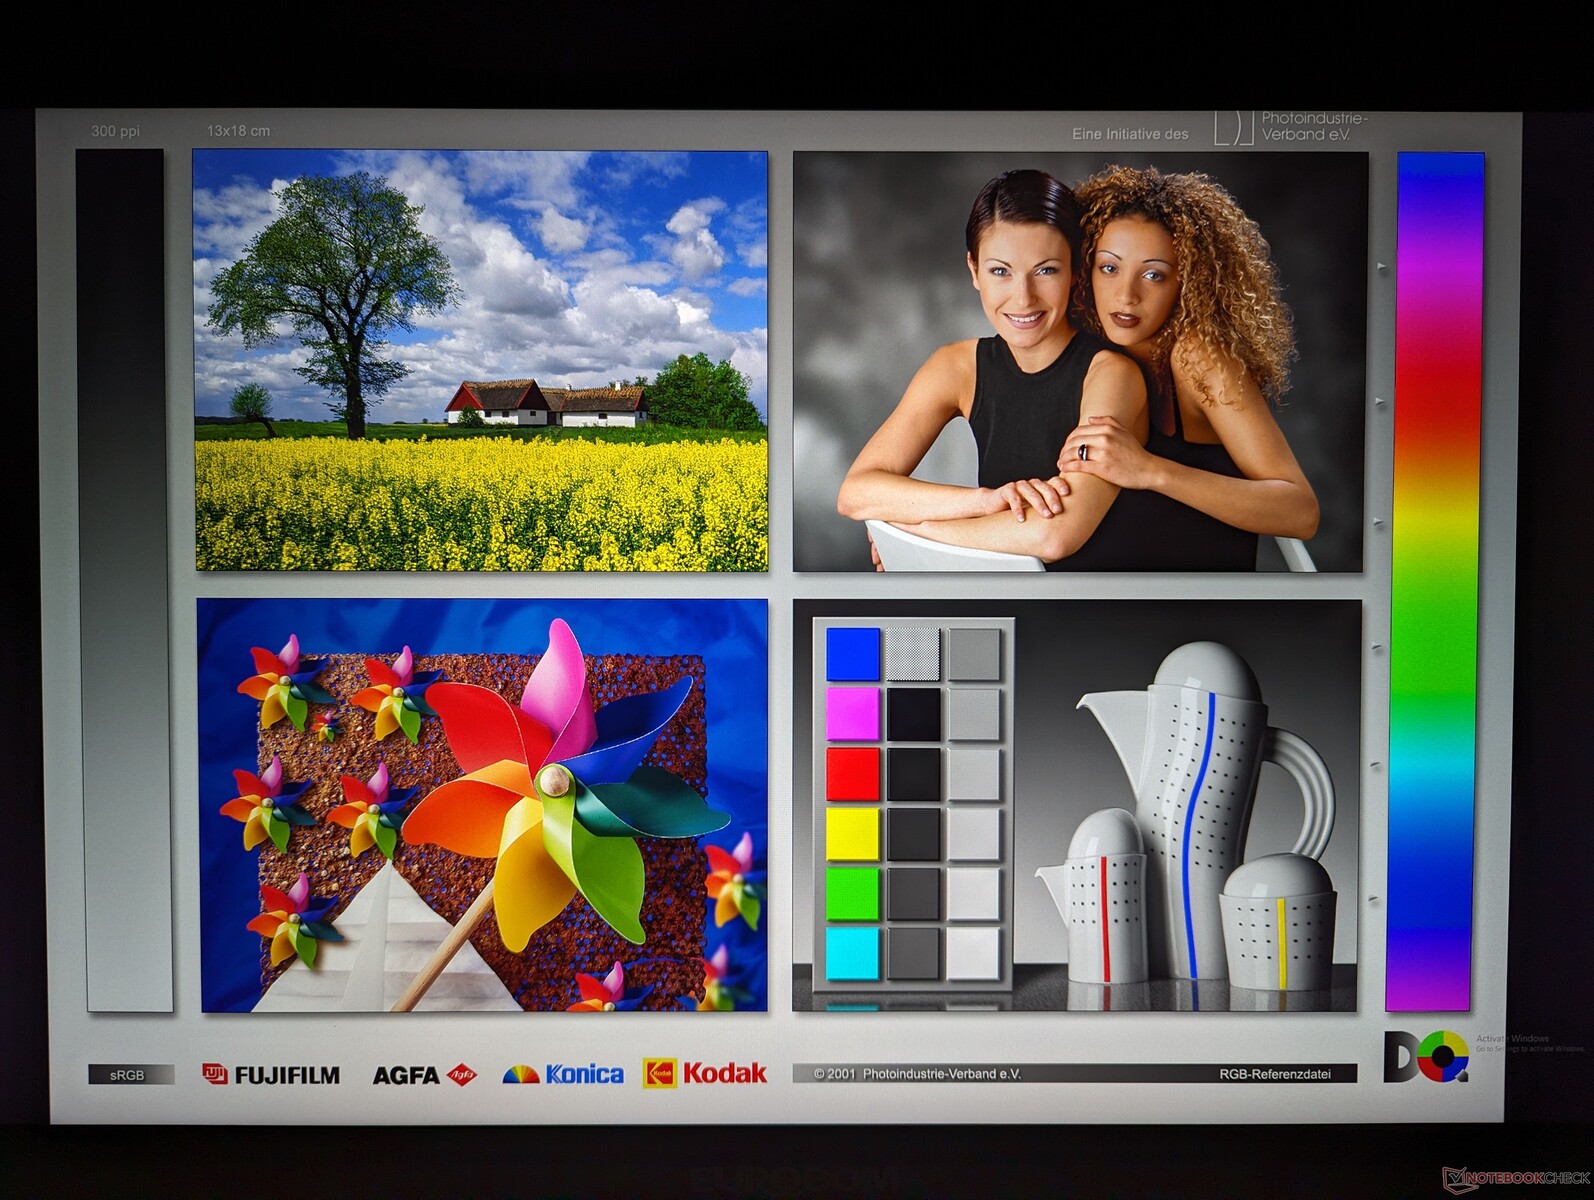
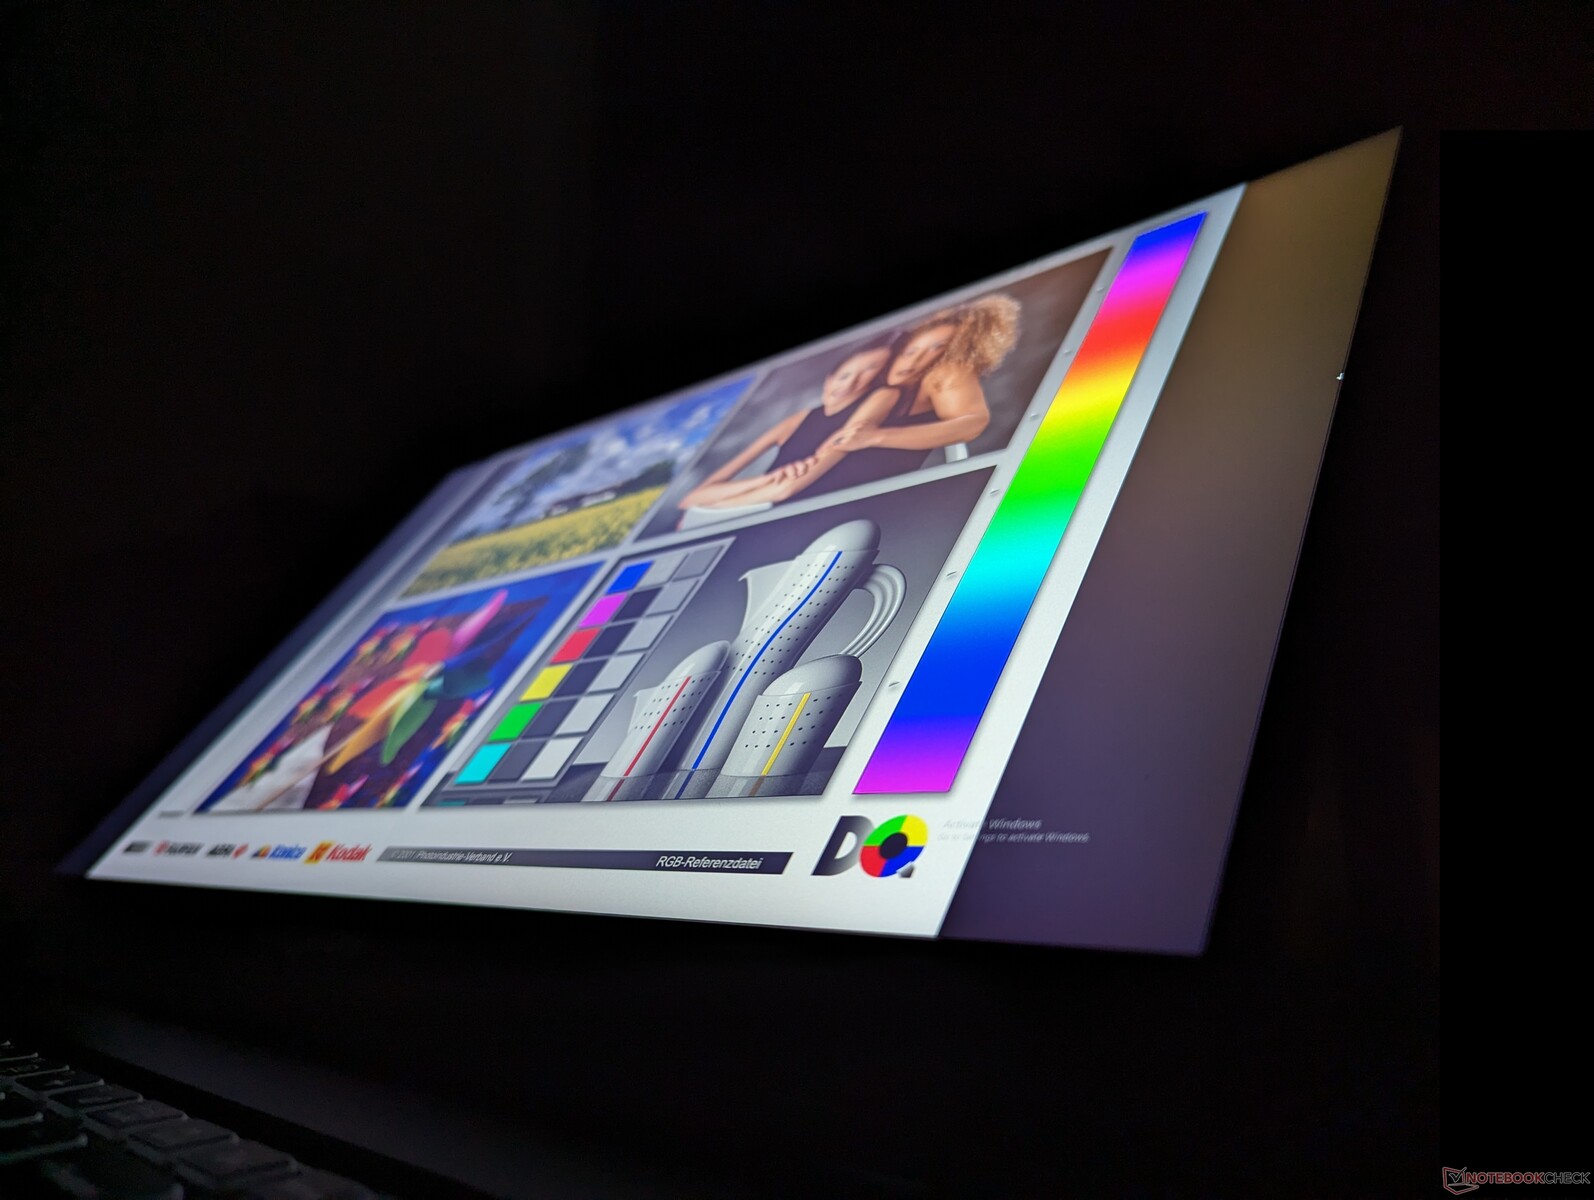
Tela
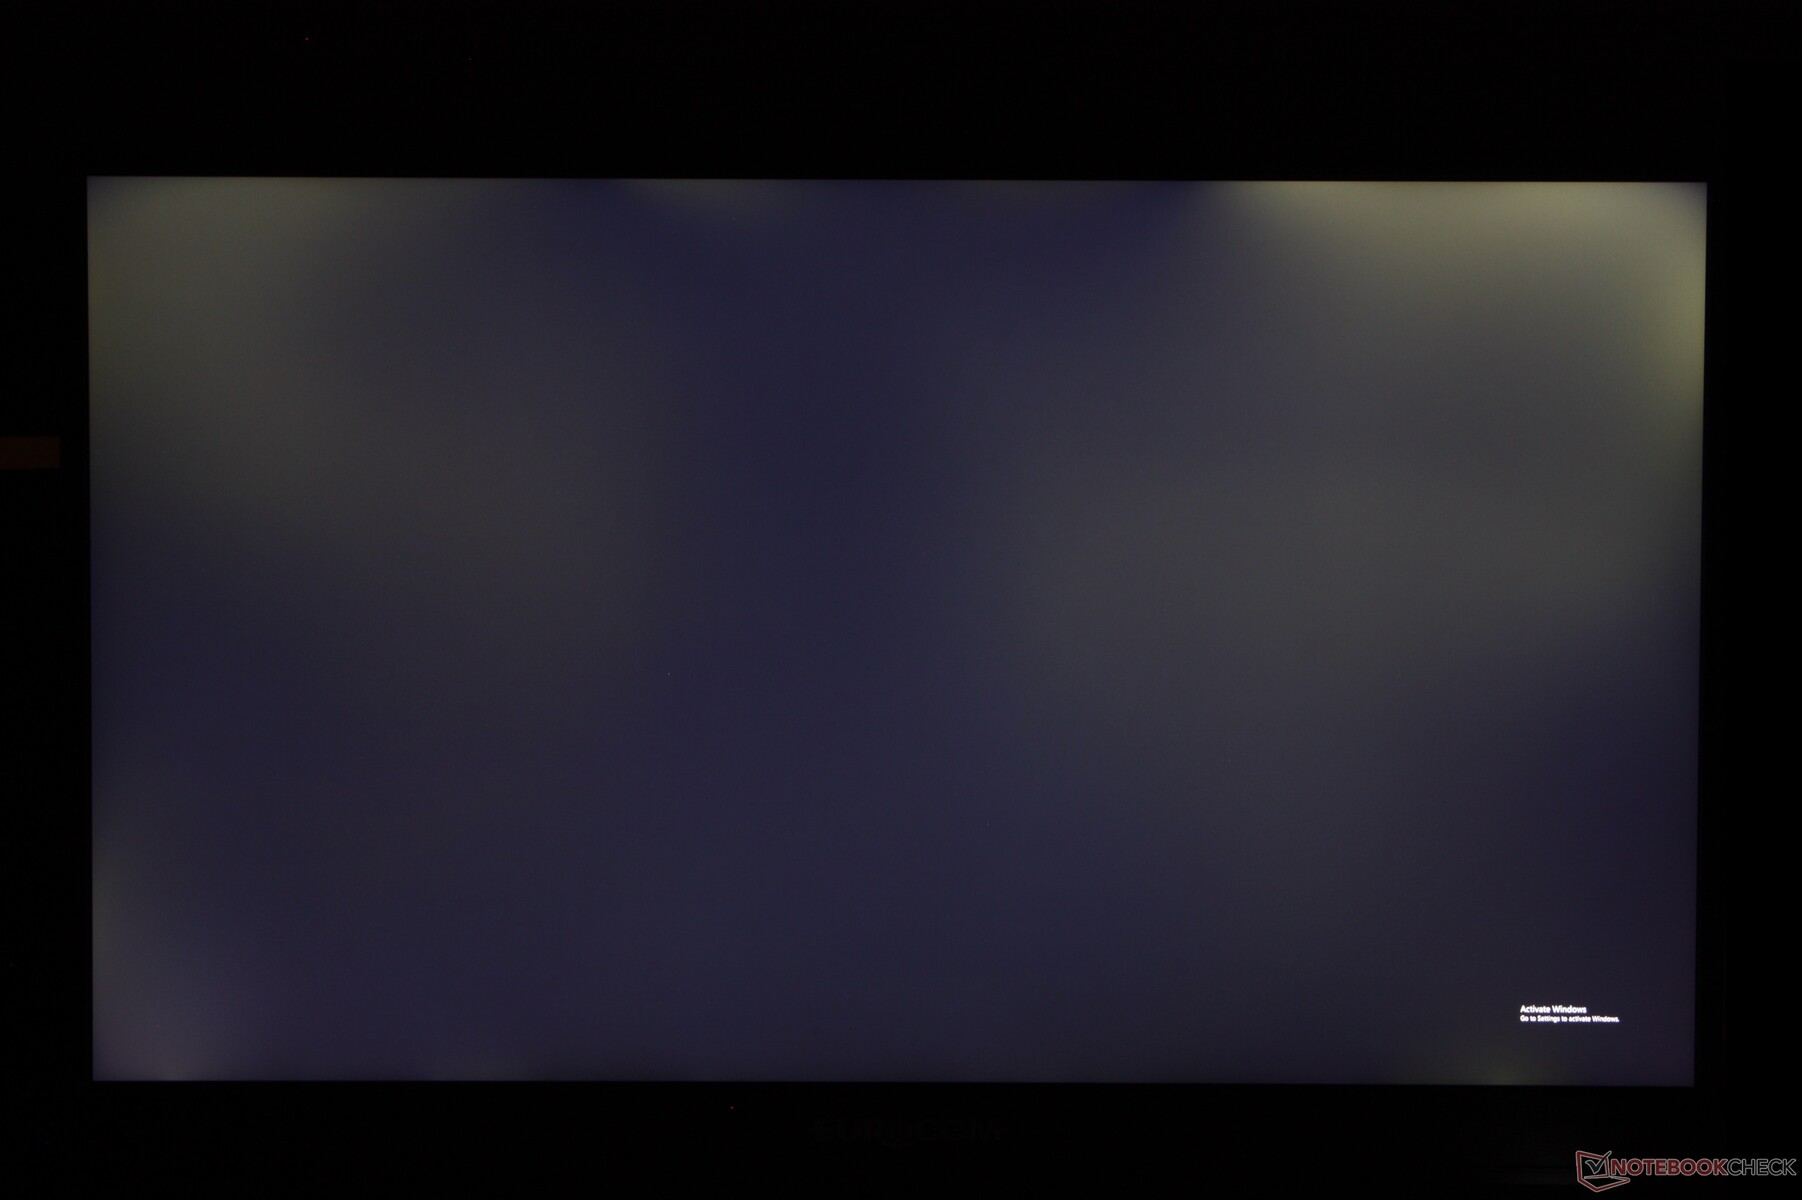
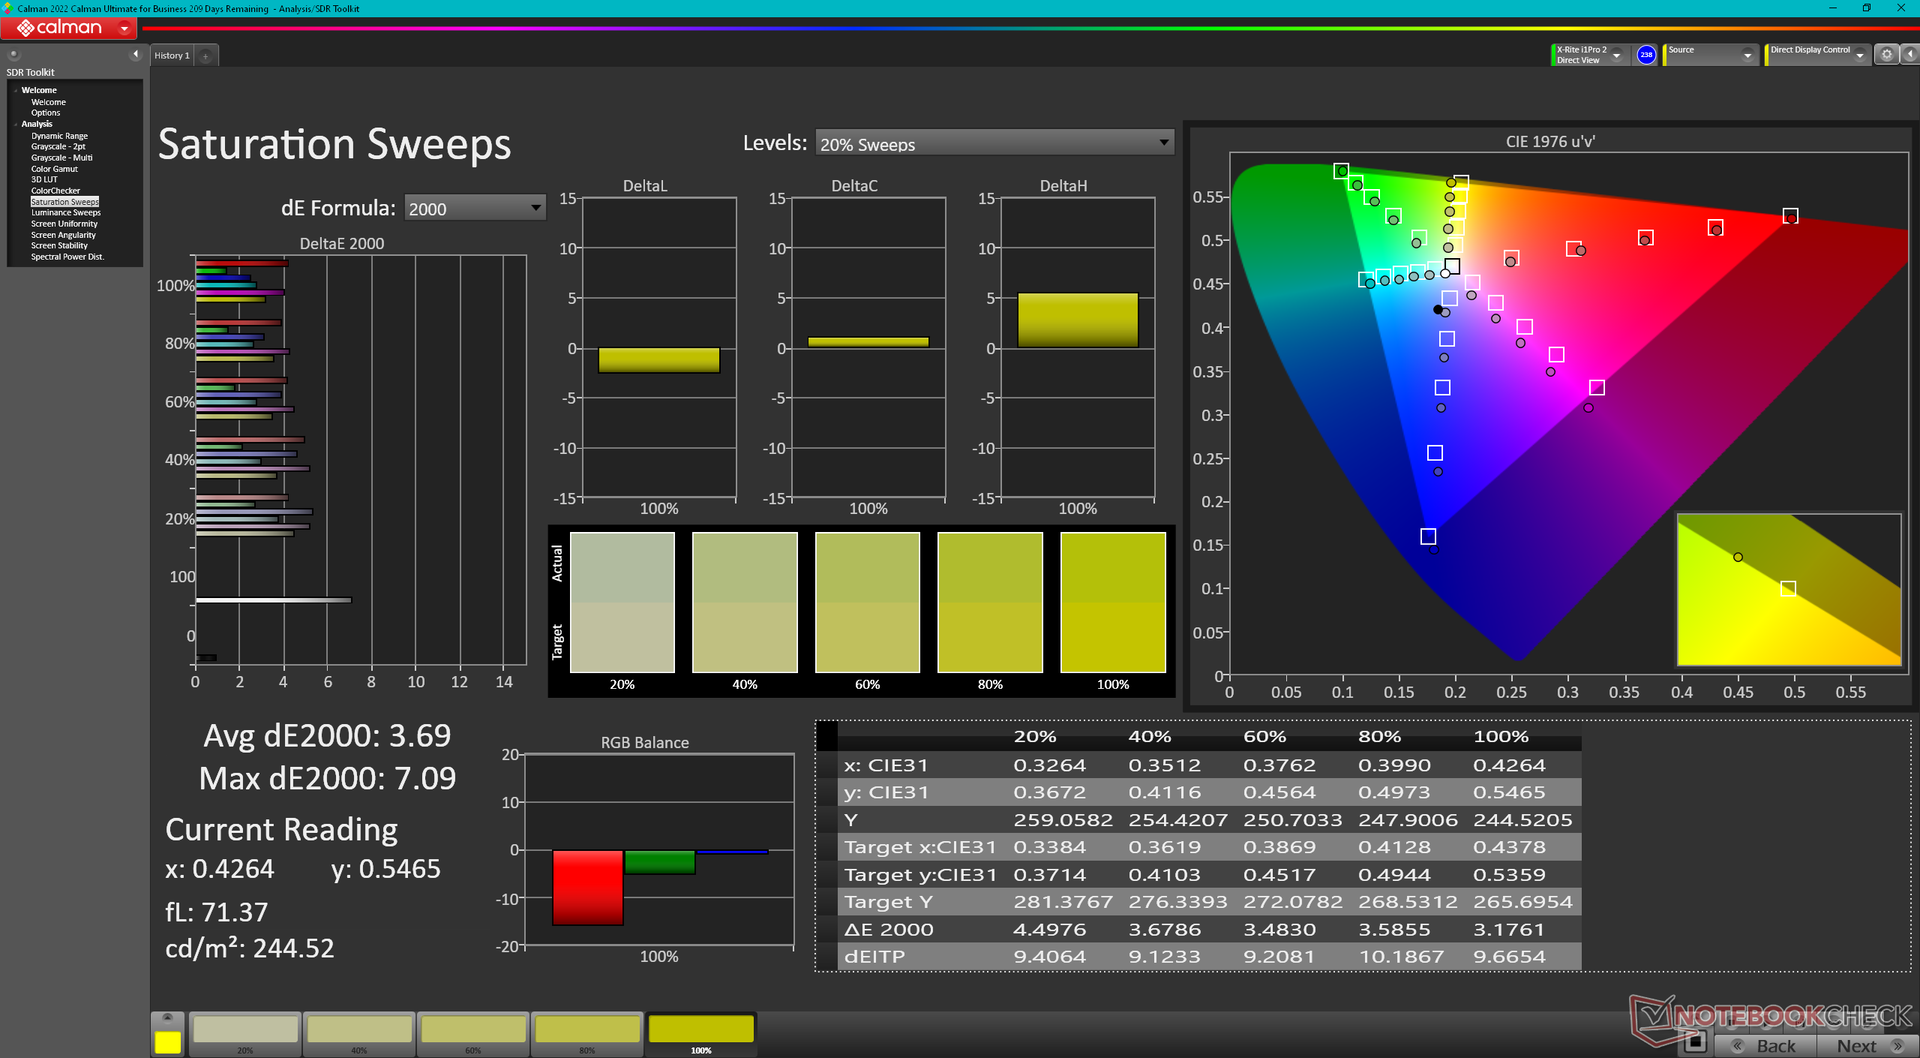
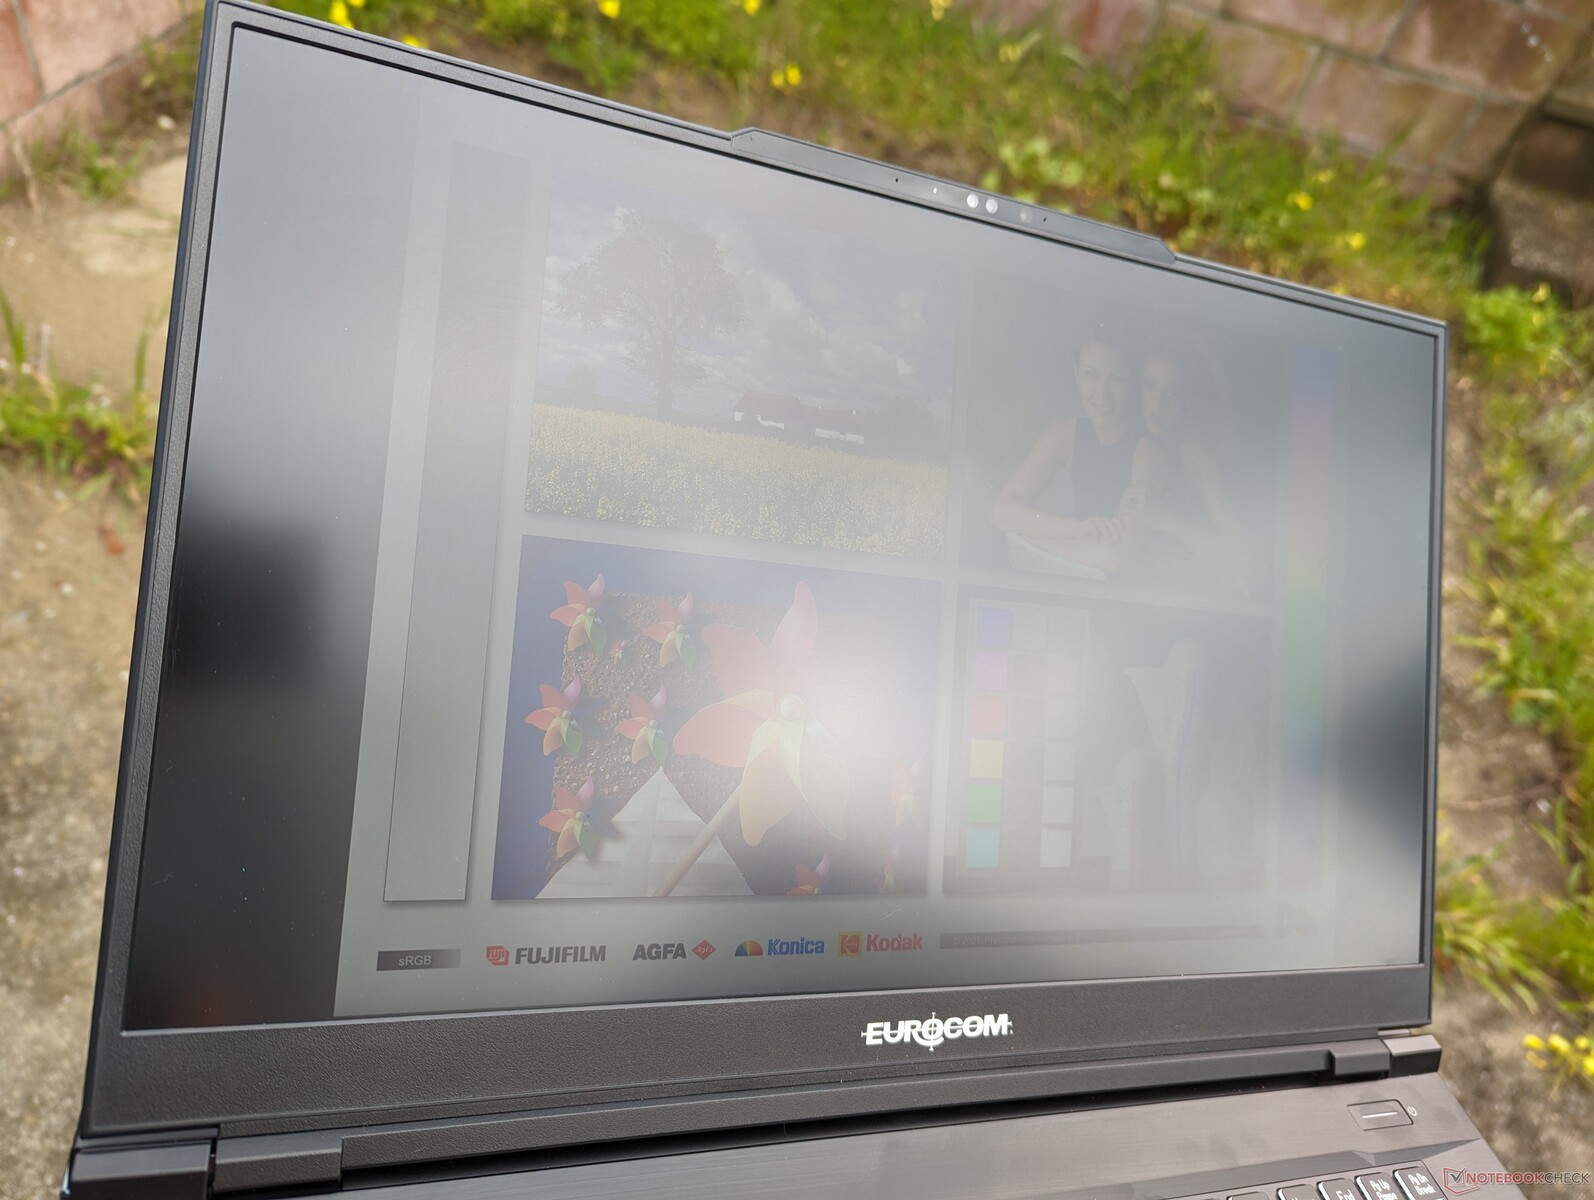
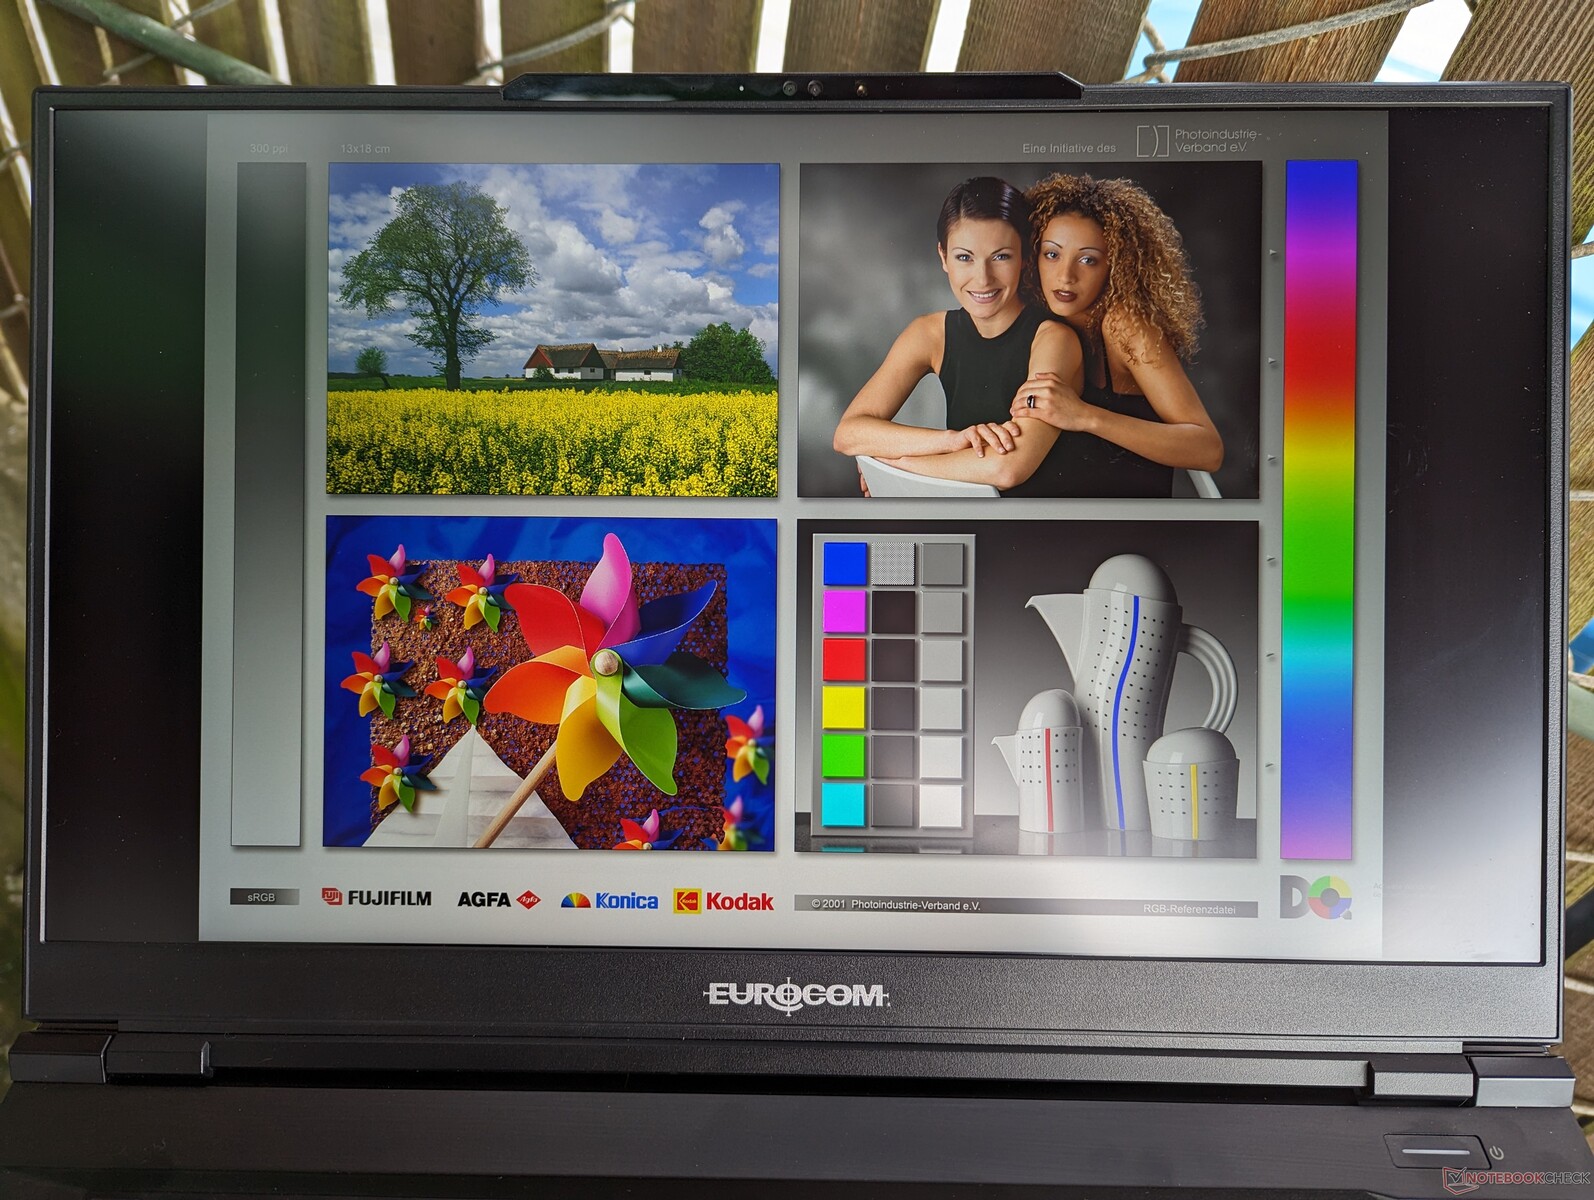
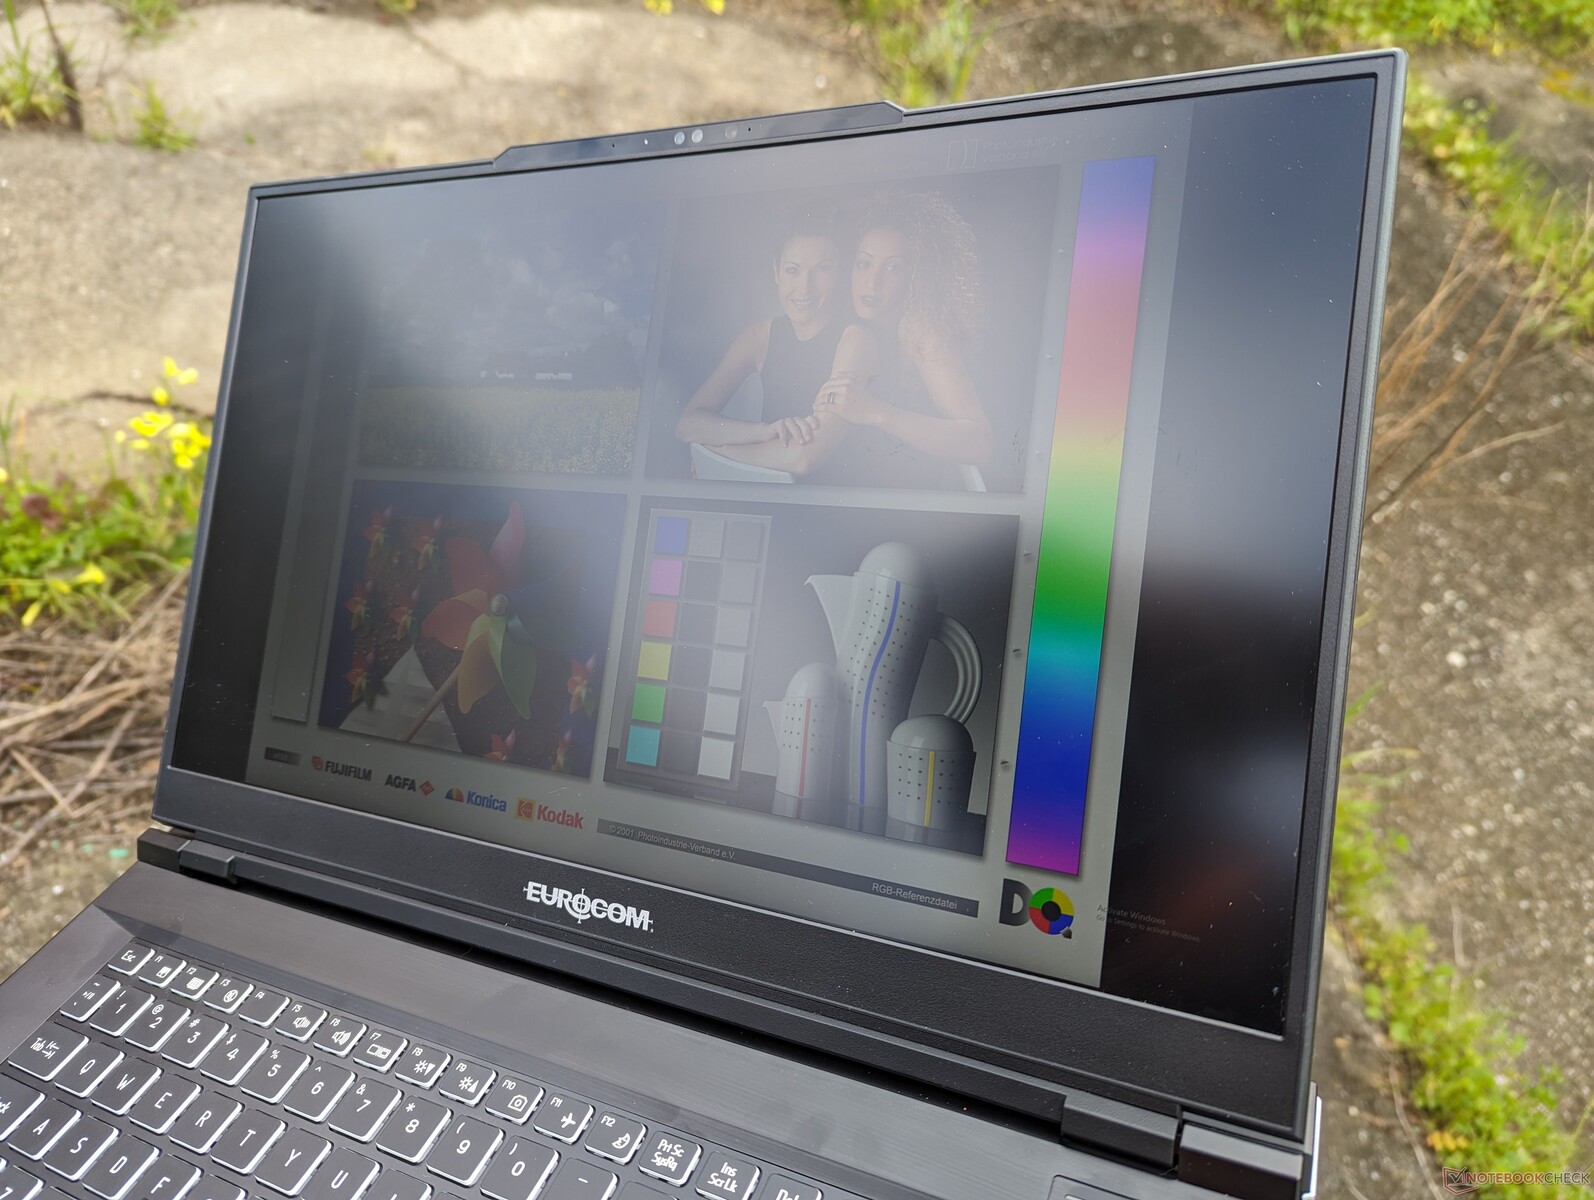
Quando comparada com a tela 2K 240 Hz em nossa configuração 2023, nossa configuração 2024 utiliza um painel 4K 144 Hz, mas com coberturas de cores, taxas de contraste e tempos de resposta semelhantes. Nosso painel de resolução mais alta também é visivelmente mais brilhante, com cerca de 500 nits em média.
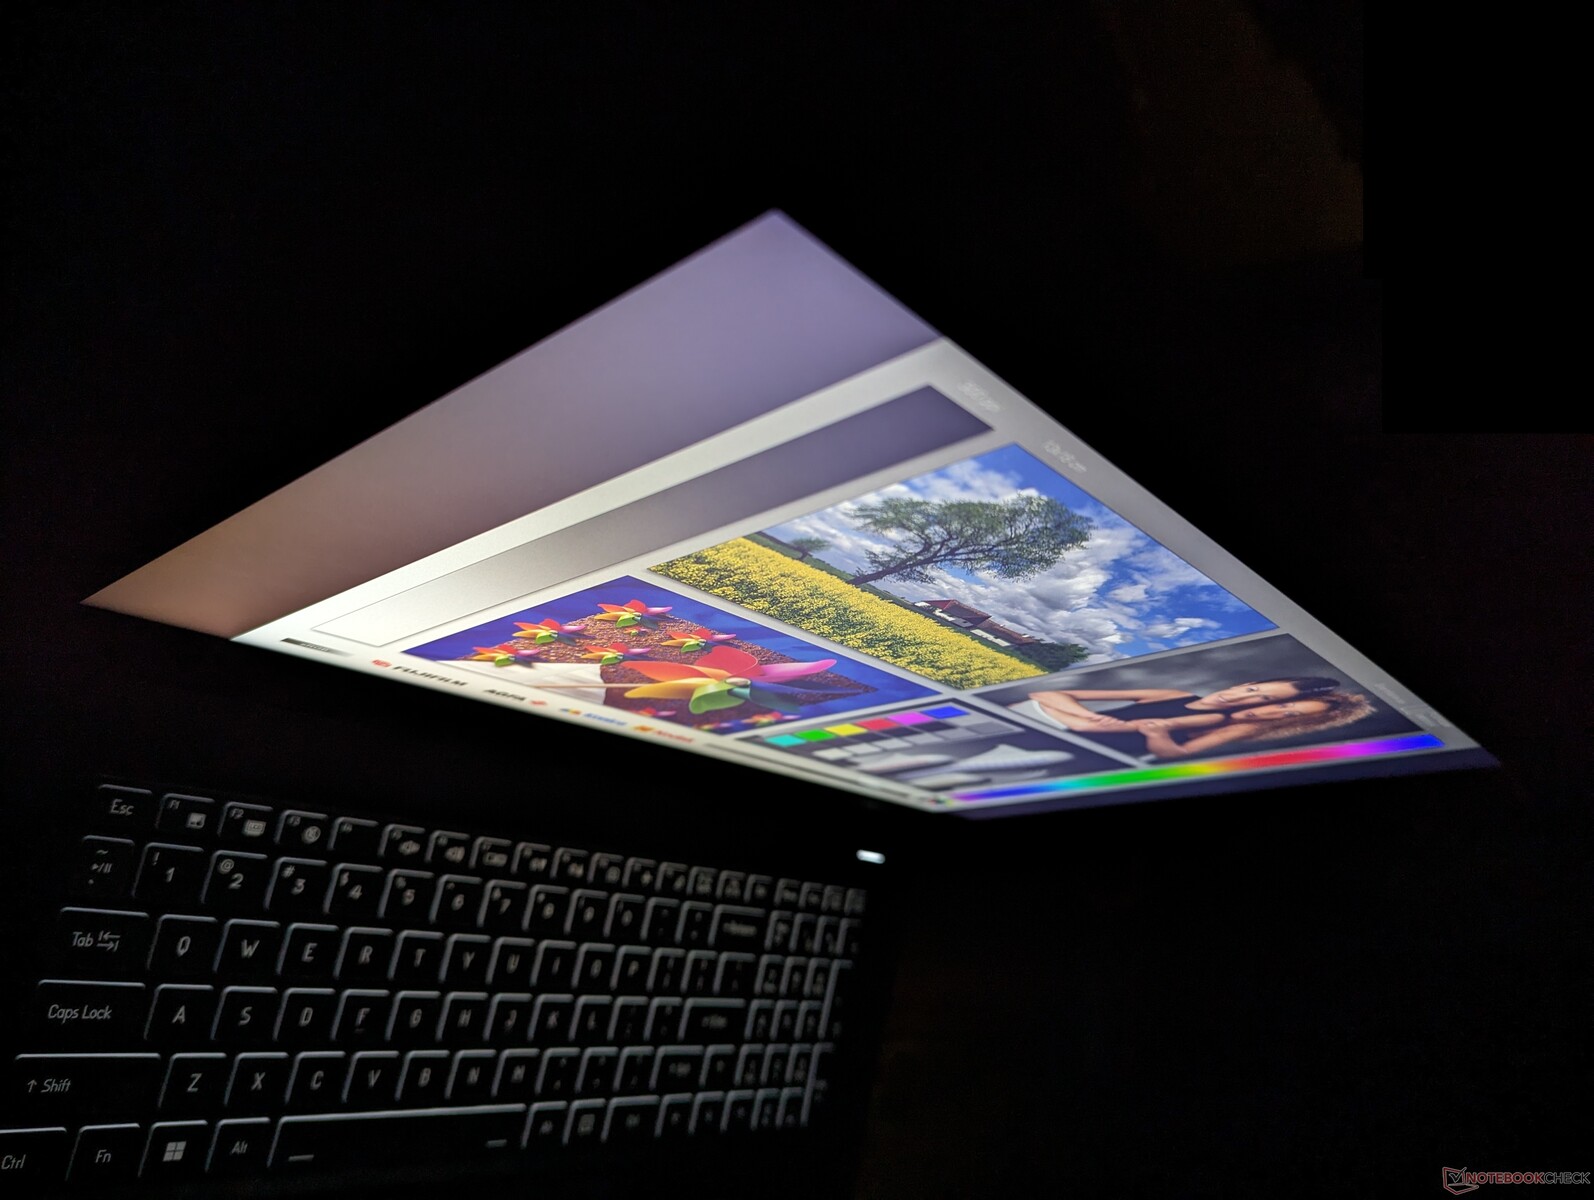
Uma das principais desvantagens da tela é o painel fosco um pouco granulado, o sangramento perceptível da luz de fundo em cenas escuras e a falta de suporte a HDR. As alternativas OLED parecem muito mais nítidas e vibrantes do que o Raptor X17 tem a oferecer nesse aspecto.
O painel BOE NE173QUM-NY1 também pode ser encontrado em outros modelos, como o Schenker Key 17 Pro.

| |||||||||||||||||||||||||
iluminação: 77 %
iluminação com acumulador: 544.6 cd/m²
Contraste: 1135:1 (Preto: 0.48 cd/m²)
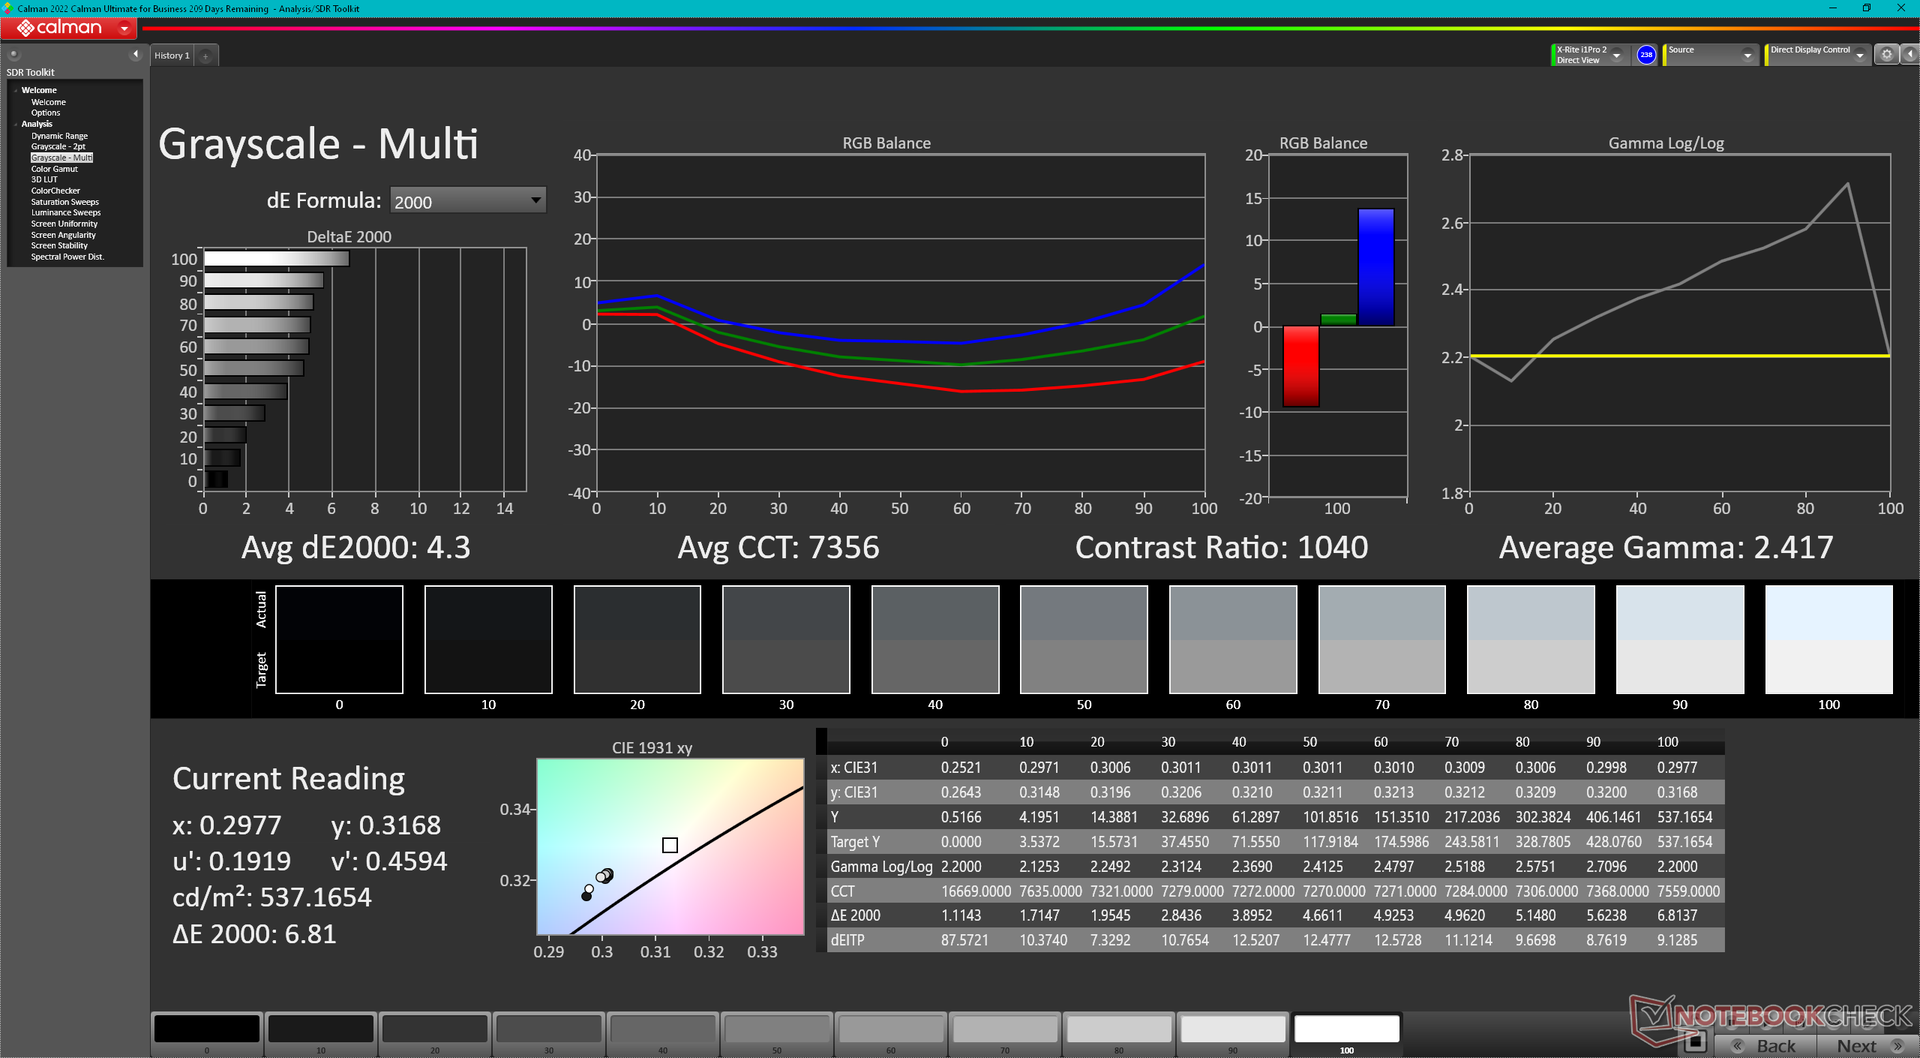
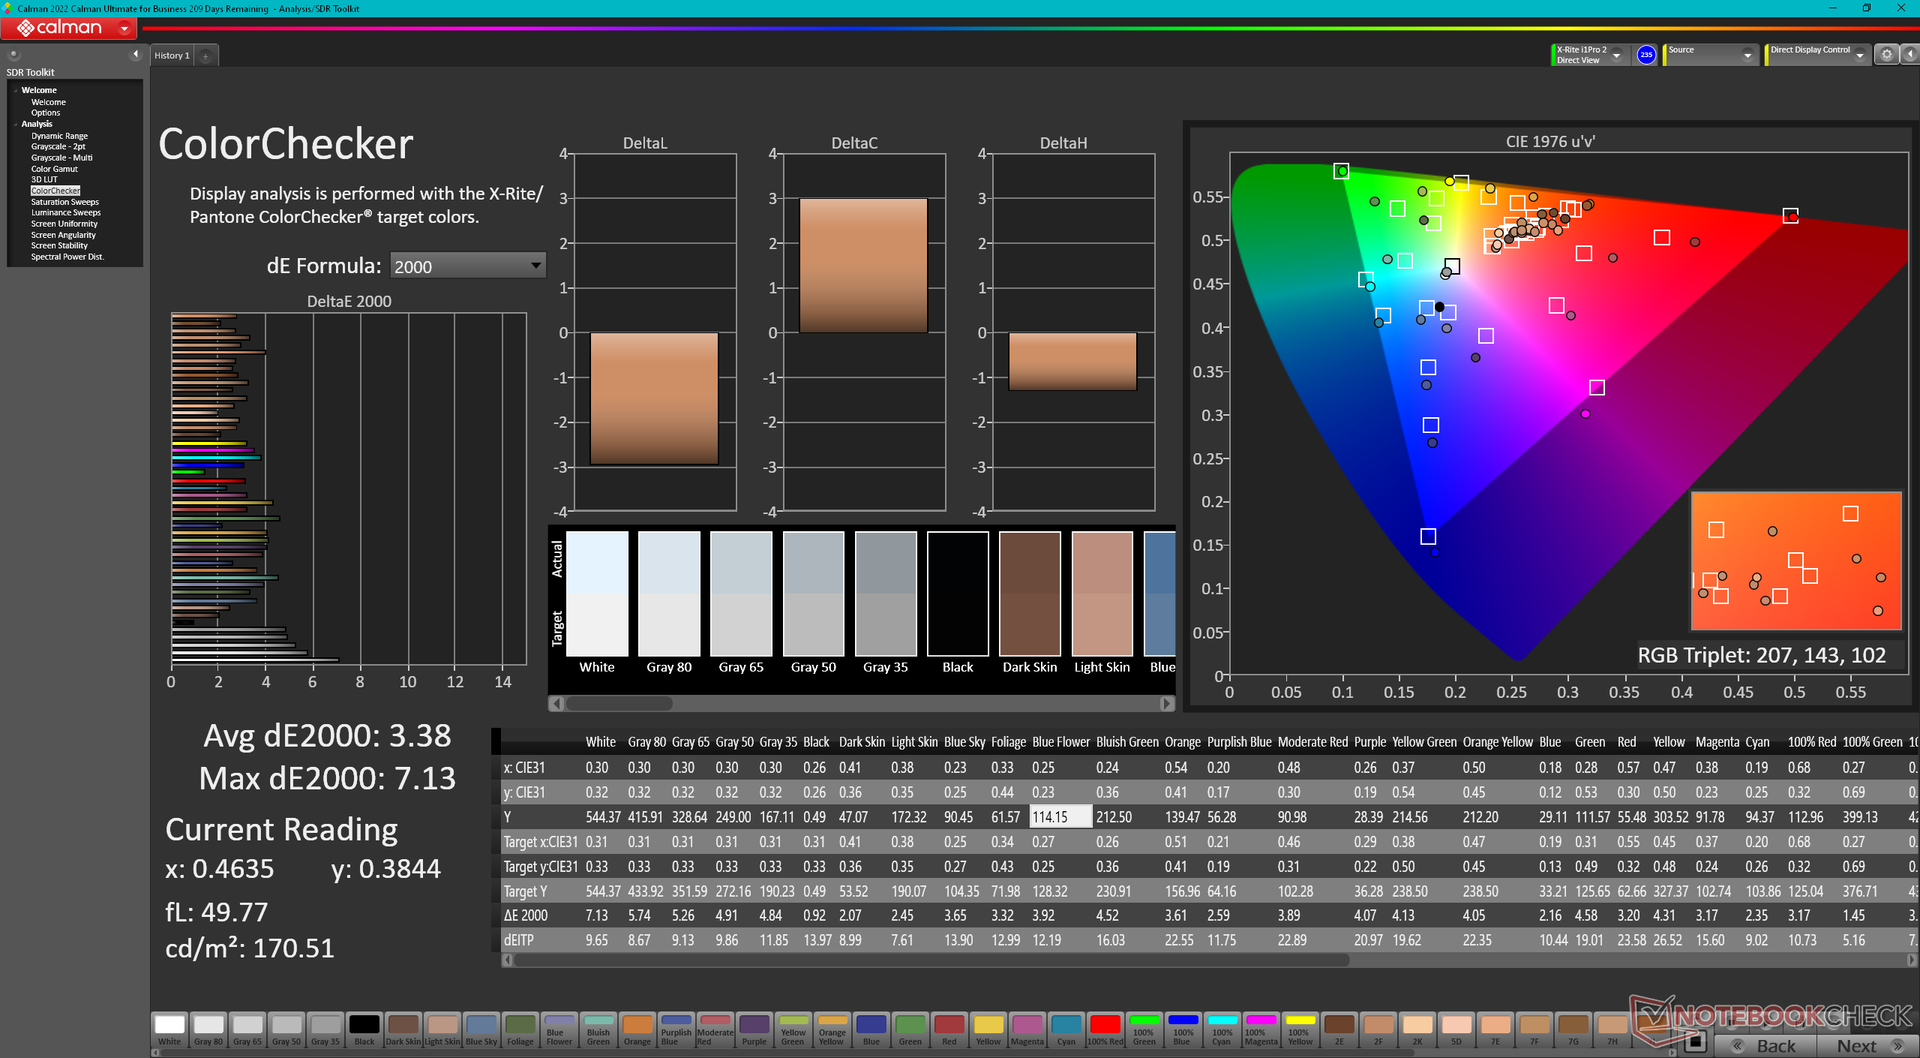
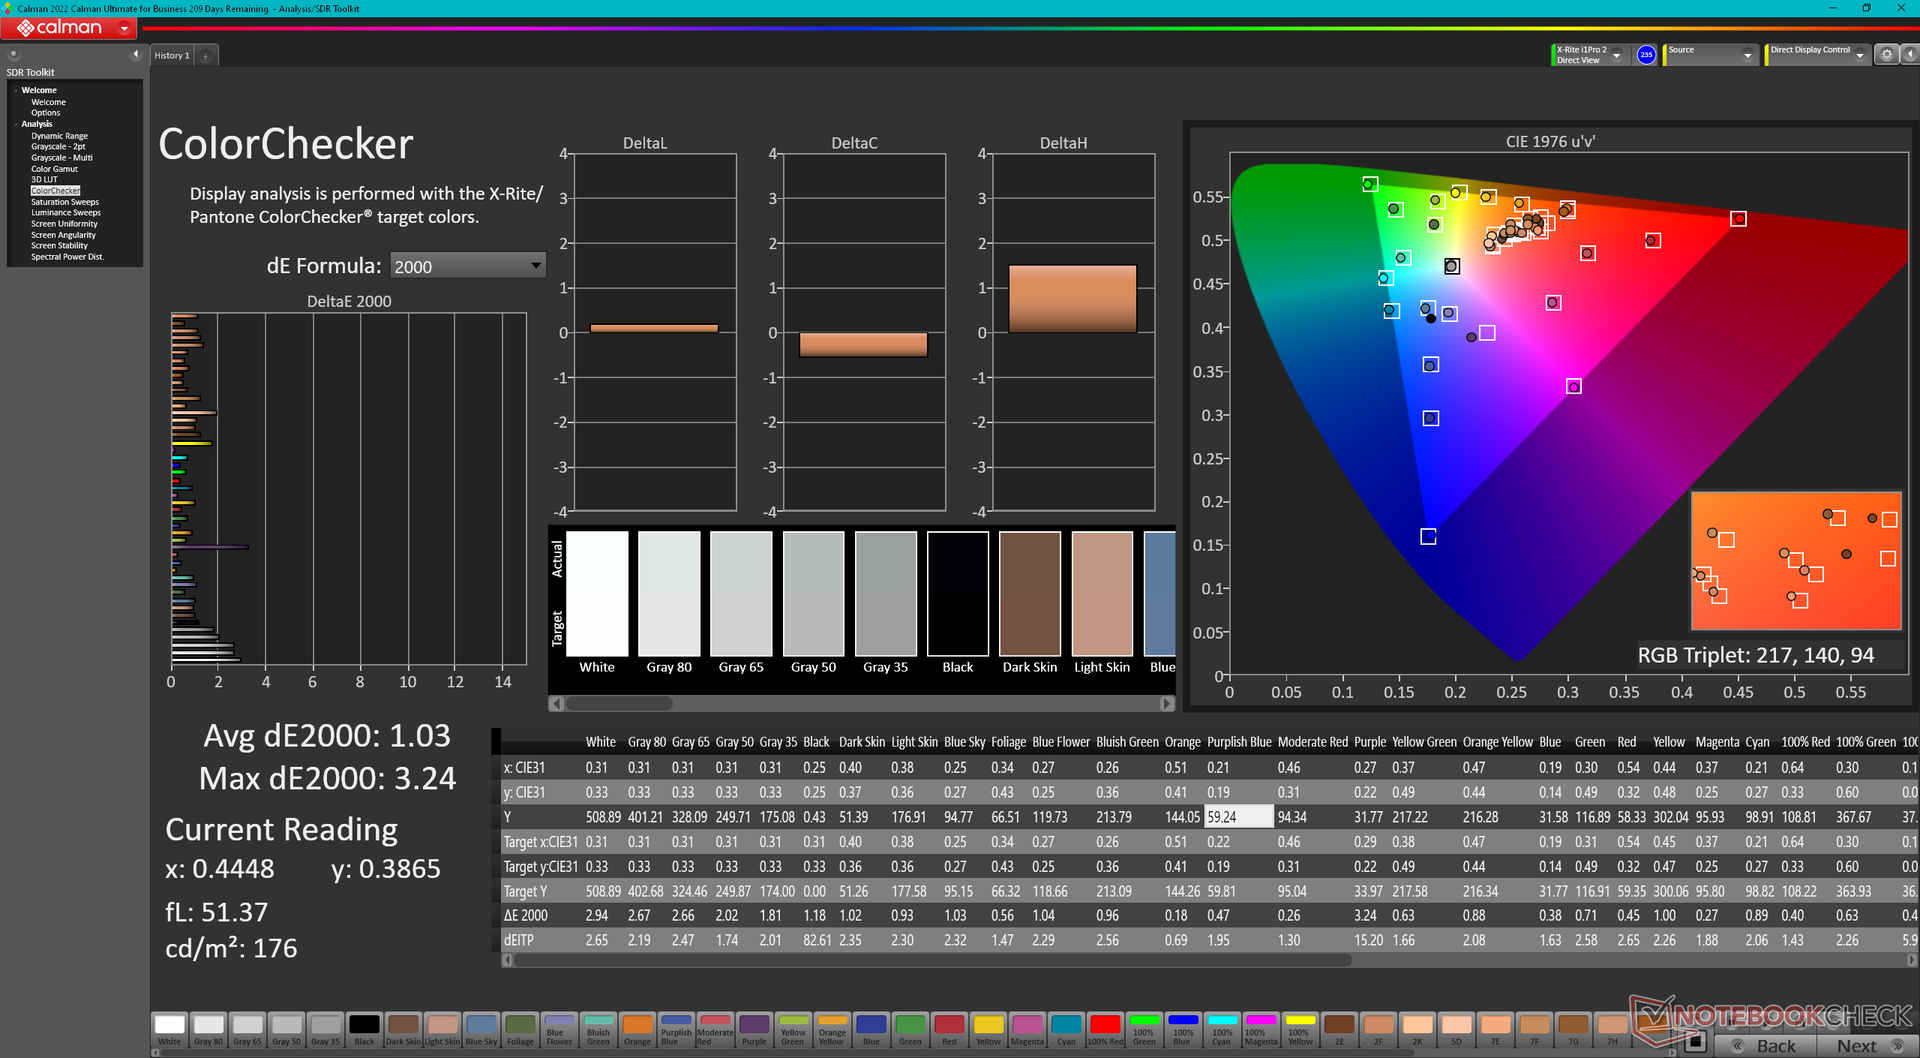
ΔE ColorChecker Calman: 3.38 | ∀{0.5-29.43 Ø4.71}
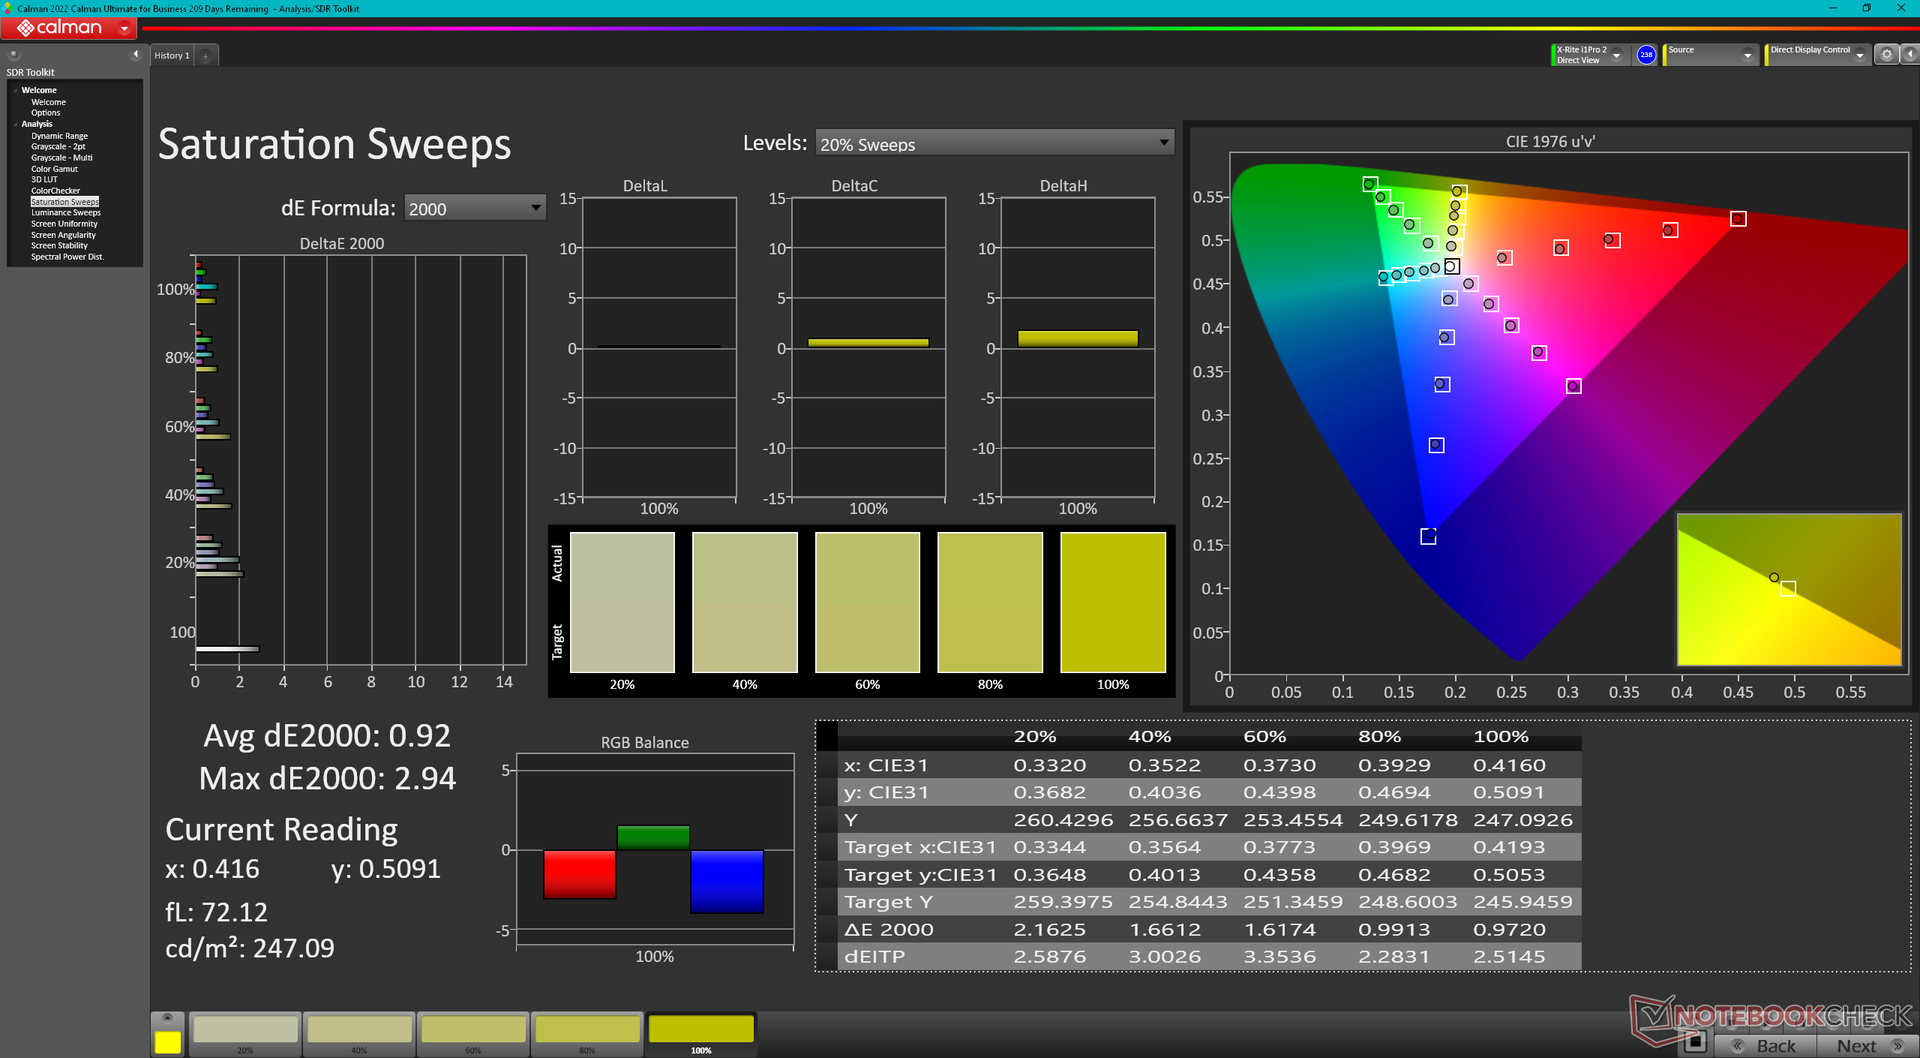
calibrated: 1.03
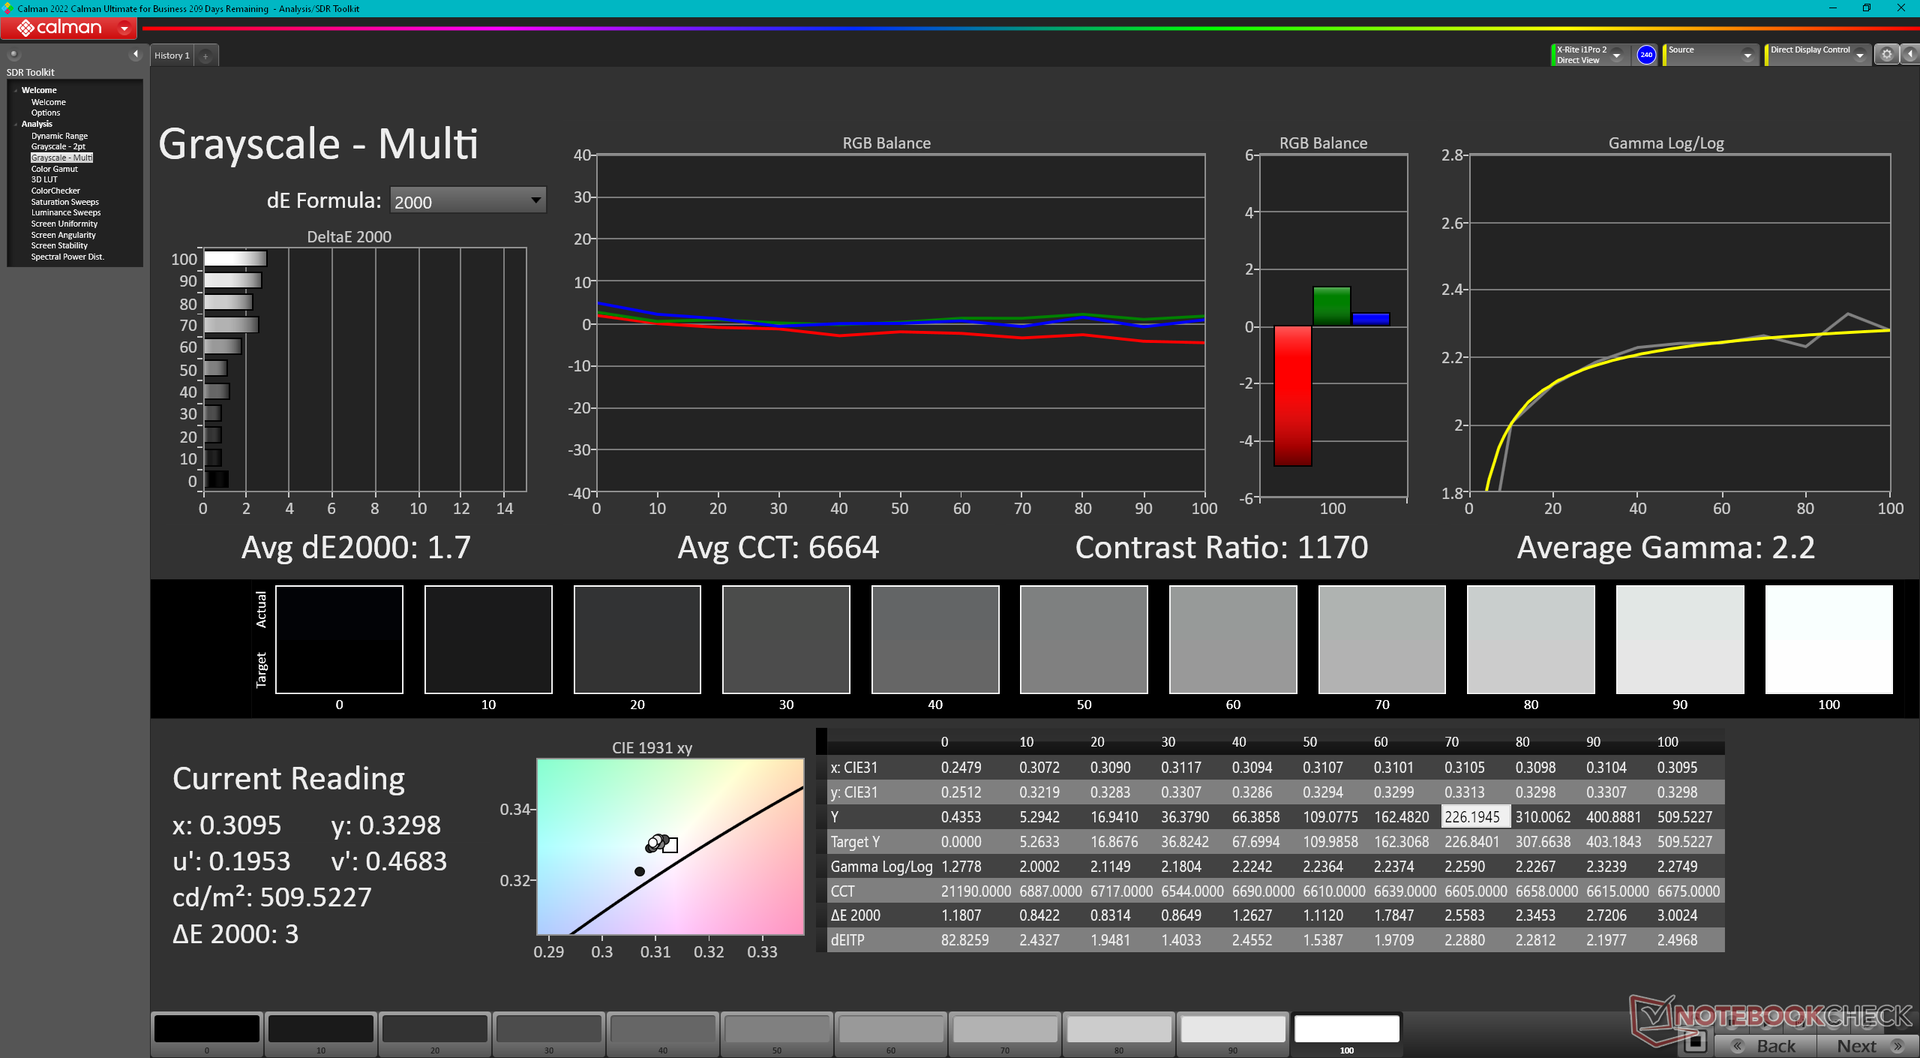
ΔE Greyscale Calman: 4.3 | ∀{0.09-98 Ø4.96}
84.2% AdobeRGB 1998 (Argyll 3D)
99.8% sRGB (Argyll 3D)
95.9% Display P3 (Argyll 3D)
Gamma: 2.42
CCT: 7356 K
| Eurocom Raptor X17 Core i9-14900HX BOE CQ NE173QUM-NY1, IPS, 3840x2160, 17.3" | Eurocom Raptor X17 BOE NE173QHM-NZ1, IPS, 2560x1440, 17.3" | Asus TUF Gaming A17 FA707XI-NS94 AU Optronics B173HAN04.9, IPS, 1920x1080, 17.3" | Asus ROG Strix Scar 17 G733PY-XS96 NE173QHM-NZ2, IPS, 2560x1440, 17.3" | MSI GE78HX 13VH-070US AU Optronics B170QAN01.2, IPS, 2560x1600, 17" | MSI Titan 18 HX A14VIG AU Optronics B180ZAN01.0, Mini-LED, 3840x2400, 18" | |
|---|---|---|---|---|---|---|
| Display | 1% | -50% | 1% | 2% | 1% | |
| Display P3 Coverage (%) | 95.9 | 97.8 2% | 39.7 -59% | 98 2% | 97.6 2% | 98.1 2% |
| sRGB Coverage (%) | 99.8 | 99.9 0% | 59.1 -41% | 100 0% | 99.9 0% | 99.8 0% |
| AdobeRGB 1998 Coverage (%) | 84.2 | 85.4 1% | 41 -51% | 85.6 2% | 86.5 3% | 86.2 2% |
| Response Times | 11% | -150% | 29% | 58% | -288% | |
| Response Time Grey 50% / Grey 80% * (ms) | 14.8 ? | 13.3 ? 10% | 39 ? -164% | 6.2 ? 58% | 4.2 ? 72% | 8.6 ? 42% |
| Response Time Black / White * (ms) | 11.4 ? | 10 ? 12% | 26.9 ? -136% | 11.4 ? -0% | 6.4 ? 44% | 81.8 ? -618% |
| PWM Frequency (Hz) | 2592 ? | |||||
| Screen | -4% | -33% | 22% | -16% | -23% | |
| Brightness middle (cd/m²) | 544.6 | 312.6 -43% | 255.9 -53% | 322.5 -41% | 398.6 -27% | 467.5 -14% |
| Brightness (cd/m²) | 507 | 292 -42% | 248 -51% | 317 -37% | 384 -24% | 459 -9% |
| Brightness Distribution (%) | 77 | 75 -3% | 91 18% | 86 12% | 89 16% | 90 17% |
| Black Level * (cd/m²) | 0.48 | 0.26 46% | 0.21 56% | 0.29 40% | 0.46 4% | |
| Contrast (:1) | 1135 | 1202 6% | 1219 7% | 1112 -2% | 867 -24% | |
| Colorchecker dE 2000 * | 3.38 | 3.43 -1% | 4.51 -33% | 1.15 66% | 4.05 -20% | 3.77 -12% |
| Colorchecker dE 2000 max. * | 7.13 | 8.31 -17% | 20.77 -191% | 3.03 58% | 8.68 -22% | 6.12 14% |
| Colorchecker dE 2000 calibrated * | 1.03 | 0.74 28% | 1.82 -77% | 0.56 46% | 1.02 1% | 2.94 -185% |
| Greyscale dE 2000 * | 4.3 | 4.8 -12% | 3.2 26% | 1.7 60% | 6.5 -51% | 3.2 26% |
| Gamma | 2.42 91% | 2.12 104% | 2.08 106% | 2.27 97% | 2.11 104% | 2.43 91% |
| CCT | 7356 88% | 7082 92% | 6054 107% | 6299 103% | 7518 86% | 6478 100% |
| Média Total (Programa/Configurações) | 3% /
-1% | -78% /
-54% | 17% /
19% | 15% /
-2% | -103% /
-61% |
* ... menor é melhor
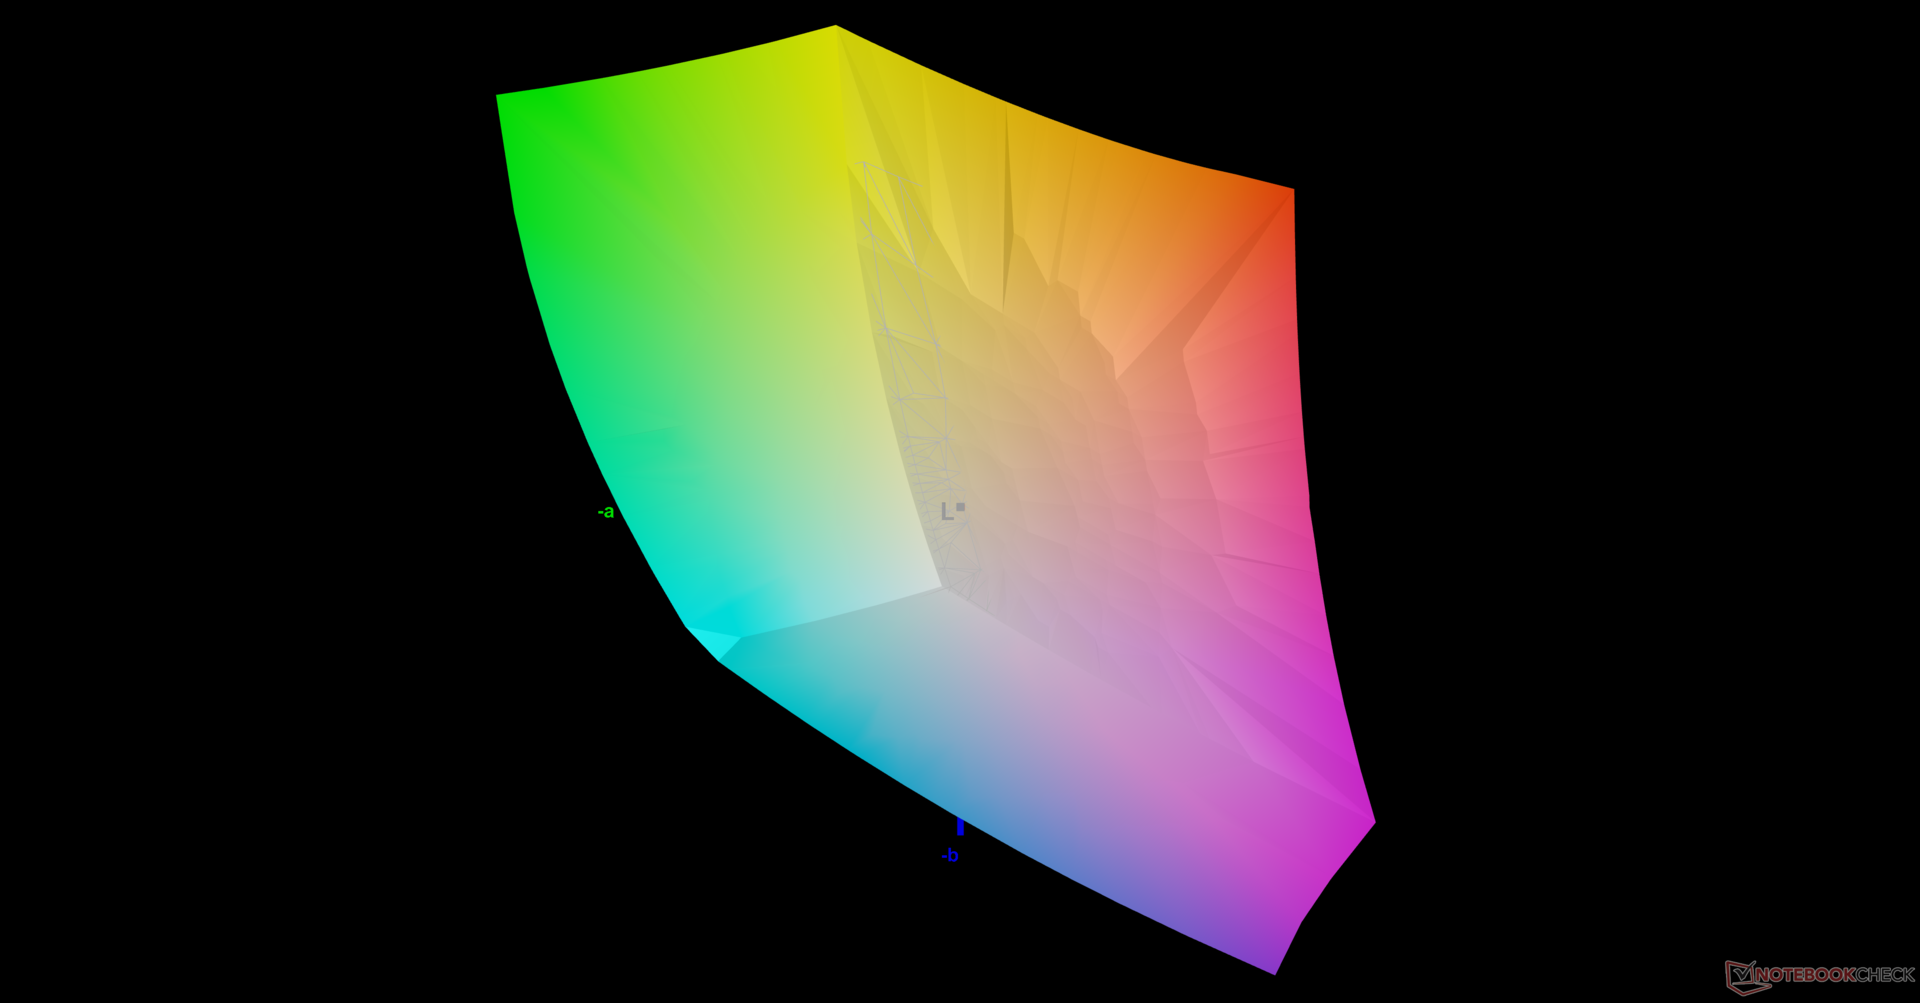
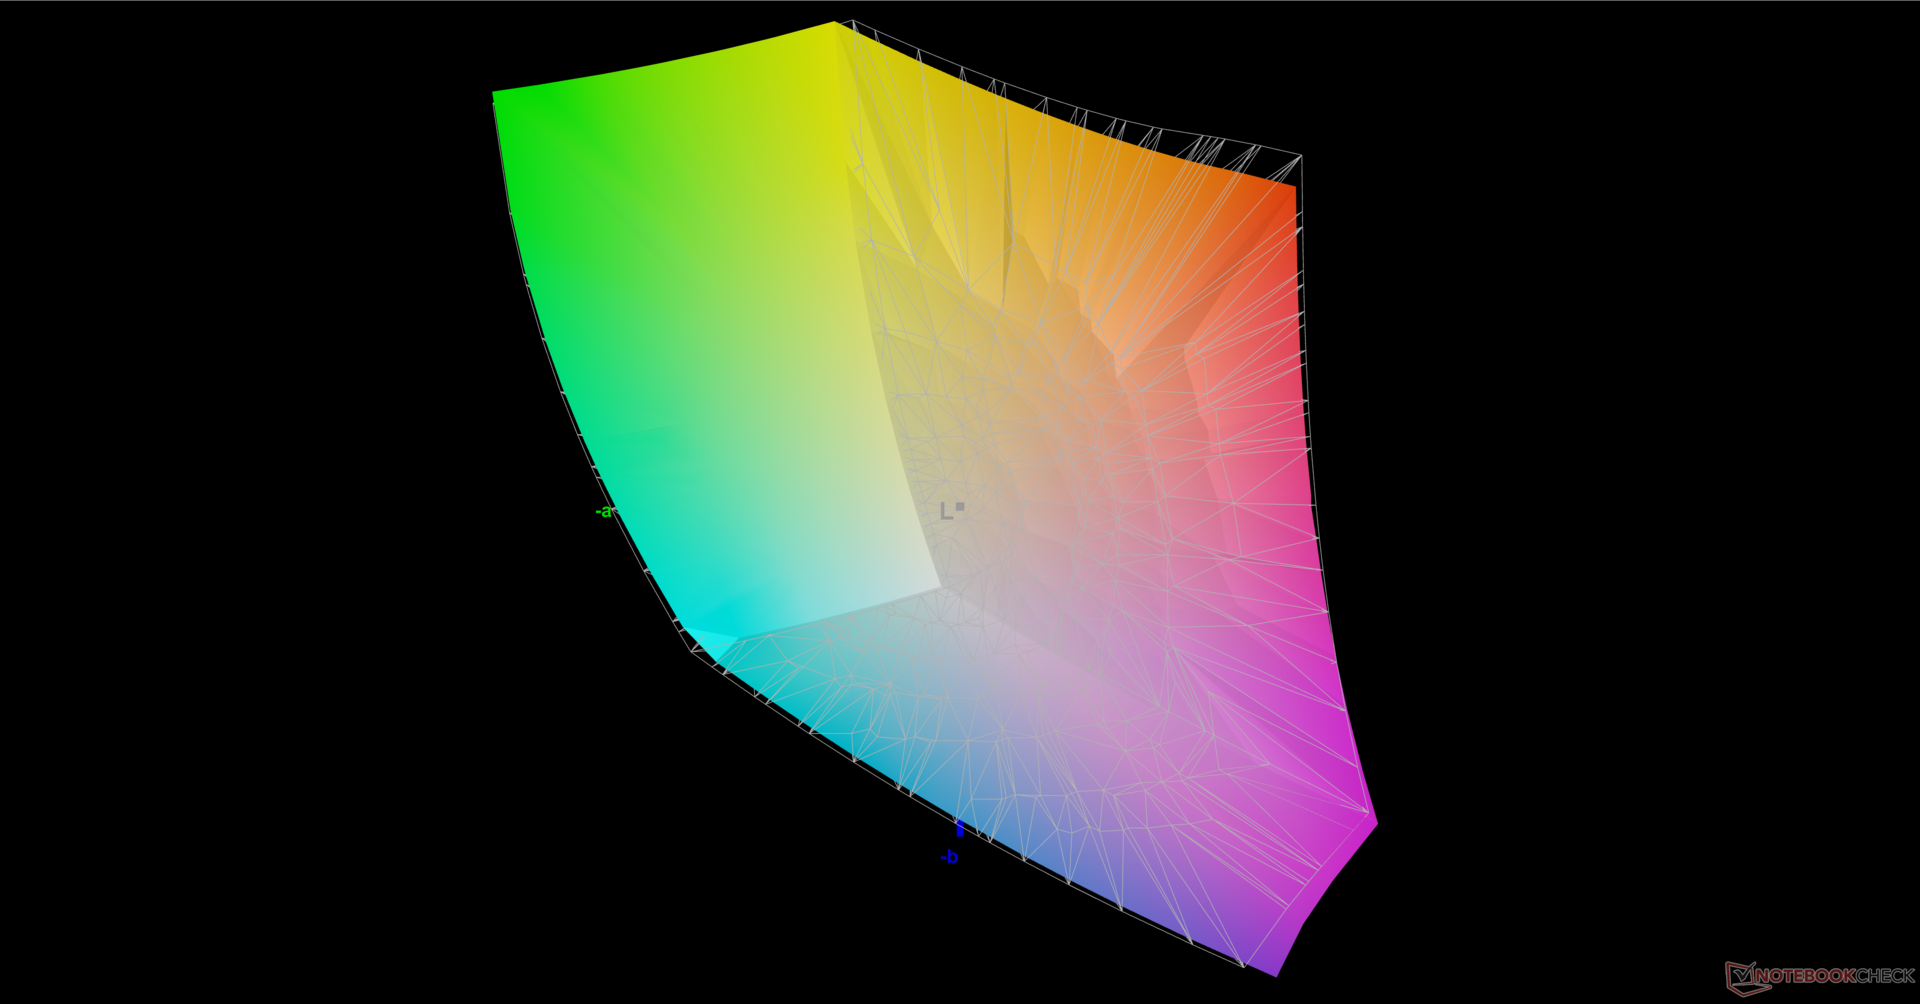
Embora o padrão P3 seja compatível, a precisão das cores poderia ter sido melhor. A temperatura da cor é muito fria, o que afeta os valores de escala de cinza e deltaE de cor. A calibração com nosso colorímetro X-Rite resolve esse problema. Nosso perfil ICM está disponível para download gratuito acima.
Exibir tempos de resposta
| ↔ Tempo de resposta preto para branco | ||
|---|---|---|
| 11.4 ms ... ascensão ↗ e queda ↘ combinadas | ↗ 6.1 ms ascensão | 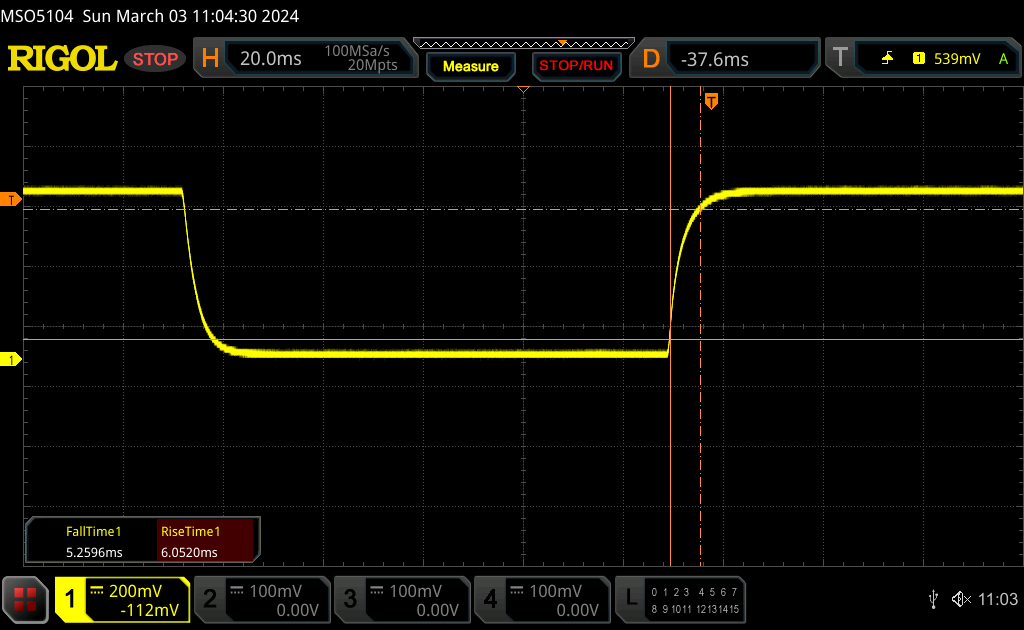 |
| ↘ 5.3 ms queda | ||
| A tela mostra boas taxas de resposta em nossos testes, mas pode ser muito lenta para jogadores competitivos. Em comparação, todos os dispositivos testados variam de 0.1 (mínimo) a 240 (máximo) ms. » 31 % de todos os dispositivos são melhores. Isso significa que o tempo de resposta medido é melhor que a média de todos os dispositivos testados (19.8 ms). | ||
| ↔ Tempo de resposta 50% cinza a 80% cinza | ||
| 14.8 ms ... ascensão ↗ e queda ↘ combinadas | ↗ 7.2 ms ascensão | 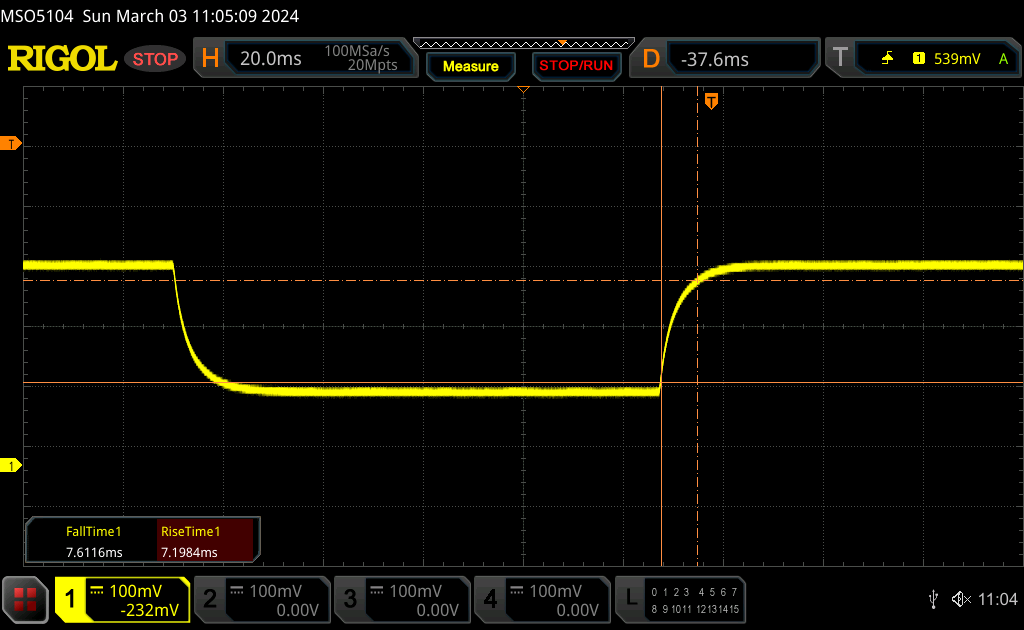 |
| ↘ 7.6 ms queda | ||
| A tela mostra boas taxas de resposta em nossos testes, mas pode ser muito lenta para jogadores competitivos. Em comparação, todos os dispositivos testados variam de 0.165 (mínimo) a 636 (máximo) ms. » 29 % de todos os dispositivos são melhores. Isso significa que o tempo de resposta medido é melhor que a média de todos os dispositivos testados (31 ms). | ||
Cintilação da tela / PWM (modulação por largura de pulso)
| Tela tremeluzindo / PWM não detectado | 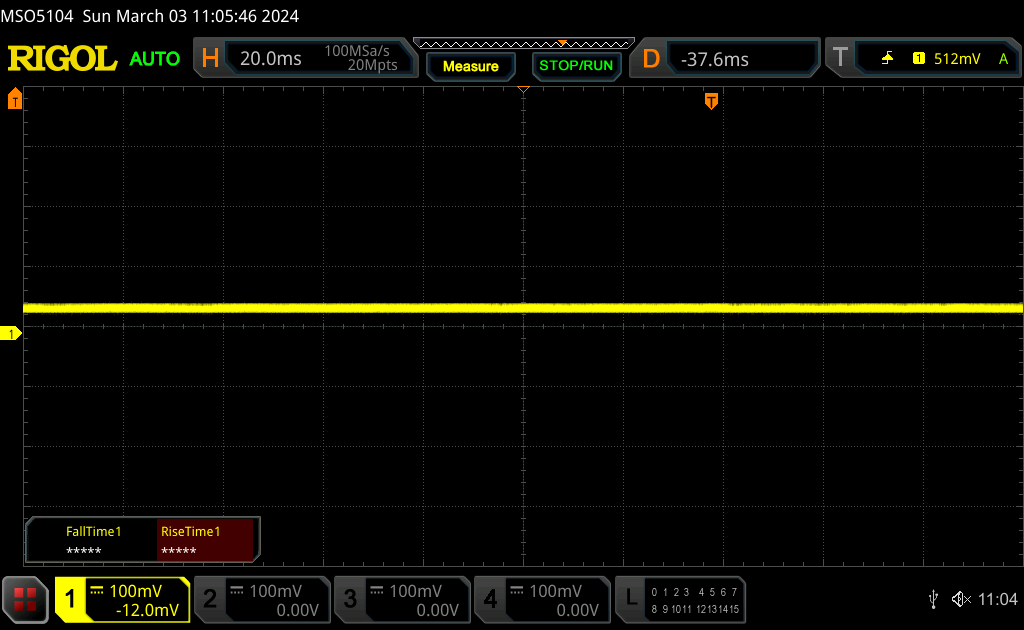 | ||
[pwm_comparison] Em comparação: 52 % de todos os dispositivos testados não usam PWM para escurecer a tela. Se PWM foi detectado, uma média de 7757 (mínimo: 5 - máximo: 343500) Hz foi medida. | |||
Desempenho - Raptor Lake-HX Refresh
Condições de teste
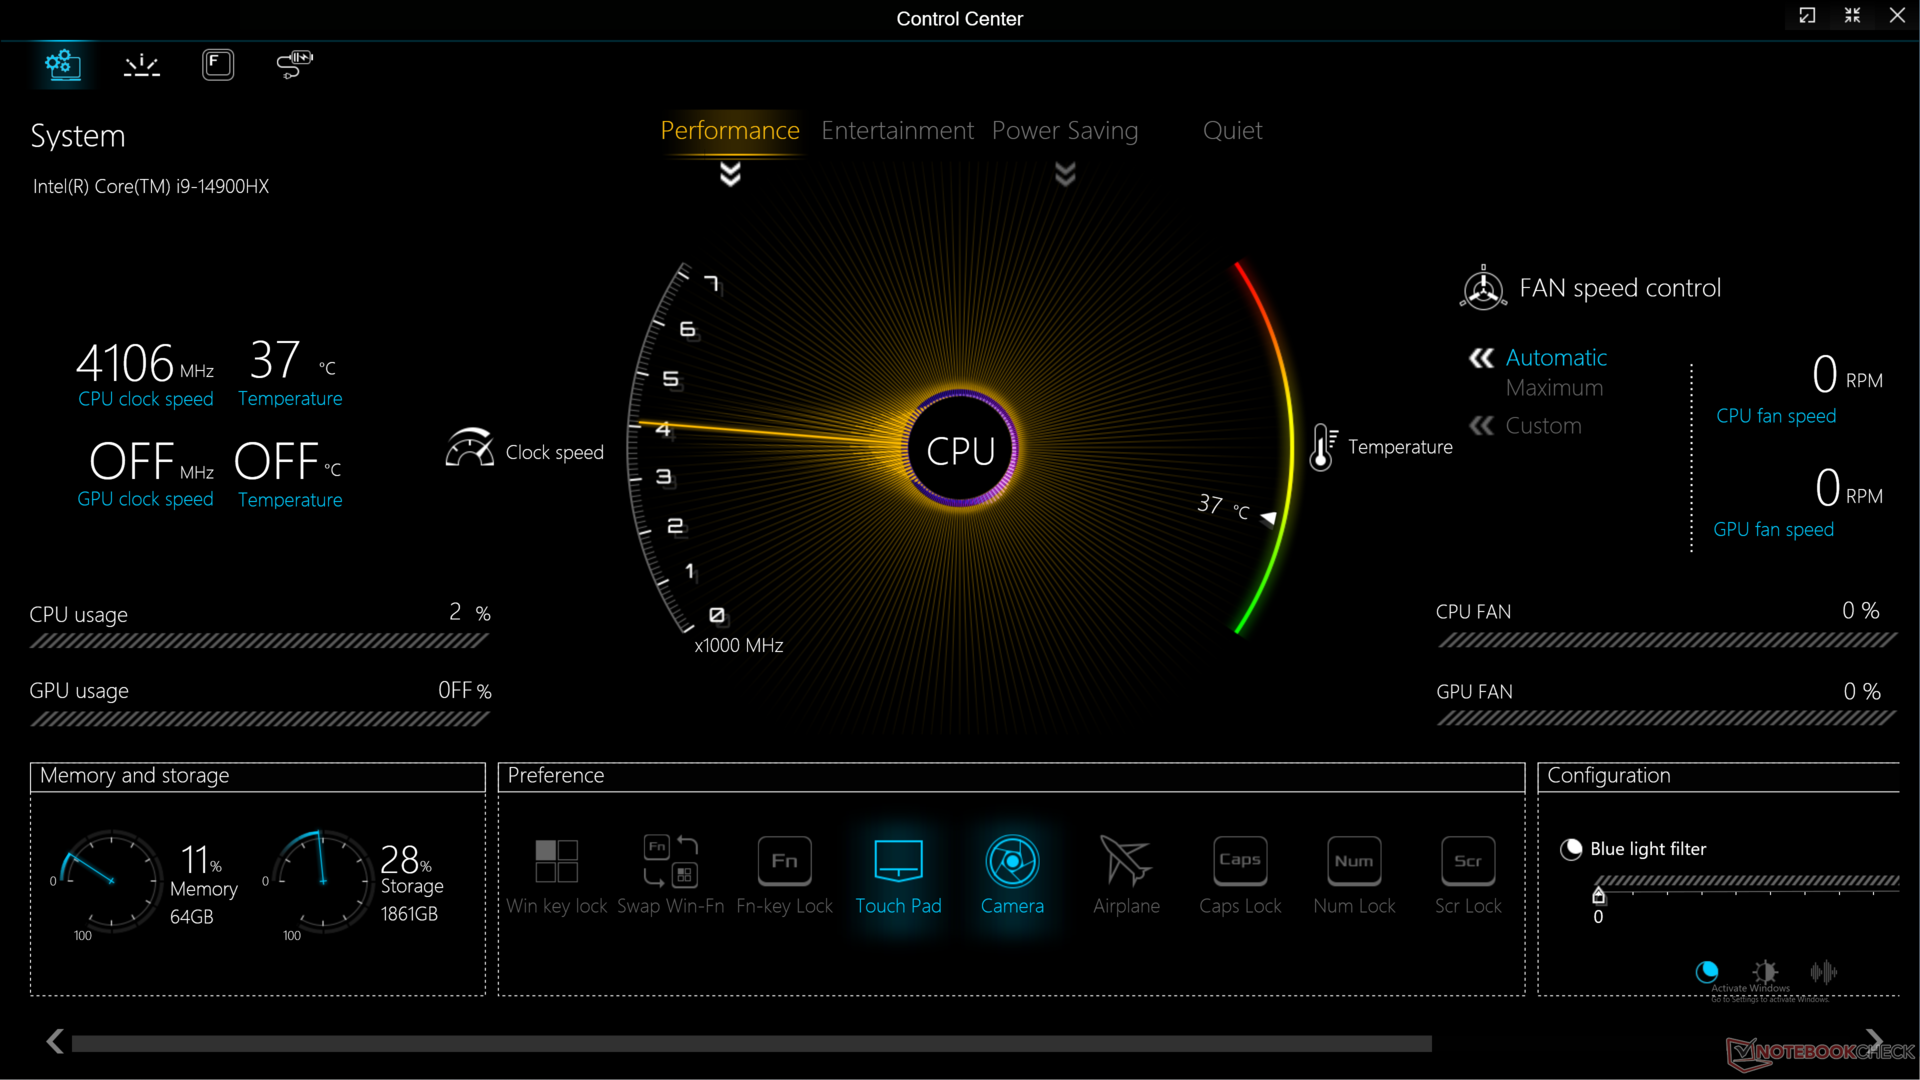
Configuramos o Windows e o Control Center para o modo Desempenho com o ventilador máximo ativo antes de executar os benchmarks abaixo. O interruptor manual da GPU também pode ser encontrado no Control Center, mas está inconvenientemente oculto atrás de uma barra de rolagem. O G-Sync é suportado, enquanto o Advanced Optimus não é, o que significa que é necessário reiniciar o computador ao alternar entre a iGPU e a dGPU.
Os modos "Entretenimento" e "Desempenho" no Control Center podem ser um pouco confusos. Talvez seja mais apropriado renomear o modo "Entretenimento" para algo como "Equilibrado".
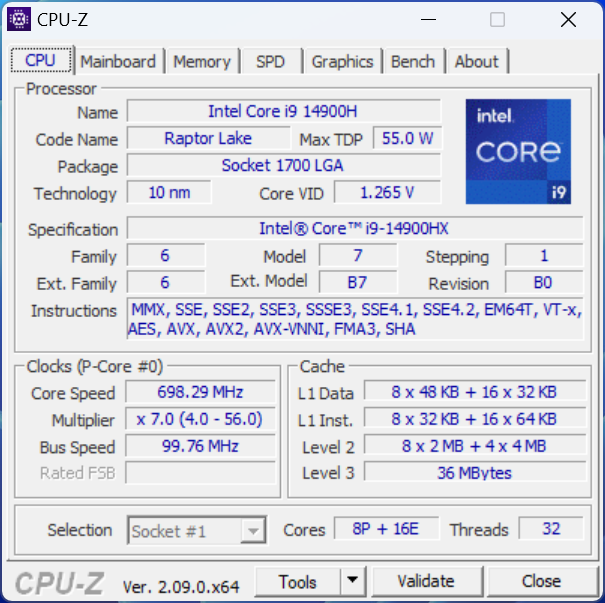
Processador
A série Raptor Lake-HX foi atualizada para 2024, mas os benefícios de desempenho são, na melhor das hipóteses, marginais em comparação com a série 2023. Passando do Core i9-13900HX no Raptor X17 do ano passado para o Core i9-14900HX nessa nova configuração melhora o desempenho em apenas 5 a 10 por cento. O chipset não apresenta uma NPU integrada, ao contrário da plataforma Meteor Lake.
Cinebench R15 Multi Loop
Cinebench R23: Multi Core | Single Core
Cinebench R20: CPU (Multi Core) | CPU (Single Core)
Cinebench R15: CPU Multi 64Bit | CPU Single 64Bit
Blender: v2.79 BMW27 CPU
7-Zip 18.03: 7z b 4 | 7z b 4 -mmt1
Geekbench 6.7: Multi-Core | Single-Core
Geekbench 5.5: Multi-Core | Single-Core
HWBOT x265 Benchmark v2.2: 4k Preset
LibreOffice : 20 Documents To PDF
R Benchmark 2.5: Overall mean
| CPU Performance rating | |
| KFA2 GeForce RTX 4080 Super SG -6! | |
| Asus ROG Strix Scar 17 G733PYV-LL053X | |
| Asus ROG Strix Scar 17 G733PY-XS96 -2! | |
| MSI GE78HX 13VH-070US -2! | |
| MSI Titan 18 HX A14VIG | |
| MSI Raider GE78 HX 13VI | |
| Média Intel Core i9-14900HX | |
| Eurocom Raptor X17 Core i9-14900HX | |
| Eurocom Raptor X17 -2! | |
| Alienware x16 R1 -3! | |
| Asus TUF Gaming A17 FA707XI-NS94 | |
| Dell XPS 17 9730 RTX 4070 -2! | |
| Medion Erazer Defender P40 -2! | |
| Eurocom Nightsky TXi317 -4! | |
| Acer Nitro 17 AN17-41-R9LN | |
| Alienware m17 R5 (R9 6900HX, RX 6850M XT) -2! | |
| Geekbench 6.7 / Multi-Core | |
| KFA2 GeForce RTX 4080 Super SG | |
| Eurocom Raptor X17 Core i9-14900HX | |
| MSI Raider GE78 HX 13VI | |
| Média Intel Core i9-14900HX (13158 - 19665, n=37) | |
| Asus ROG Strix Scar 17 G733PYV-LL053X | |
| MSI Titan 18 HX A14VIG | |
| Asus TUF Gaming A17 FA707XI-NS94 | |
| Acer Nitro 17 AN17-41-R9LN | |
| Geekbench 6.7 / Single-Core | |
| KFA2 GeForce RTX 4080 Super SG | |
| Média Intel Core i9-14900HX (2419 - 3129, n=37) | |
| Asus ROG Strix Scar 17 G733PYV-LL053X | |
| Eurocom Raptor X17 Core i9-14900HX | |
| MSI Titan 18 HX A14VIG | |
| MSI Raider GE78 HX 13VI | |
| Asus TUF Gaming A17 FA707XI-NS94 | |
| Acer Nitro 17 AN17-41-R9LN | |
Cinebench R23: Multi Core | Single Core
Cinebench R20: CPU (Multi Core) | CPU (Single Core)
Cinebench R15: CPU Multi 64Bit | CPU Single 64Bit
Blender: v2.79 BMW27 CPU
7-Zip 18.03: 7z b 4 | 7z b 4 -mmt1
Geekbench 6.7: Multi-Core | Single-Core
Geekbench 5.5: Multi-Core | Single-Core
HWBOT x265 Benchmark v2.2: 4k Preset
LibreOffice : 20 Documents To PDF
R Benchmark 2.5: Overall mean
* ... menor é melhor
AIDA64: FP32 Ray-Trace | FPU Julia | CPU SHA3 | CPU Queen | FPU SinJulia | FPU Mandel | CPU AES | CPU ZLib | FP64 Ray-Trace | CPU PhotoWorxx
| Performance rating | |
| Asus ROG Strix Scar 17 G733PY-XS96 | |
| Eurocom Raptor X17 Core i9-14900HX | |
| MSI GE78HX 13VH-070US | |
| MSI Titan 18 HX A14VIG | |
| Média Intel Core i9-14900HX | |
| Eurocom Raptor X17 | |
| Asus TUF Gaming A17 FA707XI-NS94 | |
| AIDA64 / FP32 Ray-Trace | |
| Asus ROG Strix Scar 17 G733PY-XS96 | |
| MSI Titan 18 HX A14VIG | |
| Asus TUF Gaming A17 FA707XI-NS94 | |
| MSI GE78HX 13VH-070US | |
| Eurocom Raptor X17 Core i9-14900HX | |
| Média Intel Core i9-14900HX (13098 - 33474, n=36) | |
| Eurocom Raptor X17 | |
| AIDA64 / FPU Julia | |
| Asus ROG Strix Scar 17 G733PY-XS96 | |
| MSI Titan 18 HX A14VIG | |
| MSI GE78HX 13VH-070US | |
| Eurocom Raptor X17 Core i9-14900HX | |
| Média Intel Core i9-14900HX (67573 - 166040, n=36) | |
| Asus TUF Gaming A17 FA707XI-NS94 | |
| Eurocom Raptor X17 | |
| AIDA64 / CPU SHA3 | |
| Asus ROG Strix Scar 17 G733PY-XS96 | |
| MSI Titan 18 HX A14VIG | |
| Eurocom Raptor X17 Core i9-14900HX | |
| MSI GE78HX 13VH-070US | |
| Média Intel Core i9-14900HX (3589 - 7979, n=36) | |
| Eurocom Raptor X17 | |
| Asus TUF Gaming A17 FA707XI-NS94 | |
| AIDA64 / CPU Queen | |
| Asus ROG Strix Scar 17 G733PY-XS96 | |
| MSI Titan 18 HX A14VIG | |
| Eurocom Raptor X17 Core i9-14900HX | |
| MSI GE78HX 13VH-070US | |
| Média Intel Core i9-14900HX (118405 - 148966, n=36) | |
| Eurocom Raptor X17 | |
| Asus TUF Gaming A17 FA707XI-NS94 | |
| AIDA64 / FPU SinJulia | |
| Asus ROG Strix Scar 17 G733PY-XS96 | |
| MSI Titan 18 HX A14VIG | |
| MSI GE78HX 13VH-070US | |
| Eurocom Raptor X17 Core i9-14900HX | |
| Asus TUF Gaming A17 FA707XI-NS94 | |
| Média Intel Core i9-14900HX (10475 - 18517, n=36) | |
| Eurocom Raptor X17 | |
| AIDA64 / FPU Mandel | |
| Asus ROG Strix Scar 17 G733PY-XS96 | |
| MSI Titan 18 HX A14VIG | |
| MSI GE78HX 13VH-070US | |
| Eurocom Raptor X17 Core i9-14900HX | |
| Asus TUF Gaming A17 FA707XI-NS94 | |
| Média Intel Core i9-14900HX (32543 - 83662, n=36) | |
| Eurocom Raptor X17 | |
| AIDA64 / CPU AES | |
| Eurocom Raptor X17 Core i9-14900HX | |
| Asus ROG Strix Scar 17 G733PY-XS96 | |
| Média Intel Core i9-14900HX (86964 - 241777, n=36) | |
| MSI Titan 18 HX A14VIG | |
| MSI GE78HX 13VH-070US | |
| Eurocom Raptor X17 | |
| Asus TUF Gaming A17 FA707XI-NS94 | |
| AIDA64 / CPU ZLib | |
| Asus ROG Strix Scar 17 G733PY-XS96 | |
| MSI Titan 18 HX A14VIG | |
| MSI GE78HX 13VH-070US | |
| Eurocom Raptor X17 Core i9-14900HX | |
| Eurocom Raptor X17 | |
| Média Intel Core i9-14900HX (1054 - 2292, n=36) | |
| Asus TUF Gaming A17 FA707XI-NS94 | |
| AIDA64 / FP64 Ray-Trace | |
| Asus ROG Strix Scar 17 G733PY-XS96 | |
| MSI Titan 18 HX A14VIG | |
| Asus TUF Gaming A17 FA707XI-NS94 | |
| MSI GE78HX 13VH-070US | |
| Eurocom Raptor X17 Core i9-14900HX | |
| Média Intel Core i9-14900HX (6809 - 18349, n=36) | |
| Eurocom Raptor X17 | |
| AIDA64 / CPU PhotoWorxx | |
| Eurocom Raptor X17 | |
| Eurocom Raptor X17 Core i9-14900HX | |
| MSI GE78HX 13VH-070US | |
| Média Intel Core i9-14900HX (23903 - 54702, n=36) | |
| Asus ROG Strix Scar 17 G733PY-XS96 | |
| MSI Titan 18 HX A14VIG | |
| Asus TUF Gaming A17 FA707XI-NS94 | |
Teste de estresse
A temperatura do núcleo ao executar o estresse do Prime95 é um pouco mais baixa desta vez, 91 °C, em comparação com 97 °C no modelo do ano passado, o que sugere pequenos ganhos de eficiência.
A execução do Witcher 3 para representar cargas típicas de jogos com o modo Ventilador máximo ativado e desativado não mostra grandes diferenças de desempenho entre eles. Os resultados complementam nossos resultados do site Fire Strike na seção Desempenho da GPU abaixo. A ativação do modo Maximum Fan apenas faz com que as ventoinhas funcionem em seu RPM máximo, independentemente da carga na tela; na verdade, não aumenta o teto máximo da ventoinha. Portanto, o ruído da ventoinha durante os jogos será o mesmo entre os dois modos.
O consumo de energia da placa da GPU durante os jogos é estável em 169 W, o que quase atinge a meta máxima de 175 W. A redução para o modo Entretenimento diminui o consumo de energia da placa para 148 W, proporcionando um desempenho gráfico um pouco mais lento.
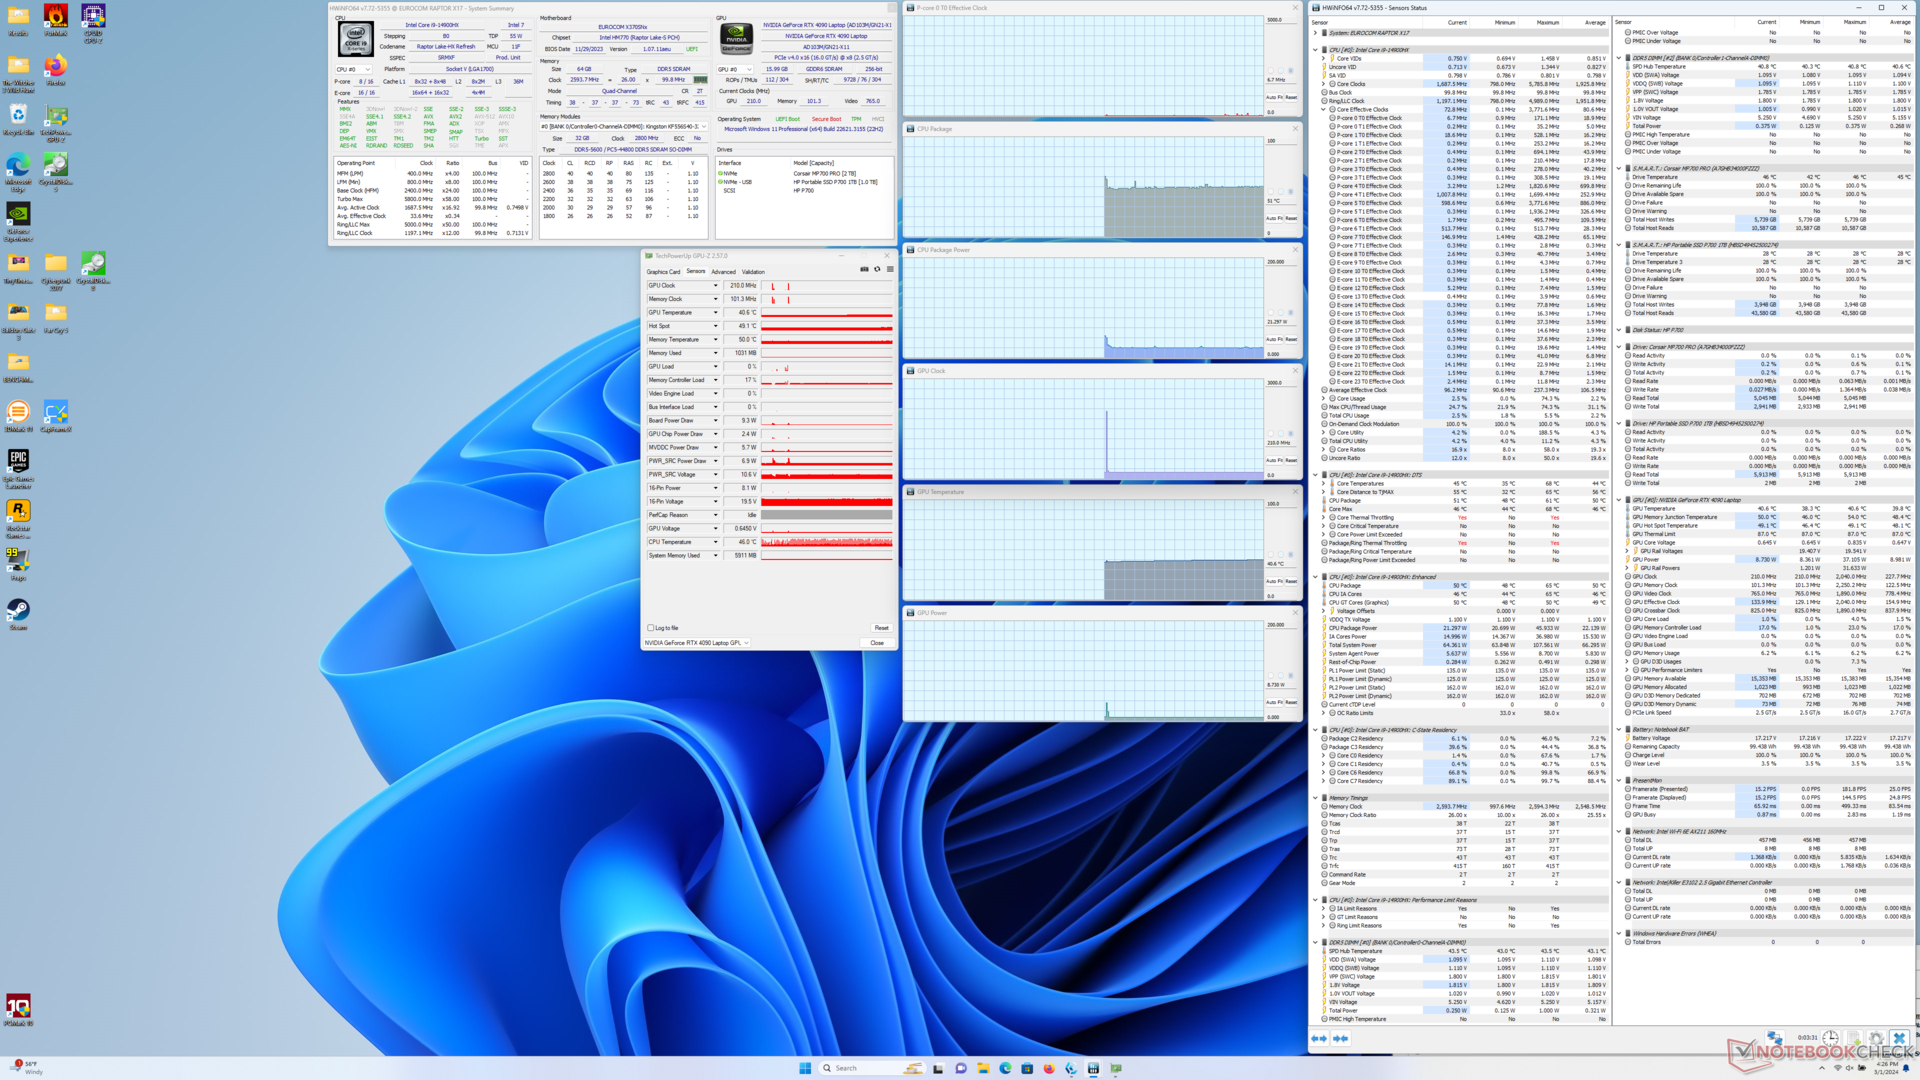
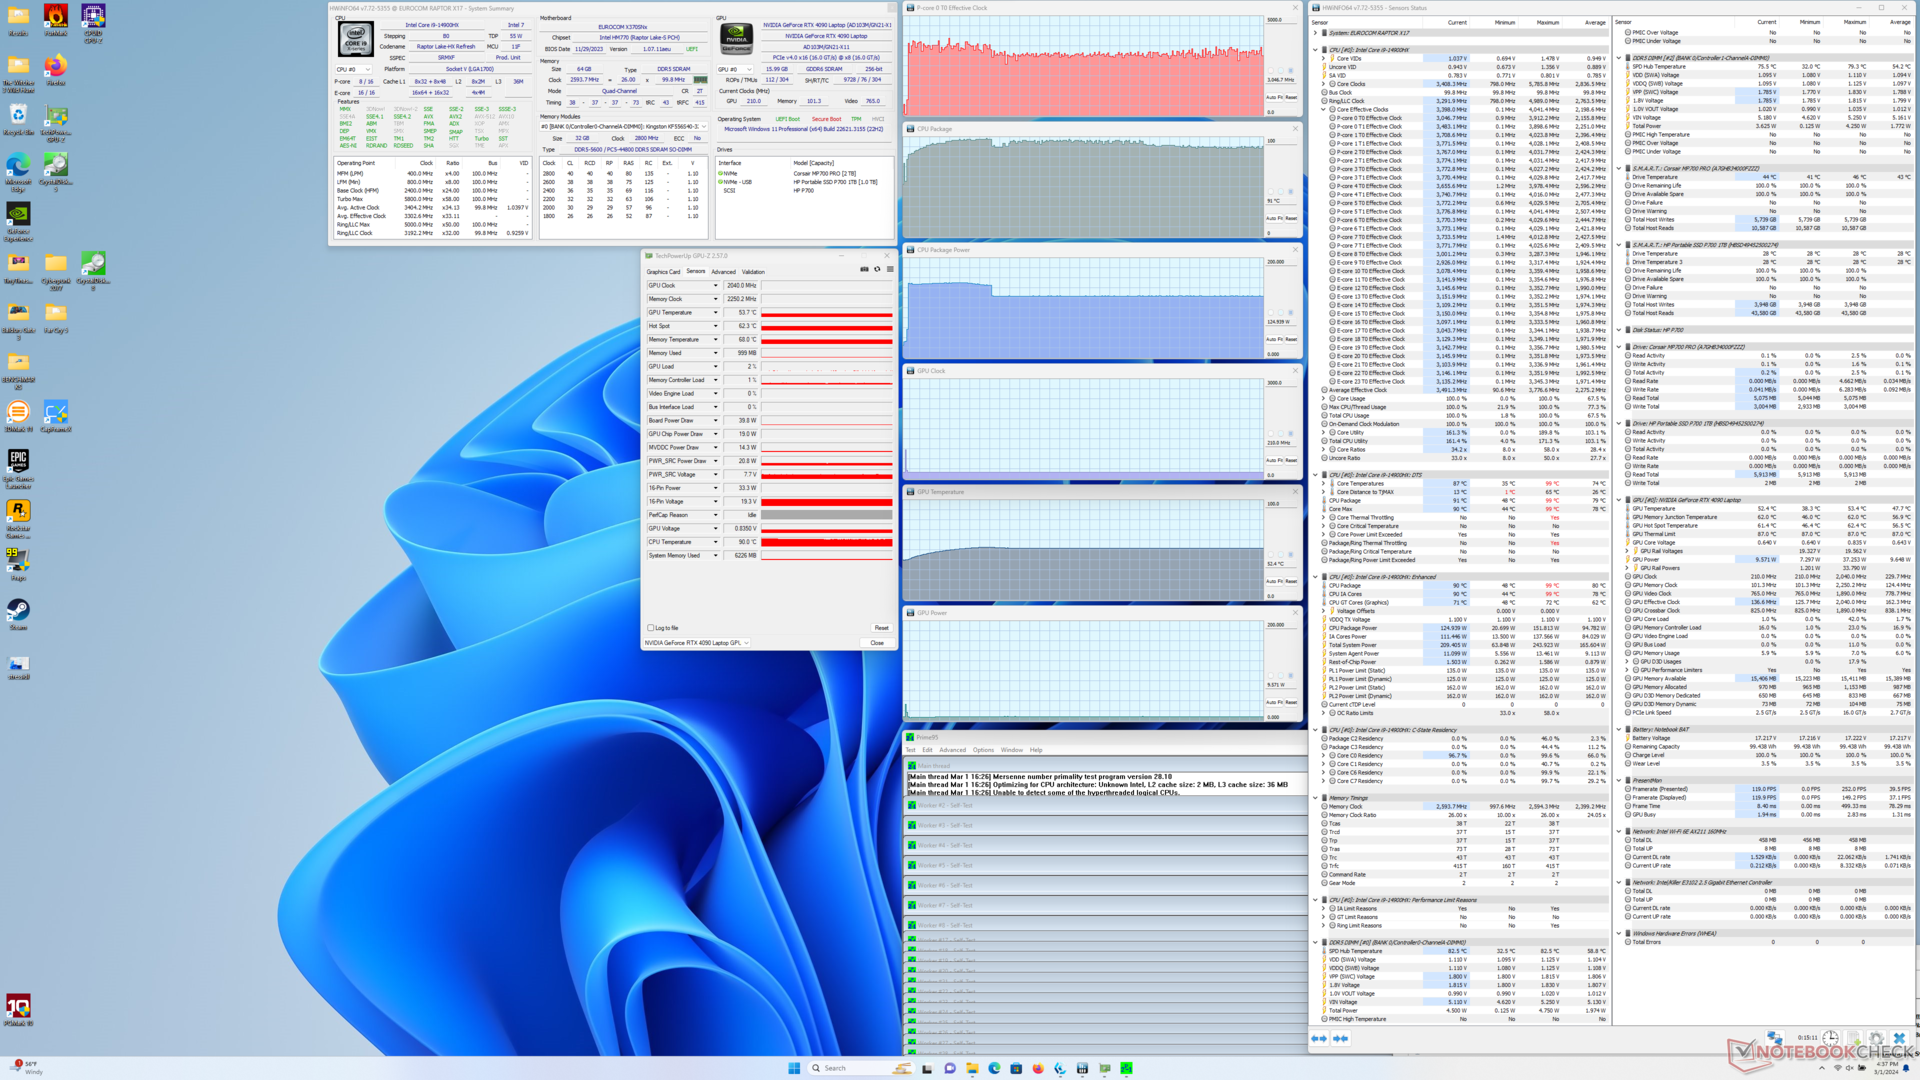
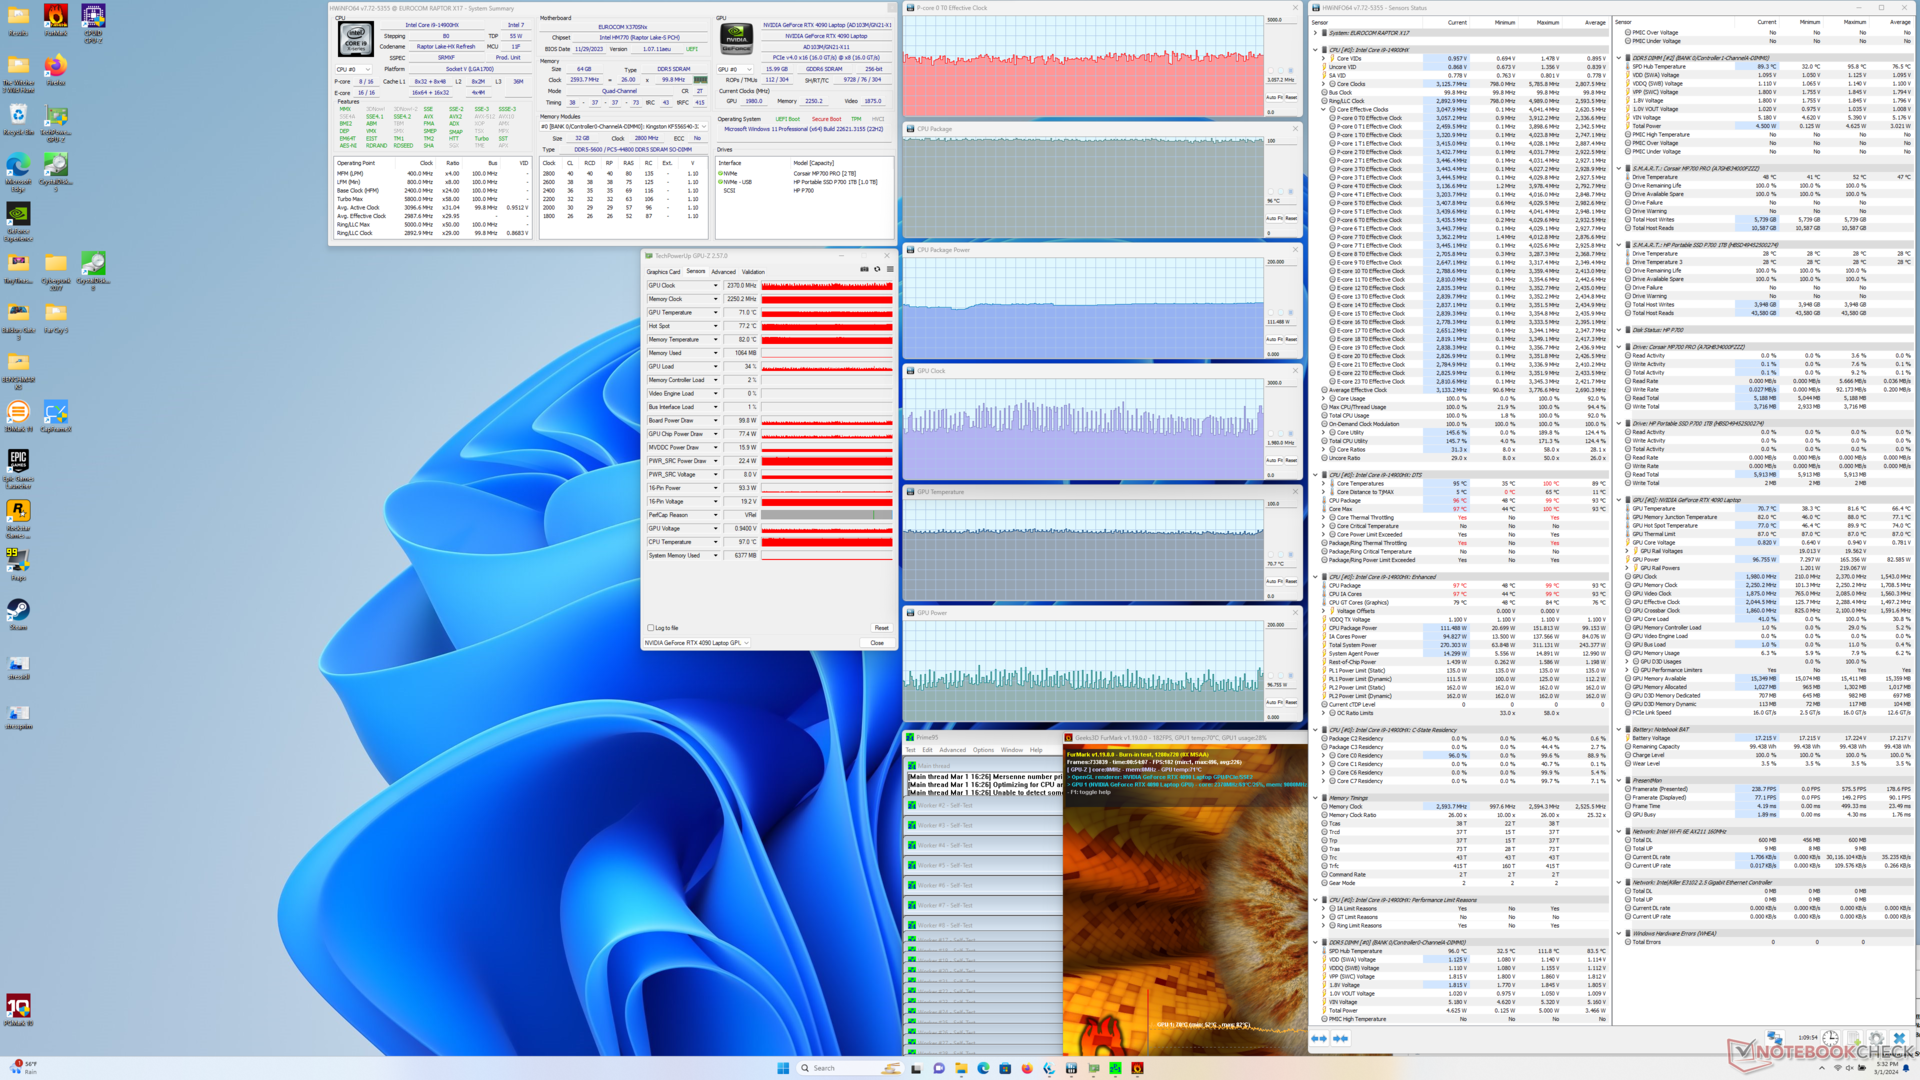
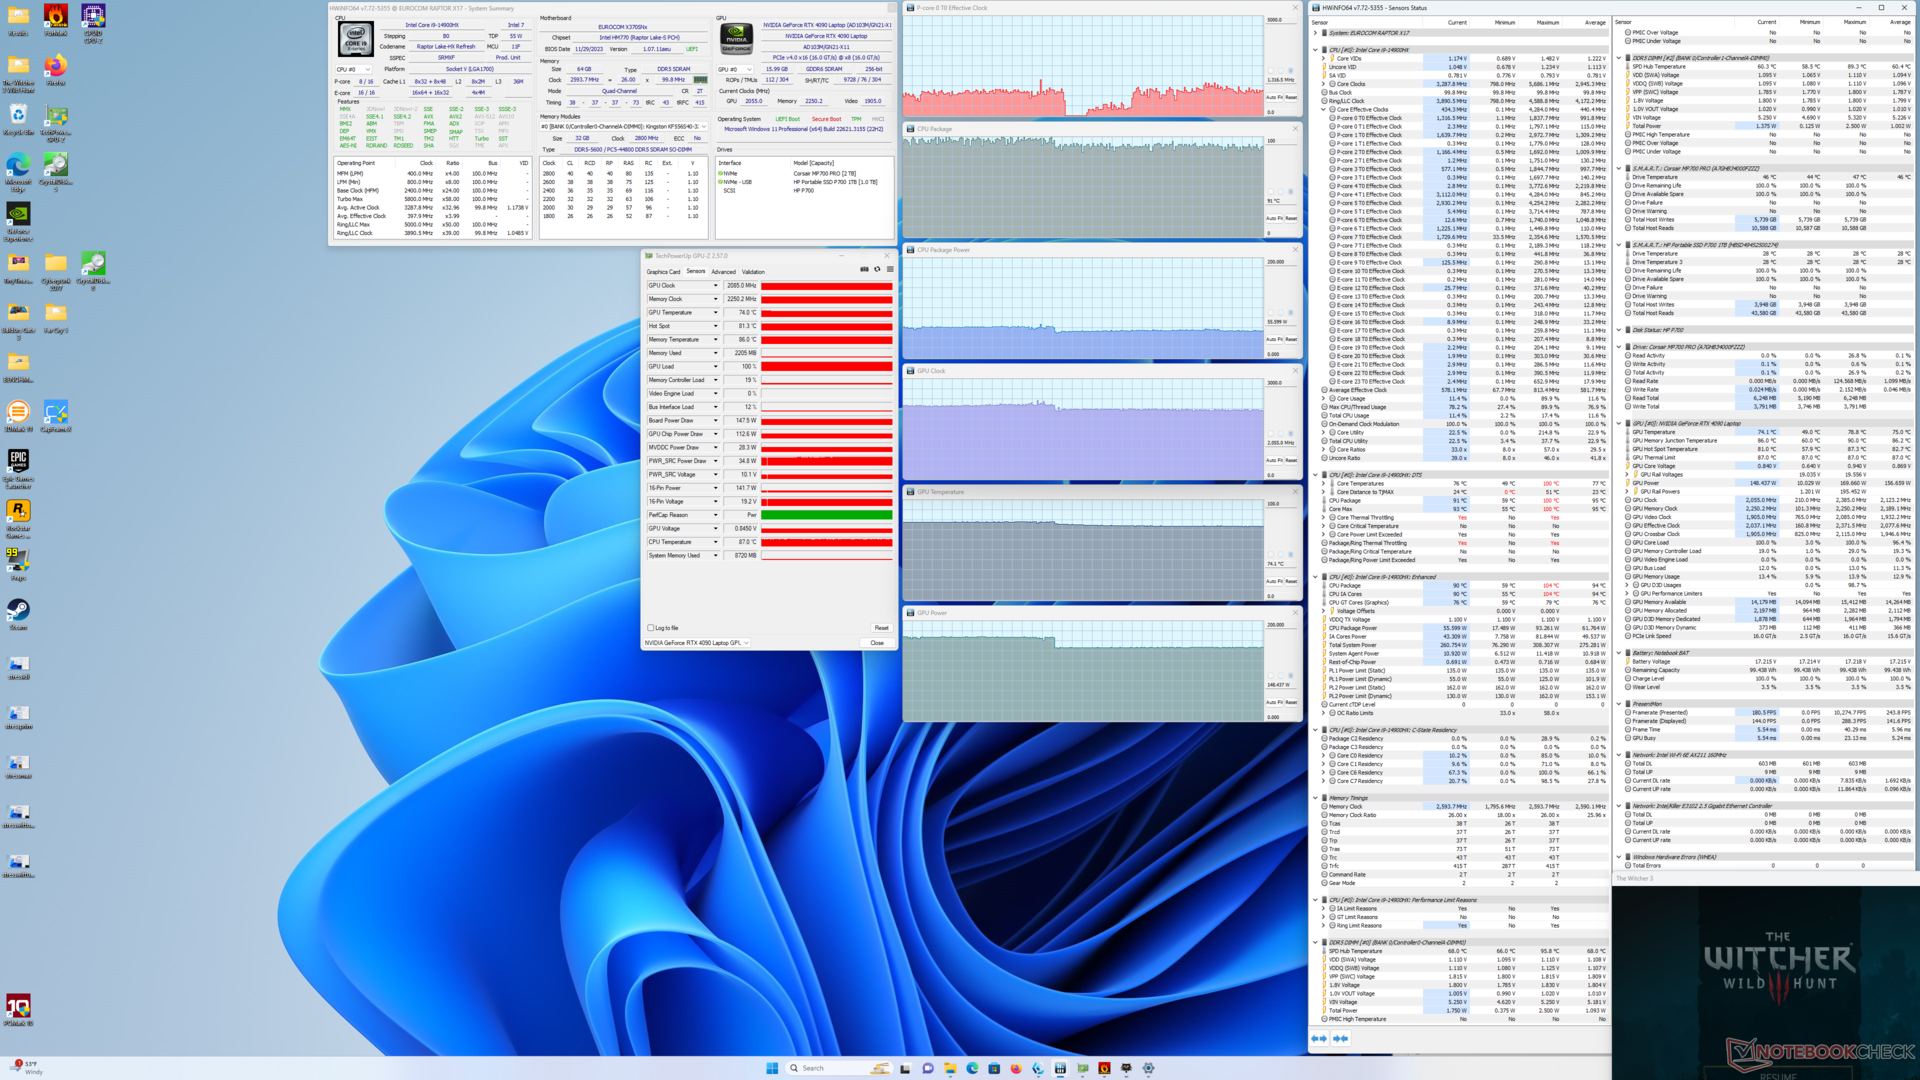
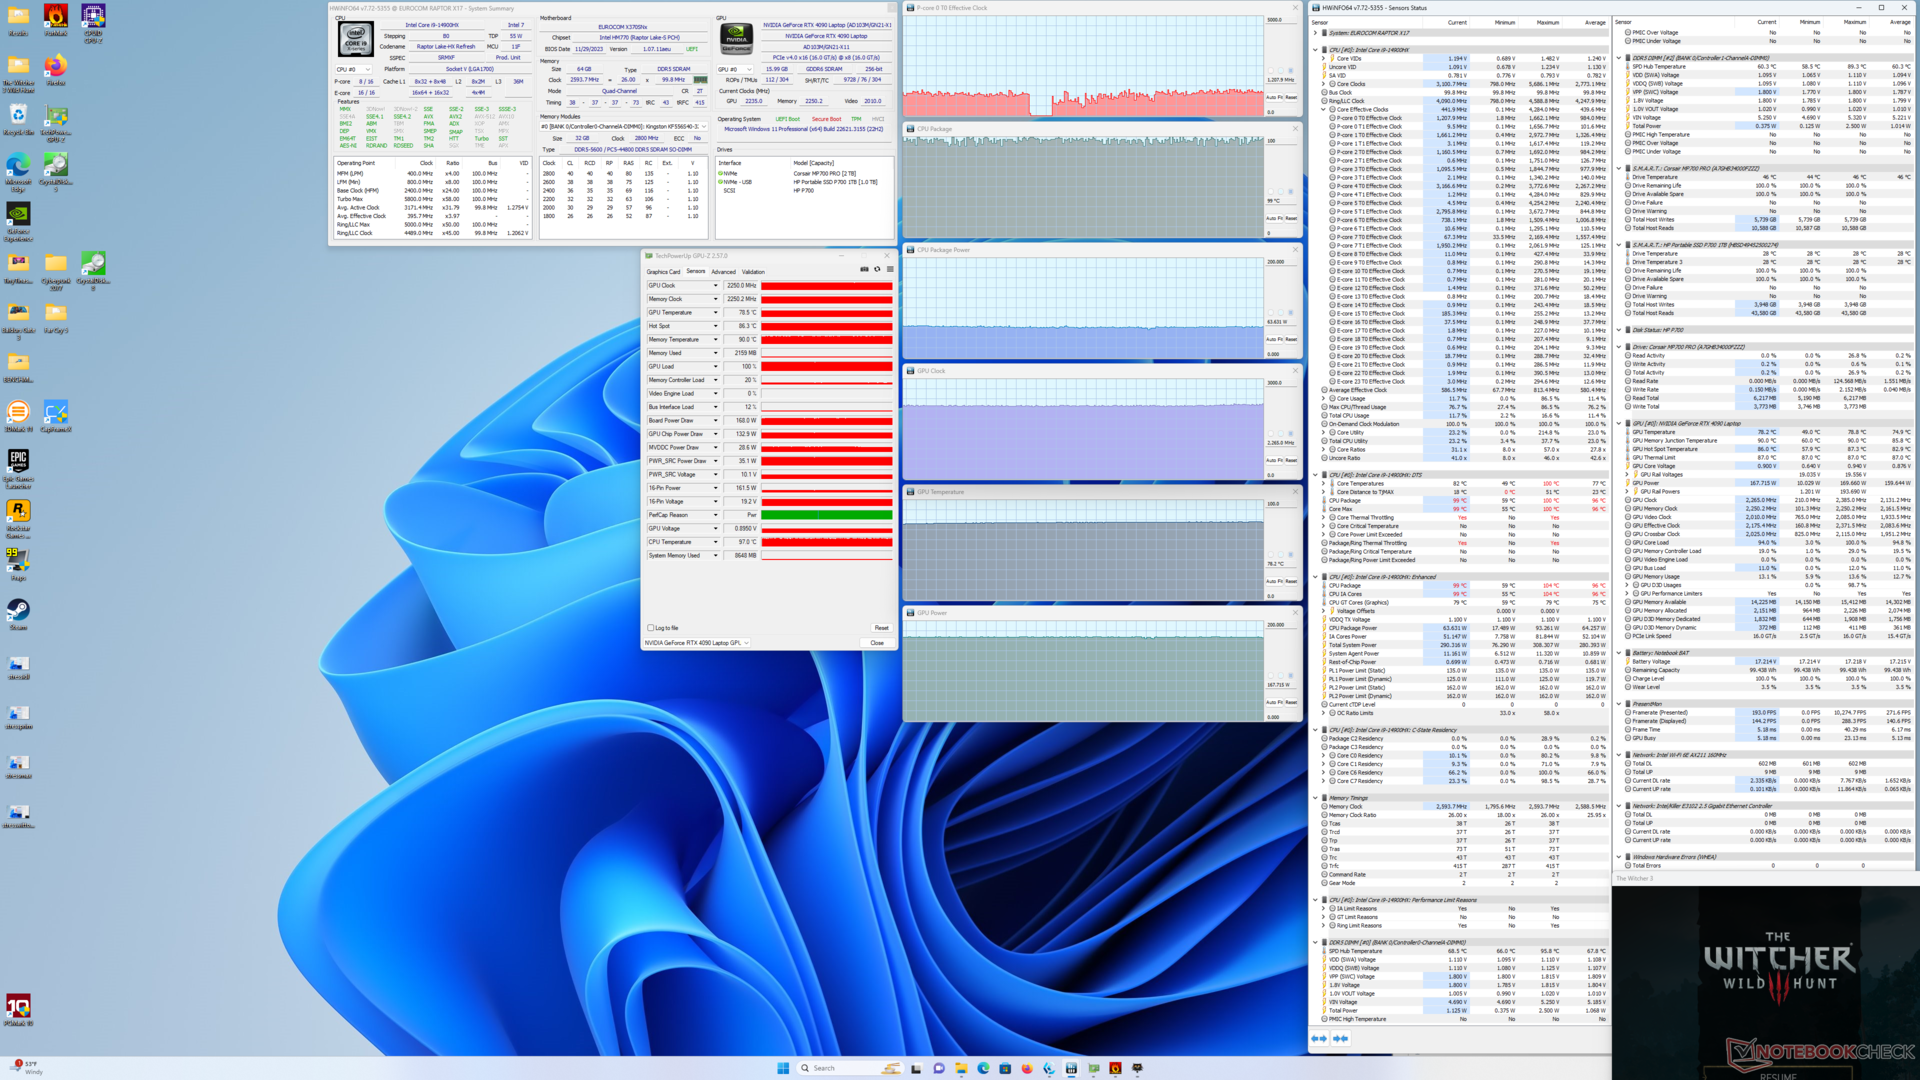

| CPU Clock (GHz) | GPU Clock (MHz) | Temperatura média da CPU (°C) | Temperatura média da GPU (°C) | |
| Sistema ocioso | -- | -- | 51 | 41 |
| Estresse doPrime95 | 3.1 | -- | 91 | 52 |
| Estresse doPrime95 + FurMark | 3.1 | 1000 - 2300 | 96 | 71 |
| Witcher 3 Estresse(modo de entretenimento) | ~1.3 | 2085 | 91 | 74 |
| Witcher 3 Estresse (modo dedesempenho com o ventilador máximo desligado) | 1.2 | 2250 | 99 | 78 |
| Witcher 3 Estresse (Modo de desempenho com o ventilador máximoligado) | 1.2 | 2205 | 97 | 78 |
| AIDA64 / Memory Copy | |
| MSI GE78HX 13VH-070US | |
| Eurocom Raptor X17 | |
| Eurocom Raptor X17 Core i9-14900HX | |
| Média Intel Core i9-14900HX (38028 - 83392, n=36) | |
| Asus TUF Gaming A17 FA707XI-NS94 | |
| MSI Titan 18 HX A14VIG | |
| Asus ROG Strix Scar 17 G733PY-XS96 | |
| AIDA64 / Memory Read | |
| MSI GE78HX 13VH-070US | |
| Média Intel Core i9-14900HX (43306 - 87568, n=36) | |
| Eurocom Raptor X17 | |
| Eurocom Raptor X17 Core i9-14900HX | |
| Asus TUF Gaming A17 FA707XI-NS94 | |
| Asus ROG Strix Scar 17 G733PY-XS96 | |
| MSI Titan 18 HX A14VIG | |
| AIDA64 / Memory Write | |
| MSI GE78HX 13VH-070US | |
| Eurocom Raptor X17 Core i9-14900HX | |
| Eurocom Raptor X17 | |
| Asus TUF Gaming A17 FA707XI-NS94 | |
| Média Intel Core i9-14900HX (37146 - 80589, n=36) | |
| Asus ROG Strix Scar 17 G733PY-XS96 | |
| MSI Titan 18 HX A14VIG | |
| AIDA64 / Memory Latency | |
| MSI Titan 18 HX A14VIG | |
| Asus TUF Gaming A17 FA707XI-NS94 | |
| Eurocom Raptor X17 Core i9-14900HX | |
| Média Intel Core i9-14900HX (76.1 - 105, n=36) | |
| MSI GE78HX 13VH-070US | |
| Eurocom Raptor X17 | |
| Asus ROG Strix Scar 17 G733PY-XS96 | |
* ... menor é melhor
Latência DPC
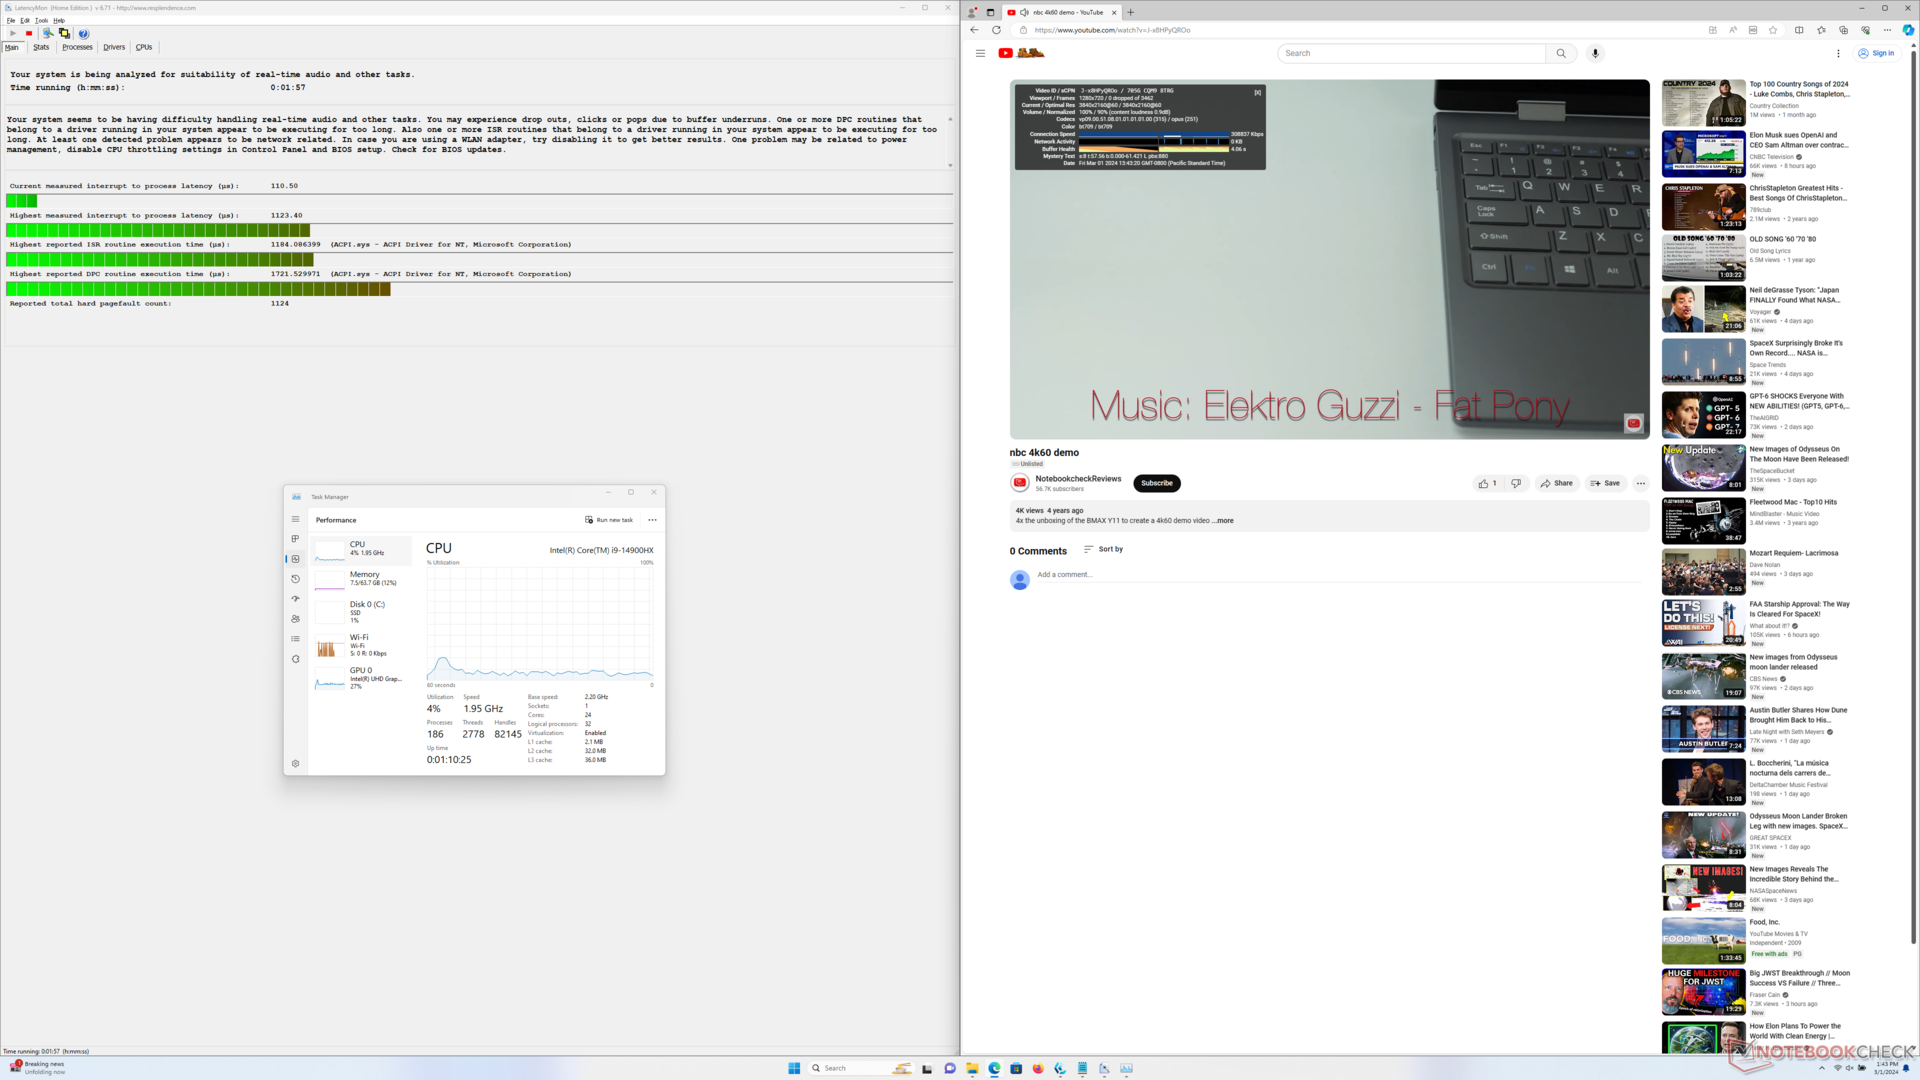
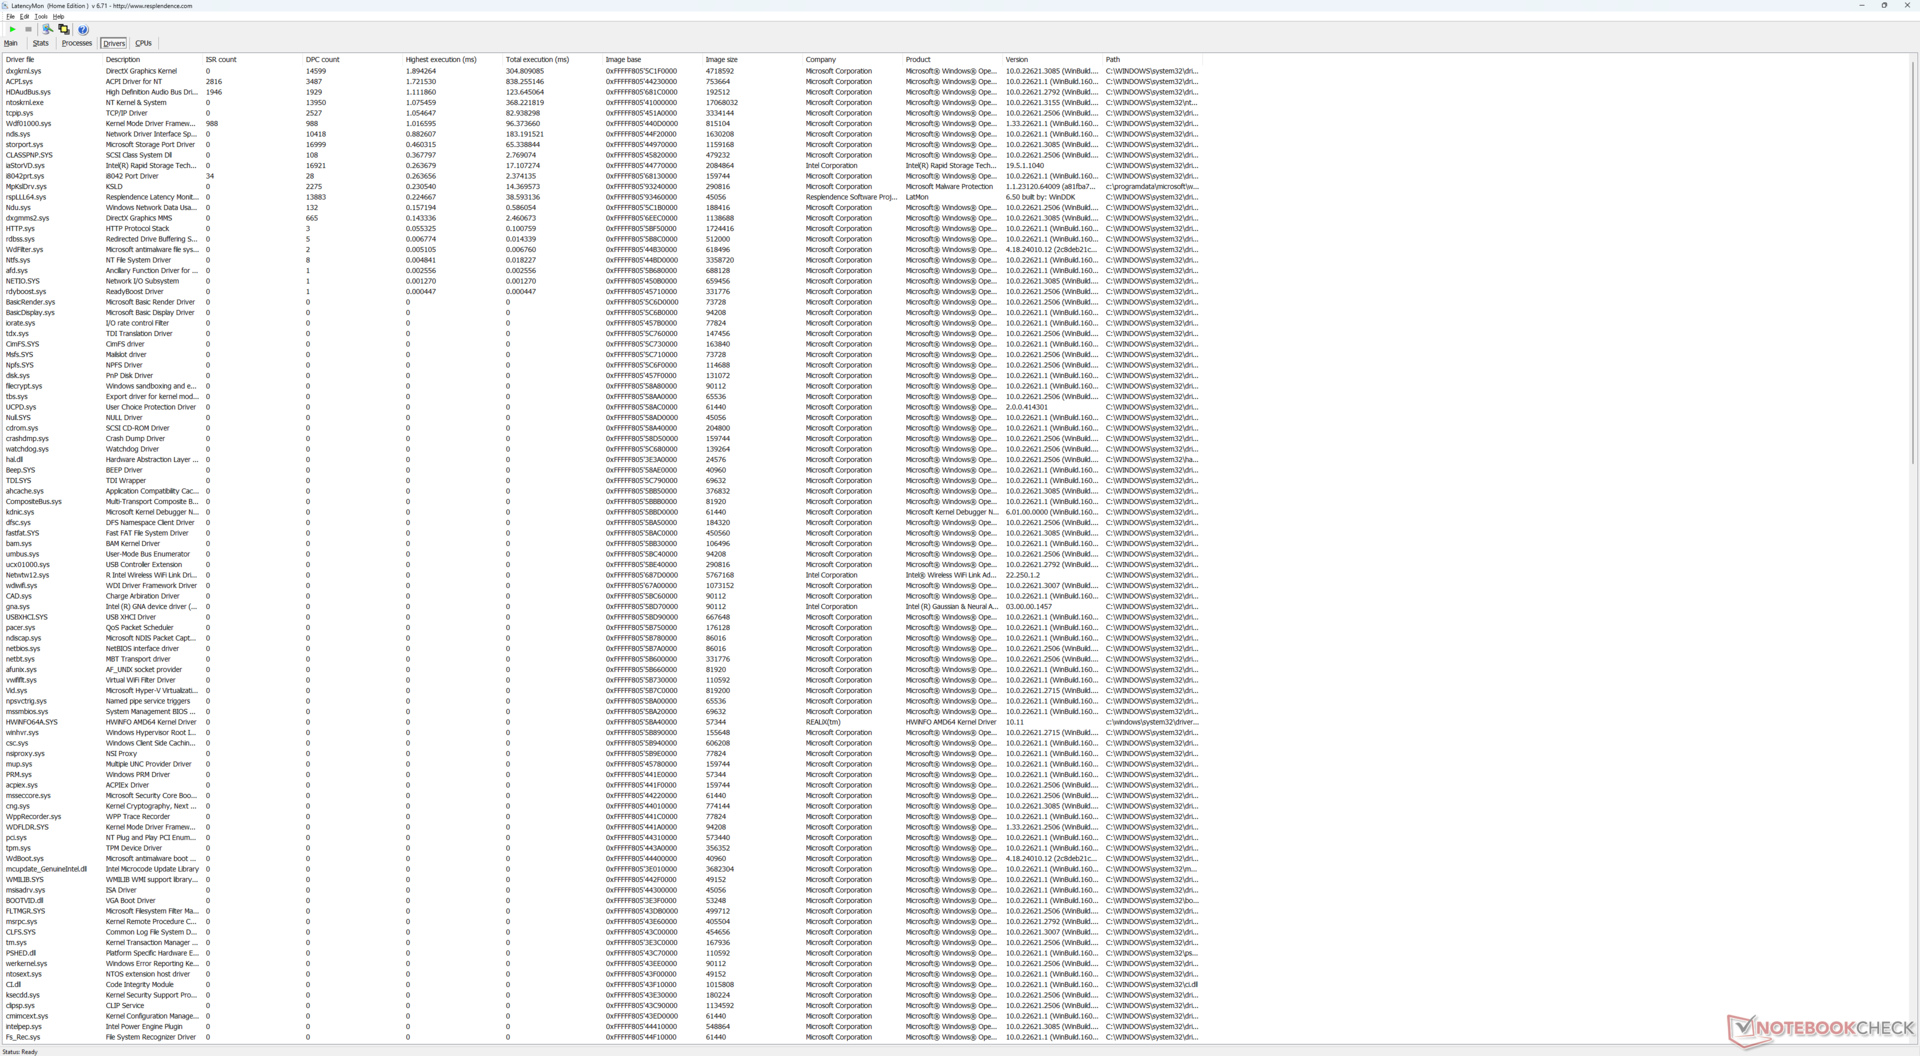
| DPC Latencies / LatencyMon - interrupt to process latency (max), Web, Youtube, Prime95 | |
| MSI GE78HX 13VH-070US | |
| Eurocom Raptor X17 | |
| MSI Titan 18 HX A14VIG | |
| Asus ROG Strix Scar 17 G733PY-XS96 | |
| Asus TUF Gaming A17 FA707XI-NS94 | |
| Eurocom Raptor X17 Core i9-14900HX | |
* ... menor é melhor
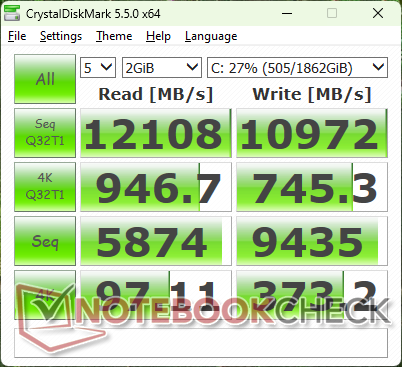
Dispositivos de armazenamento
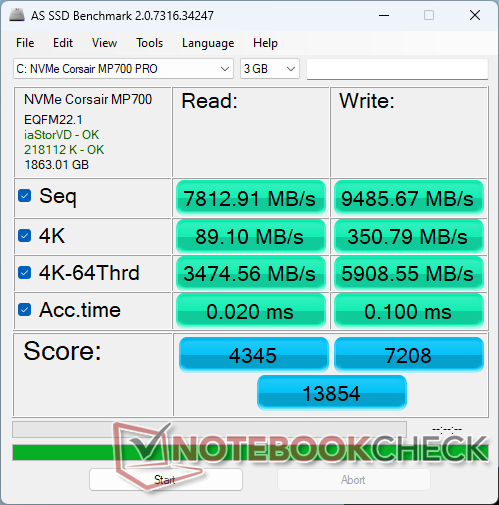
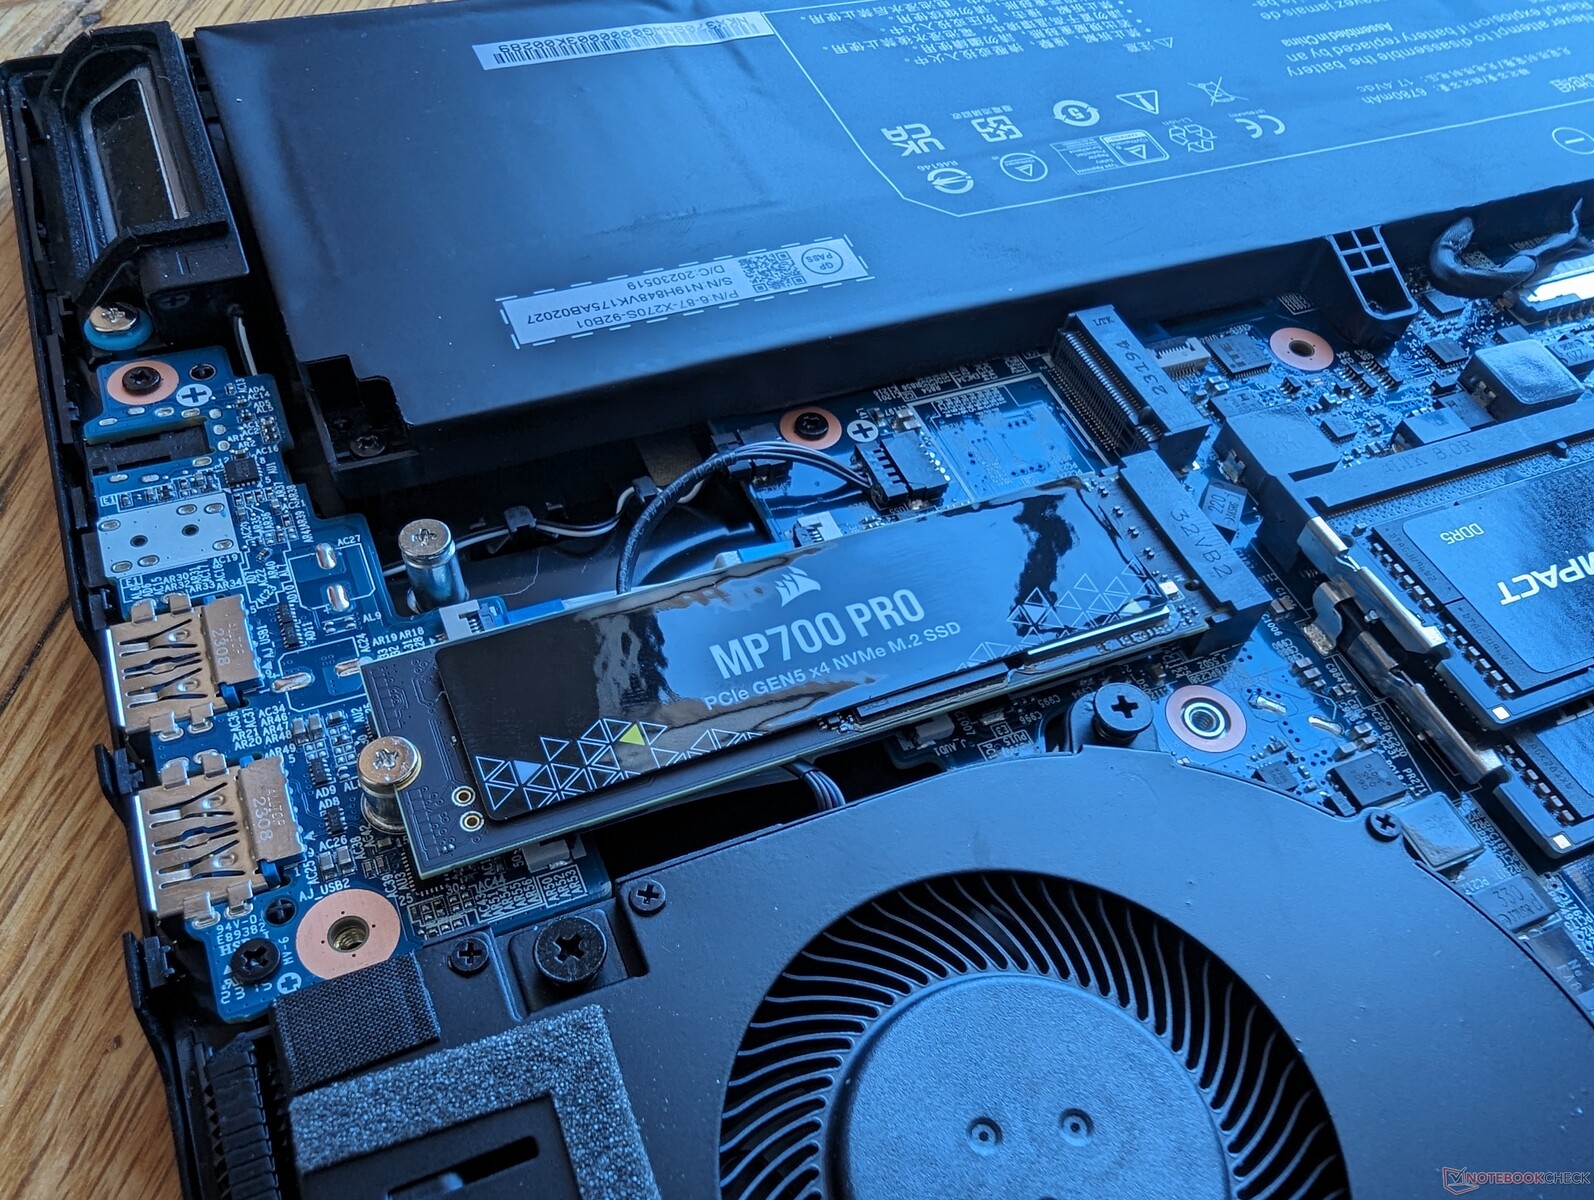
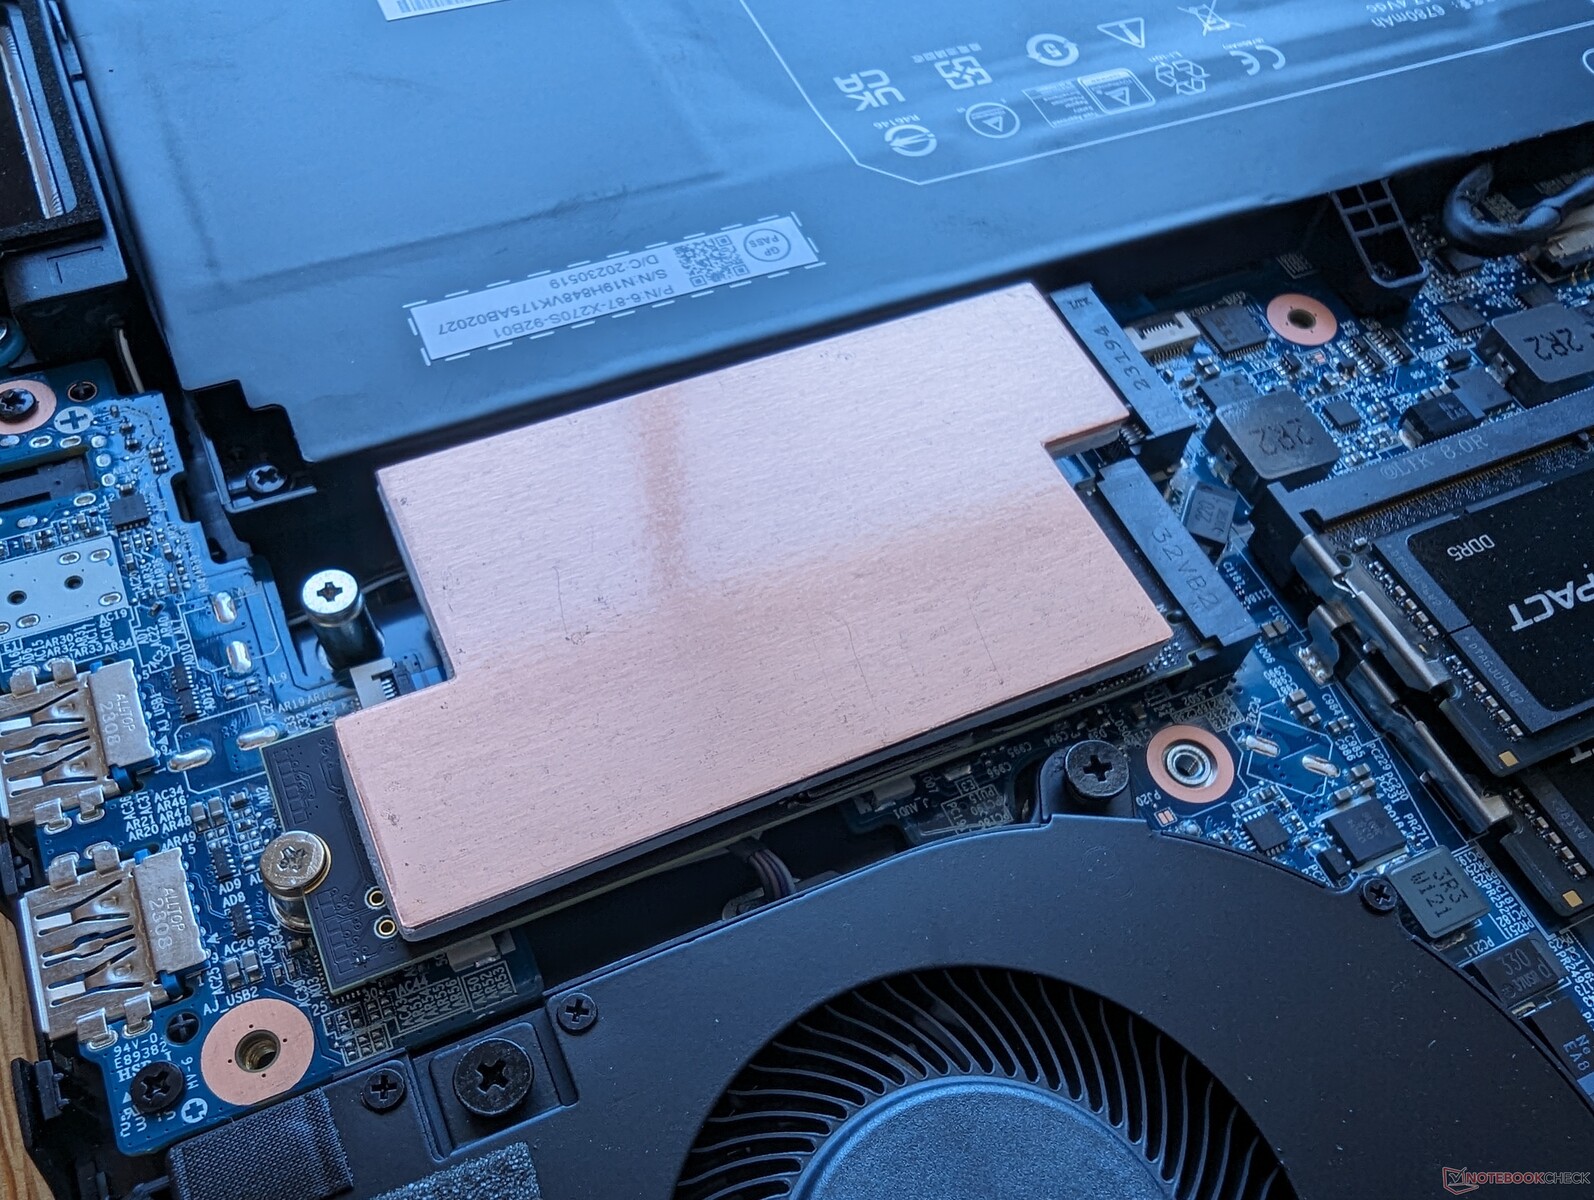
A Eurocom é um dos poucos vendedores a configurar com um Corsair MP700 Pro PCI5 x4 NVMe da Corsair para taxas de leitura sequencial de até 13.000 MB/s, quase duas vezes mais rápidas do que as unidades PCIe4 mais rápidas. No entanto, para sustentar taxas de transferência tão altas, é necessário um dissipador de calor. Nossos resultados de loop do DiskSpd abaixo mostram as diferenças de desempenho com e sem o dissipador de calor. Se o dissipador não for instalado, as taxas de transferência máximas só poderão ser atingidas durante o primeiro minuto, mais ou menos, antes de serem reduzidas para a faixa de 3500 MB/s a 6500 MB/s. A instalação do dissipador de calor permite que a unidade funcione muito mais rápido e por mais tempo.

| Drive Performance rating - Percent | |
| Eurocom Raptor X17 Core i9-14900HX | |
| Eurocom Raptor X17 | |
| MSI GE78HX 13VH-070US | |
| MSI Titan 18 HX A14VIG | |
| Asus ROG Strix Scar 17 G733PY-XS96 | |
| Asus TUF Gaming A17 FA707XI-NS94 | |
* ... menor é melhor
Disk Throttling: DiskSpd Read Loop, Queue Depth 8
Desempenho da GPU
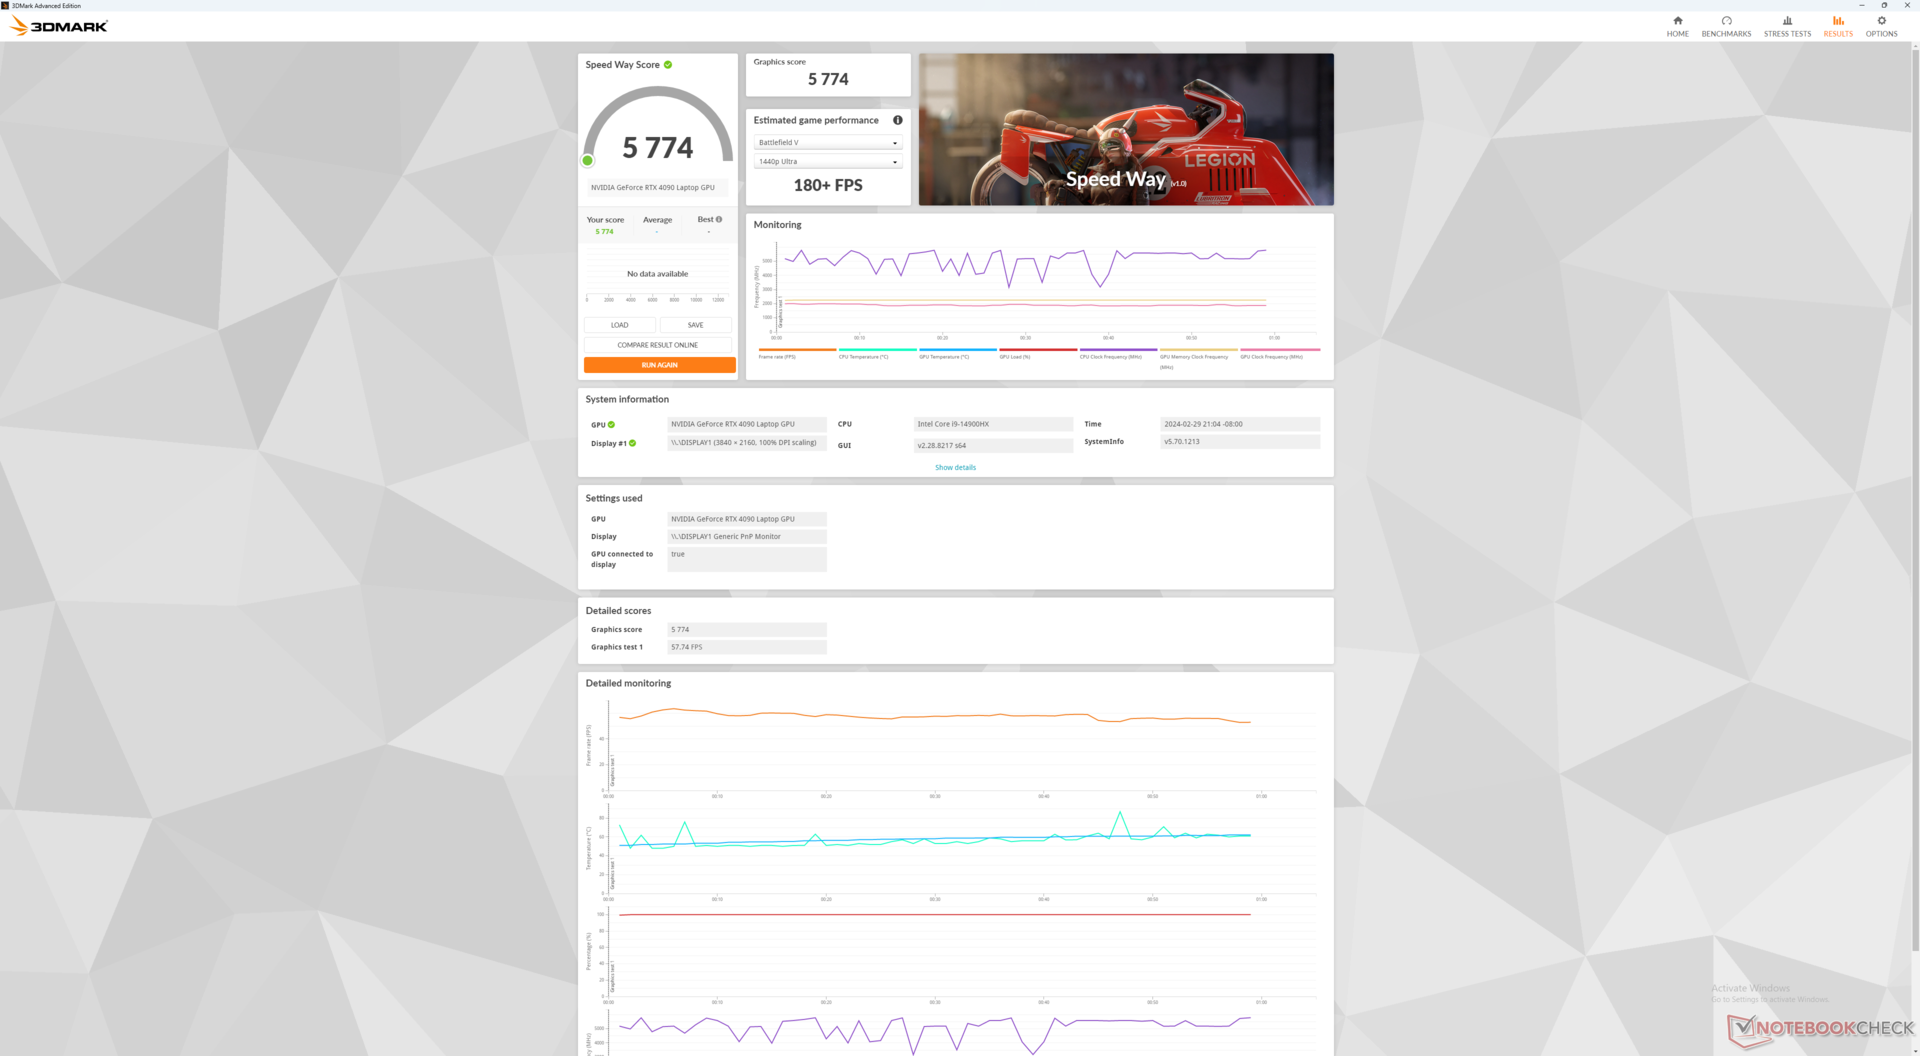
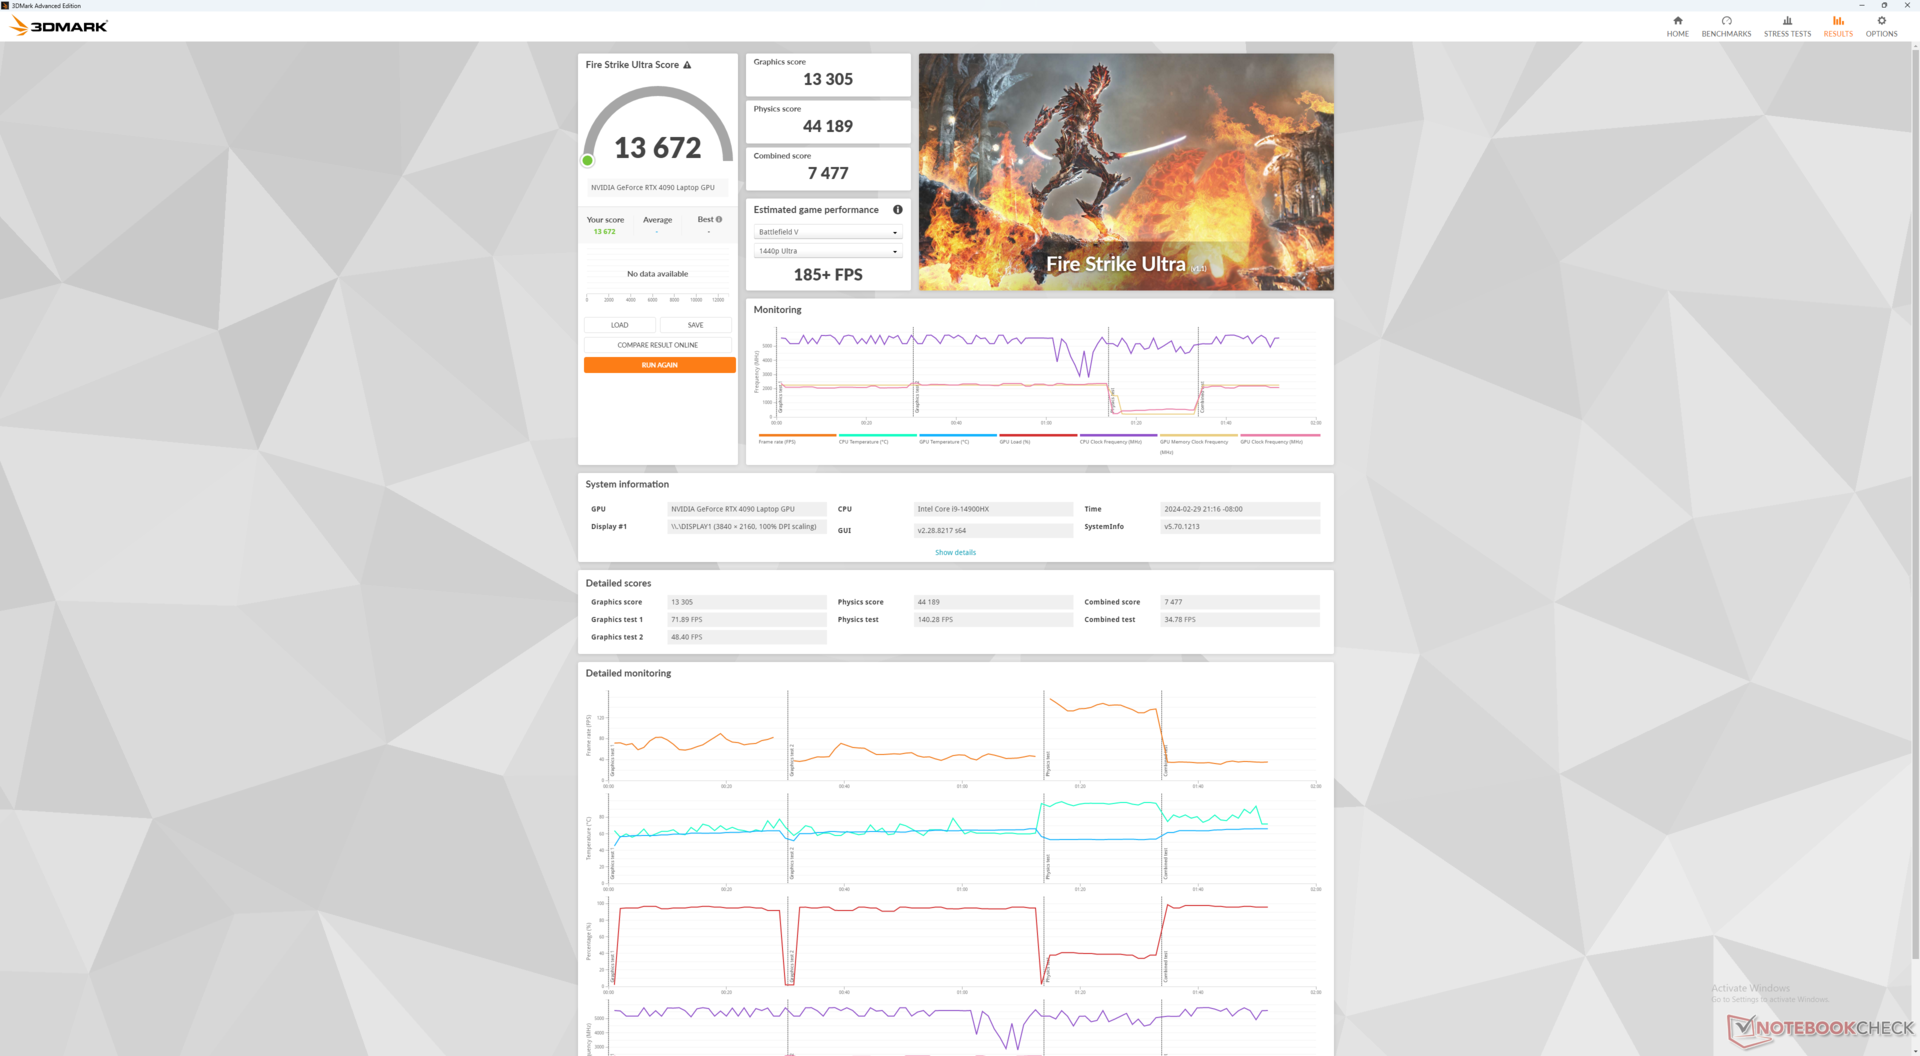
Nosso 175 W GeForce RTX 4090 É cerca de 5% mais rápida do que a registrada no Raptor X17 do ano passado. Ela rivaliza mais ou menos com a MSI Titan 18 HX que é maior e mais cara do que a nossa unidade Eurocom.
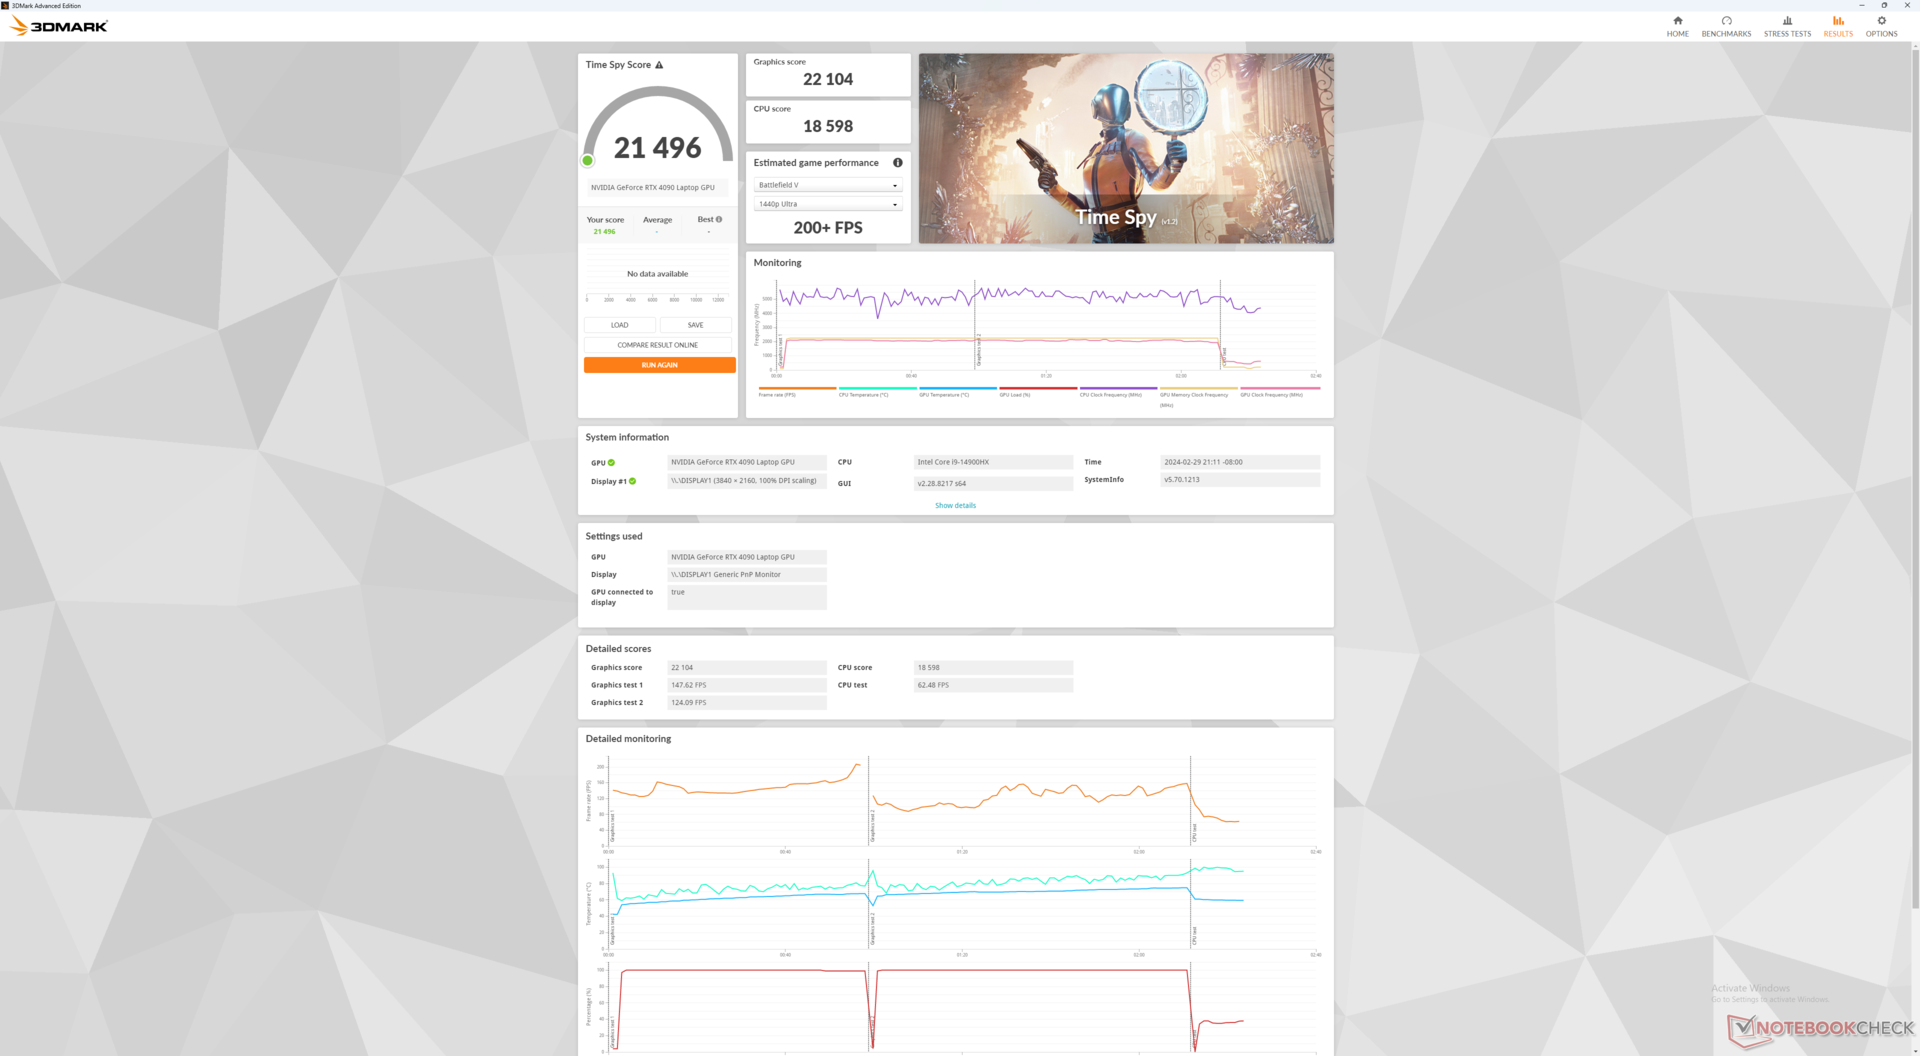
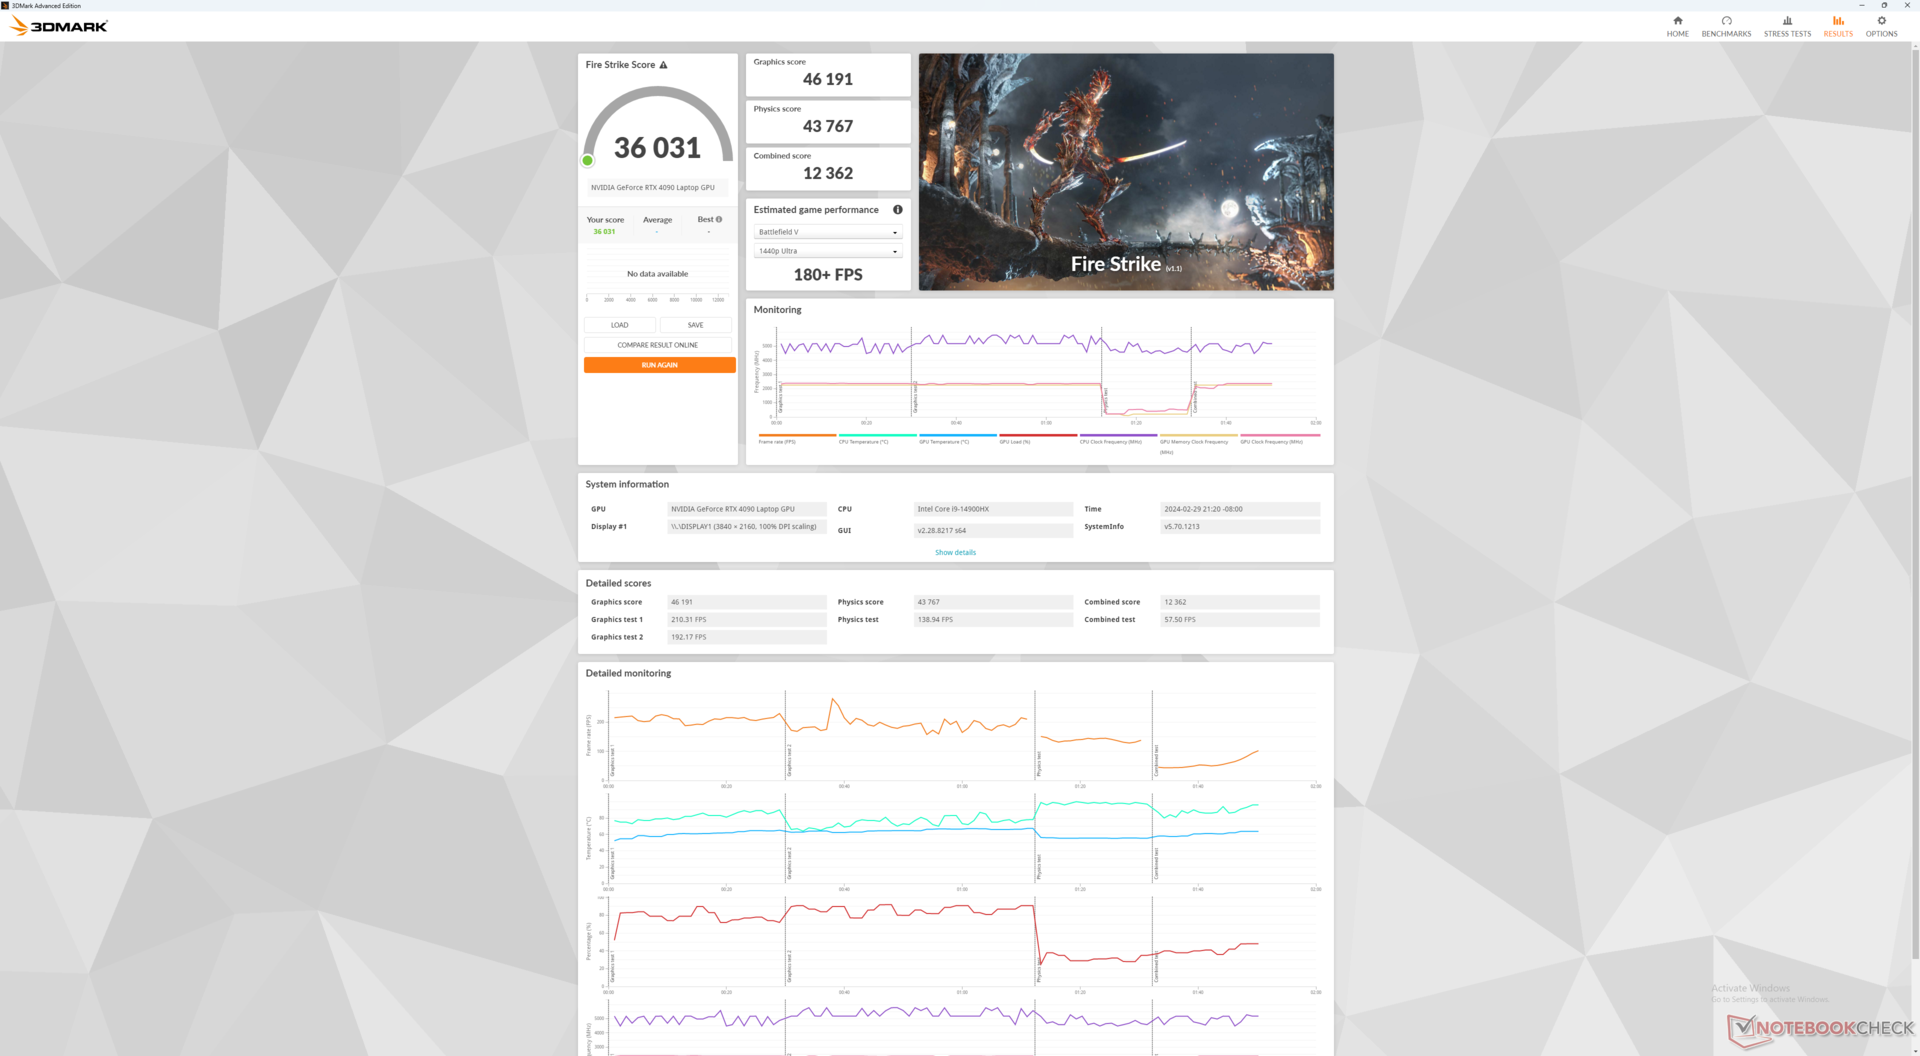
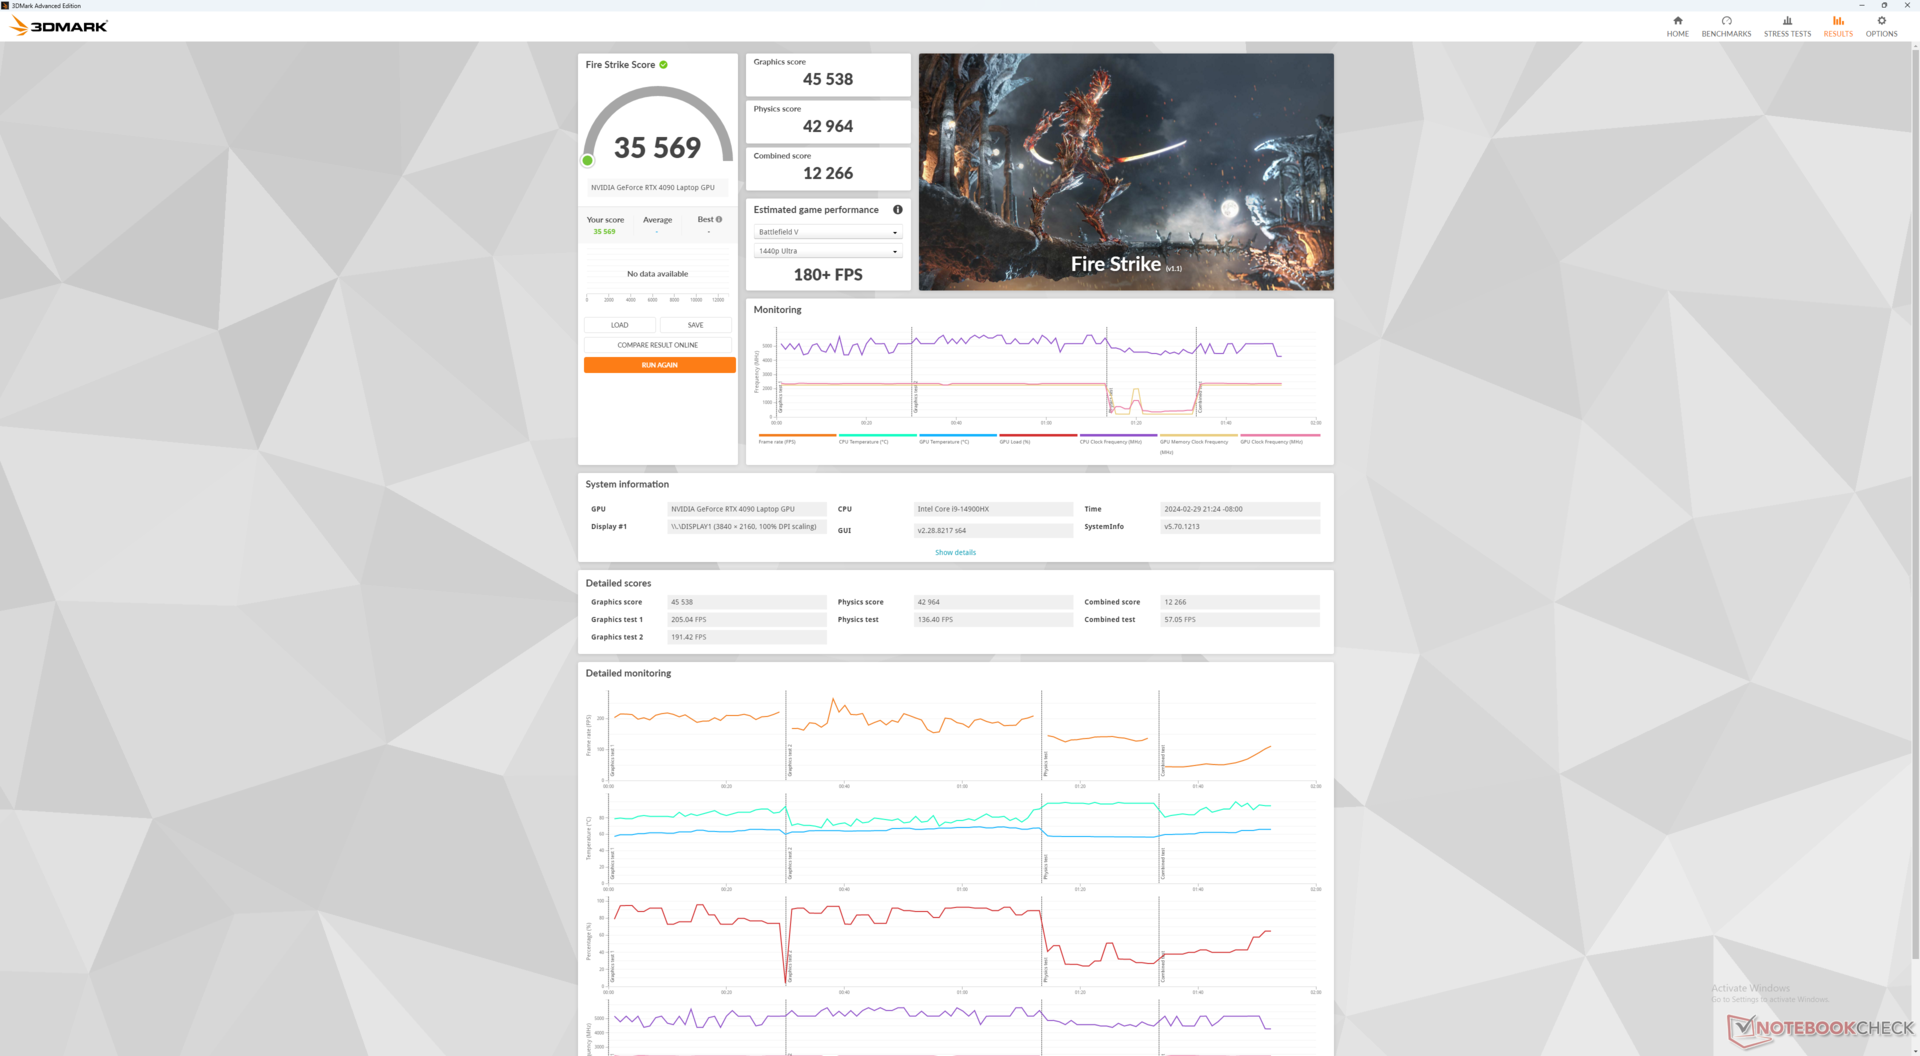
Lembre-se de que a ativação do modo Ventilador máximo não aumenta o desempenho em nenhum grau perceptível, como mostra a tabela de resultados do site Fire Strike abaixo. Portanto, o modo não é essencial para maximizar o desempenho nas configurações padrão. No entanto, a redução para o modo Entertainment tem um impacto maior no desempenho.
| Perfil de energia | Pontuação de gráficos | Pontuação de física | Pontuação combinada |
| Modo de desempenho com ventilador máximo ligado | 46191 | 43767 | 12362 |
| Modo de desempenho com o ventilador máximo desligado | 45538 (-1%) | 42964 (-2%) | 12266 (-1%) |
| Modo balanceado do Windows | 45892 (-1%) | 42567 (-3%) | 13382 (-0%) |
| Modo de entretenimento | 44593 (-4%) | 36839 (-16%) | 9640 (-22%) |
| Energia da bateria | 7324 (-84%) | 14932 (-66%) | 1901 (-85%) |
Mesmo assim, tivemos vários problemas que merecem ser mencionados. O Ubisoft Connect sempre falhava na inicialização, o Final Fantasy XV travava nas configurações altas e o PCMark 10 também travava, mesmo após a atualização para a versão mais recente.
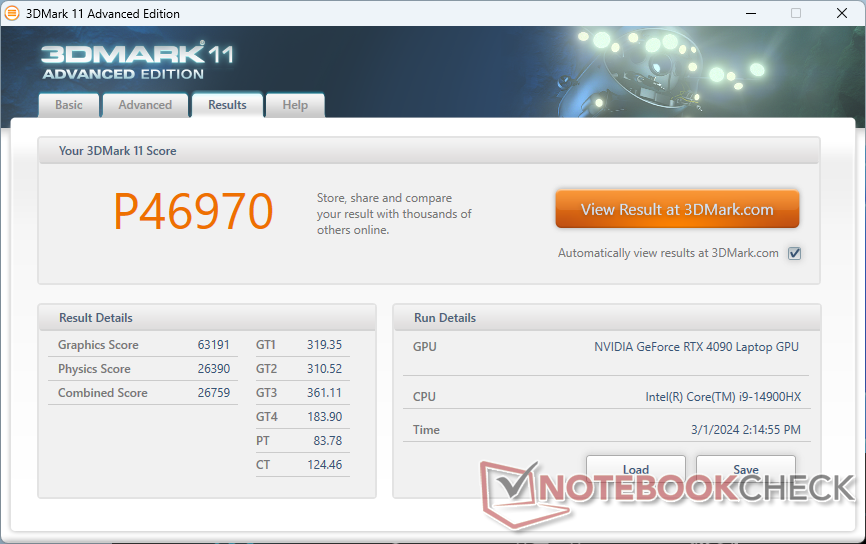
| 3DMark 11 Performance | 46970 pontos | |
| 3DMark Fire Strike Score | 36031 pontos | |
| 3DMark Time Spy Score | 21496 pontos | |
Ajuda | ||
* ... menor é melhor
| Performance rating - Percent | |
| Eurocom Raptor X17 Core i9-14900HX -1! | |
| MSI Titan 18 HX A14VIG | |
| Eurocom Raptor X17 | |
| Asus ROG Strix Scar 17 G733PY-XS96 -1! | |
| MSI GE78HX 13VH-070US | |
| Asus TUF Gaming A17 FA707XI-NS94 -1! | |
| The Witcher 3 - 1920x1080 Ultra Graphics & Postprocessing (HBAO+) | |
| MSI Titan 18 HX A14VIG | |
| Eurocom Raptor X17 | |
| Asus ROG Strix Scar 17 G733PY-XS96 | |
| Eurocom Raptor X17 Core i9-14900HX | |
| MSI GE78HX 13VH-070US | |
| Asus TUF Gaming A17 FA707XI-NS94 | |
| GTA V - 1920x1080 Highest AA:4xMSAA + FX AF:16x | |
| Eurocom Raptor X17 Core i9-14900HX | |
| Eurocom Raptor X17 | |
| MSI Titan 18 HX A14VIG | |
| Asus ROG Strix Scar 17 G733PY-XS96 | |
| MSI GE78HX 13VH-070US | |
| Final Fantasy XV Benchmark - 1920x1080 High Quality | |
| MSI Titan 18 HX A14VIG | |
| Eurocom Raptor X17 | |
| Asus ROG Strix Scar 17 G733PY-XS96 | |
| MSI GE78HX 13VH-070US | |
| Asus TUF Gaming A17 FA707XI-NS94 | |
| Strange Brigade - 1920x1080 ultra AA:ultra AF:16 | |
| Eurocom Raptor X17 Core i9-14900HX | |
| MSI Titan 18 HX A14VIG | |
| Eurocom Raptor X17 | |
| MSI GE78HX 13VH-070US | |
| Asus TUF Gaming A17 FA707XI-NS94 | |
| Dota 2 Reborn - 1920x1080 ultra (3/3) best looking | |
| Eurocom Raptor X17 Core i9-14900HX | |
| Eurocom Raptor X17 | |
| MSI Titan 18 HX A14VIG | |
| MSI GE78HX 13VH-070US | |
| Asus ROG Strix Scar 17 G733PY-XS96 | |
| Asus TUF Gaming A17 FA707XI-NS94 | |
| X-Plane 11.11 - 1920x1080 high (fps_test=3) | |
| Eurocom Raptor X17 Core i9-14900HX | |
| Eurocom Raptor X17 | |
| MSI GE78HX 13VH-070US | |
| MSI Titan 18 HX A14VIG | |
| Asus ROG Strix Scar 17 G733PY-XS96 | |
| Asus TUF Gaming A17 FA707XI-NS94 | |
Witcher 3 FPS Chart
| baixo | média | alto | ultra | QHD | 4K | |
|---|---|---|---|---|---|---|
| GTA V (2015) | 187.6 | 186.9 | 185.8 | 152.2 | 145.7 | 178.8 |
| The Witcher 3 (2015) | 688.1 | 591.6 | 423.9 | 200 | 149.7 | |
| Dota 2 Reborn (2015) | 254 | 224 | 212 | 195.2 | 195 | |
| X-Plane 11.11 (2018) | 221 | 193.1 | 150.2 | 126.7 | ||
| Far Cry 5 (2018) | 222 | 195 | 186 | 174 | 171 | 113 |
| Strange Brigade (2018) | 567 | 459 | 433 | 402 | 309 | 156.8 |
| F1 22 (2022) | 360 | 331 | 116.3 | 87.8 | 44.2 | |
| Baldur's Gate 3 (2023) | 244.1 | 217.9 | 203.8 | 200.4 | 148.9 | 75.6 |
| Cyberpunk 2077 (2023) | 195.2 | 185.2 | 164.5 | 144.7 | 93.8 | 41.4 |
Emissões
Ruído do sistema - Mais alto do que em muitos outros notebooks para jogos
As ventoinhas não pulsam com a mesma frequência que no modelo do ano passado. Ao iniciar o 3DMark 06, por exemplo, as ventoinhas permaneciam mais silenciosas por períodos mais longos antes de aumentar lentamente, enquanto o modelo 2023 chegava a quase 60 dB(A). Por outro lado, o ruído da ventoinha se estabilizaria em torno dos mesmos valores entre os dois modelos ao executar cargas exigentes, como jogos.
Os jogos no modo Entretenimento são um pouco mais silenciosos do que os jogos no modo Desempenho (58,3 dB(A) vs. 61,4 dB(A)). Lembre-se de que o modo Entretenimento implica um custo de desempenho, conforme mencionado acima.
Barulho
| Ocioso |
| 31.7 / 31.7 / 32.9 dB |
| Carga |
| 34 / 61.6 dB |
 | ||
30 dB silencioso 40 dB(A) audível 50 dB(A) ruidosamente alto |
||
min: | ||
| Eurocom Raptor X17 Core i9-14900HX GeForce RTX 4090 Laptop GPU, i9-14900HX, Corsair MP700 Pro 2TB | Eurocom Raptor X17 GeForce RTX 4090 Laptop GPU, i9-13900HX, 3x Samsung SSD 980 Pro 1TB (RAID 0) | Asus TUF Gaming A17 FA707XI-NS94 GeForce RTX 4070 Laptop GPU, R9 7940HS, WD PC SN560 SDDPNQE-1T00 | Asus ROG Strix Scar 17 G733PY-XS96 GeForce RTX 4090 Laptop GPU, R9 7945HX, SK hynix PC801 HFS001TEJ9X101N | MSI GE78HX 13VH-070US GeForce RTX 4080 Laptop GPU, i9-13950HX, Samsung PM9A1 MZVL22T0HBLB | MSI Titan 18 HX A14VIG GeForce RTX 4090 Laptop GPU, i9-14900HX, 2x Samsung PM9A1a MZVL22T0HDLB (RAID 0) | |
|---|---|---|---|---|---|---|
| Noise | -15% | 3% | 14% | 5% | 9% | |
| desligado / ambiente * (dB) | 23.7 | 23.3 2% | 27.9 -18% | 22.7 4% | 23.4 1% | 22.8 4% |
| Idle Minimum * (dB) | 31.7 | 33.1 -4% | 28.5 10% | 23.5 26% | 24.2 24% | 23.8 25% |
| Idle Average * (dB) | 31.7 | 33.1 -4% | 29.8 6% | 27.7 13% | 25.6 19% | 23.8 25% |
| Idle Maximum * (dB) | 32.9 | 40.7 -24% | 29.8 9% | 27.7 16% | 31 6% | 28 15% |
| Load Average * (dB) | 34 | 59.9 -76% | 34.8 -2% | 30.5 10% | 43.3 -27% | 38 -12% |
| Witcher 3 ultra * (dB) | 61.6 | 60.8 1% | 57.1 7% | 51.4 17% | 56.3 9% | 57.3 7% |
| Load Maximum * (dB) | 61.6 | 61 1% | 57.3 7% | 54.1 12% | 59.1 4% | 62.8 -2% |
* ... menor é melhor
Temperatura
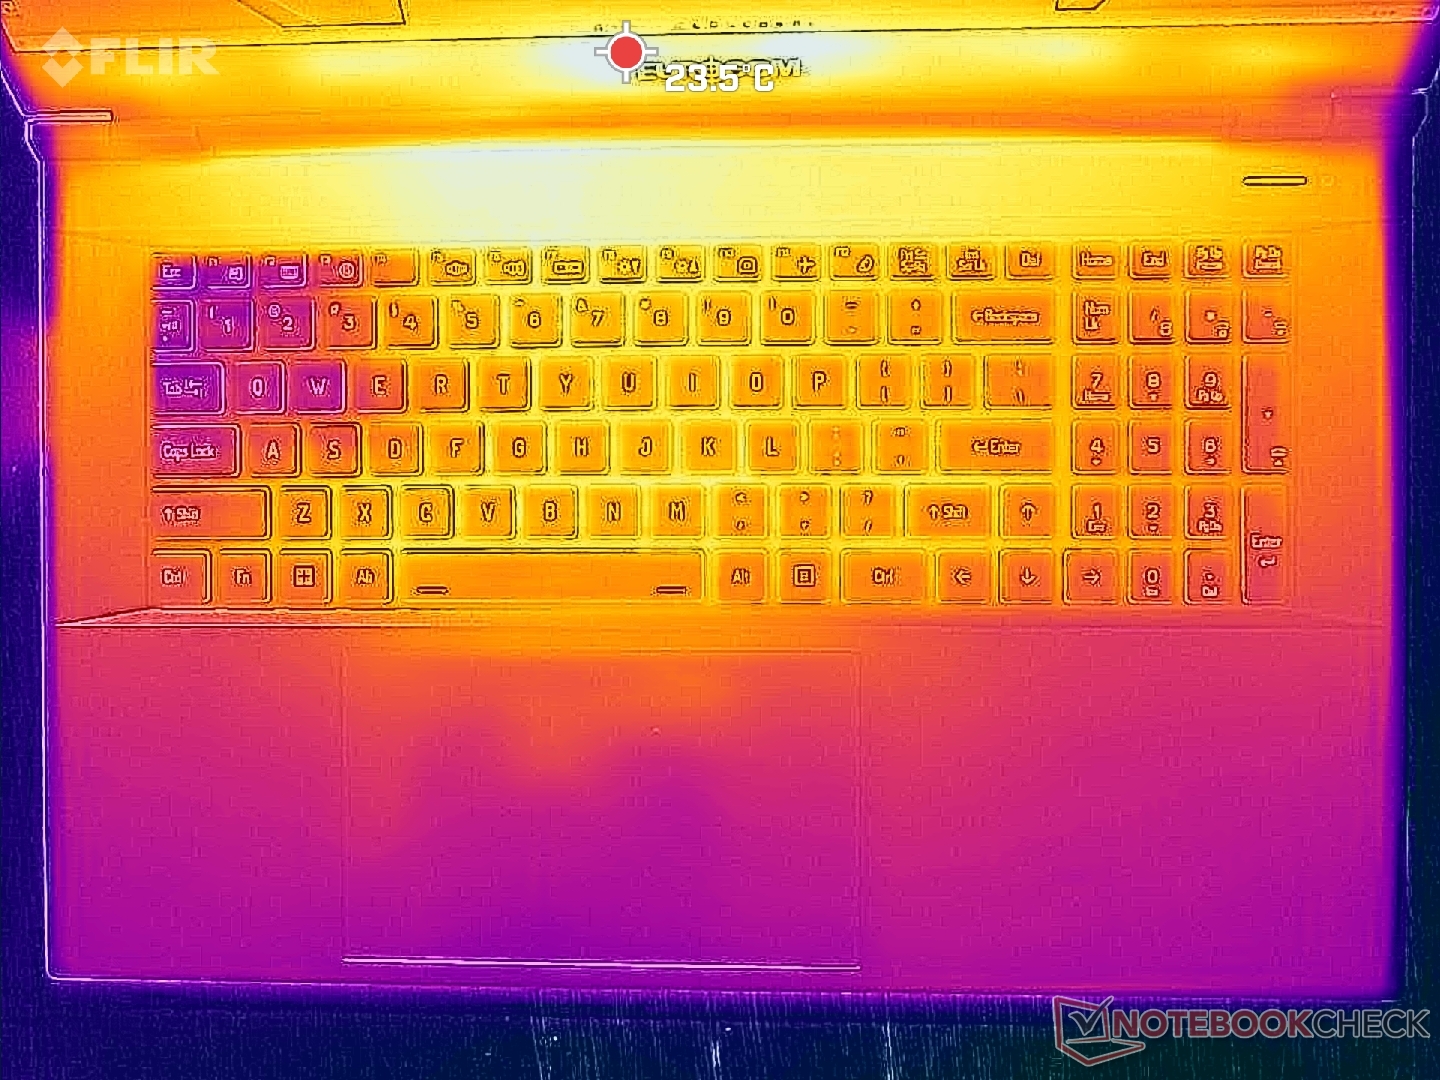
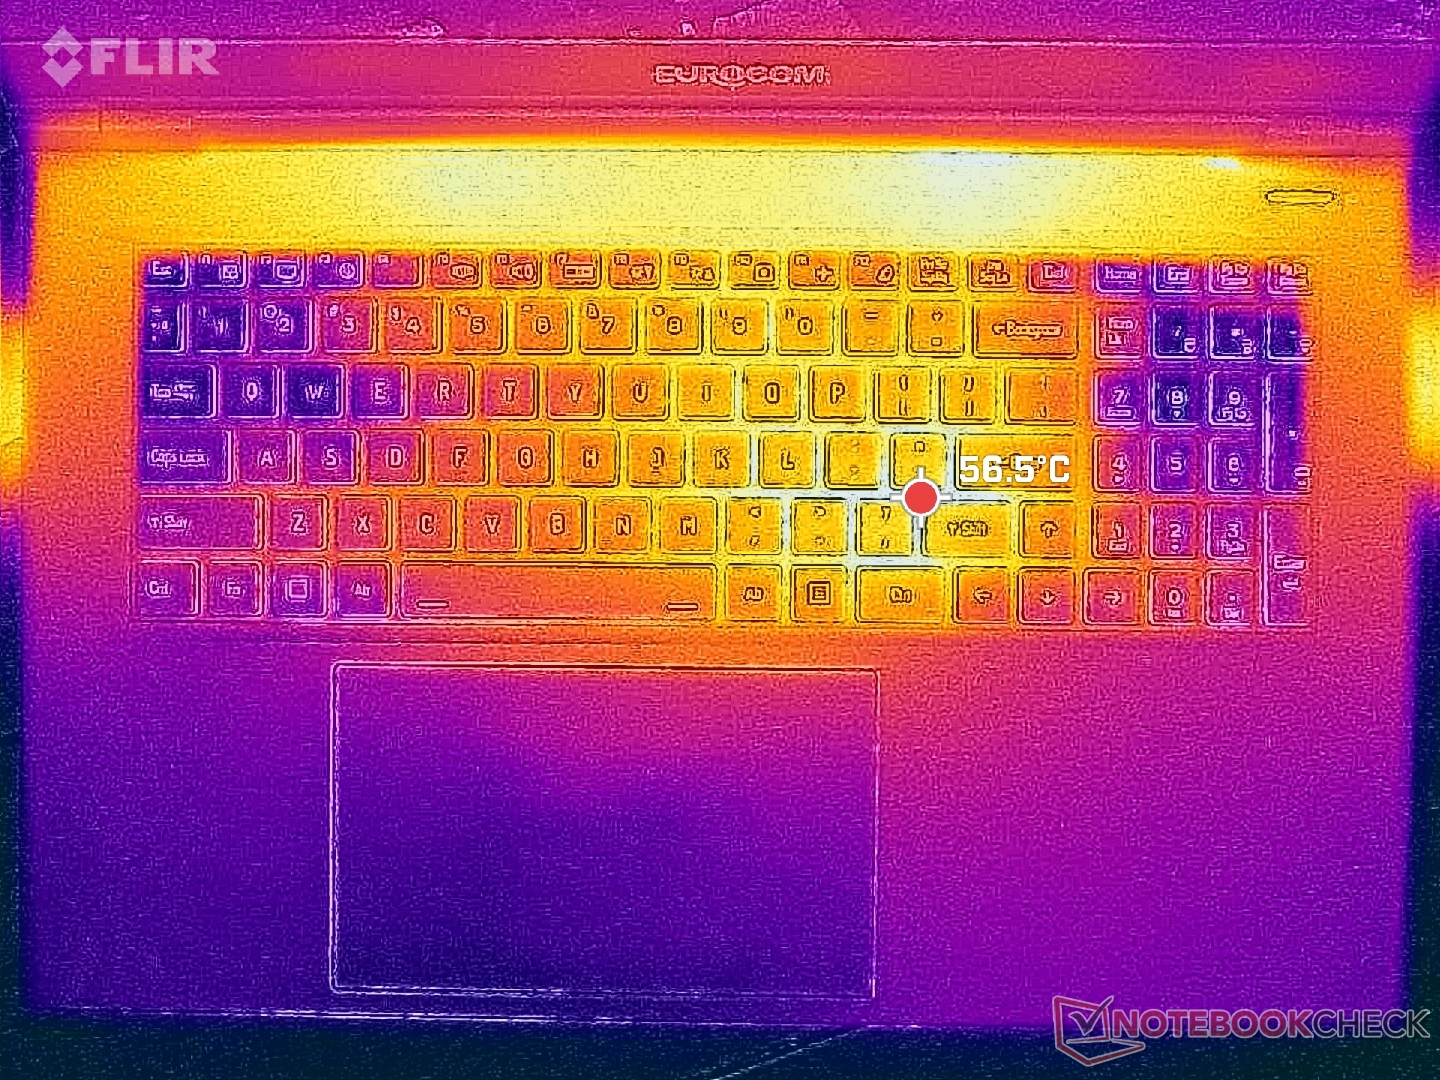
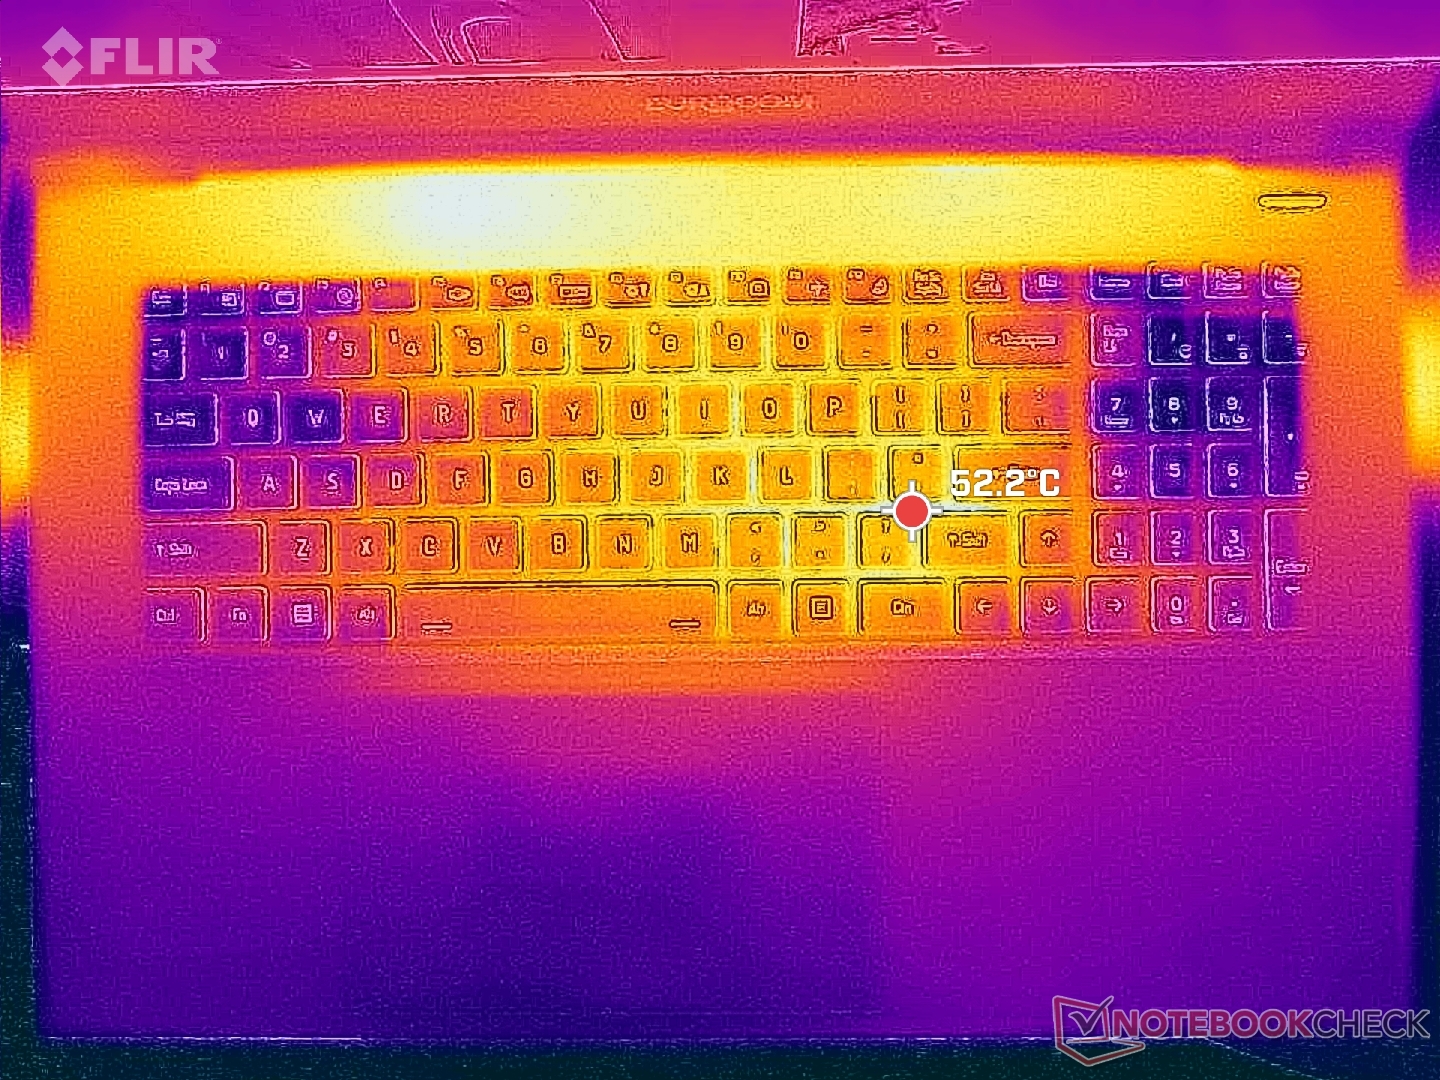
Os pontos quentes da temperatura da superfície são visivelmente mais quentes do que em outros notebooks para jogos. Em particular, certas áreas do teclado podem aquecer até 53 °C durante os jogos, em comparação com apenas 37 °C ou 40 °C no MSI GE78HX ou no Asus TUF Gaming A17.
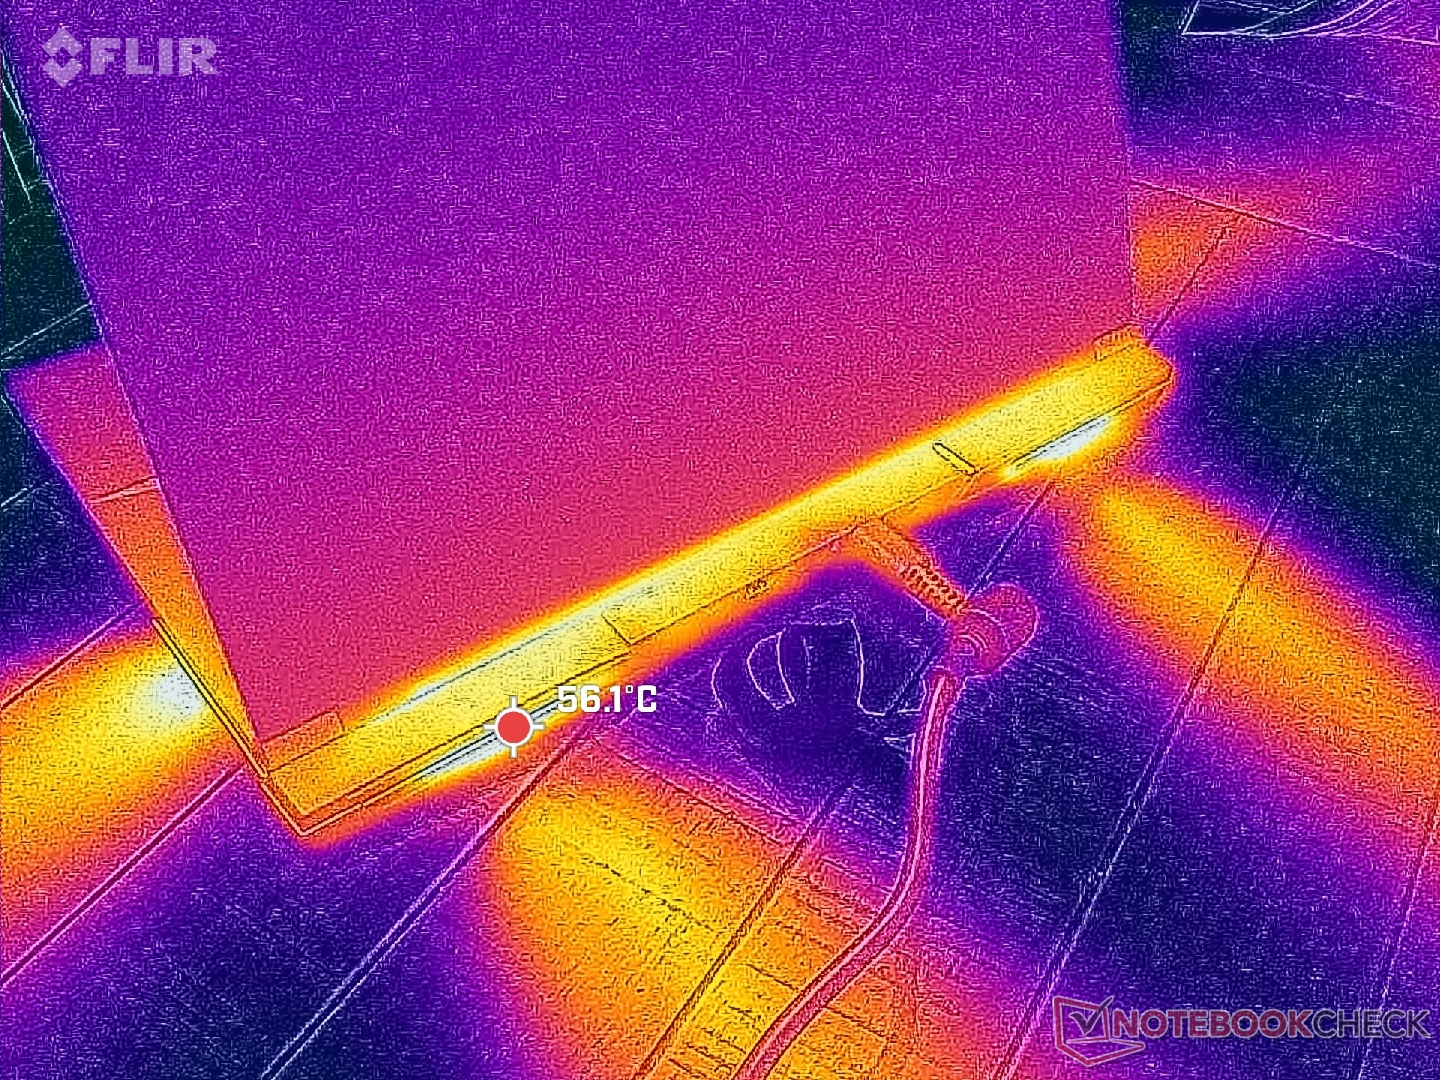
(-) A temperatura máxima no lado superior é 52.2 °C / 126 F, em comparação com a média de 40.4 °C / 105 F , variando de 21.2 a 68.8 °C para a classe Gaming.
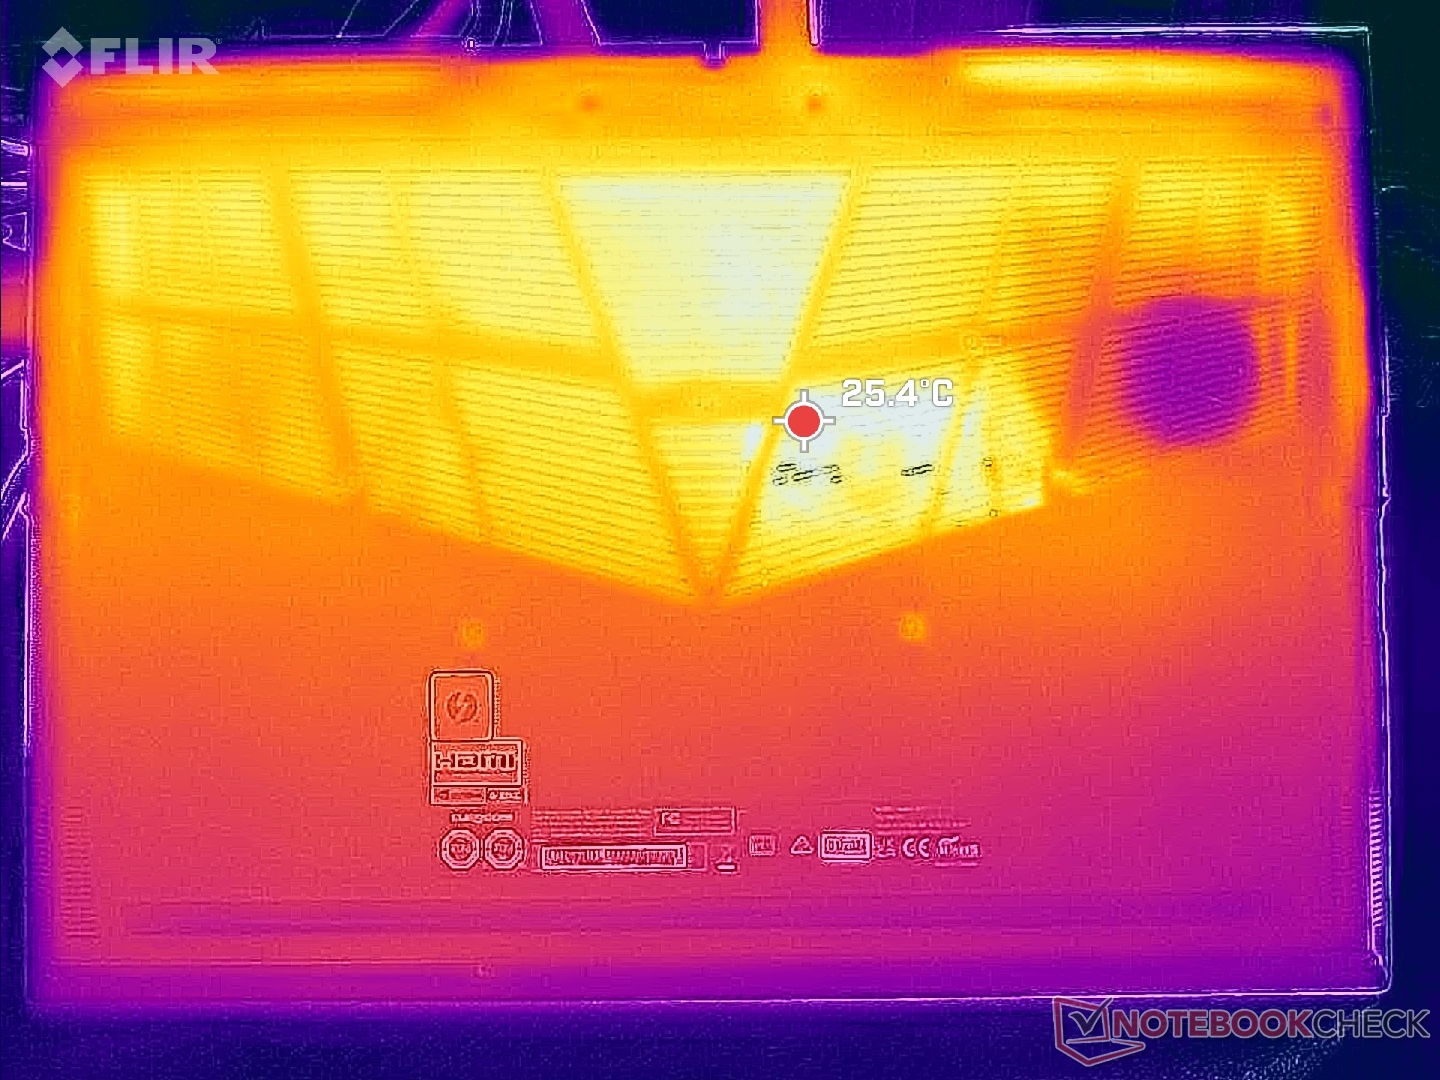
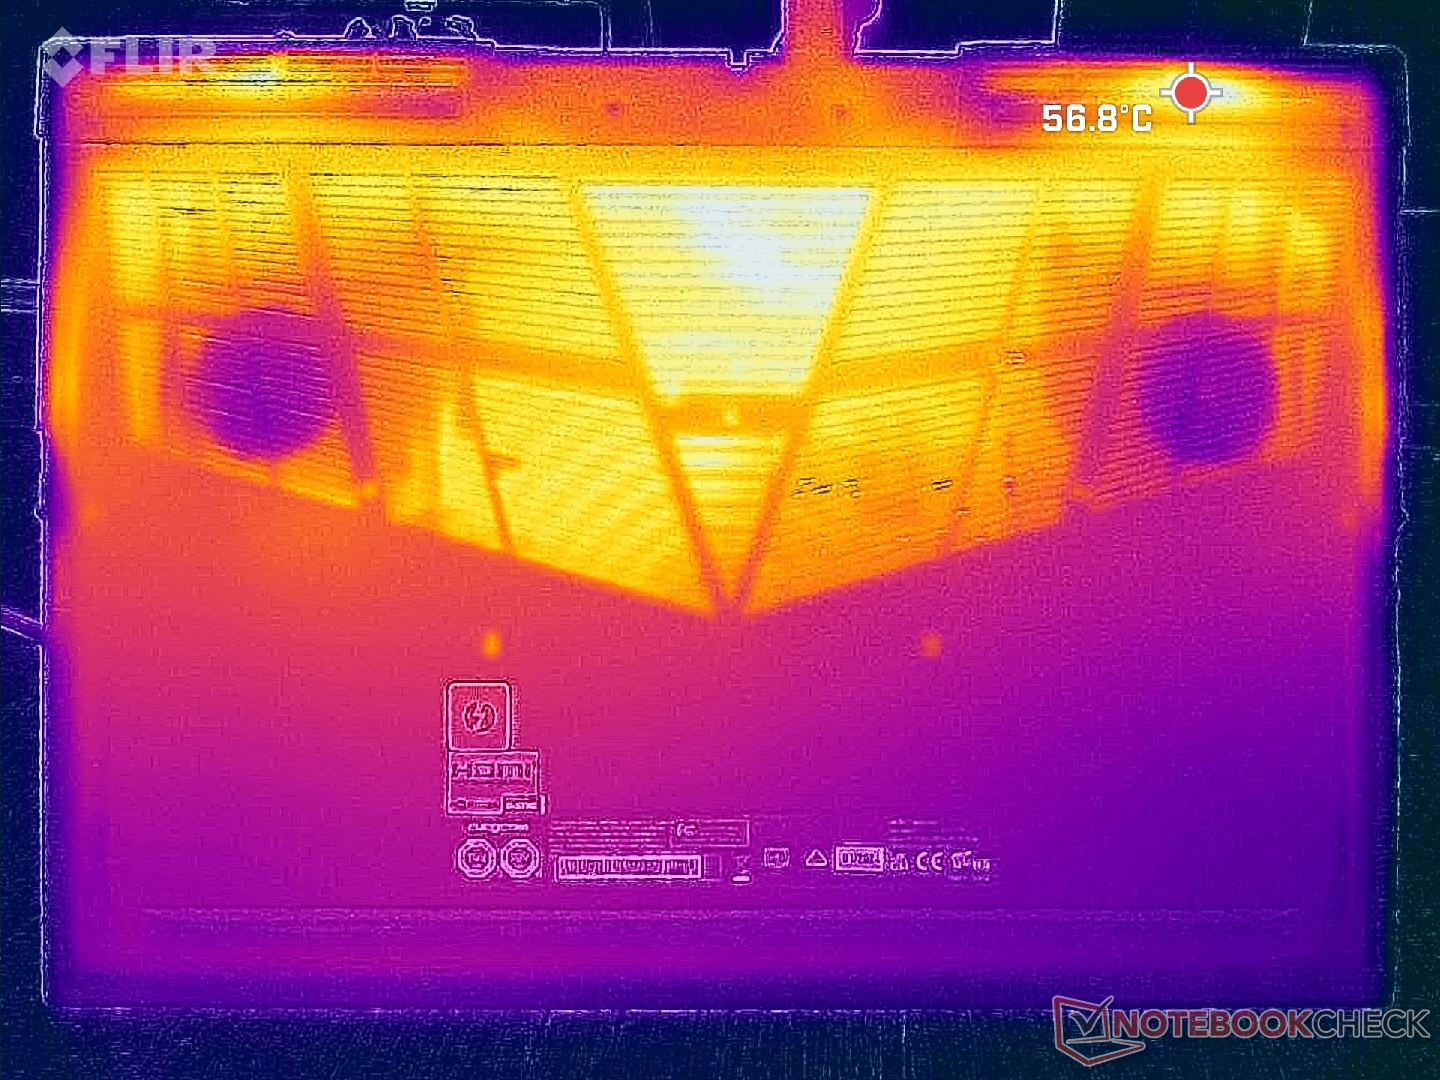
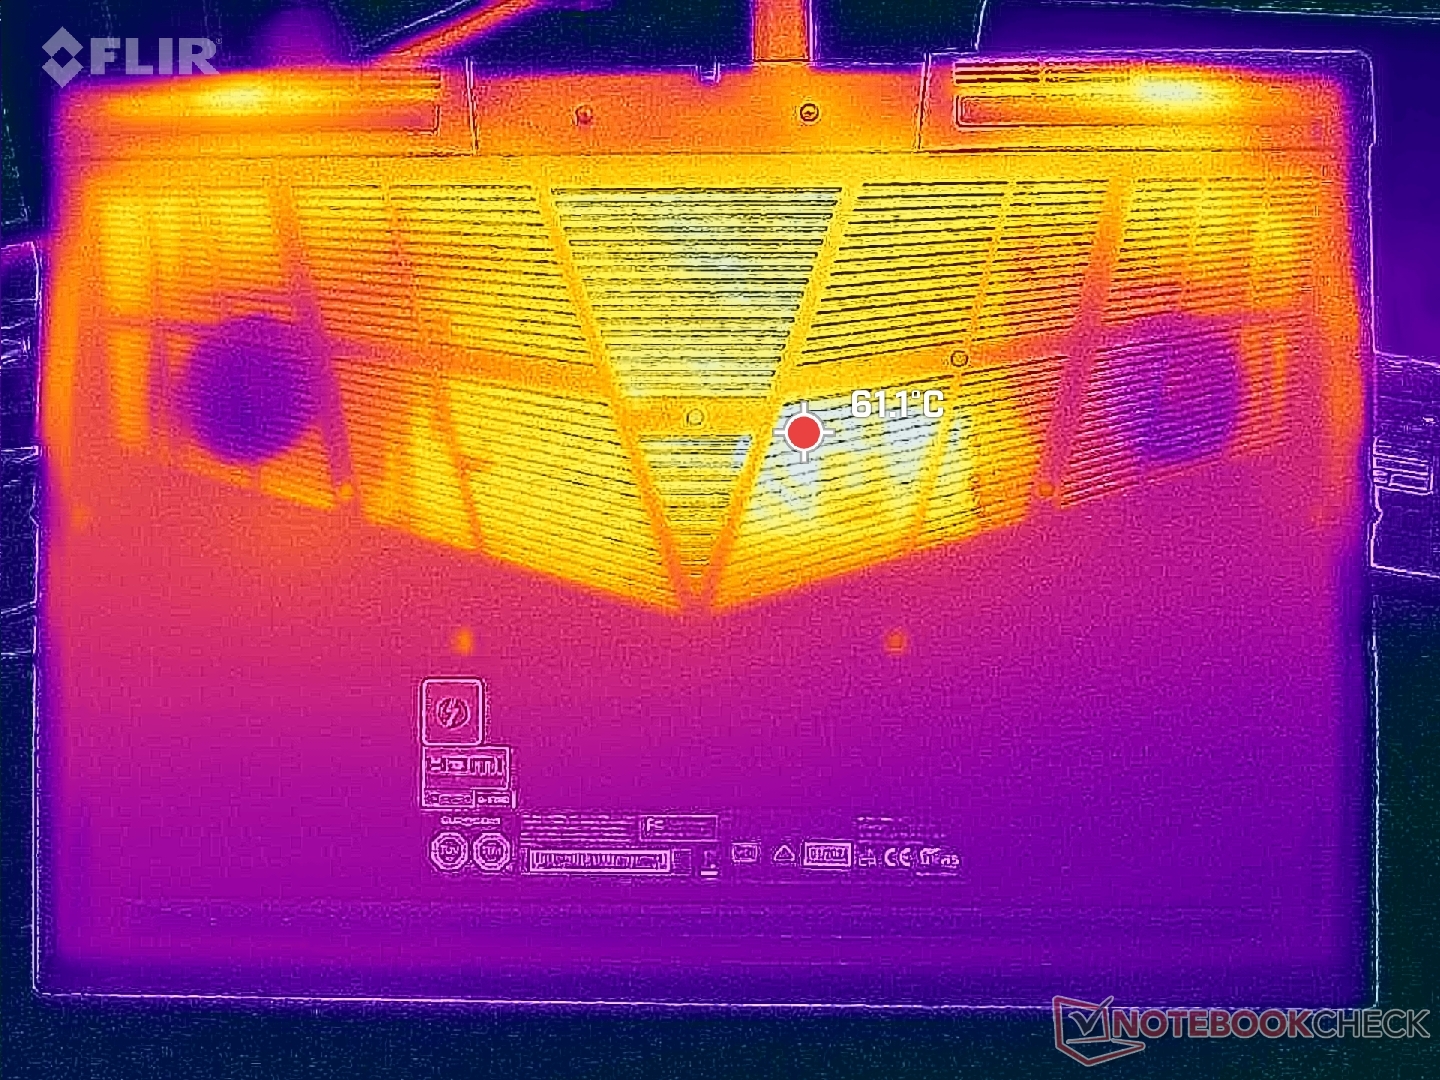
(-) A parte inferior aquece até um máximo de 53.2 °C / 128 F, em comparação com a média de 43.2 °C / 110 F
(+) Em uso inativo, a temperatura média para o lado superior é 25.8 °C / 78 F, em comparação com a média do dispositivo de 33.9 °C / ### class_avg_f### F.
(±) Jogando The Witcher 3, a temperatura média para o lado superior é 36.7 °C / 98 F, em comparação com a média do dispositivo de 33.9 °C / ## #class_avg_f### F.
(+) Os apoios para as mãos e o touchpad são mais frios que a temperatura da pele, com um máximo de 28.8 °C / 83.8 F e, portanto, são frios ao toque.
(±) A temperatura média da área do apoio para as mãos de dispositivos semelhantes foi 28.8 °C / 83.8 F (0 °C / 0 F).
| Eurocom Raptor X17 Core i9-14900HX Intel Core i9-14900HX, NVIDIA GeForce RTX 4090 Laptop GPU | Eurocom Raptor X17 Intel Core i9-13900HX, NVIDIA GeForce RTX 4090 Laptop GPU | Asus TUF Gaming A17 FA707XI-NS94 AMD Ryzen 9 7940HS, NVIDIA GeForce RTX 4070 Laptop GPU | Asus ROG Strix Scar 17 G733PY-XS96 AMD Ryzen 9 7945HX, NVIDIA GeForce RTX 4090 Laptop GPU | MSI GE78HX 13VH-070US Intel Core i9-13950HX, NVIDIA GeForce RTX 4080 Laptop GPU | MSI Titan 18 HX A14VIG Intel Core i9-14900HX, NVIDIA GeForce RTX 4090 Laptop GPU | |
|---|---|---|---|---|---|---|
| Heat | -7% | 21% | 18% | 8% | 4% | |
| Maximum Upper Side * (°C) | 52.2 | 49.4 5% | 40 23% | 34.6 34% | 37.4 28% | 37.8 28% |
| Maximum Bottom * (°C) | 53.2 | 55.2 -4% | 33.6 37% | 35.6 33% | 45 15% | 37.6 29% |
| Idle Upper Side * (°C) | 28.6 | 33.4 -17% | 26.6 7% | 27.2 5% | 29.8 -4% | 34.8 -22% |
| Idle Bottom * (°C) | 29.8 | 33.4 -12% | 24.4 18% | 30 -1% | 32.4 -9% | 36 -21% |
* ... menor é melhor
Alto-falantes
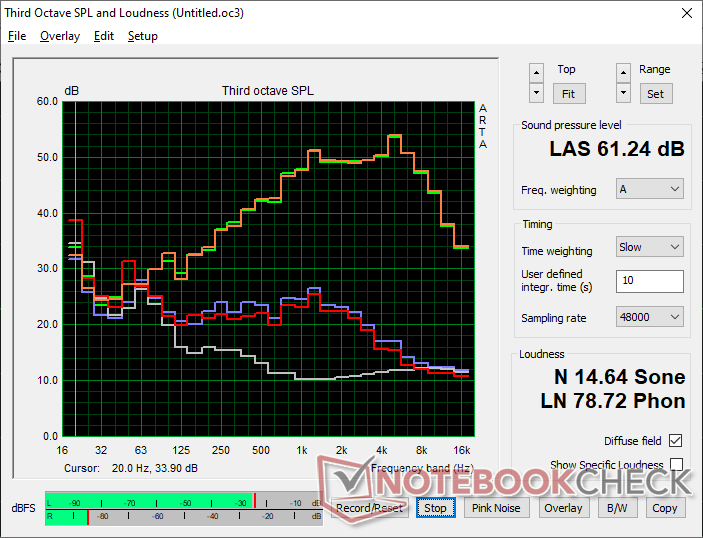
Eurocom Raptor X17 Core i9-14900HX análise de áudio
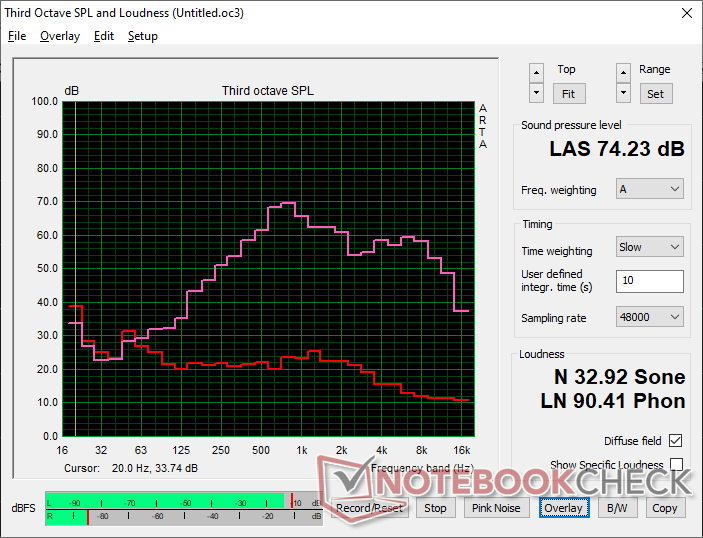
(±) | o volume do alto-falante é médio, mas bom (###valor### dB)
Graves 100 - 315Hz
(±) | graves reduzidos - em média 13.4% menor que a mediana
(±) | a linearidade dos graves é média (10.1% delta para a frequência anterior)
Médios 400 - 2.000 Hz
(±) | médios mais altos - em média 6.6% maior que a mediana
(±) | a linearidade dos médios é média (8.6% delta para frequência anterior)
Altos 2 - 16 kHz
(+) | agudos equilibrados - apenas 2% longe da mediana
(±) | a linearidade dos máximos é média (8.5% delta para frequência anterior)
Geral 100 - 16.000 Hz
(±) | a linearidade do som geral é média (24% diferença em relação à mediana)
Comparado com a mesma classe
» 86% de todos os dispositivos testados nesta classe foram melhores, 4% semelhantes, 9% piores
» O melhor teve um delta de 6%, a média foi 18%, o pior foi 132%
Comparado com todos os dispositivos testados
» 72% de todos os dispositivos testados foram melhores, 6% semelhantes, 22% piores
» O melhor teve um delta de 4%, a média foi 23%, o pior foi 134%
Apple MacBook Pro 16 2021 M1 Pro análise de áudio
(+) | os alto-falantes podem tocar relativamente alto (###valor### dB)
Graves 100 - 315Hz
(+) | bons graves - apenas 3.8% longe da mediana
(+) | o baixo é linear (5.2% delta para a frequência anterior)
Médios 400 - 2.000 Hz
(+) | médios equilibrados - apenas 1.3% longe da mediana
(+) | médios são lineares (2.1% delta para frequência anterior)
Altos 2 - 16 kHz
(+) | agudos equilibrados - apenas 1.9% longe da mediana
(+) | os máximos são lineares (2.7% delta da frequência anterior)
Geral 100 - 16.000 Hz
(+) | o som geral é linear (4.6% diferença em relação à mediana)
Comparado com a mesma classe
» 0% de todos os dispositivos testados nesta classe foram melhores, 0% semelhantes, 100% piores
» O melhor teve um delta de 5%, a média foi 17%, o pior foi 45%
Comparado com todos os dispositivos testados
» 0% de todos os dispositivos testados foram melhores, 0% semelhantes, 100% piores
» O melhor teve um delta de 4%, a média foi 23%, o pior foi 134%
Gerenciamento de energia
Consumo de energia
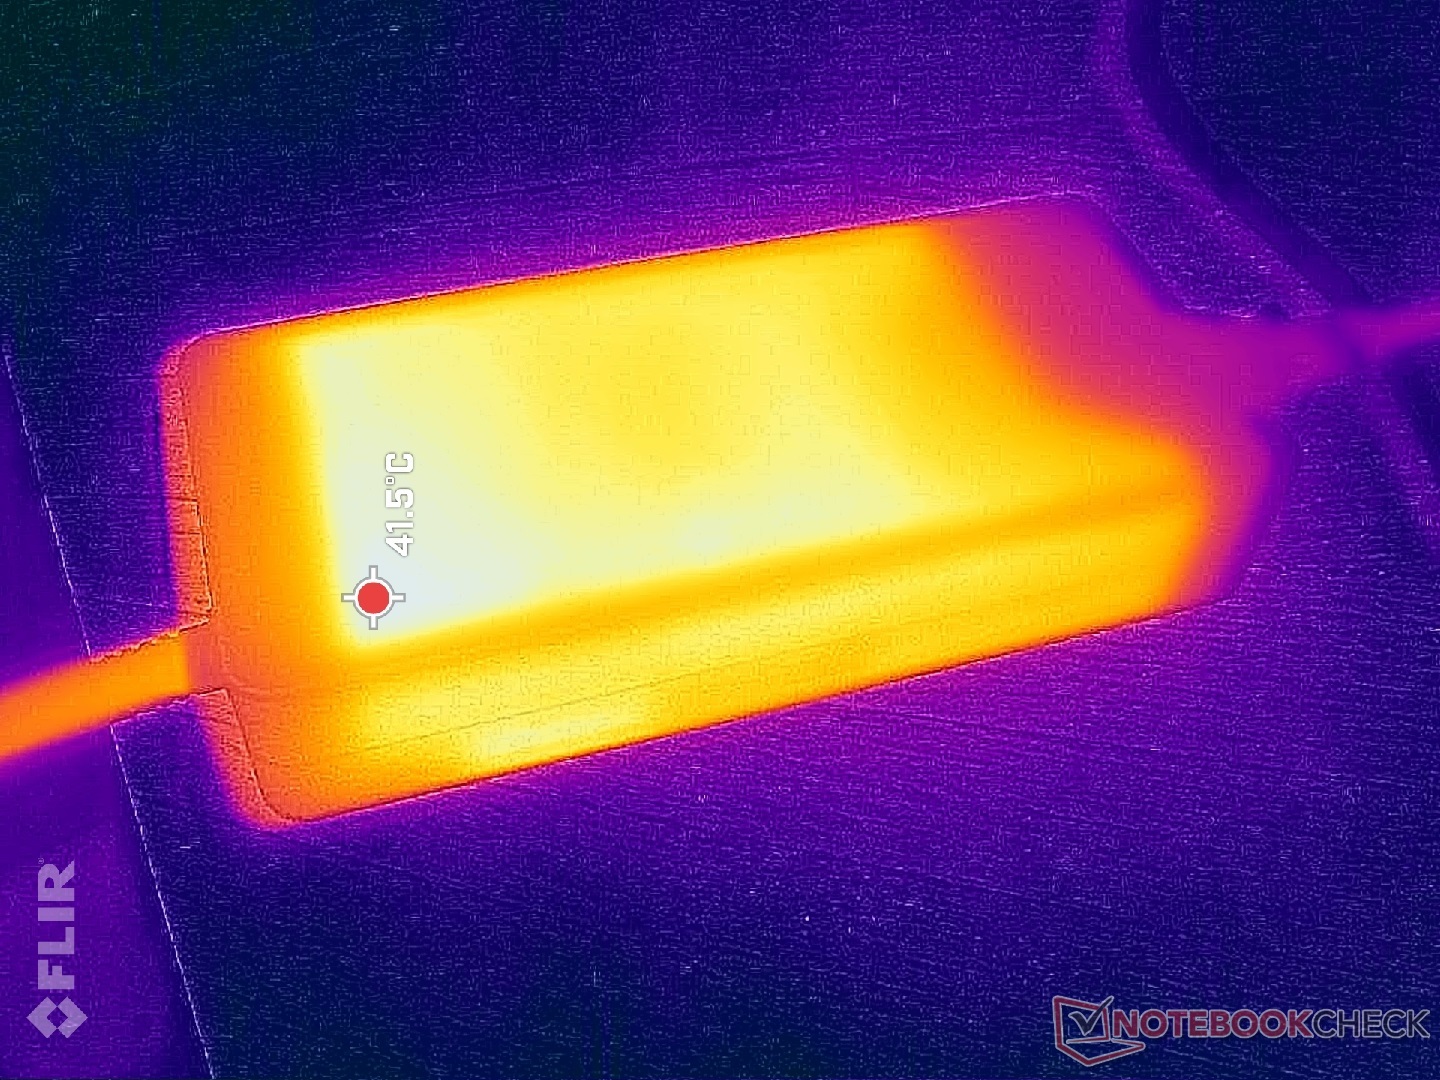
Funcionamento Witcher 3 exige um pouco mais de energia do que antes, cerca de 325 W, para ser quase igual ao Titan 18 HX. O consumo mais alto em comparação com o nosso modelo 2023 provavelmente pode ser atribuído ao painel 4K mais brilhante e de maior resolução da nossa configuração mais recente.
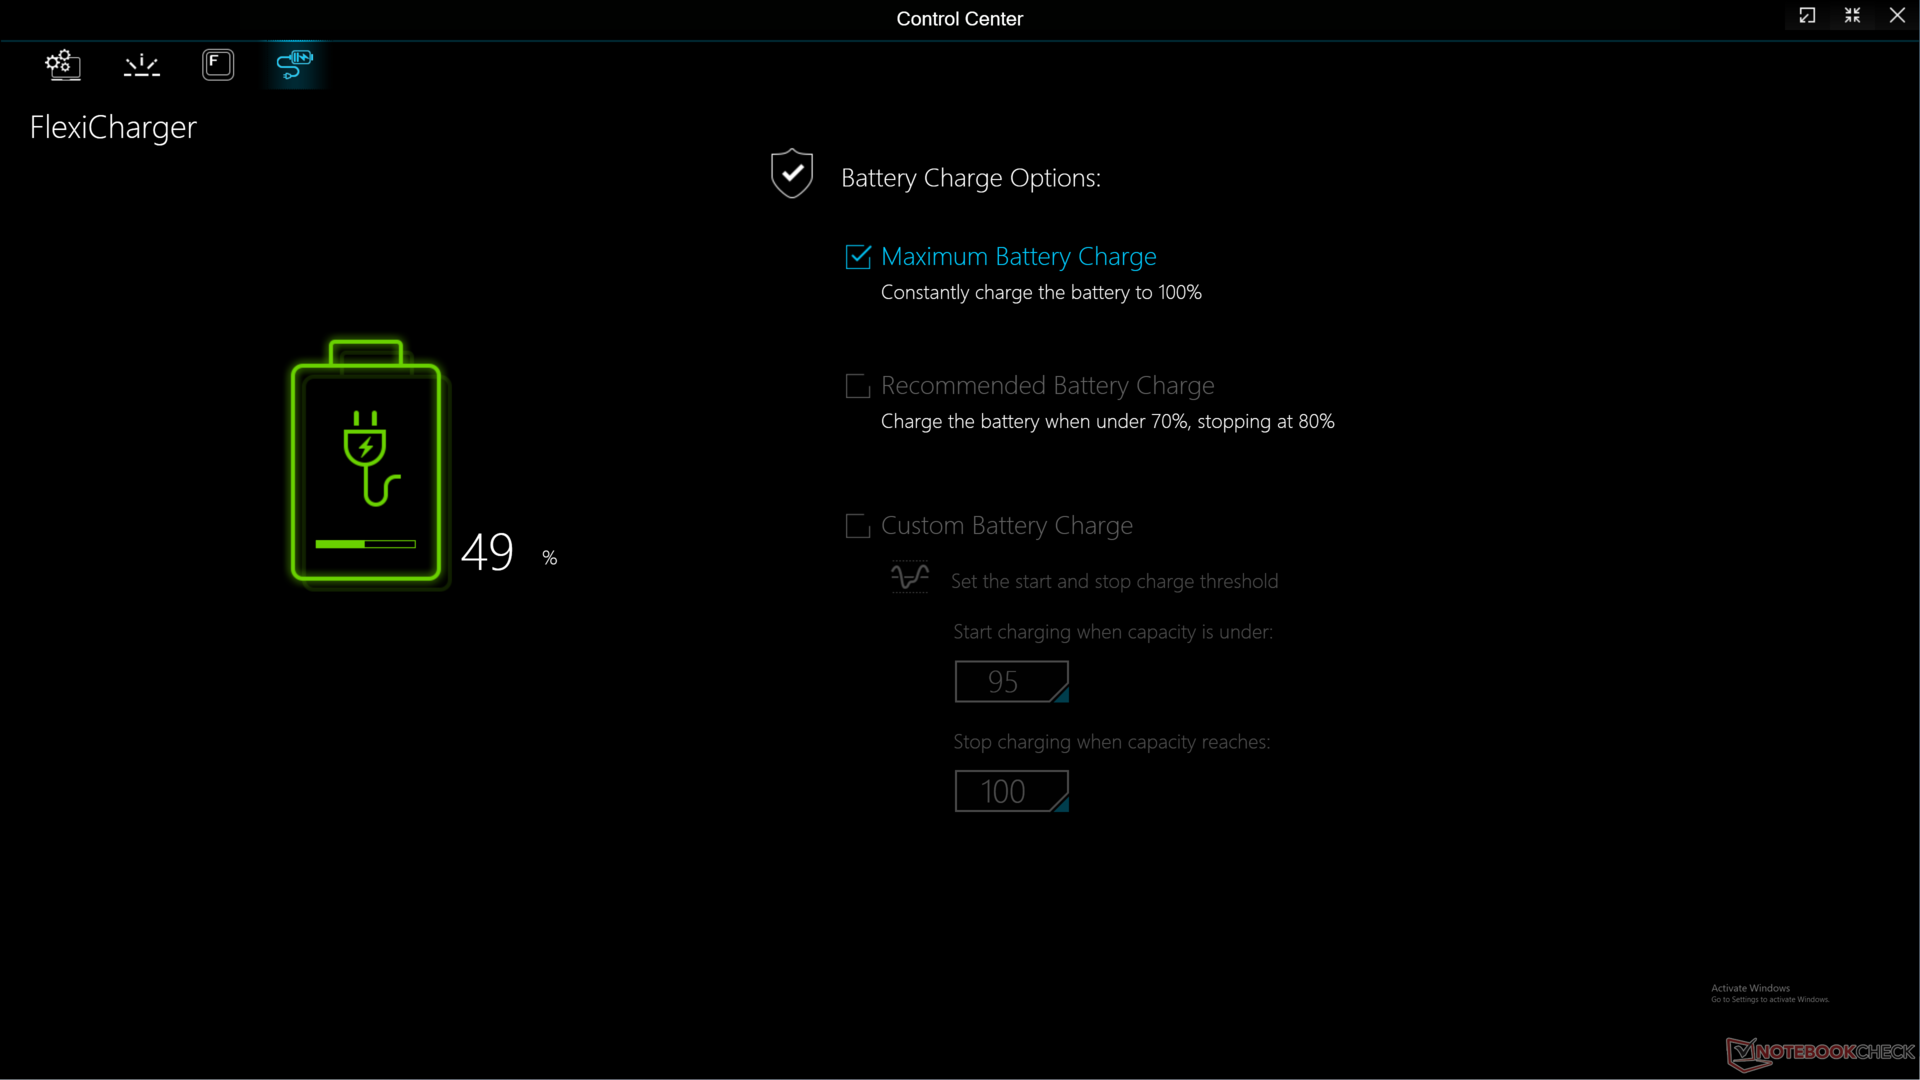
O grande adaptador CA de 330 W permanece o mesmo de antes. Como os jogos já exigem quase toda a saída do adaptador, tentar carregar a bateria durante os jogos levará muito, muito mais tempo.
(Nota do editor: esta seção será atualizada quando os reparos em nosso multímetro Metrahit Energy forem concluídos. Pedimos desculpas pela inconveniência)
| desligado | |
| Ocioso | |
| Carga |
|
Key:
min: | |
| Eurocom Raptor X17 Core i9-14900HX i9-14900HX, GeForce RTX 4090 Laptop GPU, Corsair MP700 Pro 2TB, IPS, 3840x2160, 17.3" | Eurocom Raptor X17 i9-13900HX, GeForce RTX 4090 Laptop GPU, 3x Samsung SSD 980 Pro 1TB (RAID 0), IPS, 2560x1440, 17.3" | Asus TUF Gaming A17 FA707XI-NS94 R9 7940HS, GeForce RTX 4070 Laptop GPU, WD PC SN560 SDDPNQE-1T00, IPS, 1920x1080, 17.3" | Asus ROG Strix Scar 17 G733PY-XS96 R9 7945HX, GeForce RTX 4090 Laptop GPU, SK hynix PC801 HFS001TEJ9X101N, IPS, 2560x1440, 17.3" | MSI GE78HX 13VH-070US i9-13950HX, GeForce RTX 4080 Laptop GPU, Samsung PM9A1 MZVL22T0HBLB, IPS, 2560x1600, 17" | MSI Titan 18 HX A14VIG i9-14900HX, GeForce RTX 4090 Laptop GPU, 2x Samsung PM9A1a MZVL22T0HDLB (RAID 0), Mini-LED, 3840x2400, 18" | |
|---|---|---|---|---|---|---|
| Power Consumption | 13% | 45% | 17% | 16% | -1% | |
| Idle Minimum * (Watt) | 18.7 | 13.4 28% | 6.2 67% | 14.5 22% | 16.1 14% | 13.2 29% |
| Idle Average * (Watt) | 29.9 | 22.2 26% | 21.8 27% | 21.1 29% | 24 20% | 25.4 15% |
| Idle Maximum * (Watt) | 43.8 | 42.4 3% | 22 50% | 42.8 2% | 34 22% | 53.5 -22% |
| Load Average * (Watt) | 148.9 | 132.8 11% | 59.2 60% | 116.7 22% | 123.6 17% | 151.4 -2% |
| Witcher 3 ultra * (Watt) | 310.5 | 304 2% | 189.7 39% | 278 10% | 286 8% | 336 -8% |
| Load Maximum * (Watt) | 340.2 | 319.8 6% | 247.8 27% | 279.6 18% | 285.7 16% | 395.2 -16% |
* ... menor é melhor
Power Consumption Witcher 3 / Stresstest
Power Consumption external Monitor
Duração da bateria
Os tempos de execução são um pouco mais curtos do que na configuração do ano passado, provavelmente devido à resolução 4K mais exigente.
| Eurocom Raptor X17 Core i9-14900HX i9-14900HX, GeForce RTX 4090 Laptop GPU, 99 Wh | Eurocom Raptor X17 i9-13900HX, GeForce RTX 4090 Laptop GPU, 99 Wh | Asus TUF Gaming A17 FA707XI-NS94 R9 7940HS, GeForce RTX 4070 Laptop GPU, 90 Wh | Asus ROG Strix Scar 17 G733PY-XS96 R9 7945HX, GeForce RTX 4090 Laptop GPU, 90 Wh | MSI GE78HX 13VH-070US i9-13950HX, GeForce RTX 4080 Laptop GPU, 99 Wh | MSI Titan 18 HX A14VIG i9-14900HX, GeForce RTX 4090 Laptop GPU, 99.9 Wh | |
|---|---|---|---|---|---|---|
| Duração da bateria | 6% | 94% | -13% | 30% | -11% | |
| WiFi v1.3 (h) | 4.7 | 5 6% | 9.1 94% | 4.1 -13% | 6.1 30% | 4.2 -11% |
| Reader / Idle (h) | 10.2 | 19.7 | 7.3 | 5.9 | ||
| Load (h) | 1.5 | 1.7 | 1.5 | 1.2 |
Pro
Contra
Veredicto - Novo processador, mesma aparência
Como o Core i9-14900HX é em grande parte uma reformulação do Core i9-13900HX do passado, o Eurocom Raptor X17 2024 não oferece muito mais do que a versão 2023. O desempenho do processador pode ser ligeiramente mais rápido, mas quase todo o resto permanece inalterado. No entanto, o desempenho geral ainda é comparável ao de alguns dos laptops mais rápidos disponíveis, incluindo o MSI Titan HX ou o Asus ROG Strix Scar 18. A Eurocom não oferece mini-LED ou OLED para esse modelo, mas essas opções atendem aos usuários de multimídia, enquanto o Raptor X17 foi projetado mais para espaços profissionais de alto desempenho.
O ruído do ventilador pode ser um pouco mais estável, mas não espere ganhos significativos de desempenho em relação às opções já super-rápidas da geração anterior.
Os usuários avançados que decidirem configurar com um SSD PCIe5 devem considerar a possibilidade de encomendar também o dissipador de calor. Caso contrário, a unidade PCIe5 se comportará mais como uma unidade PCIe4 após apenas alguns minutos de uso intenso.
Preço e disponibilidade
A Eurocom já está enviando o 2024 Raptor X17 a partir de US$ 3500 para a RTX 4080 e tela 2K. A configuração com a RTX 4090 e a tela 4K, como em nossa unidade de análise, aumentará o preço para mais de US$ 4200.
Eurocom Raptor X17 Core i9-14900HX
- 03/15/2024 v7 (old)
Allen Ngo
Transparência
A seleção dos dispositivos a serem analisados é feita pela nossa equipe editorial. A amostra de teste foi fornecida ao autor como empréstimo pelo fabricante ou varejista para fins desta revisão. O credor não teve influência nesta revisão, nem o fabricante recebeu uma cópia desta revisão antes da publicação. Não houve obrigação de publicar esta revisão. Como empresa de mídia independente, a Notebookcheck não está sujeita à autoridade de fabricantes, varejistas ou editores.
É assim que o Notebookcheck está testando
Todos os anos, o Notebookcheck analisa de forma independente centenas de laptops e smartphones usando procedimentos padronizados para garantir que todos os resultados sejam comparáveis. Desenvolvemos continuamente nossos métodos de teste há cerca de 20 anos e definimos padrões da indústria no processo. Em nossos laboratórios de teste, equipamentos de medição de alta qualidade são utilizados por técnicos e editores experientes. Esses testes envolvem um processo de validação em vários estágios. Nosso complexo sistema de classificação é baseado em centenas de medições e benchmarks bem fundamentados, o que mantém a objetividade.Price comparison

