A caixa de resfriamento líquido funciona mais silenciosa do que o esperado: Revisão de laptop Uniwell Technology GM7AG8N
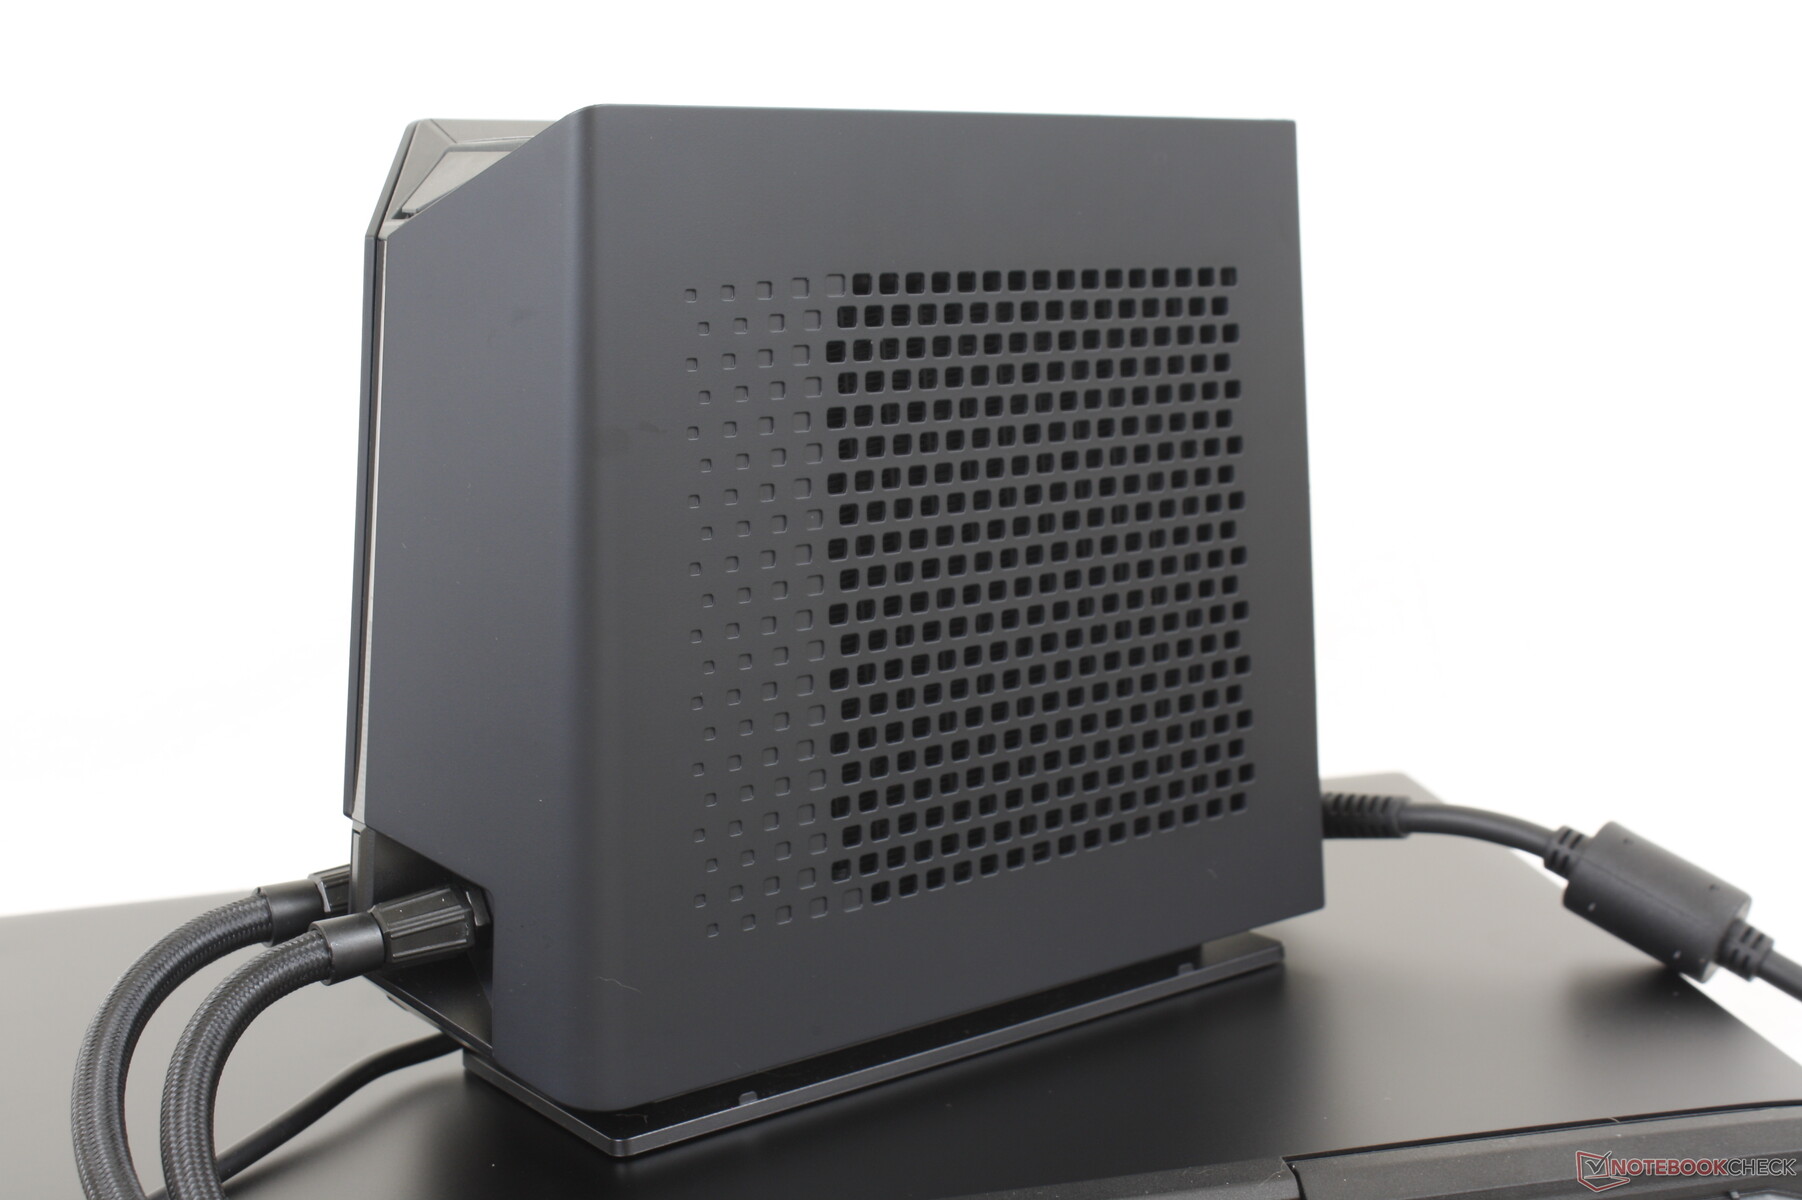
Após testar orefrigerado a água Tongfang GM5AG8W de 15,6 polegadas no início deste ano da Schenker, agora estamos prontos para testar o Tongfang GM7AG8N refrigerado a água, de 17 polegadas, cortesia da Uniwell Technology. As docas de resfriamento externas podem ser consideradas uma solução extrema para as elevadas demandas de resfriamento das CPUs e GPUs móveis mais recentes. Enquanto os computadores de mesa têm o luxo do espaço, os laptops para jogos devem se encaixar a cada ano em processadores cada vez mais rápidos em formatos cada vez mais finos.
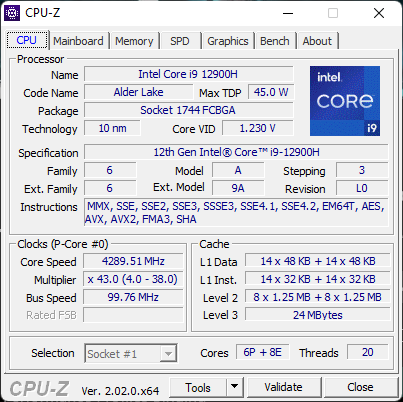
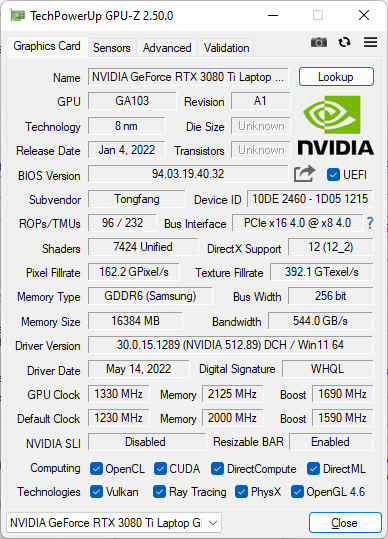
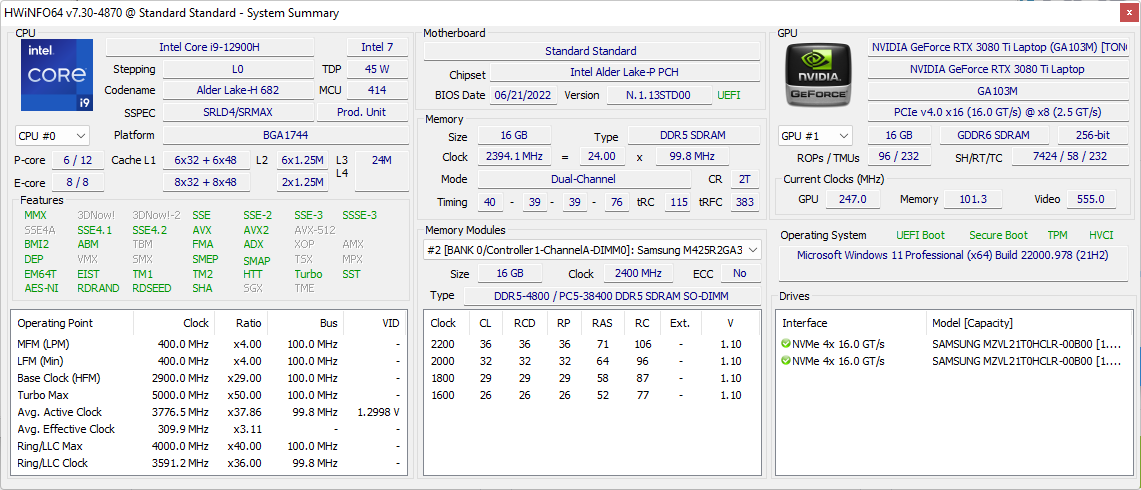
Nossa unidade de teste vem com o 12º Core i9-12900H CPU gen, 175 W GeForce RTX 3080 Ti GPU com MUX, display IPS de 17 polegadas 240 Hz 1600p, e um teclado mecânico Cherry MX integrado. O modelo ainda não está amplamente disponível no momento da publicação.
A Uniwell Technology GM7AG8N compete diretamente com laptops mais tradicionais de 17 polegadas como o Razer Blade 17, Asus ROG Zephyrus S17, MSI Stealth GS77, ou o Gigabyte Aorus 17X. Entretanto, o Uniwell é um fator de forma 16:10, enquanto a maioria das outras alternativas de 17 polegadas ainda são 16:9. A caixa de resfriamento é a mesma da Schenker GM5AG8W e por isso recomendamos verificar nossas revisões existentes aqui e aqui para mais detalhes sobre como configurar o refrigerador externo.
Mais resenhas da Uniwell Technology:
Possíveis concorrentes em comparação
Avaliação | Data | Modelo | Peso | Altura | Size | Resolução | Preço |
|---|---|---|---|---|---|---|---|
| 88.1 % v7 (old) | 10/2022 | Uniwell Technology GM7AG8N Liquid Cooling Box i9-12900H, GeForce RTX 3080 Ti Laptop GPU | 2.7 kg | 27.6 mm | 17.00" | 2560x1600 | |
| 88.3 % v7 (old) | 08/2022 | MSI Titan GT77 12UHS i9-12900HX, GeForce RTX 3080 Ti Laptop GPU | 3.3 kg | 23 mm | 17.30" | 1920x1080 | |
| 83.7 % v7 (old) | 08/2022 | Aorus 17X XES i9-12900HX, GeForce RTX 3070 Ti Laptop GPU | 2.7 kg | 30 mm | 17.30" | 1920x1080 | |
| 89.9 % v7 (old) | 07/2022 | Razer Blade 17 Early 2022 i9-12900H, GeForce RTX 3080 Ti Laptop GPU | 2.8 kg | 19.9 mm | 17.30" | 3840x2160 | |
| 87.2 % v7 (old) | 04/2022 | MSI Stealth GS77 12UHS-083US i7-12700H, GeForce RTX 3080 Ti Laptop GPU | 2.9 kg | 20.8 mm | 17.30" | 2560x1440 | |
| 90.1 % v7 (old) | 07/2021 | Asus ROG Zephyrus S17 GX703HSD i9-11900H, GeForce RTX 3080 Laptop GPU | 2.8 kg | 19.9 mm | 17.30" | 2560x1440 |
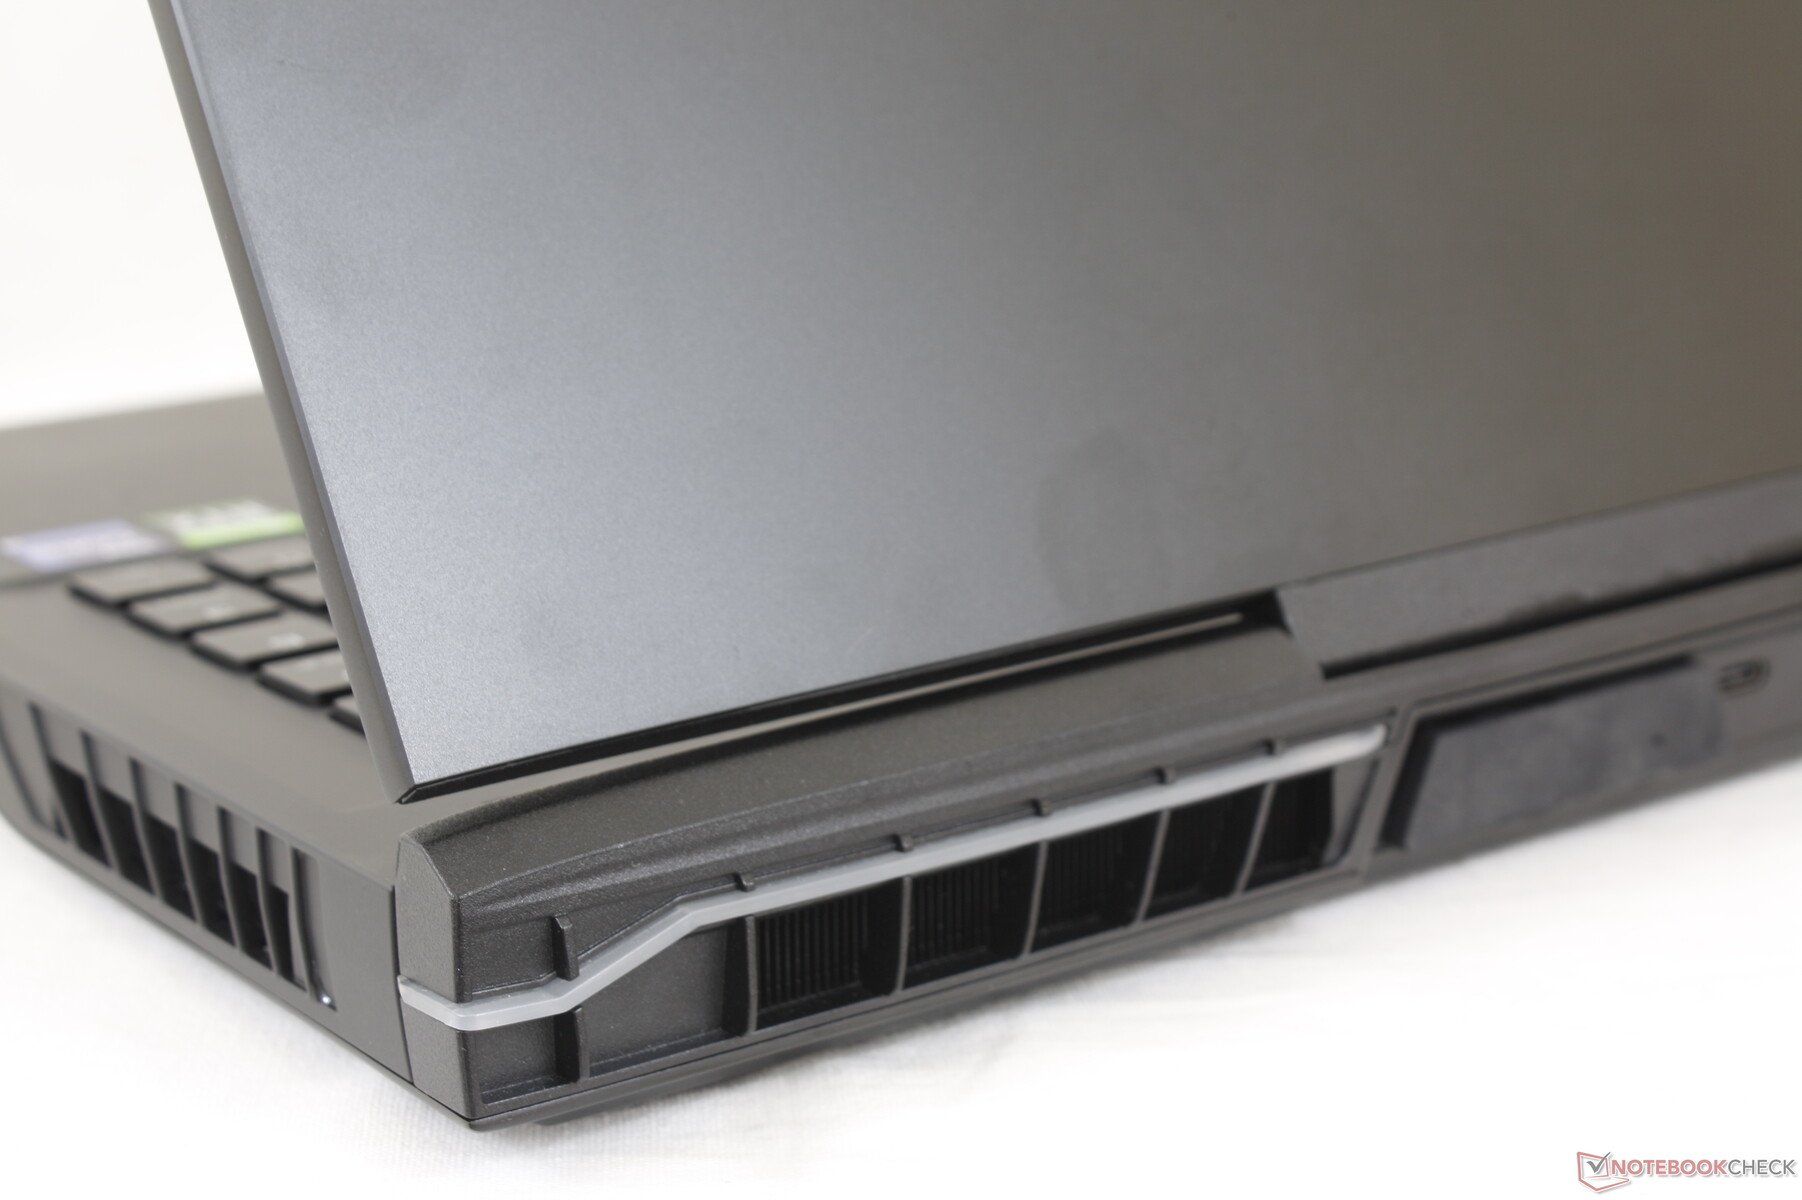
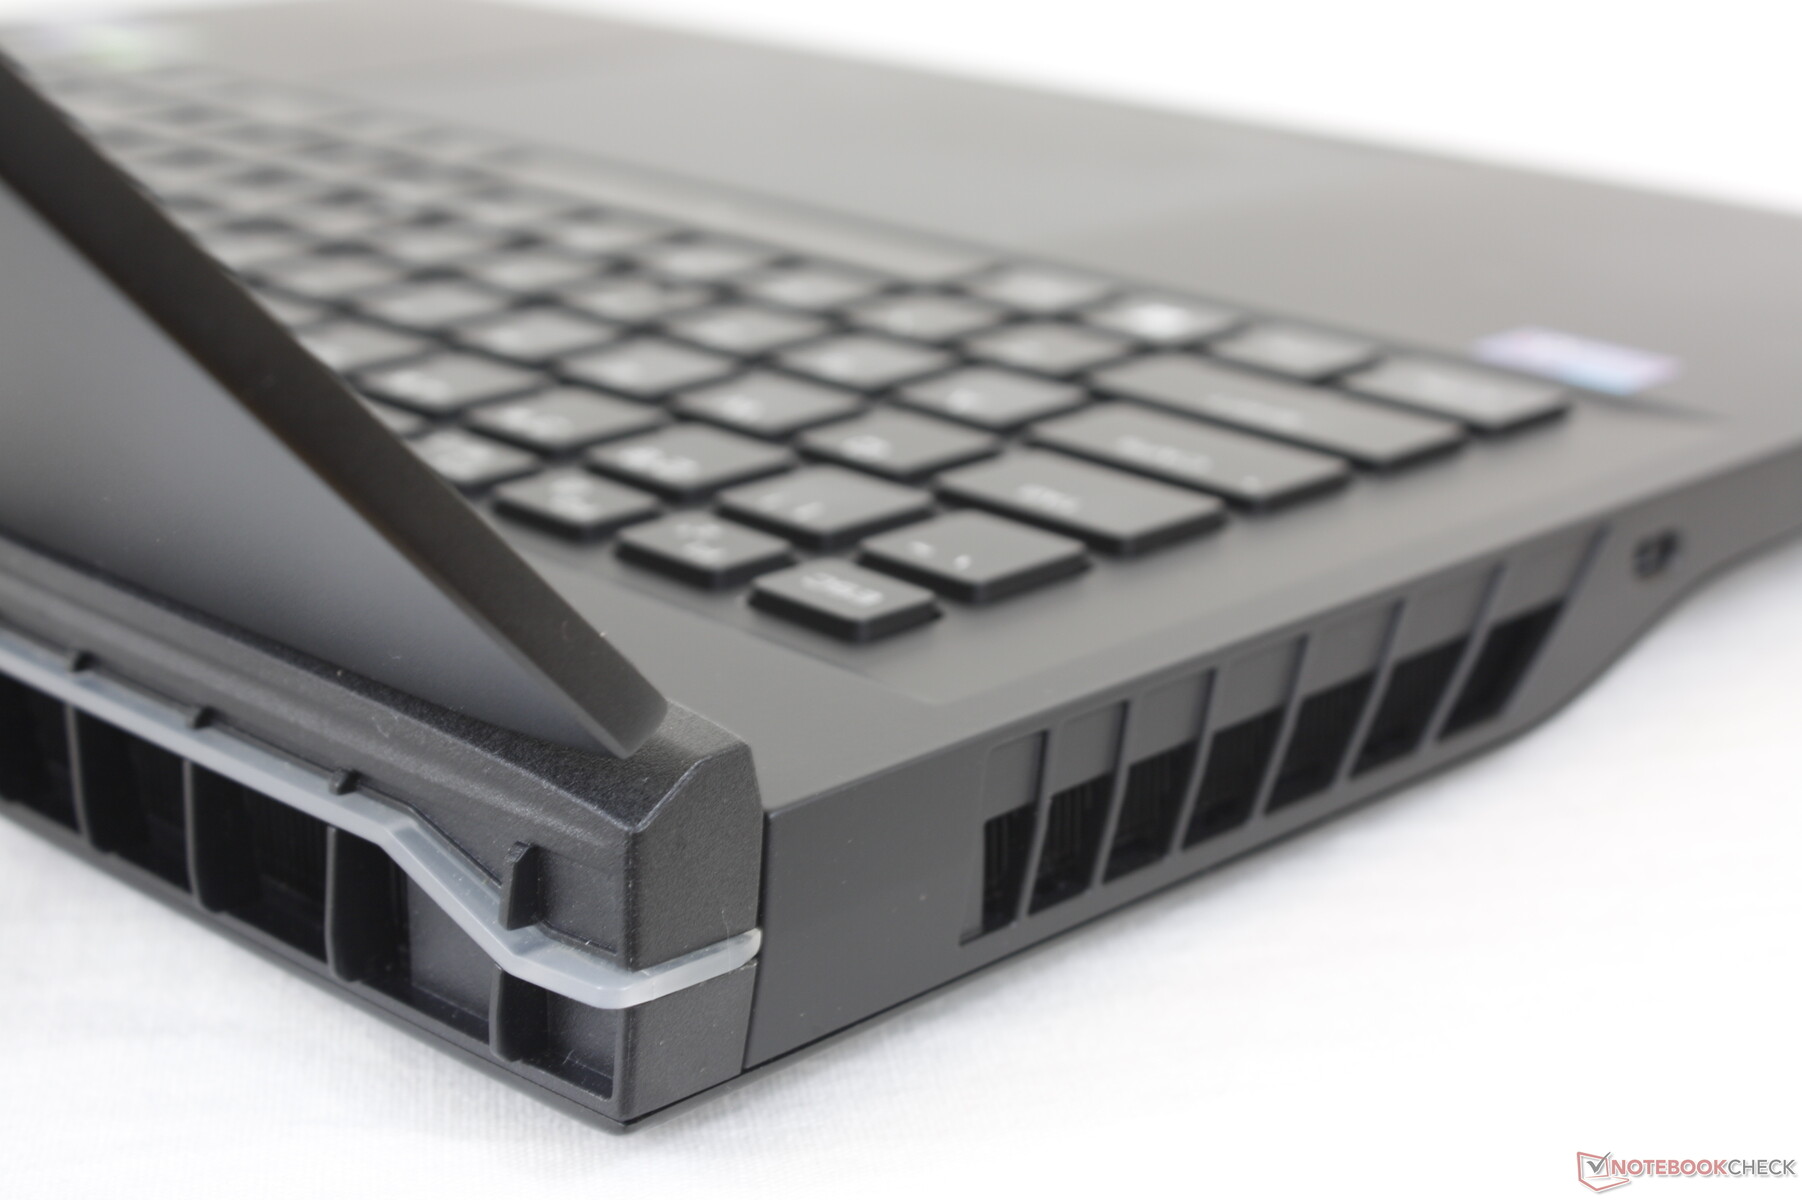
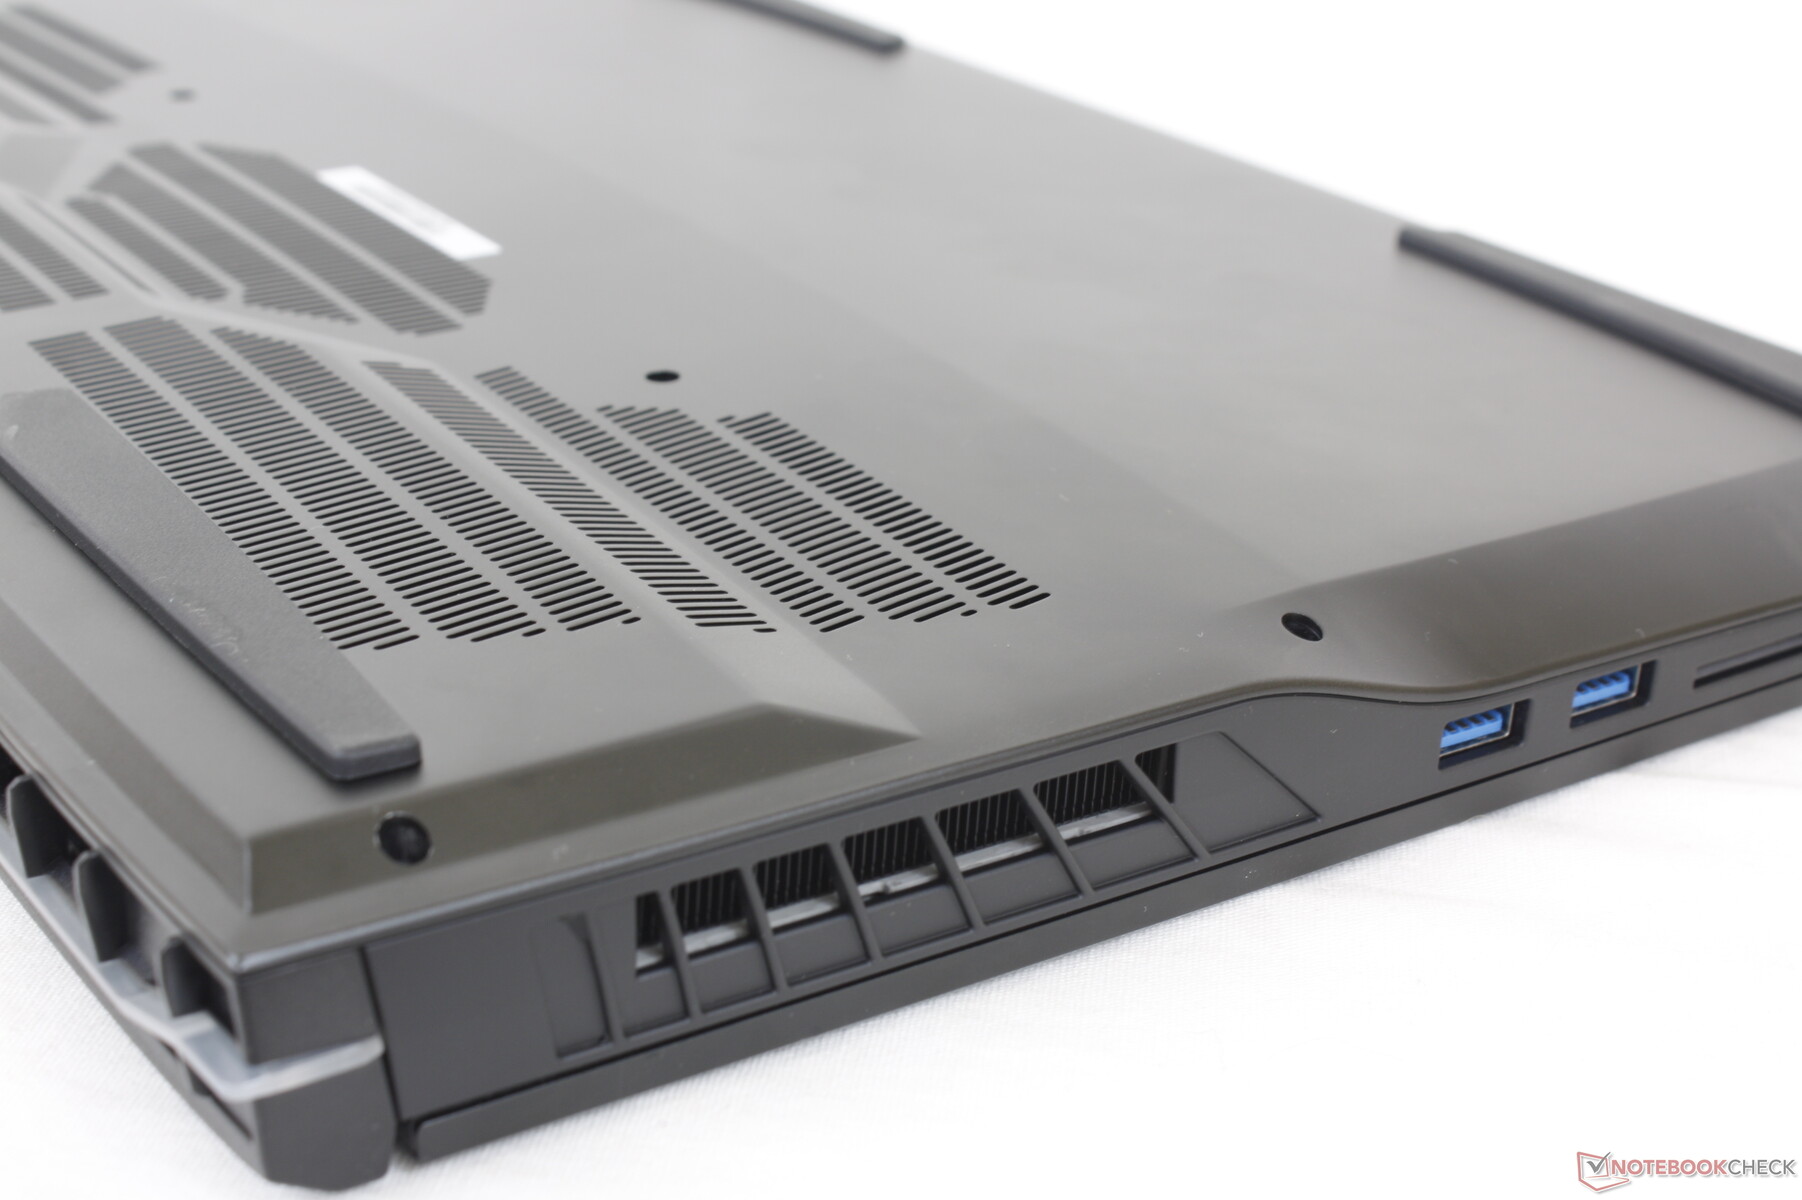
Estojo - Um imã de impressão digital enorme
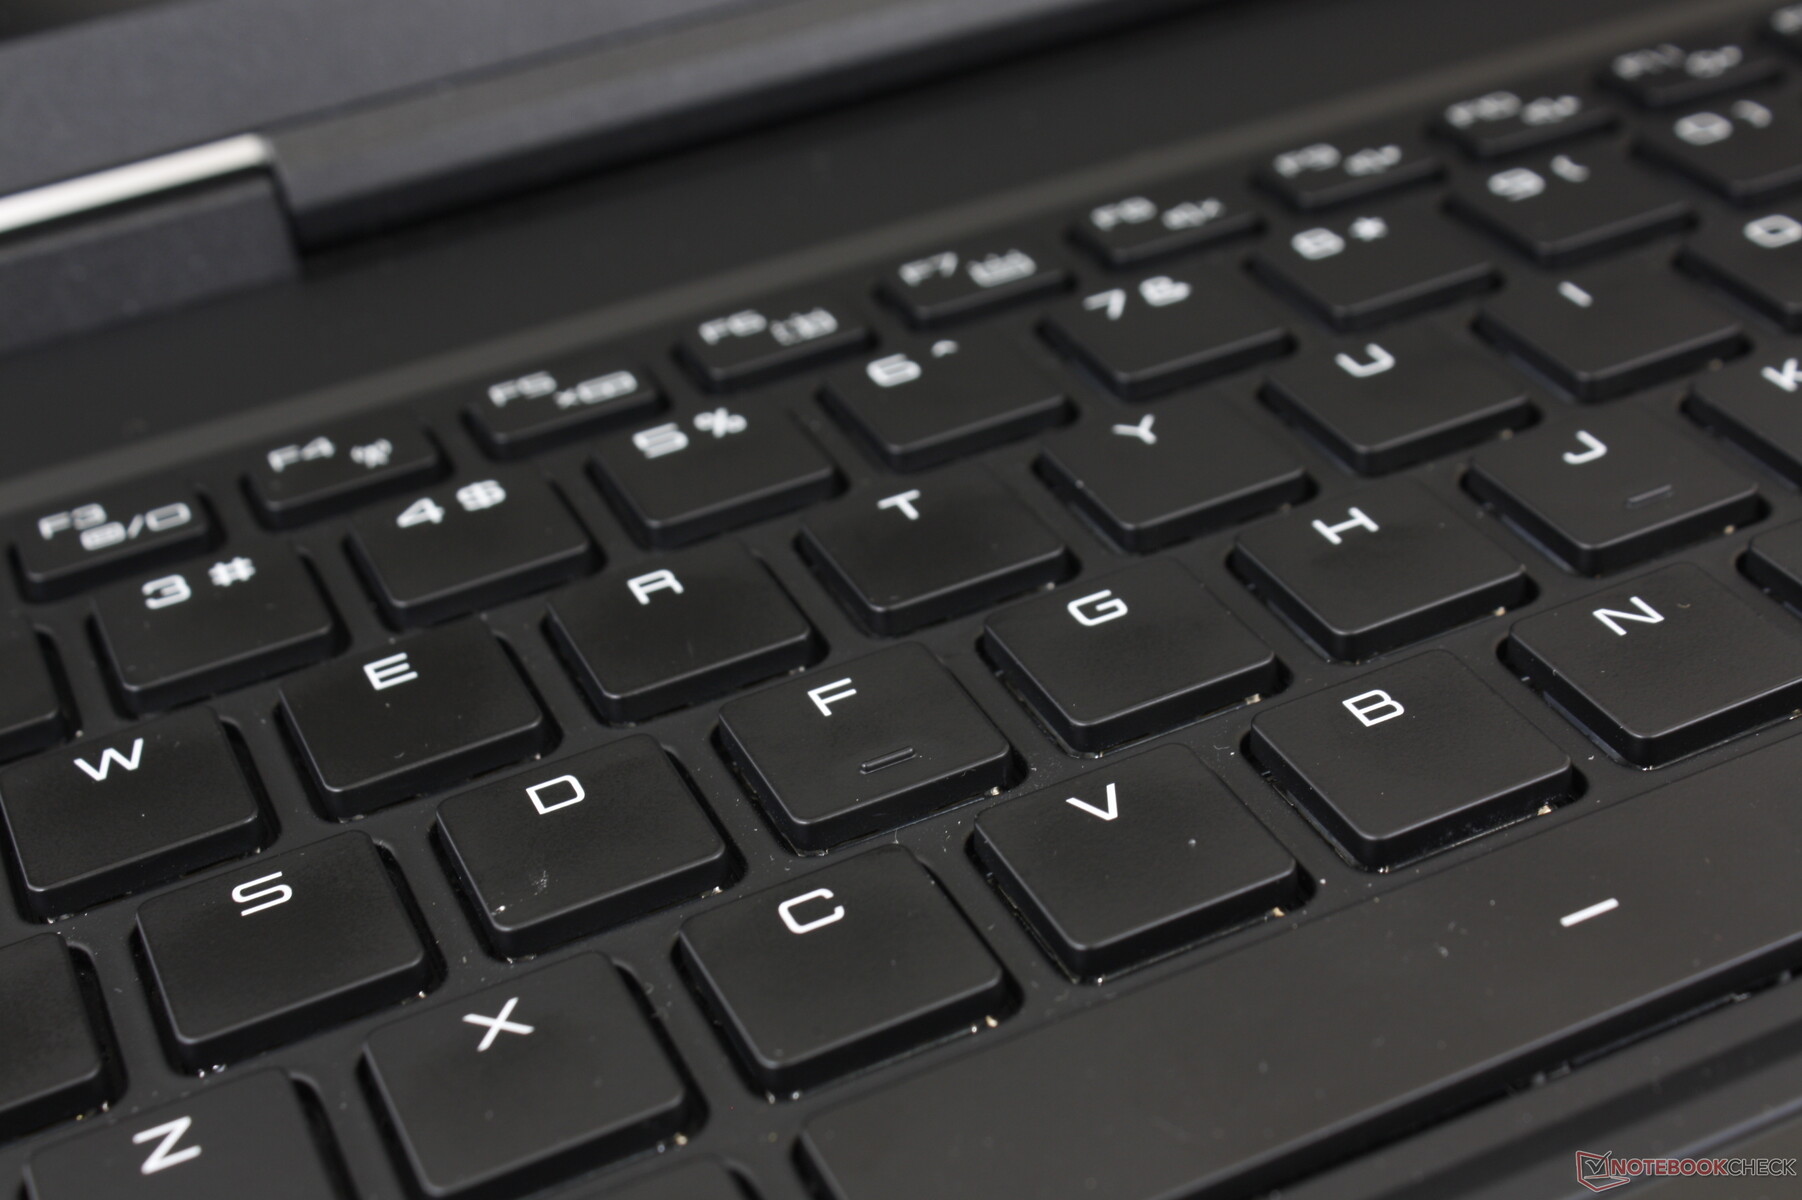
A Uniwell Technology GM7AG8N de 17 polegadas compartilha características similares à GM5AG8W de 15,6 polegadas, já que ambas suportam a mesma caixa de resfriamento de água externa. No entanto, os dois modelos são muito diferentes quando se trata do design do deck do teclado e da placa inferior. Enquanto o GM5AG8W integra um teclado biselado com muitas grelhas de ventilação na parte inferior, o GM7AG8N tem um teclado chiclet com aberturas de ventilação redesenhadas. O estilo LED também é diferente entre eles, pois o GM7AG8N tem uma barra LED ao longo da traseira, enquanto o GM5AG8W tem uma ao longo da frente
A rigidez do chassi é excelente para a base e para a plataforma do teclado. Tentar torcer a base ou aplicar pressão sobre o centro do teclado resultaria em apenas uma mínima flexão e nenhum rangido. As dobradiças e a tampa também são fortes, mas são ligeiramente mais flexíveis do que na série 17 da Razer Blade.
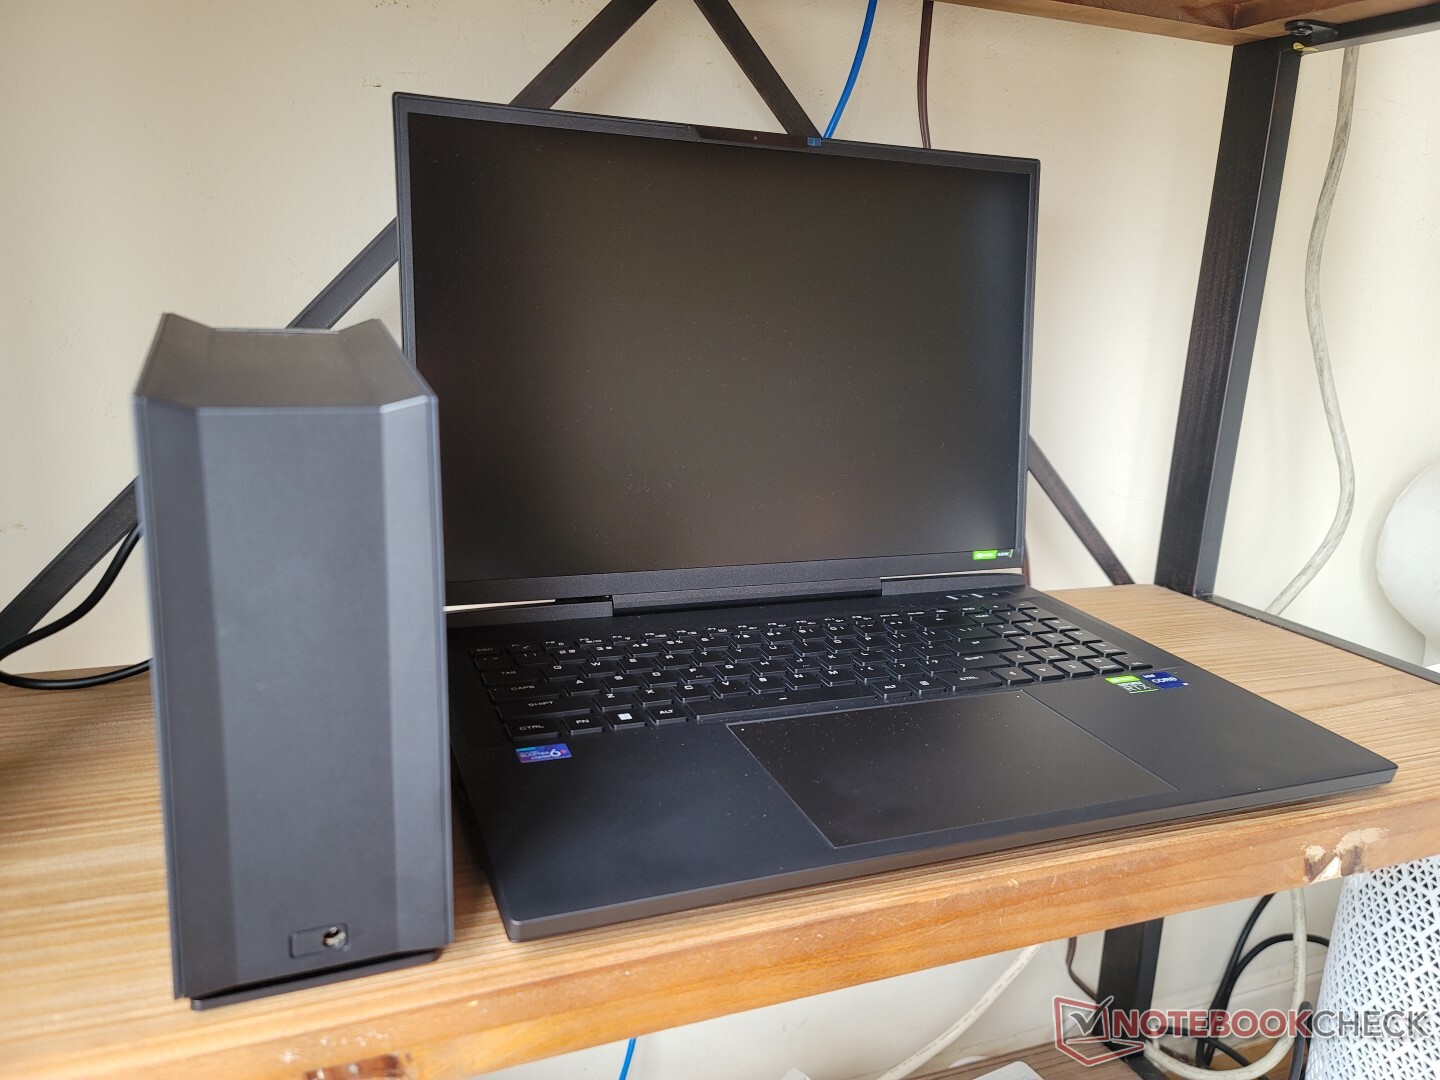
O Uniwell é mais grosso e mais longo que a maioria dos outros laptops de jogo de 17 polegadas e pesa aproximadamente o mesmo. Sua pegada ligeiramente mais quadrada pode ser atribuída a sua relação de aspecto 16:10, o que é incomum para um laptop para jogos deste tamanho de tela. O peso total é felizmente médio para a categoria antes de contabilizar a caixa de resfriamento externa
- Peso do notebook: 2749 g
- Peso do adaptador AC: 1057 g
- Caixa de resfriamento externo com tubos de água (sem água): 1160 g
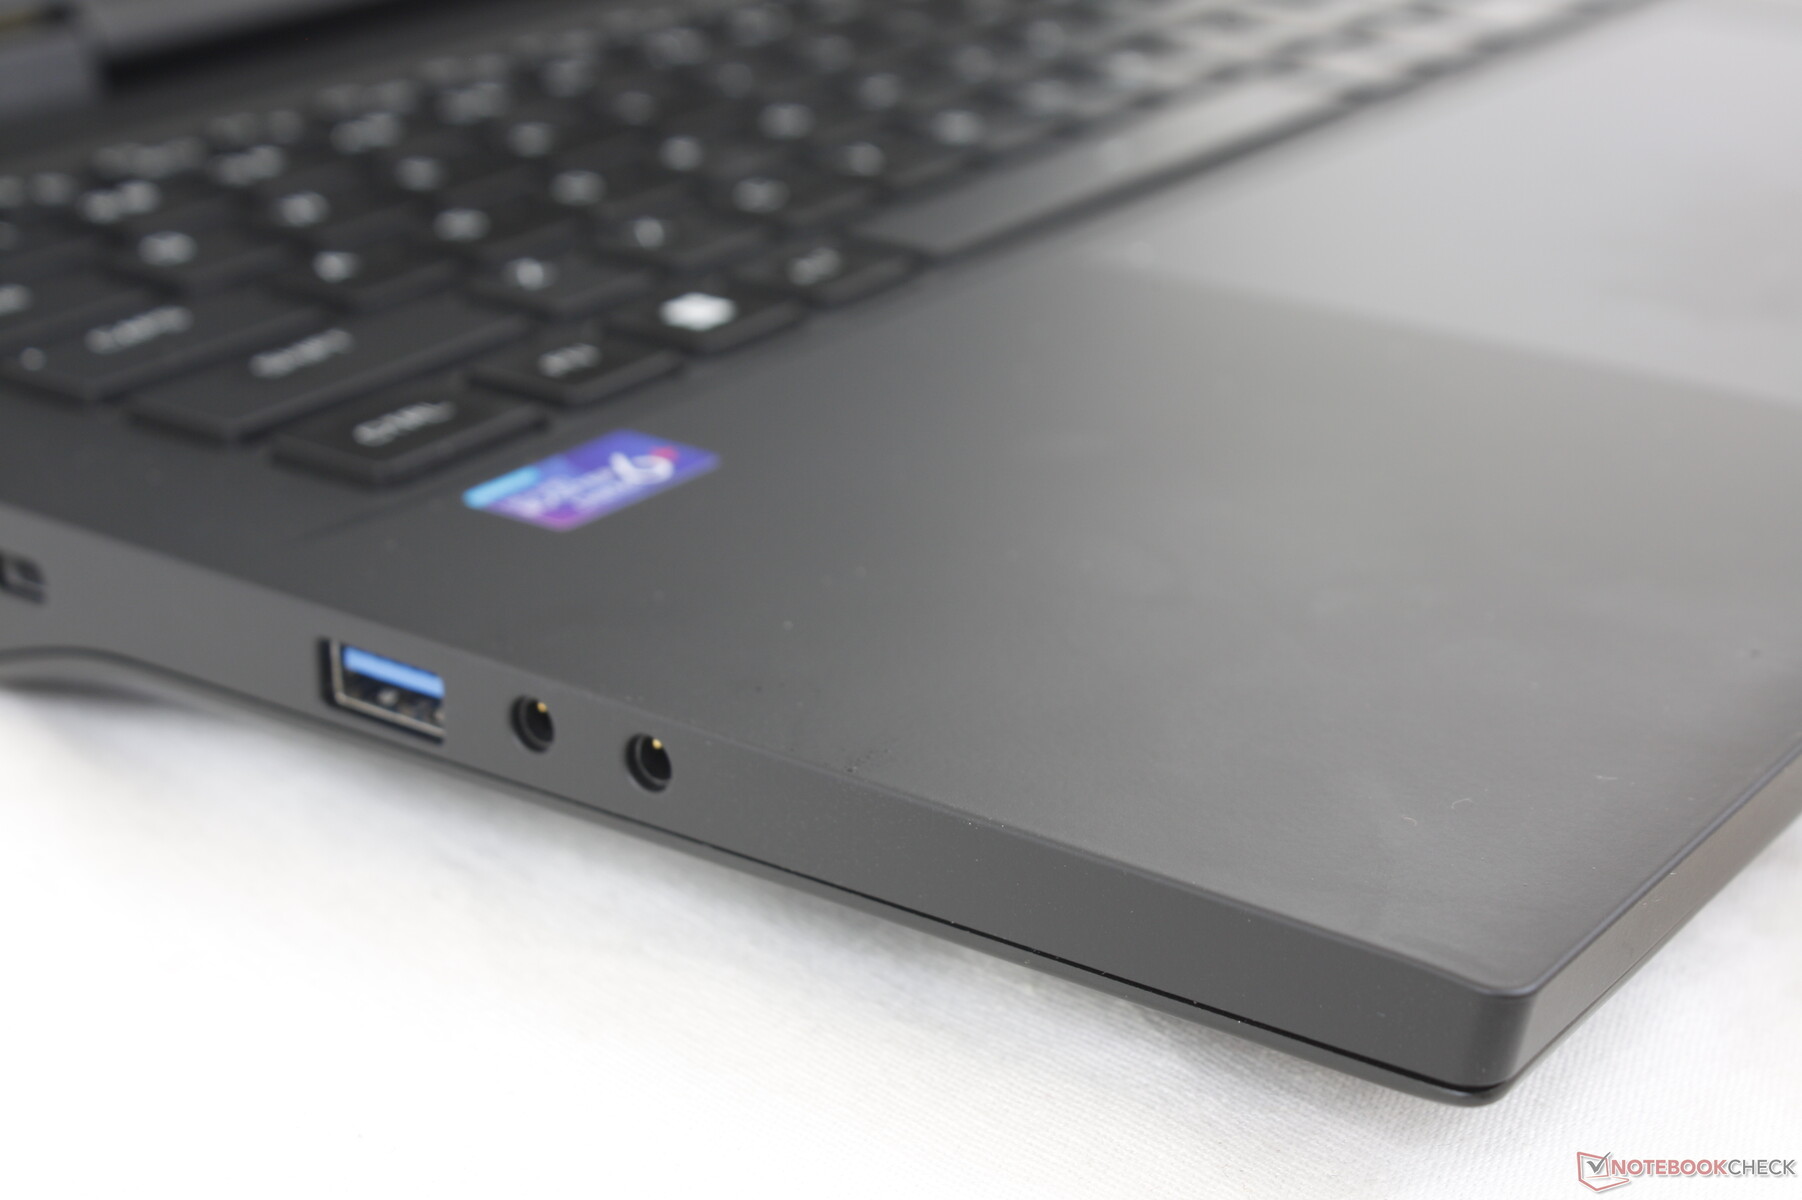
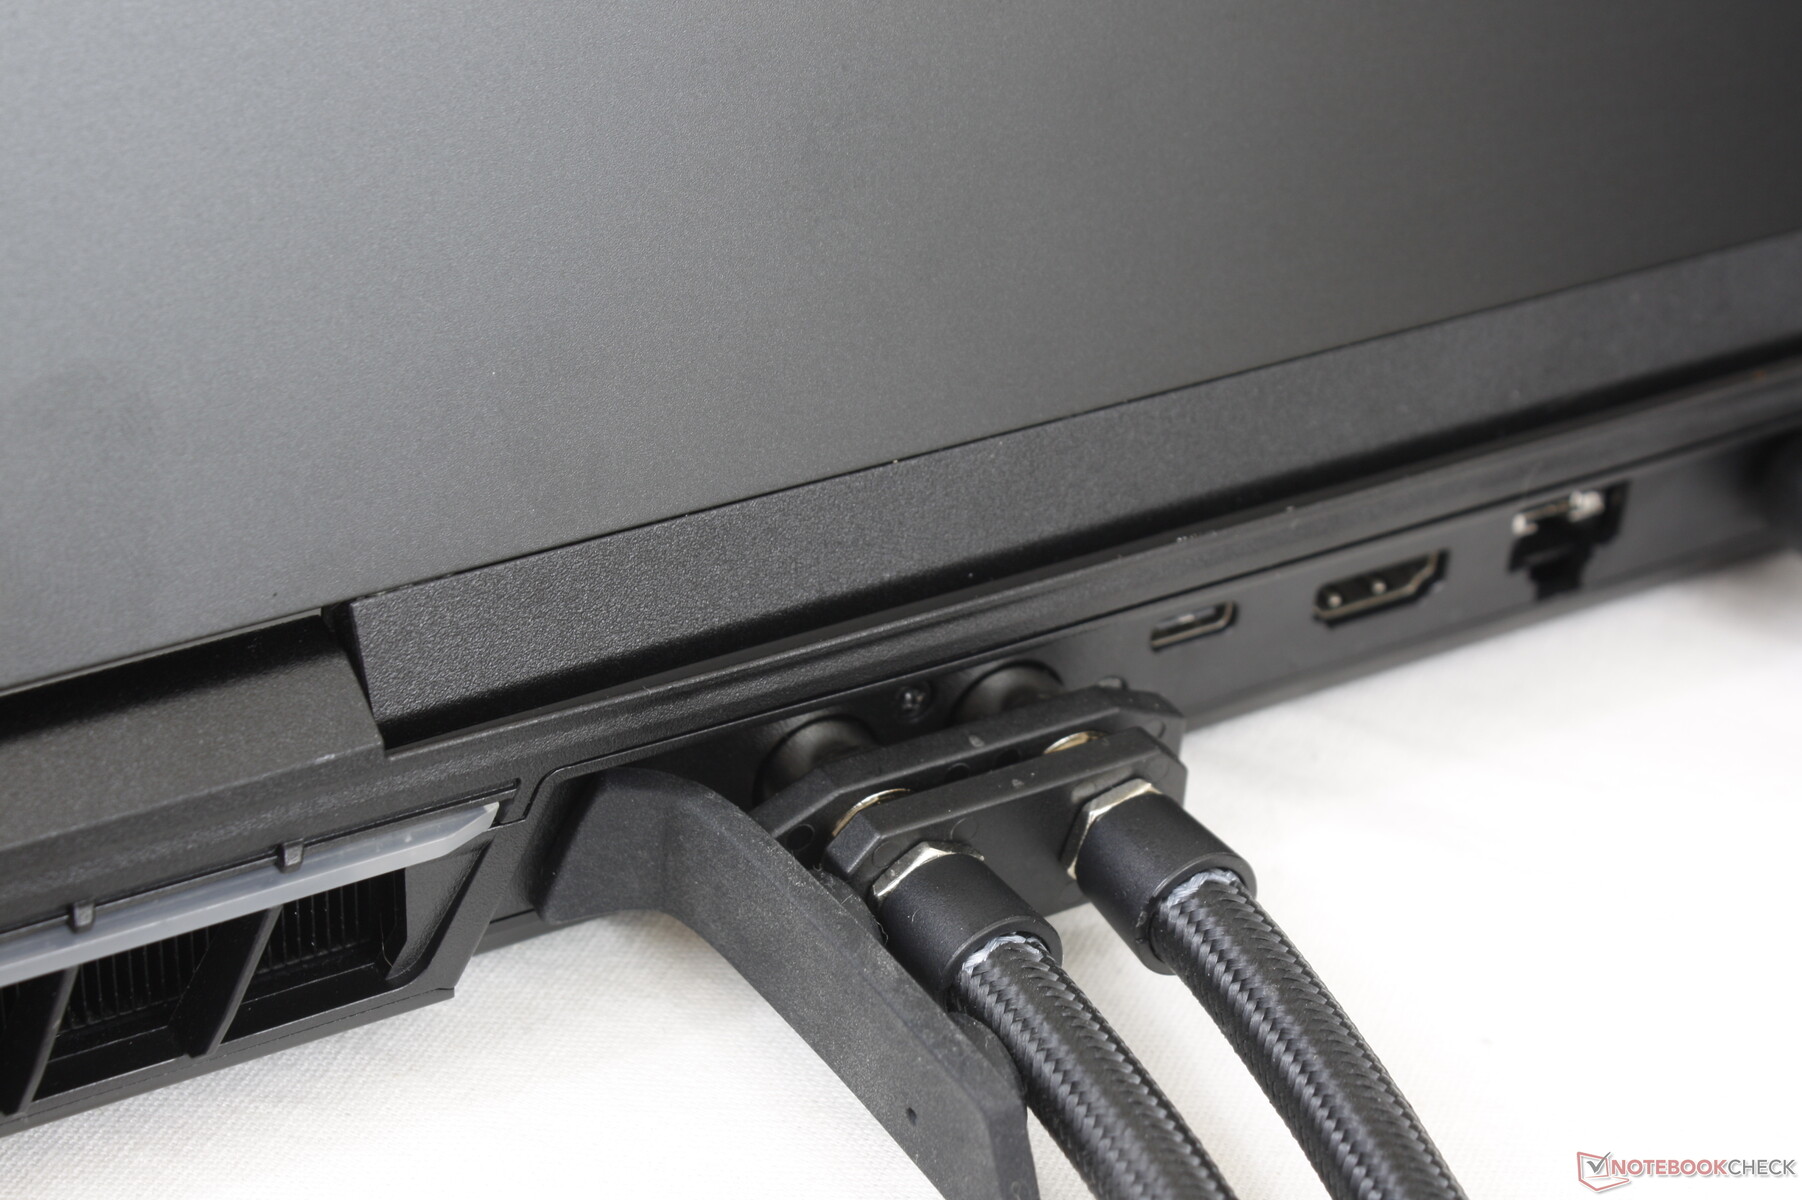
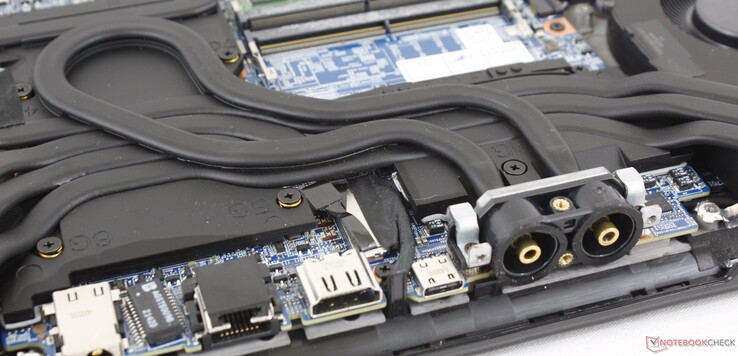
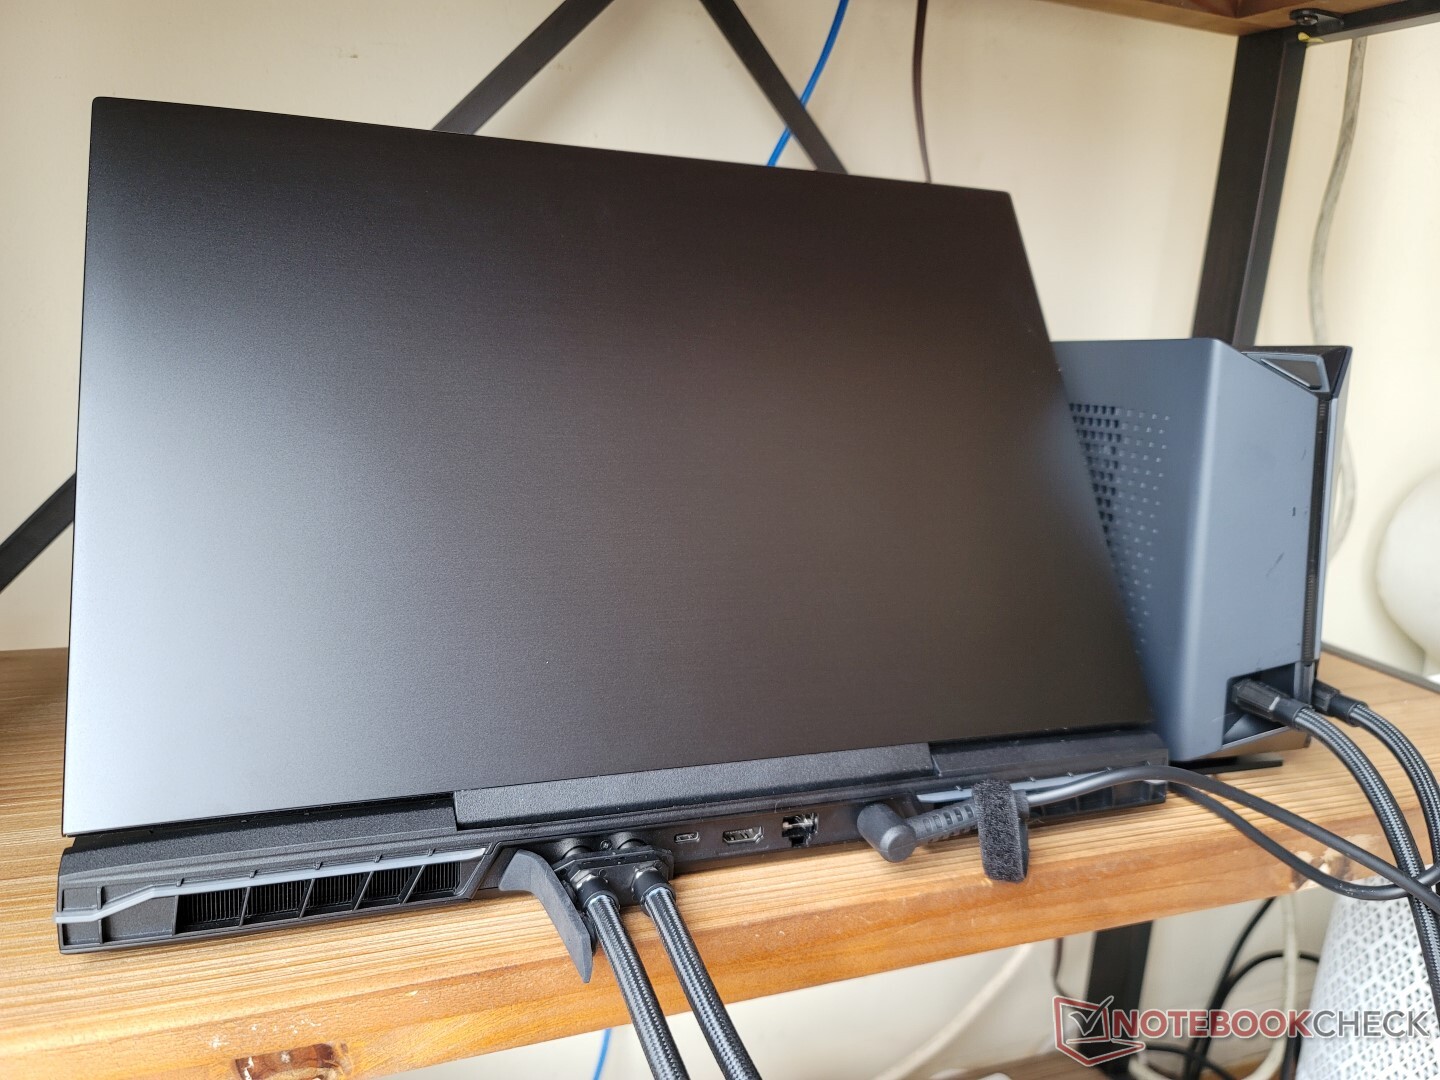
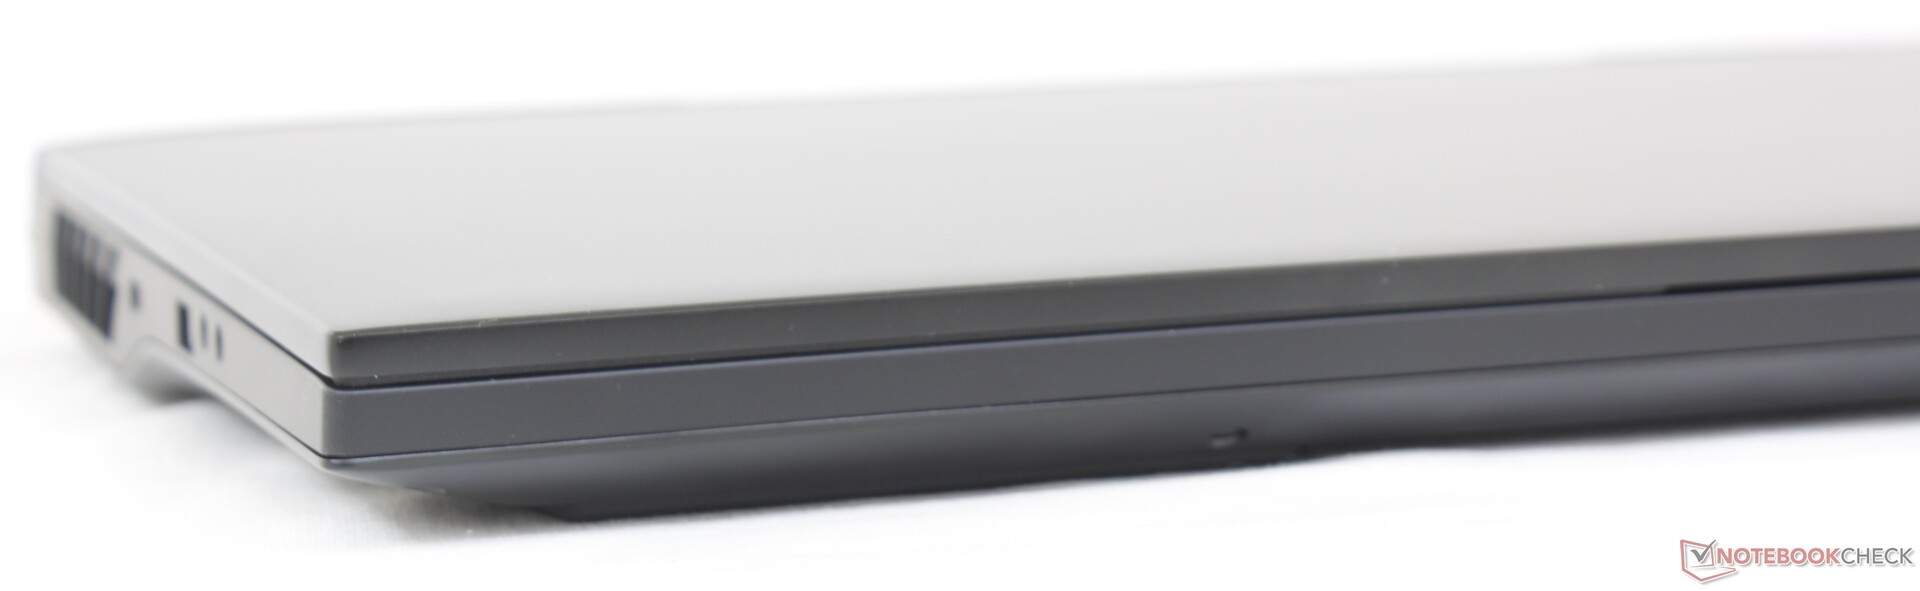
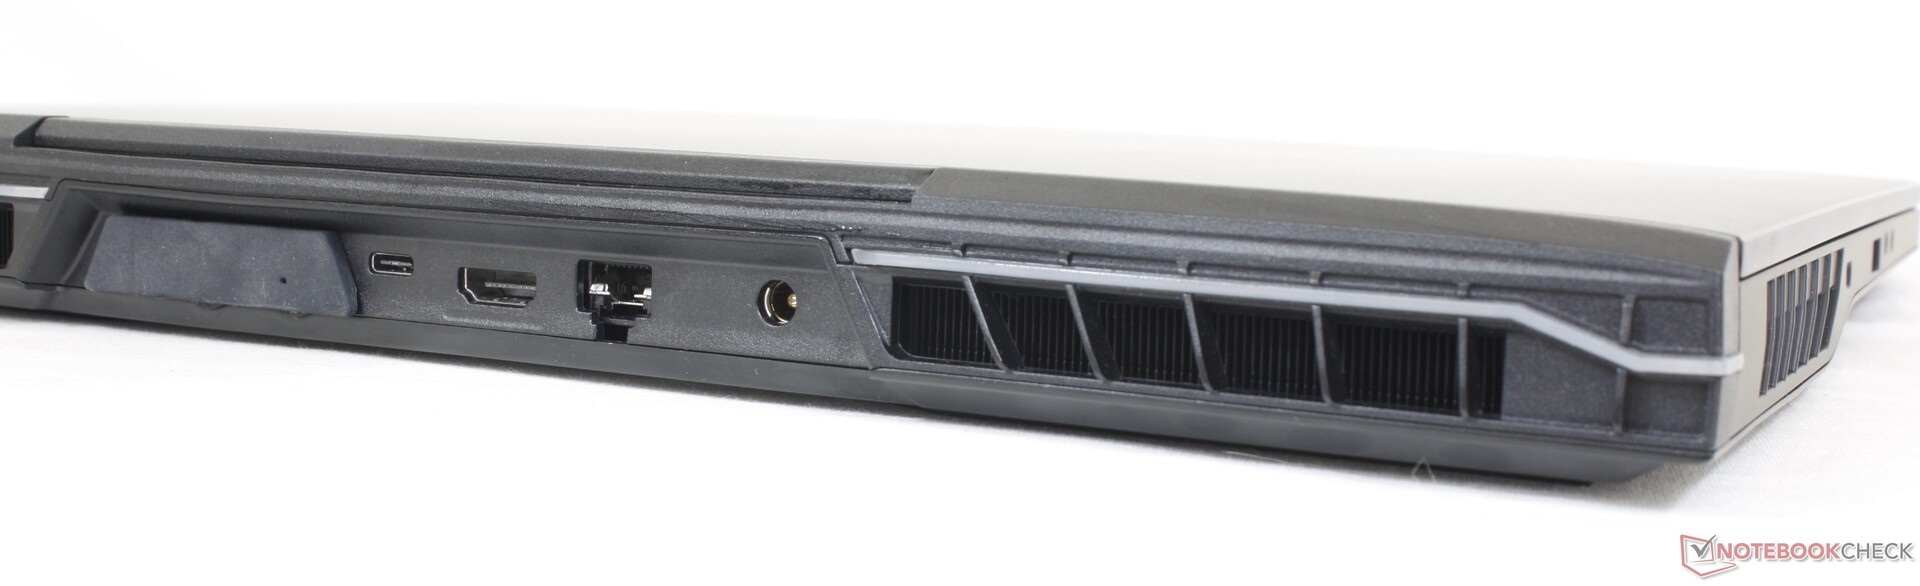
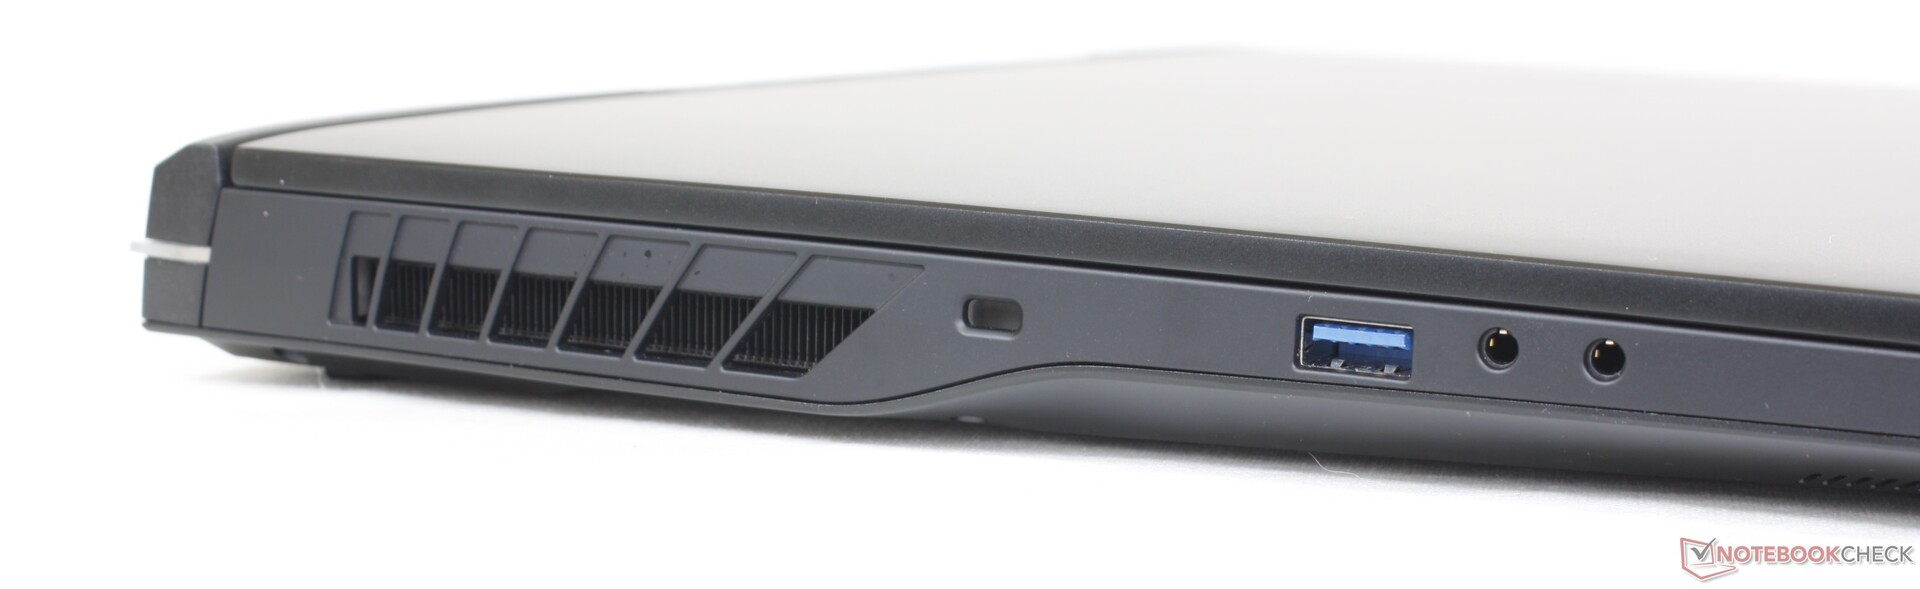
Conectividade - Suporte Thunderbolt 4
As opções de porta e posicionamento são idênticas às do Schenker XMG Neo 15 E22 de 15,6 polegadas, embora nosso Uniwell seja um fator de forma maior de 17 polegadas. Gostaríamos de ver portas USB-C adicionais no futuro, pois a porta única parece limitar.
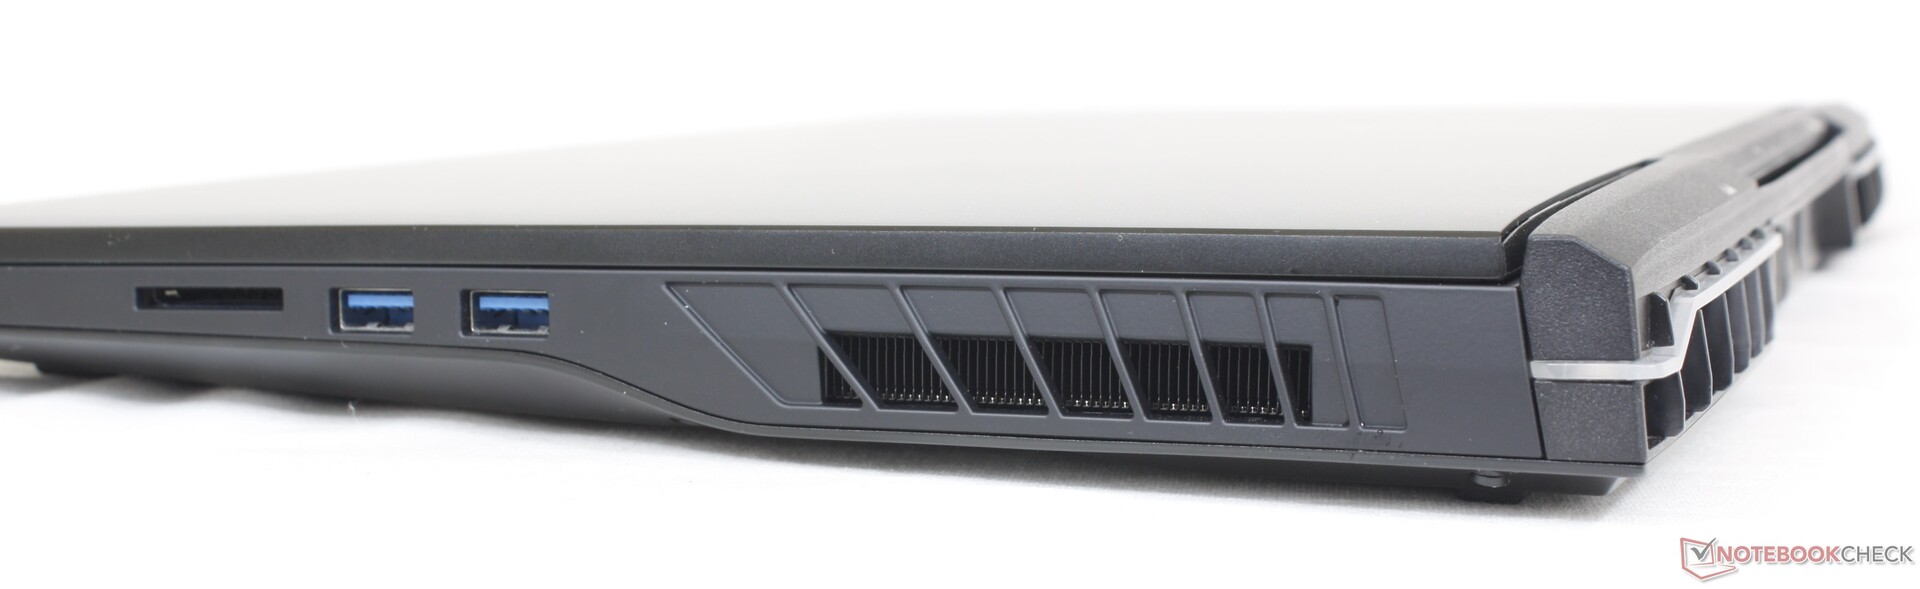
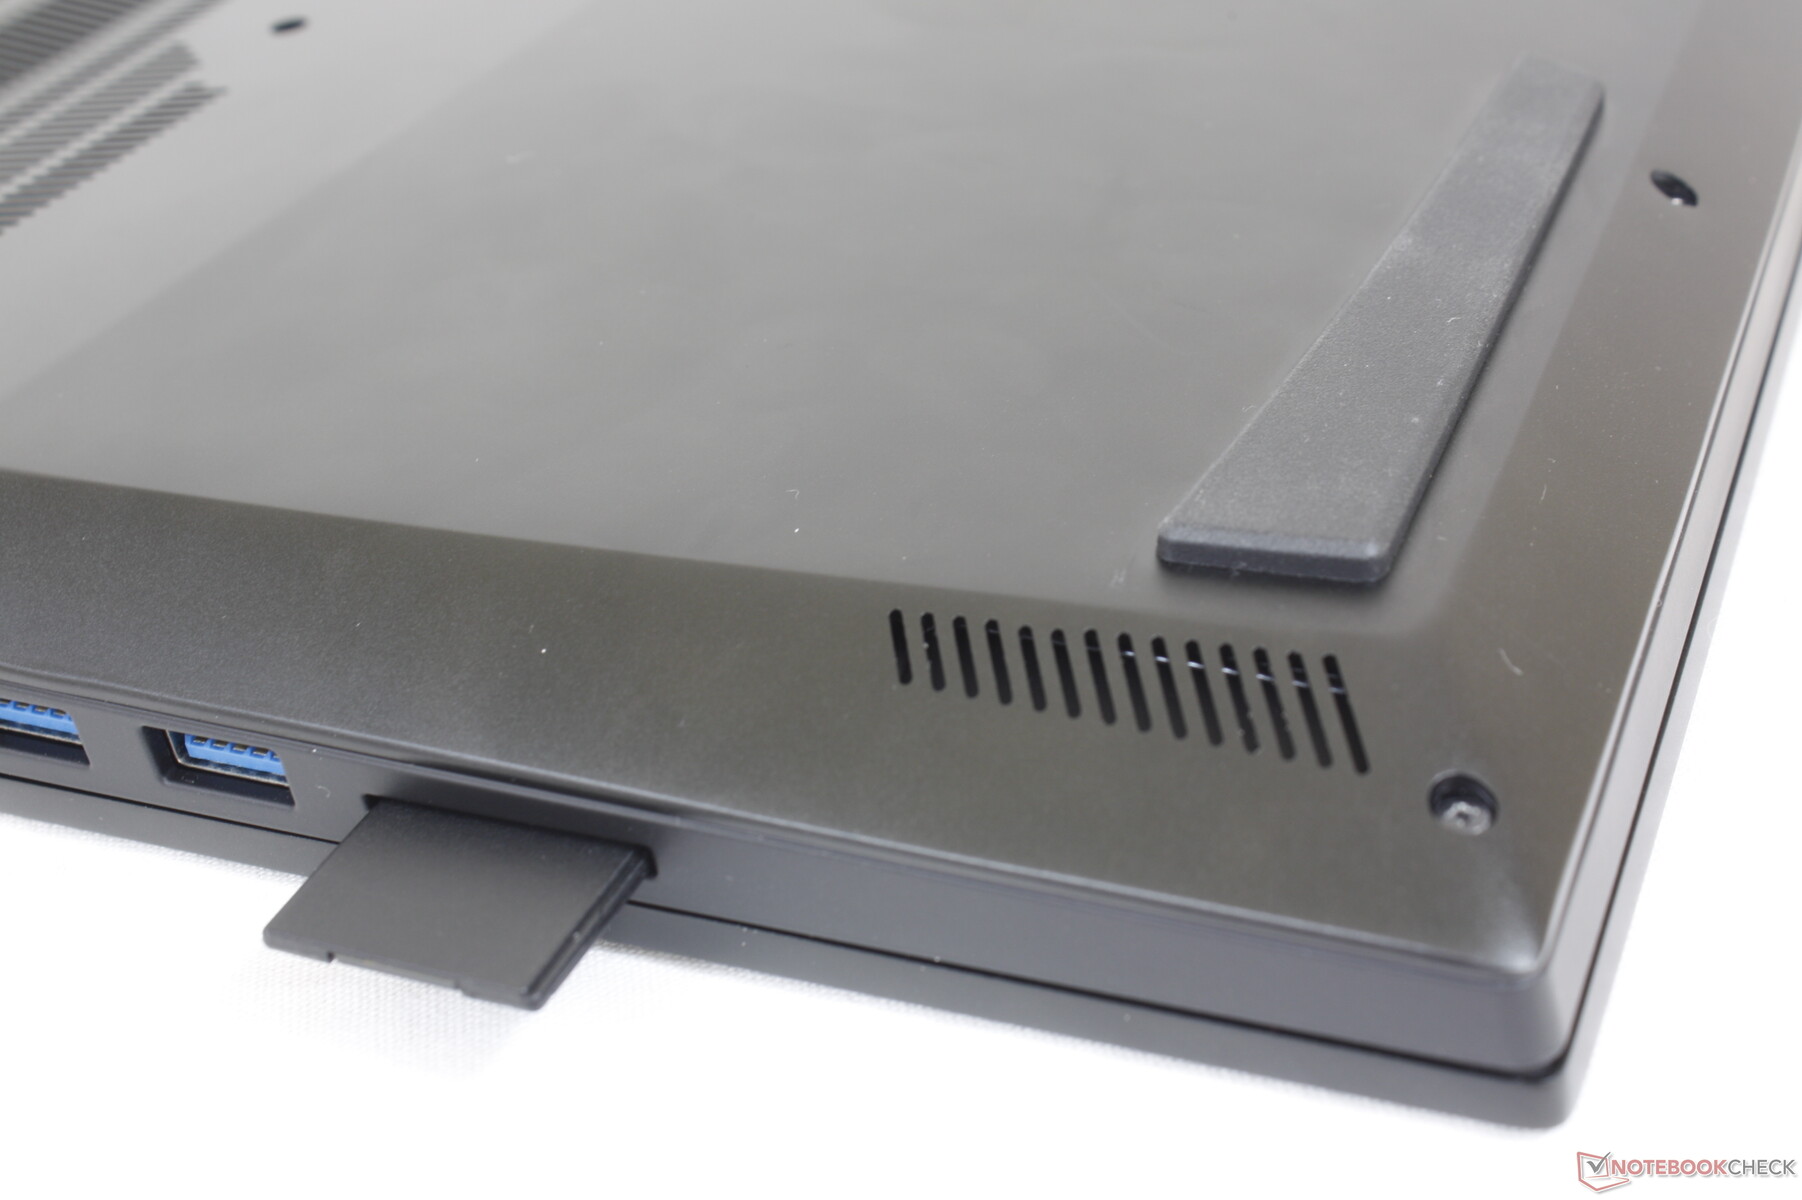
Leitor de cartões SD
As taxas de transferência com o leitor de cartões integrado é apenas a metade do Asus Zephyrus S17 ou Razer Blade 17. Isto não deve ser um problema para a maioria dos usuários além daqueles que dependem fortemente da transferência de arquivos grandes através de cartões SD.
| SD Card Reader | |
| average JPG Copy Test (av. of 3 runs) | |
| Asus ROG Zephyrus S17 GX703HSD | |
| Razer Blade 17 Early 2022 (AV PRO microSD 128 GB V60) | |
| Uniwell Technology GM7AG8N Liquid Cooling Box (AV PRO microSD 128 GB V60) | |
| MSI Stealth GS77 12UHS-083US (AV Pro V60) | |
| MSI Titan GT77 12UHS (AV PRO microSD 128 GB V60) | |
| maximum AS SSD Seq Read Test (1GB) | |
| Asus ROG Zephyrus S17 GX703HSD | |
| Uniwell Technology GM7AG8N Liquid Cooling Box (AV PRO microSD 128 GB V60) | |
| MSI Titan GT77 12UHS (AV PRO microSD 128 GB V60) | |
| MSI Stealth GS77 12UHS-083US (AV Pro V60) | |
Comunicação
É um pouco decepcionante não ver o Wi-Fi 6E incluído, considerando o alto preço do laptop. No entanto, o Wi-Fi 6E ainda é mais do que suficiente para a maioria dos usuários, já que o Wi-Fi 6E raramente é melhor na maioria dos cenários do mundo real.
| Networking | |
| iperf3 transmit AX12 | |
| MSI Stealth GS77 12UHS-083US | |
| Asus ROG Zephyrus S17 GX703HSD | |
| iperf3 receive AX12 | |
| MSI Stealth GS77 12UHS-083US | |
| Asus ROG Zephyrus S17 GX703HSD | |
| iperf3 receive AXE11000 6GHz | |
| Aorus 17X XES | |
| MSI Titan GT77 12UHS | |
| iperf3 receive AXE11000 | |
| MSI Titan GT77 12UHS | |
| Razer Blade 17 Early 2022 | |
| Uniwell Technology GM7AG8N Liquid Cooling Box | |
| iperf3 transmit AXE11000 6GHz | |
| Aorus 17X XES | |
| MSI Titan GT77 12UHS | |
| iperf3 transmit AXE11000 | |
| MSI Titan GT77 12UHS | |
| Uniwell Technology GM7AG8N Liquid Cooling Box | |
Webcam
A câmera de 2 MP tem cores pobres mesmo pelos padrões já baixos da webcam. IR é suportada, mas não há obturador de privacidade.


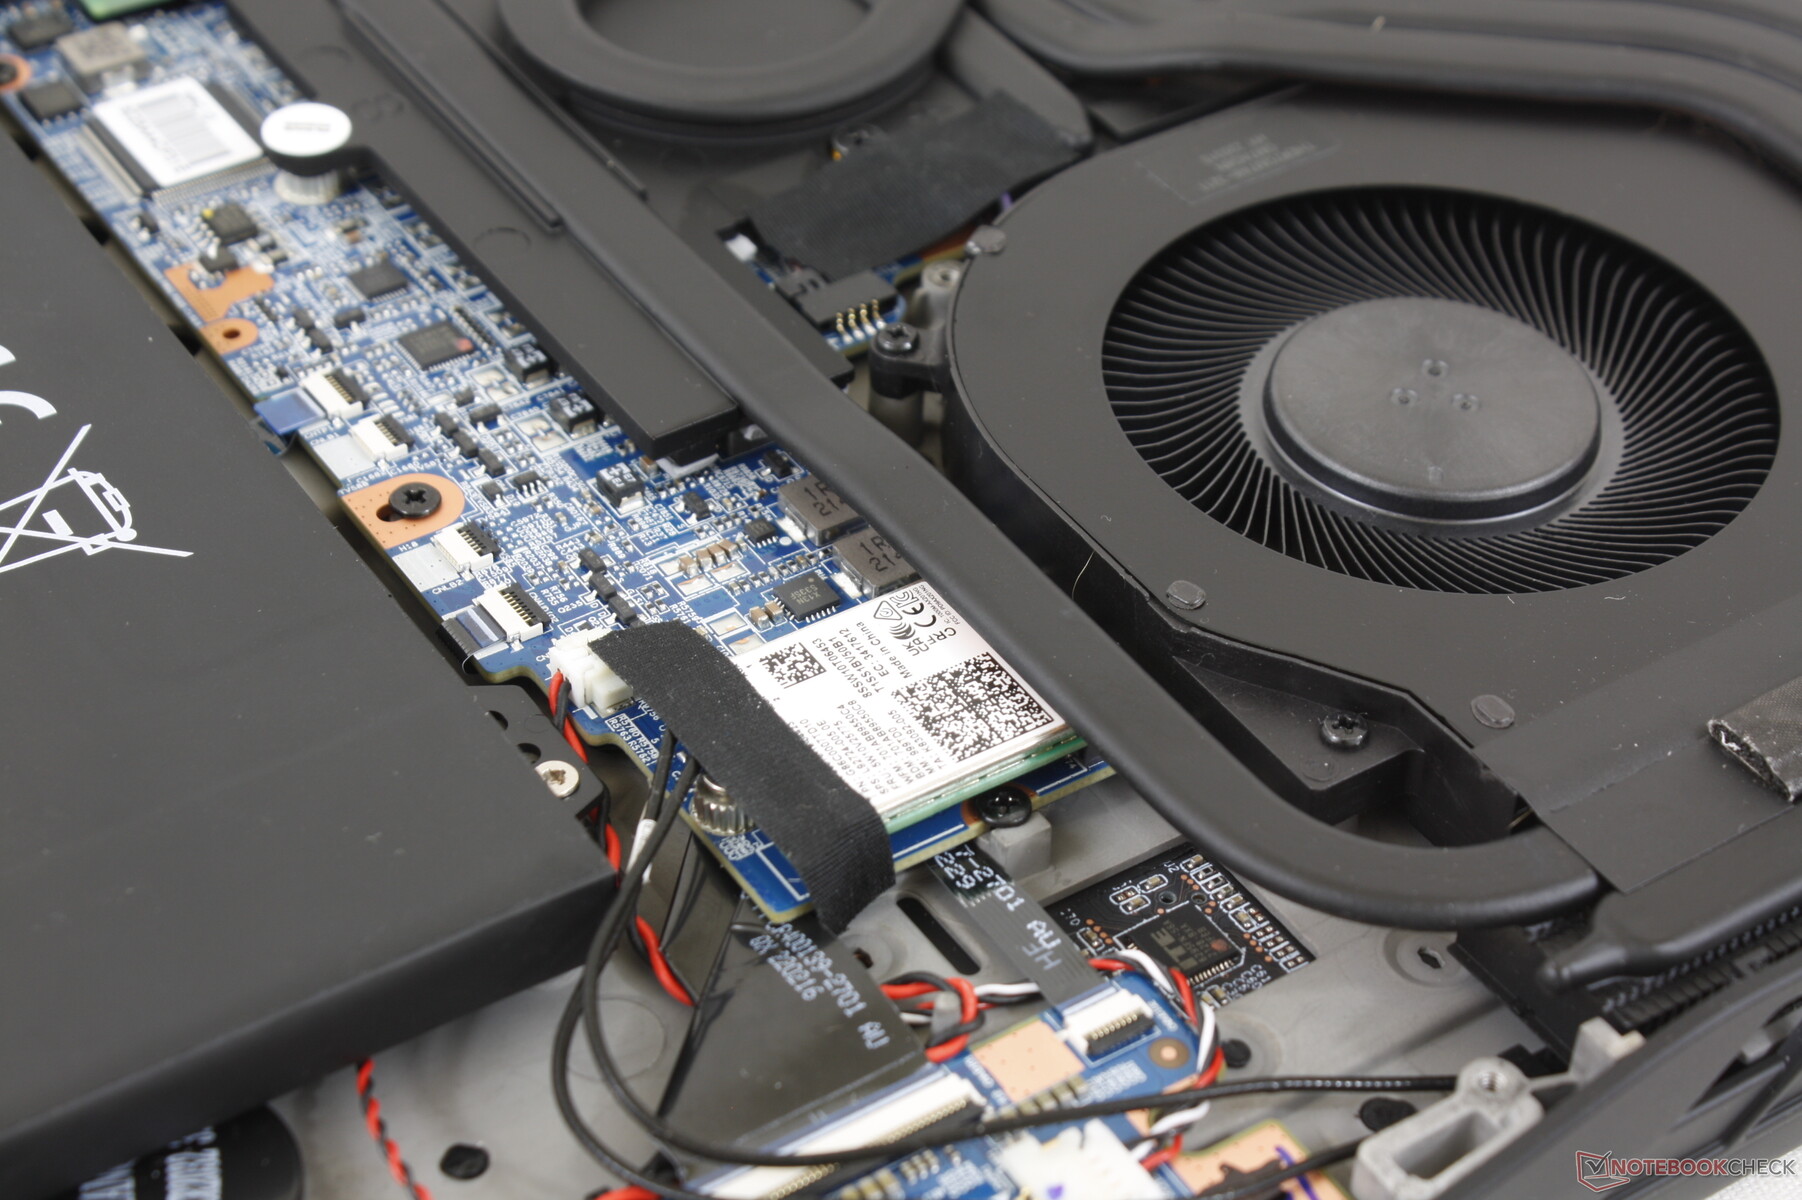
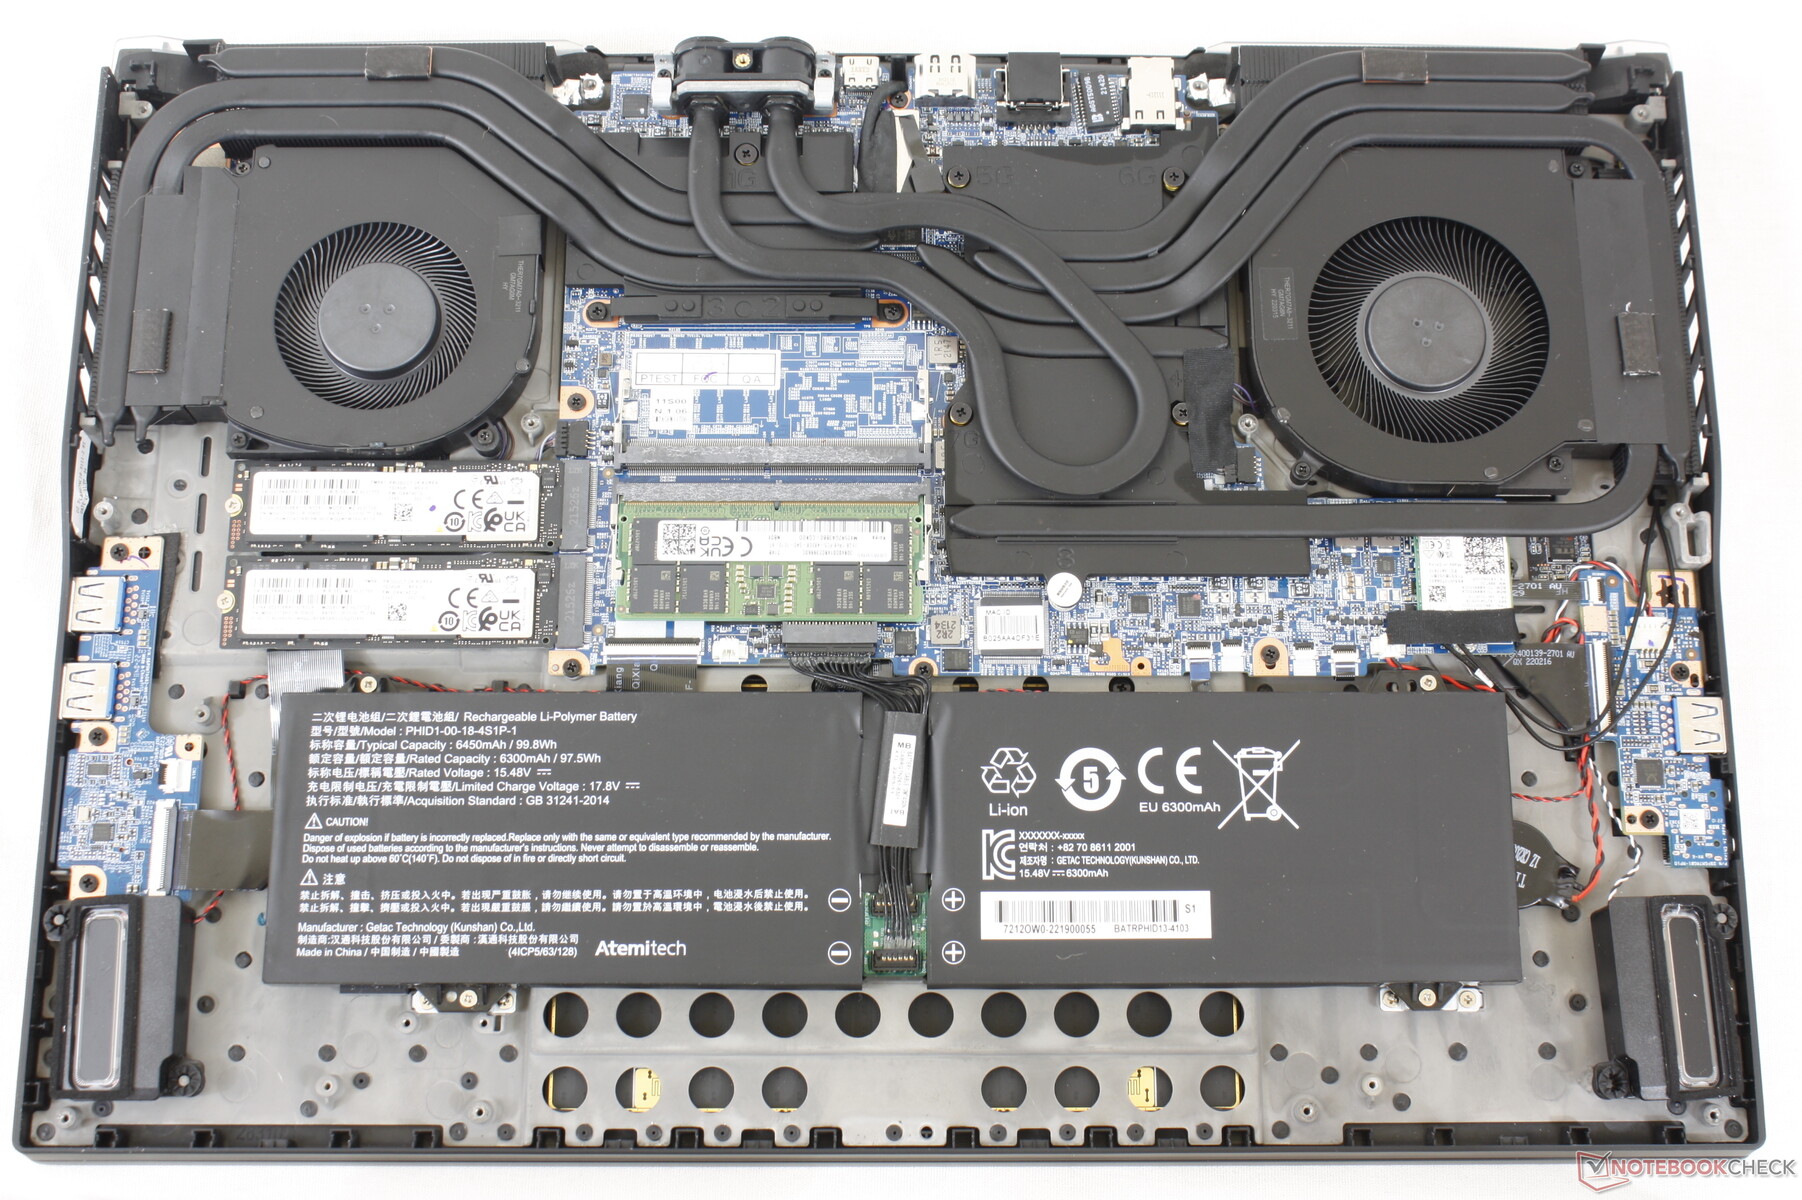
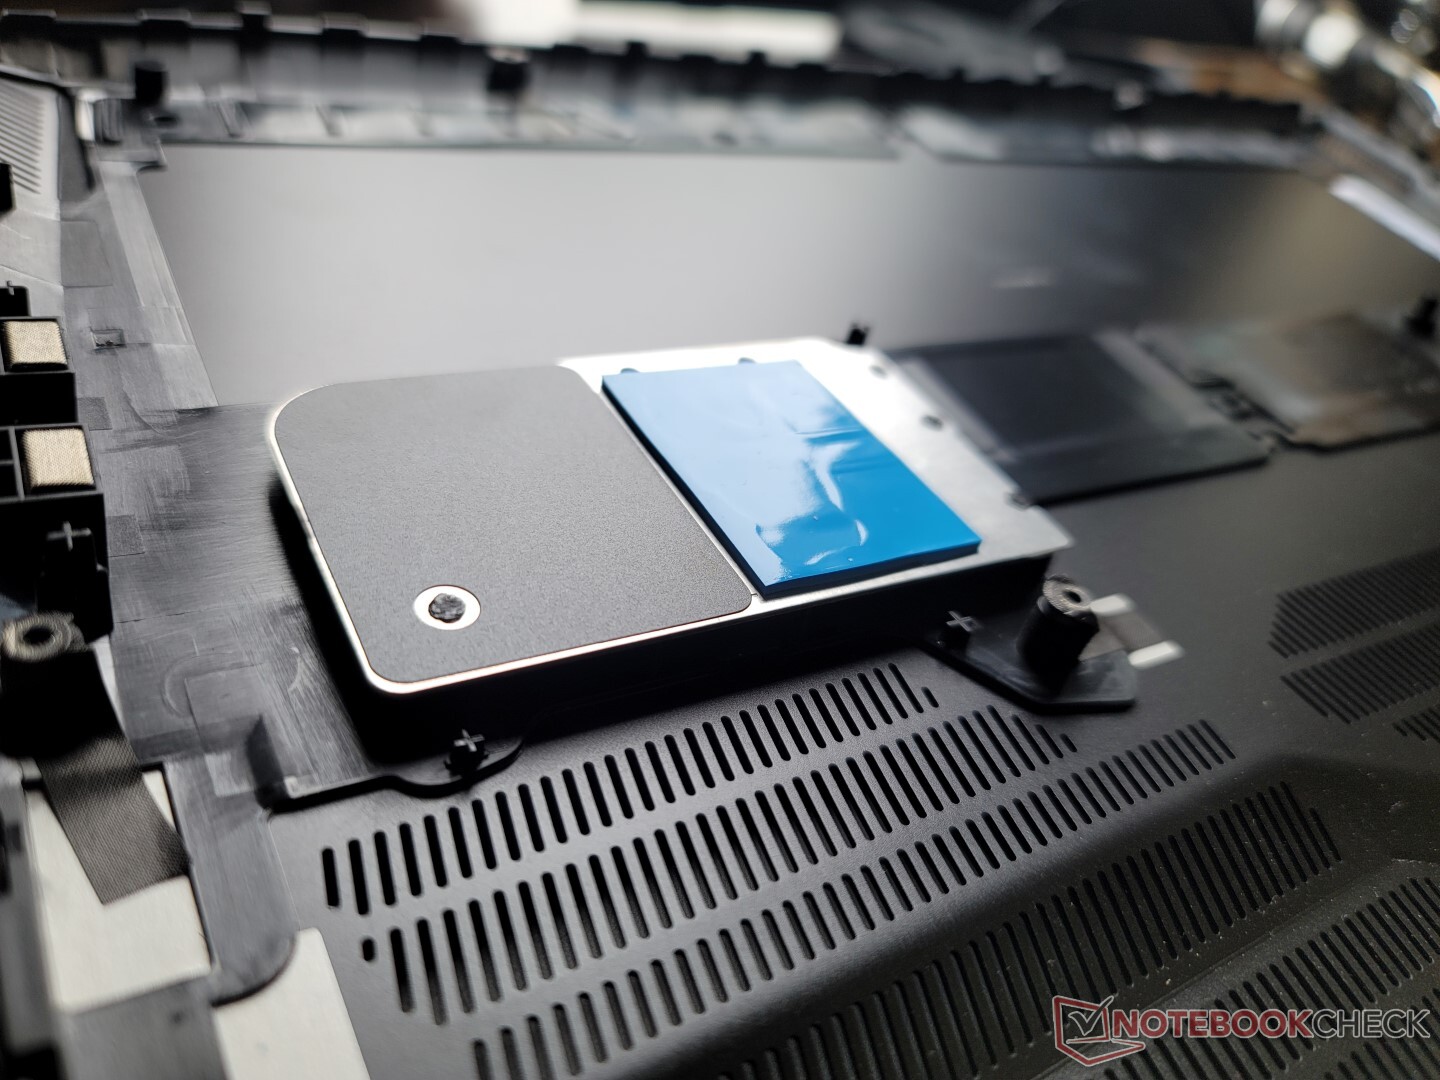
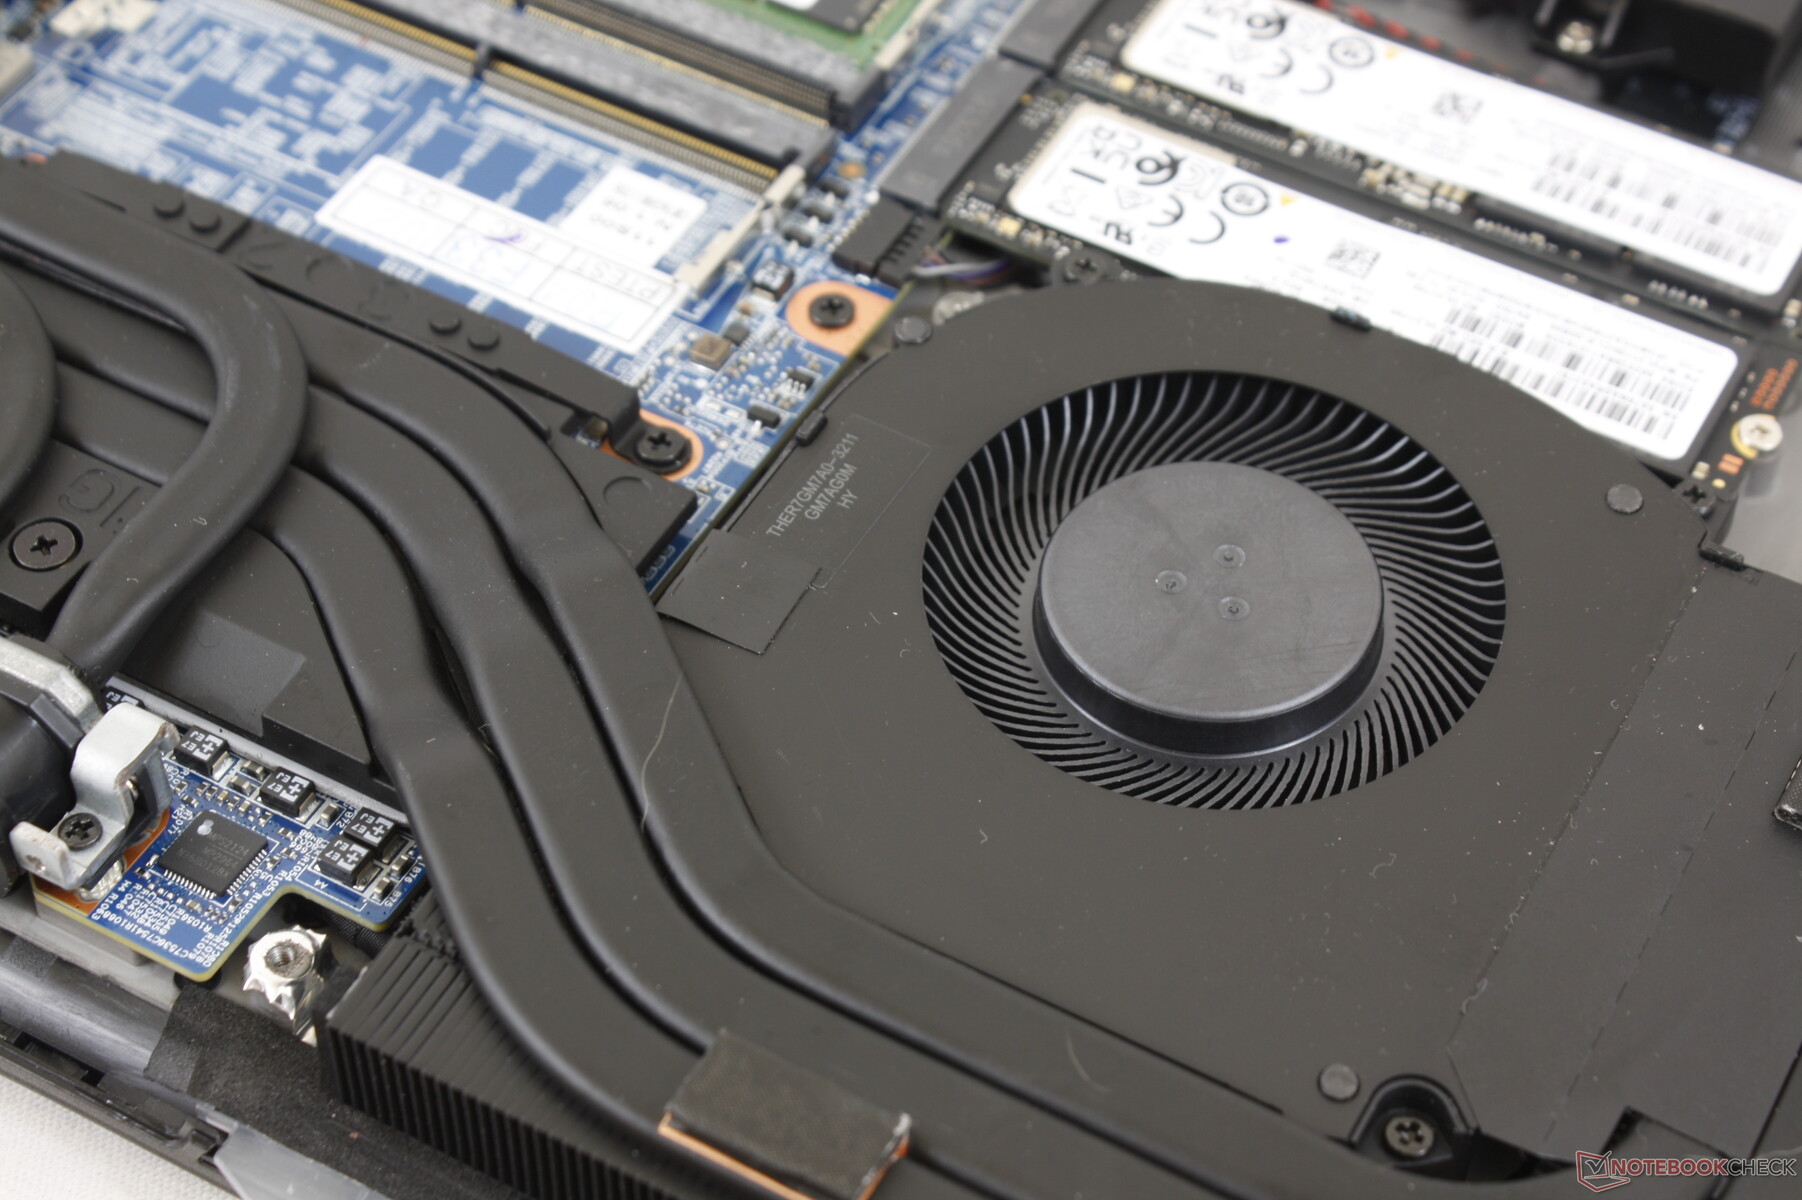
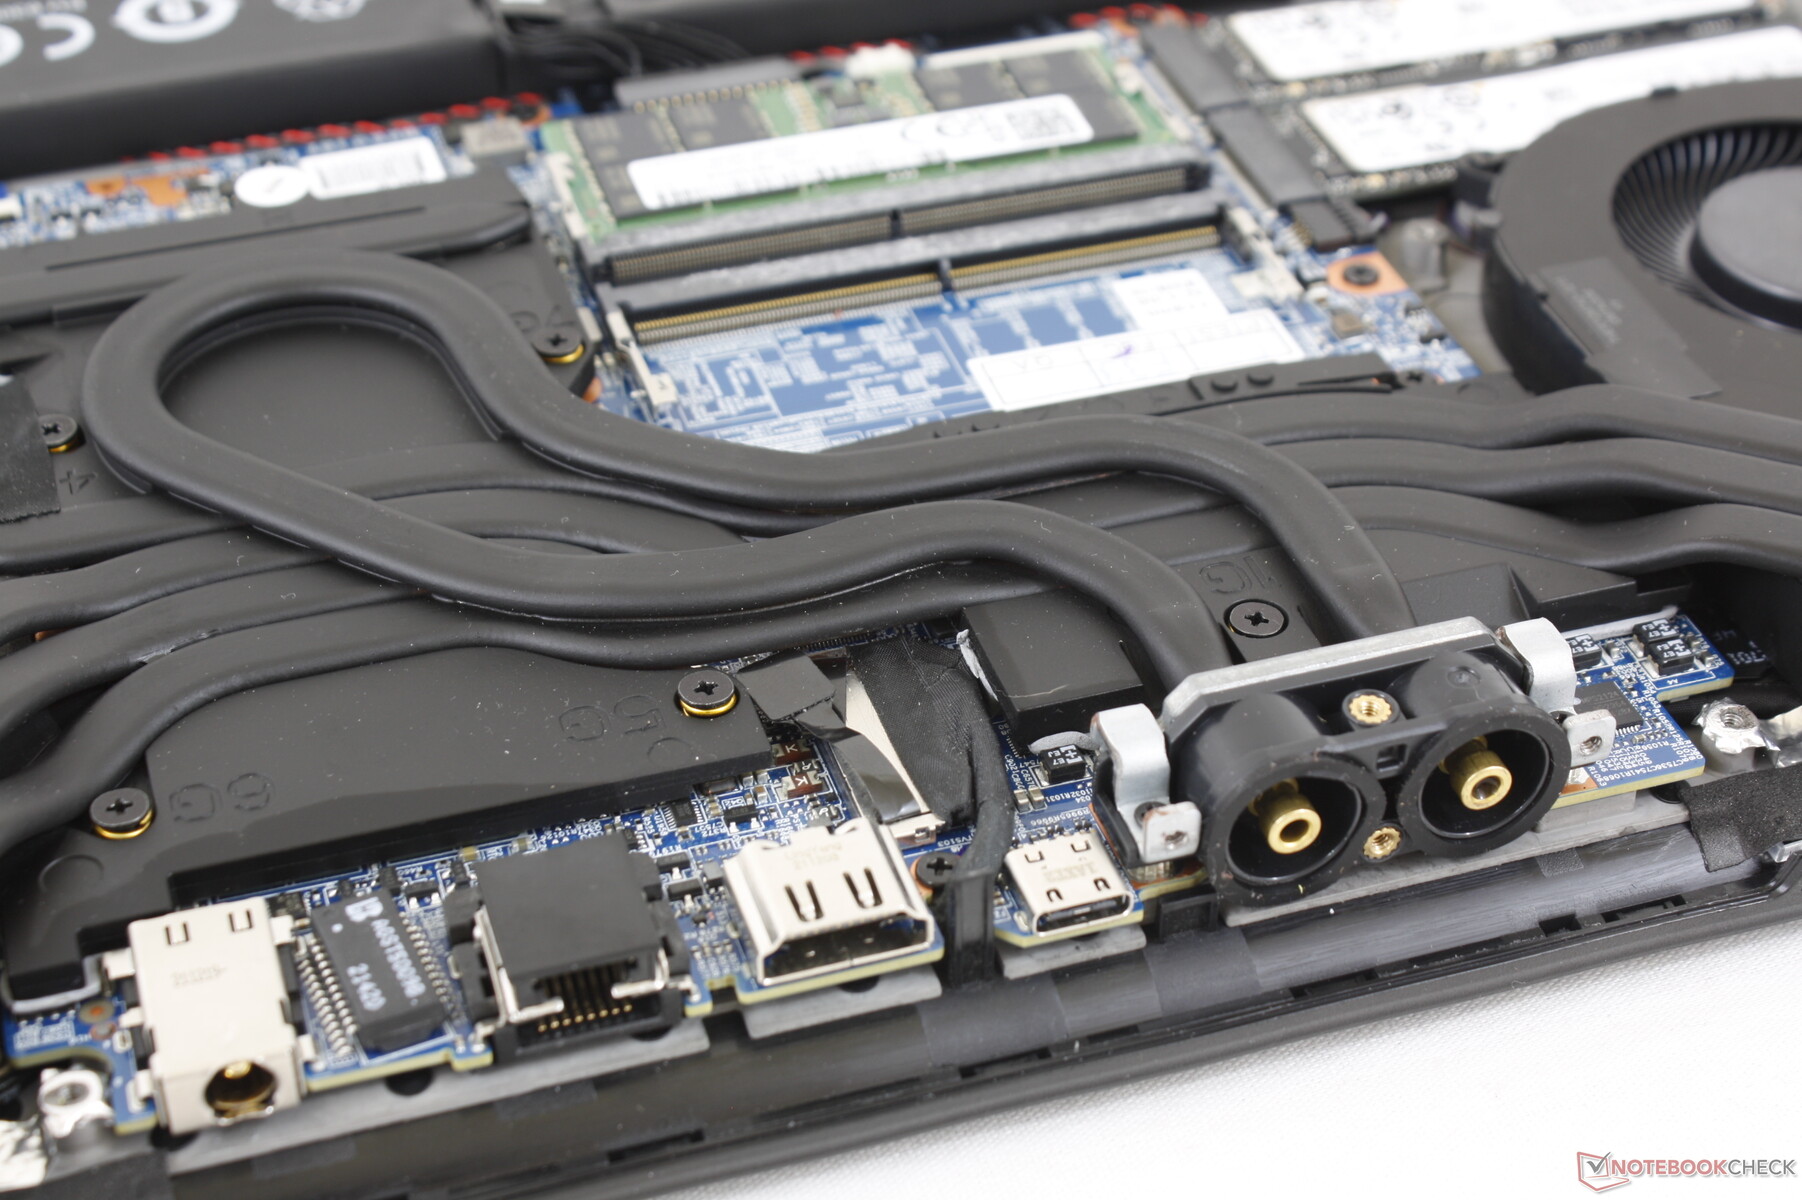
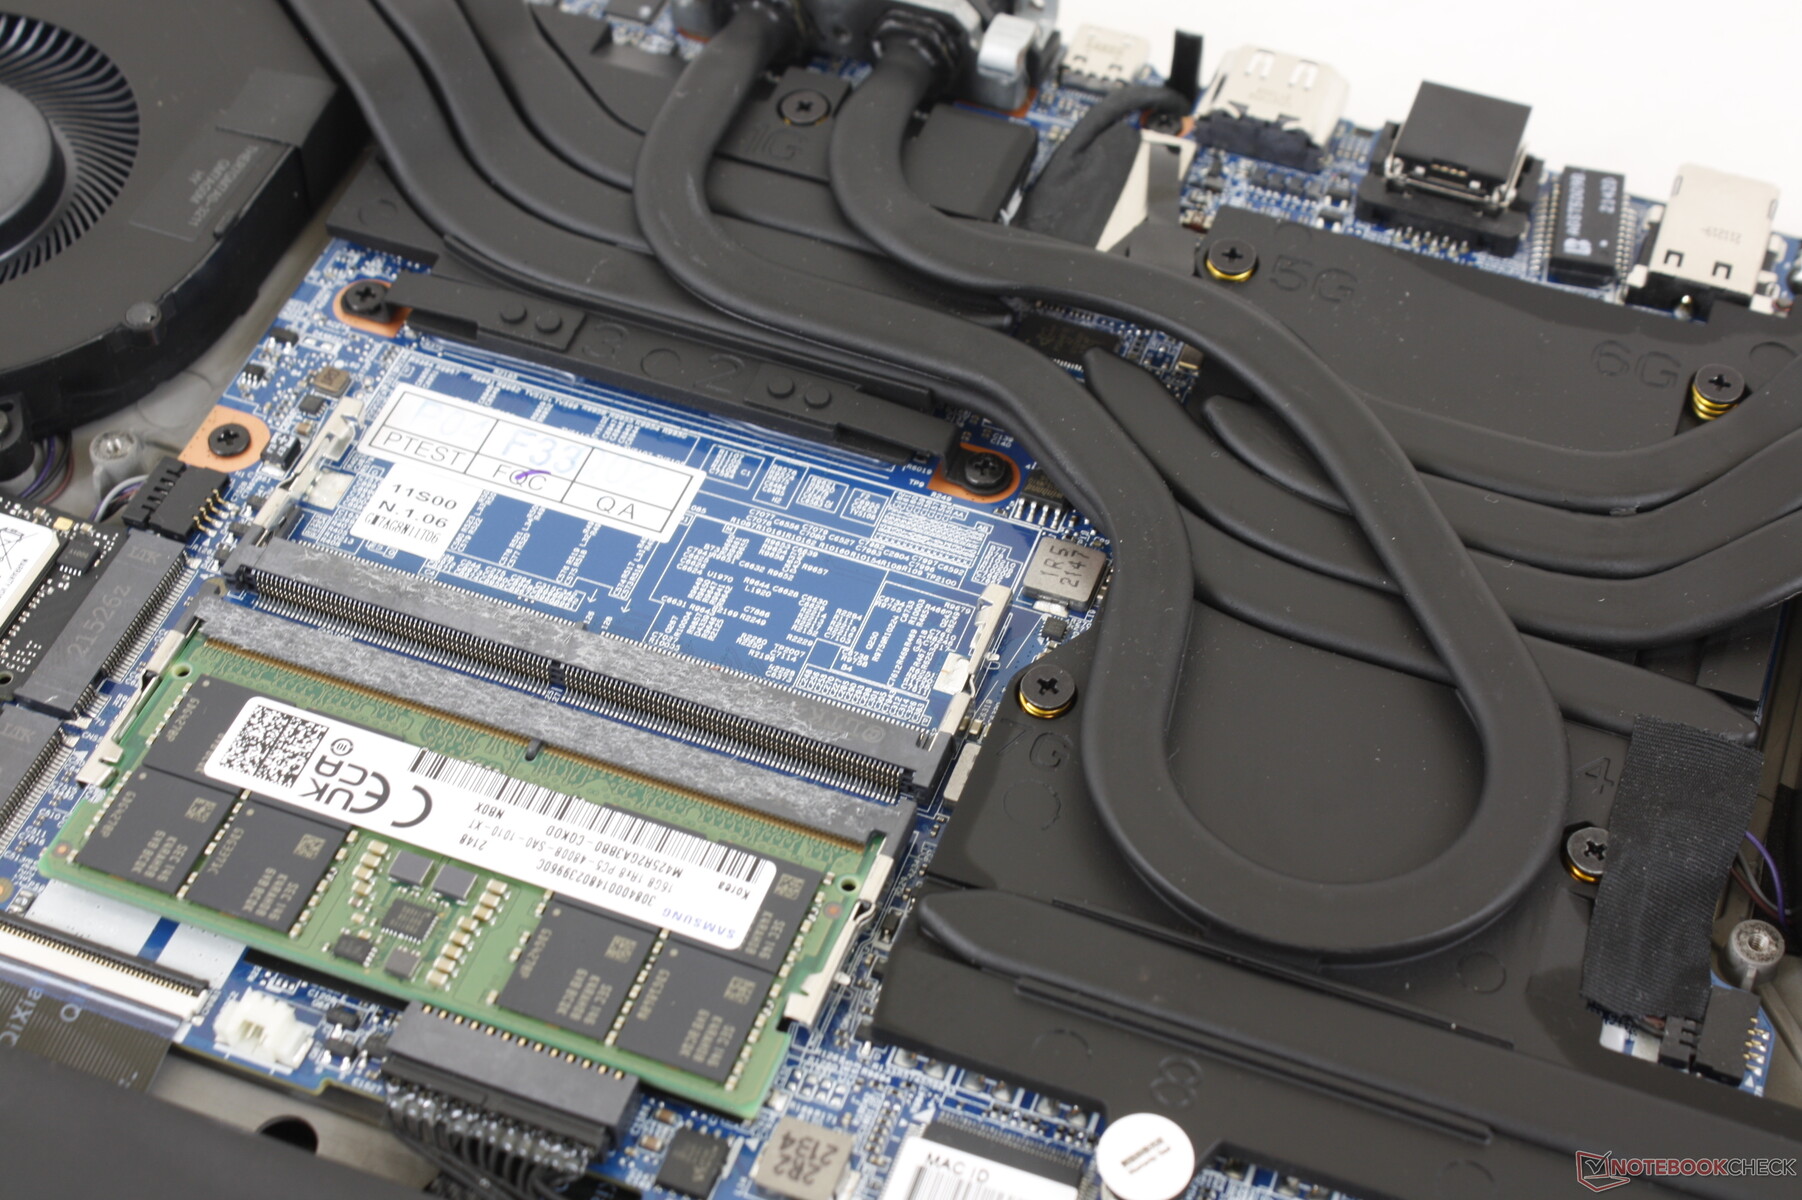
Manutenção
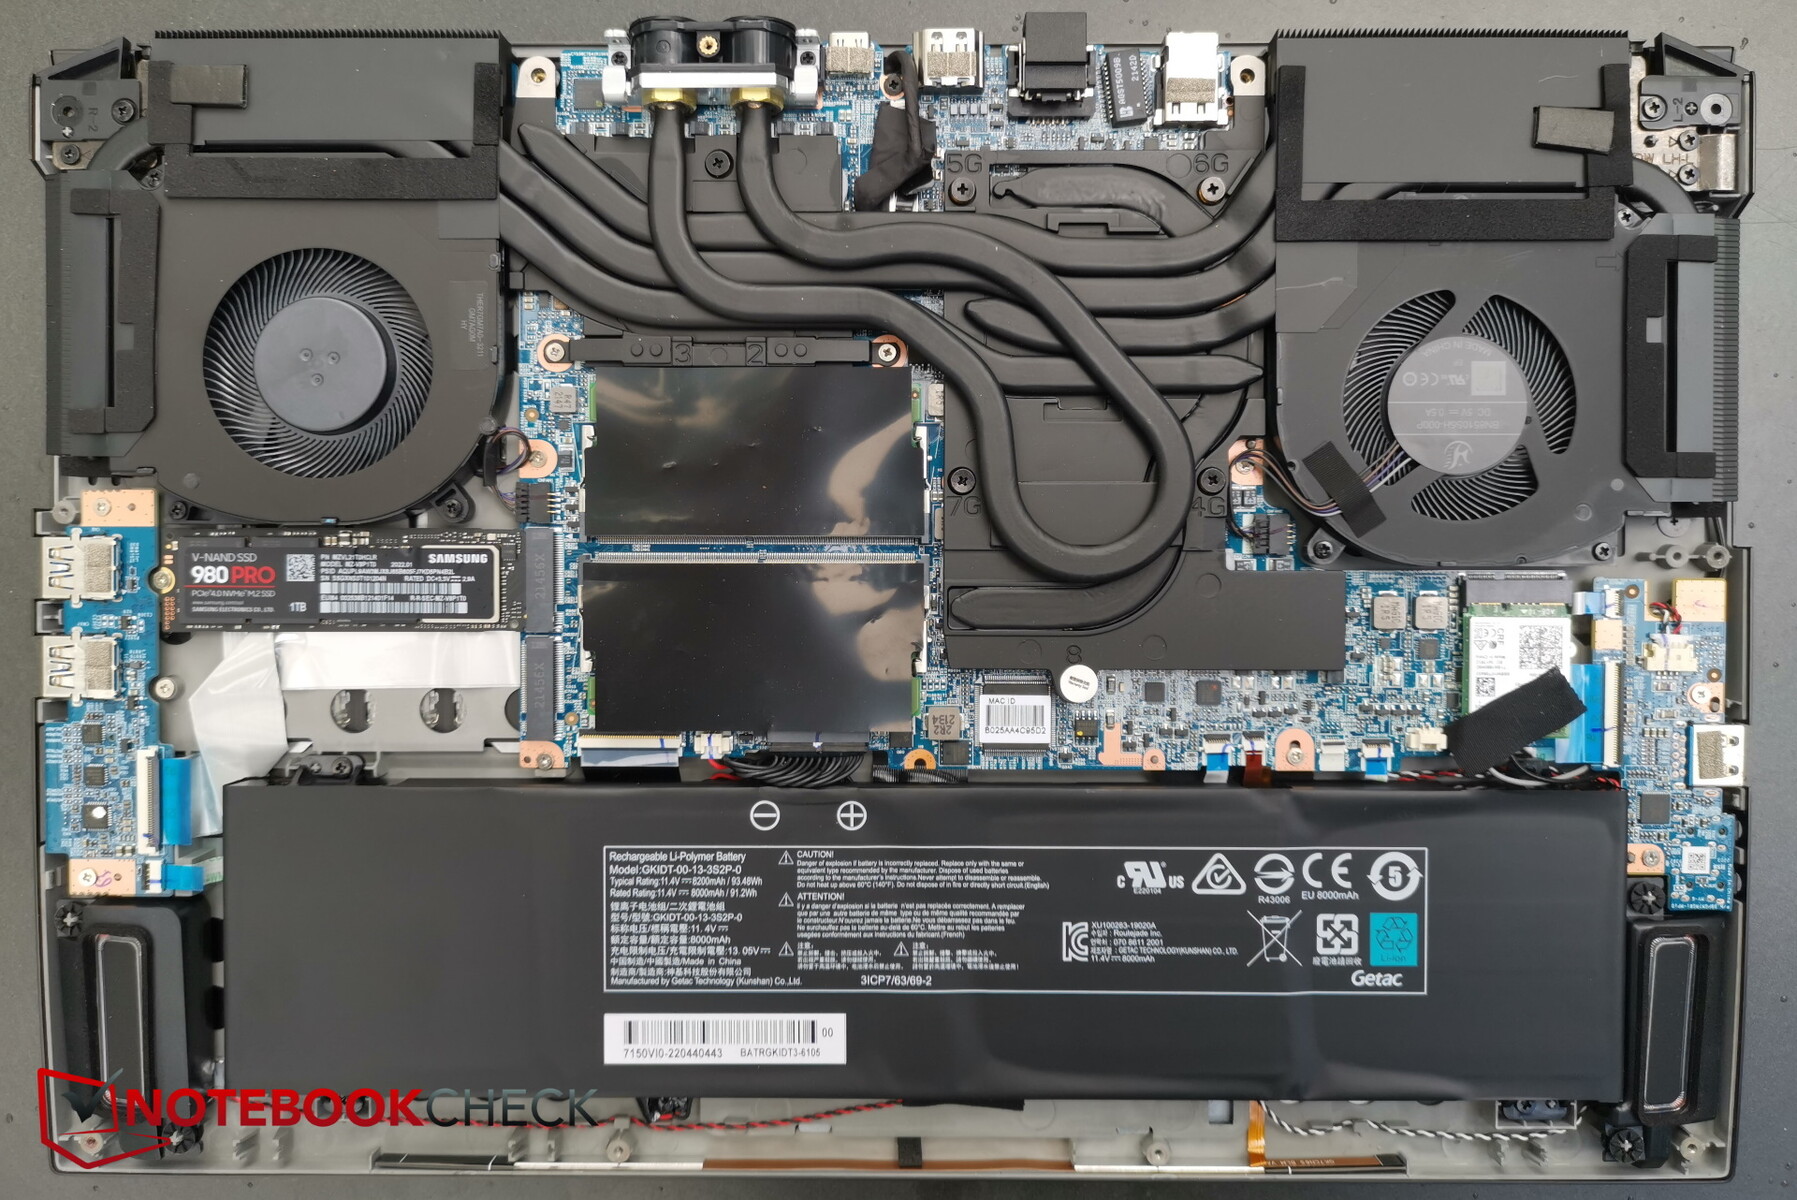
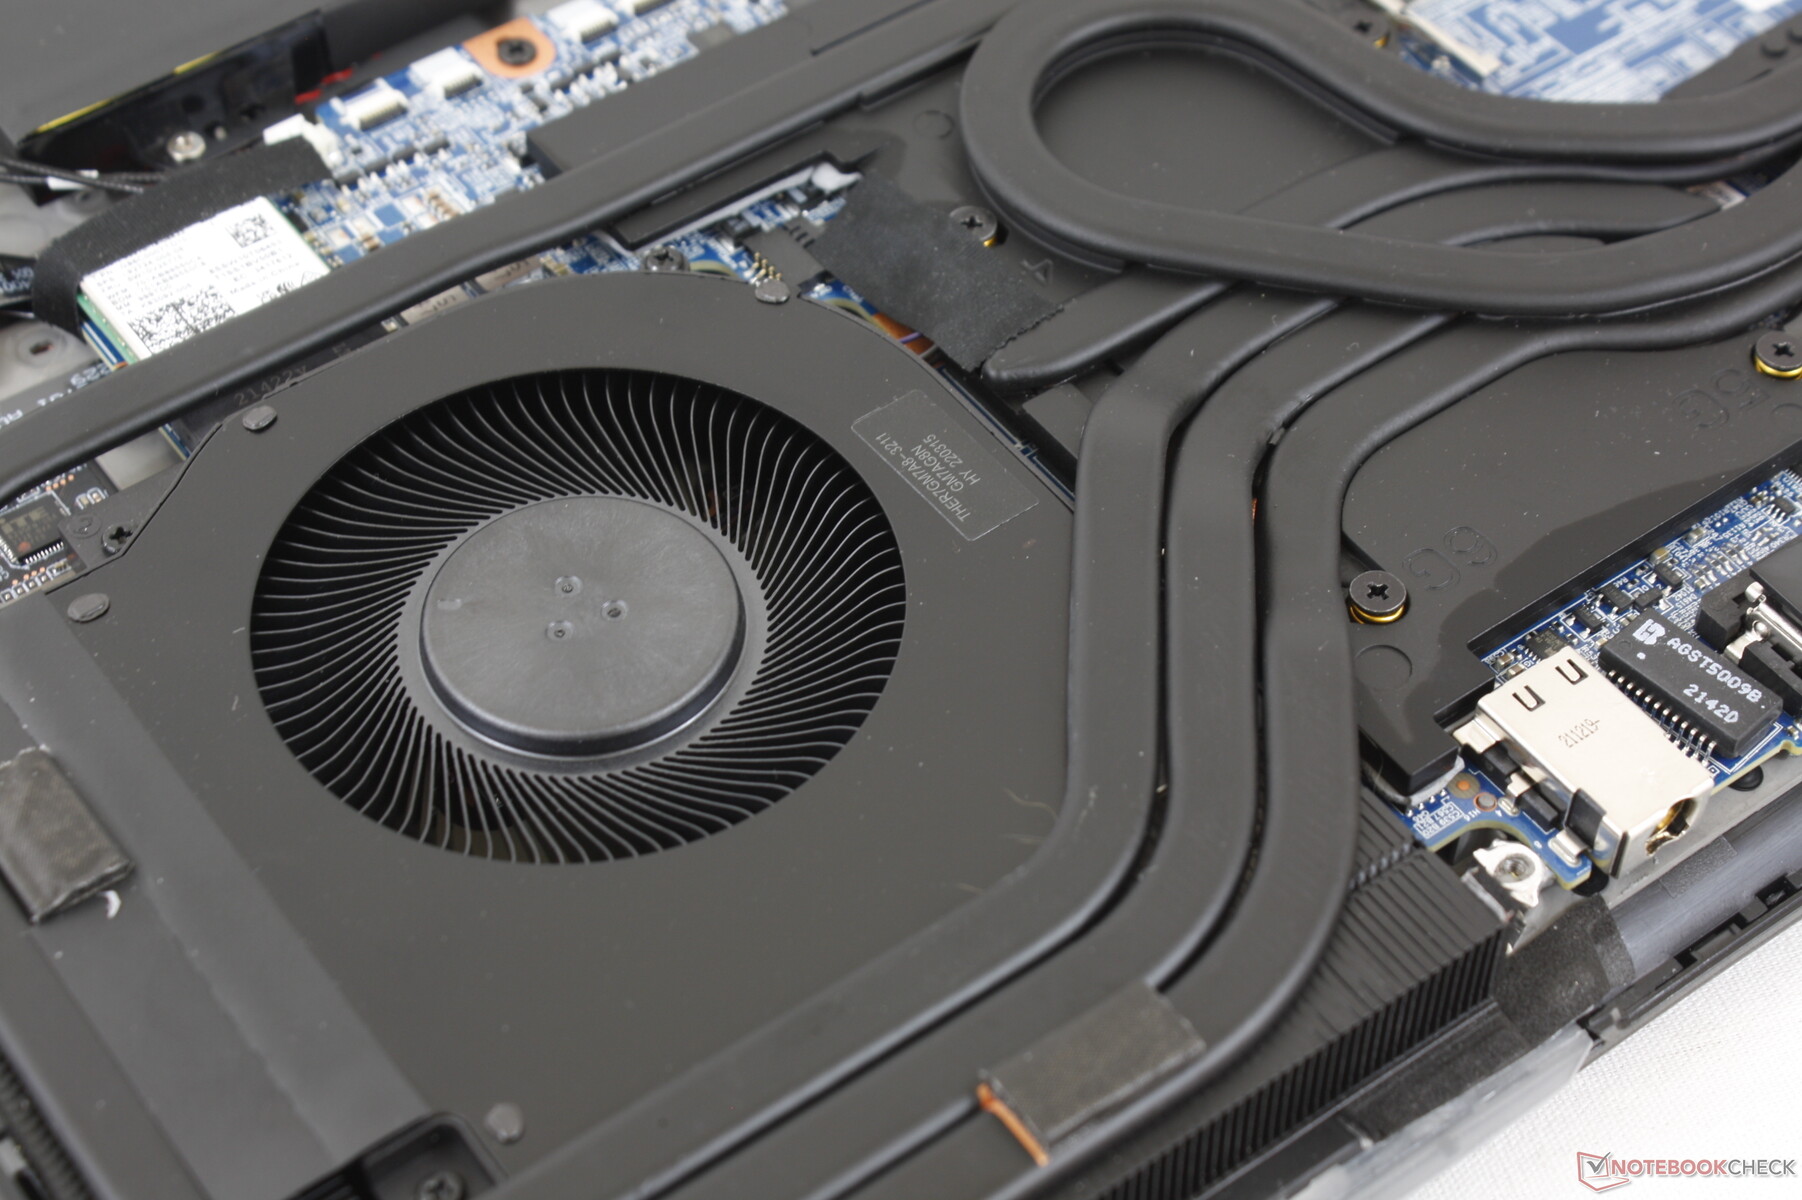
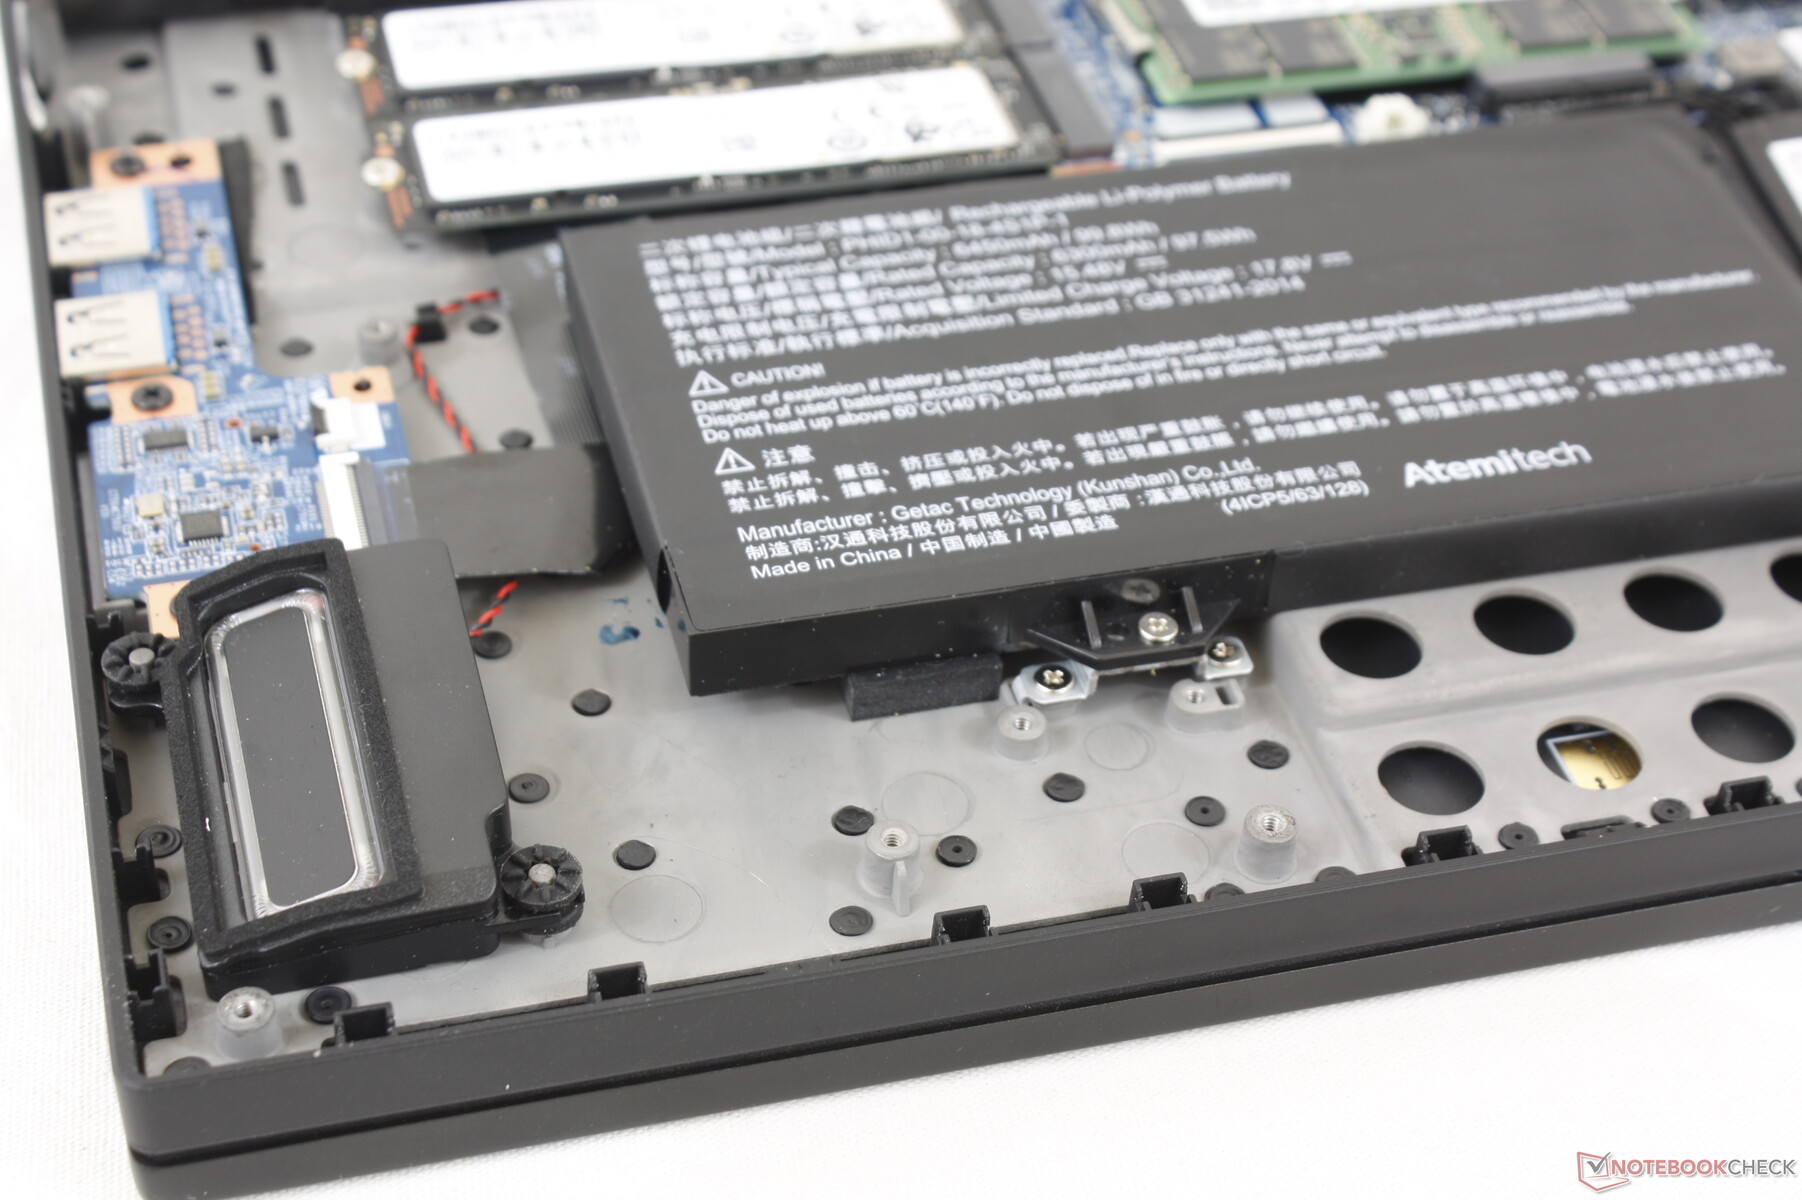
O painel inferior se solta facilmente após a remoção de vários parafusos Philips para atualizações simples de RAM ou SSD. A placa-mãe tem muitas semelhanças com a GM5AG8W, mas com pequenas alterações na solução de resfriamento, como mostram as imagens de comparação abaixo.
Acessórios e Garantia
A caixa de resfriamento externo inclui dois plugues de drenagem, dois tubos de água, duas tampas de água e um manual do usuário, além do habitual adaptador AC.
A garantia padrão limitada de um ano se aplica se adquirida nos EUA.
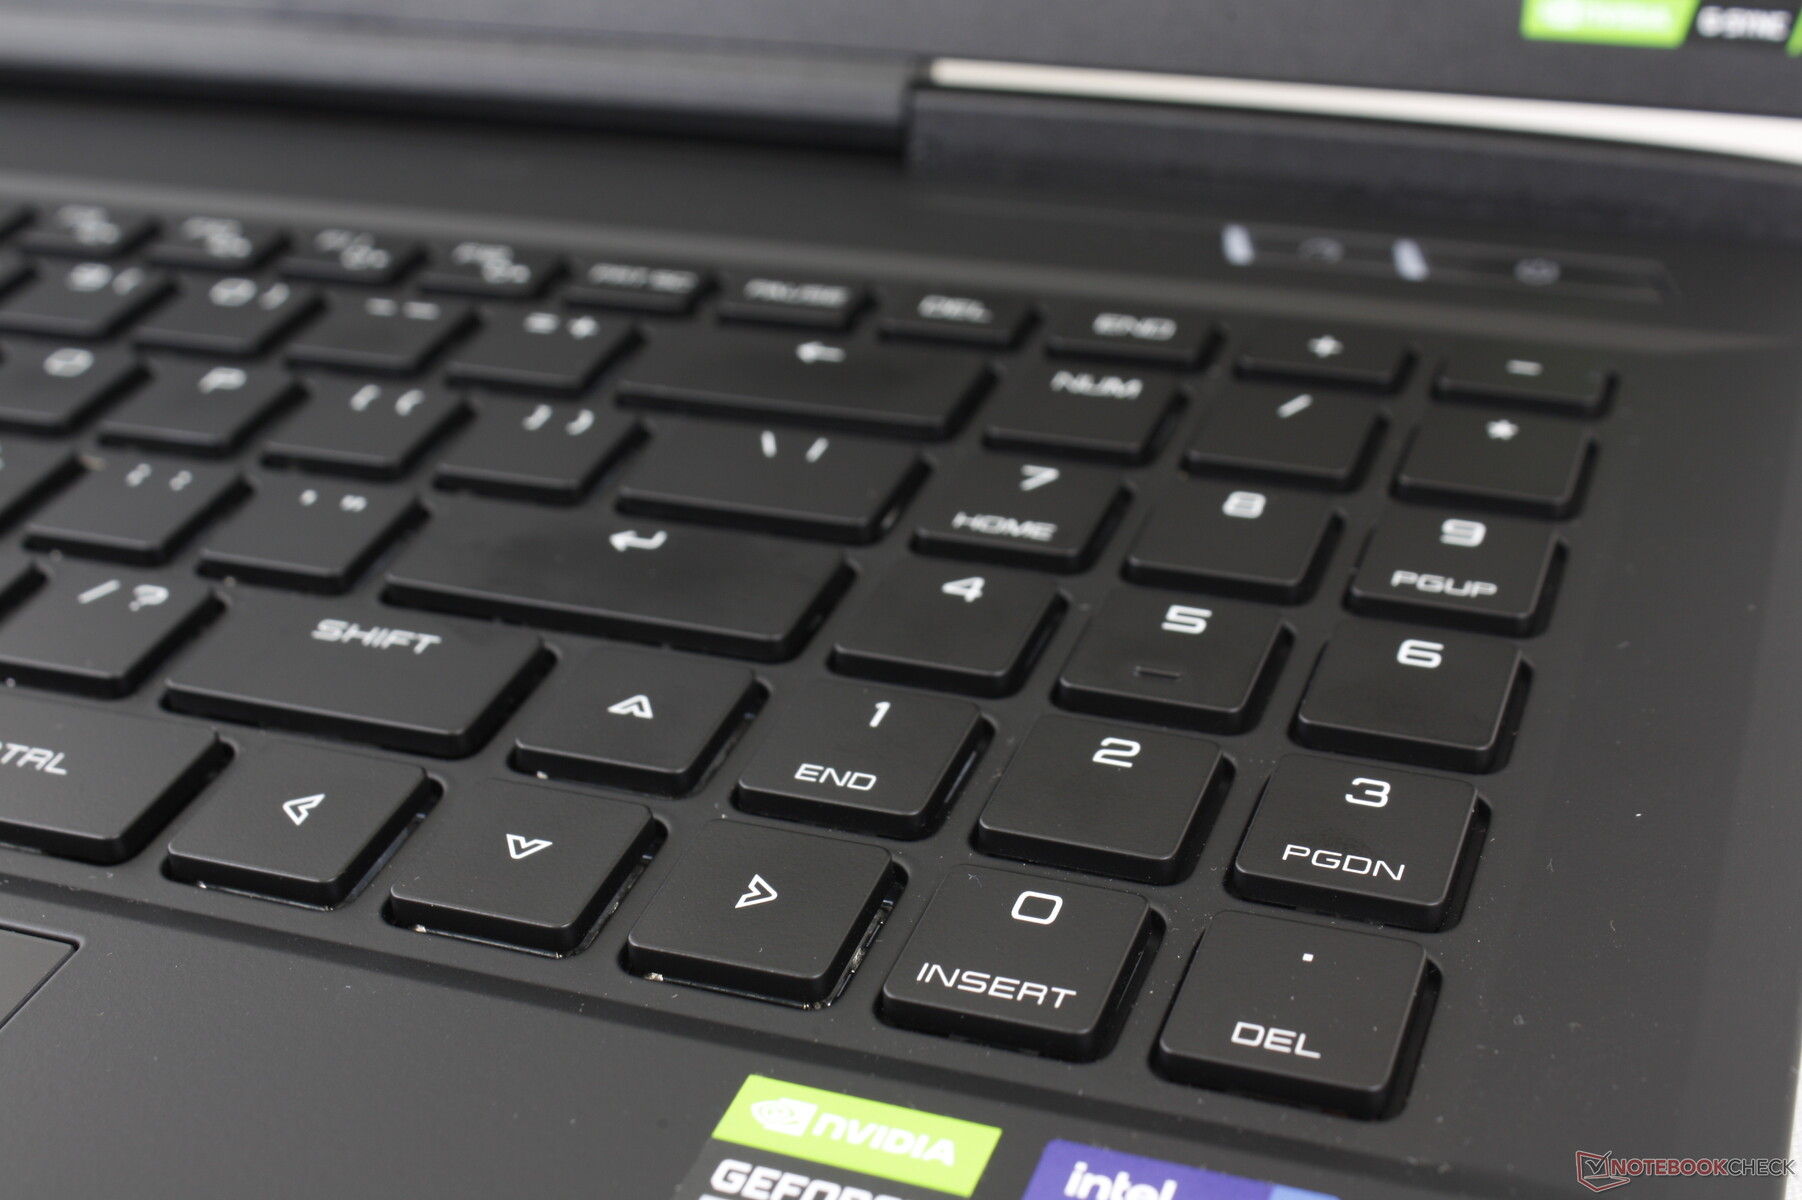
Dispositivos de entrada - Alto e Clicky
Teclado
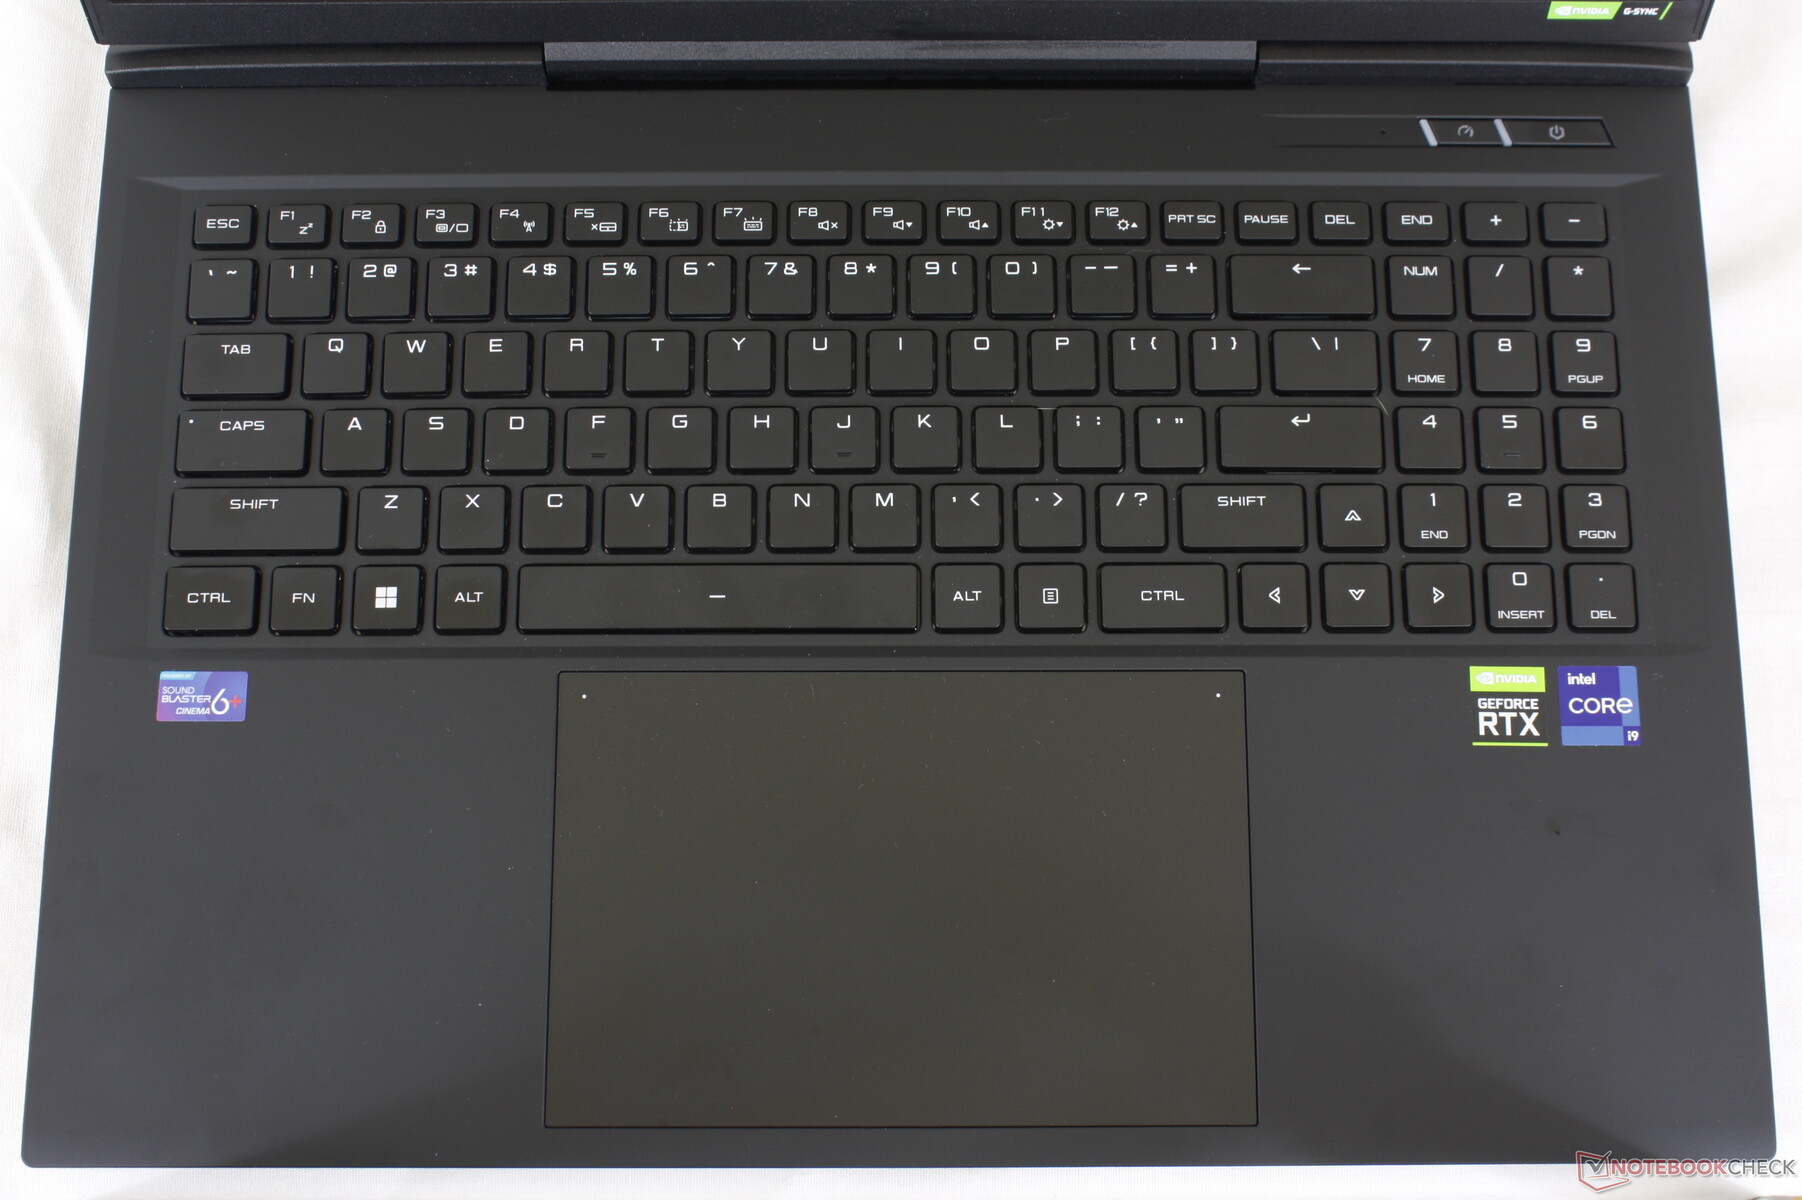
O teclado RGB per-key é diferente do que noXMG Neo 15 E22 mesmo que os dois laptops compartilhem as mesmas portas. As chaves Cherry MX em nosso Uniwell oferecem viagens visivelmente mais profundas, feedback mais nítido e um barulho muito mais alto do que na maioria dos outros laptops. Você vai querer evitar o uso deste laptop em salas de aula, conferências ou bibliotecas por causa da barulheira
Um aspecto irritante que notamos é que as teclas numpad são mais suaves e silenciosas do que as principais teclas QWERTY e, portanto, o feedback não é uniforme em todas as teclas. É estranho digitar entre palavras e números porque o feedback é muito diferente entre as teclas.
Touchpad
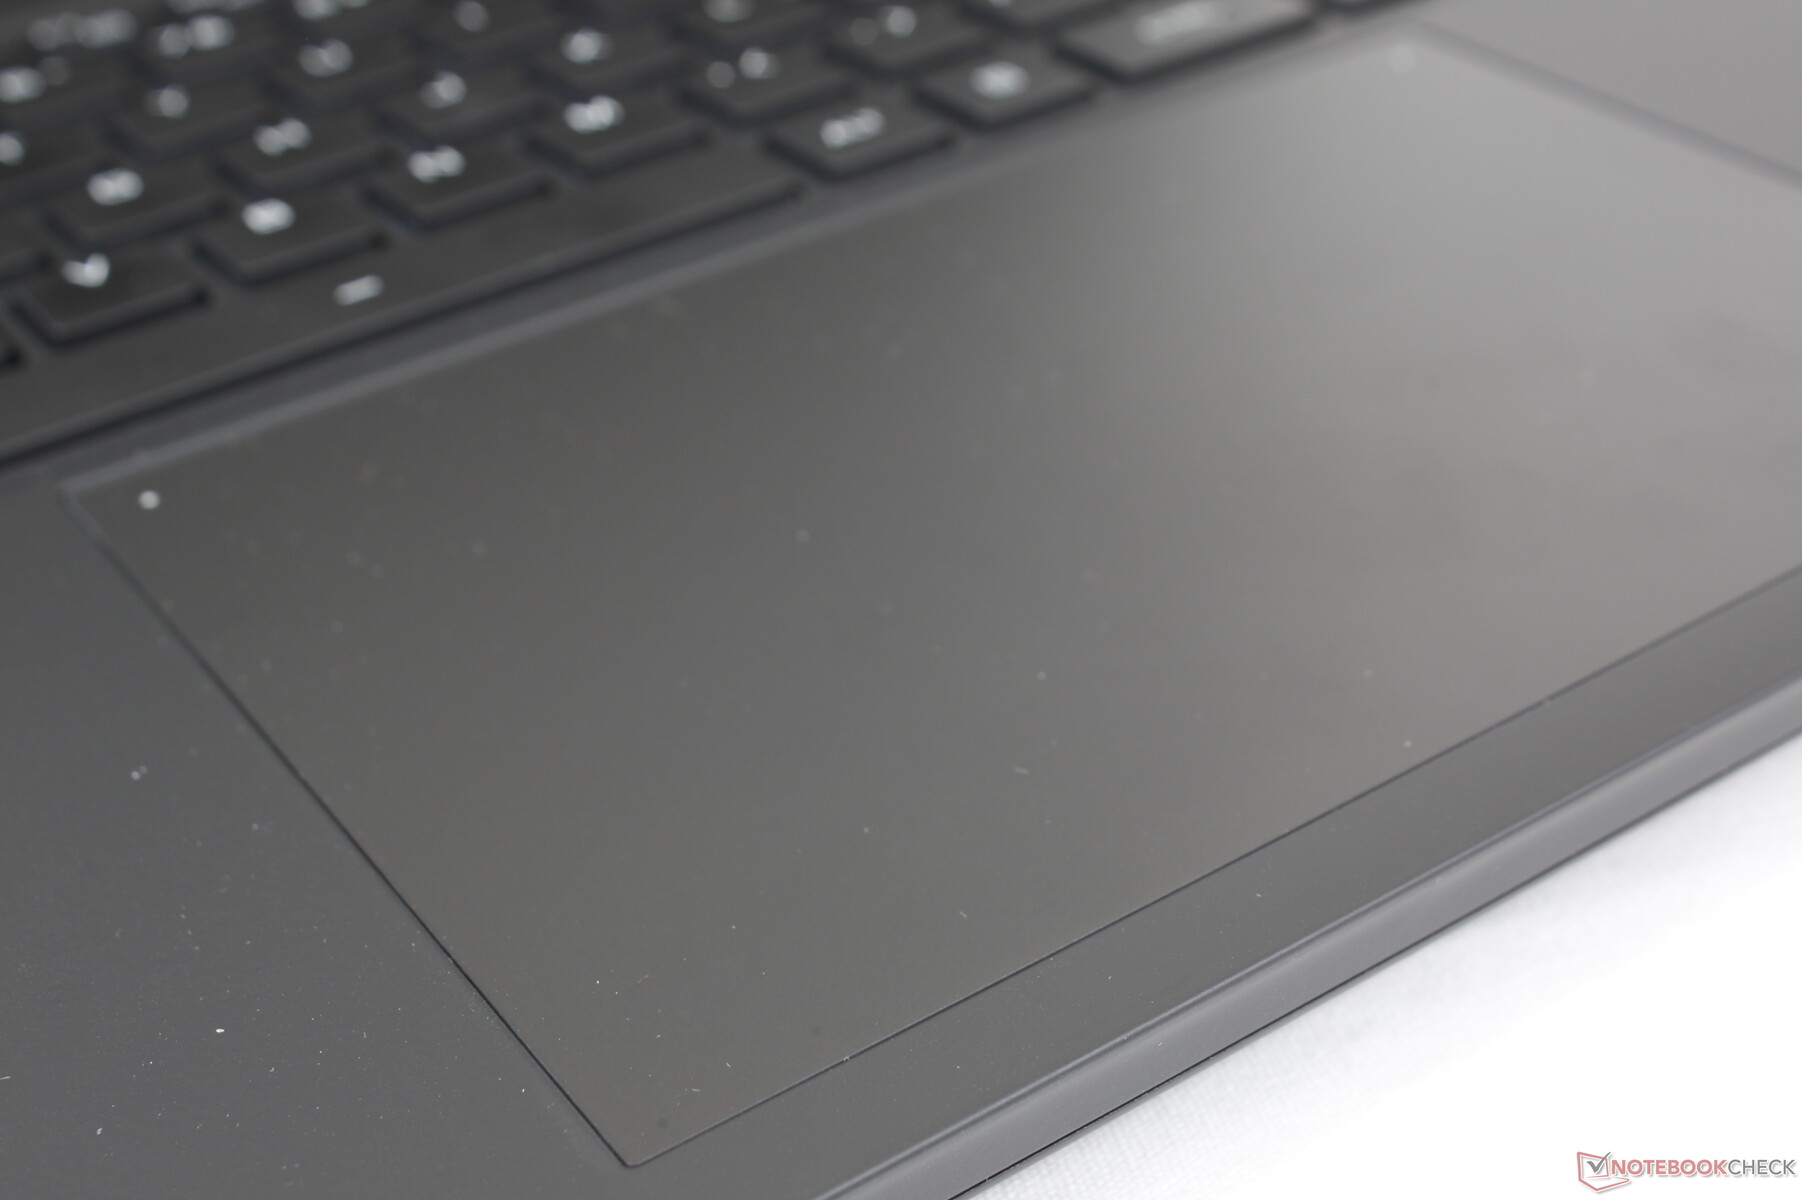
O clickpad superdimensionado é ainda maior do que o já grande clickpad do MSI GS77 (15,5 x 10 cm vs. 13,2 x 8,2 cm). Sua superfície é ligeiramente emborrachada para um deslizamento muito suave em velocidades médias a altas com apenas um pouco de aderência em velocidades mais lentas.
O feedback ao clicar no clickpad é mais firme do que no grande XPS 17 clickpad para um toque mais satisfatório. É definitivamente mais alto, no entanto, mas não esperamos que este seja um grande problema, uma vez que as teclas mecânicas já estão bem altas de qualquer forma.
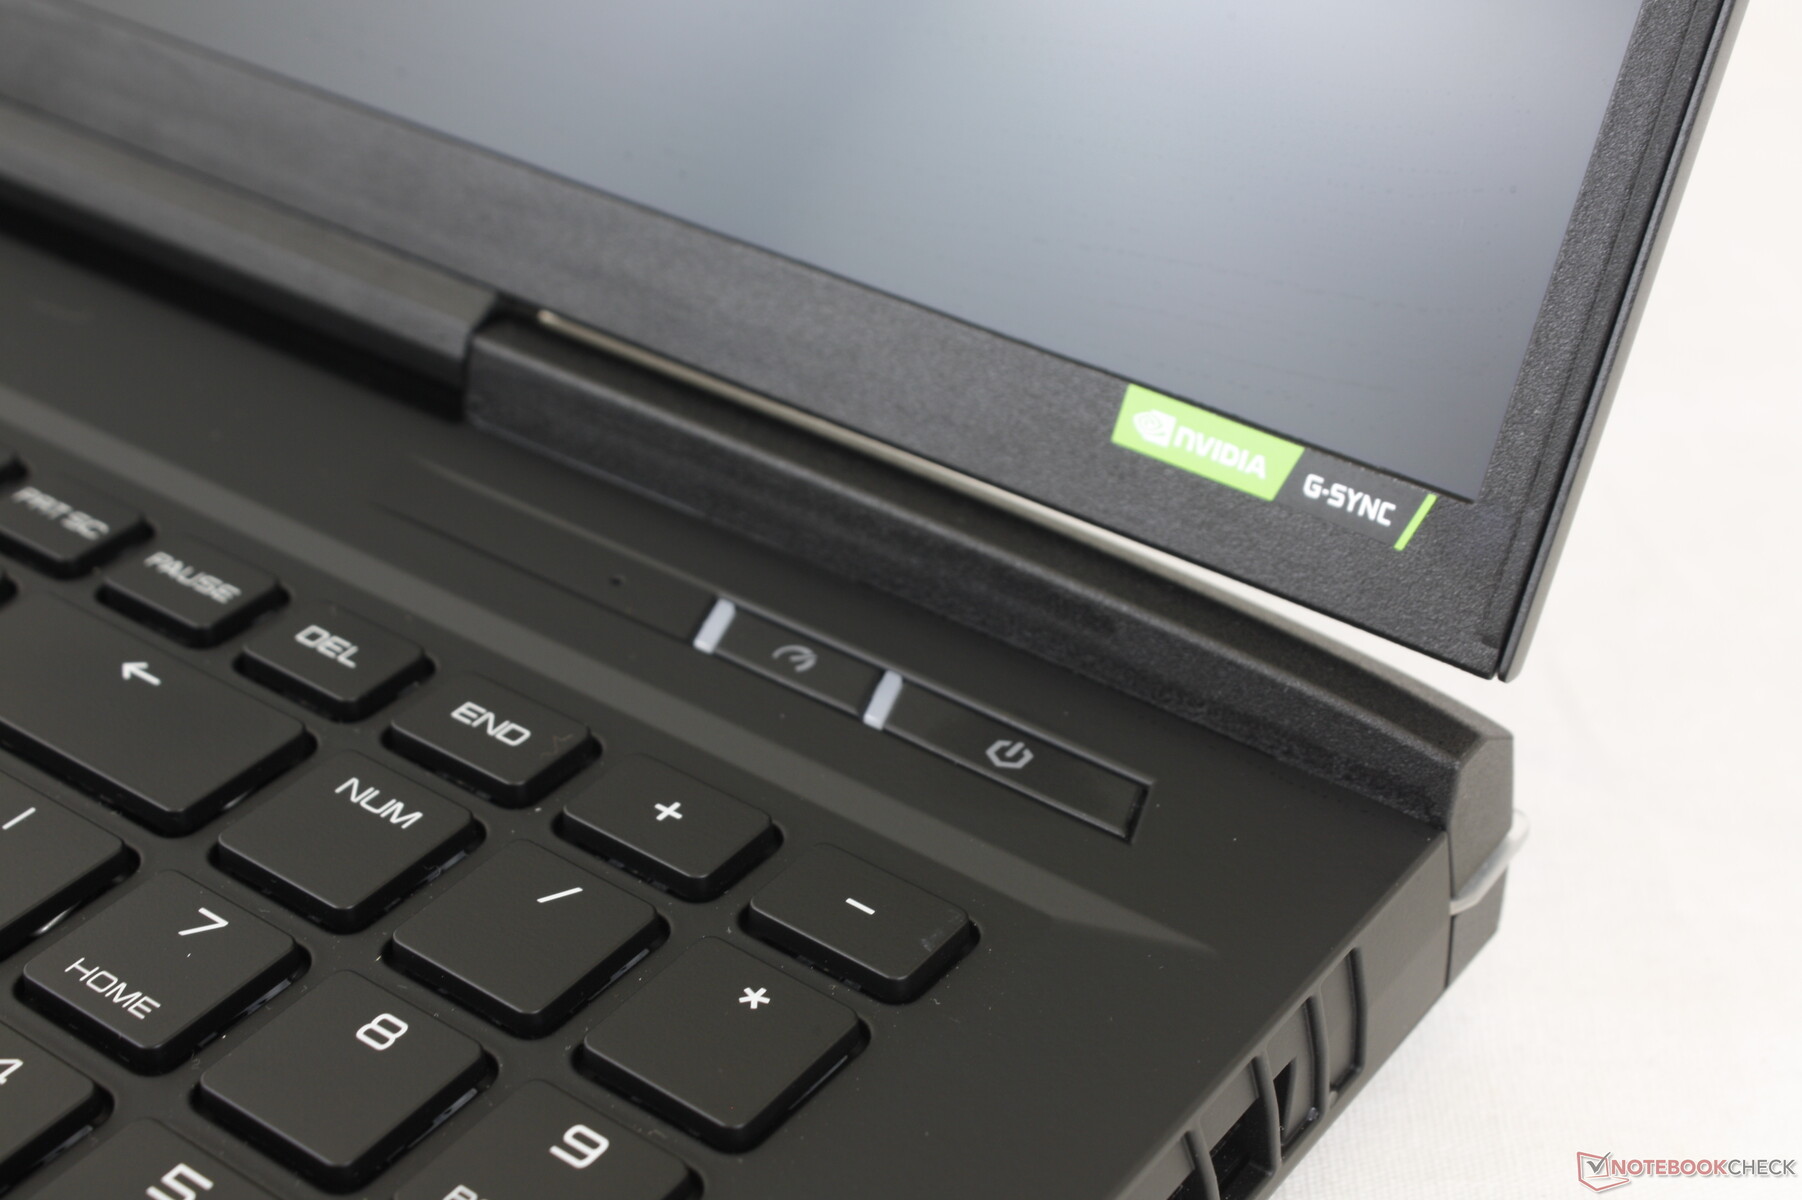
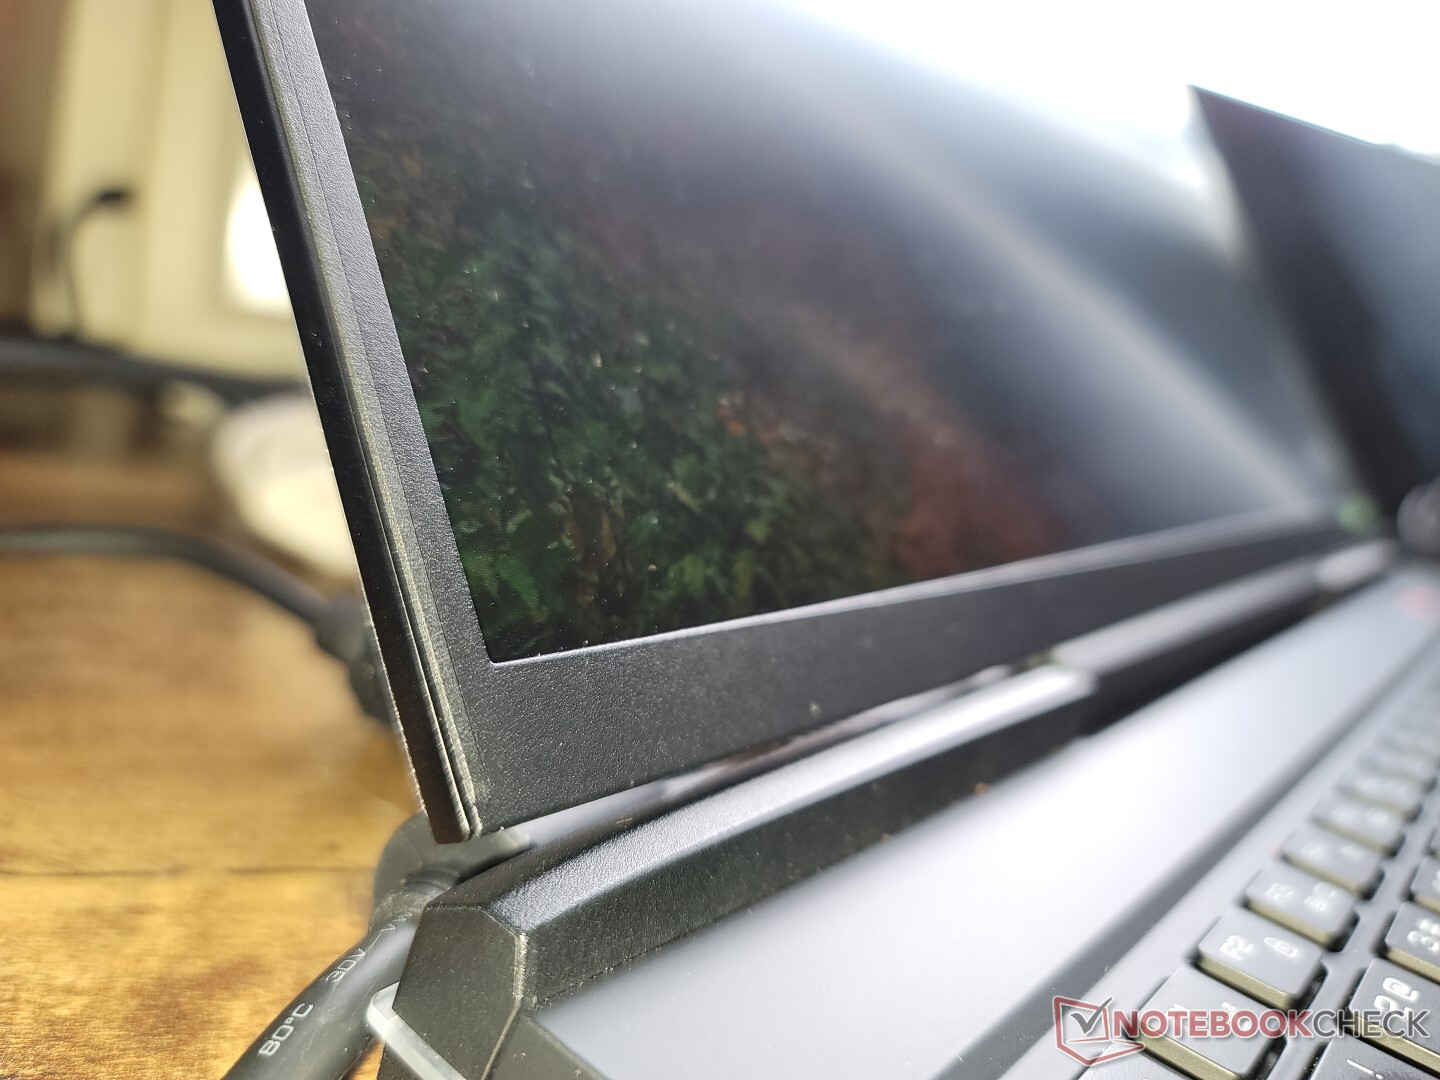
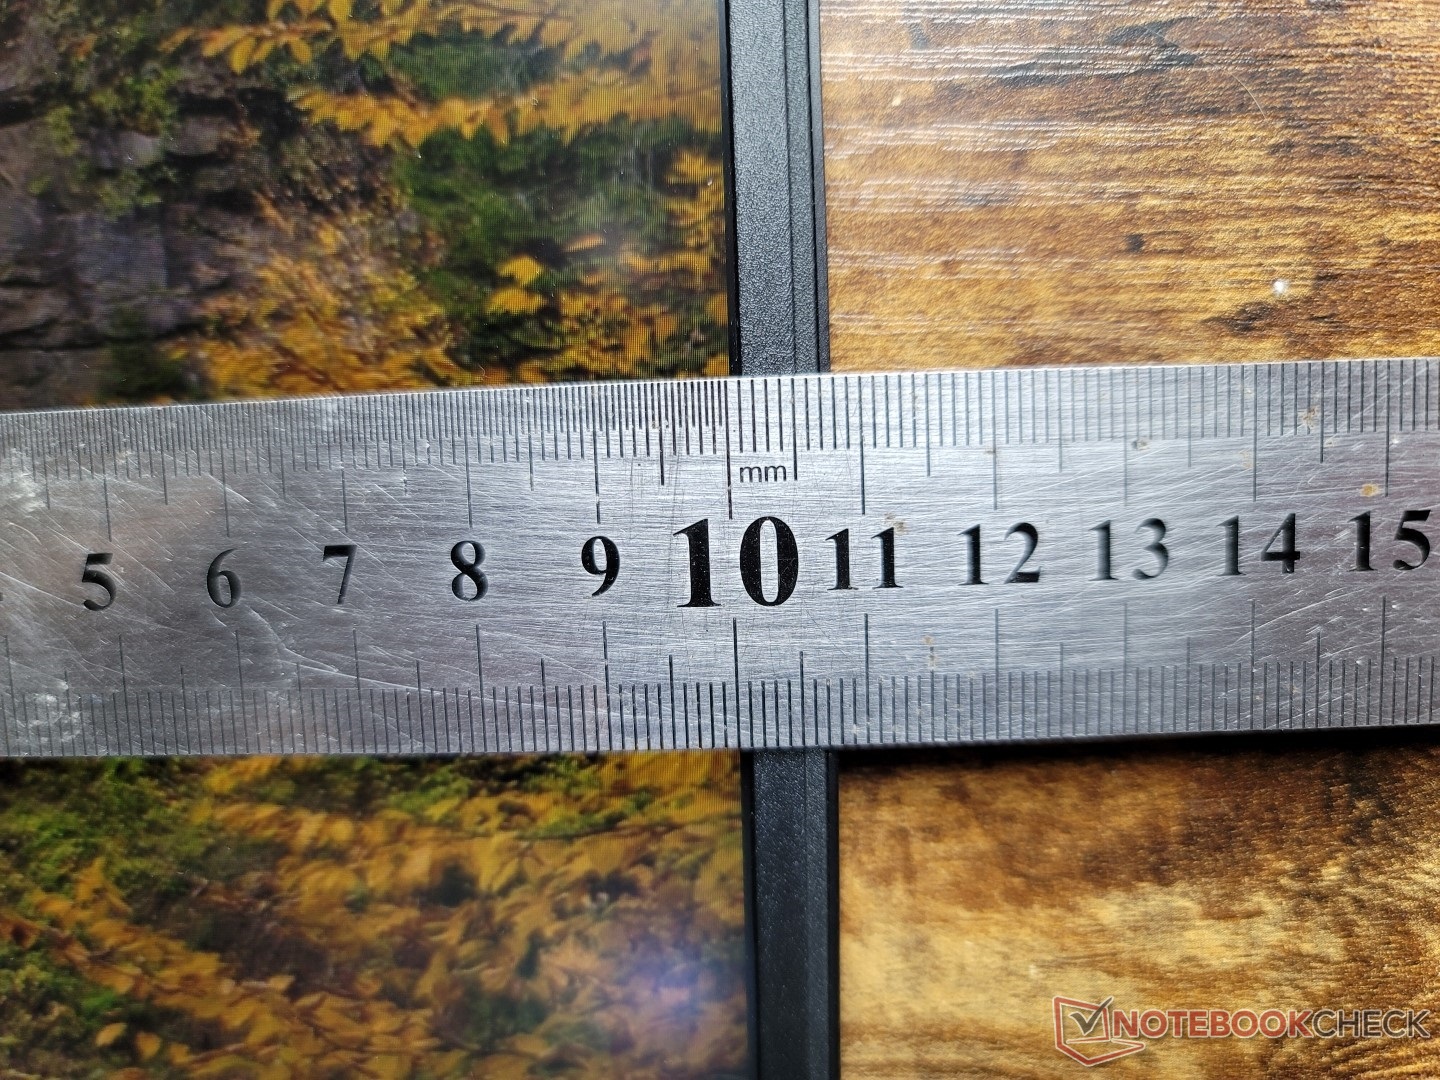
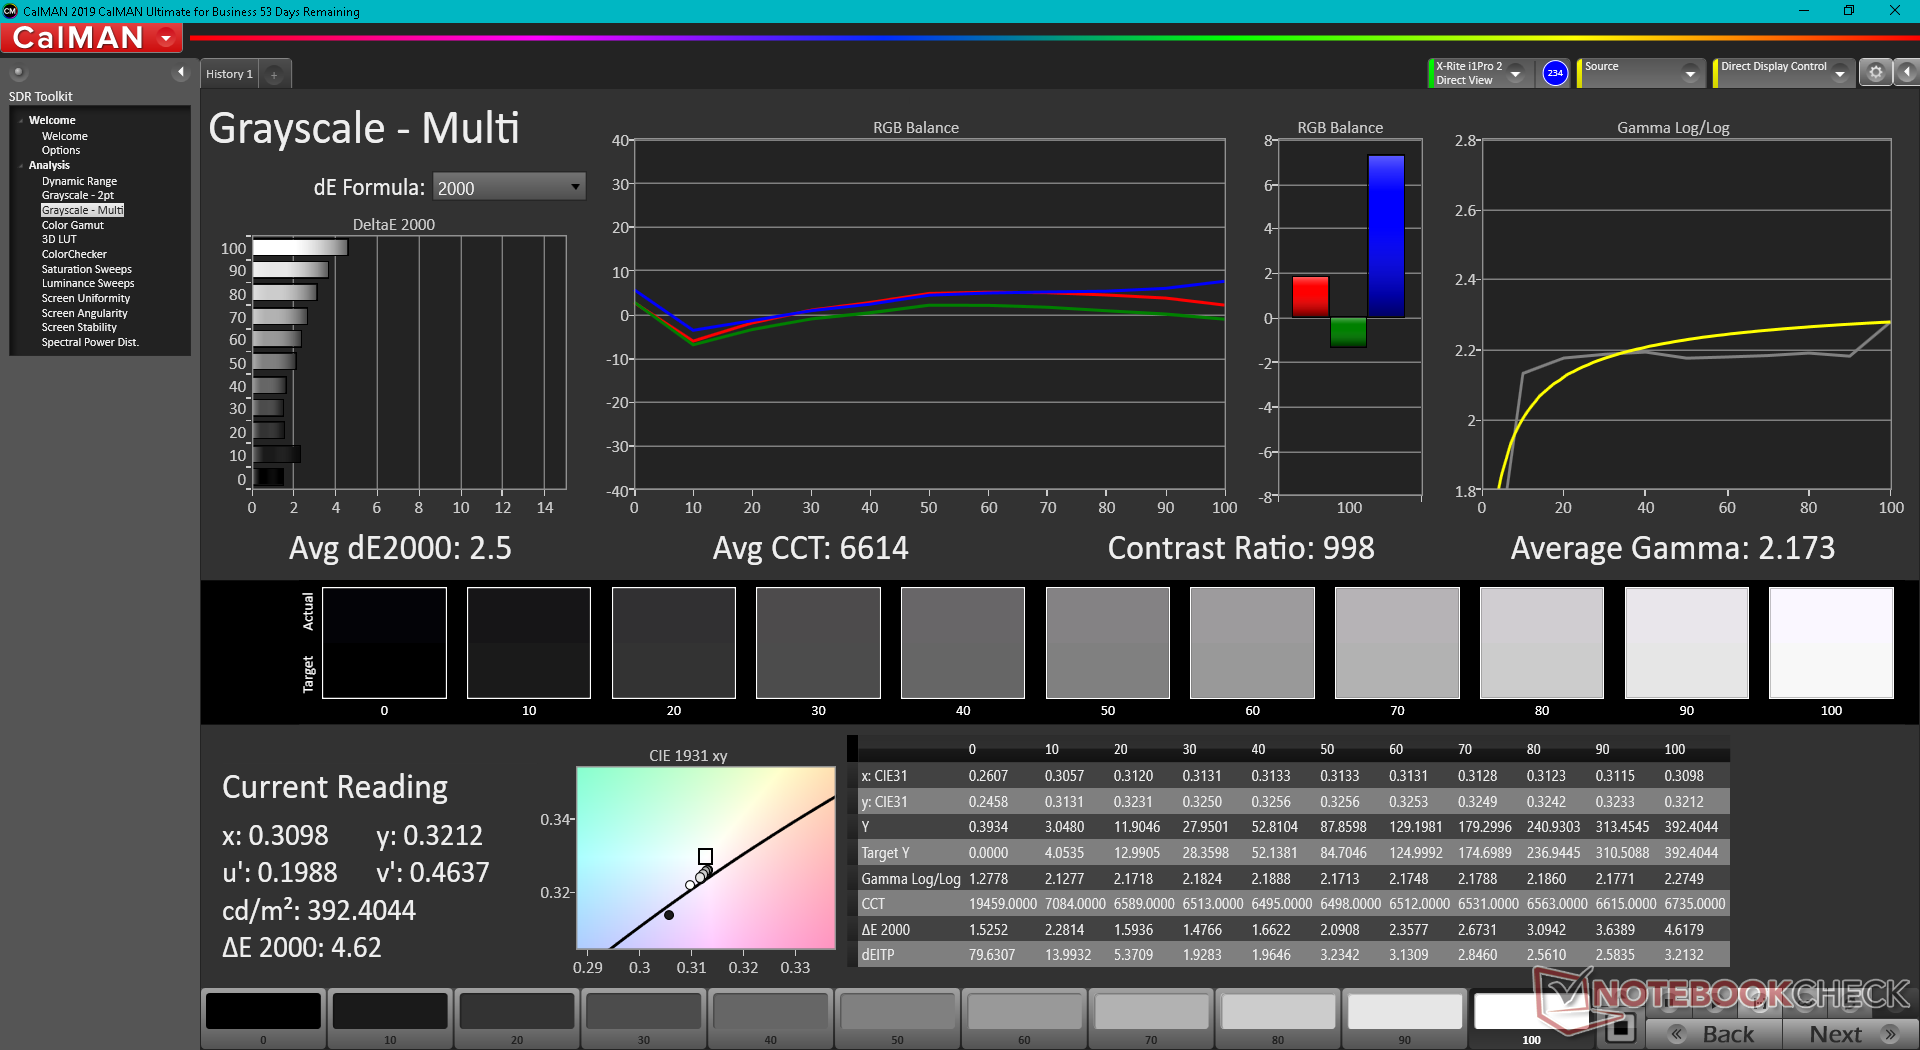
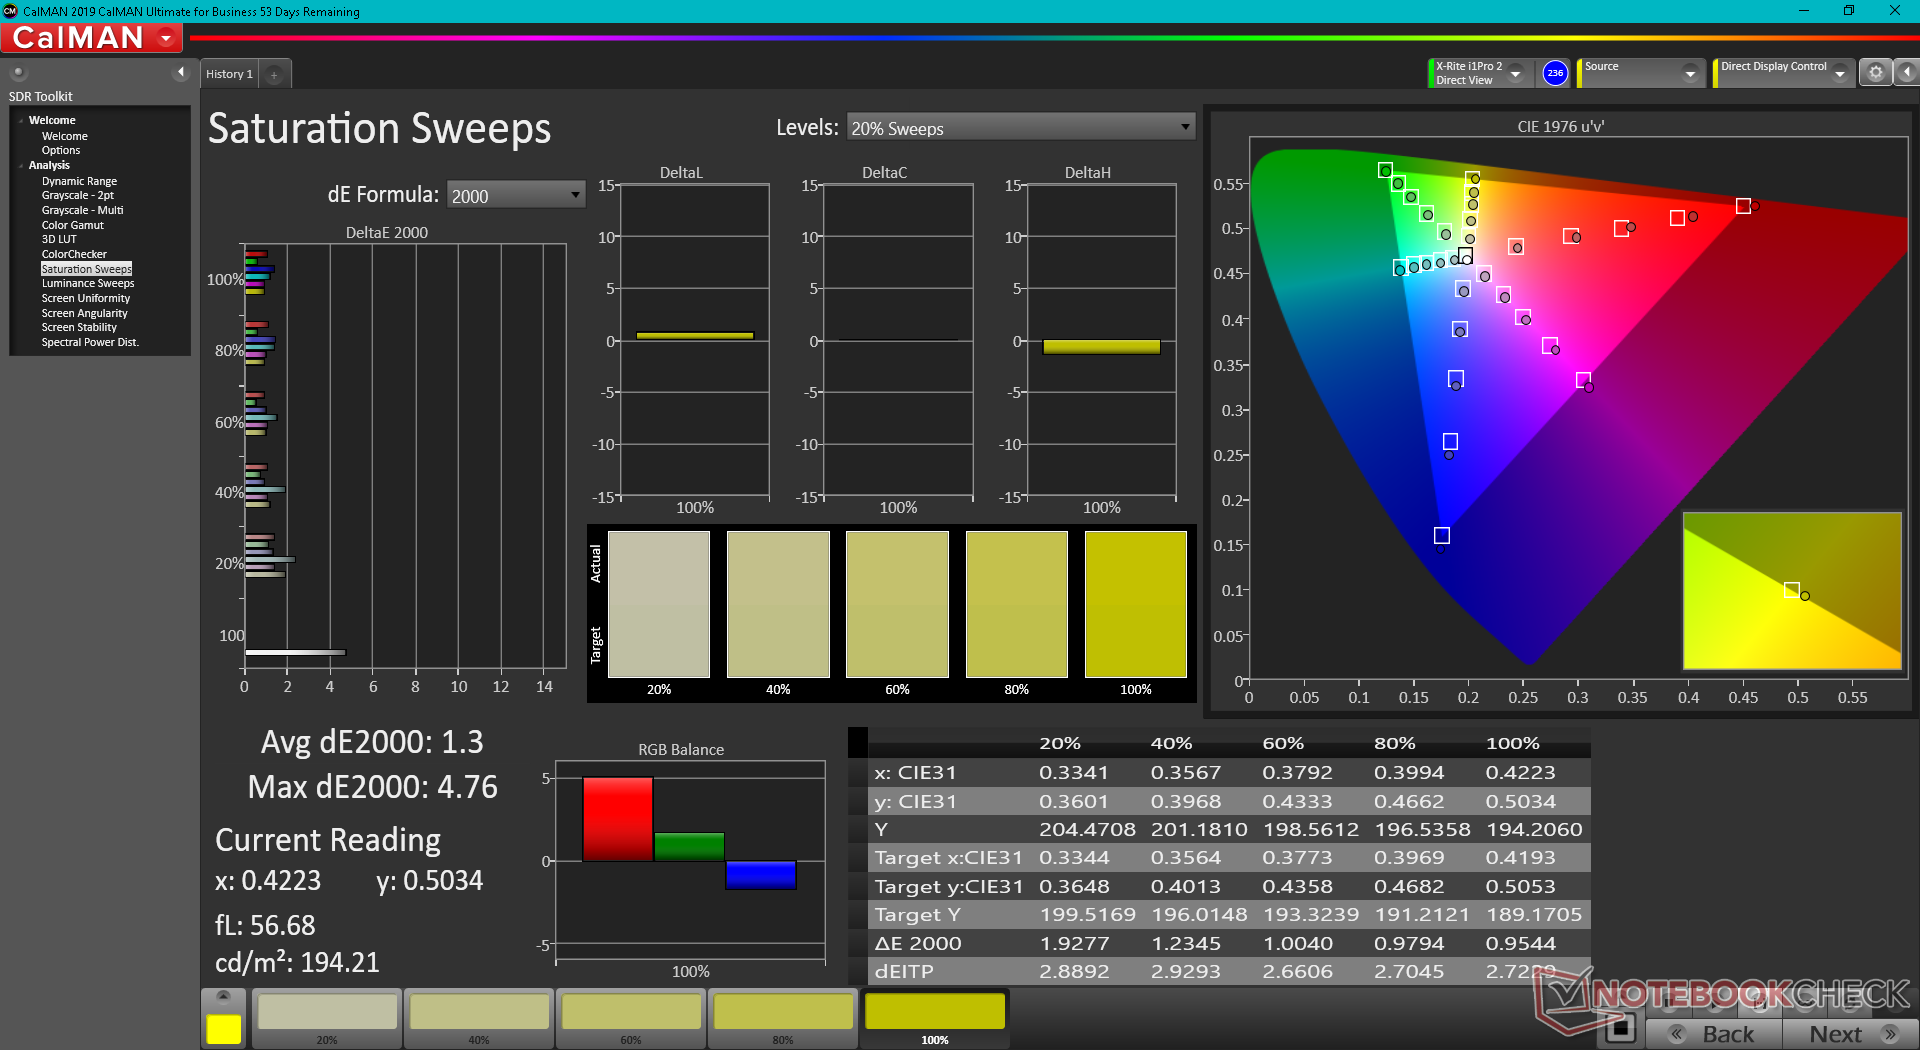
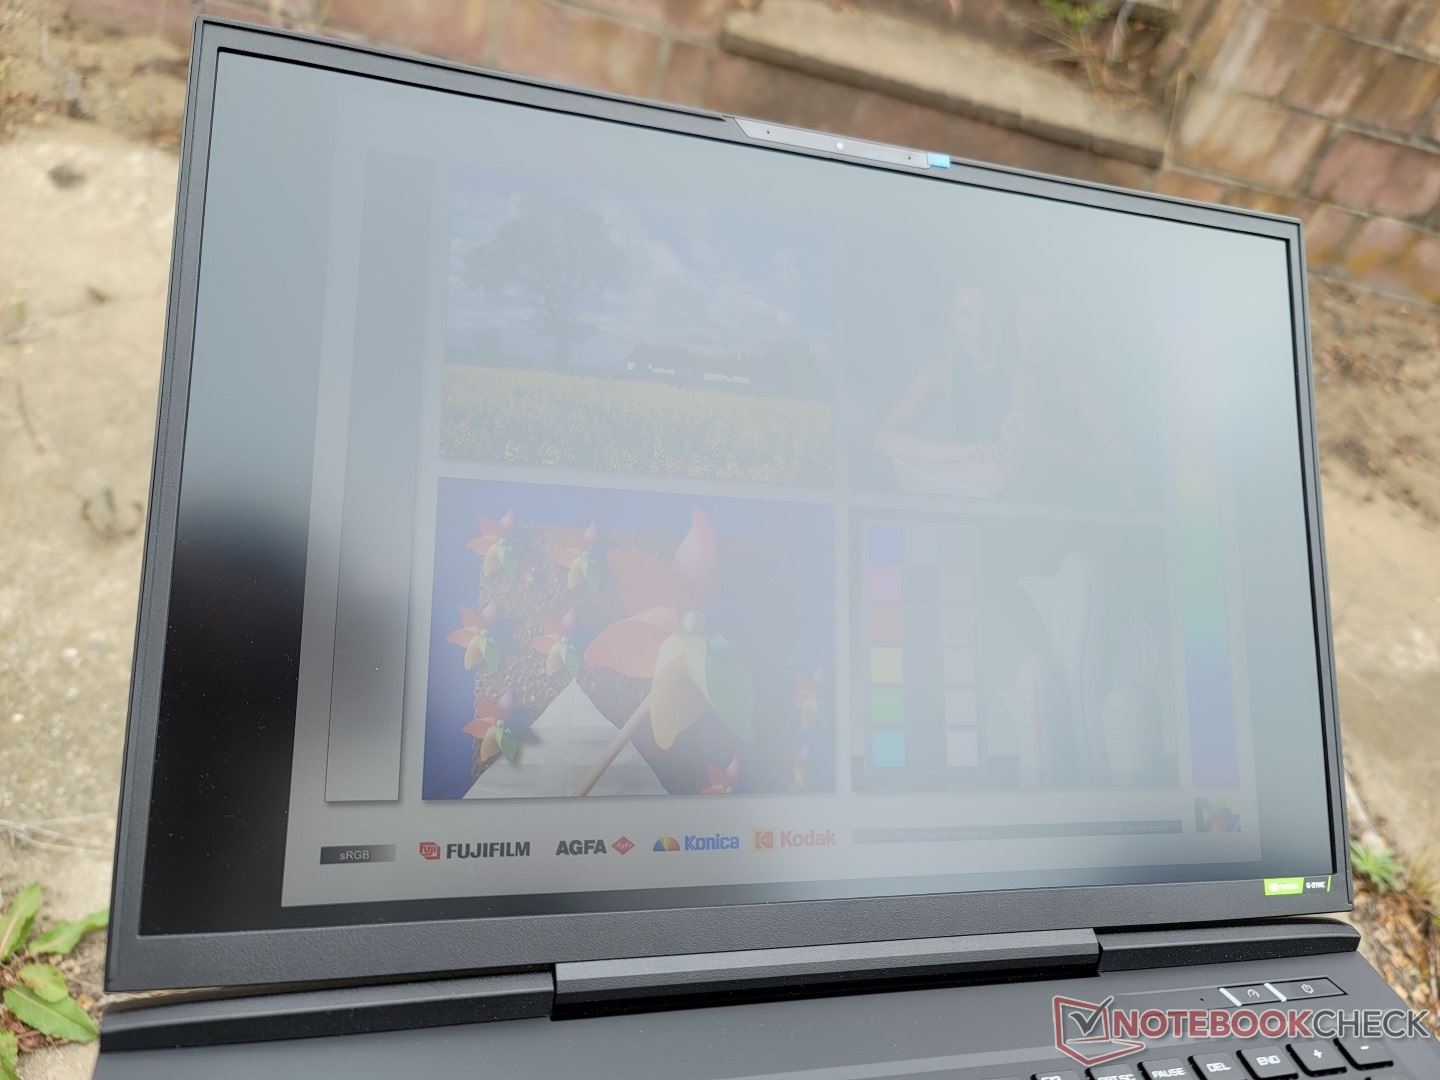
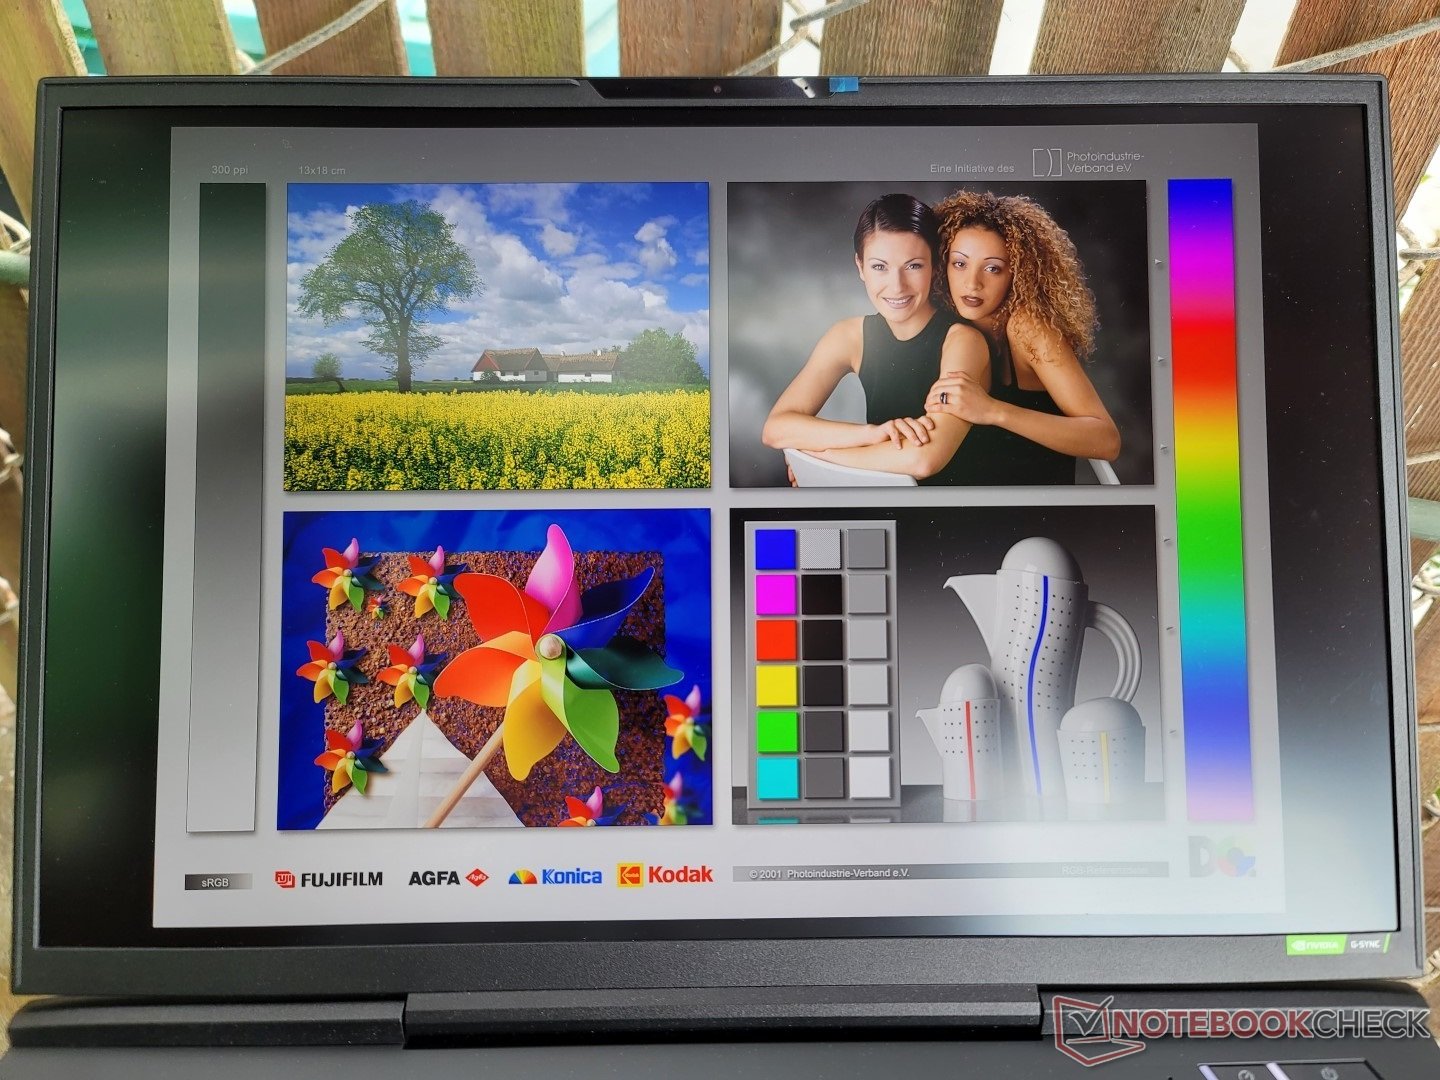
Mostrador - Otimizado para jogos 1440p
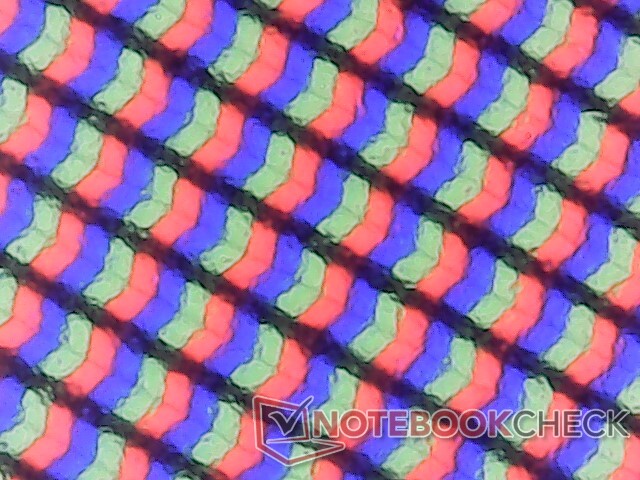
O painel BOE NE170QDM-NZ1 em nossa unidade de teste Uniwell é o primeiro a aparecer em nosso banco de dados. Este painel IPS compatível com G-Sync oferece cobertura total sRGB, tempos de resposta rápidos, bom contraste, uma taxa de atualização rápida de 240 Hz e uma retroiluminação relativamente brilhante de 400-nit para ser digno de uma máquina de jogos para os entusiastas. Entretanto, a maioria dos outros laptops para jogos, como o Lâmina Razer 17 têm opções de painéis adicionais como 4K ou OLED, ambos indisponíveis no Uniwell.
| |||||||||||||||||||||||||
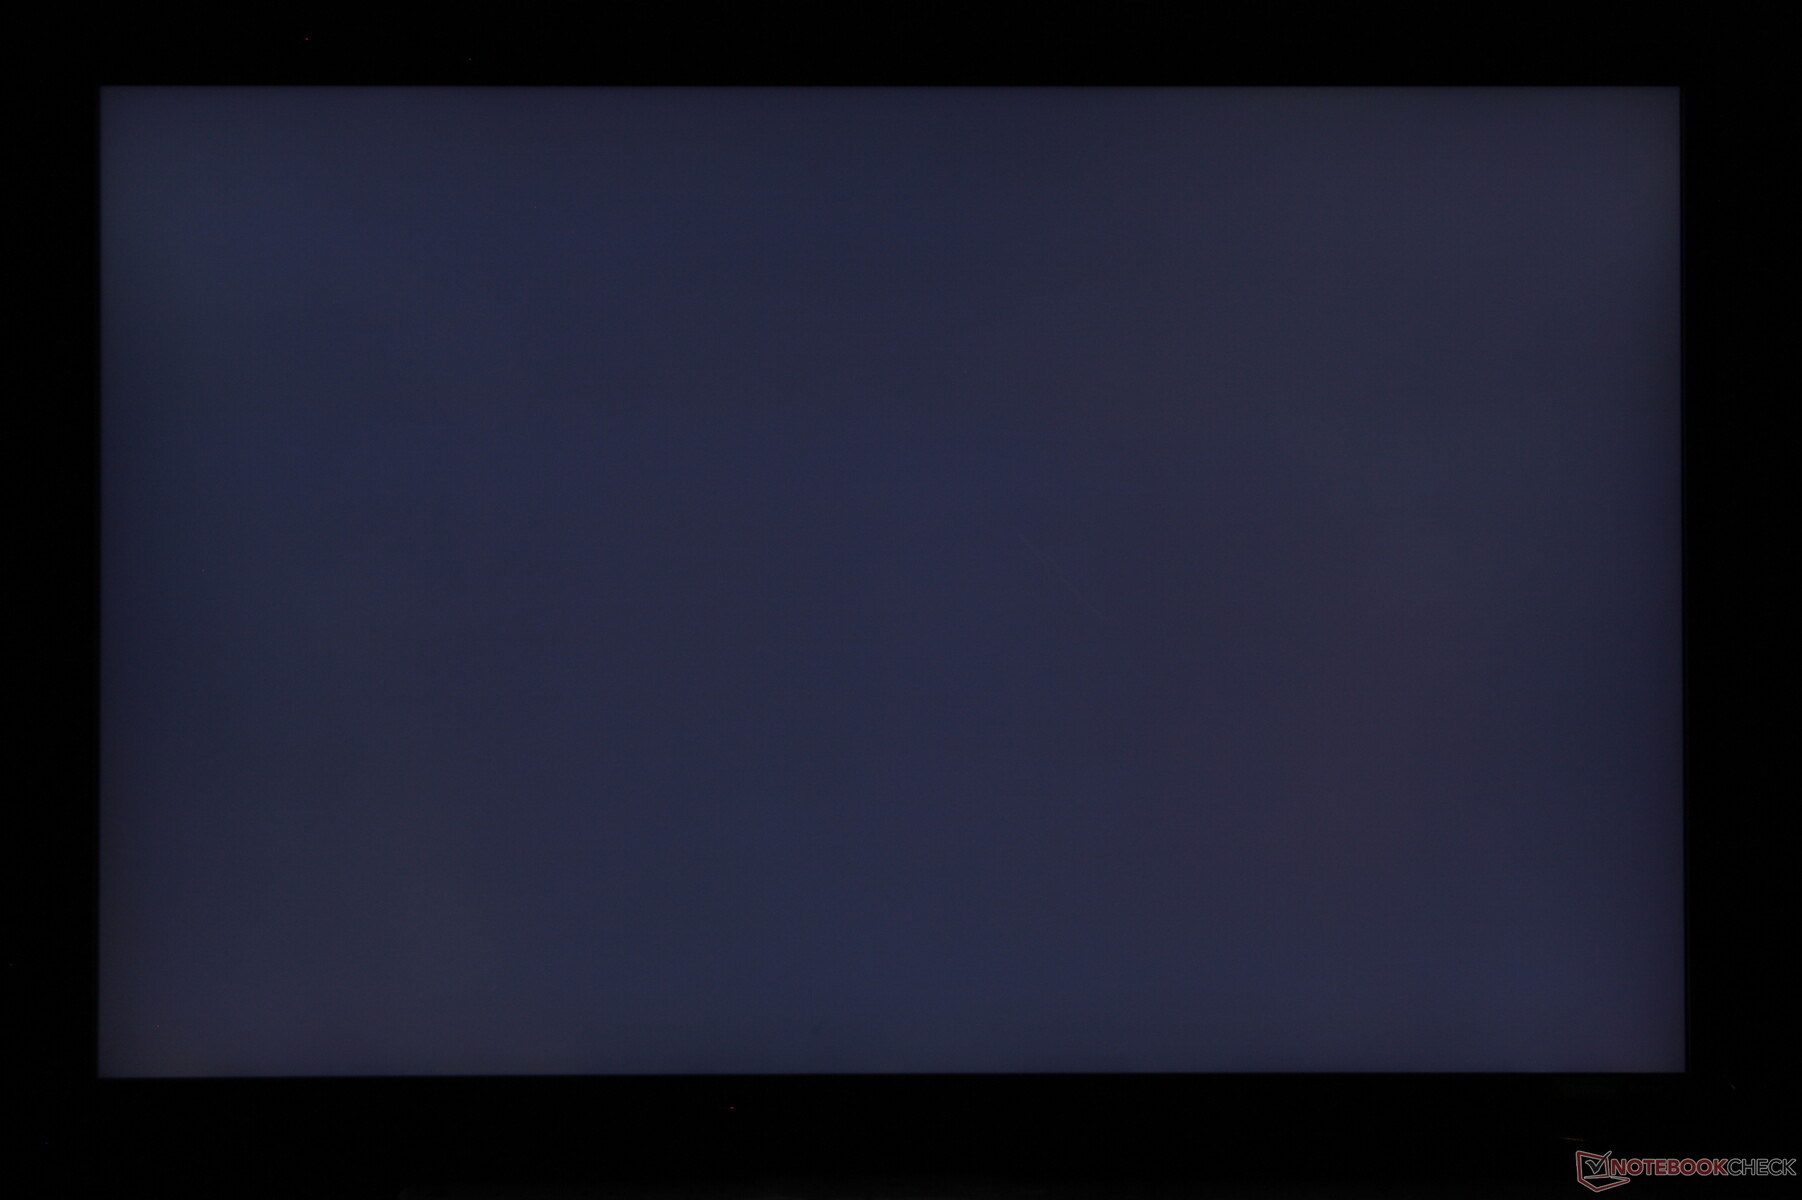
iluminação: 91 %
iluminação com acumulador: 392.5 cd/m²
Contraste: 872:1 (Preto: 0.45 cd/m²)
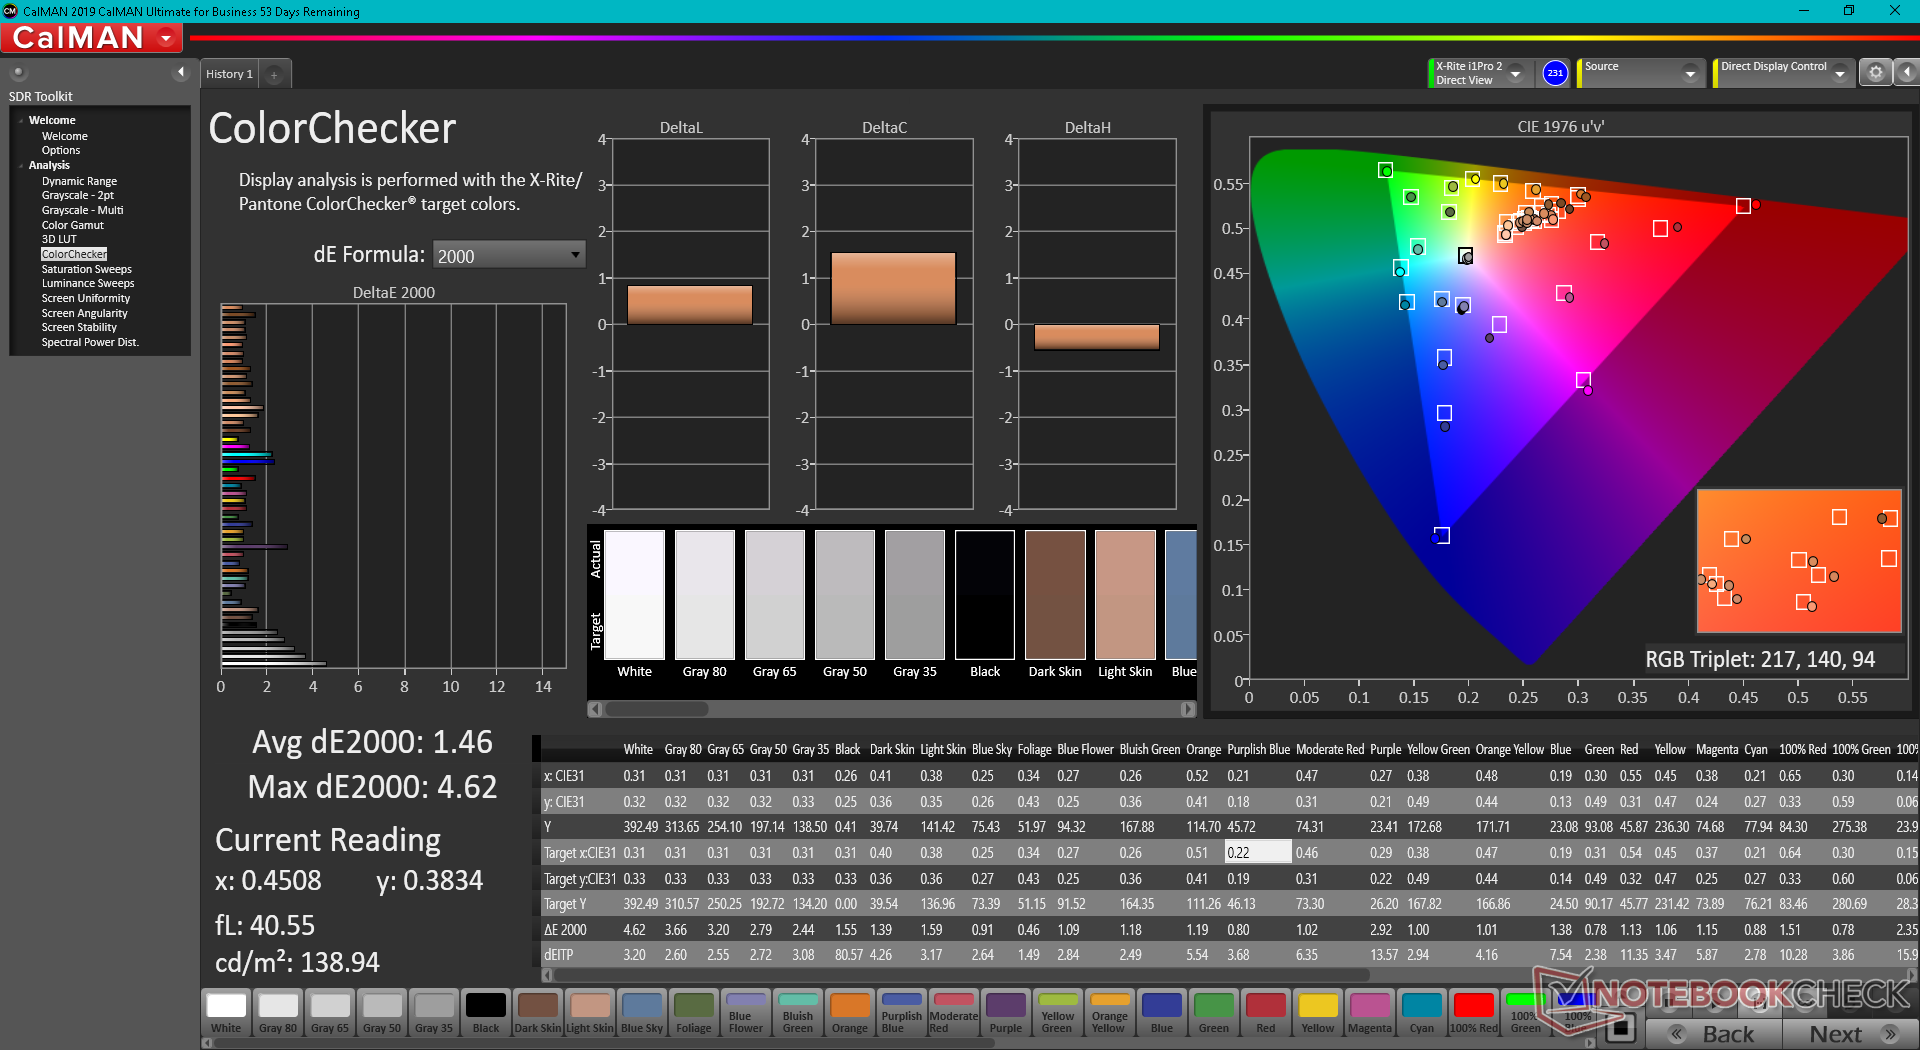
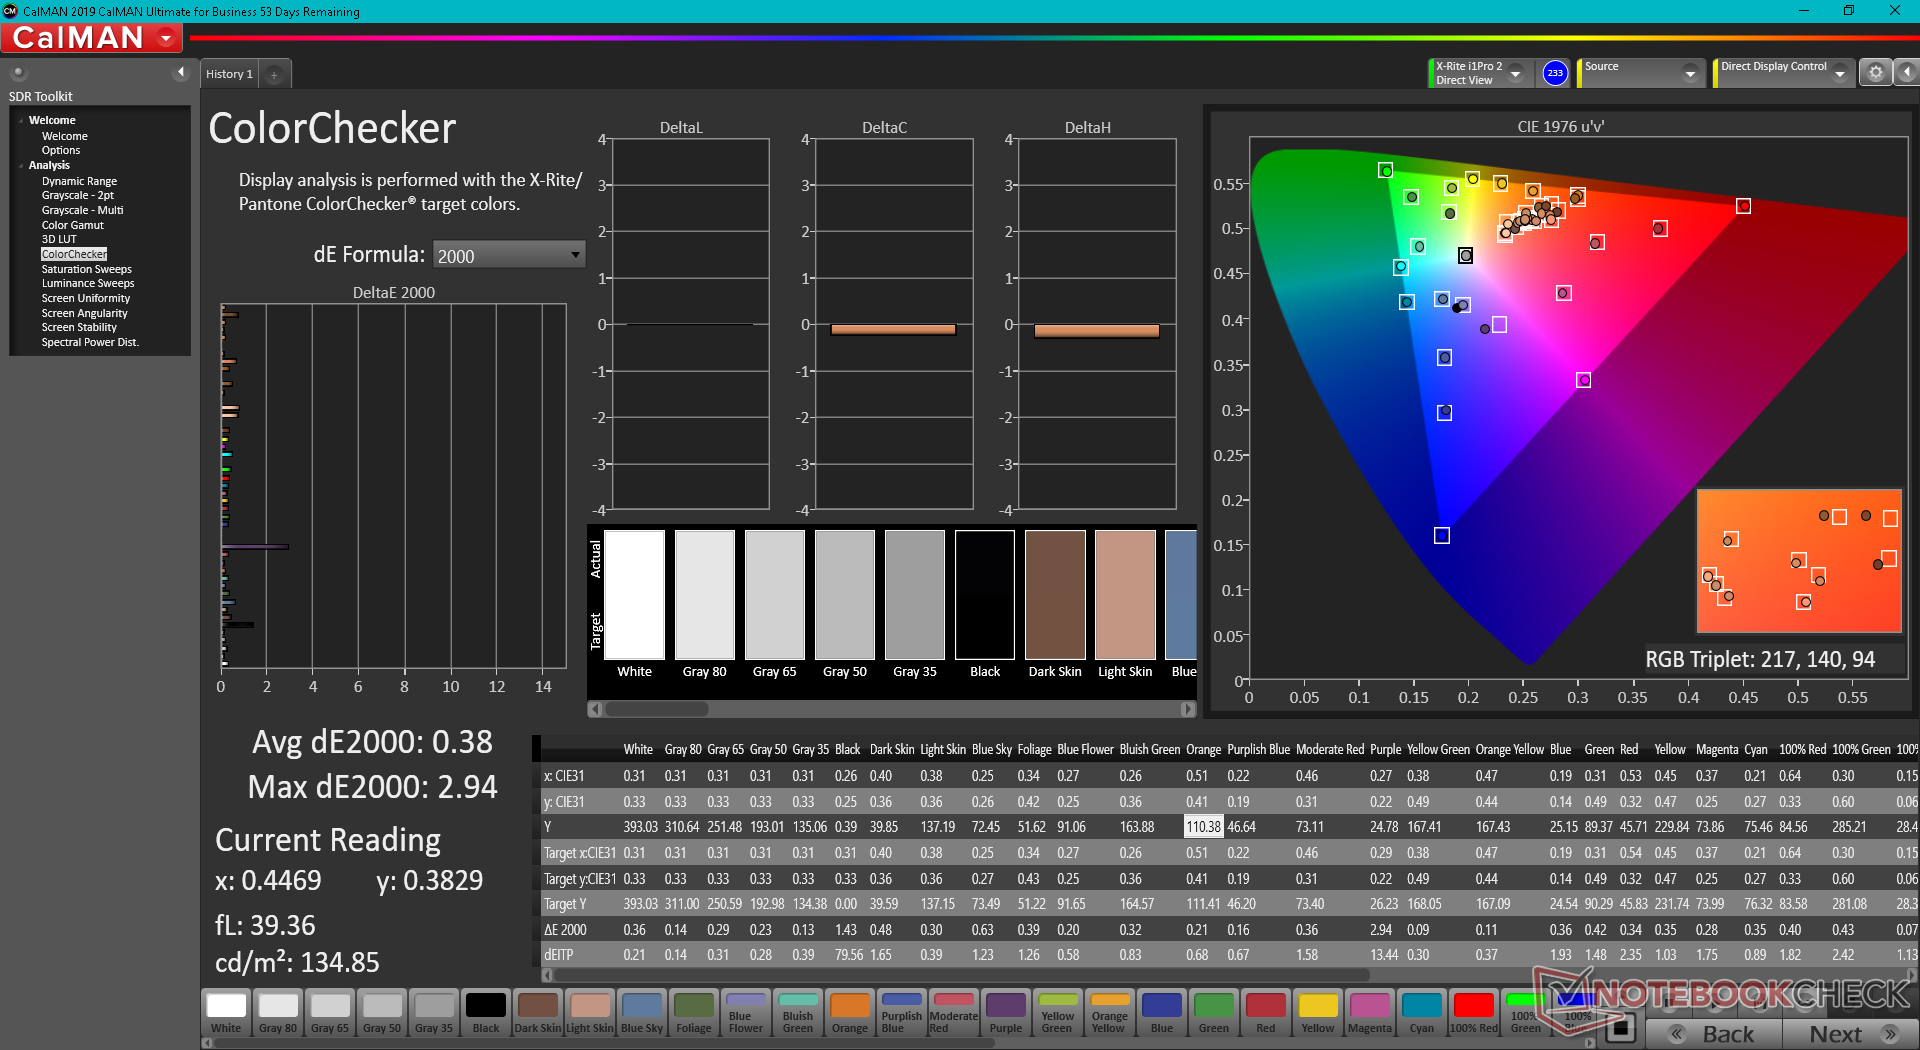
ΔE ColorChecker Calman: 1.46 | ∀{0.5-29.43 Ø4.71}
calibrated: 0.38
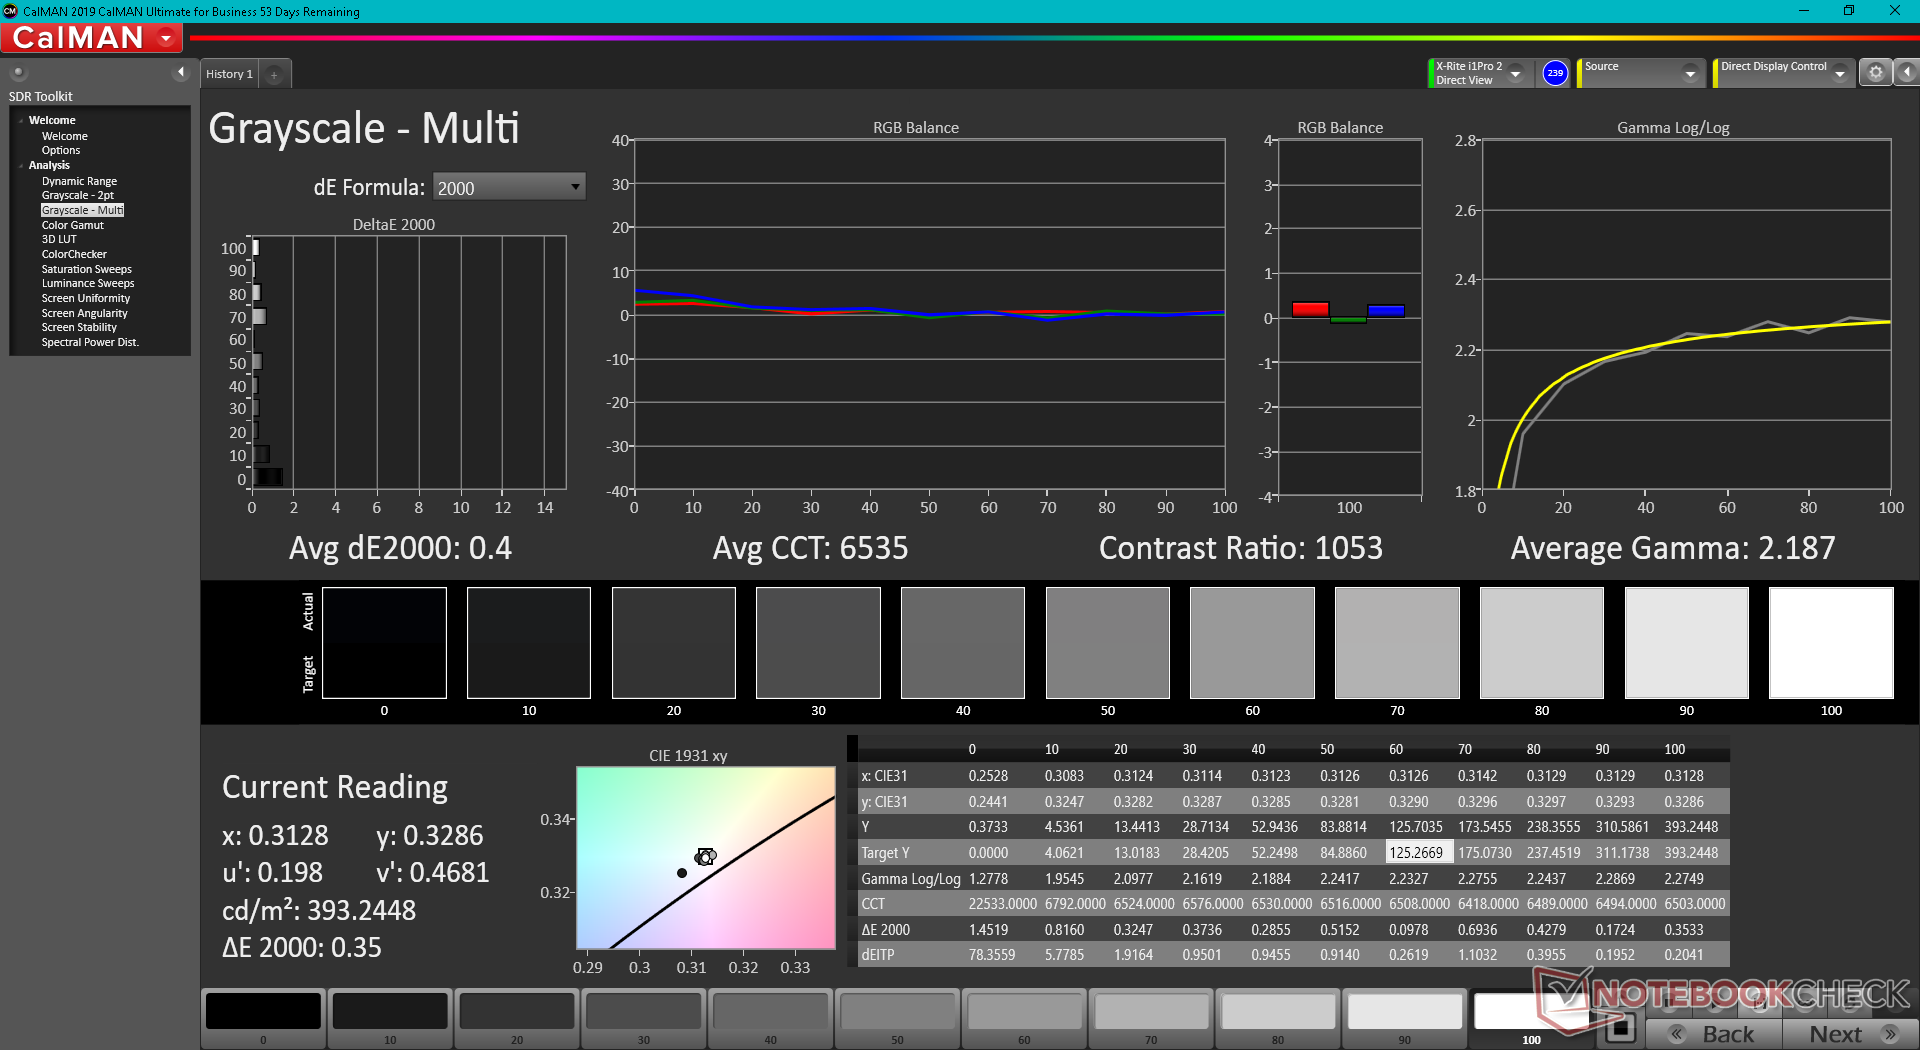
ΔE Greyscale Calman: 2.5 | ∀{0.09-98 Ø4.96}
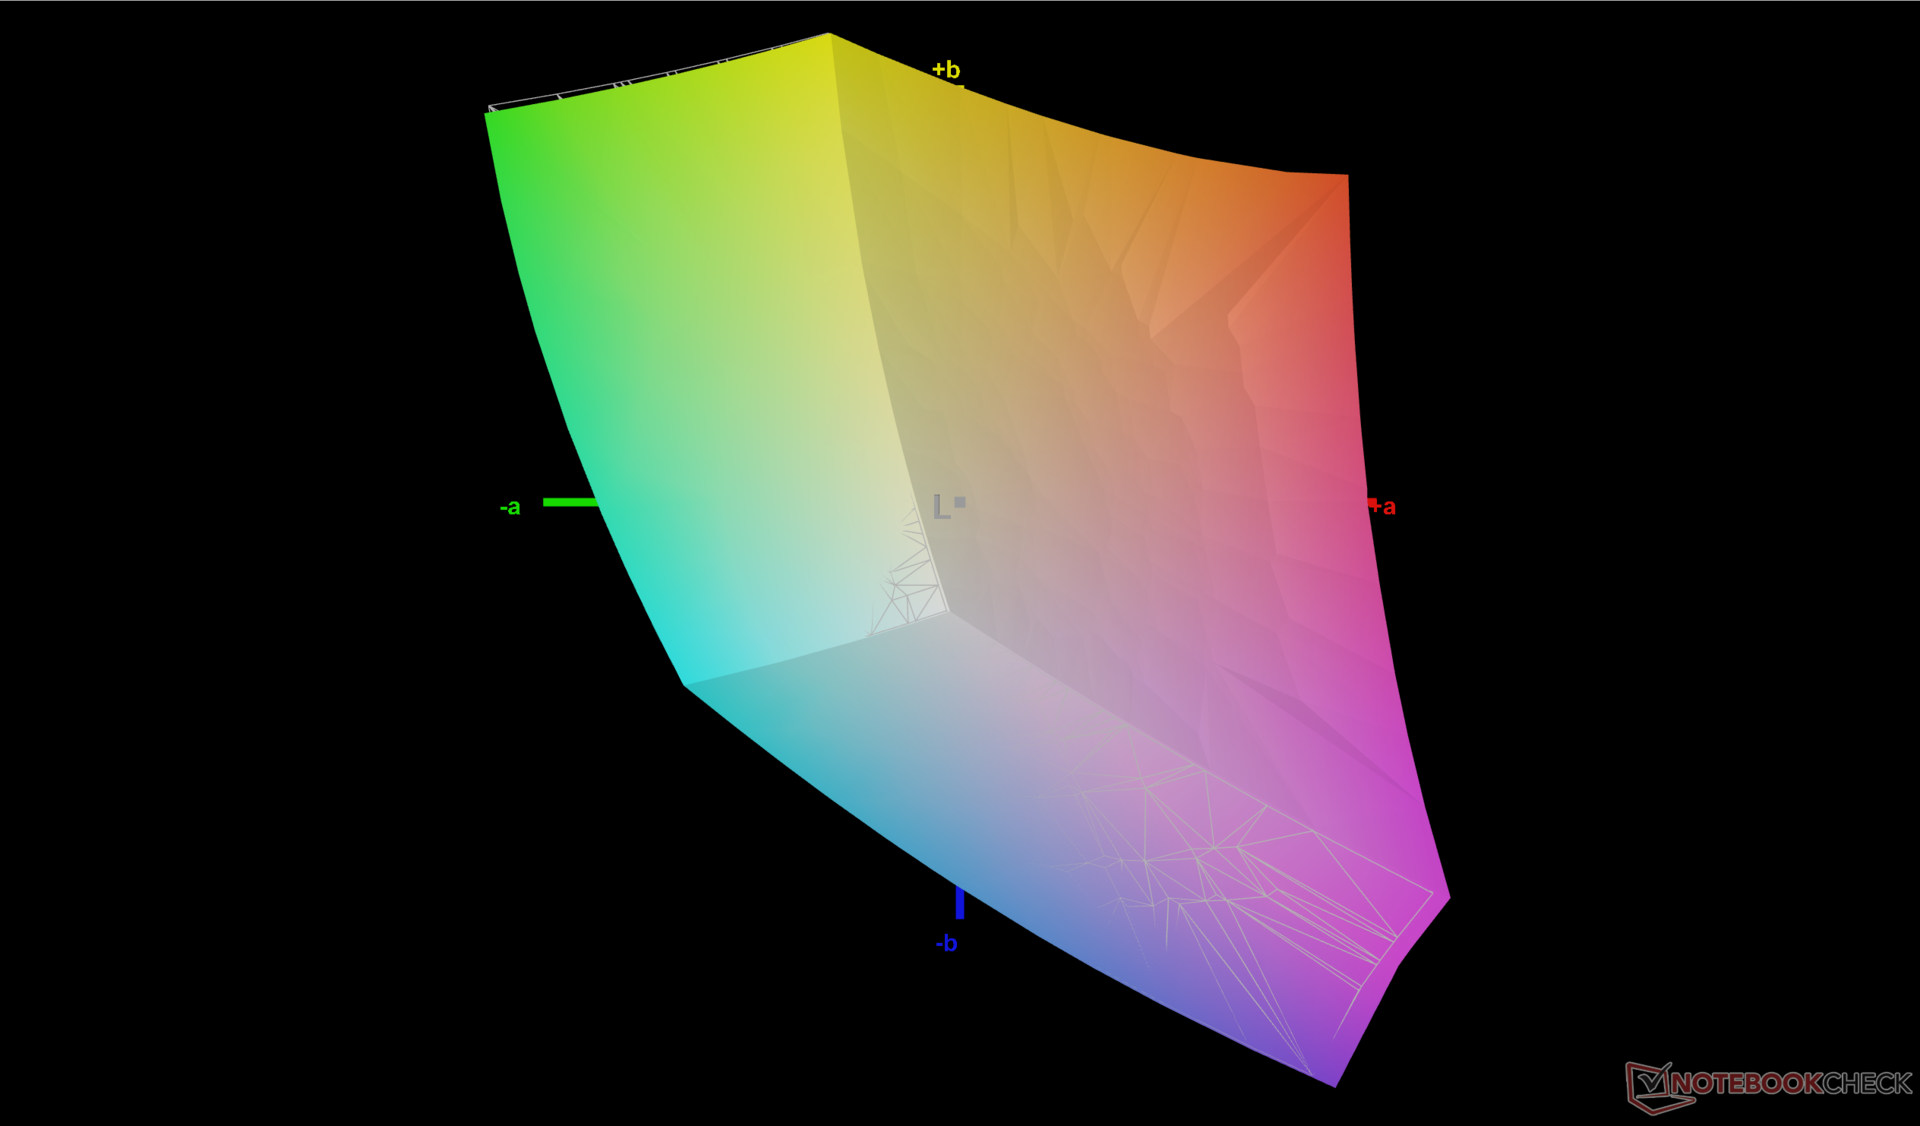
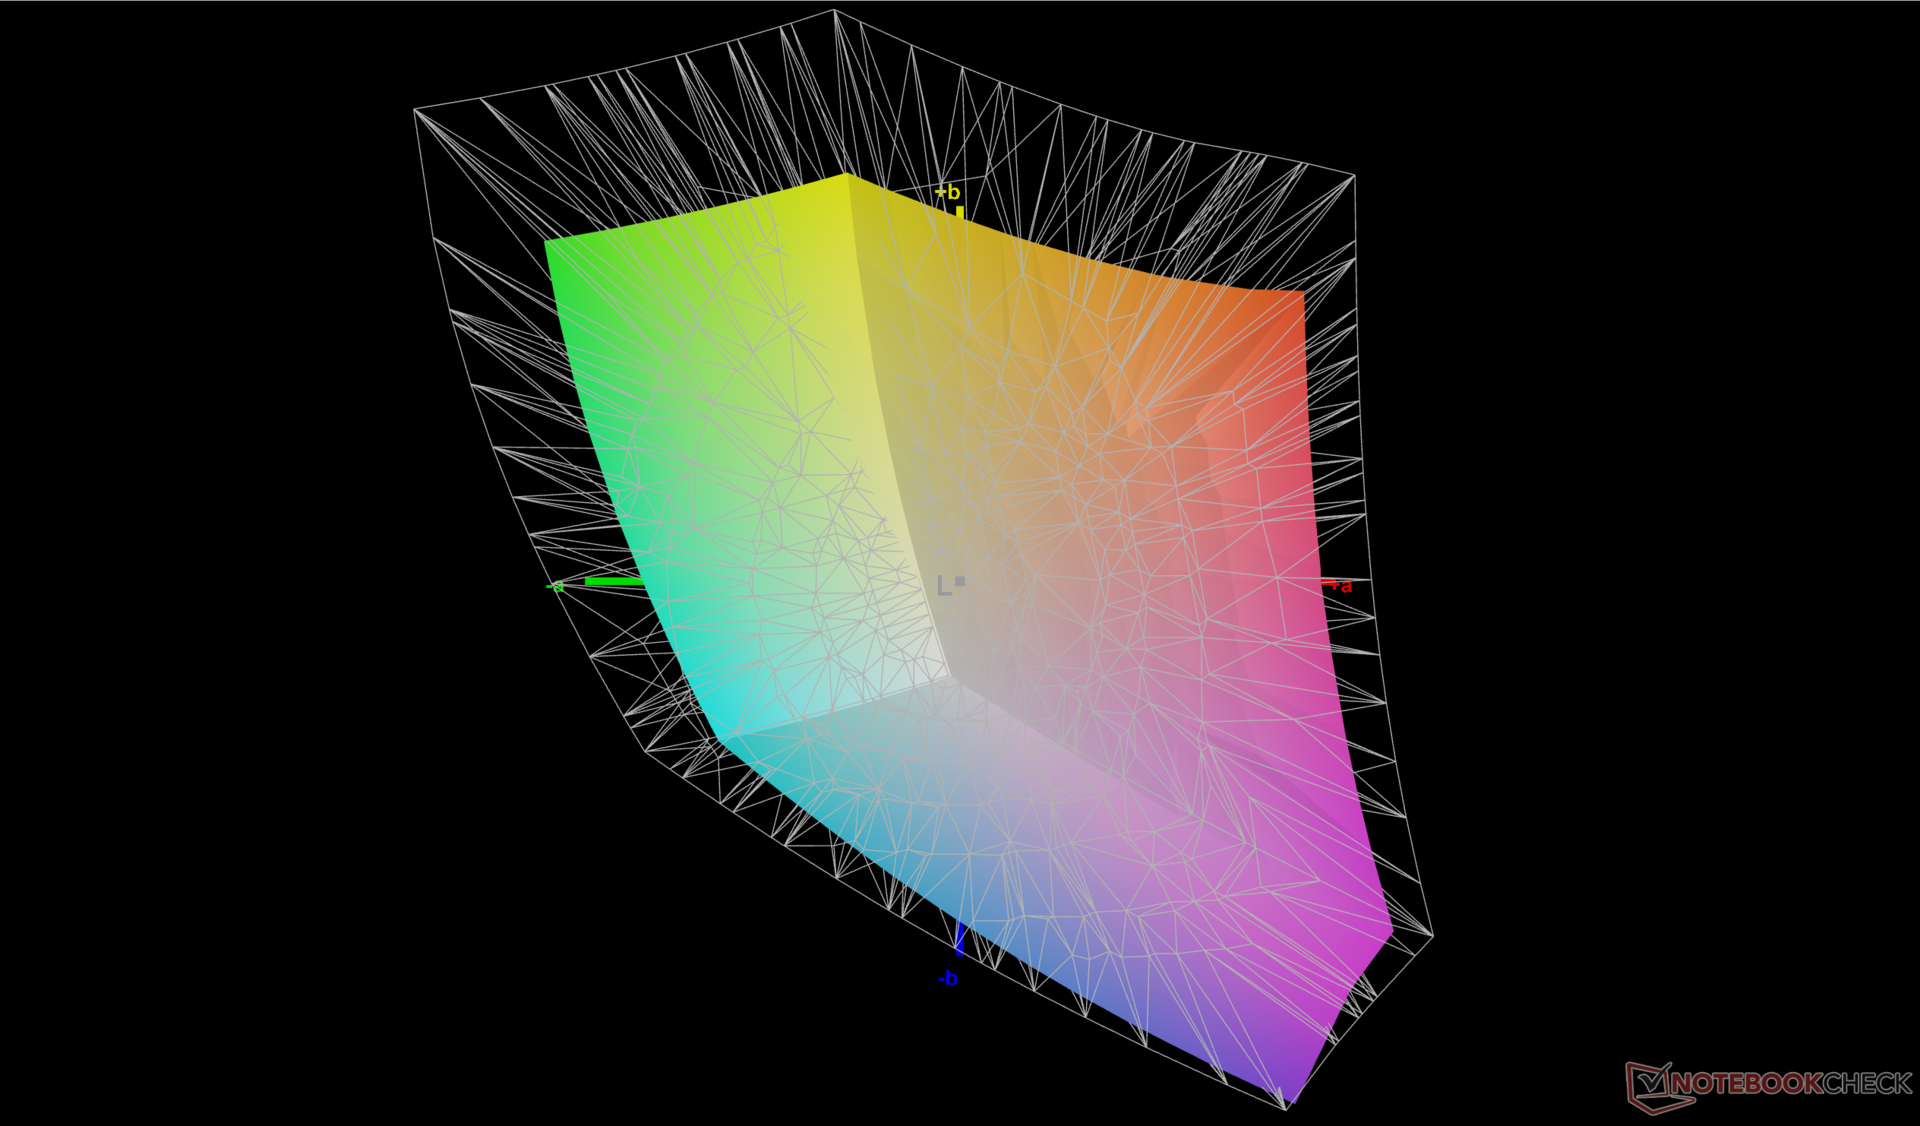
69.8% AdobeRGB 1998 (Argyll 3D)
99.7% sRGB (Argyll 3D)
69.1% Display P3 (Argyll 3D)
Gamma: 2.17
CCT: 6614 K
| Uniwell Technology GM7AG8N Liquid Cooling Box BOE NE170QDM-NZ1, IPS, 2560x1600, 17" | MSI Titan GT77 12UHS Sharp SHP1544 LQ173M1JW08, IPS-Level, 1920x1080, 17.3" | Aorus 17X XES Sharp SHP1563, IPS, 1920x1080, 17.3" | Razer Blade 17 Early 2022 AU Optronics B173ZAN06.9, IPS, 3840x2160, 17.3" | MSI Stealth GS77 12UHS-083US BOE NE173QHM-NZ1, IPS, 2560x1440, 17.3" | Asus ROG Zephyrus S17 GX703HSD BOE099D (BOE CQ NE173QHM-NY3), IPS, 2560x1440, 17.3" | |
|---|---|---|---|---|---|---|
| Display | 2% | 1% | 23% | 21% | 19% | |
| Display P3 Coverage (%) | 69.1 | 70.8 2% | 70.1 1% | 99.4 44% | 96.2 39% | 94.2 36% |
| sRGB Coverage (%) | 99.7 | 98.9 -1% | 99.9 0% | 100 0% | 99.7 0% | 98.7 -1% |
| AdobeRGB 1998 Coverage (%) | 69.8 | 73 5% | 71.9 3% | 87.3 25% | 85.8 23% | 84.4 21% |
| Response Times | 63% | 59% | 44% | -31% | 43% | |
| Response Time Grey 50% / Grey 80% * (ms) | 12.8 ? | 3.03 ? 76% | 3.4 ? 73% | 7.5 ? 41% | 17.6 ? -38% | 4.8 63% |
| Response Time Black / White * (ms) | 10.4 ? | 5.28 ? 49% | 5.8 ? 44% | 5.6 ? 46% | 12.8 ? -23% | 8 23% |
| PWM Frequency (Hz) | ||||||
| Screen | -55% | -74% | 11% | -47% | -62% | |
| Brightness middle (cd/m²) | 392.5 | 280 -29% | 278 -29% | 503 28% | 334.8 -15% | 322 -18% |
| Brightness (cd/m²) | 392 | 275 -30% | 273 -30% | 486 24% | 305 -22% | 288 -27% |
| Brightness Distribution (%) | 91 | 79 -13% | 79 -13% | 84 -8% | 79 -13% | 72 -21% |
| Black Level * (cd/m²) | 0.45 | 0.4 11% | 0.26 42% | 0.44 2% | 0.34 24% | 0.3 33% |
| Contrast (:1) | 872 | 700 -20% | 1069 23% | 1143 31% | 985 13% | 1073 23% |
| Colorchecker dE 2000 * | 1.46 | 2.1 -44% | 3.96 -171% | 1.08 26% | 4.1 -181% | 3.05 -109% |
| Colorchecker dE 2000 max. * | 4.62 | 5.83 -26% | 10.78 -133% | 4.54 2% | 7.28 -58% | 5.23 -13% |
| Colorchecker dE 2000 calibrated * | 0.38 | 1.58 -316% | 1.07 -182% | 0.6 -58% | 1.92 -405% | |
| Greyscale dE 2000 * | 2.5 | 3.3 -32% | 6.8 -172% | 1.3 48% | 5.6 -124% | 3.11 -24% |
| Gamma | 2.17 101% | 2.13 103% | 2.224 99% | 2.151 102% | 2.16 102% | 2.13 103% |
| CCT | 6614 98% | 7060 92% | 7651 85% | 6541 99% | 6314 103% | 6553 99% |
| Color Space (Percent of AdobeRGB 1998) (%) | 84 | |||||
| Color Space (Percent of sRGB) (%) | 99 | |||||
| Média Total (Programa/Configurações) | 3% /
-26% | -5% /
-39% | 26% /
18% | -19% /
-29% | 0% /
-30% |
* ... menor é melhor
A exibição já está bem calibrada, como mostram os resultados do nosso CalMAN abaixo. Tentar calibrá-lo ainda mais com nosso colorímetro X-Rite melhoraria os valores médios de escala de cinza e DeltaE de cor apenas marginalmente para 0,4 e 0,38, respectivamente.

Exibir tempos de resposta
| ↔ Tempo de resposta preto para branco | ||
|---|---|---|
| 10.4 ms ... ascensão ↗ e queda ↘ combinadas | ↗ 6 ms ascensão | 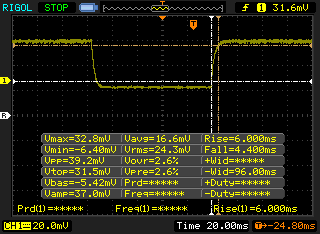 |
| ↘ 4.4 ms queda | ||
| A tela mostra boas taxas de resposta em nossos testes, mas pode ser muito lenta para jogadores competitivos. Em comparação, todos os dispositivos testados variam de 0.1 (mínimo) a 240 (máximo) ms. » 28 % de todos os dispositivos são melhores. Isso significa que o tempo de resposta medido é melhor que a média de todos os dispositivos testados (19.8 ms). | ||
| ↔ Tempo de resposta 50% cinza a 80% cinza | ||
| 12.8 ms ... ascensão ↗ e queda ↘ combinadas | ↗ 6 ms ascensão | 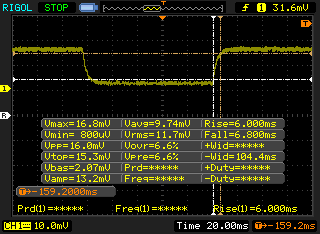 |
| ↘ 6.8 ms queda | ||
| A tela mostra boas taxas de resposta em nossos testes, mas pode ser muito lenta para jogadores competitivos. Em comparação, todos os dispositivos testados variam de 0.165 (mínimo) a 636 (máximo) ms. » 26 % de todos os dispositivos são melhores. Isso significa que o tempo de resposta medido é melhor que a média de todos os dispositivos testados (31 ms). | ||
Cintilação da tela / PWM (modulação por largura de pulso)
| Tela tremeluzindo / PWM não detectado | 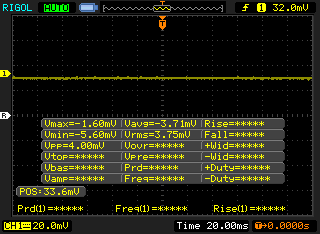 | ||
[pwm_comparison] Em comparação: 52 % de todos os dispositivos testados não usam PWM para escurecer a tela. Se PWM foi detectado, uma média de 7754 (mínimo: 5 - máximo: 343500) Hz foi medida. | |||
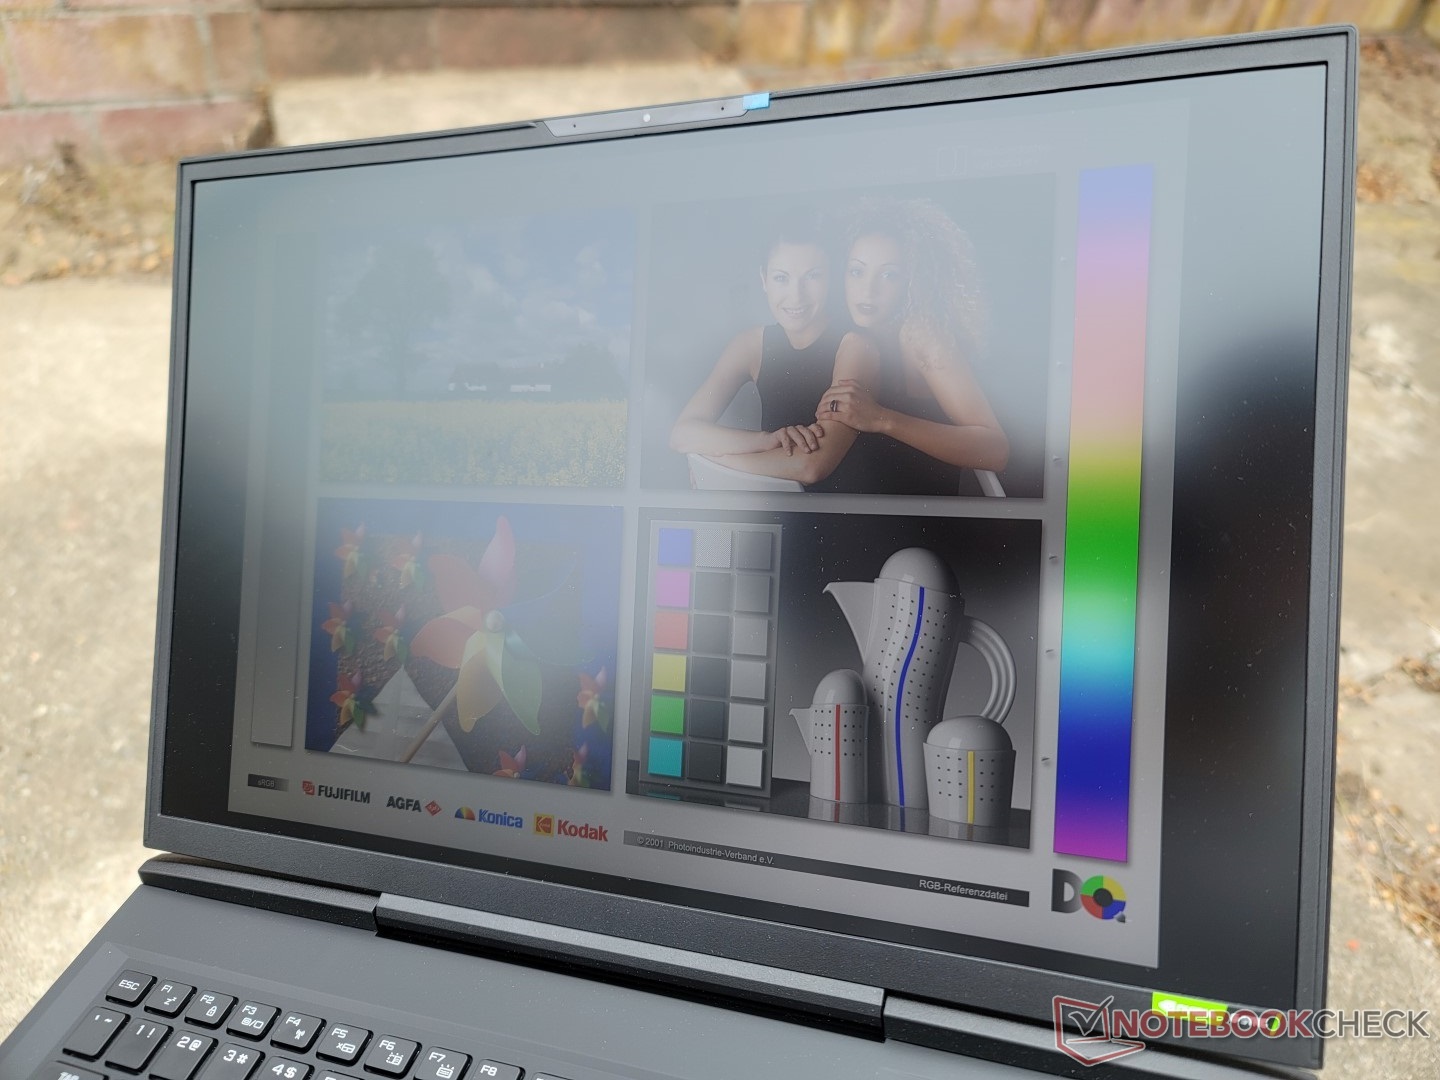
A visibilidade ao ar livre é decente se sob a sombra. A retroiluminação de 400-nit é mais brilhante do que na maioria dos outros laptops de jogos como o Aorus 17X ou Asus Zephyrus S17, onde 300 lêndeas são comuns.
Desempenho - Desengelado
Condições de teste
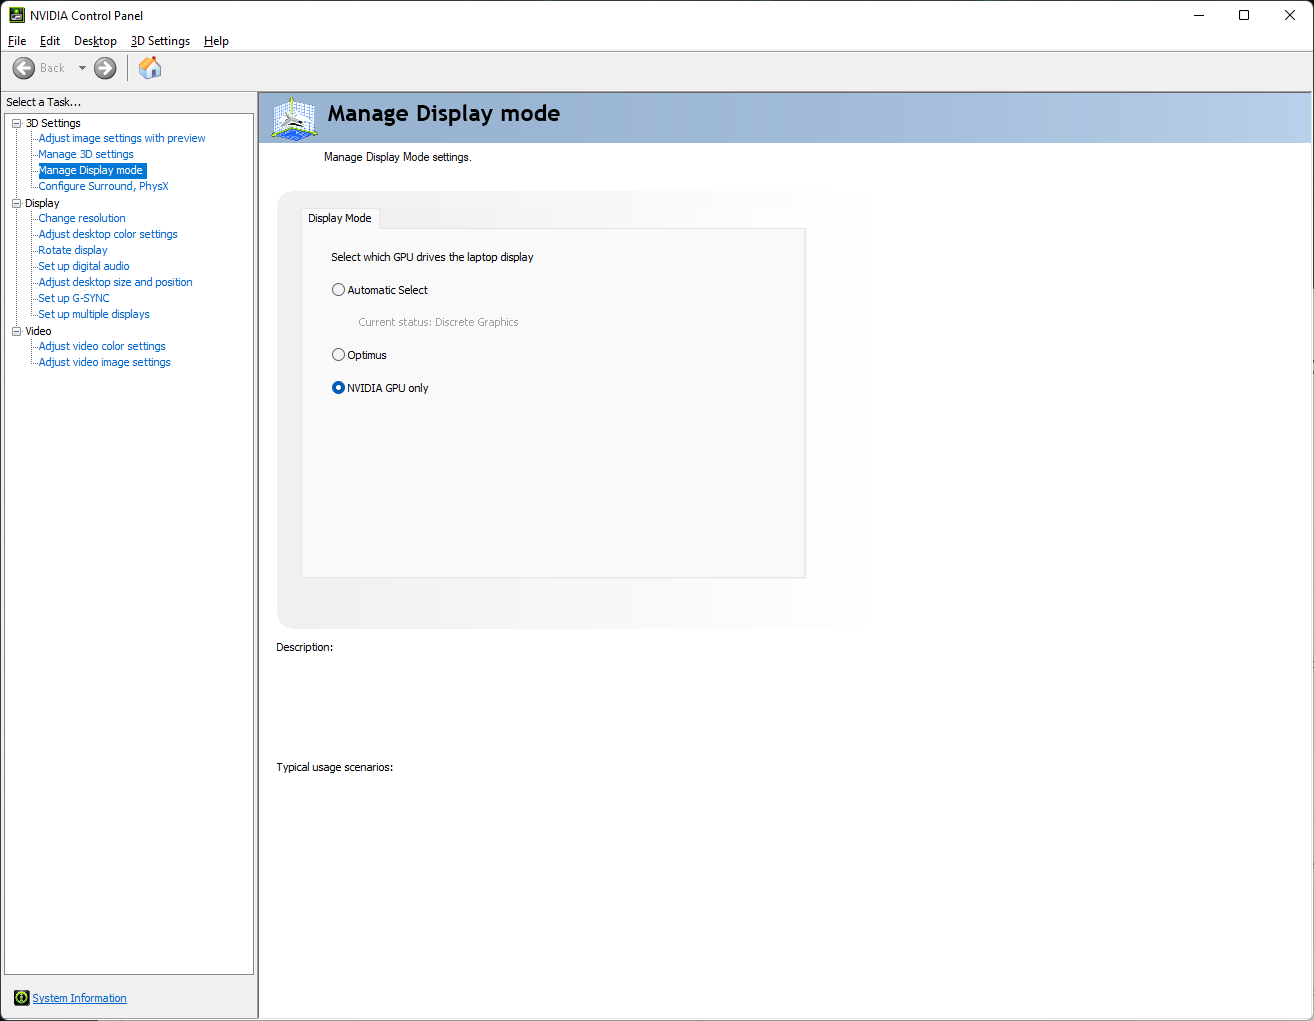
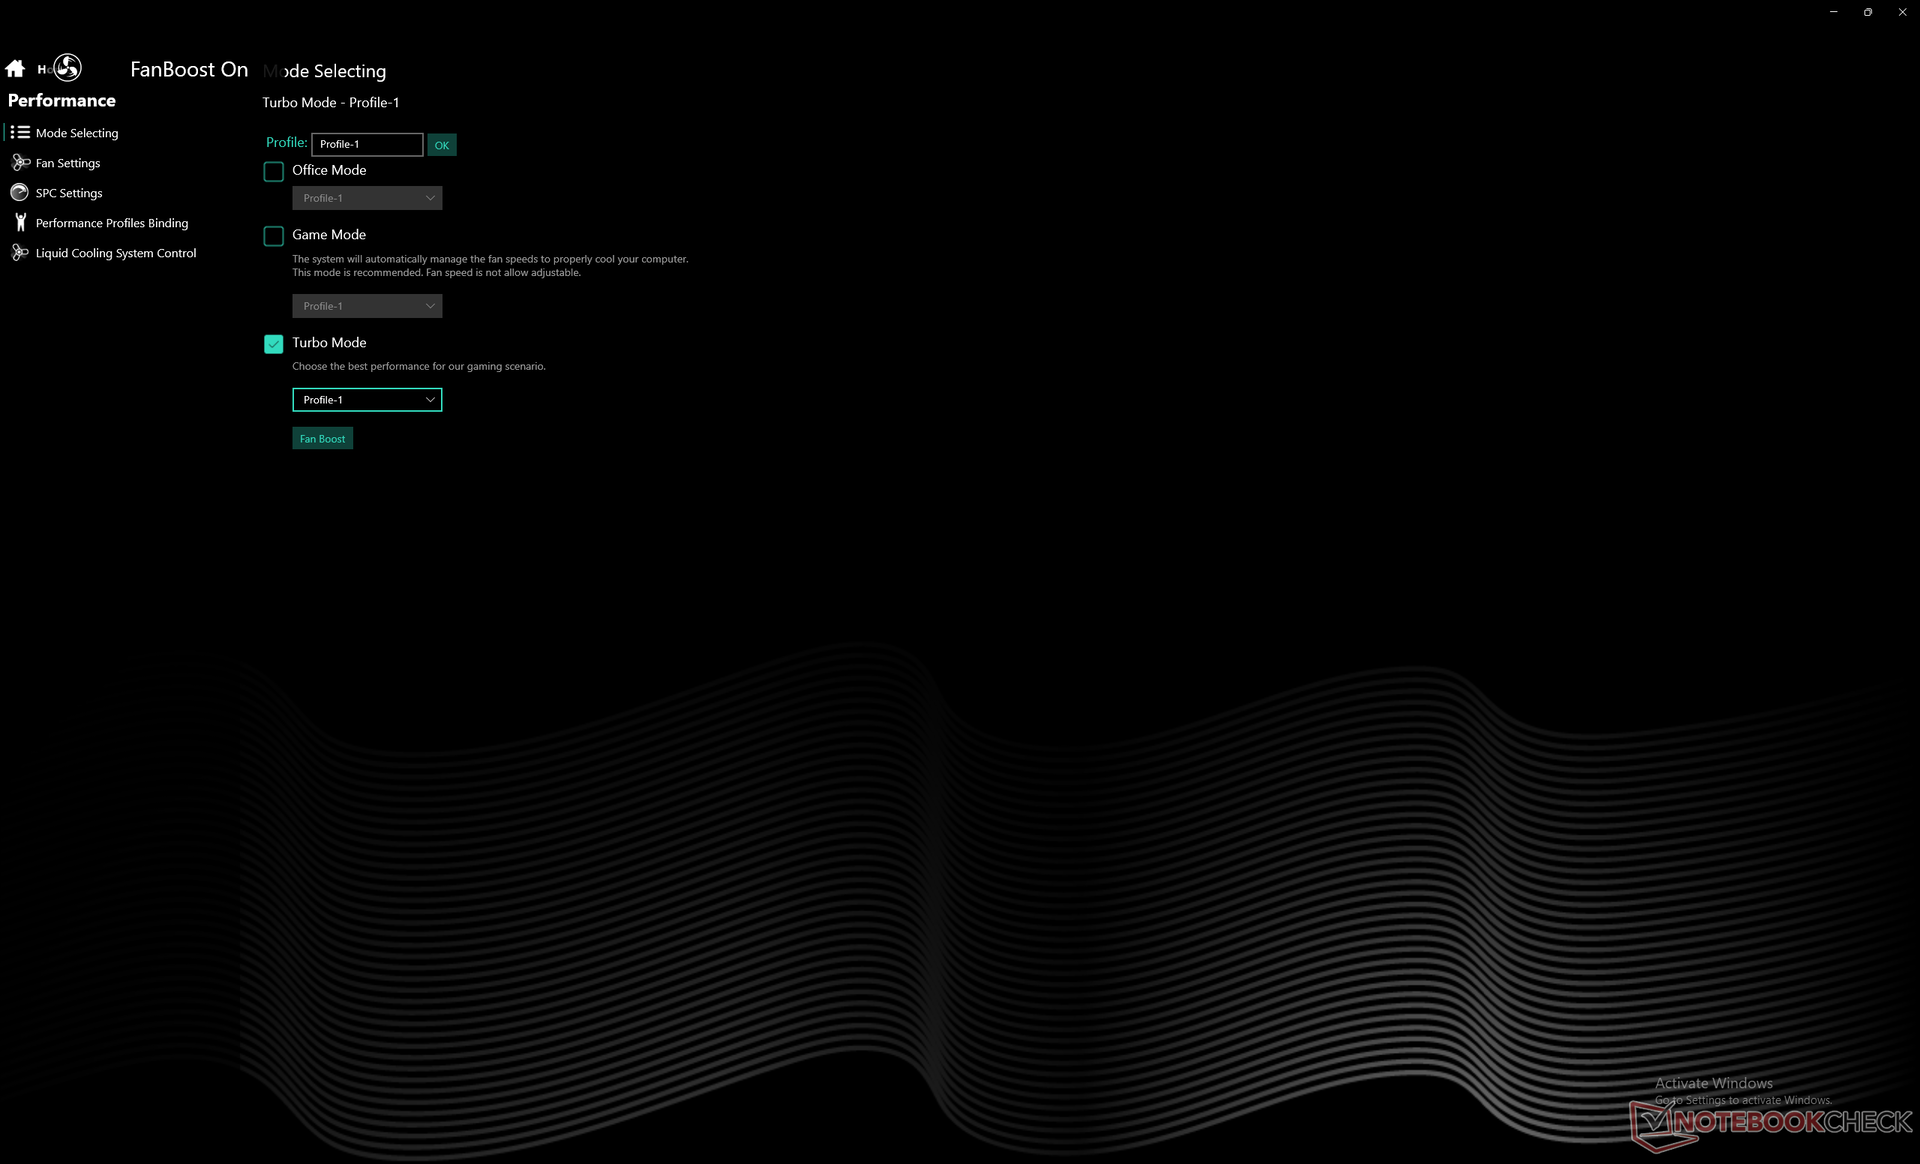
Salvo indicação em contrário, todos os testes e referências abaixo foram realizados com a caixa de resfriamento externa conectada e ativa. Também nos certificamos de configurar o Windows para desempenho, desativar o Optimus a favor do MUX e configurar o software do Centro de Controle para "Fan Boost".
A caixa de resfriamento tem três ajustes de nível de ruído: Mais silenciosa, silenciosa e balanceada. A nomenclatura não engana ninguém, no entanto, pois estas três configurações podem ser traduzidas para Baixo, Médio e Mais Alto. Definimos nossa unidade de caixa de resfriamento como "Balanceada" para fins de teste. Tenha em mente que a caixa de resfriamento não funcionará com a energia da bateria.
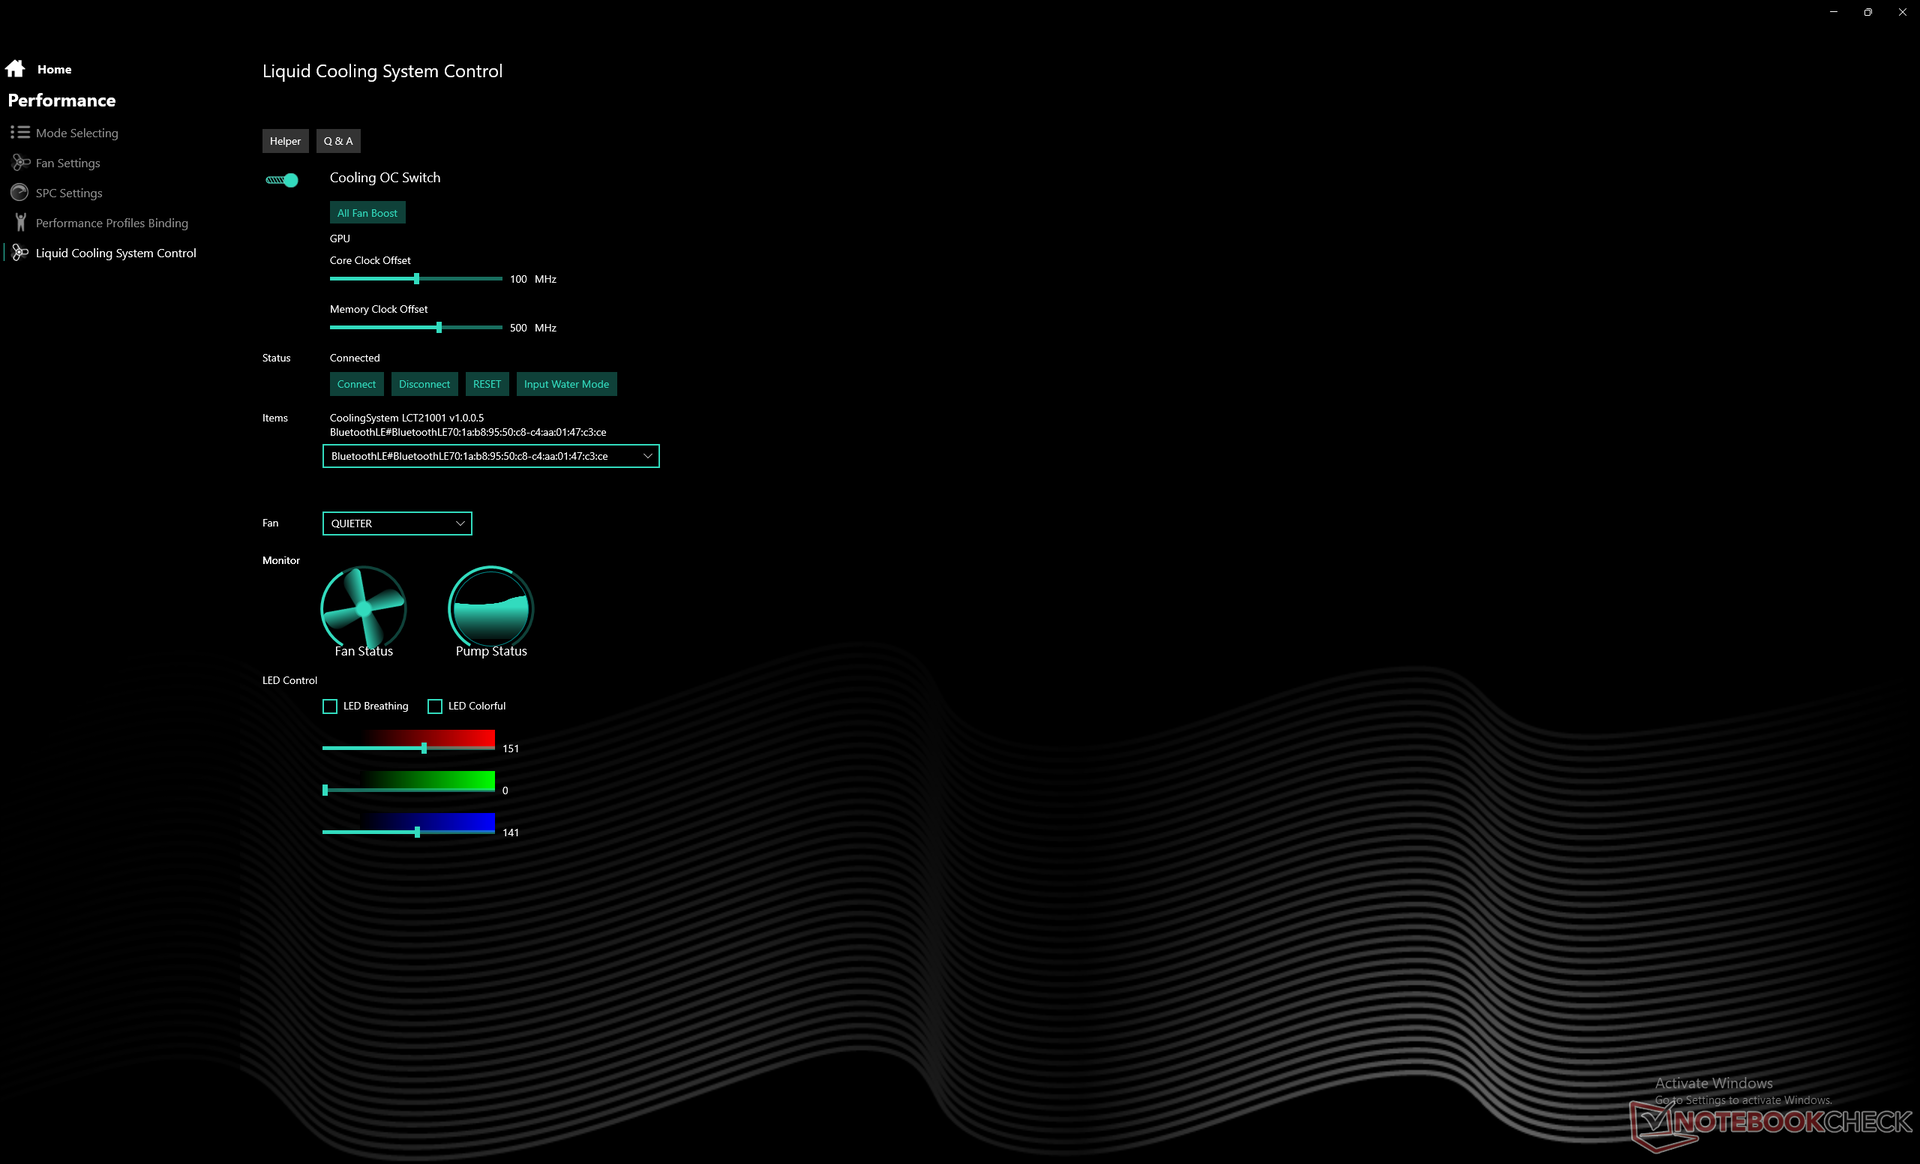
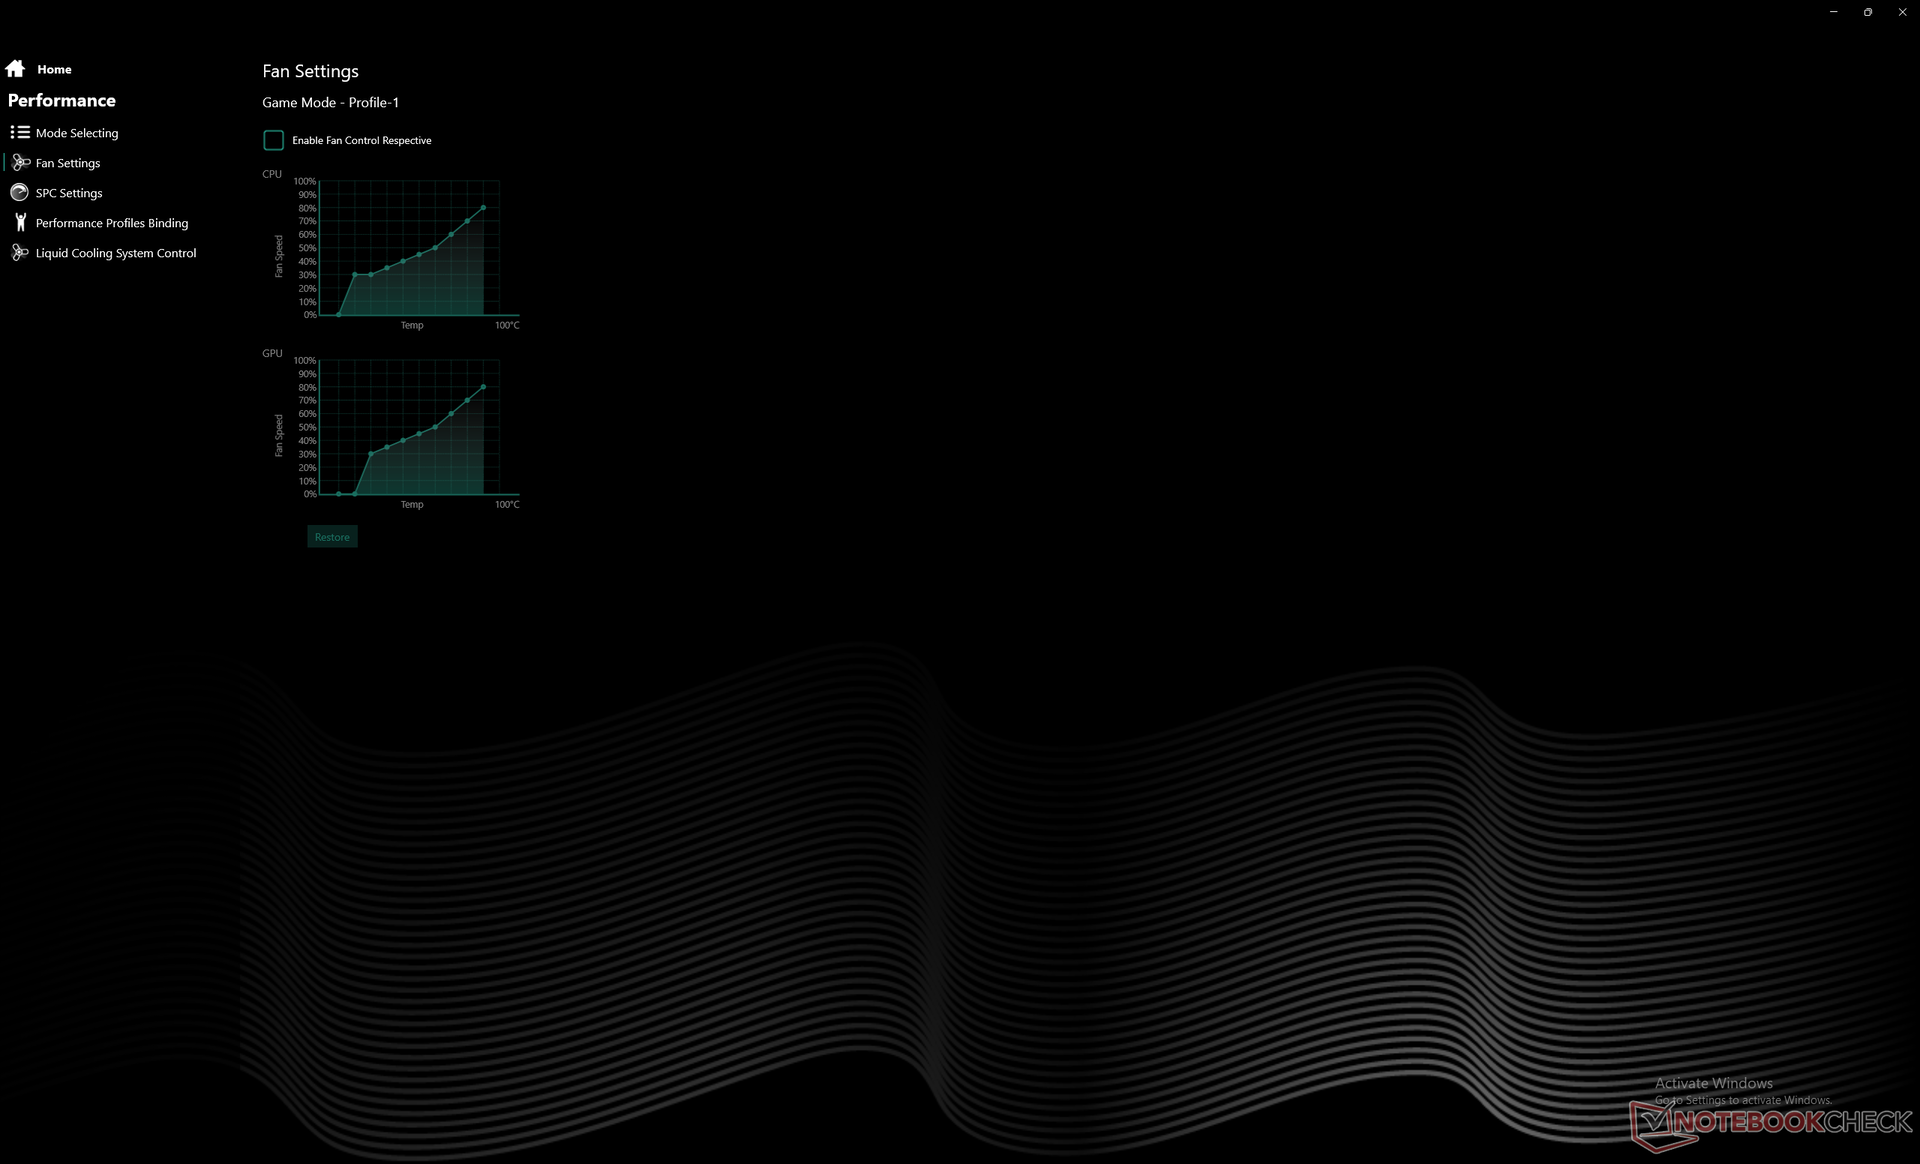
É altamente recomendável que os proprietários se familiarizem com o software do Centro de Controle pré-instalado, pois ele é o centro de controle para o laptop. Tudo, desde desempenho até iluminação, controles de ventiladores e overclocking, é controlado aqui como mostrado por algumas capturas de tela abaixo. Nossas configurações de overclock são as configurações padrão do laptop, conforme fornecido.
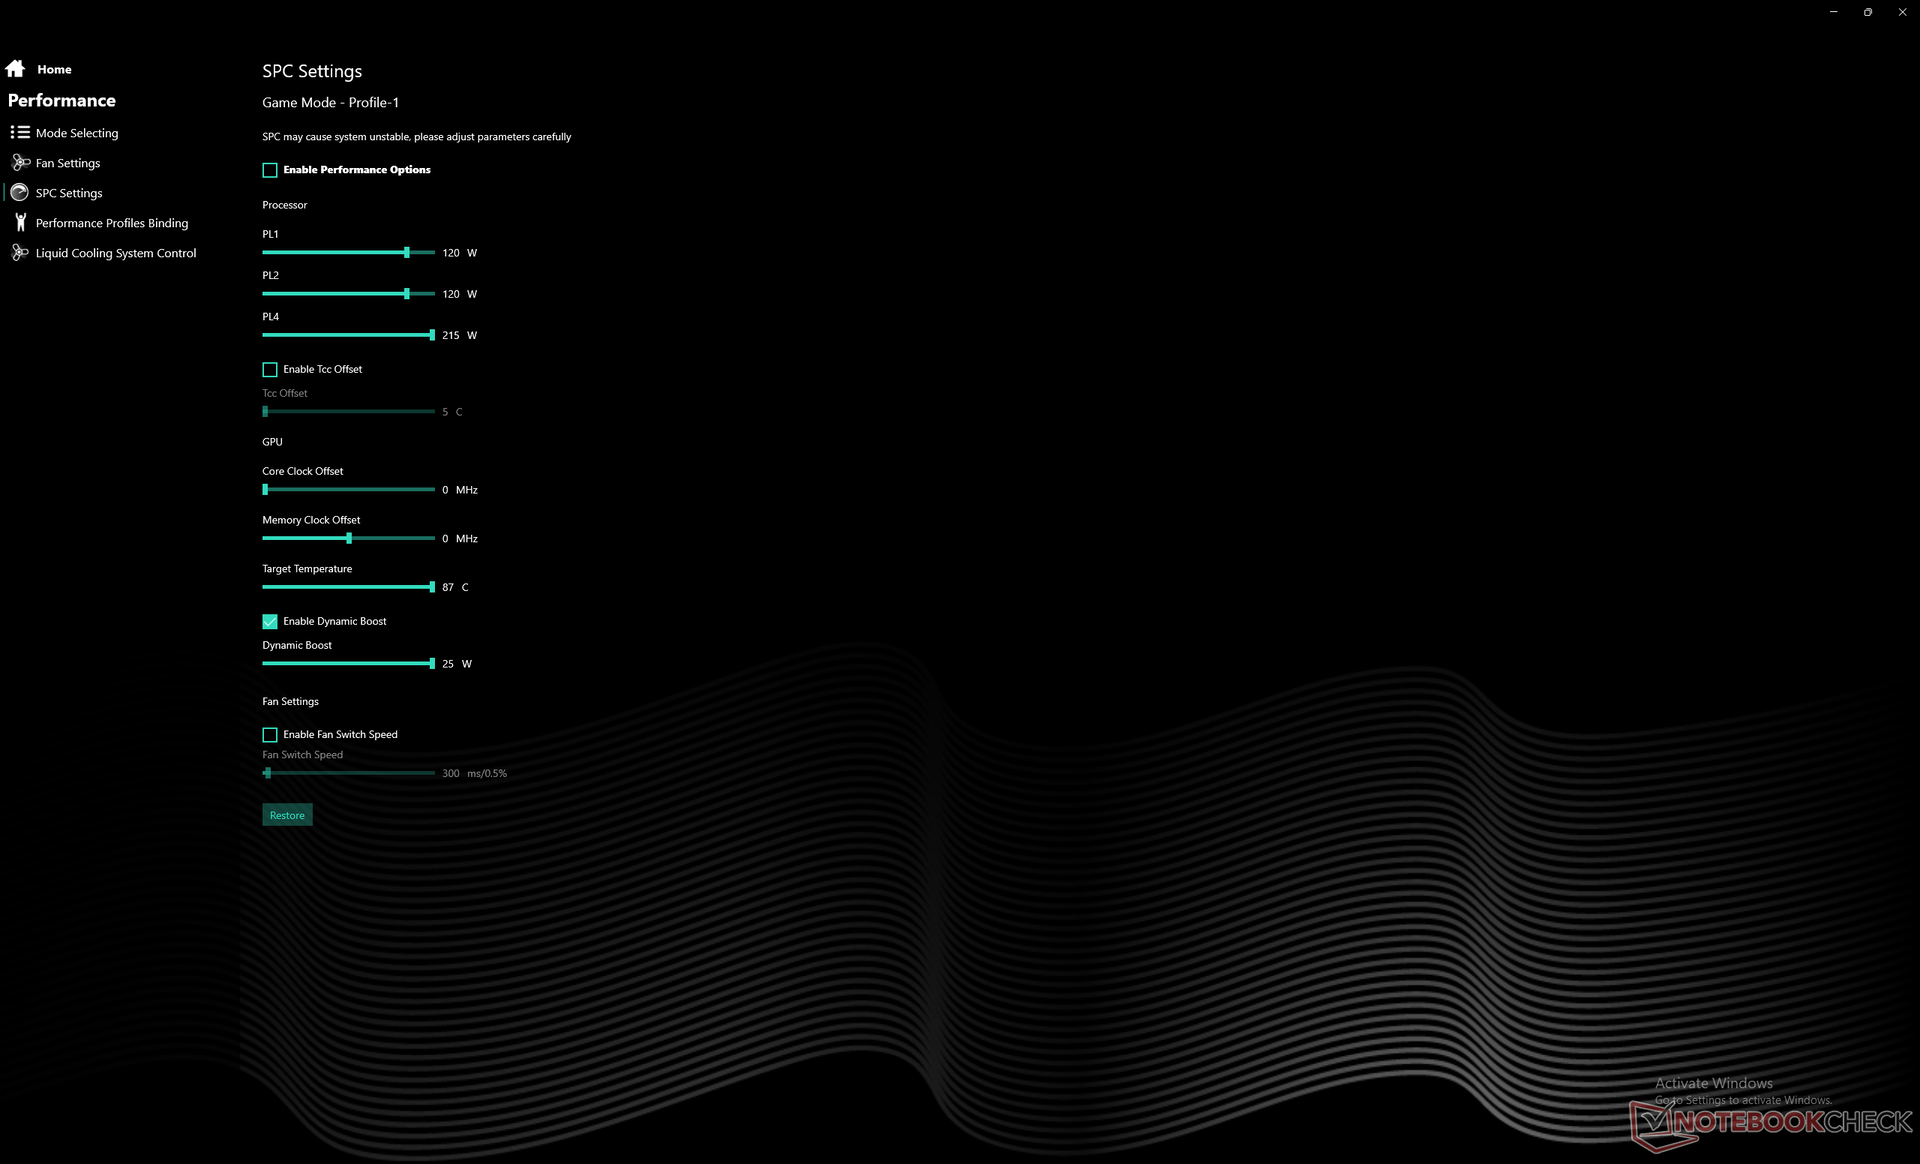
Processador
O desempenho da CPU é melhor do que o esperado, com resultados 15 a 25% mais rápidos do que a média do laptop em nosso banco de dados com o mesmo Core i9-12900H. Na verdade, este modelo Uniwell é o portátil Core i9-12900H mais rápido que testamos até agora.
A sustentabilidade do desempenho também é excelente, como seria de se esperar de qualquer laptop decente para jogos, especialmente de um que é resfriado a água.
Cinebench R15 Multi Loop
Cinebench R20: CPU (Multi Core) | CPU (Single Core)
Cinebench R23: Multi Core | Single Core
Cinebench R15: CPU Multi 64Bit | CPU Single 64Bit
Blender: v2.79 BMW27 CPU
7-Zip 18.03: 7z b 4 | 7z b 4 -mmt1
Geekbench 5.5: Multi-Core | Single-Core
HWBOT x265 Benchmark v2.2: 4k Preset
LibreOffice : 20 Documents To PDF
R Benchmark 2.5: Overall mean
* ... menor é melhor
AIDA64: FP32 Ray-Trace | FPU Julia | CPU SHA3 | CPU Queen | FPU SinJulia | FPU Mandel | CPU AES | CPU ZLib | FP64 Ray-Trace | CPU PhotoWorxx
| Performance rating | |
| MSI Titan GT77 12UHS | |
| Uniwell Technology GM7AG8N Liquid Cooling Box | |
| Aorus 17X XES | |
| Média Intel Core i9-12900H | |
| MSI Stealth GS77 12UHS-083US | |
| Razer Blade 17 Early 2022 | |
| Asus ROG Zephyrus S17 GX703HSD -9! | |
| AIDA64 / FP32 Ray-Trace | |
| MSI Titan GT77 12UHS | |
| Uniwell Technology GM7AG8N Liquid Cooling Box | |
| Aorus 17X XES | |
| Média Intel Core i9-12900H (4074 - 18289, n=29) | |
| MSI Stealth GS77 12UHS-083US | |
| Razer Blade 17 Early 2022 | |
| AIDA64 / FPU Julia | |
| MSI Titan GT77 12UHS | |
| Uniwell Technology GM7AG8N Liquid Cooling Box | |
| Aorus 17X XES | |
| Média Intel Core i9-12900H (22307 - 93236, n=29) | |
| MSI Stealth GS77 12UHS-083US | |
| Razer Blade 17 Early 2022 | |
| AIDA64 / CPU SHA3 | |
| MSI Titan GT77 12UHS | |
| Uniwell Technology GM7AG8N Liquid Cooling Box | |
| Aorus 17X XES | |
| MSI Stealth GS77 12UHS-083US | |
| Média Intel Core i9-12900H (1378 - 4215, n=29) | |
| Razer Blade 17 Early 2022 | |
| AIDA64 / CPU Queen | |
| Uniwell Technology GM7AG8N Liquid Cooling Box | |
| Aorus 17X XES | |
| MSI Titan GT77 12UHS | |
| Média Intel Core i9-12900H (78172 - 111241, n=28) | |
| MSI Stealth GS77 12UHS-083US | |
| Razer Blade 17 Early 2022 | |
| AIDA64 / FPU SinJulia | |
| MSI Titan GT77 12UHS | |
| Aorus 17X XES | |
| Uniwell Technology GM7AG8N Liquid Cooling Box | |
| MSI Stealth GS77 12UHS-083US | |
| Média Intel Core i9-12900H (5709 - 10410, n=29) | |
| Razer Blade 17 Early 2022 | |
| AIDA64 / FPU Mandel | |
| MSI Titan GT77 12UHS | |
| Uniwell Technology GM7AG8N Liquid Cooling Box | |
| Aorus 17X XES | |
| Média Intel Core i9-12900H (11257 - 45581, n=29) | |
| MSI Stealth GS77 12UHS-083US | |
| Razer Blade 17 Early 2022 | |
| AIDA64 / CPU AES | |
| MSI Titan GT77 12UHS | |
| Aorus 17X XES | |
| MSI Stealth GS77 12UHS-083US | |
| Uniwell Technology GM7AG8N Liquid Cooling Box | |
| Média Intel Core i9-12900H (31935 - 151546, n=29) | |
| Razer Blade 17 Early 2022 | |
| AIDA64 / CPU ZLib | |
| MSI Titan GT77 12UHS | |
| Uniwell Technology GM7AG8N Liquid Cooling Box | |
| MSI Stealth GS77 12UHS-083US | |
| Aorus 17X XES | |
| Média Intel Core i9-12900H (449 - 1193, n=29) | |
| Razer Blade 17 Early 2022 | |
| Asus ROG Zephyrus S17 GX703HSD | |
| AIDA64 / FP64 Ray-Trace | |
| MSI Titan GT77 12UHS | |
| Uniwell Technology GM7AG8N Liquid Cooling Box | |
| Aorus 17X XES | |
| Média Intel Core i9-12900H (2235 - 10511, n=29) | |
| MSI Stealth GS77 12UHS-083US | |
| Razer Blade 17 Early 2022 | |
| AIDA64 / CPU PhotoWorxx | |
| MSI Titan GT77 12UHS | |
| Aorus 17X XES | |
| MSI Stealth GS77 12UHS-083US | |
| Razer Blade 17 Early 2022 | |
| Média Intel Core i9-12900H (20960 - 48269, n=30) | |
| Uniwell Technology GM7AG8N Liquid Cooling Box | |
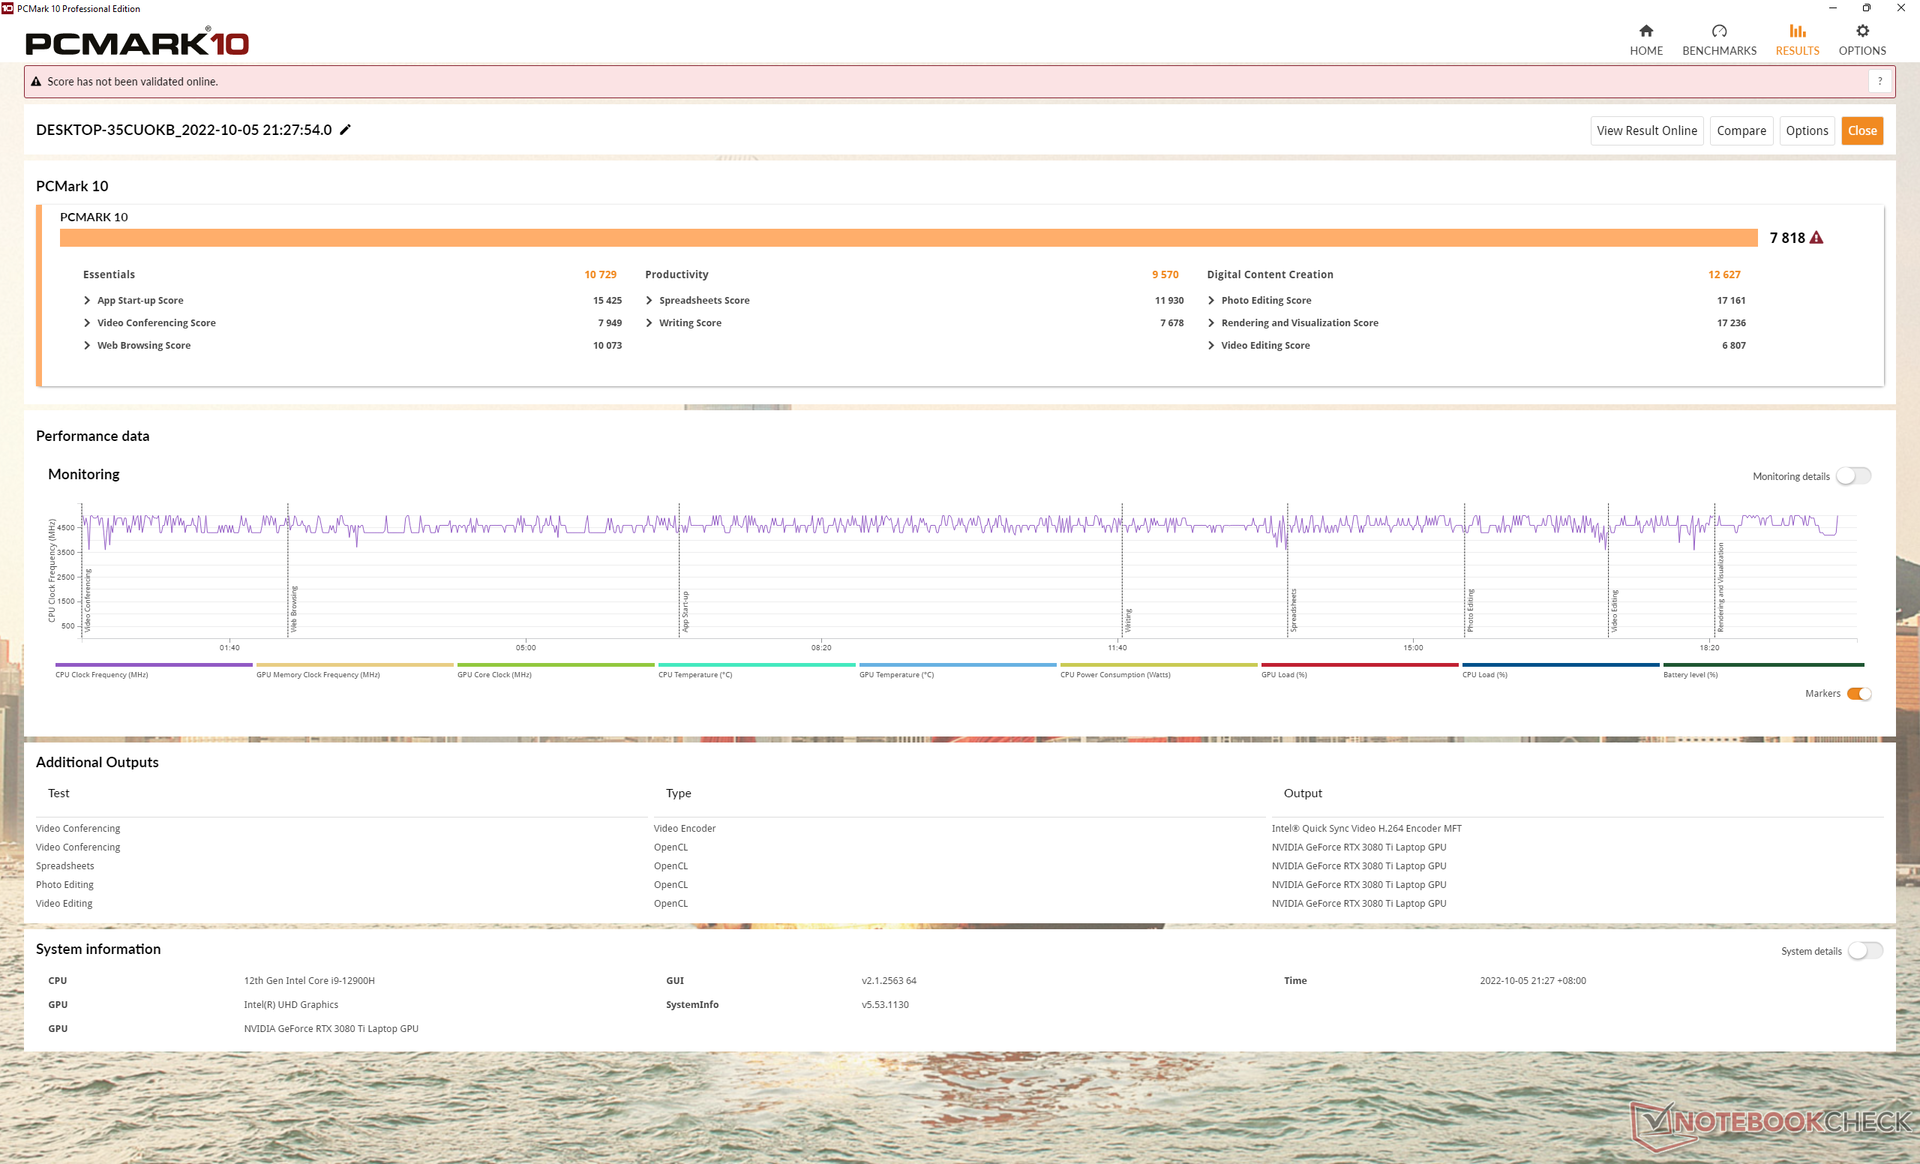
Desempenho do sistema
Os resultados do PCMark 10 são comparáveis a outros laptops com a mesma CPU e GPU, como oAlienware x15 R2 P111F ou Razer Blade 17 no início de 2022.
CrossMark: Overall | Productivity | Creativity | Responsiveness
| PCMark 10 / Score | |
| MSI Titan GT77 12UHS | |
| Aorus 17X XES | |
| Uniwell Technology GM7AG8N Liquid Cooling Box | |
| Média Intel Core i9-12900H, NVIDIA GeForce RTX 3080 Ti Laptop GPU (7139 - 8083, n=6) | |
| MSI Stealth GS77 12UHS-083US | |
| Asus ROG Zephyrus S17 GX703HSD | |
| Razer Blade 17 Early 2022 | |
| PCMark 10 / Essentials | |
| MSI Titan GT77 12UHS | |
| Média Intel Core i9-12900H, NVIDIA GeForce RTX 3080 Ti Laptop GPU (10254 - 11178, n=6) | |
| Uniwell Technology GM7AG8N Liquid Cooling Box | |
| Asus ROG Zephyrus S17 GX703HSD | |
| Aorus 17X XES | |
| MSI Stealth GS77 12UHS-083US | |
| Razer Blade 17 Early 2022 | |
| PCMark 10 / Productivity | |
| Aorus 17X XES | |
| MSI Titan GT77 12UHS | |
| Média Intel Core i9-12900H, NVIDIA GeForce RTX 3080 Ti Laptop GPU (9102 - 11186, n=6) | |
| Uniwell Technology GM7AG8N Liquid Cooling Box | |
| MSI Stealth GS77 12UHS-083US | |
| Asus ROG Zephyrus S17 GX703HSD | |
| Razer Blade 17 Early 2022 | |
| PCMark 10 / Digital Content Creation | |
| MSI Titan GT77 12UHS | |
| Uniwell Technology GM7AG8N Liquid Cooling Box | |
| Aorus 17X XES | |
| Média Intel Core i9-12900H, NVIDIA GeForce RTX 3080 Ti Laptop GPU (9847 - 12627, n=6) | |
| MSI Stealth GS77 12UHS-083US | |
| Razer Blade 17 Early 2022 | |
| Asus ROG Zephyrus S17 GX703HSD | |
| CrossMark / Overall | |
| Aorus 17X XES | |
| MSI Titan GT77 12UHS | |
| Média Intel Core i9-12900H, NVIDIA GeForce RTX 3080 Ti Laptop GPU (1696 - 1965, n=3) | |
| Razer Blade 17 Early 2022 | |
| Uniwell Technology GM7AG8N Liquid Cooling Box | |
| CrossMark / Productivity | |
| Aorus 17X XES | |
| MSI Titan GT77 12UHS | |
| Média Intel Core i9-12900H, NVIDIA GeForce RTX 3080 Ti Laptop GPU (1622 - 1870, n=3) | |
| Razer Blade 17 Early 2022 | |
| Uniwell Technology GM7AG8N Liquid Cooling Box | |
| CrossMark / Creativity | |
| Aorus 17X XES | |
| MSI Titan GT77 12UHS | |
| Média Intel Core i9-12900H, NVIDIA GeForce RTX 3080 Ti Laptop GPU (1855 - 2135, n=3) | |
| Razer Blade 17 Early 2022 | |
| Uniwell Technology GM7AG8N Liquid Cooling Box | |
| CrossMark / Responsiveness | |
| Aorus 17X XES | |
| MSI Titan GT77 12UHS | |
| Razer Blade 17 Early 2022 | |
| Média Intel Core i9-12900H, NVIDIA GeForce RTX 3080 Ti Laptop GPU (1483 - 1777, n=3) | |
| Uniwell Technology GM7AG8N Liquid Cooling Box | |
| PCMark 10 Score | 7818 pontos | |
Ajuda | ||
| AIDA64 / Memory Copy | |
| MSI Titan GT77 12UHS | |
| Aorus 17X XES | |
| MSI Stealth GS77 12UHS-083US | |
| Razer Blade 17 Early 2022 | |
| Média Intel Core i9-12900H (34438 - 74264, n=29) | |
| Uniwell Technology GM7AG8N Liquid Cooling Box | |
| AIDA64 / Memory Read | |
| Aorus 17X XES | |
| MSI Stealth GS77 12UHS-083US | |
| Razer Blade 17 Early 2022 | |
| MSI Titan GT77 12UHS | |
| Média Intel Core i9-12900H (36365 - 74642, n=29) | |
| Uniwell Technology GM7AG8N Liquid Cooling Box | |
| AIDA64 / Memory Write | |
| MSI Stealth GS77 12UHS-083US | |
| MSI Titan GT77 12UHS | |
| Aorus 17X XES | |
| Média Intel Core i9-12900H (32276 - 67858, n=29) | |
| Razer Blade 17 Early 2022 | |
| Uniwell Technology GM7AG8N Liquid Cooling Box | |
| AIDA64 / Memory Latency | |
| MSI Stealth GS77 12UHS-083US | |
| Uniwell Technology GM7AG8N Liquid Cooling Box | |
| MSI Titan GT77 12UHS | |
| Aorus 17X XES | |
| Média Intel Core i9-12900H (74.7 - 118.1, n=28) | |
| Asus ROG Zephyrus S17 GX703HSD | |
* ... menor é melhor
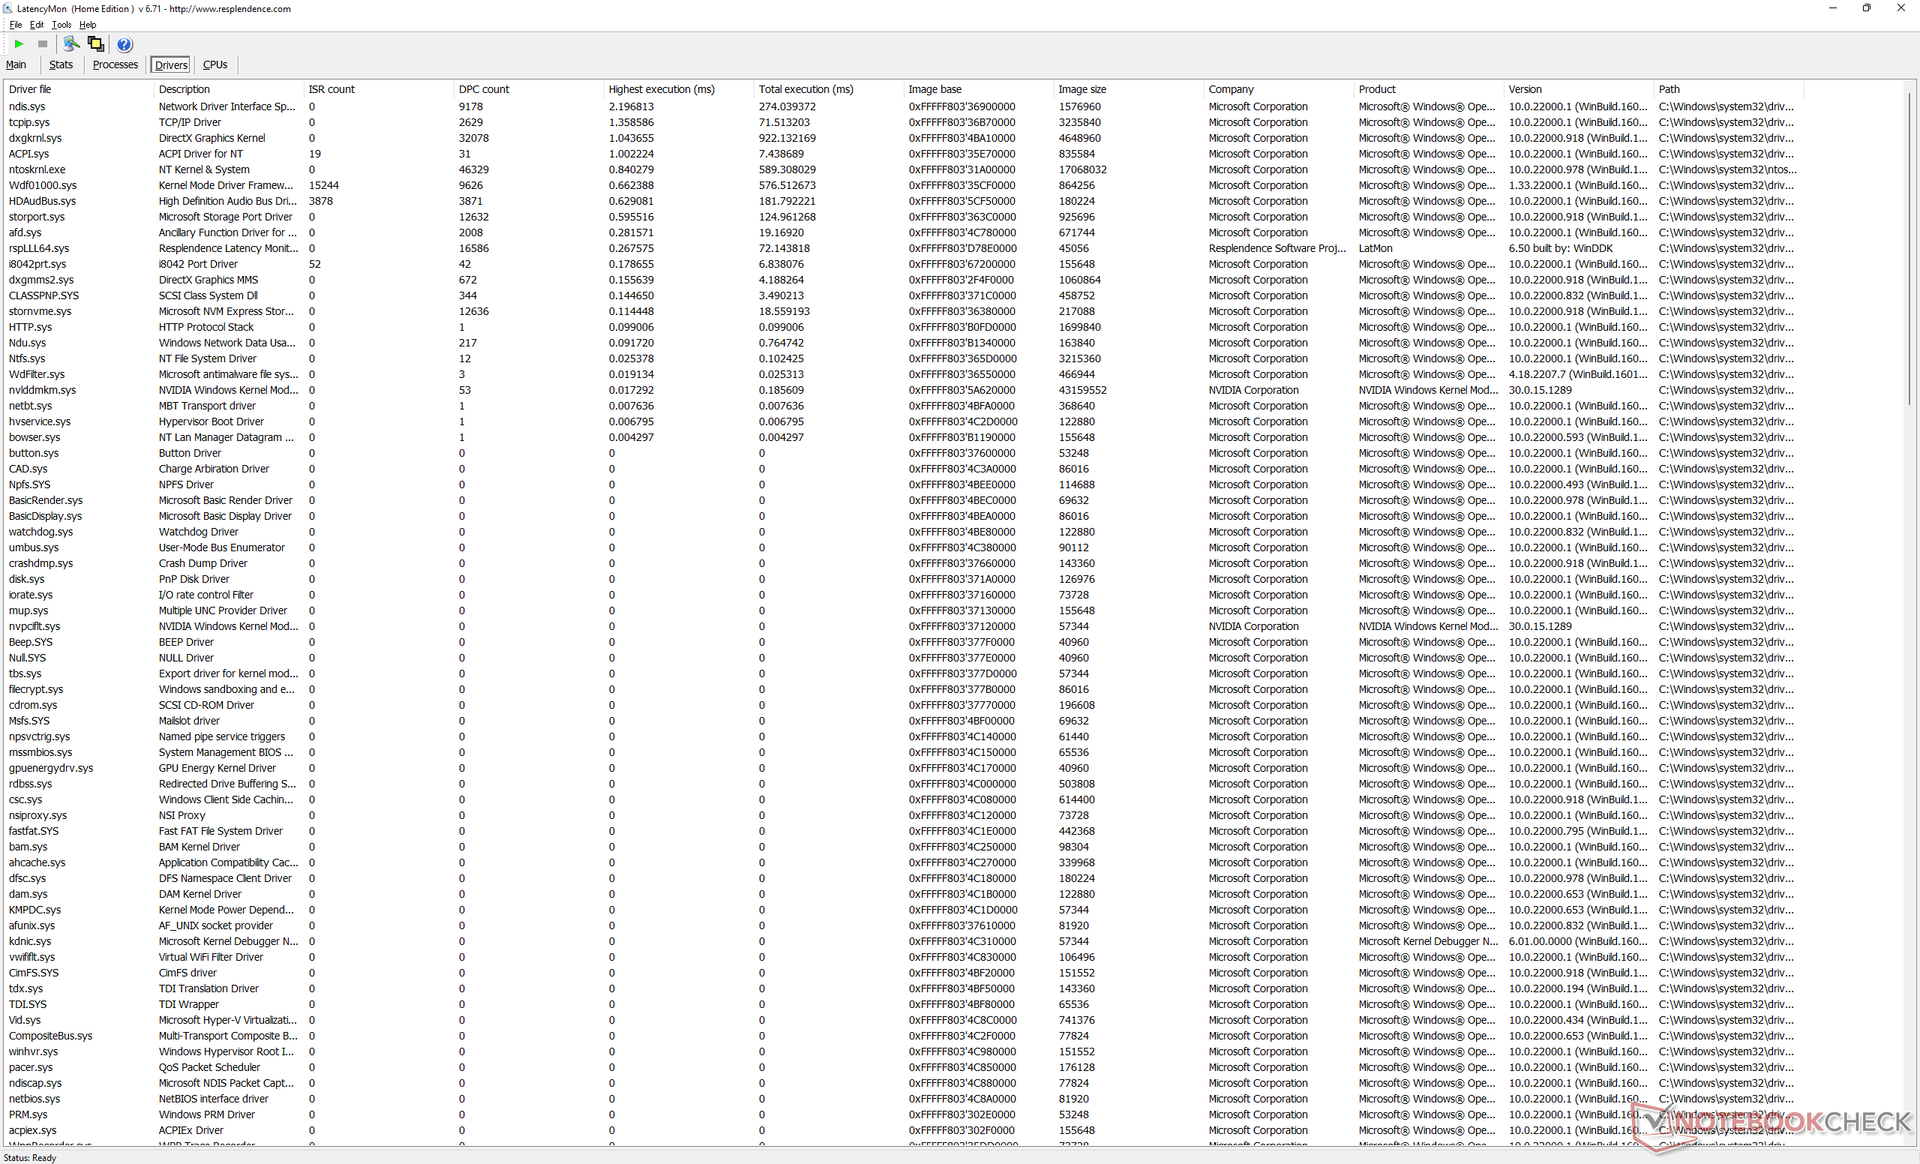
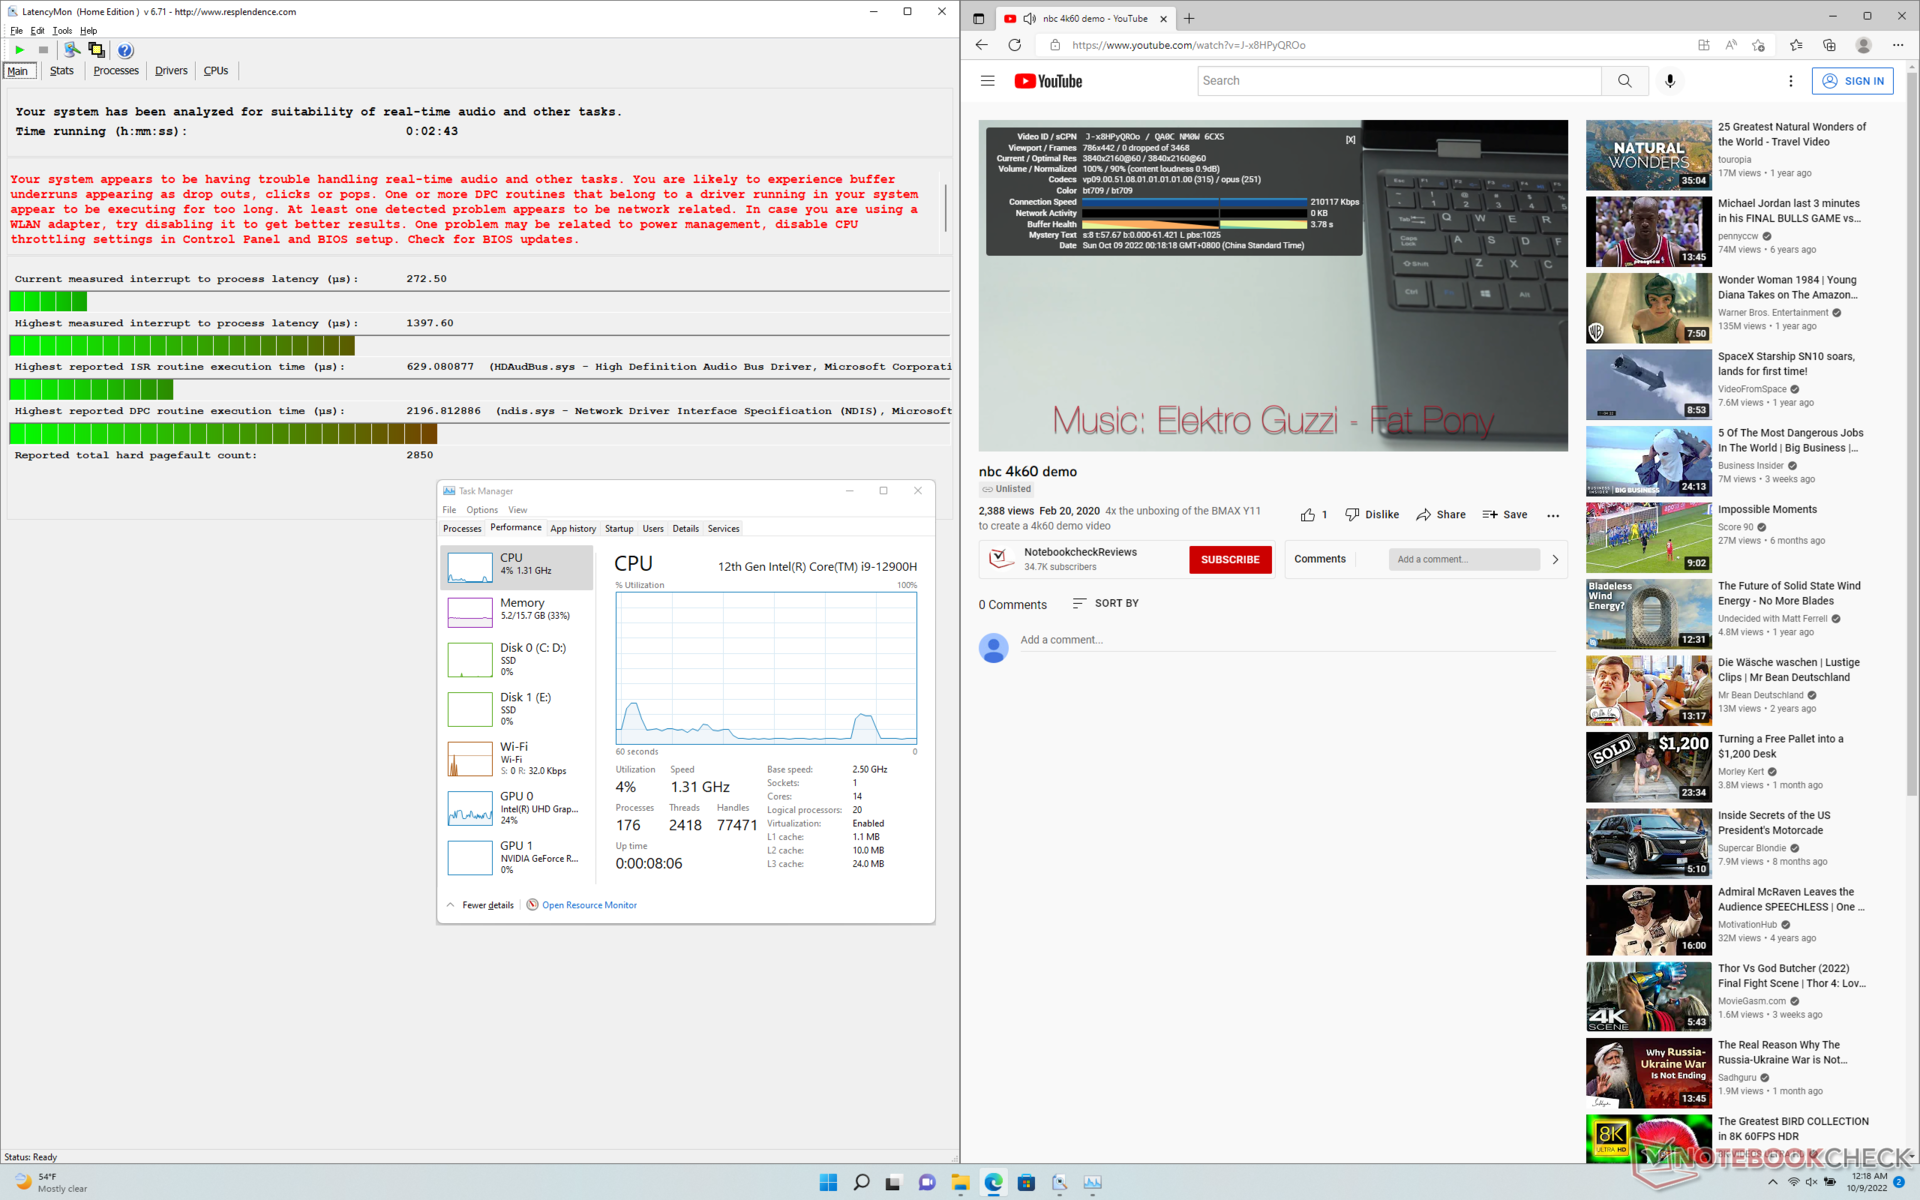
Latência do DPC
LatencyMon revela problemas de DPC ao abrir várias abas do navegador em nossa página inicial. a reprodução do vídeo 4K60 é, de outra forma, perfeita, sem queda de quadros.
| DPC Latencies / LatencyMon - interrupt to process latency (max), Web, Youtube, Prime95 | |
| MSI Stealth GS77 12UHS-083US | |
| Asus ROG Zephyrus S17 GX703HSD | |
| Uniwell Technology GM7AG8N Liquid Cooling Box | |
| Aorus 17X XES | |
| Razer Blade 17 Early 2022 | |
* ... menor é melhor
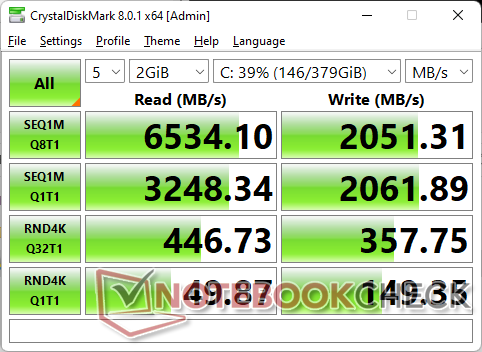
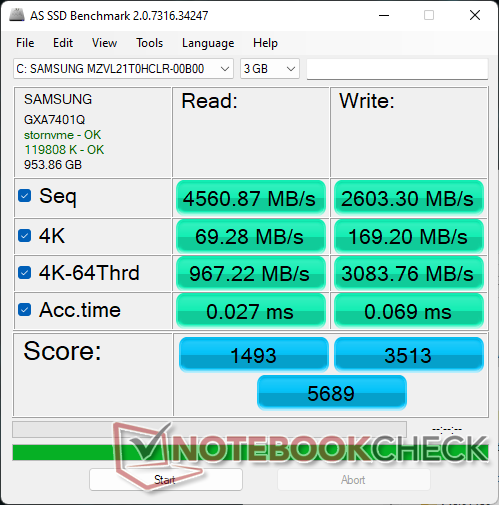
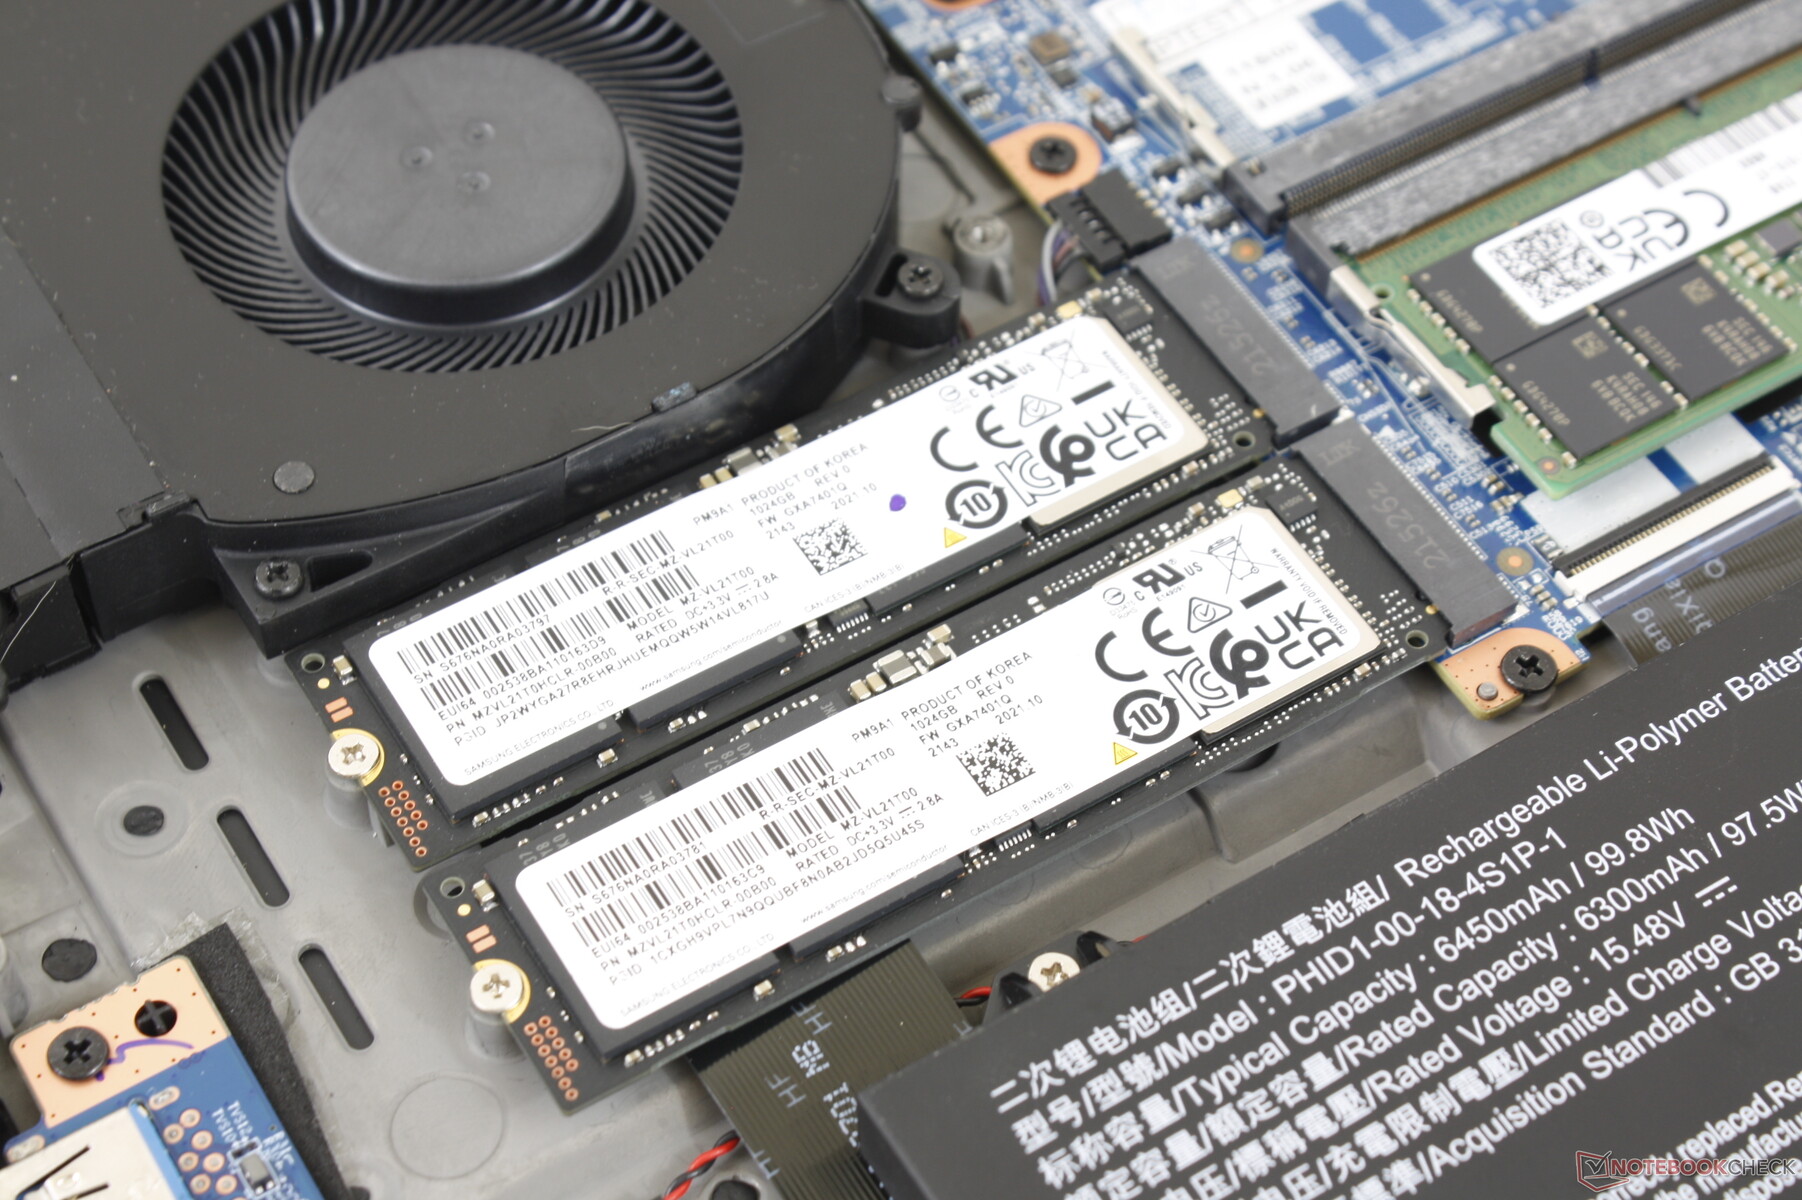
Dispositivos de armazenamento - 2x M.2 2280 PCIe4 x4 Suporte
Nossa unidade de teste vem equipada com o mesmoSamsung PM9A1 MZVL21T0HCLR PCIe4 x4 SSD, assim como muitos outros laptops de alta tecnologia para jogos como o MSI Titan GT77. No entanto, a unidade apresenta problemas de desempenho quando estressada, apesar do fato de que um espalhador de calor está incluído. Ao executar o DiskSpd em loop, as taxas de leitura começariam muito altas em ~6500 MB/s antes de cair rapidamente para ~1400 MB/s, como mostra nosso gráfico abaixo. Isto poderia ser um bug em potencial com o sistema.

| Drive Performance rating - Percent | |
| Asus ROG Zephyrus S17 GX703HSD | |
| Aorus 17X XES | |
| MSI Titan GT77 12UHS | |
| Razer Blade 17 Early 2022 | |
| MSI Stealth GS77 12UHS-083US | |
| Uniwell Technology GM7AG8N Liquid Cooling Box | |
* ... menor é melhor
Disk Throttling: DiskSpd Read Loop, Queue Depth 8
GPU Performance - Gordura total 175 W TGP GPU
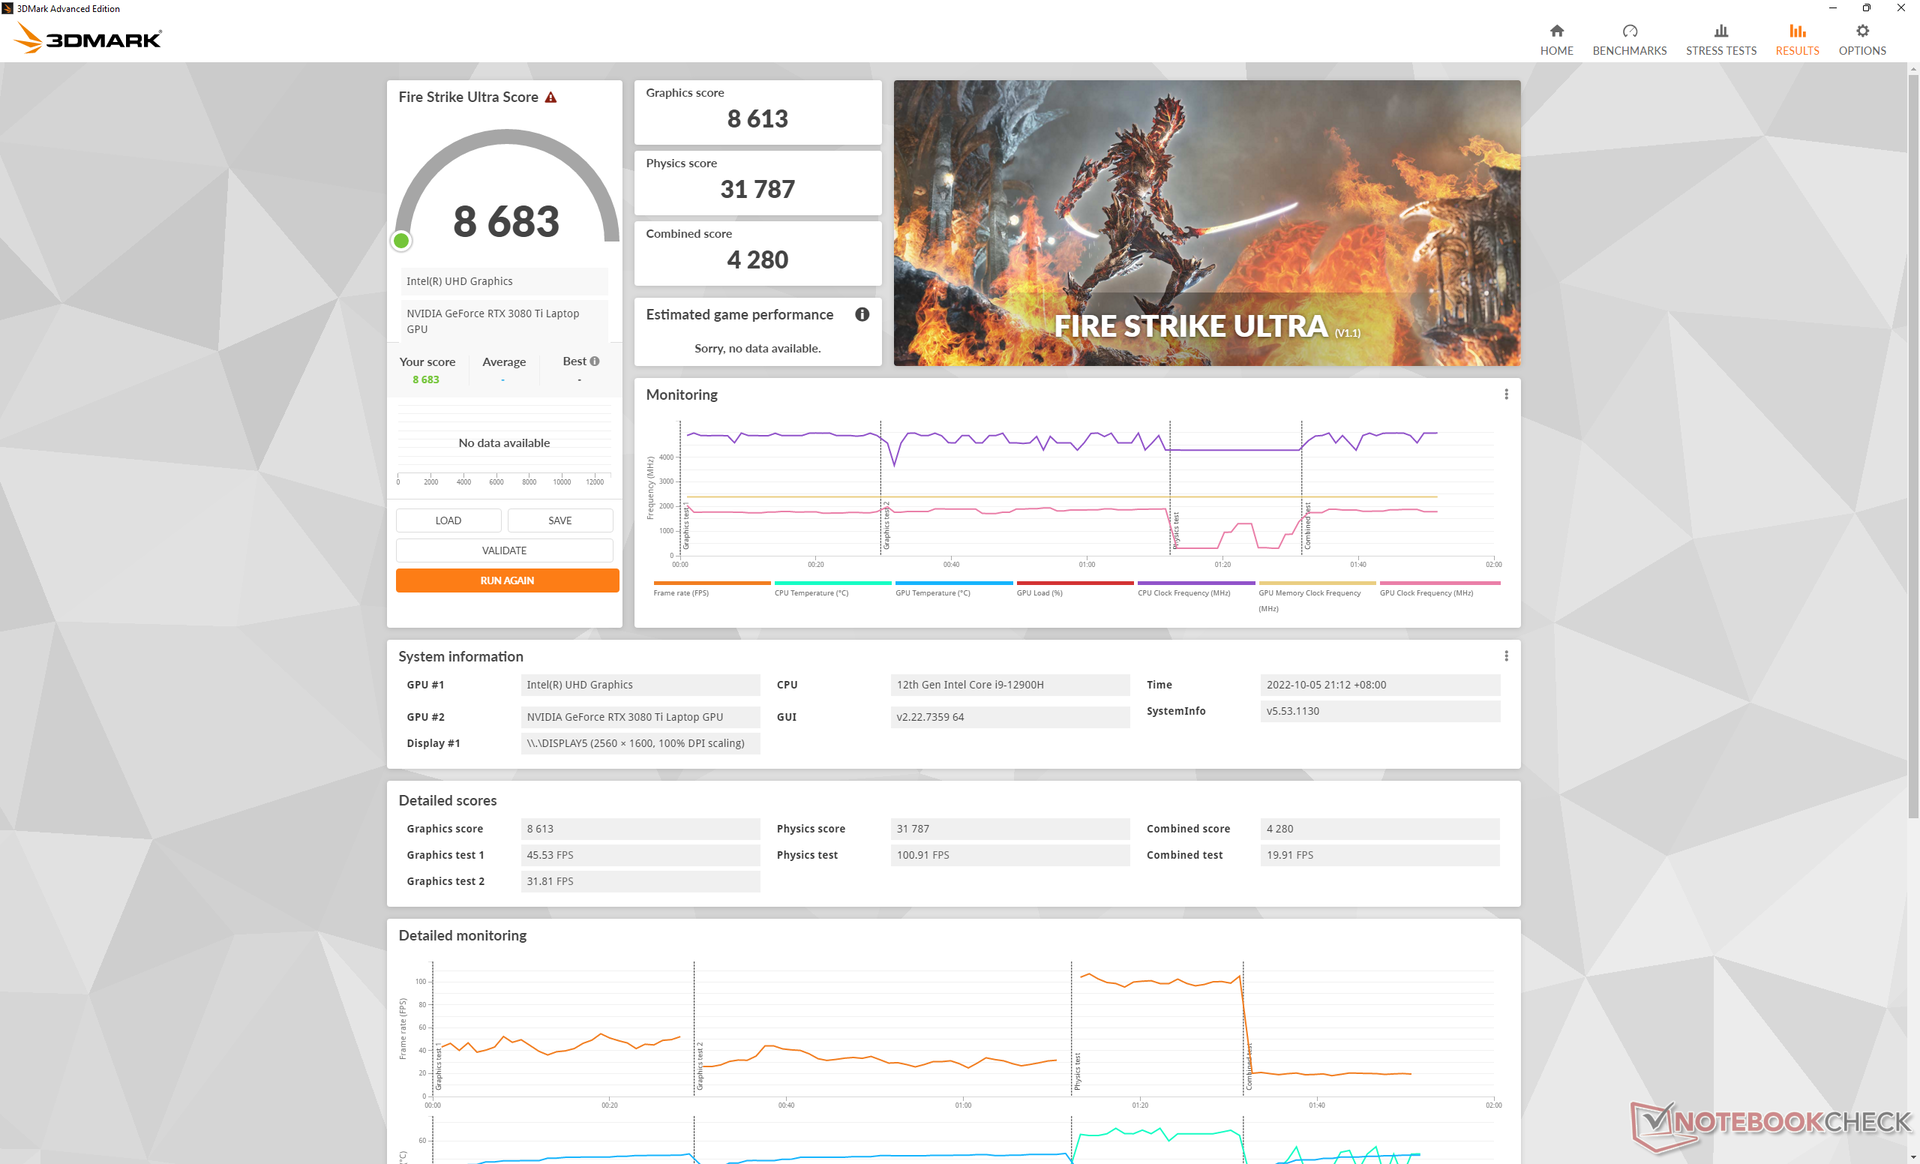
O desempenho gráfico é cerca de 5% a 15% mais rápido do que a média dos portáteis em nosso banco de dados equipados com o mesmo GeForce RTX 3080 Ti GPU. A GPU é capaz de funcionar ainda mais rápido se os usuários decidirem fazer um overclock ainda maior, além das configurações do fabricante
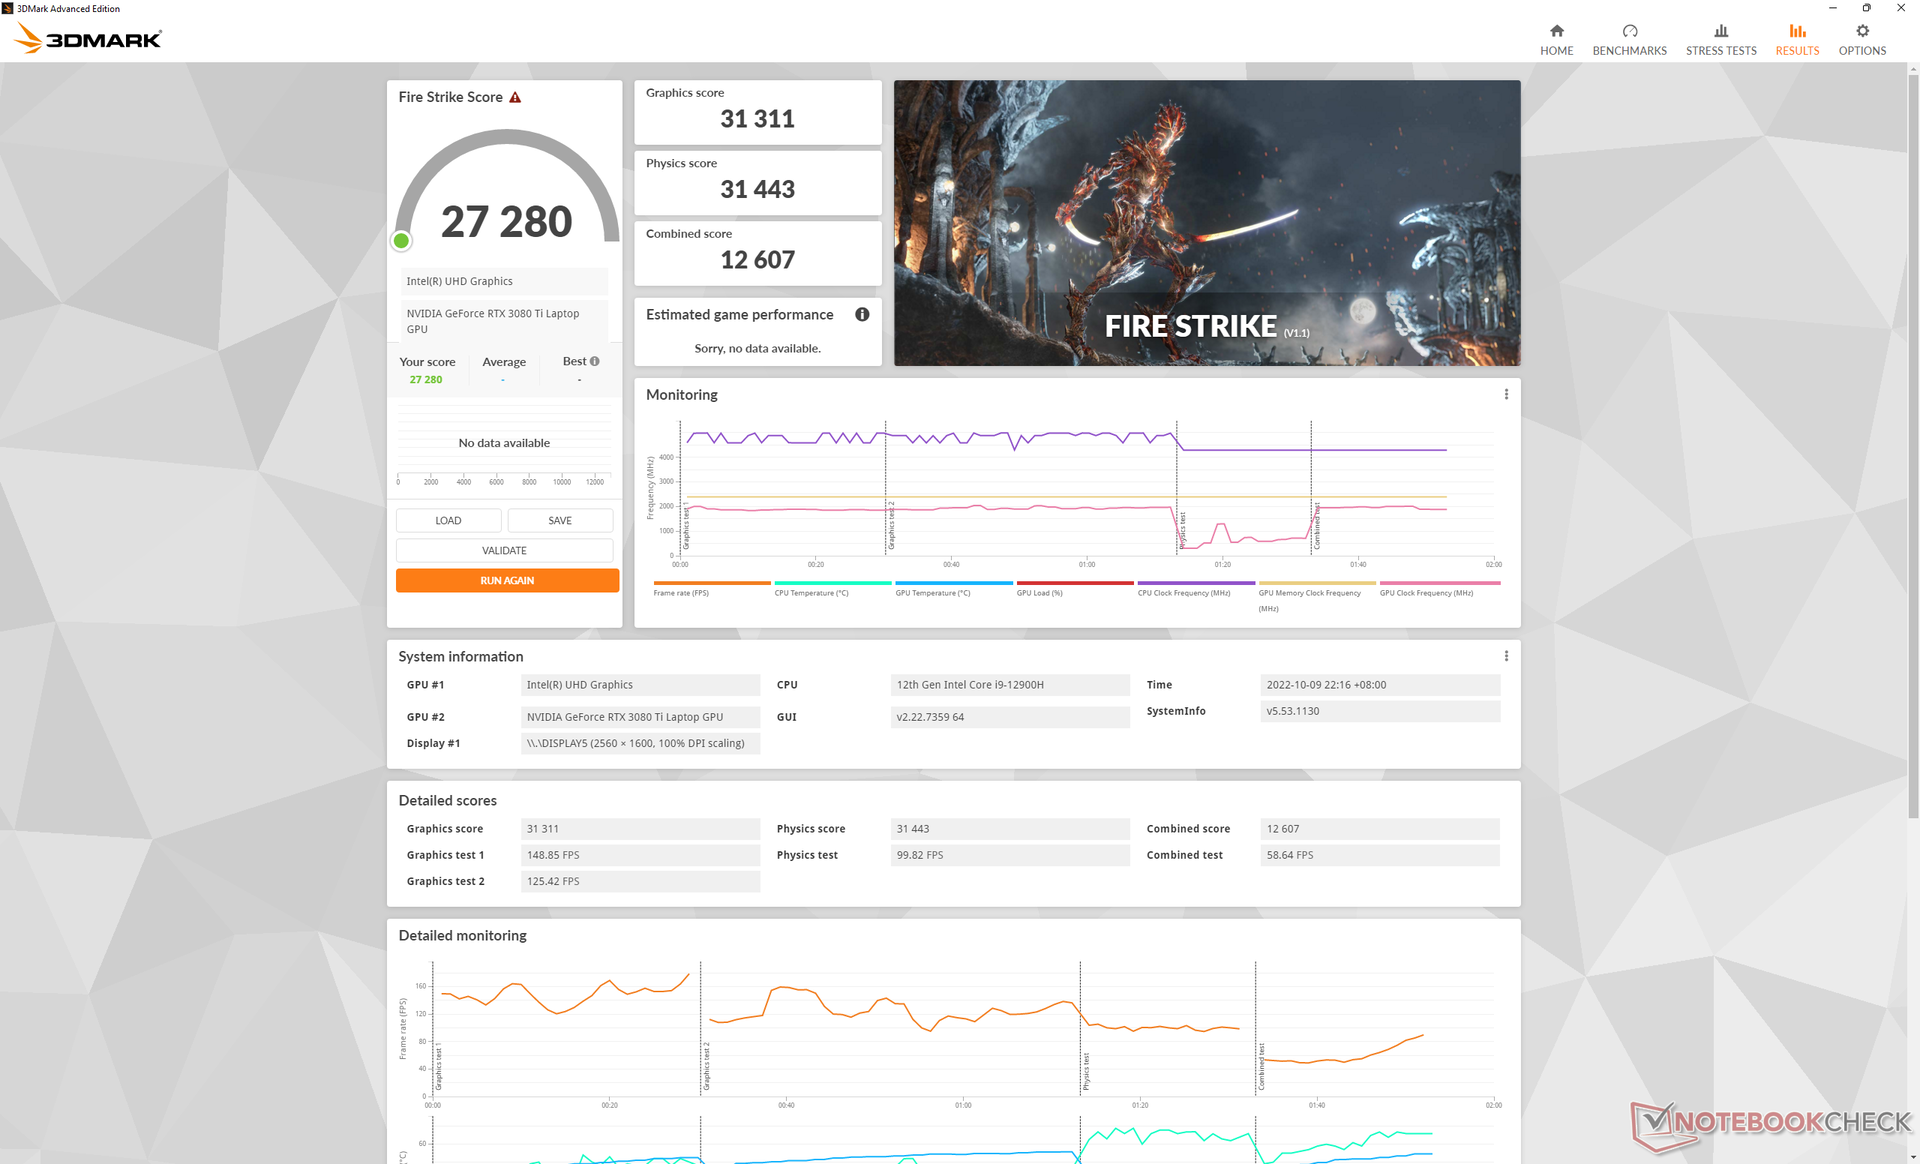
Curiosamente, a performance gráfica não é reduzida se a caixa de resfriamento estiver rodando em seu nível mais baixo de ajuste do ventilador. Rodar Fire Strike no modo "Mais silencioso" resultaria em pontuações de Física e Gráficos de 31443 e 31311 pontos, respectivamente, em comparação com 30601 e 30959 pontos quando no modo "Equilibrado" da caixa de resfriamento. Isto é especialmente importante, pois significa que você não precisa executar o sistema em suas configurações máximas de ventilação se não tiver a intenção de fazer overclock na GPU.
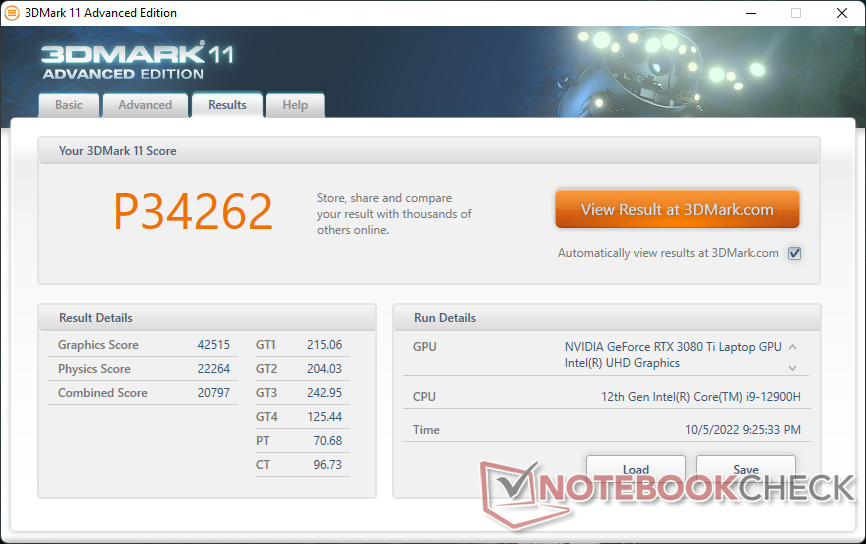
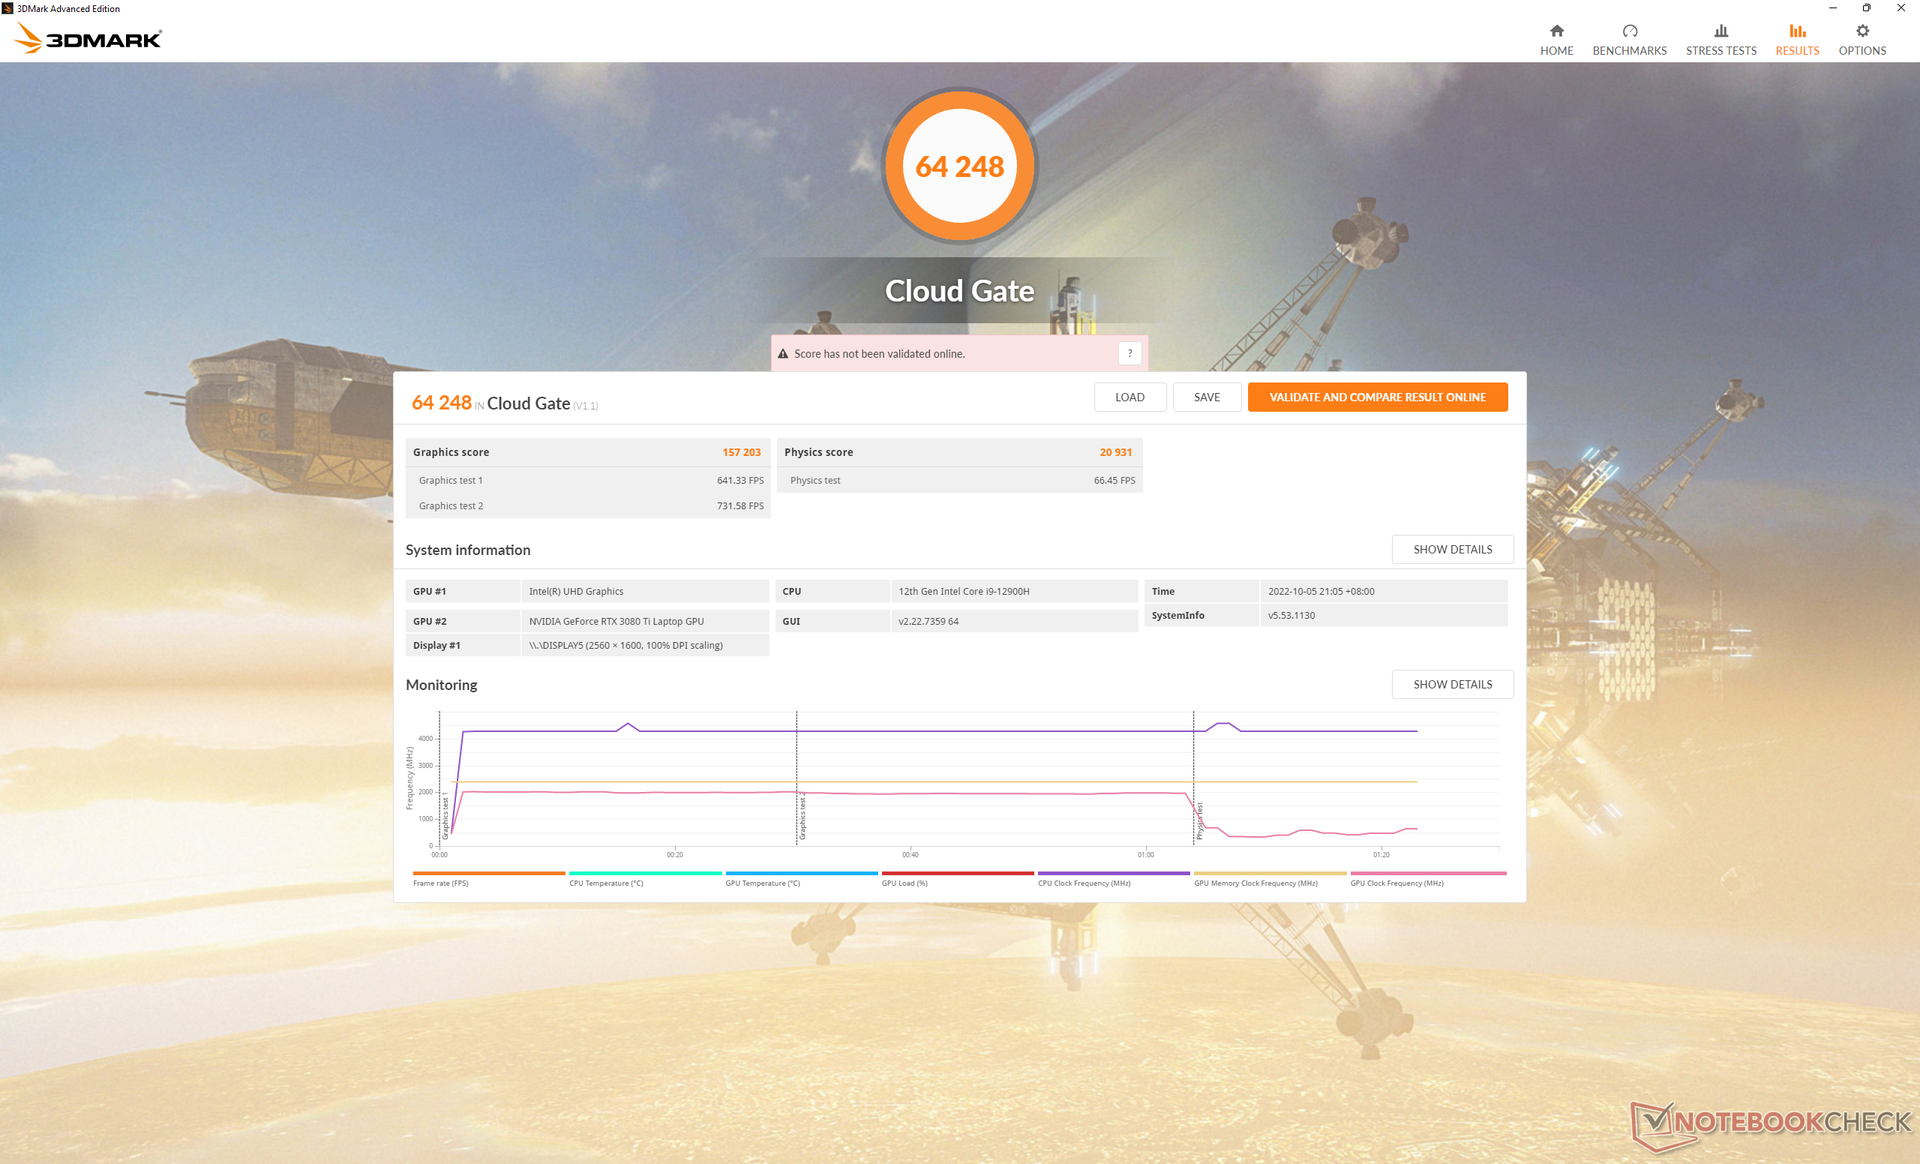

| 3DMark 11 Performance | 34262 pontos | |
| 3DMark Cloud Gate Standard Score | 64248 pontos | |
| 3DMark Fire Strike Score | 27342 pontos | |
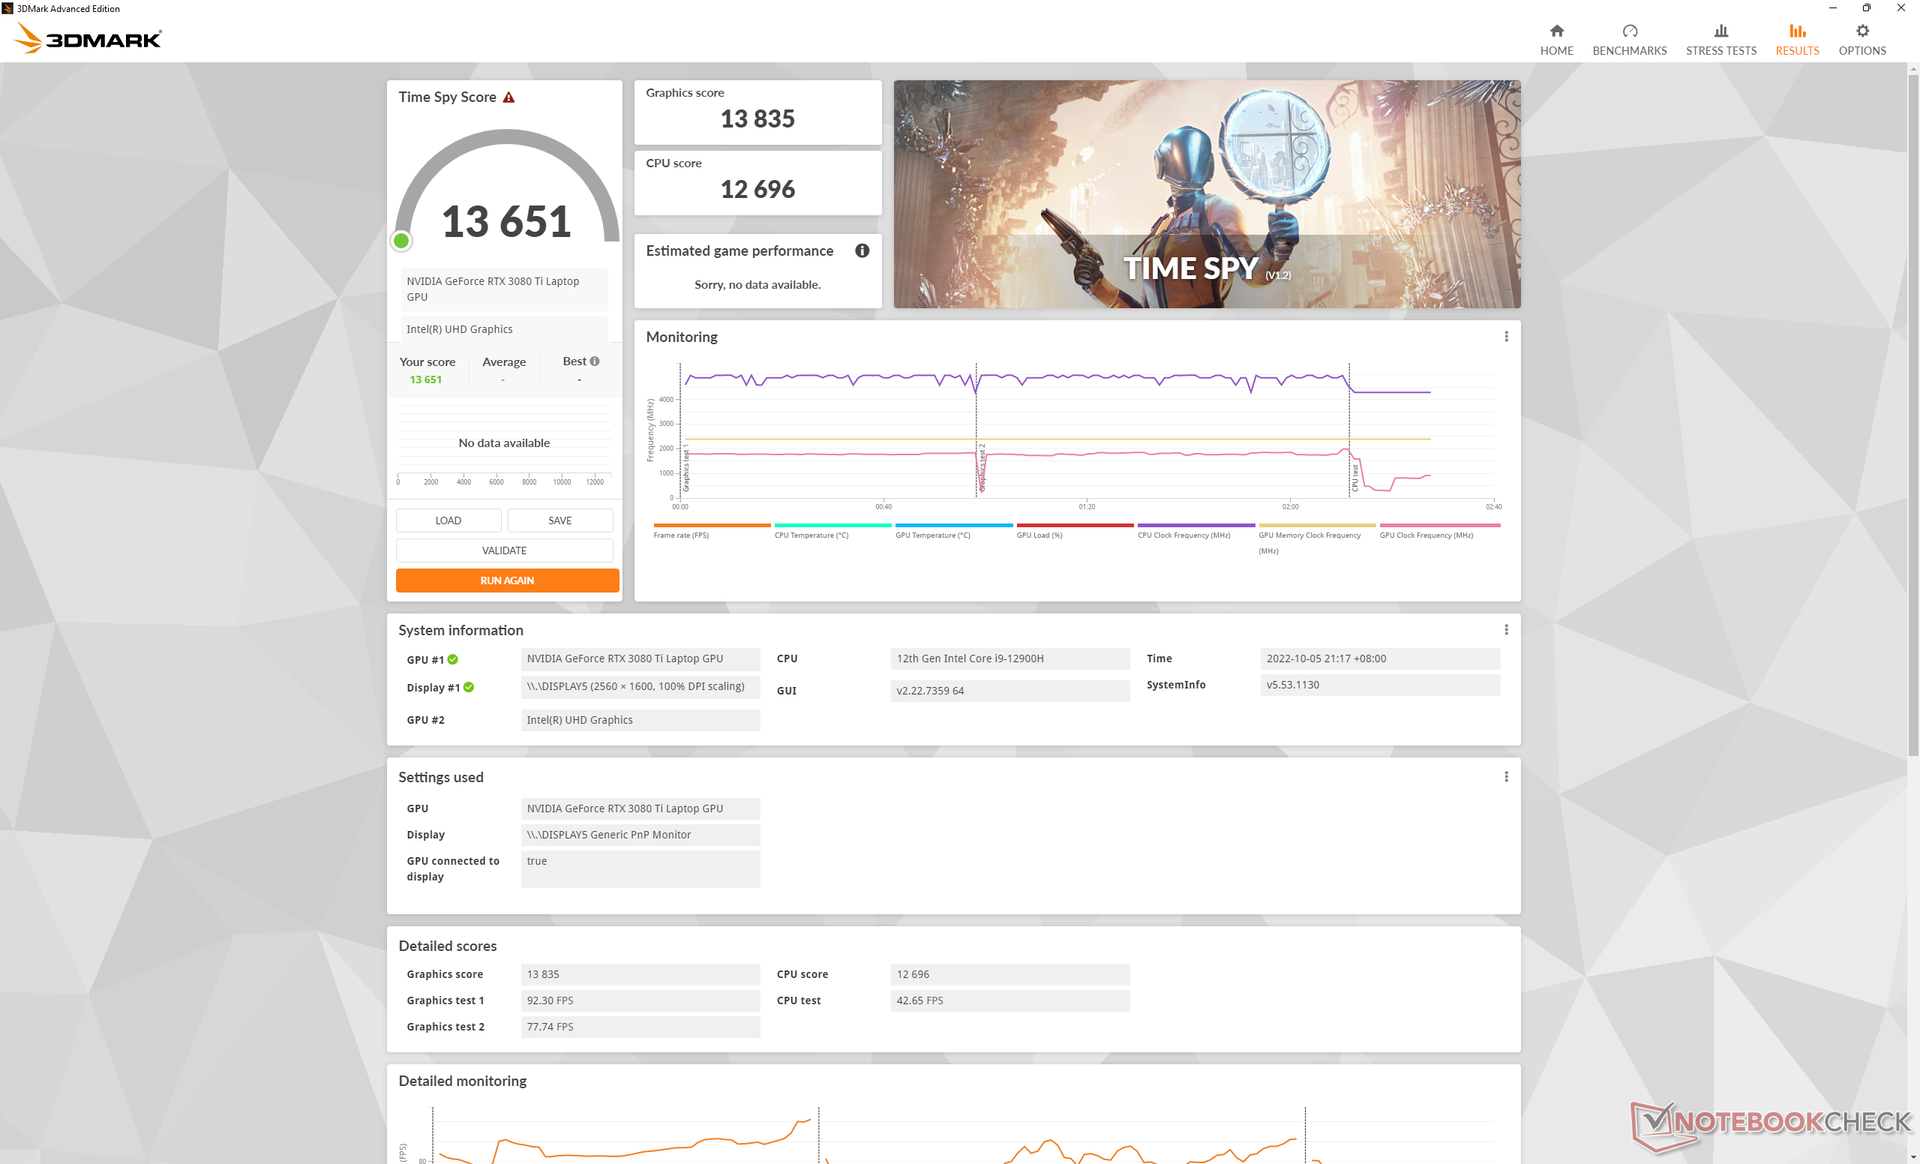
| 3DMark Time Spy Score | 13651 pontos | |
Ajuda | ||
| Blender | |
| v3.3 Classroom OPTIX/RTX | |
| Aorus 17X XES | |
| MSI Titan GT77 12UHS | |
| Uniwell Technology GM7AG8N Liquid Cooling Box | |
| v3.3 Classroom CUDA | |
| Aorus 17X XES | |
| Uniwell Technology GM7AG8N Liquid Cooling Box | |
| MSI Titan GT77 12UHS | |
| v3.3 Classroom CPU | |
| Aorus 17X XES | |
| Uniwell Technology GM7AG8N Liquid Cooling Box | |
| MSI Titan GT77 12UHS | |
* ... menor é melhor
Witcher 3 FPS Chart
| baixo | média | alto | ultra | QHD | |
|---|---|---|---|---|---|
| GTA V (2015) | 184.8 | 181.6 | 177.3 | 123.3 | 112.6 |
| The Witcher 3 (2015) | 464.9 | 366.2 | 257.5 | 127.2 | |
| Dota 2 Reborn (2015) | 171.3 | 158.9 | 152.3 | 145.3 | |
| Final Fantasy XV Benchmark (2018) | 188.7 | 164.4 | 122.7 | 97 | |
| X-Plane 11.11 (2018) | 149.2 | 133.8 | 106.2 | ||
| Strange Brigade (2018) | 448 | 311 | 255 | 224 | 166.8 |
| Cyberpunk 2077 1.6 (2022) | 144.9 | 140.1 | 115.8 | 96.7 | 63.3 |
Emissões
Ruído do sistema
Como mencionado anteriormente, a caixa de resfriamento tem três modos de ventiladores: Mais silenciosa, silenciosa e balanceada. O ruído do ventilador no "Mais silencioso" já é bastante alto a 41,6 dB(A), o que é tão alto quanto a maioria dos Ultrabooks quando se trabalha com cargas altas. Bater com isto até o modo "Silencioso" e "Equilibrado" aumentará o ruído do ventilador para 44,2 dB(A) e 45,8 dB(A), respectivamente. Recomendamos colocar a caixa de resfriamento o mais distante possível de seu assento para reduzir os níveis de ruído.
Há um quarto perfil de potência no software do Centro de Controle chamado "Fan Boost", com os ventiladores internos em suas RPMs máximas. Quando ambos os modos "Fan Boost" e a caixa de resfriamento "Balanced" estão ativos, o ruído geral do sistema pode ser tão alto quanto 55,9 dB(A), que na verdade é muito semelhante à maioria dos laptops "regulares" de 17 polegadas sem soluções de resfriamento externo.
O grande problema aqui é que você não precisa habilitar o Fan Boost ou ter a caixa de resfriamento em sua configuração mais alta para operar a CPU ou GPU em velocidades de estoque. Em contraste, a maioria dos outros laptops para jogos como o Asus Zephyrus S17 ou o Razer Blade 17 exigem que os usuários habilitem o Modo Turbo ou então o TGP será estrangulado quando estiver jogando. Isto significa que os proprietários da Uniwell podem operar a caixa de resfriamento em seu modo "mais silencioso" de 41,6 dB(A) para um desempenho melhor que a média RTX 3080 Ti em jogos, enquanto a maioria dos outros laptops para jogos deve suportar um ruído de ventilador de 50 dB(A) ou superior apenas para se aproximar do desempenho da Uniwell. Em resumo, a caixa de resfriamento é capaz de fazer quase todo o trabalho de resfriamento mesmo quando jogando nas configurações mais silenciosas do ventilador sem a necessidade de estrangular a CPU ou GPU.
Barulho
| Ocioso |
| 41.6 / 42.1 / 42.1 dB |
| Carga |
| 42.2 / 55.9 dB |
 | ||
30 dB silencioso 40 dB(A) audível 50 dB(A) ruidosamente alto |
||
min: | ||
| Uniwell Technology GM7AG8N Liquid Cooling Box GeForce RTX 3080 Ti Laptop GPU, i9-12900H, Samsung PM9A1 MZVL21T0HCLR | MSI Titan GT77 12UHS GeForce RTX 3080 Ti Laptop GPU, i9-12900HX, Samsung PM9A1 MZVL21T0HCLR | Aorus 17X XES GeForce RTX 3070 Ti Laptop GPU, i9-12900HX, Gigabyte AG470S1TB-SI B10 | Razer Blade 17 Early 2022 GeForce RTX 3080 Ti Laptop GPU, i9-12900H, Samsung PM9A1 MZVL21T0HCLR | MSI Stealth GS77 12UHS-083US GeForce RTX 3080 Ti Laptop GPU, i7-12700H, Micron 3400 1TB MTFDKBA1T0TFH | Asus ROG Zephyrus S17 GX703HSD GeForce RTX 3080 Laptop GPU, i9-11900H, Samsung PM9A1 MZVL22T0HBLB | |
|---|---|---|---|---|---|---|
| Noise | 17% | 5% | 12% | 19% | 23% | |
| desligado / ambiente * (dB) | 22.8 | 21.9 4% | 26 -14% | 26 -14% | 24.5 -7% | 23 -1% |
| Idle Minimum * (dB) | 41.6 | 24.53 41% | 28 33% | 26 37% | 24.5 41% | 23 45% |
| Idle Average * (dB) | 42.1 | 24.53 42% | 32 24% | 27 36% | 24.5 42% | 23 45% |
| Idle Maximum * (dB) | 42.1 | 24.53 42% | 38 10% | 32 24% | 30.8 27% | 23 45% |
| Load Average * (dB) | 42.2 | 46.25 -10% | 53 -26% | 50 -18% | 34.6 18% | 41 3% |
| Witcher 3 ultra * (dB) | 55.9 | 56.86 -2% | 54 3% | 51 9% | 46.2 17% | 45 19% |
| Load Maximum * (dB) | 55.9 | 54.25 3% | 55 2% | 51 9% | 56.8 -2% | 52 7% |
* ... menor é melhor
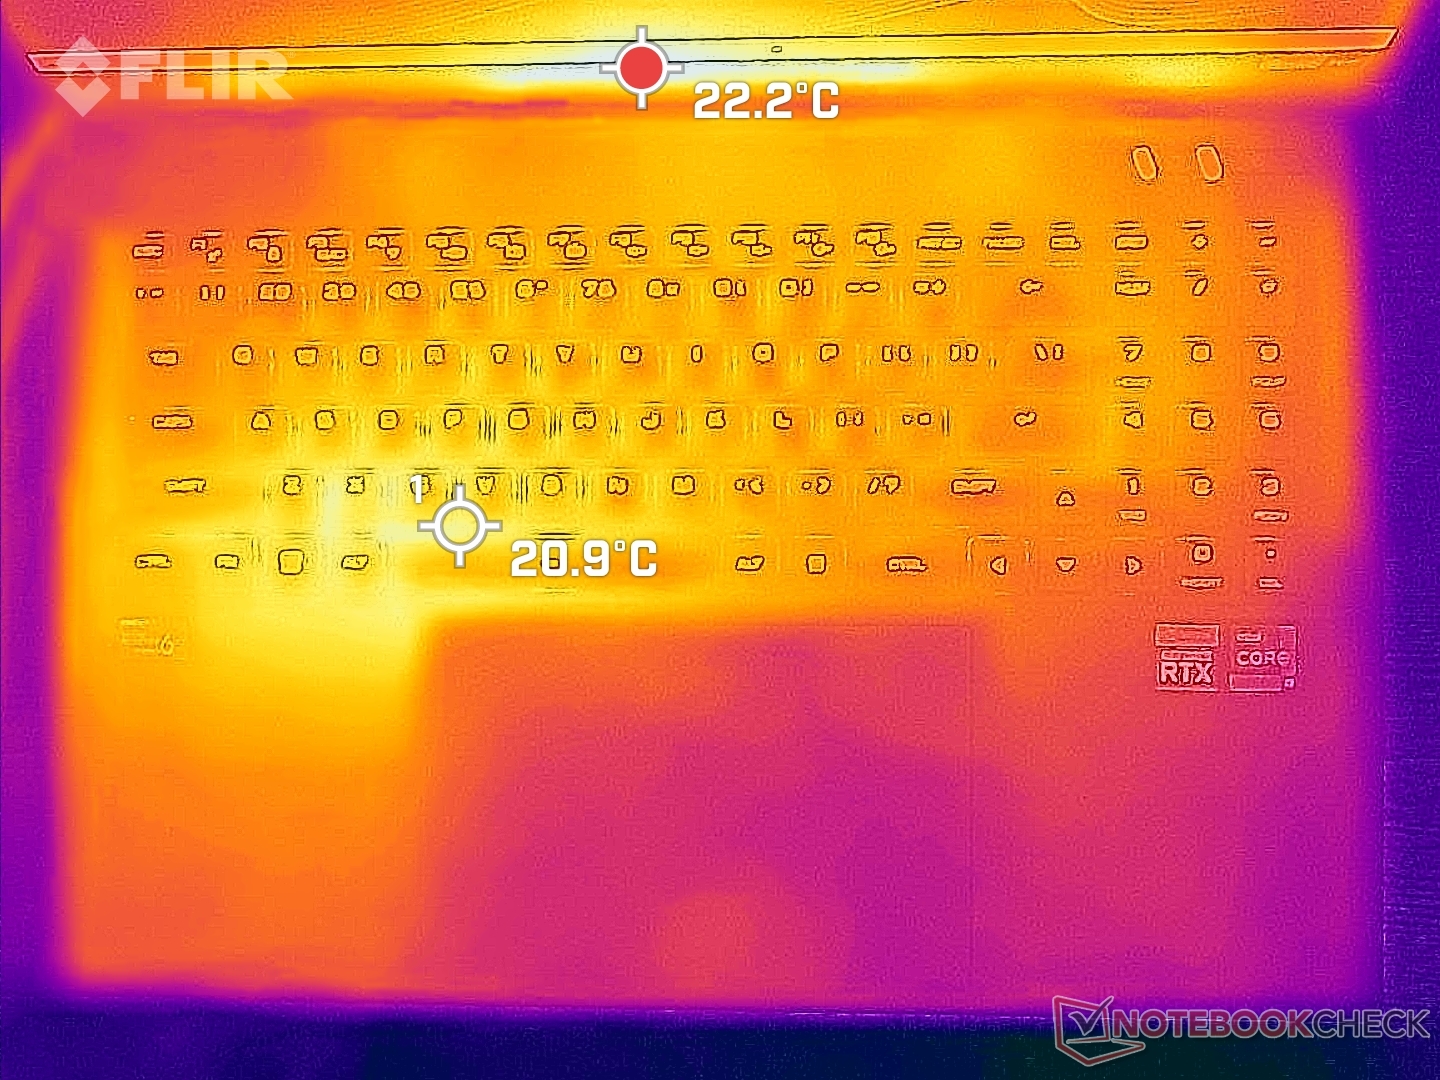
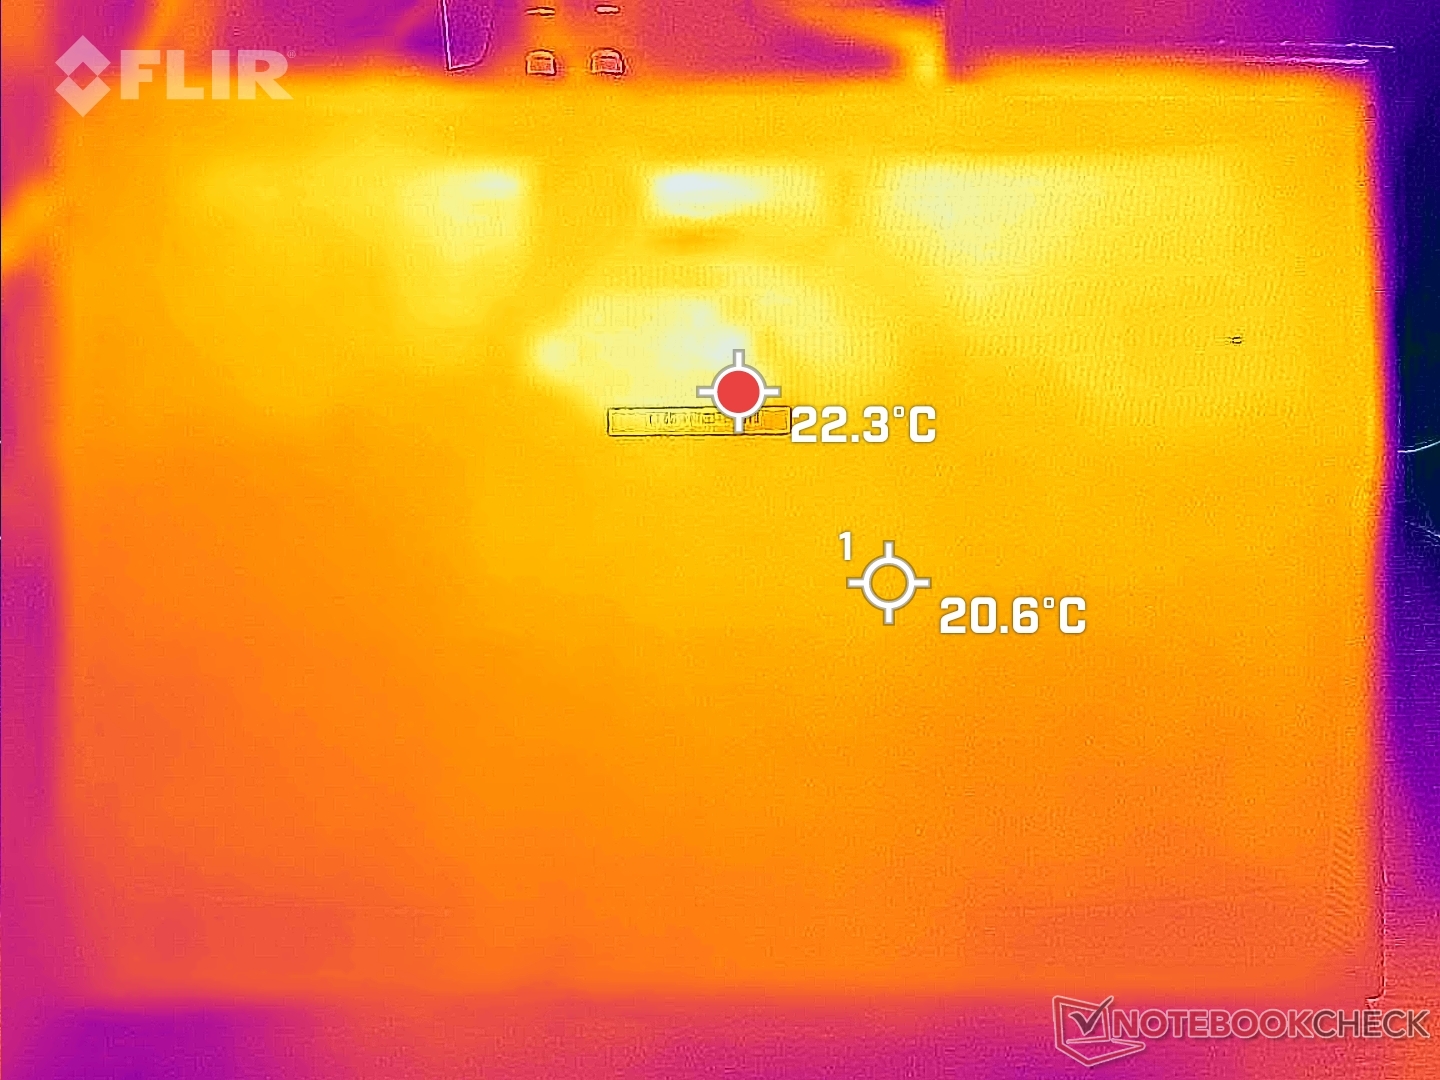
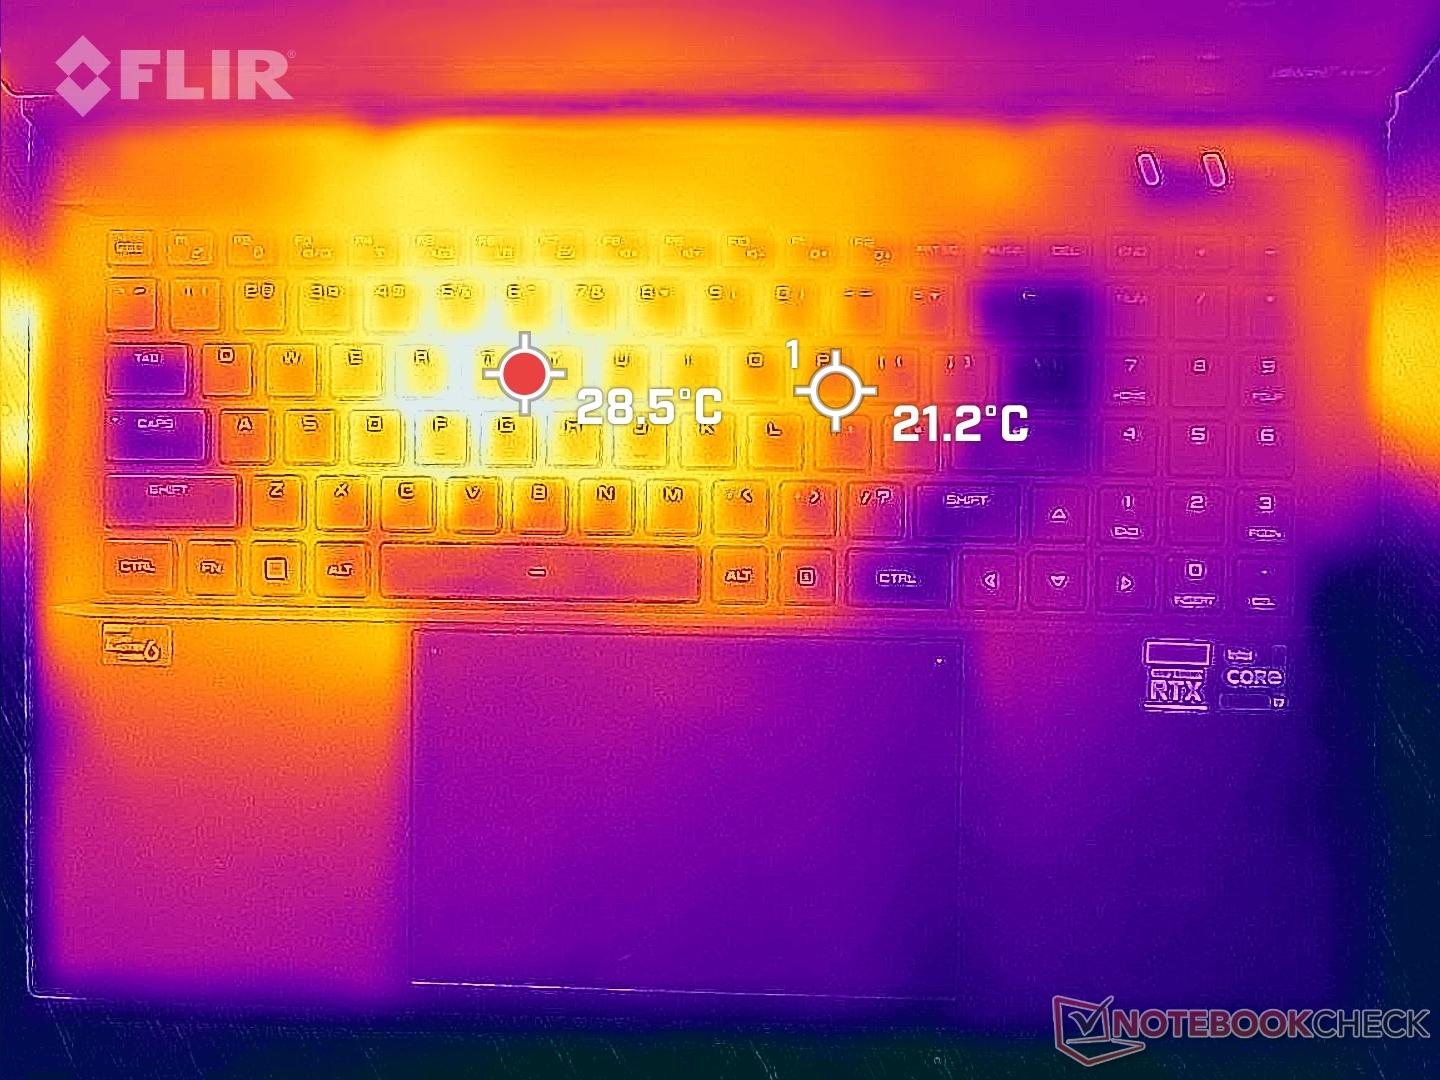
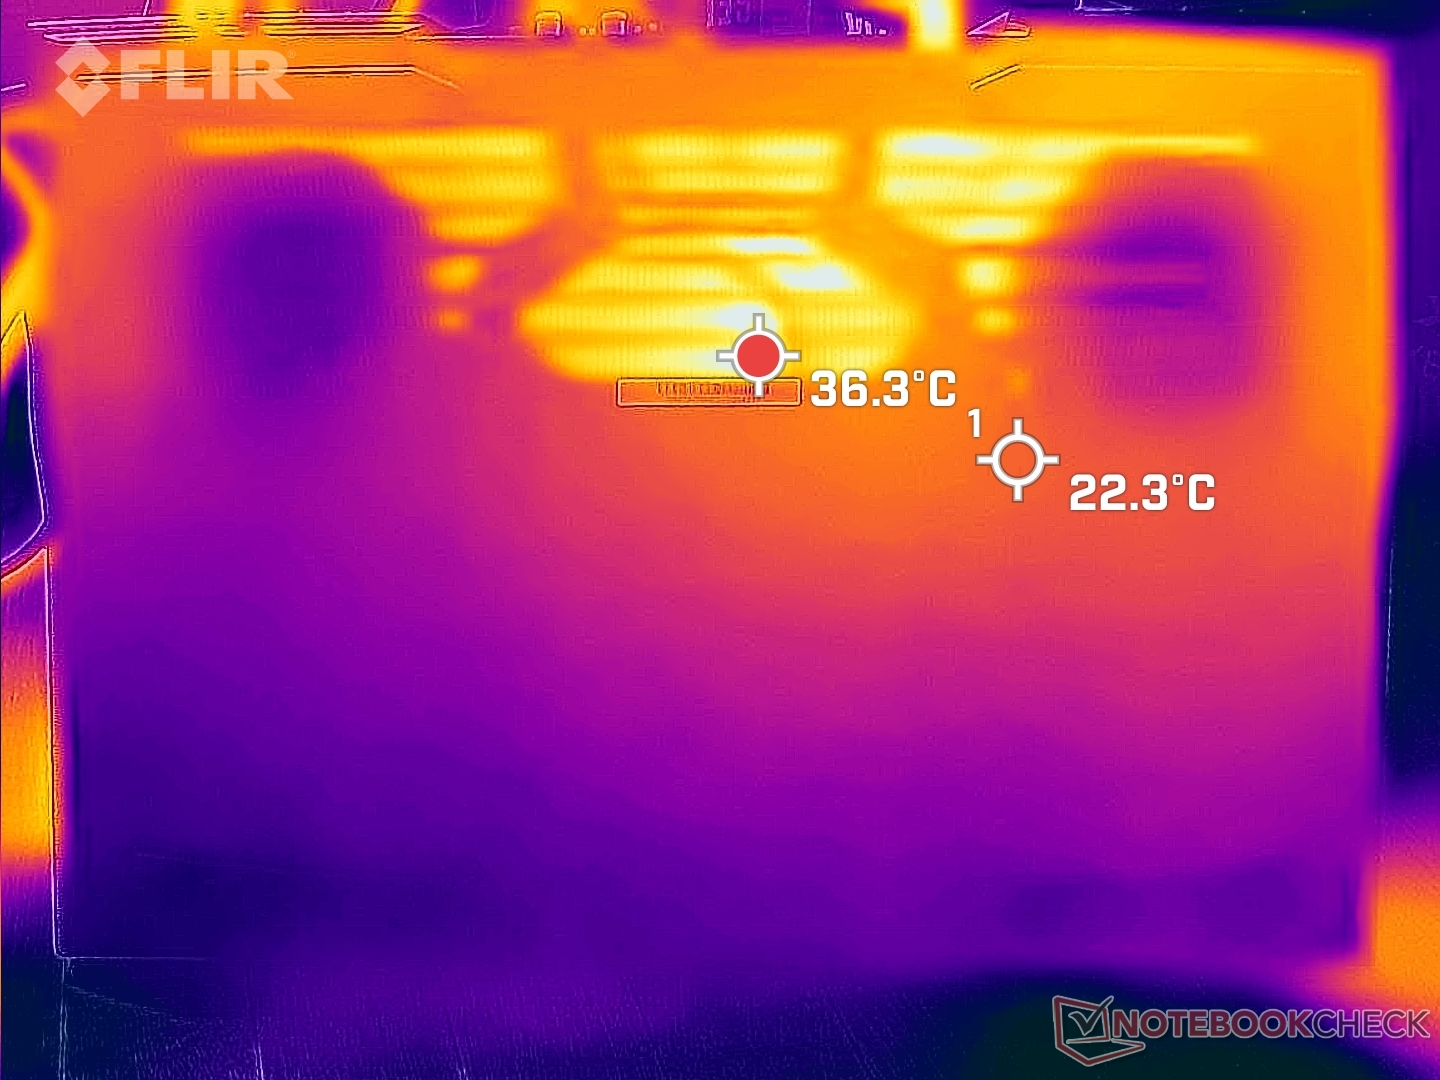
Temperatura - Mantendo o frio
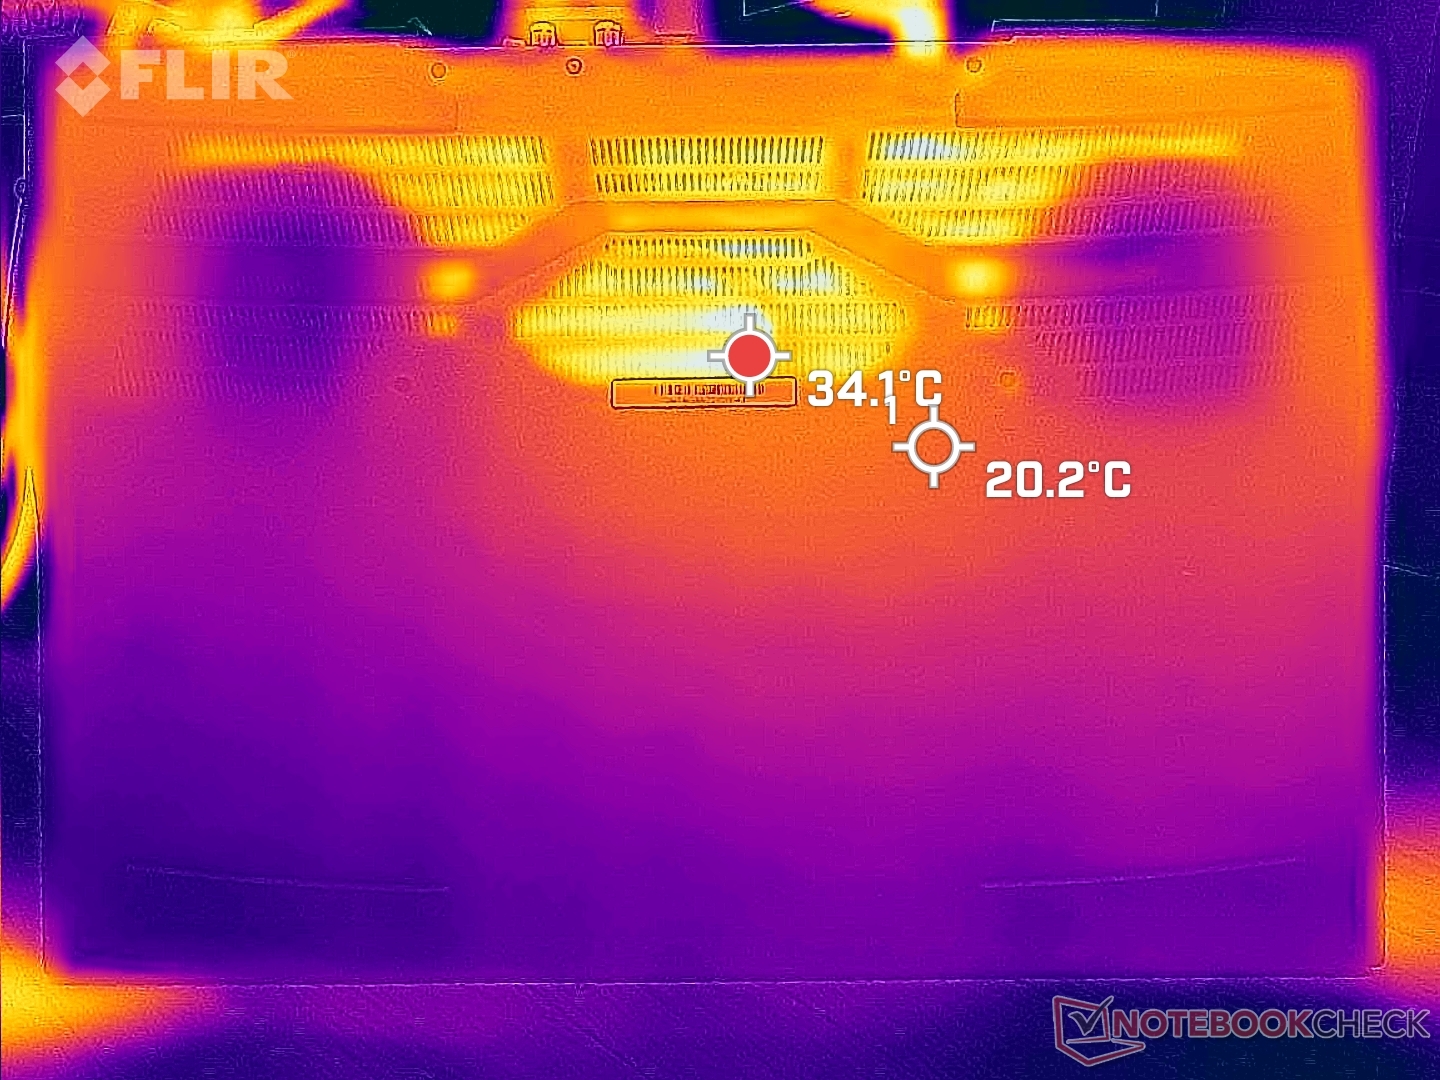
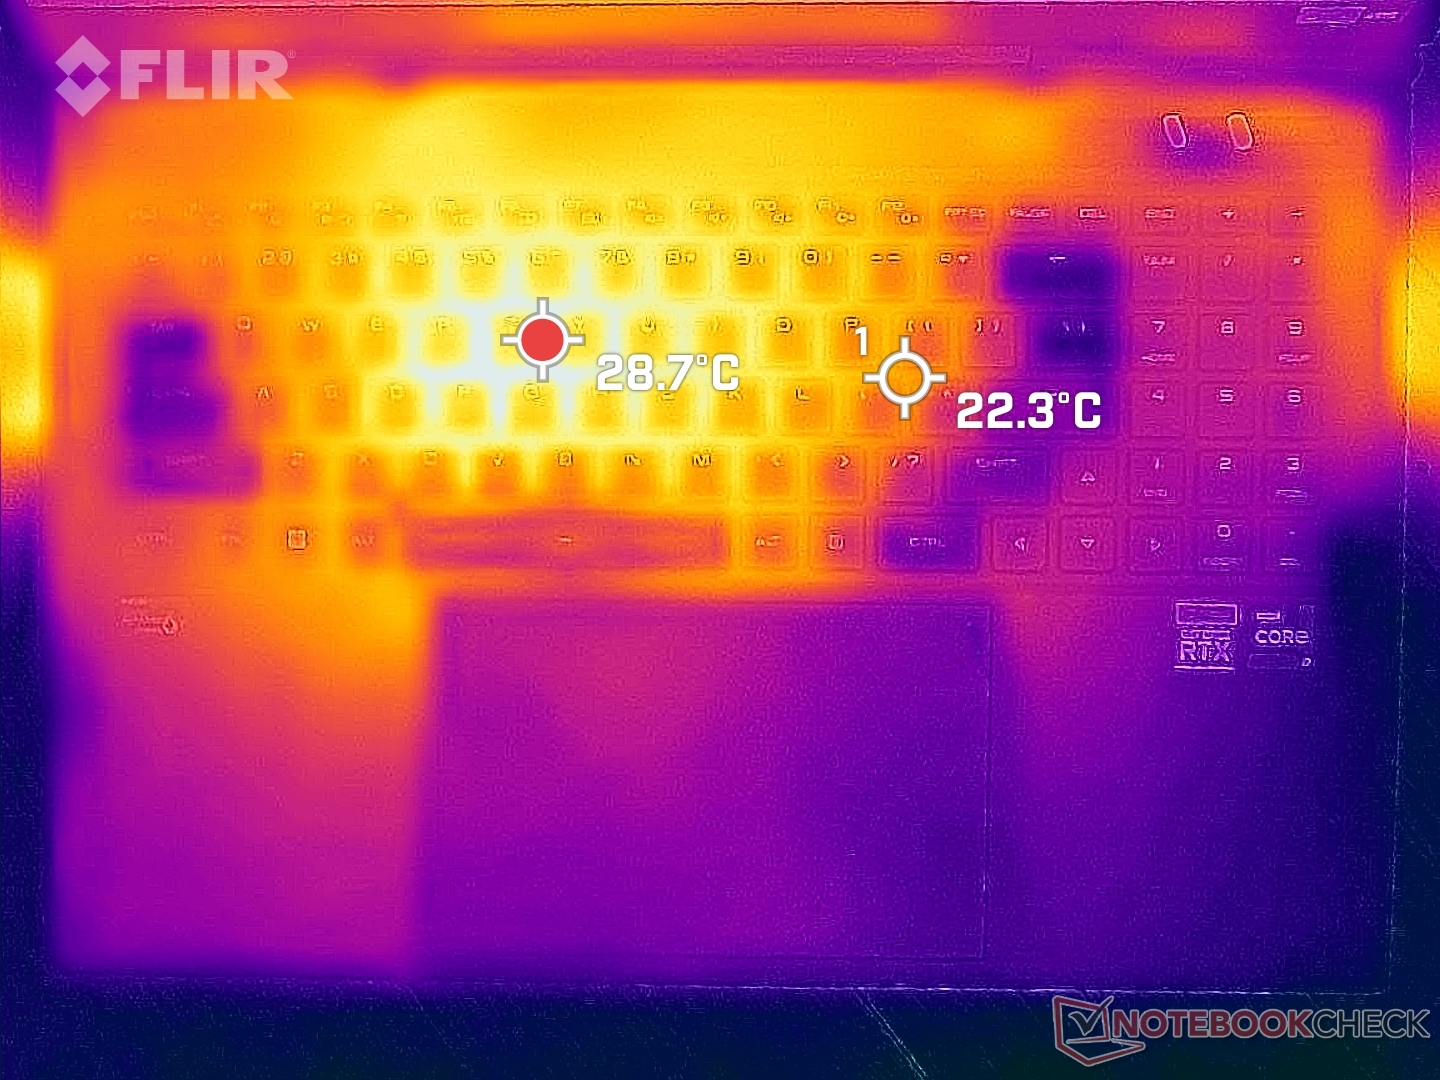
As temperaturas superficiais são as mais frias que já gravamos em qualquer laptop de jogos. Quando sujeitas a 100% de utilização de CPU e GPU, os pontos quentes na parte superior e inferior alcançariam apenas 32 C e 30 C, respectivamente, em comparação com 50 C a 60+ C no MSI Stealth GS77. O aumento médio da temperatura é de apenas cerca de 3 C quando comparado a um estado ocioso. A caixa de resfriamento é notável em termos de manter as temperaturas sob controle.
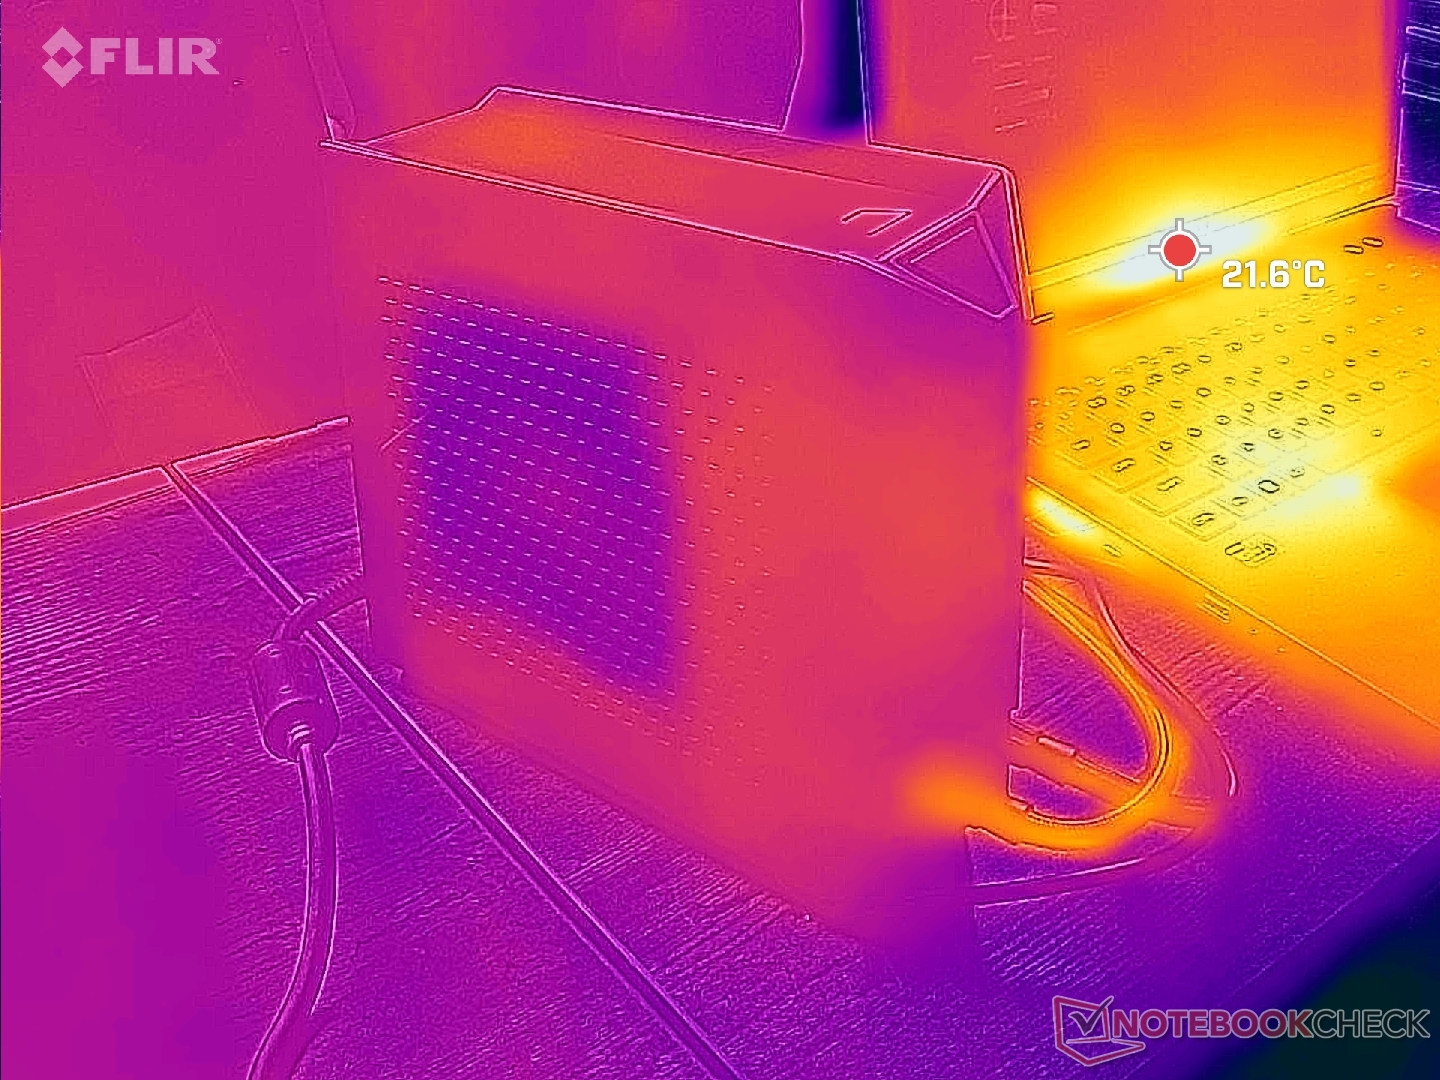
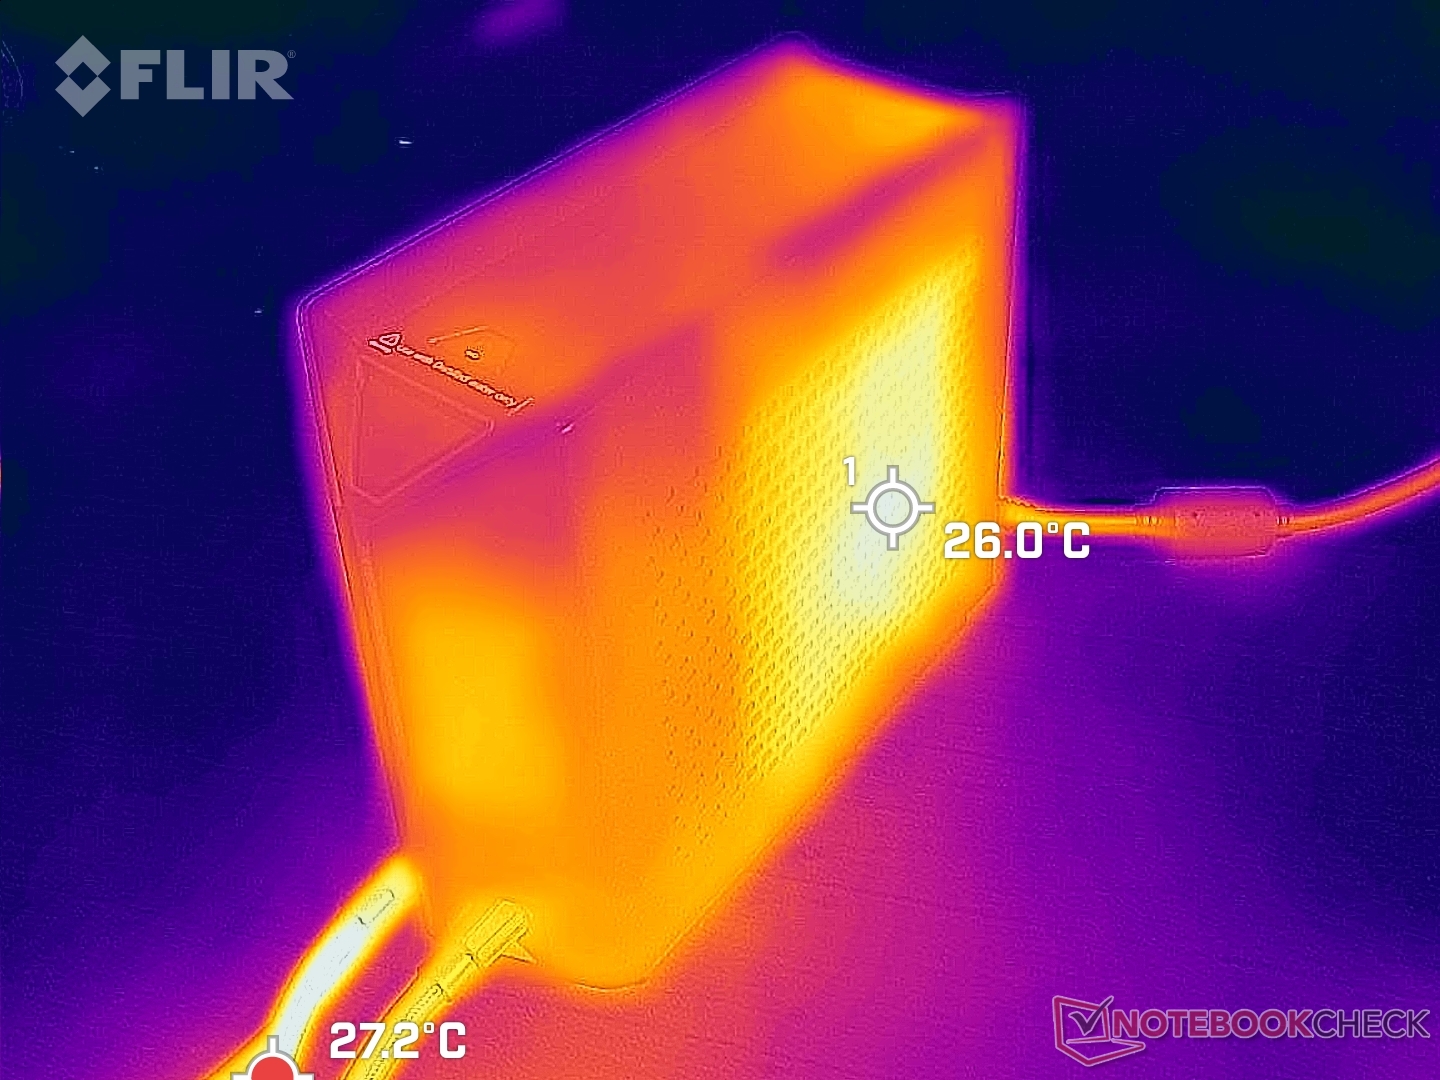
(+) A temperatura máxima no lado superior é 32 °C / 90 F, em comparação com a média de 40.4 °C / 105 F , variando de 21.2 a 68.8 °C para a classe Gaming.
(+) A parte inferior aquece até um máximo de 30 °C / 86 F, em comparação com a média de 43.2 °C / 110 F
(+) Em uso inativo, a temperatura média para o lado superior é 24.5 °C / 76 F, em comparação com a média do dispositivo de 33.9 °C / ### class_avg_f### F.
(+) Jogando The Witcher 3, a temperatura média para o lado superior é 27.2 °C / 81 F, em comparação com a média do dispositivo de 33.9 °C / ## #class_avg_f### F.
(+) Os apoios para as mãos e o touchpad são mais frios que a temperatura da pele, com um máximo de 25.2 °C / 77.4 F e, portanto, são frios ao toque.
(+) A temperatura média da área do apoio para as mãos de dispositivos semelhantes foi 28.8 °C / 83.8 F (+3.6 °C / 6.4 F).
| Uniwell Technology GM7AG8N Liquid Cooling Box Intel Core i9-12900H, NVIDIA GeForce RTX 3080 Ti Laptop GPU | MSI Titan GT77 12UHS Intel Core i9-12900HX, NVIDIA GeForce RTX 3080 Ti Laptop GPU | Aorus 17X XES Intel Core i9-12900HX, NVIDIA GeForce RTX 3070 Ti Laptop GPU | Razer Blade 17 Early 2022 Intel Core i9-12900H, NVIDIA GeForce RTX 3080 Ti Laptop GPU | MSI Stealth GS77 12UHS-083US Intel Core i7-12700H, NVIDIA GeForce RTX 3080 Ti Laptop GPU | Asus ROG Zephyrus S17 GX703HSD Intel Core i9-11900H, NVIDIA GeForce RTX 3080 Laptop GPU | |
|---|---|---|---|---|---|---|
| Heat | -47% | -65% | -58% | -55% | -59% | |
| Maximum Upper Side * (°C) | 32 | 40.8 -27% | 54 -69% | 50 -56% | 50.6 -58% | 59 -84% |
| Maximum Bottom * (°C) | 30 | 52.4 -75% | 58 -93% | 56 -87% | 59.6 -99% | 53 -77% |
| Idle Upper Side * (°C) | 26.4 | 34.6 -31% | 37 -40% | 36 -36% | 30 -14% | 35 -33% |
| Idle Bottom * (°C) | 25 | 38.4 -54% | 39 -56% | 38 -52% | 37.4 -50% | 35 -40% |
* ... menor é melhor
Teste de Estresse - Muito Overclocking Headroom
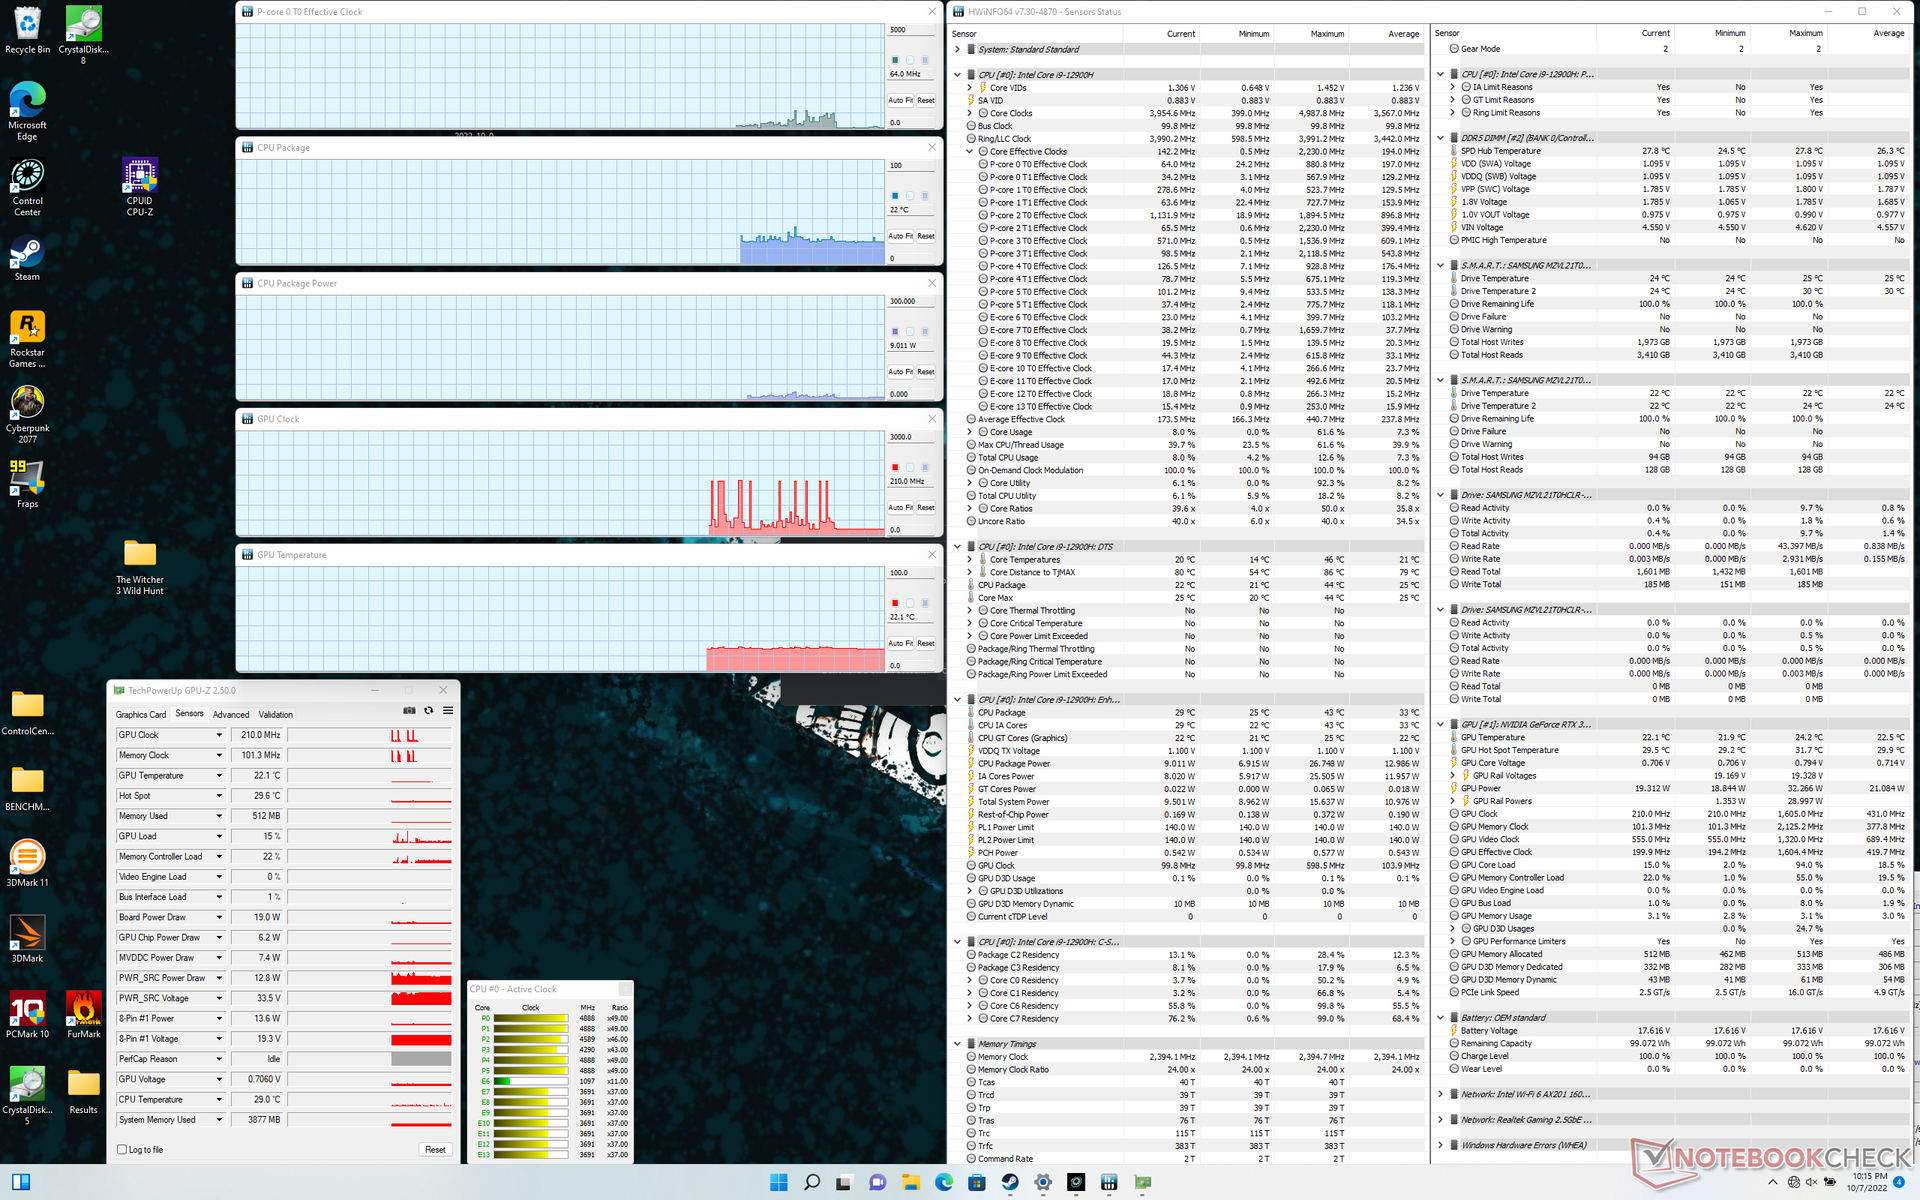
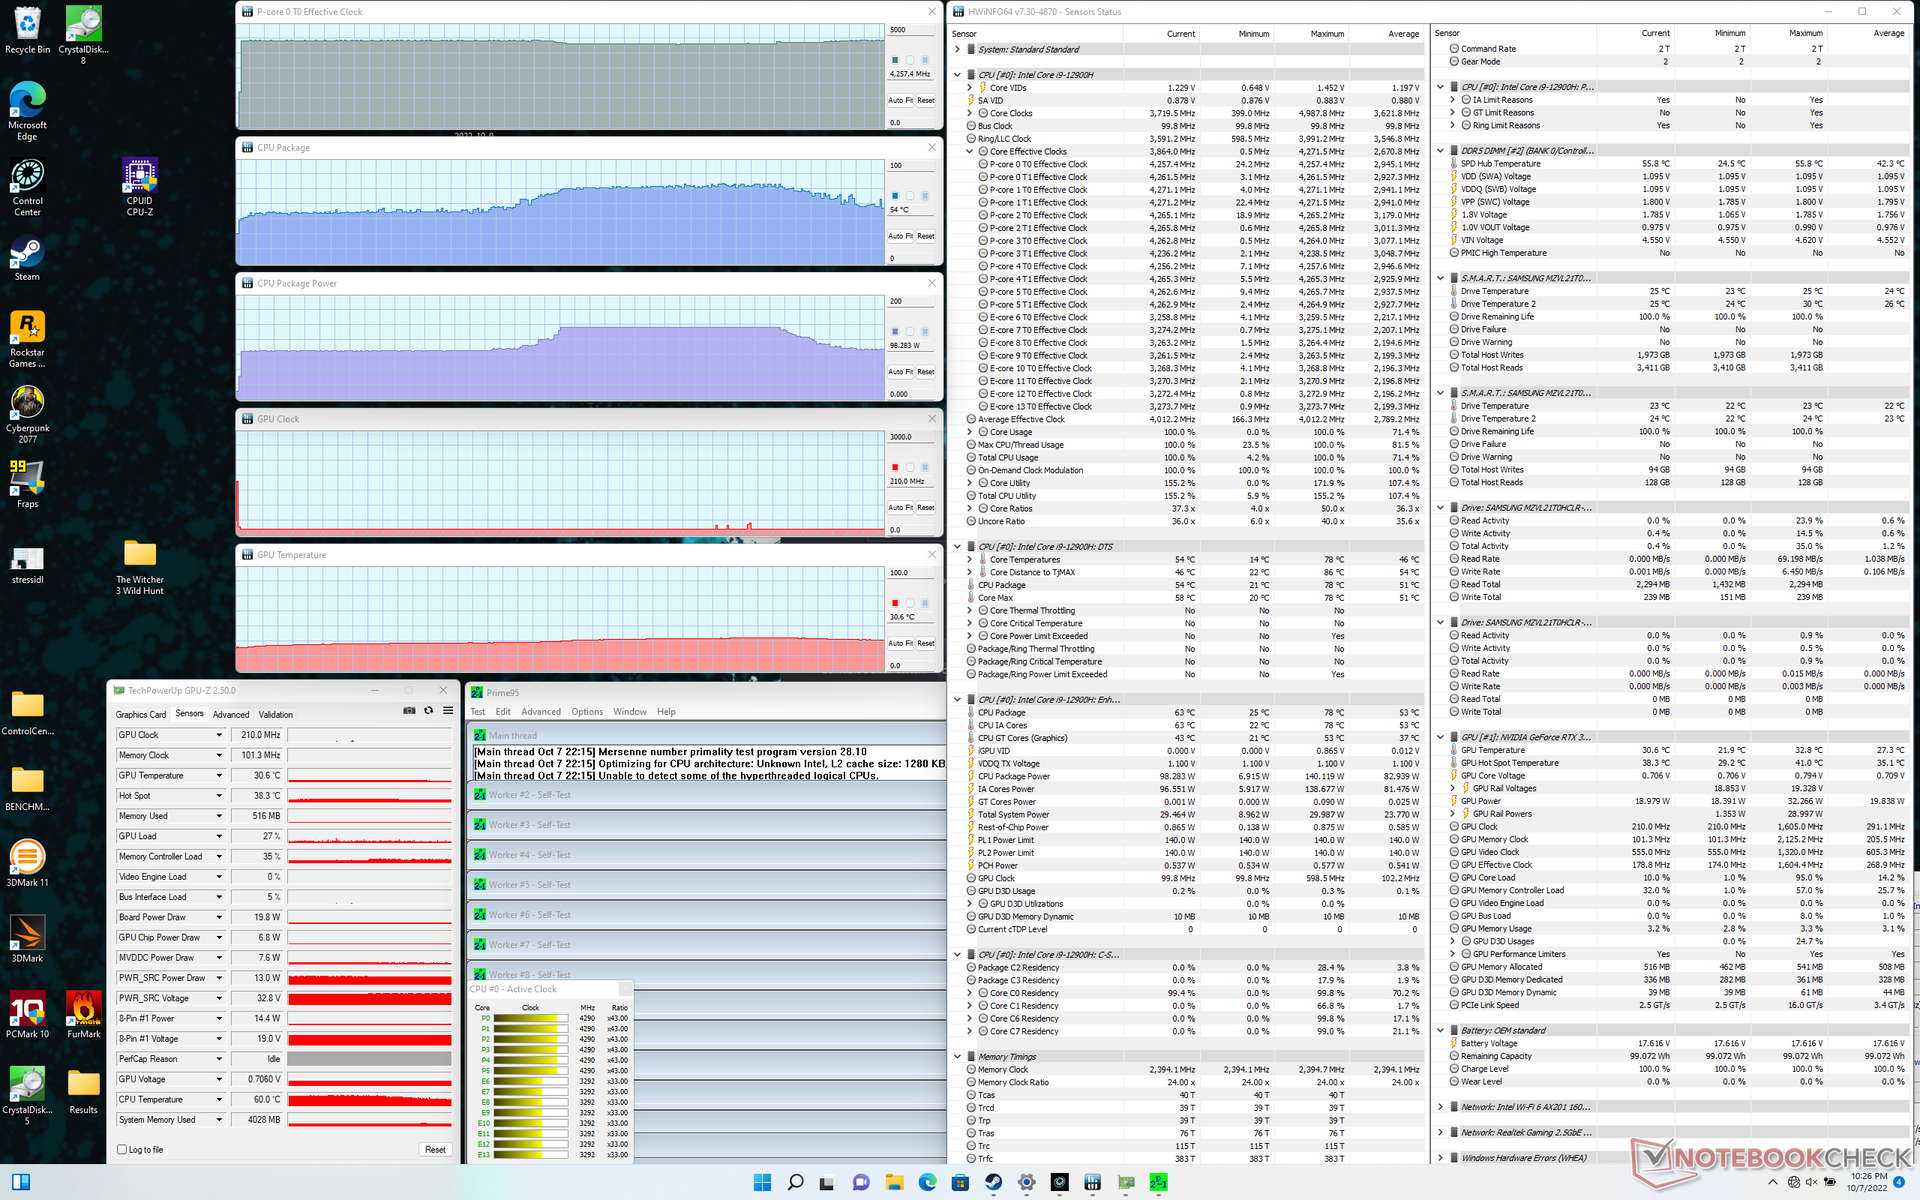
O sistema não apresenta problemas em manter uma alta taxa de relógio Turbo Boost de 4,3 GHz quando a caixa de resfriamento e os ventiladores internos são ajustados para seus respectivos máximos. A CPU estabilizaria a uma alta taxa de clock de 4,3 GHz, baixa temperatura central de 54 C, e um alto consumo de energia da placa de 98 W quando em funcionamento Prime95. Executando este mesmo teste Prime95 no MSI Vetor GP66 com exatamente a mesma CPU resultaria em taxas de relógio centrais mais lentas, uma temperatura mais alta e um menor consumo de energia de 3,0 GHz, 90 C, e 70 W, respectivamente.
A temperatura e o consumo de energia ao executar Prime95 às vezes atingiriam 78 C e 140 W, respectivamente, sem afetar as taxas do relógio. Não sabemos ao certo por que isto ocorre, mas é notável, no entanto
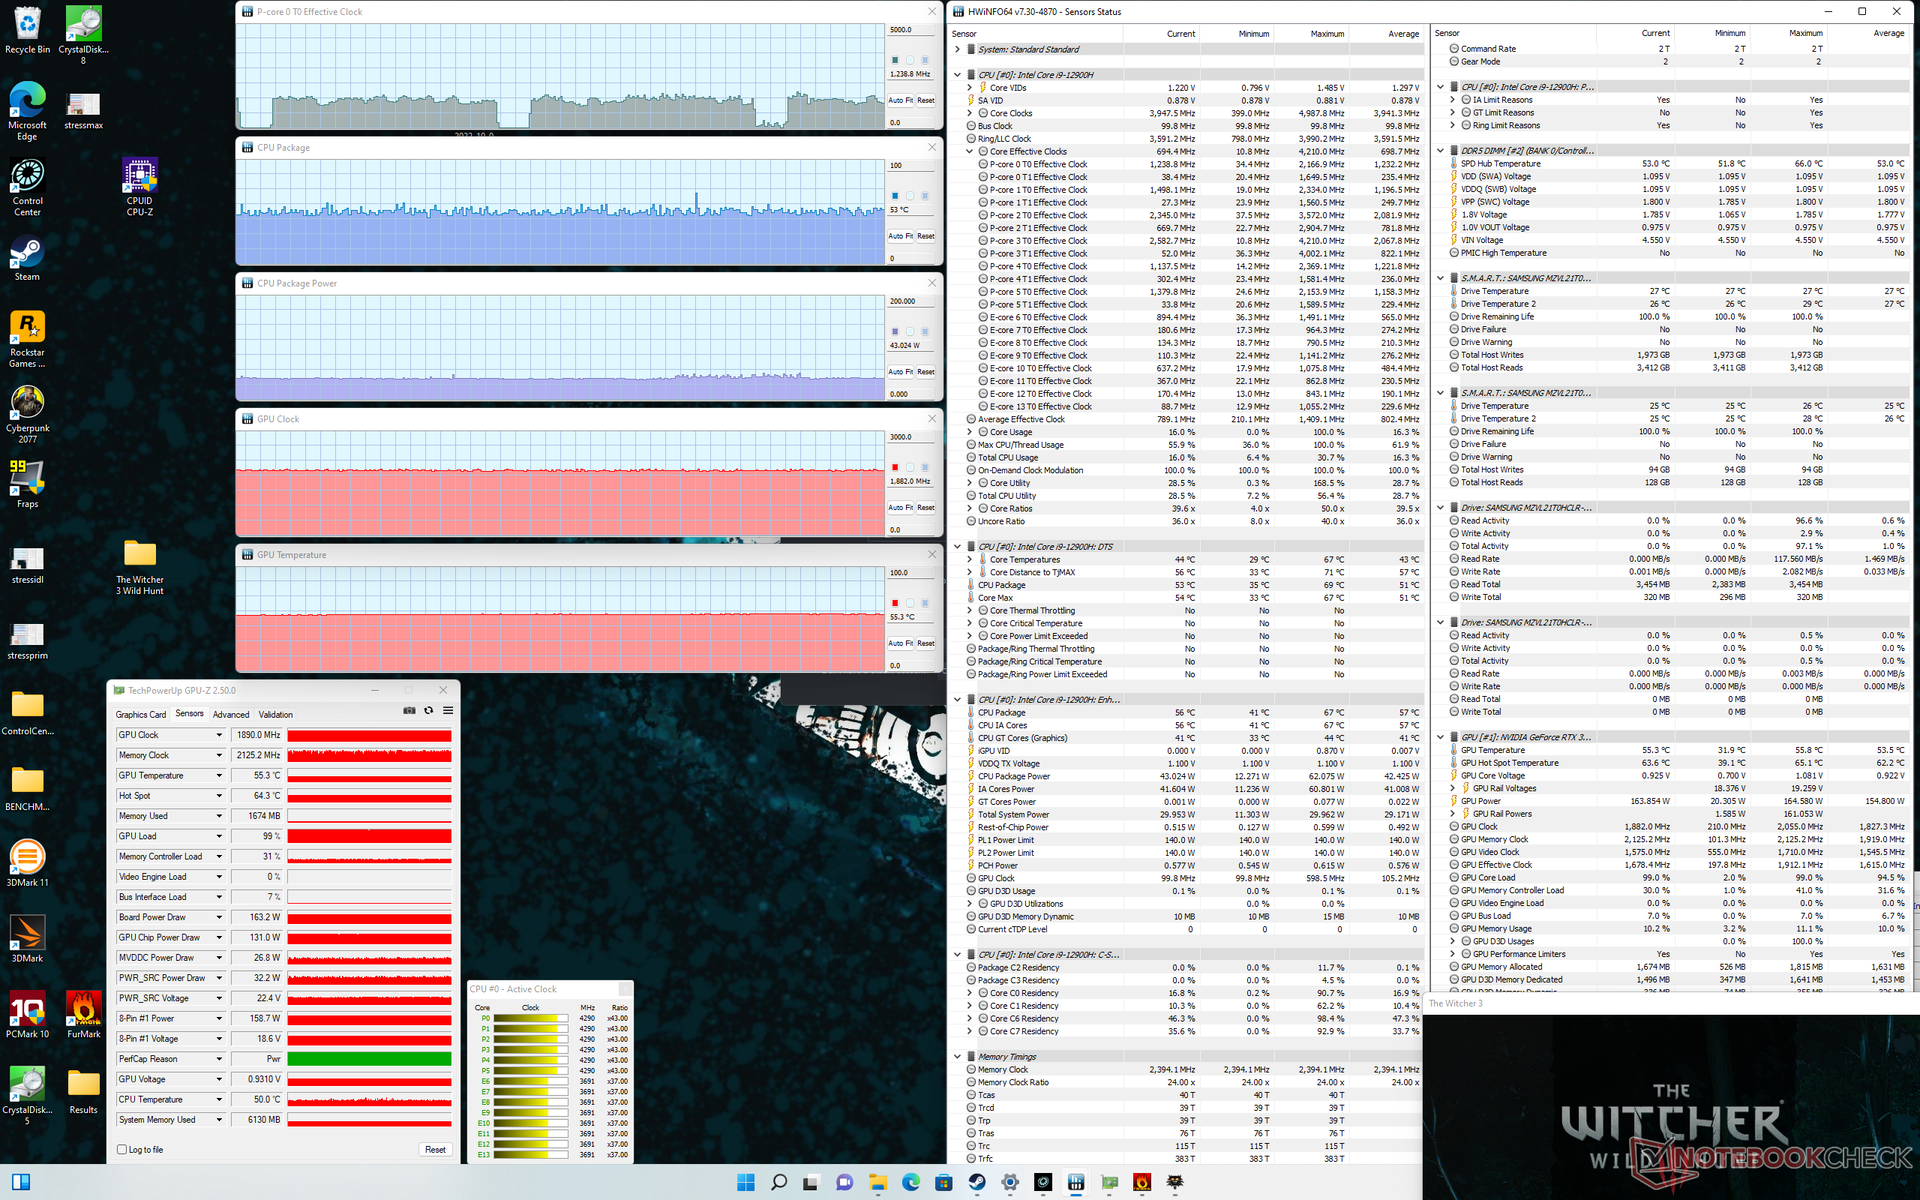
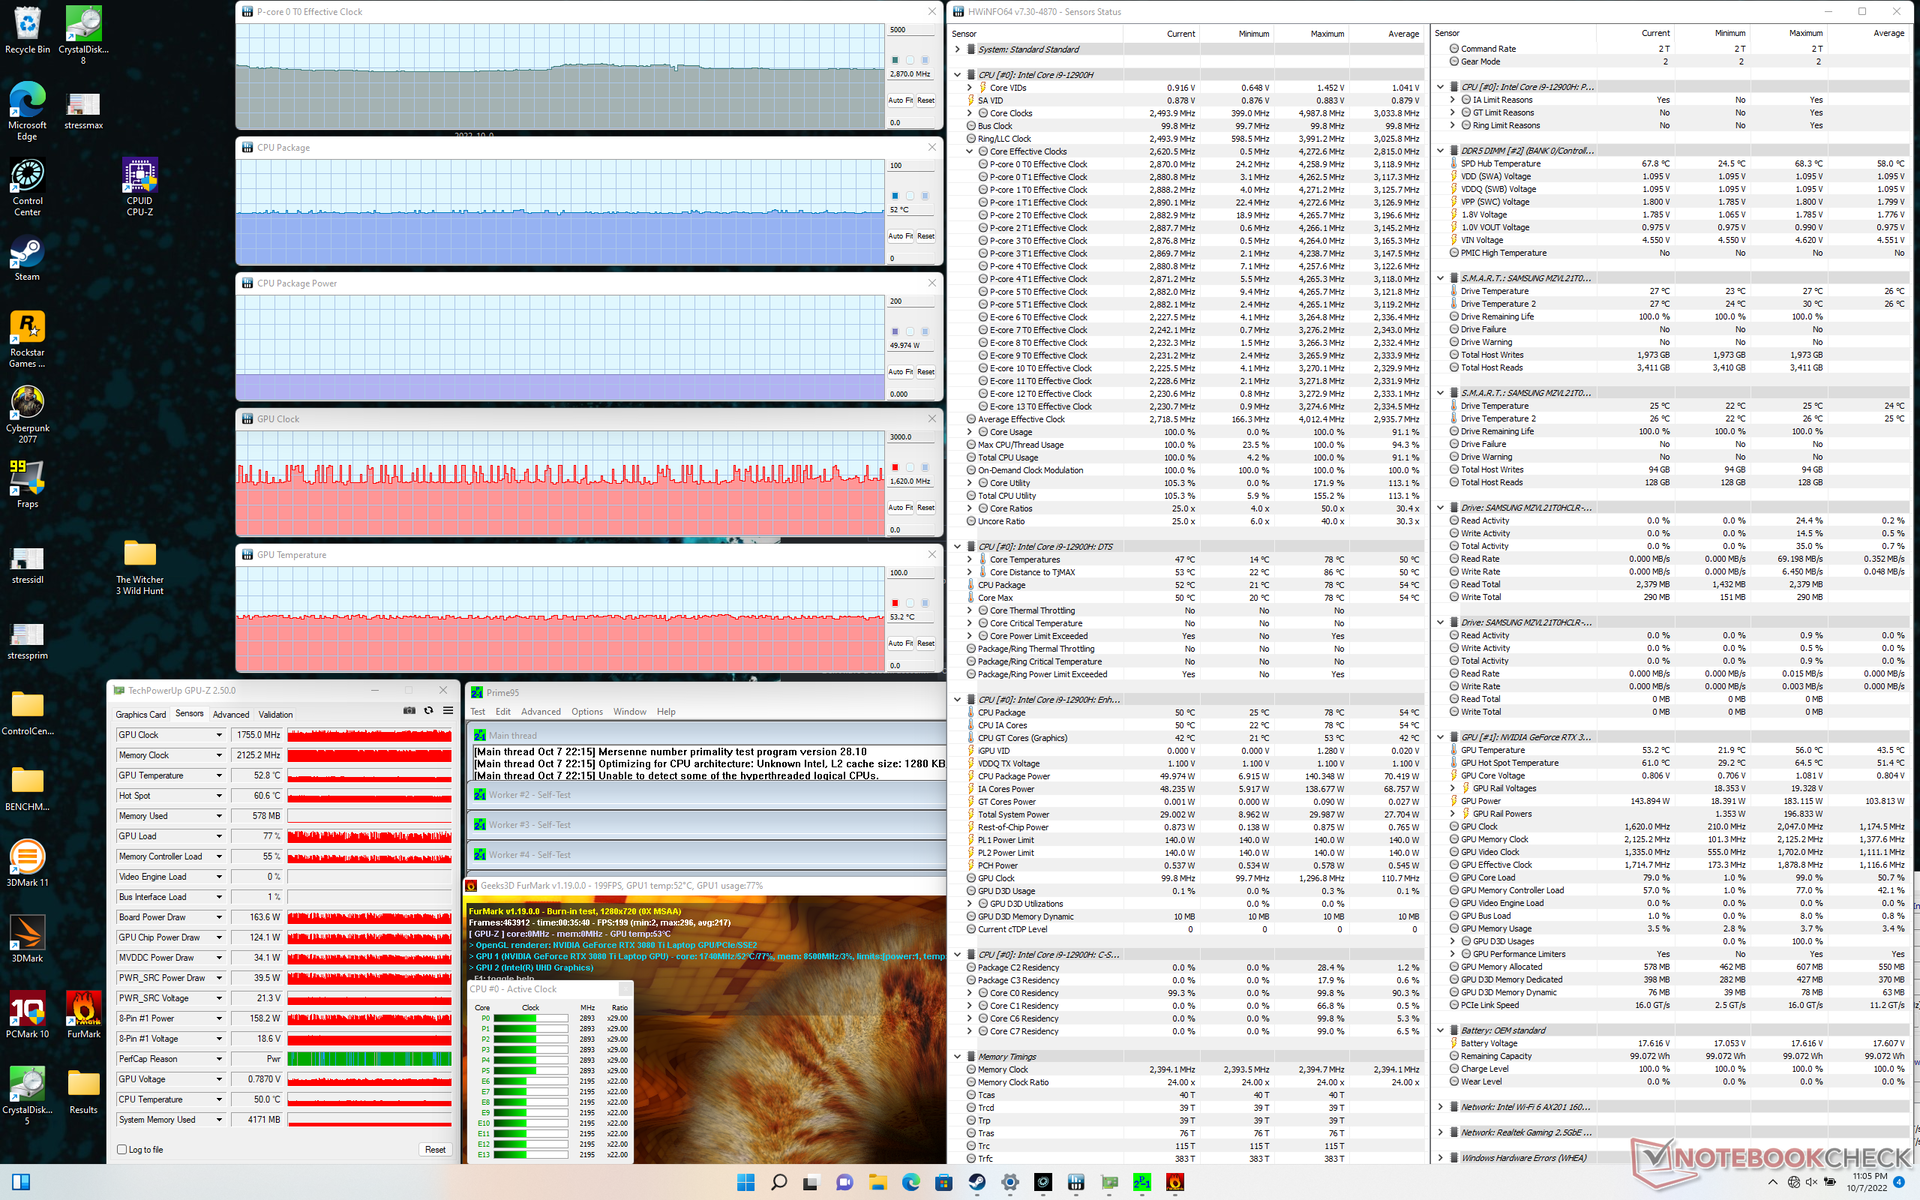
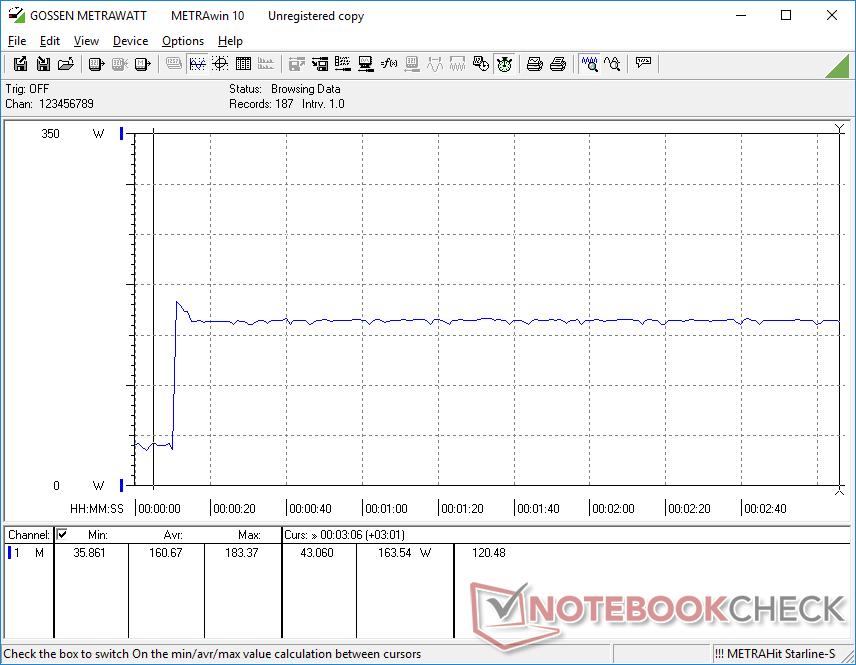
A GPU se estabilizaria em 1890 MHz, 2125 MHz VRAM, 55 C, e 163 W (contra sua TGP nominal de 175 W) quando em funcionamento Witcher 3. A repetição deste teste no MSI GS77 com a mesma GPU de 3080 Ti resultaria em uma taxa de relógio mais lenta de 1432 MHz e VRAM de 1750 MHz, temperatura mais quente de 75 C e menor consumo de 105 W. Os benefícios de uma caixa de resfriamento de água externa são muito claros a este respeito.
Funcionar com bateria limita o desempenho, como seria de se esperar. Um teste Fire Strike nas baterias retornaria pontuações de Física e Gráficos de apenas 11276 e 4393 pontos, respectivamente, em comparação com 30601 e 30959 pontos quando em rede elétrica.
| Relógio CPU (GHz) | Relógio GPU (MHz) | Temperatura média da CPU (°C) | Temperatura média da GPU (°C) | |
| System Idle | -- | -- | 22 | 22 |
| Prime95 Stress | 4.3 | -- | 54 | 31 |
| Prime95 + FurMark Stress | 2.9 | ~1755 | 52 | 53 |
| Witcher 3 Stress | ~1.3 | 1890 | 53 | 55 |
Oradores
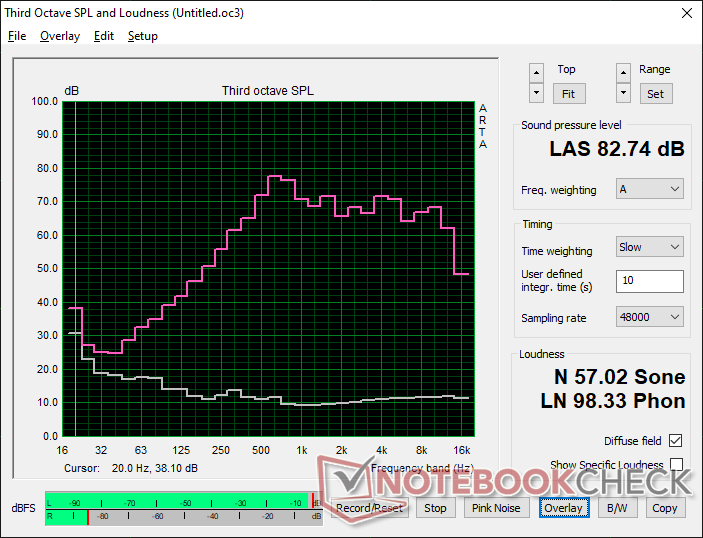
Uniwell Technology GM7AG8N Liquid Cooling Box análise de áudio
(+) | os alto-falantes podem tocar relativamente alto (###valor### dB)
Graves 100 - 315Hz
(-) | quase nenhum baixo - em média 17.5% menor que a mediana
(±) | a linearidade dos graves é média (8% delta para a frequência anterior)
Médios 400 - 2.000 Hz
(±) | médios mais altos - em média 5% maior que a mediana
(±) | a linearidade dos médios é média (7.8% delta para frequência anterior)
Altos 2 - 16 kHz
(+) | agudos equilibrados - apenas 2.2% longe da mediana
(+) | os máximos são lineares (5.5% delta da frequência anterior)
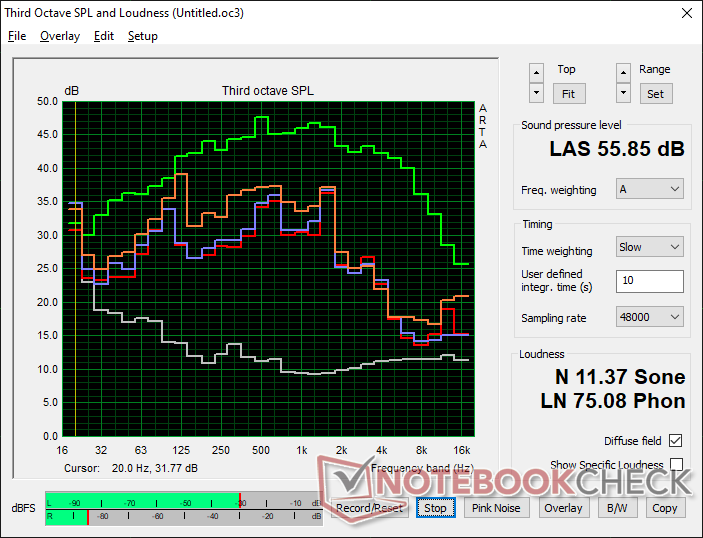
Geral 100 - 16.000 Hz
(±) | a linearidade do som geral é média (15.1% diferença em relação à mediana)
Comparado com a mesma classe
» 32% de todos os dispositivos testados nesta classe foram melhores, 6% semelhantes, 62% piores
» O melhor teve um delta de 6%, a média foi 18%, o pior foi 132%
Comparado com todos os dispositivos testados
» 21% de todos os dispositivos testados foram melhores, 4% semelhantes, 75% piores
» O melhor teve um delta de 4%, a média foi 23%, o pior foi 134%
Apple MacBook Pro 16 2021 M1 Pro análise de áudio
(+) | os alto-falantes podem tocar relativamente alto (###valor### dB)
Graves 100 - 315Hz
(+) | bons graves - apenas 3.8% longe da mediana
(+) | o baixo é linear (5.2% delta para a frequência anterior)
Médios 400 - 2.000 Hz
(+) | médios equilibrados - apenas 1.3% longe da mediana
(+) | médios são lineares (2.1% delta para frequência anterior)
Altos 2 - 16 kHz
(+) | agudos equilibrados - apenas 1.9% longe da mediana
(+) | os máximos são lineares (2.7% delta da frequência anterior)
Geral 100 - 16.000 Hz
(+) | o som geral é linear (4.6% diferença em relação à mediana)
Comparado com a mesma classe
» 0% de todos os dispositivos testados nesta classe foram melhores, 0% semelhantes, 100% piores
» O melhor teve um delta de 5%, a média foi 17%, o pior foi 45%
Comparado com todos os dispositivos testados
» 0% de todos os dispositivos testados foram melhores, 0% semelhantes, 100% piores
» O melhor teve um delta de 4%, a média foi 23%, o pior foi 134%
Gestão de energia
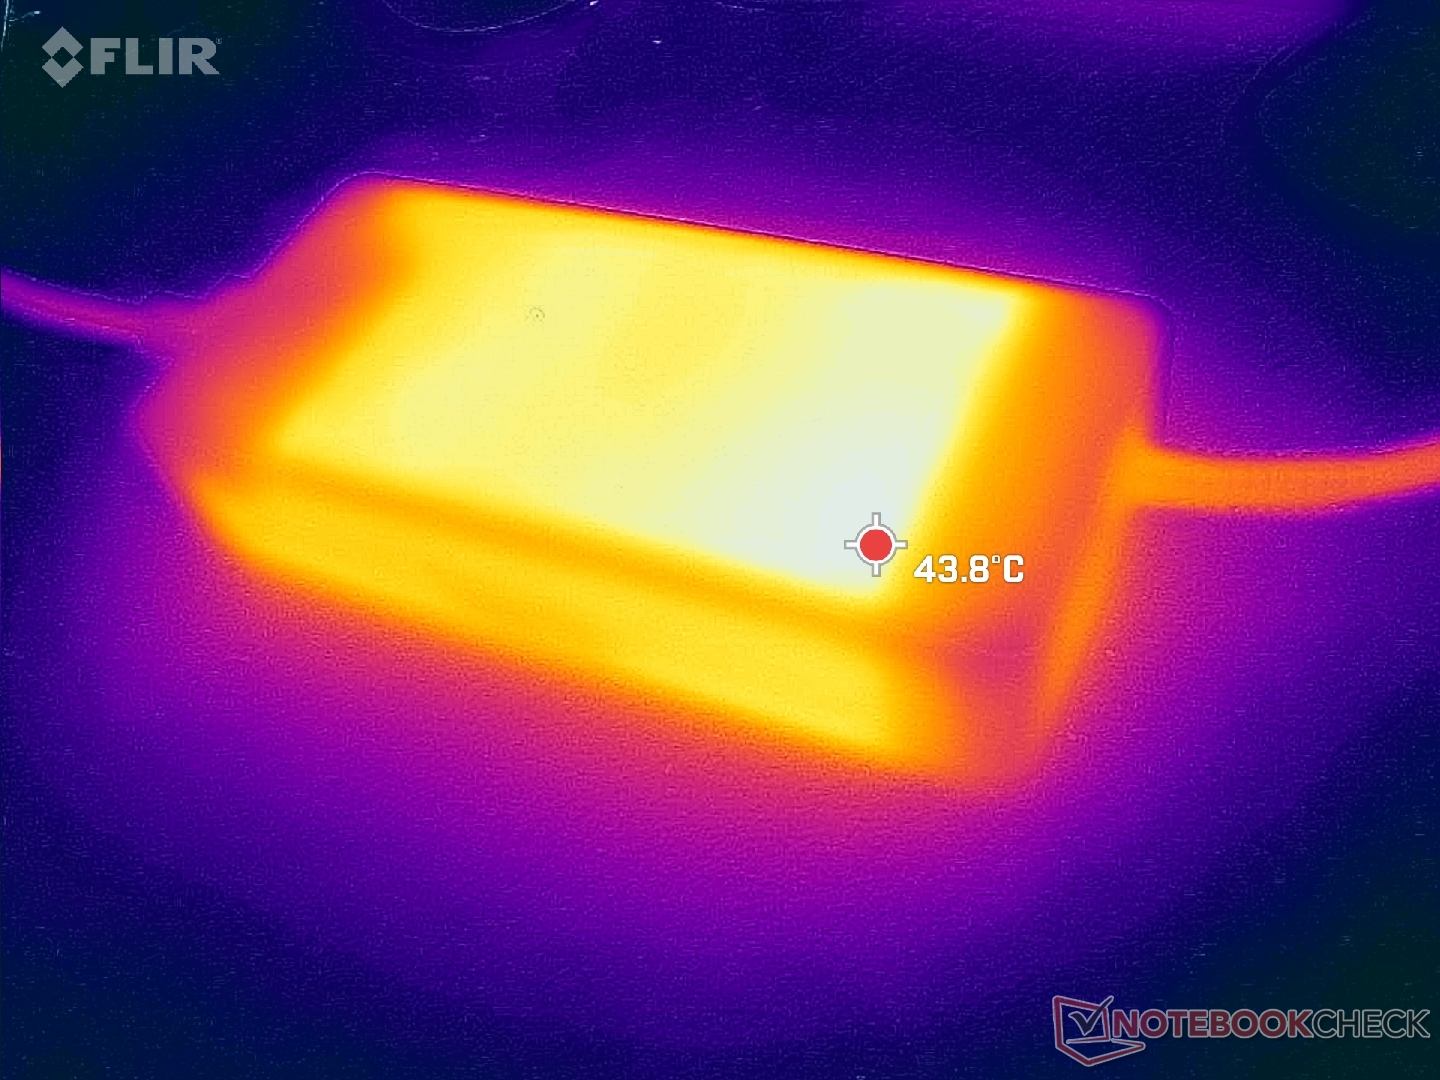
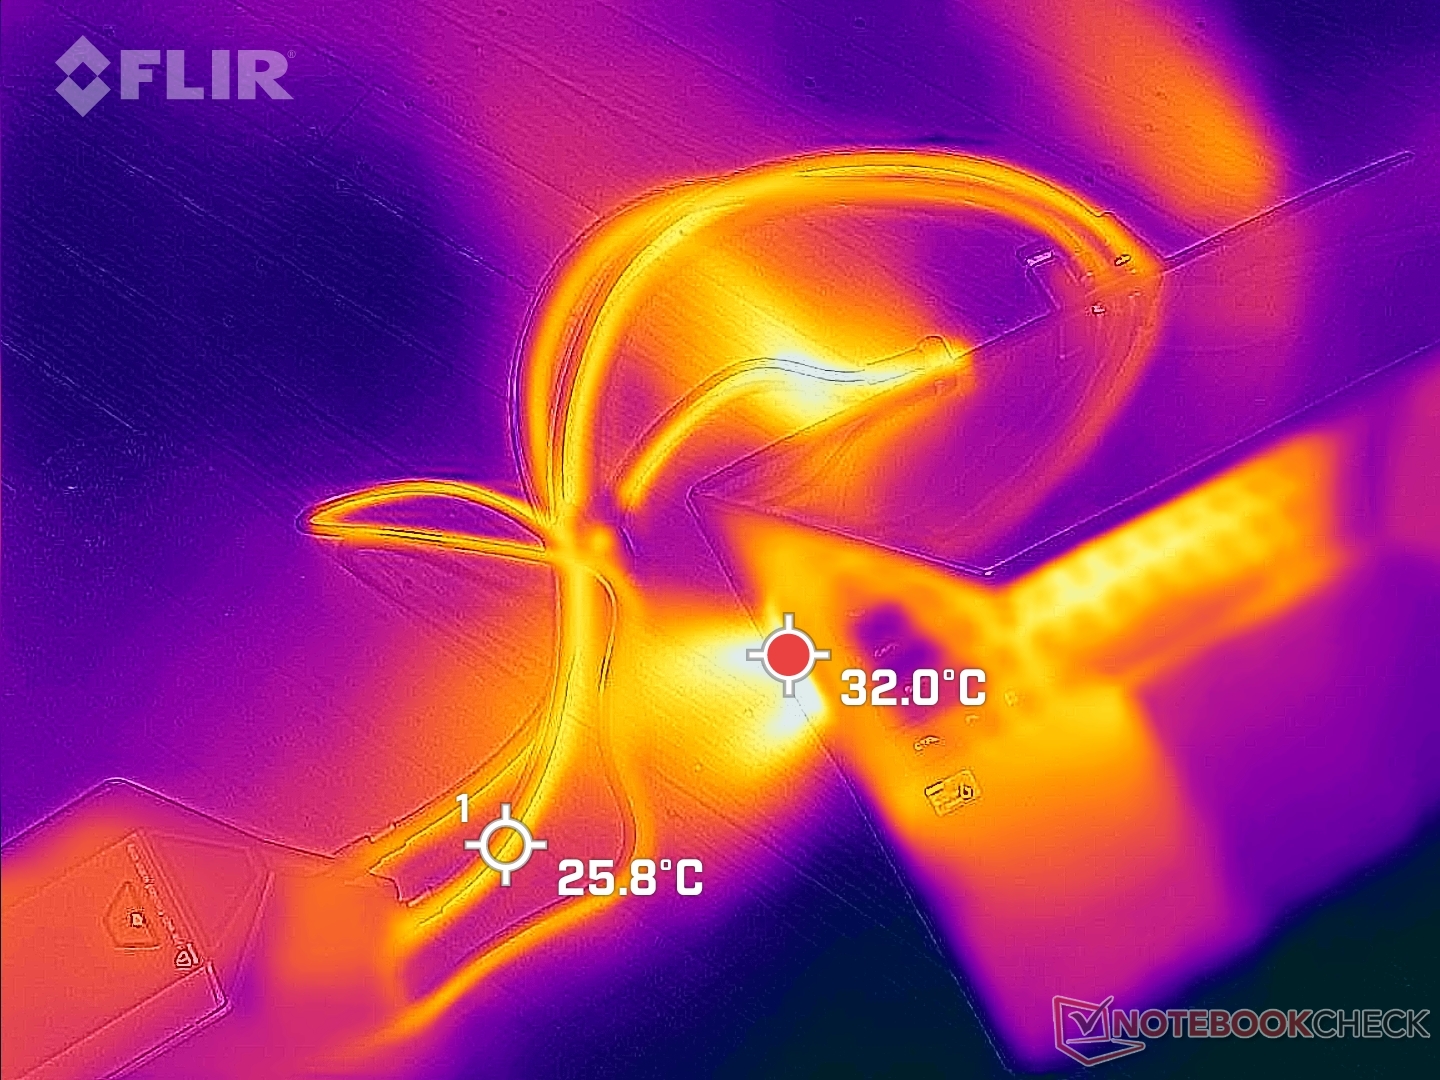
Consumo de energia - Yikes!
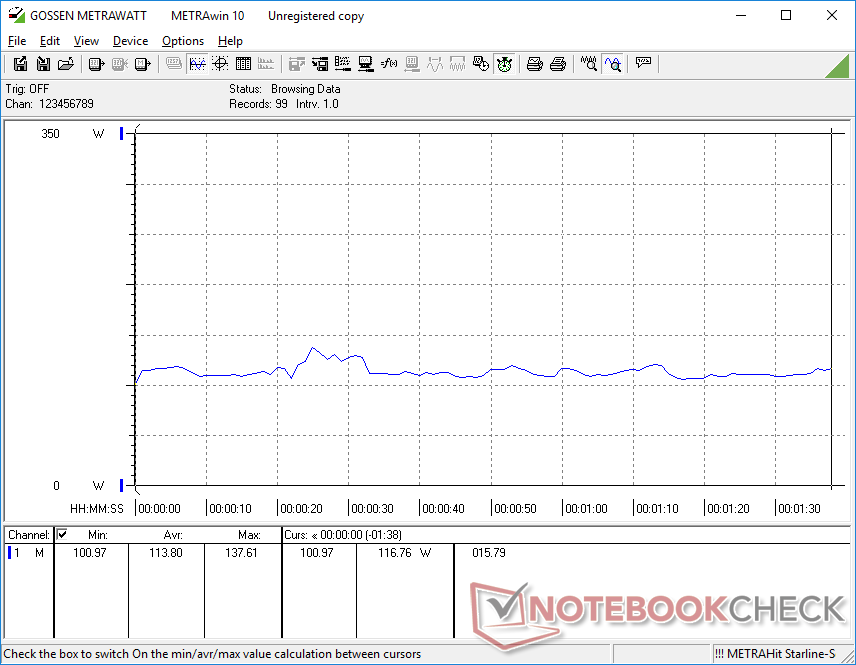
A movimentação na área de trabalho com o mais baixo brilho e configurações de perfil de potência e com a caixa de resfriamento desconectada extrai apenas 14 W da tomada. Em contraste, ociosos na área de trabalho nas configurações mais altas de brilho e perfil de potência e com a caixa de resfriamento ativa atrairia quase 44 W em comparação com ~35 W ou menos naAsus ROG Zephyrus S17 ou Razer Blade 17. Você pode querer desligar a caixa de resfriamento se não estiver em uso para economizar nas contas de energia
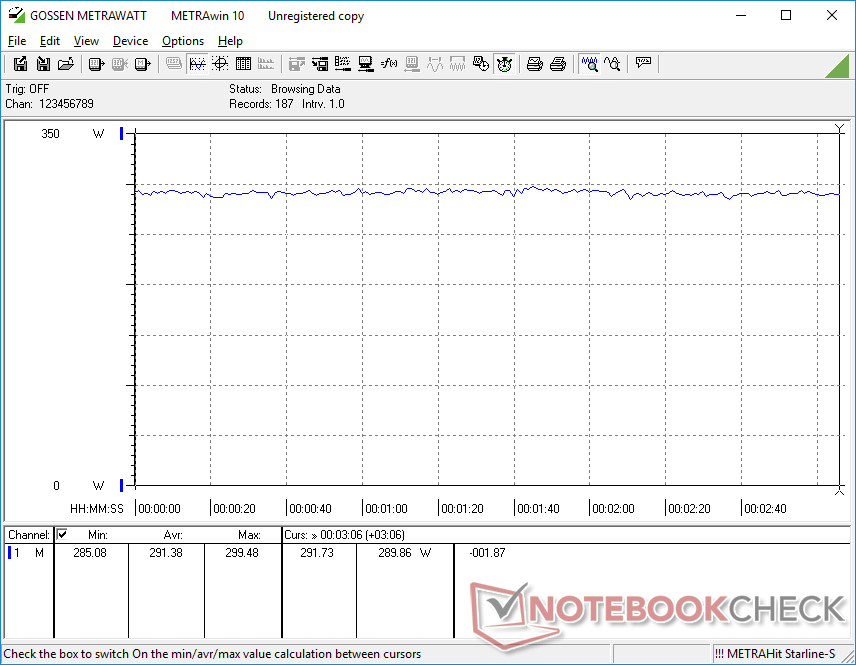
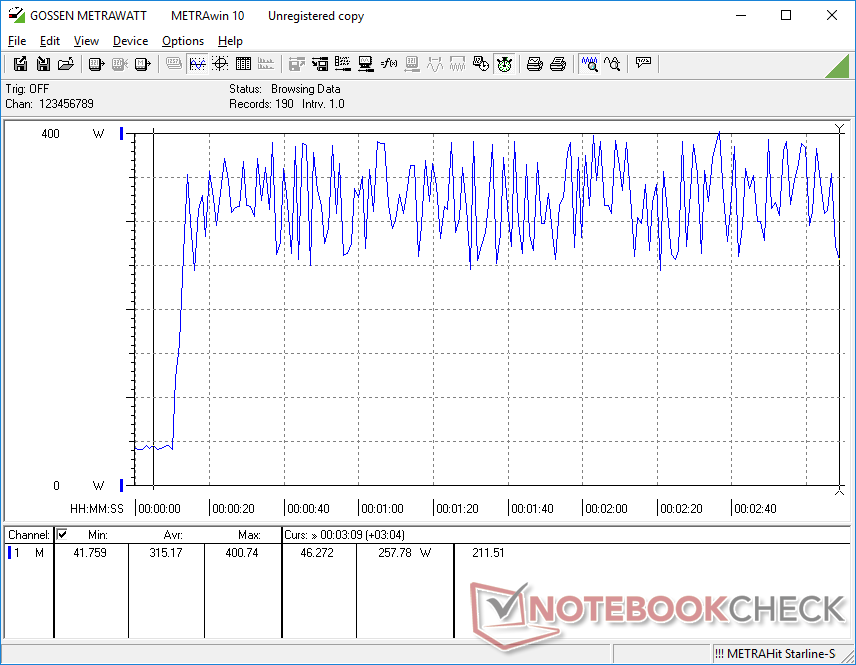
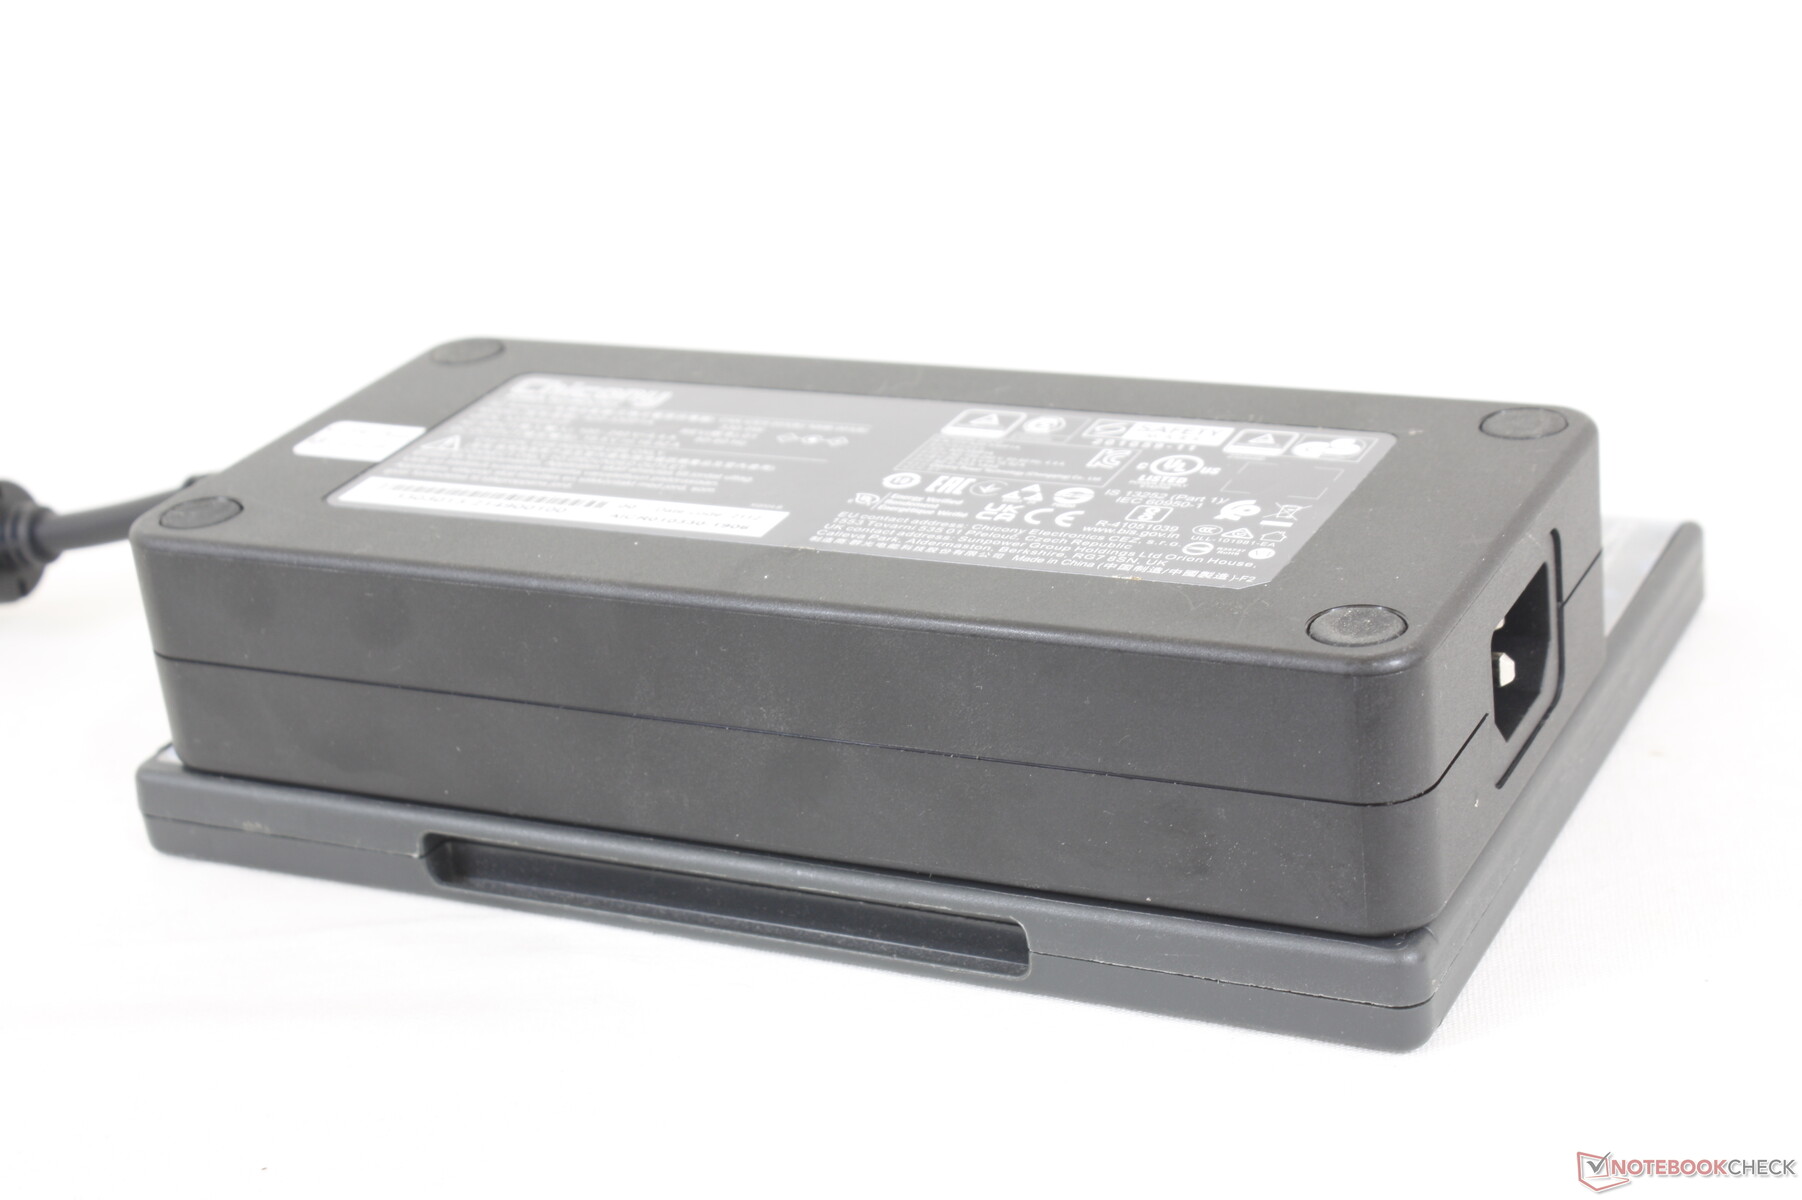
O adaptador AC grande (~18,5 x 8,5 x 3,5 cm) é classificado para 330 W. Funcionamento Witcher 3 já consome 291 W para ser significativamente mais do que a maioria dos outros laptops, incluindo até mesmo o maciço MSI Titan GT77 em quase 15%. Se a CPU e a GPU estiverem cada uma com 100% de utilização, o consumo de energia pode variar entre 250 W e 400 W, como mostram nossos gráficos abaixo. O adaptador AC de 330 W incluído é suficiente para fins de jogos, mas é evidentemente necessária mais energia se você pretende rodar tanto a CPU quanto a GPU em seus respectivos máximos.
| desligado | |
| Ocioso | |
| Carga |
|
Key:
min: | |
| Uniwell Technology GM7AG8N Liquid Cooling Box i9-12900H, GeForce RTX 3080 Ti Laptop GPU, Samsung PM9A1 MZVL21T0HCLR, IPS, 2560x1600, 17" | MSI Titan GT77 12UHS i9-12900HX, GeForce RTX 3080 Ti Laptop GPU, Samsung PM9A1 MZVL21T0HCLR, IPS-Level, 1920x1080, 17.3" | Aorus 17X XES i9-12900HX, GeForce RTX 3070 Ti Laptop GPU, Gigabyte AG470S1TB-SI B10, IPS, 1920x1080, 17.3" | Razer Blade 17 Early 2022 i9-12900H, GeForce RTX 3080 Ti Laptop GPU, Samsung PM9A1 MZVL21T0HCLR, IPS, 3840x2160, 17.3" | MSI Stealth GS77 12UHS-083US i7-12700H, GeForce RTX 3080 Ti Laptop GPU, Micron 3400 1TB MTFDKBA1T0TFH, IPS, 2560x1440, 17.3" | Asus ROG Zephyrus S17 GX703HSD i9-11900H, GeForce RTX 3080 Laptop GPU, Samsung PM9A1 MZVL22T0HBLB, IPS, 2560x1440, 17.3" | |
|---|---|---|---|---|---|---|
| Power Consumption | -10% | 5% | 15% | 22% | 14% | |
| Idle Minimum * (Watt) | 13.7 | 30.21 -121% | 18 -31% | 17 -24% | 20 -46% | 21.7 -58% |
| Idle Average * (Watt) | 38 | 32.42 15% | 28 26% | 23 39% | 21.4 44% | 27 29% |
| Idle Maximum * (Watt) | 43.4 | 33.7 22% | 36 17% | 34 22% | 27 38% | 33 24% |
| Load Average * (Watt) | 113.8 | 125.09 -10% | 153 -34% | 120 -5% | 100.5 12% | 108 5% |
| Witcher 3 ultra * (Watt) | 291 | 256 12% | 221 24% | 229 21% | 165 43% | 195 33% |
| Load Maximum * (Watt) | 400.8 | 321.88 20% | 290 28% | 243 39% | 247.1 38% | 210 48% |
* ... menor é melhor
Power Consumption Witcher 3 / Stresstest
Power Consumption external Monitor
Vida útil da bateria - Na verdade, nada mal
A capacidade da bateria é semelhante à do MSI Stealth GS77 a 99 Wh. Os tempos gerais de funcionamento são similares ao MSI GT77, apesar de suas diferenças de tamanho.
O USB-PD não é suportado e por isso o laptop não pode ser carregado via USB-C.
| Uniwell Technology GM7AG8N Liquid Cooling Box i9-12900H, GeForce RTX 3080 Ti Laptop GPU, 99 Wh | MSI Titan GT77 12UHS i9-12900HX, GeForce RTX 3080 Ti Laptop GPU, 99.9 Wh | Aorus 17X XES i9-12900HX, GeForce RTX 3070 Ti Laptop GPU, 99 Wh | Razer Blade 17 Early 2022 i9-12900H, GeForce RTX 3080 Ti Laptop GPU, 82 Wh | MSI Stealth GS77 12UHS-083US i7-12700H, GeForce RTX 3080 Ti Laptop GPU, 99 Wh | Asus ROG Zephyrus S17 GX703HSD i9-11900H, GeForce RTX 3080 Laptop GPU, 90 Wh | |
|---|---|---|---|---|---|---|
| Duração da bateria | -7% | -25% | -19% | 0% | 38% | |
| Reader / Idle (h) | 8.7 | 7.1 -18% | 10.8 24% | |||
| WiFi v1.3 (h) | 7 | 6.9 -1% | 4.4 -37% | 3.8 -46% | 6.2 -11% | 7.5 7% |
| Load (h) | 1.6 | 1.4 -13% | 1.4 -13% | 1.7 6% | 1.4 -13% | 2.7 69% |
| H.264 (h) | 7.2 | 3.8 | 4.8 | 7.2 | ||
| Witcher 3 ultra (h) | 1.5 | 1 |
Pro
Contra
Veredicto - Funciona Realmente
Uma bomba d'água externa é uma solução louca para resfriar um laptop para jogos. Ela não só é desajeitada com seus cabos e tubos, mas também faz do transporte um grande incômodo. Ela essencialmente ancora o laptop à mesa e desestimula ainda mais as viagens do que uma estação de acoplamento eGPU.
A caixa de resfriamento líquido é para um mercado relativamente pequeno de laptops, mas seu desempenho e ruído relativamente baixo são, no entanto, impressionantes e melhores do que o esperado. No entanto, ela enfrenta grandes desafios contra o crescente mercado de eGPU.
Os resultados, no entanto, são difíceis de ignorar. O desempenho geral é mais rápido do que a maioria dos outros laptops equipados com a mesma CPU Core i9-12900H e GPU RTX 3080 Ti, mesmo quando a Uniwell e a caixa de resfriamento estão configuradas com seus ventiladores mais baixos. É capaz de funcionar visivelmente mais silencioso do que os laptops para jogos tradicionais sem precisar acelerar o desempenho, o que não é algo que podemos dizer de quase nenhum outro laptop para jogos por aí.
Os resultados são igualmente impressionantes quando o sistema é ajustado para suas configurações máximas de ventiladores. A temperatura central estável de apenas cerca de 55 C é superior a 30 C mais fria do que na maioria dos laptops para jogos ultra-rápidos, sendo a temperatura mais baixa registrada que vimos para a categoria. Isto deixa muito espaço para os entusiastas se eles estiverem dispostos a tolerar o barulho mais alto dos ventiladores.
Preço e Disponibilidade
Nome preço e disponibilidade do modelo testado, se necessário desviando as variantes relevantes do equipamento. Afilie o link a uma loja da lista na janela de link.
Uniwell Technology GM7AG8N Liquid Cooling Box
- 10/13/2022 v7 (old)
Allen Ngo
Price comparison

