Eluktronics Mech-17 GP2 revisão de laptop: MSI GT77 Titan performance sem o tamanho
A Eluktronics Mech-17 GP2 substitui a Mech-17 GP do ano passado, trocando as opções do 12º gênero da Intel e Nvidia Ampere pelo 13º gênero da Intel e Nvidia Ada Lovelace, respectivamente. É notável por oferecer CPUs Core HX-series e gráficos de 175 W GeForce RTX 4090 apesar da pequena pegada em relação a outros laptops de jogo de 17 polegadas.
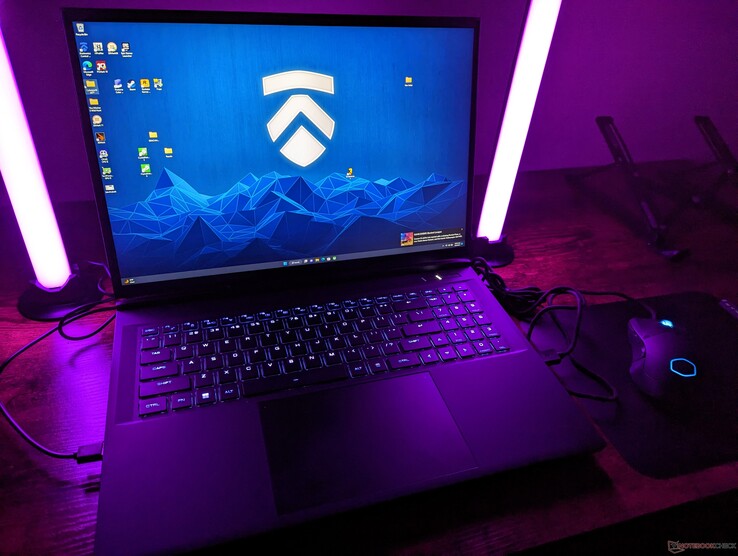
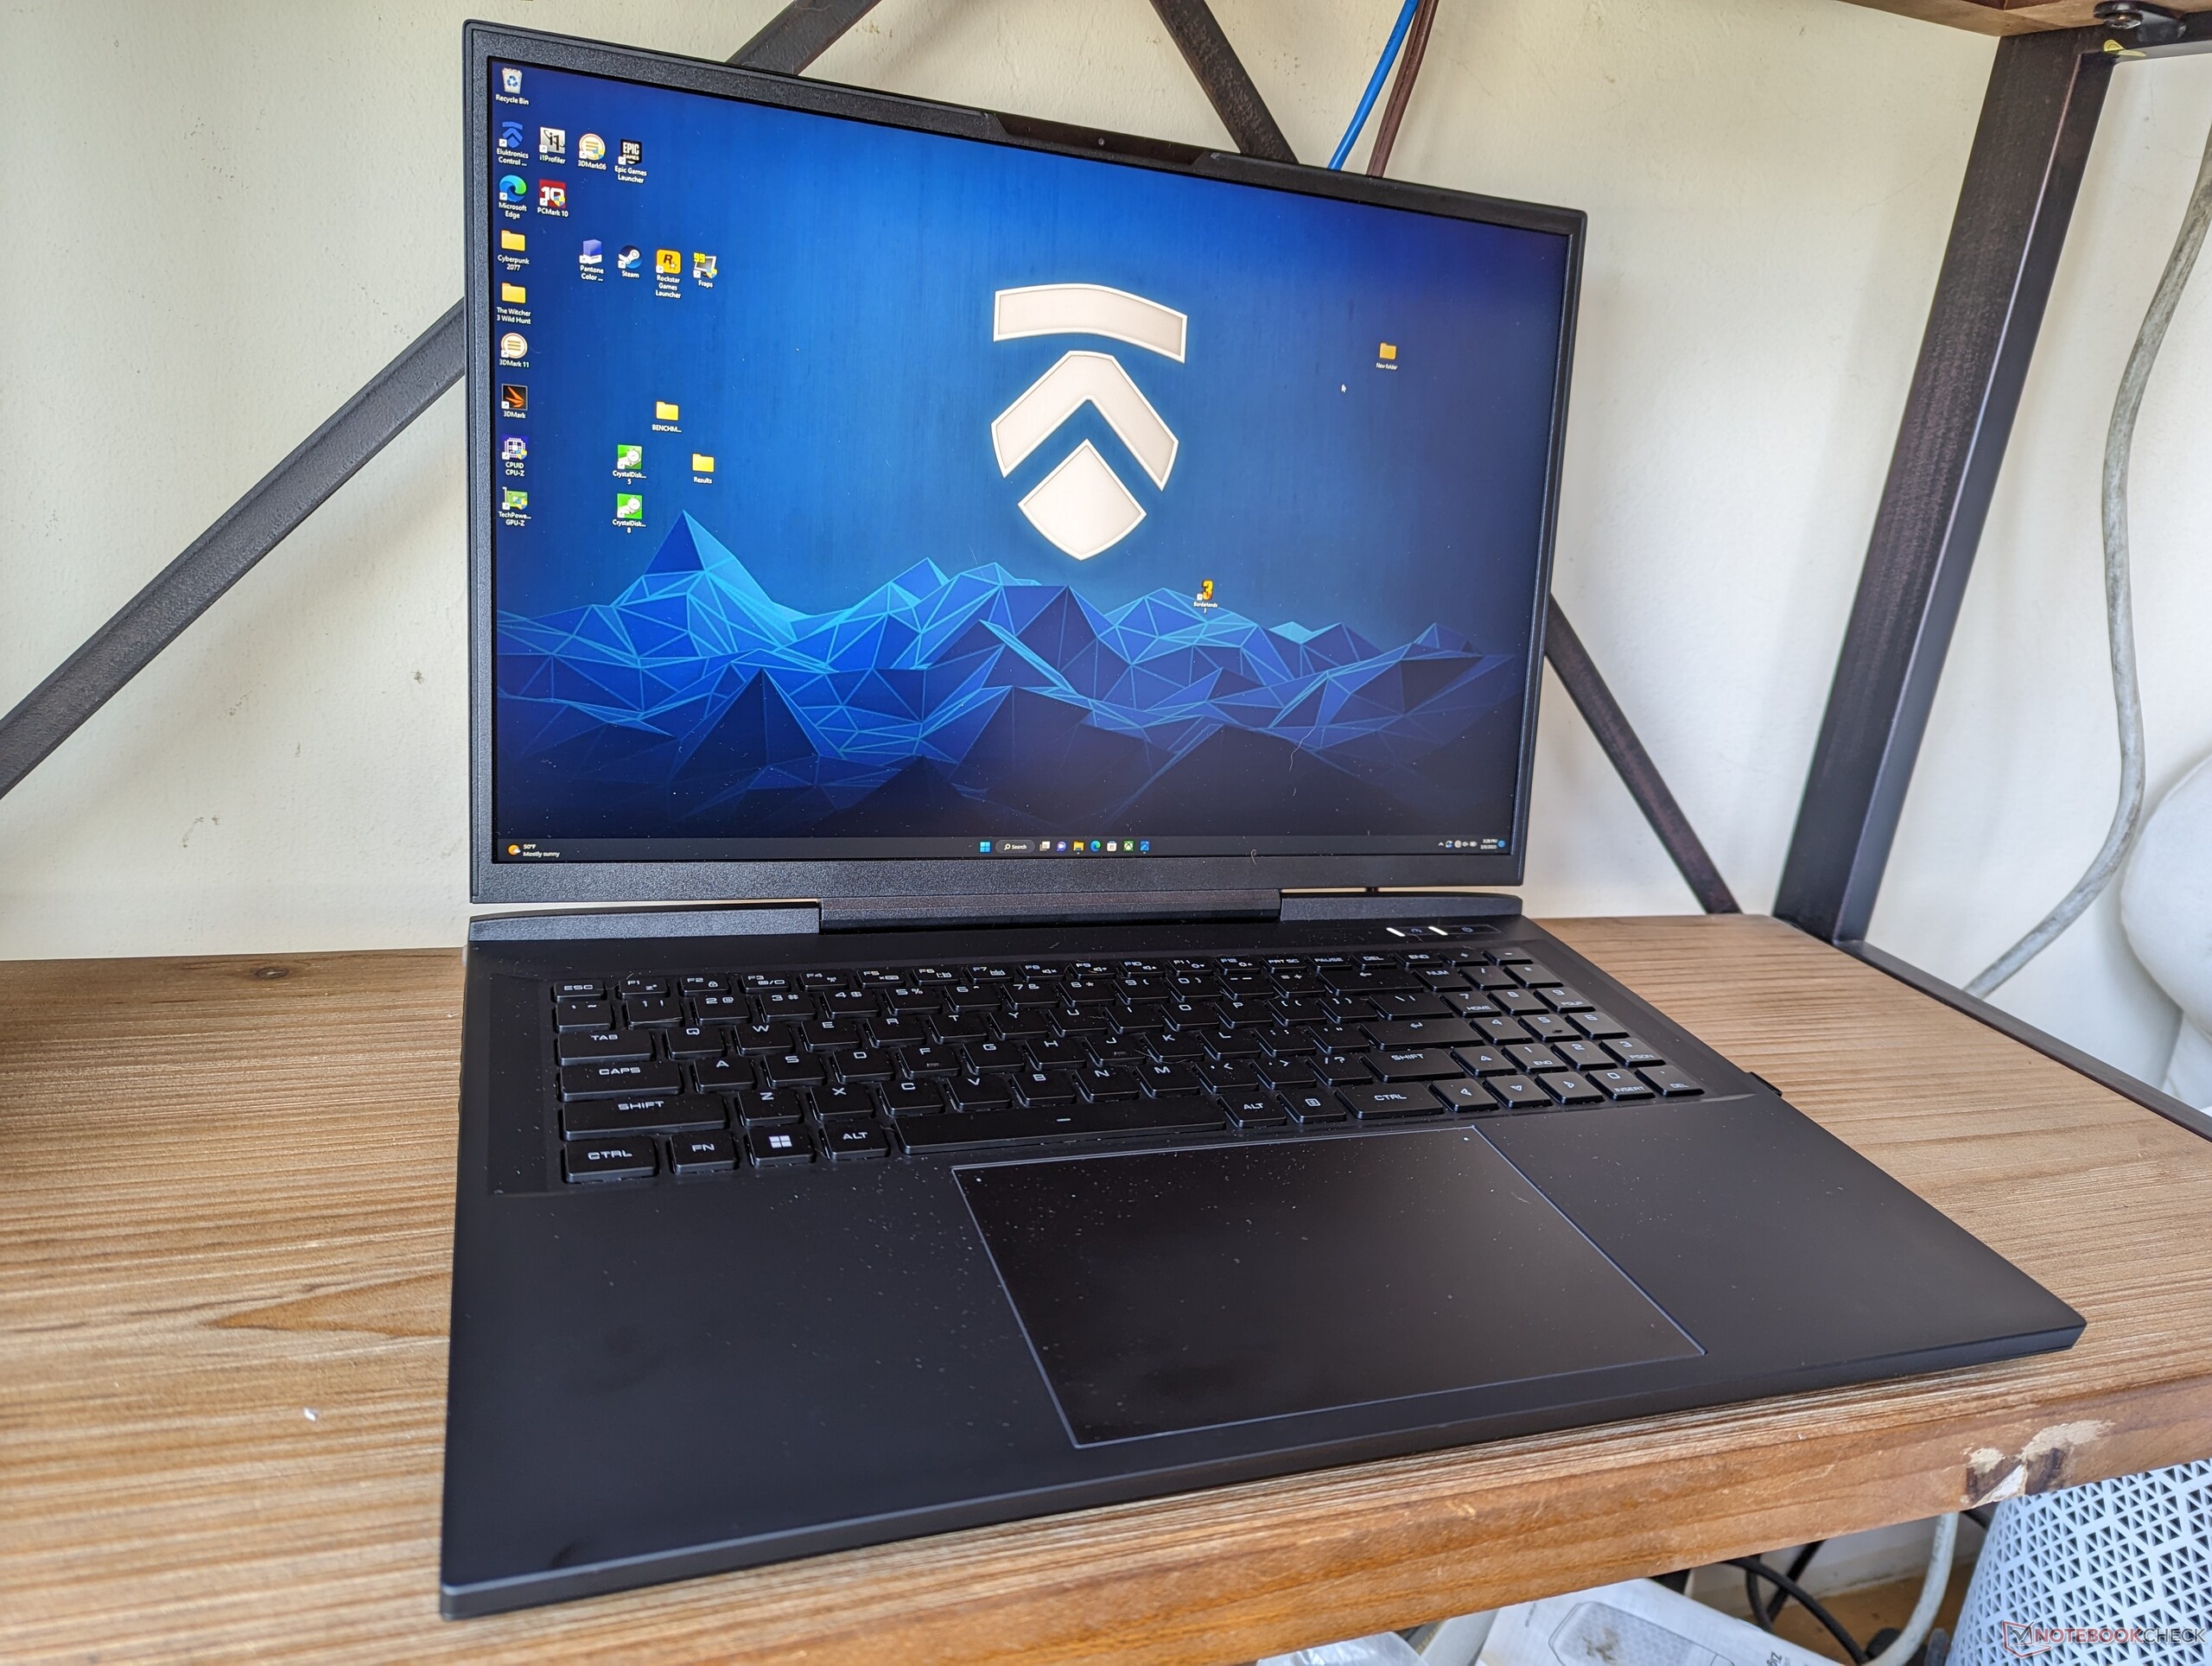
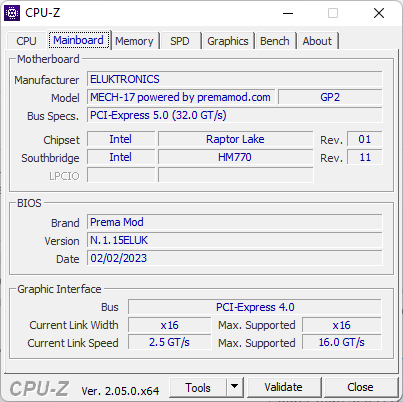
O Mech-17 GP2 é baseado em uma versão atualizada do projeto do ano passado da Uniwill Schenker Neo 17 M22. É essencialmente o Neo 17 E23, embora sob a marca Eluktronics. Há várias mudanças importantes na placa-mãe este ano, que detalharemos em nossas análises abaixo. Caso contrário, seus designs exteriores permanecem idênticos e por isso recomendamos verificar nossa revisão existente no Schenker Neo 17 M22 para saber mais sobre as características físicas do Mech-17 GP2.
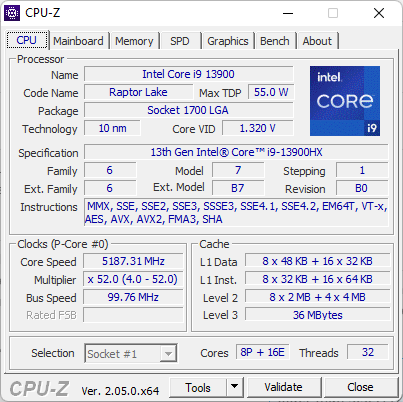
Nossa configuração em revisão foi totalmente configurada com o Core i9-13900HX e RTX 4090 por aproximadamente $3400 USD. SKUs menores estão disponíveis até o RTX 4070, mas todas as outras opções vêm com a mesma CPU e tela IPS 240 Hz 2560 x 1600.
As alternativas ao Mech-17 GP2 incluem outros laptops de alta qualidade de 17 polegadas como o Razer Blade 17, Alienware m17 R5, Asus Zephyrus S17, ou o MSI Titan GT77.
Mais análises da Eluktronics:
Possíveis concorrentes em comparação
Avaliação | Data | Modelo | Peso | Altura | Size | Resolução | Preço |
|---|---|---|---|---|---|---|---|
| 89.9 % v7 (old) | 03/2023 | Eluktronics Mech-17 GP2 i9-13900HX, GeForce RTX 4090 Laptop GPU | 2.9 kg | 27 mm | 17.00" | 2560x1600 | |
| 87.6 % v7 (old) | 09/2022 | Schenker XMG Neo 17 M22 R9 6900HX, GeForce RTX 3080 Ti Laptop GPU | 2.8 kg | 27 mm | 17.00" | 2560x1600 | |
| 82.1 % v7 (old) | 02/2023 | MSI Katana 17 B13VFK i7-13620H, GeForce RTX 4060 Laptop GPU | 2.8 kg | 25.2 mm | 17.30" | 1920x1080 | |
| 89 % v7 (old) | 02/2023 | MSI Titan GT77 HX 13VI i9-13950HX, GeForce RTX 4090 Laptop GPU | 3.5 kg | 23 mm | 17.30" | 3840x2160 | |
| 86.1 % v7 (old) | 01/2023 | Alienware m17 R5 (R9 6900HX, RX 6850M XT) R9 6900HX, Radeon RX 6850M XT | 3.4 kg | 26.7 mm | 17.00" | 3840x2160 | |
| 91.4 % v7 (old) | 02/2023 | Razer Blade 18 RTX 4070 i9-13950HX, GeForce RTX 4070 Laptop GPU | 3 kg | 21.9 mm | 18.00" | 2560x1600 |
Caso
Leitor de cartões SD
O leitor de cartões SD é lento em relação ao ponto de preço elevado do modelo. O Razer Blade 18 e Série Dell XPS ter leitores de cartões 2x a 3x mais rápidos.
| SD Card Reader | |
| average JPG Copy Test (av. of 3 runs) | |
| Razer Blade 18 RTX 4070 (Angelibird AV Pro V60) | |
| MSI Titan GT77 HX 13VI (Angelibird AV Pro V60) | |
| Eluktronics Mech-17 GP2 (Angelibird AV Pro V60) | |
| Schenker XMG Neo 17 M22 (AV PRO microSD 128 GB V60) | |
| maximum AS SSD Seq Read Test (1GB) | |
| Razer Blade 18 RTX 4070 (Angelibird AV Pro V60) | |
| Eluktronics Mech-17 GP2 (Angelibird AV Pro V60) | |
| MSI Titan GT77 HX 13VI (Angelibird AV Pro V60) | |
Comunicação
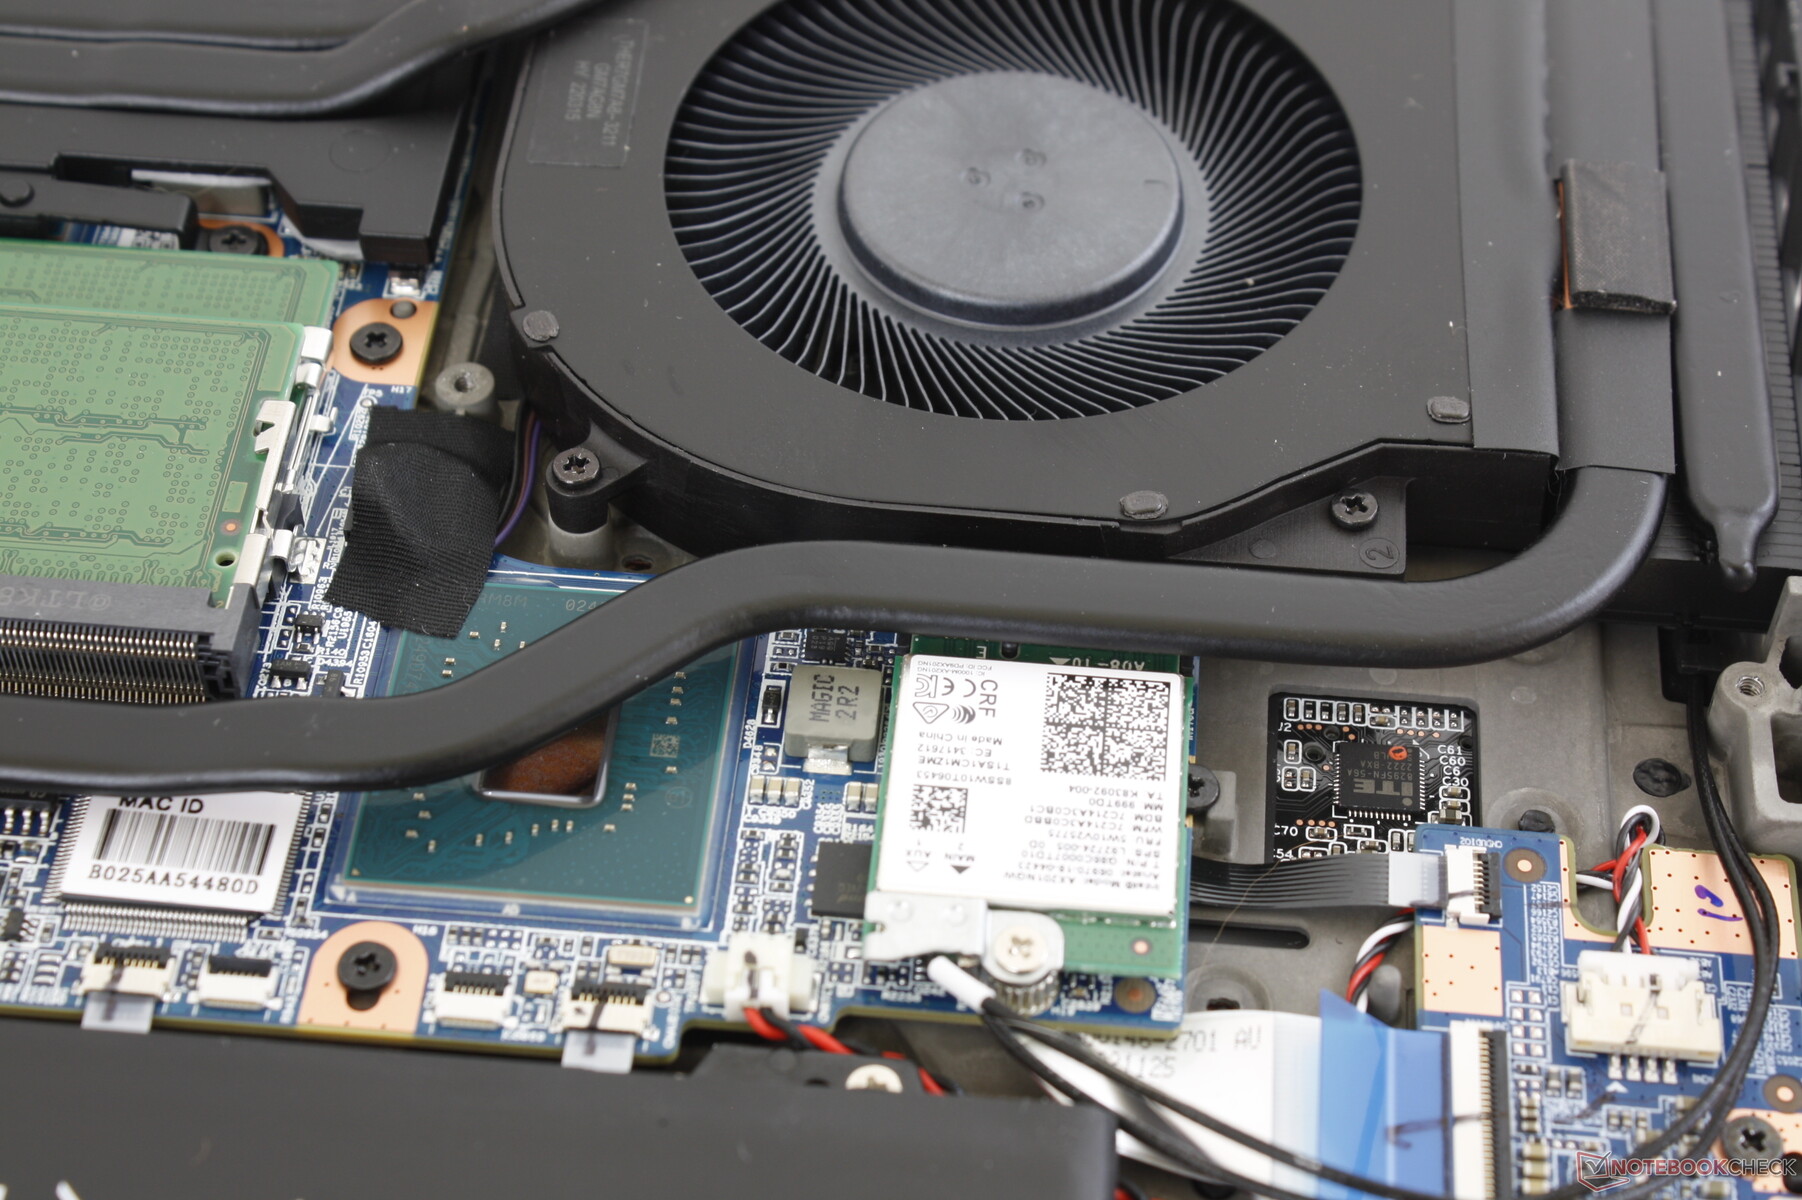
Um Intel AX201 vem como padrão para conectividade Wi-Fi 6 e Bluetooth 5.2. No entanto, estávamos esperando um AX210/211 para velocidades Wi-Fi 6E mais rápidas, considerando o preço do sistema.
| Networking | |
| iperf3 transmit AXE11000 | |
| MSI Titan GT77 HX 13VI | |
| MSI Katana 17 B13VFK | |
| Eluktronics Mech-17 GP2 | |
| Razer Blade 18 RTX 4070 | |
| Alienware m17 R5 (R9 6900HX, RX 6850M XT) | |
| Schenker XMG Neo 17 M22 | |
| iperf3 receive AXE11000 | |
| MSI Katana 17 B13VFK | |
| MSI Titan GT77 HX 13VI | |
| Razer Blade 18 RTX 4070 | |
| Eluktronics Mech-17 GP2 | |
| Alienware m17 R5 (R9 6900HX, RX 6850M XT) | |
| Schenker XMG Neo 17 M22 | |
| iperf3 transmit AXE11000 6GHz | |
| Razer Blade 18 RTX 4070 | |
| iperf3 receive AXE11000 6GHz | |
| Razer Blade 18 RTX 4070 | |
Webcam
A webcam FHD de 2 MP e o infravermelho vêm como padrão para o suporte do Hello. No entanto, não há opção de interruptor de privacidade ou obturador.


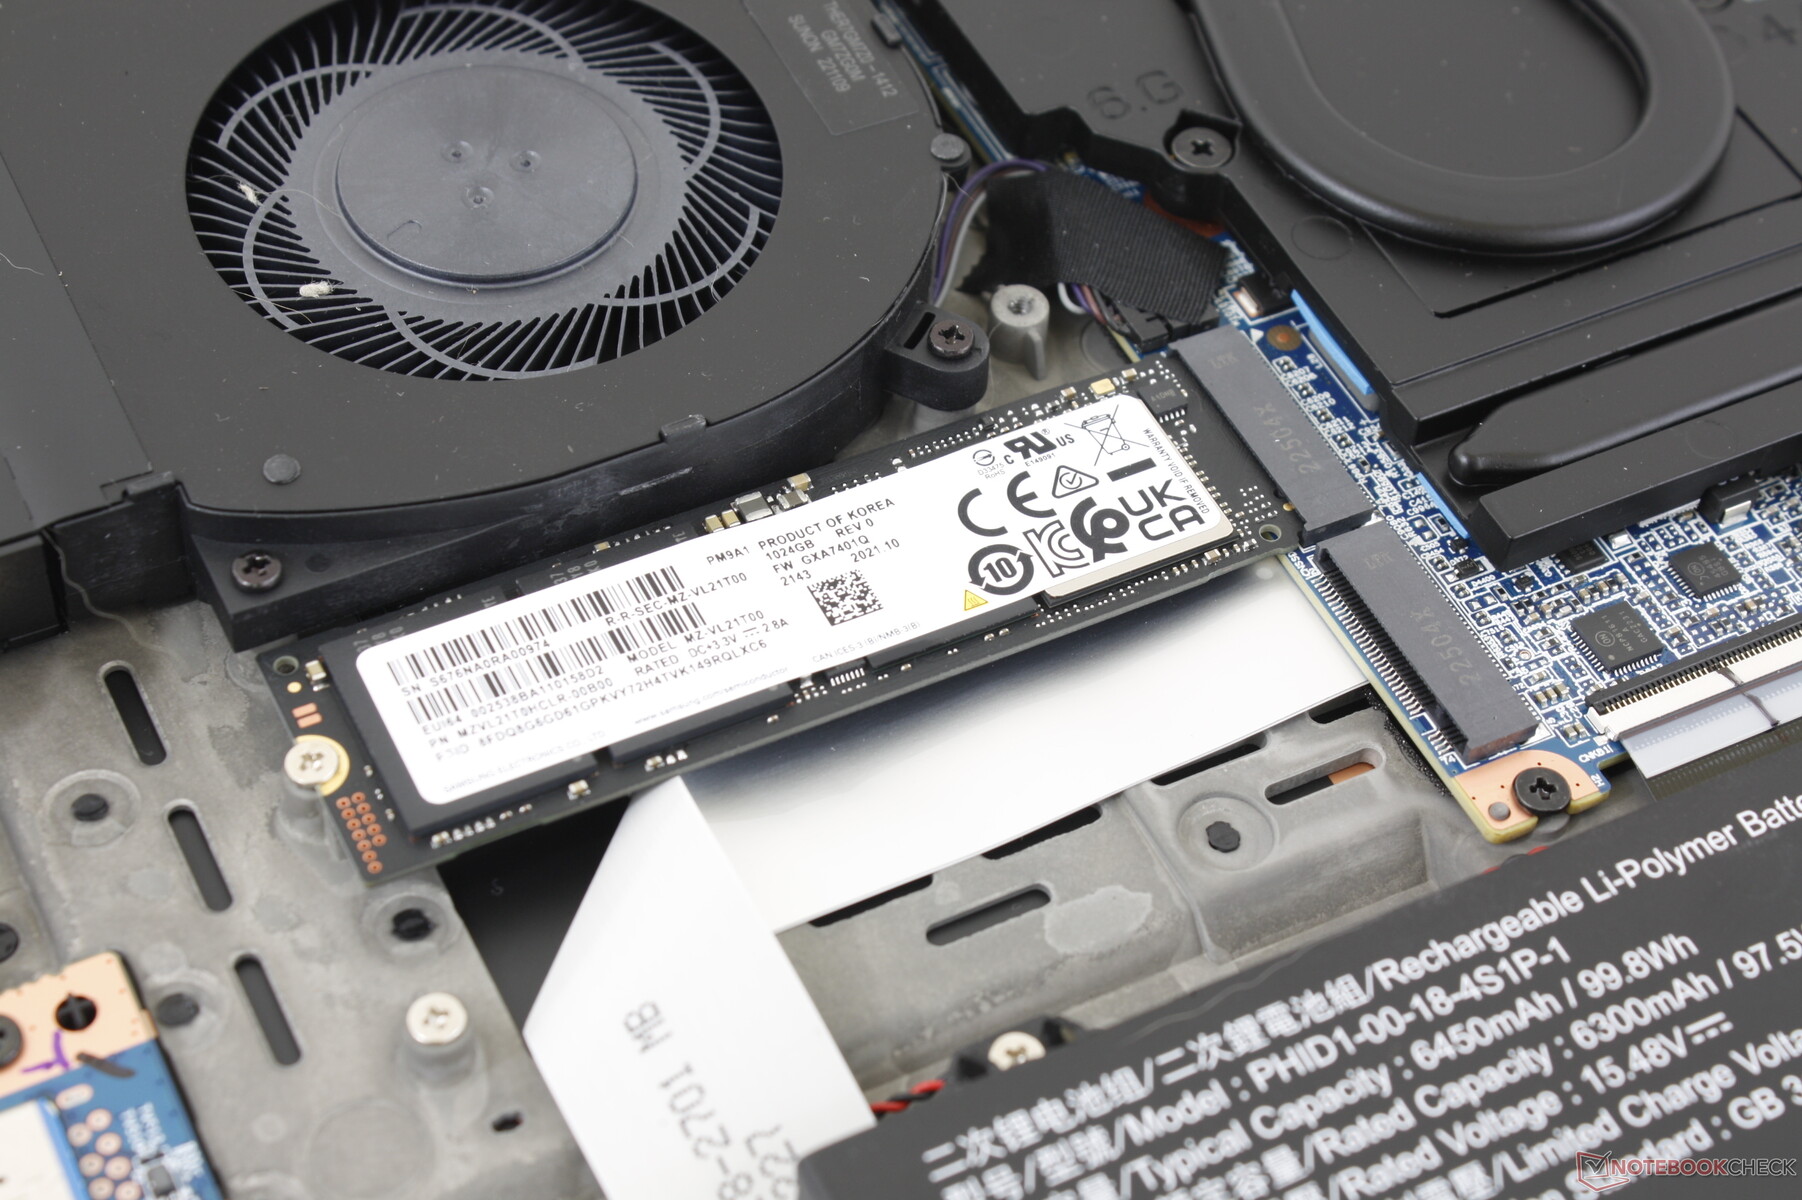
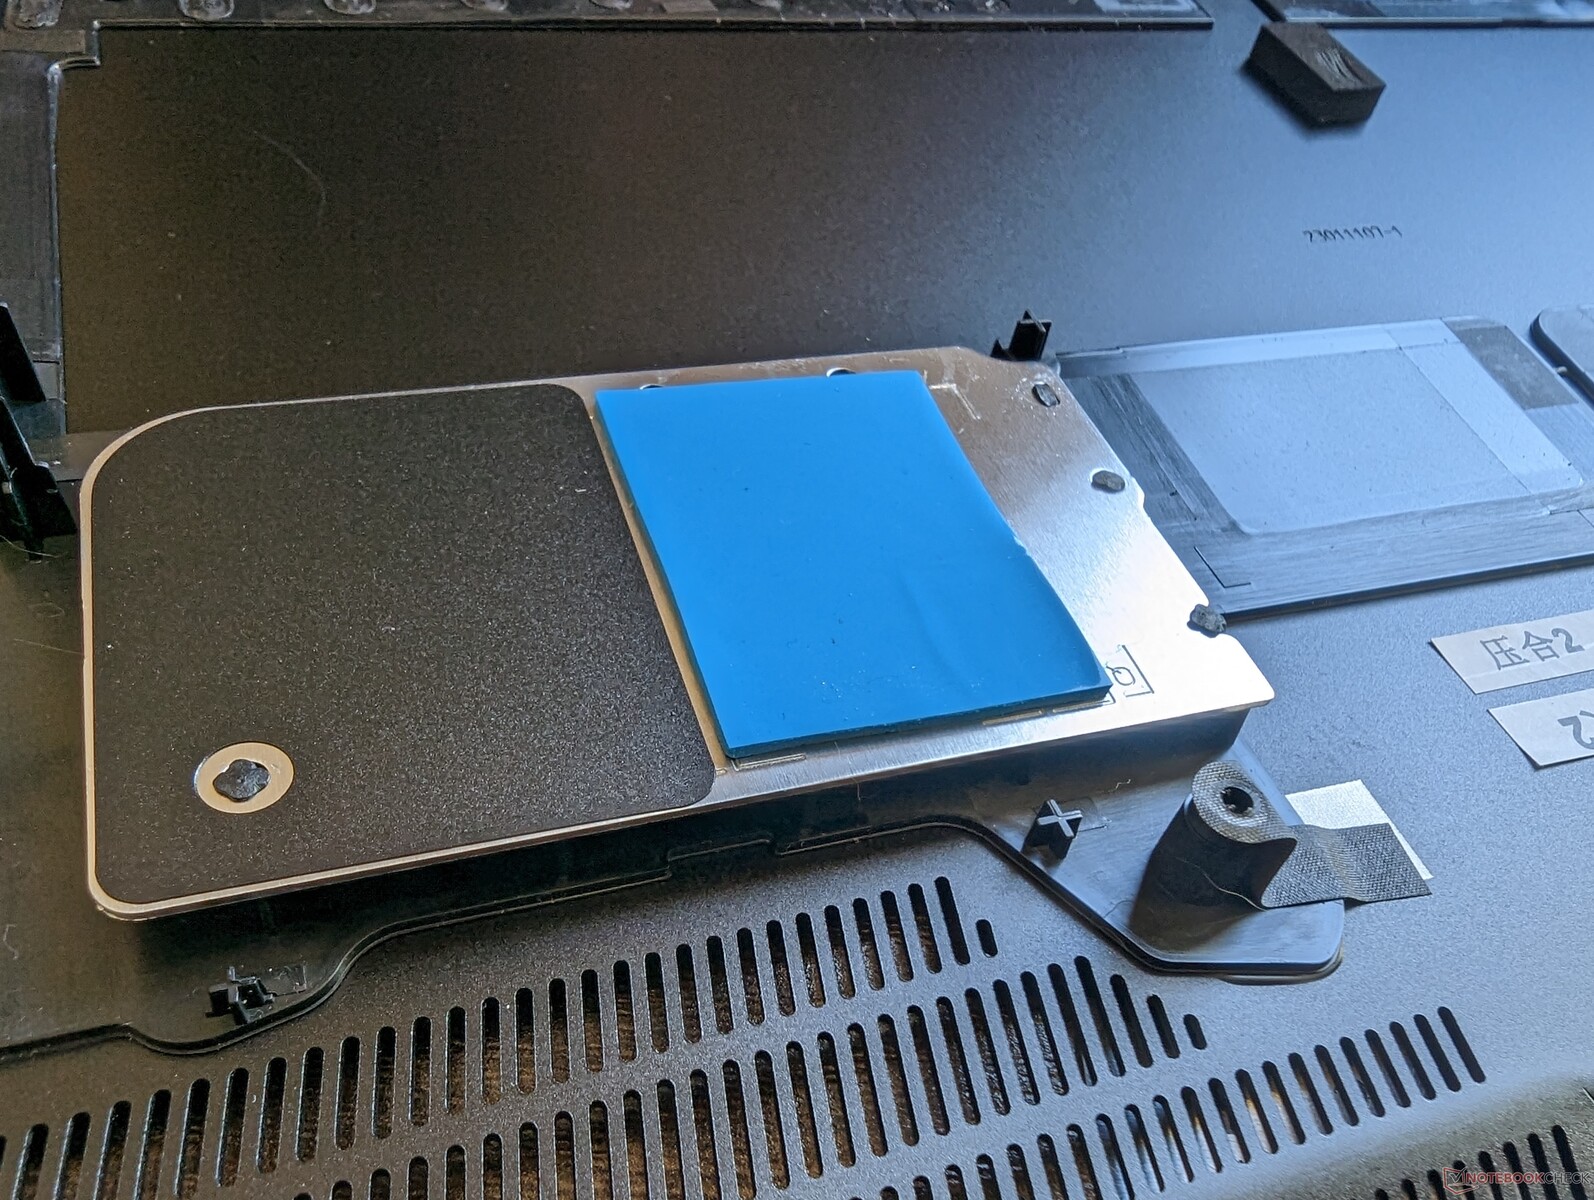
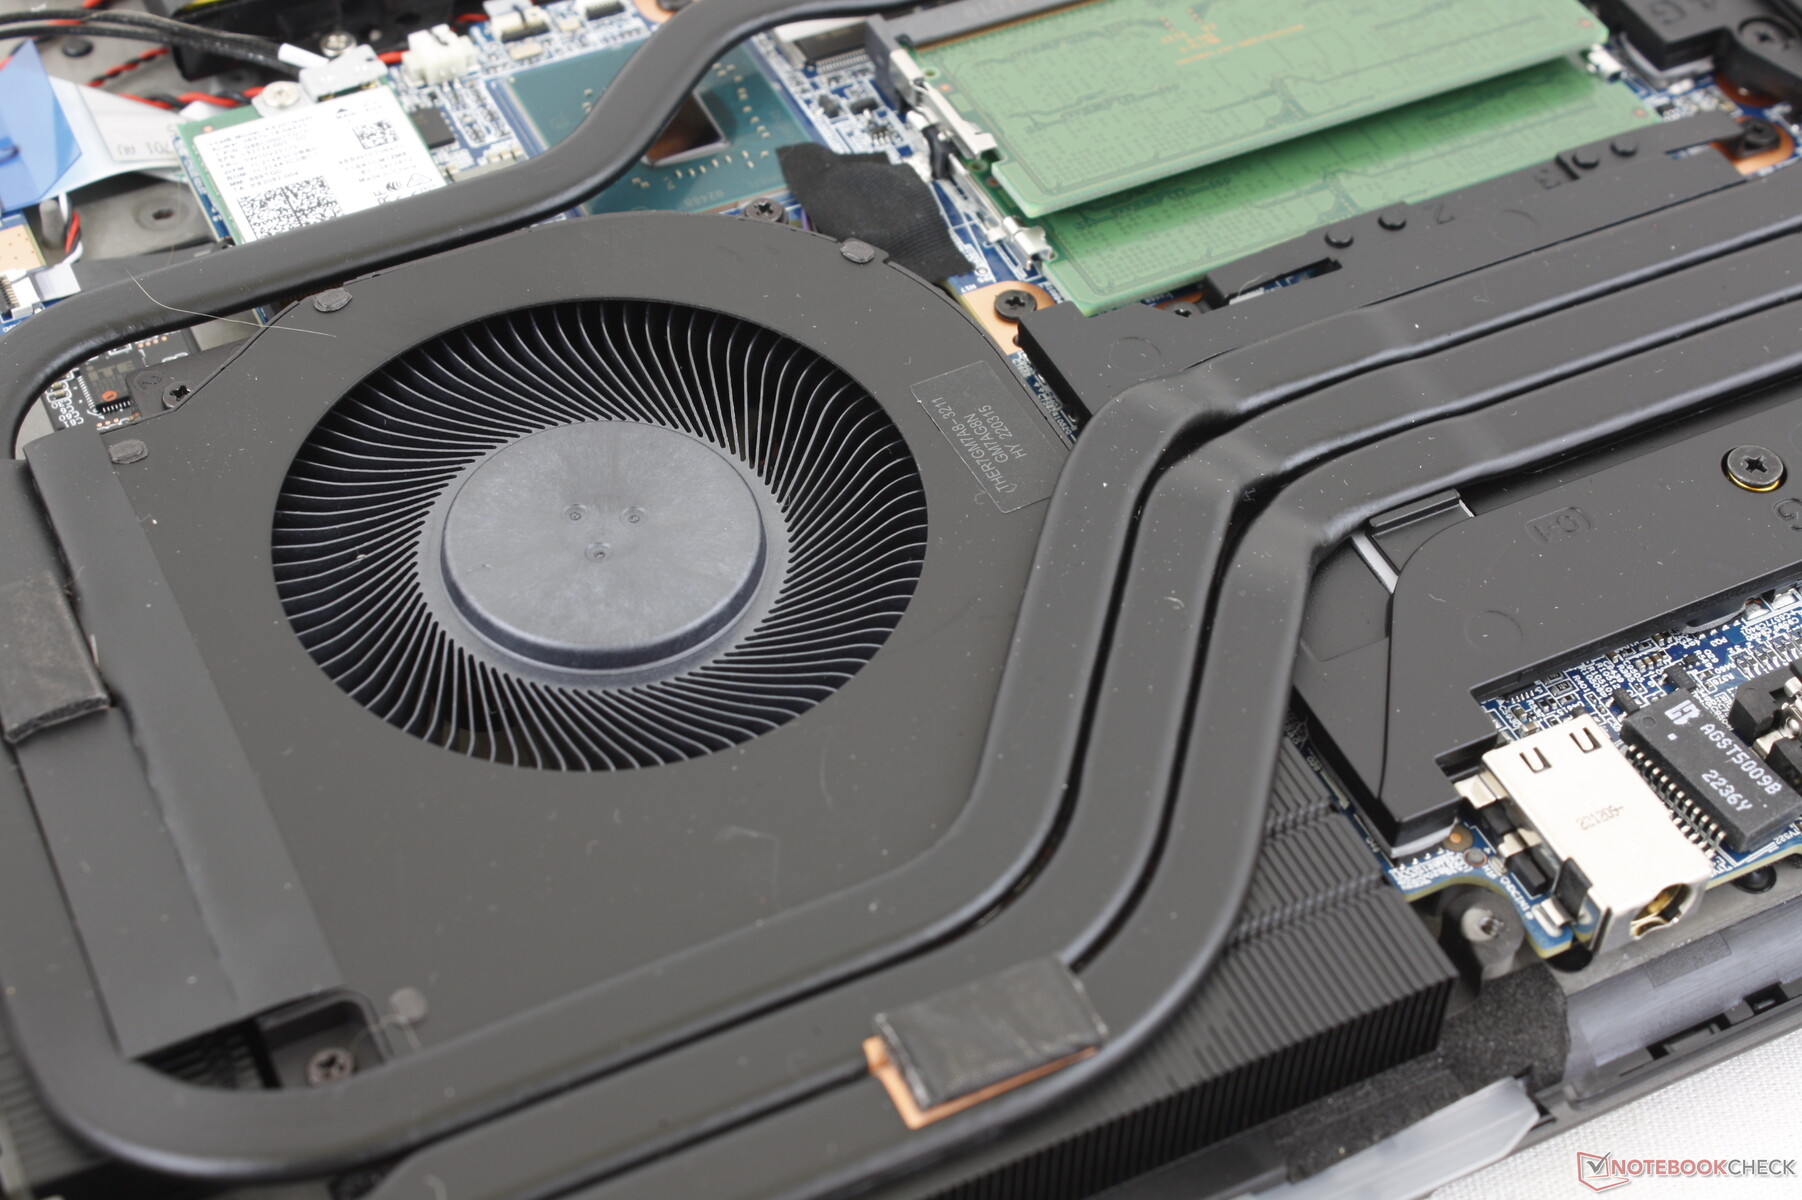
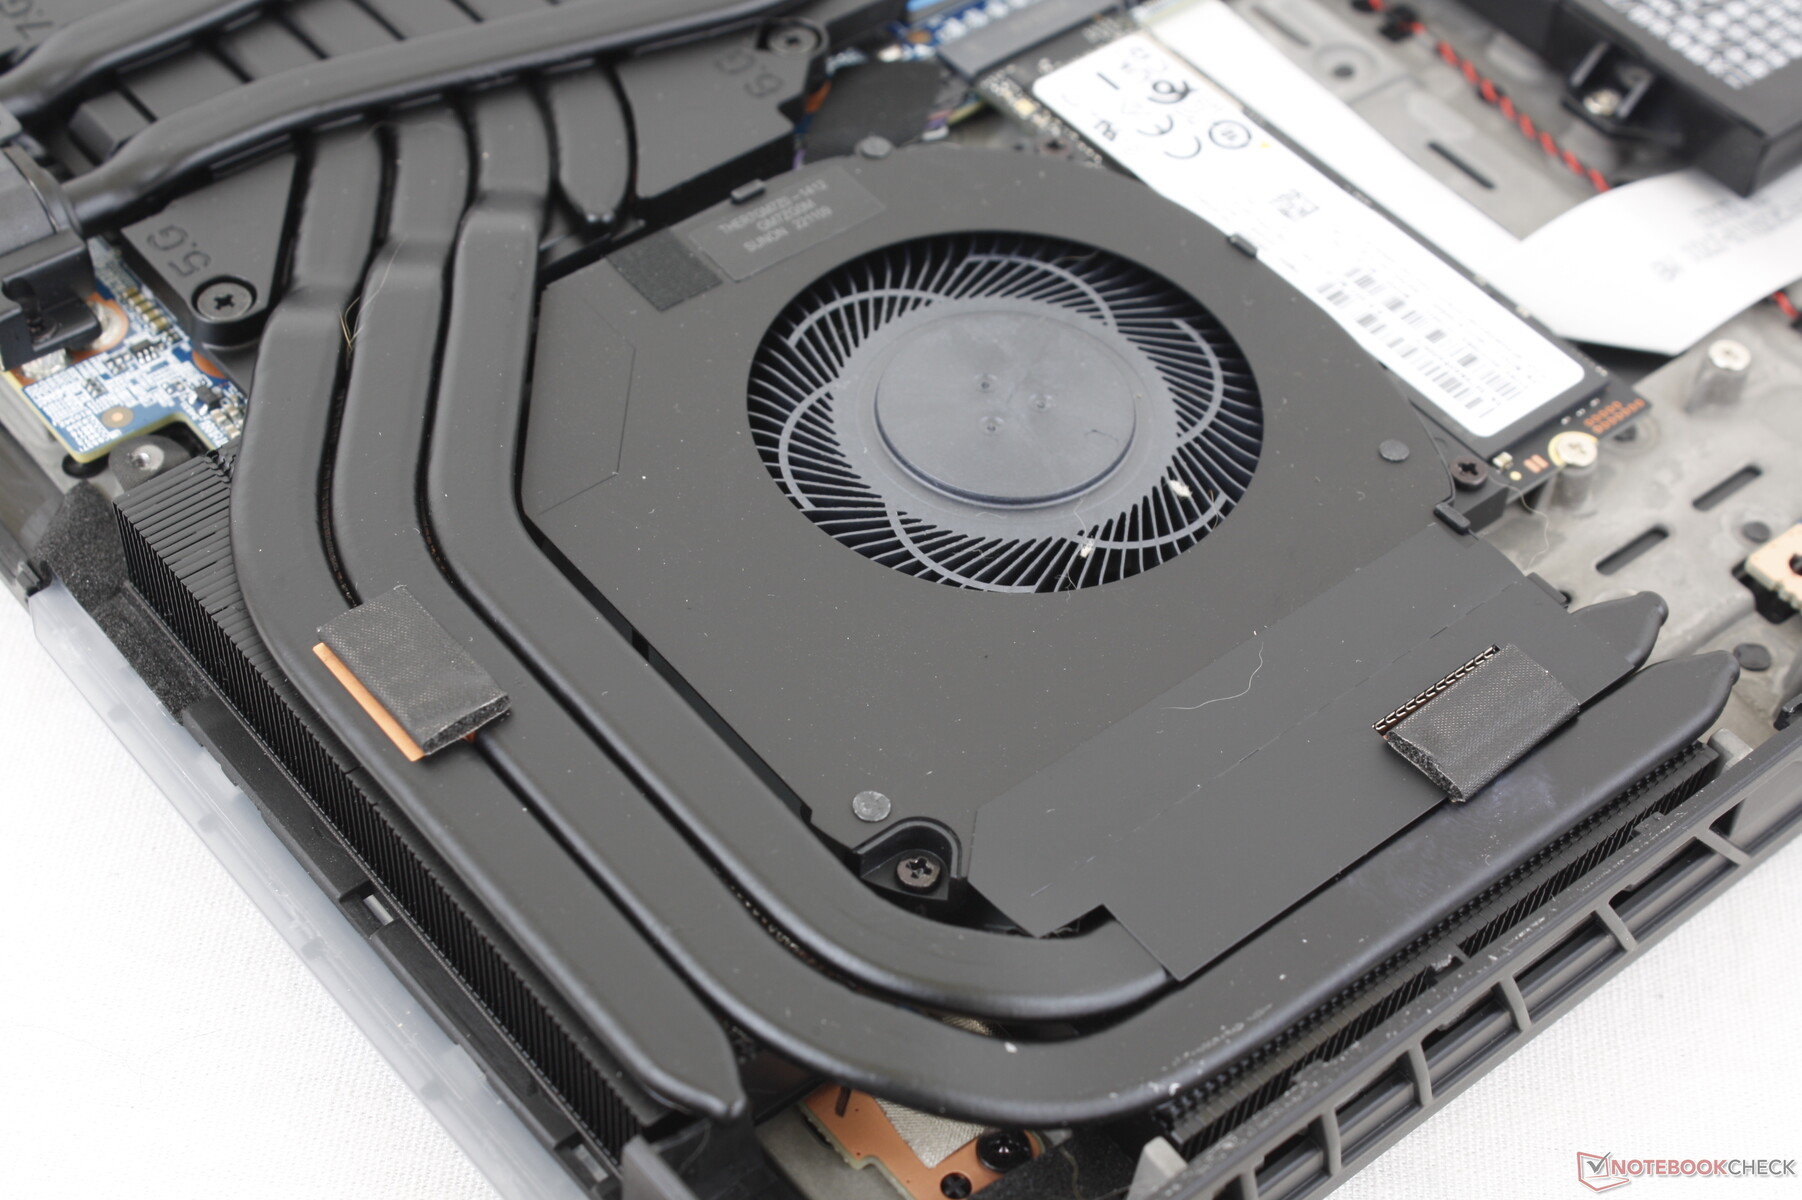
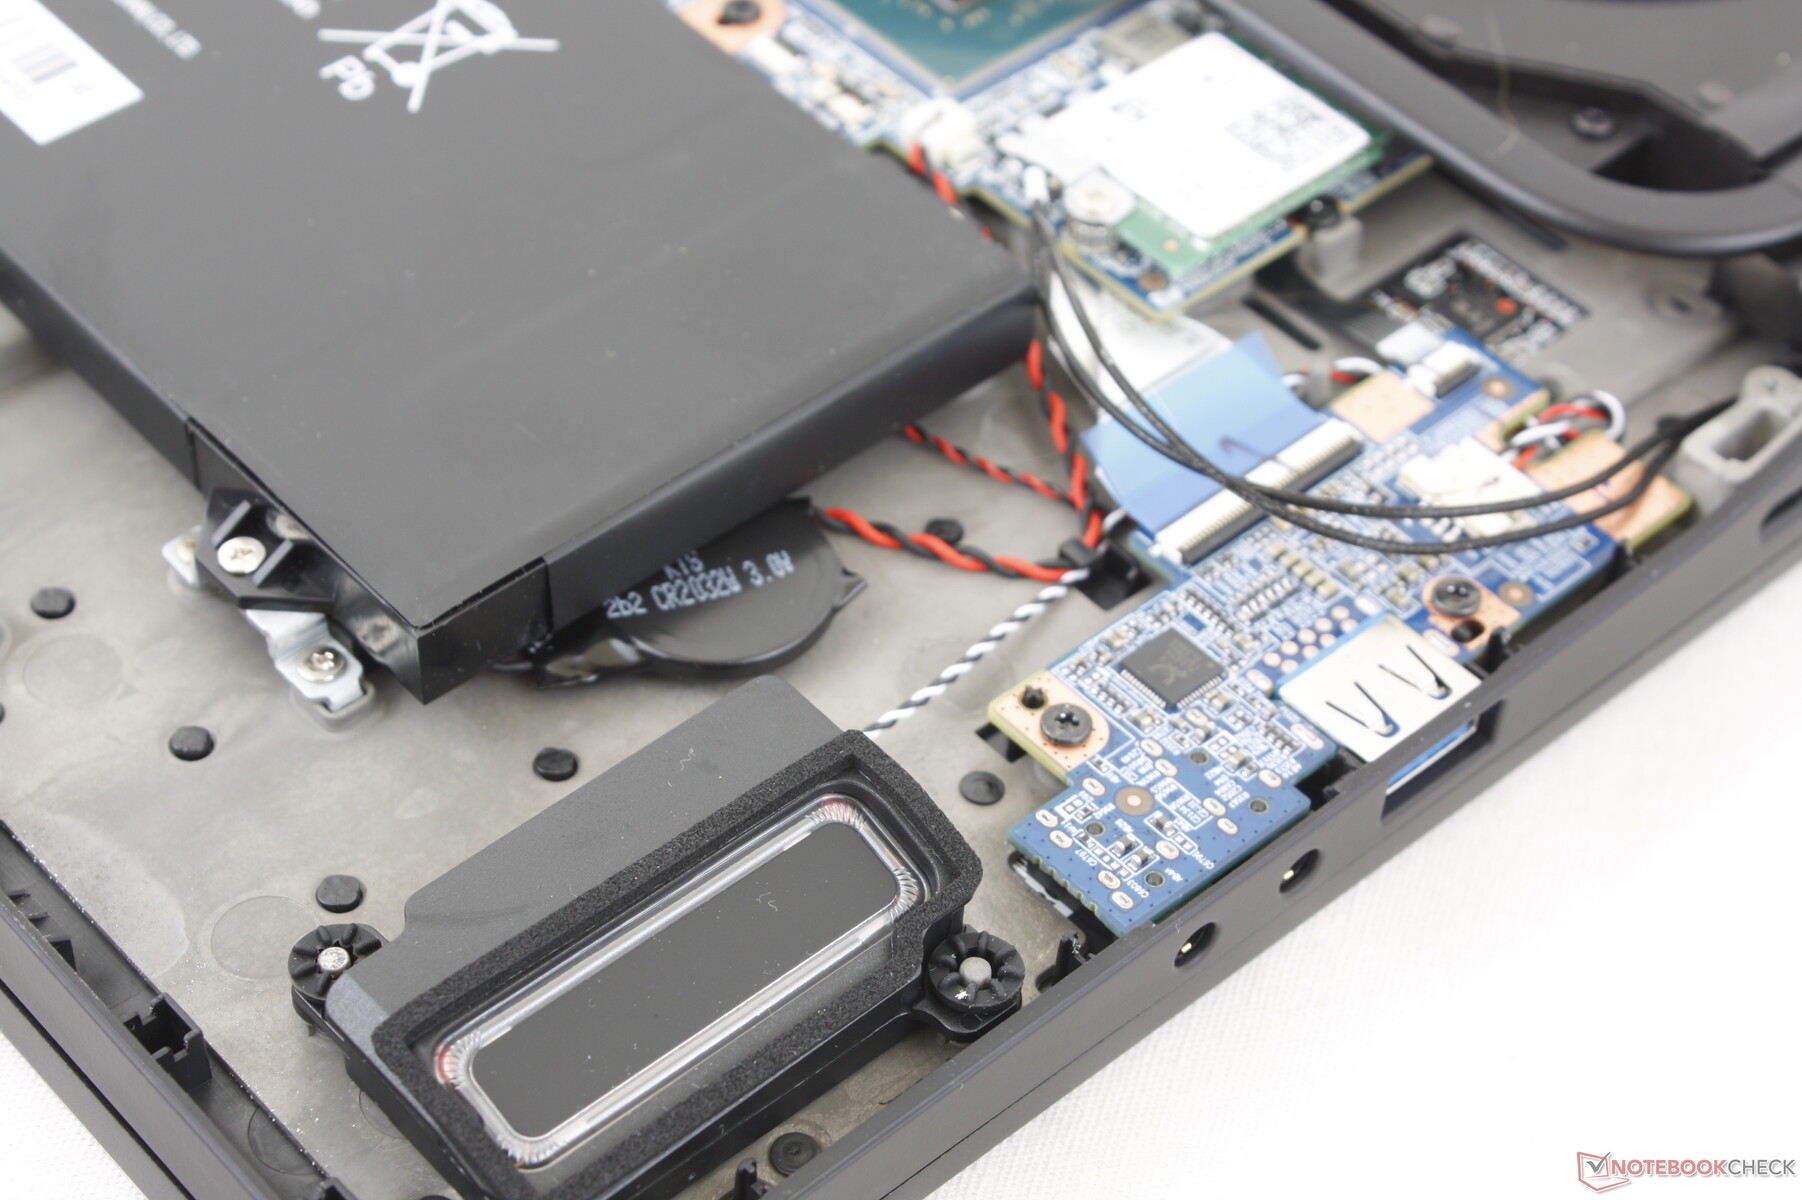
Manutenção
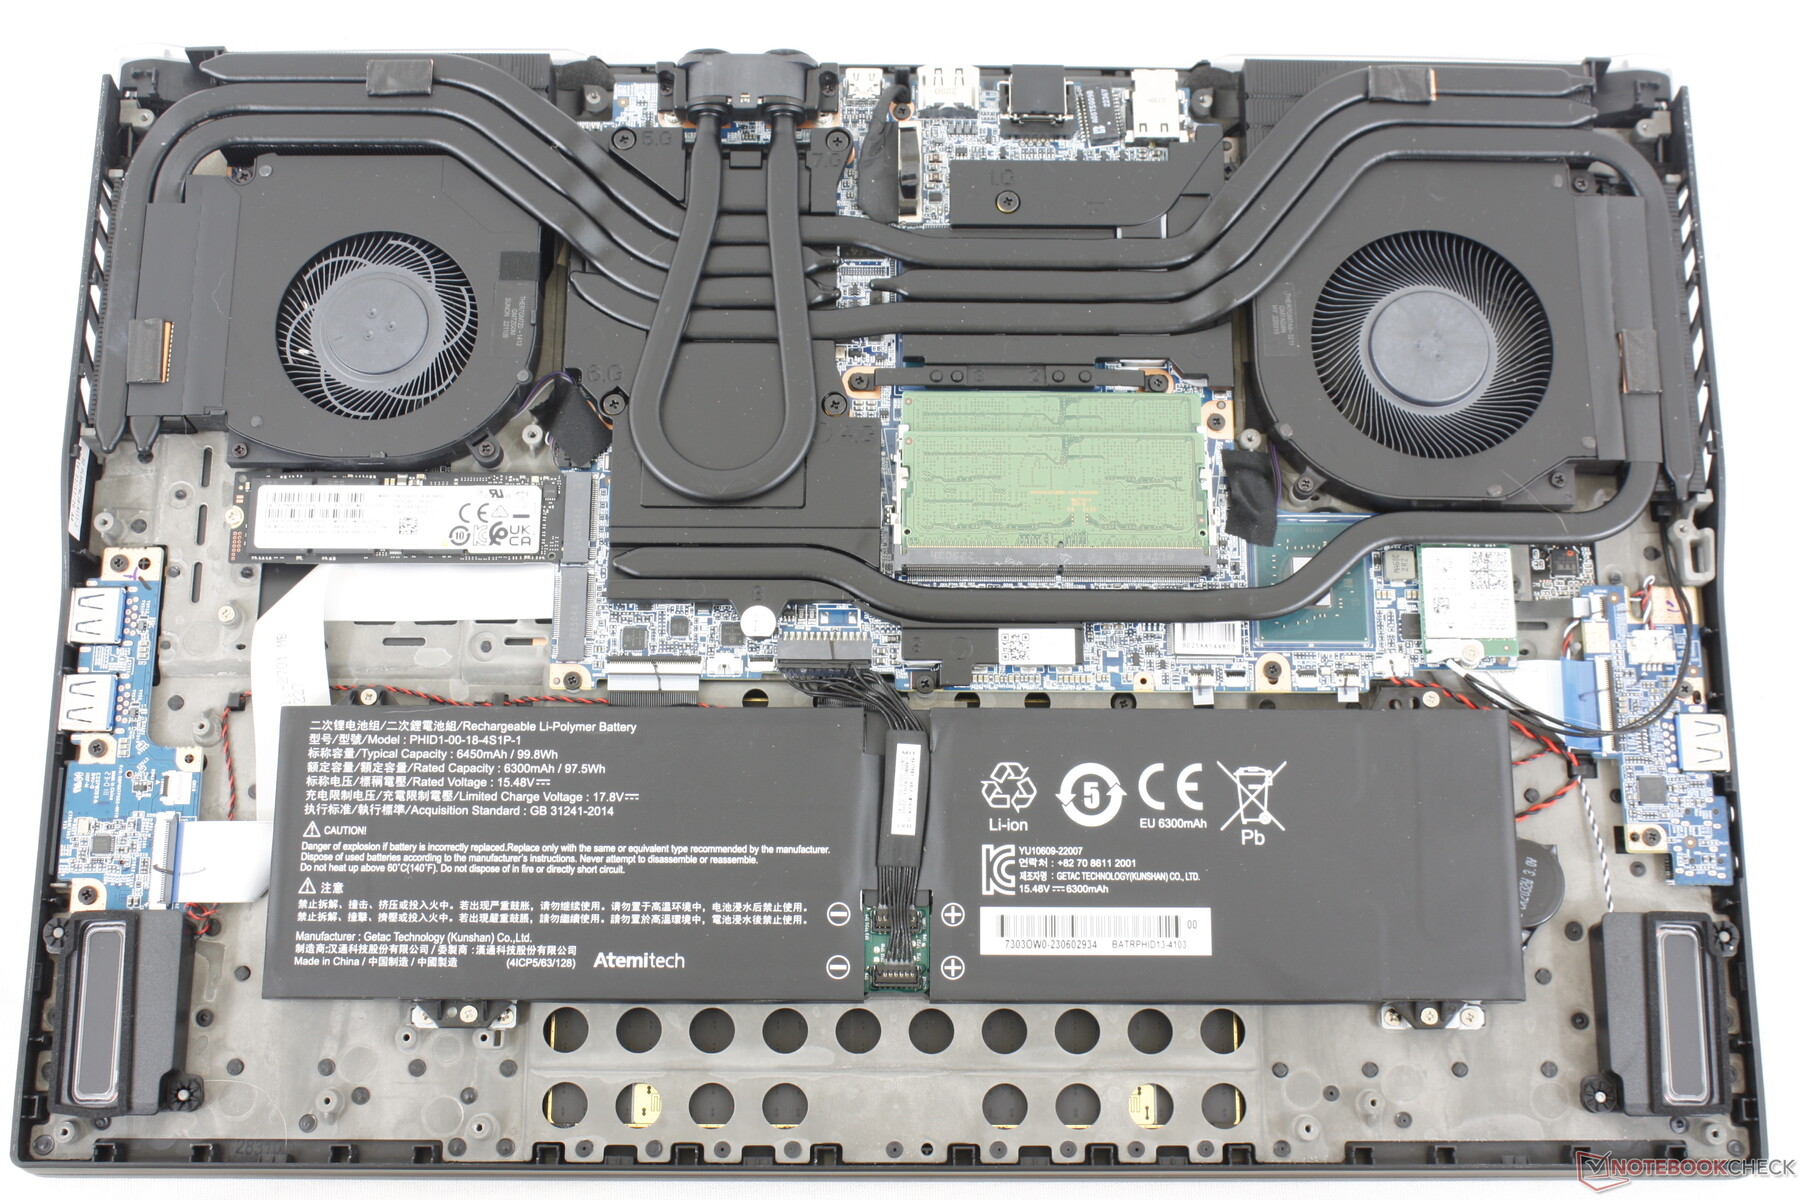
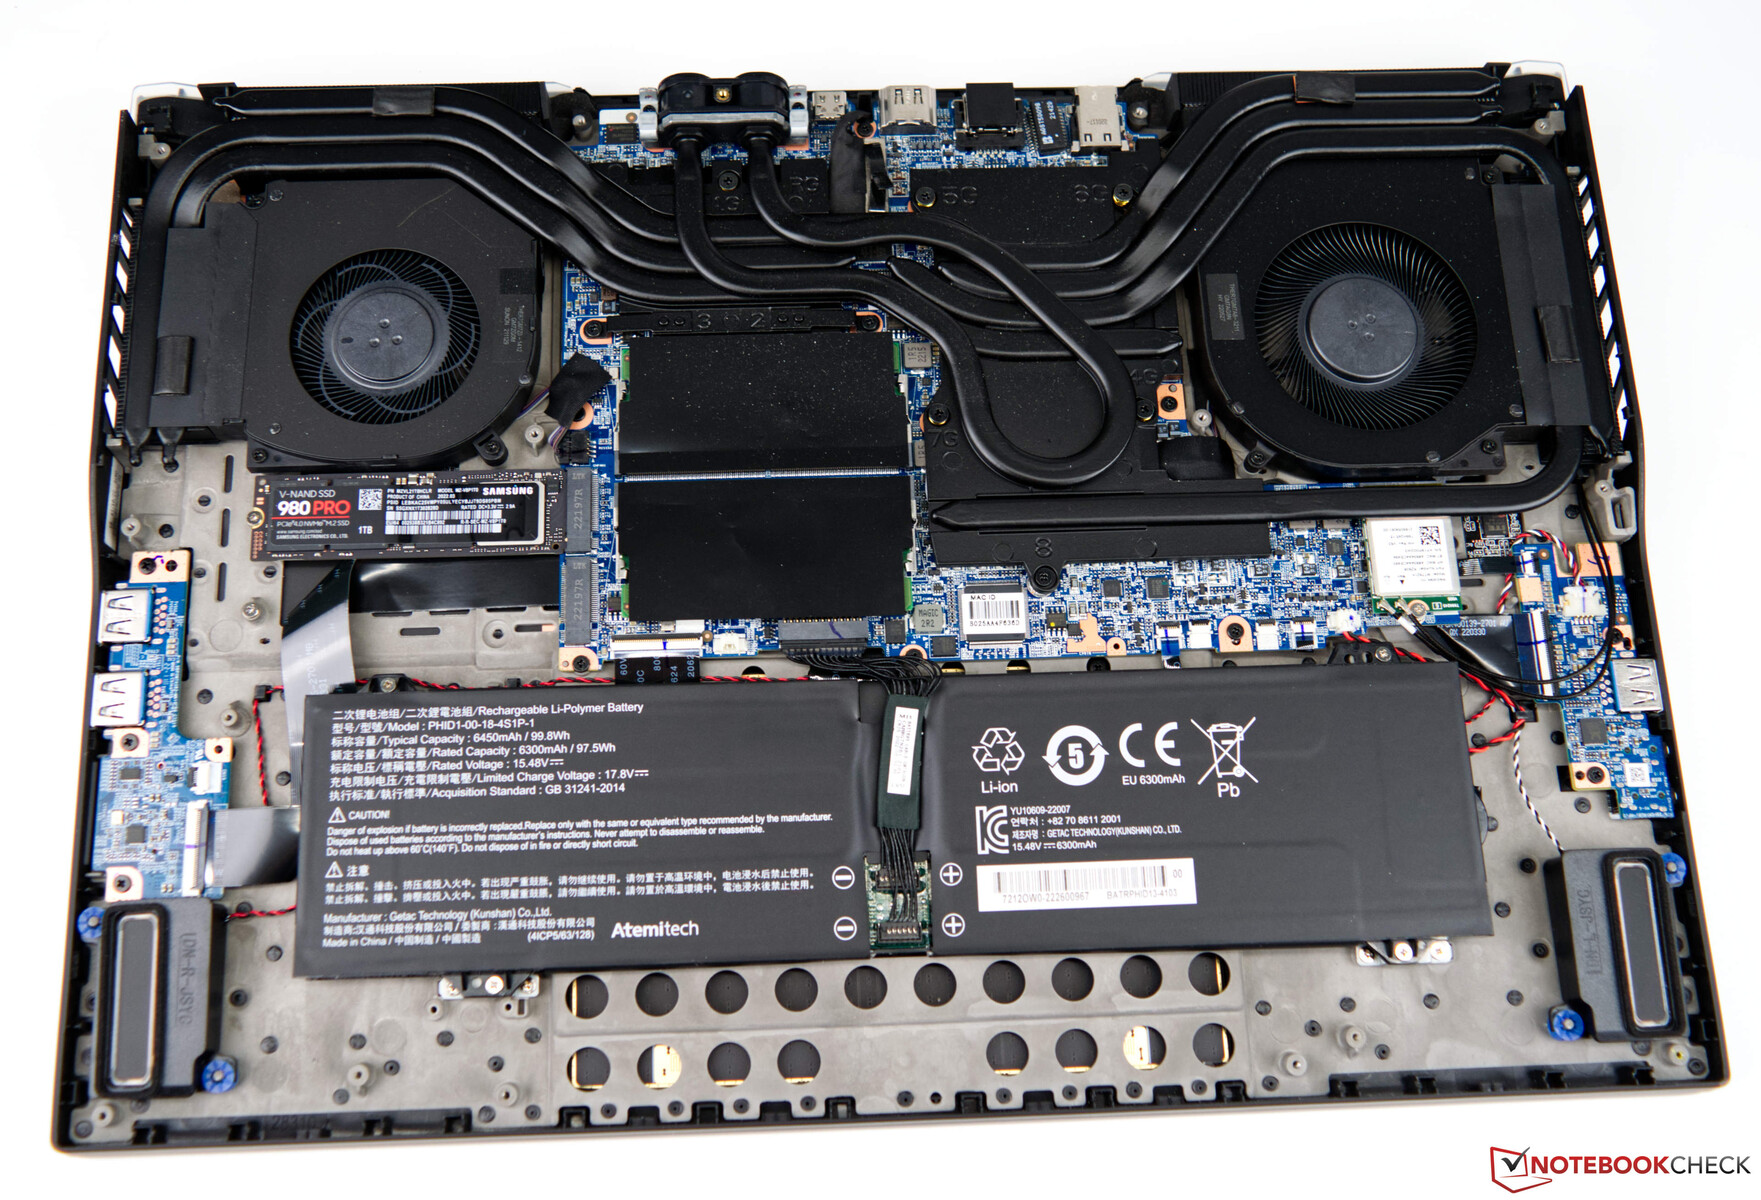
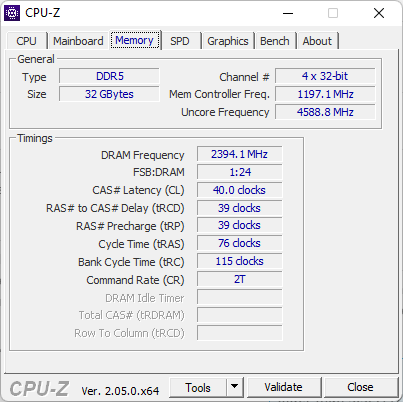
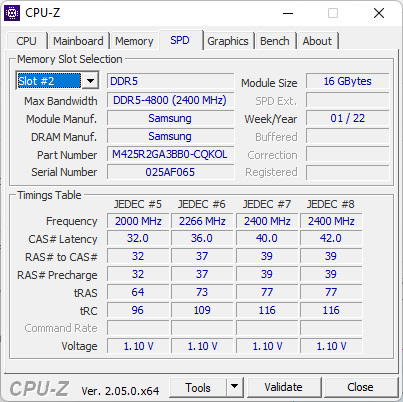
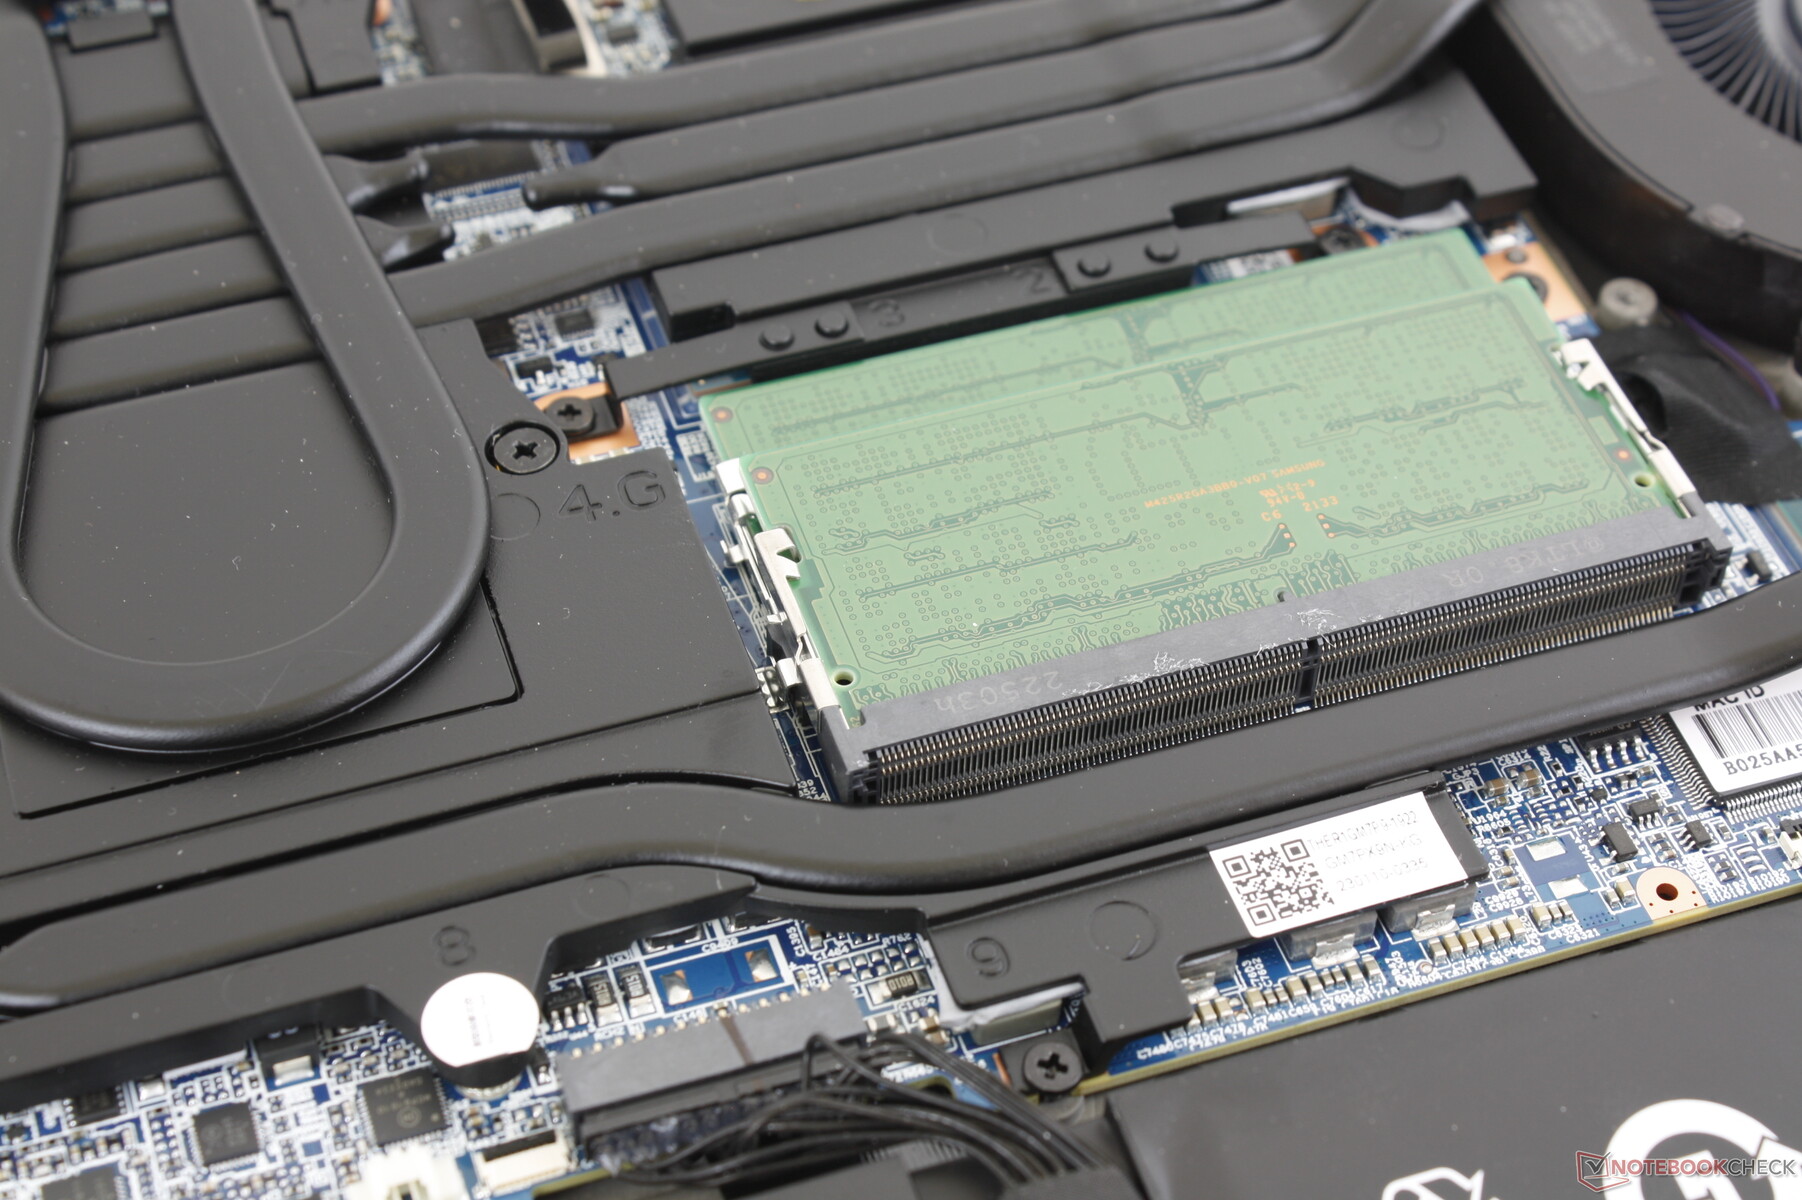
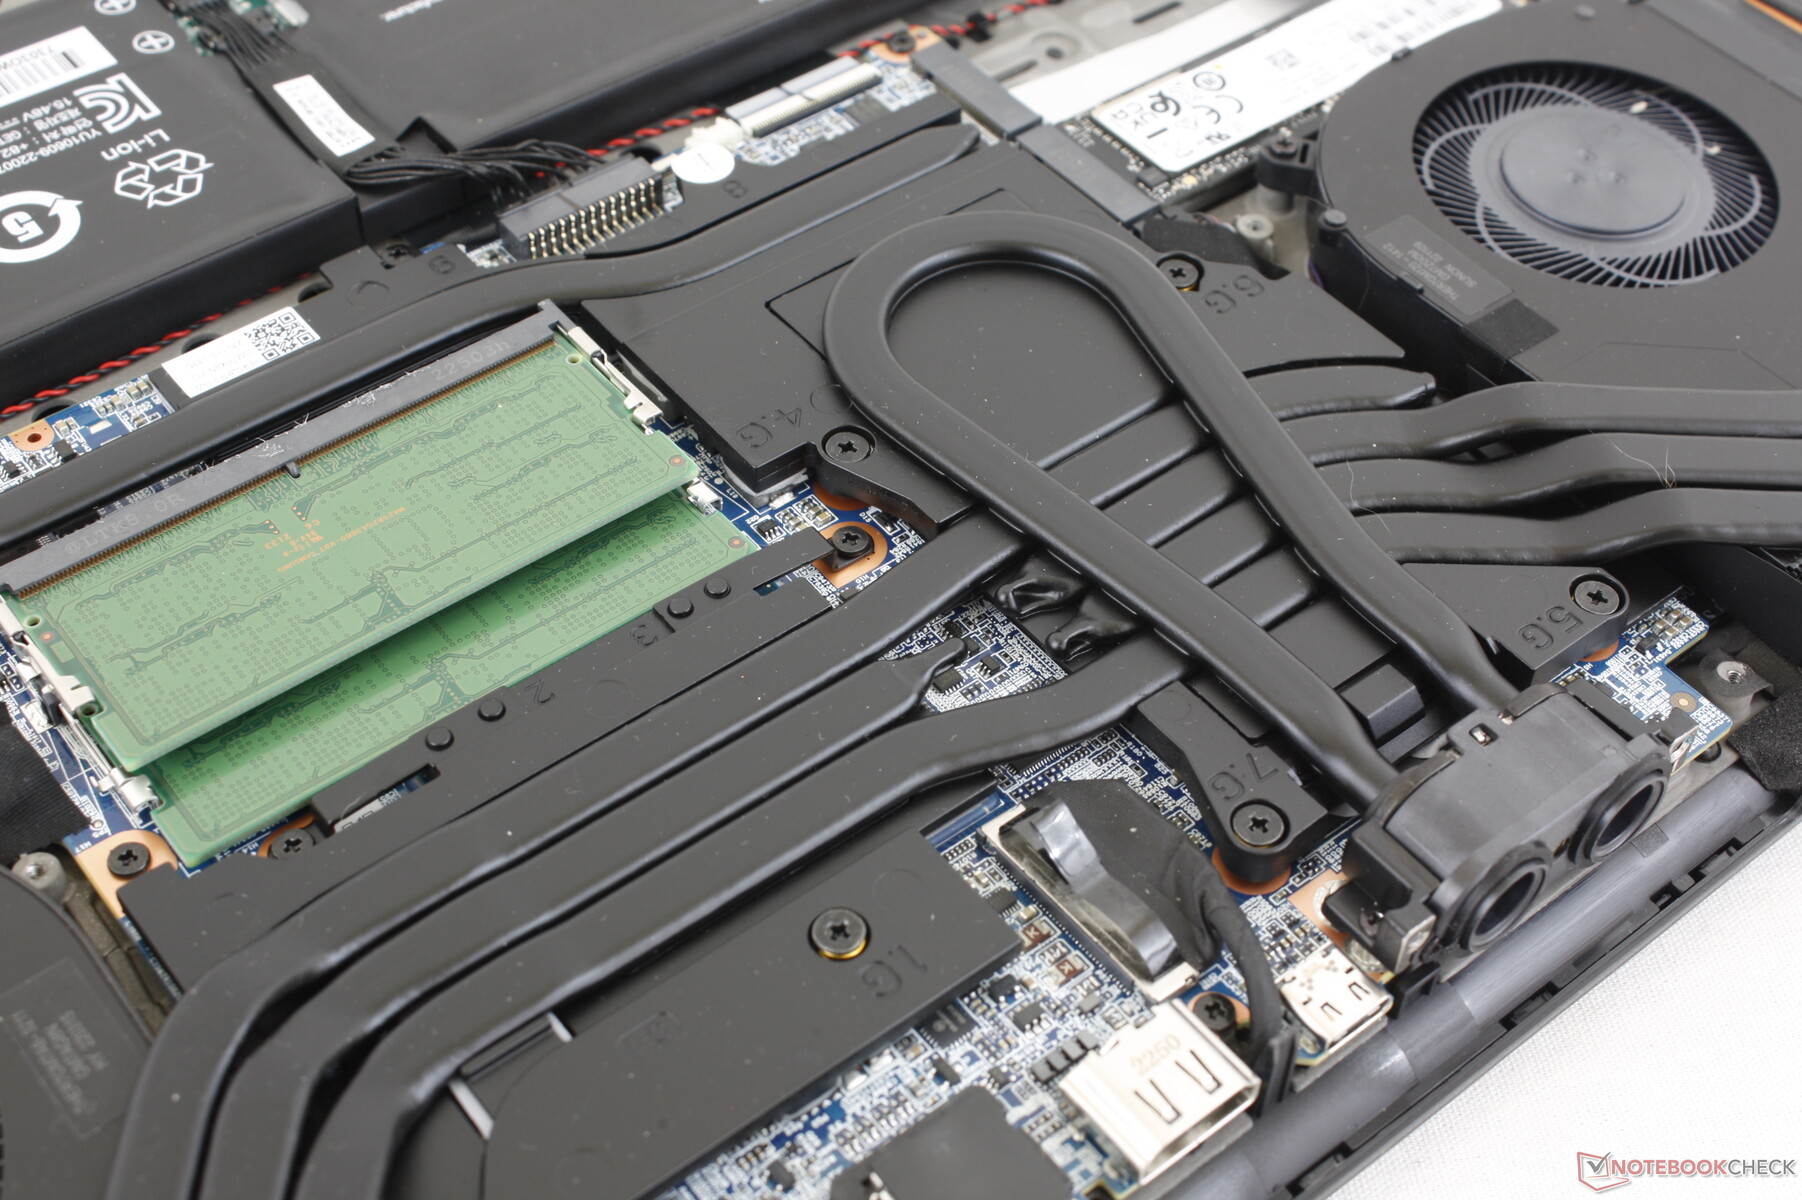
O painel inferior é fixado por 14 parafusos Philips para uma manutenção relativamente fácil. O fabricante revisou os internos em relação ao modelo do ano passado, como mostrado abaixo, apesar de seus desenhos externos permanecerem idênticos. Os dois módulos de RAM estão agora empilhados para economizar espaço na placa-mãe enquanto a CPU e a GPU trocaram de posição.
Acessórios e Garantia
Não há extras na caixa de varejo além do adaptador AC e da papelada. O modelo é compatível com o refrigerador externo opcional de segunda geração do pacote de propulsão líquida (LPP G2).
Aplica-se a garantia padrão limitada de um ano do fabricante. Uma atualização para três anos está disponível por mais $250.
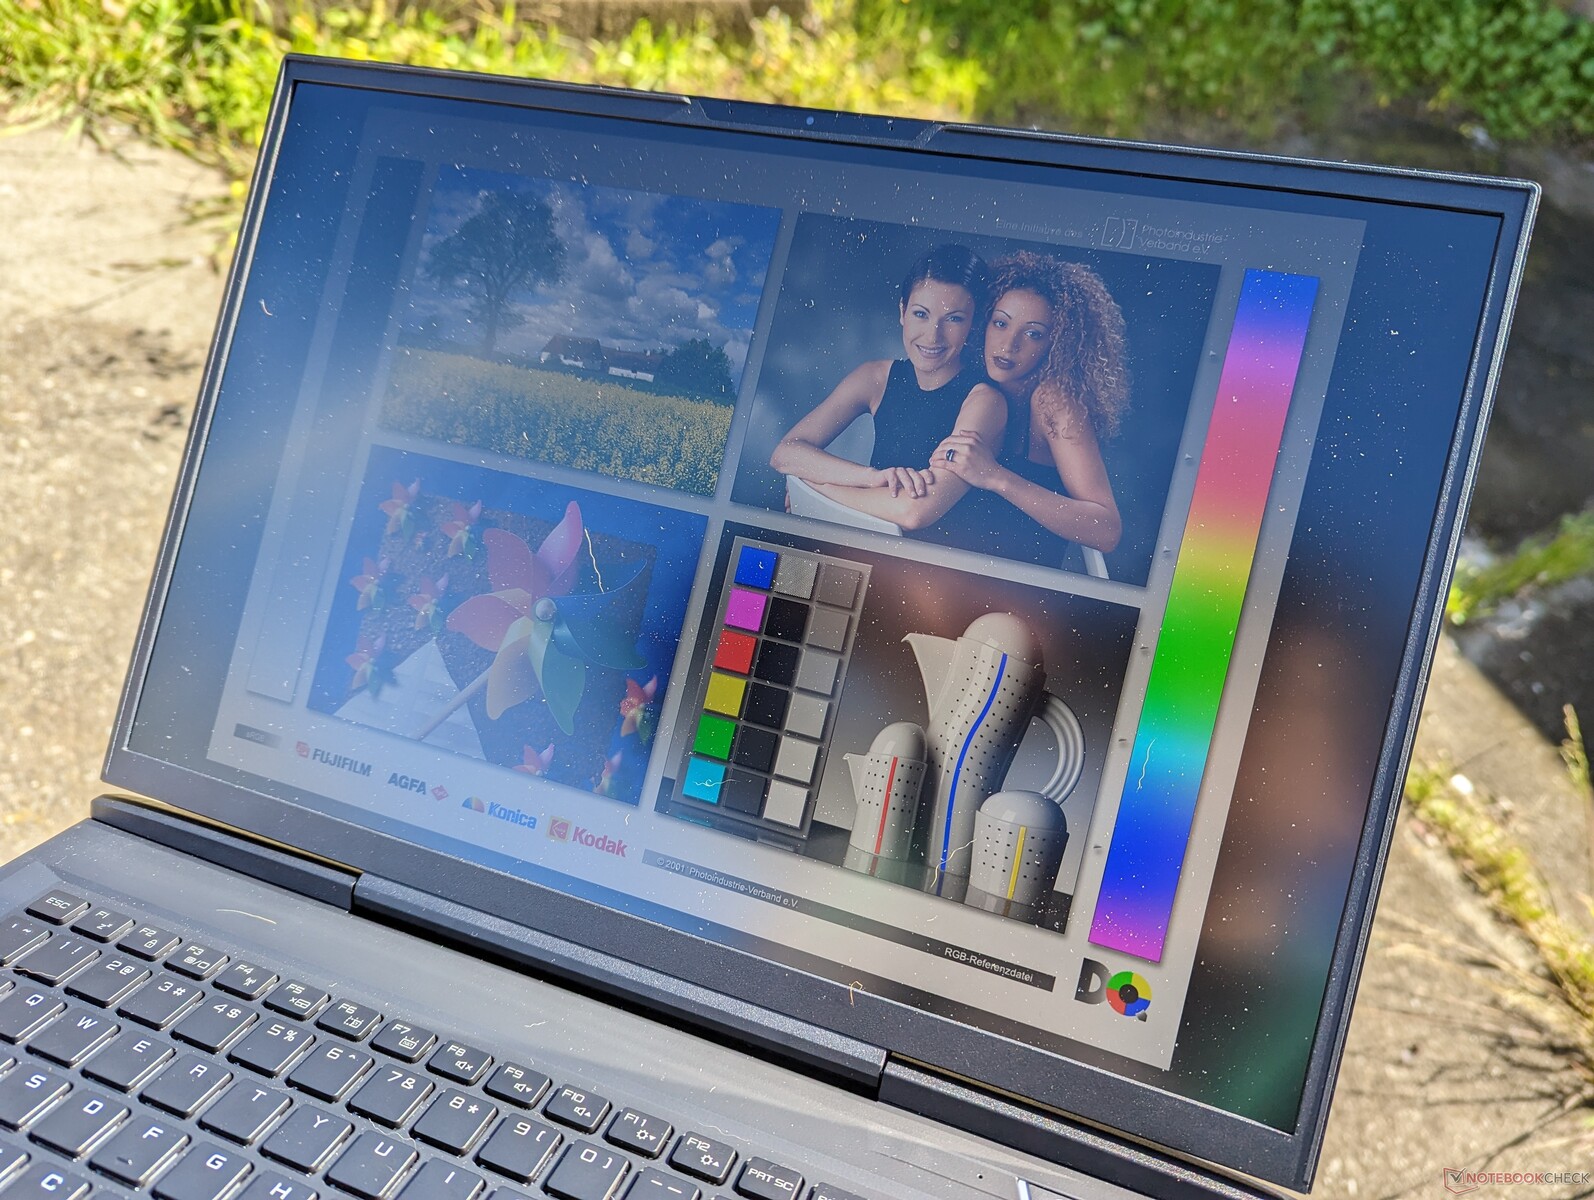
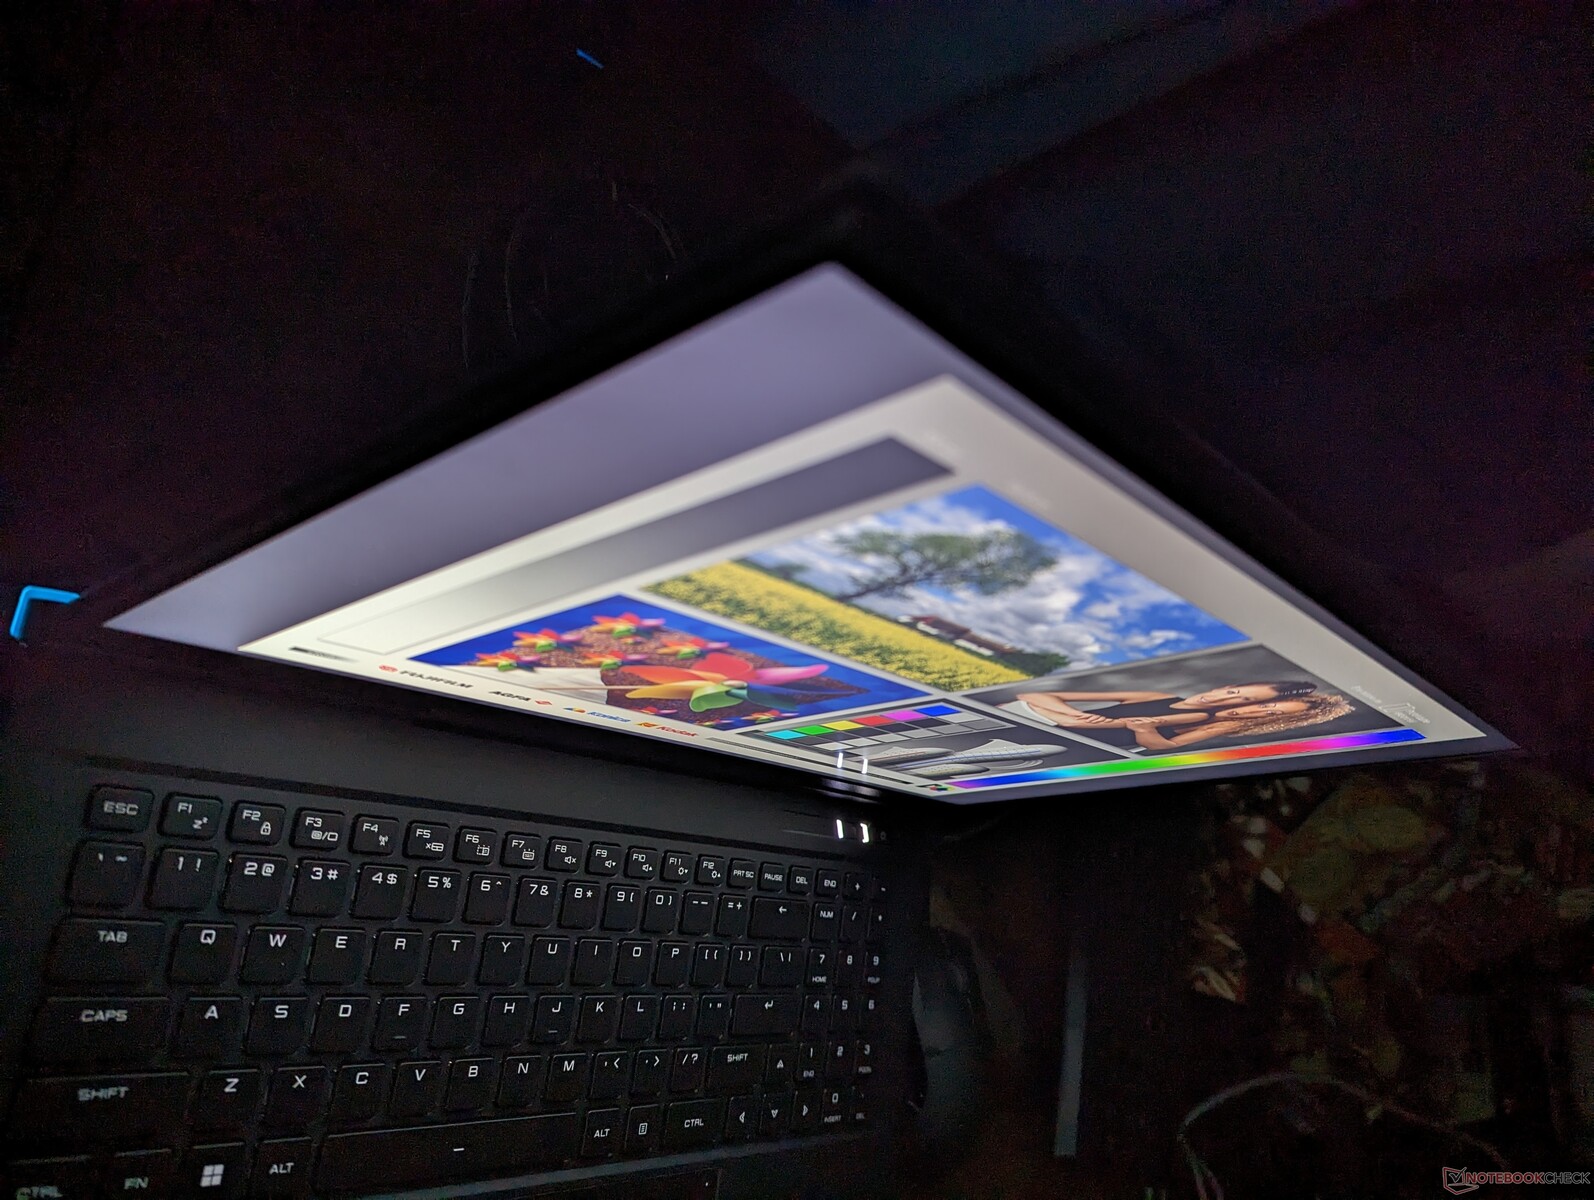
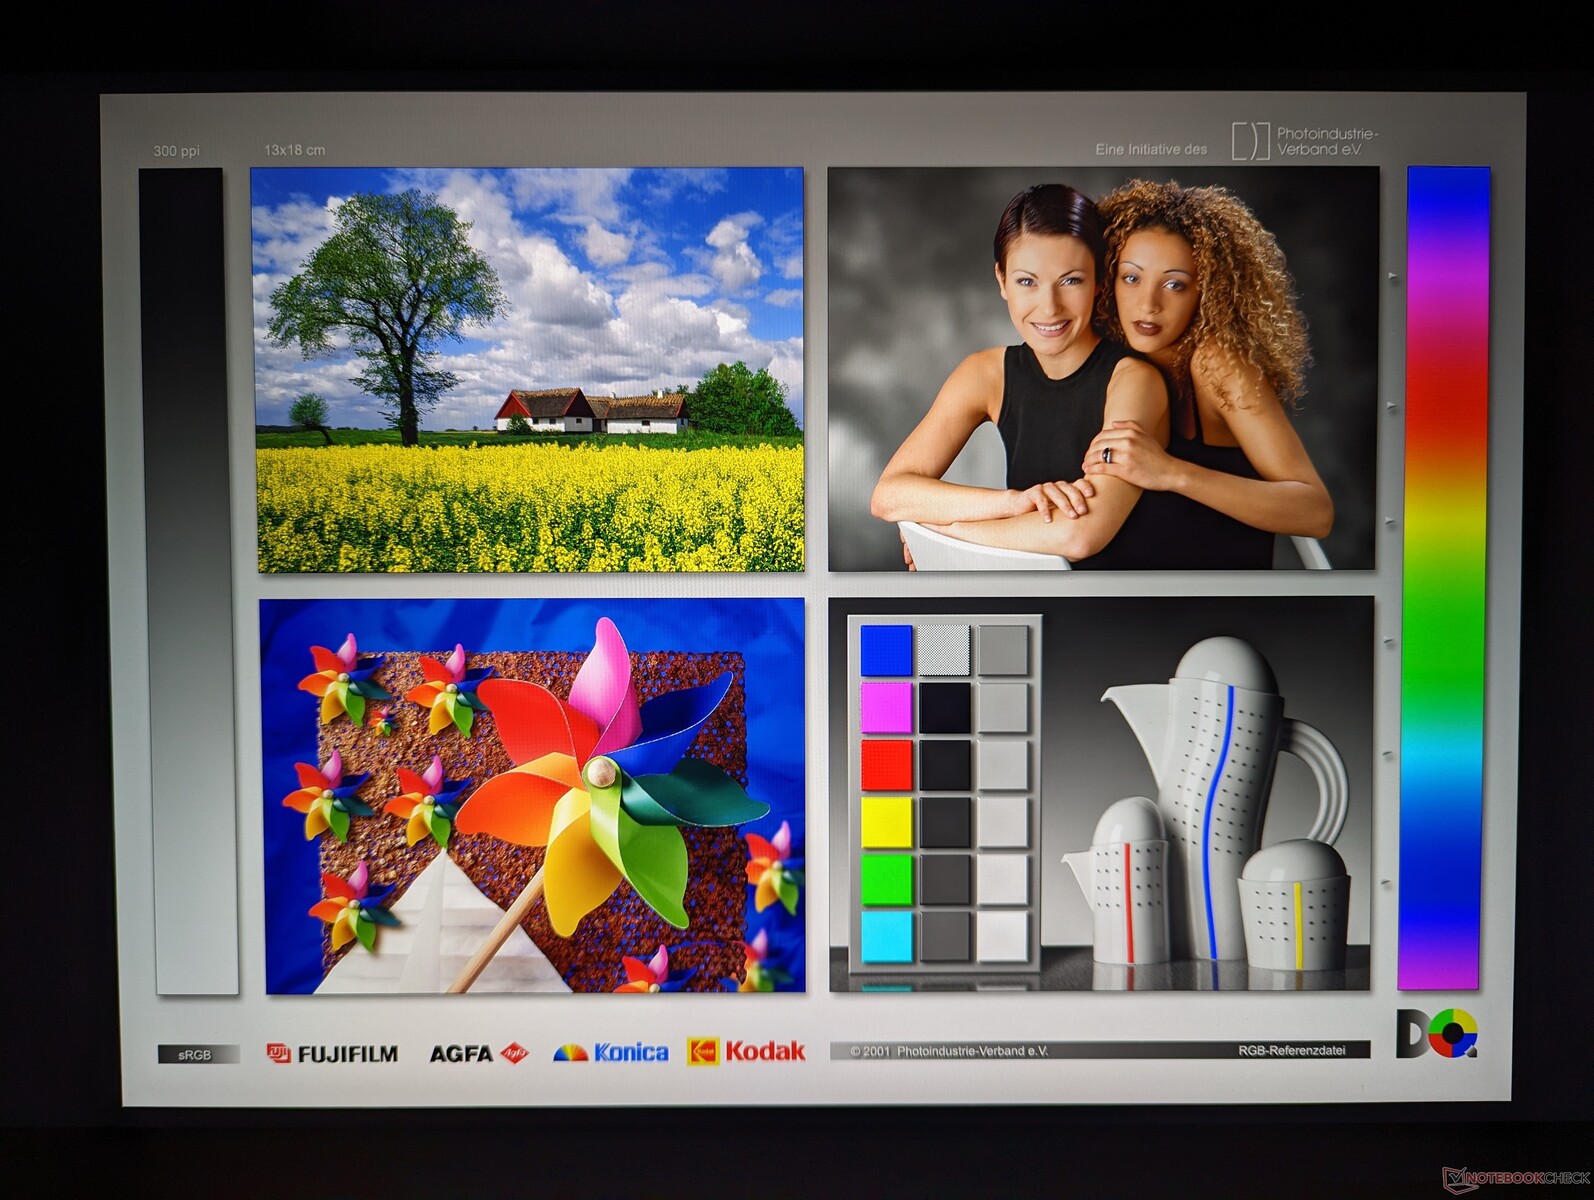
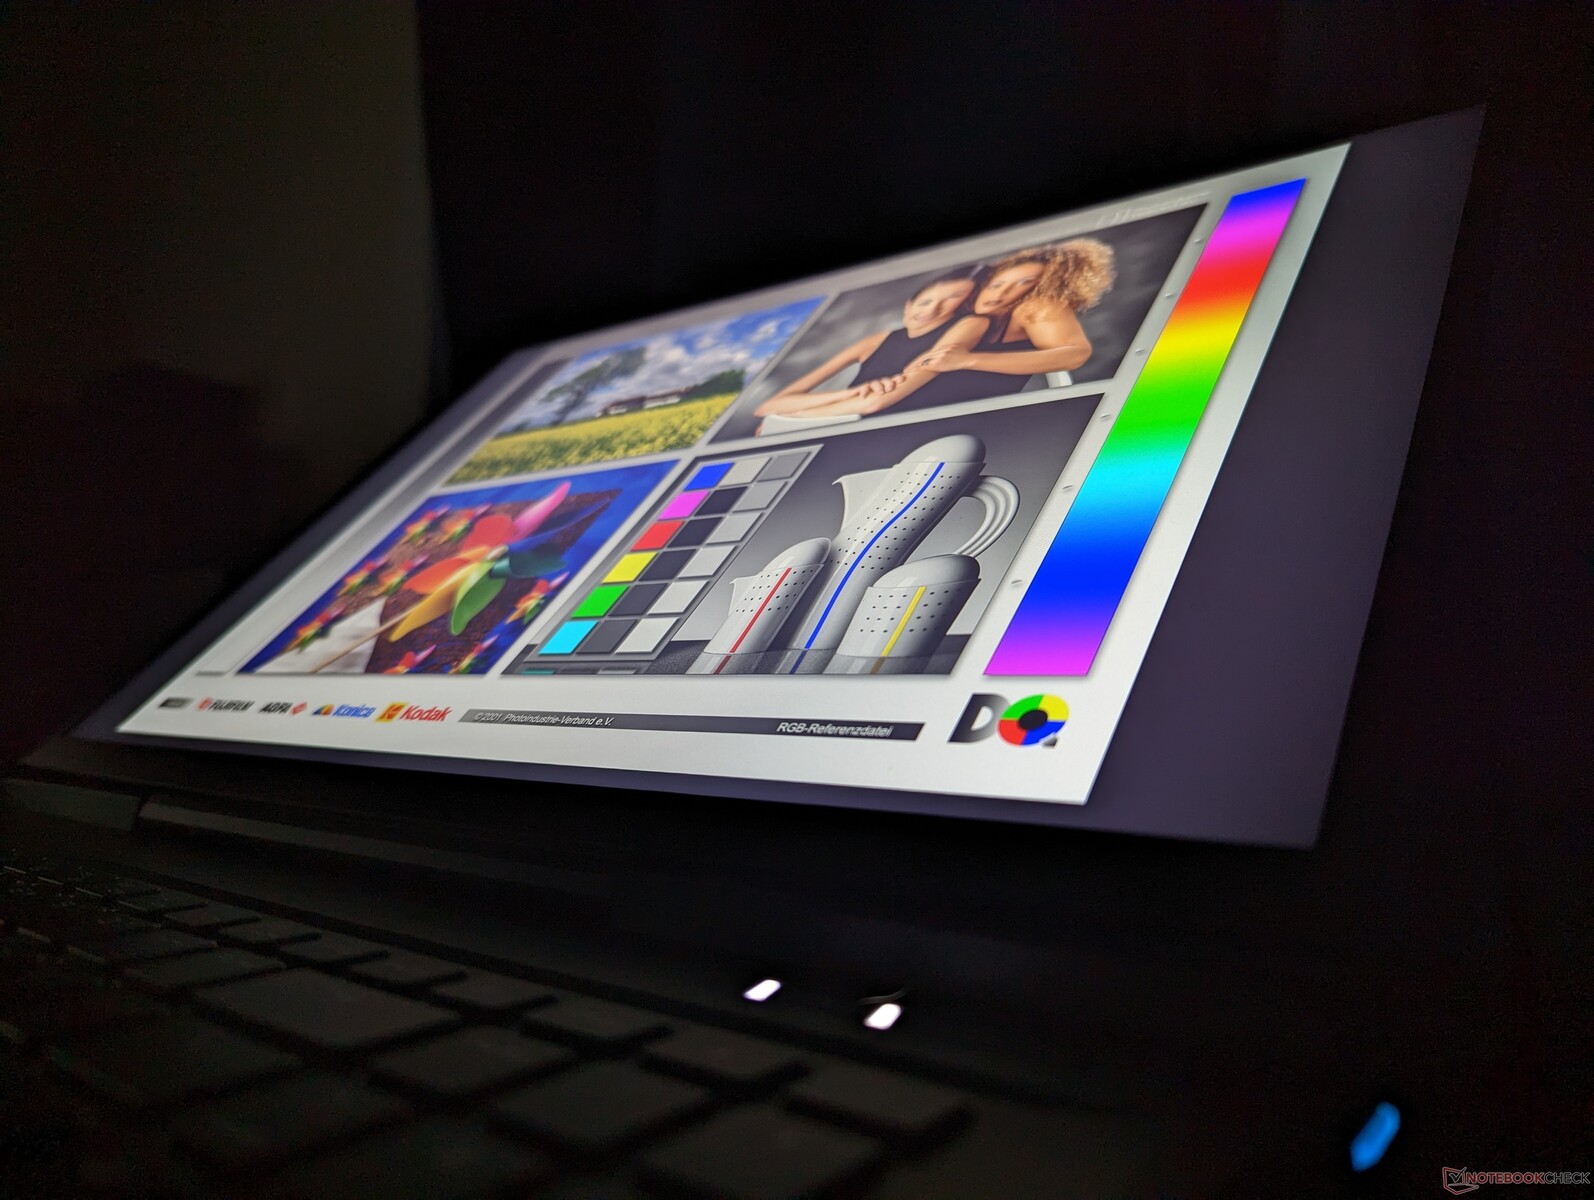
Mostrar
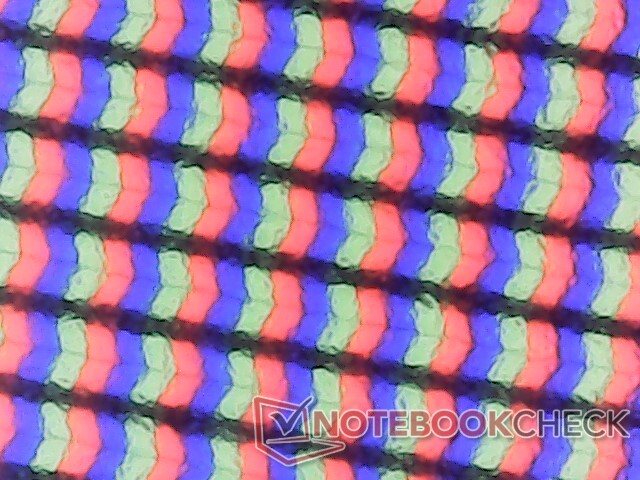
Nosso modelo do início de 2023 utiliza o mesmo painel BOE NE170QDM-NZ1 e controlador BOE0A99 como no modelo 2022, o que significa que a experiência visual não é diferente de ano para ano. Consequentemente, nossas medidas abaixo são quase idênticas entre os modelos 2022 e 2023. No entanto, isto não é uma reclamação, pois o painel oferece quase tudo o que esperamos de um laptop de alta qualidade, incluindo taxas de atualização rápida, tempos de resposta rápidos, cobertura completa de sRGB e suporte G-Sync. Para resoluções mais altas e cores P3 ainda mais profundas, no entanto, você terá que procurar em outro lugar, como o MSI GT77 ou Lâmina Razer 18.
| |||||||||||||||||||||||||
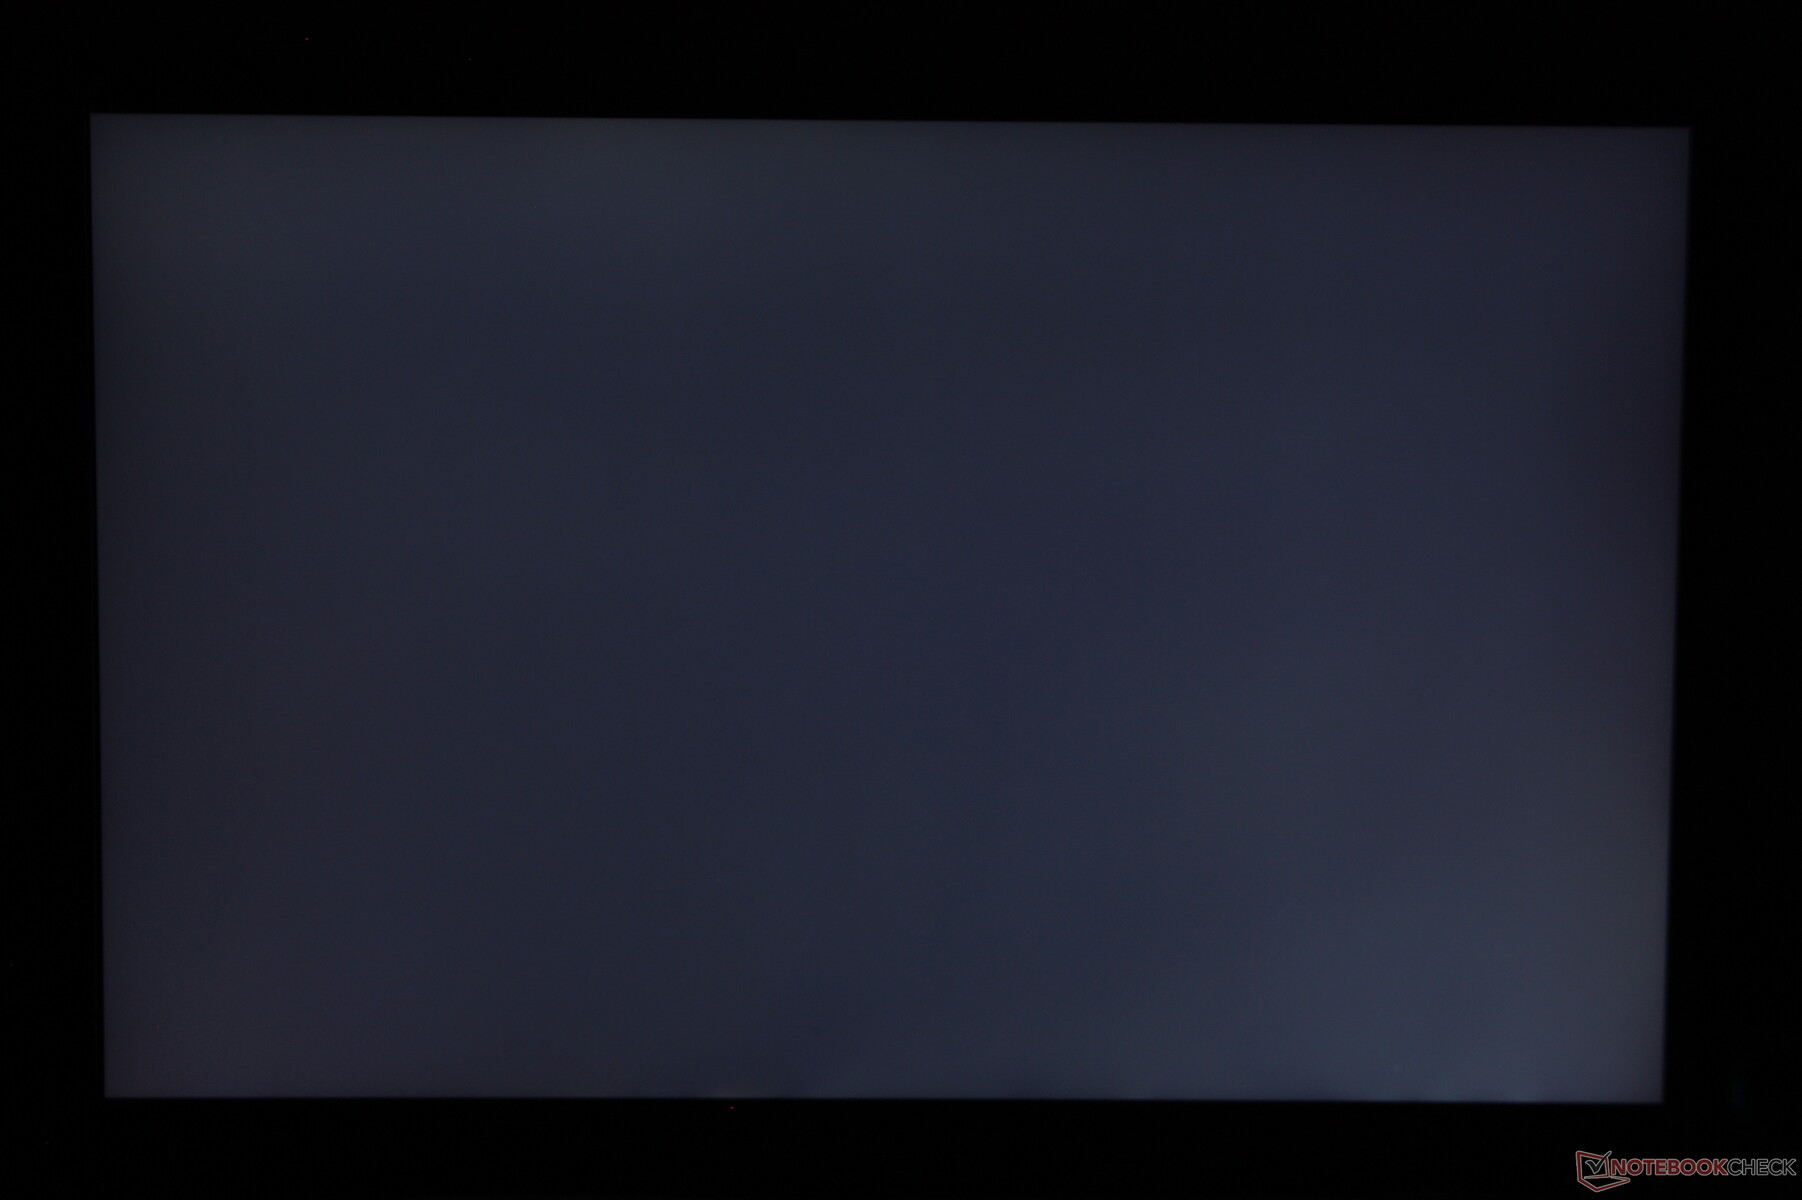
iluminação: 87 %
iluminação com acumulador: 417.3 cd/m²
Contraste: 994:1 (Preto: 0.42 cd/m²)
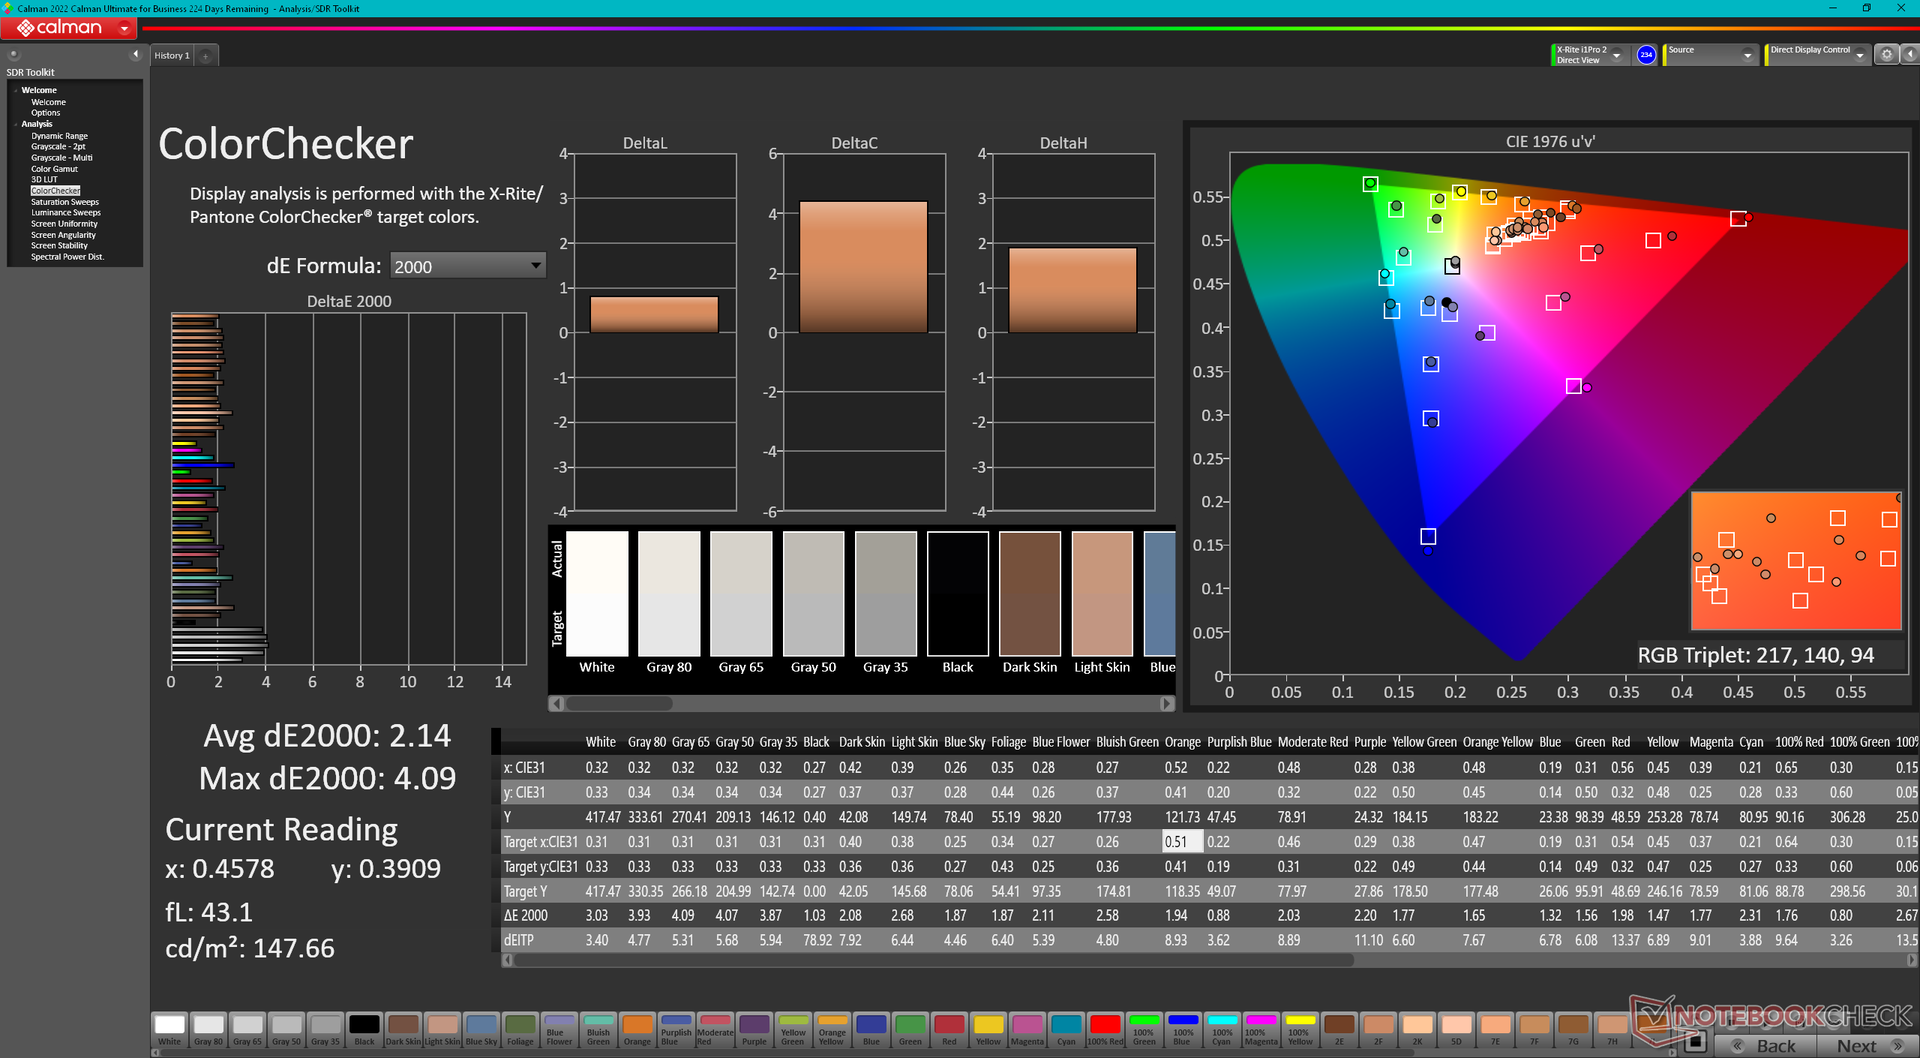
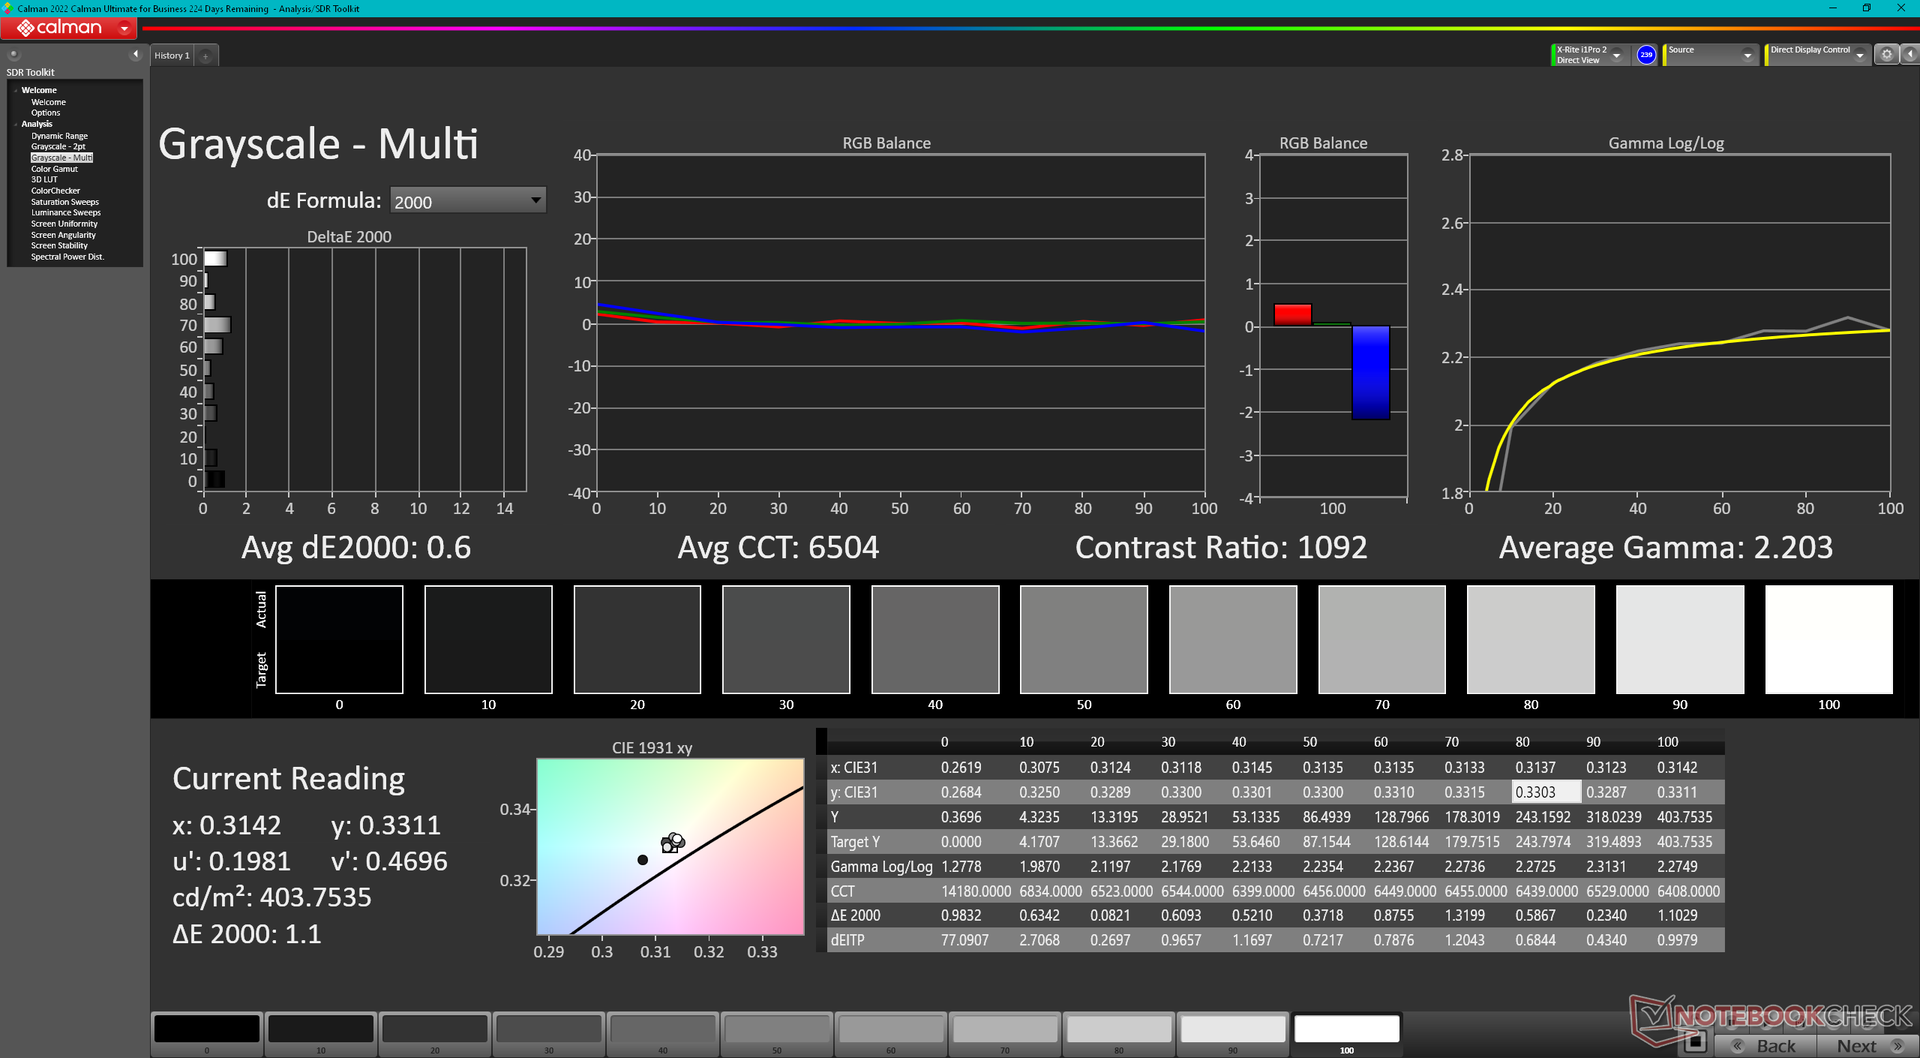
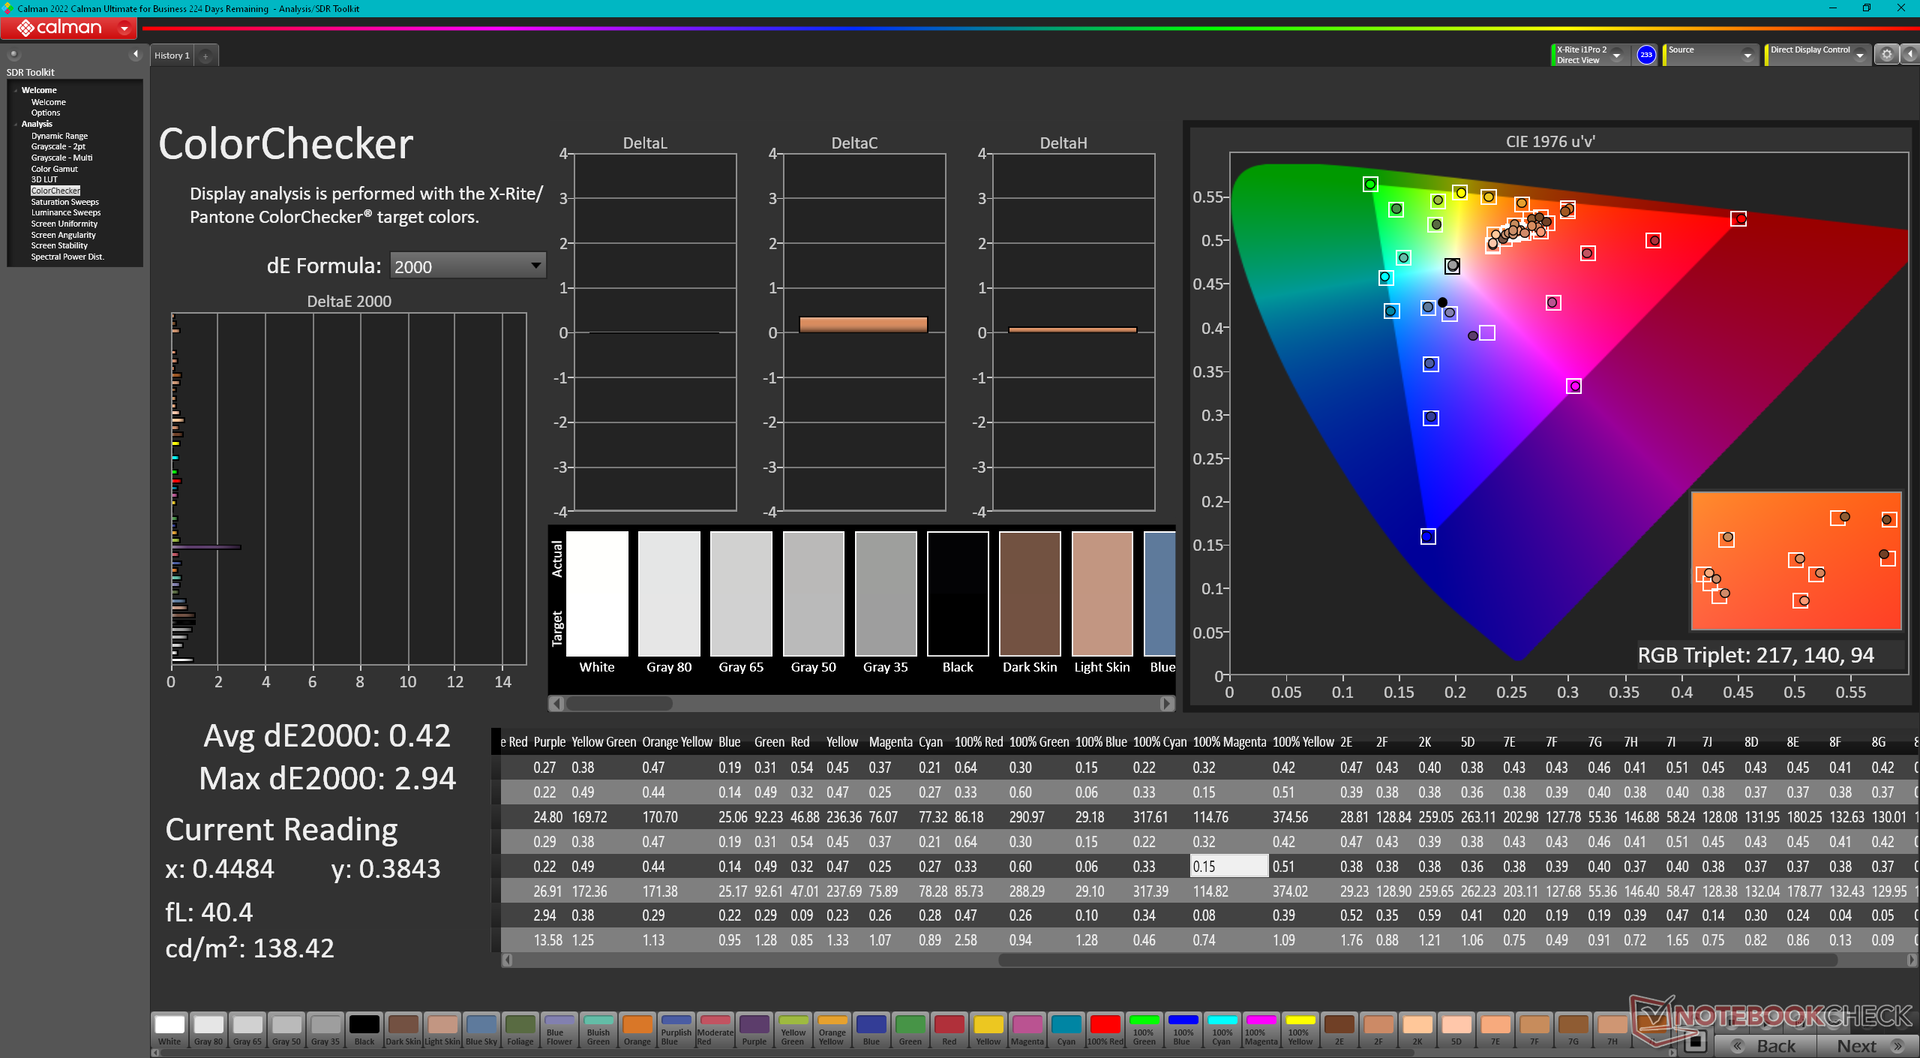
ΔE ColorChecker Calman: 2.14 | ∀{0.5-29.43 Ø4.73}
calibrated: 0.42
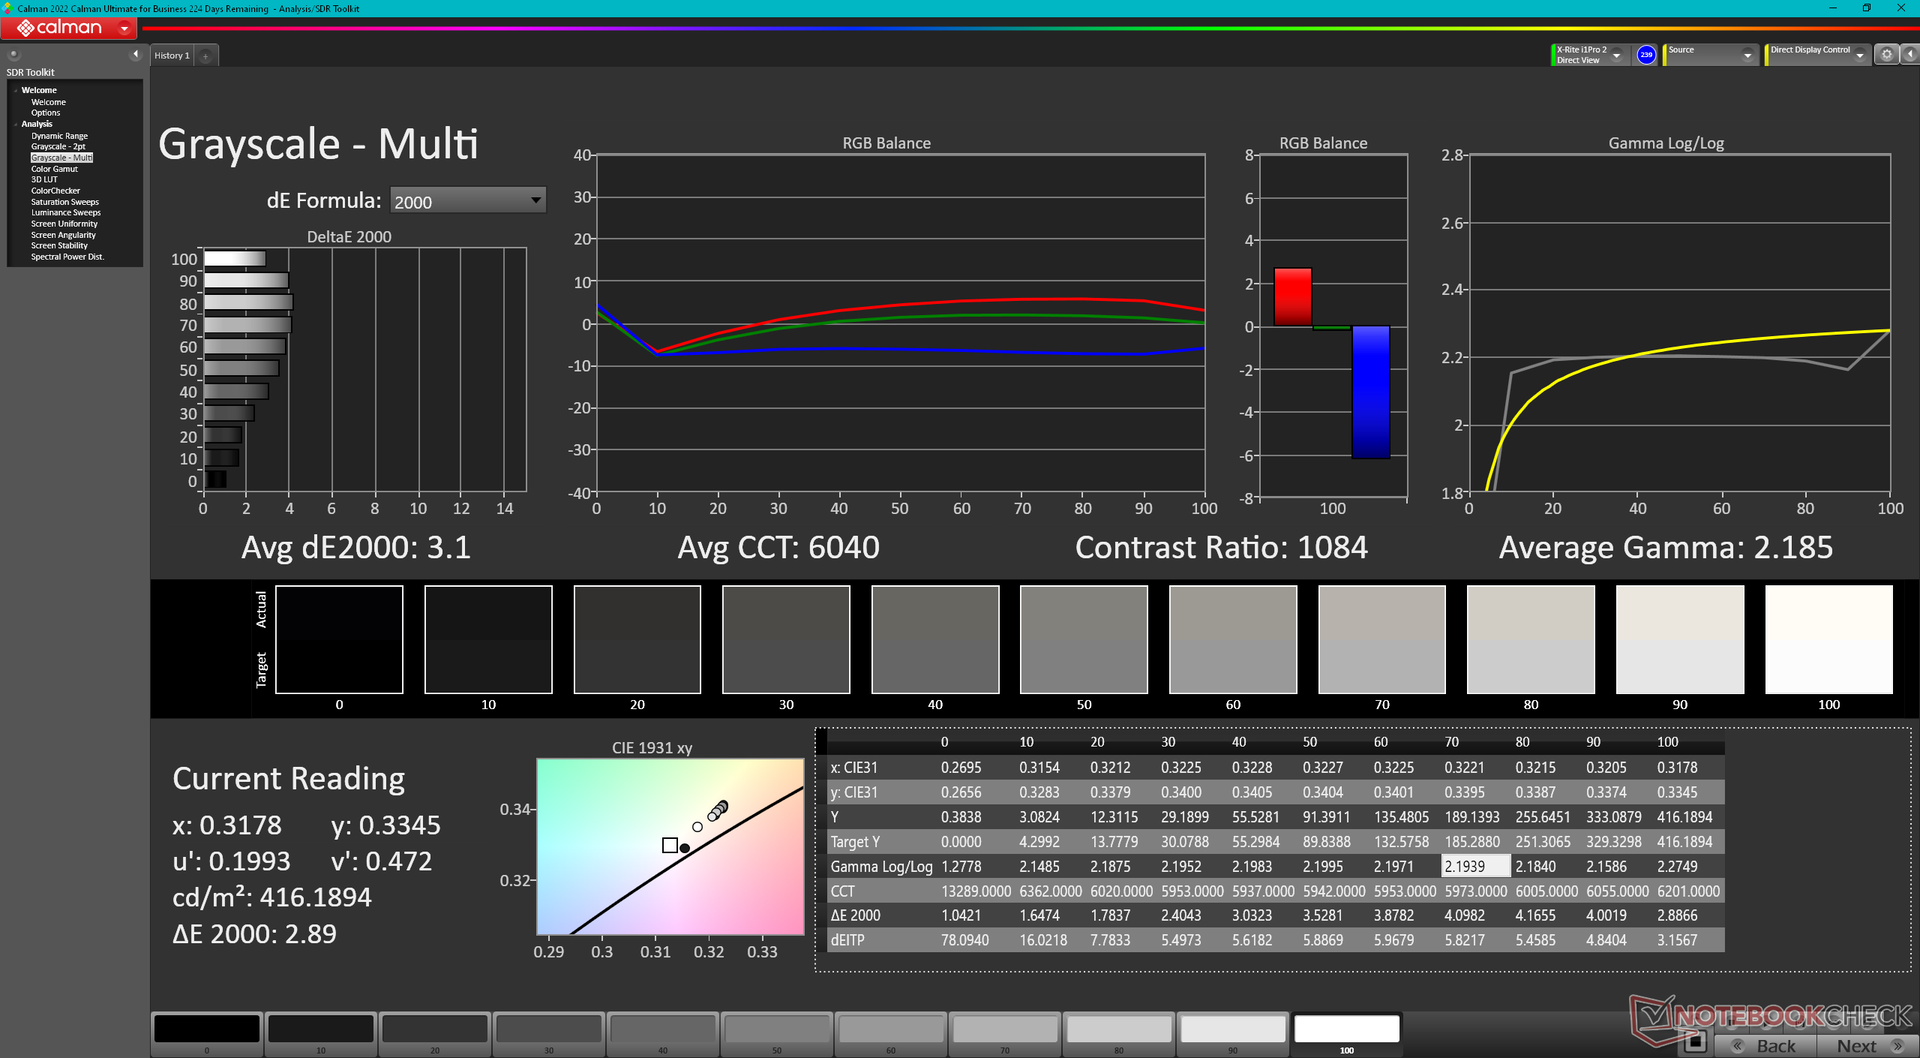
ΔE Greyscale Calman: 3.1 | ∀{0.09-98 Ø4.97}
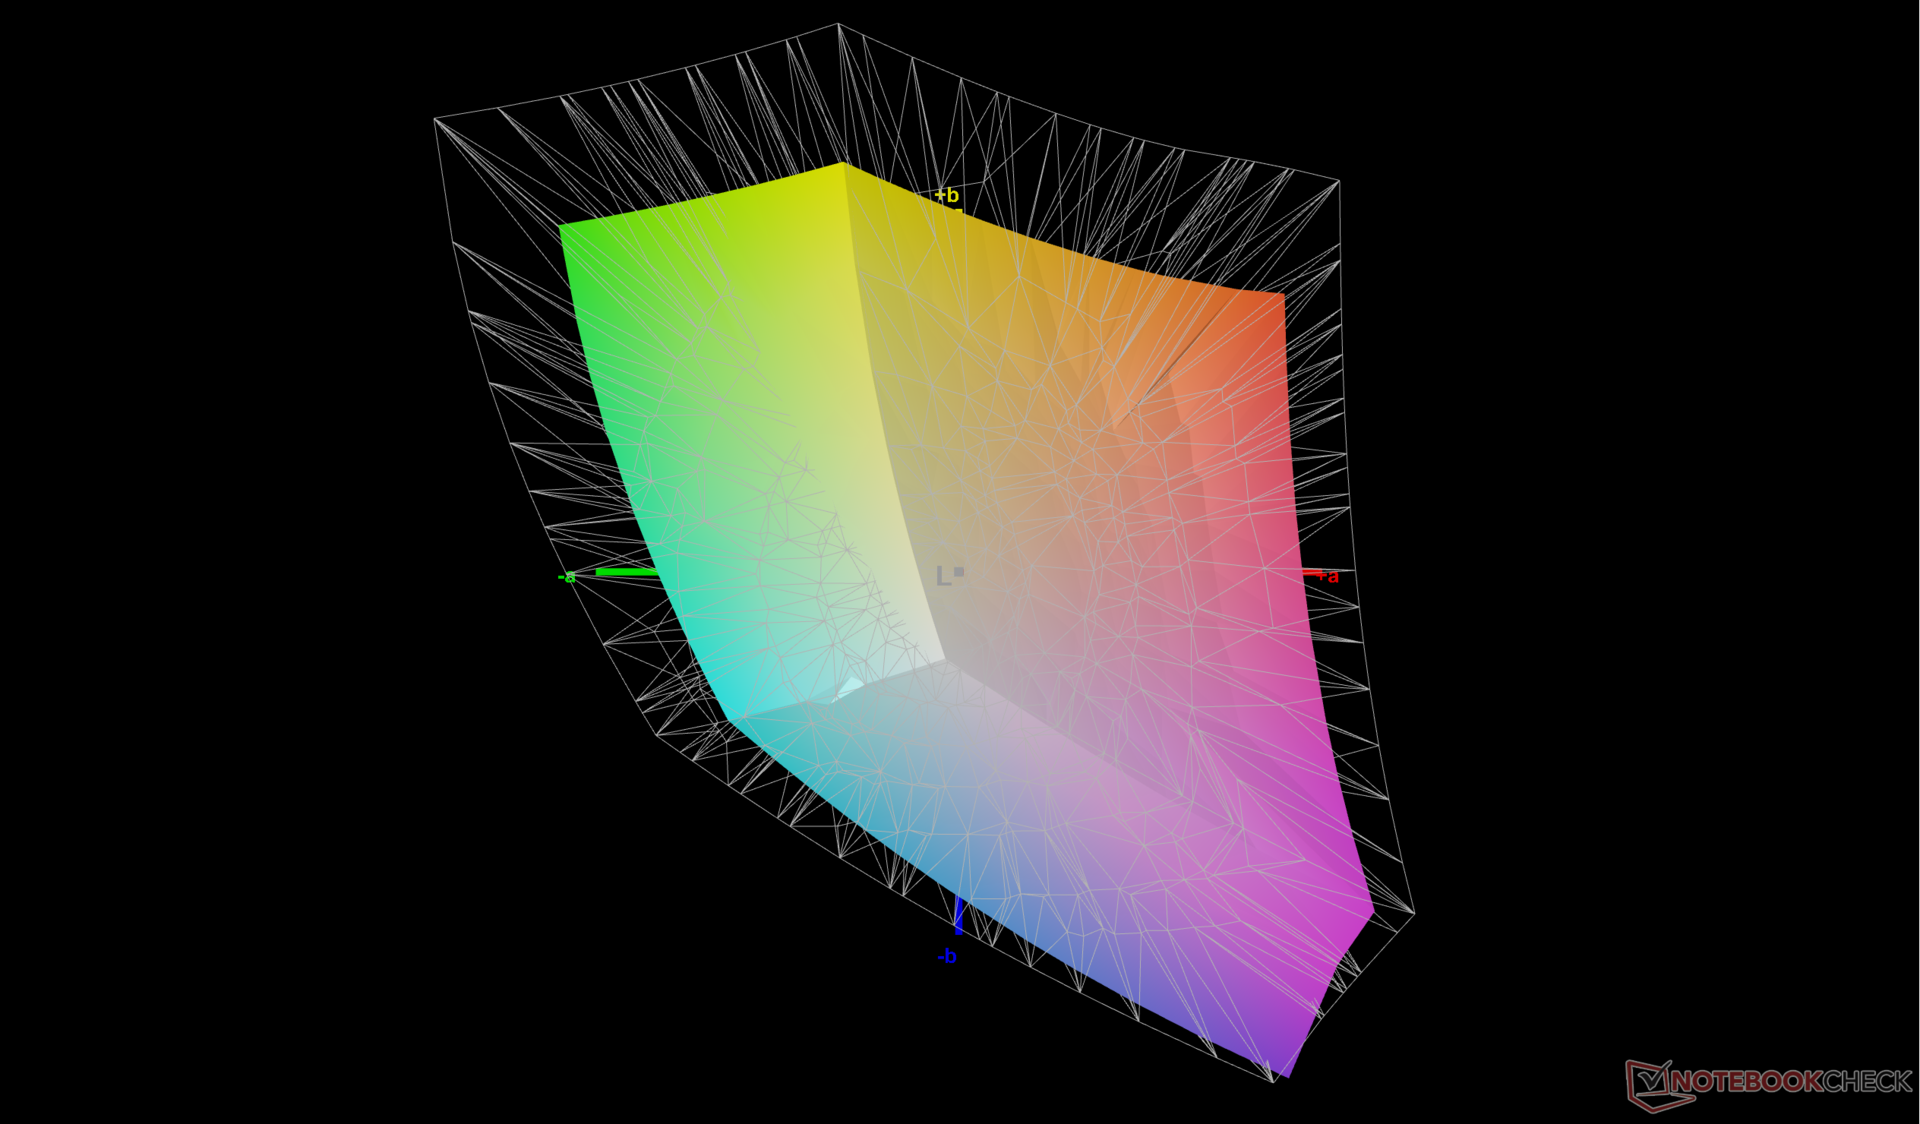
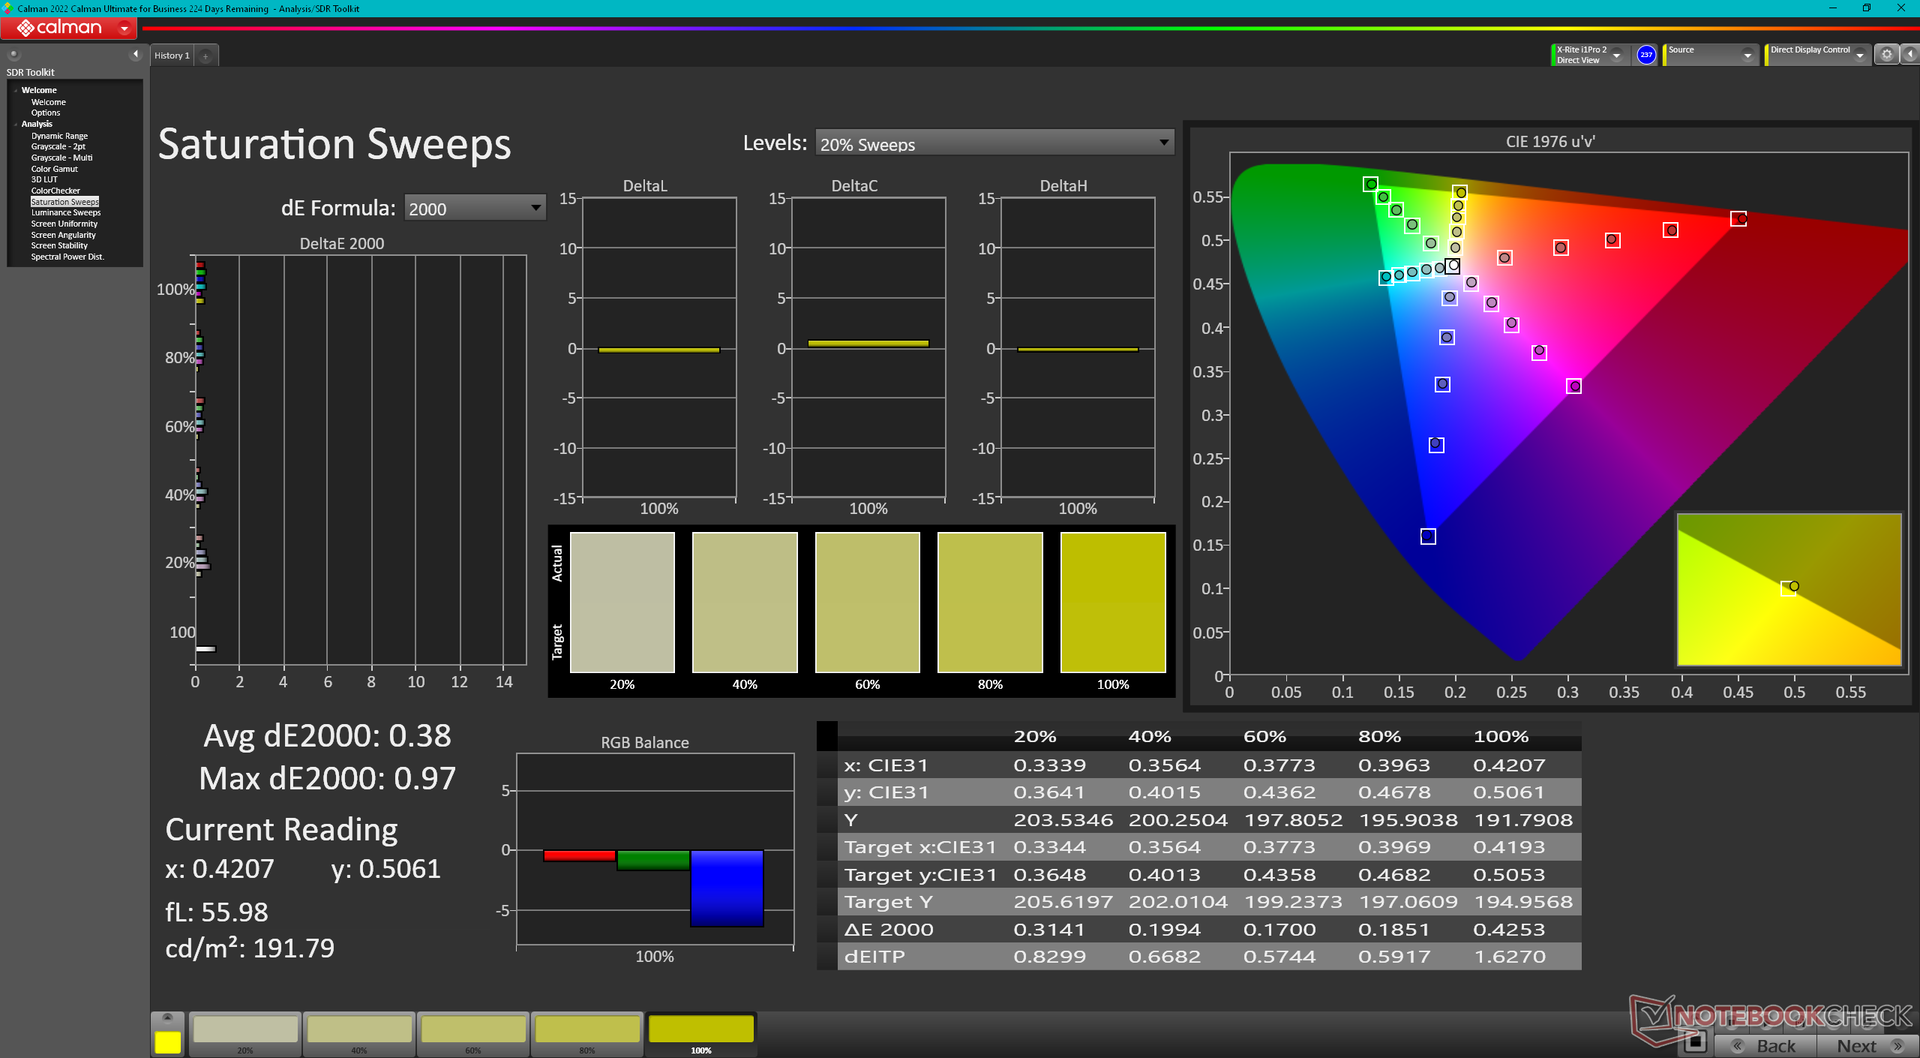
69.8% AdobeRGB 1998 (Argyll 3D)
99.7% sRGB (Argyll 3D)
69.1% Display P3 (Argyll 3D)
Gamma: 2.19
CCT: 6040 K
| Eluktronics Mech-17 GP2 BOE NE170QDM-NZ1, IPS, 2560x1600, 17" | Schenker XMG Neo 17 M22 BOE0A99, IPS, 2560x1600, 17" | MSI Katana 17 B13VFK B173HAN04.9, IPS LED, 1920x1080, 17.3" | MSI Titan GT77 HX 13VI B173ZAN06.C, Mini-LED, 3840x2160, 17.3" | Alienware m17 R5 (R9 6900HX, RX 6850M XT) AU Optronics AUODBA3, IPS, 3840x2160, 17" | Razer Blade 18 RTX 4070 AU Optronics B180QAN01.0, IPS, 2560x1600, 18" | |
|---|---|---|---|---|---|---|
| Display | 0% | -40% | 23% | 23% | 21% | |
| Display P3 Coverage (%) | 69.1 | 69 0% | 40.8 -41% | 94.9 37% | 97.2 41% | 96.9 40% |
| sRGB Coverage (%) | 99.7 | 99.8 0% | 61 -39% | 99.9 0% | 99.6 0% | 99.8 0% |
| AdobeRGB 1998 Coverage (%) | 69.8 | 69.6 0% | 42.2 -40% | 92.4 32% | 88.4 27% | 85.3 22% |
| Response Times | 23% | -176% | -202% | -30% | 40% | |
| Response Time Grey 50% / Grey 80% * (ms) | 12 ? | 10.8 ? 10% | 33 ? -175% | 38.4 ? -220% | 16.4 ? -37% | 4.2 ? 65% |
| Response Time Black / White * (ms) | 9.4 ? | 6.1 ? 35% | 26 ? -177% | 26.6 ? -183% | 11.6 ? -23% | 8 ? 15% |
| PWM Frequency (Hz) | 2380 ? | |||||
| Screen | 1% | -158% | 67678% | -147% | -64% | |
| Brightness middle (cd/m²) | 417.3 | 415 -1% | 267 -36% | 606 45% | 484 16% | 549.6 32% |
| Brightness (cd/m²) | 387 | 399 3% | 256 -34% | 602 56% | 449 16% | 524 35% |
| Brightness Distribution (%) | 87 | 90 3% | 93 7% | 93 7% | 87 0% | 89 2% |
| Black Level * (cd/m²) | 0.42 | 0.43 -2% | 0.21 50% | 0.0001 100% | 0.55 -31% | 0.53 -26% |
| Contrast (:1) | 994 | 965 -3% | 1271 28% | 6060000 609558% | 880 -11% | 1037 4% |
| Colorchecker dE 2000 * | 2.14 | 1.44 33% | 4.7 -120% | 4.8 -124% | 4.8 -124% | 3.32 -55% |
| Colorchecker dE 2000 max. * | 4.09 | 2.33 43% | 20.4 -399% | 8.2 -100% | 7.48 -83% | 6.63 -62% |
| Colorchecker dE 2000 calibrated * | 0.42 | 0.89 -112% | 4.5 -971% | 1.8 -329% | 4.74 -1029% | 2.7 -543% |
| Greyscale dE 2000 * | 3.1 | 1.8 42% | 1.5 52% | 6.5 -110% | 5.5 -77% | 2 35% |
| Gamma | 2.19 100% | 2.132 103% | 2.12 104% | 2.63 84% | 2.42 91% | 2.29 96% |
| CCT | 6040 108% | 6327 103% | 6552 99% | 6596 99% | 6148 106% | 6319 103% |
| Média Total (Programa/Configurações) | 8% /
4% | -125% /
-135% | 22500% /
43484% | -51% /
-94% | -1% /
-31% |
* ... menor é melhor
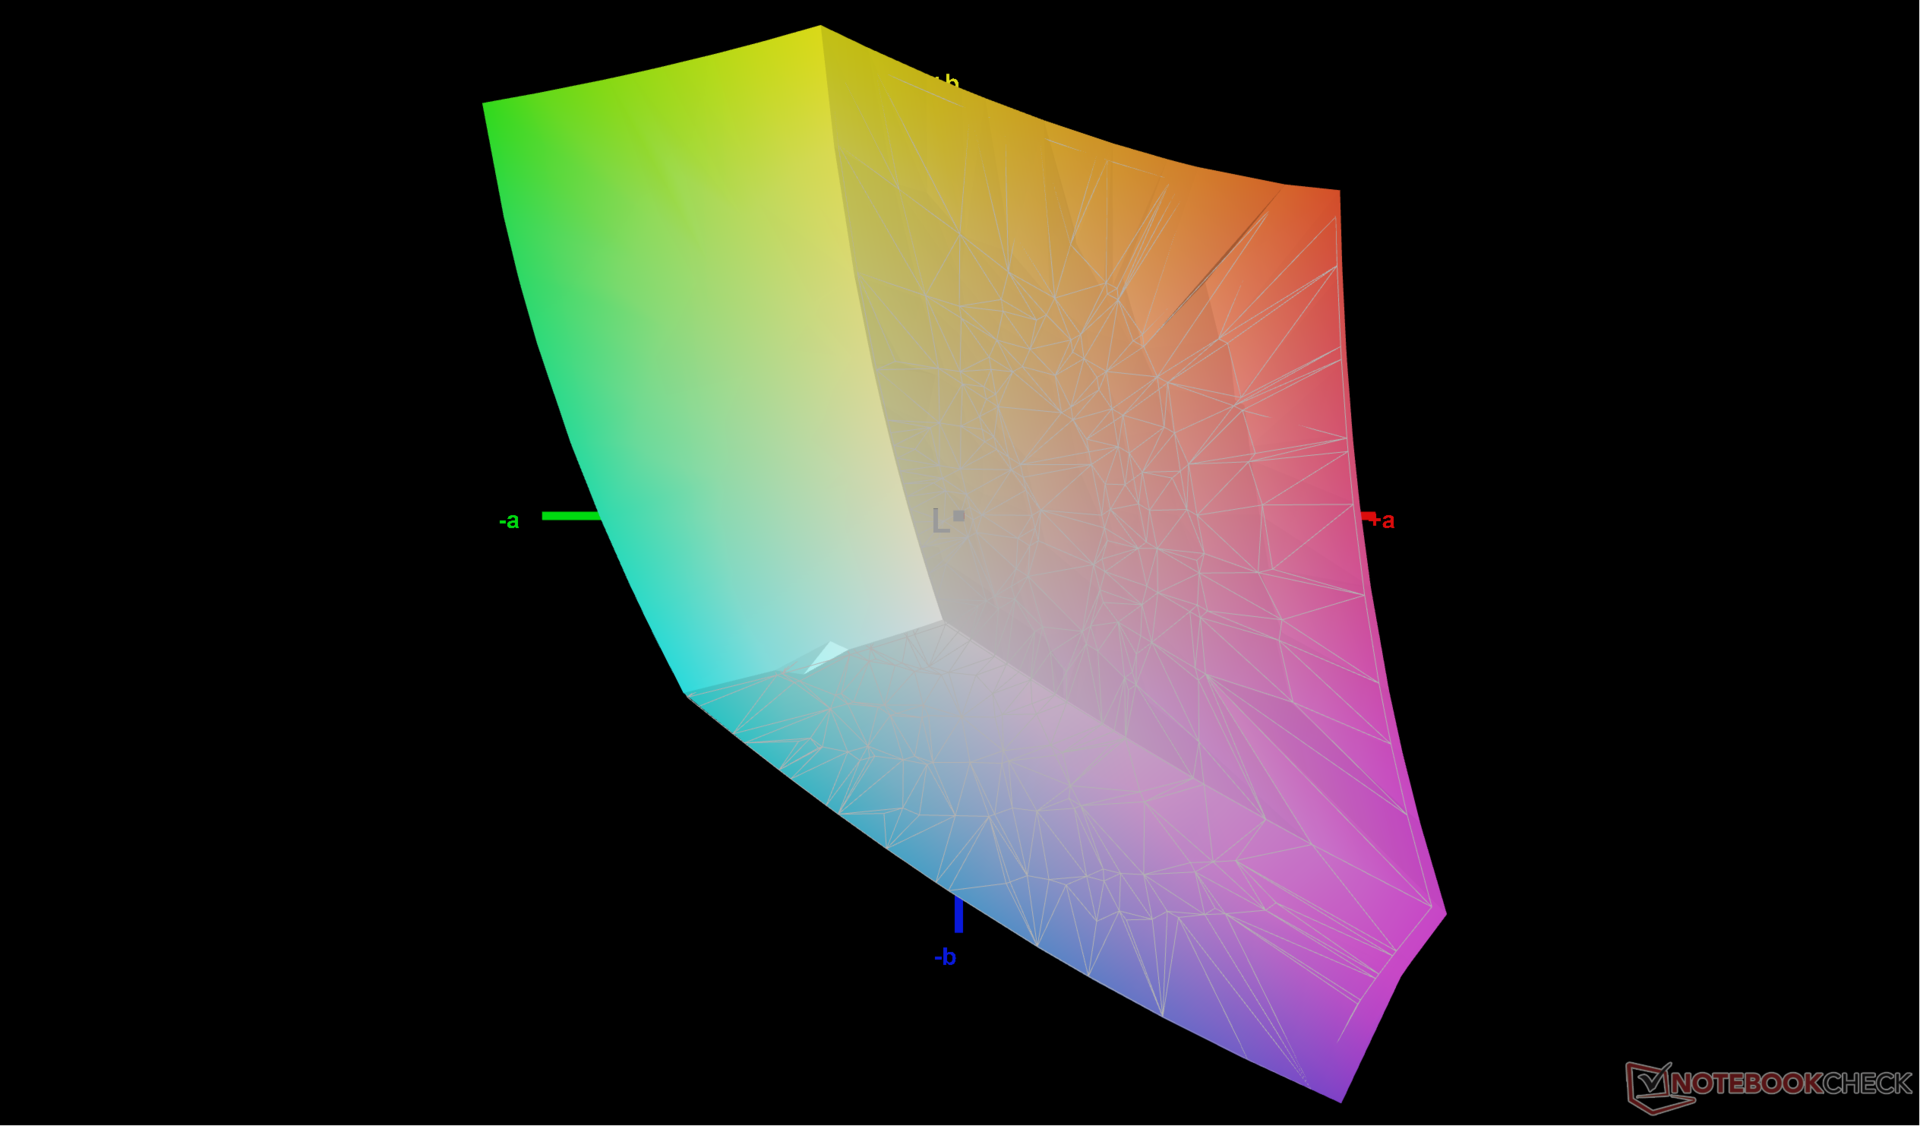
O display é bem calibrado fora da caixa com valores médios de escala de cinza e deltaE de cor de apenas 3,1 e 2,14, respectivamente. Calibrando-o nós mesmos melhoraríamos ainda mais as médias de deltaE para apenas 0,6 e 0,42 em relação ao padrão sRGB. Nosso perfil de ICM calibrado acima está disponível para download gratuito.
Exibir tempos de resposta
| ↔ Tempo de resposta preto para branco | ||
|---|---|---|
| 9.4 ms ... ascensão ↗ e queda ↘ combinadas | ↗ 4.9 ms ascensão | 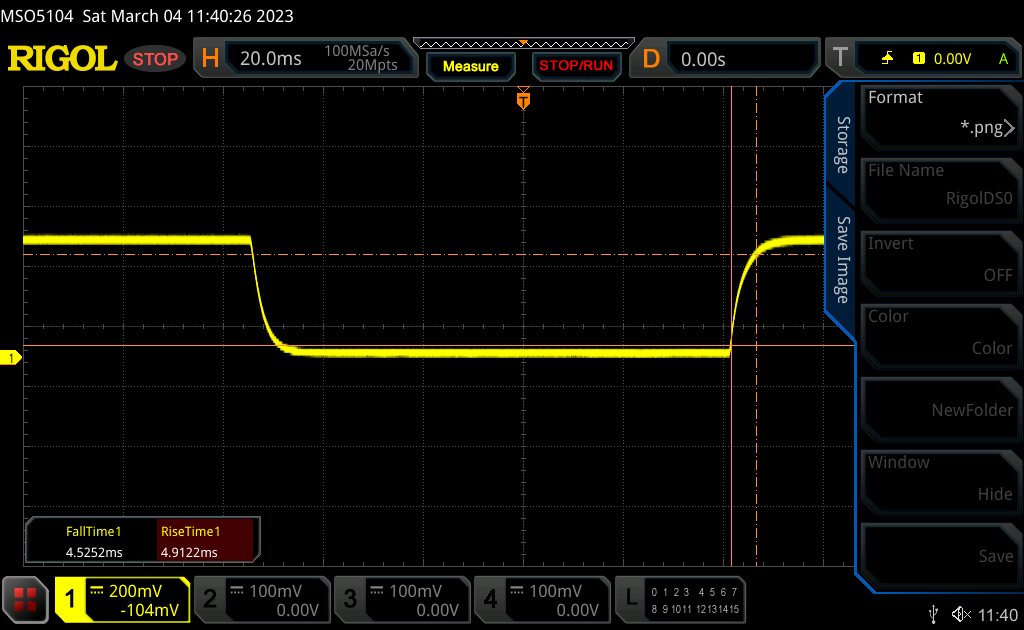 |
| ↘ 4.5 ms queda | ||
| A tela mostra taxas de resposta rápidas em nossos testes e deve ser adequada para jogos. Em comparação, todos os dispositivos testados variam de 0.1 (mínimo) a 240 (máximo) ms. » 26 % de todos os dispositivos são melhores. Isso significa que o tempo de resposta medido é melhor que a média de todos os dispositivos testados (19.9 ms). | ||
| ↔ Tempo de resposta 50% cinza a 80% cinza | ||
| 12 ms ... ascensão ↗ e queda ↘ combinadas | ↗ 5.4 ms ascensão | 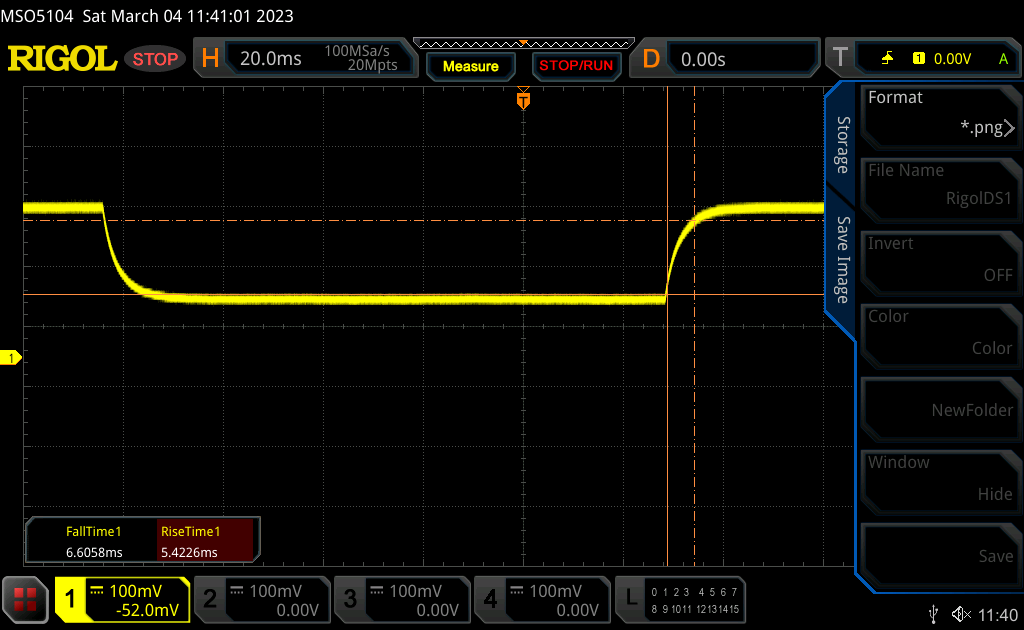 |
| ↘ 6.6 ms queda | ||
| A tela mostra boas taxas de resposta em nossos testes, mas pode ser muito lenta para jogadores competitivos. Em comparação, todos os dispositivos testados variam de 0.165 (mínimo) a 636 (máximo) ms. » 25 % de todos os dispositivos são melhores. Isso significa que o tempo de resposta medido é melhor que a média de todos os dispositivos testados (31.1 ms). | ||
Cintilação da tela / PWM (modulação por largura de pulso)
| Tela tremeluzindo / PWM não detectado | 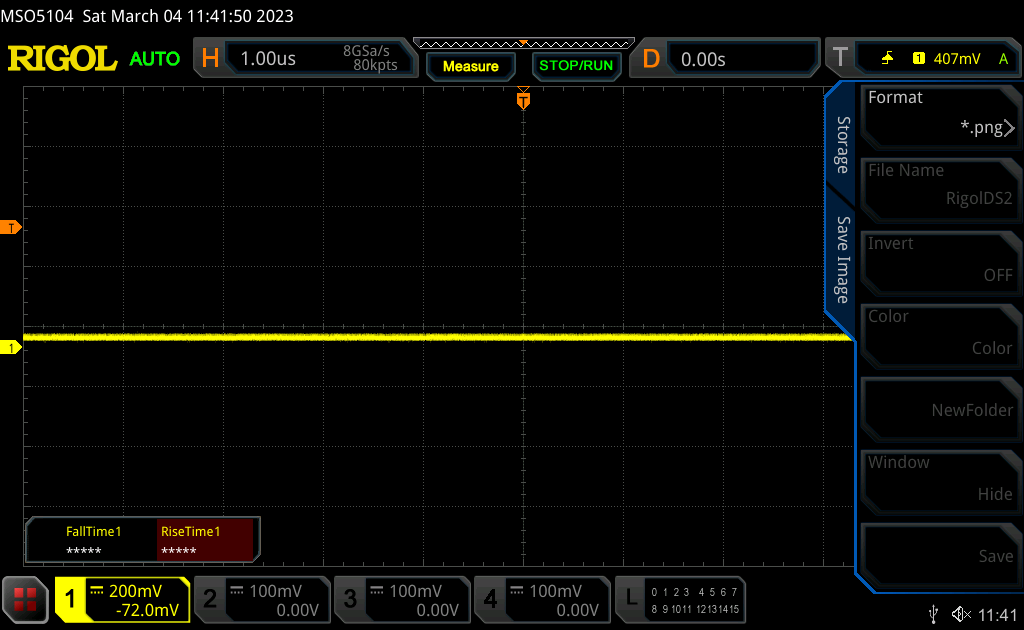 | ||
[pwm_comparison] Em comparação: 52 % de todos os dispositivos testados não usam PWM para escurecer a tela. Se PWM foi detectado, uma média de 7798 (mínimo: 5 - máximo: 343500) Hz foi medida. | |||
Desempenho
Condições de teste
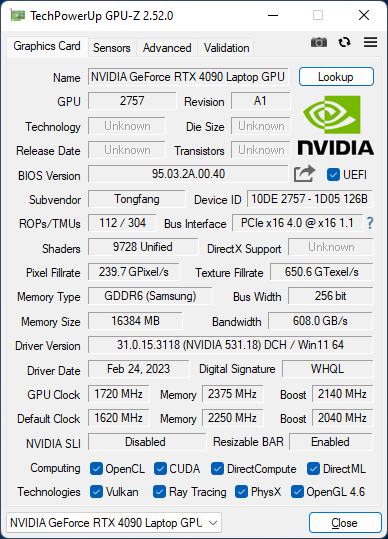
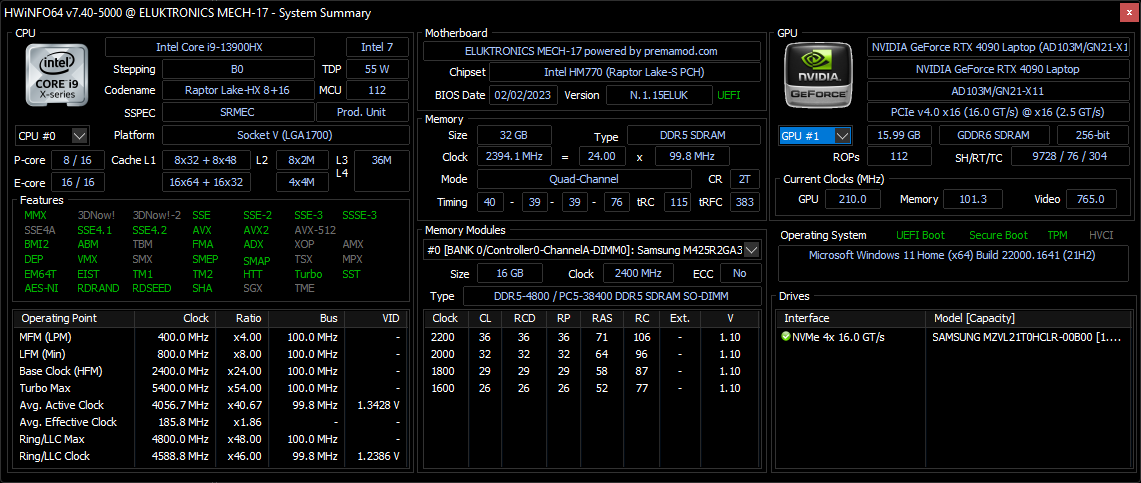
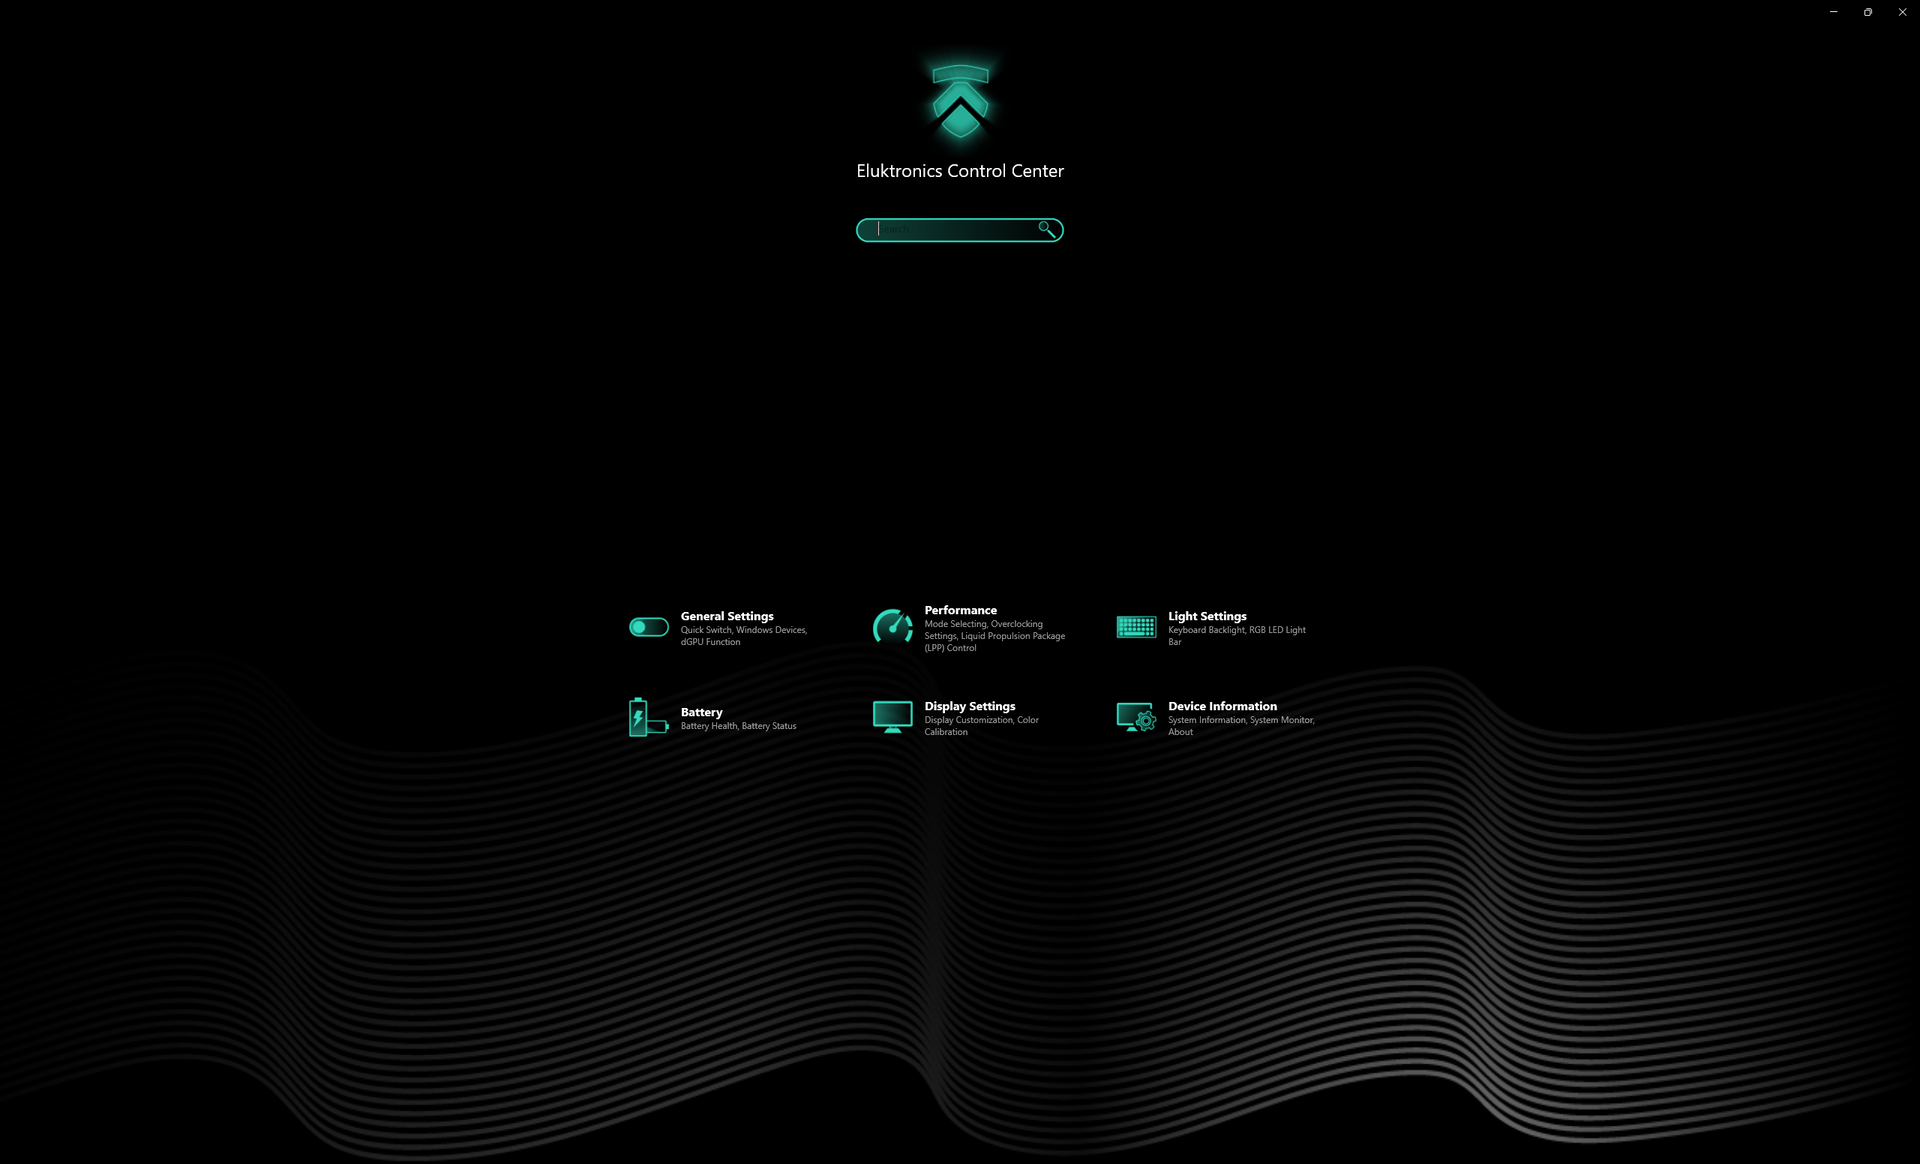
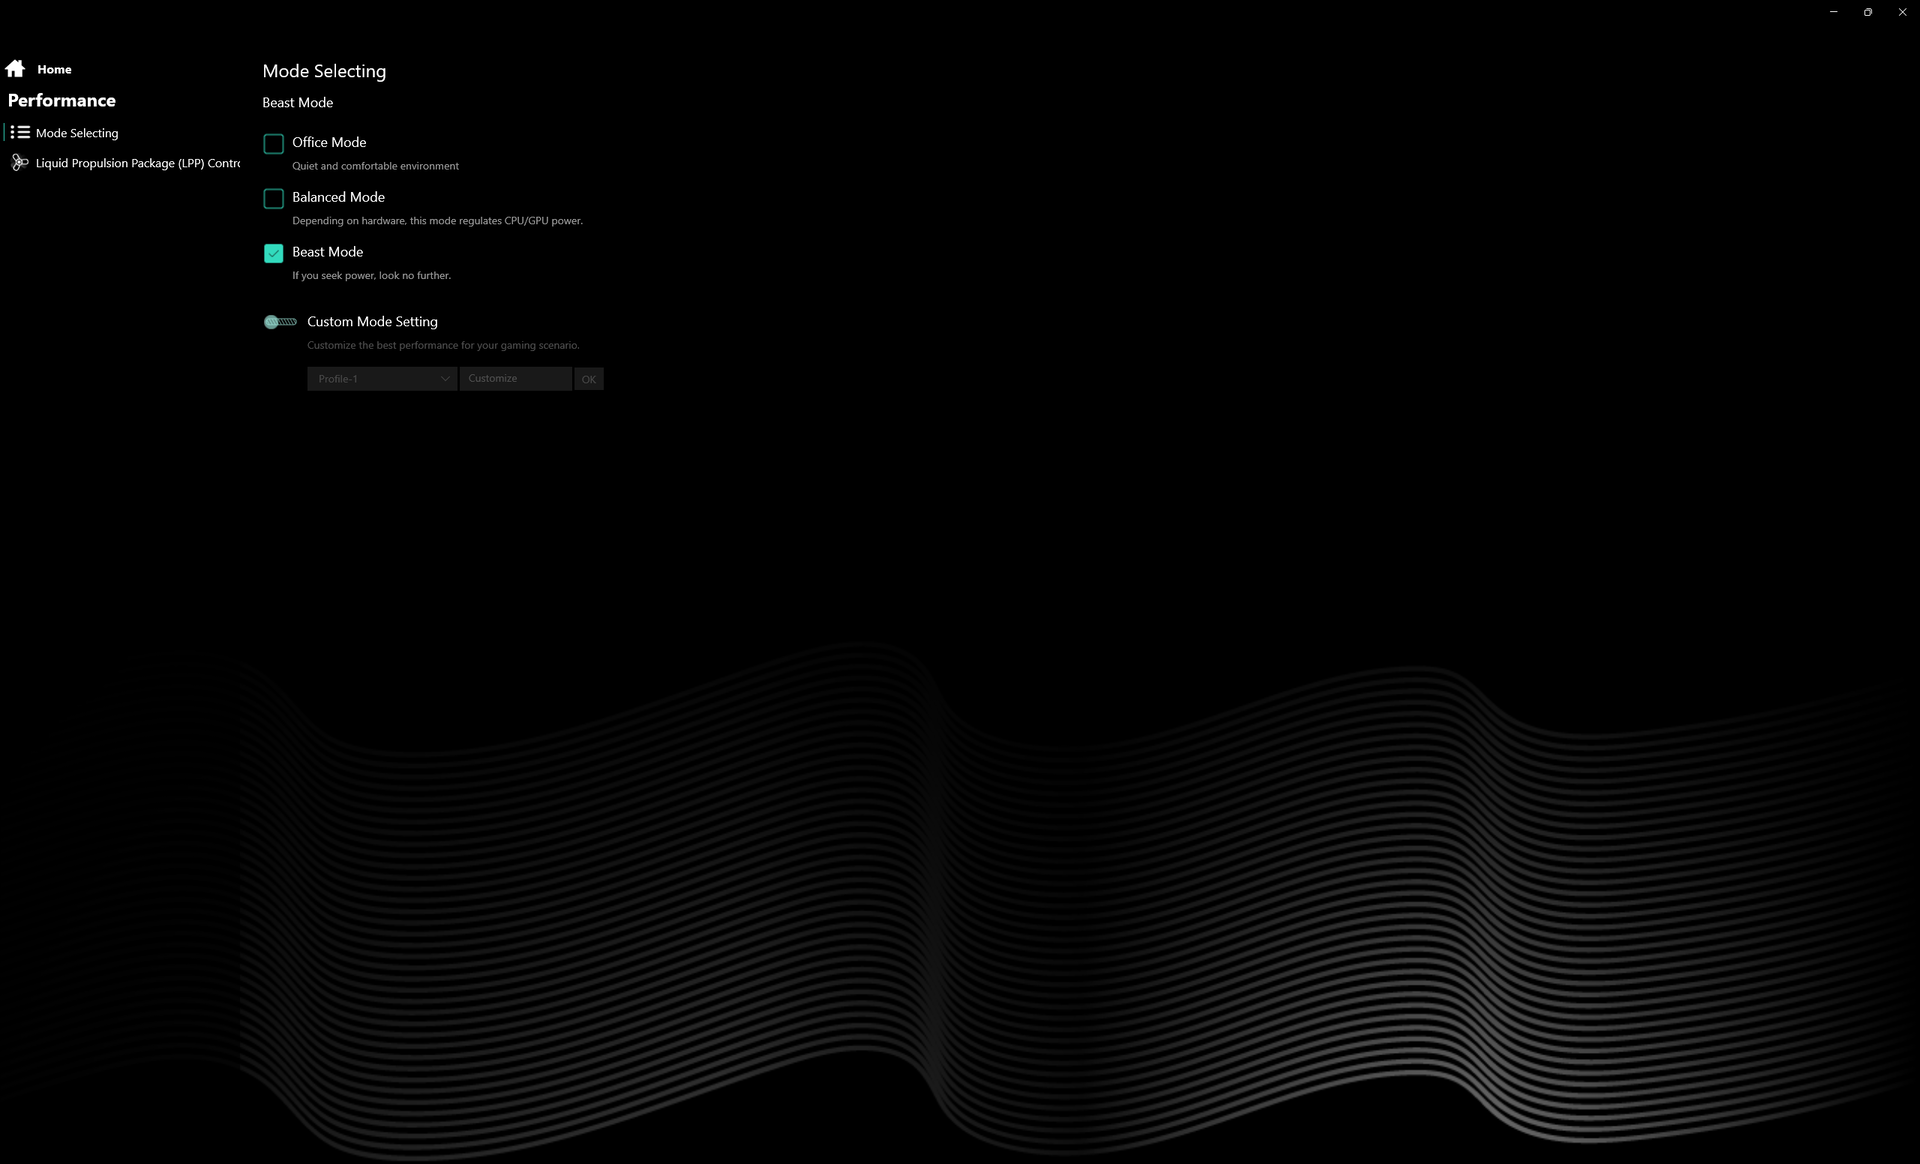
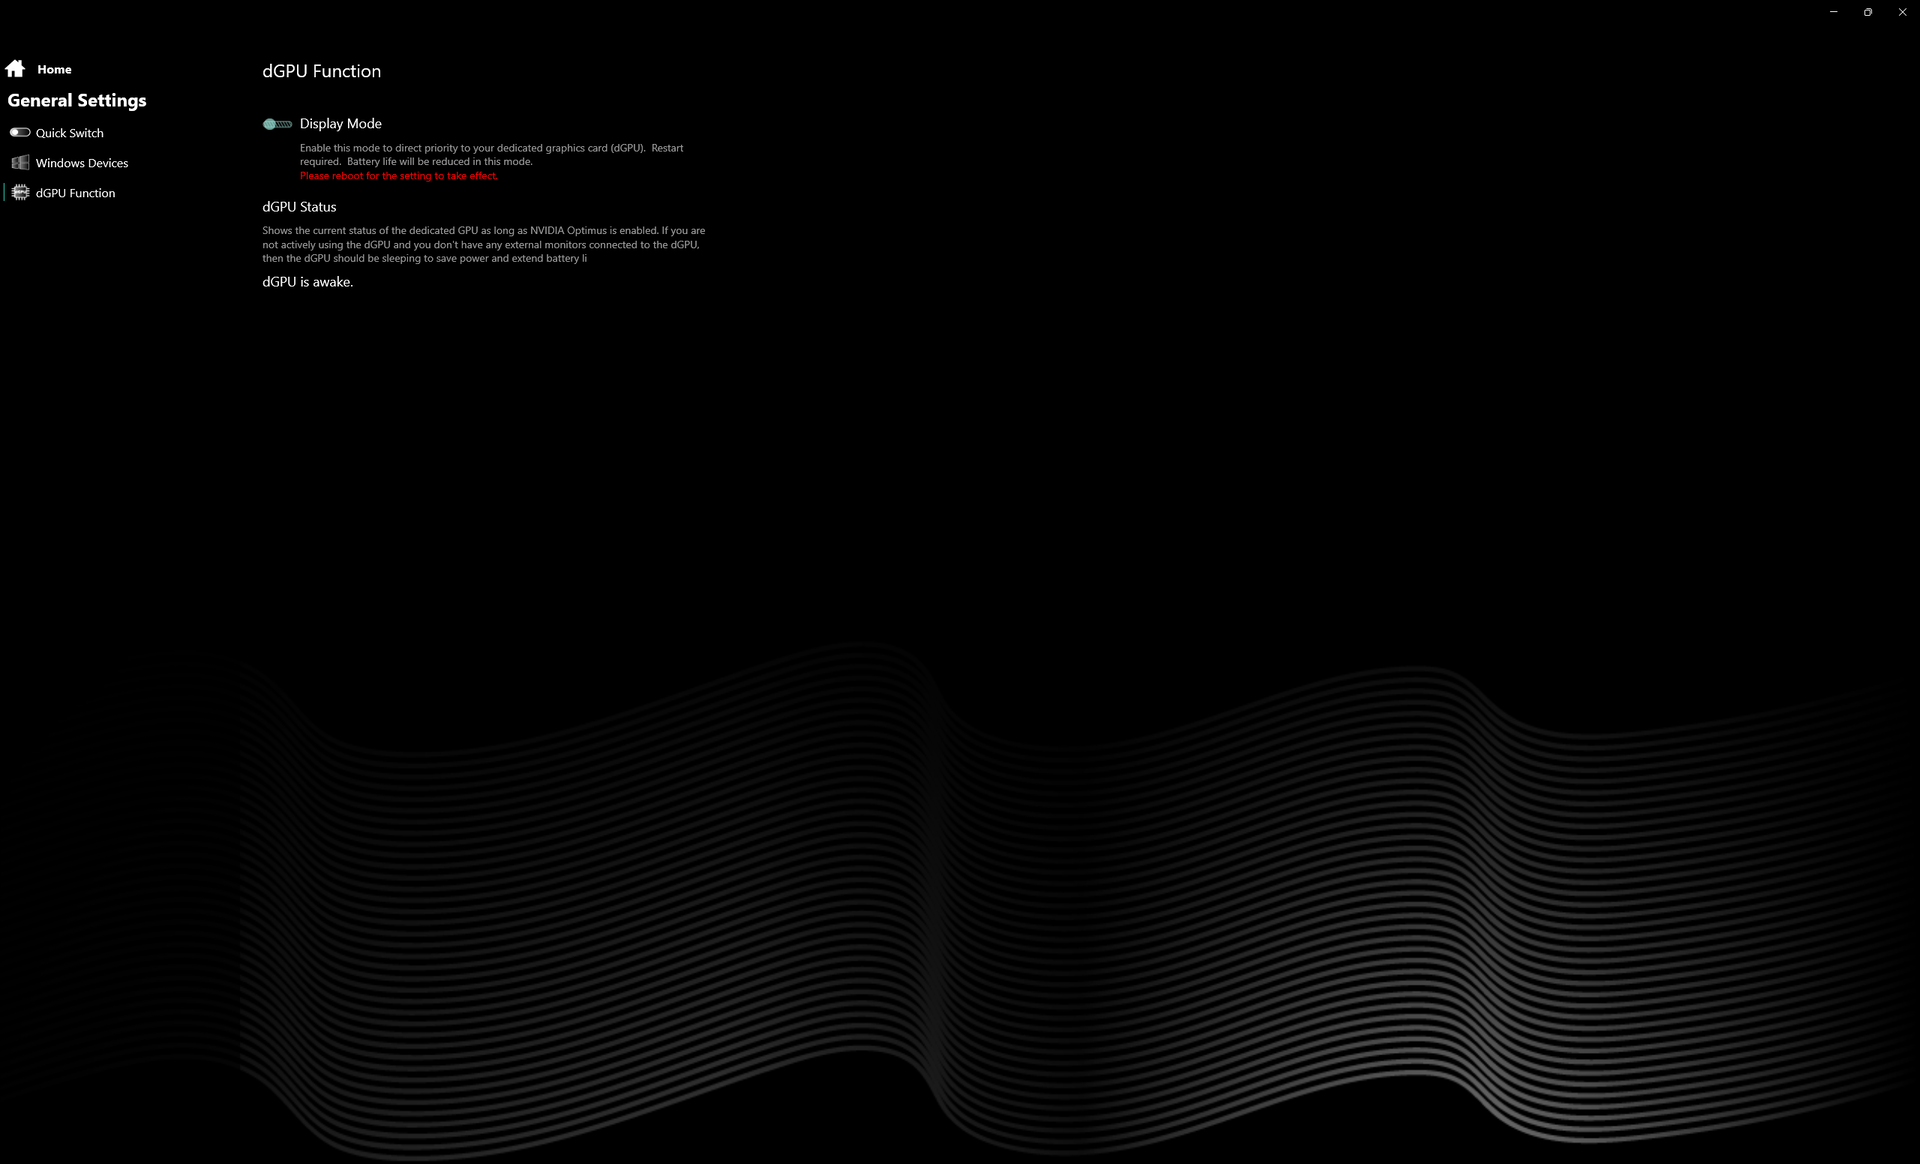
Ajustamos nossa unidade para o modo Performance via Windows e "Beast Mode" via o software pré-instalado Eluktronics Control Center antes de executar quaisquer benchmarks abaixo. Também ajustamos o sistema para o modo dGPU através do painel de controle Nvidia. Os proprietários devem se familiarizar com o Centro de Controle, pois ele é o centro para alternar características específicas do modelo como RGB, modos de carga de bateria, modos de desempenho, modo de resfriamento líquido e muito mais. O Advanced Optimus (MUX) é suportado.
Experimentamos um punhado de problemas em nossa unidade de teste incluindo telas de inicialização em branco, pelo menos um sistema congela quando se joga, e reinicializa automaticamente quando a CPU e a GPU estão em utilização máxima por períodos prolongados. Tratamos do primeiro problema desativando o Quick Boot no menu BIOS, mas tais problemas não devem estar presentes em primeiro lugar.
Processador
O desempenho bruto da CPU está apenas 1 a 2% atrás do 13º gênero Núcleo i9-13950HX no MSI Titan GT77 e, portanto, também podem ser equivalentes na maioria dos cenários. Saltando do Ryzen 9 6900HX ao nosso Núcleo i9-13900HX aumenta o desempenho multi-tarefa por um extraordinário 2x a 2,5x. O 12º gênero Núcleo i7-12700Ha velocidade do jogo, que ainda é comum em muitos laptops de gama média superior, é aproximadamente 50% mais lenta.
A sustentabilidade do desempenho é excelente, sem grandes quedas de desempenho ou comportamento de ciclismo ao longo do tempo.
Cinebench R15 Multi Loop
Cinebench R23: Multi Core | Single Core
Cinebench R20: CPU (Multi Core) | CPU (Single Core)
Cinebench R15: CPU Multi 64Bit | CPU Single 64Bit
Blender: v2.79 BMW27 CPU
7-Zip 18.03: 7z b 4 | 7z b 4 -mmt1
Geekbench 5.5: Multi-Core | Single-Core
HWBOT x265 Benchmark v2.2: 4k Preset
LibreOffice : 20 Documents To PDF
R Benchmark 2.5: Overall mean
| Cinebench R20 / CPU (Single Core) | |
| MSI Titan GT77 HX 13VI | |
| Eluktronics Mech-17 GP2 | |
| Razer Blade 18 RTX 4070 | |
| Média Intel Core i9-13900HX (722 - 810, n=21) | |
| Corsair One i300 | |
| MSI Titan GT77 12UHS | |
| MSI Katana 17 B13VFK | |
| MSI Pulse GL76 12UGK | |
| MSI GS76 Stealth 11UH | |
| Schenker XMG Neo 17 M22 | |
| HP Omen 16-n0033dx | |
| Schenker XMG Core 17 (Early 2021) | |
| HWBOT x265 Benchmark v2.2 / 4k Preset | |
| Eluktronics Mech-17 GP2 | |
| MSI Titan GT77 HX 13VI | |
| Razer Blade 18 RTX 4070 | |
| Média Intel Core i9-13900HX (23.5 - 34.4, n=22) | |
| Corsair One i300 | |
| MSI Titan GT77 12UHS | |
| MSI Pulse GL76 12UGK | |
| Schenker XMG Neo 17 M22 | |
| MSI Katana 17 B13VFK | |
| HP Omen 16-n0033dx | |
| MSI GS76 Stealth 11UH | |
| Schenker XMG Core 17 (Early 2021) | |
| LibreOffice / 20 Documents To PDF | |
| HP Omen 16-n0033dx | |
| MSI Katana 17 B13VFK | |
| Schenker XMG Core 17 (Early 2021) | |
| Schenker XMG Neo 17 M22 | |
| MSI GS76 Stealth 11UH | |
| MSI Titan GT77 HX 13VI | |
| MSI Pulse GL76 12UGK | |
| Razer Blade 18 RTX 4070 | |
| Média Intel Core i9-13900HX (32.8 - 51.1, n=21) | |
| MSI Titan GT77 12UHS | |
| Corsair One i300 | |
| Eluktronics Mech-17 GP2 | |
* ... menor é melhor
AIDA64: FP32 Ray-Trace | FPU Julia | CPU SHA3 | CPU Queen | FPU SinJulia | FPU Mandel | CPU AES | CPU ZLib | FP64 Ray-Trace | CPU PhotoWorxx
| Performance rating | |
| Eluktronics Mech-17 GP2 | |
| MSI Titan GT77 HX 13VI | |
| Razer Blade 18 RTX 4070 | |
| Média Intel Core i9-13900HX | |
| Schenker XMG Neo 17 M22 | |
| Alienware m17 R5 (R9 6900HX, RX 6850M XT) | |
| MSI Katana 17 B13VFK | |
| AIDA64 / FP32 Ray-Trace | |
| MSI Titan GT77 HX 13VI | |
| Eluktronics Mech-17 GP2 | |
| Razer Blade 18 RTX 4070 | |
| Média Intel Core i9-13900HX (17589 - 27615, n=22) | |
| Alienware m17 R5 (R9 6900HX, RX 6850M XT) | |
| Schenker XMG Neo 17 M22 | |
| MSI Katana 17 B13VFK | |
| AIDA64 / FPU Julia | |
| MSI Titan GT77 HX 13VI | |
| Eluktronics Mech-17 GP2 | |
| Razer Blade 18 RTX 4070 | |
| Média Intel Core i9-13900HX (88686 - 137015, n=22) | |
| Alienware m17 R5 (R9 6900HX, RX 6850M XT) | |
| Schenker XMG Neo 17 M22 | |
| MSI Katana 17 B13VFK | |
| AIDA64 / CPU SHA3 | |
| MSI Titan GT77 HX 13VI | |
| Eluktronics Mech-17 GP2 | |
| Razer Blade 18 RTX 4070 | |
| Média Intel Core i9-13900HX (4362 - 7029, n=22) | |
| Alienware m17 R5 (R9 6900HX, RX 6850M XT) | |
| Schenker XMG Neo 17 M22 | |
| MSI Katana 17 B13VFK | |
| AIDA64 / CPU Queen | |
| Eluktronics Mech-17 GP2 | |
| MSI Titan GT77 HX 13VI | |
| Razer Blade 18 RTX 4070 | |
| Média Intel Core i9-13900HX (125644 - 141385, n=22) | |
| Alienware m17 R5 (R9 6900HX, RX 6850M XT) | |
| Schenker XMG Neo 17 M22 | |
| MSI Katana 17 B13VFK | |
| AIDA64 / FPU SinJulia | |
| Eluktronics Mech-17 GP2 | |
| MSI Titan GT77 HX 13VI | |
| Razer Blade 18 RTX 4070 | |
| Média Intel Core i9-13900HX (12334 - 17179, n=22) | |
| Alienware m17 R5 (R9 6900HX, RX 6850M XT) | |
| Schenker XMG Neo 17 M22 | |
| MSI Katana 17 B13VFK | |
| AIDA64 / FPU Mandel | |
| MSI Titan GT77 HX 13VI | |
| Eluktronics Mech-17 GP2 | |
| Razer Blade 18 RTX 4070 | |
| Média Intel Core i9-13900HX (43850 - 69202, n=22) | |
| Alienware m17 R5 (R9 6900HX, RX 6850M XT) | |
| Schenker XMG Neo 17 M22 | |
| MSI Katana 17 B13VFK | |
| AIDA64 / CPU AES | |
| Eluktronics Mech-17 GP2 | |
| Média Intel Core i9-13900HX (89413 - 237881, n=22) | |
| MSI Titan GT77 HX 13VI | |
| Schenker XMG Neo 17 M22 | |
| Razer Blade 18 RTX 4070 | |
| MSI Katana 17 B13VFK | |
| Alienware m17 R5 (R9 6900HX, RX 6850M XT) | |
| AIDA64 / CPU ZLib | |
| MSI Titan GT77 HX 13VI | |
| Eluktronics Mech-17 GP2 | |
| Razer Blade 18 RTX 4070 | |
| Média Intel Core i9-13900HX (1284 - 1958, n=22) | |
| Alienware m17 R5 (R9 6900HX, RX 6850M XT) | |
| Schenker XMG Neo 17 M22 | |
| MSI Katana 17 B13VFK | |
| AIDA64 / FP64 Ray-Trace | |
| MSI Titan GT77 HX 13VI | |
| Eluktronics Mech-17 GP2 | |
| Razer Blade 18 RTX 4070 | |
| Média Intel Core i9-13900HX (9481 - 15279, n=22) | |
| Alienware m17 R5 (R9 6900HX, RX 6850M XT) | |
| Schenker XMG Neo 17 M22 | |
| MSI Katana 17 B13VFK | |
| AIDA64 / CPU PhotoWorxx | |
| Razer Blade 18 RTX 4070 | |
| Média Intel Core i9-13900HX (42994 - 51994, n=22) | |
| Eluktronics Mech-17 GP2 | |
| MSI Titan GT77 HX 13VI | |
| MSI Katana 17 B13VFK | |
| Alienware m17 R5 (R9 6900HX, RX 6850M XT) | |
| Schenker XMG Neo 17 M22 | |
Desempenho do sistema
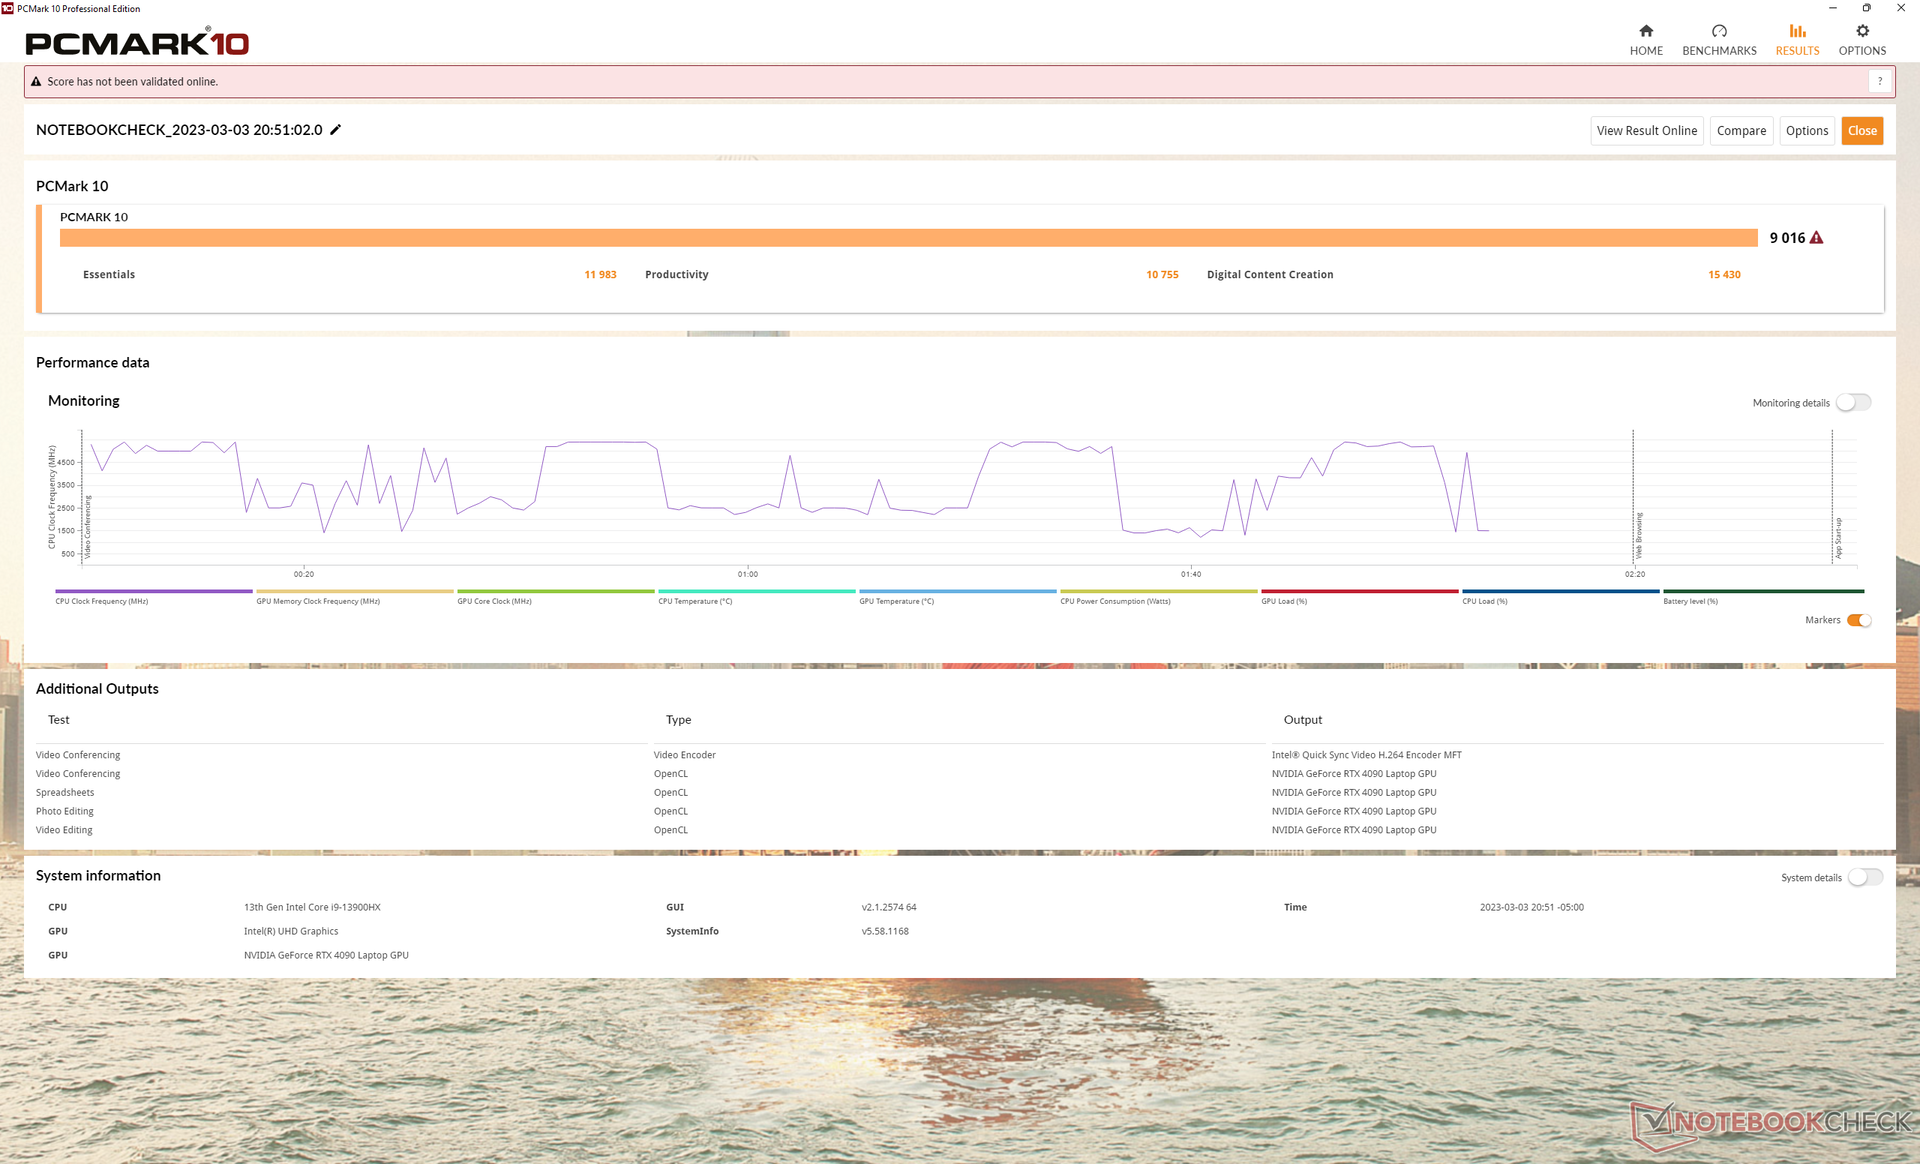
As pontuações PCMark são algumas das mais altas em nosso banco de dados, rivalizando com o MSI Titan GT77. Sua pontuação na Criação de Conteúdo Digital em particular é quase 70% maior do que a do modelo RTX 3080 Ti do ano passado, devido ao aumento no desempenho gráfico.
CrossMark: Overall | Productivity | Creativity | Responsiveness
| PCMark 10 / Score | |
| Eluktronics Mech-17 GP2 | |
| MSI Titan GT77 HX 13VI | |
| Média Intel Core i9-13900HX, NVIDIA GeForce RTX 4090 Laptop GPU (7690 - 9331, n=8) | |
| Razer Blade 18 RTX 4070 | |
| Alienware m17 R5 (R9 6900HX, RX 6850M XT) | |
| MSI Katana 17 B13VFK | |
| Schenker XMG Neo 17 M22 | |
| PCMark 10 / Essentials | |
| Eluktronics Mech-17 GP2 | |
| MSI Titan GT77 HX 13VI | |
| Razer Blade 18 RTX 4070 | |
| Média Intel Core i9-13900HX, NVIDIA GeForce RTX 4090 Laptop GPU (10972 - 11983, n=8) | |
| MSI Katana 17 B13VFK | |
| Alienware m17 R5 (R9 6900HX, RX 6850M XT) | |
| Schenker XMG Neo 17 M22 | |
| PCMark 10 / Productivity | |
| Eluktronics Mech-17 GP2 | |
| Média Intel Core i9-13900HX, NVIDIA GeForce RTX 4090 Laptop GPU (9038 - 11680, n=8) | |
| MSI Titan GT77 HX 13VI | |
| Razer Blade 18 RTX 4070 | |
| Schenker XMG Neo 17 M22 | |
| MSI Katana 17 B13VFK | |
| Alienware m17 R5 (R9 6900HX, RX 6850M XT) | |
| PCMark 10 / Digital Content Creation | |
| MSI Titan GT77 HX 13VI | |
| Eluktronics Mech-17 GP2 | |
| Média Intel Core i9-13900HX, NVIDIA GeForce RTX 4090 Laptop GPU (10605 - 16395, n=8) | |
| Alienware m17 R5 (R9 6900HX, RX 6850M XT) | |
| Razer Blade 18 RTX 4070 | |
| MSI Katana 17 B13VFK | |
| Schenker XMG Neo 17 M22 | |
| CrossMark / Overall | |
| Eluktronics Mech-17 GP2 | |
| MSI Titan GT77 HX 13VI | |
| Razer Blade 18 RTX 4070 | |
| Média Intel Core i9-13900HX, NVIDIA GeForce RTX 4090 Laptop GPU (1825 - 2295, n=8) | |
| MSI Katana 17 B13VFK | |
| Schenker XMG Neo 17 M22 | |
| Alienware m17 R5 (R9 6900HX, RX 6850M XT) | |
| CrossMark / Productivity | |
| Eluktronics Mech-17 GP2 | |
| MSI Titan GT77 HX 13VI | |
| Razer Blade 18 RTX 4070 | |
| Média Intel Core i9-13900HX, NVIDIA GeForce RTX 4090 Laptop GPU (1666 - 2166, n=8) | |
| MSI Katana 17 B13VFK | |
| Schenker XMG Neo 17 M22 | |
| Alienware m17 R5 (R9 6900HX, RX 6850M XT) | |
| CrossMark / Creativity | |
| Eluktronics Mech-17 GP2 | |
| MSI Titan GT77 HX 13VI | |
| Razer Blade 18 RTX 4070 | |
| Média Intel Core i9-13900HX, NVIDIA GeForce RTX 4090 Laptop GPU (2162 - 2514, n=8) | |
| MSI Katana 17 B13VFK | |
| Schenker XMG Neo 17 M22 | |
| Alienware m17 R5 (R9 6900HX, RX 6850M XT) | |
| CrossMark / Responsiveness | |
| Razer Blade 18 RTX 4070 | |
| MSI Titan GT77 HX 13VI | |
| Eluktronics Mech-17 GP2 | |
| Média Intel Core i9-13900HX, NVIDIA GeForce RTX 4090 Laptop GPU (1441 - 2275, n=8) | |
| MSI Katana 17 B13VFK | |
| Schenker XMG Neo 17 M22 | |
| Alienware m17 R5 (R9 6900HX, RX 6850M XT) | |
| PCMark 10 Score | 9016 pontos | |
Ajuda | ||
| AIDA64 / Memory Copy | |
| Razer Blade 18 RTX 4070 | |
| Média Intel Core i9-13900HX (67716 - 79193, n=22) | |
| Eluktronics Mech-17 GP2 | |
| MSI Titan GT77 HX 13VI | |
| MSI Katana 17 B13VFK | |
| Alienware m17 R5 (R9 6900HX, RX 6850M XT) | |
| Schenker XMG Neo 17 M22 | |
| AIDA64 / Memory Read | |
| Razer Blade 18 RTX 4070 | |
| Média Intel Core i9-13900HX (73998 - 88462, n=22) | |
| Eluktronics Mech-17 GP2 | |
| MSI Titan GT77 HX 13VI | |
| MSI Katana 17 B13VFK | |
| Schenker XMG Neo 17 M22 | |
| Alienware m17 R5 (R9 6900HX, RX 6850M XT) | |
| AIDA64 / Memory Write | |
| Razer Blade 18 RTX 4070 | |
| Média Intel Core i9-13900HX (65472 - 77045, n=22) | |
| Eluktronics Mech-17 GP2 | |
| MSI Titan GT77 HX 13VI | |
| Schenker XMG Neo 17 M22 | |
| Alienware m17 R5 (R9 6900HX, RX 6850M XT) | |
| MSI Katana 17 B13VFK | |
| AIDA64 / Memory Latency | |
| MSI Katana 17 B13VFK | |
| Alienware m17 R5 (R9 6900HX, RX 6850M XT) | |
| MSI Titan GT77 HX 13VI | |
| Schenker XMG Neo 17 M22 | |
| Eluktronics Mech-17 GP2 | |
| Média Intel Core i9-13900HX (75.3 - 91.1, n=22) | |
| Razer Blade 18 RTX 4070 | |
* ... menor é melhor
Latência do DPC
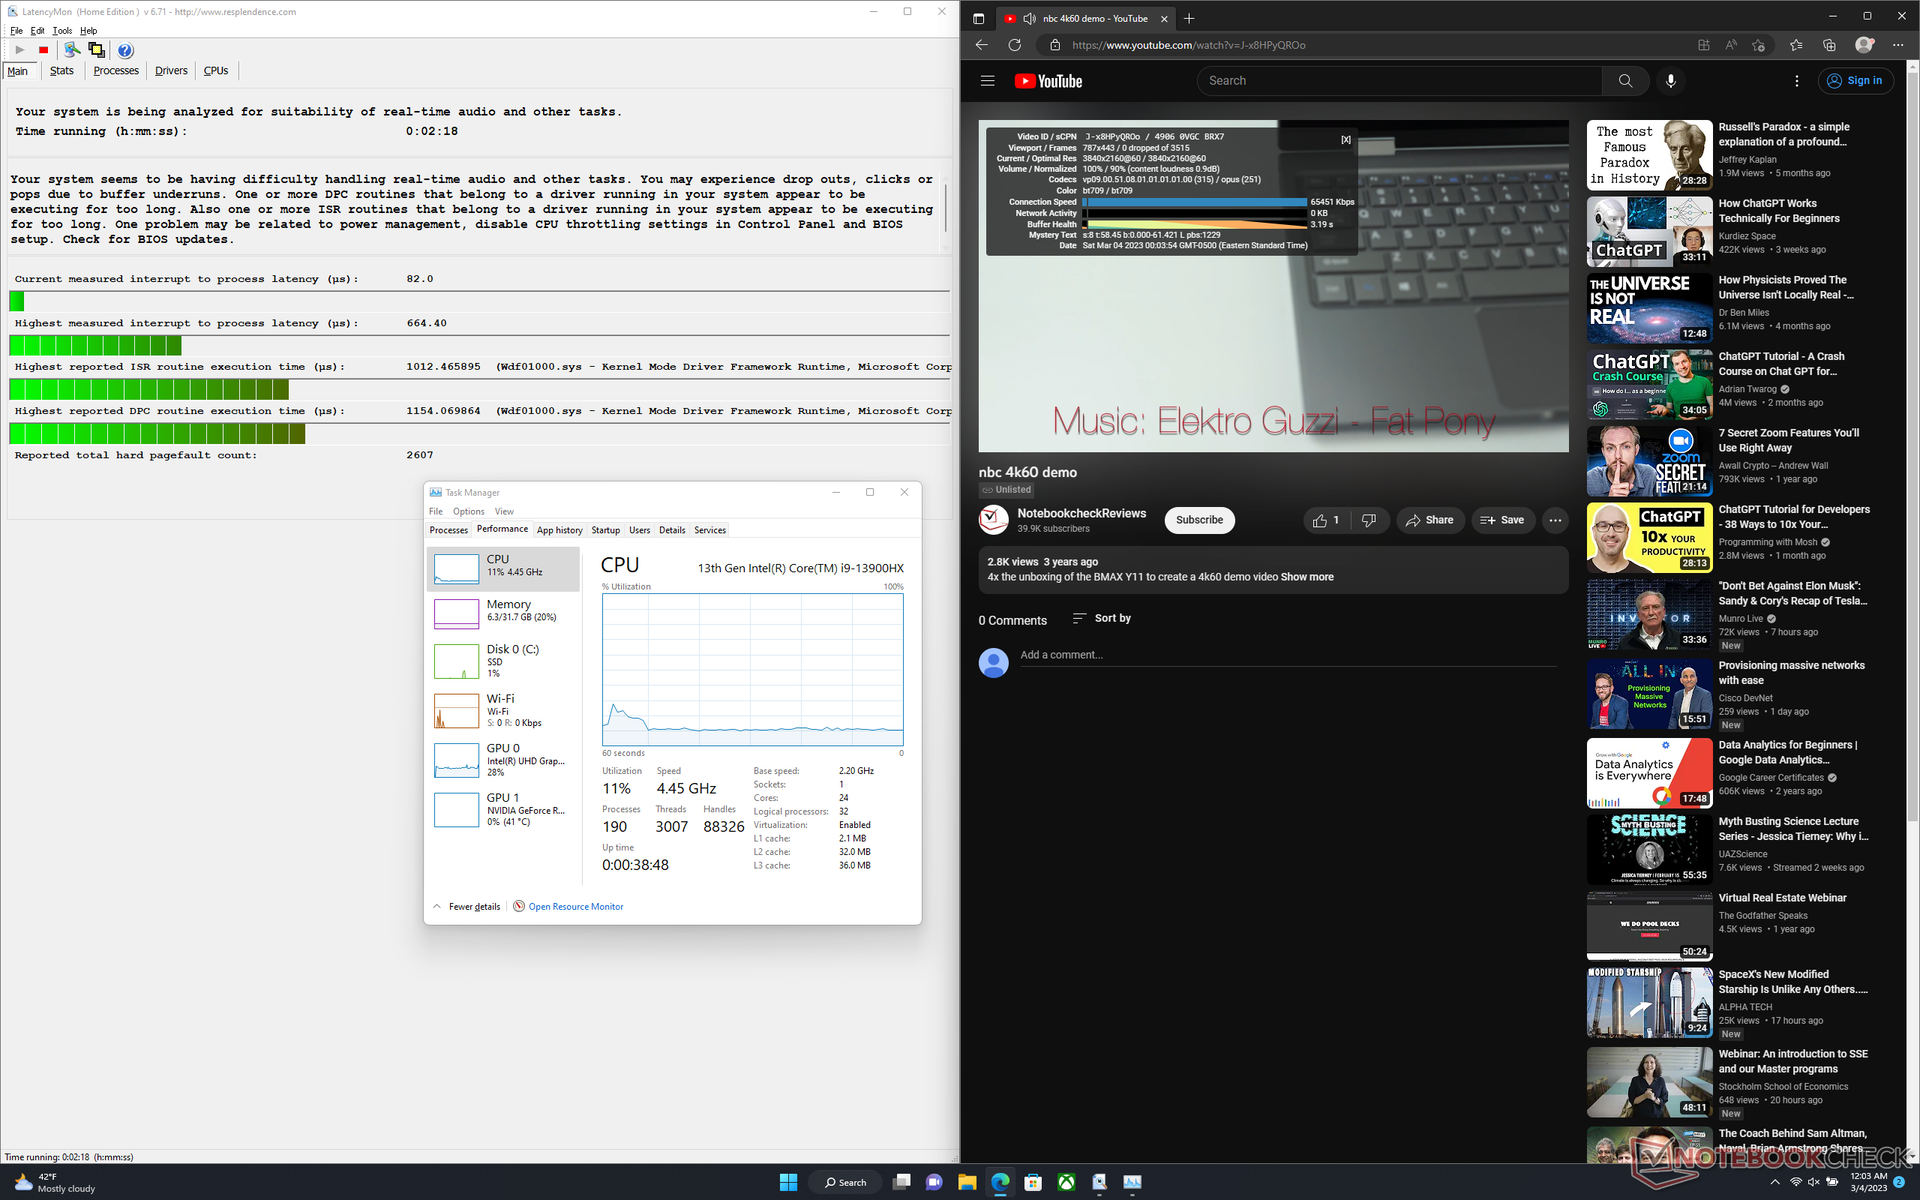
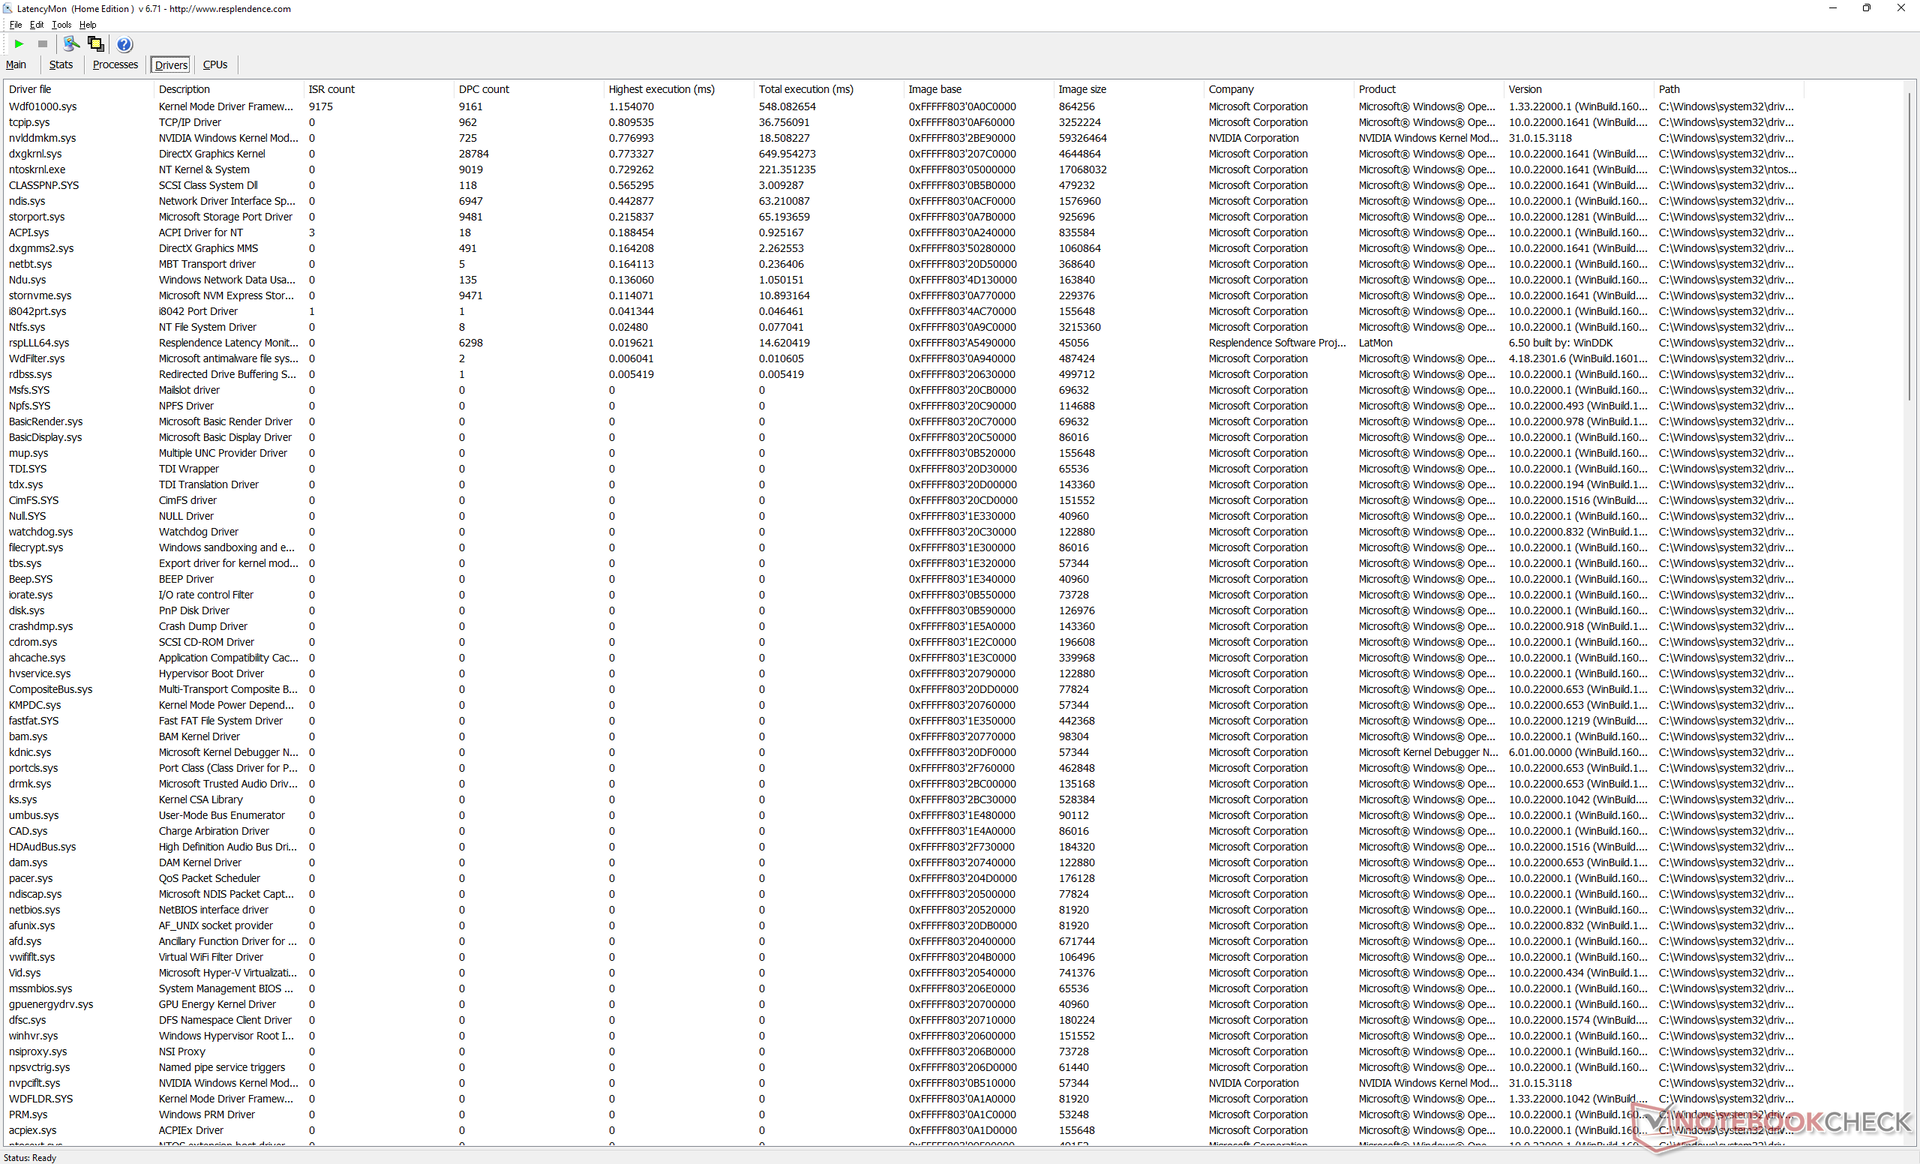
LatencyMon revela pequenos problemas de DPC ao abrir várias abas do navegador em nossa página inicial. a reprodução de vídeo de 4K a 60 FPS é perfeita, sem queda de quadros.
| DPC Latencies / LatencyMon - interrupt to process latency (max), Web, Youtube, Prime95 | |
| MSI Titan GT77 HX 13VI | |
| Schenker XMG Neo 17 M22 | |
| MSI Katana 17 B13VFK | |
| Alienware m17 R5 (R9 6900HX, RX 6850M XT) | |
| Razer Blade 18 RTX 4070 | |
| Eluktronics Mech-17 GP2 | |
* ... menor é melhor
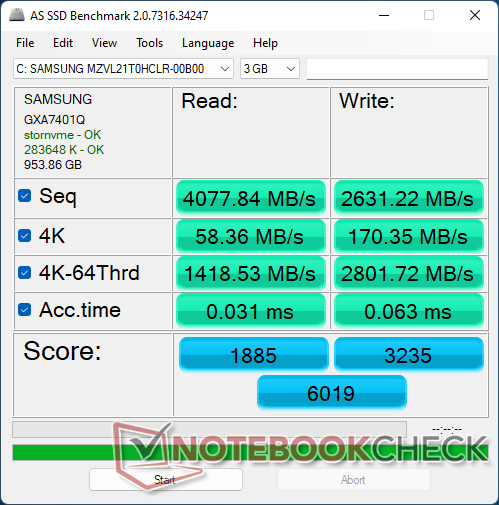
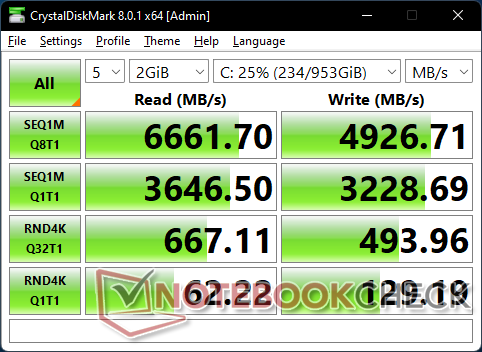
Dispositivos de armazenamento
Nossa unidade é enviada com um TB de 1 TB Samsung PM9A1 MZVL21T0HCLR que é um dos mais rápidos SSDs PCIe4 x4 NVMe baseados no consumidor atualmente disponíveis. Infelizmente, o disco em nossa unidade apresenta problemas para manter as taxas máximas de transferência por longos períodos, como mostra nosso gráfico de teste de estresse abaixo. Em comparação, o Razer Blade 15 com o mesmo drive Samsung é capaz de manter taxas de transferência de 6700 MB/s sem nenhum problema.

| Drive Performance rating - Percent | |
| Schenker XMG Neo 17 M22 | |
| MSI Titan GT77 HX 13VI | |
| Razer Blade 18 RTX 4070 | |
| MSI Katana 17 B13VFK | |
| Eluktronics Mech-17 GP2 | |
| Alienware m17 R5 (R9 6900HX, RX 6850M XT) | |
* ... menor é melhor
Disk Throttling: DiskSpd Read Loop, Queue Depth 8
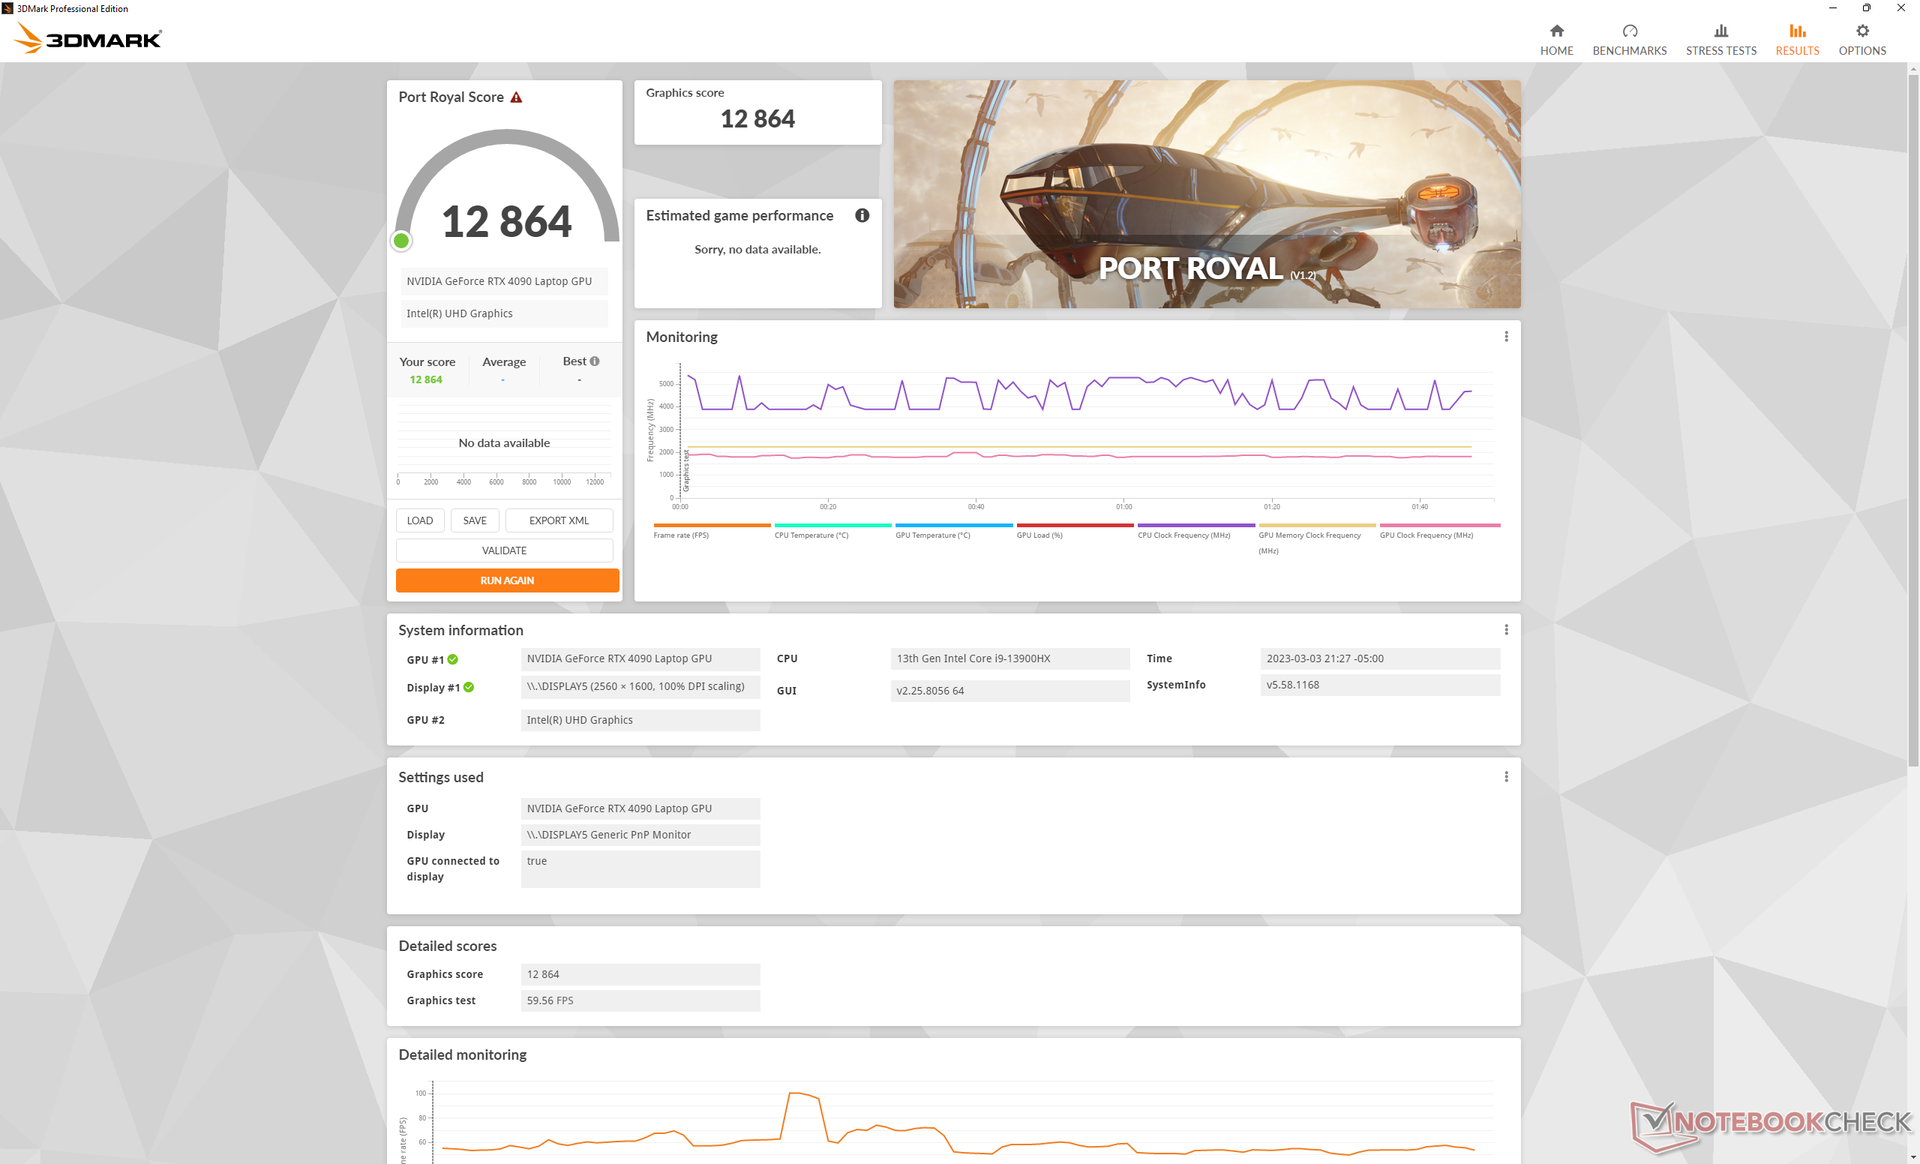
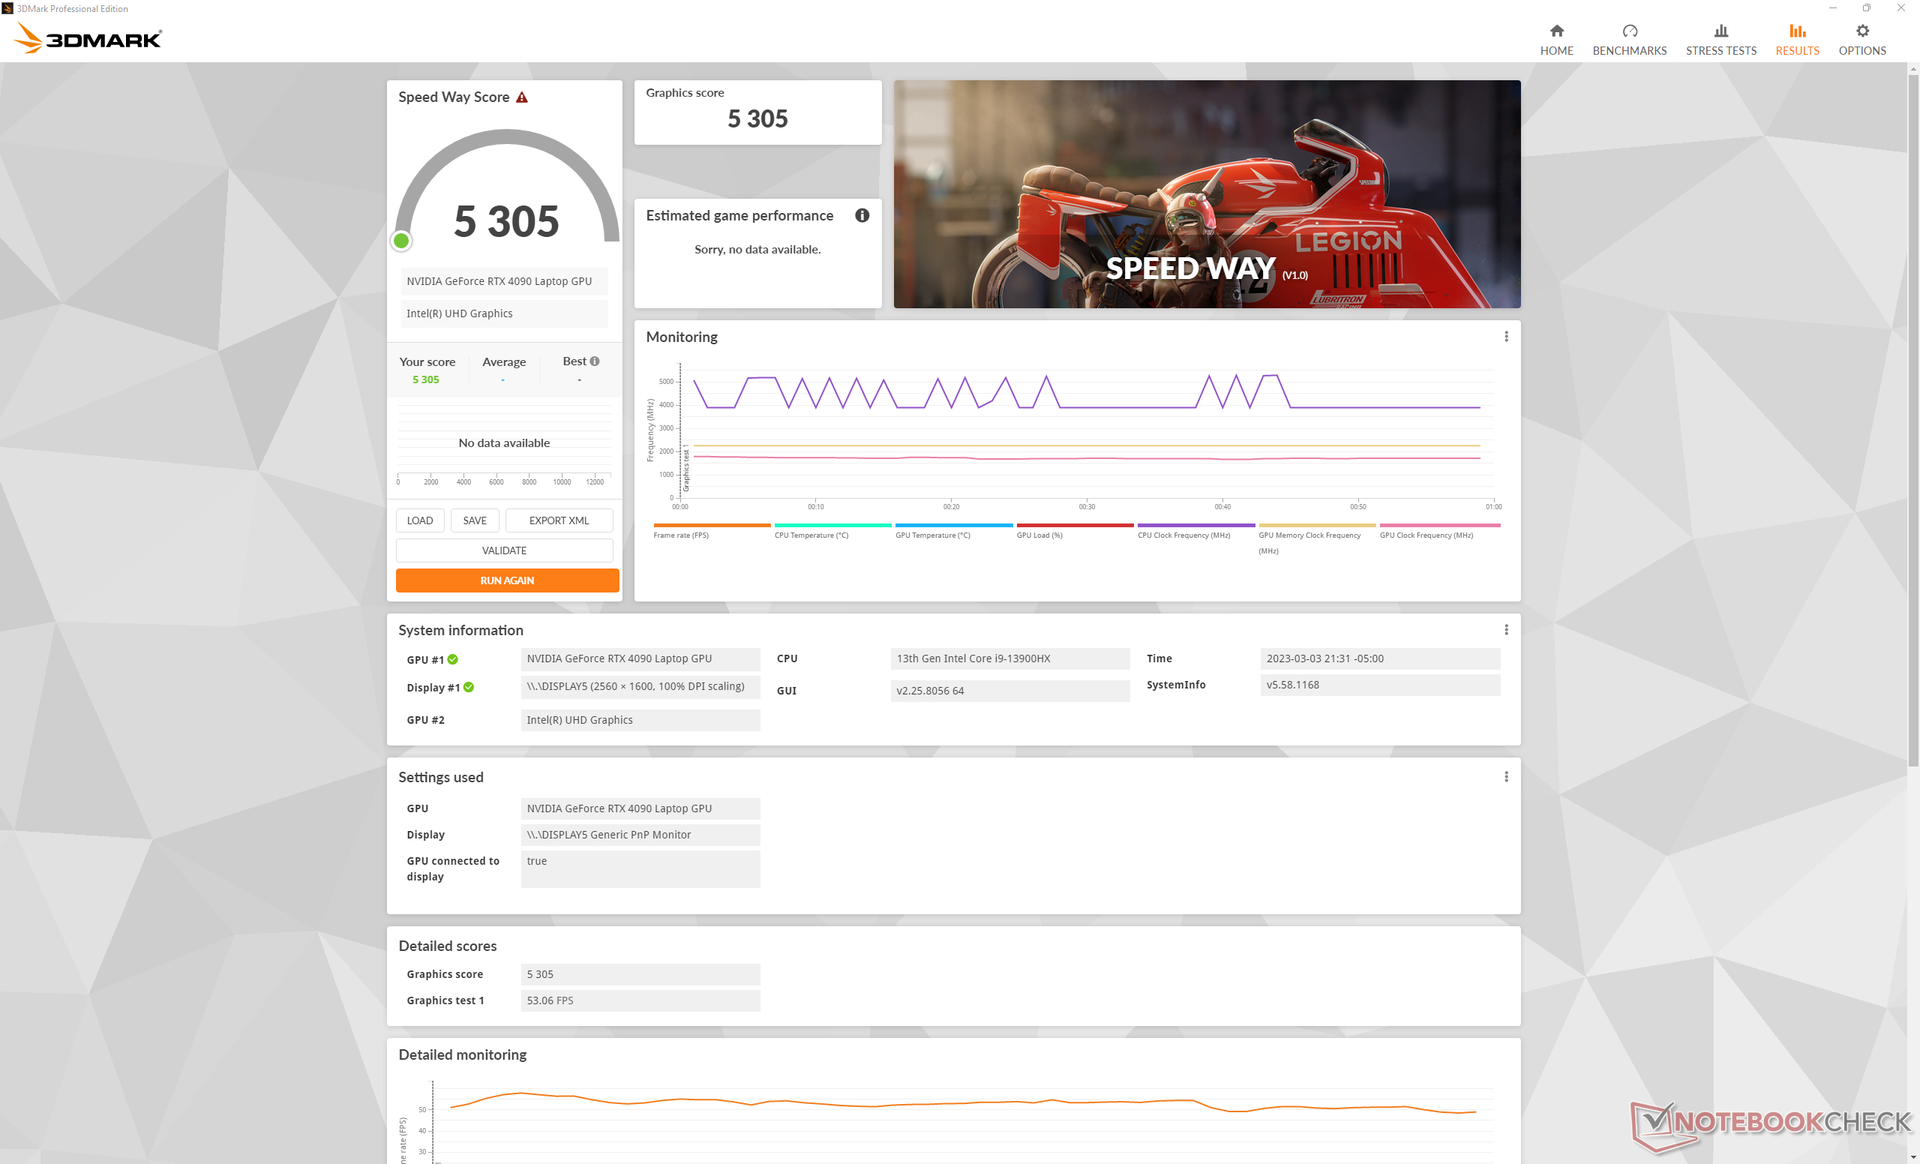
Desempenho da GPU
O desempenho geral é cerca de 40 a 60 por cento mais rápido do que o móvel RTX 3080 Ti para estar aproximadamente no mesmo nível do desktop RTX 3080 Ti. A habilitação do DLSS 3 em títulos suportados aumenta o desempenho ainda mais em 2 a 3 vezes, embora com artefatos gráficos potenciais.
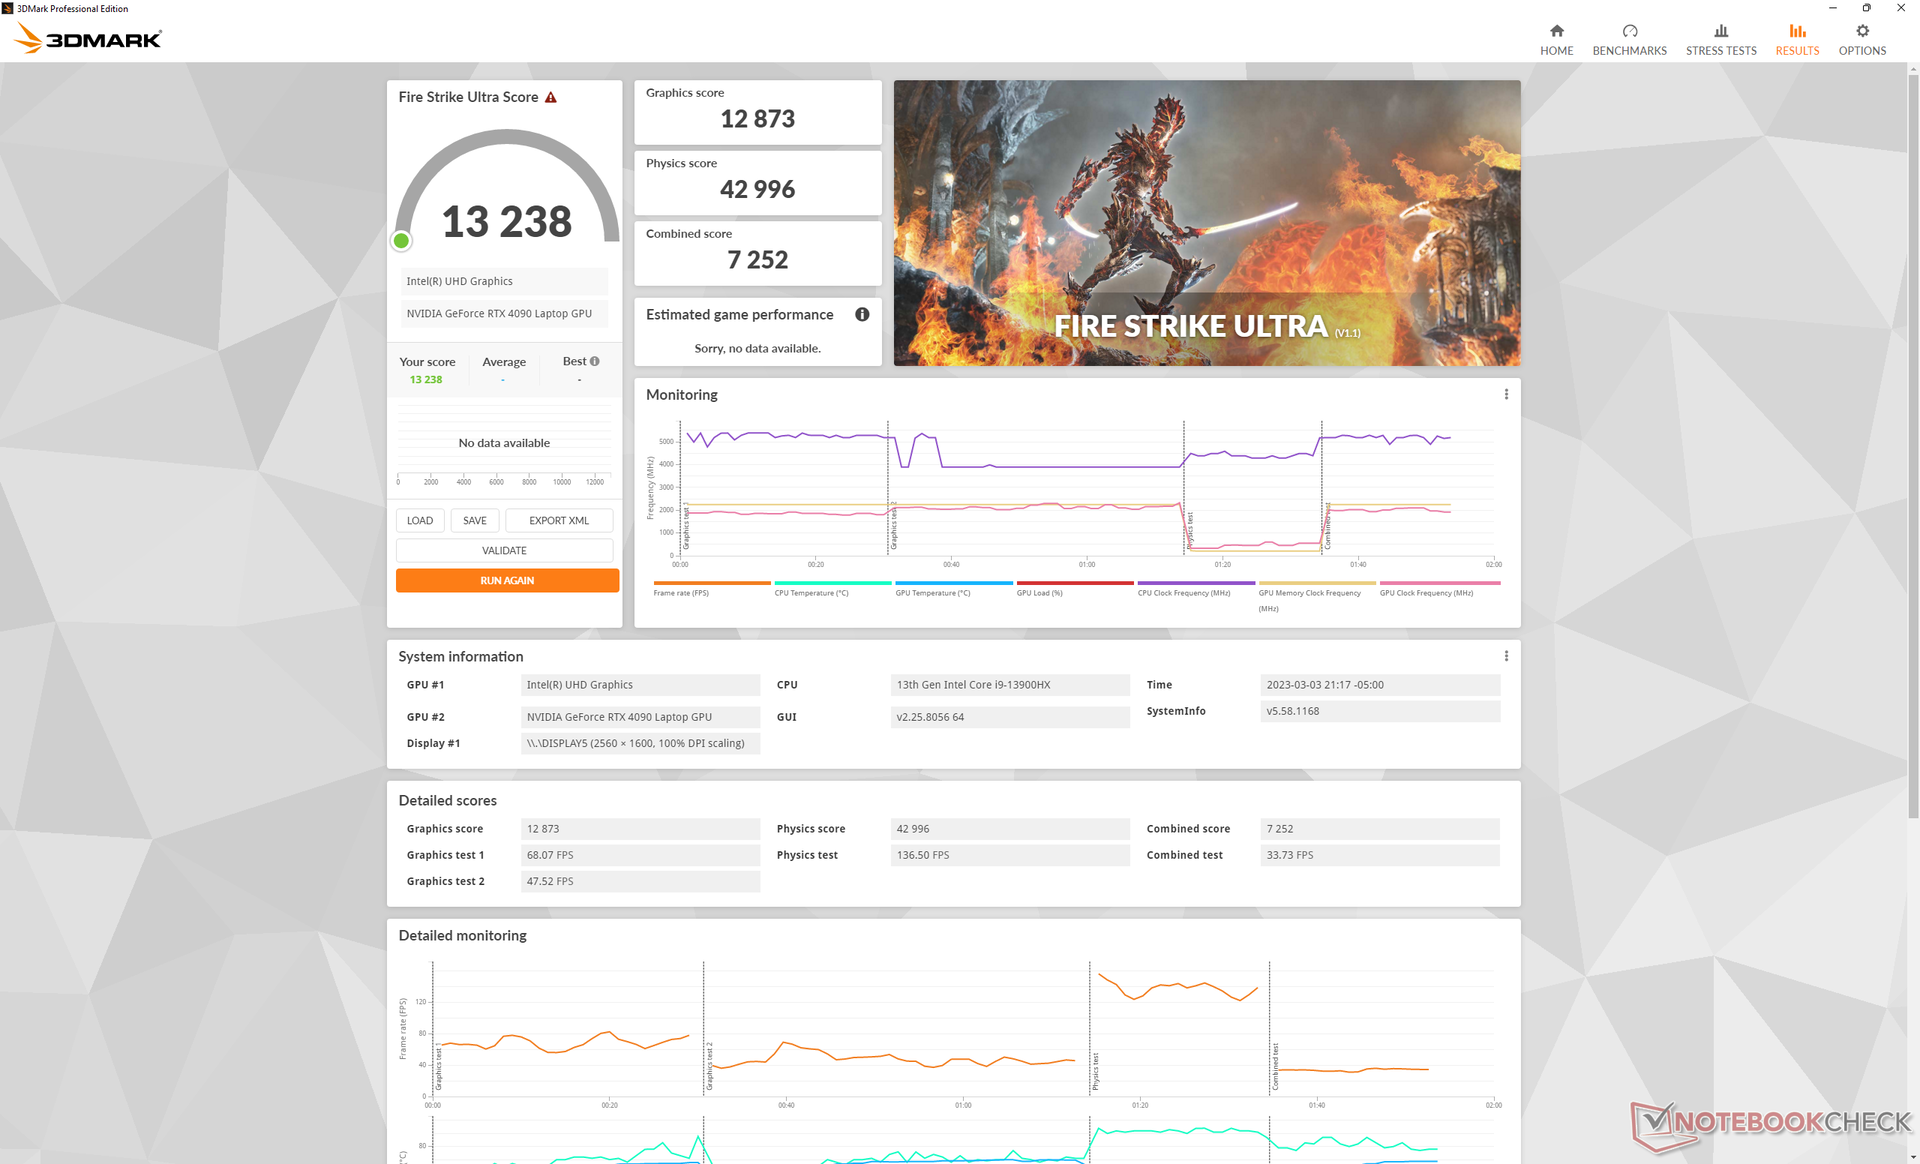
A maioria dos jogos pode rodar em 4K e 60 FPS nativos se os efeitos RT não forem suportados ou forem desativados. As exceções incluem títulos muito exigentes como o Cyberpunk 2077 ou F1 22, onde as taxas de quadros ficariam na faixa de 40 a 50 FPS. Neste caso, a G-Sync e DLSS podem ser úteis para reduzir o rasgo e aumentar o desempenho, respectivamente.
A opção pela configuração RTX 4080 ou RTX 4070 em vez da RTX 4090 reduzirá o desempenho gráfico em 10 a 15 por cento e 40 a 45 por cento, respectivamente. Assim, o delta de desempenho entre o 4090 e o 4080 é muito menor do que o delta de desempenho entre o 4080 e o 4070, embora a diferença de preço seja de $500 fixos entre cada etapa.
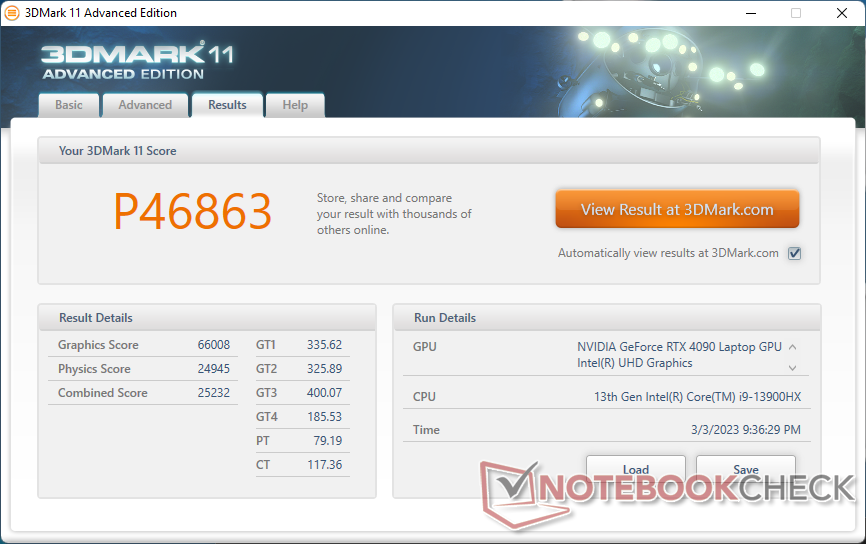
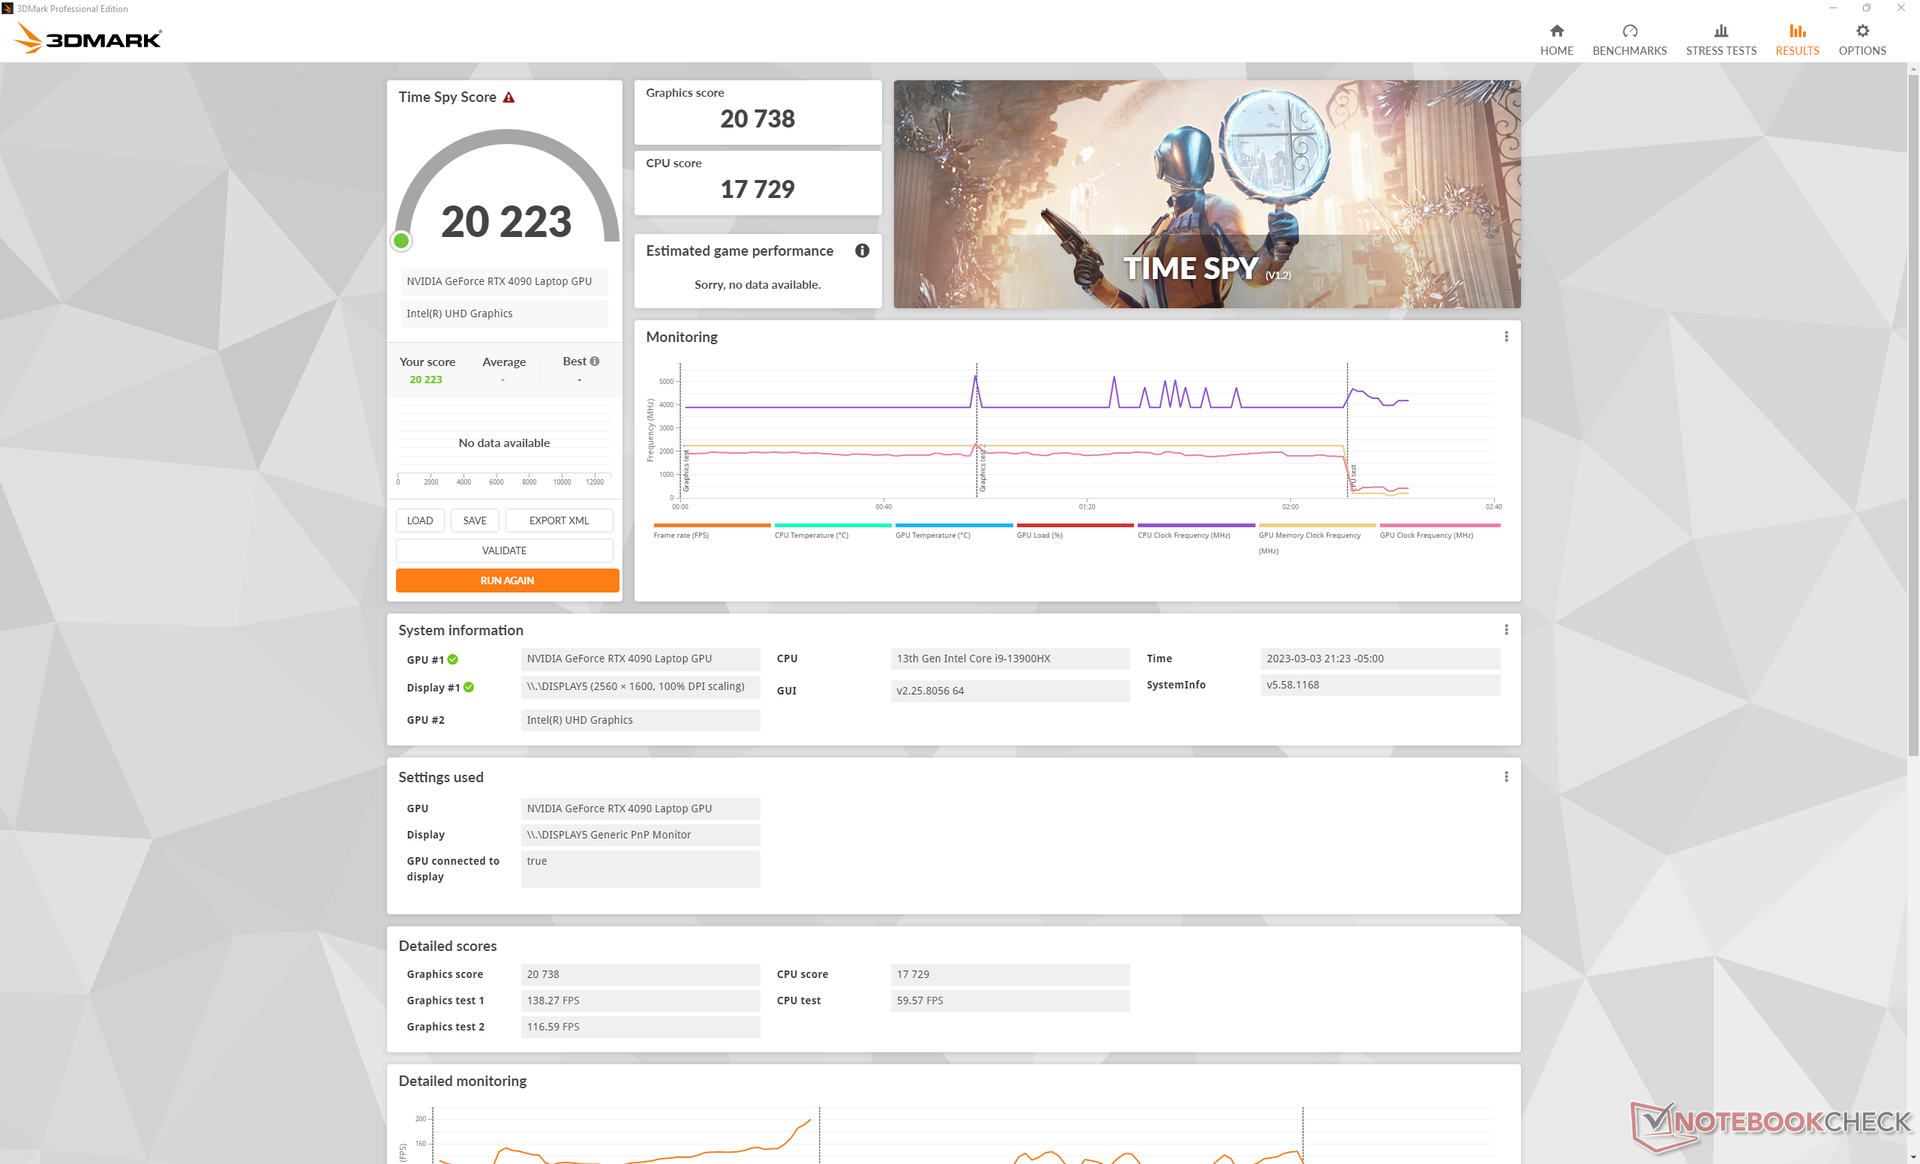
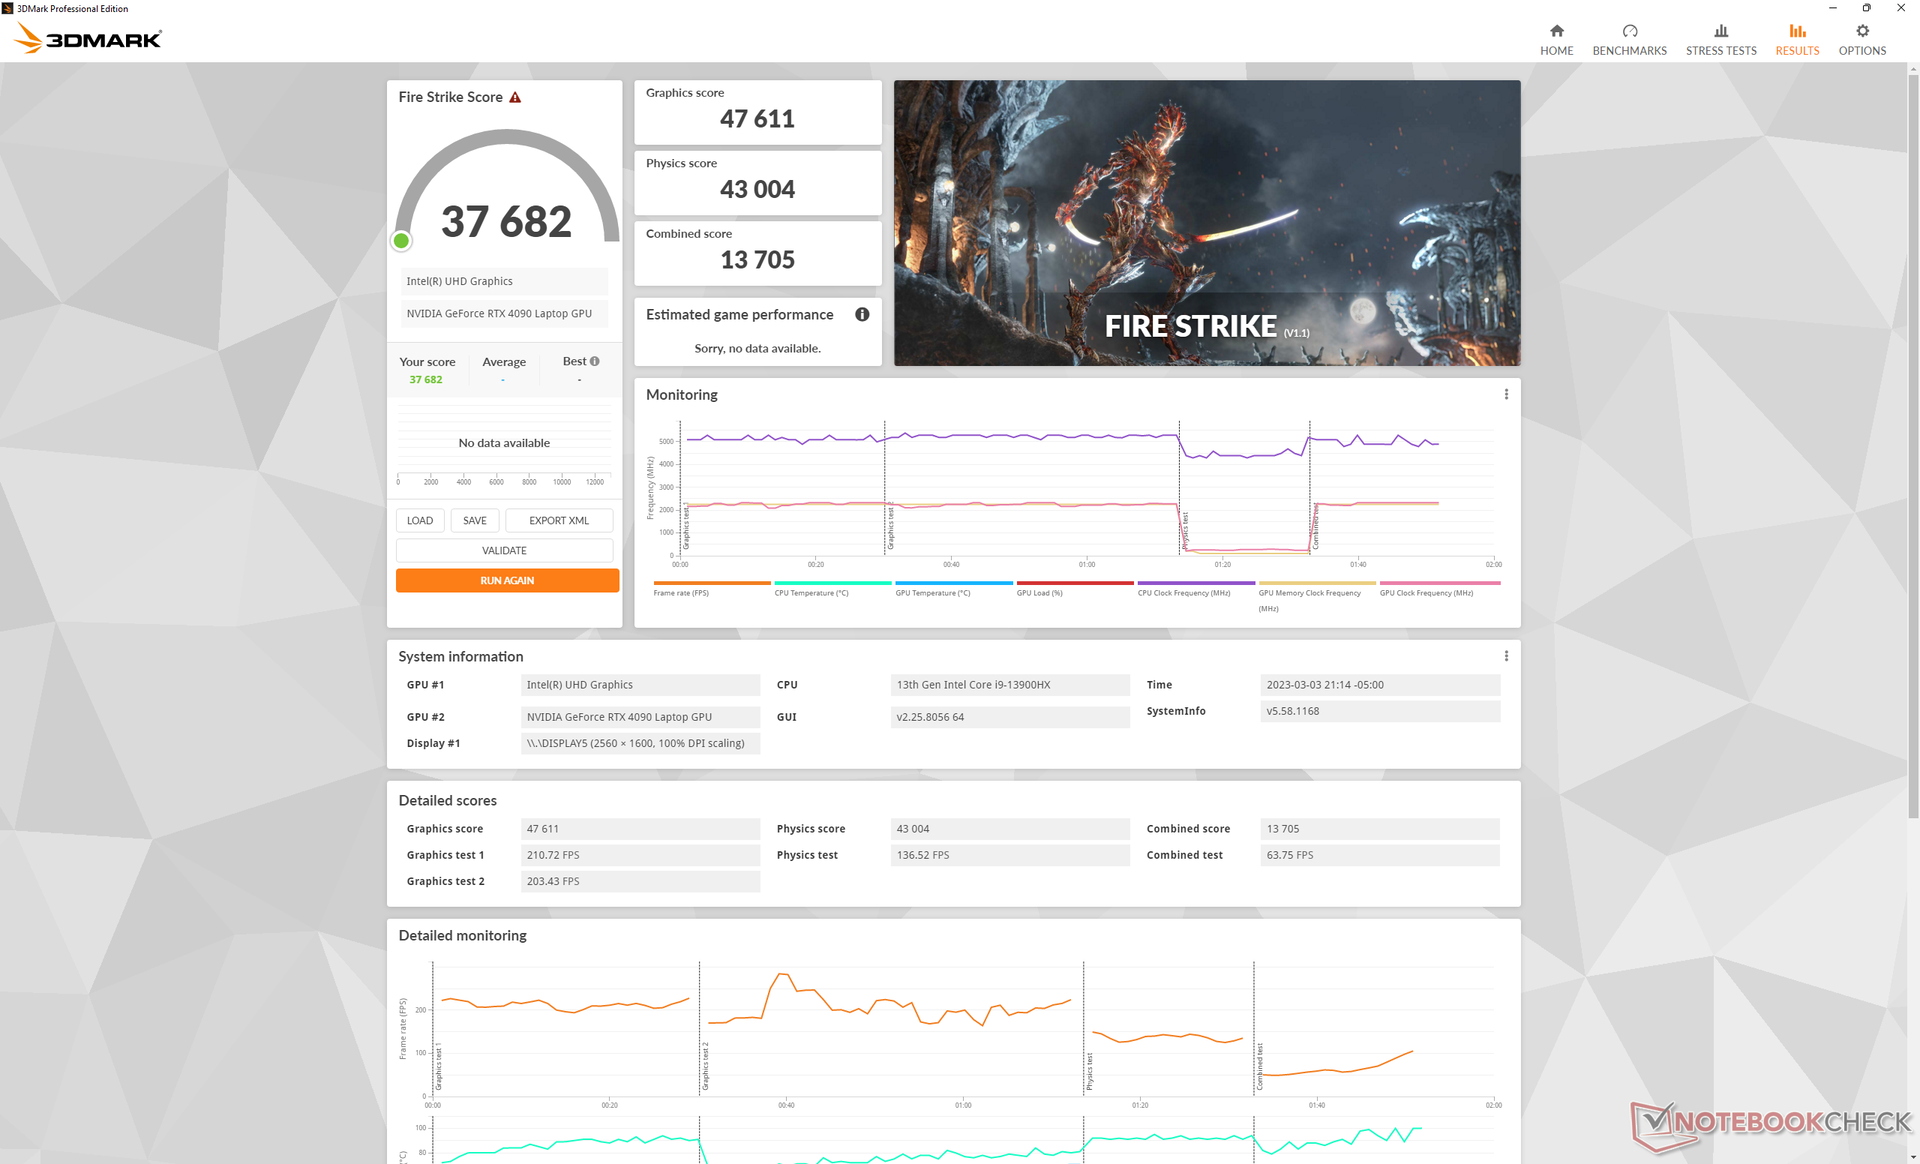
| 3DMark 11 Performance | 46863 pontos | |
| 3DMark Fire Strike Score | 37682 pontos | |
| 3DMark Time Spy Score | 20223 pontos | |
Ajuda | ||
* ... menor é melhor
| The Witcher 3 - 1920x1080 Ultra Graphics & Postprocessing (HBAO+) | |
| Schenker XMG SECTOR, i9 13900K, RTX 4090 | |
| Eluktronics Mech-17 GP2 | |
| Corsair One i300 | |
| MSI Titan GT77 12UHS | |
| Schenker XMG Neo 17 M22 | |
| Razer Blade 18 RTX 4070 | |
| MSI Katana 17 B13VFK | |
| MSI GS76 Stealth 11UH | |
| MSI Pulse GL76 12UGK | |
| HP Omen 16-n0033dx | |
| Schenker XMG Core 17 (Early 2021) | |
| Cyberpunk 2077 1.6 - 1920x1080 Ultra Preset | |
| Schenker XMG SECTOR, i9 13900K, RTX 4090 | |
| Eluktronics Mech-17 GP2 | |
| MSI Titan GT77 12UHS | |
| Razer Blade 18 RTX 4070 | |
| MSI Katana 17 B13VFK | |
| MSI Pulse GL76 12UGK | |
| HP Omen 16-n0033dx | |
Witcher 3 FPS Chart
| baixo | média | alto | ultra | QHD | 4K | |
|---|---|---|---|---|---|---|
| GTA V (2015) | 187.5 | 187.2 | 186.5 | 149.8 | 146.3 | 180.2 |
| The Witcher 3 (2015) | 717.7 | 617.3 | 449 | 216.3 | 167.6 | |
| Dota 2 Reborn (2015) | 243 | 216 | 205 | 192.5 | 186.7 | |
| Final Fantasy XV Benchmark (2018) | 233 | 230 | 194.9 | 157.1 | 90.8 | |
| X-Plane 11.11 (2018) | 212 | 188.8 | 146.4 | 124.7 | ||
| Strange Brigade (2018) | 656 | 508 | 465 | 421 | 315 | 163.4 |
| Metro Exodus (2019) | 240.1 | 207.1 | 173.8 | 146.5 | 127.7 | 82.1 |
| Borderlands 3 (2019) | 284.2 | 269.7 | 238.5 | 179.7 | 129.4 | 72.2 |
| Cyberpunk 2077 1.6 (2022) | 191.1 | 178.6 | 166.9 | 159.7 | 101.3 | 47.8 |
| F1 22 (2022) | 375 | 358 | 322 | 140.6 | 91.8 | 45.3 |
Emissões
Ruído do sistema
Embora tenha havido ajustes na solução de resfriamento quando comparada ao modelo do ano passado, o ruído geral do ventilador permanece praticamente o mesmo. Os ventiladores internos estão sempre ativos, não importando o ajuste ou a carga na tela. Recomendamos o modo Office ou Balanced se não estiver rodando nenhuma aplicação intensiva, pois os ventiladores se tornam visivelmente mais silenciosos e letárgicos.
Ao jogar no modo Performance ou no modo "Besta", o ruído do ventilador se instalaria entre 50 e 52 dB(A), o que é semelhante ao do Alienware m17 R5 ou Lâmina Razer 18 quando em condições semelhantes. Os fones de ouvido são quase uma necessidade para ruídos de ventiladores acima de 50 dB(A) quando se joga.
O metal líquido termo-grizzly vem de série em todas as configurações.
Barulho
| Ocioso |
| 28 / 28 / 30.4 dB |
| Carga |
| 41 / 52.6 dB |
 | ||
30 dB silencioso 40 dB(A) audível 50 dB(A) ruidosamente alto |
||
min: | ||
| Eluktronics Mech-17 GP2 GeForce RTX 4090 Laptop GPU, i9-13900HX, Samsung PM9A1 MZVL21T0HCLR | Schenker XMG Neo 17 M22 GeForce RTX 3080 Ti Laptop GPU, R9 6900HX, Samsung SSD 980 Pro 1TB MZ-V8P1T0BW | MSI Katana 17 B13VFK GeForce RTX 4060 Laptop GPU, i7-13620H, Micron 2400 MTFDKBA1T0QFM | MSI Titan GT77 HX 13VI GeForce RTX 4090 Laptop GPU, i9-13950HX, Samsung PM9A1 MZVL22T0HBLB | Alienware m17 R5 (R9 6900HX, RX 6850M XT) Radeon RX 6850M XT, R9 6900HX, SSSTC CA6-8D1024 | Razer Blade 18 RTX 4070 GeForce RTX 4070 Laptop GPU, i9-13950HX, SSSTC CA6-8D1024 | |
|---|---|---|---|---|---|---|
| Noise | -8% | -6% | -7% | 10% | 9% | |
| desligado / ambiente * (dB) | 25.2 | 26 -3% | 24.5 3% | 24.6 2% | 23 9% | 23.5 7% |
| Idle Minimum * (dB) | 28 | 26 7% | 24.5 12% | 29.2 -4% | 23 18% | 23.8 15% |
| Idle Average * (dB) | 28 | 29 -4% | 24.5 12% | 29.2 -4% | 28.11 -0% | 23.8 15% |
| Idle Maximum * (dB) | 30.4 | 40 -32% | 40 -32% | 29.2 4% | 28.11 8% | 26.8 12% |
| Load Average * (dB) | 41 | 47 -15% | 48.3 -18% | 50.7 -24% | 30.62 25% | 37.3 9% |
| Witcher 3 ultra * (dB) | 50.7 | 52 -3% | 56 -10% | 53.3 -5% | 49.75 2% | 48 5% |
| Load Maximum * (dB) | 52.6 | 54 -3% | 59.1 -12% | 61 -16% | 50.17 5% | 53.5 -2% |
* ... menor é melhor
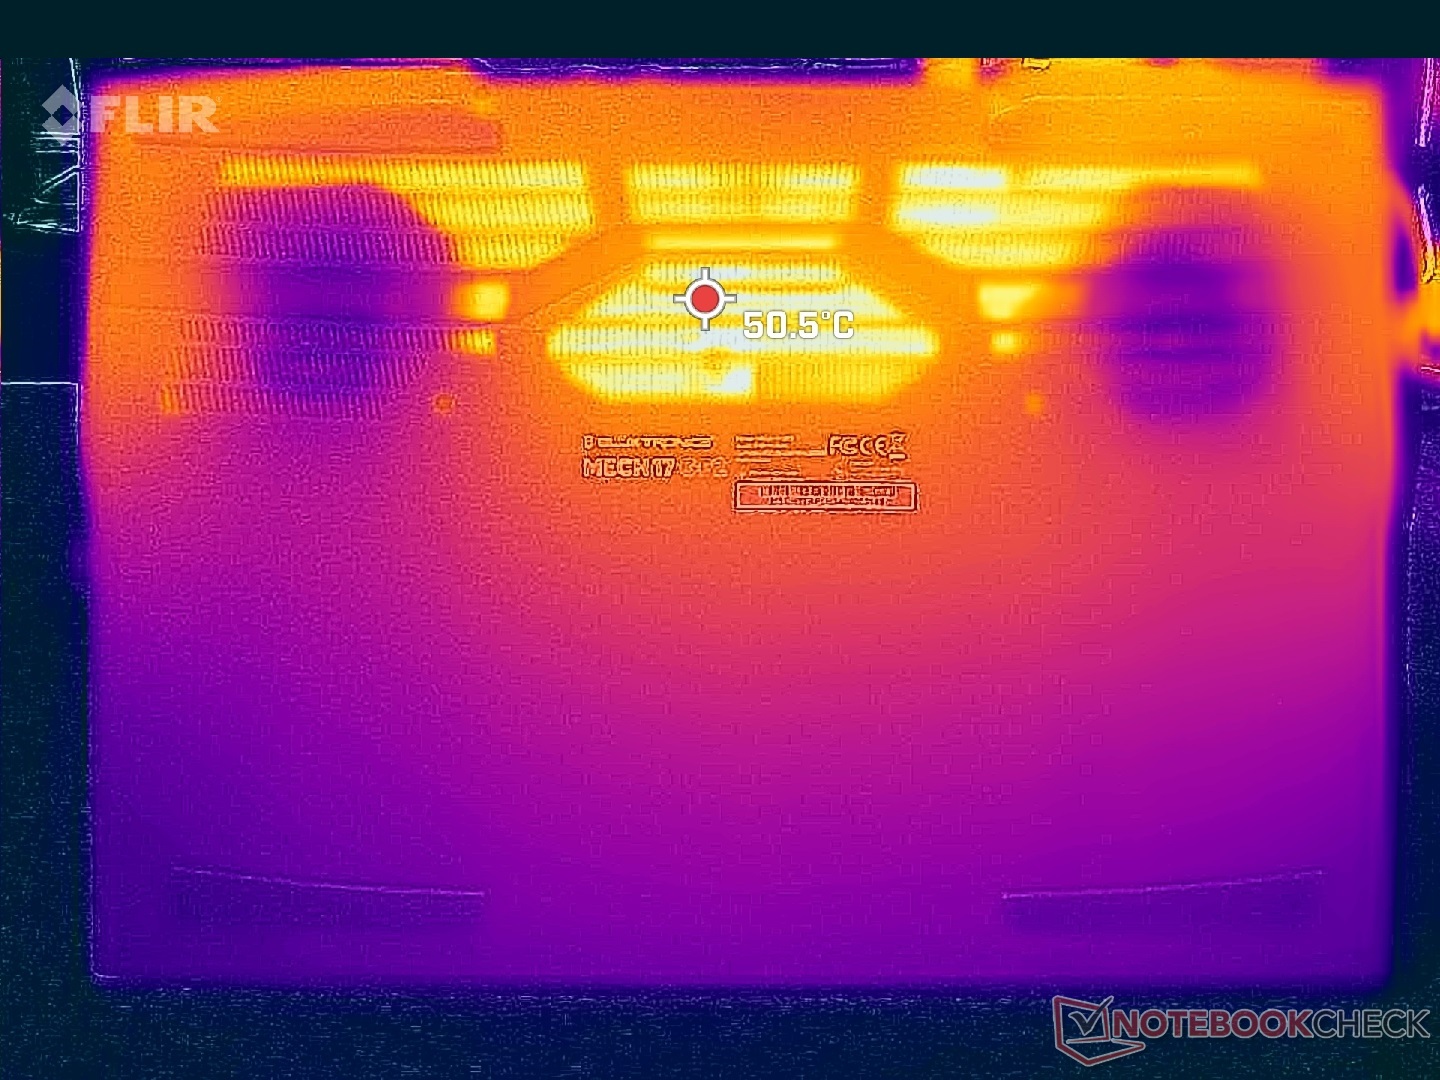
Temperatura
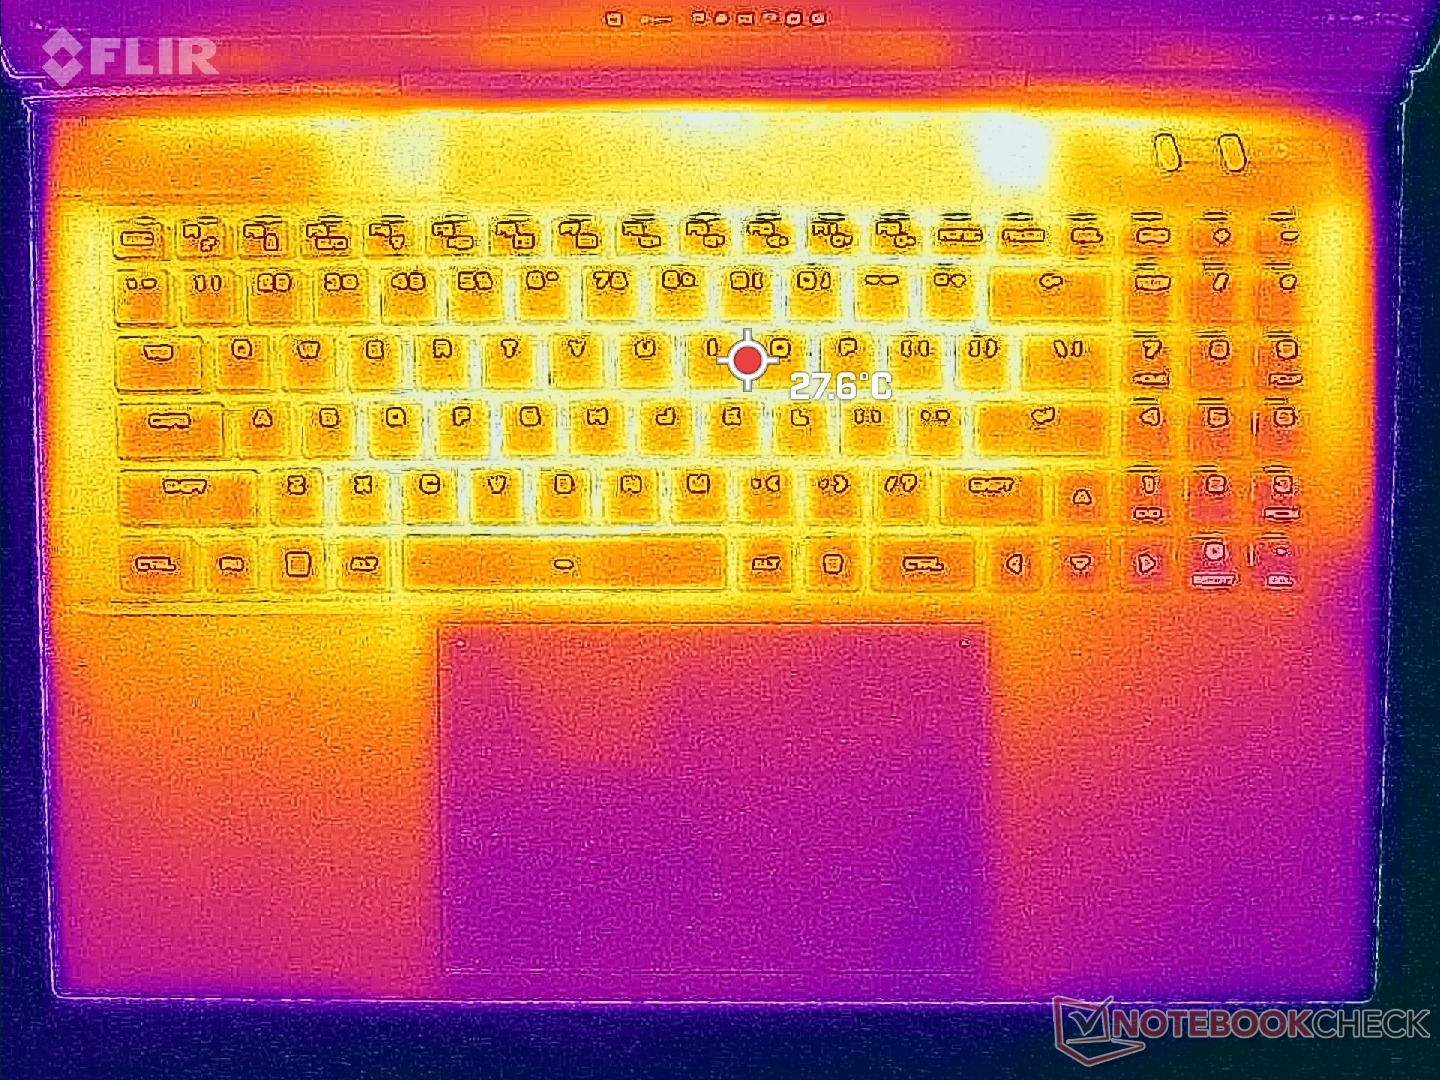
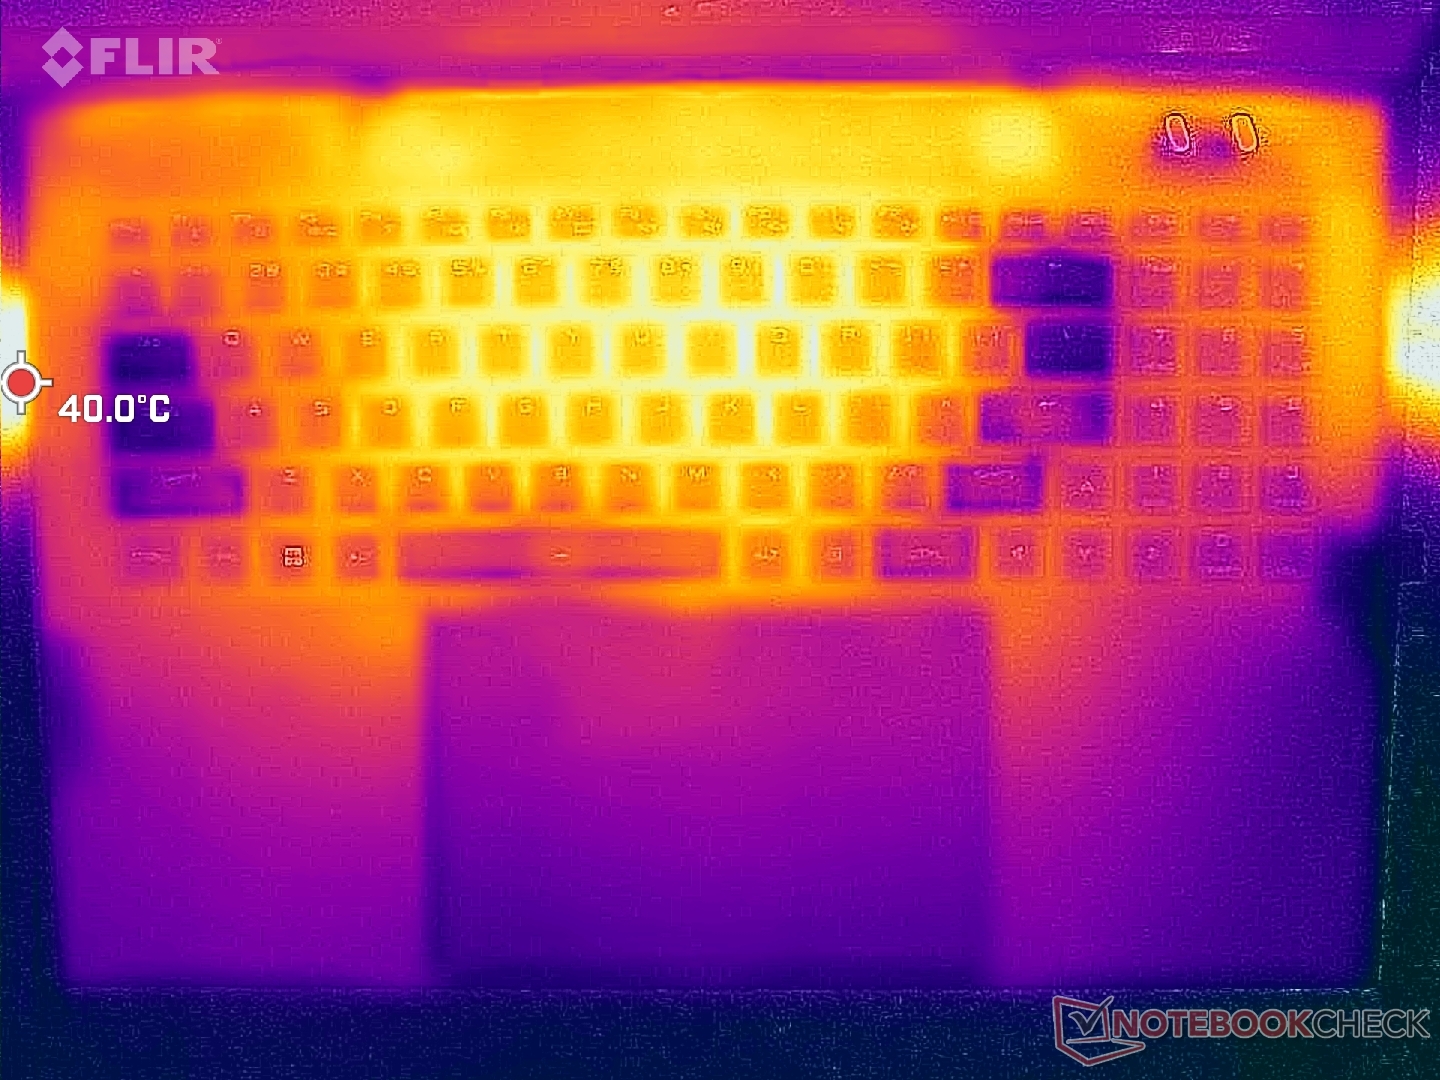
As temperaturas superficiais são mais quentes em direção ao centro e mais frias ao longo dos lados do teclado e dos apoios das palmas. O ar fresco entra através das teclas WASD para manter os dedos frios enquanto se joga. Os pontos quentes de 39 C a 44 C são mais frios do que o que gravamos no Alienware m17 R5 onde os pontos quentes podem chegar a 50 C a 57 C quando em condições de jogo similares.
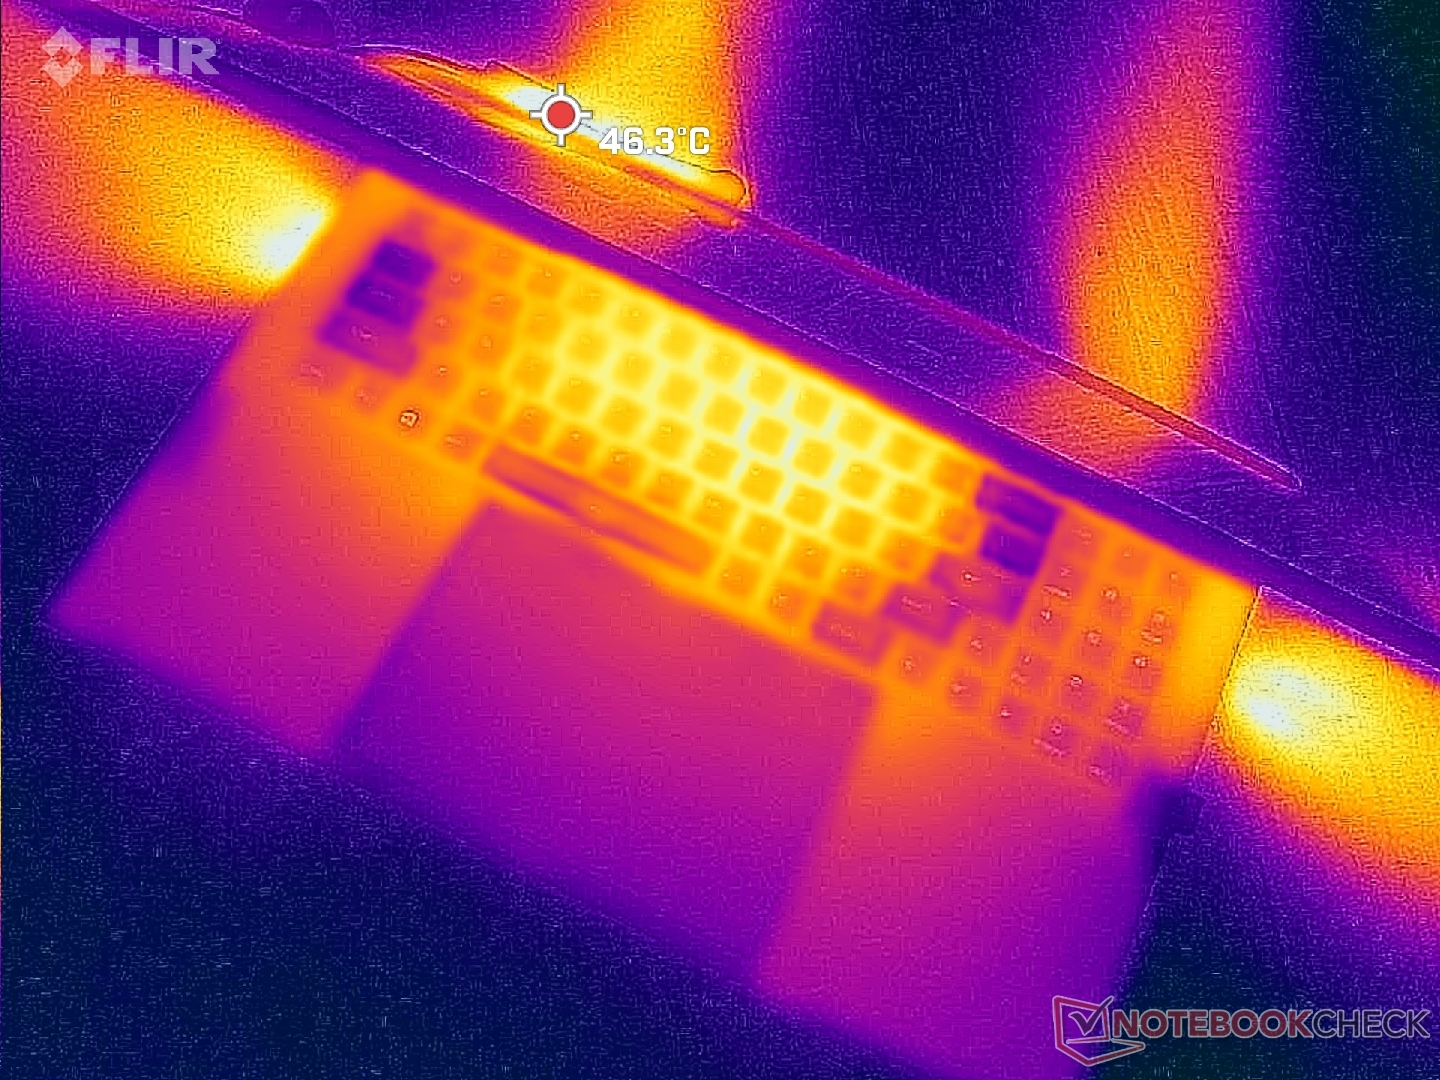
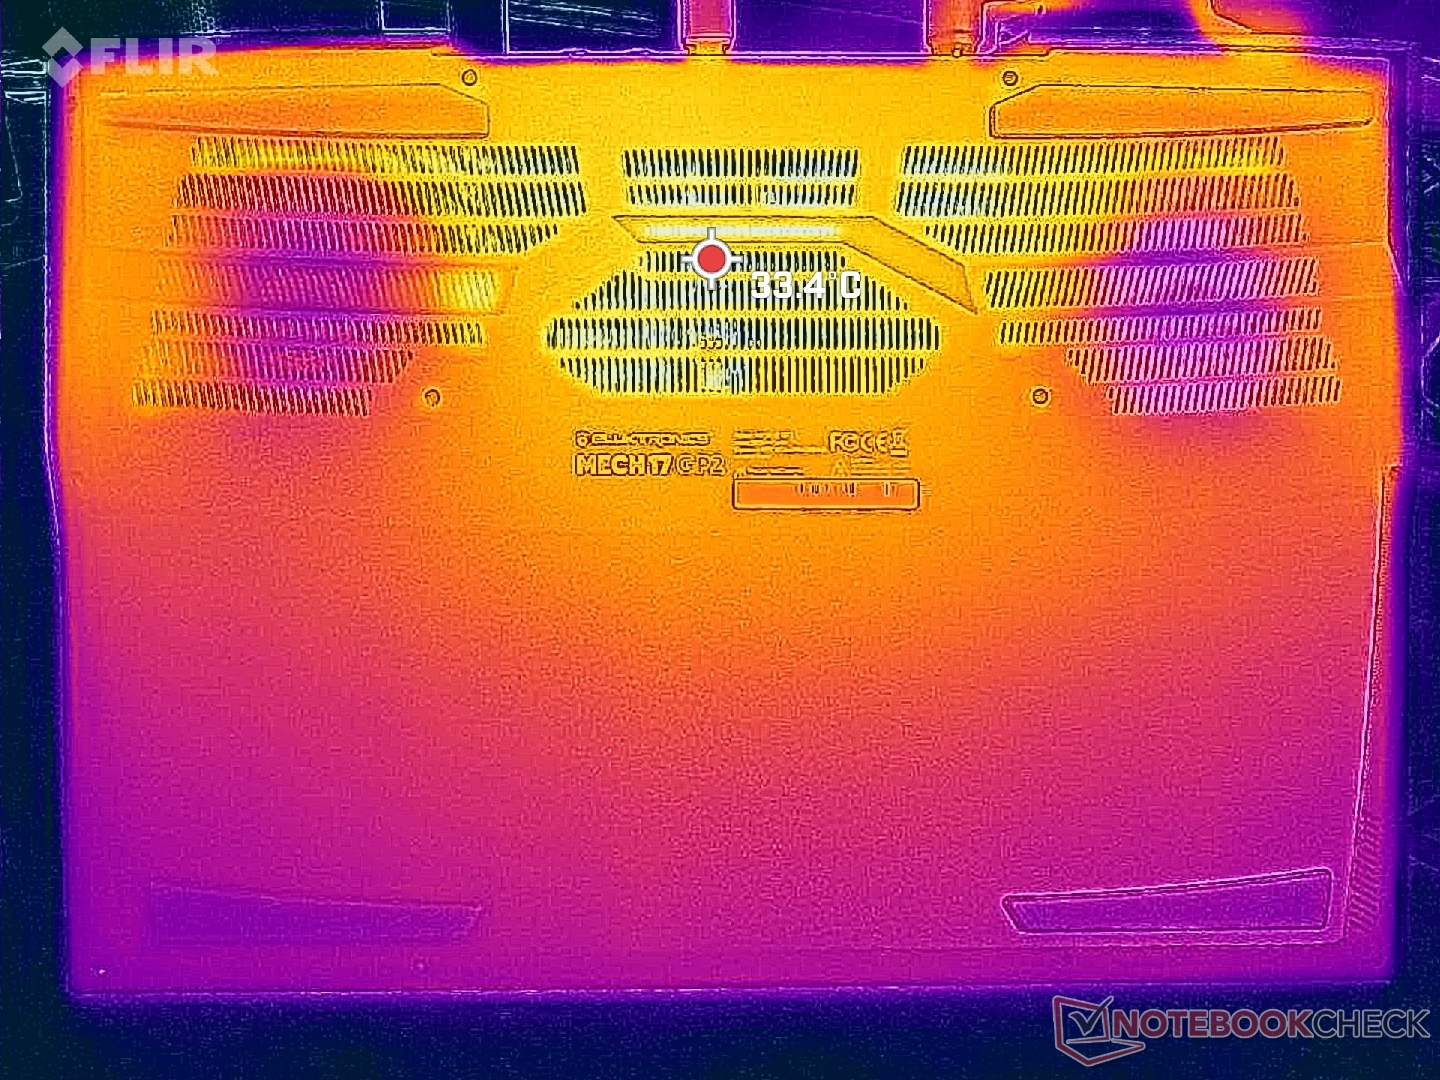
(+) A temperatura máxima no lado superior é 39 °C / 102 F, em comparação com a média de 40.4 °C / 105 F , variando de 21.2 a 68.8 °C para a classe Gaming.
(±) A parte inferior aquece até um máximo de 44 °C / 111 F, em comparação com a média de 43.2 °C / 110 F
(+) Em uso inativo, a temperatura média para o lado superior é 27.5 °C / 82 F, em comparação com a média do dispositivo de 33.9 °C / ### class_avg_f### F.
(+) Os apoios para as mãos e o touchpad são mais frios que a temperatura da pele, com um máximo de 25 °C / 77 F e, portanto, são frios ao toque.
(+) A temperatura média da área do apoio para as mãos de dispositivos semelhantes foi 28.8 °C / 83.8 F (+3.8 °C / 6.8 F).
| Eluktronics Mech-17 GP2 Intel Core i9-13900HX, NVIDIA GeForce RTX 4090 Laptop GPU | Schenker XMG Neo 17 M22 AMD Ryzen 9 6900HX, NVIDIA GeForce RTX 3080 Ti Laptop GPU | MSI Katana 17 B13VFK Intel Core i7-13620H, NVIDIA GeForce RTX 4060 Laptop GPU | MSI Titan GT77 HX 13VI Intel Core i9-13950HX, NVIDIA GeForce RTX 4090 Laptop GPU | Alienware m17 R5 (R9 6900HX, RX 6850M XT) AMD Ryzen 9 6900HX, AMD Radeon RX 6850M XT | Razer Blade 18 RTX 4070 Intel Core i9-13950HX, NVIDIA GeForce RTX 4070 Laptop GPU | |
|---|---|---|---|---|---|---|
| Heat | -13% | -7% | 4% | -14% | 1% | |
| Maximum Upper Side * (°C) | 39 | 49 -26% | 41.6 -7% | 40.6 -4% | 53 -36% | 39.2 -1% |
| Maximum Bottom * (°C) | 44 | 52 -18% | 43.1 2% | 41.1 7% | 56 -27% | 35.6 19% |
| Idle Upper Side * (°C) | 31 | 30 3% | 32 -3% | 26.2 15% | 30 3% | 31.8 -3% |
| Idle Bottom * (°C) | 29.8 | 33 -11% | 35.8 -20% | 30.3 -2% | 29 3% | 33.2 -11% |
* ... menor é melhor
Teste de estresse
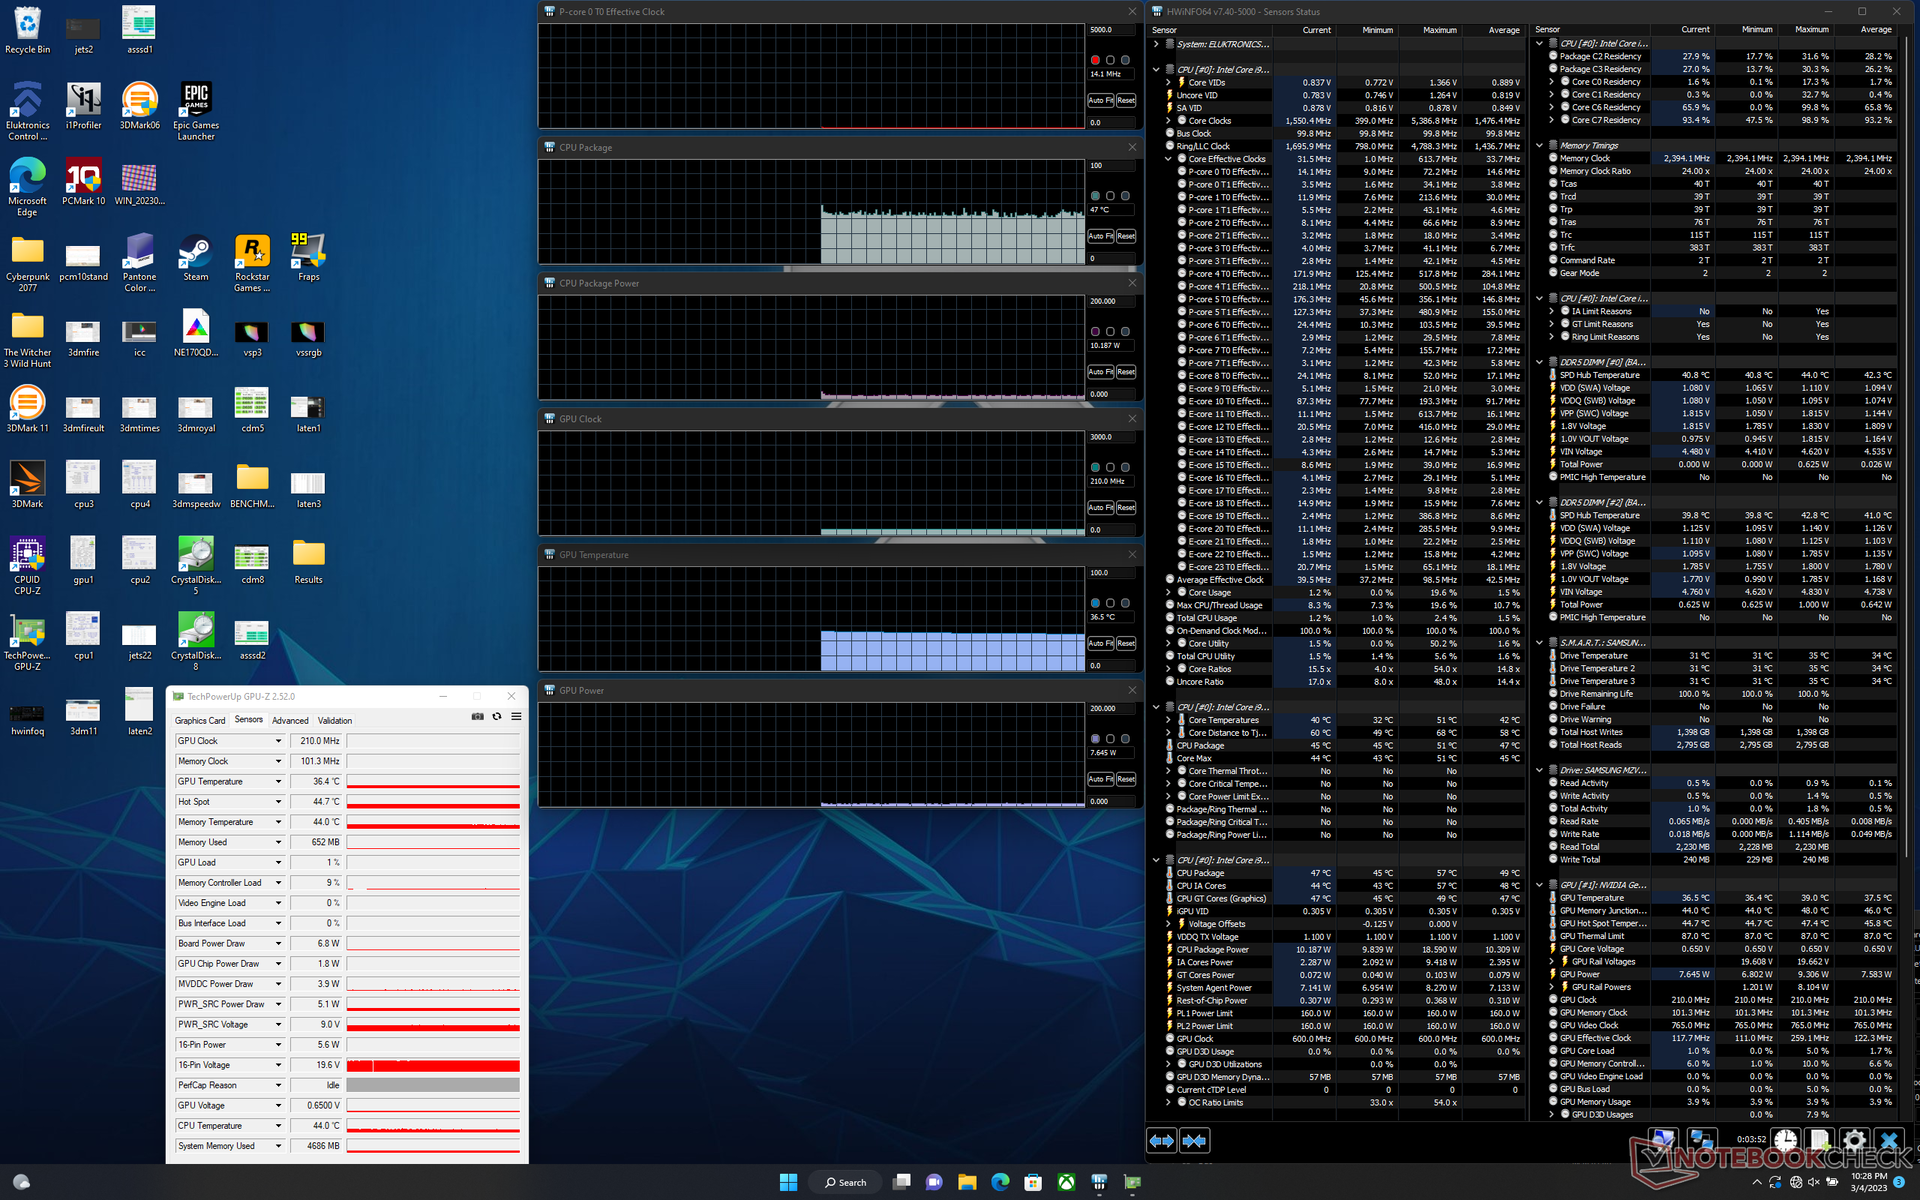
Quando estressada sob Prime95, a CPU aumentaria para 4,7 GHz, 160 W e 96 C por apenas um segundo ou dois antes de cair imediatamente para 4,1 GHz e 107 W. A temperatura central, entretanto, permaneceria muito alta a 96 C. Após mais alguns minutos, as taxas de relógio cairiam ainda mais para 3,4 GHz com apenas mudanças mínimas na temperatura e no consumo de energia da placa.
A taxa de clock GPU, temperatura e consumo de energia se estabilizariam em 2310 MHz, 80 C e 169 W, respectivamente, quando em funcionamento Witcher 3. O GPU é classificado para um TGP de 175 W e assim o sorteio no mundo real de 169 W chega muito perto. A temperatura da CPU infelizmente permaneceria alta a 96 C em comparação com 85 C ou 66 C no Lâmina Razer 18(RTX 4070) ou MSI GT77respectivamente.
A execução simultânea do Prime95 e do FurMark por mais de vários minutos irá colidir com nossa unidade a cada vez. Suspeitamos que as altas temperaturas do núcleo são responsáveis pelo desligamento e reinício automático. A maioria dos outros laptops acelerariam o desempenho quando sob tais cargas extremas, a fim de evitar a colisão.
O funcionamento com energia de bateria limita severamente o desempenho. Um teste Fire Strike em baterias retornaria pontuações de Física e Gráficos de 11430 e 11496 pontos, respectivamente, em comparação com 43004 e 47611 pontos quando em rede elétrica.
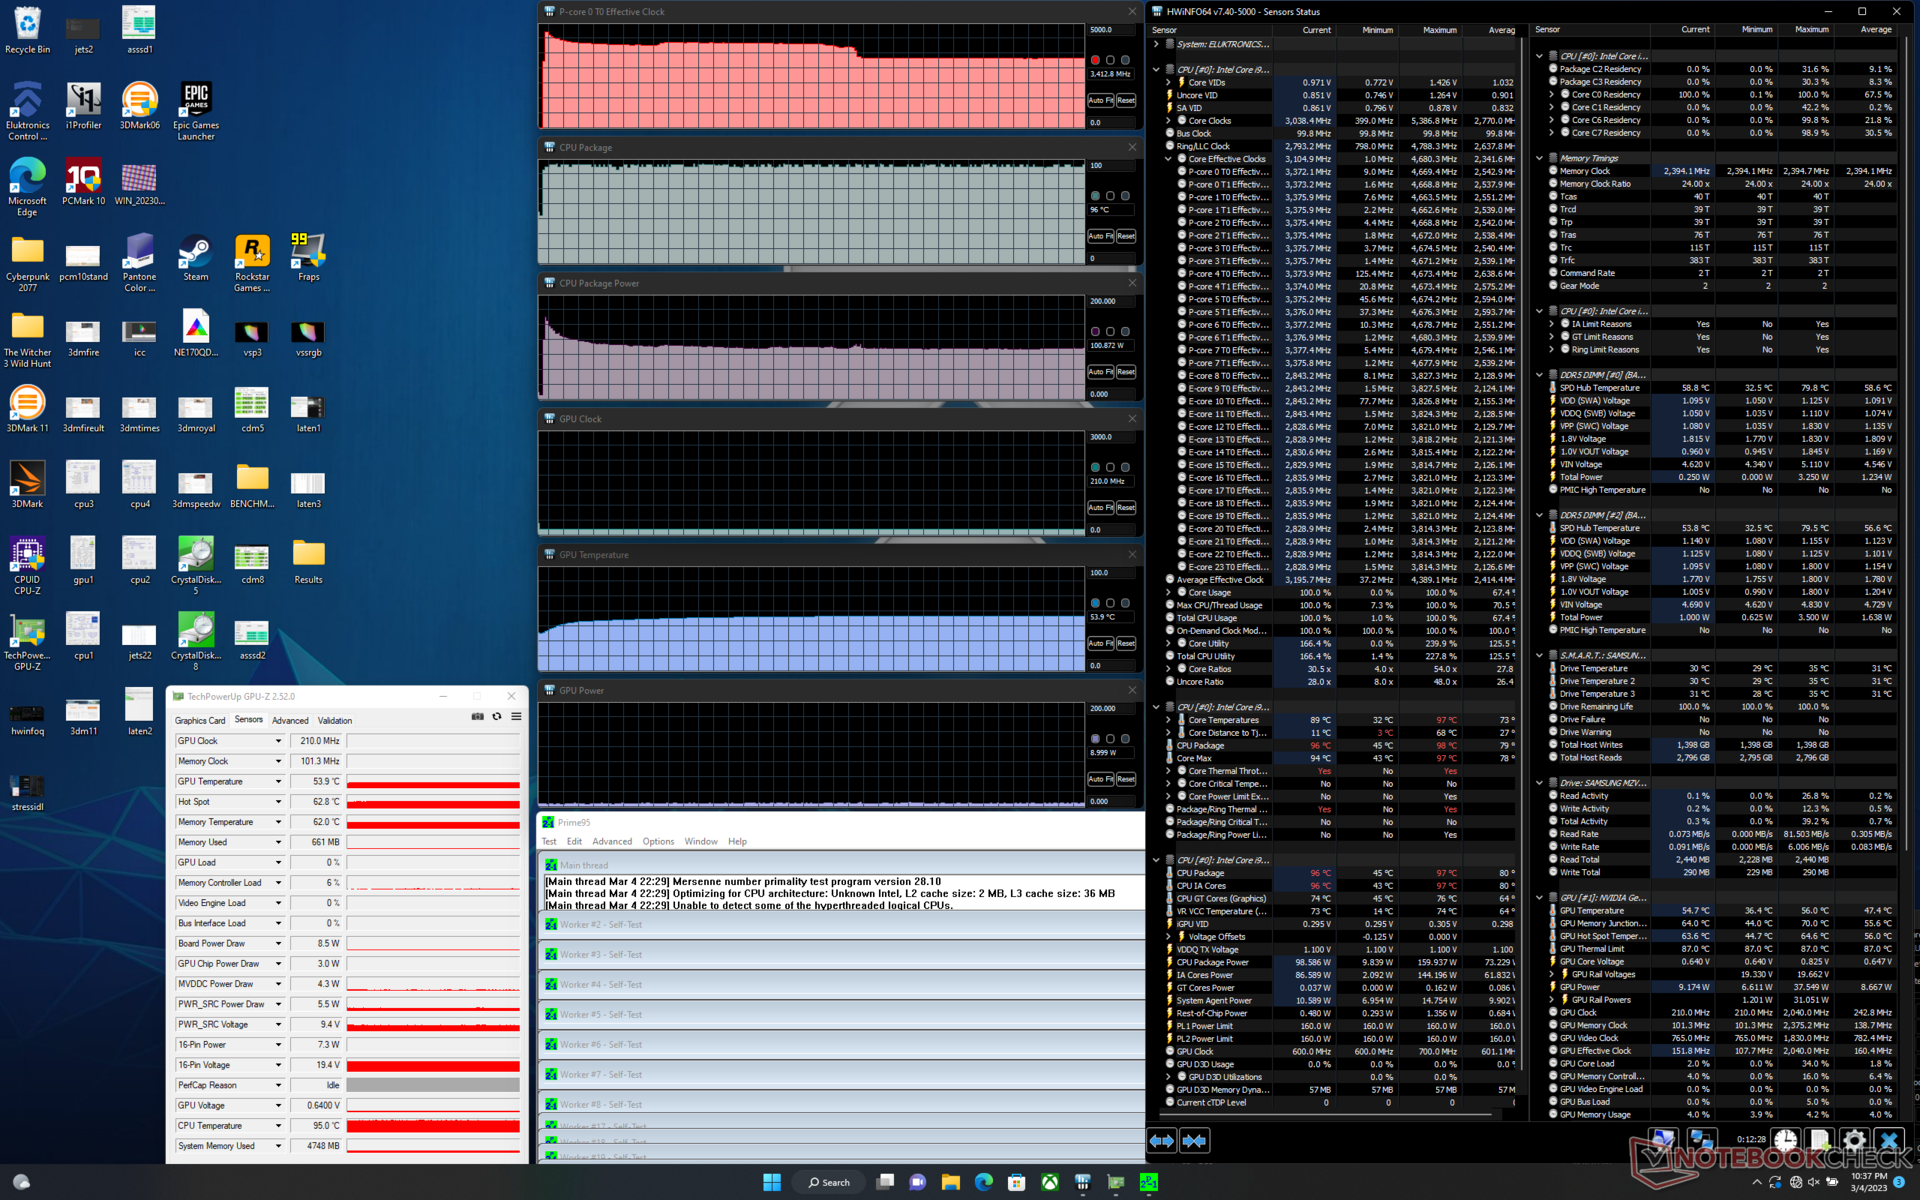
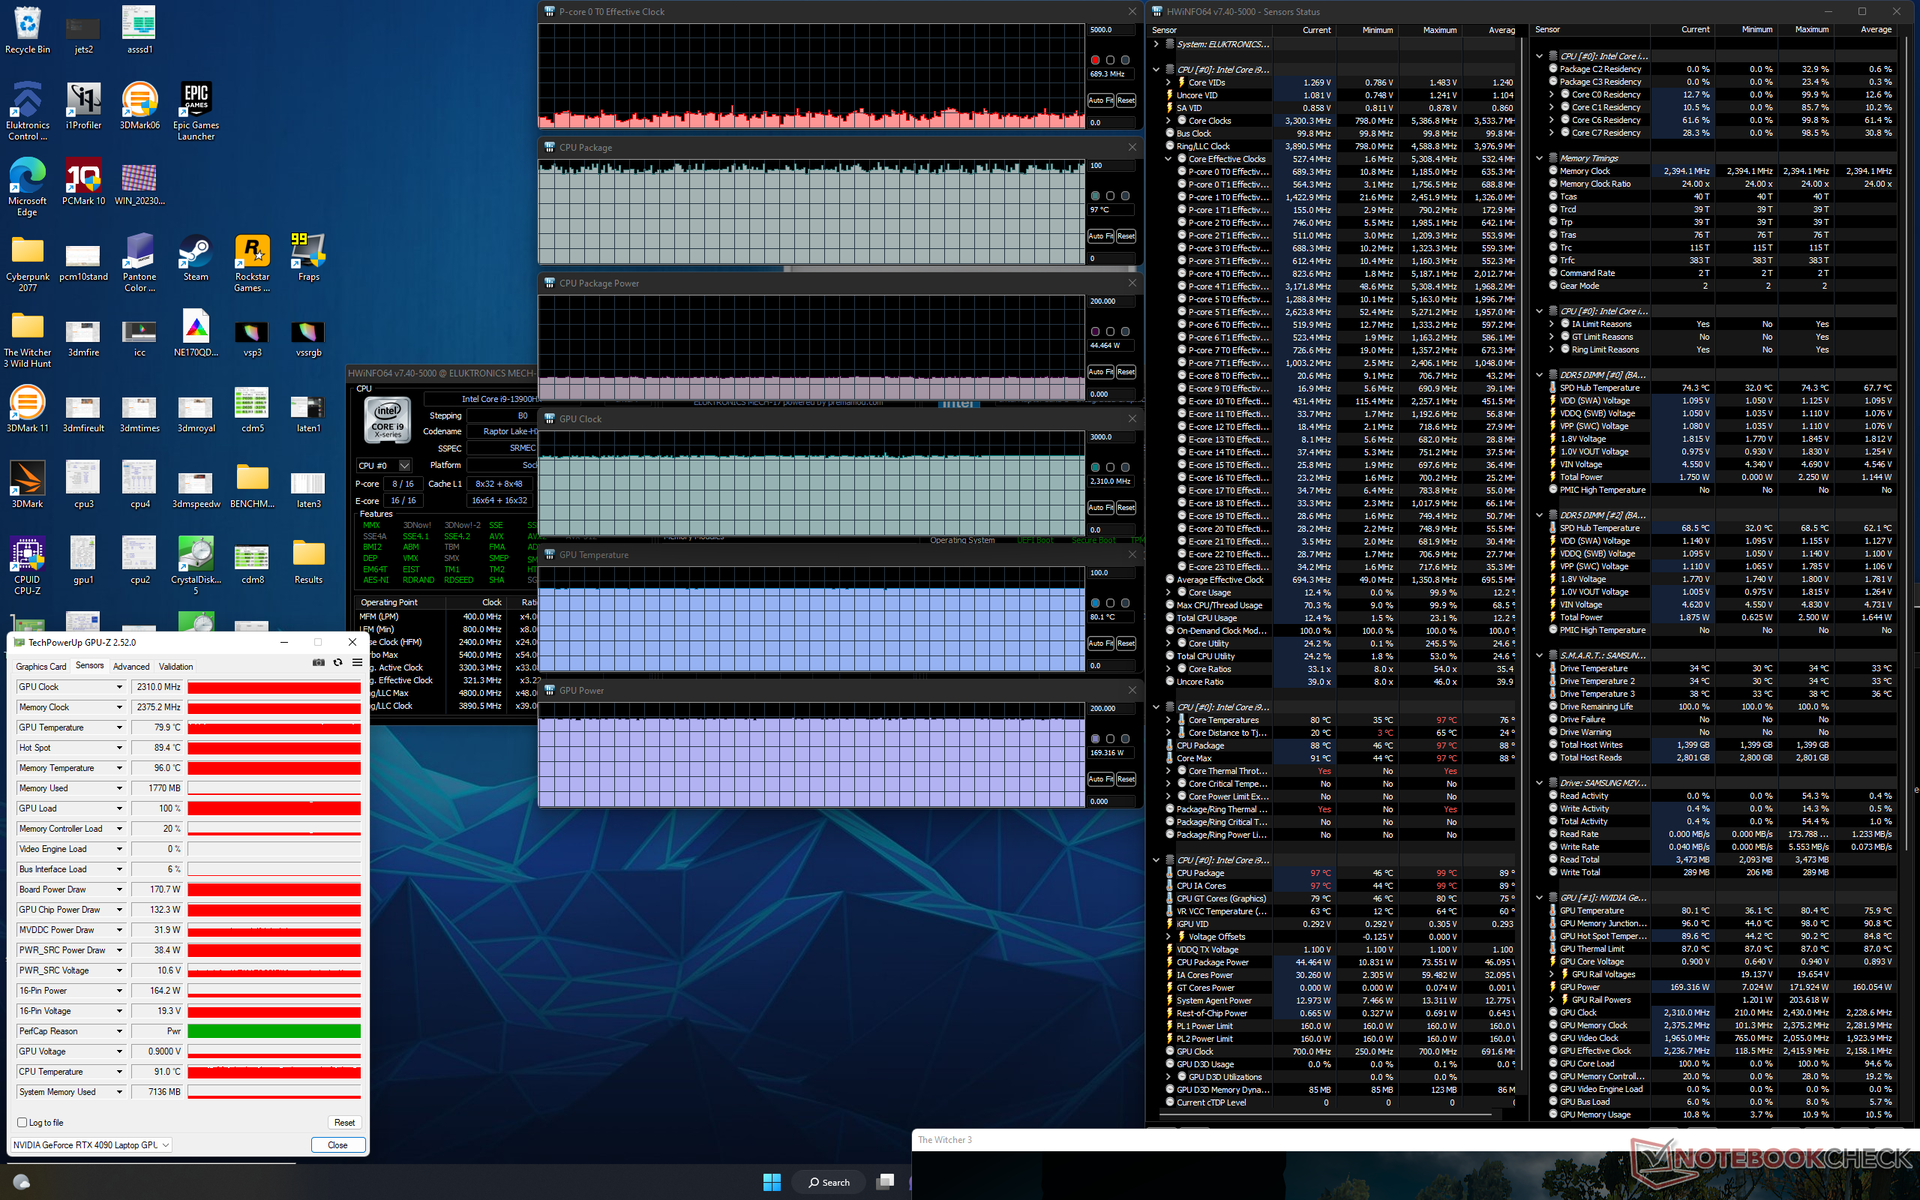
| Relógio CPU (GHz) | Relógio GPU (MHz) | Temperatura média da CPU (°C) | Temperatura média da GPU (°C) | |
| System Idle | -- | -- | 47 | 37 |
| Prime95 Stress | 3.4 | -- | 96 | 54 |
| Witcher 3 Stress | ~0.7 | 2310 | 97 | 80 |
Oradores
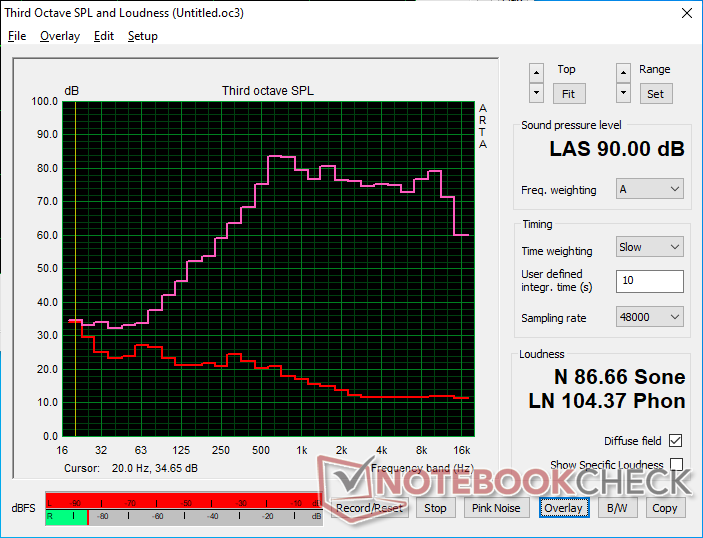
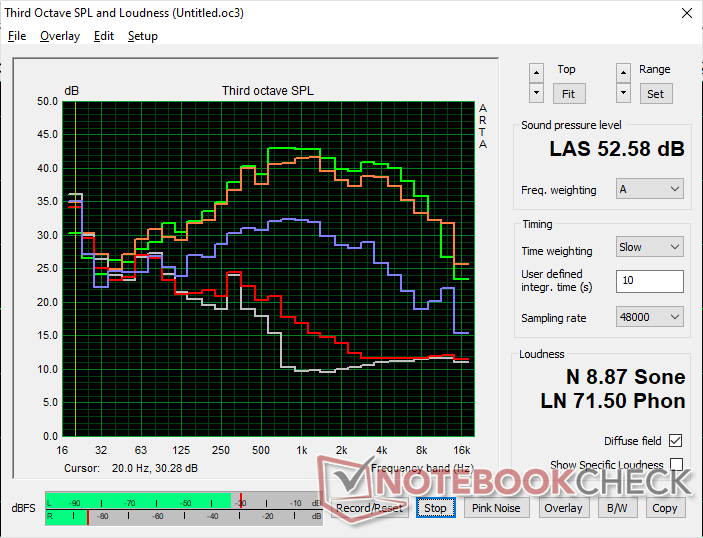
Eluktronics Mech-17 GP2 análise de áudio
(+) | os alto-falantes podem tocar relativamente alto (###valor### dB)
Graves 100 - 315Hz
(-) | quase nenhum baixo - em média 22.5% menor que a mediana
(±) | a linearidade dos graves é média (7.3% delta para a frequência anterior)
Médios 400 - 2.000 Hz
(+) | médios equilibrados - apenas 4.4% longe da mediana
(±) | a linearidade dos médios é média (7.4% delta para frequência anterior)
Altos 2 - 16 kHz
(+) | agudos equilibrados - apenas 1.3% longe da mediana
(+) | os máximos são lineares (2.7% delta da frequência anterior)
Geral 100 - 16.000 Hz
(±) | a linearidade do som geral é média (15% diferença em relação à mediana)
Comparado com a mesma classe
» 32% de todos os dispositivos testados nesta classe foram melhores, 6% semelhantes, 62% piores
» O melhor teve um delta de 6%, a média foi 18%, o pior foi 132%
Comparado com todos os dispositivos testados
» 20% de todos os dispositivos testados foram melhores, 4% semelhantes, 75% piores
» O melhor teve um delta de 4%, a média foi 24%, o pior foi 134%
Apple MacBook Pro 16 2021 M1 Pro análise de áudio
(+) | os alto-falantes podem tocar relativamente alto (###valor### dB)
Graves 100 - 315Hz
(+) | bons graves - apenas 3.8% longe da mediana
(+) | o baixo é linear (5.2% delta para a frequência anterior)
Médios 400 - 2.000 Hz
(+) | médios equilibrados - apenas 1.3% longe da mediana
(+) | médios são lineares (2.1% delta para frequência anterior)
Altos 2 - 16 kHz
(+) | agudos equilibrados - apenas 1.9% longe da mediana
(+) | os máximos são lineares (2.7% delta da frequência anterior)
Geral 100 - 16.000 Hz
(+) | o som geral é linear (4.6% diferença em relação à mediana)
Comparado com a mesma classe
» 0% de todos os dispositivos testados nesta classe foram melhores, 0% semelhantes, 100% piores
» O melhor teve um delta de 5%, a média foi 17%, o pior foi 45%
Comparado com todos os dispositivos testados
» 0% de todos os dispositivos testados foram melhores, 0% semelhantes, 100% piores
» O melhor teve um delta de 4%, a média foi 24%, o pior foi 134%
Gestão de energia
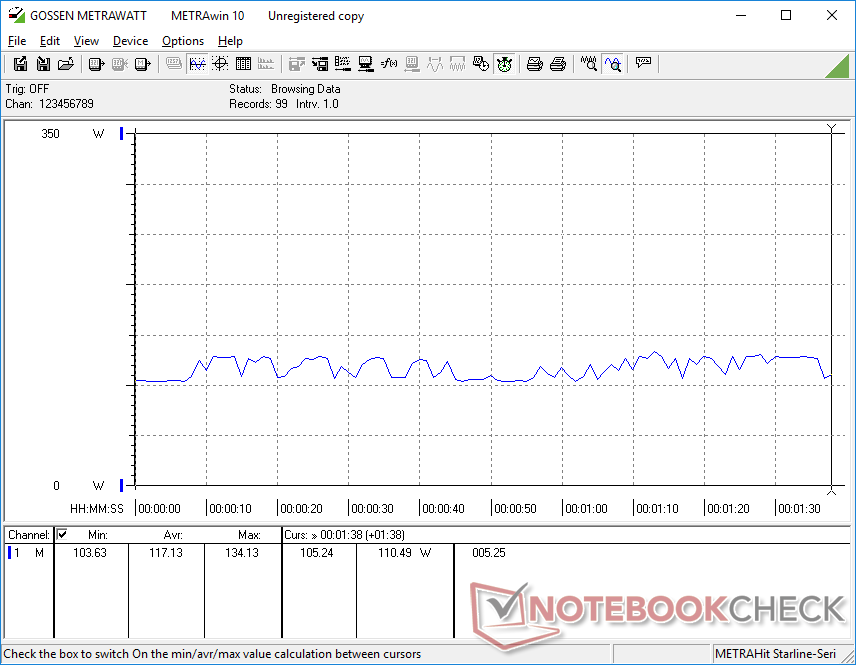
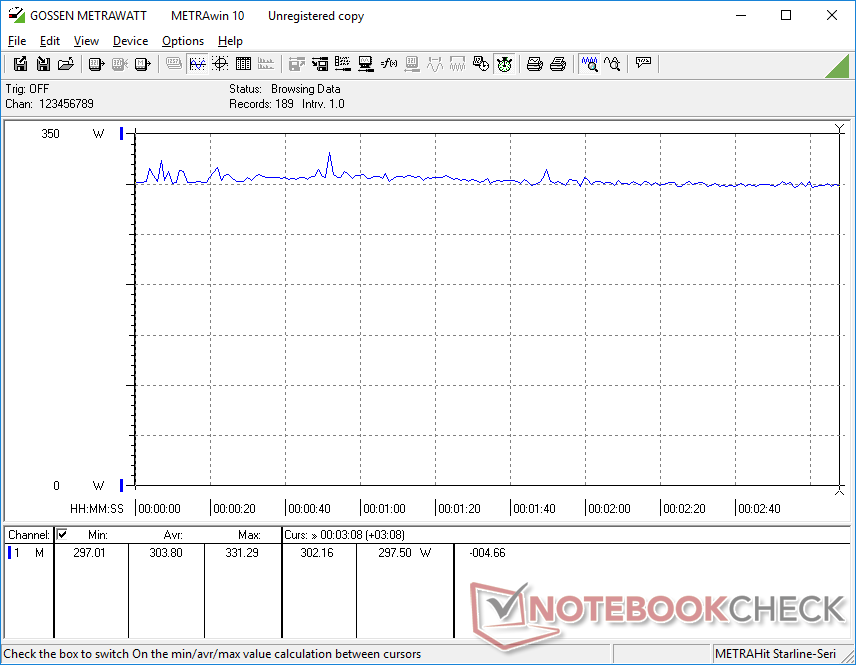
Consumo de energia
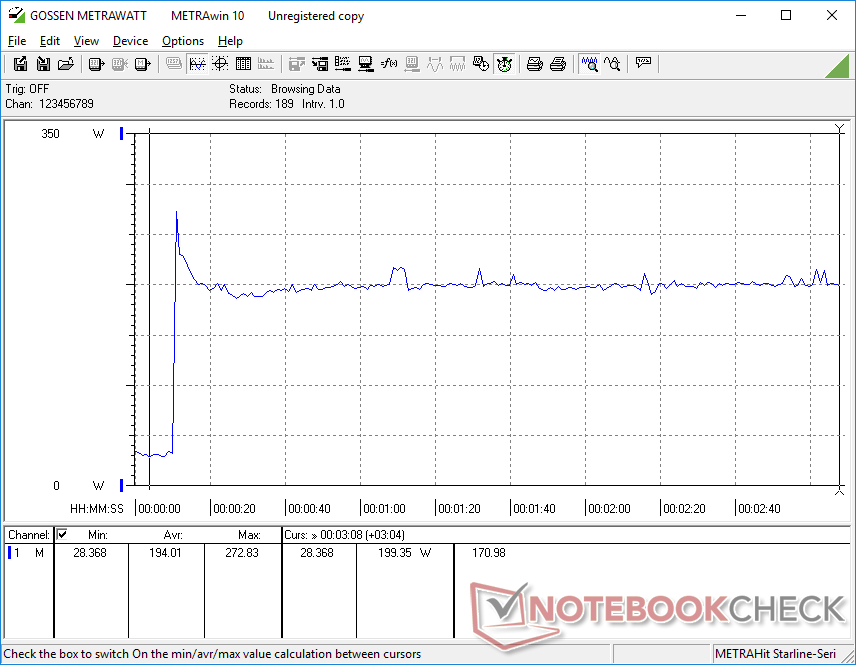
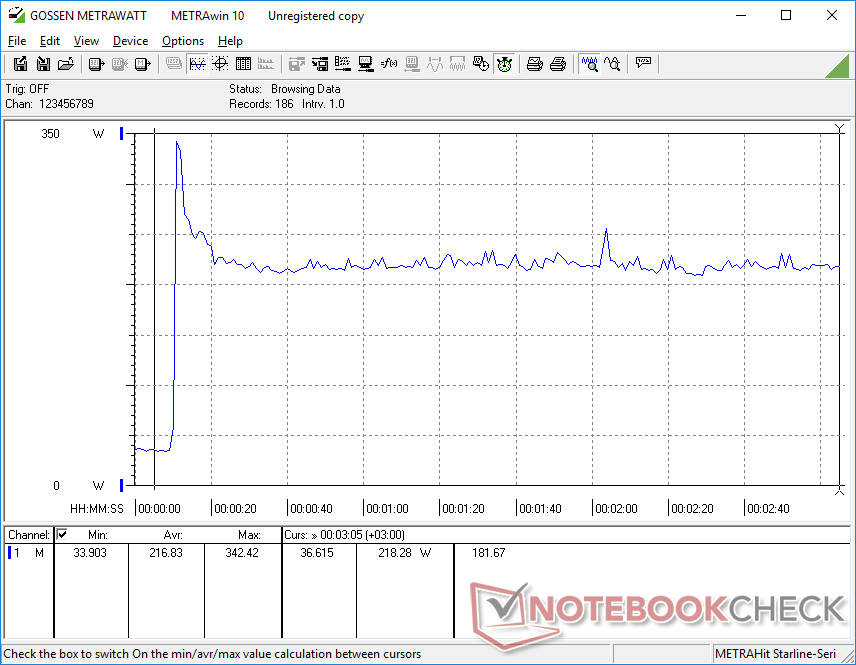
O consumo geral de energia é marcadamente maior em toda a linha do que o que registramos no modelo AMD-Ampere de 2022. Por exemplo, simplesmente ociosos no desktop consumiriam entre 14 W e 37 W em comparação com apenas 7 W a 17 W na versão 2022. Os jogos exigem 37% mais potência em nossa unidade 2023, mas o desempenho por watt ainda é muito bom, pois os usuários estão obtendo 40 a 60% a mais de desempenho gráfico sobre o móvel RTX 3080 Ti.
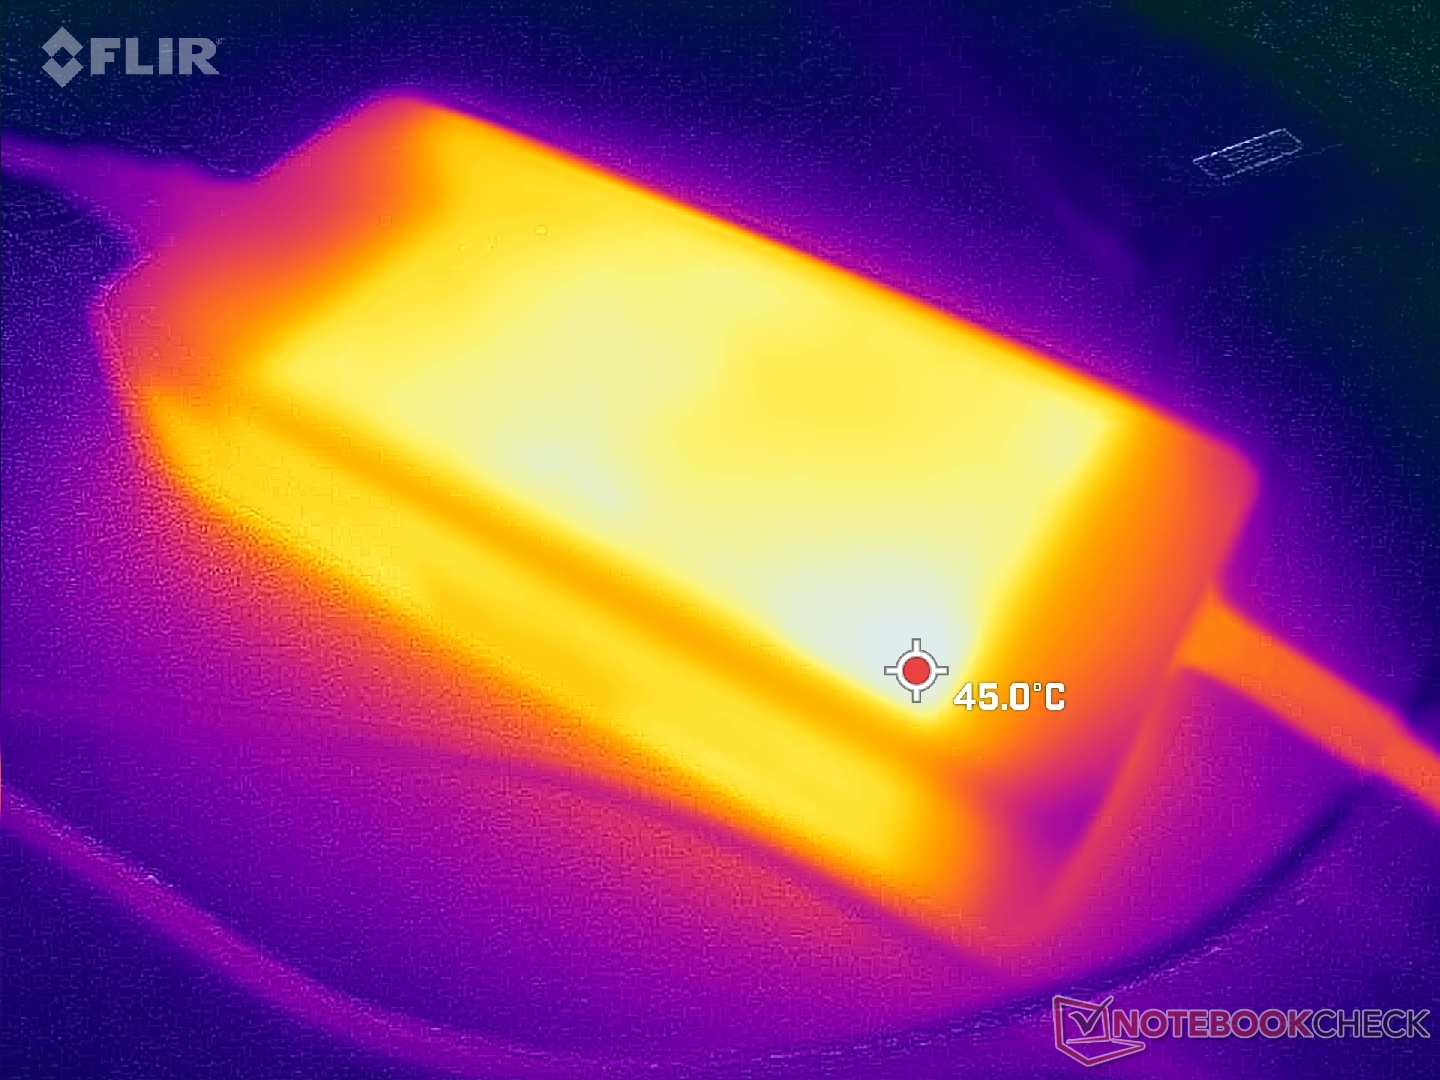
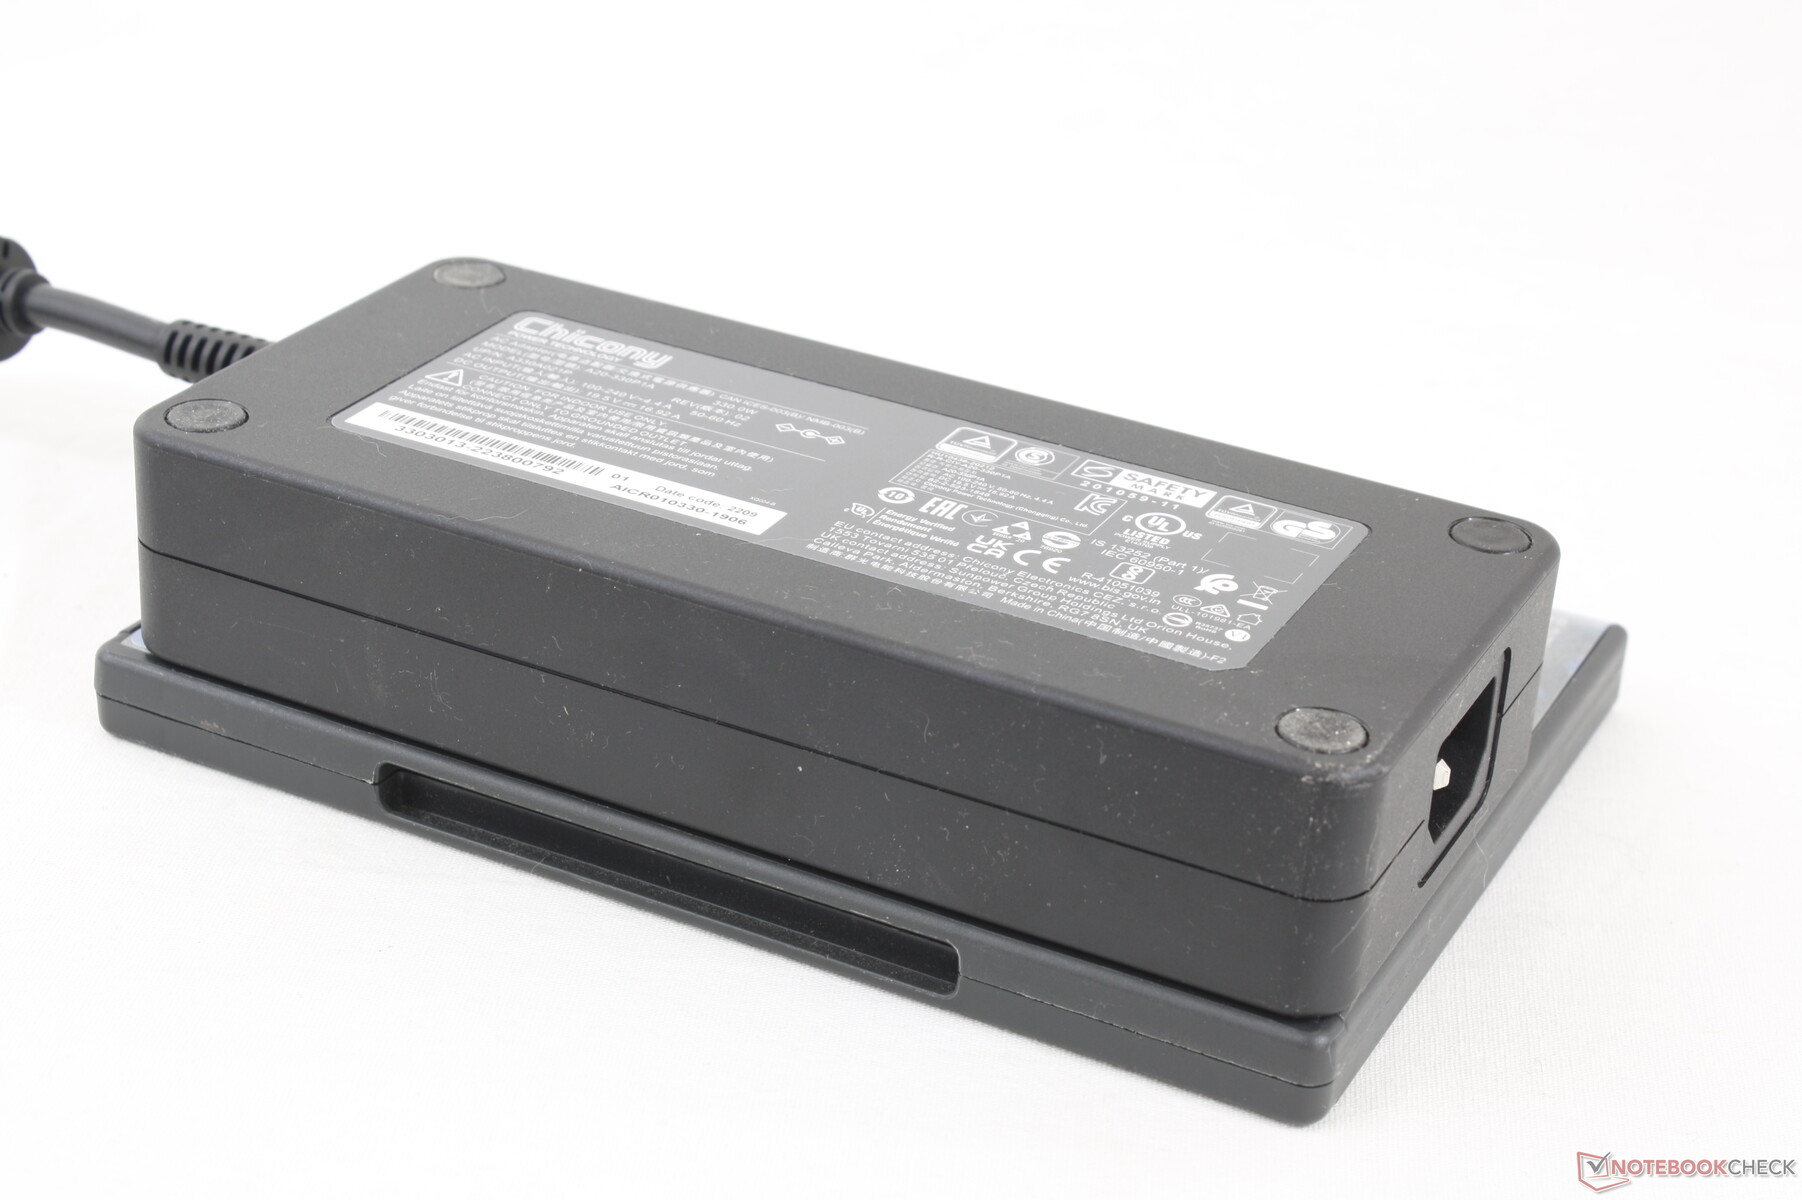
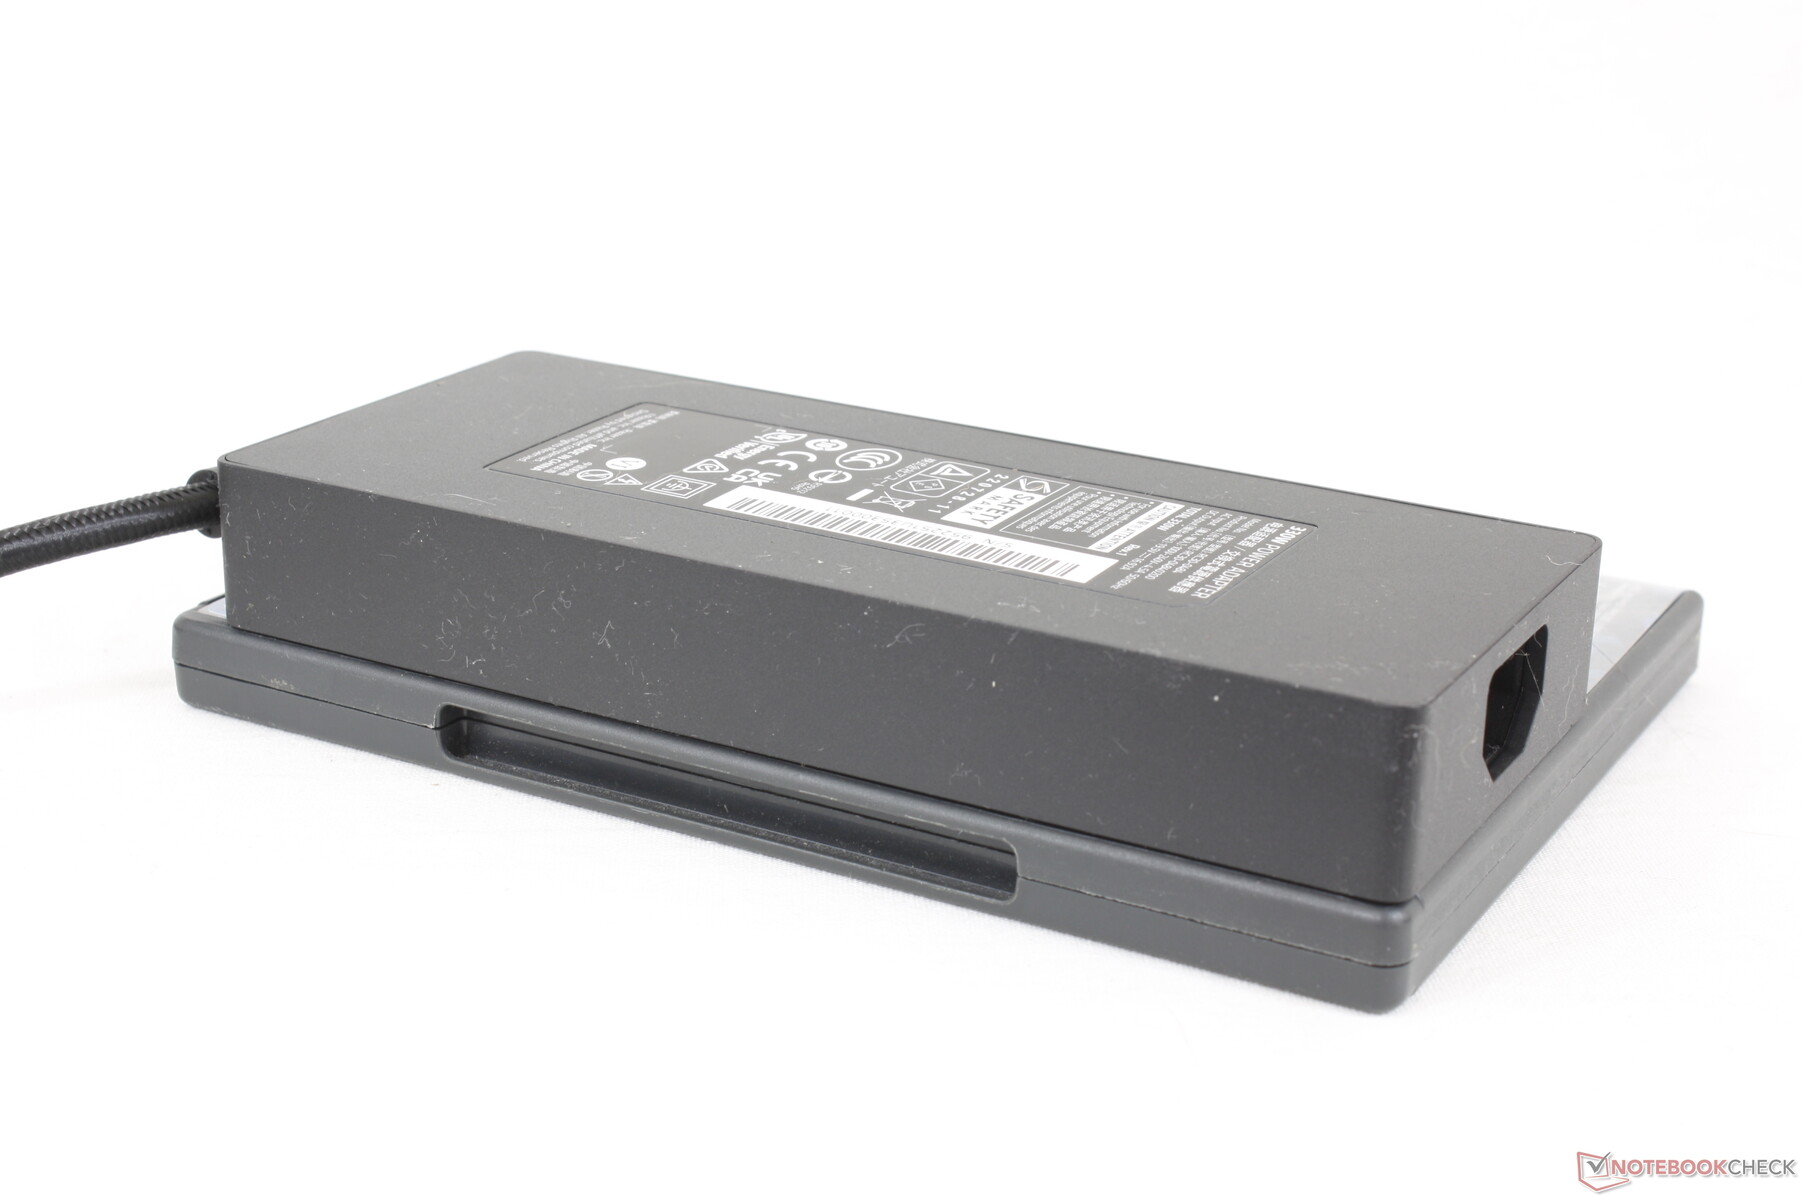
O adaptador AC de 330 W é maior que o adaptador AC de 330 W para o nova Lâmina Razer (~18,5 x 8,5 x 3,6 cm vs. ~18 x 7,5 x 2,5 cm) desde que a Eluktronics e a Uni ainda não se mudaram para a cobrança GaN. Somos capazes de registrar um consumo máximo temporário de 343 W quando a CPU e a GPU estiverem cada uma com 100% de utilização.
| desligado | |
| Ocioso | |
| Carga |
|
Key:
min: | |
| Eluktronics Mech-17 GP2 i9-13900HX, GeForce RTX 4090 Laptop GPU, Samsung PM9A1 MZVL21T0HCLR, IPS, 2560x1600, 17" | Schenker XMG Neo 17 M22 R9 6900HX, GeForce RTX 3080 Ti Laptop GPU, Samsung SSD 980 Pro 1TB MZ-V8P1T0BW, IPS, 2560x1600, 17" | MSI Katana 17 B13VFK i7-13620H, GeForce RTX 4060 Laptop GPU, Micron 2400 MTFDKBA1T0QFM, IPS LED, 1920x1080, 17.3" | MSI Titan GT77 HX 13VI i9-13950HX, GeForce RTX 4090 Laptop GPU, Samsung PM9A1 MZVL22T0HBLB, Mini-LED, 3840x2160, 17.3" | Alienware m17 R5 (R9 6900HX, RX 6850M XT) R9 6900HX, Radeon RX 6850M XT, SSSTC CA6-8D1024, IPS, 3840x2160, 17" | Razer Blade 18 RTX 4070 i9-13950HX, GeForce RTX 4070 Laptop GPU, SSSTC CA6-8D1024, IPS, 2560x1600, 18" | |
|---|---|---|---|---|---|---|
| Power Consumption | 35% | 35% | 1% | 24% | -24% | |
| Idle Minimum * (Watt) | 14 | 7 50% | 12.2 13% | 14 -0% | 13 7% | 24.5 -75% |
| Idle Average * (Watt) | 19.3 | 11 43% | 14.9 23% | 21.6 -12% | 16.5 15% | 34.1 -77% |
| Idle Maximum * (Watt) | 36.8 | 17 54% | 15.8 57% | 24.8 33% | 17 54% | 47.7 -30% |
| Load Average * (Watt) | 117.2 | 92 22% | 85.22 27% | 122.5 -5% | 93 21% | 140 -19% |
| Witcher 3 ultra * (Watt) | 304 | 221 27% | 151.1 50% | 265 13% | 239 21% | 202 34% |
| Load Maximum * (Watt) | 342.5 | 306 11% | 212.8 38% | 418 -22% | 251 27% | 261 24% |
* ... menor é melhor
Power Consumption Witcher 3 / Stresstest
Power Consumption external Monitor
Vida útil da bateria
O tempo de funcionamento da WLAN é menor do que o do Neo 17 M22 do ano passado por várias horas, por um total de pouco mais de 5 horas. Ambas as unidades de teste seriam ajustadas para o perfil de potência balanceada com Optimus ativo no iGPU.
O carregamento da capacidade vazia para a plena carga leva entre 2 e 2,5 horas. O sistema não pode ser recarregado via USB-C.
| Eluktronics Mech-17 GP2 i9-13900HX, GeForce RTX 4090 Laptop GPU, 99 Wh | Schenker XMG Neo 17 M22 R9 6900HX, GeForce RTX 3080 Ti Laptop GPU, 99 Wh | MSI Katana 17 B13VFK i7-13620H, GeForce RTX 4060 Laptop GPU, 53.5 Wh | MSI Titan GT77 HX 13VI i9-13950HX, GeForce RTX 4090 Laptop GPU, 99.9 Wh | Alienware m17 R5 (R9 6900HX, RX 6850M XT) R9 6900HX, Radeon RX 6850M XT, 97 Wh | Razer Blade 18 RTX 4070 i9-13950HX, GeForce RTX 4070 Laptop GPU, 91.7 Wh | |
|---|---|---|---|---|---|---|
| Duração da bateria | 76% | -43% | 4% | -6% | -22% | |
| WiFi v1.3 (h) | 5.1 | 9 76% | 2.9 -43% | 5.3 4% | 4.8 -6% | 4 -22% |
| Reader / Idle (h) | 12 | 7 | ||||
| H.264 (h) | 6.6 | 6 | 4.9 | |||
| Load (h) | 1.8 | 1 | 1.4 | 1.8 | 1.3 |
Pro
Contra
Veredicto - Aumentar um pouco demais o calor literalmente
O Mech-17 GP2 é 7 por cento menor e 17 por cento mais leve que o MSI GT77 HX Titan enquanto oferece quase o mesmo desempenho. Como resultado, está densamente embalado, mas talvez por um pouco demais. As temperaturas da CPU são extremamente altas até mesmo para um laptop para jogos quando se está rodando jogos. Embora a faixa de ~97 C seja tecnicamente "segura" para o processador Intel, é no entanto mais quente do que no modelo do ano passado e não é exatamente reconfortante para o usuário final. A alta temperatura central talvez possa ser aliviada utilizando a estação externa de encaixe do resfriador de água, mas um laptop não deveria ter que depender de um acessório opcional para um resfriamento ideal.
Alto desempenho ao custo de altas temperaturas do núcleo.
Além de seu alto desempenho por volume, o preço também é um fator distintivo do modelo. O Mech-17 GP2 é um dos poucos GeForce 40 laptops com opção de barebone, o que significa que você pode economizar várias centenas de dólares se você puder fornecer sua própria RAM, SSD e SO. $2999 USD para um dos laptops mais rápidos do mercado para jogos não é nem metade ruim; apenas tenha certeza de estar atento a essas temperaturas centrais.
Preço e Disponibilidade
A Amazônia está agora enviando o Mech-17 GP2 com o RTX 4090 por $4400 USD completo com RAM e armazenamento. Alternativamente, os usuários podem adquirir diretamente da Eluktronics para opções mais configuráveis.
Eluktronics Mech-17 GP2
- 03/08/2023 v7 (old)
Allen Ngo
Transparência
A seleção dos dispositivos a serem analisados é feita pela nossa equipe editorial. A amostra de teste foi fornecida ao autor como empréstimo pelo fabricante ou varejista para fins desta revisão. O credor não teve influência nesta revisão, nem o fabricante recebeu uma cópia desta revisão antes da publicação. Não houve obrigação de publicar esta revisão. Como empresa de mídia independente, a Notebookcheck não está sujeita à autoridade de fabricantes, varejistas ou editores.
É assim que o Notebookcheck está testando
Todos os anos, o Notebookcheck analisa de forma independente centenas de laptops e smartphones usando procedimentos padronizados para garantir que todos os resultados sejam comparáveis. Desenvolvemos continuamente nossos métodos de teste há cerca de 20 anos e definimos padrões da indústria no processo. Em nossos laboratórios de teste, equipamentos de medição de alta qualidade são utilizados por técnicos e editores experientes. Esses testes envolvem um processo de validação em vários estágios. Nosso complexo sistema de classificação é baseado em centenas de medições e benchmarks bem fundamentados, o que mantém a objetividade.Price comparison

