

Notebookcheck Logo
Teaser

Análise do Dell Pro 5 14: um modelo de gama média com surpreendentemente poucas concessões

Escolha entre alumínio ou fibra de vidro.

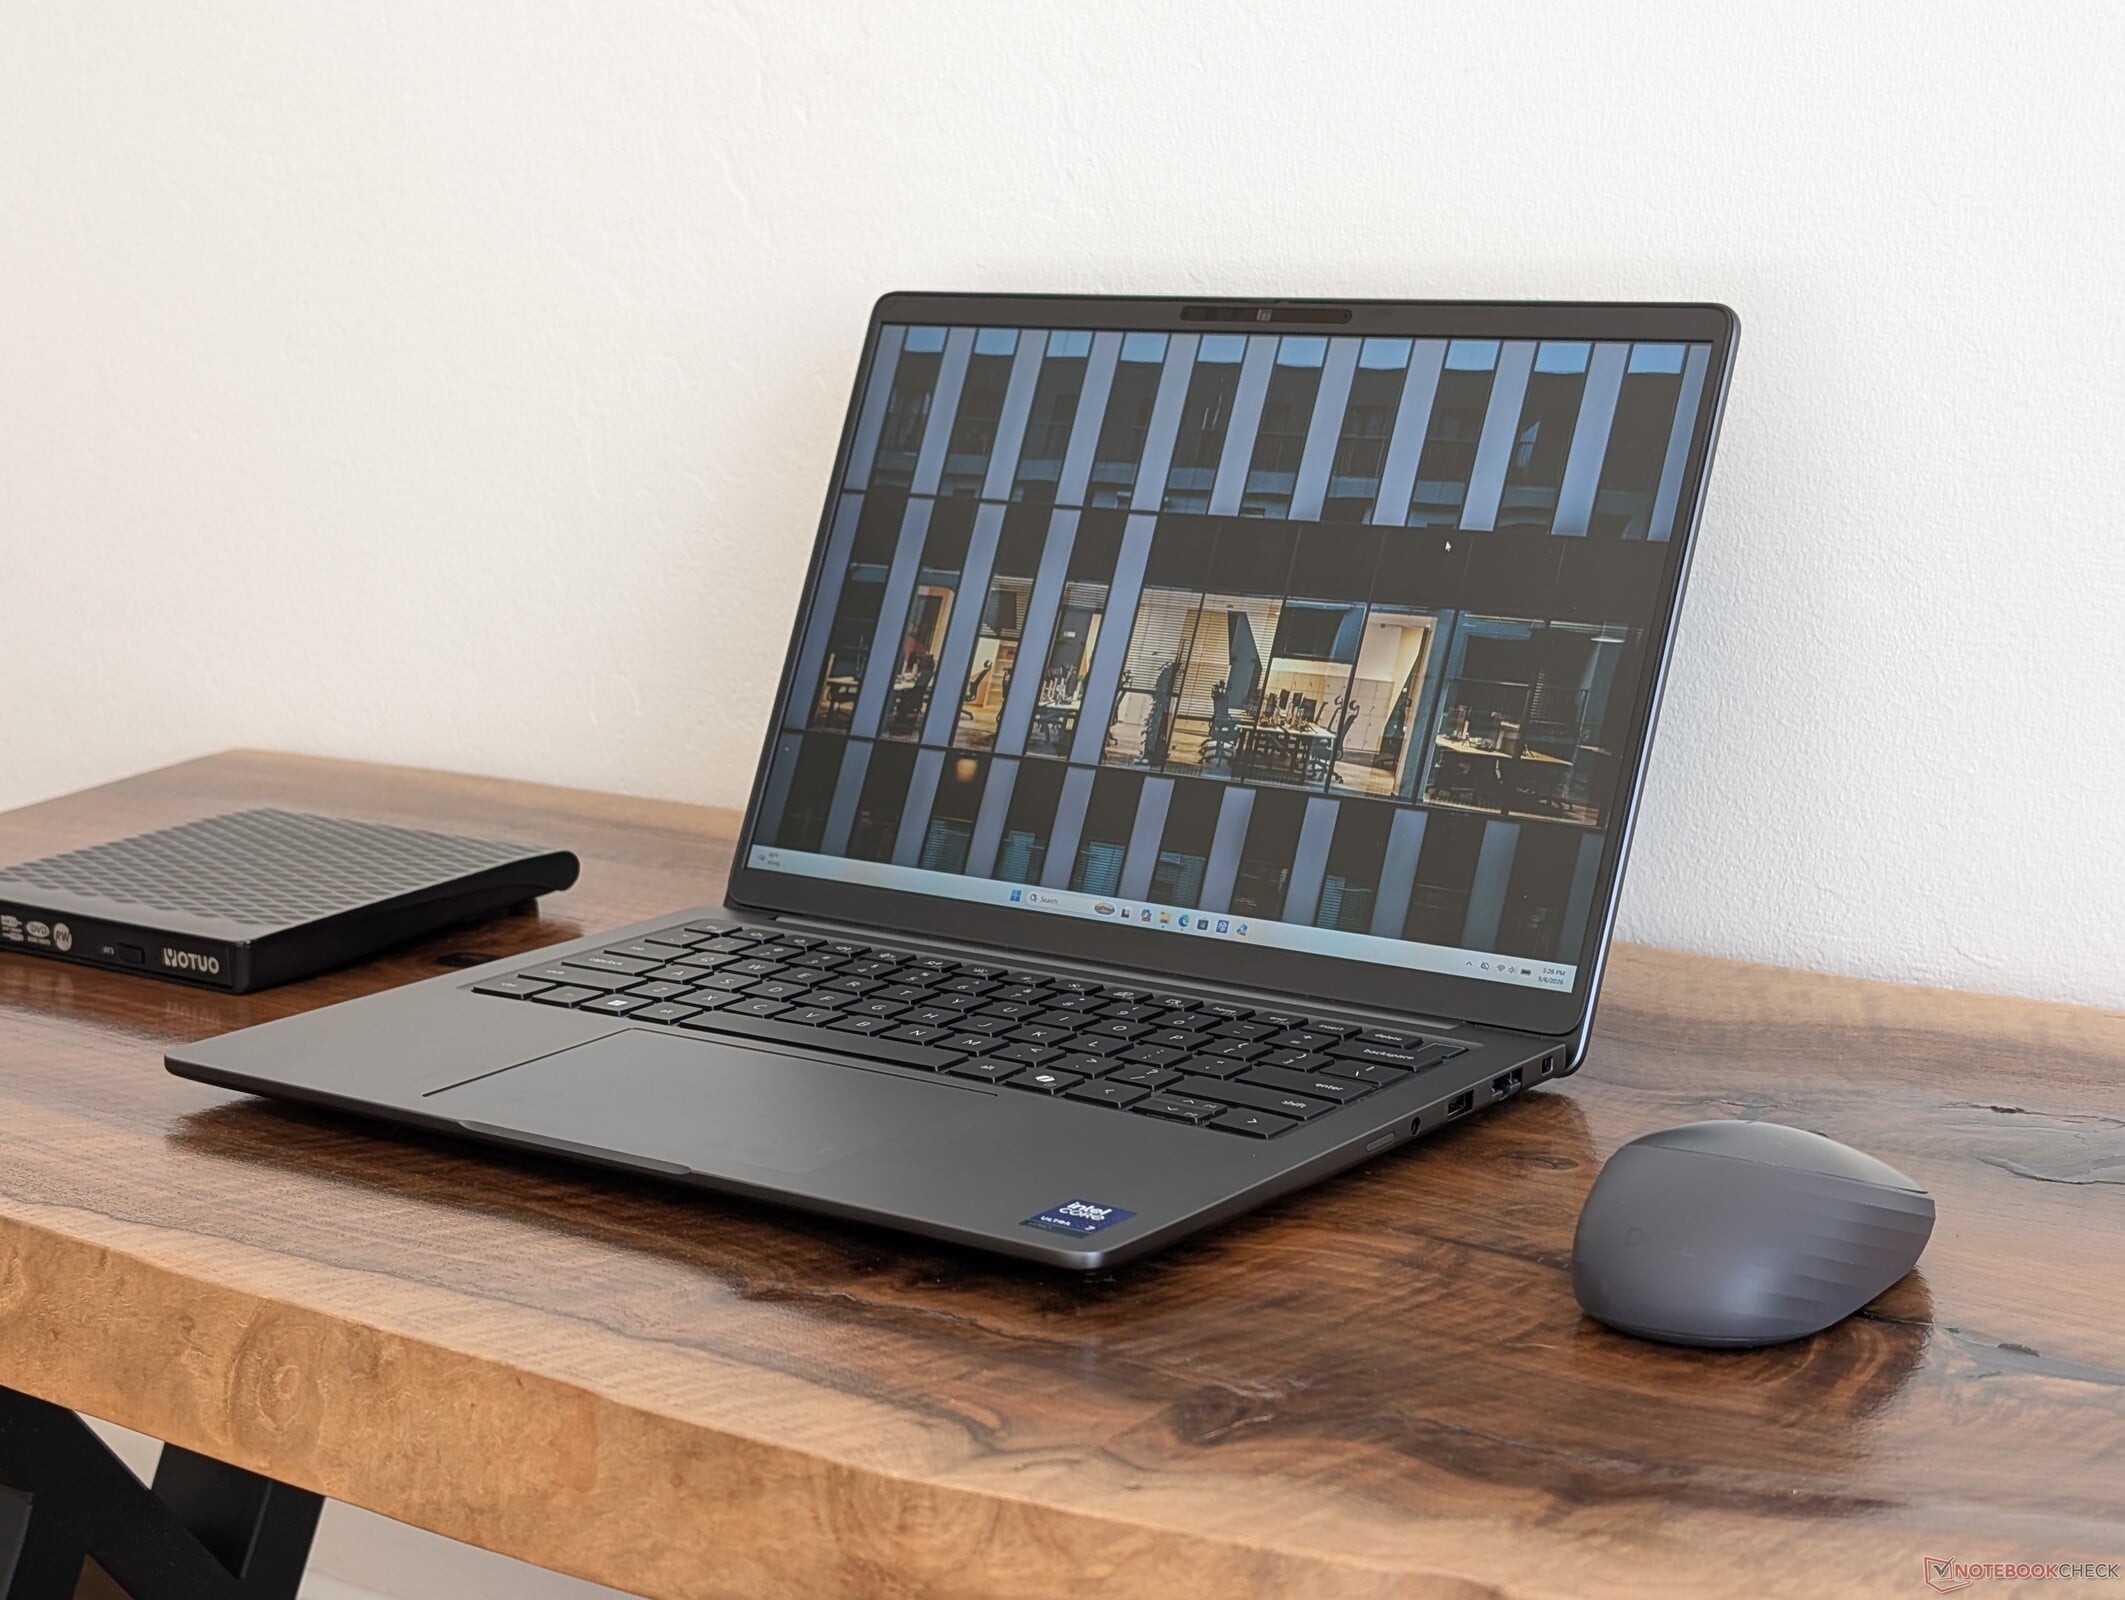
O Dell Pro 5 14, modelo mais comum, pode estar posicionado abaixo do Dell Pro 7 14, mais caro, mas eles têm tanto em comum que a experiência do usuário entre os dois é quase idêntica na maioria dos cenários. O modelo “inferior” chega a apresentar alguns recursos não encontrados no último.
Allen Ngo, 👁 Allen Ngo (traduzido por DeepL / Ninh Duy) Publicado 🇺🇸 🇳🇱 ...
Laptop / Notebook Panther Lake Business

Veredicto — Melhor do que o Dell Pro 7 14 em certos aspectos

Apesar de ser mais acessível que o Dell Pro 7 14, o Dell Pro 5 14 apresenta características de chassi semelhantes e os mesmos dispositivos de entrada, tamanhos de bateria, webcam e opções de tela, proporcionando uma experiência de usuário quase idêntica. Na verdade, o Dell Pro 5 14 possui alguns recursos não disponíveis no Dell Pro 7 14, incluindo RJ-45, LPCAMM2 opcional e processadores Panther Lake X7 — sendo que estes últimos aumentam significativamente o desempenho gráfico para quem precisa.

No entanto, por ser o modelo mais econômico, o Dell Pro 5 14 é ligeiramente mais espesso e mais pesado do que seu irmão mais caro; assim, os recursos extras vêm à custa do tamanho e do peso. Concorrentes como o Lenovo ThinkPad T14s, mais leve, são mais práticos para viagens, com tamanho de tela e opções de hardware semelhantes.

Outras pequenas observações incluem a falta de portas USB-C na borda direita, o que limita o carregamento apenas à borda esquerda do sistema. Além disso, o SSD e a iGPU tendem a apresentar uma ligeira redução de desempenho após alguns minutos de carga pesada, ao contrário do que observamos no Dell Pro 7 14, que é mais caro. Na prática, porém, essas pequenas quedas no desempenho são insignificantes na grande maioria dos casos de uso.

Pro

+ bateria de longa duração; excelente eficiência energética
+ boa variedade de portas integradas
+ alto-falantes internos potentes
+ design robusto do chassi
+ fácil manutenção

Contra

- o desempenho dos gráficos e do SSD pode ser limitado
- opção de OLED limitada a FHD e 300 nits
- a tela não vem pré-calibrada
- não há porta USB-C na borda direita
- poderia ser mais leve

Preço e disponibilidade

Os preços começam em US$ 2.000 para a configuração básica Core Ultra 5 e vão até US$ 3.000 ou mais para a configuração Core Ultra X7.

Amazon: Request rate limit exceeded. Learn more: https://affiliate-program.amazon.com/creatorsapi/docs/en-us/concepts/api-rates

Da mesma forma que a série Dell Pro 7 14, de gama alta, sucede a antiga série Latitude 7400, o novo Dell Pro 5 14, de gama média, substitui a antiga série Latitude 5400. Mesmo assim, o modelo é notavelmente semelhante ao Dell Pro 7 14, mais caro, em vários aspectos importantes.

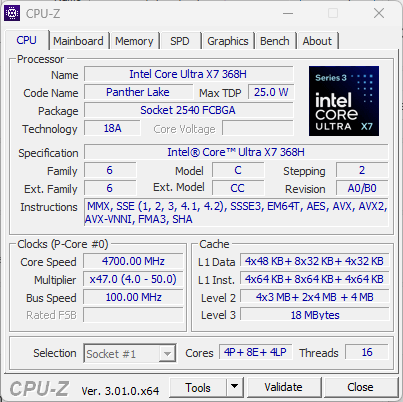
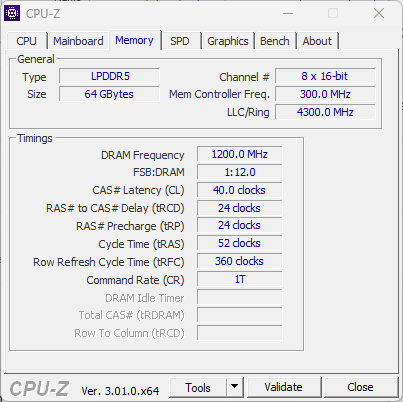
Nossa unidade de teste específica é uma configuração de ponta com a CPU Core Ultra X7 368H vPro Panther Lake, 64 GB de LPCAMM2 removível e uma tela IPS de 1200p e 120 Hz, por aproximadamente US$ 4.000. Modelos com especificações inferiores custam a partir da metade desse preço, com o processador Core Ultra 5 ou módulos de memória SODIMM padrão.

Entre as alternativas estão outros notebooks voltados para o mercado empresarial, como o Lenovo ThinkPad T14s ou a série HP EliteBook 14.

Mais análises da Dell:

Especificações

Dell Pro 5 14 P514260
Processador
Intel Core Ultra X7 368H 16c/16t, 4 x 4.9 GHz Intel Cougar Cove P-Core, 8 x 4.0 GHz Intel Darkmont E-Core, 4 x 3.6 GHz Intel Darkmont E-Core, 67 W PL2 / Short Burst, 41 W PL1 / Sustained, Panther Lake
Placa gráfica
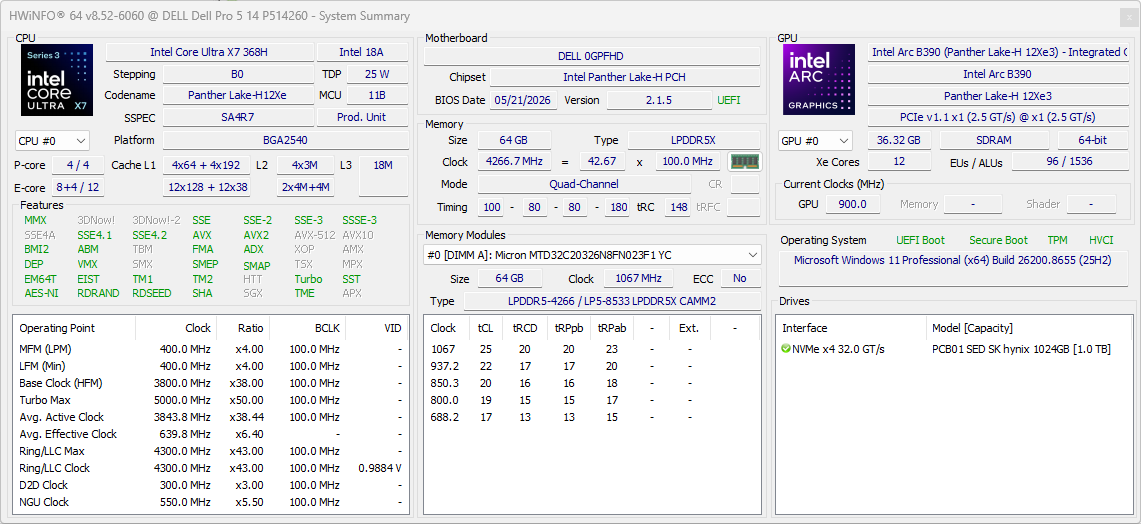
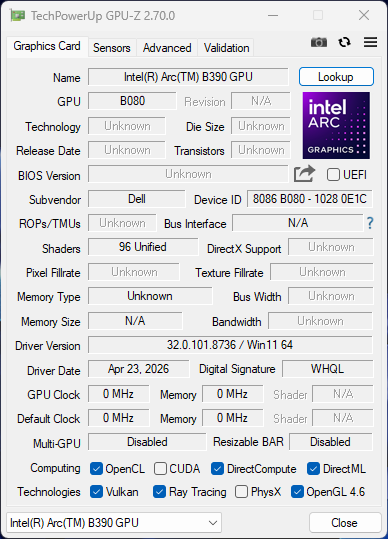
Intel Arc B390 12 Xe3 Panther Lake iGPU, Análises do: 1850 MHz, LPDDR5x, 32.0.101.8736
Memória
64 GB 
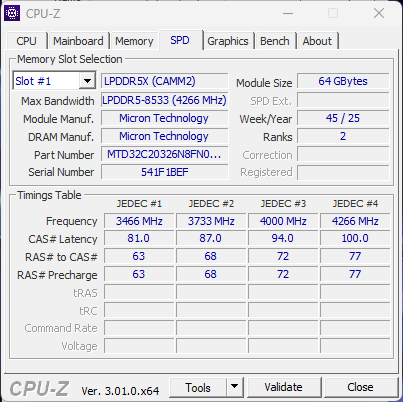
, LPCAMM2, 8533 MT/s, Dual-Channel
Pantalha
14.00 polegadas 16:10, 1920 x 1200 pixel 162 PPI, LG Philips LP140WU, IPS, Brilhante: não, 120 Hz
placa mãe
Intel Panther Lake-H PCH
Disco rígido
SK hynix PCB01 HFS001TFM9X186N
Placa de Som
Intel Panther Lake-H PCH - High Definition Audio - AVS (Audio, Voice, Speech)
Conexões
2 USB 3.0, 2 USB4 40 Gbps, 2 Thunderbolt 4, USB-C Power Delivery (PD), 1 HDMI, 2 DisplayPort, 1 Kensington Lock, Conexões Audio: 3.5 mm combo, 1 Leitor de Impressões Digitais
Funcionamento em rede
Intel Ethernet Connection I219-LM (10/100/1000MBit/s), Intel Wi-Fi 7 BE211 320MHz (a/b/g/n = Wi-Fi 4/ac = Wi-Fi 5/ax = Wi-Fi 6/ Wi-Fi 6E 6 GHz be = Wi-Fi 7), Bluetooth 6
Tamanho
altura x largura x profundidade (em mm): 18.1 x 315.5 x 226
Bateria
70 Wh Lítio-Polímero
Sistema Operativo
Microsoft Windows 11 Pro
Câmera
Webcam: 1440p30 w/ IR + physical shutter
Câmera principal: 8.3 MPix
Características adicionais
Alto falantes: 2x 2 W stereo, Teclado: Chiclet, Iluminação do Teclado: sim, Dell Optimizer, Update, SupportAssist, 12 Meses Garantia
peso
1.471 kg, Suprimento de energia: 314 g
Preço
4000 USD
Amazon
Nota: O fabricante pode utilizar componentes de diferentes fornecedores, incluindo painéis de exibição, unidades ou cartões de memória com especificações semelhantes.


Maiúsculas e minúsculas

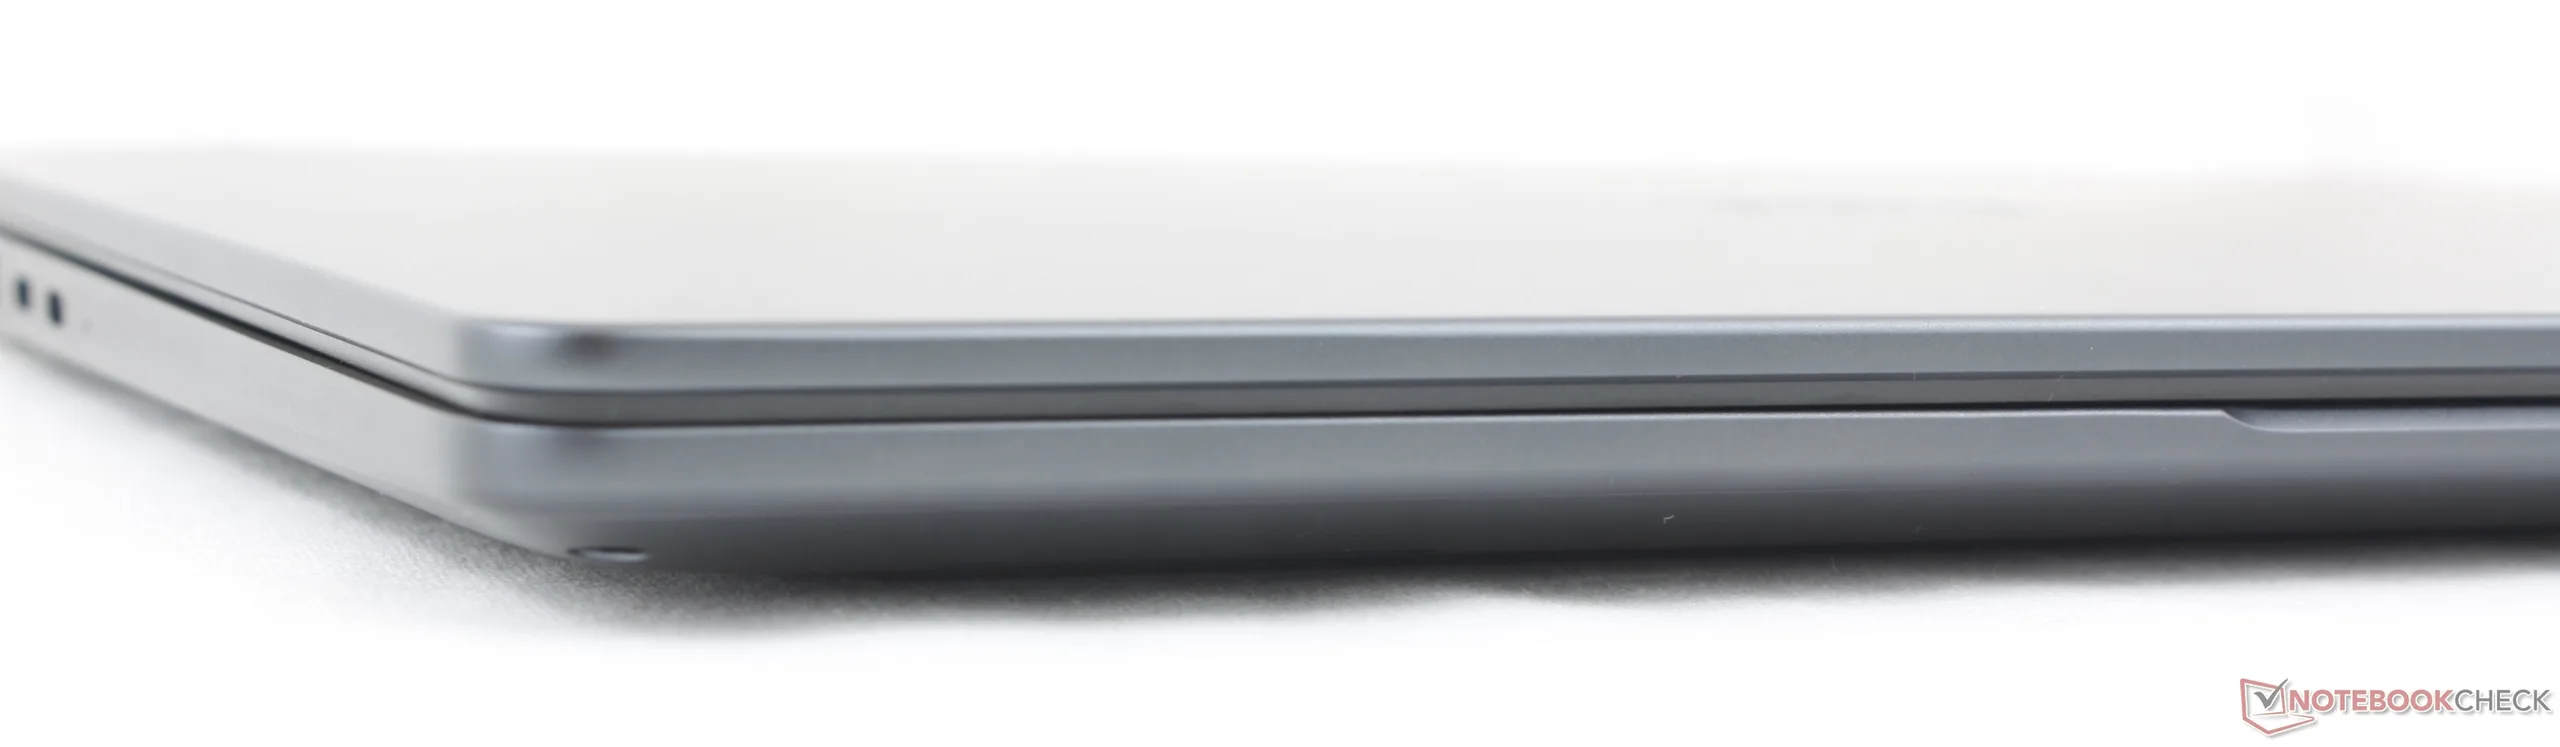
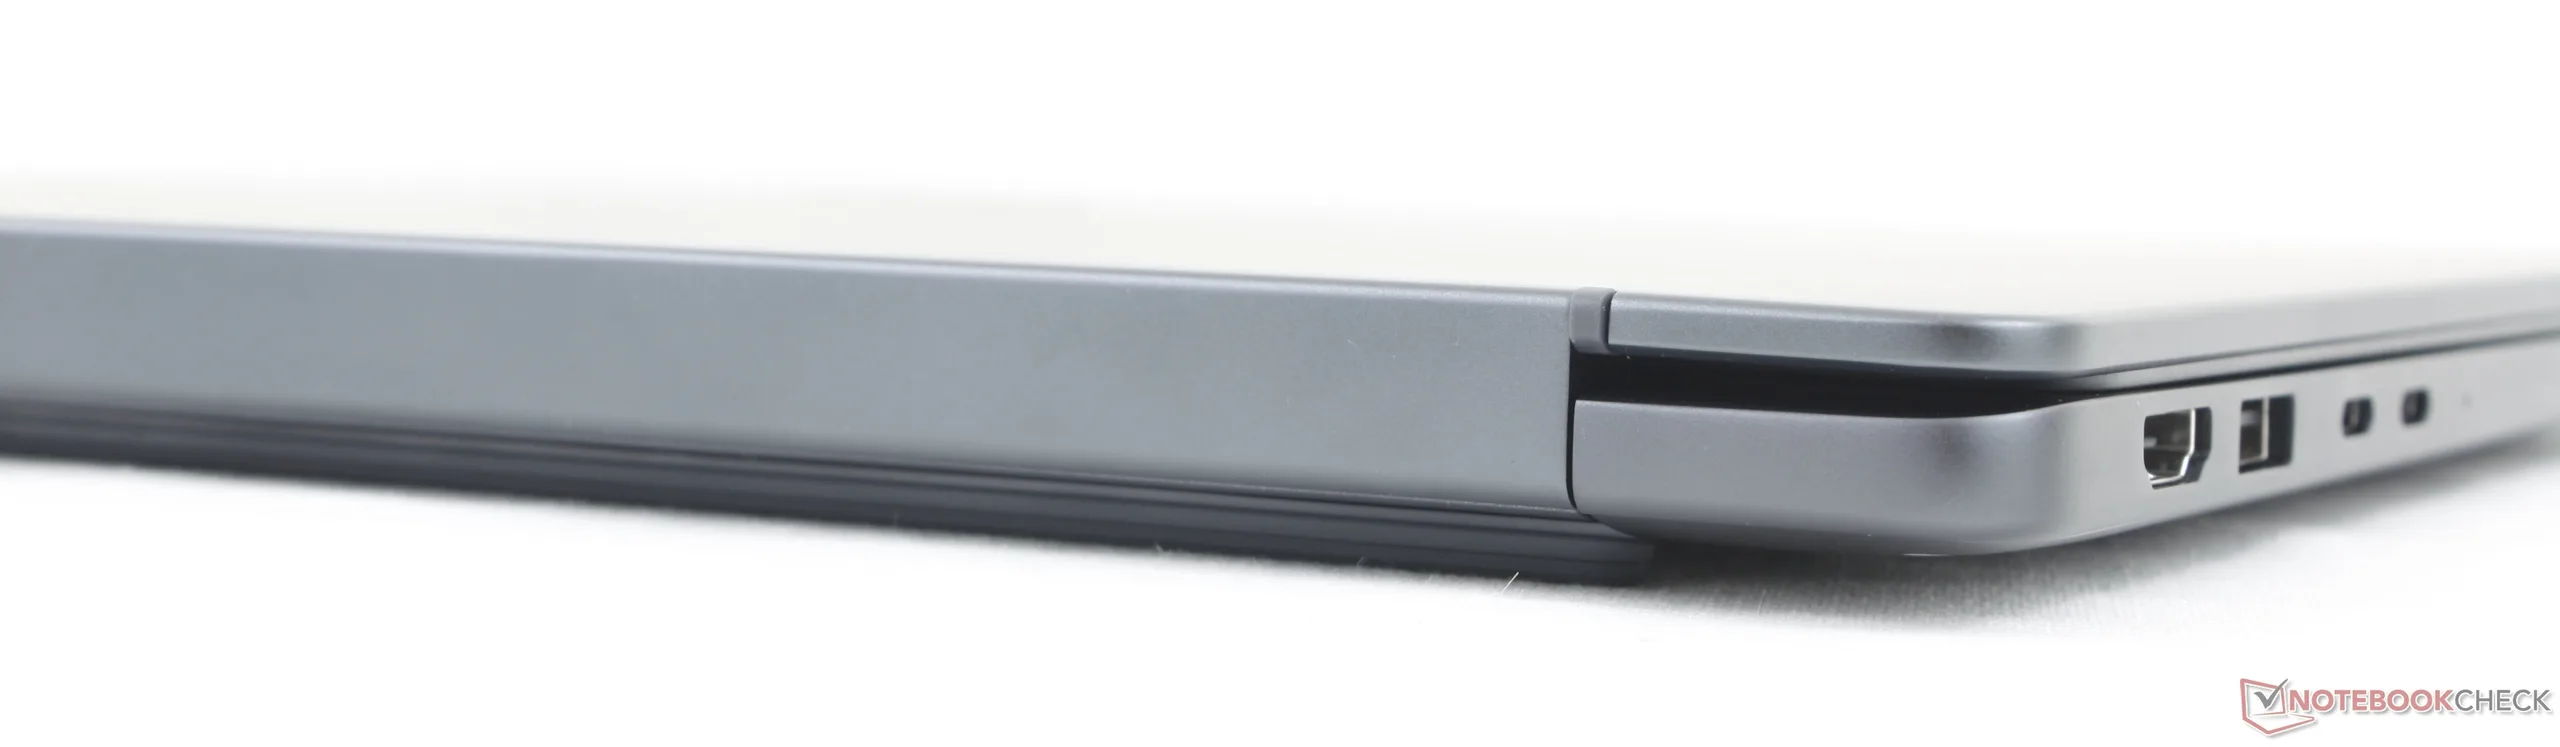
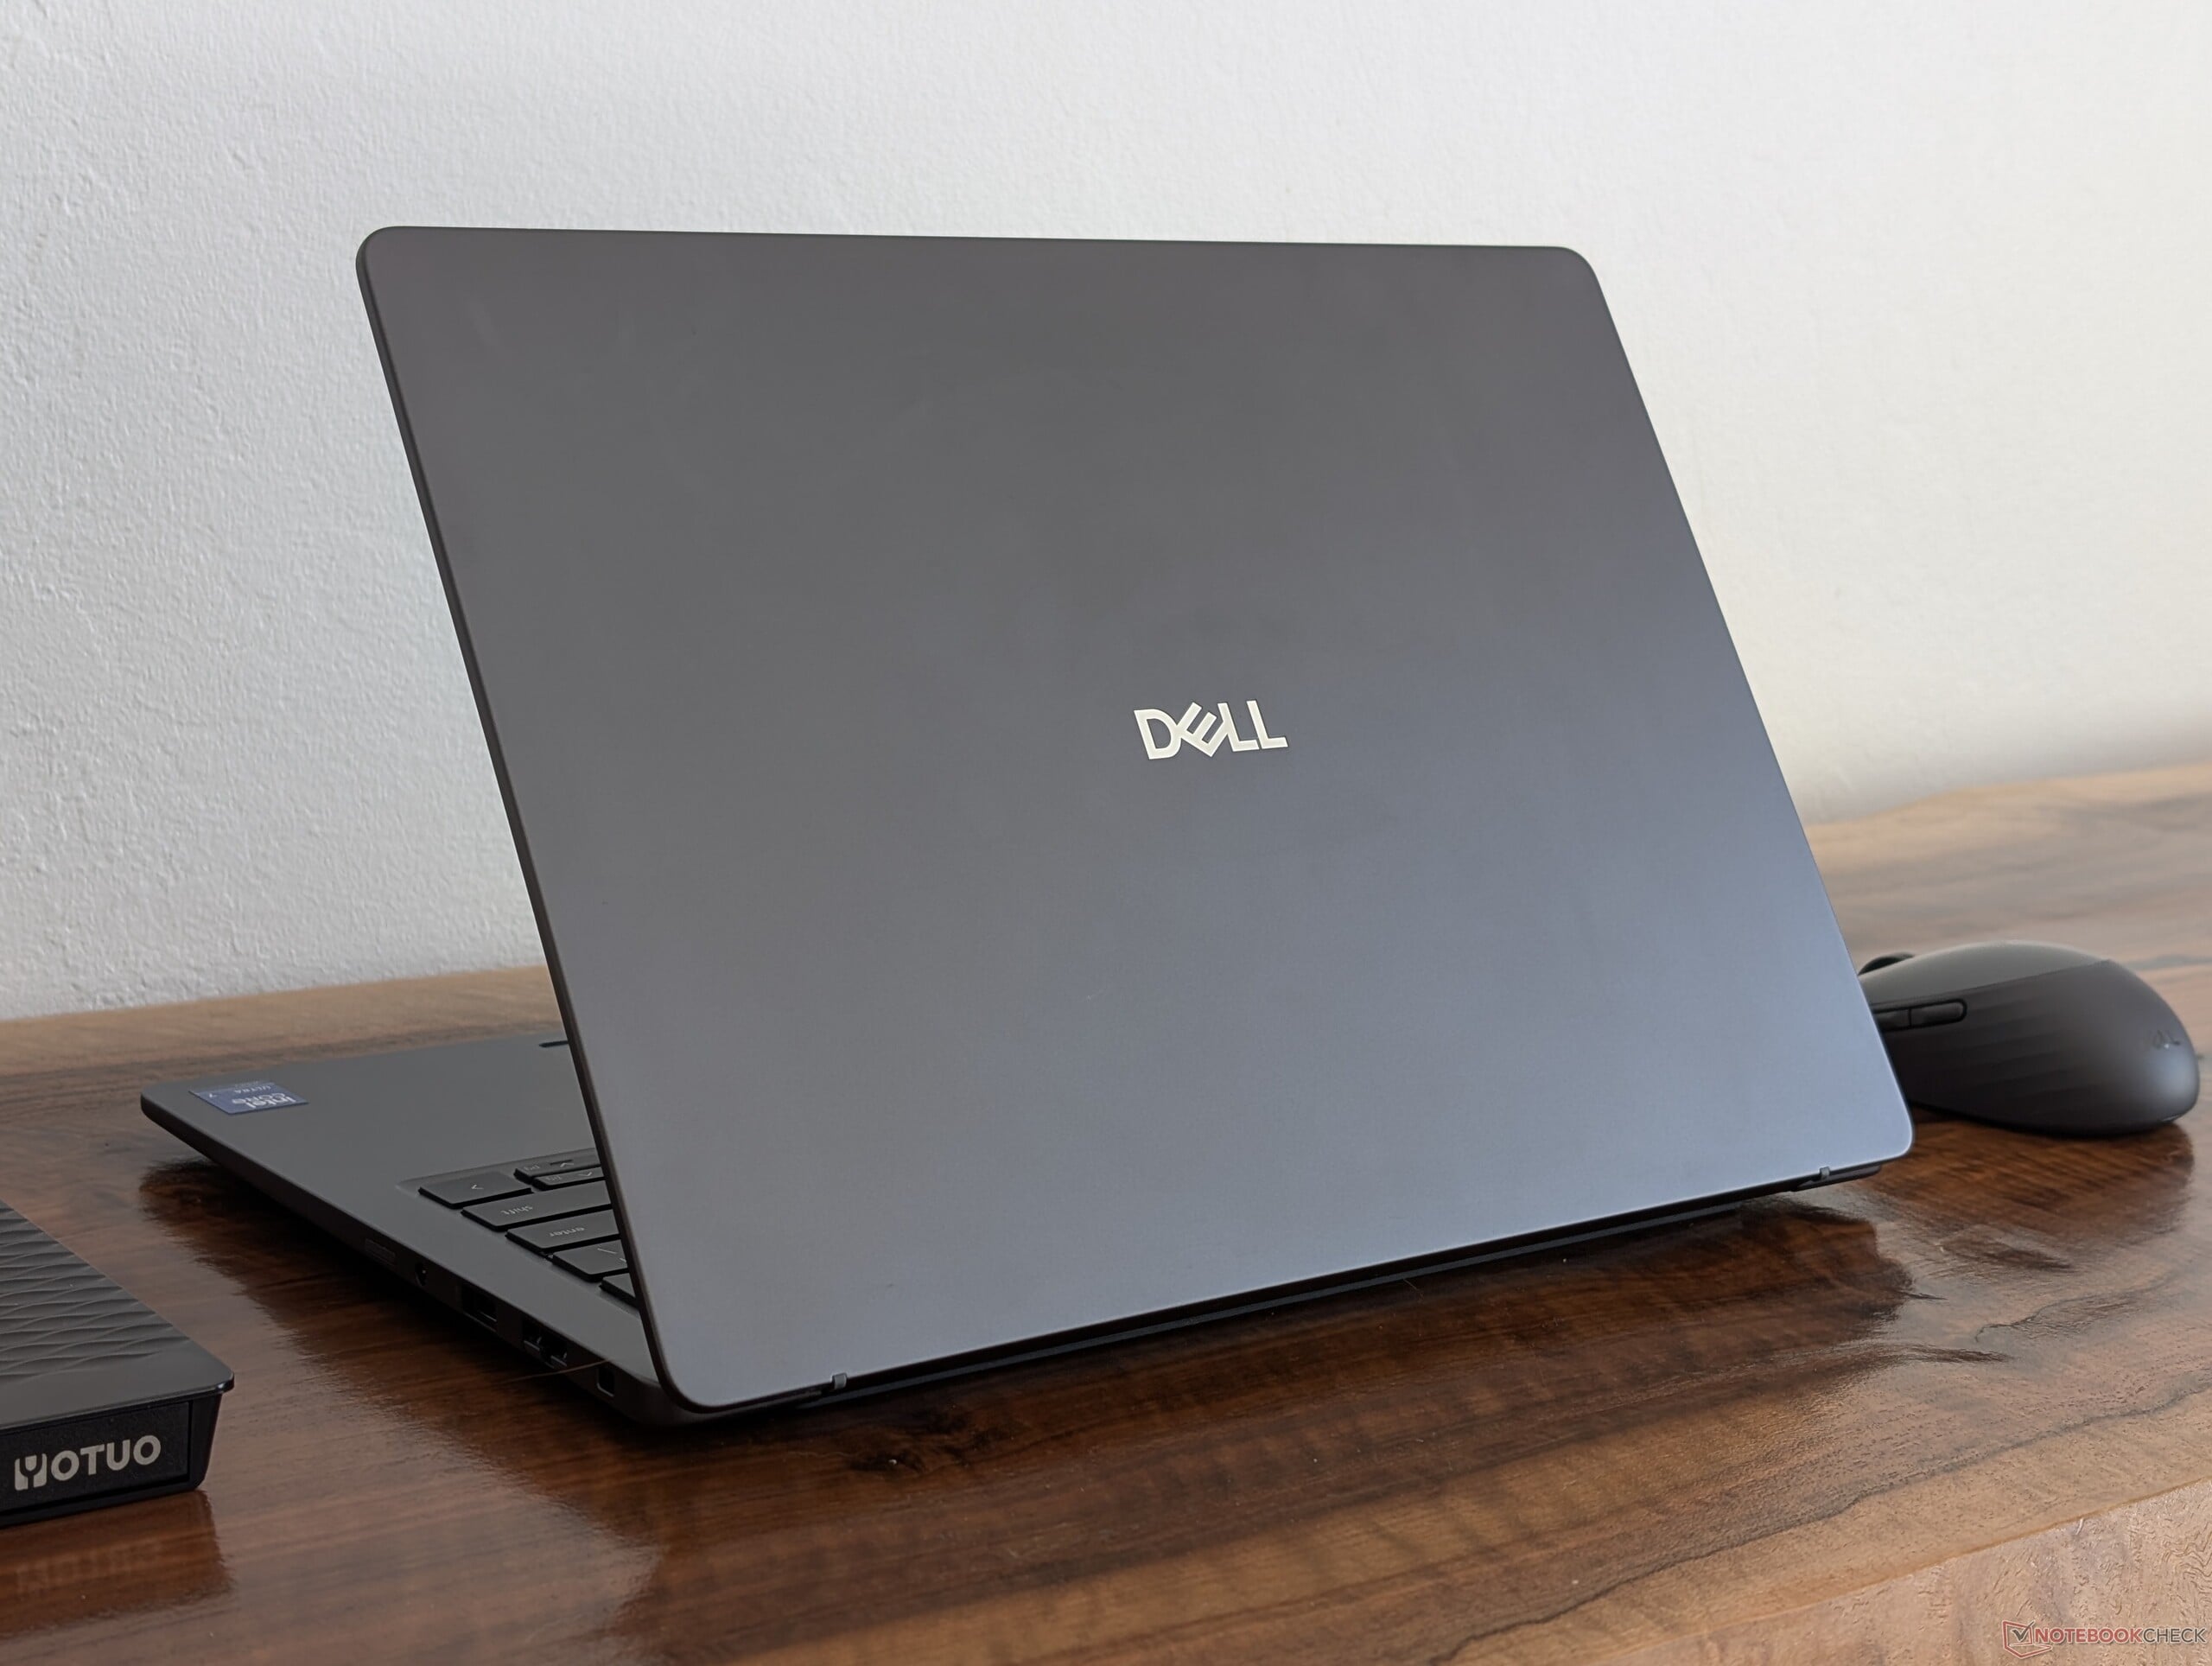
O chassi é praticamente idêntico ao do Dell Pro 7 14 em termos de materiais, textura, tamanho e primeiras impressões. No entanto, a base do Dell Pro 5 14 pode ser configurada com alumínio anodizado ou compósito de fibra de vidro — sendo que este último é ligeiramente mais espesso (18,65 mm contra 18,1 mm). Recomendamos o alumínio anodizado, pois o perfil mais fino é mais perceptível do que a economia de peso muito leve (~10 g) associada à fibra de vidro.
Comparação de tamanhos

315.5 mm 226 mm 18.1 mm 1.5 kg315.5 mm 226 mm 14.73 mm 1.4 kg313 mm 219.4 mm 15.9 mm 1.2 kg310.9 mm 212.8 mm 15.9 mm 1.1 kg312.3 mm 223.8 mm 11.6 mm 1.2 kg311.1 mm 215.6 mm 10.7 mm 1.3 kg297 mm 210 mm 1 mm 5.7 g

Conectividade

Parte frontal: Sem portas
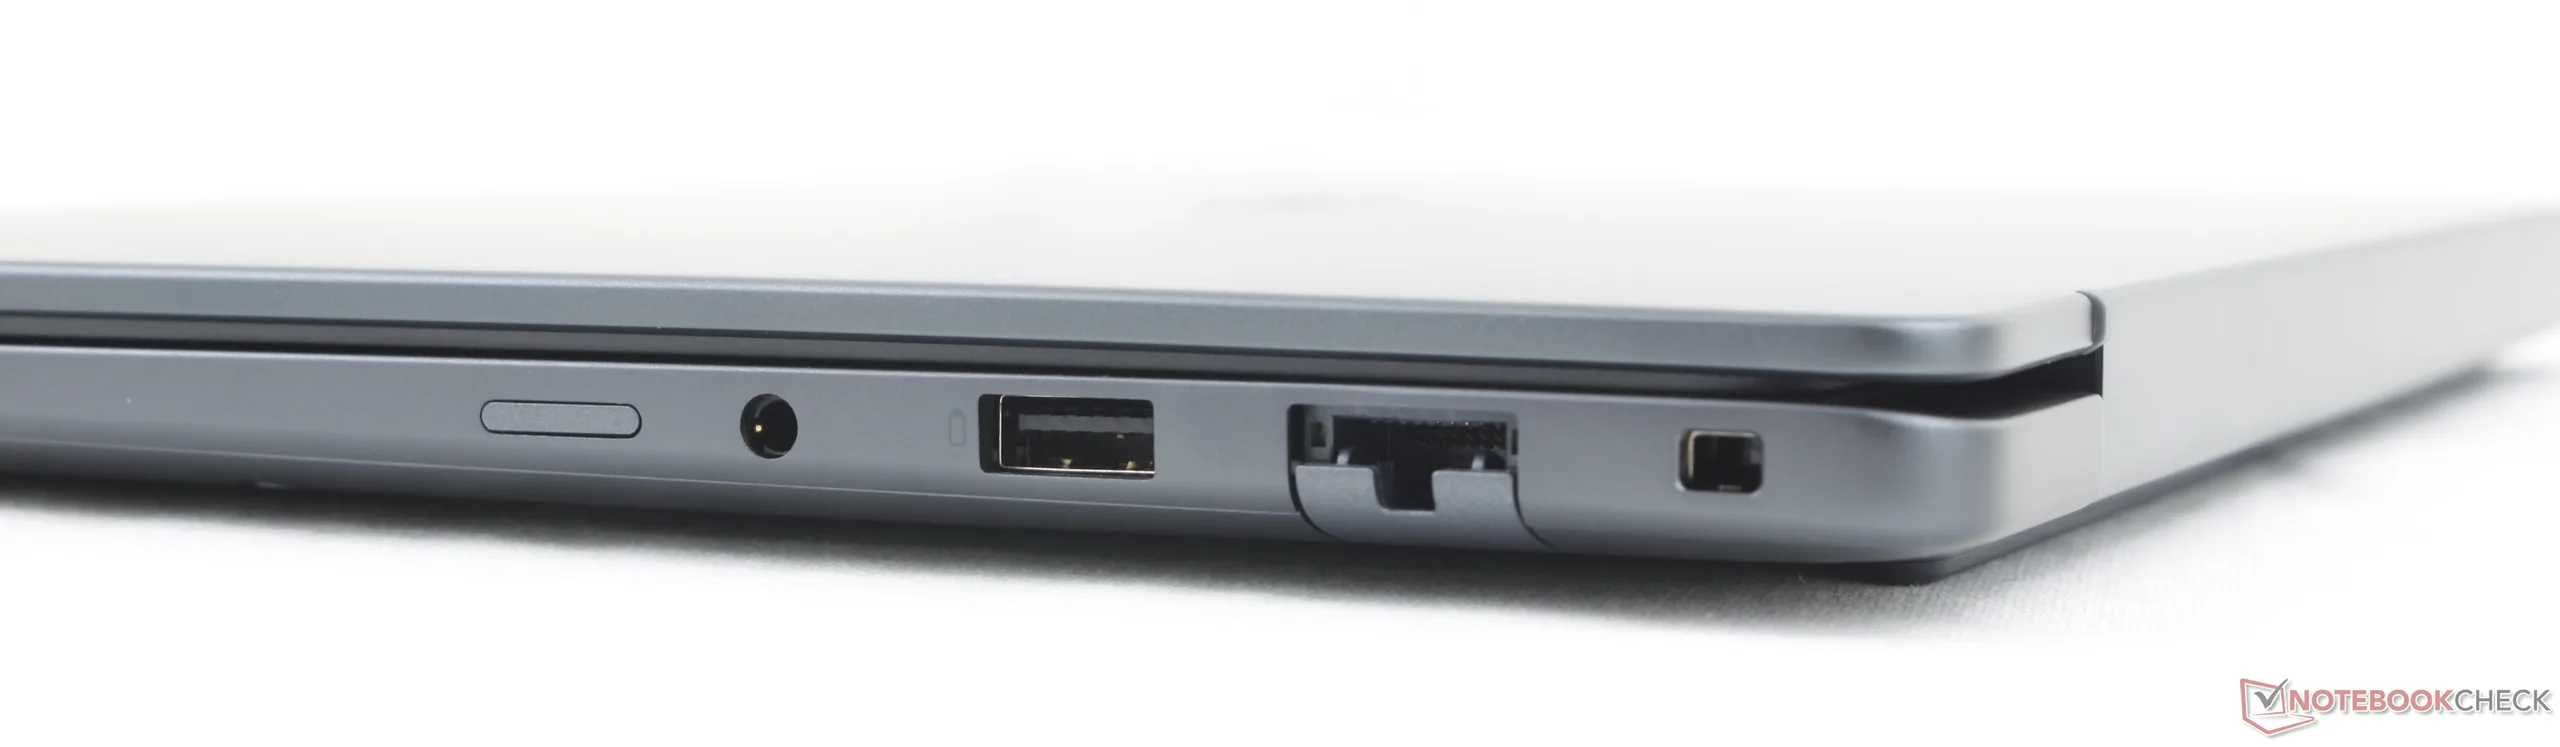
Certo: slot para Nano-SIM (opcional), entrada para fone de ouvido de 3,5 mm, USB-A 3.2 Gen. 1 (5 Gbps), RJ-45 (1 Gbps), Noble lock
Parte traseira: Sem portas
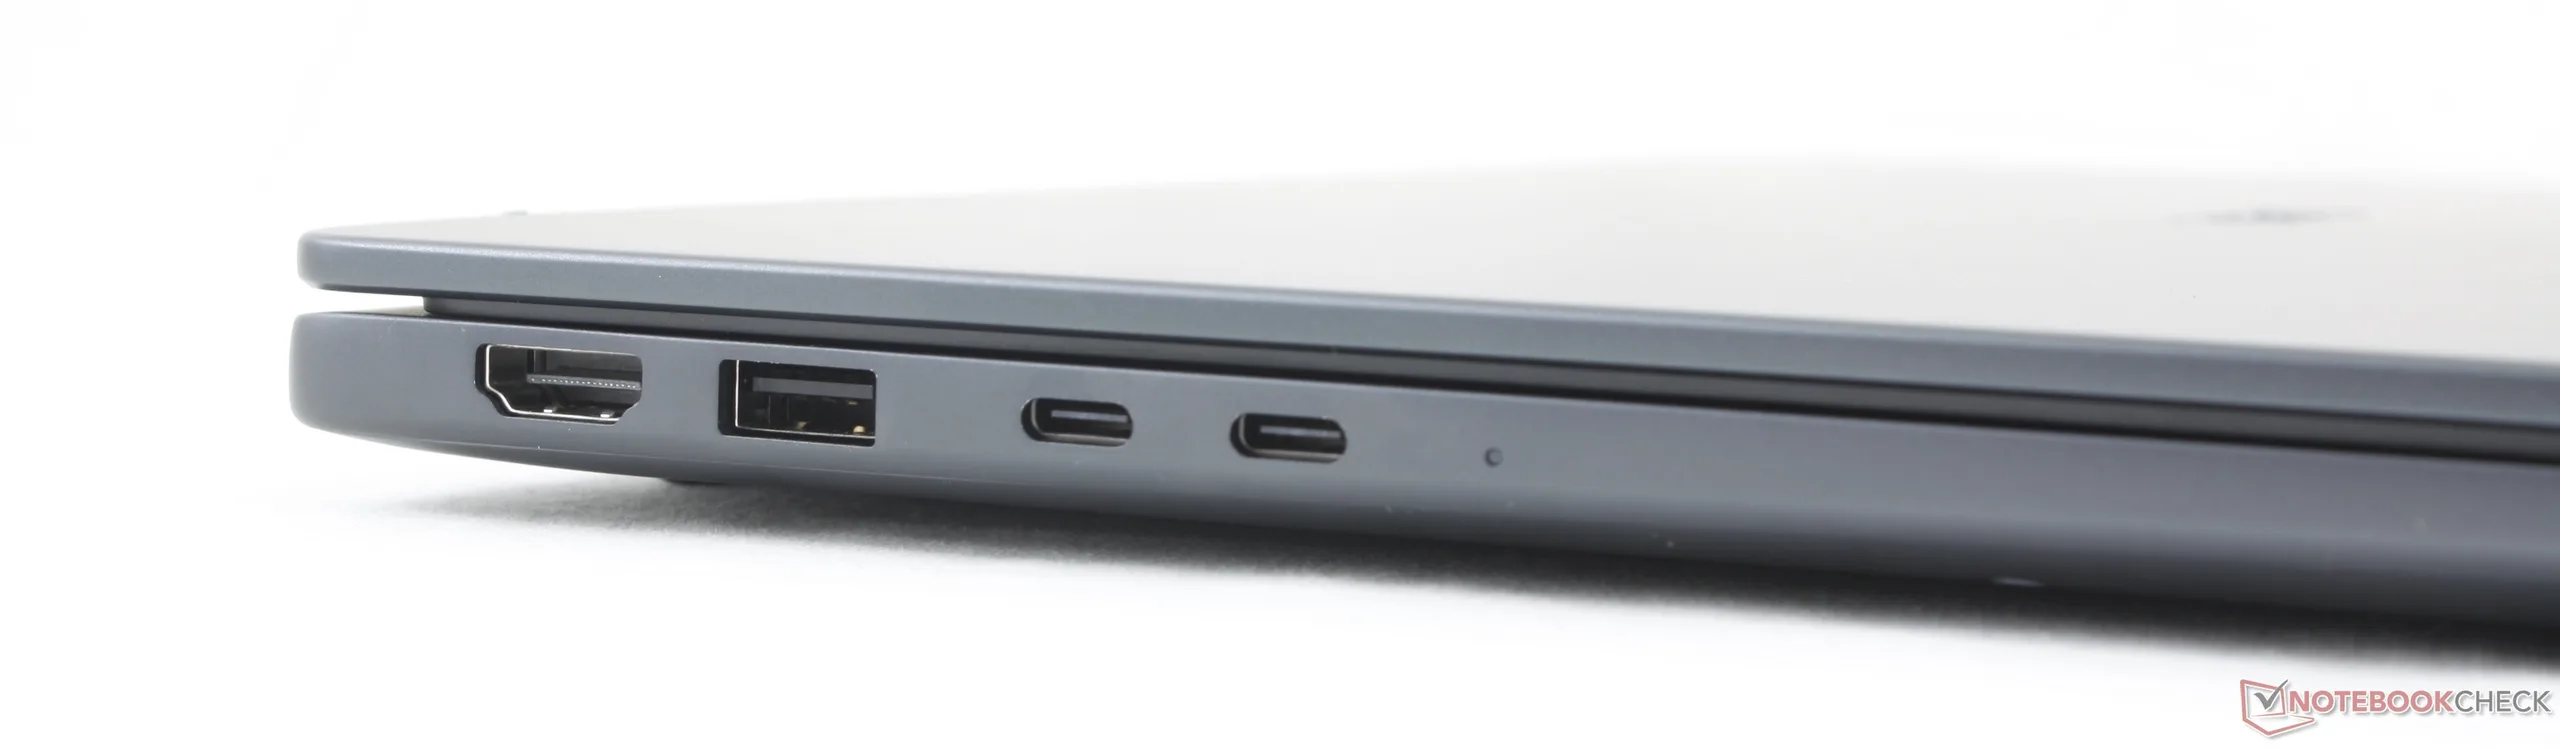
Esquerda: HDMI 2.1, USB-A 3.2 Gen. 1 (5 Gbps), 2x USB-C Thunderbolt 4 com DisplayPort 2.1 + Power Delivery (100 W)

Comunicação

Networking
iperf3 transmit Wi-Fi6/7 RT-BE96U
Lenovo ThinkPad T14s Gen 7 21YW0022GE
Mediatek Wi-Fi 7 MT7925 Wireless LAN Card
1723 (1533min - 1812max) MBit/s
iperf3 receive Wi-Fi6/7 RT-BE96U
Lenovo ThinkPad T14s Gen 7 21YW0022GE
Mediatek Wi-Fi 7 MT7925 Wireless LAN Card
1957 (1880min - 2007max) MBit/s
iperf3 receive AXE11000 6GHz
HP OmniBook Ultra 14 Core Ultra X9
Intel Wi-Fi 7 BE211 320MHz
1702 (1671min - 1731max) MBit/s +4%
Dell Pro 5 14 P514260
Intel Wi-Fi 7 BE211 320MHz
1631 (1610min - 1656max) MBit/s
Asus ExpertBook Ultra B9406CAA
Intel Wi-Fi 7 BE211 320MHz
1621 (1600min - 1650max) MBit/s -1%
Dell Pro 7 14 P714260
Intel Wi-Fi 7 BE211 320MHz
1534 (1508min - 1572max) MBit/s -6%
iperf3 transmit AXE11000 6GHz
Dell Pro 5 14 P514260
Intel Wi-Fi 7 BE211 320MHz
1662 (1480min - 1849max) MBit/s
Dell Pro 7 14 P714260
Intel Wi-Fi 7 BE211 320MHz
1657 (1413min - 1902max) MBit/s 0%
HP OmniBook Ultra 14 Core Ultra X9
Intel Wi-Fi 7 BE211 320MHz
1626 (1572min - 1670max) MBit/s -2%
Asus ExpertBook Ultra B9406CAA
Intel Wi-Fi 7 BE211 320MHz
1625 (848min - 1675max) MBit/s -2%
0100200300400500600700800900100011001200130014001500160017001800Tooltip
Dell Pro 5 14 P514260; iperf3 receive AXE11000 6GHz; iperf 3.1.3: Ø1630 (1610-1656) MBit/s
Dell Pro 5 14 P514260; iperf3 transmit AXE11000 6GHz; iperf 3.1.3: Ø1662 (1480-1849) MBit/s

Webcam

ColorChecker
6.4 ∆E
4.7 ∆E
17.5 ∆E
17.4 ∆E
14.8 ∆E
13 ∆E
5.9 ∆E
14.6 ∆E
15.1 ∆E
15.2 ∆E
15.8 ∆E
14.8 ∆E
8.9 ∆E
12.8 ∆E
17 ∆E
15.3 ∆E
16.7 ∆E
15.7 ∆E
8.9 ∆E
13.6 ∆E
19.4 ∆E
16.6 ∆E
19.8 ∆E
7.3 ∆E
ColorChecker Dell Pro 5 14 P514260: 13.63 ∆E min: 4.66 - max: 19.83 ∆E

Manutenção

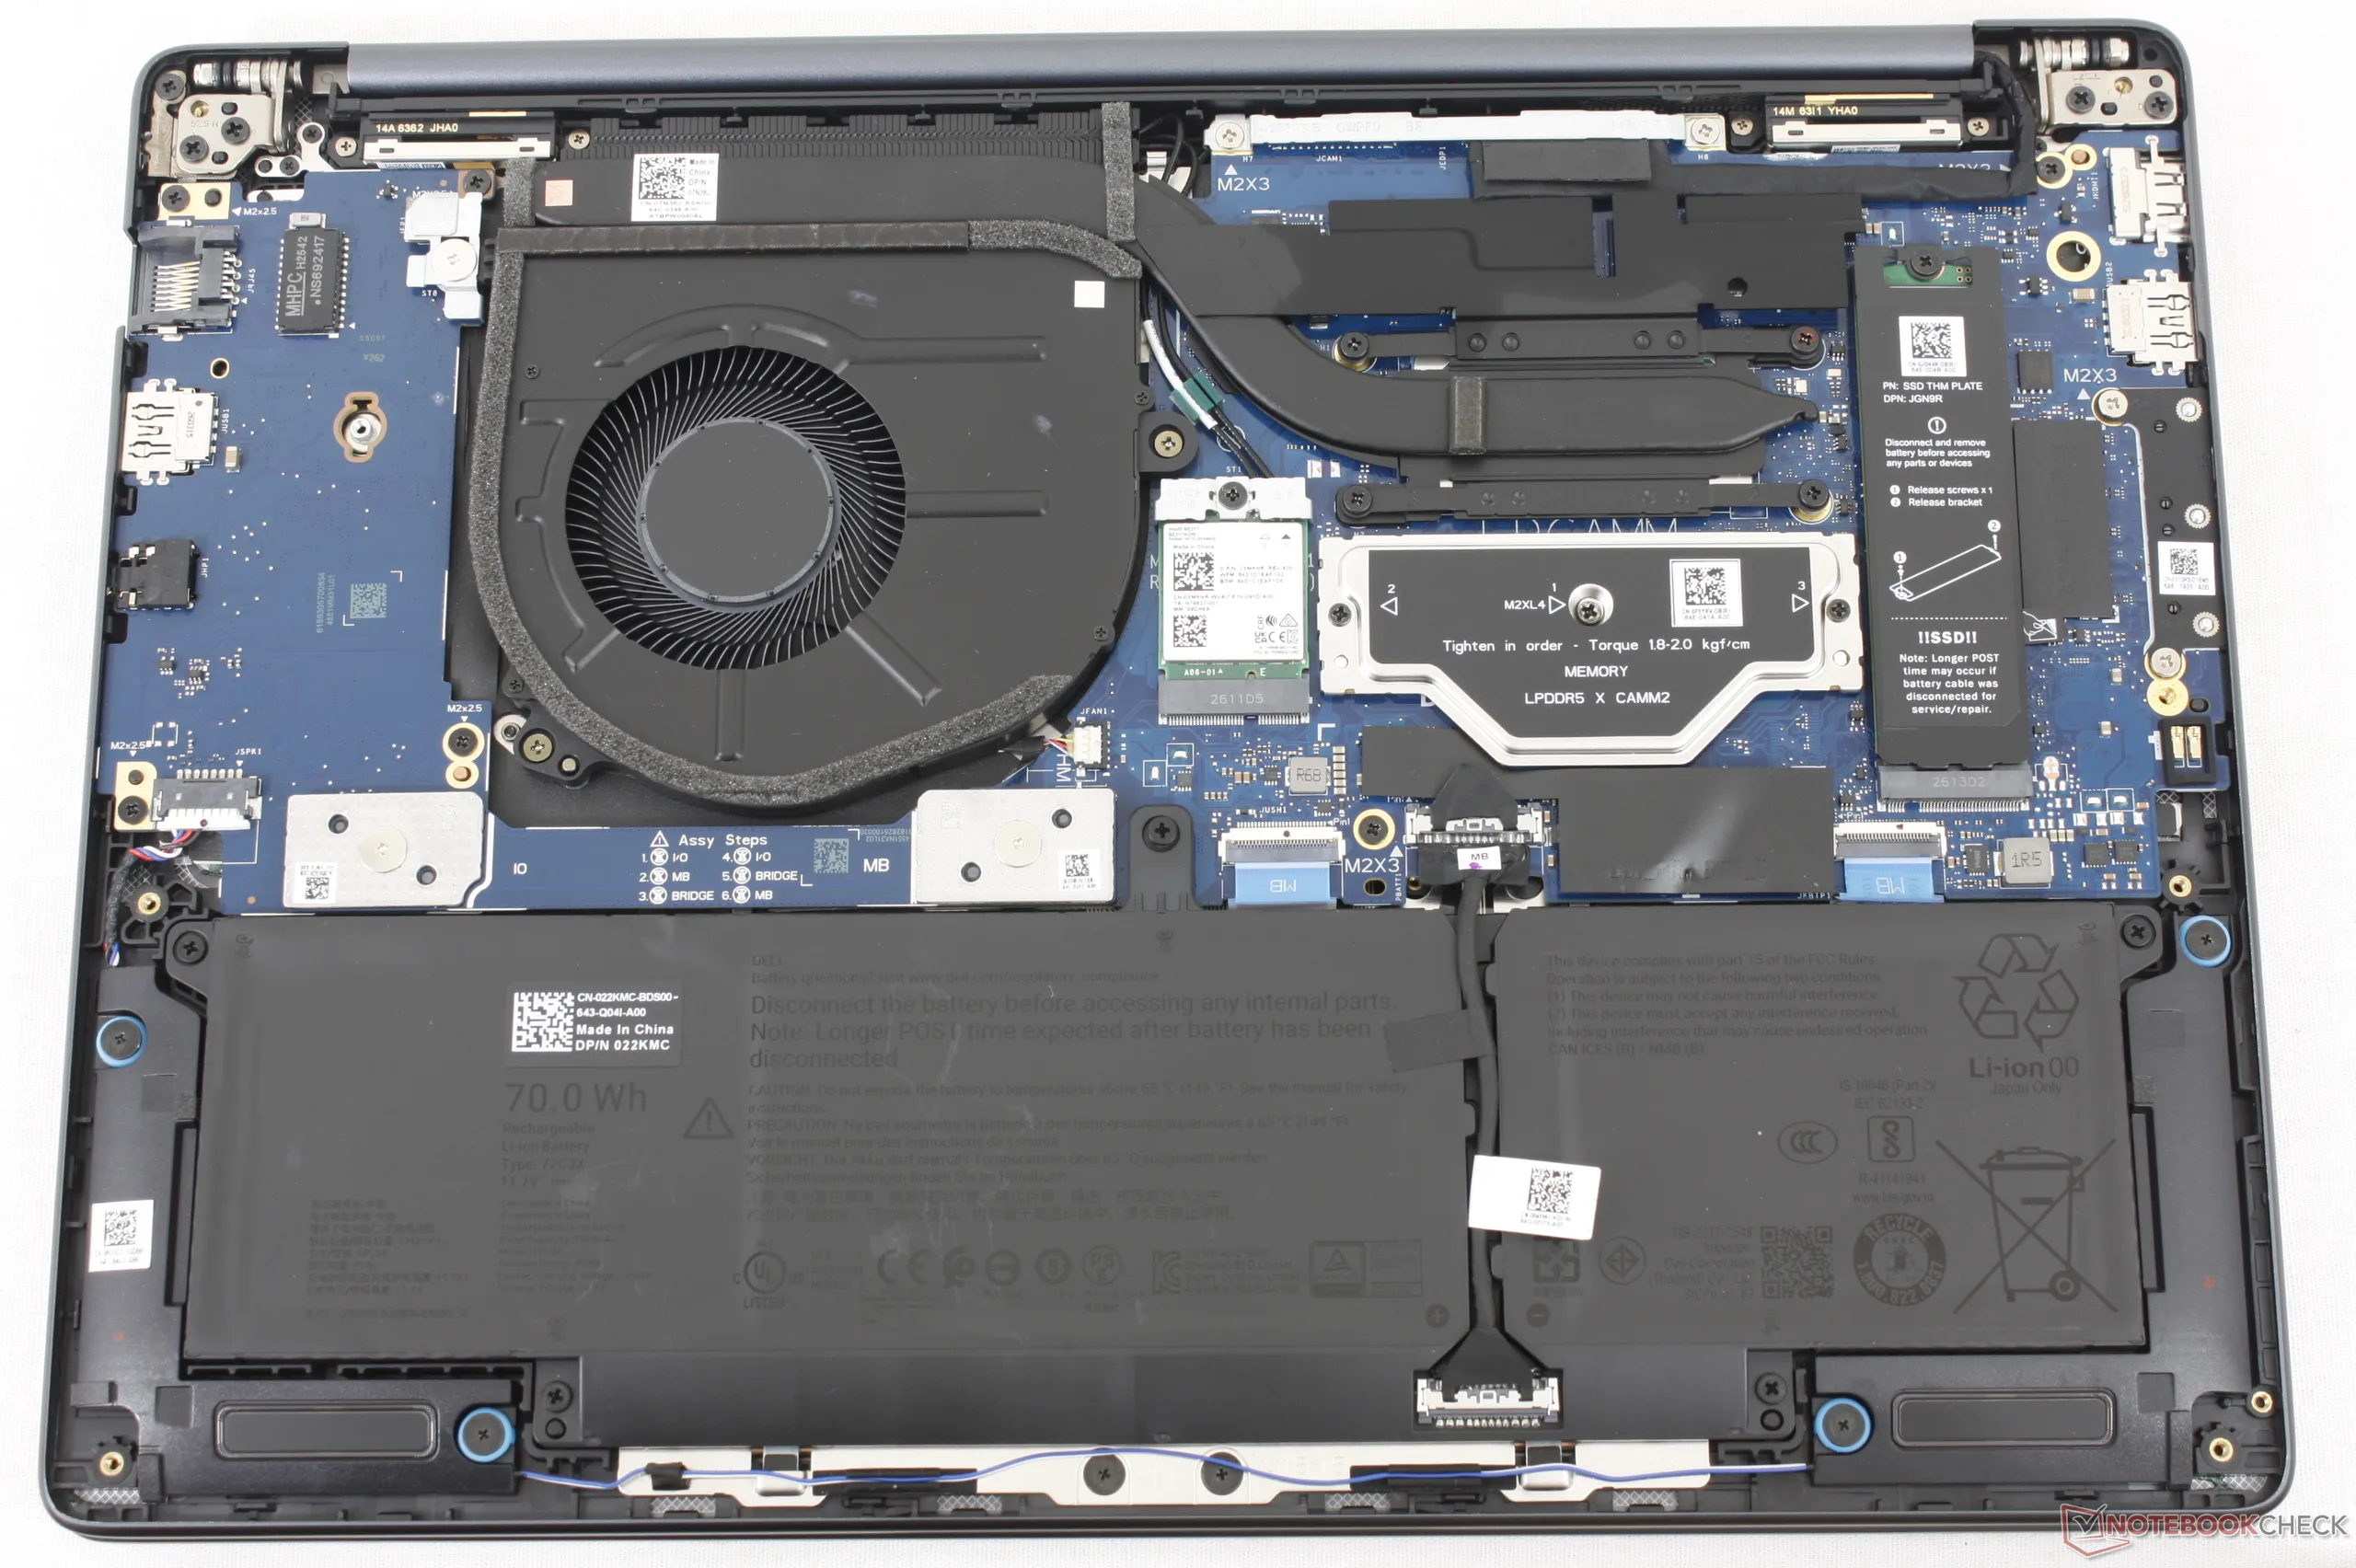
Placa-mãe do Dell Pro 5 14. Observe o slot LPCAMM2 para nossa configuração de teste
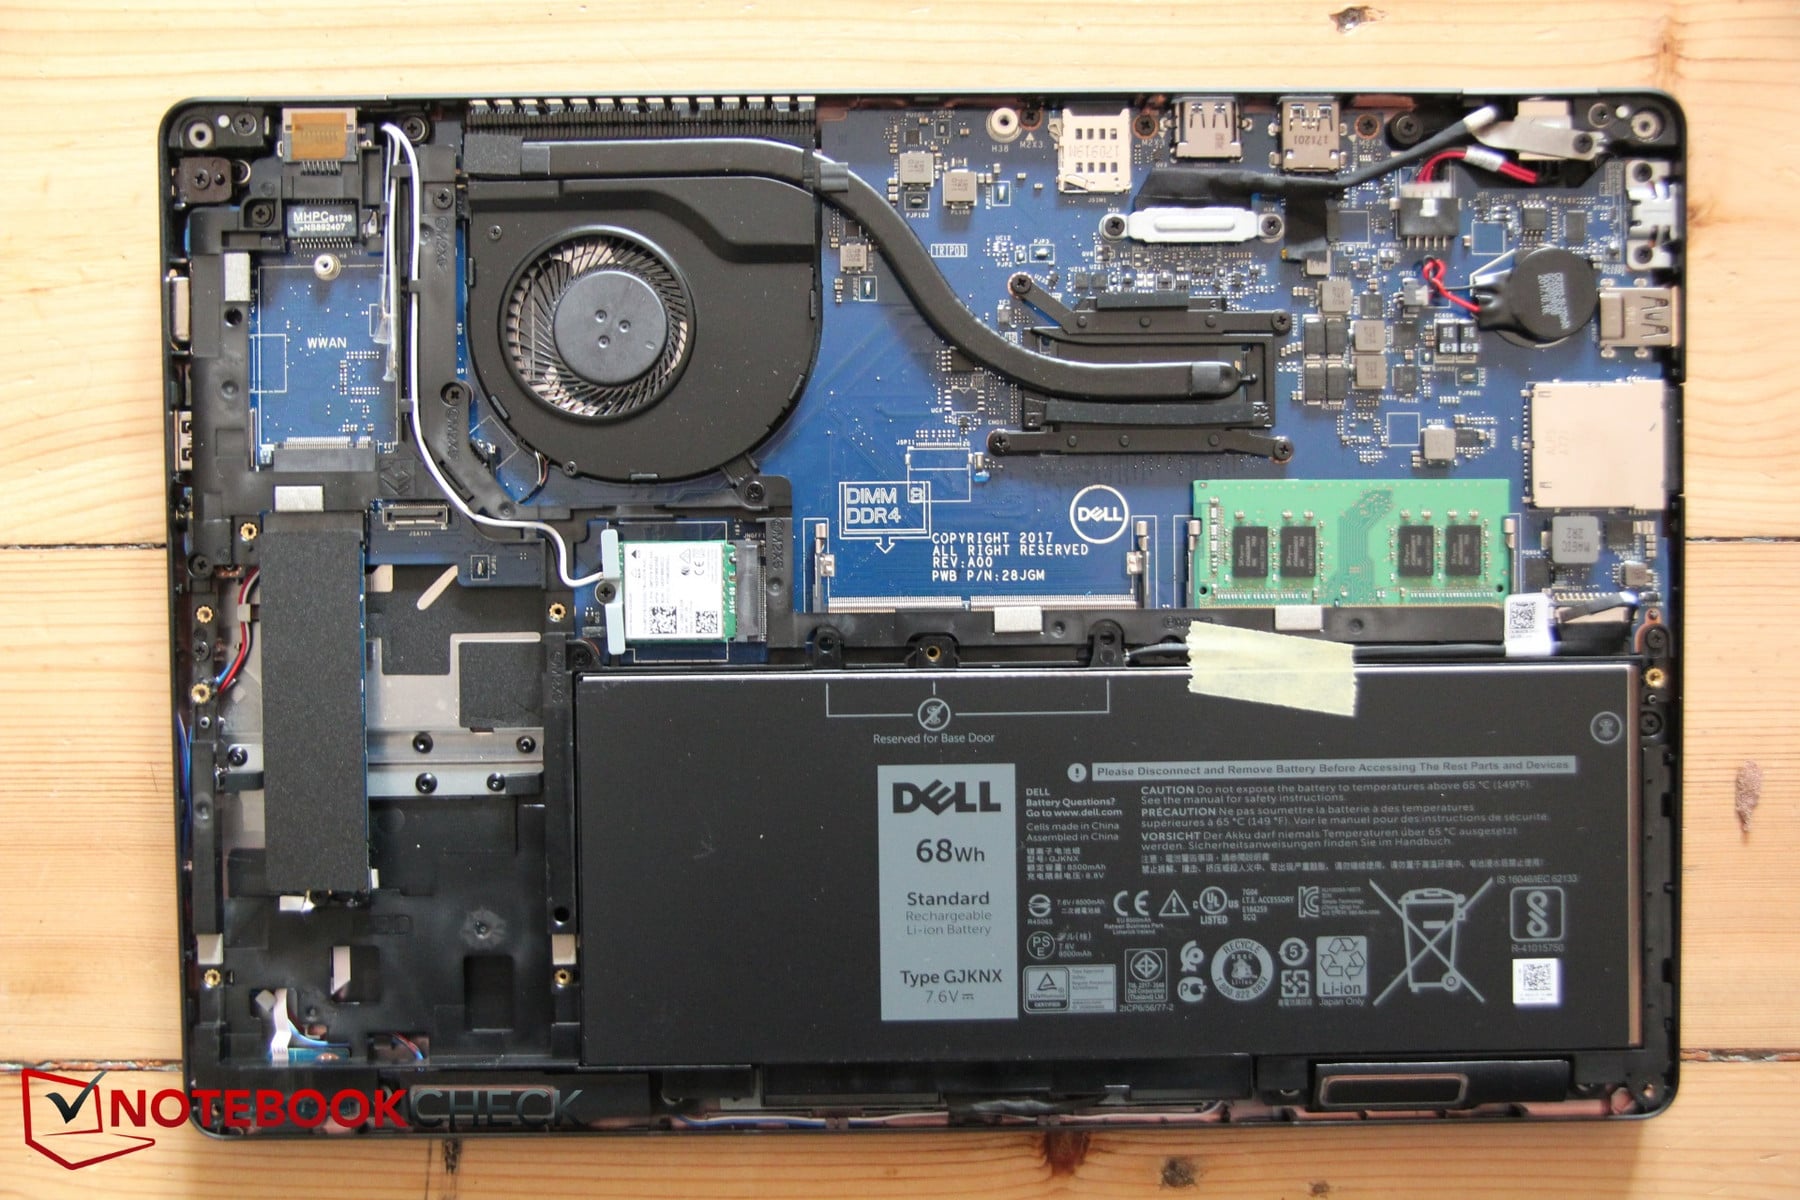
Dell Latitude 5490 para comparação

Sustentabilidade

O modelo é fabricado com aço reciclado, cobalto, plásticos recuperados do oceano e alumínio para a tampa externa, os apoios para as mãos e a tampa inferior, em diversas porcentagens. A embalagem não contém plástico e é totalmente reciclável.

Dispositivos de entrada
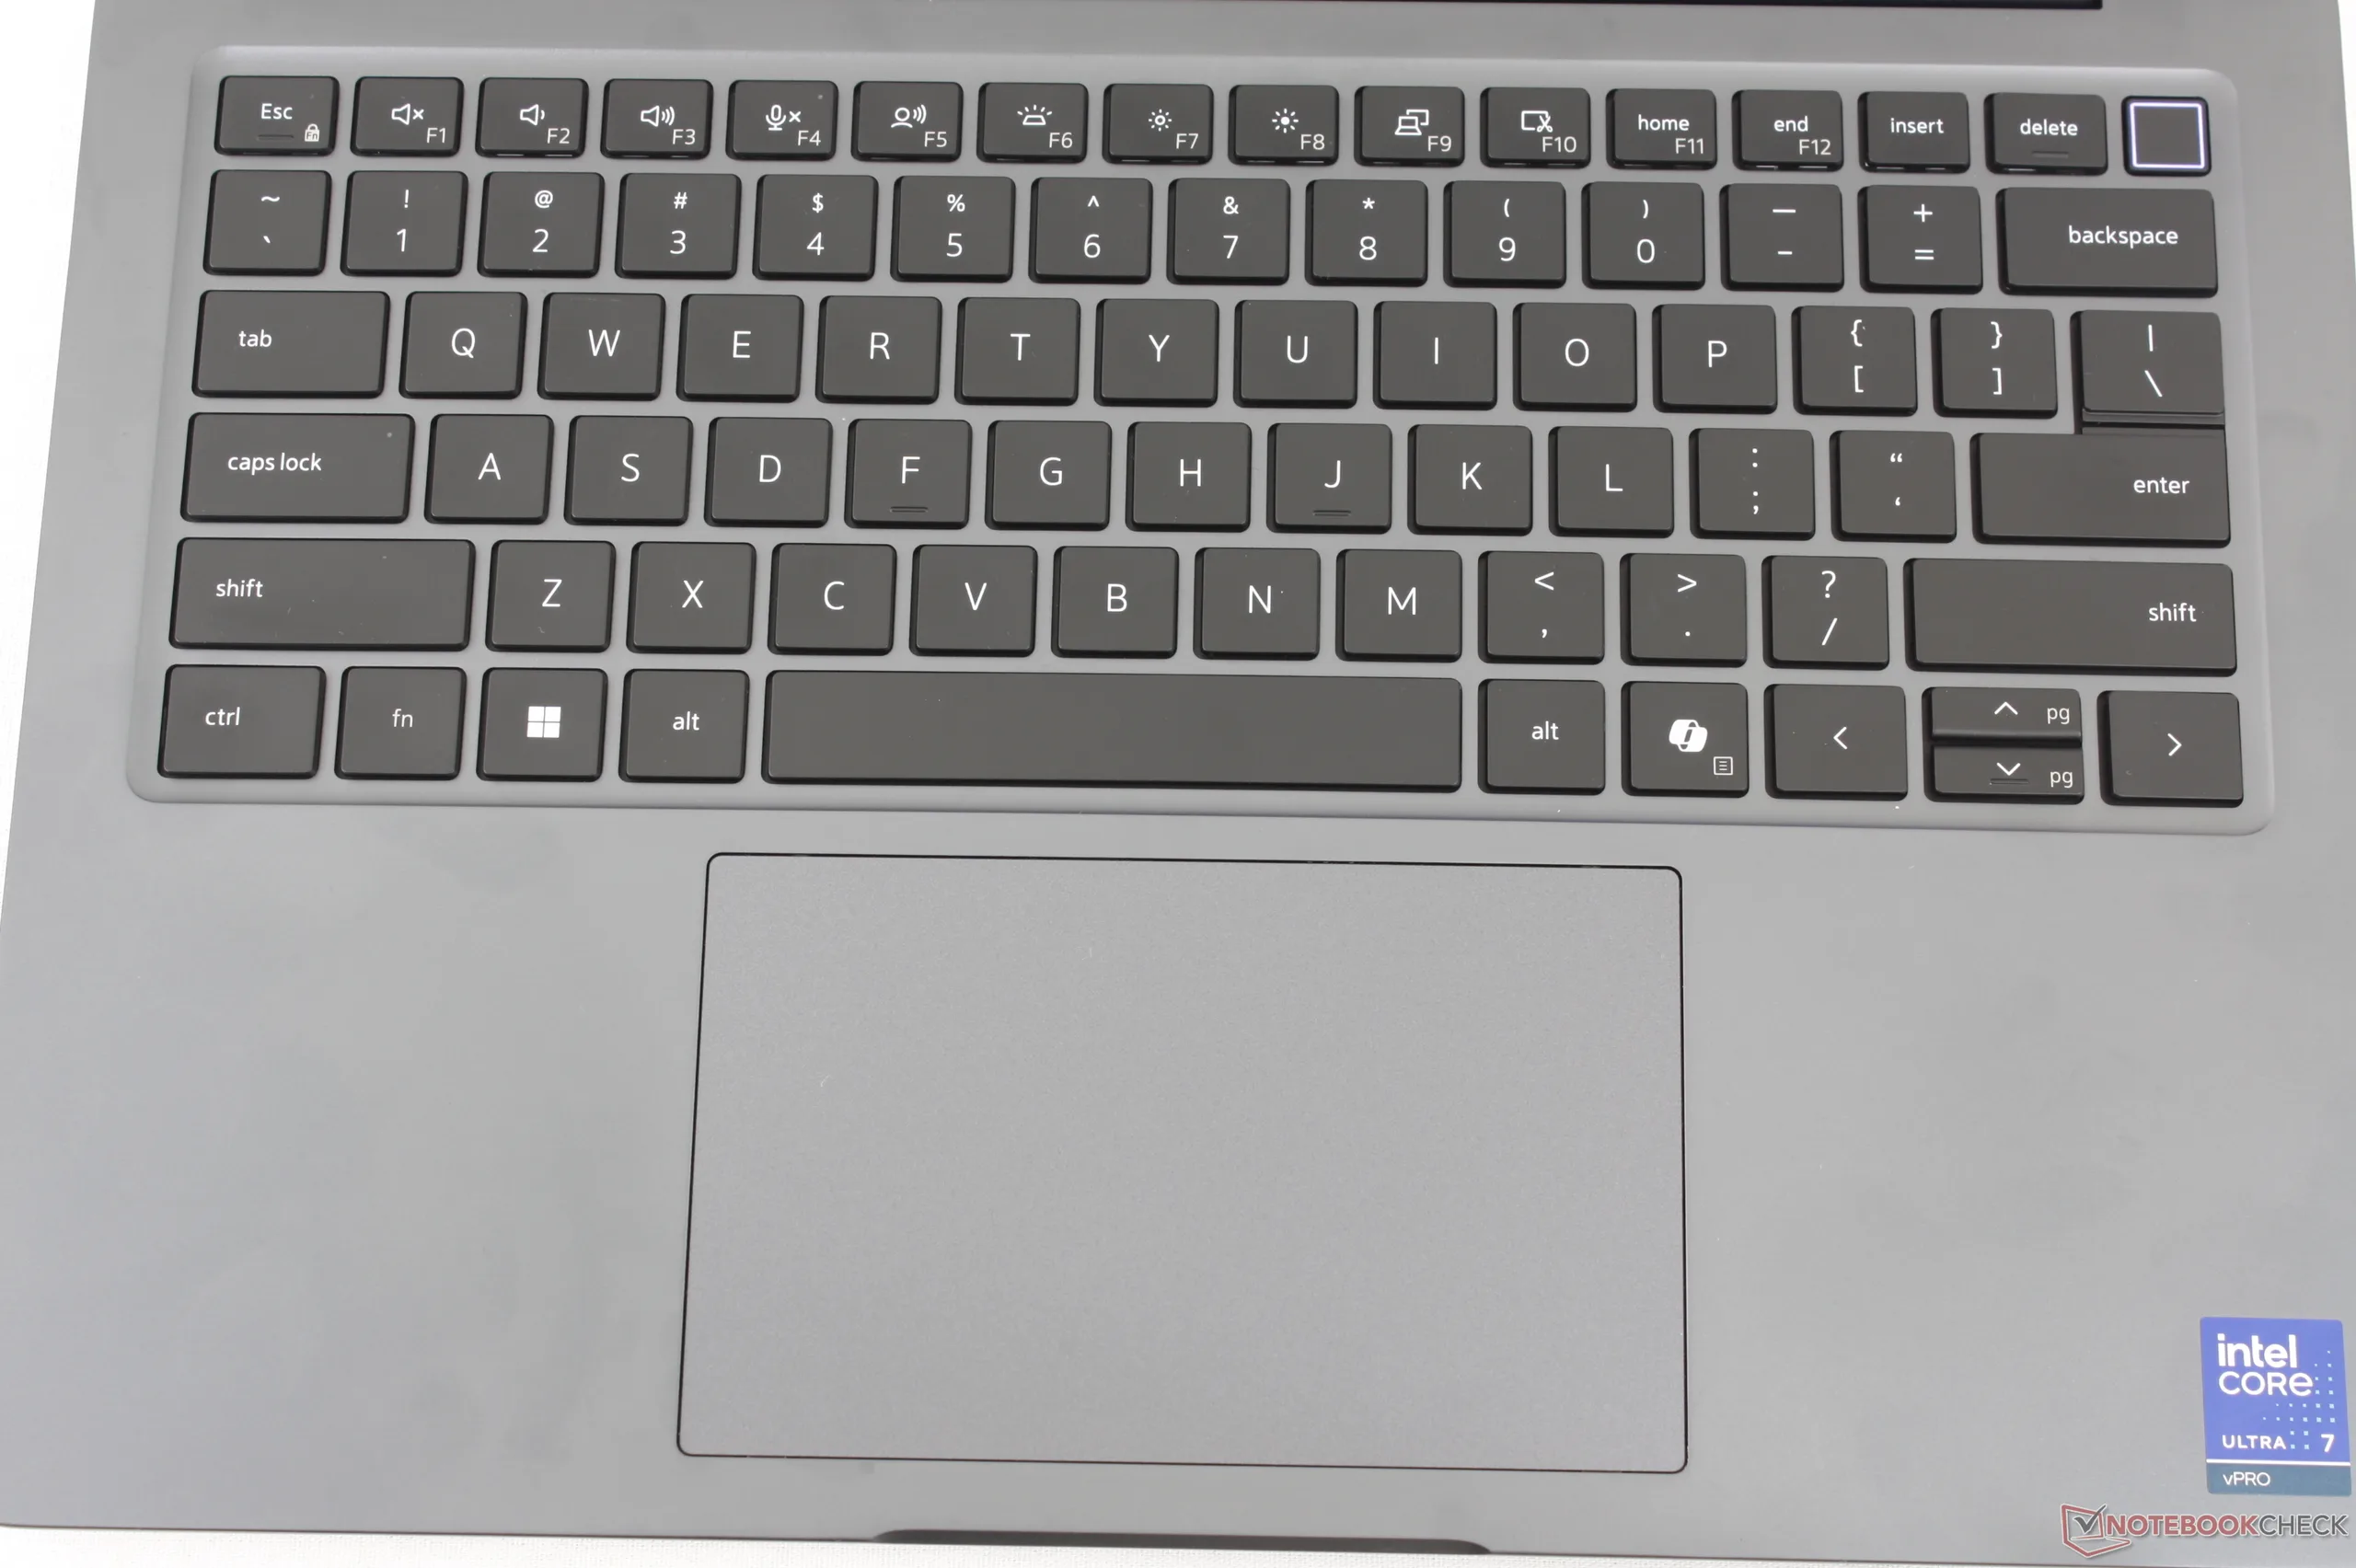
Teclado e touchpad idênticos aos encontrados na série Dell Pro 7 14, mais cara

Exibição

Há um total de sete opções de tela disponíveis, todas elas IPS, exceto por uma única opção FHD OLED. Não há opções de tela sensível ao toque ou HDR, o que é típico de muitos notebooks clamshell voltados para negócios.

Apenas uma das opções suporta uma taxa de atualização de 1 Hz para economia adicional de energia, já que todas as outras têm uma taxa mínima de apenas 60 Hz ou 48 Hz.

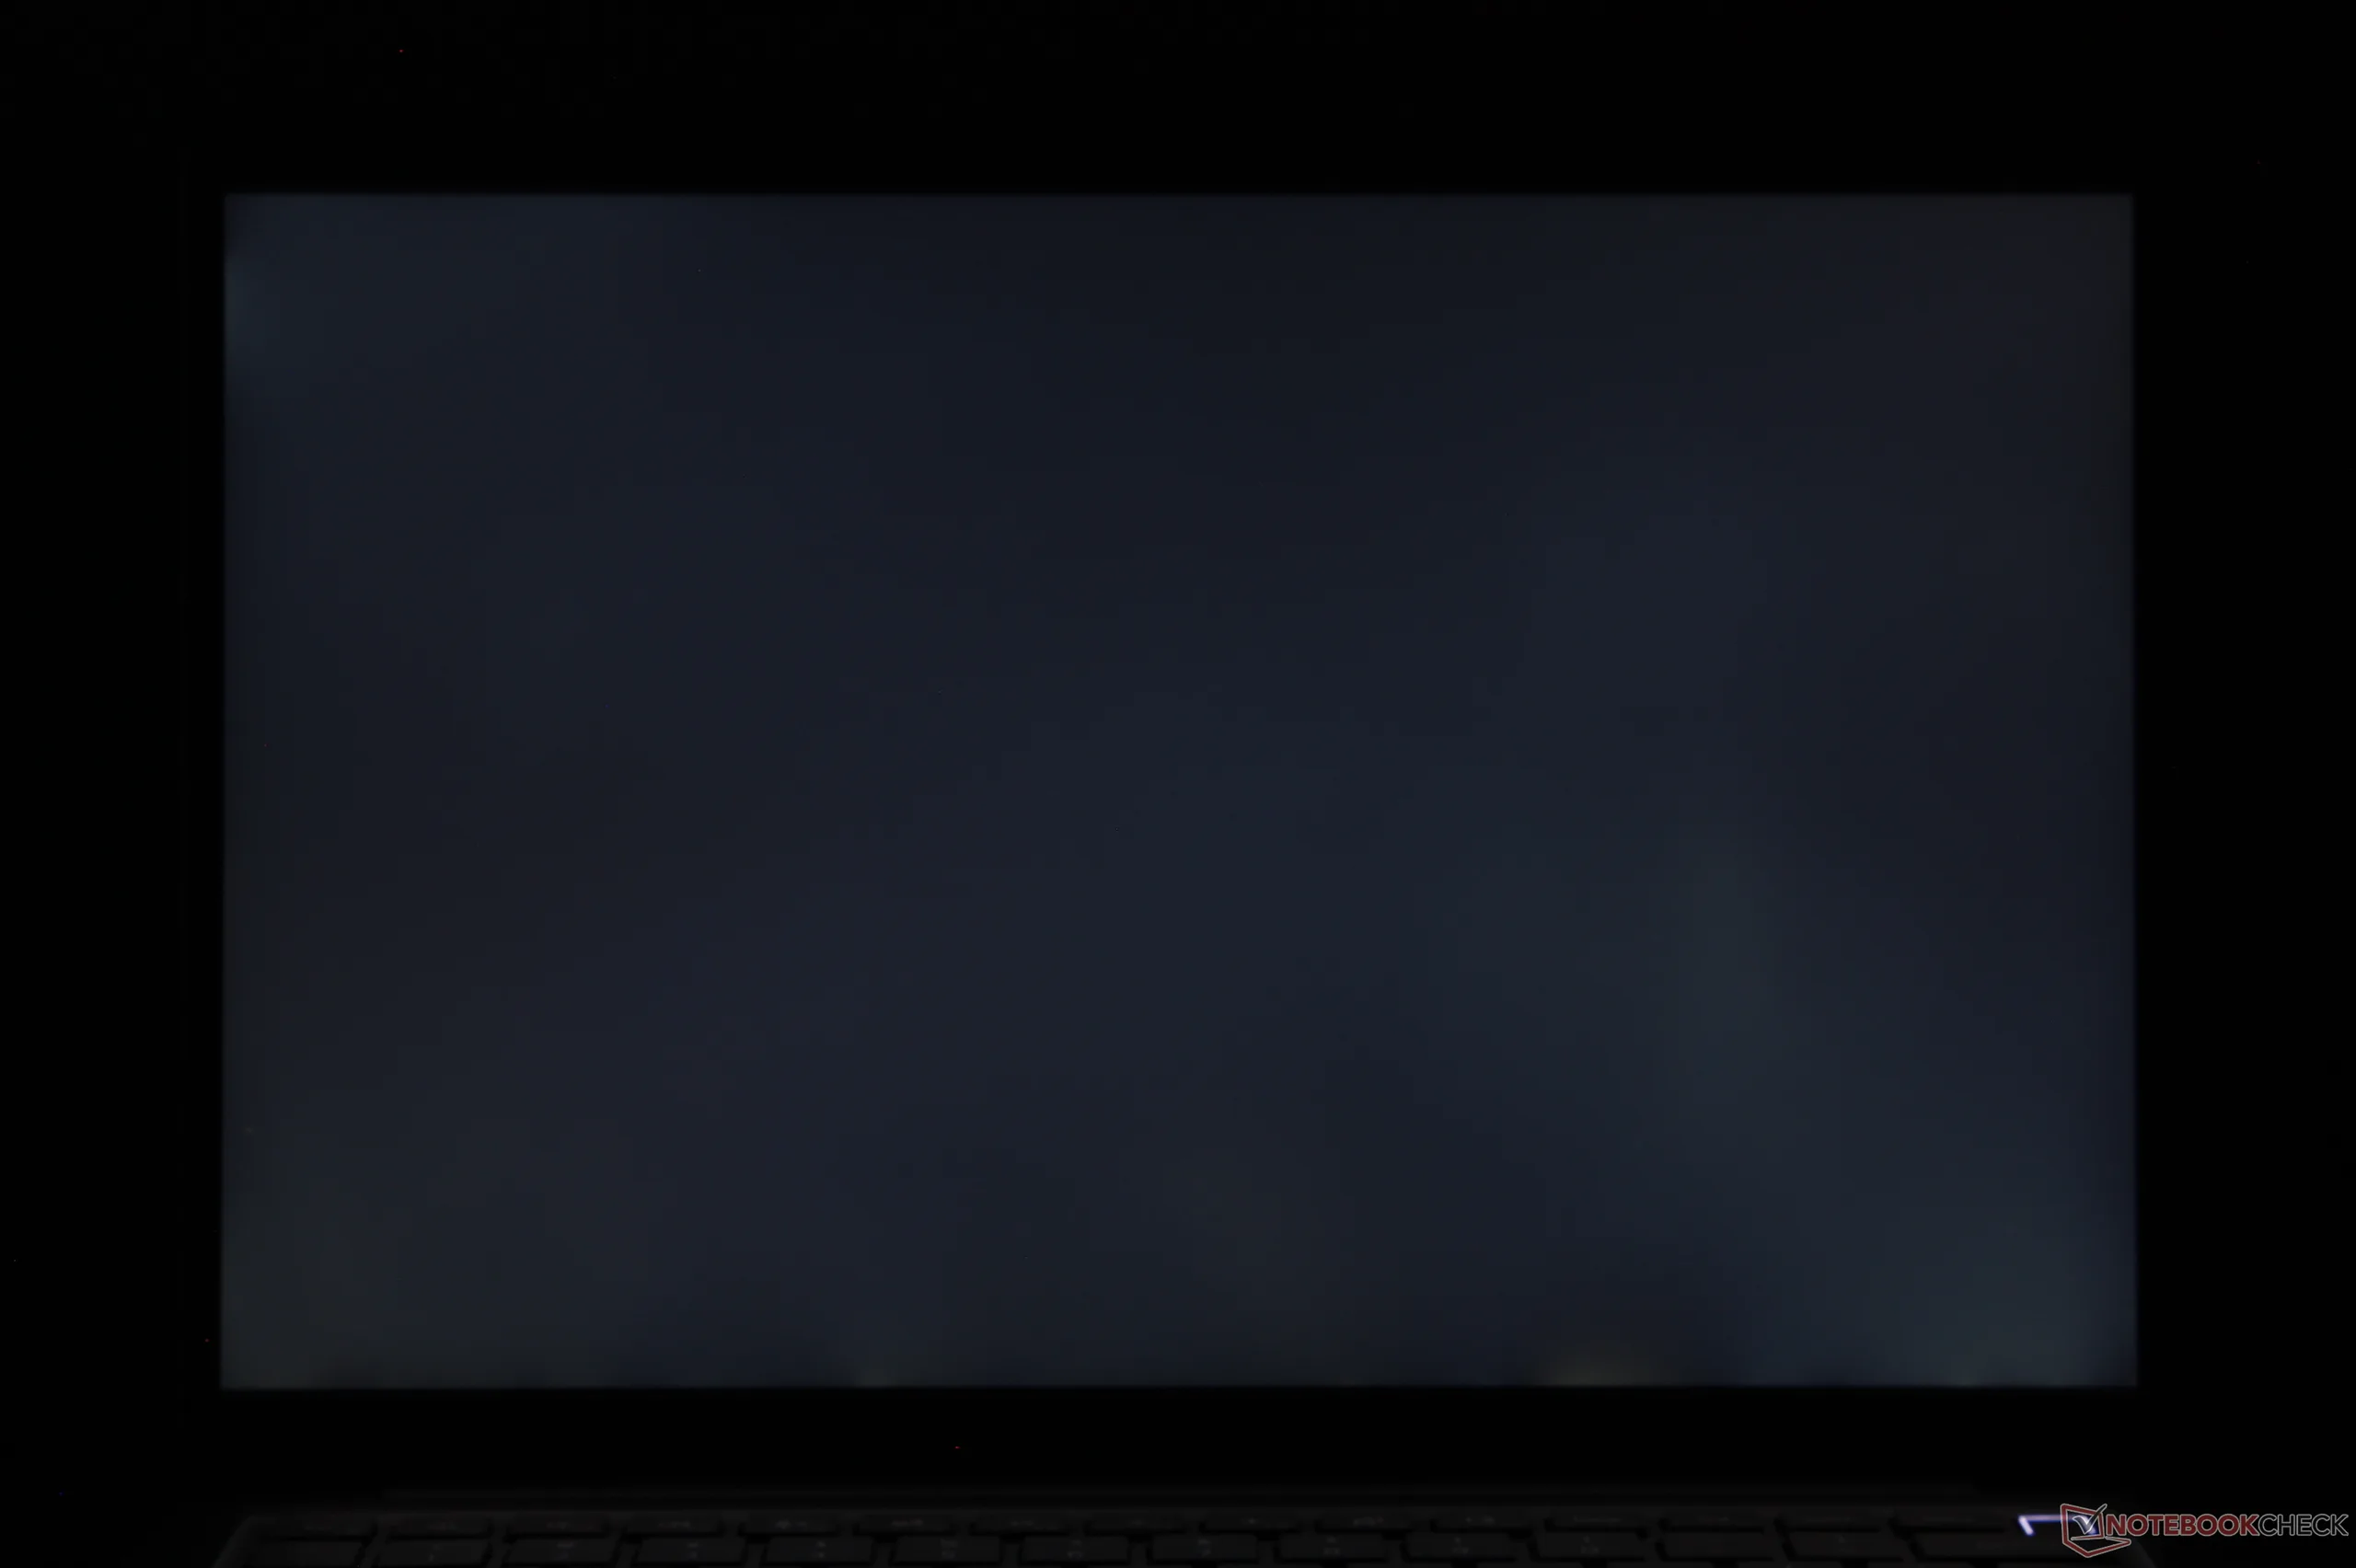
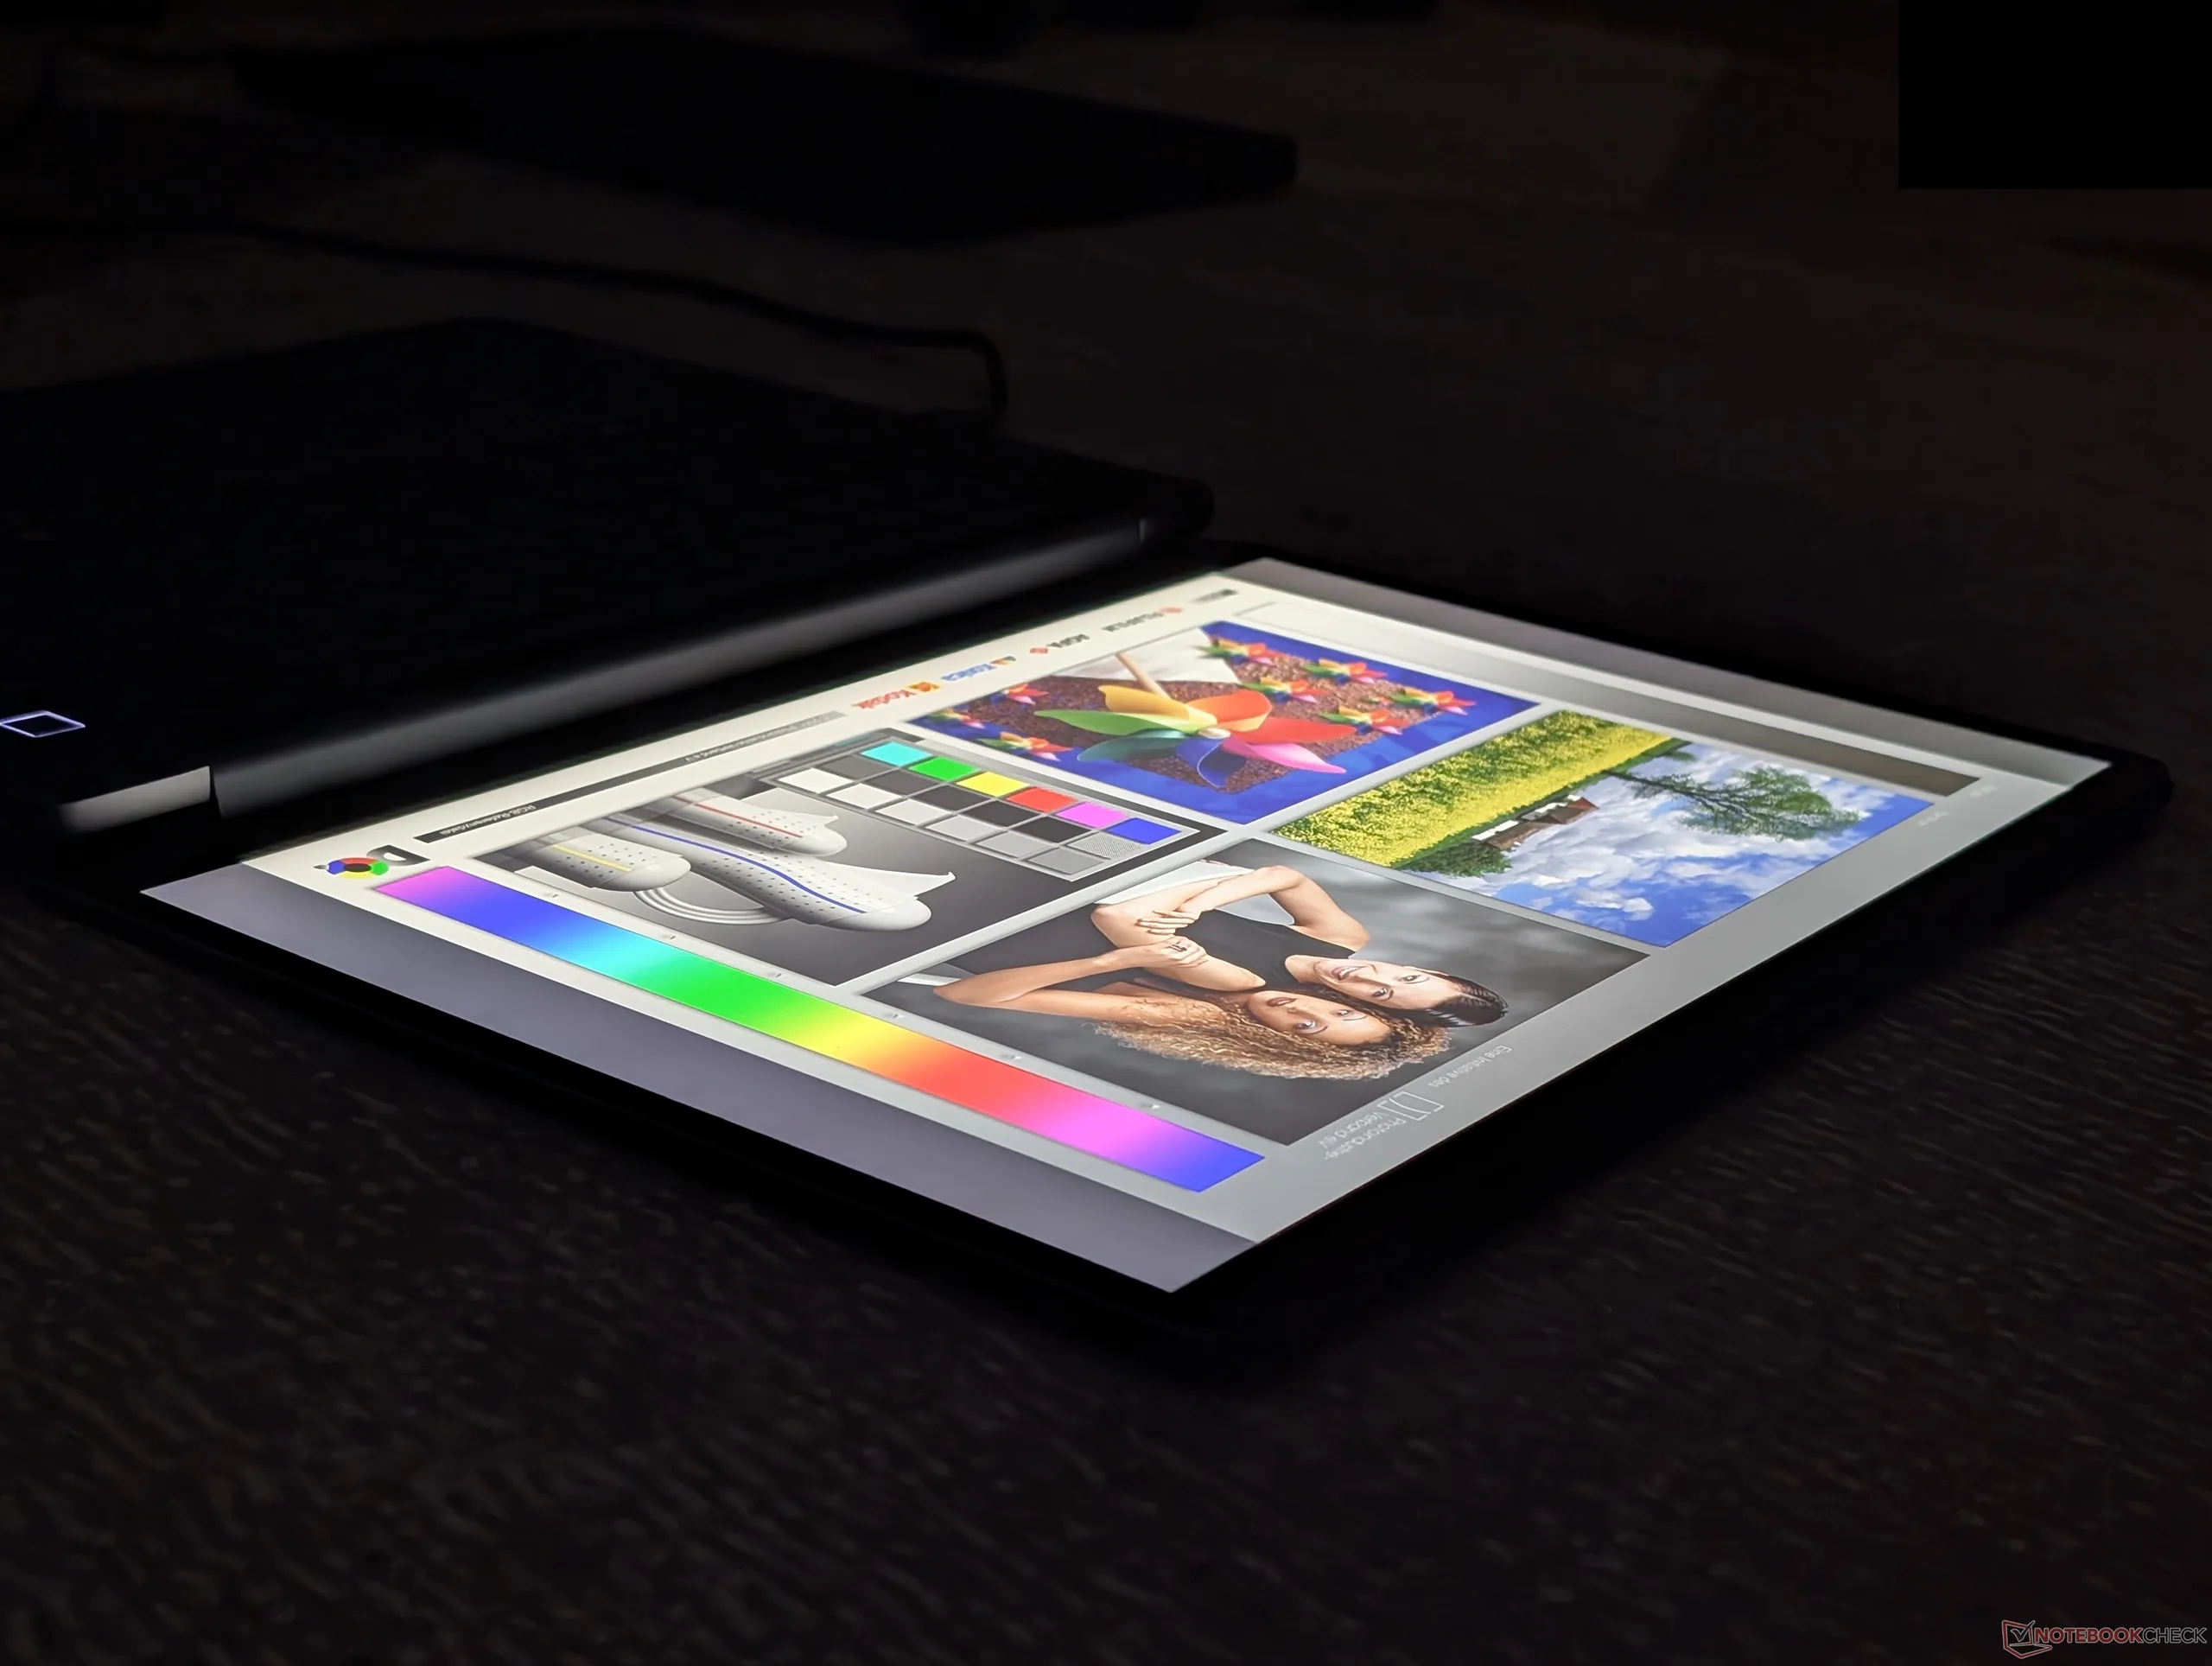
Granulação mínima do painel fosco
Havia um leve vazamento irregular de luz de fundo ao longo da borda inferior
510.1
cd/m²
494.4
cd/m²
536.1
cd/m²
548.2
cd/m²
559.9
cd/m²
563.7
cd/m²
620.1
cd/m²
595.8
cd/m²
613.3
cd/m²
Distribuição do brilho
LG Philips LP140WU testado com X-Rite i1Pro 3
Máximo: 620.1 cd/m² (Nits) Médio: 560.2 cd/m² Minimum: 36 cd/m²
iluminação: 80 %
iluminação com acumulador: 559.9 cd/m²
Contraste: 2333:1 (Preto: 0.24 cd/m²)
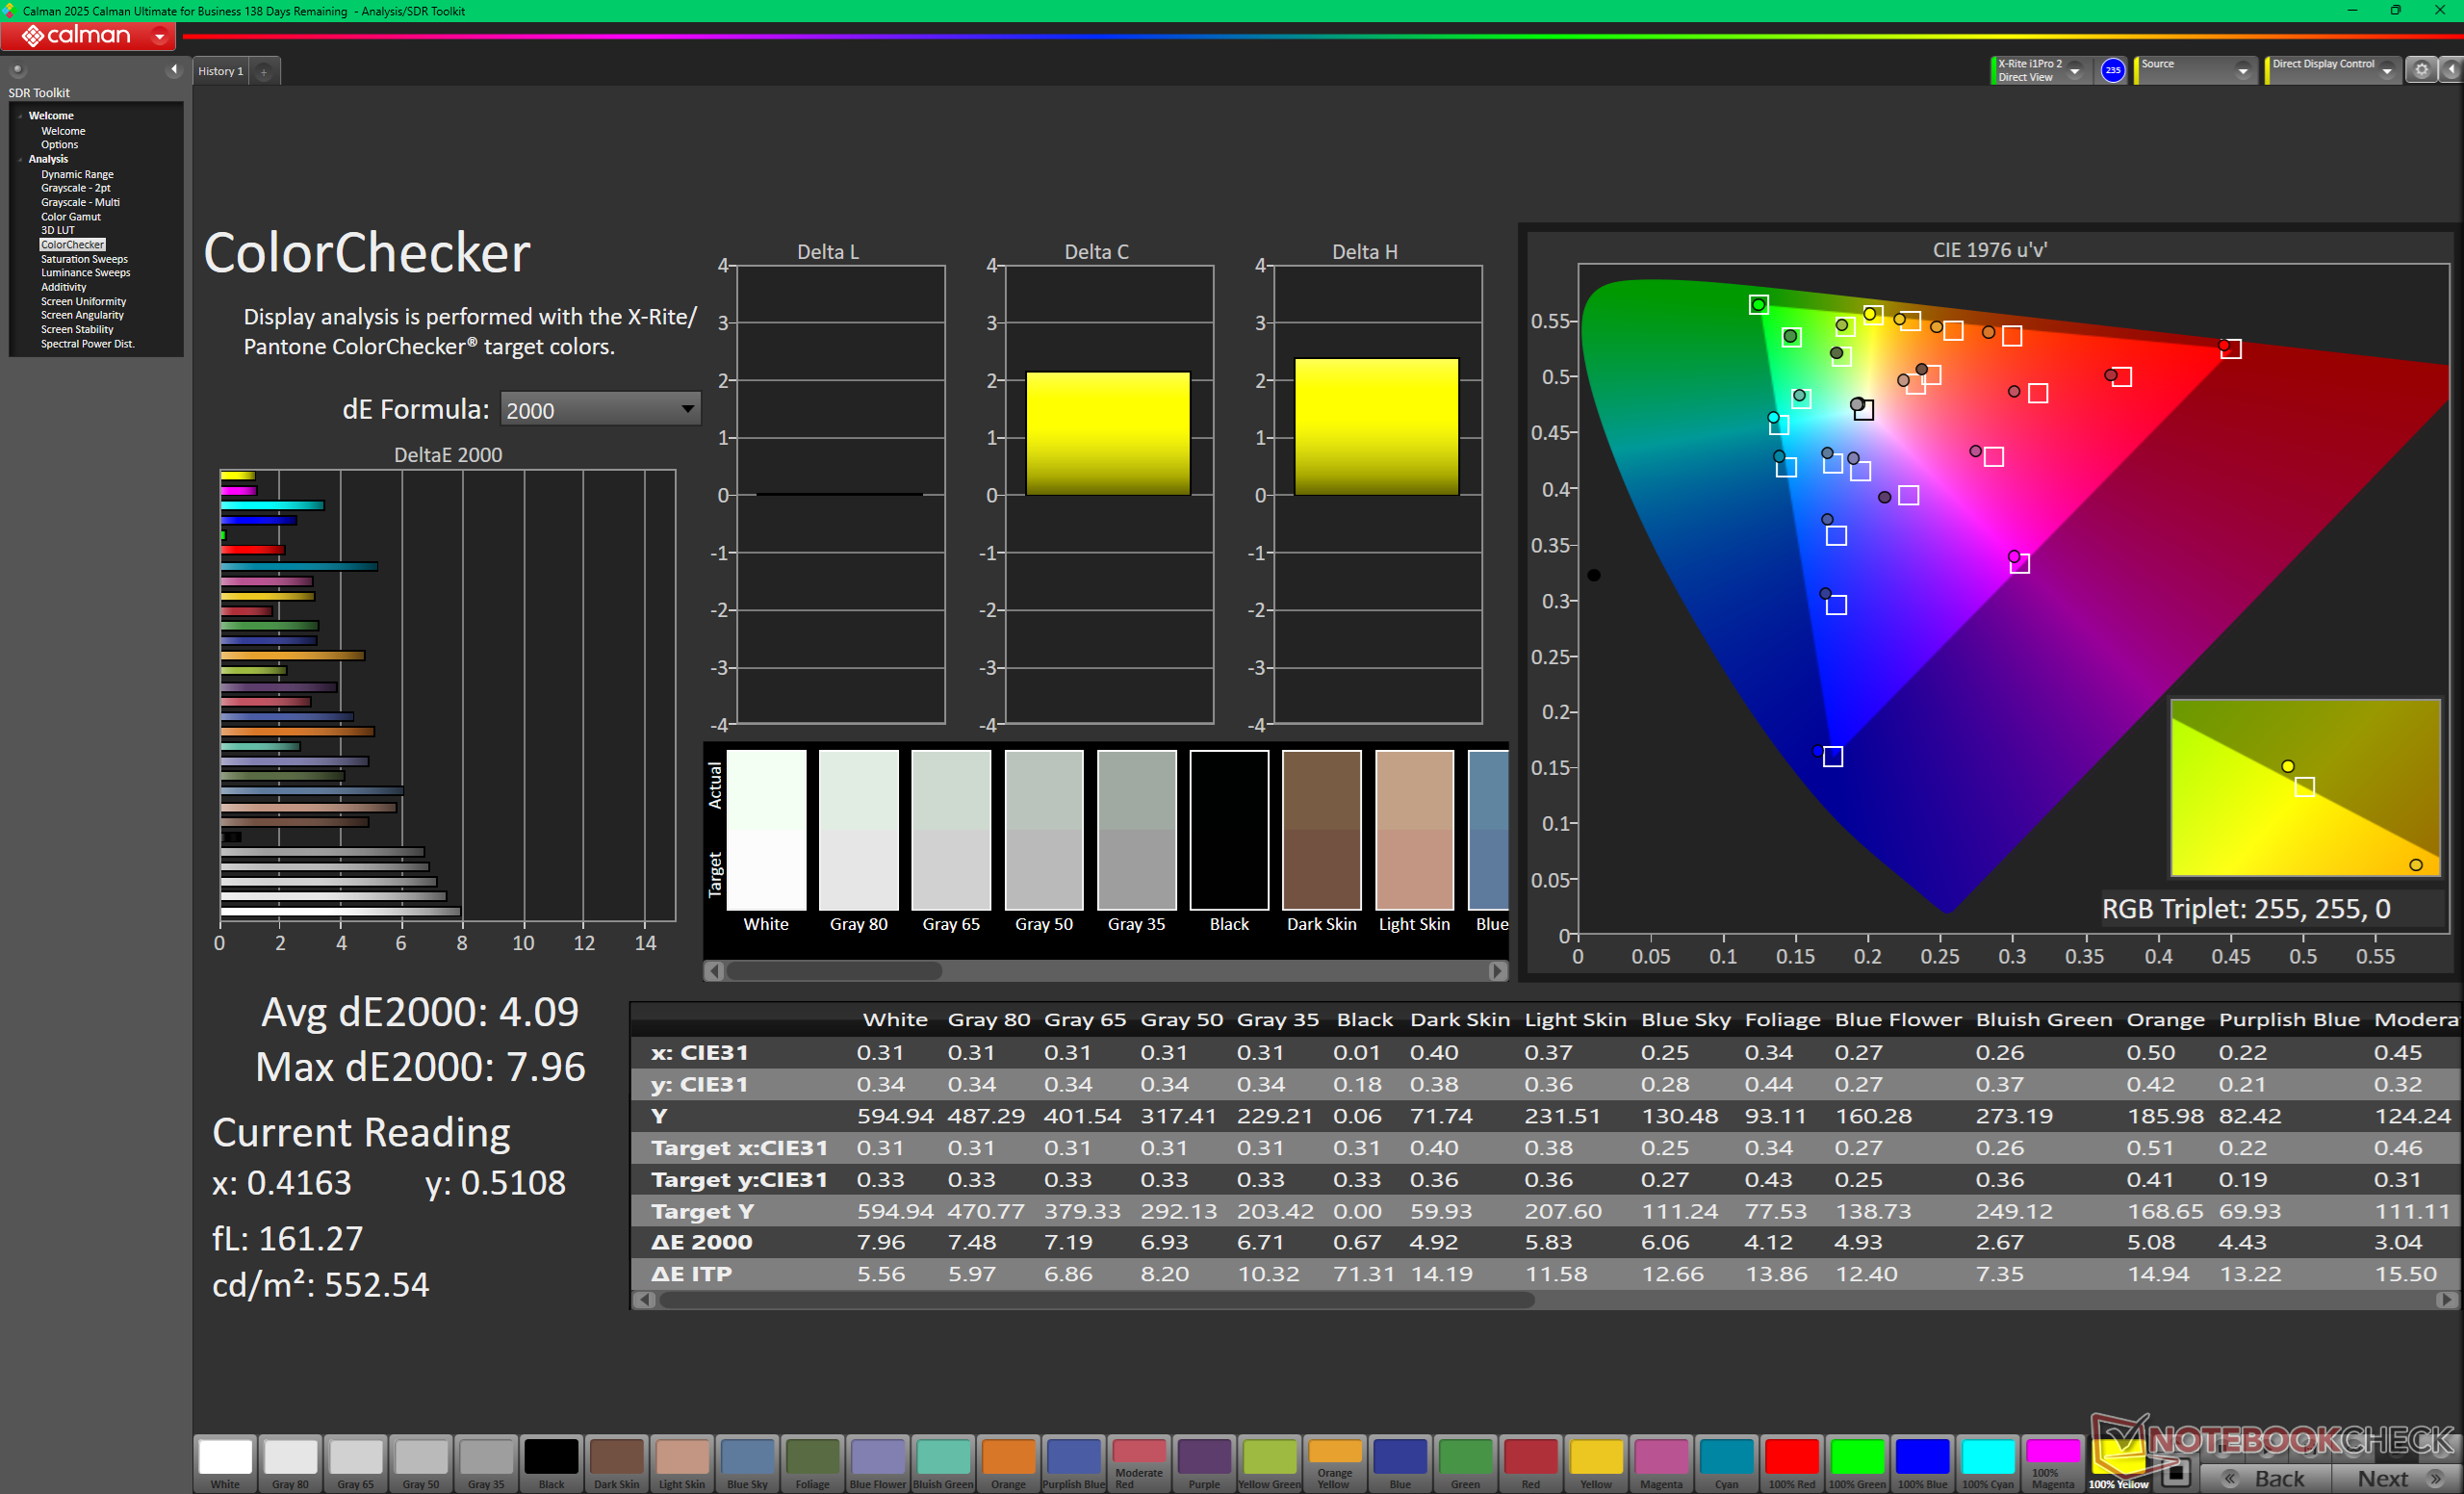
ΔE ColorChecker Calman: 4.09 | ∀{0.5-29.43 Ø4.7}
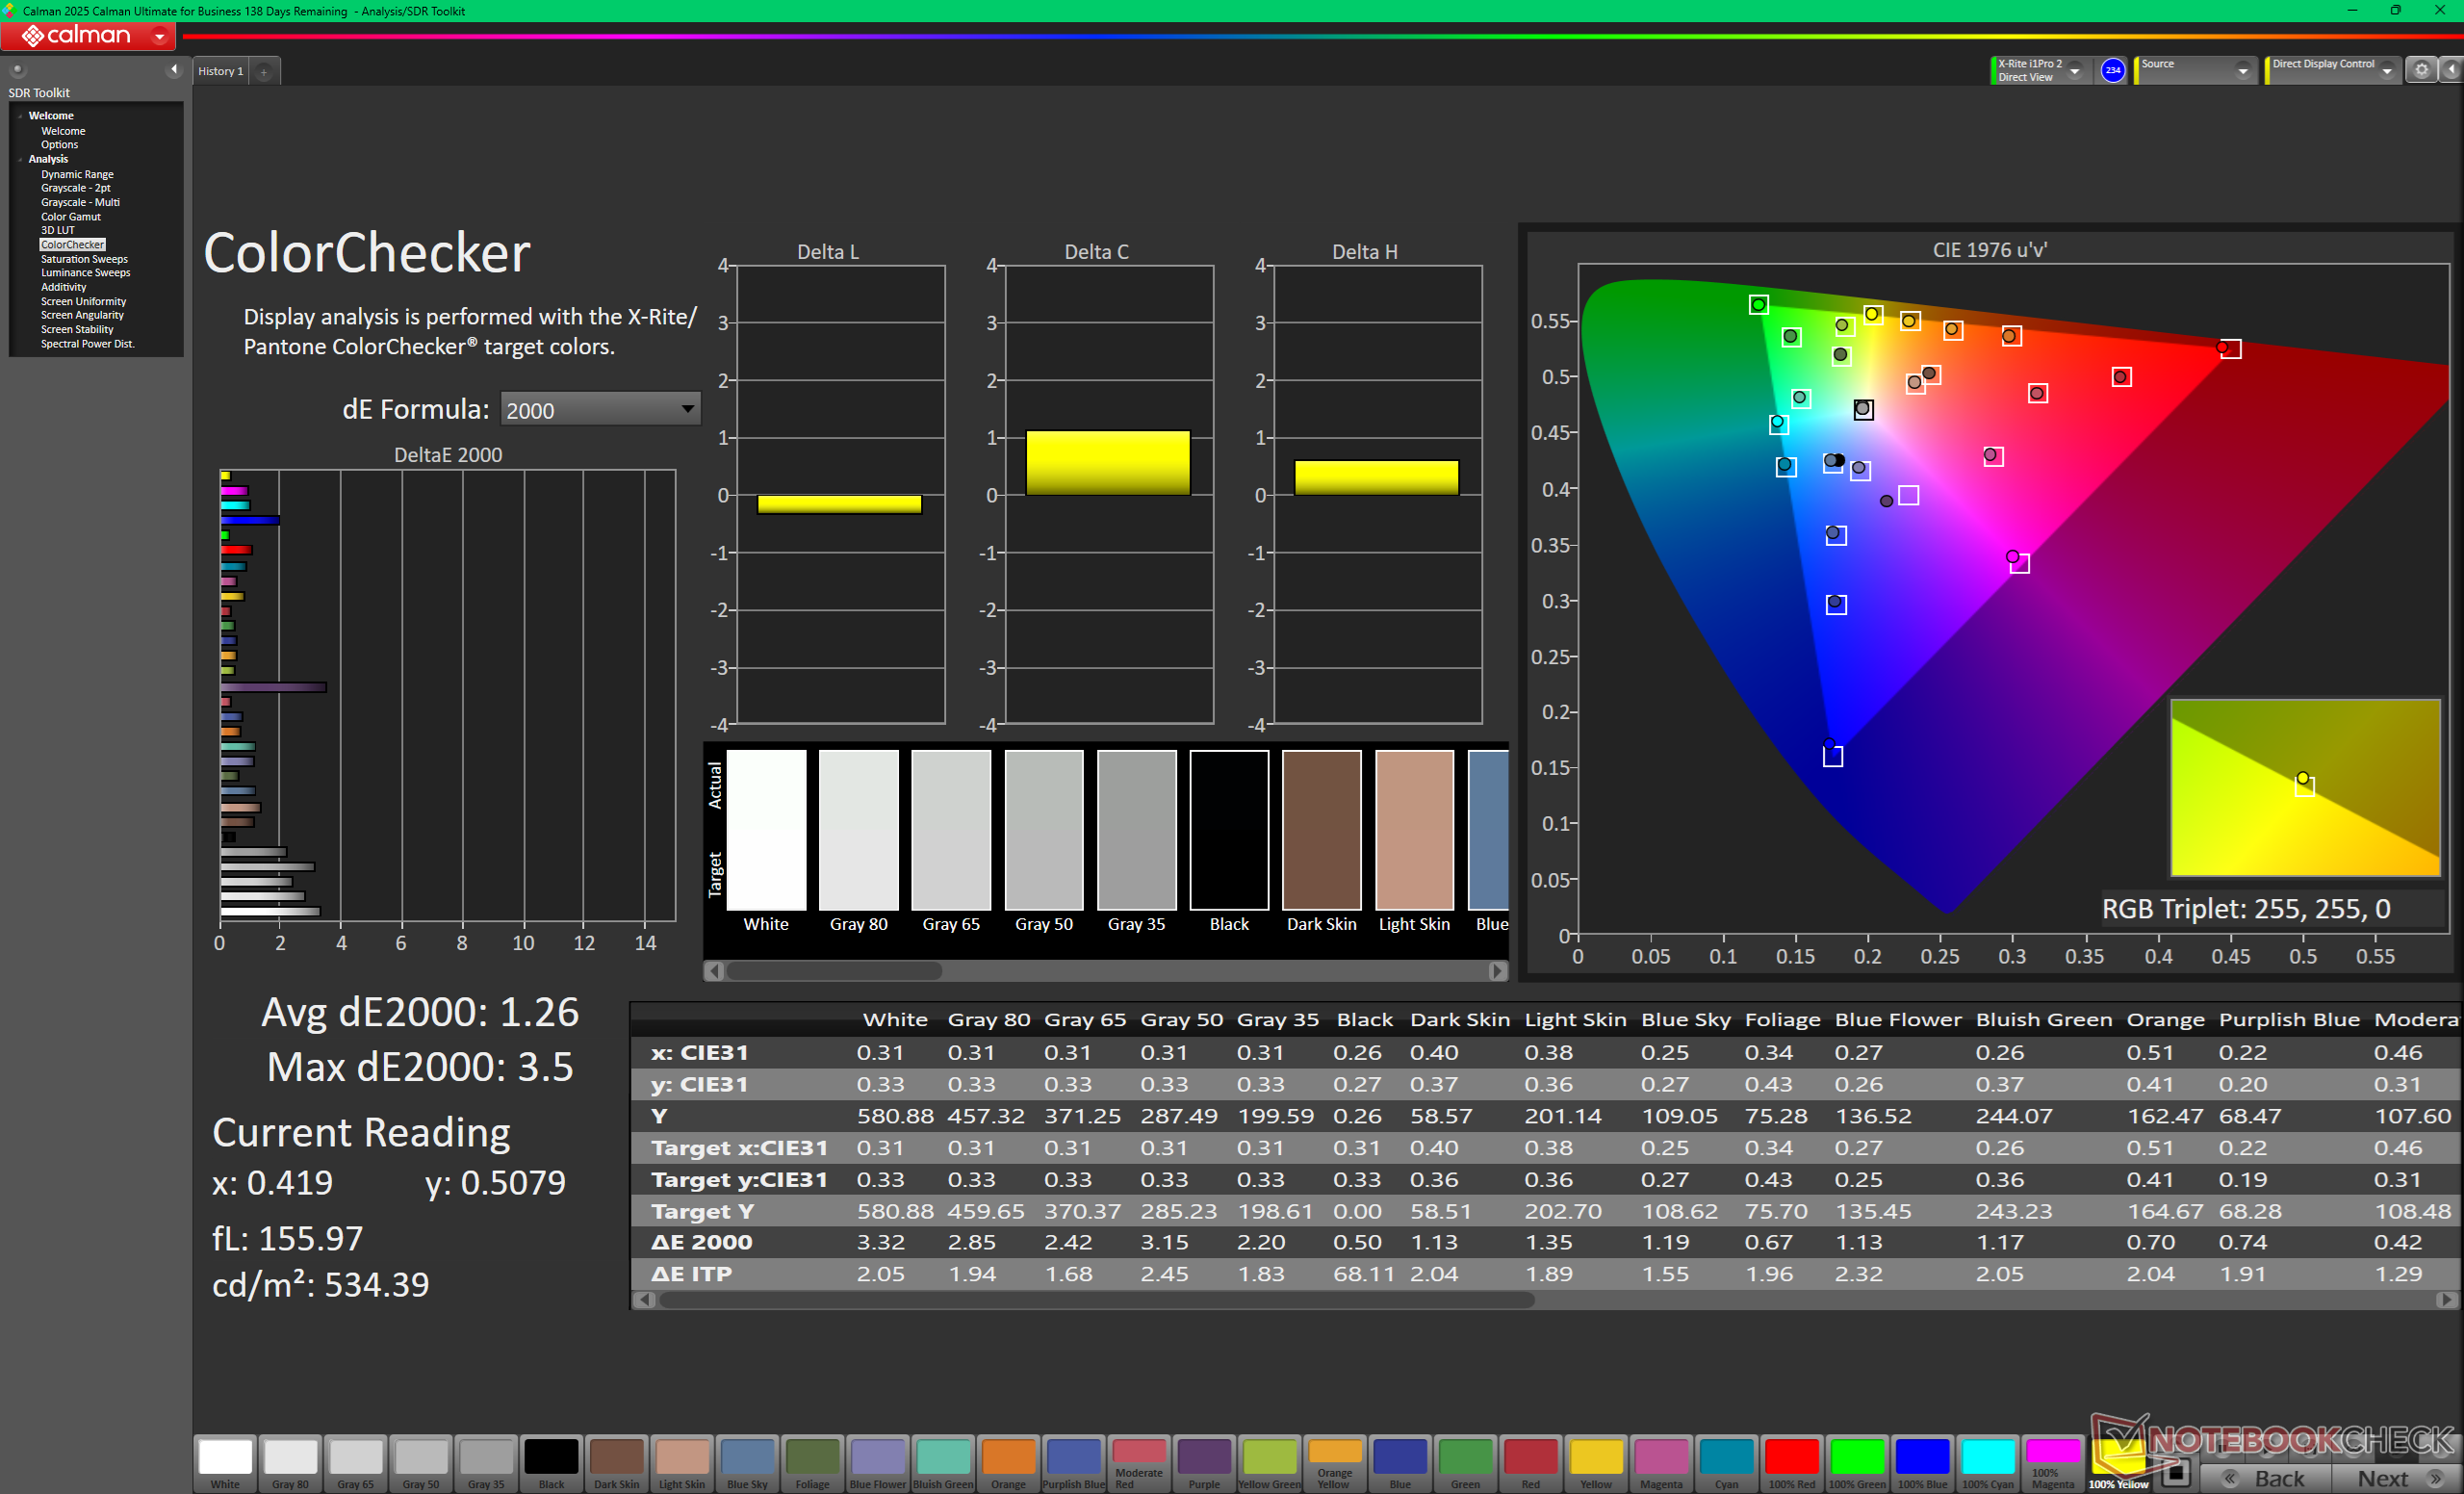
calibrated: 1.26
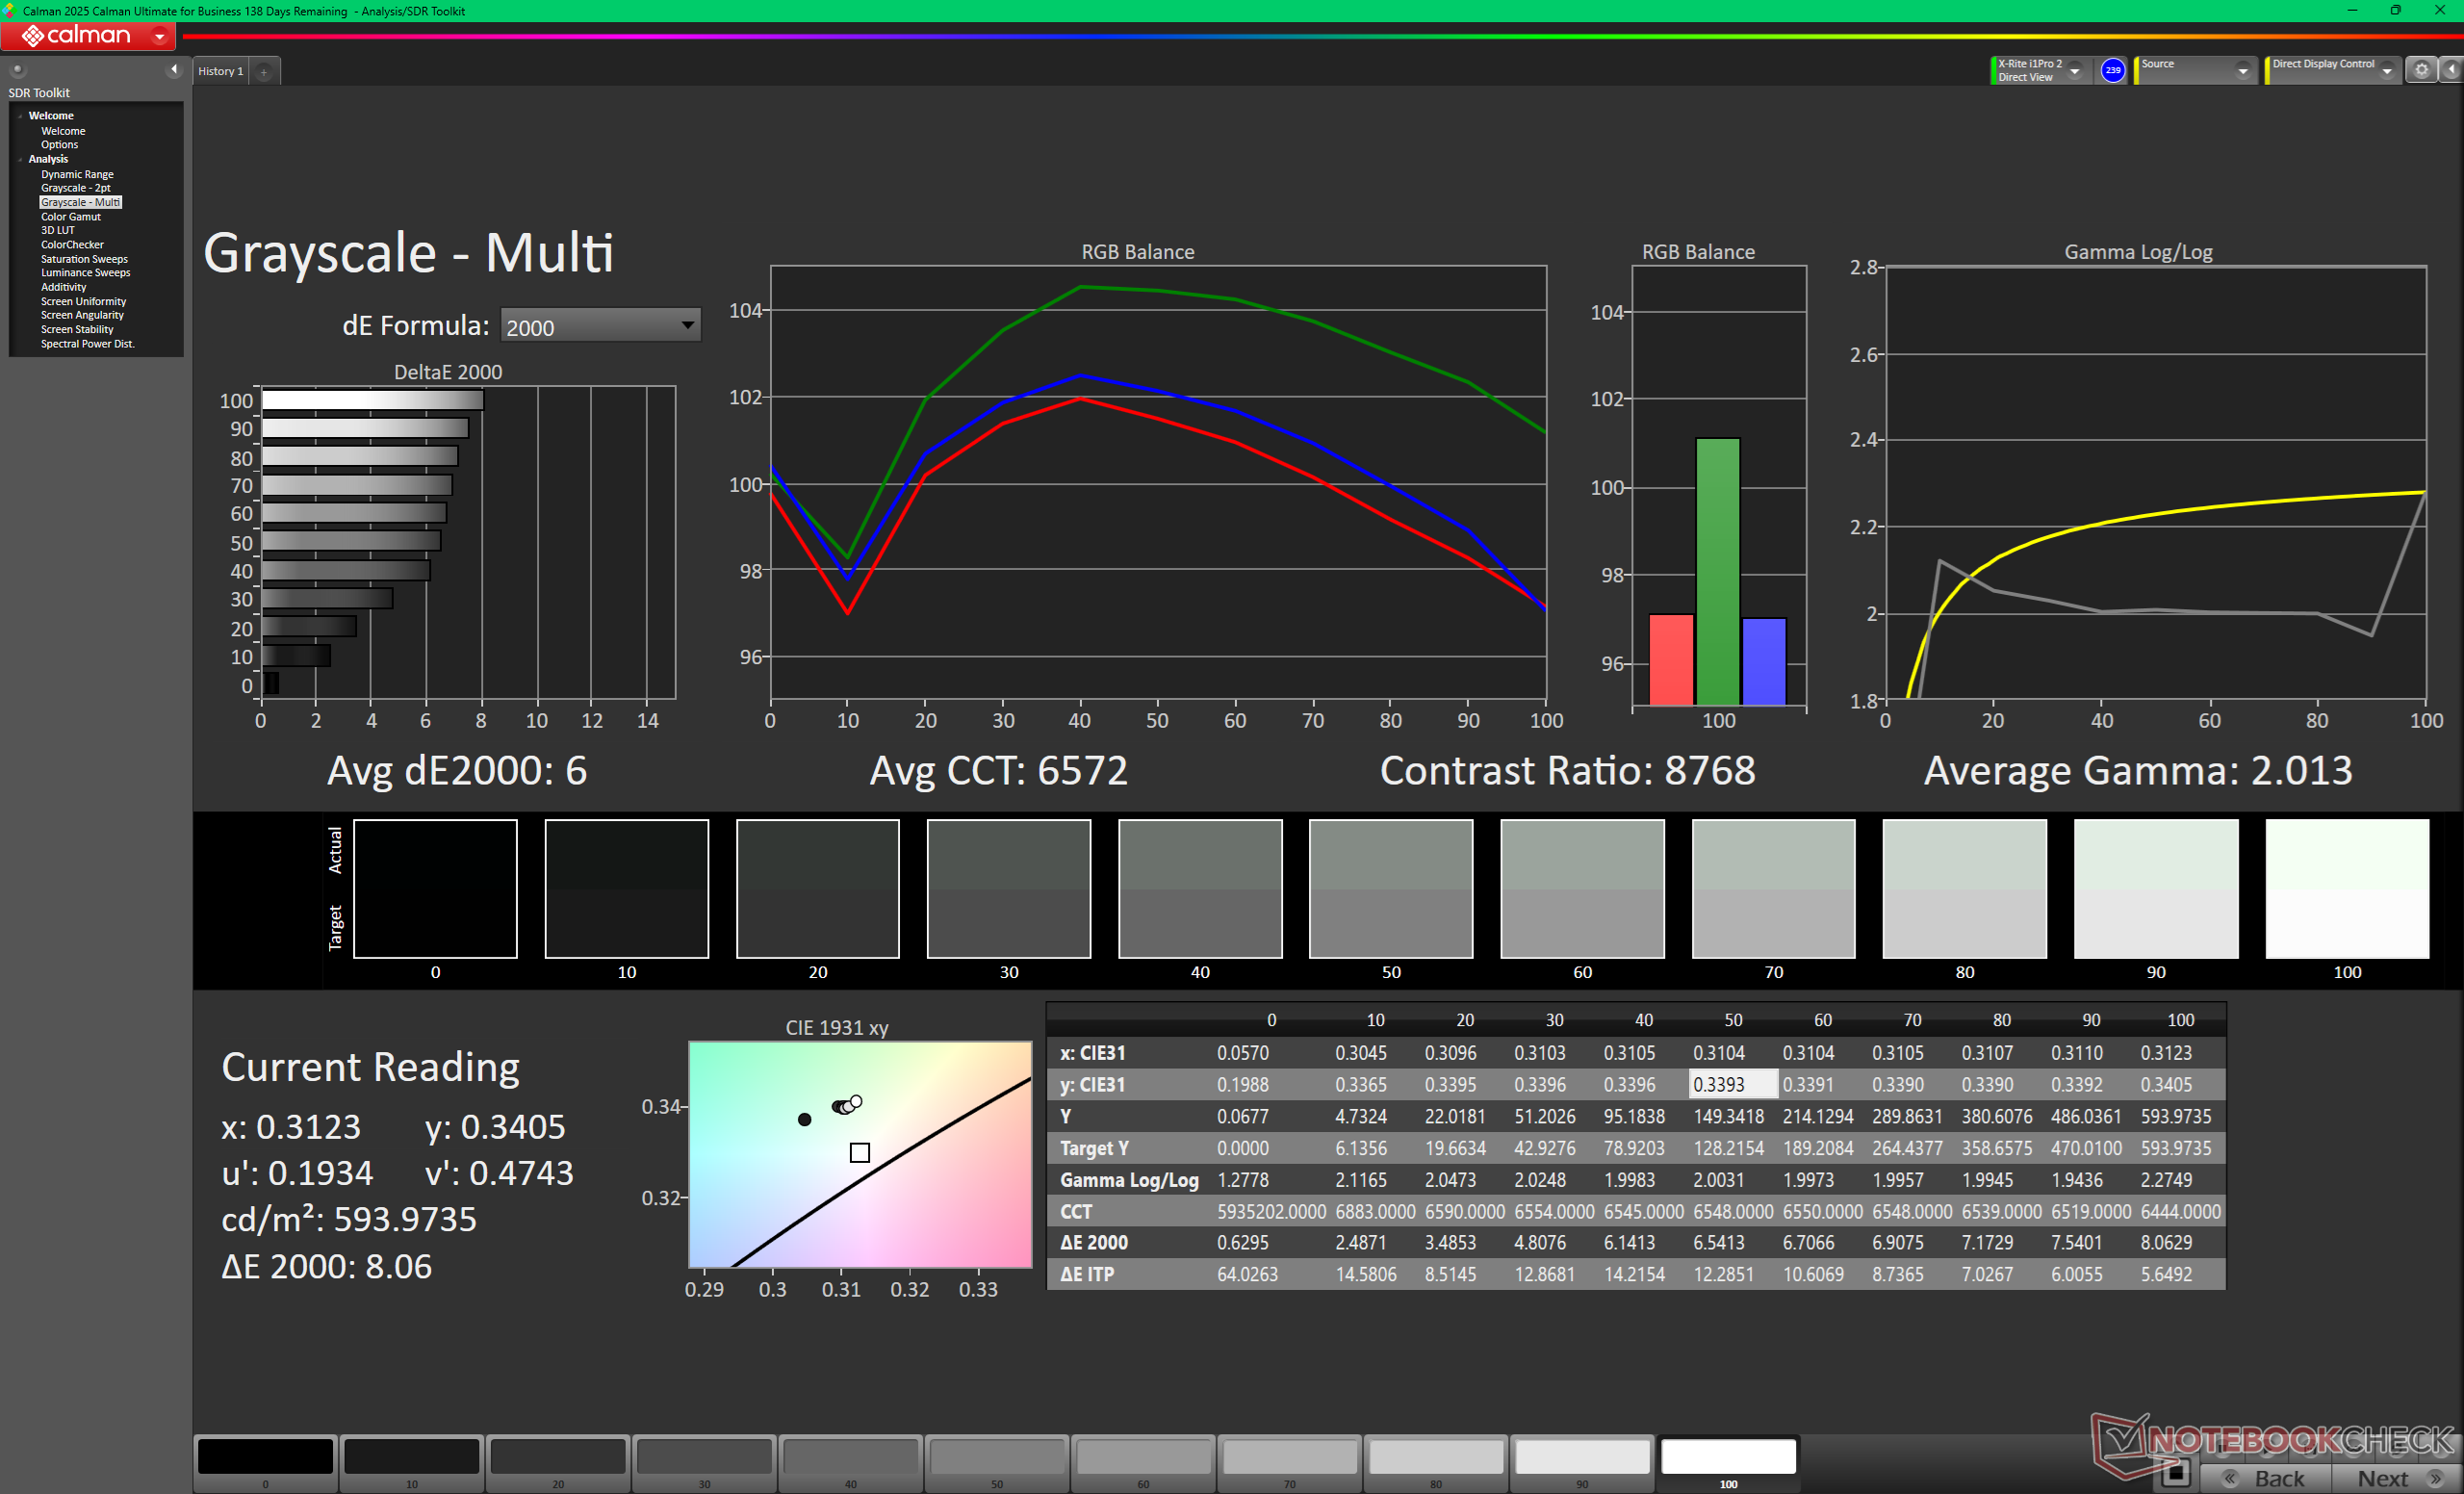
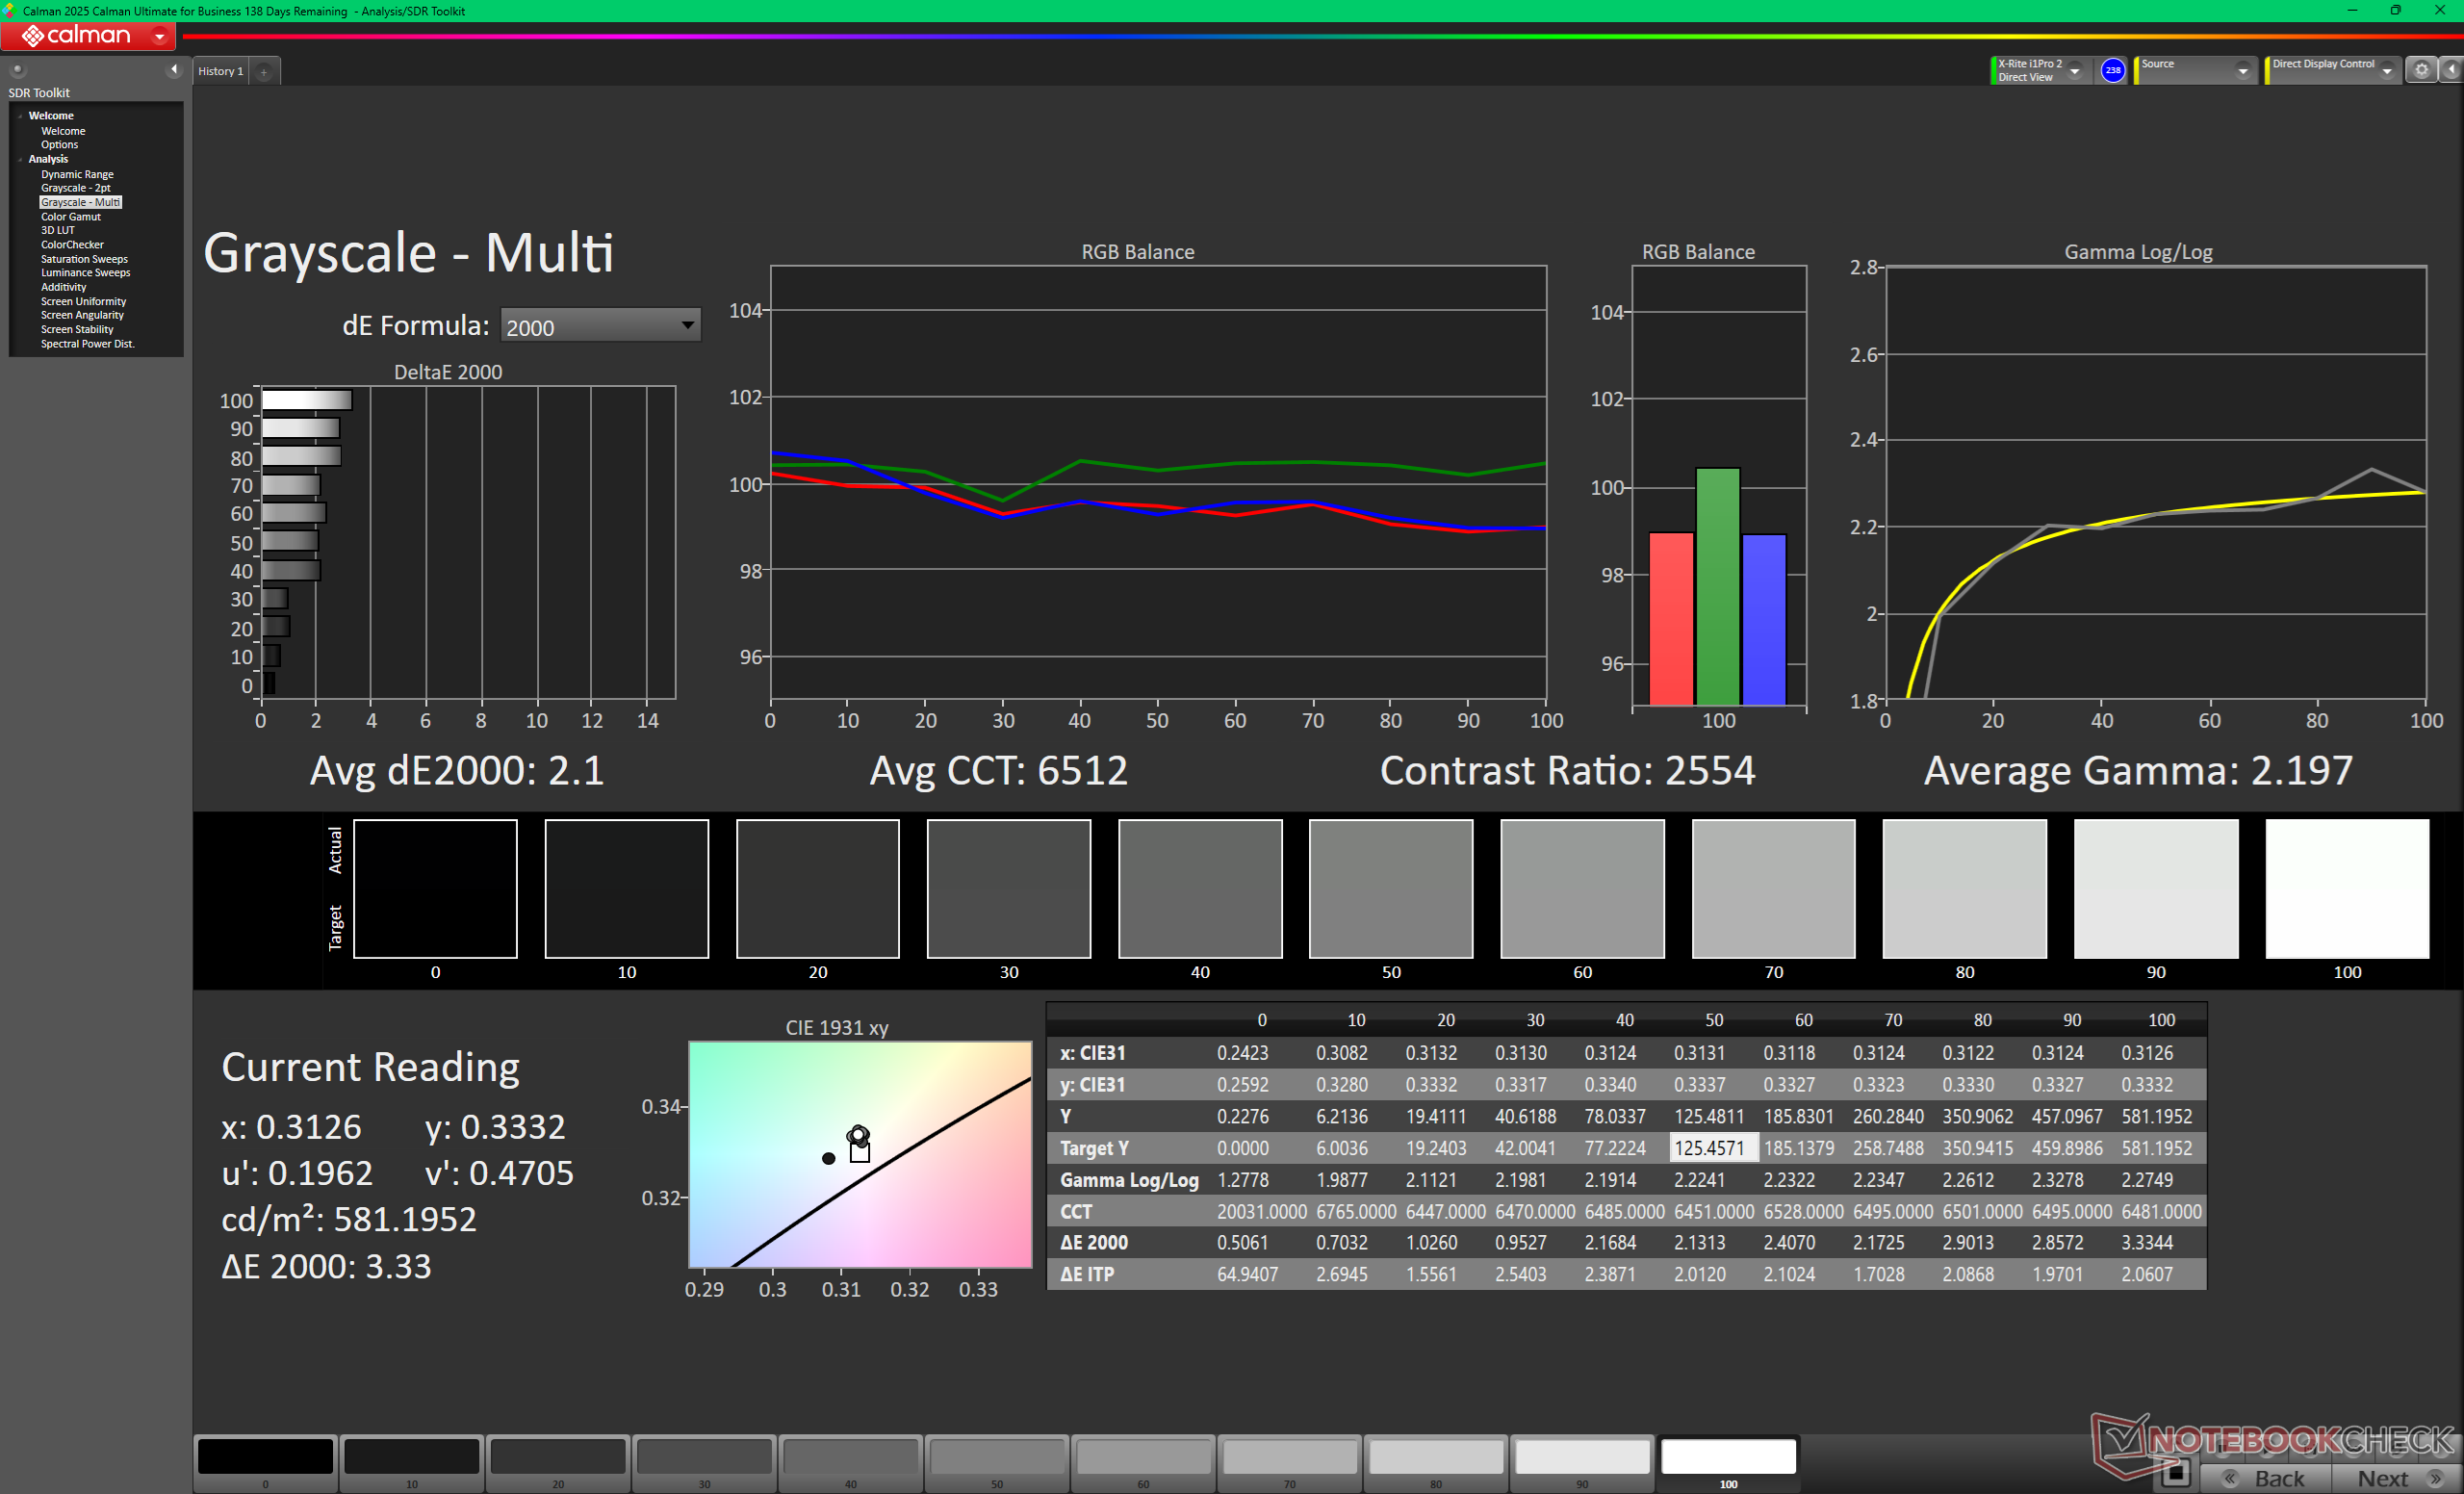
ΔE Greyscale Calman: 6 | ∀{0.09-98 Ø4.95}
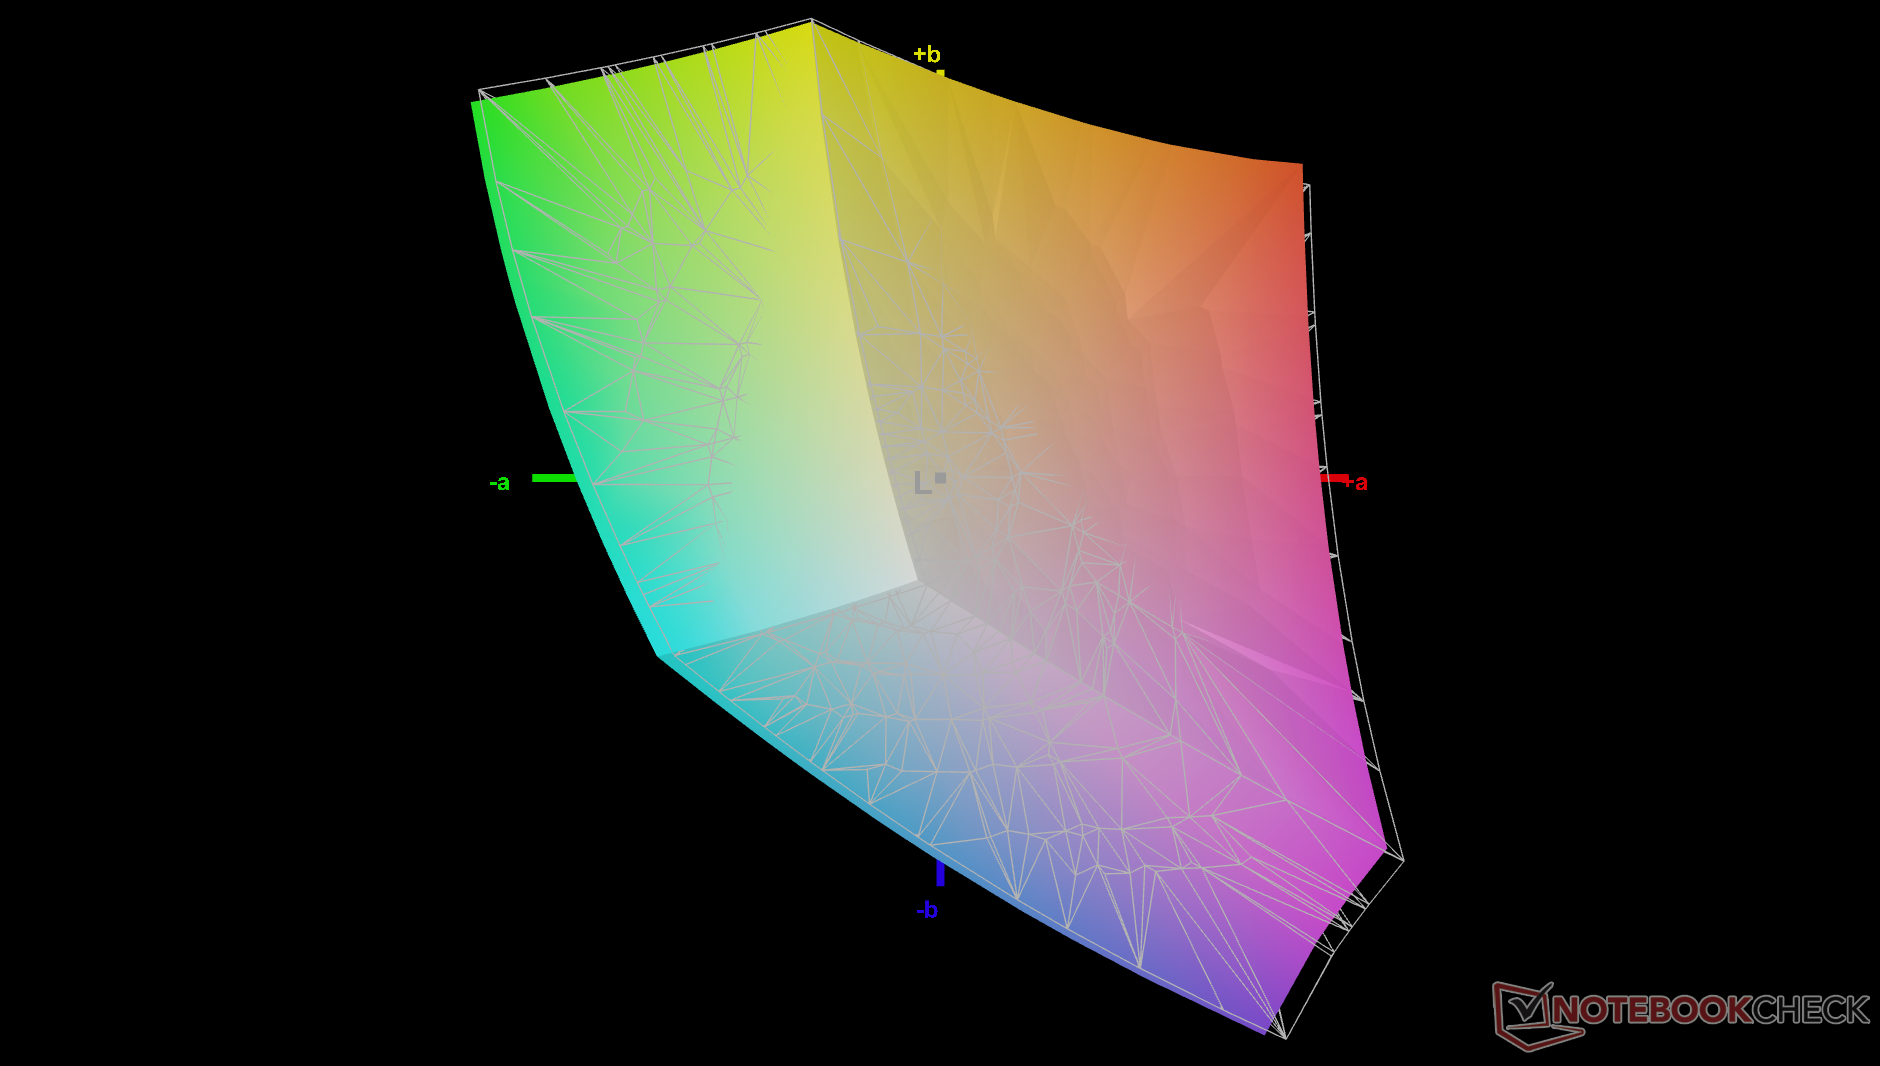
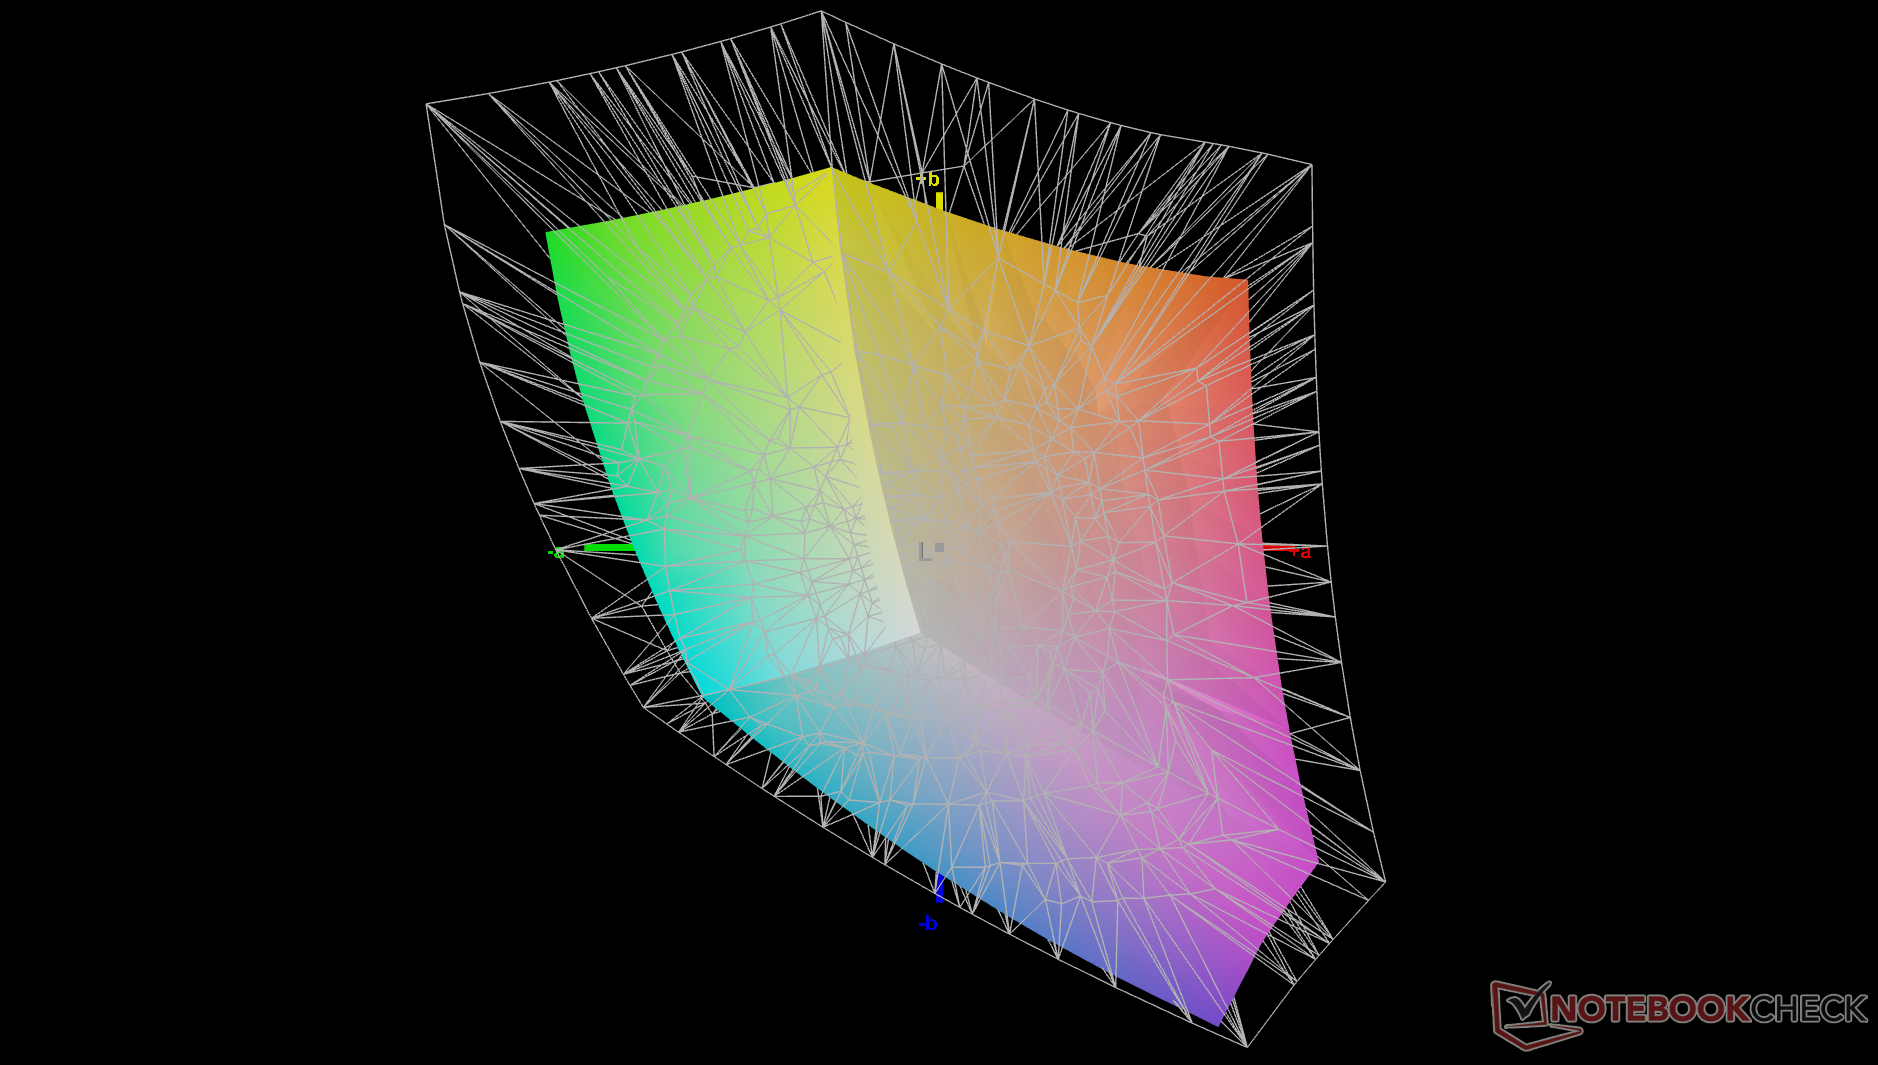
68.7% AdobeRGB 1998 (Argyll 3D)
96.9% sRGB (Argyll 3D)
66.5% Display P3 (Argyll 3D)
Gamma: 2.01
CCT: 8768 K
Dell Pro 5 14 P514260
LG Philips LP140WU, IPS, 1920x1200, 14", 120 Hz
Dell Pro 7 14 P714260
LG Philips LP140WU, IPS, 1920x1200, 14", 120 Hz
Lenovo ThinkPad T14s Gen 7 21YW0022GE
MNE007QB1-1, IPS, 1920x1200, 14", 60 Hz
HP OmniBook Ultra 14 Core Ultra X9
Samsung SDC4215, OLED, 2880x1800, 14", 120 Hz
Samsung Galaxy Book5 Pro 14 940XHA
ATNA40CU07-0, OLED, 2880x1800, 14", 120 Hz
Asus ExpertBook Ultra B9406CAA
Samsung ATNA40LE01-0, OLED, 2880x1800, 14", 120 Hz
Display
-2%
4%
29%
31%
25%
Display P3 Coverage (%)
66.5
65.4
-2%
71.6
8%
99.9
50%
99.9
50%
96.2
45%
sRGB Coverage (%)
96.9
96.2
-1%
97.4
1%
100
3%
100
3%
100
3%
AdobeRGB 1998 Coverage (%)
68.7
67.6
-2%
70.4
2%
92.3
34%
95.7
39%
86.7
26%
Response Times
-14%
38%
98%
98%
98%
Response Time Grey 50% / Grey 80% * (ms)
36.9 ?(17.2, 19.7)
43.8 ?(20.4, 23.4)
-19%
27.8 ?(10.2, 17.6)
25%
0.58 ?(0.3, 0.28)
98%
0.83 ?(0.43, 0.4)
98%
0.71 ?(0.38, 0.33)
98%
Response Time Black / White * (ms)
28.6 ?(11.9, 16.7)
31.3 ?(13, 18.3)
-9%
14 ?(4.3, 9.7)
51%
0.87 ?(0.4, 0.47)
97%
0.69 ?(0.38, 0.31)
98%
0.94 ?(0.49, 0.45)
97%
PWM Frequency (Hz)
927.13 ?(100)
240 ?(100)
968.8 ?(100)
PWM Amplitude * (%)
25
66
20
Screen
-2%
14%
24%
16%
41%
Brightness middle (cd/m²)
559.9
575.7
3%
574
3%
446
-20%
400
-29%
600.5
7%
Brightness (cd/m²)
560
532
-5%
530
-5%
447
-20%
402
-28%
612
9%
Brightness Distribution (%)
80
82
2%
87
9%
99
24%
99
24%
96
20%
Black Level * (cd/m²)
0.24
0.32
-33%
0.32
-33%
Contrast (:1)
2333
1799
-23%
1794
-23%
Colorchecker dE 2000 *
4.09
3.88
5%
2
51%
1.76
57%
2.1
49%
1.18
71%
Colorchecker dE 2000 max. *
7.96
7.53
5%
3.7
54%
3.29
59%
3.3
59%
3.4
57%
Colorchecker dE 2000 calibrated *
1.26
0.96
24%
1.1
13%
1.18
6%
1.6
-27%
0.73
42%
Greyscale dE 2000 *
6
5.6
7%
2.6
57%
2.3
62%
2.3
62%
1
83%
Gamma
2.01 109%
2.01 109%
2.27 97%
2.25 98%
2.26 97%
2.27 97%
CCT
8768 74%
6541 99%
6910 94%
6470 100%
6795 96%
6567 99%
Média Total (Programa/Configurações)
-6% / -3%
19% / 15%
50% / 38%
48% / 33%
55% / 47%

* ... menor é melhor

vs. sRGB
vs. sRGB
vs. P3
vs. P3
Escala de cinza antes da calibração (sRGB)
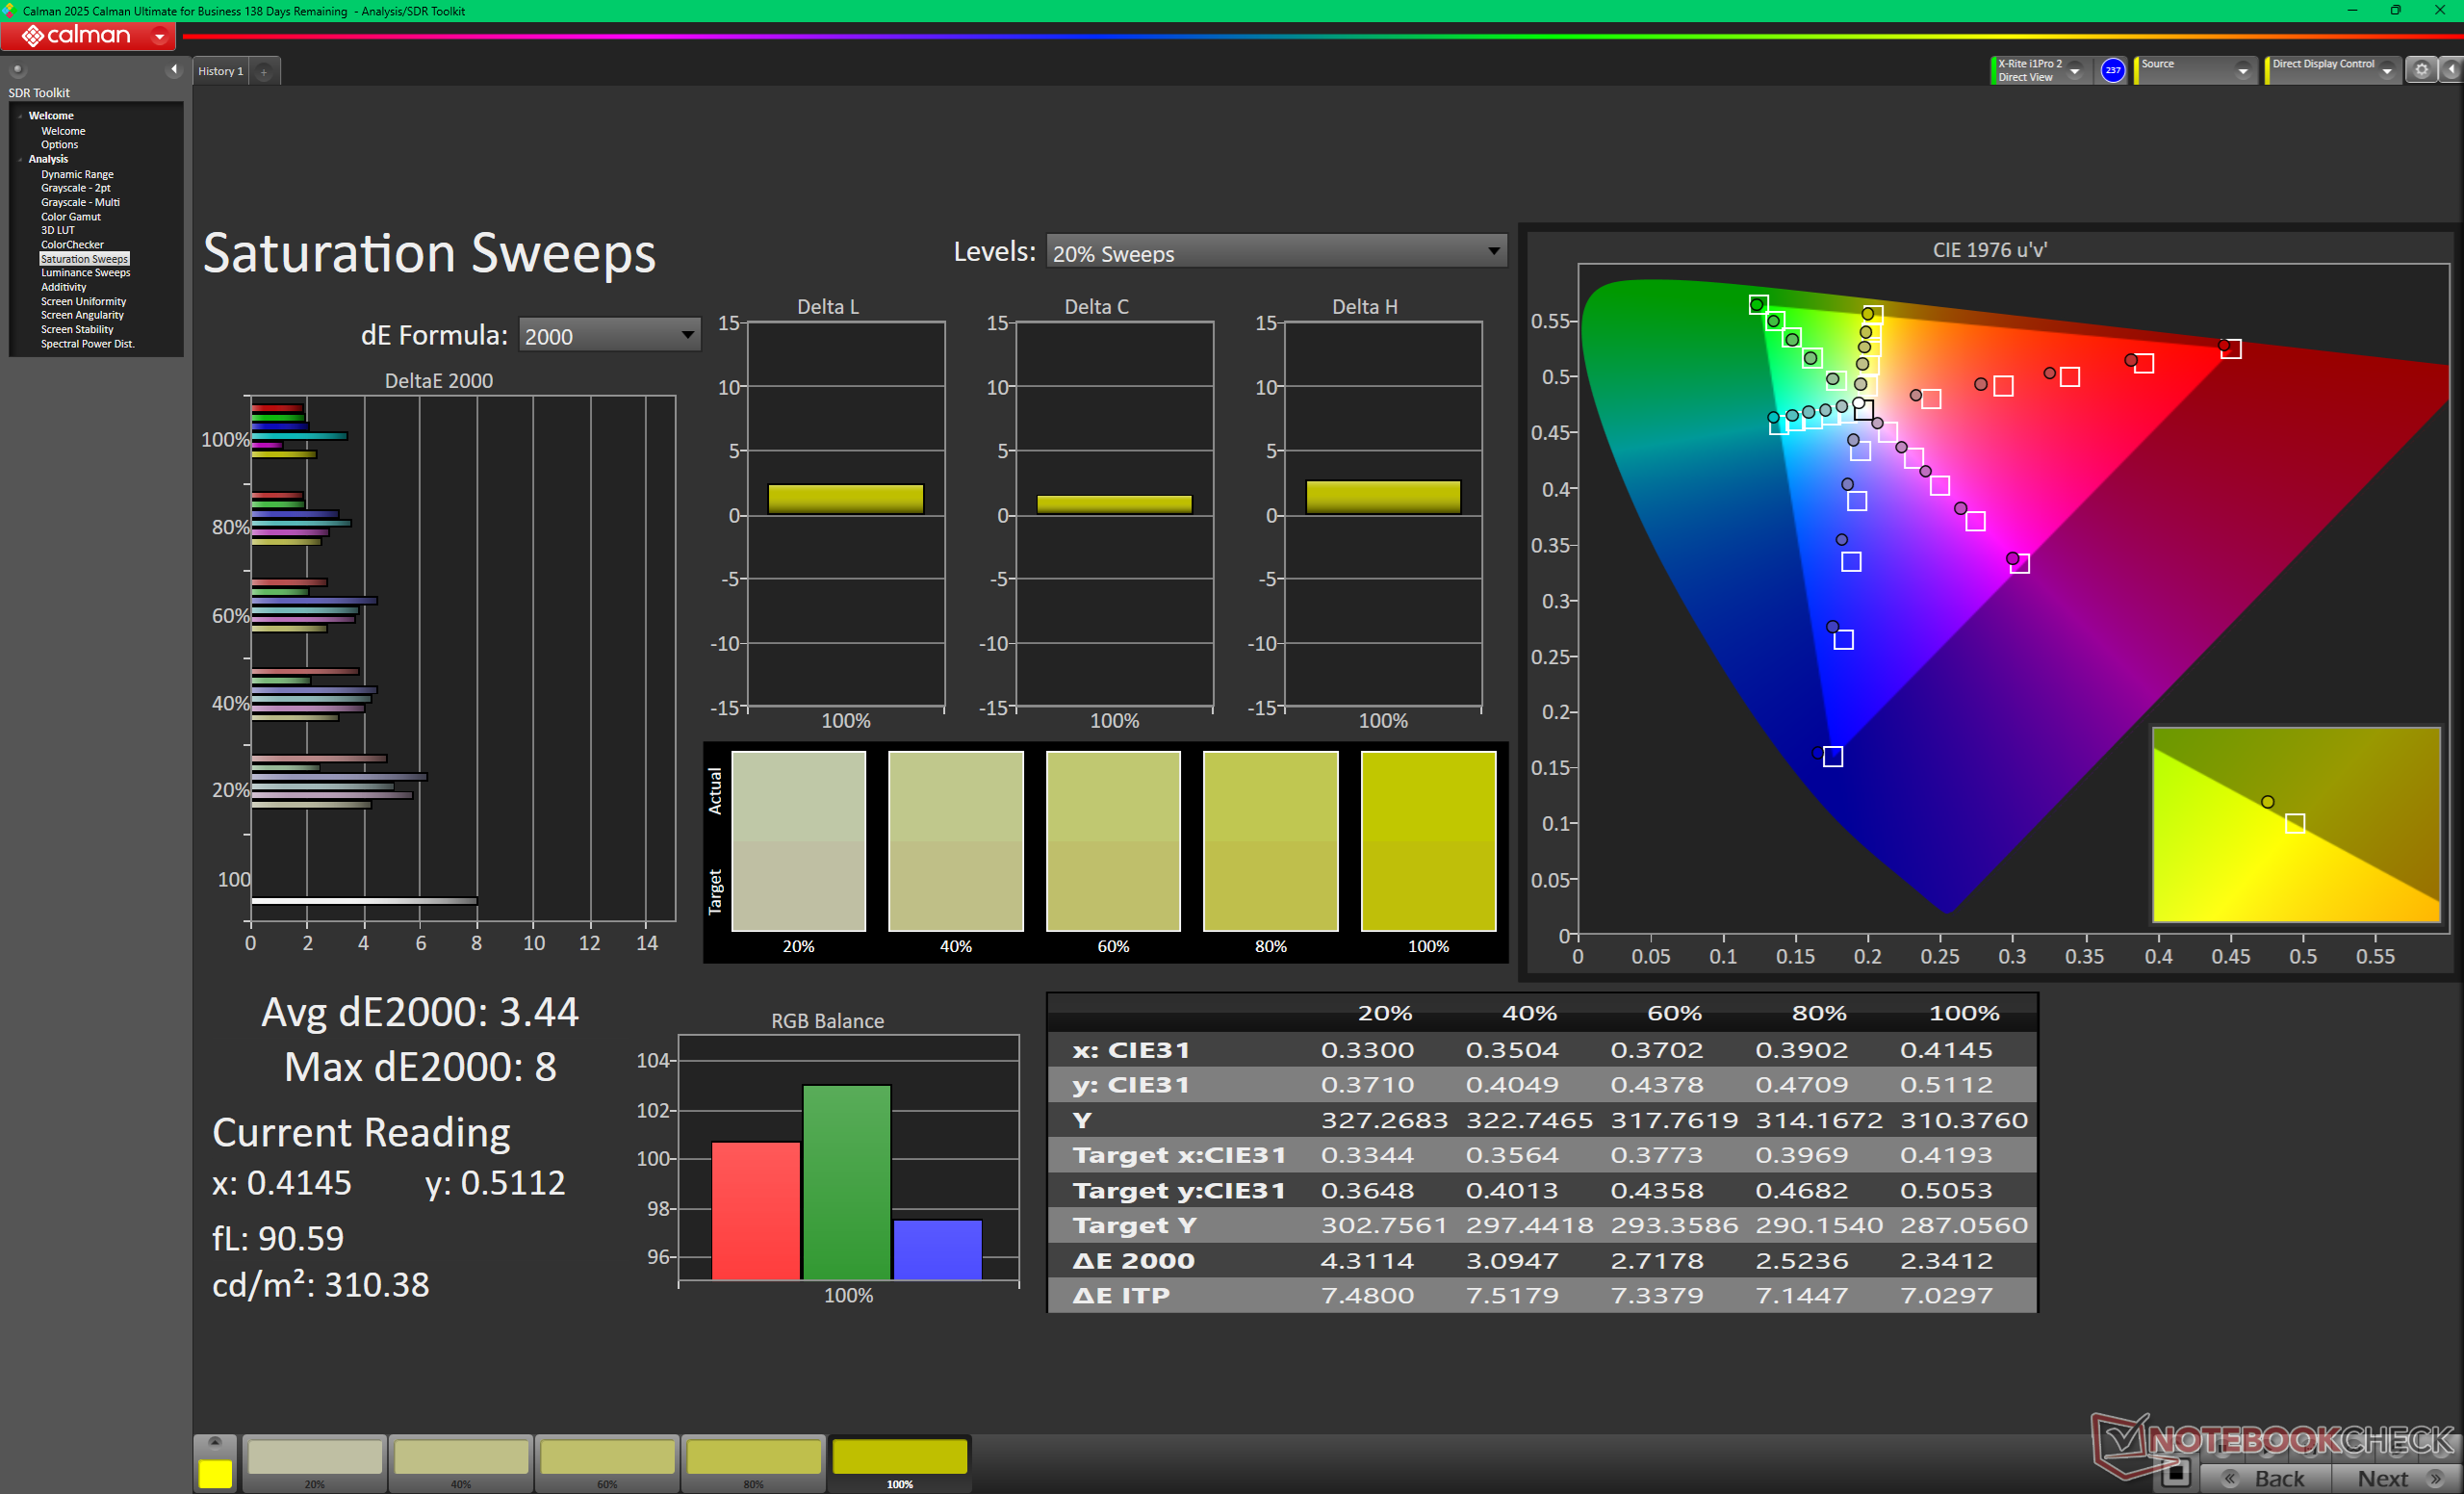
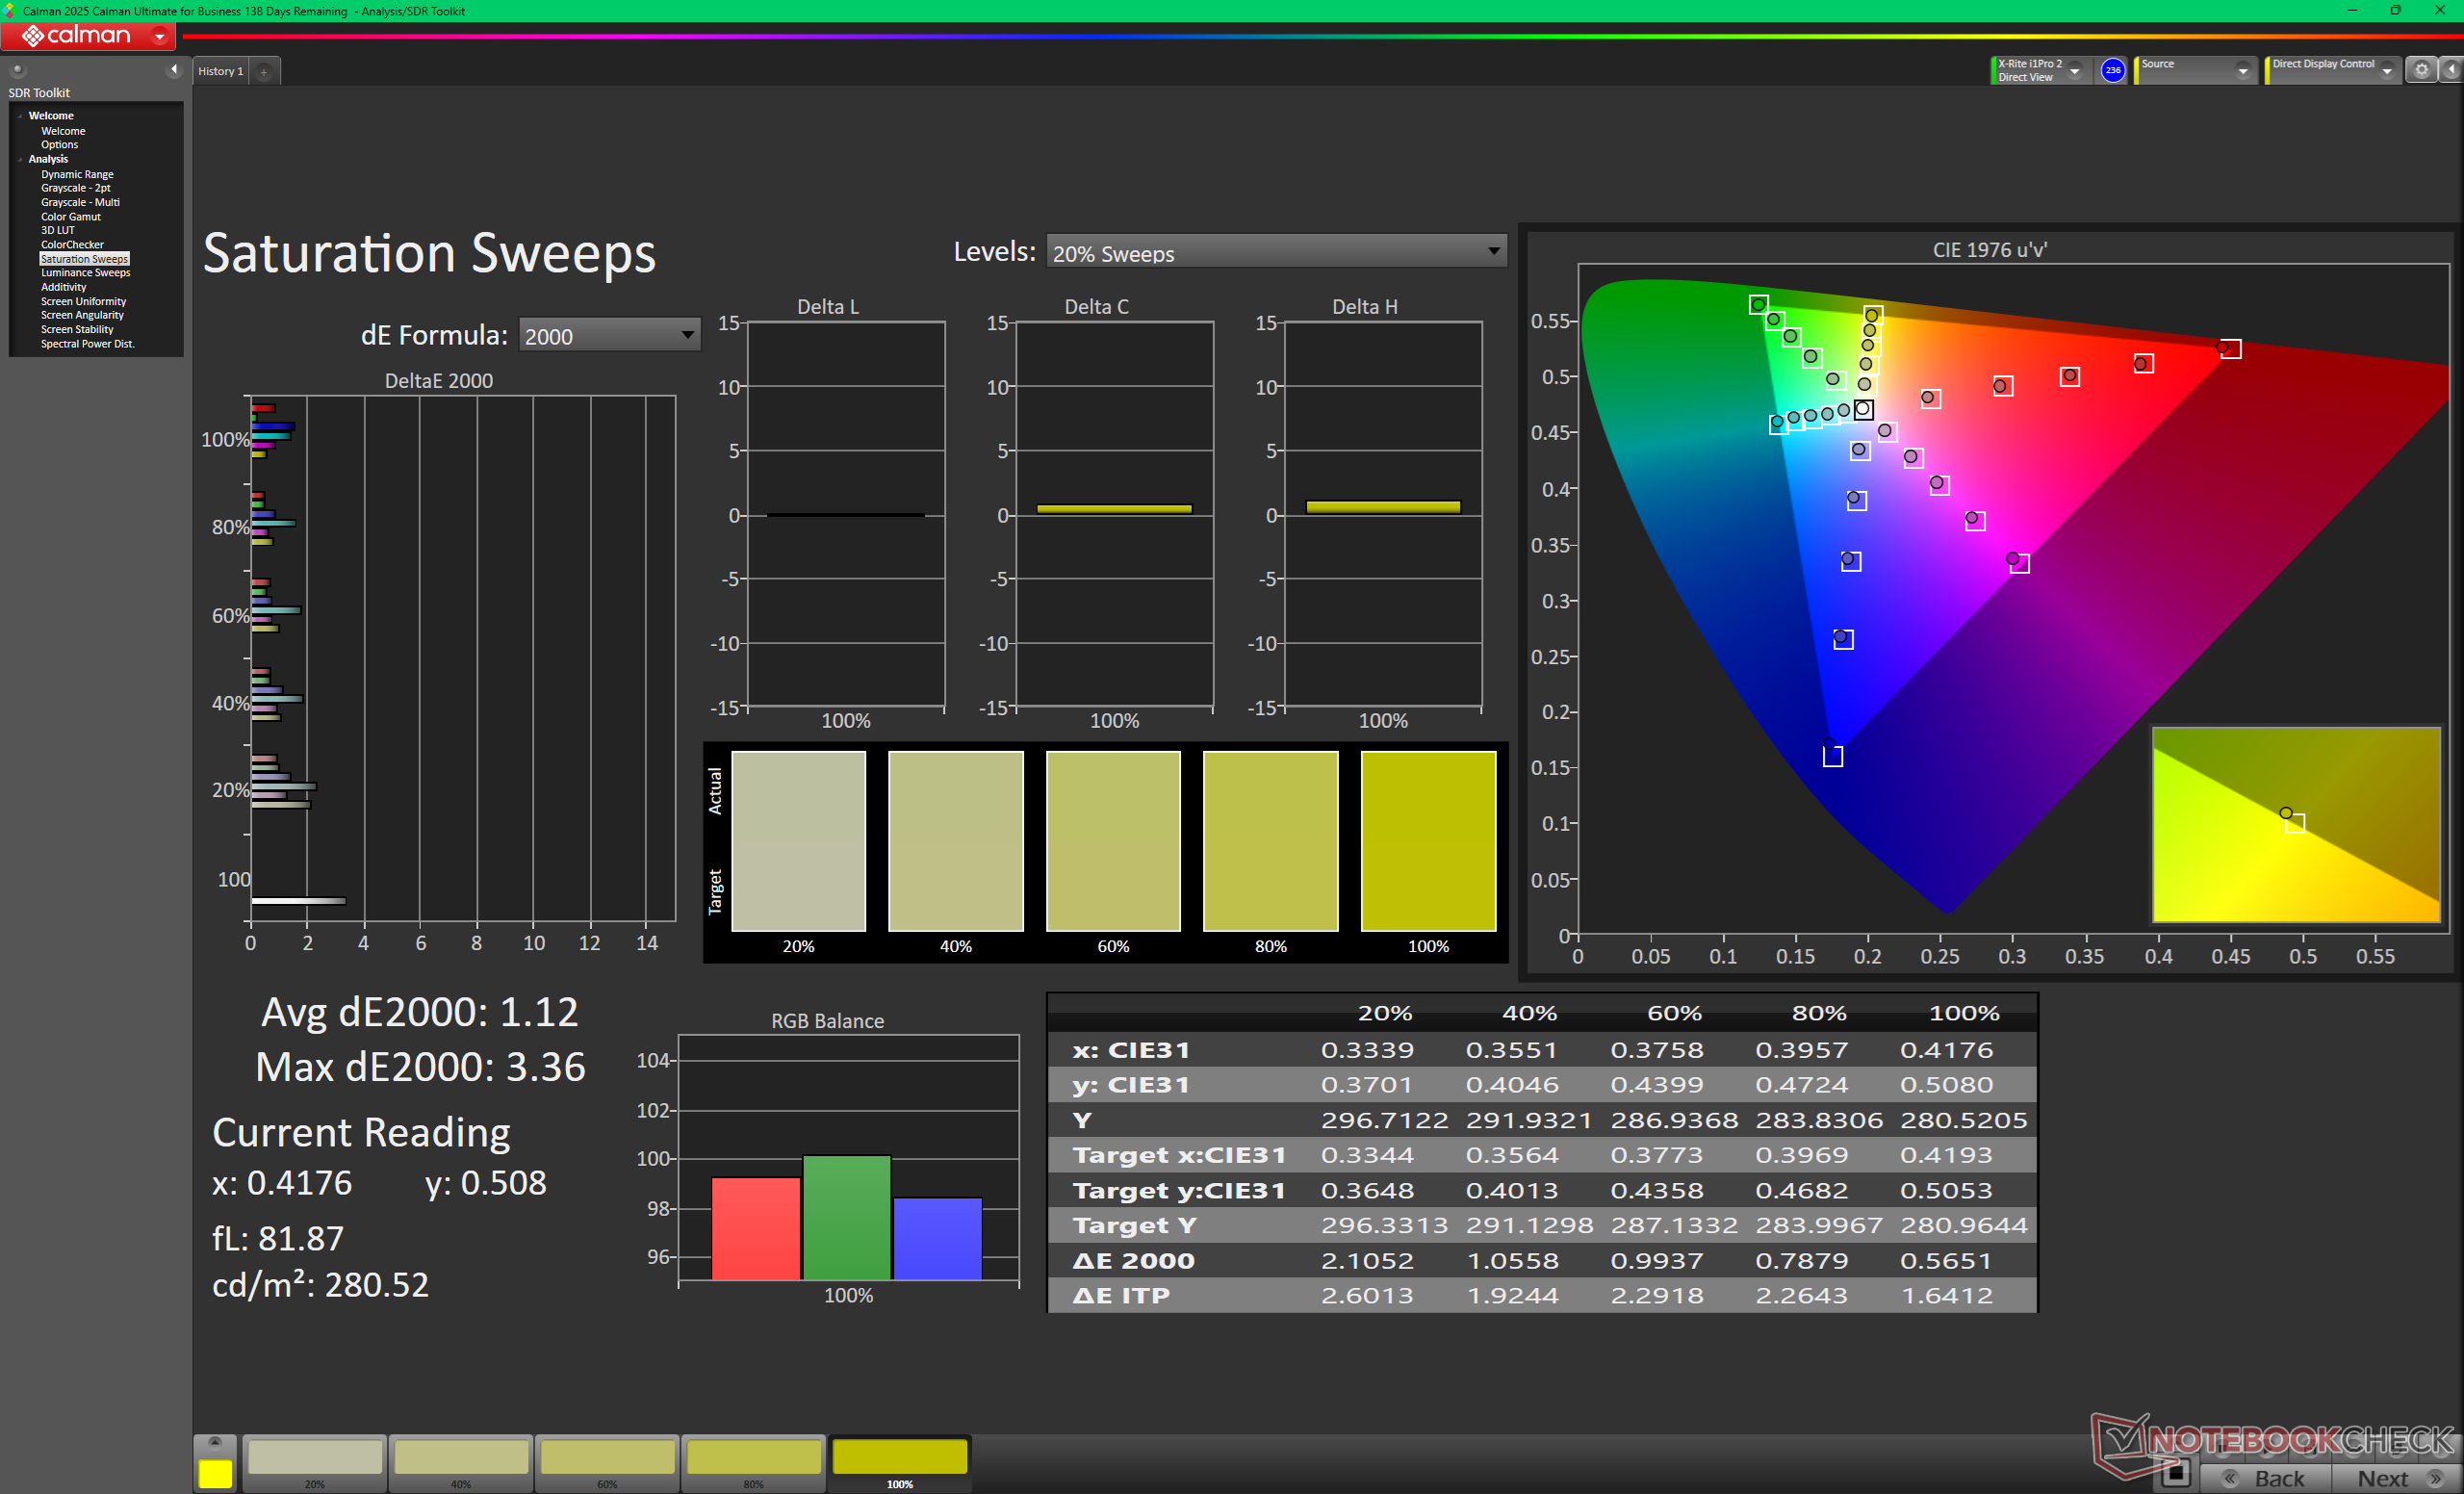
Varreduras de saturação antes da calibração (sRGB)
ColorChecker antes da calibração (sRGB)
Escala de cinza após a calibração
Varreduras de saturação após a calibração
ColorChecker após a calibração

Exibir tempos de resposta

Os tempos de resposta do display mostram a rapidez com que a tela é capaz de mudar de uma cor para outra. Tempos de resposta lentos podem gerar imagens residuais e fazer com que objetos em movimento pareçam desfocados (fantasmas). Os jogadores de títulos 3D de ritmo acelerado devem prestar atenção especial aos tempos de resposta rápidos.
       Tempo de resposta preto para branco
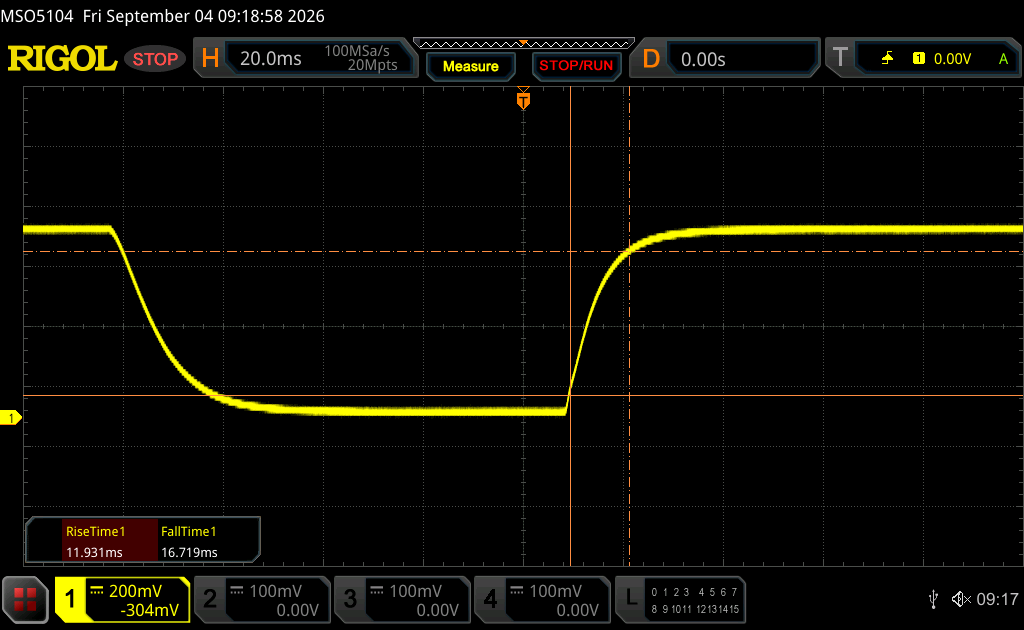
28.6 ms ... ascensão ↗ e queda ↘ combinadas↗ 11.9 ms ascensão
↘ 16.7 ms queda
A tela mostra taxas de resposta relativamente lentas em nossos testes e pode ser muito lenta para os jogadores.
Em comparação, todos os dispositivos testados variam de 0.1 (mínimo) a 240 (máximo) ms. » 76 % de todos os dispositivos são melhores.
Isso significa que o tempo de resposta medido é pior que a média de todos os dispositivos testados (19.7 ms).
       Tempo de resposta 50% cinza a 80% cinza
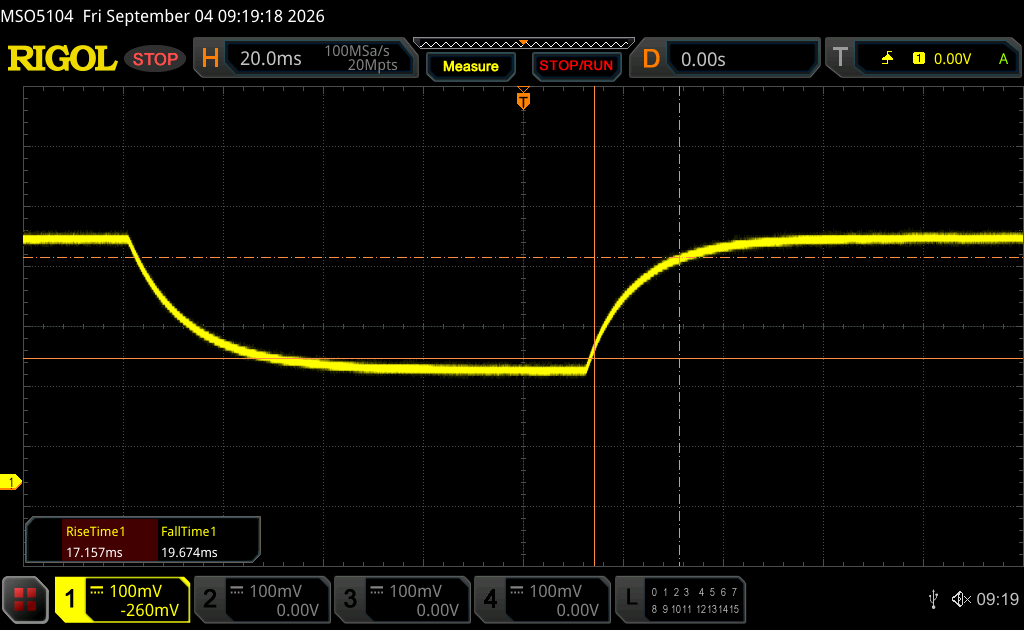
36.9 ms ... ascensão ↗ e queda ↘ combinadas↗ 17.2 ms ascensão
↘ 19.7 ms queda
A tela mostra taxas de resposta lentas em nossos testes e será insatisfatória para os jogadores.
Em comparação, todos os dispositivos testados variam de 0.13 (mínimo) a 636 (máximo) ms. » 54 % de todos os dispositivos são melhores.
Isso significa que o tempo de resposta medido é pior que a média de todos os dispositivos testados (30.8 ms).

Cintilação da tela / PWM (modulação por largura de pulso)

Para escurecer a tela, alguns notebooks simplesmente ligam e desligam a luz de fundo em rápida sucessão - um método chamado Modulação por Largura de Pulso (PWM). Idealmente, esta frequência de ciclagem deve ser indetectável ao olho humano. Se a frequência for muito baixa, os usuários com olhos sensíveis podem sentir cansaço ou dores de cabeça ou até mesmo notar a oscilação total.
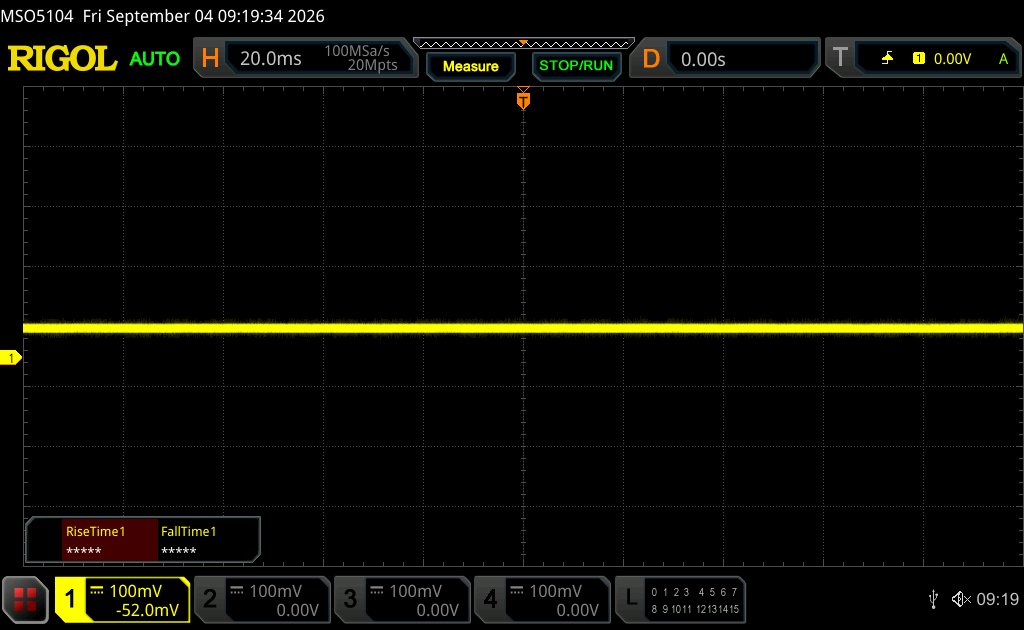
Tela tremeluzindo / PWM não detectado

[pwm_comparison] Em comparação: 52 % de todos os dispositivos testados não usam PWM para escurecer a tela. Se PWM foi detectado, uma média de 7662 (mínimo: 5 - máximo: 343500) Hz foi medida.

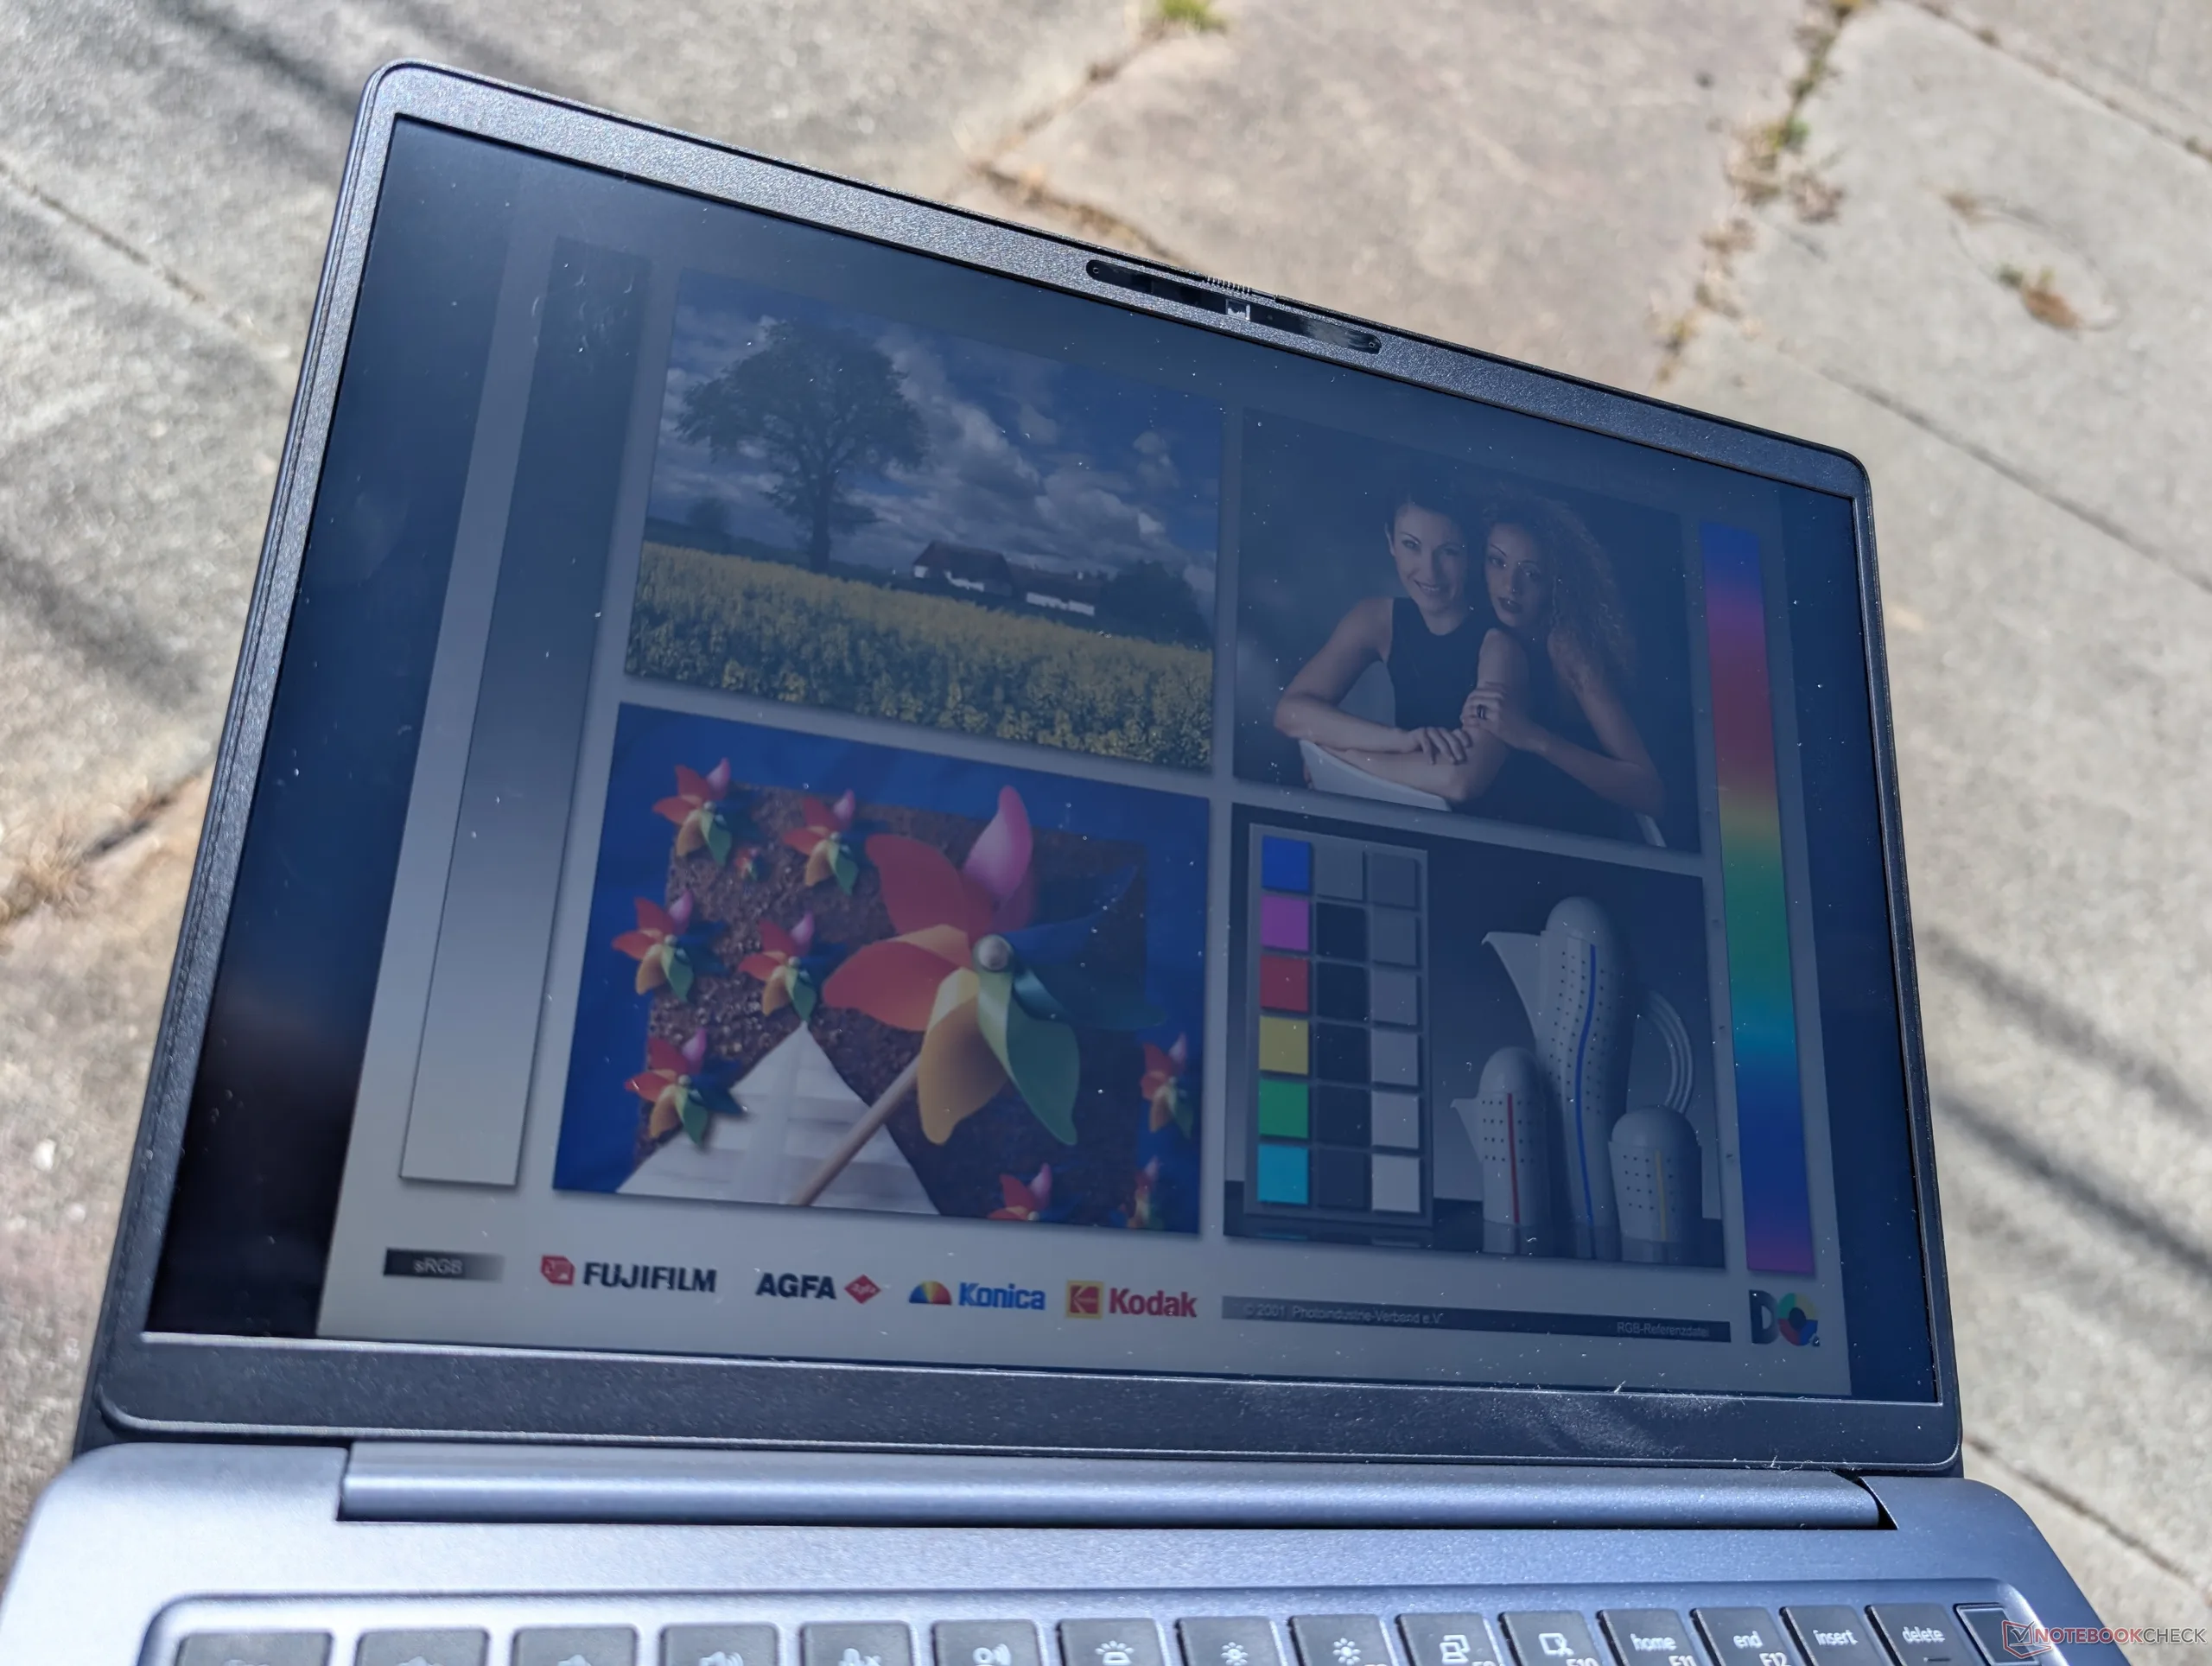
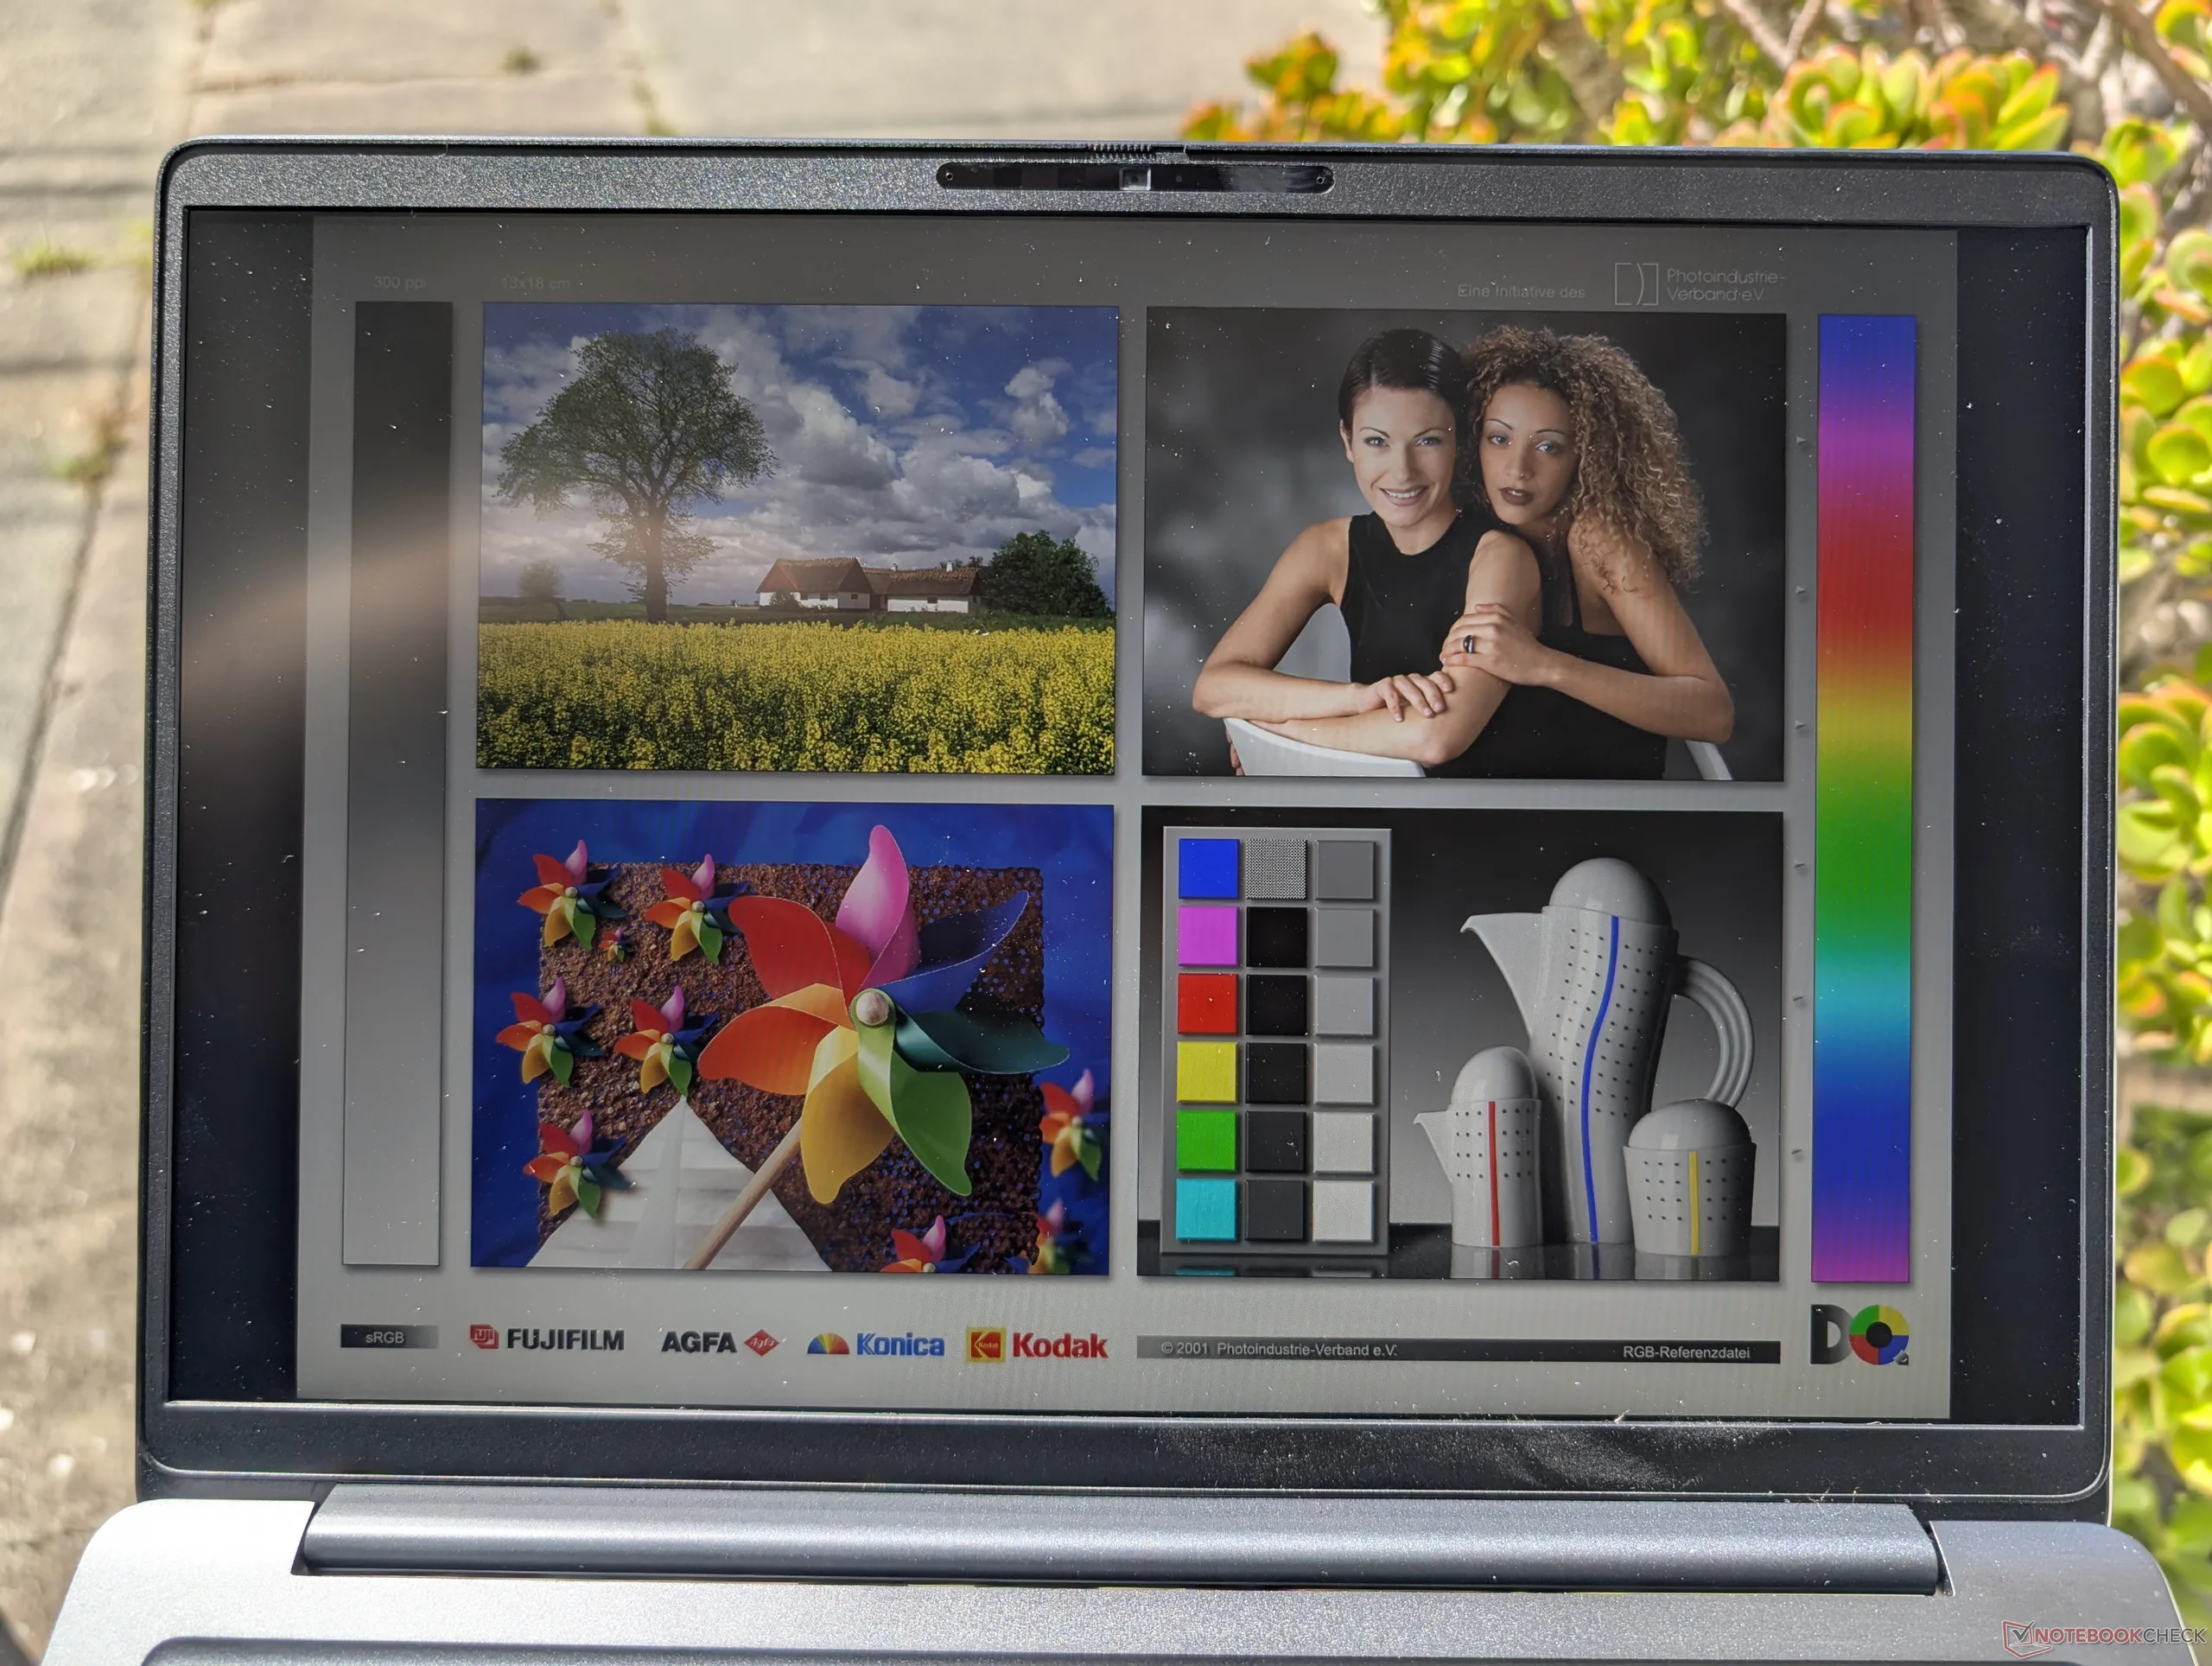
Ao ar livre, sob a luz do sol
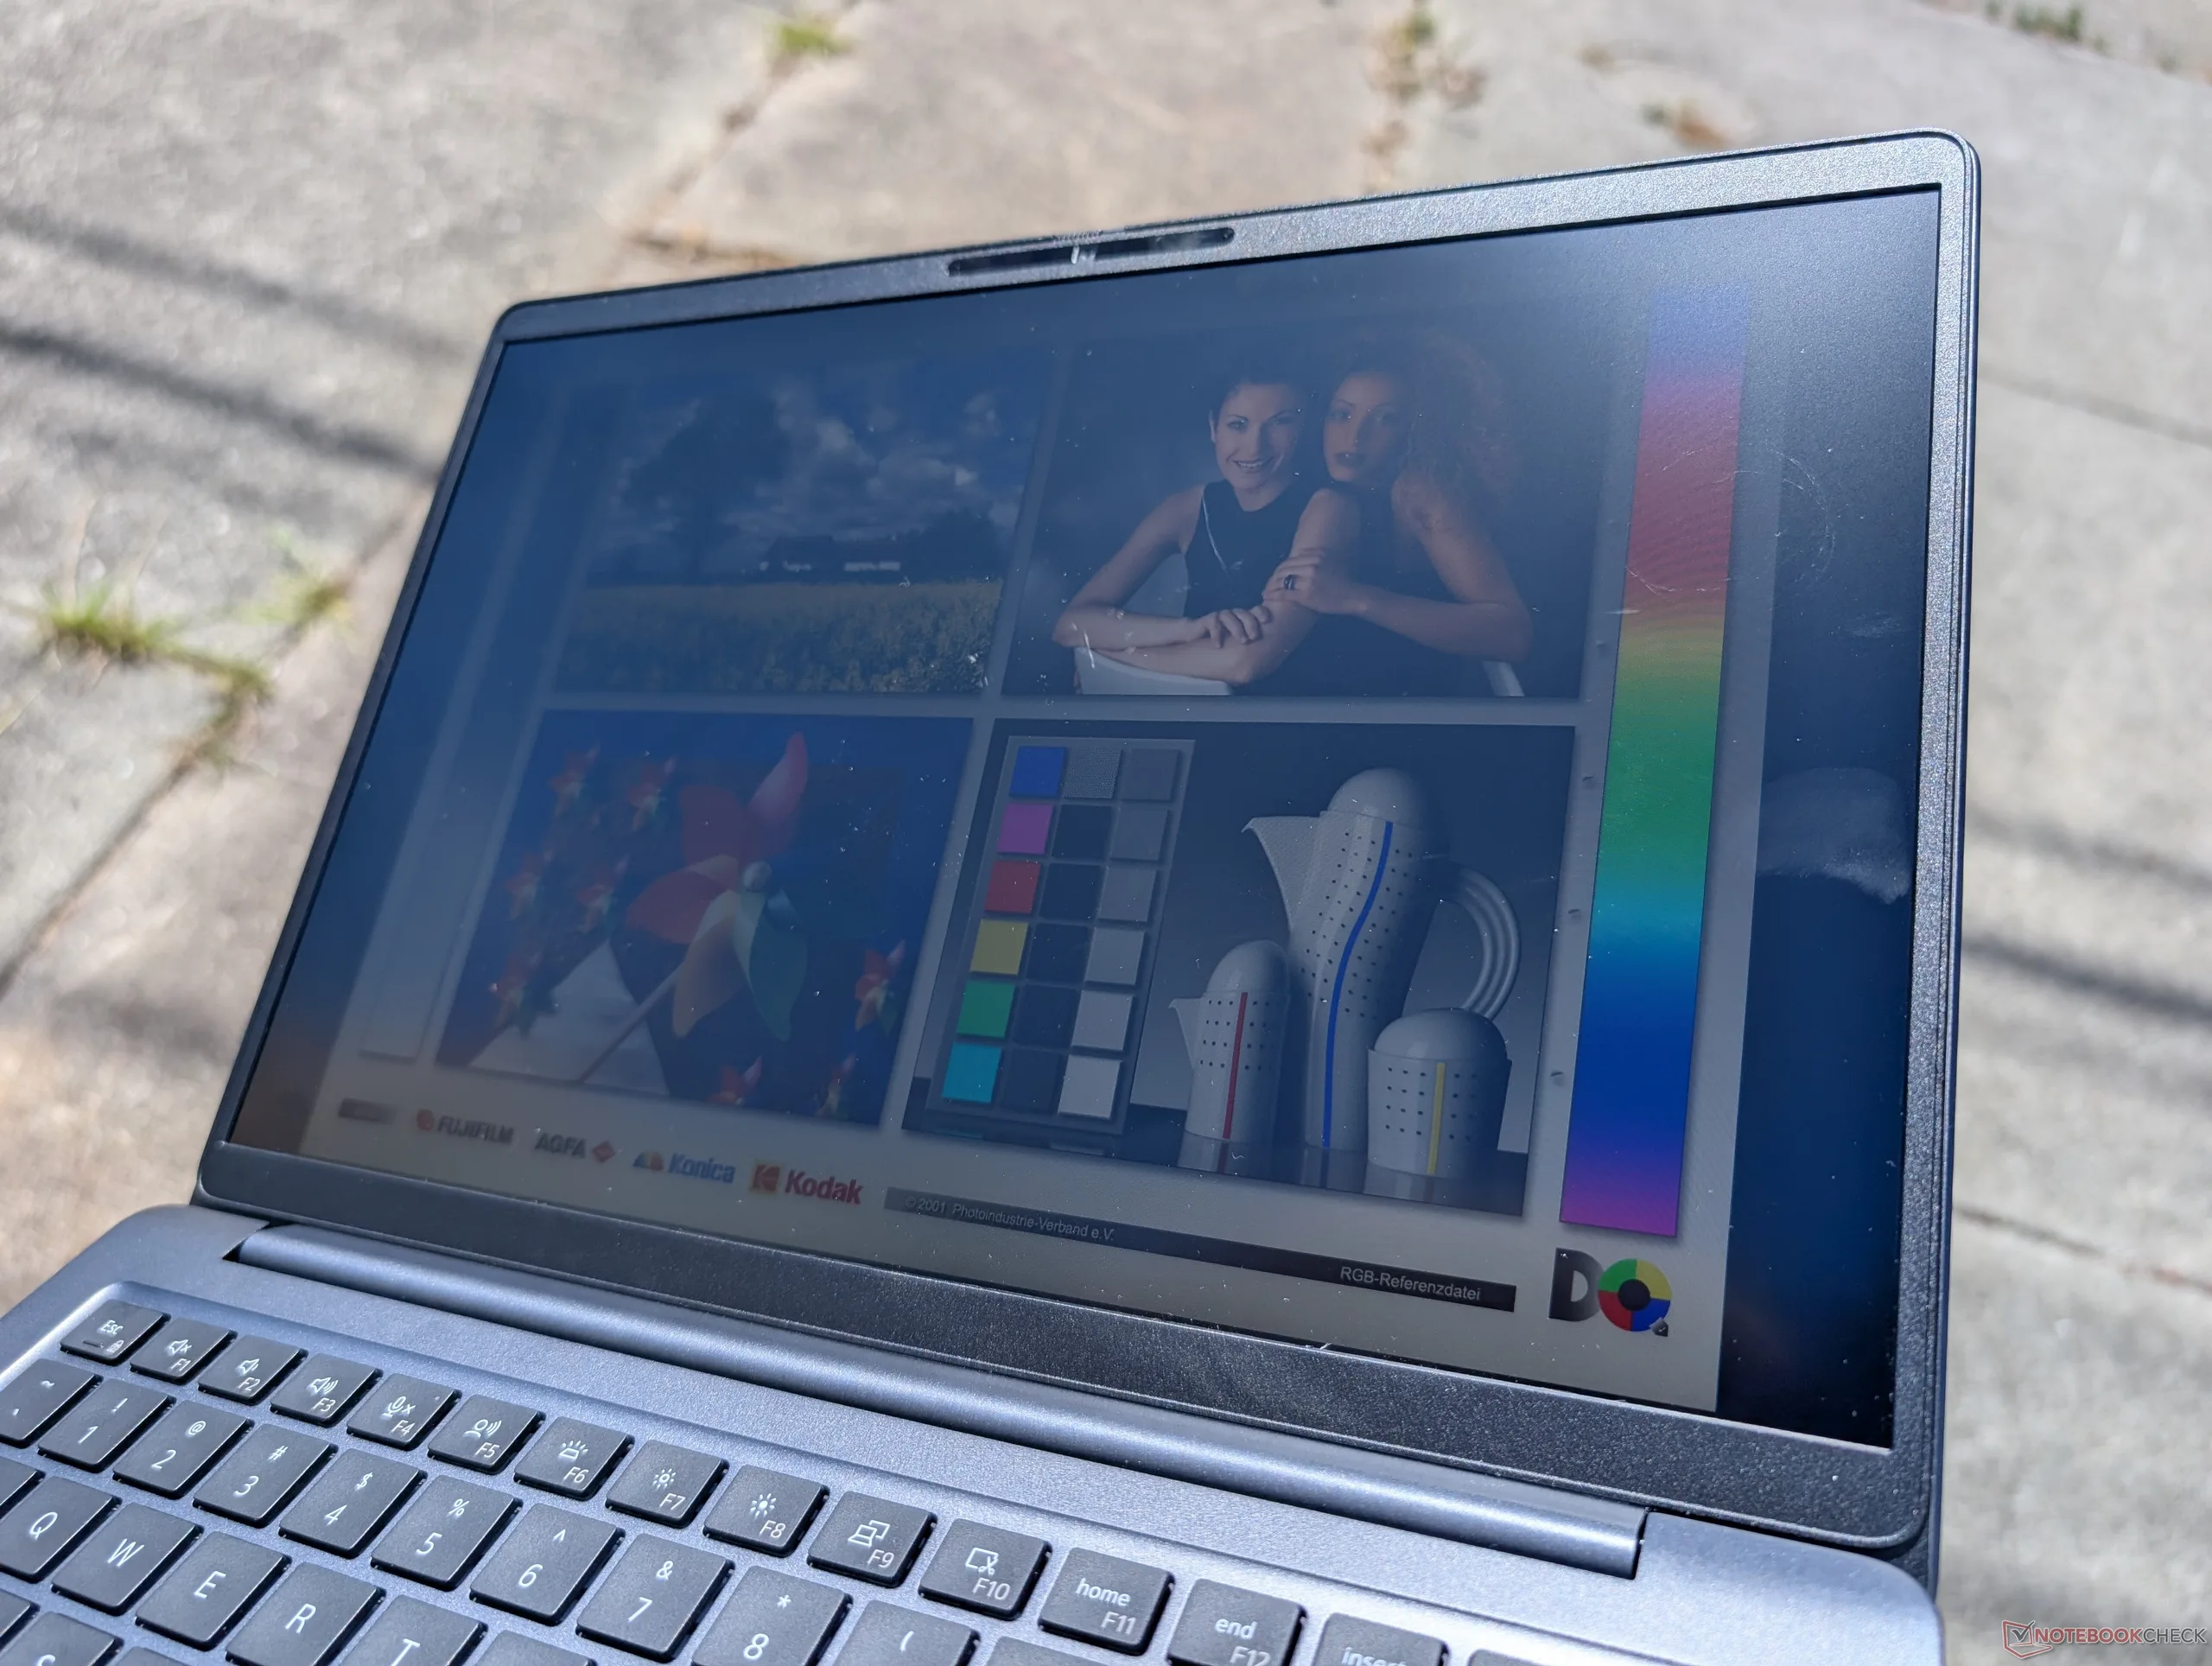
Ao ar livre, à sombra
Ao ar livre, sob a luz do sol
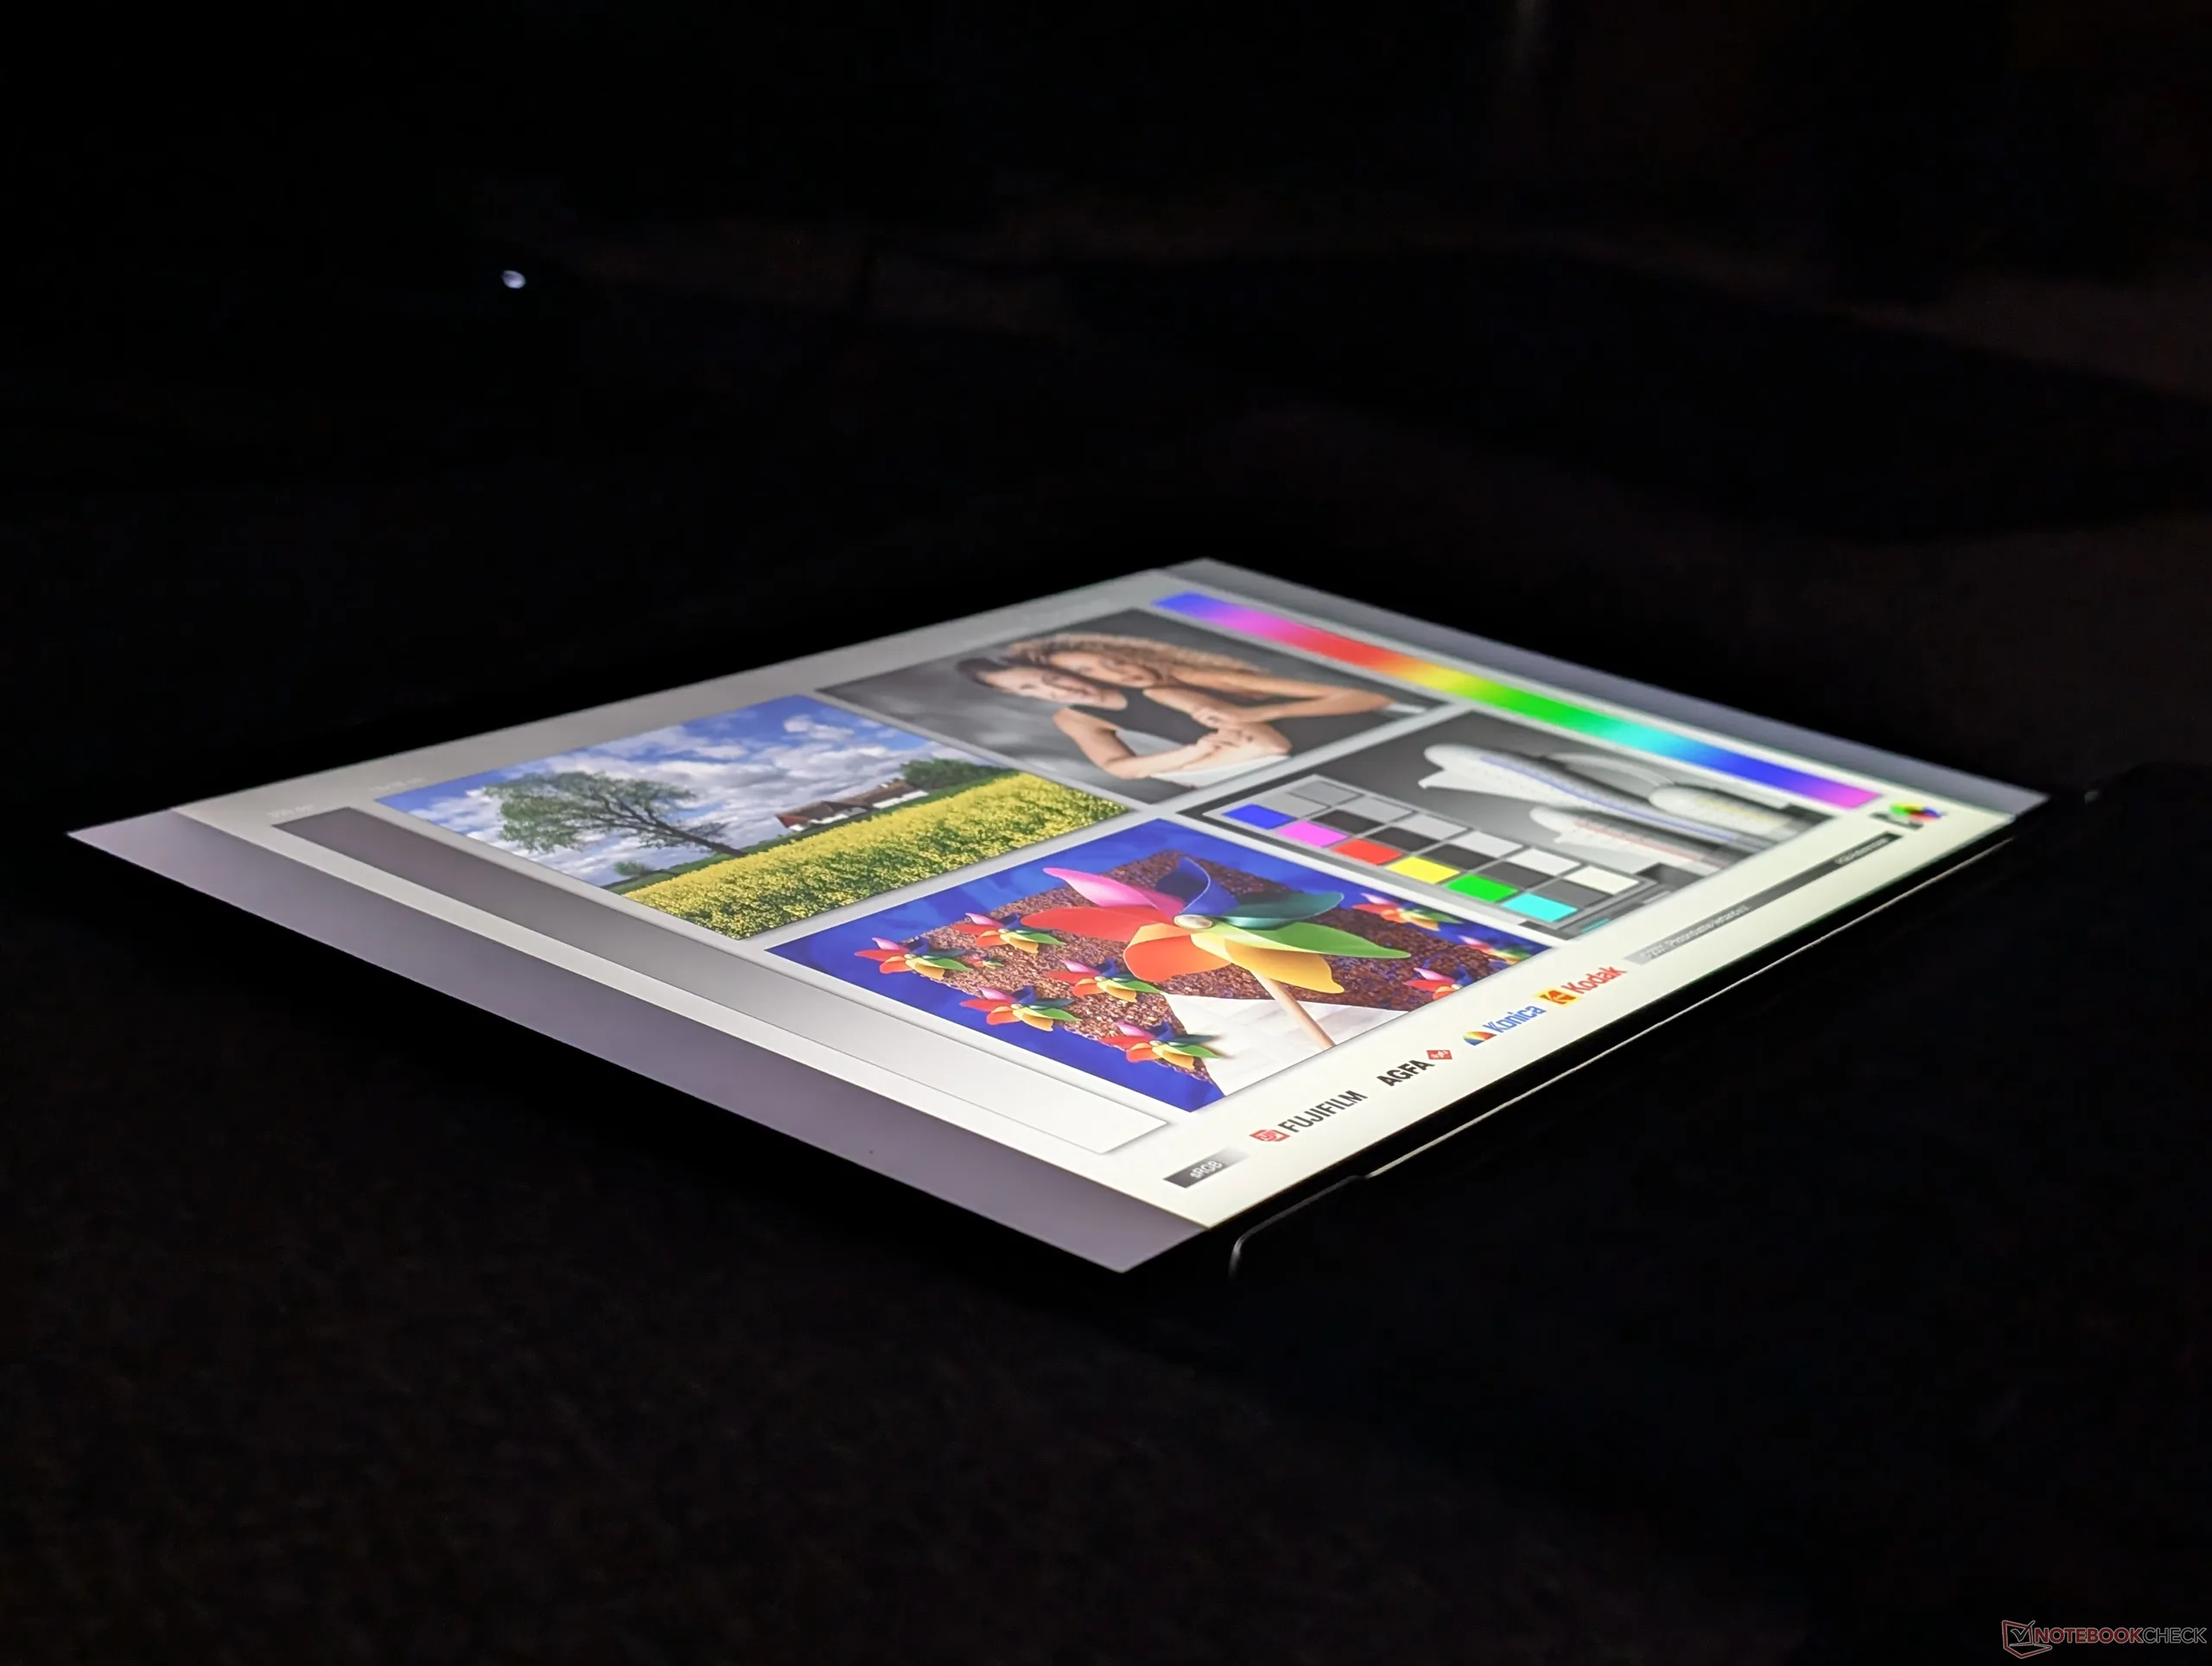
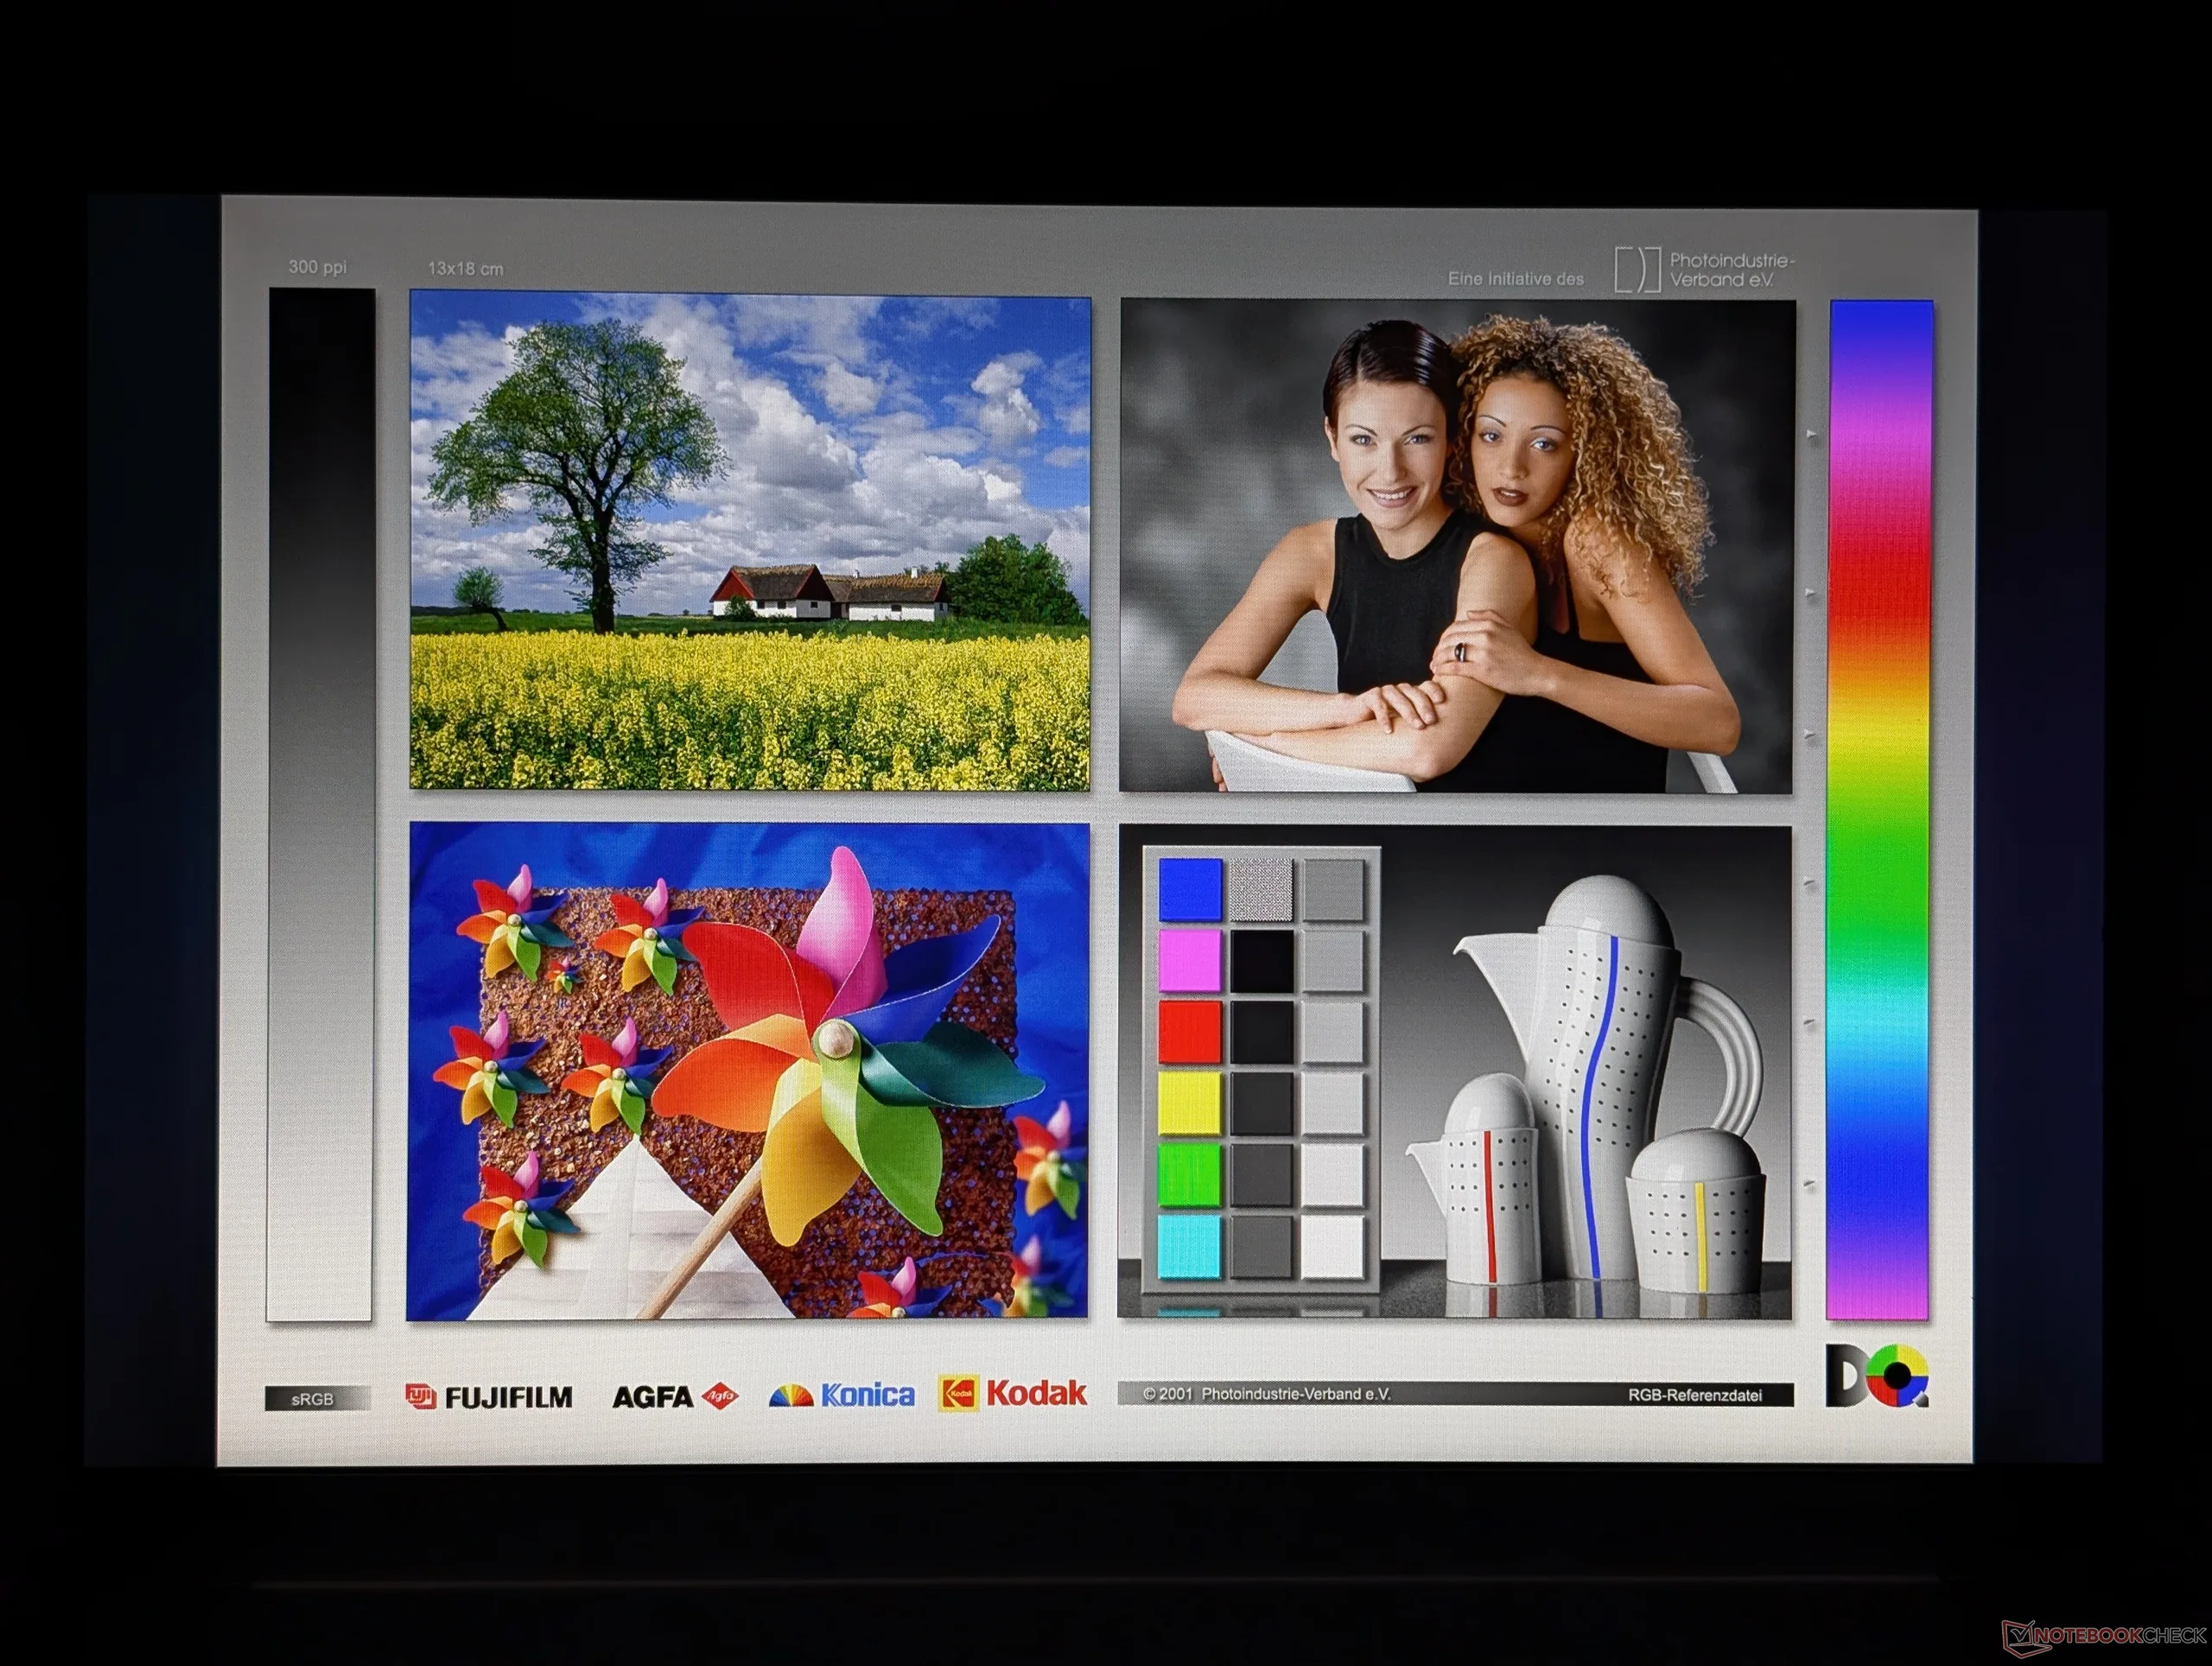
Amplos ângulos de visão IPS

Desempenho

Condições de teste

Configuramos o Windows e o Dell Optimizer no modo de Desempenho antes de executar os testes de desempenho abaixo.

Desempenho do processador

Cinebench R15 Multi Loop

0651301952603253904555205856507157808459109751040110511701235130013651430149515601625169017551820188519502015208021452210227523402405247025352600266527302795286029252990Tooltip
Dell Pro 5 14 P514260 Intel Core Ultra X7 368H: Ø2305 (2162.98-2976.19) Points
Dell Pro 7 14 P714260 Intel Core Ultra 7 366H: Ø2128 (1809.55-2888.92) Points
Lenovo ThinkPad T14s Gen 7 21YW0022GE AMD Ryzen AI 7 PRO 450: Ø2330 (2063.03-2456.7) Points
HP OmniBook Ultra 14 Core Ultra X9 Intel Core Ultra X9 388H: Ø2466 (2420.72-2711.68) Points
Samsung Galaxy Book5 Pro 14 940XHA Intel Core Ultra 5 226V: Ø1380 (1248.24-1530.87) Points
Asus ExpertBook Ultra B9406CAA Intel Core Ultra X7 358H: Ø2886 (2802.49-3038.82) Points
CPU Performance rating: Percent
Cinebench 2026: CPU Multi | CPU Single Thread
Cinebench R23: Multi Core | Single Core
Cinebench R20: CPU (Multi Core) | CPU (Single Core)
Cinebench R15: CPU Multi 64Bit | CPU Single 64Bit
Blender: v2.79 BMW27 CPU
7-Zip 18.03: 7z b 4 | 7z b 4 -mmt1
Geekbench 6.7: Multi-Core | Single-Core
Geekbench 5.5: Multi-Core | Single-Core
HWBOT x265 Benchmark v2.2: 4k Preset
LibreOffice : 20 Documents To PDF
R Benchmark 2.5: Overall mean
CPU Performance rating
Asus ExpertBook Ultra B9406CAA
Intel Core Ultra X7 358H
86.3 pt
HP OmniBook Ultra 14 Core Ultra X9
Intel Core Ultra X9 388H
84.9 pt
Dell Pro 7 14 P714265
AMD Ryzen AI 9 HX PRO 470
84.3 pt
Média Intel Core Ultra X7 368H
 
82.9 pt
Dell Pro 7 14 P714260
Intel Core Ultra 7 366H
82.5 pt
Dell Pro 5 14 P514260
Intel Core Ultra X7 368H
81.9 pt
HP EliteBook 8 G2a 14 -4!
AMD Ryzen AI 7 450
74.8 pt
Lenovo ThinkPad T14s Gen 7 21YW0022GE -2!
AMD Ryzen AI 7 PRO 450
74.2 pt
HP ZBook Ultra G1a 14 B30FBES -4!
AMD Ryzen AI Max PRO 380
69.1 pt
Lenovo Yoga 9 14 2in1 G10 -2!
Intel Core Ultra 7 258V
61.9 pt
Lenovo ThinkPad E14 G8-21Y2006XGE
AMD Ryzen AI 7 345
58.8 pt
Samsung Galaxy Book5 Pro 14 940XHA -2!
Intel Core Ultra 5 226V
57.1 pt
Cinebench 2026 / CPU Multi
Asus ExpertBook Ultra B9406CAA
Intel Core Ultra X7 358H
4512 Points +2%
Dell Pro 5 14 P514260
Intel Core Ultra X7 368H
4440 Points
Média Intel Core Ultra X7 368H
  (n=1)
4440 Points 0%
Dell Pro 7 14 P714265
AMD Ryzen AI 9 HX PRO 470
4142 Points -7%
HP OmniBook Ultra 14 Core Ultra X9
Intel Core Ultra X9 388H
4044 Points -9%
Dell Pro 7 14 P714260
Intel Core Ultra 7 366H
3785 Points -15%
Lenovo ThinkPad E14 G8-21Y2006XGE
AMD Ryzen AI 7 345
2569 Points -42%
Cinebench 2026 / CPU Single Thread
HP OmniBook Ultra 14 Core Ultra X9
Intel Core Ultra X9 388H
533 Points +1%
Dell Pro 5 14 P514260
Intel Core Ultra X7 368H
527 Points
Média Intel Core Ultra X7 368H
  (n=1)
527 Points 0%
Dell Pro 7 14 P714260
Intel Core Ultra 7 366H
510 Points -3%
Asus ExpertBook Ultra B9406CAA
Intel Core Ultra X7 358H
505 Points -4%
Dell Pro 7 14 P714265
AMD Ryzen AI 9 HX PRO 470
471 Points -11%
Lenovo ThinkPad E14 G8-21Y2006XGE
AMD Ryzen AI 7 345
437 Points -17%
Cinebench R23 / Multi Core
Asus ExpertBook Ultra B9406CAA
Intel Core Ultra X7 358H
19841 (17837.1min - 19840.9max) Points +14%
Dell Pro 7 14 P714265
AMD Ryzen AI 9 HX PRO 470
18834 (17418.6min - 18834.3max) Points +9%
HP OmniBook Ultra 14 Core Ultra X9
Intel Core Ultra X9 388H
17663 (16042.7min - 17663.2max) Points +2%
Dell Pro 5 14 P514260
Intel Core Ultra X7 368H
17350 (14392.2min - 17349.7max) Points
Média Intel Core Ultra X7 368H
  (n=1)
17350 Points 0%
Dell Pro 7 14 P714260
Intel Core Ultra 7 366H
17100 (12200.5min - 17100max) Points -1%
HP EliteBook 8 G2a 14
AMD Ryzen AI 7 450
16101 Points -7%
Lenovo ThinkPad T14s Gen 7 21YW0022GE
AMD Ryzen AI 7 PRO 450
16054 Points -7%
HP ZBook Ultra G1a 14 B30FBES
AMD Ryzen AI Max PRO 380
14801 Points -15%
Lenovo ThinkPad E14 G8-21Y2006XGE
AMD Ryzen AI 7 345
11461 Points -34%
Lenovo Yoga 9 14 2in1 G10
Intel Core Ultra 7 258V
11023 Points -36%
Samsung Galaxy Book5 Pro 14 940XHA
Intel Core Ultra 5 226V
9896 Points -43%
Cinebench R23 / Single Core
HP OmniBook Ultra 14 Core Ultra X9
Intel Core Ultra X9 388H
2213 Points +2%
Dell Pro 5 14 P514260
Intel Core Ultra X7 368H
2169 Points
Média Intel Core Ultra X7 368H
  (n=1)
2169 Points 0%
Dell Pro 7 14 P714260
Intel Core Ultra 7 366H
2081 Points -4%
Asus ExpertBook Ultra B9406CAA
Intel Core Ultra X7 358H
2079 Points -4%
Dell Pro 7 14 P714265
AMD Ryzen AI 9 HX PRO 470
2054 Points -5%
HP EliteBook 8 G2a 14
AMD Ryzen AI 7 450
2031 Points -6%
Lenovo ThinkPad T14s Gen 7 21YW0022GE
AMD Ryzen AI 7 PRO 450
2010 Points -7%
HP ZBook Ultra G1a 14 B30FBES
AMD Ryzen AI Max PRO 380
1935 Points -11%
Lenovo Yoga 9 14 2in1 G10
Intel Core Ultra 7 258V
1879 Points -13%
Samsung Galaxy Book5 Pro 14 940XHA
Intel Core Ultra 5 226V
1821 Points -16%
Lenovo ThinkPad E14 G8-21Y2006XGE
AMD Ryzen AI 7 345
1818 Points -16%
Cinebench R20 / CPU (Multi Core)
Dell Pro 5 14 P514260
Intel Core Ultra X7 368H
7938 Points
Média Intel Core Ultra X7 368H
  (n=1)
7938 Points 0%
Asus ExpertBook Ultra B9406CAA
Intel Core Ultra X7 358H
7736 Points -3%
Dell Pro 7 14 P714265
AMD Ryzen AI 9 HX PRO 470
7355 Points -7%
HP OmniBook Ultra 14 Core Ultra X9
Intel Core Ultra X9 388H
7008 Points -12%
Dell Pro 7 14 P714260
Intel Core Ultra 7 366H
6707 Points -16%
Lenovo ThinkPad T14s Gen 7 21YW0022GE
AMD Ryzen AI 7 PRO 450
6274 Points -21%
HP EliteBook 8 G2a 14
AMD Ryzen AI 7 450
6247 Points -21%
HP ZBook Ultra G1a 14 B30FBES
AMD Ryzen AI Max PRO 380
5721 Points -28%
Lenovo ThinkPad E14 G8-21Y2006XGE
AMD Ryzen AI 7 345
4505 Points -43%
Lenovo Yoga 9 14 2in1 G10
Intel Core Ultra 7 258V
4304 Points -46%
Samsung Galaxy Book5 Pro 14 940XHA
Intel Core Ultra 5 226V
3889 Points -51%
Cinebench R20 / CPU (Single Core)
HP OmniBook Ultra 14 Core Ultra X9
Intel Core Ultra X9 388H
832 Points +1%
Dell Pro 5 14 P514260
Intel Core Ultra X7 368H
820 Points
Média Intel Core Ultra X7 368H
  (n=1)
820 Points 0%
Dell Pro 7 14 P714265
AMD Ryzen AI 9 HX PRO 470
806 Points -2%
Lenovo ThinkPad T14s Gen 7 21YW0022GE
AMD Ryzen AI 7 PRO 450
793 Points -3%
HP EliteBook 8 G2a 14
AMD Ryzen AI 7 450
792 Points -3%
Dell Pro 7 14 P714260
Intel Core Ultra 7 366H
789 Points -4%
Asus ExpertBook Ultra B9406CAA
Intel Core Ultra X7 358H
788 Points -4%
HP ZBook Ultra G1a 14 B30FBES
AMD Ryzen AI Max PRO 380
757 Points -8%
Lenovo Yoga 9 14 2in1 G10
Intel Core Ultra 7 258V
724 Points -12%
Lenovo ThinkPad E14 G8-21Y2006XGE
AMD Ryzen AI 7 345
711 Points -13%
Samsung Galaxy Book5 Pro 14 940XHA
Intel Core Ultra 5 226V
703 Points -14%
Cinebench R15 / CPU Multi 64Bit
Dell Pro 7 14 P714265
AMD Ryzen AI 9 HX PRO 470
3274 (2661.34min - 3274.13max) Points +10%
Asus ExpertBook Ultra B9406CAA
Intel Core Ultra X7 358H
3039 (2802.49min - 3038.82max) Points +2%
Dell Pro 5 14 P514260
Intel Core Ultra X7 368H
2976 (2162.98min - 2976.19max) Points
Média Intel Core Ultra X7 368H
  (n=1)
2976 Points 0%
Dell Pro 7 14 P714260
Intel Core Ultra 7 366H
2889 (1809.55min - 2888.92max) Points -3%
HP OmniBook Ultra 14 Core Ultra X9
Intel Core Ultra X9 388H
2712 (2420.72min - 2711.68max) Points -9%
Lenovo ThinkPad T14s Gen 7 21YW0022GE
AMD Ryzen AI 7 PRO 450
2457 (2063.03min - 2456.7max) Points -17%
HP EliteBook 8 G2a 14
AMD Ryzen AI 7 450
2409 (2358.35min - 2409.49max) Points -19%
HP ZBook Ultra G1a 14 B30FBES
AMD Ryzen AI Max PRO 380
2223 (2094.79min - 2223.21max) Points -25%
Lenovo ThinkPad E14 G8-21Y2006XGE
AMD Ryzen AI 7 345
1712 Points -42%
Lenovo Yoga 9 14 2in1 G10
Intel Core Ultra 7 258V
1625 (1490.65min - 1625.36max) Points -45%
Samsung Galaxy Book5 Pro 14 940XHA
Intel Core Ultra 5 226V
1531 (1248.24min - 1530.87max) Points -49%
Cinebench R15 / CPU Single 64Bit
Dell Pro 5 14 P514260
Intel Core Ultra X7 368H
323 Points
Média Intel Core Ultra X7 368H
  (n=1)
323 Points 0%
HP OmniBook Ultra 14 Core Ultra X9
Intel Core Ultra X9 388H
313 Points -3%
Dell Pro 7 14 P714265
AMD Ryzen AI 9 HX PRO 470
313 Points -3%
Asus ExpertBook Ultra B9406CAA
Intel Core Ultra X7 358H
309 Points -4%
Dell Pro 7 14 P714260
Intel Core Ultra 7 366H
305 Points -6%
HP ZBook Ultra G1a 14 B30FBES
AMD Ryzen AI Max PRO 380
292 Points -10%
Lenovo Yoga 9 14 2in1 G10
Intel Core Ultra 7 258V
291 Points -10%
Samsung Galaxy Book5 Pro 14 940XHA
Intel Core Ultra 5 226V
278 Points -14%
Lenovo ThinkPad E14 G8-21Y2006XGE
AMD Ryzen AI 7 345
271 Points -16%
HP EliteBook 8 G2a 14
AMD Ryzen AI 7 450
235 Points -27%
Lenovo ThinkPad T14s Gen 7 21YW0022GE
AMD Ryzen AI 7 PRO 450
220 Points -32%
Blender / v2.79 BMW27 CPU
Samsung Galaxy Book5 Pro 14 940XHA
Intel Core Ultra 5 226V
357 Seconds * -99%
Lenovo Yoga 9 14 2in1 G10
Intel Core Ultra 7 258V
324 Seconds * -81%
Lenovo ThinkPad E14 G8-21Y2006XGE
AMD Ryzen AI 7 345
286 Seconds * -60%
HP ZBook Ultra G1a 14 B30FBES
AMD Ryzen AI Max PRO 380
225 Seconds * -26%
Dell Pro 7 14 P714260
Intel Core Ultra 7 366H
211 Seconds * -18%
Lenovo ThinkPad T14s Gen 7 21YW0022GE
AMD Ryzen AI 7 PRO 450
205 Seconds * -15%
HP EliteBook 8 G2a 14
AMD Ryzen AI 7 450
203 Seconds * -13%
HP OmniBook Ultra 14 Core Ultra X9
Intel Core Ultra X9 388H
198 Seconds * -11%
Dell Pro 5 14 P514260
Intel Core Ultra X7 368H
179 Seconds *
Média Intel Core Ultra X7 368H
  (n=1)
179 Seconds * -0%
Dell Pro 7 14 P714265
AMD Ryzen AI 9 HX PRO 470
178 Seconds * +1%
Asus ExpertBook Ultra B9406CAA
Intel Core Ultra X7 358H
175 Seconds * +2%
7-Zip 18.03 / 7z b 4
Dell Pro 7 14 P714265
AMD Ryzen AI 9 HX PRO 470
71554 MIPS +12%
Asus ExpertBook Ultra B9406CAA
Intel Core Ultra X7 358H
68533 MIPS +8%
Dell Pro 5 14 P514260
Intel Core Ultra X7 368H
63679 MIPS
Média Intel Core Ultra X7 368H
  (n=1)
63679 MIPS 0%
HP OmniBook Ultra 14 Core Ultra X9
Intel Core Ultra X9 388H
62372 MIPS -2%
Dell Pro 7 14 P714260
Intel Core Ultra 7 366H
61353 MIPS -4%
HP EliteBook 8 G2a 14
AMD Ryzen AI 7 450
59952 MIPS -6%
Lenovo ThinkPad T14s Gen 7 21YW0022GE
AMD Ryzen AI 7 PRO 450
57988 MIPS -9%
HP ZBook Ultra G1a 14 B30FBES
AMD Ryzen AI Max PRO 380
51408 MIPS -19%
Lenovo ThinkPad E14 G8-21Y2006XGE
AMD Ryzen AI 7 345
41884 MIPS -34%
Lenovo Yoga 9 14 2in1 G10
Intel Core Ultra 7 258V
36407 MIPS -43%
Samsung Galaxy Book5 Pro 14 940XHA
Intel Core Ultra 5 226V
33446 MIPS -47%
7-Zip 18.03 / 7z b 4 -mmt1
HP OmniBook Ultra 14 Core Ultra X9
Intel Core Ultra X9 388H
6699 MIPS +4%
Dell Pro 5 14 P514260
Intel Core Ultra X7 368H
6434 MIPS
Média Intel Core Ultra X7 368H
  (n=1)
6434 MIPS 0%
Dell Pro 7 14 P714260
Intel Core Ultra 7 366H
6359 MIPS -1%
HP EliteBook 8 G2a 14
AMD Ryzen AI 7 450
6192 MIPS -4%
Asus ExpertBook Ultra B9406CAA
Intel Core Ultra X7 358H
6170 MIPS -4%
Dell Pro 7 14 P714265
AMD Ryzen AI 9 HX PRO 470
6041 MIPS -6%
Lenovo ThinkPad T14s Gen 7 21YW0022GE
AMD Ryzen AI 7 PRO 450
5945 MIPS -8%
Lenovo Yoga 9 14 2in1 G10
Intel Core Ultra 7 258V
5833 MIPS -9%
HP ZBook Ultra G1a 14 B30FBES
AMD Ryzen AI Max PRO 380
5574 MIPS -13%
Lenovo ThinkPad E14 G8-21Y2006XGE
AMD Ryzen AI 7 345
5499 MIPS -15%
Samsung Galaxy Book5 Pro 14 940XHA
Intel Core Ultra 5 226V
5341 MIPS -17%
Geekbench 6.7 / Multi-Core
Dell Pro 7 14 P714260
Intel Core Ultra 7 366H
16801 Points +39%
Asus ExpertBook Ultra B9406CAA
Intel Core Ultra X7 358H
16674 Points +38%
HP OmniBook Ultra 14 Core Ultra X9
Intel Core Ultra X9 388H
16568 Points +37%
Dell Pro 7 14 P714265
AMD Ryzen AI 9 HX PRO 470
14979 Points +24%
Média Intel Core Ultra X7 368H
  (12050 - 17352, n=3)
14936 Points +24%
HP EliteBook 8 G2a 14
AMD Ryzen AI 7 450
13611 Points +13%
Lenovo ThinkPad T14s Gen 7 21YW0022GE
AMD Ryzen AI 7 PRO 450
13439 Points +12%
HP ZBook Ultra G1a 14 B30FBES
AMD Ryzen AI Max PRO 380
12139 Points +1%
Dell Pro 5 14 P514260
Intel Core Ultra X7 368H
12050 Points
Lenovo Yoga 9 14 2in1 G10
Intel Core Ultra 7 258V
10991 Points -9%
Samsung Galaxy Book5 Pro 14 940XHA
Intel Core Ultra 5 226V
10114 Points -16%
Lenovo ThinkPad E14 G8-21Y2006XGE
AMD Ryzen AI 7 345
9100 Points -24%
Geekbench 6.7 / Single-Core
HP OmniBook Ultra 14 Core Ultra X9
Intel Core Ultra X9 388H
3027 Points +4%
Média Intel Core Ultra X7 368H
  (2924 - 2983, n=2)
2954 Points +1%
Dell Pro 5 14 P514260
Intel Core Ultra X7 368H
2924 Points
Dell Pro 7 14 P714265
AMD Ryzen AI 9 HX PRO 470
2918 Points 0%
HP EliteBook 8 G2a 14
AMD Ryzen AI 7 450
2914 Points 0%
Lenovo ThinkPad T14s Gen 7 21YW0022GE
AMD Ryzen AI 7 PRO 450
2899 Points -1%
Dell Pro 7 14 P714260
Intel Core Ultra 7 366H
2866 Points -2%
Asus ExpertBook Ultra B9406CAA
Intel Core Ultra X7 358H
2836 Points -3%
Lenovo Yoga 9 14 2in1 G10
Intel Core Ultra 7 258V
2761 Points -6%
HP ZBook Ultra G1a 14 B30FBES
AMD Ryzen AI Max PRO 380
2732 Points -7%
Samsung Galaxy Book5 Pro 14 940XHA
Intel Core Ultra 5 226V
2627 Points -10%
Lenovo ThinkPad E14 G8-21Y2006XGE
AMD Ryzen AI 7 345
2604 Points -11%
Geekbench 5.5 / Multi-Core
Asus ExpertBook Ultra B9406CAA
Intel Core Ultra X7 358H
16929 Points +49%
Dell Pro 7 14 P714260
Intel Core Ultra 7 366H
16399 Points +44%
HP OmniBook Ultra 14 Core Ultra X9
Intel Core Ultra X9 388H
15933 Points +40%
Dell Pro 7 14 P714265
AMD Ryzen AI 9 HX PRO 470
15013 Points +32%
Lenovo ThinkPad T14s Gen 7 21YW0022GE
AMD Ryzen AI 7 PRO 450
12037 Points +6%
Dell Pro 5 14 P514260
Intel Core Ultra X7 368H
11378 Points
Média Intel Core Ultra X7 368H
  (n=1)
11378 Points 0%
Lenovo Yoga 9 14 2in1 G10
Intel Core Ultra 7 258V
9651 Points -15%
Samsung Galaxy Book5 Pro 14 940XHA
Intel Core Ultra 5 226V
8941 Points -21%
Lenovo ThinkPad E14 G8-21Y2006XGE
AMD Ryzen AI 7 345
8139 Points -28%
Geekbench 5.5 / Single-Core
HP OmniBook Ultra 14 Core Ultra X9
Intel Core Ultra X9 388H
2224 Points +2%
Dell Pro 5 14 P514260
Intel Core Ultra X7 368H
2183 Points
Média Intel Core Ultra X7 368H
  (n=1)
2183 Points 0%
Lenovo ThinkPad T14s Gen 7 21YW0022GE
AMD Ryzen AI 7 PRO 450
2148 Points -2%
Dell Pro 7 14 P714265
AMD Ryzen AI 9 HX PRO 470
2129 Points -2%
Dell Pro 7 14 P714260
Intel Core Ultra 7 366H
2125 Points -3%
Asus ExpertBook Ultra B9406CAA
Intel Core Ultra X7 358H
2116 Points -3%
Lenovo Yoga 9 14 2in1 G10
Intel Core Ultra 7 258V
2021 Points -7%
Samsung Galaxy Book5 Pro 14 940XHA
Intel Core Ultra 5 226V
1912 Points -12%
Lenovo ThinkPad E14 G8-21Y2006XGE
AMD Ryzen AI 7 345
1807 Points -17%
HWBOT x265 Benchmark v2.2 / 4k Preset
Asus ExpertBook Ultra B9406CAA
Intel Core Ultra X7 358H
23.1 fps +64%
Dell Pro 7 14 P714265
AMD Ryzen AI 9 HX PRO 470
21.9 fps +55%
HP EliteBook 8 G2a 14
AMD Ryzen AI 7 450
21.2 fps +50%
HP OmniBook Ultra 14 Core Ultra X9
Intel Core Ultra X9 388H
20.6 fps +46%
Lenovo ThinkPad T14s Gen 7 21YW0022GE
AMD Ryzen AI 7 PRO 450
20.1 fps +43%
Dell Pro 7 14 P714260
Intel Core Ultra 7 366H
19.4 fps +38%
HP ZBook Ultra G1a 14 B30FBES
AMD Ryzen AI Max PRO 380
18.1 fps +28%
Lenovo ThinkPad E14 G8-21Y2006XGE
AMD Ryzen AI 7 345
14.8 fps +5%
Dell Pro 5 14 P514260
Intel Core Ultra X7 368H
14.1 fps
Média Intel Core Ultra X7 368H
  (n=1)
14.1 fps 0%
Lenovo Yoga 9 14 2in1 G10
Intel Core Ultra 7 258V
13.8 fps -2%
Samsung Galaxy Book5 Pro 14 940XHA
Intel Core Ultra 5 226V
12.2 fps -13%
LibreOffice / 20 Documents To PDF
Lenovo ThinkPad E14 G8-21Y2006XGE
AMD Ryzen AI 7 345
98.7 s * -152%
HP ZBook Ultra G1a 14 B30FBES
AMD Ryzen AI Max PRO 380
59.7 s * -53%
Dell Pro 7 14 P714265
AMD Ryzen AI 9 HX PRO 470
55.4 s * -42%
Lenovo ThinkPad T14s Gen 7 21YW0022GE
AMD Ryzen AI 7 PRO 450
53.1 s * -36%
Asus ExpertBook Ultra B9406CAA
Intel Core Ultra X7 358H
51.9 s * -33%
Samsung Galaxy Book5 Pro 14 940XHA
Intel Core Ultra 5 226V
49.7 s * -27%
Lenovo Yoga 9 14 2in1 G10
Intel Core Ultra 7 258V
47 s * -20%
HP OmniBook Ultra 14 Core Ultra X9
Intel Core Ultra X9 388H
45.9 s * -17%
HP EliteBook 8 G2a 14
AMD Ryzen AI 7 450
44.9 s * -15%
Dell Pro 7 14 P714260
Intel Core Ultra 7 366H
40.3 s * -3%
Dell Pro 5 14 P514260
Intel Core Ultra X7 368H
39.1 s *
Média Intel Core Ultra X7 368H
  (n=1)
39.1 s * -0%
R Benchmark 2.5 / Overall mean
Samsung Galaxy Book5 Pro 14 940XHA
Intel Core Ultra 5 226V
0.4719 sec * -14%
Lenovo Yoga 9 14 2in1 G10
Intel Core Ultra 7 258V
0.4511 sec * -9%
Lenovo ThinkPad E14 G8-21Y2006XGE
AMD Ryzen AI 7 345
0.4422 sec * -7%
Lenovo ThinkPad T14s Gen 7 21YW0022GE
AMD Ryzen AI 7 PRO 450
0.4332 sec * -5%
Asus ExpertBook Ultra B9406CAA
Intel Core Ultra X7 358H
0.4247 sec * -3%
HP EliteBook 8 G2a 14
AMD Ryzen AI 7 450
0.4177 sec * -1%
HP ZBook Ultra G1a 14 B30FBES
AMD Ryzen AI Max PRO 380
0.4146 sec * -0%
Dell Pro 7 14 P714260
Intel Core Ultra 7 366H
0.4144 sec * -0%
Dell Pro 5 14 P514260
Intel Core Ultra X7 368H
0.4137 sec *
Média Intel Core Ultra X7 368H
  (n=1)
0.4137 sec * -0%
Dell Pro 7 14 P714265
AMD Ryzen AI 9 HX PRO 470
0.4047 sec * +2%
HP OmniBook Ultra 14 Core Ultra X9
Intel Core Ultra X9 388H
0.4045 sec * +2%

* ... menor é melhor

Cinebench R15 CPU Multi 64Bit
2976 Points
Cinebench R15 OpenGL 64Bit
234 fps
Cinebench R15 Ref. Match 64Bit
97.8 %
Cinebench R15 CPU Single 64Bit
323 Points
Cinebench R20 CPU (Multi Core)
7938 Points
Cinebench R20 CPU (Single Core)
820 Points
Cinebench R23 Single Core
2169 Points
Cinebench R23 Multi Core
17350 Points
Cinebench 2024 CPU Single Core
128.8 Points
Cinebench 2024 CPU Multi Core
1104 Points
Cinebench 2026 CPU Multi
4440 Points
Cinebench 2026 CPU Single Thread
527 Points
Ajuda
Performance rating
Lenovo ThinkPad T14s Gen 7 21YW0022GE -1!
AMD Ryzen AI 7 PRO 450, Radeon 860M
92.7 pt
Dell Pro 5 14 P514260 -1!
Intel Core Ultra X7 368H, Arc B390 Panther Lake iGPU
84.1 pt
Média Intel Core Ultra X7 368H -1!
 
84.1 pt
HP OmniBook Ultra 14 Core Ultra X9 -1!
Intel Core Ultra X9 388H, Arc B390 Panther Lake iGPU
77.2 pt
Dell Pro 7 14 P714260 -1!
Intel Core Ultra 7 366H, Intel Graphics 4 Xe3 PTL
72.8 pt
Asus ExpertBook Ultra B9406CAA -1!
Intel Core Ultra X7 358H, Arc B390 Panther Lake iGPU
53.4 pt
Samsung Galaxy Book5 Pro 14 940XHA -1!
Intel Core Ultra 5 226V, Arc 130V
51.4 pt
AIDA64 / FP32 Ray-Trace
Lenovo ThinkPad T14s Gen 7 21YW0022GE
AMD Ryzen AI 7 PRO 450, Radeon 860M (v8.20.8100)
24488 KRay/s +42%
Dell Pro 5 14 P514260
Intel Core Ultra X7 368H, Arc B390 Panther Lake iGPU (v8.20.8100)
17245 KRay/s
Média Intel Core Ultra X7 368H
  (n=1)
17245 KRay/s 0%
HP OmniBook Ultra 14 Core Ultra X9
Intel Core Ultra X9 388H, Arc B390 Panther Lake iGPU (v8.20.8100)
15651 KRay/s -9%
Dell Pro 7 14 P714260
Intel Core Ultra 7 366H, Intel Graphics 4 Xe3 PTL (v8.20.8100)
14248 KRay/s -17%
Asus ExpertBook Ultra B9406CAA
Intel Core Ultra X7 358H, Arc B390 Panther Lake iGPU (v6.92.6600)
12221 KRay/s -29%
Samsung Galaxy Book5 Pro 14 940XHA
Intel Core Ultra 5 226V, Arc 130V (v6.92.6600)
11876 KRay/s -31%
AIDA64 / FPU Julia
Lenovo ThinkPad T14s Gen 7 21YW0022GE
AMD Ryzen AI 7 PRO 450, Radeon 860M (v8.20.8100)
100434 Points +11%
Dell Pro 5 14 P514260
Intel Core Ultra X7 368H, Arc B390 Panther Lake iGPU (v8.20.8100)
90689 Points
Média Intel Core Ultra X7 368H
  (n=1)
90689 Points 0%
HP OmniBook Ultra 14 Core Ultra X9
Intel Core Ultra X9 388H, Arc B390 Panther Lake iGPU (v8.20.8100)
82749 Points -9%
Dell Pro 7 14 P714260
Intel Core Ultra 7 366H, Intel Graphics 4 Xe3 PTL (v8.20.8100)
75534 Points -17%
Samsung Galaxy Book5 Pro 14 940XHA
Intel Core Ultra 5 226V, Arc 130V (v6.92.6600)
56296 Points -38%
Asus ExpertBook Ultra B9406CAA
Intel Core Ultra X7 358H, Arc B390 Panther Lake iGPU (v6.92.6600)
29930 Points -67%
AIDA64 / CPU SHA3
Asus ExpertBook Ultra B9406CAA
Intel Core Ultra X7 358H, Arc B390 Panther Lake iGPU (v6.92.6600)
4549 MB/s 0%
Dell Pro 5 14 P514260
Intel Core Ultra X7 368H, Arc B390 Panther Lake iGPU (v8.20.8100)
4537 MB/s
Média Intel Core Ultra X7 368H
  (n=1)
4537 MB/s 0%
HP OmniBook Ultra 14 Core Ultra X9
Intel Core Ultra X9 388H, Arc B390 Panther Lake iGPU (v8.20.8100)
4178 MB/s -8%
Lenovo ThinkPad T14s Gen 7 21YW0022GE
AMD Ryzen AI 7 PRO 450, Radeon 860M (v8.20.8100)
3934 MB/s -13%
Dell Pro 7 14 P714260
Intel Core Ultra 7 366H, Intel Graphics 4 Xe3 PTL (v8.20.8100)
3837 MB/s -15%
Samsung Galaxy Book5 Pro 14 940XHA
Intel Core Ultra 5 226V, Arc 130V (v6.92.6600)
2566 MB/s -43%
AIDA64 / CPU Queen
Asus ExpertBook Ultra B9406CAA
Intel Core Ultra X7 358H, Arc B390 Panther Lake iGPU (v6.92.6600)
63425 Points
Samsung Galaxy Book5 Pro 14 940XHA
Intel Core Ultra 5 226V, Arc 130V (v6.92.6600)
47041 Points
AIDA64 / FPU SinJulia
Lenovo ThinkPad T14s Gen 7 21YW0022GE
AMD Ryzen AI 7 PRO 450, Radeon 860M (v8.20.8100)
13684 Points +82%
Dell Pro 5 14 P514260
Intel Core Ultra X7 368H, Arc B390 Panther Lake iGPU (v8.20.8100)
7511 Points
Média Intel Core Ultra X7 368H
  (n=1)
7511 Points 0%
HP OmniBook Ultra 14 Core Ultra X9
Intel Core Ultra X9 388H, Arc B390 Panther Lake iGPU (v8.20.8100)
7015 Points -7%
Dell Pro 7 14 P714260
Intel Core Ultra 7 366H, Intel Graphics 4 Xe3 PTL (v8.20.8100)
6925 Points -8%
Asus ExpertBook Ultra B9406CAA
Intel Core Ultra X7 358H, Arc B390 Panther Lake iGPU (v6.92.6600)
4735 Points -37%
Samsung Galaxy Book5 Pro 14 940XHA
Intel Core Ultra 5 226V, Arc 130V (v6.92.6600)
3916 Points -48%
AIDA64 / FPU Mandel
Lenovo ThinkPad T14s Gen 7 21YW0022GE
AMD Ryzen AI 7 PRO 450, Radeon 860M (v8.20.8100)
51669 Points +6%
Dell Pro 5 14 P514260
Intel Core Ultra X7 368H, Arc B390 Panther Lake iGPU (v8.20.8100)
48562 Points
Média Intel Core Ultra X7 368H
  (n=1)
48562 Points 0%
HP OmniBook Ultra 14 Core Ultra X9
Intel Core Ultra X9 388H, Arc B390 Panther Lake iGPU (v8.20.8100)
44749 Points -8%
Dell Pro 7 14 P714260
Intel Core Ultra 7 366H, Intel Graphics 4 Xe3 PTL (v8.20.8100)
40198 Points -17%
Samsung Galaxy Book5 Pro 14 940XHA
Intel Core Ultra 5 226V, Arc 130V (v6.92.6600)
28485 Points -41%
Asus ExpertBook Ultra B9406CAA
Intel Core Ultra X7 358H, Arc B390 Panther Lake iGPU (v6.92.6600)
14716 Points -70%
AIDA64 / CPU AES
Lenovo ThinkPad T14s Gen 7 21YW0022GE
AMD Ryzen AI 7 PRO 450, Radeon 860M (v8.20.8100)
81704 MB/s +20%
Dell Pro 5 14 P514260
Intel Core Ultra X7 368H, Arc B390 Panther Lake iGPU (v8.20.8100)
68180 MB/s
Média Intel Core Ultra X7 368H
  (n=1)
68180 MB/s 0%
HP OmniBook Ultra 14 Core Ultra X9
Intel Core Ultra X9 388H, Arc B390 Panther Lake iGPU (v8.20.8100)
61890 MB/s -9%
Dell Pro 7 14 P714260
Intel Core Ultra 7 366H, Intel Graphics 4 Xe3 PTL (v8.20.8100)
60279 MB/s -12%
Samsung Galaxy Book5 Pro 14 940XHA
Intel Core Ultra 5 226V, Arc 130V (v6.92.6600)
36115 MB/s -47%
Asus ExpertBook Ultra B9406CAA
Intel Core Ultra X7 358H, Arc B390 Panther Lake iGPU (v6.92.6600)
5127 MB/s -92%
AIDA64 / CPU ZLib
Asus ExpertBook Ultra B9406CAA
Intel Core Ultra X7 358H, Arc B390 Panther Lake iGPU (v6.92.6600)
1168 MB/s +3%
Dell Pro 5 14 P514260
Intel Core Ultra X7 368H, Arc B390 Panther Lake iGPU (v8.20.8100)
1130 MB/s
Média Intel Core Ultra X7 368H
  (n=1)
1130 MB/s 0%
Lenovo ThinkPad T14s Gen 7 21YW0022GE
AMD Ryzen AI 7 PRO 450, Radeon 860M (v8.20.8100)
1014 MB/s -10%
HP OmniBook Ultra 14 Core Ultra X9
Intel Core Ultra X9 388H, Arc B390 Panther Lake iGPU (v8.20.8100)
984 MB/s -13%
Dell Pro 7 14 P714260
Intel Core Ultra 7 366H, Intel Graphics 4 Xe3 PTL (v8.20.8100)
921 MB/s -18%
Samsung Galaxy Book5 Pro 14 940XHA
Intel Core Ultra 5 226V, Arc 130V (v6.92.6600)
548 MB/s -52%
AIDA64 / FP64 Ray-Trace
Lenovo ThinkPad T14s Gen 7 21YW0022GE
AMD Ryzen AI 7 PRO 450, Radeon 860M (v8.20.8100)
13274 KRay/s +45%
Dell Pro 5 14 P514260
Intel Core Ultra X7 368H, Arc B390 Panther Lake iGPU (v8.20.8100)
9131 KRay/s
Média Intel Core Ultra X7 368H
  (n=1)
9131 KRay/s 0%
HP OmniBook Ultra 14 Core Ultra X9
Intel Core Ultra X9 388H, Arc B390 Panther Lake iGPU (v8.20.8100)
8317 KRay/s -9%
Dell Pro 7 14 P714260
Intel Core Ultra 7 366H, Intel Graphics 4 Xe3 PTL (v8.20.8100)
7395 KRay/s -19%
Asus ExpertBook Ultra B9406CAA
Intel Core Ultra X7 358H, Arc B390 Panther Lake iGPU (v6.92.6600)
6506 KRay/s -29%
Samsung Galaxy Book5 Pro 14 940XHA
Intel Core Ultra 5 226V, Arc 130V (v6.92.6600)
6098 KRay/s -33%
AIDA64 / CPU PhotoWorxx
HP OmniBook Ultra 14 Core Ultra X9
Intel Core Ultra X9 388H, Arc B390 Panther Lake iGPU (v8.20.8100)
85600 MPixel/s +2%
Dell Pro 5 14 P514260
Intel Core Ultra X7 368H, Arc B390 Panther Lake iGPU (v8.20.8100)
84065 MPixel/s
Média Intel Core Ultra X7 368H
  (n=1)
84065 MPixel/s 0%
Dell Pro 7 14 P714260
Intel Core Ultra 7 366H, Intel Graphics 4 Xe3 PTL (v8.20.8100)
82103 MPixel/s -2%
Samsung Galaxy Book5 Pro 14 940XHA
Intel Core Ultra 5 226V, Arc 130V (v6.92.6600)
50115 MPixel/s -40%
Lenovo ThinkPad T14s Gen 7 21YW0022GE
AMD Ryzen AI 7 PRO 450, Radeon 860M (v8.20.8100)
46202 MPixel/s -45%
Asus ExpertBook Ultra B9406CAA
Intel Core Ultra X7 358H, Arc B390 Panther Lake iGPU (v6.92.6600)
30538 MPixel/s -64%
AIDA64 / CPU CheckMate
Lenovo ThinkPad T14s Gen 7 21YW0022GE
AMD Ryzen AI 7 PRO 450, Radeon 860M (v8.20.8100)
5484 MP/s +19%
Dell Pro 5 14 P514260
Intel Core Ultra X7 368H, Arc B390 Panther Lake iGPU (v8.20.8100)
4613 MP/s
Média Intel Core Ultra X7 368H
  (n=1)
4613 MP/s 0%
Dell Pro 7 14 P714260
Intel Core Ultra 7 366H, Intel Graphics 4 Xe3 PTL (v8.20.8100)
4239 MP/s -8%
HP OmniBook Ultra 14 Core Ultra X9
Intel Core Ultra X9 388H, Arc B390 Panther Lake iGPU (v8.20.8100)
4009 MP/s -13%

Desempenho do sistema

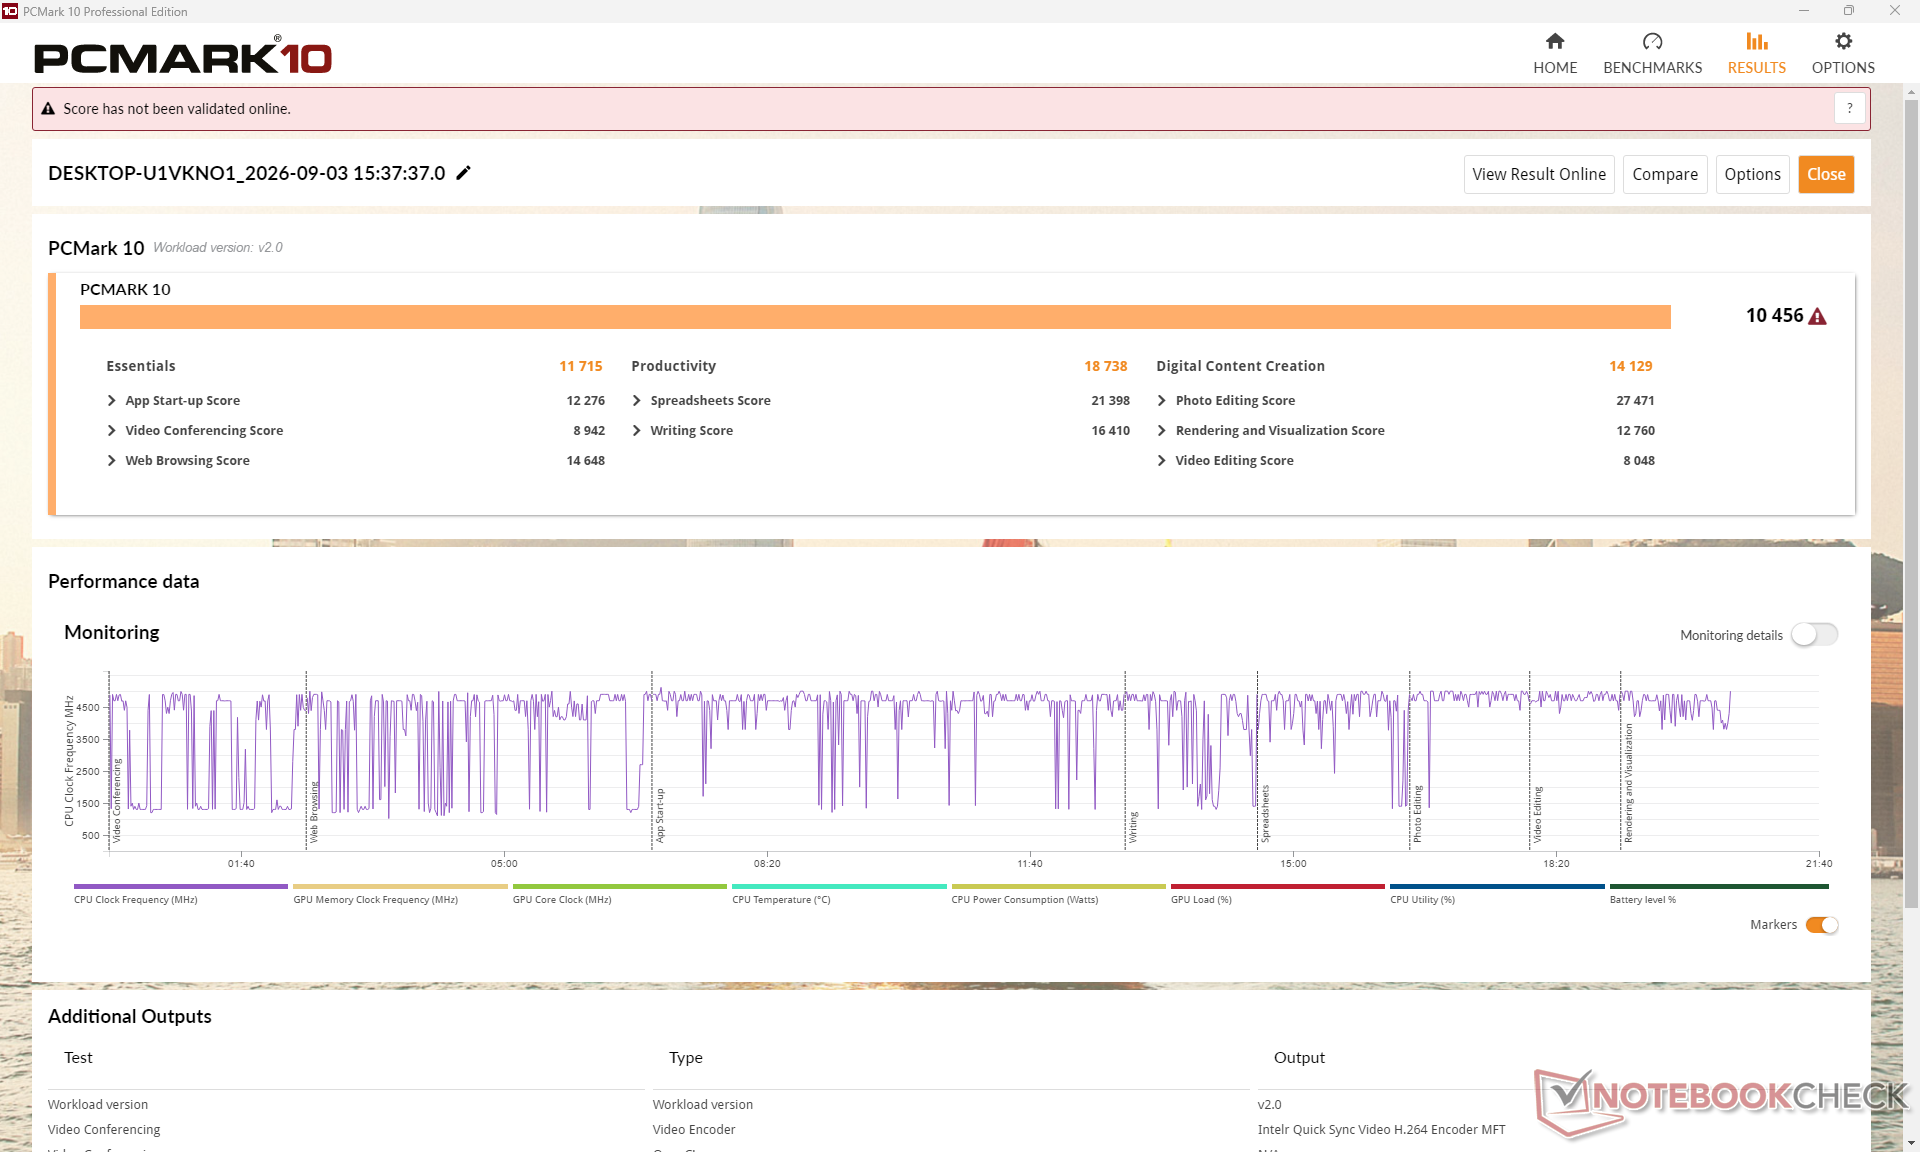
As pontuações do PCMark 10 Standard são significativamente mais altas do que até mesmo as dos produtos Lunar Lake do ano passado
Performance rating
HP OmniBook Ultra 14 Core Ultra X9
Arc B390 Panther Lake iGPU, Ultra X9 388H
89 pt
Dell Pro 5 14 P514260
Arc B390 Panther Lake iGPU, Ultra X7 368H, SK hynix PCB01 HFS001TFM9X186N
88.5 pt
Média Intel Core Ultra X7 368H, Intel Arc B390 12 Xe3 Panther Lake iGPU
 
88.5 pt
Asus ExpertBook Ultra B9406CAA
Arc B390 Panther Lake iGPU, Ultra X7 358H, Samsung PM9E1 MZVLC2T0HBLD
84.6 pt
Dell Pro 7 14 P714260
Intel Graphics 4 Xe3 PTL, Ultra 7 366H, SK hynix PCB01 HFS001TFM9X186N
80.2 pt
Lenovo ThinkPad T14s Gen 7 21YW0022GE
Radeon 860M, Ryzen AI 7 PRO 450, Micron 2650 MTFDKBA512TGW
72.1 pt
Samsung Galaxy Book5 Pro 14 940XHA
Arc 130V, Core Ultra 5 226V, Samsung PM9C1 MZVL8512HELU
62.9 pt
PCMark 10 / Score
Dell Pro 5 14 P514260
Arc B390 Panther Lake iGPU, Ultra X7 368H, SK hynix PCB01 HFS001TFM9X186N
10456 Points
Média Intel Core Ultra X7 368H, Intel Arc B390 12 Xe3 Panther Lake iGPU
  (n=1)
10456 Points 0%
HP OmniBook Ultra 14 Core Ultra X9
Arc B390 Panther Lake iGPU, Ultra X9 388H
9939 Points -5%
Dell Pro 7 14 P714260
Intel Graphics 4 Xe3 PTL, Ultra 7 366H, SK hynix PCB01 HFS001TFM9X186N
9352 Points -11%
Asus ExpertBook Ultra B9406CAA
Arc B390 Panther Lake iGPU, Ultra X7 358H, Samsung PM9E1 MZVLC2T0HBLD
9298 Points -11%
Lenovo ThinkPad T14s Gen 7 21YW0022GE
Radeon 860M, Ryzen AI 7 PRO 450, Micron 2650 MTFDKBA512TGW
8180 Points -22%
Samsung Galaxy Book5 Pro 14 940XHA
Arc 130V, Core Ultra 5 226V, Samsung PM9C1 MZVL8512HELU
6547 Points -37%
PCMark 10 / Essentials
Dell Pro 5 14 P514260
Arc B390 Panther Lake iGPU, Ultra X7 368H, SK hynix PCB01 HFS001TFM9X186N
11715 Points
Média Intel Core Ultra X7 368H, Intel Arc B390 12 Xe3 Panther Lake iGPU
  (n=1)
11715 Points 0%
Dell Pro 7 14 P714260
Intel Graphics 4 Xe3 PTL, Ultra 7 366H, SK hynix PCB01 HFS001TFM9X186N
11664 Points 0%
HP OmniBook Ultra 14 Core Ultra X9
Arc B390 Panther Lake iGPU, Ultra X9 388H
11646 Points -1%
Lenovo ThinkPad T14s Gen 7 21YW0022GE
Radeon 860M, Ryzen AI 7 PRO 450, Micron 2650 MTFDKBA512TGW
11208 Points -4%
Asus ExpertBook Ultra B9406CAA
Arc B390 Panther Lake iGPU, Ultra X7 358H, Samsung PM9E1 MZVLC2T0HBLD
10811 Points -8%
Samsung Galaxy Book5 Pro 14 940XHA
Arc 130V, Core Ultra 5 226V, Samsung PM9C1 MZVL8512HELU
9640 Points -18%
PCMark 10 / Productivity
Dell Pro 5 14 P514260
Arc B390 Panther Lake iGPU, Ultra X7 368H, SK hynix PCB01 HFS001TFM9X186N
18738 Points
Média Intel Core Ultra X7 368H, Intel Arc B390 12 Xe3 Panther Lake iGPU
  (n=1)
18738 Points 0%
Dell Pro 7 14 P714260
Intel Graphics 4 Xe3 PTL, Ultra 7 366H, SK hynix PCB01 HFS001TFM9X186N
17860 Points -5%
HP OmniBook Ultra 14 Core Ultra X9
Arc B390 Panther Lake iGPU, Ultra X9 388H
16606 Points -11%
Asus ExpertBook Ultra B9406CAA
Arc B390 Panther Lake iGPU, Ultra X7 358H, Samsung PM9E1 MZVLC2T0HBLD
14899 Points -20%
Lenovo ThinkPad T14s Gen 7 21YW0022GE
Radeon 860M, Ryzen AI 7 PRO 450, Micron 2650 MTFDKBA512TGW
14067 Points -25%
Samsung Galaxy Book5 Pro 14 940XHA
Arc 130V, Core Ultra 5 226V, Samsung PM9C1 MZVL8512HELU
8591 Points -54%
PCMark 10 / Digital Content Creation
Dell Pro 5 14 P514260
Arc B390 Panther Lake iGPU, Ultra X7 368H, SK hynix PCB01 HFS001TFM9X186N
14129 Points
Média Intel Core Ultra X7 368H, Intel Arc B390 12 Xe3 Panther Lake iGPU
  (n=1)
14129 Points 0%
HP OmniBook Ultra 14 Core Ultra X9
Arc B390 Panther Lake iGPU, Ultra X9 388H
13779 Points -2%
Asus ExpertBook Ultra B9406CAA
Arc B390 Panther Lake iGPU, Ultra X7 358H, Samsung PM9E1 MZVLC2T0HBLD
13541 Points -4%
Dell Pro 7 14 P714260
Intel Graphics 4 Xe3 PTL, Ultra 7 366H, SK hynix PCB01 HFS001TFM9X186N
10655 Points -25%
Lenovo ThinkPad T14s Gen 7 21YW0022GE
Radeon 860M, Ryzen AI 7 PRO 450, Micron 2650 MTFDKBA512TGW
9424 Points -33%
Samsung Galaxy Book5 Pro 14 940XHA
Arc 130V, Core Ultra 5 226V, Samsung PM9C1 MZVL8512HELU
9197 Points -35%
CrossMark / Overall
Dell Pro 7 14 P714260
Intel Graphics 4 Xe3 PTL, Ultra 7 366H, SK hynix PCB01 HFS001TFM9X186N
2172 Points +7%
HP OmniBook Ultra 14 Core Ultra X9
Arc B390 Panther Lake iGPU, Ultra X9 388H
2048 Points +1%
Dell Pro 5 14 P514260
Arc B390 Panther Lake iGPU, Ultra X7 368H, SK hynix PCB01 HFS001TFM9X186N
2032 Points
Média Intel Core Ultra X7 368H, Intel Arc B390 12 Xe3 Panther Lake iGPU
  (n=1)
2032 Points 0%
Asus ExpertBook Ultra B9406CAA
Arc B390 Panther Lake iGPU, Ultra X7 358H, Samsung PM9E1 MZVLC2T0HBLD
1884 Points -7%
Lenovo ThinkPad T14s Gen 7 21YW0022GE
Radeon 860M, Ryzen AI 7 PRO 450, Micron 2650 MTFDKBA512TGW
1803 Points -11%
Samsung Galaxy Book5 Pro 14 940XHA
Arc 130V, Core Ultra 5 226V, Samsung PM9C1 MZVL8512HELU
1620 Points -20%
CrossMark / Productivity
Dell Pro 7 14 P714260
Intel Graphics 4 Xe3 PTL, Ultra 7 366H, SK hynix PCB01 HFS001TFM9X186N
1968 Points +3%
Dell Pro 5 14 P514260
Arc B390 Panther Lake iGPU, Ultra X7 368H, SK hynix PCB01 HFS001TFM9X186N
1916 Points
Média Intel Core Ultra X7 368H, Intel Arc B390 12 Xe3 Panther Lake iGPU
  (n=1)
1916 Points 0%
HP OmniBook Ultra 14 Core Ultra X9
Arc B390 Panther Lake iGPU, Ultra X9 388H
1834 Points -4%
Lenovo ThinkPad T14s Gen 7 21YW0022GE
Radeon 860M, Ryzen AI 7 PRO 450, Micron 2650 MTFDKBA512TGW
1760 Points -8%
Asus ExpertBook Ultra B9406CAA
Arc B390 Panther Lake iGPU, Ultra X7 358H, Samsung PM9E1 MZVLC2T0HBLD
1678 Points -12%
Samsung Galaxy Book5 Pro 14 940XHA
Arc 130V, Core Ultra 5 226V, Samsung PM9C1 MZVL8512HELU
1575 Points -18%
CrossMark / Creativity
Dell Pro 7 14 P714260
Intel Graphics 4 Xe3 PTL, Ultra 7 366H, SK hynix PCB01 HFS001TFM9X186N
2479 Points +11%
HP OmniBook Ultra 14 Core Ultra X9
Arc B390 Panther Lake iGPU, Ultra X9 388H
2390 Points +7%
Asus ExpertBook Ultra B9406CAA
Arc B390 Panther Lake iGPU, Ultra X7 358H, Samsung PM9E1 MZVLC2T0HBLD
2241 Points 0%
Dell Pro 5 14 P514260
Arc B390 Panther Lake iGPU, Ultra X7 368H, SK hynix PCB01 HFS001TFM9X186N
2241 Points
Média Intel Core Ultra X7 368H, Intel Arc B390 12 Xe3 Panther Lake iGPU
  (n=1)
2241 Points 0%
Lenovo ThinkPad T14s Gen 7 21YW0022GE
Radeon 860M, Ryzen AI 7 PRO 450, Micron 2650 MTFDKBA512TGW
1841 Points -18%
Samsung Galaxy Book5 Pro 14 940XHA
Arc 130V, Core Ultra 5 226V, Samsung PM9C1 MZVL8512HELU
1746 Points -22%
CrossMark / Responsiveness
Dell Pro 7 14 P714260
Intel Graphics 4 Xe3 PTL, Ultra 7 366H, SK hynix PCB01 HFS001TFM9X186N
1966 Points +9%
Lenovo ThinkPad T14s Gen 7 21YW0022GE
Radeon 860M, Ryzen AI 7 PRO 450, Micron 2650 MTFDKBA512TGW
1820 Points +1%
Dell Pro 5 14 P514260
Arc B390 Panther Lake iGPU, Ultra X7 368H, SK hynix PCB01 HFS001TFM9X186N
1808 Points
Média Intel Core Ultra X7 368H, Intel Arc B390 12 Xe3 Panther Lake iGPU
  (n=1)
1808 Points 0%
HP OmniBook Ultra 14 Core Ultra X9
Arc B390 Panther Lake iGPU, Ultra X9 388H
1797 Points -1%
Asus ExpertBook Ultra B9406CAA
Arc B390 Panther Lake iGPU, Ultra X7 358H, Samsung PM9E1 MZVLC2T0HBLD
1585 Points -12%
Samsung Galaxy Book5 Pro 14 940XHA
Arc 130V, Core Ultra 5 226V, Samsung PM9C1 MZVL8512HELU
1408 Points -22%
WebXPRT 3 / Overall
HP OmniBook Ultra 14 Core Ultra X9
Arc B390 Panther Lake iGPU, Ultra X9 388H
354 Points +4%
Dell Pro 5 14 P514260
Arc B390 Panther Lake iGPU, Ultra X7 368H, SK hynix PCB01 HFS001TFM9X186N
342 Points
Média Intel Core Ultra X7 368H, Intel Arc B390 12 Xe3 Panther Lake iGPU
  (n=1)
342 Points 0%
Dell Pro 7 14 P714260
Intel Graphics 4 Xe3 PTL, Ultra 7 366H, SK hynix PCB01 HFS001TFM9X186N
334 Points -2%
Lenovo ThinkPad T14s Gen 7 21YW0022GE
Radeon 860M, Ryzen AI 7 PRO 450, Micron 2650 MTFDKBA512TGW
331 Points -3%
Asus ExpertBook Ultra B9406CAA
Arc B390 Panther Lake iGPU, Ultra X7 358H, Samsung PM9E1 MZVLC2T0HBLD
304 Points -11%
Samsung Galaxy Book5 Pro 14 940XHA
Arc 130V, Core Ultra 5 226V, Samsung PM9C1 MZVL8512HELU
281 Points -18%
WebXPRT 4 / Overall
HP OmniBook Ultra 14 Core Ultra X9
Arc B390 Panther Lake iGPU, Ultra X9 388H
318 Points +5%
Dell Pro 7 14 P714260
Intel Graphics 4 Xe3 PTL, Ultra 7 366H, SK hynix PCB01 HFS001TFM9X186N
307 Points +1%
Dell Pro 5 14 P514260
Arc B390 Panther Lake iGPU, Ultra X7 368H, SK hynix PCB01 HFS001TFM9X186N
304 Points
Média Intel Core Ultra X7 368H, Intel Arc B390 12 Xe3 Panther Lake iGPU
  (n=1)
304 Points 0%
Asus ExpertBook Ultra B9406CAA
Arc B390 Panther Lake iGPU, Ultra X7 358H, Samsung PM9E1 MZVLC2T0HBLD
279 Points -8%
Lenovo ThinkPad T14s Gen 7 21YW0022GE
Radeon 860M, Ryzen AI 7 PRO 450, Micron 2650 MTFDKBA512TGW
270 Points -11%
Samsung Galaxy Book5 Pro 14 940XHA
Arc 130V, Core Ultra 5 226V, Samsung PM9C1 MZVL8512HELU
248 Points -18%
Mozilla Kraken 1.1 / Total
Samsung Galaxy Book5 Pro 14 940XHA
Arc 130V, Core Ultra 5 226V, Samsung PM9C1 MZVL8512HELU
503 ms * -15%
Asus ExpertBook Ultra B9406CAA
Arc B390 Panther Lake iGPU, Ultra X7 358H, Samsung PM9E1 MZVLC2T0HBLD
449 ms * -3%
Dell Pro 7 14 P714260
Intel Graphics 4 Xe3 PTL, Ultra 7 366H, SK hynix PCB01 HFS001TFM9X186N
449 ms * -3%
Lenovo ThinkPad T14s Gen 7 21YW0022GE
Radeon 860M, Ryzen AI 7 PRO 450, Micron 2650 MTFDKBA512TGW
446 ms * -2%
Dell Pro 5 14 P514260
Arc B390 Panther Lake iGPU, Ultra X7 368H, SK hynix PCB01 HFS001TFM9X186N
437 ms *
Média Intel Core Ultra X7 368H, Intel Arc B390 12 Xe3 Panther Lake iGPU
  (n=1)
437 ms * -0%
HP OmniBook Ultra 14 Core Ultra X9
Arc B390 Panther Lake iGPU, Ultra X9 388H
431 ms * +1%
Geekbench AI / Single Precision GPU 1.7
Asus ExpertBook Ultra B9406CAA
Arc B390 Panther Lake iGPU, Ultra X7 358H, Samsung PM9E1 MZVLC2T0HBLD
12255 Points +20%
HP OmniBook Ultra 14 Core Ultra X9
Arc B390 Panther Lake iGPU, Ultra X9 388H
11399 Points +12%
Dell Pro 5 14 P514260
Arc B390 Panther Lake iGPU, Ultra X7 368H, SK hynix PCB01 HFS001TFM9X186N
10200 Points
Média Intel Core Ultra X7 368H, Intel Arc B390 12 Xe3 Panther Lake iGPU
  (n=1)
10200 Points 0%
Lenovo ThinkPad T14s Gen 7 21YW0022GE
Radeon 860M, Ryzen AI 7 PRO 450, Micron 2650 MTFDKBA512TGW
6638 Points -35%
Samsung Galaxy Book5 Pro 14 940XHA
Arc 130V, Core Ultra 5 226V, Samsung PM9C1 MZVL8512HELU
6557 Points -36%
Dell Pro 7 14 P714260
Intel Graphics 4 Xe3 PTL, Ultra 7 366H, SK hynix PCB01 HFS001TFM9X186N
6446 Points -37%
Geekbench AI / Half Precision GPU 1.7
Asus ExpertBook Ultra B9406CAA
Arc B390 Panther Lake iGPU, Ultra X7 358H, Samsung PM9E1 MZVLC2T0HBLD
21796 Points +7%
Dell Pro 5 14 P514260
Arc B390 Panther Lake iGPU, Ultra X7 368H, SK hynix PCB01 HFS001TFM9X186N
20294 Points
Média Intel Core Ultra X7 368H, Intel Arc B390 12 Xe3 Panther Lake iGPU
  (n=1)
20294 Points 0%
HP OmniBook Ultra 14 Core Ultra X9
Arc B390 Panther Lake iGPU, Ultra X9 388H
19272 Points -5%
Samsung Galaxy Book5 Pro 14 940XHA
Arc 130V, Core Ultra 5 226V, Samsung PM9C1 MZVL8512HELU
13043 Points -36%
Dell Pro 7 14 P714260
Intel Graphics 4 Xe3 PTL, Ultra 7 366H, SK hynix PCB01 HFS001TFM9X186N
12067 Points -41%
Lenovo ThinkPad T14s Gen 7 21YW0022GE
Radeon 860M, Ryzen AI 7 PRO 450, Micron 2650 MTFDKBA512TGW
10131 Points -50%
Geekbench AI / Quantized GPU 1.7
Asus ExpertBook Ultra B9406CAA
Arc B390 Panther Lake iGPU, Ultra X7 358H, Samsung PM9E1 MZVLC2T0HBLD
8011 Points +18%
HP OmniBook Ultra 14 Core Ultra X9
Arc B390 Panther Lake iGPU, Ultra X9 388H
7569 Points +12%
Dell Pro 5 14 P514260
Arc B390 Panther Lake iGPU, Ultra X7 368H, SK hynix PCB01 HFS001TFM9X186N
6761 Points
Média Intel Core Ultra X7 368H, Intel Arc B390 12 Xe3 Panther Lake iGPU
  (n=1)
6761 Points 0%
Lenovo ThinkPad T14s Gen 7 21YW0022GE
Radeon 860M, Ryzen AI 7 PRO 450, Micron 2650 MTFDKBA512TGW
5124 Points -24%
Samsung Galaxy Book5 Pro 14 940XHA
Arc 130V, Core Ultra 5 226V, Samsung PM9C1 MZVL8512HELU
4634 Points -31%
Dell Pro 7 14 P714260
Intel Graphics 4 Xe3 PTL, Ultra 7 366H, SK hynix PCB01 HFS001TFM9X186N
4273 Points -37%

* ... menor é melhor

PCMark 10 Score
10456 pontos
Ajuda
AIDA64 / Memory Copy
HP OmniBook Ultra 14 Core Ultra X9
Intel Core Ultra X9 388H, Arc B390 Panther Lake iGPU
131023 MB/s +15%
Dell Pro 7 14 P714260
Intel Core Ultra 7 366H, Intel Graphics 4 Xe3 PTL
116863 MB/s +2%
Dell Pro 5 14 P514260
Intel Core Ultra X7 368H, Arc B390 Panther Lake iGPU
114339 MB/s
Samsung Galaxy Book5 Pro 14 940XHA
Intel Core Ultra 5 226V, Arc 130V
99848 MB/s -13%
Lenovo ThinkPad T14s Gen 7 21YW0022GE
AMD Ryzen AI 7 PRO 450, Radeon 860M
87261 MB/s -24%
AIDA64 / Memory Read
HP OmniBook Ultra 14 Core Ultra X9
Intel Core Ultra X9 388H, Arc B390 Panther Lake iGPU
120487 MB/s +13%
Asus ExpertBook Ultra B9406CAA
Intel Core Ultra X7 358H, Arc B390 Panther Lake iGPU
117245 MB/s +10%
Dell Pro 7 14 P714260
Intel Core Ultra 7 366H, Intel Graphics 4 Xe3 PTL
111878 MB/s +5%
Dell Pro 5 14 P514260
Intel Core Ultra X7 368H, Arc B390 Panther Lake iGPU
106702 MB/s
Samsung Galaxy Book5 Pro 14 940XHA
Intel Core Ultra 5 226V, Arc 130V
84606 MB/s -21%
Lenovo ThinkPad T14s Gen 7 21YW0022GE
AMD Ryzen AI 7 PRO 450, Radeon 860M
66186 MB/s -38%
AIDA64 / Memory Write
HP OmniBook Ultra 14 Core Ultra X9
Intel Core Ultra X9 388H, Arc B390 Panther Lake iGPU
135141 MB/s +12%
Dell Pro 7 14 P714260
Intel Core Ultra 7 366H, Intel Graphics 4 Xe3 PTL
120952 MB/s 0%
Dell Pro 5 14 P514260
Intel Core Ultra X7 368H, Arc B390 Panther Lake iGPU
120732 MB/s
Asus ExpertBook Ultra B9406CAA
Intel Core Ultra X7 358H, Arc B390 Panther Lake iGPU
119858 MB/s -1%
Samsung Galaxy Book5 Pro 14 940XHA
Intel Core Ultra 5 226V, Arc 130V
111533 MB/s -8%
Lenovo ThinkPad T14s Gen 7 21YW0022GE
AMD Ryzen AI 7 PRO 450, Radeon 860M
109442 MB/s -9%
AIDA64 / Memory Latency
Lenovo ThinkPad T14s Gen 7 21YW0022GE
AMD Ryzen AI 7 PRO 450, Radeon 860M
123.8 ns * -37%
Samsung Galaxy Book5 Pro 14 940XHA
Intel Core Ultra 5 226V, Arc 130V
90.5 ns * -0%
Dell Pro 7 14 P714260
Intel Core Ultra 7 366H, Intel Graphics 4 Xe3 PTL
90.5 ns * -0%
Dell Pro 5 14 P514260
Intel Core Ultra X7 368H, Arc B390 Panther Lake iGPU
90.3 ns *
HP OmniBook Ultra 14 Core Ultra X9
Intel Core Ultra X9 388H, Arc B390 Panther Lake iGPU
85 ns * +6%

* ... menor é melhor

Latência do DPC

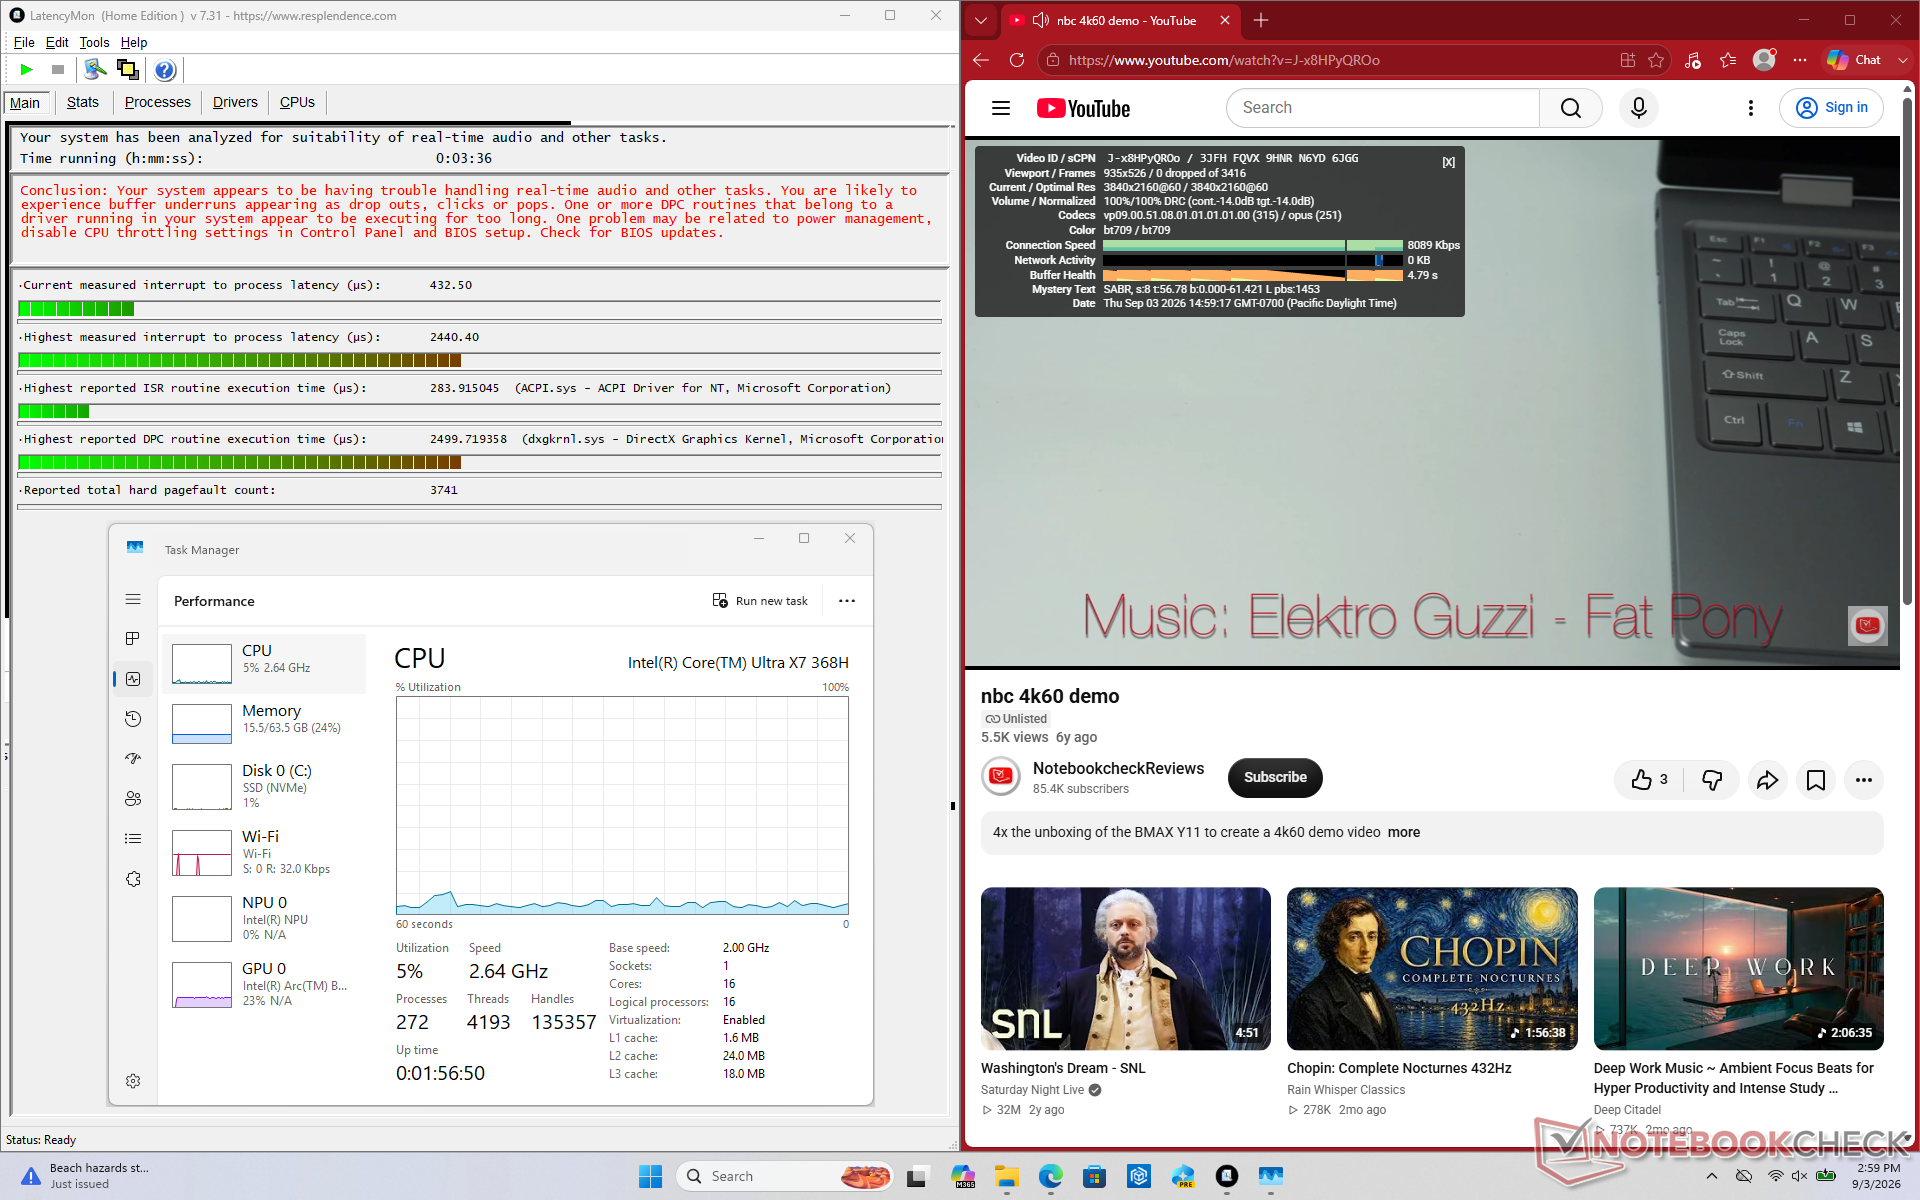
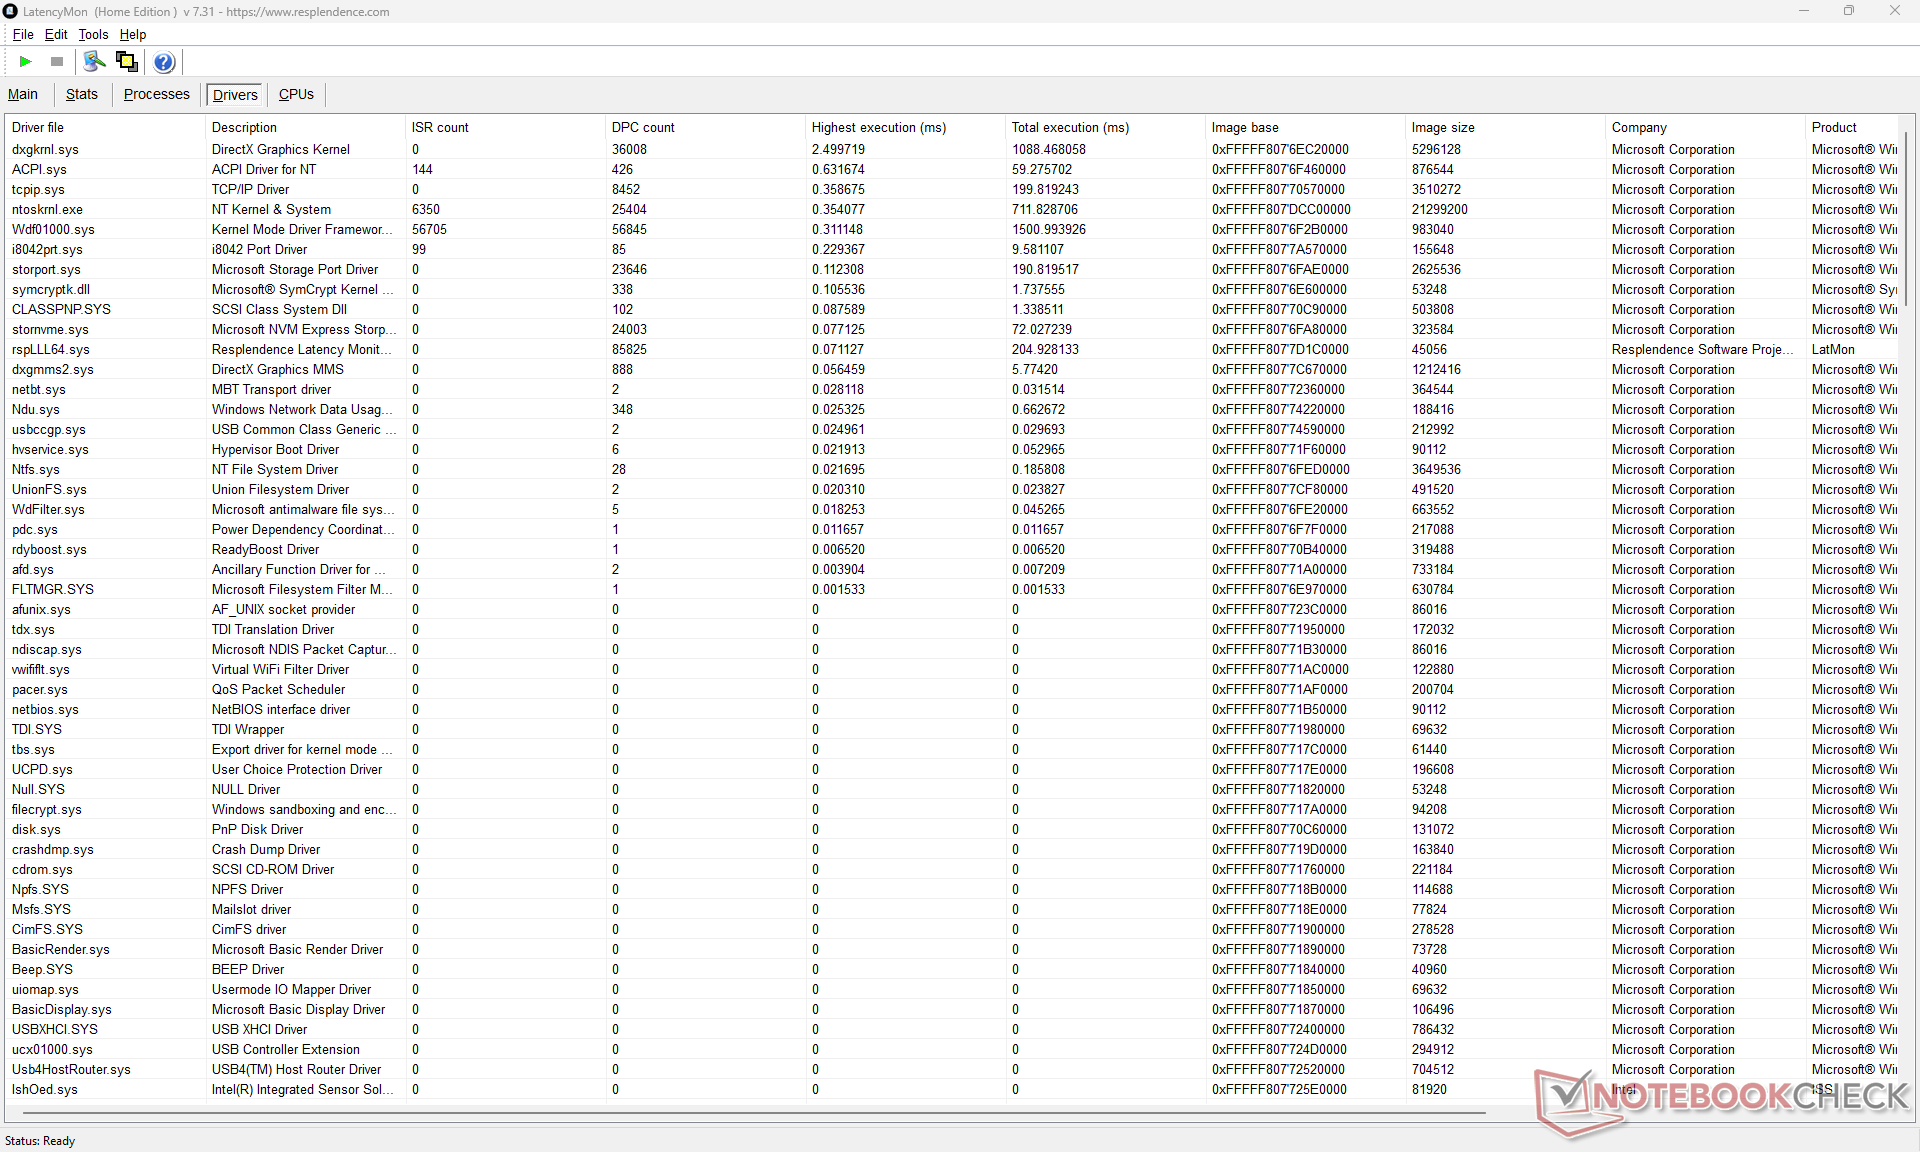
O LatencyMon indica pequenos problemas de DPC, mas, fora isso, não há perda de quadros durante a reprodução de vídeo em 4K a 60 Hz
Lista de drivers
Lista de drivers
DPC Latencies / LatencyMon - interrupt to process latency (max), Web, Youtube, Prime95
HP OmniBook Ultra 14 Core Ultra X9
Arc B390 Panther Lake iGPU, Ultra X9 388H
5654.9 μs * -132%
Samsung Galaxy Book5 Pro 14 940XHA
Arc 130V, Core Ultra 5 226V, Samsung PM9C1 MZVL8512HELU
3862.9 μs * -58%
Lenovo ThinkPad T14s Gen 7 21YW0022GE
Radeon 860M, Ryzen AI 7 PRO 450, Micron 2650 MTFDKBA512TGW
2926.1 μs * -20%
Dell Pro 5 14 P514260
Arc B390 Panther Lake iGPU, Ultra X7 368H, SK hynix PCB01 HFS001TFM9X186N
2440.4 μs *
Dell Pro 7 14 P714260
Intel Graphics 4 Xe3 PTL, Ultra 7 366H, SK hynix PCB01 HFS001TFM9X186N
615.8 μs * +75%
Asus ExpertBook Ultra B9406CAA
Arc B390 Panther Lake iGPU, Ultra X7 358H, Samsung PM9E1 MZVLC2T0HBLD
398 μs * +84%

* ... menor é melhor

Dispositivos de armazenamento
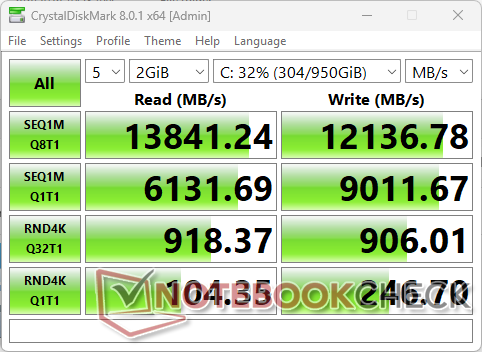
CDM 8
CDM 8

O AS SSD não conseguiu inicializar e, por isso, seus resultados não estão incluídos abaixo. No entanto, o SSD SK Hynix PCB01 PCIe5 apresentou uma ligeira redução de velocidade, passando de 14 GB/s para 11 GB/s após alguns minutos do início do nosso teste de estresse.

Tenha em mente que o sistema suporta SSDs M.2 2280 apenas se estiver configurado com LPCAMM2; caso contrário, apenas SSDs M.2 2230 são suportados se estiver configurado com SODIMM.

SK hynix PCB01 HFS001TFM9X186N
DiskSpd seq_q8t1_read: 13928MB/s
DiskSpd seq_q8t1_write: 12260MB/s
DiskSpd seq_read: 6558MB/s
DiskSpd seq_write: 5969MB/s
DiskSpd 4k_q32t16_read: 2044MB/s
DiskSpd 4k_q32t16_write: 1868MB/s
DiskSpd 4k_q1t1_read: 101.3MB/s
DiskSpd 4k_q1t1_write: 175.9MB/s
DiskSpd Loop seq_q8t1_read: 11890MB/s
Drive Performance rating - Percent
Dell Pro 7 14 P714260
SK hynix PCB01 HFS001TFM9X186N
89.8 pt
Dell Pro 5 14 P514260
SK hynix PCB01 HFS001TFM9X186N
76.5 pt
Lenovo ThinkPad T14s Gen 7 21YW0022GE
Micron 2650 MTFDKBA512TGW
74.6 pt
HP OmniBook Ultra 14 Core Ultra X9
 
54.9 pt
Asus ExpertBook Ultra B9406CAA
Samsung PM9E1 MZVLC2T0HBLD
51.5 pt
Samsung Galaxy Book5 Pro 14 940XHA
Samsung PM9C1 MZVL8512HELU
42.1 pt
DiskSpd
seq read
Dell Pro 7 14 P714260
SK hynix PCB01 HFS001TFM9X186N
9097 (8798.6min - 9097.03max) MB/s +39%
Dell Pro 5 14 P514260
SK hynix PCB01 HFS001TFM9X186N
6558 (5399.96min - 6558.31max) MB/s
Asus ExpertBook Ultra B9406CAA
Samsung PM9E1 MZVLC2T0HBLD
5202 (5000.31min - 5202.2max) MB/s -21%
Lenovo ThinkPad T14s Gen 7 21YW0022GE
Micron 2650 MTFDKBA512TGW
4665 (4580.04min - 4665.32max) MB/s -29%
HP OmniBook Ultra 14 Core Ultra X9
 
4309 (3909.03min - 4308.81max) MB/s -34%
Samsung Galaxy Book5 Pro 14 940XHA
Samsung PM9C1 MZVL8512HELU
2738 (2622.07min - 2738.46max) MB/s -58%
seq write
Dell Pro 7 14 P714260
SK hynix PCB01 HFS001TFM9X186N
7890 (7719.62min - 7890.27max) MB/s +32%
Dell Pro 5 14 P514260
SK hynix PCB01 HFS001TFM9X186N
5969 (4925.37min - 5968.51max) MB/s
Lenovo ThinkPad T14s Gen 7 21YW0022GE
Micron 2650 MTFDKBA512TGW
5223 (5088.01min - 5223.21max) MB/s -12%
HP OmniBook Ultra 14 Core Ultra X9
 
4651 (4040.05min - 4650.57max) MB/s -22%
Asus ExpertBook Ultra B9406CAA
Samsung PM9E1 MZVLC2T0HBLD
2975 (2363.07min - 2974.81max) MB/s -50%
Samsung Galaxy Book5 Pro 14 940XHA
Samsung PM9C1 MZVL8512HELU
2887 (2771.18min - 2887.15max) MB/s -52%
seq q8 t1 read
Asus ExpertBook Ultra B9406CAA
Samsung PM9E1 MZVLC2T0HBLD
14067 (11621.3min - 14067.1max) MB/s +1%
Dell Pro 5 14 P514260
SK hynix PCB01 HFS001TFM9X186N
13928 (11901.5min - 13928.1max) MB/s
Dell Pro 7 14 P714260
SK hynix PCB01 HFS001TFM9X186N
13926 (12290.5min - 13926.4max) MB/s 0%
HP OmniBook Ultra 14 Core Ultra X9
 
10314 (8944.92min - 10313.9max) MB/s -26%
Lenovo ThinkPad T14s Gen 7 21YW0022GE
Micron 2650 MTFDKBA512TGW
6991 (6471.18min - 6991.07max) MB/s -50%
Samsung Galaxy Book5 Pro 14 940XHA
Samsung PM9C1 MZVL8512HELU
5008 (4528.17min - 5007.63max) MB/s -64%
seq q8 t1 write
Dell Pro 7 14 P714260
SK hynix PCB01 HFS001TFM9X186N
12374 (12340.8min - 12374max) MB/s +1%
Dell Pro 5 14 P514260
SK hynix PCB01 HFS001TFM9X186N
12260 (12212.5min - 12260.4max) MB/s
Asus ExpertBook Ultra B9406CAA
Samsung PM9E1 MZVLC2T0HBLD
9127 (8641.19min - 9127.43max) MB/s -26%
HP OmniBook Ultra 14 Core Ultra X9
 
8967 (8867.27min - 8966.79max) MB/s -27%
Lenovo ThinkPad T14s Gen 7 21YW0022GE
Micron 2650 MTFDKBA512TGW
5333 (5268.41min - 5333.48max) MB/s -57%
Samsung Galaxy Book5 Pro 14 940XHA
Samsung PM9C1 MZVL8512HELU
2873 (2752.51min - 2872.55max) MB/s -77%
4k q1 t1 read
Dell Pro 5 14 P514260
SK hynix PCB01 HFS001TFM9X186N
101.3 (100.82min - 101.26max) MB/s
Dell Pro 7 14 P714260
SK hynix PCB01 HFS001TFM9X186N
100.3 (98.84min - 100.3max) MB/s -1%
Lenovo ThinkPad T14s Gen 7 21YW0022GE
Micron 2650 MTFDKBA512TGW
87.5 (85.01min - 87.46max) MB/s -14%
HP OmniBook Ultra 14 Core Ultra X9
 
81.6 (80.13min - 81.55max) MB/s -19%
Asus ExpertBook Ultra B9406CAA
Samsung PM9E1 MZVLC2T0HBLD
69.7 (68.02min - 69.67max) MB/s -31%
Samsung Galaxy Book5 Pro 14 940XHA
Samsung PM9C1 MZVL8512HELU
61.9 (58.67min - 61.86max) MB/s -39%
4k q1 t1 write
Lenovo ThinkPad T14s Gen 7 21YW0022GE
Micron 2650 MTFDKBA512TGW
273 (265.84min - 273.13max) MB/s +55%
HP OmniBook Ultra 14 Core Ultra X9
 
191.6 (187.96min - 191.62max) MB/s +9%
Dell Pro 5 14 P514260
SK hynix PCB01 HFS001TFM9X186N
175.9 (170.45min - 175.9max) MB/s
Samsung Galaxy Book5 Pro 14 940XHA
Samsung PM9C1 MZVL8512HELU
170.2 (159.17min - 170.23max) MB/s -3%
Dell Pro 7 14 P714260
SK hynix PCB01 HFS001TFM9X186N
167.8 (165.54min - 167.83max) MB/s -5%
Asus ExpertBook Ultra B9406CAA
Samsung PM9E1 MZVLC2T0HBLD
125.3 (122.16min - 125.28max) MB/s -29%
4k q32 t16 read
Lenovo ThinkPad T14s Gen 7 21YW0022GE
Micron 2650 MTFDKBA512TGW
3783 (3766.41min - 3783.27max) MB/s +85%
Dell Pro 7 14 P714260
SK hynix PCB01 HFS001TFM9X186N
3187 (2903.25min - 3187.22max) MB/s +56%
Dell Pro 5 14 P514260
SK hynix PCB01 HFS001TFM9X186N
2044 (1904.57min - 2043.84max) MB/s
Samsung Galaxy Book5 Pro 14 940XHA
Samsung PM9C1 MZVL8512HELU
1751 (1747.14min - 1750.91max) MB/s -14%
HP OmniBook Ultra 14 Core Ultra X9
 
932 (924.12min - 932.49max) MB/s -54%
Asus ExpertBook Ultra B9406CAA
Samsung PM9E1 MZVLC2T0HBLD
690 (639.86min - 689.58max) MB/s -66%
4k q32 t16 write
Lenovo ThinkPad T14s Gen 7 21YW0022GE
Micron 2650 MTFDKBA512TGW
3889 (3629.66min - 3889.46max) MB/s +108%
Dell Pro 7 14 P714260
SK hynix PCB01 HFS001TFM9X186N
2889 (2458.26min - 2888.79max) MB/s +55%
Dell Pro 5 14 P514260
SK hynix PCB01 HFS001TFM9X186N
1868 (1834.54min - 1867.88max) MB/s
Samsung Galaxy Book5 Pro 14 940XHA
Samsung PM9C1 MZVL8512HELU
1626 (1615.92min - 1626.34max) MB/s -13%
HP OmniBook Ultra 14 Core Ultra X9
 
464 (436.89min - 463.53max) MB/s -75%
Asus ExpertBook Ultra B9406CAA
Samsung PM9E1 MZVLC2T0HBLD
390 (355.81min - 389.58max) MB/s -79%

Limitação de disco: Loop de leitura do DiskSpd, profundidade da fila 8

0280560840112014001680196022402520280030803360364039204200448047605040532056005880616064406720700072807560784081208400868089609240952098001008010360106401092011200114801176012040123201260012880131601344013720Tooltip
Dell Pro 5 14 P514260 SK hynix PCB01 HFS001TFM9X186N; diskspd 2.0.17 f: Ø11890 (9445.99-13929.32) MB/s
Dell Pro 7 14 P714260 SK hynix PCB01 HFS001TFM9X186N; diskspd 2.0.17 f: Ø13901 (13066.89-13928.69) MB/s

Desempenho da GPU

Embora o desempenho gráfico seja bom para o tamanho do aparelho, ele tende a apresentar queda de desempenho após 10 minutos de carga pesada, conforme demonstrado em nosso teste com Cyberpunk 2077 abaixo; já o Asus ExpertBook Ultra mantém taxas de quadros mais consistentes ao longo do tempo, apesar de ambos possuírem a mesma GPU integrada Arc B390.

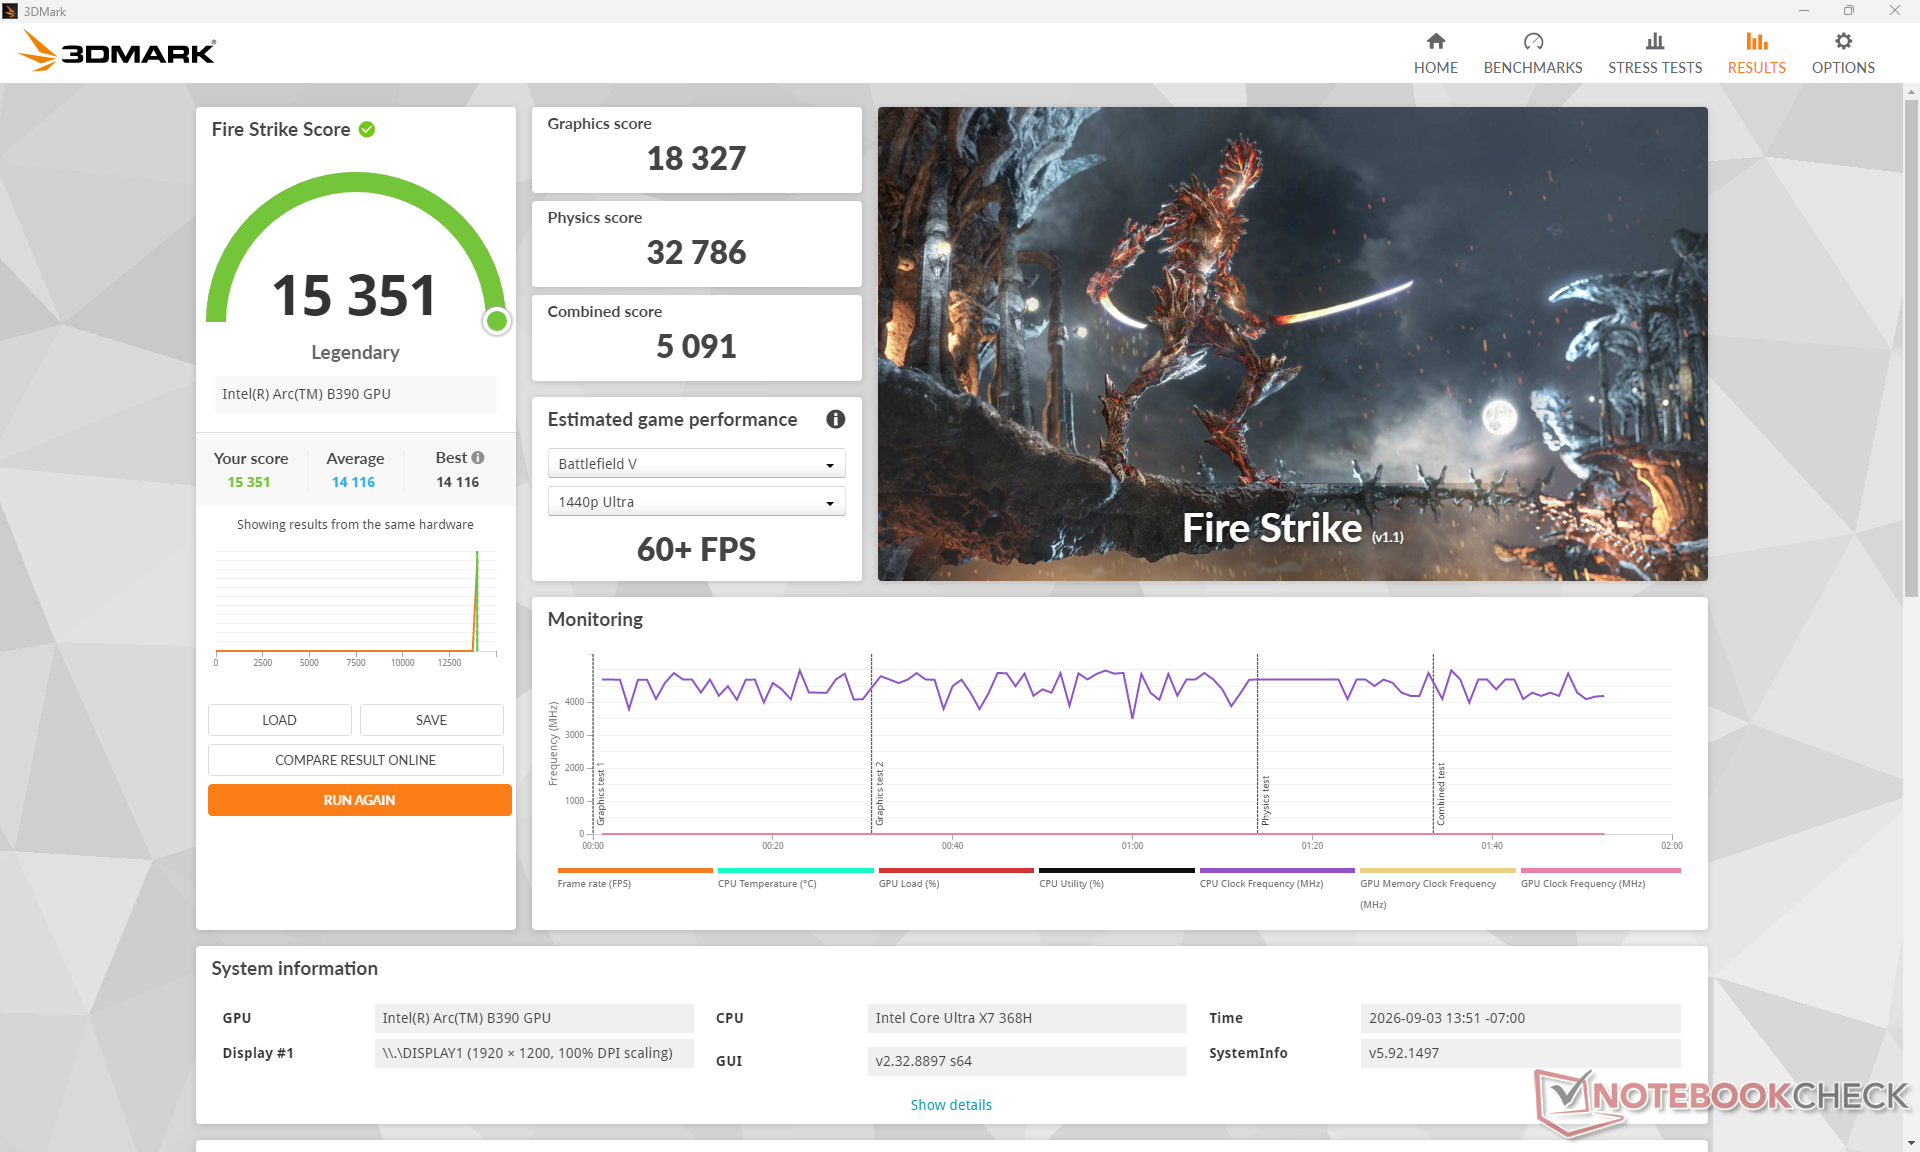
Perfil de energiaPontuação de gráficosPontuação de FísicaPontuação combinada
Modo de Desempenho18.32732.7865.091
Modo Equilibrado18.194 (-0%)32.616 (-0%)4.191 (-0%)
Alimentação por bateria17.114 (-0%)28.206 (-0%)4.705 (-0%)
3DMark 11
3DMark 11
Fire Strike
Fire Strike
Time Spy
Time Spy
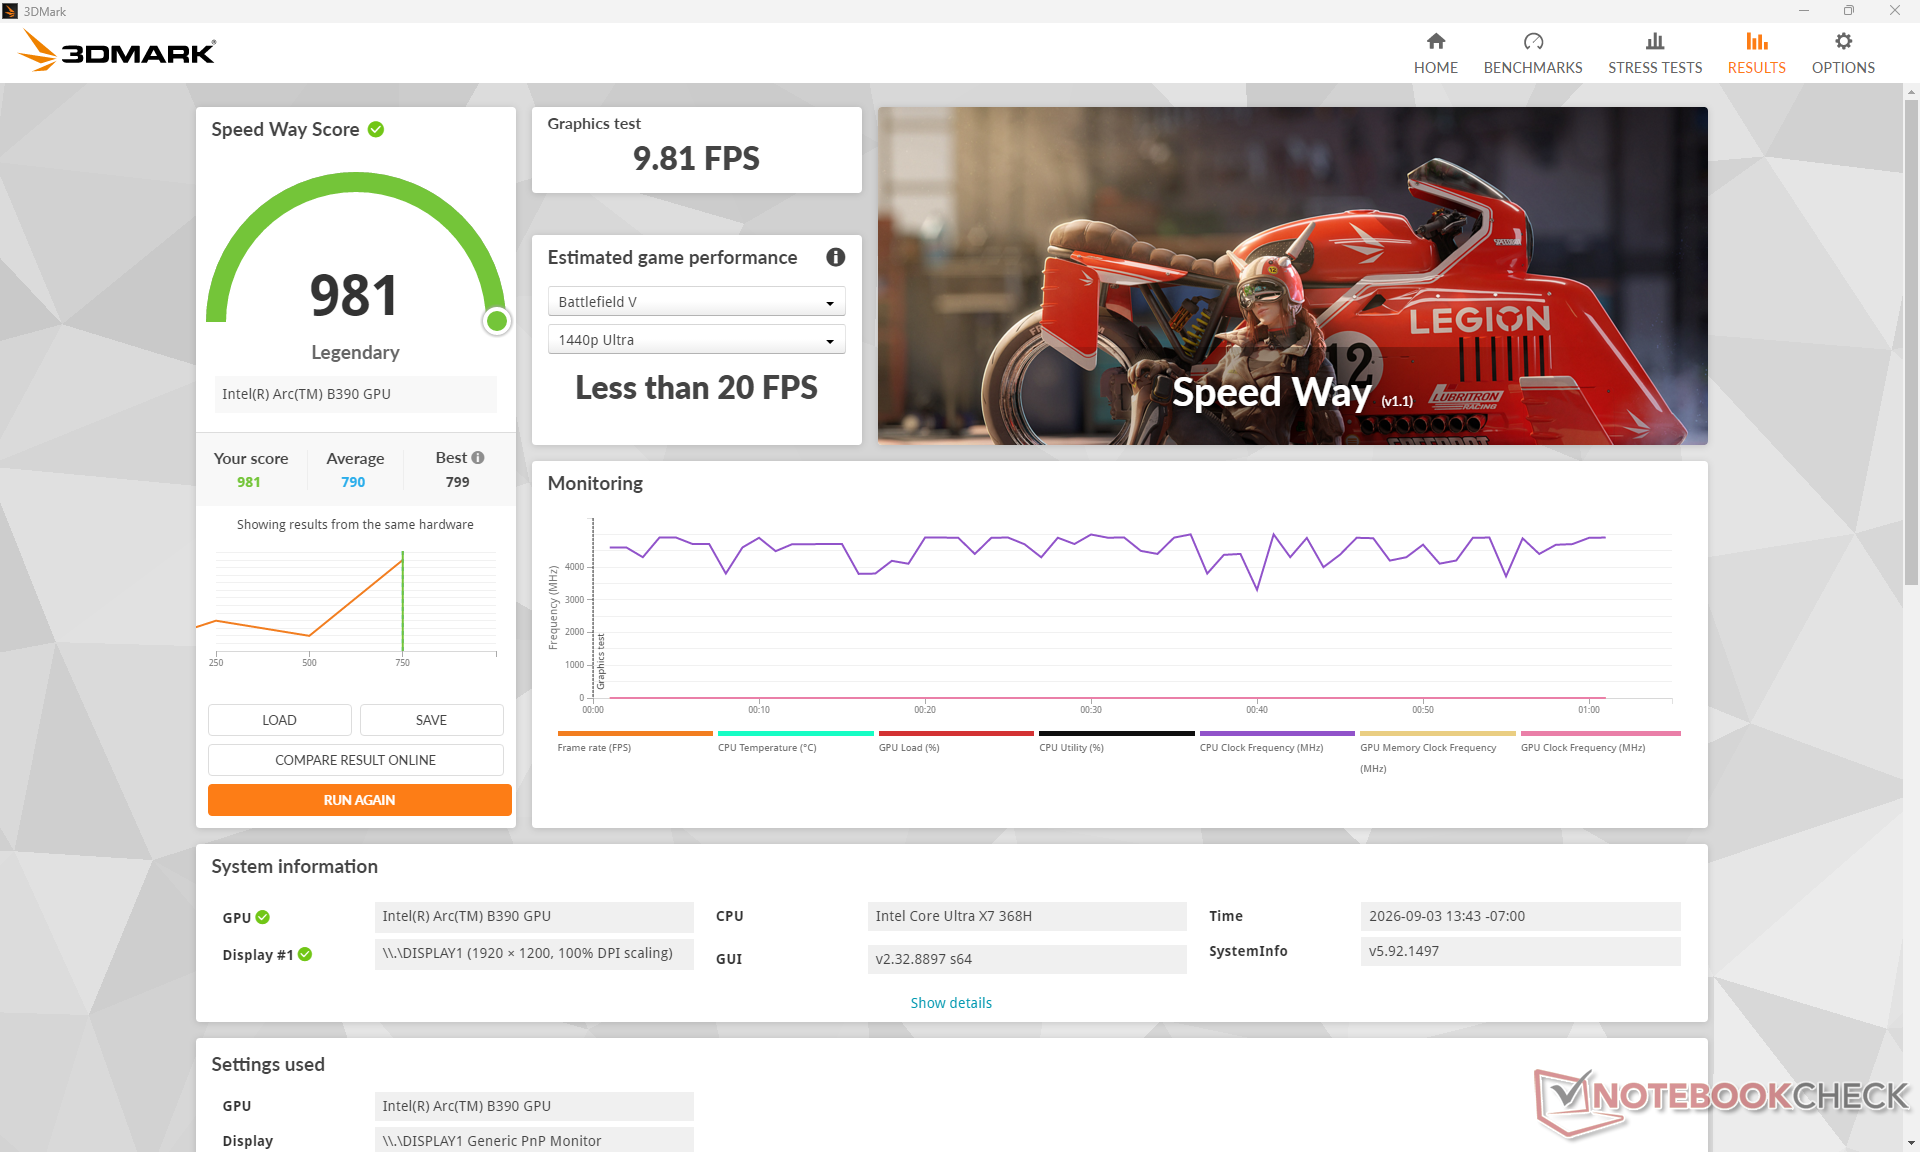
Speed Way
Speed Way
3DMark Performance rating - Percent
Dell Pro 5 14 P514260
Intel Arc B390 12 Xe3 Panther Lake iGPU, Intel Core Ultra X7 368H
100 pt
Asus ExpertBook Ultra B9406CAA
Intel Arc B390 12 Xe3 Panther Lake iGPU, Intel Core Ultra X7 358H
93.5 pt
Média Intel Arc B390 12 Xe3 Panther Lake iGPU
 
92.3 pt
HP OmniBook Ultra 14 Core Ultra X9
Intel Arc B390 12 Xe3 Panther Lake iGPU, Intel Core Ultra X9 388H
89.9 pt
HP ZBook Ultra G1a 14 B30FBES
AMD Radeon 8040S, AMD Ryzen AI Max PRO 380
68.9 pt
Lenovo Yoga 9 14 2in1 G10
Intel Arc Graphics 140V, Intel Core Ultra 7 258V
57.4 pt
Samsung Galaxy Book5 Pro 14 940XHA
Intel Arc Graphics 130V, Intel Core Ultra 5 226V
49.4 pt
Dell Pro 7 14 P714265
AMD Radeon 890M, AMD Ryzen AI 9 HX PRO 470
45.4 pt
Lenovo ThinkPad T14s Gen 7 21YW0022GE
AMD Radeon 860M, AMD Ryzen AI 7 PRO 450
45.3 pt
Dell Pro 7 14 P714260
Intel Graphics 4 Xe3 Panther Lake iGPU, Intel Core Ultra 7 366H
42.1 pt
HP EliteBook 8 G2a 14
AMD Radeon 860M, AMD Ryzen AI 7 450
41.9 pt
Lenovo ThinkPad E14 G8-21Y2006XGE
AMD Radeon 840M, AMD Ryzen AI 7 345
22.9 pt
3DMark
1920x1080 Fire Strike Graphics
Dell Pro 5 14 P514260
Intel Arc B390 12 Xe3 Panther Lake iGPU, Intel Core Ultra X7 368H
18327 Points
Asus ExpertBook Ultra B9406CAA
Intel Arc B390 12 Xe3 Panther Lake iGPU, Intel Core Ultra X7 358H
17054 Points -7%
Média Intel Arc B390 12 Xe3 Panther Lake iGPU
  (13410 - 18327, n=14)
16714 Points -9%
HP OmniBook Ultra 14 Core Ultra X9
Intel Arc B390 12 Xe3 Panther Lake iGPU, Intel Core Ultra X9 388H
16347 Points -11%
HP ZBook Ultra G1a 14 B30FBES
AMD Radeon 8040S, AMD Ryzen AI Max PRO 380
12374 Points -32%
Lenovo Yoga 9 14 2in1 G10
Intel Arc Graphics 140V, Intel Core Ultra 7 258V
9923 Points -46%
Samsung Galaxy Book5 Pro 14 940XHA
Intel Arc Graphics 130V, Intel Core Ultra 5 226V
8648 Points -53%
Lenovo ThinkPad T14s Gen 7 21YW0022GE
AMD Radeon 860M, AMD Ryzen AI 7 PRO 450
7459 Points -59%
HP EliteBook 8 G2a 14
AMD Radeon 860M, AMD Ryzen AI 7 450
7437 Points -59%
Dell Pro 7 14 P714260
Intel Graphics 4 Xe3 Panther Lake iGPU, Intel Core Ultra 7 366H
7415 Points -60%
Dell Pro 7 14 P714265
AMD Radeon 890M, AMD Ryzen AI 9 HX PRO 470
6693 Points -63%
Lenovo ThinkPad E14 G8-21Y2006XGE
AMD Radeon 840M, AMD Ryzen AI 7 345
3903 Points -79%
2560x1440 Time Spy Graphics
Dell Pro 5 14 P514260
Intel Arc B390 12 Xe3 Panther Lake iGPU, Intel Core Ultra X7 368H
7114 Points
Asus ExpertBook Ultra B9406CAA
Intel Arc B390 12 Xe3 Panther Lake iGPU, Intel Core Ultra X7 358H
6679 Points -6%
Média Intel Arc B390 12 Xe3 Panther Lake iGPU
  (4567 - 7257, n=21)
6499 Points -9%
HP OmniBook Ultra 14 Core Ultra X9
Intel Arc B390 12 Xe3 Panther Lake iGPU, Intel Core Ultra X9 388H
6288 Points -12%
Lenovo Yoga 9 14 2in1 G10
Intel Arc Graphics 140V, Intel Core Ultra 7 258V
4130 Points -42%
HP ZBook Ultra G1a 14 B30FBES
AMD Radeon 8040S, AMD Ryzen AI Max PRO 380
4033 Points -43%
Samsung Galaxy Book5 Pro 14 940XHA
Intel Arc Graphics 130V, Intel Core Ultra 5 226V
3532 Points -50%
Dell Pro 7 14 P714260
Intel Graphics 4 Xe3 Panther Lake iGPU, Intel Core Ultra 7 366H
3130 Points -56%
Lenovo ThinkPad T14s Gen 7 21YW0022GE
AMD Radeon 860M, AMD Ryzen AI 7 PRO 450
2812 Points -60%
Dell Pro 7 14 P714265
AMD Radeon 890M, AMD Ryzen AI 9 HX PRO 470
2639 Points -63%
HP EliteBook 8 G2a 14
AMD Radeon 860M, AMD Ryzen AI 7 450
2355 Points -67%
Lenovo ThinkPad E14 G8-21Y2006XGE
AMD Radeon 840M, AMD Ryzen AI 7 345
1380 Points -81%
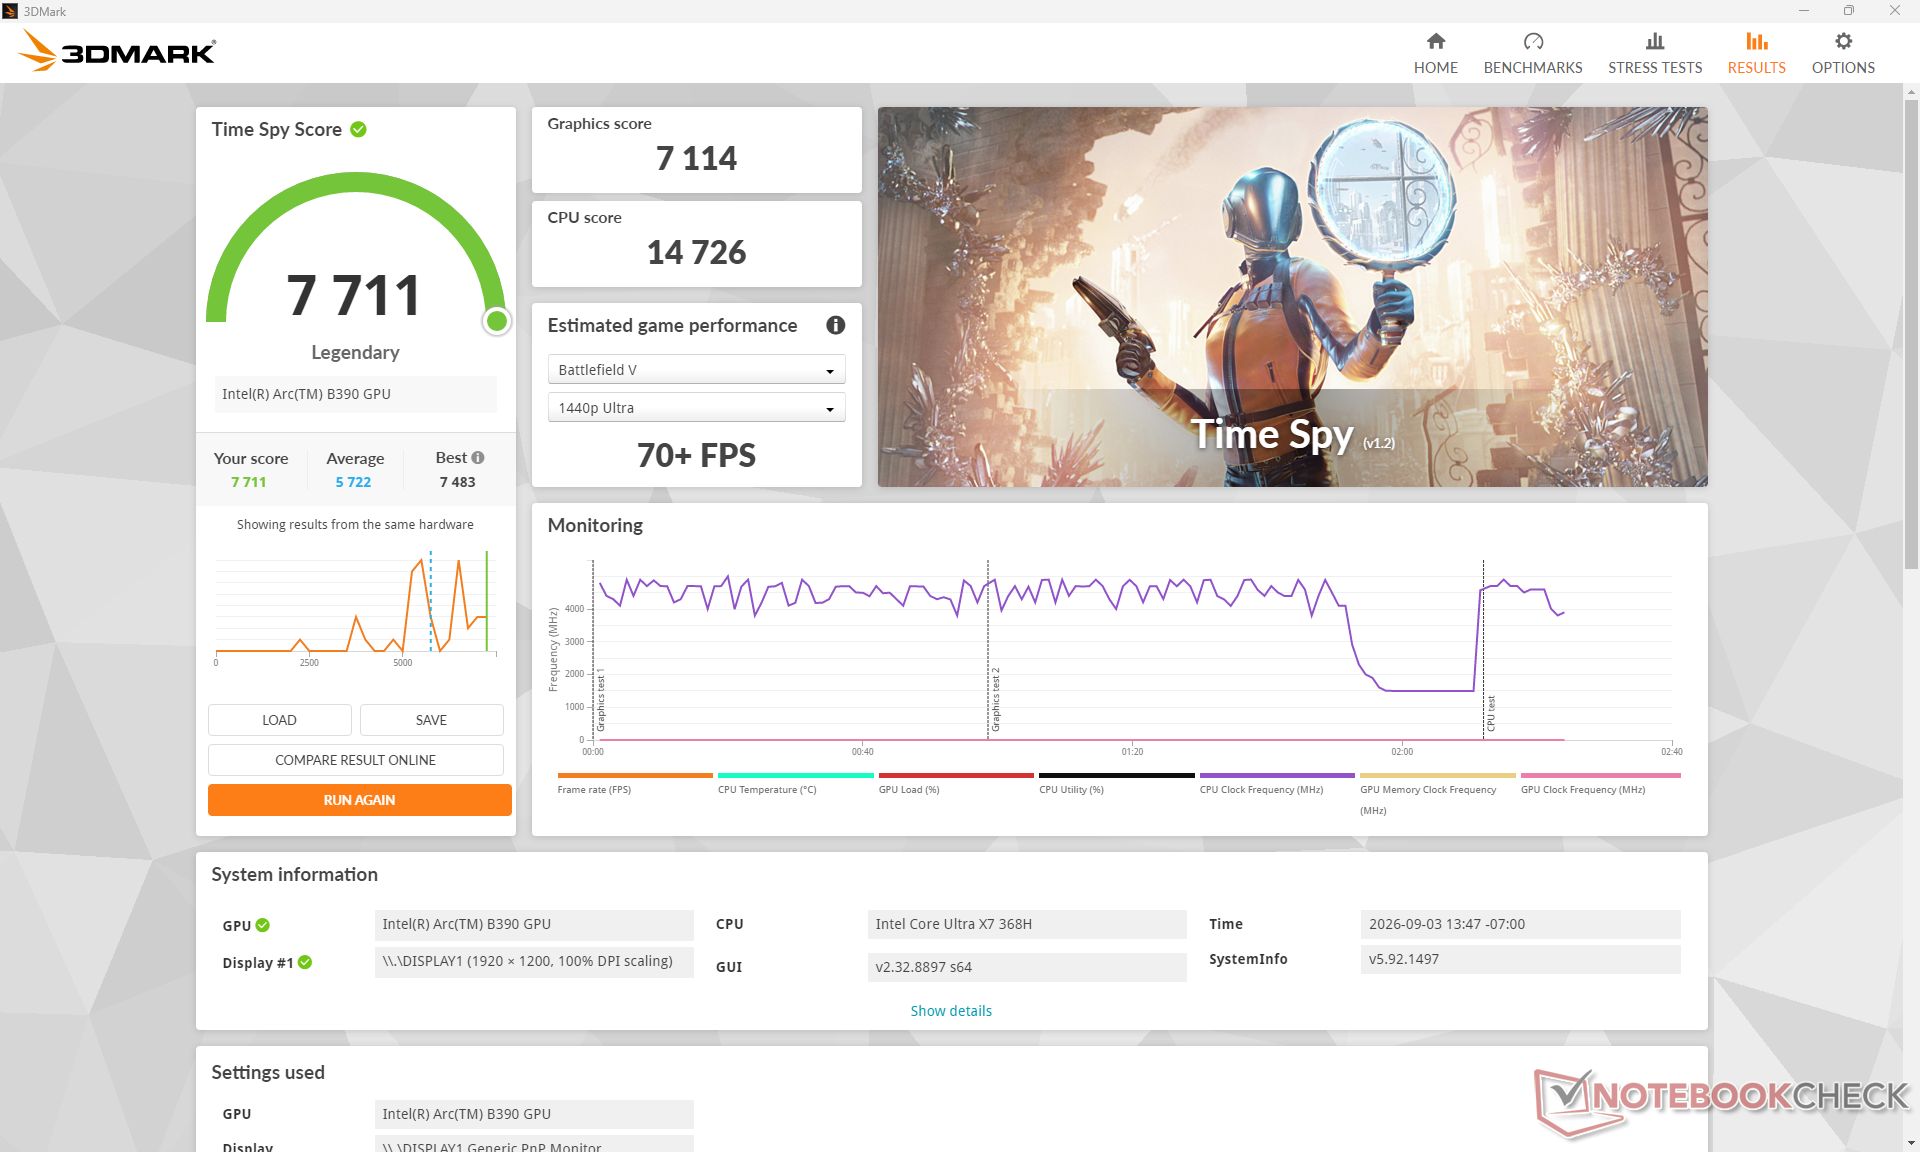
2560x1440 Time Spy Score
Dell Pro 5 14 P514260
Intel Arc B390 12 Xe3 Panther Lake iGPU, Intel Core Ultra X7 368H
7711 Points
Asus ExpertBook Ultra B9406CAA
Intel Arc B390 12 Xe3 Panther Lake iGPU, Intel Core Ultra X7 358H
7270 Points -6%
Média Intel Arc B390 12 Xe3 Panther Lake iGPU
  (5915 - 7842, n=15)
7202 Points -7%
HP OmniBook Ultra 14 Core Ultra X9
Intel Arc B390 12 Xe3 Panther Lake iGPU, Intel Core Ultra X9 388H
6806 Points -12%
Lenovo Yoga 9 14 2in1 G10
Intel Arc Graphics 140V, Intel Core Ultra 7 258V
4466 Points -42%
HP ZBook Ultra G1a 14 B30FBES
AMD Radeon 8040S, AMD Ryzen AI Max PRO 380
4313 Points -44%
Samsung Galaxy Book5 Pro 14 940XHA
Intel Arc Graphics 130V, Intel Core Ultra 5 226V
3840 Points -50%
Dell Pro 7 14 P714260
Intel Graphics 4 Xe3 Panther Lake iGPU, Intel Core Ultra 7 366H
3513 Points -54%
Lenovo ThinkPad T14s Gen 7 21YW0022GE
AMD Radeon 860M, AMD Ryzen AI 7 PRO 450
3148 Points -59%
Dell Pro 7 14 P714265
AMD Radeon 890M, AMD Ryzen AI 9 HX PRO 470
2954 Points -62%
HP EliteBook 8 G2a 14
AMD Radeon 860M, AMD Ryzen AI 7 450
2659 Points -66%
Lenovo ThinkPad E14 G8-21Y2006XGE
AMD Radeon 840M, AMD Ryzen AI 7 345
1568 Points -80%
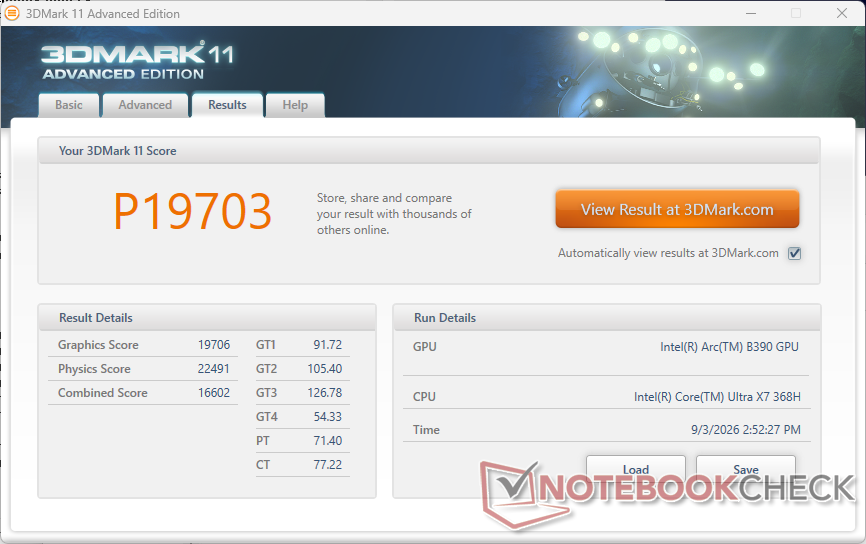
3DMark 11 - 1280x720 Performance GPU
Dell Pro 5 14 P514260
Intel Arc B390 12 Xe3 Panther Lake iGPU, Intel Core Ultra X7 368H
19706 Points
HP ZBook Ultra G1a 14 B30FBES
AMD Radeon 8040S, AMD Ryzen AI Max PRO 380
18783 Points -5%
HP OmniBook Ultra 14 Core Ultra X9
Intel Arc B390 12 Xe3 Panther Lake iGPU, Intel Core Ultra X9 388H
18489 Points -6%
Média Intel Arc B390 12 Xe3 Panther Lake iGPU
  (14637 - 19706, n=14)
18348 Points -7%
Asus ExpertBook Ultra B9406CAA
Intel Arc B390 12 Xe3 Panther Lake iGPU, Intel Core Ultra X7 358H
18313 Points -7%
Dell Pro 7 14 P714265
AMD Radeon 890M, AMD Ryzen AI 9 HX PRO 470
13767 Points -30%
Lenovo ThinkPad T14s Gen 7 21YW0022GE
AMD Radeon 860M, AMD Ryzen AI 7 PRO 450
11833 Points -40%
Lenovo Yoga 9 14 2in1 G10
Intel Arc Graphics 140V, Intel Core Ultra 7 258V
11752 Points -40%
HP EliteBook 8 G2a 14
AMD Radeon 860M, AMD Ryzen AI 7 450
11677 Points -41%
Samsung Galaxy Book5 Pro 14 940XHA
Intel Arc Graphics 130V, Intel Core Ultra 5 226V
10042 Points -49%
Dell Pro 7 14 P714260
Intel Graphics 4 Xe3 Panther Lake iGPU, Intel Core Ultra 7 366H
7583 Points -62%
Lenovo ThinkPad E14 G8-21Y2006XGE
AMD Radeon 840M, AMD Ryzen AI 7 345
6063 Points -69%
3DMark 11 Performance
19703 pontos
3DMark Cloud Gate Standard Score
42701 pontos
3DMark Fire Strike Score
15351 pontos
3DMark Time Spy Score
7711 pontos
Ajuda
Blender
v3.3 Classroom CPU
Samsung Galaxy Book5 Pro 14 940XHA
Intel Arc Graphics 130V, Intel Core Ultra 5 226V
593 Seconds * -84%
Lenovo Yoga 9 14 2in1 G10
Intel Arc Graphics 140V, Intel Core Ultra 7 258V
531 Seconds * -64%
Lenovo ThinkPad E14 G8-21Y2006XGE
AMD Radeon 840M, AMD Ryzen AI 7 345
446 Seconds * -38%
HP ZBook Ultra G1a 14 B30FBES
AMD Radeon 8040S, AMD Ryzen AI Max PRO 380
358 Seconds * -11%
Dell Pro 7 14 P714260
Intel Graphics 4 Xe3 Panther Lake iGPU, Intel Core Ultra 7 366H
355 Seconds * -10%
Lenovo ThinkPad T14s Gen 7 21YW0022GE
AMD Radeon 860M, AMD Ryzen AI 7 PRO 450
337 Seconds * -4%
Média Intel Arc B390 12 Xe3 Panther Lake iGPU
  (282 - 409, n=14)
328 Seconds * -2%
HP OmniBook Ultra 14 Core Ultra X9
Intel Arc B390 12 Xe3 Panther Lake iGPU, Intel Core Ultra X9 388H
326 Seconds * -1%
Dell Pro 5 14 P514260
Intel Arc B390 12 Xe3 Panther Lake iGPU, Intel Core Ultra X7 368H
323 Seconds *
HP EliteBook 8 G2a 14
AMD Radeon 860M, AMD Ryzen AI 7 450
316 Seconds * +2%
Asus ExpertBook Ultra B9406CAA
Intel Arc B390 12 Xe3 Panther Lake iGPU, Intel Core Ultra X7 358H
288 Seconds * +11%
Dell Pro 7 14 P714265
AMD Radeon 890M, AMD Ryzen AI 9 HX PRO 470
279 Seconds * +14%
v3.3 Classroom oneAPI/Intel
Média Intel Arc B390 12 Xe3 Panther Lake iGPU
  (105 - 254, n=6)
131.5 Seconds *
Asus ExpertBook Ultra B9406CAA
Intel Arc B390 12 Xe3 Panther Lake iGPU, Intel Core Ultra X7 358H
110 Seconds *
HP OmniBook Ultra 14 Core Ultra X9
Intel Arc B390 12 Xe3 Panther Lake iGPU, Intel Core Ultra X9 388H
105 Seconds *
v4.3 Barbershop CPU
Lenovo ThinkPad E14 G8-21Y2006XGE
AMD Radeon 840M, AMD Ryzen AI 7 345
2344 Seconds * -38%
Dell Pro 7 14 P714260
Intel Graphics 4 Xe3 Panther Lake iGPU, Intel Core Ultra 7 366H
2108 Seconds * -24%
Dell Pro 5 14 P514260
Intel Arc B390 12 Xe3 Panther Lake iGPU, Intel Core Ultra X7 368H
1697 Seconds *
HP OmniBook Ultra 14 Core Ultra X9
Intel Arc B390 12 Xe3 Panther Lake iGPU, Intel Core Ultra X9 388H
1609 Seconds * +5%
Média Intel Arc B390 12 Xe3 Panther Lake iGPU
  (1382 - 1800, n=9)
1602 Seconds * +6%
Dell Pro 7 14 P714265
AMD Radeon 890M, AMD Ryzen AI 9 HX PRO 470
1444 Seconds * +15%
Asus ExpertBook Ultra B9406CAA
Intel Arc B390 12 Xe3 Panther Lake iGPU, Intel Core Ultra X7 358H
1439 Seconds * +15%
v4.3 Barbershop oneAPI
Dell Pro 7 14 P714260
Intel Graphics 4 Xe3 Panther Lake iGPU, Intel Core Ultra 7 366H
758 Seconds * -101%
Média Intel Arc B390 12 Xe3 Panther Lake iGPU
  (369 - 625, n=8)
436 Seconds * -16%
Asus ExpertBook Ultra B9406CAA
Intel Arc B390 12 Xe3 Panther Lake iGPU, Intel Core Ultra X7 358H
383 Seconds * -2%
Dell Pro 5 14 P514260
Intel Arc B390 12 Xe3 Panther Lake iGPU, Intel Core Ultra X7 368H
377 Seconds *
HP OmniBook Ultra 14 Core Ultra X9
Intel Arc B390 12 Xe3 Panther Lake iGPU, Intel Core Ultra X9 388H
371 Seconds * +2%

* ... menor é melhor

Performance rating - Percent
Asus ExpertBook Ultra B9406CAA
Intel Core Ultra X7 358H, Intel Arc B390 12 Xe3 Panther Lake iGPU
97.4 pt
HP OmniBook Ultra 14 Core Ultra X9
Intel Core Ultra X9 388H, Intel Arc B390 12 Xe3 Panther Lake iGPU
96.4 pt
Dell Pro 5 14 P514260
Intel Core Ultra X7 368H, Intel Arc B390 12 Xe3 Panther Lake iGPU
89.8 pt
Dell Pro 7 14 P714260
Intel Core Ultra 7 366H, Intel Graphics 4 Xe3 Panther Lake iGPU
57.1 pt
Samsung Galaxy Book5 Pro 14 940XHA
Intel Core Ultra 5 226V, Intel Arc Graphics 130V
56.1 pt
Lenovo ThinkPad T14s Gen 7 21YW0022GE
AMD Ryzen AI 7 PRO 450, AMD Radeon 860M
55.6 pt
Cyberpunk 2077 - 1920x1080 Ultra Preset (FSR off)
Dell Pro 5 14 P514260
Intel Core Ultra X7 368H, Intel Arc B390 12 Xe3 Panther Lake iGPU
51 (41.4min, 39.2P1) fps
Asus ExpertBook Ultra B9406CAA
Intel Core Ultra X7 358H, Intel Arc B390 12 Xe3 Panther Lake iGPU
47.2 (39.1min, 36.3P1) fps -7%
HP OmniBook Ultra 14 Core Ultra X9
Intel Core Ultra X9 388H, Intel Arc B390 12 Xe3 Panther Lake iGPU
44.9 (36.5min, 35.1P1) fps -12%
Samsung Galaxy Book5 Pro 14 940XHA
Intel Core Ultra 5 226V, Intel Arc Graphics 130V
24.9 (20.8min) fps -51%
Dell Pro 7 14 P714260
Intel Core Ultra 7 366H, Intel Graphics 4 Xe3 Panther Lake iGPU
22.6 (19.2min, 18.1P1) fps -56%
Lenovo ThinkPad T14s Gen 7 21YW0022GE
AMD Ryzen AI 7 PRO 450, AMD Radeon 860M
17.7 (14.1min) fps -65%
Baldur's Gate 3 - 1920x1080 Ultra Preset AA:T
HP OmniBook Ultra 14 Core Ultra X9
Intel Core Ultra X9 388H, Intel Arc B390 12 Xe3 Panther Lake iGPU
53.5 (48.4min, 49.1P0.1, 50.4P1) fps +10%
Asus ExpertBook Ultra B9406CAA
Intel Core Ultra X7 358H, Intel Arc B390 12 Xe3 Panther Lake iGPU
53.4 (45.4min, 46.4P0.1, 49.5P1) fps +10%
Dell Pro 5 14 P514260
Intel Core Ultra X7 368H, Intel Arc B390 12 Xe3 Panther Lake iGPU
48.5 (44.7min, 44.7P0.1, 45.6P1) fps
Dell Pro 7 14 P714260
Intel Core Ultra 7 366H, Intel Graphics 4 Xe3 Panther Lake iGPU
23.5 (21min, 21.3P0.1, 21.8P1) fps -52%
Samsung Galaxy Book5 Pro 14 940XHA
Intel Core Ultra 5 226V, Intel Arc Graphics 130V
22.8 fps -53%
Lenovo ThinkPad T14s Gen 7 21YW0022GE
AMD Ryzen AI 7 PRO 450, AMD Radeon 860M
17.9 (14.8min, 15.2P0.1, 16.1P1) fps -63%
GTA V - 1920x1080 Highest AA:4xMSAA + FX AF:16x
Asus ExpertBook Ultra B9406CAA
Intel Core Ultra X7 358H, Intel Arc B390 12 Xe3 Panther Lake iGPU
45.3 (11.1min, 34.5P1) fps +9%
HP OmniBook Ultra 14 Core Ultra X9
Intel Core Ultra X9 388H, Intel Arc B390 12 Xe3 Panther Lake iGPU
43.7 (6.57min, 29.4P1) fps +6%
Dell Pro 5 14 P514260
Intel Core Ultra X7 368H, Intel Arc B390 12 Xe3 Panther Lake iGPU
41.4 (5.87min, 27.8P1) fps
Lenovo ThinkPad T14s Gen 7 21YW0022GE
AMD Ryzen AI 7 PRO 450, AMD Radeon 860M
25.4 (4.78min, 18.2P1) fps -39%
Dell Pro 7 14 P714260
Intel Core Ultra 7 366H, Intel Graphics 4 Xe3 Panther Lake iGPU
23.8 (5.94min, 18.9P1) fps -43%
Samsung Galaxy Book5 Pro 14 940XHA
Intel Core Ultra 5 226V, Intel Arc Graphics 130V
20.8 (7.23min, 16.4P1) fps -50%
Final Fantasy XV Benchmark - 1920x1080 High Quality
Asus ExpertBook Ultra B9406CAA
Intel Core Ultra X7 358H, Intel Arc B390 12 Xe3 Panther Lake iGPU
55.4 fps +56%
HP OmniBook Ultra 14 Core Ultra X9
Intel Core Ultra X9 388H, Intel Arc B390 12 Xe3 Panther Lake iGPU
54.5 fps +54%
Dell Pro 5 14 P514260
Intel Core Ultra X7 368H, Intel Arc B390 12 Xe3 Panther Lake iGPU
35.5 fps
Samsung Galaxy Book5 Pro 14 940XHA
Intel Core Ultra 5 226V, Intel Arc Graphics 130V
30.3 fps -15%
Dell Pro 7 14 P714260
Intel Core Ultra 7 366H, Intel Graphics 4 Xe3 Panther Lake iGPU
27.4 fps -23%
Lenovo ThinkPad T14s Gen 7 21YW0022GE
AMD Ryzen AI 7 PRO 450, AMD Radeon 860M
26.8 fps -25%
Strange Brigade - 1920x1080 ultra AA:ultra AF:16
HP OmniBook Ultra 14 Core Ultra X9
Intel Core Ultra X9 388H, Intel Arc B390 12 Xe3 Panther Lake iGPU
101.3 (43.7min, 74.5P1) fps +10%
Asus ExpertBook Ultra B9406CAA
Intel Core Ultra X7 358H, Intel Arc B390 12 Xe3 Panther Lake iGPU
99.5 (24.8min, 76.1P1) fps +9%
Dell Pro 5 14 P514260
Intel Core Ultra X7 368H, Intel Arc B390 12 Xe3 Panther Lake iGPU
91.7 (40min, 61.5P1) fps
Dell Pro 7 14 P714260
Intel Core Ultra 7 366H, Intel Graphics 4 Xe3 Panther Lake iGPU
52.4 (34.3min, 38.9P1) fps -43%
Samsung Galaxy Book5 Pro 14 940XHA
Intel Core Ultra 5 226V, Intel Arc Graphics 130V
51.3 (21.7min, 28.6P1) fps -44%
Lenovo ThinkPad T14s Gen 7 21YW0022GE
AMD Ryzen AI 7 PRO 450, AMD Radeon 860M
44.4 (33min, 34.8P1) fps -52%
Dota 2 Reborn - 1920x1080 ultra (3/3) best looking
Asus ExpertBook Ultra B9406CAA
Intel Core Ultra X7 358H, Intel Arc B390 12 Xe3 Panther Lake iGPU
102.5 (67.7min) fps +9%
HP OmniBook Ultra 14 Core Ultra X9
Intel Core Ultra X9 388H, Intel Arc B390 12 Xe3 Panther Lake iGPU
97 (51.8min) fps +3%
Dell Pro 5 14 P514260
Intel Core Ultra X7 368H, Intel Arc B390 12 Xe3 Panther Lake iGPU
94.3 (62.2min) fps
Dell Pro 7 14 P714260
Intel Core Ultra 7 366H, Intel Graphics 4 Xe3 Panther Lake iGPU
91.7 (61.9min) fps -3%
Lenovo ThinkPad T14s Gen 7 21YW0022GE
AMD Ryzen AI 7 PRO 450, AMD Radeon 860M
81.3 (71.8min) fps -14%
Samsung Galaxy Book5 Pro 14 940XHA
Intel Core Ultra 5 226V, Intel Arc Graphics 130V
79.5 (53.1min) fps -16%
X-Plane 11.11 - 1920x1080 high (fps_test=3)
Dell Pro 5 14 P514260
Intel Core Ultra X7 368H, Intel Arc B390 12 Xe3 Panther Lake iGPU
43.4 fps
HP OmniBook Ultra 14 Core Ultra X9
Intel Core Ultra X9 388H, Intel Arc B390 12 Xe3 Panther Lake iGPU
42.2 fps -3%
Lenovo ThinkPad T14s Gen 7 21YW0022GE
AMD Ryzen AI 7 PRO 450, AMD Radeon 860M
40.7 fps -6%
Asus ExpertBook Ultra B9406CAA
Intel Core Ultra X7 358H, Intel Arc B390 12 Xe3 Panther Lake iGPU
39.7 fps -9%
Samsung Galaxy Book5 Pro 14 940XHA
Intel Core Ultra 5 226V, Intel Arc Graphics 130V
31.5 fps -27%
Dell Pro 7 14 P714260
Intel Core Ultra 7 366H, Intel Graphics 4 Xe3 Panther Lake iGPU
29.5 fps -32%
Cyberpunk 2077
1920x1080 Medium Preset (FSR off)
Dell Pro 5 14 P514260
Intel Core Ultra X7 368H, Intel Arc B390 12 Xe3 Panther Lake iGPU
68.9 (58.8min, 55.4P1) fps
Asus ExpertBook Ultra B9406CAA
Intel Core Ultra X7 358H, Intel Arc B390 12 Xe3 Panther Lake iGPU
63.1 (54.6min, 52.4P1) fps -8%
Média Intel Arc B390 12 Xe3 Panther Lake iGPU
  (49.3 - 68.9, n=14)
61.1 fps -11%
HP OmniBook Ultra 14 Core Ultra X9
Intel Core Ultra X9 388H, Intel Arc B390 12 Xe3 Panther Lake iGPU
60.1 (51.4min, 48.1P1) fps -13%
HP ZBook Ultra G1a 14 B30FBES
AMD Ryzen AI Max PRO 380, AMD Radeon 8040S
46 (40min) fps -33%
Lenovo Yoga 9 14 2in1 G10
Intel Core Ultra 7 258V, Intel Arc Graphics 140V
38.7 (31.7min) fps -44%
Dell Pro 7 14 P714265
AMD Ryzen AI 9 HX PRO 470, AMD Radeon 890M
38.6 (33.4min, 31.9P1) fps -44%
Samsung Galaxy Book5 Pro 14 940XHA
Intel Core Ultra 5 226V, Intel Arc Graphics 130V
32.6 (27.9min) fps -53%
Dell Pro 7 14 P714260
Intel Core Ultra 7 366H, Intel Graphics 4 Xe3 Panther Lake iGPU
30.9 (27min, 26P1) fps -55%
HP EliteBook 8 G2a 14
AMD Ryzen AI 7 450, AMD Radeon 860M
28.2 (23.4min) fps -59%
Lenovo ThinkPad T14s Gen 7 21YW0022GE
AMD Ryzen AI 7 PRO 450, AMD Radeon 860M
27.7 (22.9min) fps -60%
Lenovo ThinkPad E14 G8-21Y2006XGE
AMD Ryzen AI 7 345, AMD Radeon 840M
15 (13min, 11.7P1) fps -78%
1920x1080 High Preset (FSR off)
Dell Pro 5 14 P514260
Intel Core Ultra X7 368H, Intel Arc B390 12 Xe3 Panther Lake iGPU
58.3 (48.7min, 45.2P1) fps
Asus ExpertBook Ultra B9406CAA
Intel Core Ultra X7 358H, Intel Arc B390 12 Xe3 Panther Lake iGPU
53.8 (46.6min, 44.7P1) fps -8%
HP OmniBook Ultra 14 Core Ultra X9
Intel Core Ultra X9 388H, Intel Arc B390 12 Xe3 Panther Lake iGPU
51.9 (44.1min, 41.3P1) fps -11%
Média Intel Arc B390 12 Xe3 Panther Lake iGPU
  (43.2 - 58.8, n=13)
51.9 fps -11%
HP ZBook Ultra G1a 14 B30FBES
AMD Ryzen AI Max PRO 380, AMD Radeon 8040S
36 (31min) fps -38%
Lenovo Yoga 9 14 2in1 G10
Intel Core Ultra 7 258V, Intel Arc Graphics 140V
33.9 (28.1min) fps -42%
Dell Pro 7 14 P714265
AMD Ryzen AI 9 HX PRO 470, AMD Radeon 890M
29.7 (25min, 23.6P1) fps -49%
Samsung Galaxy Book5 Pro 14 940XHA
Intel Core Ultra 5 226V, Intel Arc Graphics 130V
28 (23.2min) fps -52%
Dell Pro 7 14 P714260
Intel Core Ultra 7 366H, Intel Graphics 4 Xe3 Panther Lake iGPU
26.8 (23.1min, 22.2P1) fps -54%
HP EliteBook 8 G2a 14
AMD Ryzen AI 7 450, AMD Radeon 860M
22.2 (18.2min) fps -62%
Lenovo ThinkPad T14s Gen 7 21YW0022GE
AMD Ryzen AI 7 PRO 450, AMD Radeon 860M
21.6 (17.5min) fps -63%
Lenovo ThinkPad E14 G8-21Y2006XGE
AMD Ryzen AI 7 345, AMD Radeon 840M
12 (10.2min, 9.61P1) fps -79%
1920x1080 Ultra Preset (FSR off)
Dell Pro 5 14 P514260
Intel Core Ultra X7 368H, Intel Arc B390 12 Xe3 Panther Lake iGPU
51 (41.4min, 39.2P1) fps
Asus ExpertBook Ultra B9406CAA
Intel Core Ultra X7 358H, Intel Arc B390 12 Xe3 Panther Lake iGPU
47.2 (39.1min, 36.3P1) fps -7%
HP OmniBook Ultra 14 Core Ultra X9
Intel Core Ultra X9 388H, Intel Arc B390 12 Xe3 Panther Lake iGPU
44.9 (36.5min, 35.1P1) fps -12%
Média Intel Arc B390 12 Xe3 Panther Lake iGPU
  (27.2 - 51, n=19)
42.9 fps -16%
HP ZBook Ultra G1a 14 B30FBES
AMD Ryzen AI Max PRO 380, AMD Radeon 8040S
33.2 (28min) fps -35%
Lenovo Yoga 9 14 2in1 G10
Intel Core Ultra 7 258V, Intel Arc Graphics 140V
29.9 (24.5min) fps -41%
Dell Pro 7 14 P714265
AMD Ryzen AI 9 HX PRO 470, AMD Radeon 890M
25.7 (21.4min, 20.2P1) fps -50%
Samsung Galaxy Book5 Pro 14 940XHA
Intel Core Ultra 5 226V, Intel Arc Graphics 130V
24.9 (20.8min) fps -51%
Dell Pro 7 14 P714260
Intel Core Ultra 7 366H, Intel Graphics 4 Xe3 Panther Lake iGPU
22.6 (19.2min, 18.1P1) fps -56%
HP EliteBook 8 G2a 14
AMD Ryzen AI 7 450, AMD Radeon 860M
18.6 (14.6min) fps -64%
Lenovo ThinkPad T14s Gen 7 21YW0022GE
AMD Ryzen AI 7 PRO 450, AMD Radeon 860M
17.7 (14.1min) fps -65%
Lenovo ThinkPad E14 G8-21Y2006XGE
AMD Ryzen AI 7 345, AMD Radeon 840M
10 (8.39min, 8.08P1) fps -80%
GTA V
1920x1080 High/On (Advanced Graphics Off) AA:2xMSAA + FX AF:8x
Asus ExpertBook Ultra B9406CAA
Intel Core Ultra X7 358H, Intel Arc B390 12 Xe3 Panther Lake iGPU
111.9 (7.17min, 76.9P1) fps +18%
Média Intel Arc B390 12 Xe3 Panther Lake iGPU
  (82.3 - 114.5, n=13)
101.3 fps +7%
HP OmniBook Ultra 14 Core Ultra X9
Intel Core Ultra X9 388H, Intel Arc B390 12 Xe3 Panther Lake iGPU
99.6 (7.57min, 62.5P1) fps +5%
Dell Pro 5 14 P514260
Intel Core Ultra X7 368H, Intel Arc B390 12 Xe3 Panther Lake iGPU
94.7 (7.08min, 58.8P1) fps
Dell Pro 7 14 P714265
AMD Ryzen AI 9 HX PRO 470, AMD Radeon 890M
78.9 (5.51min, 55.6P1) fps -17%
Lenovo Yoga 9 14 2in1 G10
Intel Core Ultra 7 258V, Intel Arc Graphics 140V
71.6 (7.48min, 55.6P1) fps -24%
HP EliteBook 8 G2a 14
AMD Ryzen AI 7 450, AMD Radeon 860M
70.3 (9.46min, 50P1) fps -26%
Lenovo ThinkPad T14s Gen 7 21YW0022GE
AMD Ryzen AI 7 PRO 450, AMD Radeon 860M
67.6 (6.64min, 47.6P1) fps -29%
Samsung Galaxy Book5 Pro 14 940XHA
Intel Core Ultra 5 226V, Intel Arc Graphics 130V
56.9 (6.65min, 43.5P1) fps -40%
Dell Pro 7 14 P714260
Intel Core Ultra 7 366H, Intel Graphics 4 Xe3 Panther Lake iGPU
51.5 (4.62min, 32.3P1) fps -46%
Lenovo ThinkPad E14 G8-21Y2006XGE
AMD Ryzen AI 7 345, AMD Radeon 840M
32.1 (5.6min, 22.2P1) fps -66%
1920x1080 Highest AA:4xMSAA + FX AF:16x
Asus ExpertBook Ultra B9406CAA
Intel Core Ultra X7 358H, Intel Arc B390 12 Xe3 Panther Lake iGPU
45.3 (11.1min, 34.5P1) fps +9%
HP OmniBook Ultra 14 Core Ultra X9
Intel Core Ultra X9 388H, Intel Arc B390 12 Xe3 Panther Lake iGPU
43.7 (6.57min, 29.4P1) fps +6%
Média Intel Arc B390 12 Xe3 Panther Lake iGPU
  (35.4 - 46.2, n=14)
42.5 fps +3%
Dell Pro 5 14 P514260
Intel Core Ultra X7 368H, Intel Arc B390 12 Xe3 Panther Lake iGPU
41.4 (5.87min, 27.8P1) fps
Dell Pro 7 14 P714265
AMD Ryzen AI 9 HX PRO 470, AMD Radeon 890M
32.8 (4.62min, 23.8P1) fps -21%
HP EliteBook 8 G2a 14
AMD Ryzen AI 7 450, AMD Radeon 860M
29.1 (6.9min, 20.4P1) fps -30%
Lenovo Yoga 9 14 2in1 G10
Intel Core Ultra 7 258V, Intel Arc Graphics 140V
27.3 (6.02min, 21.7P1) fps -34%
Lenovo ThinkPad T14s Gen 7 21YW0022GE
AMD Ryzen AI 7 PRO 450, AMD Radeon 860M
25.4 (4.78min, 18.2P1) fps -39%
Dell Pro 7 14 P714260
Intel Core Ultra 7 366H, Intel Graphics 4 Xe3 Panther Lake iGPU
23.8 (5.94min, 18.9P1) fps -43%
Samsung Galaxy Book5 Pro 14 940XHA
Intel Core Ultra 5 226V, Intel Arc Graphics 130V
20.8 (7.23min, 16.4P1) fps -50%
Lenovo ThinkPad E14 G8-21Y2006XGE
AMD Ryzen AI 7 345, AMD Radeon 840M
13.4 (8.04min, 9.09P1) fps -68%
Dota 2 Reborn - 1920x1080 ultra (3/3) best looking
Asus ExpertBook Ultra B9406CAA
Intel Core Ultra X7 358H, Intel Arc B390 12 Xe3 Panther Lake iGPU
102.5 (67.7min) fps +9%
Média Intel Arc B390 12 Xe3 Panther Lake iGPU
  (79.7 - 117.2, n=15)
100.8 fps +7%
HP OmniBook Ultra 14 Core Ultra X9
Intel Core Ultra X9 388H, Intel Arc B390 12 Xe3 Panther Lake iGPU
97 (51.8min) fps +3%
Dell Pro 5 14 P514260
Intel Core Ultra X7 368H, Intel Arc B390 12 Xe3 Panther Lake iGPU
94.3 (62.2min) fps
HP ZBook Ultra G1a 14 B30FBES
AMD Ryzen AI Max PRO 380, AMD Radeon 8040S
93.1 (83.8min) fps -1%
Lenovo Yoga 9 14 2in1 G10
Intel Core Ultra 7 258V, Intel Arc Graphics 140V
93 (58.6min) fps -1%
Dell Pro 7 14 P714260
Intel Core Ultra 7 366H, Intel Graphics 4 Xe3 Panther Lake iGPU
91.7 (61.9min) fps -3%
HP EliteBook 8 G2a 14
AMD Ryzen AI 7 450, AMD Radeon 860M
81.4 (72.4min) fps -14%
Lenovo ThinkPad T14s Gen 7 21YW0022GE
AMD Ryzen AI 7 PRO 450, AMD Radeon 860M
81.3 (71.8min) fps -14%
Samsung Galaxy Book5 Pro 14 940XHA
Intel Core Ultra 5 226V, Intel Arc Graphics 130V
79.5 (53.1min) fps -16%
Dell Pro 7 14 P714265
AMD Ryzen AI 9 HX PRO 470, AMD Radeon 890M
79.2 (63.3min) fps -16%
Lenovo ThinkPad E14 G8-21Y2006XGE
AMD Ryzen AI 7 345, AMD Radeon 840M
50 (46min) fps -47%
Final Fantasy XV Benchmark
1920x1080 Standard Quality
Asus ExpertBook Ultra B9406CAA
Intel Core Ultra X7 358H, Intel Arc B390 12 Xe3 Panther Lake iGPU
76.1 fps +56%
HP OmniBook Ultra 14 Core Ultra X9
Intel Core Ultra X9 388H, Intel Arc B390 12 Xe3 Panther Lake iGPU
75.2 fps +54%
Média Intel Arc B390 12 Xe3 Panther Lake iGPU
  (48.9 - 83, n=13)
71.7 fps +47%
Dell Pro 5 14 P514260
Intel Core Ultra X7 368H, Intel Arc B390 12 Xe3 Panther Lake iGPU
48.9 fps
Lenovo Yoga 9 14 2in1 G10
Intel Core Ultra 7 258V, Intel Arc Graphics 140V
46.4 fps -5%
Samsung Galaxy Book5 Pro 14 940XHA
Intel Core Ultra 5 226V, Intel Arc Graphics 130V
43.9 fps -10%
Dell Pro 7 14 P714265
AMD Ryzen AI 9 HX PRO 470, AMD Radeon 890M
41.3 fps -16%
Dell Pro 7 14 P714260
Intel Core Ultra 7 366H, Intel Graphics 4 Xe3 Panther Lake iGPU
37.2 fps -24%
Lenovo ThinkPad T14s Gen 7 21YW0022GE
AMD Ryzen AI 7 PRO 450, AMD Radeon 860M
36.4 fps -26%
HP EliteBook 8 G2a 14
AMD Ryzen AI 7 450, AMD Radeon 860M
36.1 fps -26%
Lenovo ThinkPad E14 G8-21Y2006XGE
AMD Ryzen AI 7 345, AMD Radeon 840M
18.4 fps -62%
1920x1080 High Quality
Asus ExpertBook Ultra B9406CAA
Intel Core Ultra X7 358H, Intel Arc B390 12 Xe3 Panther Lake iGPU
55.4 fps +56%
HP OmniBook Ultra 14 Core Ultra X9
Intel Core Ultra X9 388H, Intel Arc B390 12 Xe3 Panther Lake iGPU
54.5 fps +54%
Média Intel Arc B390 12 Xe3 Panther Lake iGPU
  (35.5 - 57.9, n=13)
50.2 fps +41%
Dell Pro 5 14 P514260
Intel Core Ultra X7 368H, Intel Arc B390 12 Xe3 Panther Lake iGPU
35.5 fps
Lenovo Yoga 9 14 2in1 G10
Intel Core Ultra 7 258V, Intel Arc Graphics 140V
35 fps -1%
Dell Pro 7 14 P714265
AMD Ryzen AI 9 HX PRO 470, AMD Radeon 890M
30.4 fps -14%
Samsung Galaxy Book5 Pro 14 940XHA
Intel Core Ultra 5 226V, Intel Arc Graphics 130V
30.3 fps -15%
Dell Pro 7 14 P714260
Intel Core Ultra 7 366H, Intel Graphics 4 Xe3 Panther Lake iGPU
27.4 fps -23%
Lenovo ThinkPad T14s Gen 7 21YW0022GE
AMD Ryzen AI 7 PRO 450, AMD Radeon 860M
26.8 fps -25%
HP EliteBook 8 G2a 14
AMD Ryzen AI 7 450, AMD Radeon 860M
26.1 fps -26%
Lenovo ThinkPad E14 G8-21Y2006XGE
AMD Ryzen AI 7 345, AMD Radeon 840M
13.7 fps -61%
X-Plane 11.11 - 1920x1080 high (fps_test=3)
HP ZBook Ultra G1a 14 B30FBES
AMD Ryzen AI Max PRO 380, AMD Radeon 8040S
45 fps +4%
HP EliteBook 8 G2a 14
AMD Ryzen AI 7 450, AMD Radeon 860M
43.9 fps +1%
Dell Pro 5 14 P514260
Intel Core Ultra X7 368H, Intel Arc B390 12 Xe3 Panther Lake iGPU
43.4 fps
HP OmniBook Ultra 14 Core Ultra X9
Intel Core Ultra X9 388H, Intel Arc B390 12 Xe3 Panther Lake iGPU
42.2 fps -3%
Lenovo ThinkPad T14s Gen 7 21YW0022GE
AMD Ryzen AI 7 PRO 450, AMD Radeon 860M
40.7 fps -6%
Média Intel Arc B390 12 Xe3 Panther Lake iGPU
  (37.2 - 44.5, n=15)
40.6 fps -6%
Dell Pro 7 14 P714265
AMD Ryzen AI 9 HX PRO 470, AMD Radeon 890M
40.2 fps -7%
Asus ExpertBook Ultra B9406CAA
Intel Core Ultra X7 358H, Intel Arc B390 12 Xe3 Panther Lake iGPU
39.7 fps -9%
Lenovo Yoga 9 14 2in1 G10
Intel Core Ultra 7 258V, Intel Arc Graphics 140V
35.4 fps -18%
Lenovo Yoga 9 14 2in1 G10
Intel Core Ultra 7 258V, Intel Arc Graphics 140V
35.3 fps -19%
Lenovo ThinkPad E14 G8-21Y2006XGE
AMD Ryzen AI 7 345, AMD Radeon 840M
31.7 fps -27%
Samsung Galaxy Book5 Pro 14 940XHA
Intel Core Ultra 5 226V, Intel Arc Graphics 130V
31.5 fps -27%
Dell Pro 7 14 P714260
Intel Core Ultra 7 366H, Intel Graphics 4 Xe3 Panther Lake iGPU
29.5 fps -32%
Strange Brigade
1920x1080 high AA:high AF:8
HP OmniBook Ultra 14 Core Ultra X9
Intel Core Ultra X9 388H, Intel Arc B390 12 Xe3 Panther Lake iGPU
114.9 (46min, 91.6P1) fps +10%
Asus ExpertBook Ultra B9406CAA
Intel Core Ultra X7 358H, Intel Arc B390 12 Xe3 Panther Lake iGPU
107.6 (64.5min, 89P1) fps +3%
Média Intel Arc B390 12 Xe3 Panther Lake iGPU
  (91.8 - 116.7, n=13)
104.9 fps 0%
Dell Pro 5 14 P514260
Intel Core Ultra X7 368H, Intel Arc B390 12 Xe3 Panther Lake iGPU
104.7 (39.2min, 78.9P1) fps
Lenovo Yoga 9 14 2in1 G10
Intel Core Ultra 7 258V, Intel Arc Graphics 140V
72.9 (54.1min, 58.6P1) fps -30%
Samsung Galaxy Book5 Pro 14 940XHA
Intel Core Ultra 5 226V, Intel Arc Graphics 130V
62.2 (22.8min, 46.8P1) fps -41%
Dell Pro 7 14 P714260
Intel Core Ultra 7 366H, Intel Graphics 4 Xe3 Panther Lake iGPU
61.9 (39.3min, 46.7P1) fps -41%
Dell Pro 7 14 P714265
AMD Ryzen AI 9 HX PRO 470, AMD Radeon 890M
60.8 (40.2min, 45.9P1) fps -42%
Lenovo ThinkPad T14s Gen 7 21YW0022GE
AMD Ryzen AI 7 PRO 450, AMD Radeon 860M
52 (35.9min, 40.8P1) fps -50%
HP EliteBook 8 G2a 14
AMD Ryzen AI 7 450, AMD Radeon 860M
50.5 (37.4min, 40.8P1) fps -52%
Lenovo ThinkPad E14 G8-21Y2006XGE
AMD Ryzen AI 7 345, AMD Radeon 840M
27.2 (17.5min, 20.5P1) fps -74%
1920x1080 ultra AA:ultra AF:16
HP OmniBook Ultra 14 Core Ultra X9
Intel Core Ultra X9 388H, Intel Arc B390 12 Xe3 Panther Lake iGPU
101.3 (43.7min, 74.5P1) fps +10%
Asus ExpertBook Ultra B9406CAA
Intel Core Ultra X7 358H, Intel Arc B390 12 Xe3 Panther Lake iGPU
99.5 (24.8min, 76.1P1) fps +9%
Média Intel Arc B390 12 Xe3 Panther Lake iGPU
  (80 - 101.4, n=13)
92.8 fps +1%
Dell Pro 5 14 P514260
Intel Core Ultra X7 368H, Intel Arc B390 12 Xe3 Panther Lake iGPU
91.7 (40min, 61.5P1) fps
Lenovo Yoga 9 14 2in1 G10
Intel Core Ultra 7 258V, Intel Arc Graphics 140V
60.4 (30.6min, 45.1P1) fps -34%
Dell Pro 7 14 P714260
Intel Core Ultra 7 366H, Intel Graphics 4 Xe3 Panther Lake iGPU
52.4 (34.3min, 38.9P1) fps -43%
Dell Pro 7 14 P714265
AMD Ryzen AI 9 HX PRO 470, AMD Radeon 890M
51.7 (33min, 38.9P1) fps -44%
Samsung Galaxy Book5 Pro 14 940XHA
Intel Core Ultra 5 226V, Intel Arc Graphics 130V
51.3 (21.7min, 28.6P1) fps -44%
Lenovo ThinkPad T14s Gen 7 21YW0022GE
AMD Ryzen AI 7 PRO 450, AMD Radeon 860M
44.4 (33min, 34.8P1) fps -52%
HP EliteBook 8 G2a 14
AMD Ryzen AI 7 450, AMD Radeon 860M
44.4 (29.6min, 35.2P1) fps -52%
Lenovo ThinkPad E14 G8-21Y2006XGE
AMD Ryzen AI 7 345, AMD Radeon 840M
23.2 (15.2min, 16.7P1) fps -75%
Baldur's Gate 3
1920x1080 High Preset AA:T
Asus ExpertBook Ultra B9406CAA
Intel Core Ultra X7 358H, Intel Arc B390 12 Xe3 Panther Lake iGPU
54.3 (45.6min, 47.8P0.1, 50P1) fps +10%
HP OmniBook Ultra 14 Core Ultra X9
Intel Core Ultra X9 388H, Intel Arc B390 12 Xe3 Panther Lake iGPU
54 (47.6min, 48.5P0.1, 49.7P1) fps +10%
Média Intel Arc B390 12 Xe3 Panther Lake iGPU
  (42.5 - 57.6, n=12)
49.6 fps +1%
Dell Pro 5 14 P514260
Intel Core Ultra X7 368H, Intel Arc B390 12 Xe3 Panther Lake iGPU
49.3 (43.8min, 44.3P0.1, 45.9P1) fps
HP ZBook Ultra G1a 14 B30FBES
AMD Ryzen AI Max PRO 380, AMD Radeon 8040S
34.1 (24min) fps -31%
Dell Pro 7 14 P714265
AMD Ryzen AI 9 HX PRO 470, AMD Radeon 890M
28 (19.9min, 20.6P0.1, 25.7P1) fps -43%
Lenovo Yoga 9 14 2in1 G10
Intel Core Ultra 7 258V, Intel Arc Graphics 140V
27.3 fps -45%
Dell Pro 7 14 P714260
Intel Core Ultra 7 366H, Intel Graphics 4 Xe3 Panther Lake iGPU
23.9 (21.6min, 21.8P0.1, 22.5P1) fps -52%
Samsung Galaxy Book5 Pro 14 940XHA
Intel Core Ultra 5 226V, Intel Arc Graphics 130V
23.1 fps -53%
Lenovo ThinkPad T14s Gen 7 21YW0022GE
AMD Ryzen AI 7 PRO 450, AMD Radeon 860M
18.2 (14.8min, 15P0.1, 16.7P1) fps -63%
HP EliteBook 8 G2a 14
AMD Ryzen AI 7 450, AMD Radeon 860M
18.1 (15.2min, 15.5P0.1, 16.6P1) fps -63%
Lenovo ThinkPad E14 G8-21Y2006XGE
AMD Ryzen AI 7 345, AMD Radeon 840M
10.6 (8.54min, 8.54P0.1, 9.94P1) fps -78%
1920x1080 Ultra Preset AA:T
HP OmniBook Ultra 14 Core Ultra X9
Intel Core Ultra X9 388H, Intel Arc B390 12 Xe3 Panther Lake iGPU
53.5 (48.4min, 49.1P0.1, 50.4P1) fps +10%
Asus ExpertBook Ultra B9406CAA
Intel Core Ultra X7 358H, Intel Arc B390 12 Xe3 Panther Lake iGPU
53.4 (45.4min, 46.4P0.1, 49.5P1) fps +10%
Dell Pro 5 14 P514260
Intel Core Ultra X7 368H, Intel Arc B390 12 Xe3 Panther Lake iGPU
48.5 (44.7min, 44.7P0.1, 45.6P1) fps
Média Intel Arc B390 12 Xe3 Panther Lake iGPU
  (39.4 - 54.3, n=15)
47.8 fps -1%
HP ZBook Ultra G1a 14 B30FBES
AMD Ryzen AI Max PRO 380, AMD Radeon 8040S
33.8 (17min) fps -30%
Dell Pro 7 14 P714265
AMD Ryzen AI 9 HX PRO 470, AMD Radeon 890M
27 (20.4min, 20.6P0.1, 24.1P1) fps -44%
Lenovo Yoga 9 14 2in1 G10
Intel Core Ultra 7 258V, Intel Arc Graphics 140V
25.9 fps -47%
Dell Pro 7 14 P714260
Intel Core Ultra 7 366H, Intel Graphics 4 Xe3 Panther Lake iGPU
23.5 (21min, 21.3P0.1, 21.8P1) fps -52%
Samsung Galaxy Book5 Pro 14 940XHA
Intel Core Ultra 5 226V, Intel Arc Graphics 130V
22.8 fps -53%
Lenovo ThinkPad T14s Gen 7 21YW0022GE
AMD Ryzen AI 7 PRO 450, AMD Radeon 860M
17.9 (14.8min, 15.2P0.1, 16.1P1) fps -63%
HP EliteBook 8 G2a 14
AMD Ryzen AI 7 450, AMD Radeon 860M
17.9 (15.2min, 15.3P0.1, 16.4P1) fps -63%
Lenovo ThinkPad E14 G8-21Y2006XGE
AMD Ryzen AI 7 345, AMD Radeon 840M
10.5 (8.53min, 8.54P0.1, 8.55P1) fps -78%
F1 24
1920x1080 Medium Preset AA:T AF:16x
Dell Pro 5 14 P514260
Intel Core Ultra X7 368H, Intel Arc B390 12 Xe3 Panther Lake iGPU
144.3 (122min, 101P1) fps
Asus ExpertBook Ultra B9406CAA
Intel Core Ultra X7 358H, Intel Arc B390 12 Xe3 Panther Lake iGPU
135 (117min, 95P1) fps -6%
Média Intel Arc B390 12 Xe3 Panther Lake iGPU
  (107.3 - 147.7, n=11)
132.3 fps -8%
HP OmniBook Ultra 14 Core Ultra X9
Intel Core Ultra X9 388H, Intel Arc B390 12 Xe3 Panther Lake iGPU
131.9 (95min, 84P1) fps -9%
Lenovo Yoga 9 14 2in1 G10
Intel Core Ultra 7 258V, Intel Arc Graphics 140V
85.4 (70min, 65P1) fps -41%
Dell Pro 7 14 P714265
AMD Ryzen AI 9 HX PRO 470, AMD Radeon 890M
73.5 (62min, 55P1) fps -49%
Dell Pro 7 14 P714260
Intel Core Ultra 7 366H, Intel Graphics 4 Xe3 Panther Lake iGPU
67.6 (58min, 53P1) fps -53%
HP EliteBook 8 G2a 14
AMD Ryzen AI 7 450, AMD Radeon 860M
61.8 (47min, 43P1) fps -57%
Samsung Galaxy Book5 Pro 14 940XHA
Intel Core Ultra 5 226V, Intel Arc Graphics 130V
61.7 (48min, 49P1) fps -57%
Lenovo ThinkPad T14s Gen 7 21YW0022GE
AMD Ryzen AI 7 PRO 450, AMD Radeon 860M
61.7 (52min, 44P1) fps -57%
Lenovo ThinkPad E14 G8-21Y2006XGE
AMD Ryzen AI 7 345, AMD Radeon 840M
32.6 (25min, 24P1) fps -77%
1920x1080 High Preset AA:T AF:16x
Dell Pro 5 14 P514260
Intel Core Ultra X7 368H, Intel Arc B390 12 Xe3 Panther Lake iGPU
107.3 (93min, 75P1) fps
Asus ExpertBook Ultra B9406CAA
Intel Core Ultra X7 358H, Intel Arc B390 12 Xe3 Panther Lake iGPU
104.3 (91min, 76P1) fps -3%
HP OmniBook Ultra 14 Core Ultra X9
Intel Core Ultra X9 388H, Intel Arc B390 12 Xe3 Panther Lake iGPU
101.4 (80min, 70P1) fps -5%
Média Intel Arc B390 12 Xe3 Panther Lake iGPU
  (82.9 - 109.6, n=12)
101 fps -6%
Lenovo Yoga 9 14 2in1 G10
Intel Core Ultra 7 258V, Intel Arc Graphics 140V
66.4 (56min, 54P1) fps -38%
Dell Pro 7 14 P714265
AMD Ryzen AI 9 HX PRO 470, AMD Radeon 890M
56 (46min, 39P1) fps -48%
Dell Pro 7 14 P714260
Intel Core Ultra 7 366H, Intel Graphics 4 Xe3 Panther Lake iGPU
50.3 (42min, 40P1) fps -53%
Samsung Galaxy Book5 Pro 14 940XHA
Intel Core Ultra 5 226V, Intel Arc Graphics 130V
49.1 (38min, 39P1) fps -54%
Lenovo ThinkPad T14s Gen 7 21YW0022GE
AMD Ryzen AI 7 PRO 450, AMD Radeon 860M
45.8 (37min, 33P1) fps -57%
HP EliteBook 8 G2a 14
AMD Ryzen AI 7 450, AMD Radeon 860M
42.8 (35min, 35P1) fps -60%
Lenovo ThinkPad E14 G8-21Y2006XGE
AMD Ryzen AI 7 345, AMD Radeon 840M
22.6 (1min, 18P1) fps -79%
1920x1080 Ultra High Preset AA:T AF:16x
Asus ExpertBook Ultra B9406CAA
Intel Core Ultra X7 358H, Intel Arc B390 12 Xe3 Panther Lake iGPU
38 (31min, 30P1) fps +14%
Média Intel Arc B390 12 Xe3 Panther Lake iGPU
  (30.5 - 38.6, n=12)
35.8 fps +8%
HP OmniBook Ultra 14 Core Ultra X9
Intel Core Ultra X9 388H, Intel Arc B390 12 Xe3 Panther Lake iGPU
35.6 (25min, 26P1) fps +7%
Dell Pro 5 14 P514260
Intel Core Ultra X7 368H, Intel Arc B390 12 Xe3 Panther Lake iGPU
33.2 (25min, 26P1) fps
Lenovo Yoga 9 14 2in1 G10
Intel Core Ultra 7 258V, Intel Arc Graphics 140V
21.2 (15min, 15P1) fps -36%
Samsung Galaxy Book5 Pro 14 940XHA
Intel Core Ultra 5 226V, Intel Arc Graphics 130V
16.1 (12min, 13P1) fps -52%
Dell Pro 7 14 P714265
AMD Ryzen AI 9 HX PRO 470, AMD Radeon 890M
15 (9min, 8P1) fps -55%
Dell Pro 7 14 P714260
Intel Core Ultra 7 366H, Intel Graphics 4 Xe3 Panther Lake iGPU
14.3 (12min, 10P1) fps -57%
Lenovo ThinkPad T14s Gen 7 21YW0022GE
AMD Ryzen AI 7 PRO 450, AMD Radeon 860M
10.8 (8min, 8P1) fps -67%
HP EliteBook 8 G2a 14
AMD Ryzen AI 7 450, AMD Radeon 860M
10.6 (8min, 8P1) fps -68%

Gráfico de FPS do Cyberpunk 2077 em ultra

051015202530354045Tooltip
Dell Pro 5 14 P514260 Ultra X7 368H, Arc B390 Panther Lake iGPU: Ø41.4 (30.8-47.7) fps
Asus ExpertBook Ultra B9406CAA Ultra X7 358H, Arc B390 Panther Lake iGPU: Ø46.3 (40.9-47.4) fps
baixomédiaaltoultra
GTA V (2015) 180.6 174.4 94.7 41.4
Dota 2 Reborn (2015) 139.5 76.5 94.6 94.3
Final Fantasy XV Benchmark (2018) 83.6 48.9 35.5
X-Plane 11.11 (2018) 63.8 50.2 43.4
Strange Brigade (2018) 333 128.6 104.7 91.7
Baldur's Gate 3 (2023) 65.8 56.2 49.3 48.5
Cyberpunk 2077 (2023) 85.9 68.9 58.3 51
F1 24 (2024) 157.2 144.3 107.3 33.2

Emissões

Ruído do sistema

Perfil de ruído do ventilador (Branco: Fundo, Vermelho: Sistema em repouso, Azul: 3DMark 11, Laranja: Cyberpunk 2077, Verde: Teste de estresse com Prime95)

Barulho

Ocioso
23.9 / 23.9 / 28.9 dB
Carga
33.5 / 46 dB
  red to green bar
 
 
30 dB
silencioso
40 dB(A)
audível
50 dB(A)
ruidosamente alto
 
min: dark, med: mid, max: light   Earthworks M23R, Arta (15 cm de distância)   ruído ambiente: 23.6 dB(A)
dB(A) 0102030405060708090Deep BassMiddle BassHigh BassLower RangeMidsHigher MidsLower HighsMid HighsUpper HighsSuper Highs2039.23836.233.530.92524.324.822.421.323.93120.221.619.920.620.74032.519.824.219.919.35027.328.926.523.632.76322.124.423.420.825.68023.523.519.418.221.910020.619.917.116.721.11252117.316.315.72116023.91714.512.924.220025.418.614.514.72625027.318.614.614.328.831530.320.617.41830.440030.319.715.415.331.250030.119.712.613.630.263031.320.313.112.831.880034.322.411.311.534100034.122.910.310.134125033.522.69.99.533.5160033.222.29.79.633.4200034.923.110.29.935.2250036.623.210.410.936.4315036.322.91111.336.340003623.411.111.435.8500035.216.911.81235.5630030.21411.612.830.2800027.514.311.612.327.31000023.413.111.712.422.81250019.213.111.612.418.31600015.411.610.710.813.9SPL4633.523.623.946N5.21.70.50.55.3median 30.3median 19.7median 11.6median 12.4median 30.4Delta5.33.61.71.75hearing rangehide median Fan NoiseDell Pro 5 14 P514260
Dell Pro 5 14 P514260
Ultra X7 368H, Arc B390 Panther Lake iGPU
Dell Pro 7 14 P714260
Ultra 7 366H, Intel Graphics 4 Xe3 PTL
Lenovo ThinkPad T14s Gen 7 21YW0022GE
Ryzen AI 7 PRO 450, Radeon 860M
HP OmniBook Ultra 14 Core Ultra X9
Ultra X9 388H, Arc B390 Panther Lake iGPU
Samsung Galaxy Book5 Pro 14 940XHA
Core Ultra 5 226V, Arc 130V
Asus ExpertBook Ultra B9406CAA
Ultra X7 358H, Arc B390 Panther Lake iGPU
Noise
3%
2%
1%
8%
7%
desligado / ambiente * (dB)
23.6
23.3
1%
24.8
-5%
23.3
1%
25.1
-6%
22.9
3%
Idle Minimum * (dB)
23.9
23.8
-0%
24.8
-4%
23.3
3%
25.1
-5%
23.4
2%
Idle Average * (dB)
23.9
23.8
-0%
24.8
-4%
23.3
3%
25.1
-5%
23.4
2%
Idle Maximum * (dB)
28.9
23.8
18%
24.8
14%
23.3
19%
25.1
13%
23.4
19%
Load Average * (dB)
33.5
31.9
5%
36.7
-10%
42.9
-28%
29.3
13%
28.6
15%
Cyberpunk 2077 ultra * (dB)
46
46.1
-0%
41.6
10%
44.4
3%
33.1
28%
42.8
7%
Load Maximum * (dB)
46
46.3
-1%
41.6
10%
44.1
4%
38.7
16%
45.2
2%

* ... menor é melhor

Temperatura

Escape traseiro
Escape traseiro
Um adaptador CA de tamanho médio (~11,2 x 5 x 2,7 cm) e 65 W atinge mais de 38 °C ao operar com cargas exigentes
Carga Máxima
41.2 °C42.4 °C40.4 °C
41.8 °C42.8 °C35 °C
33.2 °C30.4 °C27.4 °C
Máximo: 42.8 °C
Médio: 37.2 °C
32.4 °C40 °C43.6 °C
29.8 °C41.2 °C42.6 °C
29.6 °C33.2 °C34.6 °C
Máximo: 43.6 °C
Médio: 36.3 °C
alimentação elétrica  38.6 °C | Temperatura do quarto 20 °C | Fluke 62 Mini IR Thermometer
(±) A temperatura média para o lado superior sob carga máxima é 37.2 °C / 99 F, em comparação com a média de 29.5 °C / ###class_avg_f# ## F para os dispositivos da classe Office.
(±) A temperatura máxima no lado superior é 42.8 °C / 109 F, em comparação com a média de 34.4 °C / 94 F , variando de 21.2 a 62.5 °C para a classe Office.
(±) A parte inferior aquece até um máximo de 43.6 °C / 110 F, em comparação com a média de 36.8 °C / 98 F
(+) Em uso inativo, a temperatura média para o lado superior é 25.2 °C / 77 F, em comparação com a média do dispositivo de 29.5 °C / ### class_avg_f### F.
(+) Os apoios para as mãos e o touchpad estão atingindo a temperatura máxima da pele (33.2 °C / 91.8 F) e, portanto, não estão quentes.
(-) A temperatura média da área do apoio para as mãos de dispositivos semelhantes foi 27.6 °C / 81.7 F (-5.6 °C / -10.1 F).
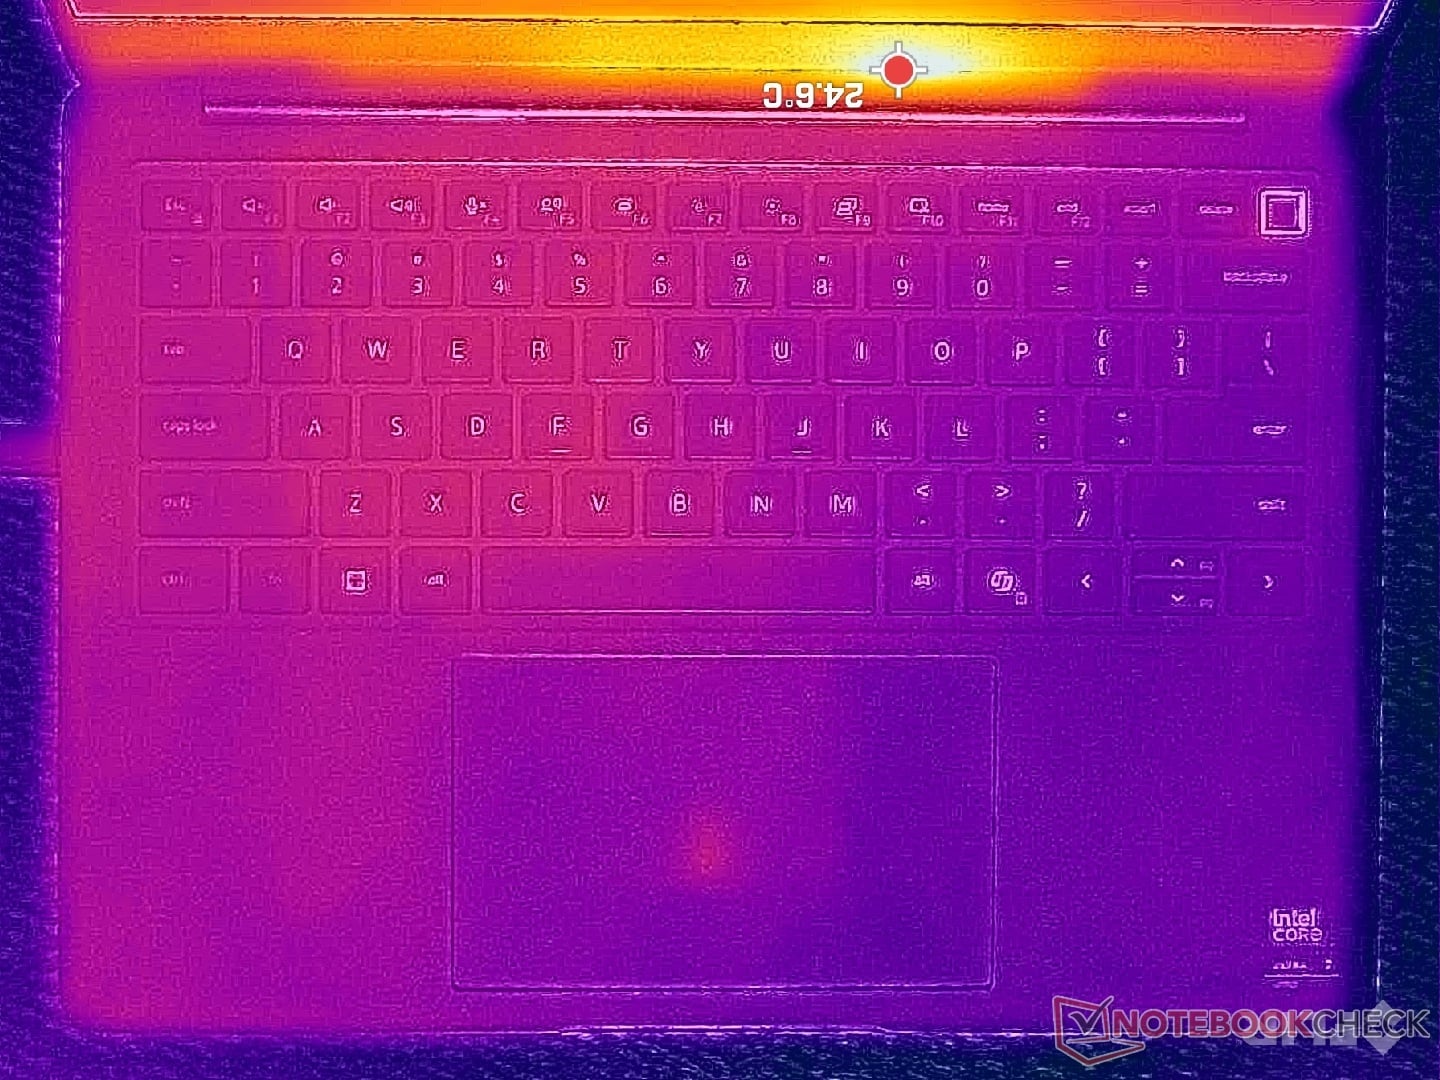
Sistema ocioso (Capa C)
Sistema inativo (capa D)
Teste de estresse com Prime95+FurMark (nível C)
Teste de estresse com Prime95+FurMark (cobertura D)
Dell Pro 5 14 P514260
Ultra X7 368H, Arc B390 Panther Lake iGPU
Dell Pro 7 14 P714260
Ultra 7 366H, Intel Graphics 4 Xe3 PTL
Lenovo ThinkPad T14s Gen 7 21YW0022GE
Ryzen AI 7 PRO 450, Radeon 860M
HP OmniBook Ultra 14 Core Ultra X9
Ultra X9 388H, Arc B390 Panther Lake iGPU
Samsung Galaxy Book5 Pro 14 940XHA
Core Ultra 5 226V, Arc 130V
Asus ExpertBook Ultra B9406CAA
Ultra X7 358H, Arc B390 Panther Lake iGPU
Heat
-4%
1%
7%
1%
7%
Maximum Upper Side * (°C)
42.8
43.4
-1%
42.3
1%
40.2
6%
41.4
3%
38.6
10%
Maximum Bottom * (°C)
43.6
44.6
-2%
43.8
-0%
44.2
-1%
44.6
-2%
38.4
12%
Idle Upper Side * (°C)
25.8
27.2
-5%
25.2
2%
22.8
12%
24.9
3%
24.6
5%
Idle Bottom * (°C)
25.8
27.6
-7%
25.5
1%
23.4
9%
25.5
1%
26
-1%

* ... menor é melhor

Teste de estresse

A CPU atingia 3,1 GHz e 66 W até chegar a 96 °C alguns instantes depois. O desempenho então caía para 2,4 GHz e 40 W, a fim de manter uma temperatura do núcleo mais controlável, de 81 °C.
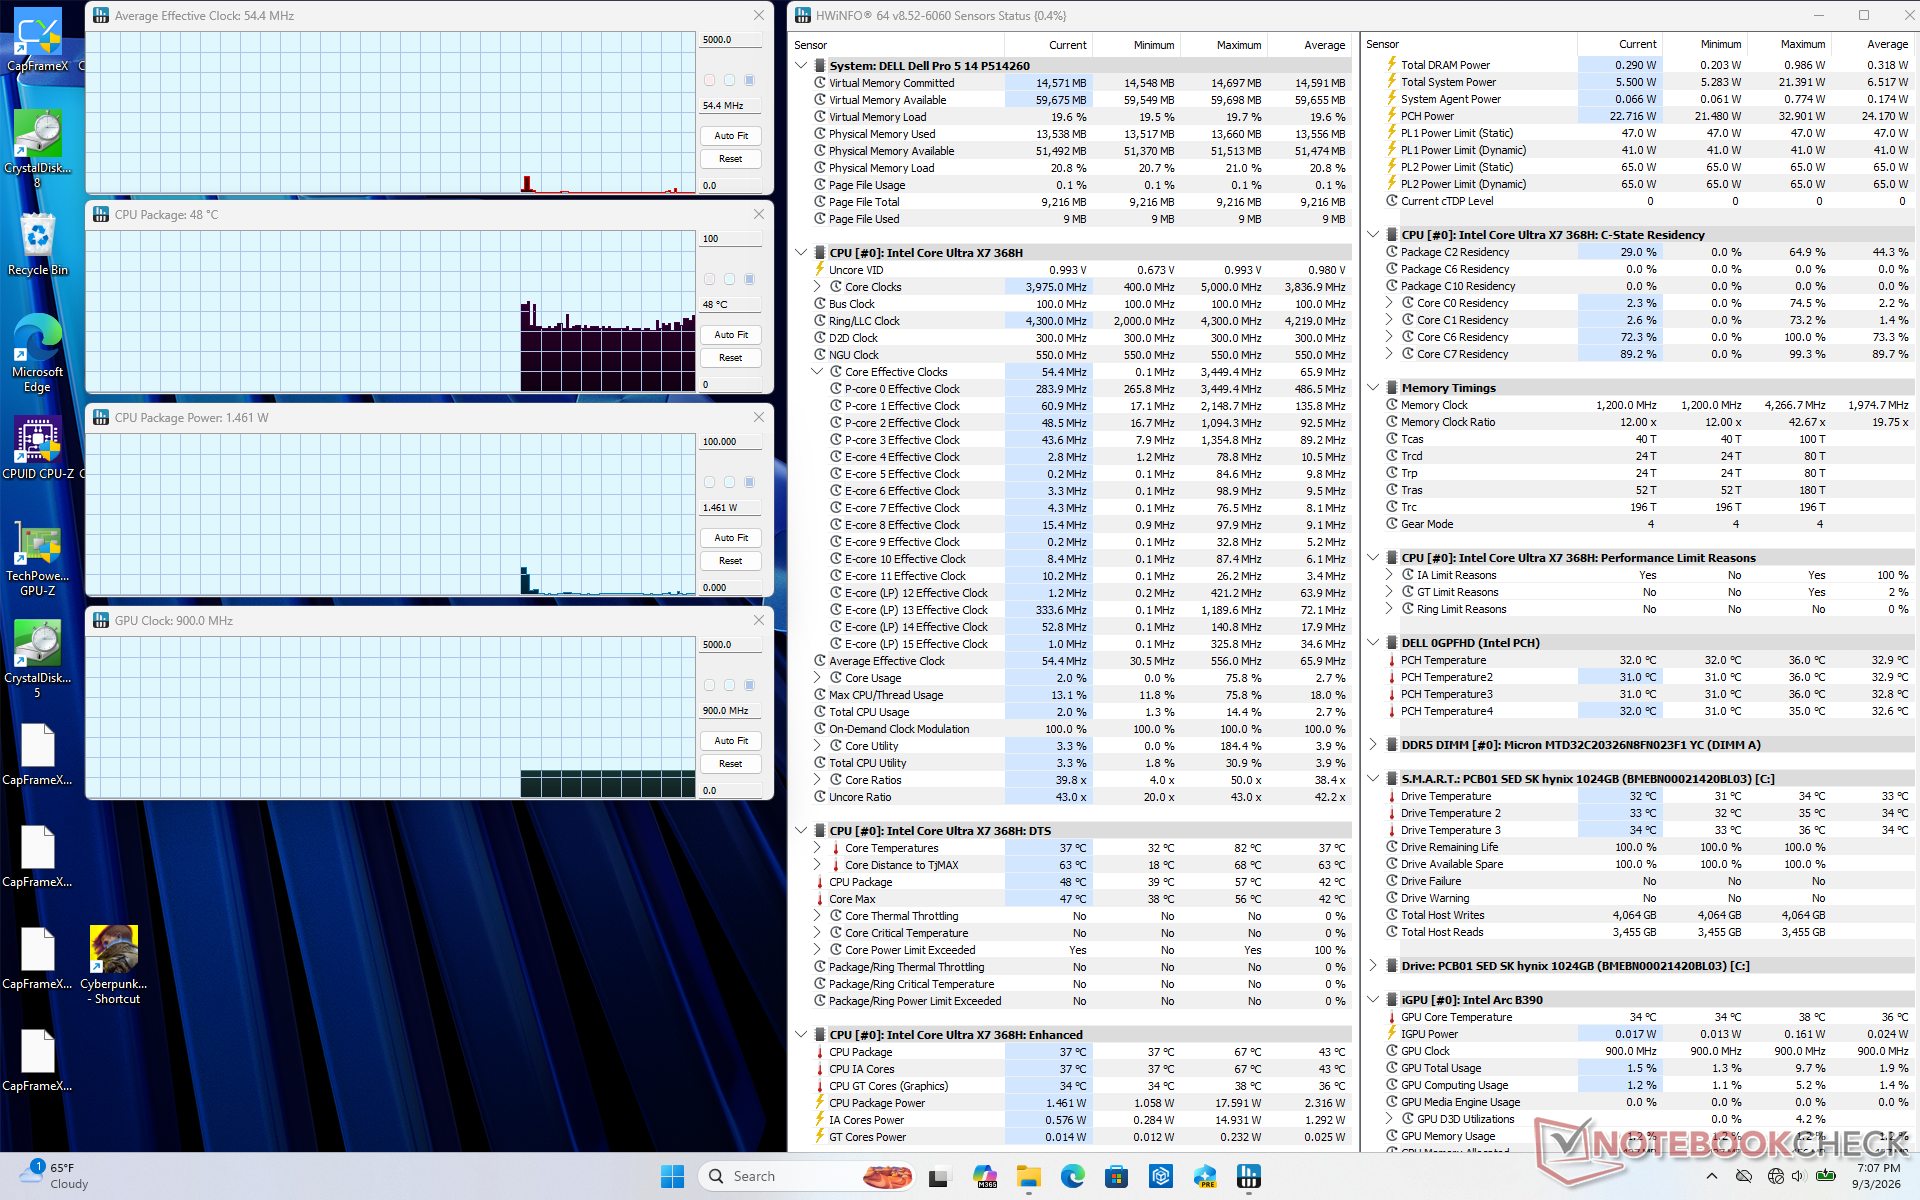
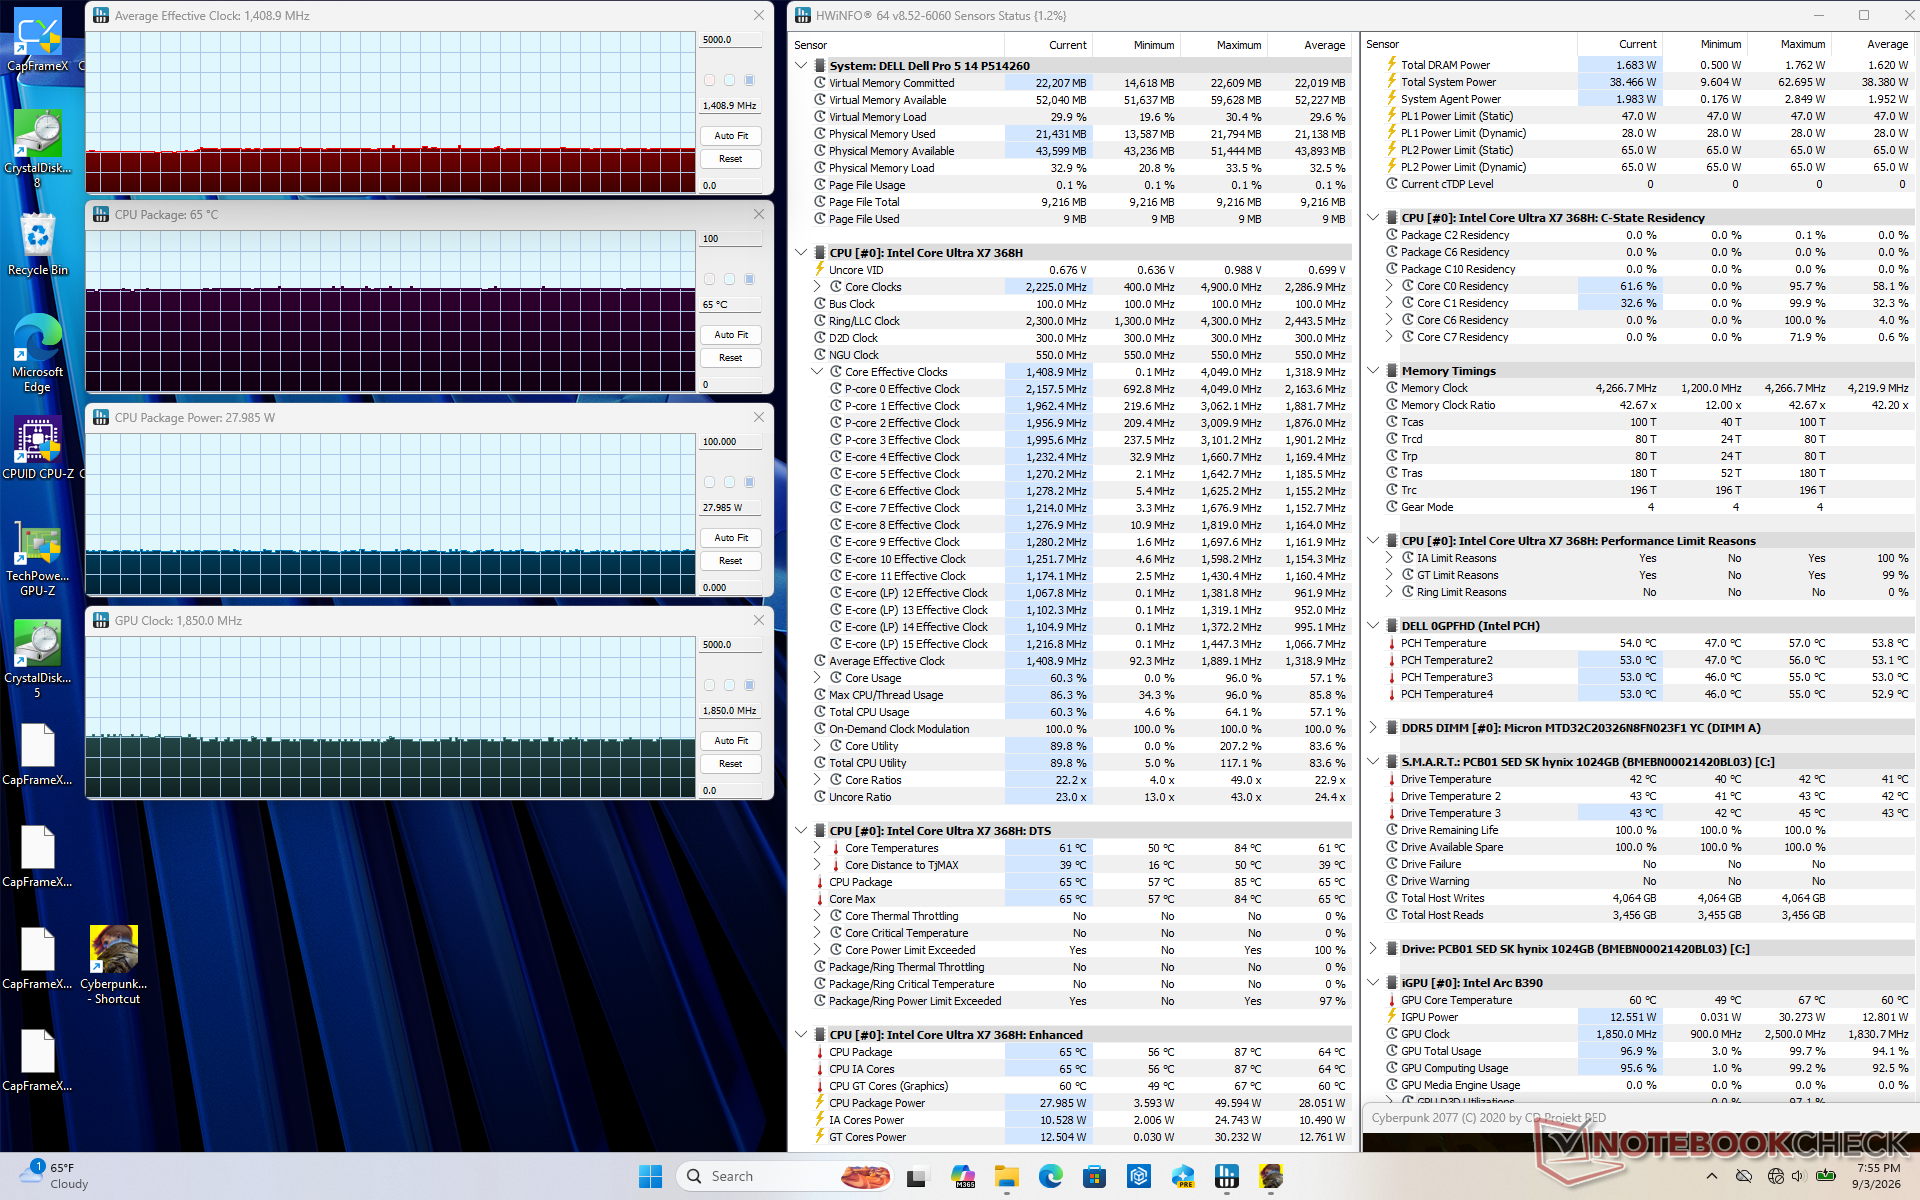
Sistema ocioso
Sistema ocioso
O estresse em Cyberpunk 2077
Teste de estresse com o Prime95
Teste de estresse com Prime95 e FurMark
Frequência média do clock da CPU (GHz) Frequência da GPU (MHz) Temperatura média da CPU (°C)
Sistema ocioso -- -- 47
Prime95 Stress 2.4 -- 85
Prime95 + FurMark Stress 1.5 1450 65
Cyberpunk 2077: Estresse 1.4 1850 65

Palestrantes

O ruído rosa demonstra que os alto-falantes são potentes e que a reprodução de graves é satisfatória para o tamanho do aparelho
dB(A) 0102030405060708090Deep BassMiddle BassHigh BassLower RangeMidsHigher MidsLower HighsMid HighsUpper HighsSuper Highs2033.532.22521.326.53120.623.44019.923.75023.631.96320.827.78018.241.910016.749.712515.755.616012.962.220014.762.925014.363.83151869.940015.372.550013.671.263012.877.880011.579.7100010.177.912509.579.416009.680.520009.976.6250010.977315011.376400011.476.550001278.8630012.877800012.371.71000012.466.21250012.466.41600010.869SPL23.989.3N0.584.3median 12.4median 76Delta1.75.826.325.821.422.12624.925.127.622.532.523.448.72655.818.860.922.167.2267019.372.317.674.217.774.319.575.31571.711.871.311.27410.574.21072.710.17210.67210.97511.374.811.671.71269.71269.612.371.112.669.61270.111.269.824.784.70.666.6median 12median 71.73.42.2hearing rangehide median Pink NoiseDell Pro 5 14 P514260Apple MacBook Pro 16 2021 M1 Pro
Diagrama de frequência (as caixas de seleção podem ser marcadas e desmarcadas para comparar dispositivos)
Dell Pro 5 14 P514260 análise de áudio

(+) | os alto-falantes podem tocar relativamente alto (###valor### dB)
Graves 100 - 315Hz
(-) | quase nenhum baixo - em média 15.4% menor que a mediana
(±) | a linearidade dos graves é média (7.4% delta para a frequência anterior)
Médios 400 - 2.000 Hz
(+) | médios equilibrados - apenas 3% longe da mediana
(+) | médios são lineares (4% delta para frequência anterior)
Altos 2 - 16 kHz
(+) | agudos equilibrados - apenas 2.7% longe da mediana
(+) | os máximos são lineares (3.7% delta da frequência anterior)
Geral 100 - 16.000 Hz
(+) | o som geral é linear (10.9% diferença em relação à mediana)
Comparado com a mesma classe
» 2% de todos os dispositivos testados nesta classe foram melhores, 2% semelhantes, 96% piores
» O melhor teve um delta de 7%, a média foi 21%, o pior foi 53%
Comparado com todos os dispositivos testados
» 6% de todos os dispositivos testados foram melhores, 2% semelhantes, 92% piores
» O melhor teve um delta de 4%, a média foi 23%, o pior foi 136%

Apple MacBook Pro 16 2021 M1 Pro análise de áudio

(+) | os alto-falantes podem tocar relativamente alto (###valor### dB)
Graves 100 - 315Hz
(+) | bons graves - apenas 3.8% longe da mediana
(+) | o baixo é linear (5.2% delta para a frequência anterior)
Médios 400 - 2.000 Hz
(+) | médios equilibrados - apenas 1.3% longe da mediana
(+) | médios são lineares (2.1% delta para frequência anterior)
Altos 2 - 16 kHz
(+) | agudos equilibrados - apenas 1.9% longe da mediana
(+) | os máximos são lineares (2.7% delta da frequência anterior)
Geral 100 - 16.000 Hz
(+) | o som geral é linear (4.6% diferença em relação à mediana)
Comparado com a mesma classe
» 0% de todos os dispositivos testados nesta classe foram melhores, 0% semelhantes, 100% piores
» O melhor teve um delta de 5%, a média foi 17%, o pior foi 45%
Comparado com todos os dispositivos testados
» 0% de todos os dispositivos testados foram melhores, 0% semelhantes, 100% piores
» O melhor teve um delta de 4%, a média foi 23%, o pior foi 136%

Gestão de Energia

Consumo de energia
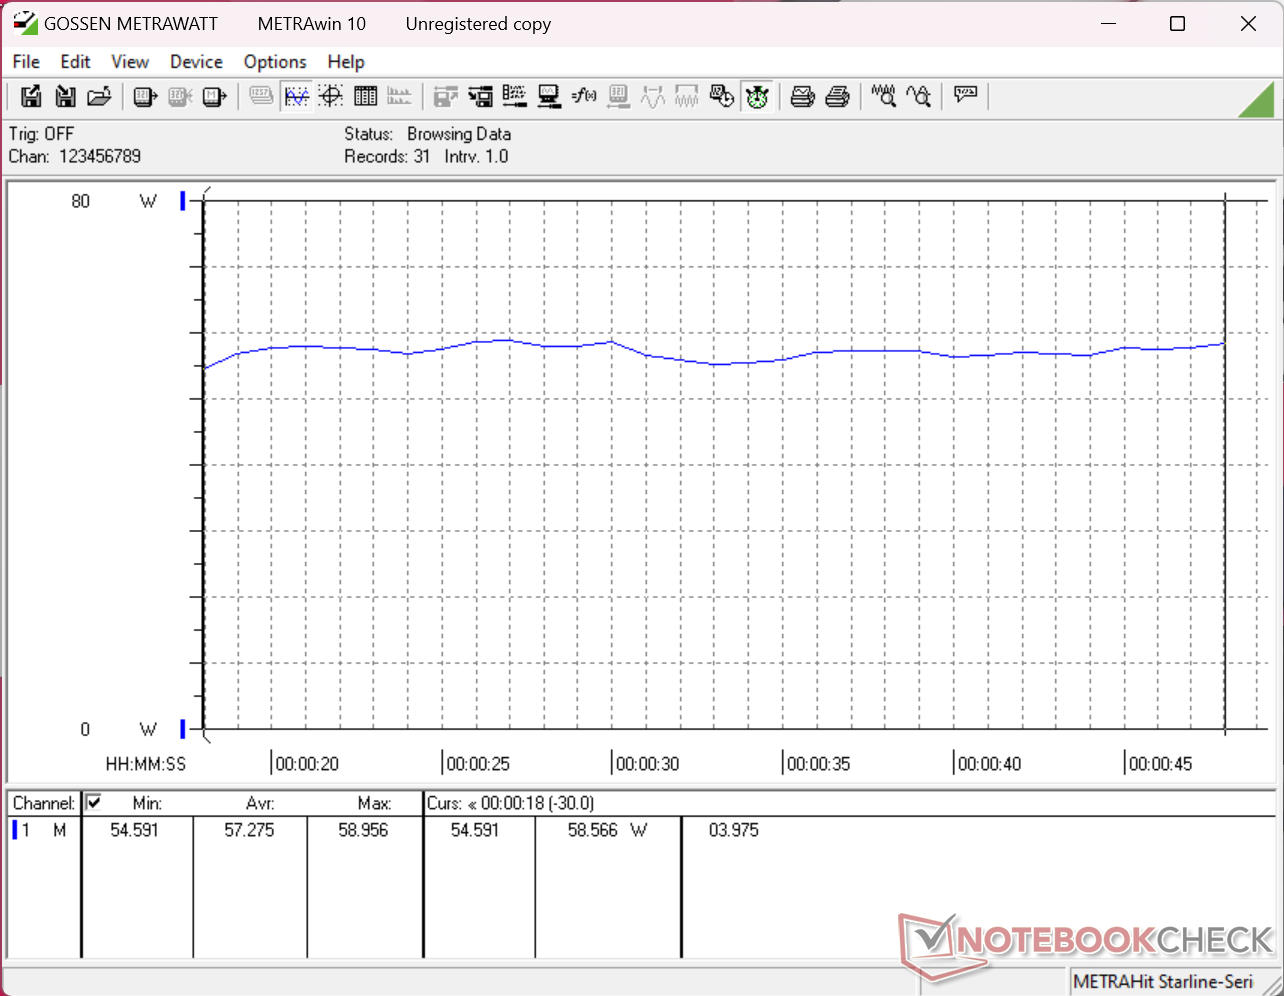
Consumo do 3DMark 11
Consumo de recursos do Cyberpunk 2077 em 1080p Ultra
O consumo atingiria um pico de 70 W ao iniciar o teste de estresse do Prime95, antes de cair para 64 W cerca de 20 segundos depois, o que sugere um Turbo Boost limitado
O teste de estresse com o Prime95+FurMark foi iniciado aos 10 segundos
Consumo de energia
desligadodarklight 0.15 / 0.67 Watt
Ociosodarkmidlight 1.5 / 4.5 / 4.7 Watt
Carga midlight 57.3 / 70.2 Watt
 color bar
Key: min: dark, med: mid, max: light        Metrahit Energy
Dell Pro 5 14 P514260
Ultra X7 368H, Arc B390 Panther Lake iGPU, SK hynix PCB01 HFS001TFM9X186N, IPS, 1920x1200, 14"
Dell Pro 7 14 P714260
Ultra 7 366H, Intel Graphics 4 Xe3 PTL, SK hynix PCB01 HFS001TFM9X186N, IPS, 1920x1200, 14"
Lenovo ThinkPad T14s Gen 7 21YW0022GE
Ryzen AI 7 PRO 450, Radeon 860M, Micron 2650 MTFDKBA512TGW, IPS, 1920x1200, 14"
HP OmniBook Ultra 14 Core Ultra X9
Ultra X9 388H, Arc B390 Panther Lake iGPU, , OLED, 2880x1800, 14"
Samsung Galaxy Book5 Pro 14 940XHA
Core Ultra 5 226V, Arc 130V, Samsung PM9C1 MZVL8512HELU, OLED, 2880x1800, 14"
Asus ExpertBook Ultra B9406CAA
Ultra X7 358H, Arc B390 Panther Lake iGPU, Samsung PM9E1 MZVLC2T0HBLD, OLED, 2880x1800, 14"
Power Consumption
10%
-18%
-15%
-13%
-20%
Idle Minimum * (Watt)
1.5
1.4
7%
2.7
-80%
2.5
-67%
3.7
-147%
3.5
-133%
Idle Average * (Watt)
4.5
4.3
4%
5.5
-22%
5.1
-13%
5.2
-16%
4
11%
Idle Maximum * (Watt)
4.7
4.6
2%
6.8
-45%
5.8
-23%
5.4
-15%
5.3
-13%
Load Average * (Watt)
57.3
32.5
43%
60.5
-6%
49.8
13%
26.2
54%
43.7
24%
Cyberpunk 2077 ultra * (Watt)
53.2
49.9
6%
49.7
7%
55
-3%
47.4
11%
61.3
-15%
Cyberpunk 2077 ultra external monitor * (Watt)
48.7
47.4
3%
44.1
9%
55.1
-13%
42.7
12%
61.4
-26%
Load Maximum * (Watt)
70.2
69
2%
64.8
8%
68
3%
63.5
10%
63.4
10%

* ... menor é melhor

Consumo de energia no Cyberpunk / Teste de estresse

0510152025303540455055606570Tooltip
Dell Pro 5 14 P514260 Ultra X7 368H, Arc B390 Panther Lake iGPU; 1280x720 Prime95 28.10 and Furmark 1.25: Ø49.6 (44.7-70.2) Watt
Dell Pro 7 14 P714260 Ultra 7 366H, Intel Graphics 4 Xe3 PTL; 1280x720 Prime95 28.10 and Furmark 1.25: Ø52.5 (50.3-69) Watt
Dell Pro 5 14 P514260 Ultra X7 368H, Arc B390 Panther Lake iGPU; Idle 150cd/m2: Ø2.17 (1.933-3.01) Watt
Dell Pro 7 14 P714260 Ultra 7 366H, Intel Graphics 4 Xe3 PTL; Idle 150cd/m2: Ø1.949 (1.68-4.52) Watt
Dell Pro 5 14 P514260 Ultra X7 368H, Arc B390 Panther Lake iGPU; Cyberpunk 2077 FHD ultra no FSR 150cd: Ø53.2 (47.3-65.5) Watt
Dell Pro 7 14 P714260 Ultra 7 366H, Intel Graphics 4 Xe3 PTL; Cyberpunk 2077 FHD ultra no FSR 150cd: Ø49.9 (48.6-52.7) Watt

Consumo de energia do monitor externo

0510152025303540455055606570Tooltip
Dell Pro 5 14 P514260 Ultra X7 368H, Arc B390 Panther Lake iGPU; Prime95 V2810 Stress (external Monitor): Ø64.7 (61.9-70.2) Watt
Dell Pro 7 14 P714260 Ultra 7 366H, Intel Graphics 4 Xe3 PTL; Prime95 V2810 Stress (external Monitor): Ø33.8 (31-69) Watt
Dell Pro 5 14 P514260 Ultra X7 368H, Arc B390 Panther Lake iGPU; Cinebench R23 Multi (external Monitor): Ø48.3 (39.3-70.2) Watt
Dell Pro 7 14 P714260 Ultra 7 366H, Intel Graphics 4 Xe3 PTL; Cinebench R23 Multi (external Monitor): Ø56.5 (44.4-69.1) Watt
Dell Pro 5 14 P514260 Ultra X7 368H, Arc B390 Panther Lake iGPU; 1280x720 FurMark 1.19 GPU Stress Test (external Monitor): Ø63 (60-66.6) Watt
Dell Pro 7 14 P714260 Ultra 7 366H, Intel Graphics 4 Xe3 PTL; 1280x720 FurMark 1.19 GPU Stress Test (external Monitor): Ø42.8 (32.9-50.9) Watt
Dell Pro 5 14 P514260 Ultra X7 368H, Arc B390 Panther Lake iGPU; Idle 1min (external Monitor): Ø1.659 (1.338-4.76) Watt
Dell Pro 7 14 P714260 Ultra 7 366H, Intel Graphics 4 Xe3 PTL; Idle 1min (external Monitor): Ø1.442 (1.161-3.25) Watt
Dell Pro 5 14 P514260 Ultra X7 368H, Arc B390 Panther Lake iGPU; Cyberpunk 2077 FHD ultra no FSR (external Monitor): Ø48.7 (45.1-52.7) Watt
Dell Pro 7 14 P714260 Ultra 7 366H, Intel Graphics 4 Xe3 PTL; Cyberpunk 2077 FHD ultra no FSR (external Monitor): Ø47.4 (44.6-52.5) Watt

Duração da bateria

Tempo de Execução da Bateria
WiFi Websurfing
21h 17min
Dell Pro 5 14 P514260
Ultra X7 368H, Arc B390 Panther Lake iGPU, 70 Wh
Dell Pro 7 14 P714260
Ultra 7 366H, Intel Graphics 4 Xe3 PTL, 70 Wh
Lenovo ThinkPad T14s Gen 7 21YW0022GE
Ryzen AI 7 PRO 450, Radeon 860M, 58 Wh
HP OmniBook Ultra 14 Core Ultra X9
Ultra X9 388H, Arc B390 Panther Lake iGPU, 70 Wh
Samsung Galaxy Book5 Pro 14 940XHA
Core Ultra 5 226V, Arc 130V, 63 Wh
Asus ExpertBook Ultra B9406CAA
Ultra X7 358H, Arc B390 Panther Lake iGPU, 70 Wh
Duração da bateria
WiFi v1.3 (h)
21.3
23.5
10%
17.4
-18%
12.6
-41%
10.1
-53%
16.1
-24%

Avaliação do Notebookcheck

O Dell Pro 5 14 tem a aparência e a sensação do Dell Pro 7 14, que é mais caro, mas por um preço mais baixo.

Dell Pro 5 14 P514260 - 09/09/2026 v8
Allen Ngo

Acabamento
86 / 98 → 88%
Teclado
80%
Mouse
75%
Conectividade
73 / 80 → 91%
Peso
69 / 20-75 → 90%
Bateria
92%
Pantalha
82%
Desempenho do jogos
61 / 75 → 82%
Desempenho da aplicação
87 / 92 → 95%
AI Performance
91%
Temperatura
90%
Ruído
79%
Áudio
81%
Câmera
40 / 75 → 53%
Médio
69%
84%
Office - Médio equilibrado
CO2 Emissions
No Data
Materials
50%
Packaging
100%
Power Use
90%
Repairability
50%
Software Updates
22.3%
Recycle Logo Total Sustainability Score: 52.1%

Comparativo com possíveis concorrentes

Imagem
Modelo / Análises
Preço
Peso
Altura
Tela
1.
84%
Dell Pro 5 14 P514260
Intel Core Ultra X7 368H ⎘
Intel Arc B390 12 Xe3 Panther Lake iGPU ⎘
64 GB Memória,  SSD
Preço de tabela: 4000 USD1.5 kg18.1 mm14.00"
1920x1200
162 PPI
IPS
2.
84.5%
Dell Pro 7 14 P714260
Intel Core Ultra 7 366H ⎘
Intel Graphics 4 Xe3 Panther Lake iGPU ⎘
64 GB Memória,  SSD
Preço de tabela: 4900 USD1.4 kg14.73 mm14.00"
1920x1200
162 PPI
IPS
3.
89.7%
Lenovo ThinkPad T14s Gen 7 21YW0022GE
AMD Ryzen AI 7 PRO 450 ⎘
AMD Radeon 860M ⎘
64 GB Memória, 512 GB SSD
Amazon:
1. $1,749.00
Lenovo ThinkPad T14s Gen 6 2...
2. $489.60
Lenovo ThinkPad T14s | 14" F...
3. $1,095.00
Lenovo ThinkPad E14 Gen 7 14...
1.2 kg15.9 mm14.00"
1920x1200
162 PPI
IPS
4.
87.9%
HP OmniBook Ultra 14 Core Ultra X9
Intel Core Ultra X9 388H ⎘
Intel Arc B390 12 Xe3 Panther Lake iGPU ⎘
32 GB Memória
Preço de tabela: 2800 USD1.3 kg10.7 mm14.00"
2880x1800
243 PPI
OLED
5.
86.9%
Samsung Galaxy Book5 Pro 14 940XHA
Intel Core Ultra 5 226V ⎘
Intel Arc Graphics 130V ⎘
16 GB Memória, 512 GB SSD
Preço de tabela: 1699€1.2 kg11.6 mm14.00"
2880x1800
243 PPI
OLED
6.
87.6%
Asus ExpertBook Ultra B9406CAA
Intel Core Ultra X7 358H ⎘
Intel Arc B390 12 Xe3 Panther Lake iGPU ⎘
32 GB Memória, 2048 GB SSD
1.1 kg15.9 mm14.00"
2880x1800
243 PPI
OLED

Transparência

A seleção dos dispositivos a serem analisados ​​é feita pela nossa equipe editorial. A amostra de teste foi fornecida ao autor como empréstimo pelo fabricante ou varejista para fins desta revisão. O credor não teve influência nesta revisão, nem o fabricante recebeu uma cópia desta revisão antes da publicação. Não houve obrigação de publicar esta revisão. Como empresa de mídia independente, a Notebookcheck não está sujeita à autoridade de fabricantes, varejistas ou editores.

É assim que o Notebookcheck está testando

Todos os anos, o Notebookcheck analisa de forma independente centenas de laptops e smartphones usando procedimentos padronizados para garantir que todos os resultados sejam comparáveis. Desenvolvemos continuamente nossos métodos de teste há cerca de 20 anos e definimos padrões da indústria no processo. Em nossos laboratórios de teste, equipamentos de medição de alta qualidade são utilizados por técnicos e editores experientes. Esses testes envolvem um processo de validação em vários estágios. Nosso complexo sistema de classificação é baseado em centenas de medições e benchmarks bem fundamentados, o que mantém a objetividade.
Google LogoAdd as a preferred source on Google
Mail Logo
> Análises e revisões de portáteis e celulares > Análises > Análises > Análise do Dell Pro 5 14: um modelo de gama média com surpreendentemente poucas concessões
Allen Ngo, 2026-09-10 (Update: 2026-09-10)