Verdict - Recentemente otimizado para escritórios e varejo
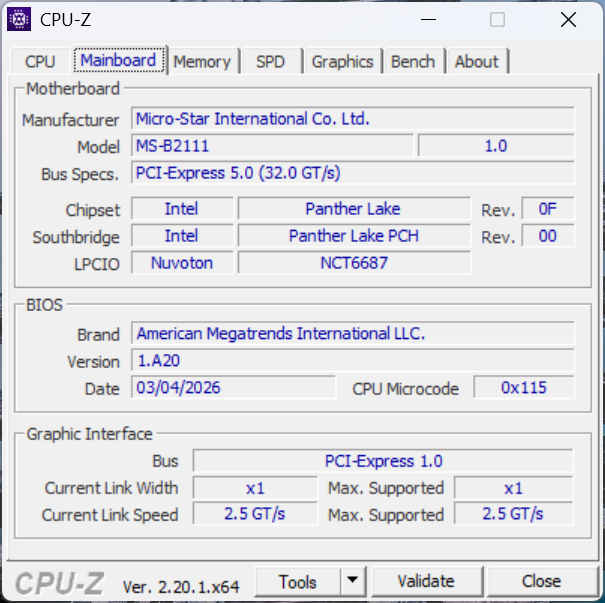
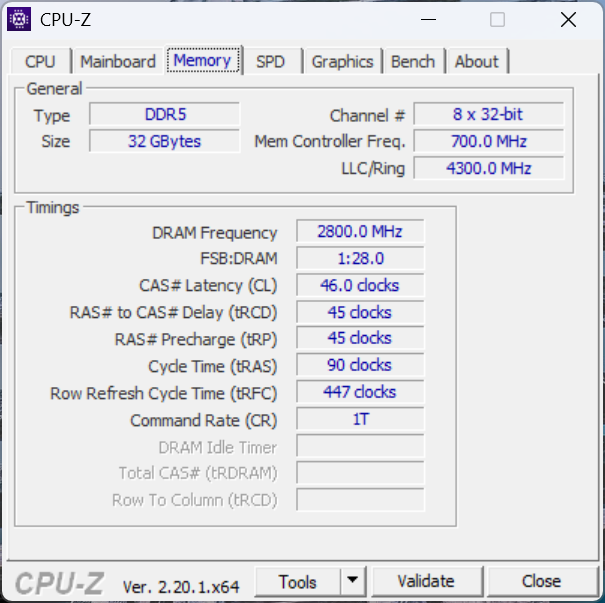
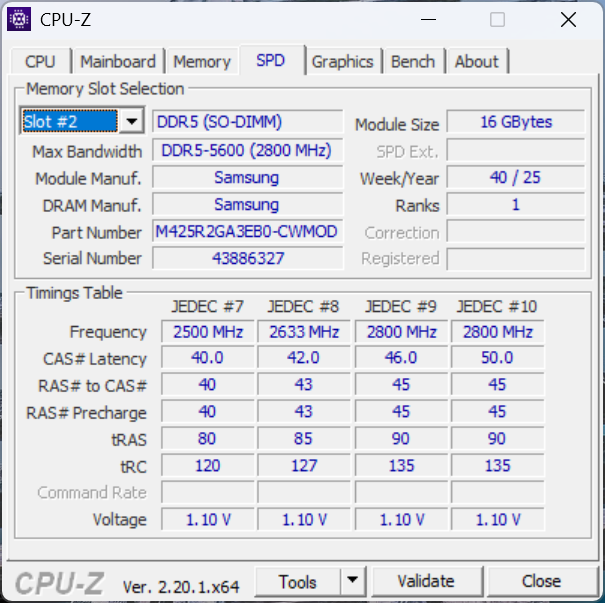
Pode não parecer à primeira vista, mas o Cubi NUC AI+ 3MG é um avanço significativo em relação ao Cubi NUC AI+ 2MG do ano passado. Há muitas mudanças por baixo do capô, incluindo uma placa-mãe revisada com RAM removível, um procedimento de manutenção ainda mais fácil, portas mais úteis e um design muito menor e discreto para se integrar melhor a ambientes mais profissionais. Na verdade, esse é um dos menores minicomputadores Intel com suporte para até 128 GB de memória removível. O aumento significativo no desempenho da CPU também aborda uma das principais preocupações sobre o modelo Lunar Lake mais antigo.
Por outro lado, o tamanho menor implica em alguns compromissos. O leitor de MicroSD do modelo do ano passado não existe mais e não há alto-falante integrado, o que teria tornado o sistema mais versátil. As temperaturas do núcleo são geralmente mais quentes e o ruído da ventoinha não é necessariamente melhor ou pior do que antes. A fonte de alimentação relativamente grande, que é quase tão pesada quanto o próprio mini PC, pode ser difícil de guardar, dependendo do ambiente. E, por fim, embora a alta capacidade de RAM seja um recurso de destaque, outros aspectos ficaram em segundo plano, inclusive o armazenamento local e o desempenho da GPU, já que modelos concorrentes como o GMK EVO-X1 ou o Asus NUC 15 Pro+ são máquinas mais rápidas e com mais opções de armazenamento.
Pro
Contra
Preço e disponibilidade
A Newegg está enviando atualmente o MSI Cubi NUC AI+ 3MG barebone com CPU Core Ultra 9 por US$ 830. Se configurado com 32 GB de RAM, o preço sobe para US$ 1.220.
O Cubi NUC AI+ 3MG sucede o Cubi NUC AI+ 2MG do ano passado Cubi NUC AI+ 2MG do ano passado do ano passado, trocando a CPU Intel Lunar Lake pelas opções mais recentes da Panther Lake. O design externo também foi alterado para ser visivelmente menor e mais leve do que antes.
Nossa unidade de teste é uma configuração de ponta com a CPU Core Ultra 9 386H por aproximadamente US$ 1100 se configurada com RAM e armazenamento. Felizmente, as opções barebones estão disponíveis a preços iniciais mais baixos. Também estão disponíveis SKUs com Core Ultra 5 e Core Ultra 7 de nível básico.
O Cubi NUC AI+ 3MG concorre com outros minicomputadores voltados para a empresa e para o varejo/escritório, como a Série GMK EVO, Asus NUC 15 Pro+ou o HP EliteBoard G1a AI.
Mais análises da MSI:
Especificações
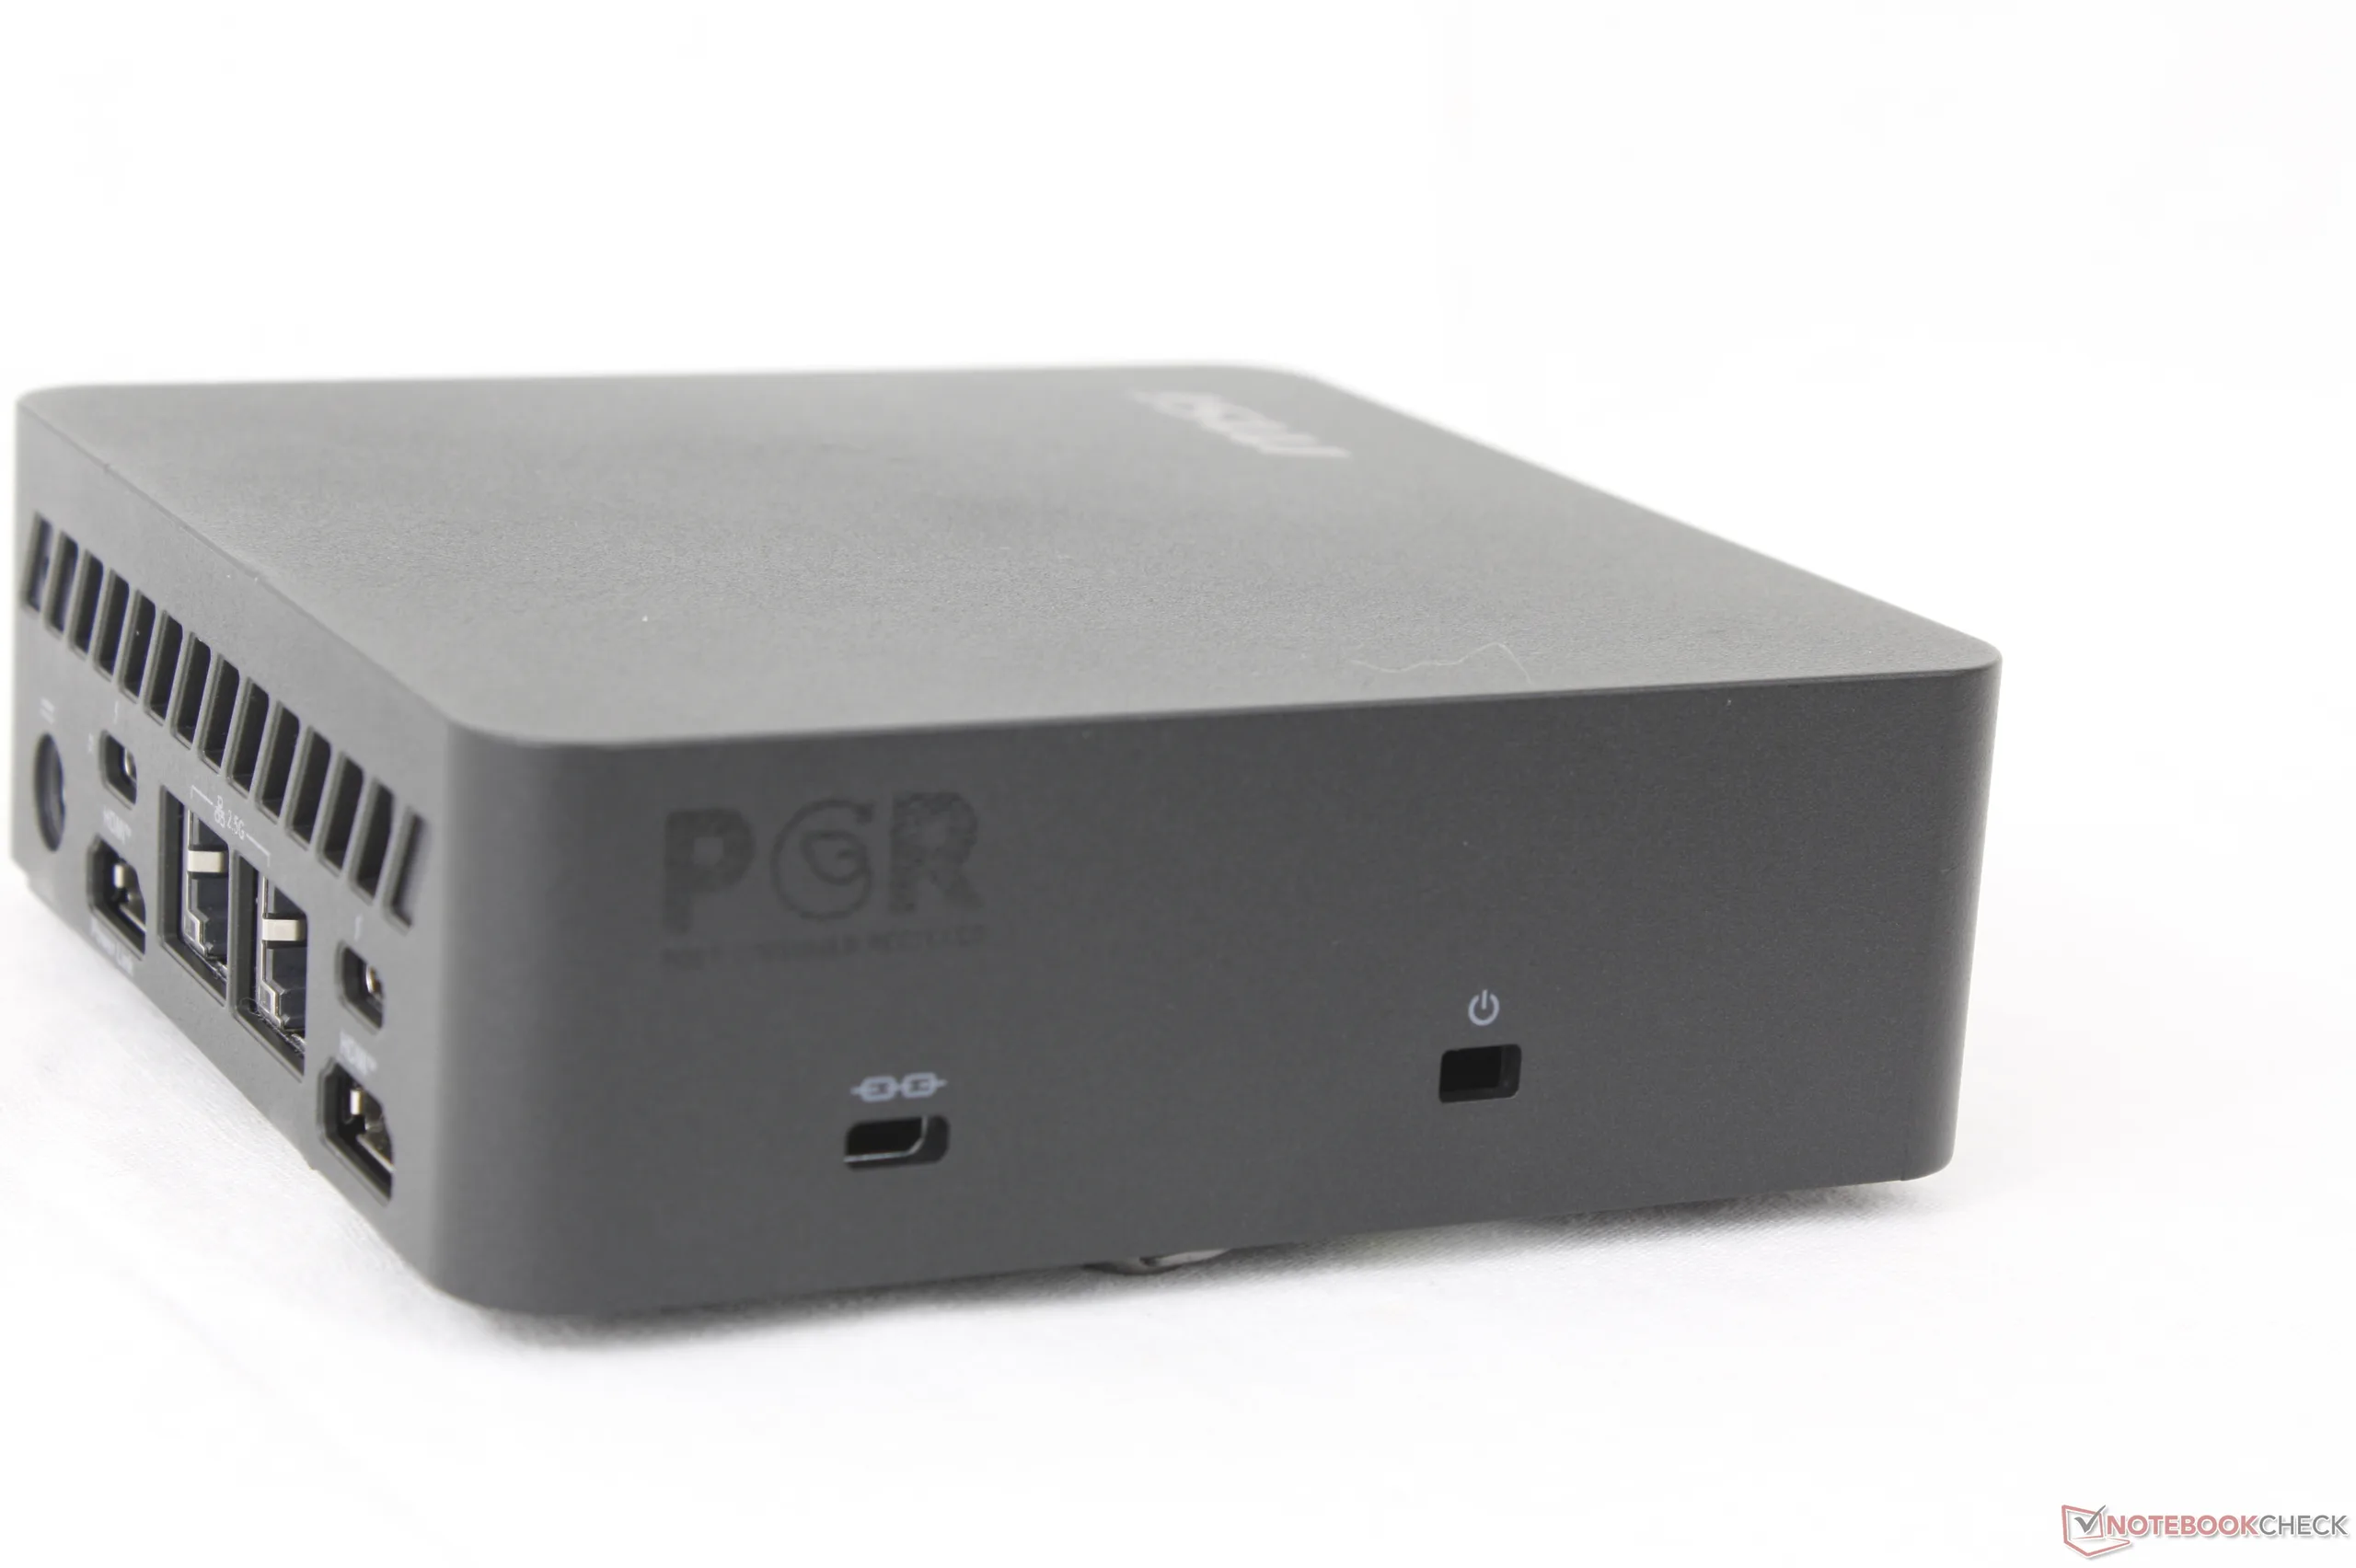
Caso
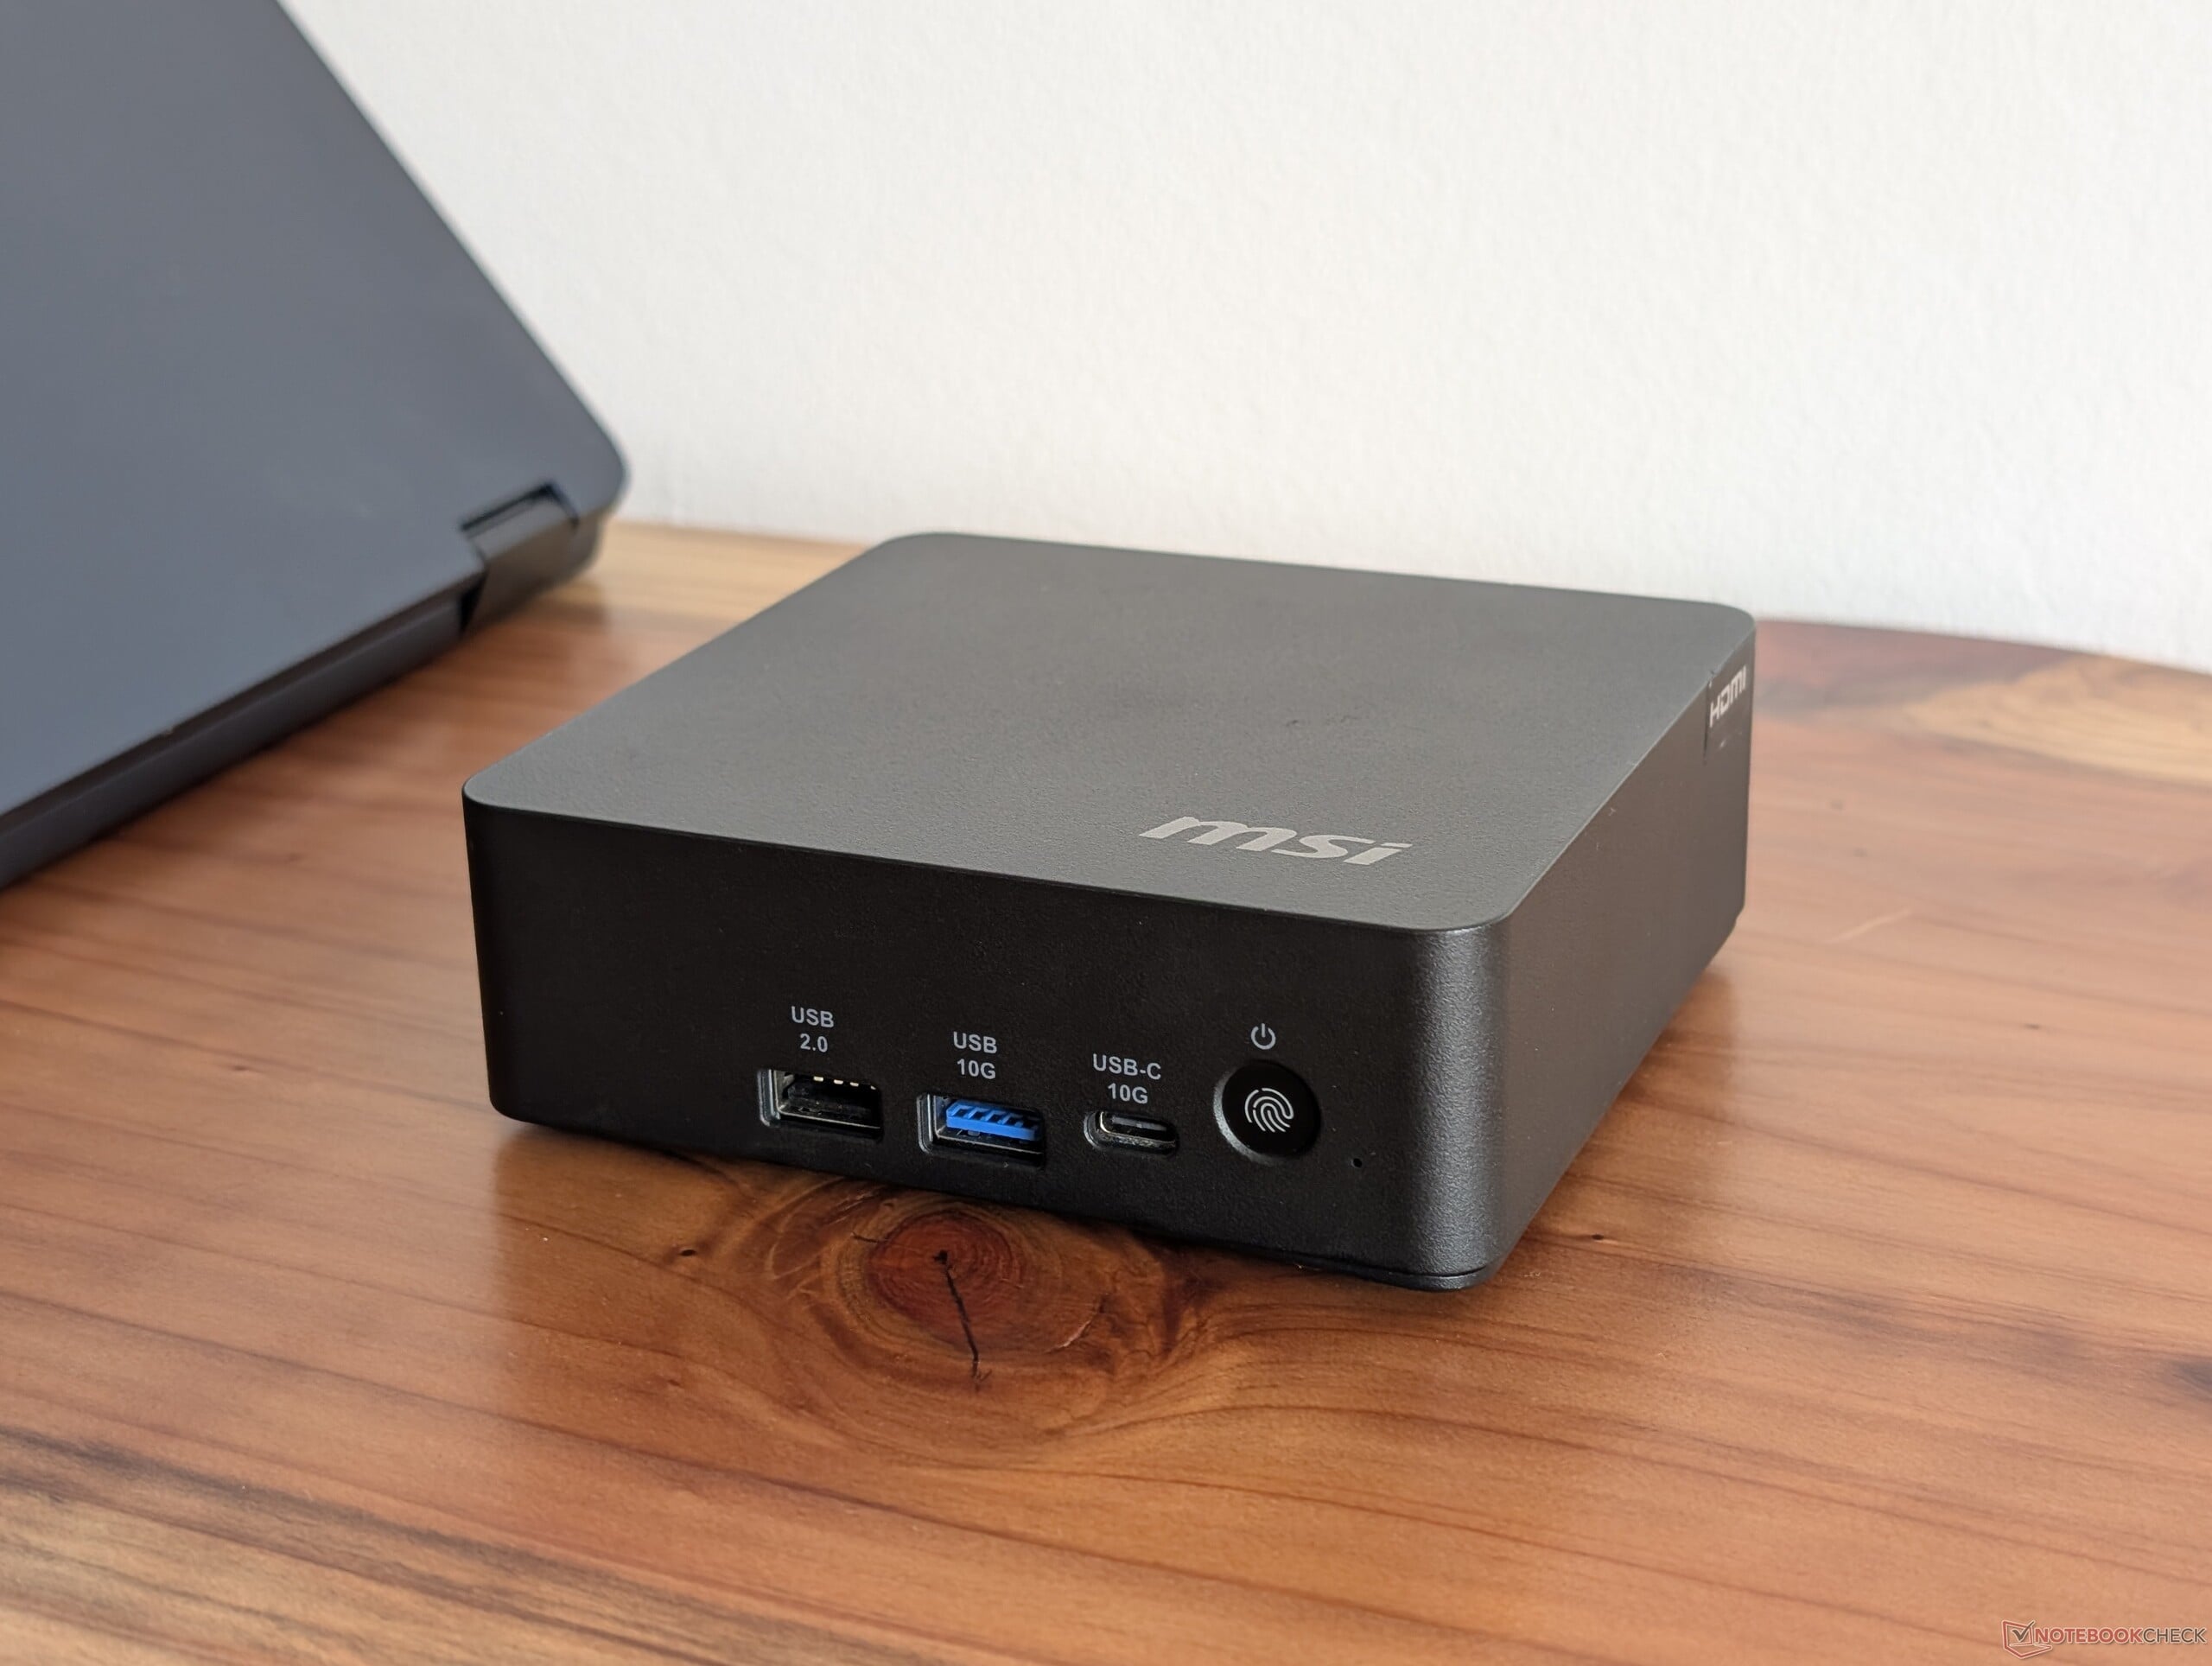
O chassi utiliza os mesmos materiais plásticos pretos para impressões semelhantes às anteriores, embora em um volume 17% mais leve e 43% menor. O que talvez seja mais impressionante é o fato de o design menor não incluir mais grades de ventilação nem grandes revisões externas.
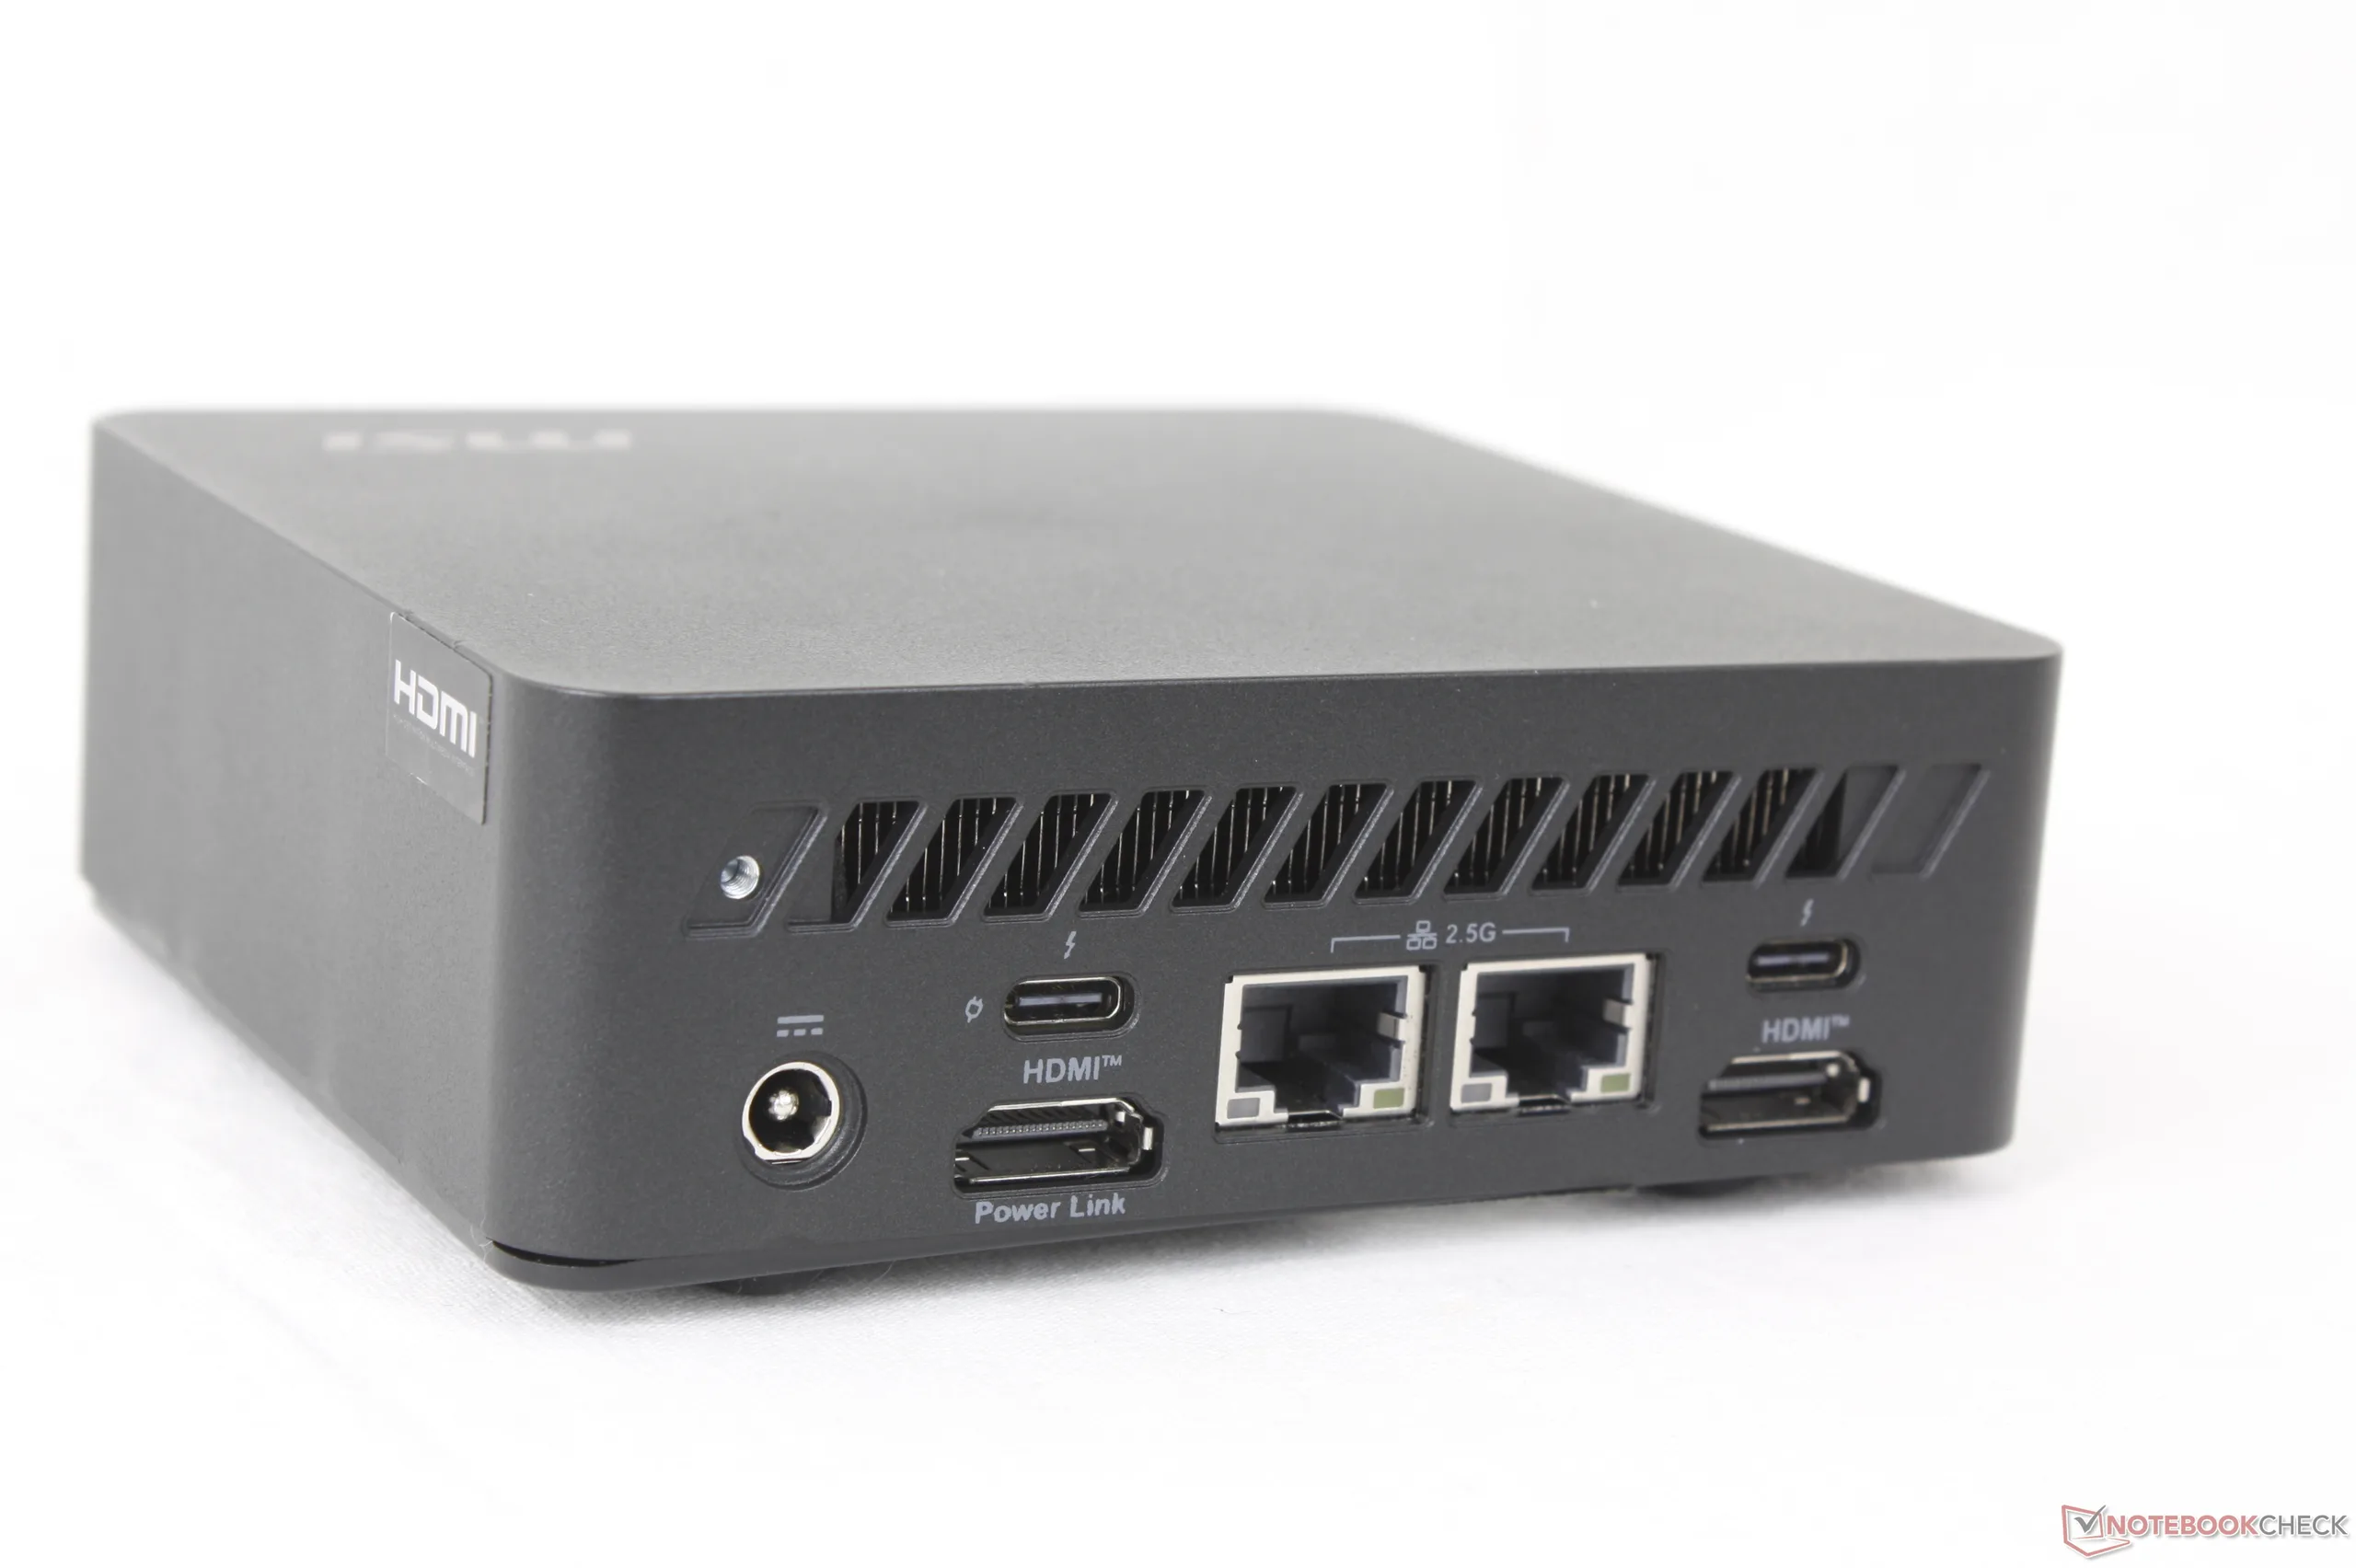
Conectividade
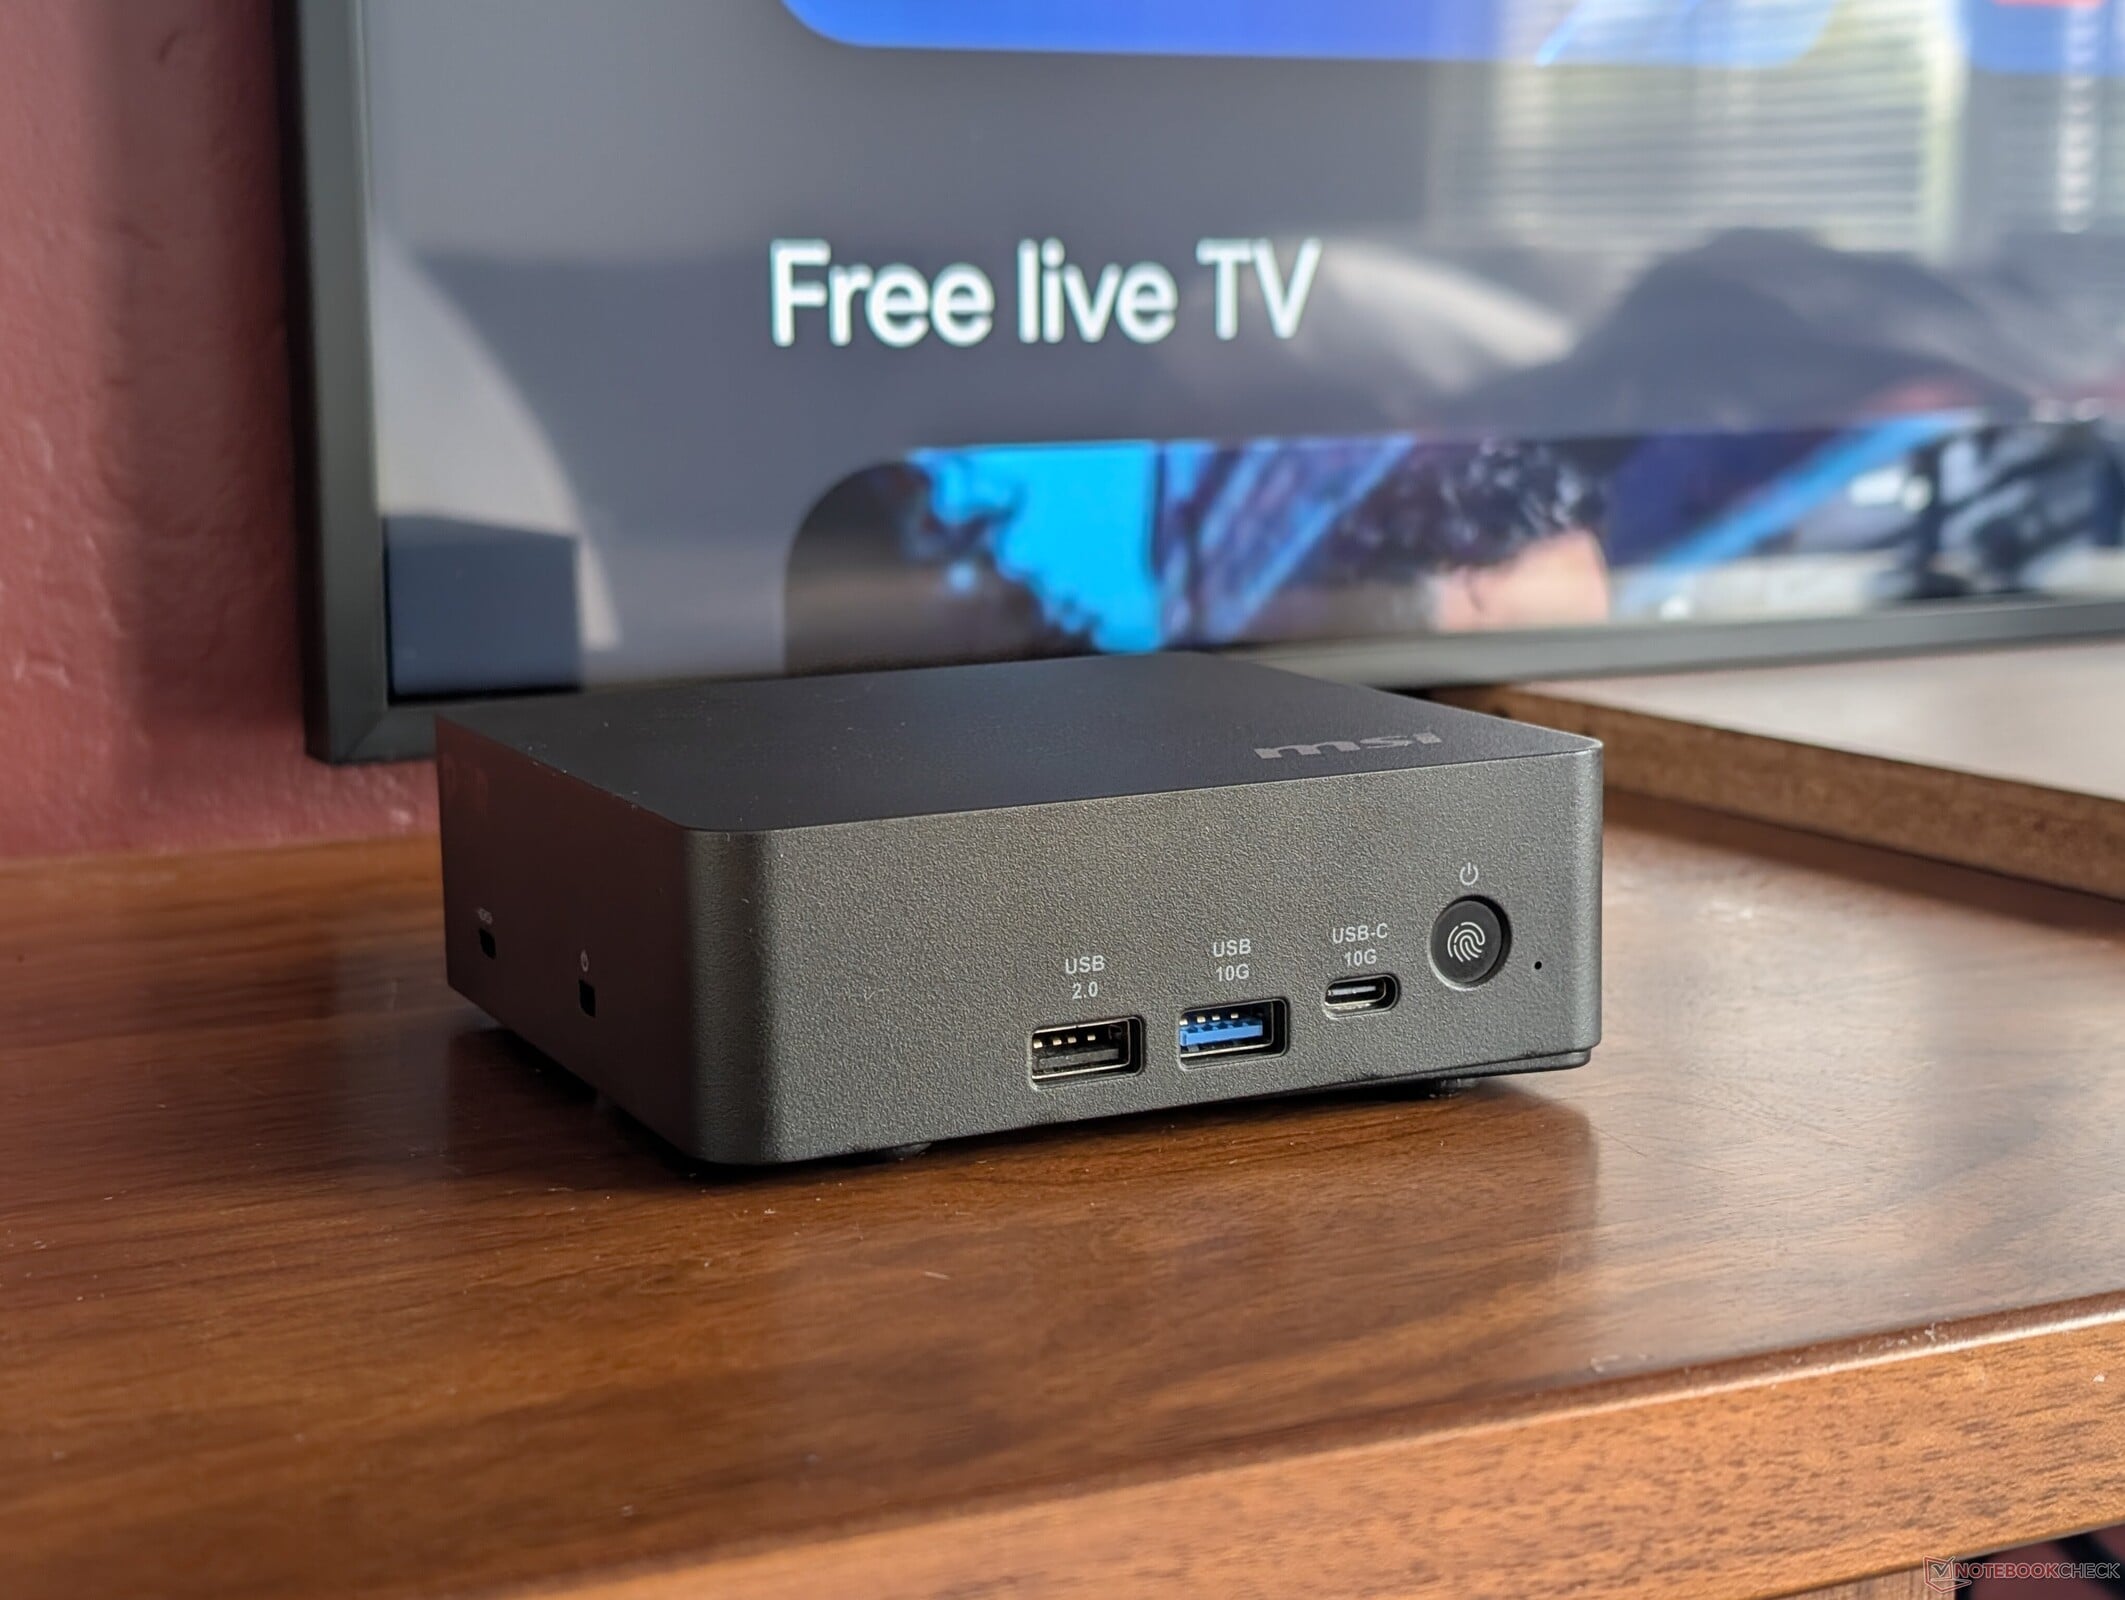
O recurso de conectividade mais notável do Cubi 3MG é o pino do interruptor de alimentação externo na lateral da unidade. A porta permite que um botão de energia com cabo ligue ou desligue facilmente o sistema caso o minicomputador seja colocado em um local de difícil acesso, como embaixo de uma mesa de escritório ou atrás de uma mesa ou monitor.
As opções de portas foram significativamente revisadas em comparação com o modelo do ano passado. Agora há menos portas USB-A e não há mais leitor de cartão SD ou conector de áudio em favor de mais portas HDMI e USB-C.
Lembre-se de que apenas uma das duas portas Thunderbolt 4 é compatível com o Power Delivery. Essa porta pode ser usada para alimentar o minicomputador se o senhor tiver um adaptador CA USB-C compatível em vez do adaptador CA de barril incluído.
Comunicação
O módulo WLAN foi atualizado de Wi-Fi 6E para Wi-Fi 7 com suporte a Bluetooth 6.0.
| Networking | |
| iperf3 transmit AXE11000 | |
| MSI Cubi NUC AI+ 3MG | |
| Asus NUC 15 Pro+ | |
| GMK EVO-T1 | |
| MSI Cubi NUC AI+ 2MG | |
| GMK NucBox K16 | |
| Geekom A5 Pro | |
| MSI Cubi NUC 1M | |
| iperf3 receive AXE11000 | |
| Asus NUC 15 Pro+ | |
| GMK EVO-T1 | |
| MSI Cubi NUC AI+ 3MG | |
| MSI Cubi NUC AI+ 2MG | |
| Geekom A5 Pro | |
| GMK NucBox K16 | |
| MSI Cubi NUC 1M | |
| iperf3 transmit AXE11000 6GHz | |
| GMK NucBox K16 | |
| MSI Cubi NUC AI+ 3MG | |
| Asus NUC 15 Pro+ | |
| MSI Cubi NUC 1M | |
| MSI Cubi NUC AI+ 2MG | |
| iperf3 receive AXE11000 6GHz | |
| GMK NucBox K16 | |
| MSI Cubi NUC AI+ 3MG | |
| MSI Cubi NUC AI+ 2MG | |
| Asus NUC 15 Pro+ | |
| MSI Cubi NUC 1M | |
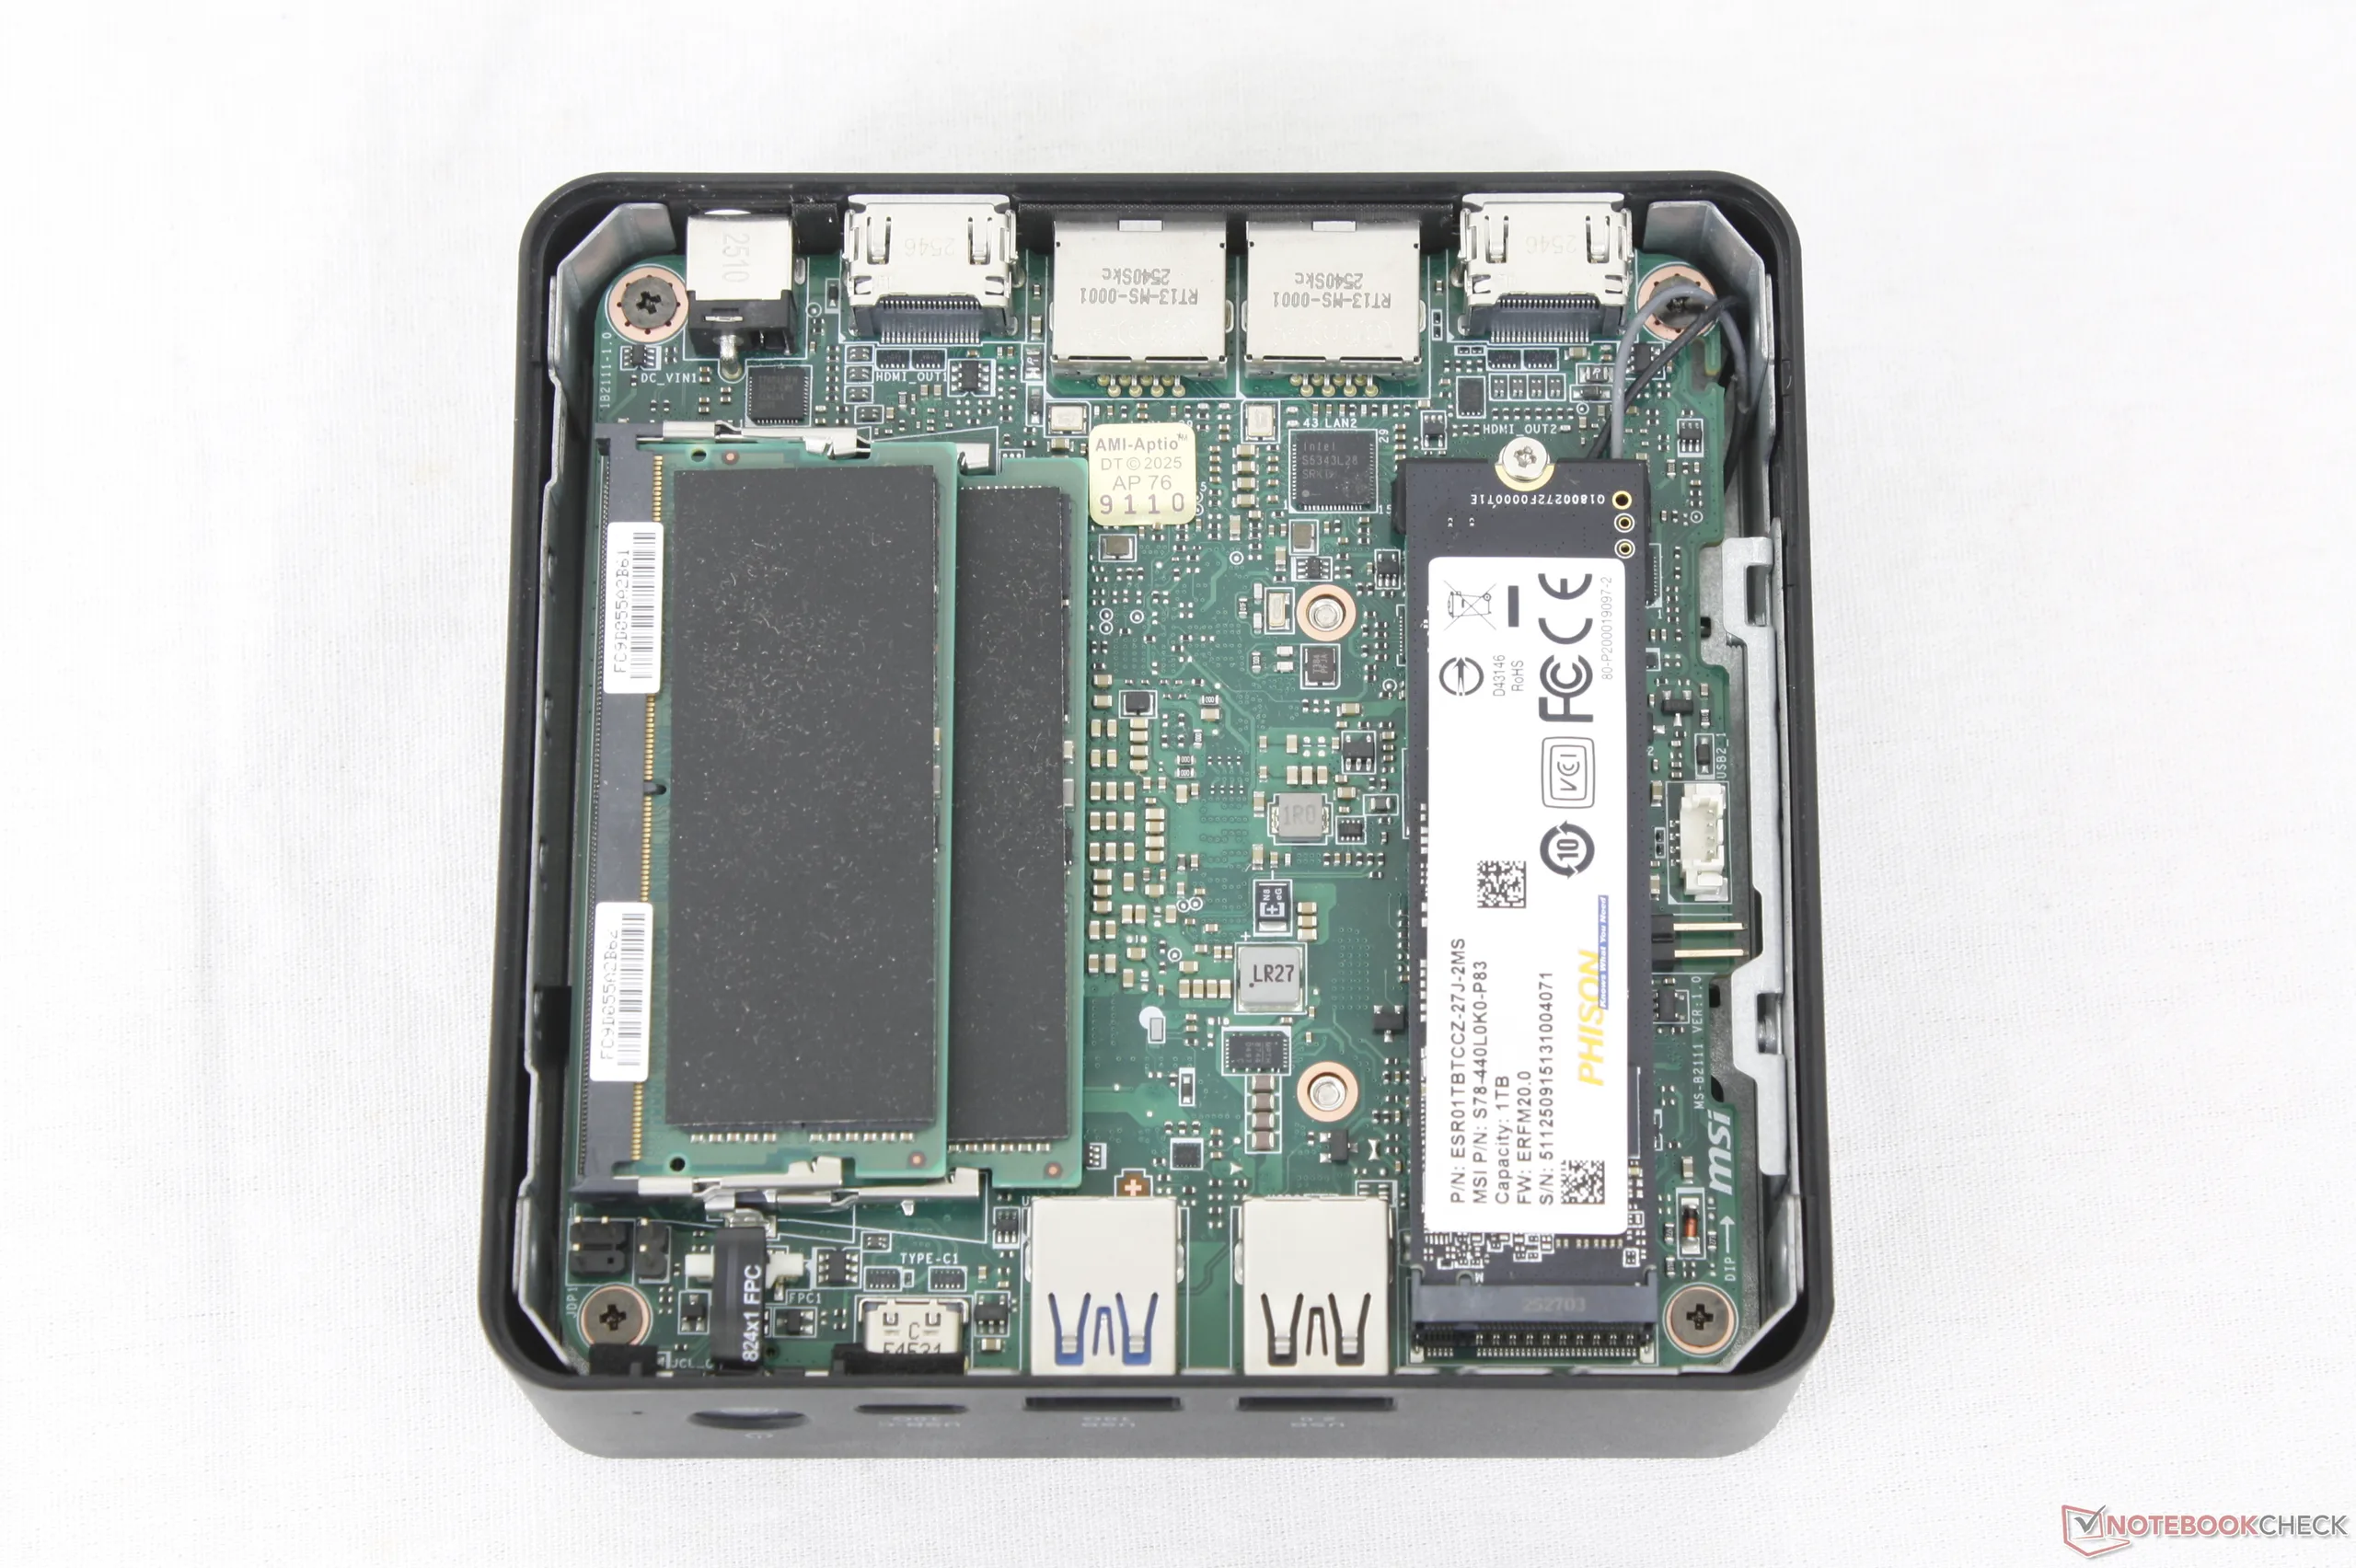
Manutenção
O painel inferior é fixado por um parafuso simples para facilitar a manutenção sem o uso de ferramentas. Na parte interna, os usuários têm acesso direto ao slot SSD M.2 2280, ao módulo WLAN M.2 removível e a dois slots SODIMM DDR5.
Acessórios e garantia
A caixa de varejo inclui o interruptor de alimentação externo para conexão ao pino do interruptor de alimentação mencionado acima. No entanto, o interruptor externo não é muito longo, com apenas ~47 cm.
Desempenho
Condições de teste
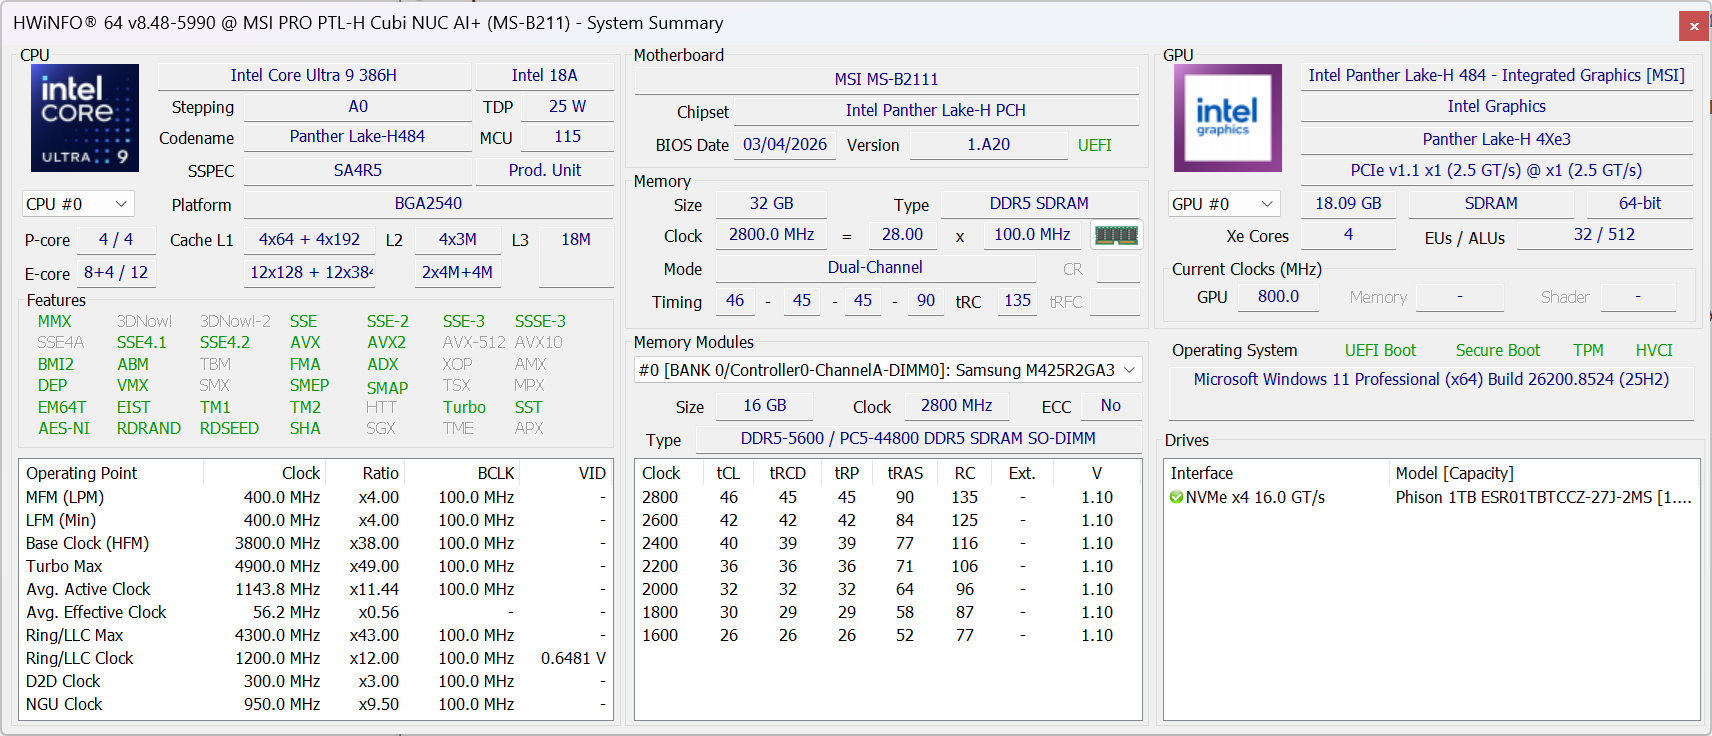
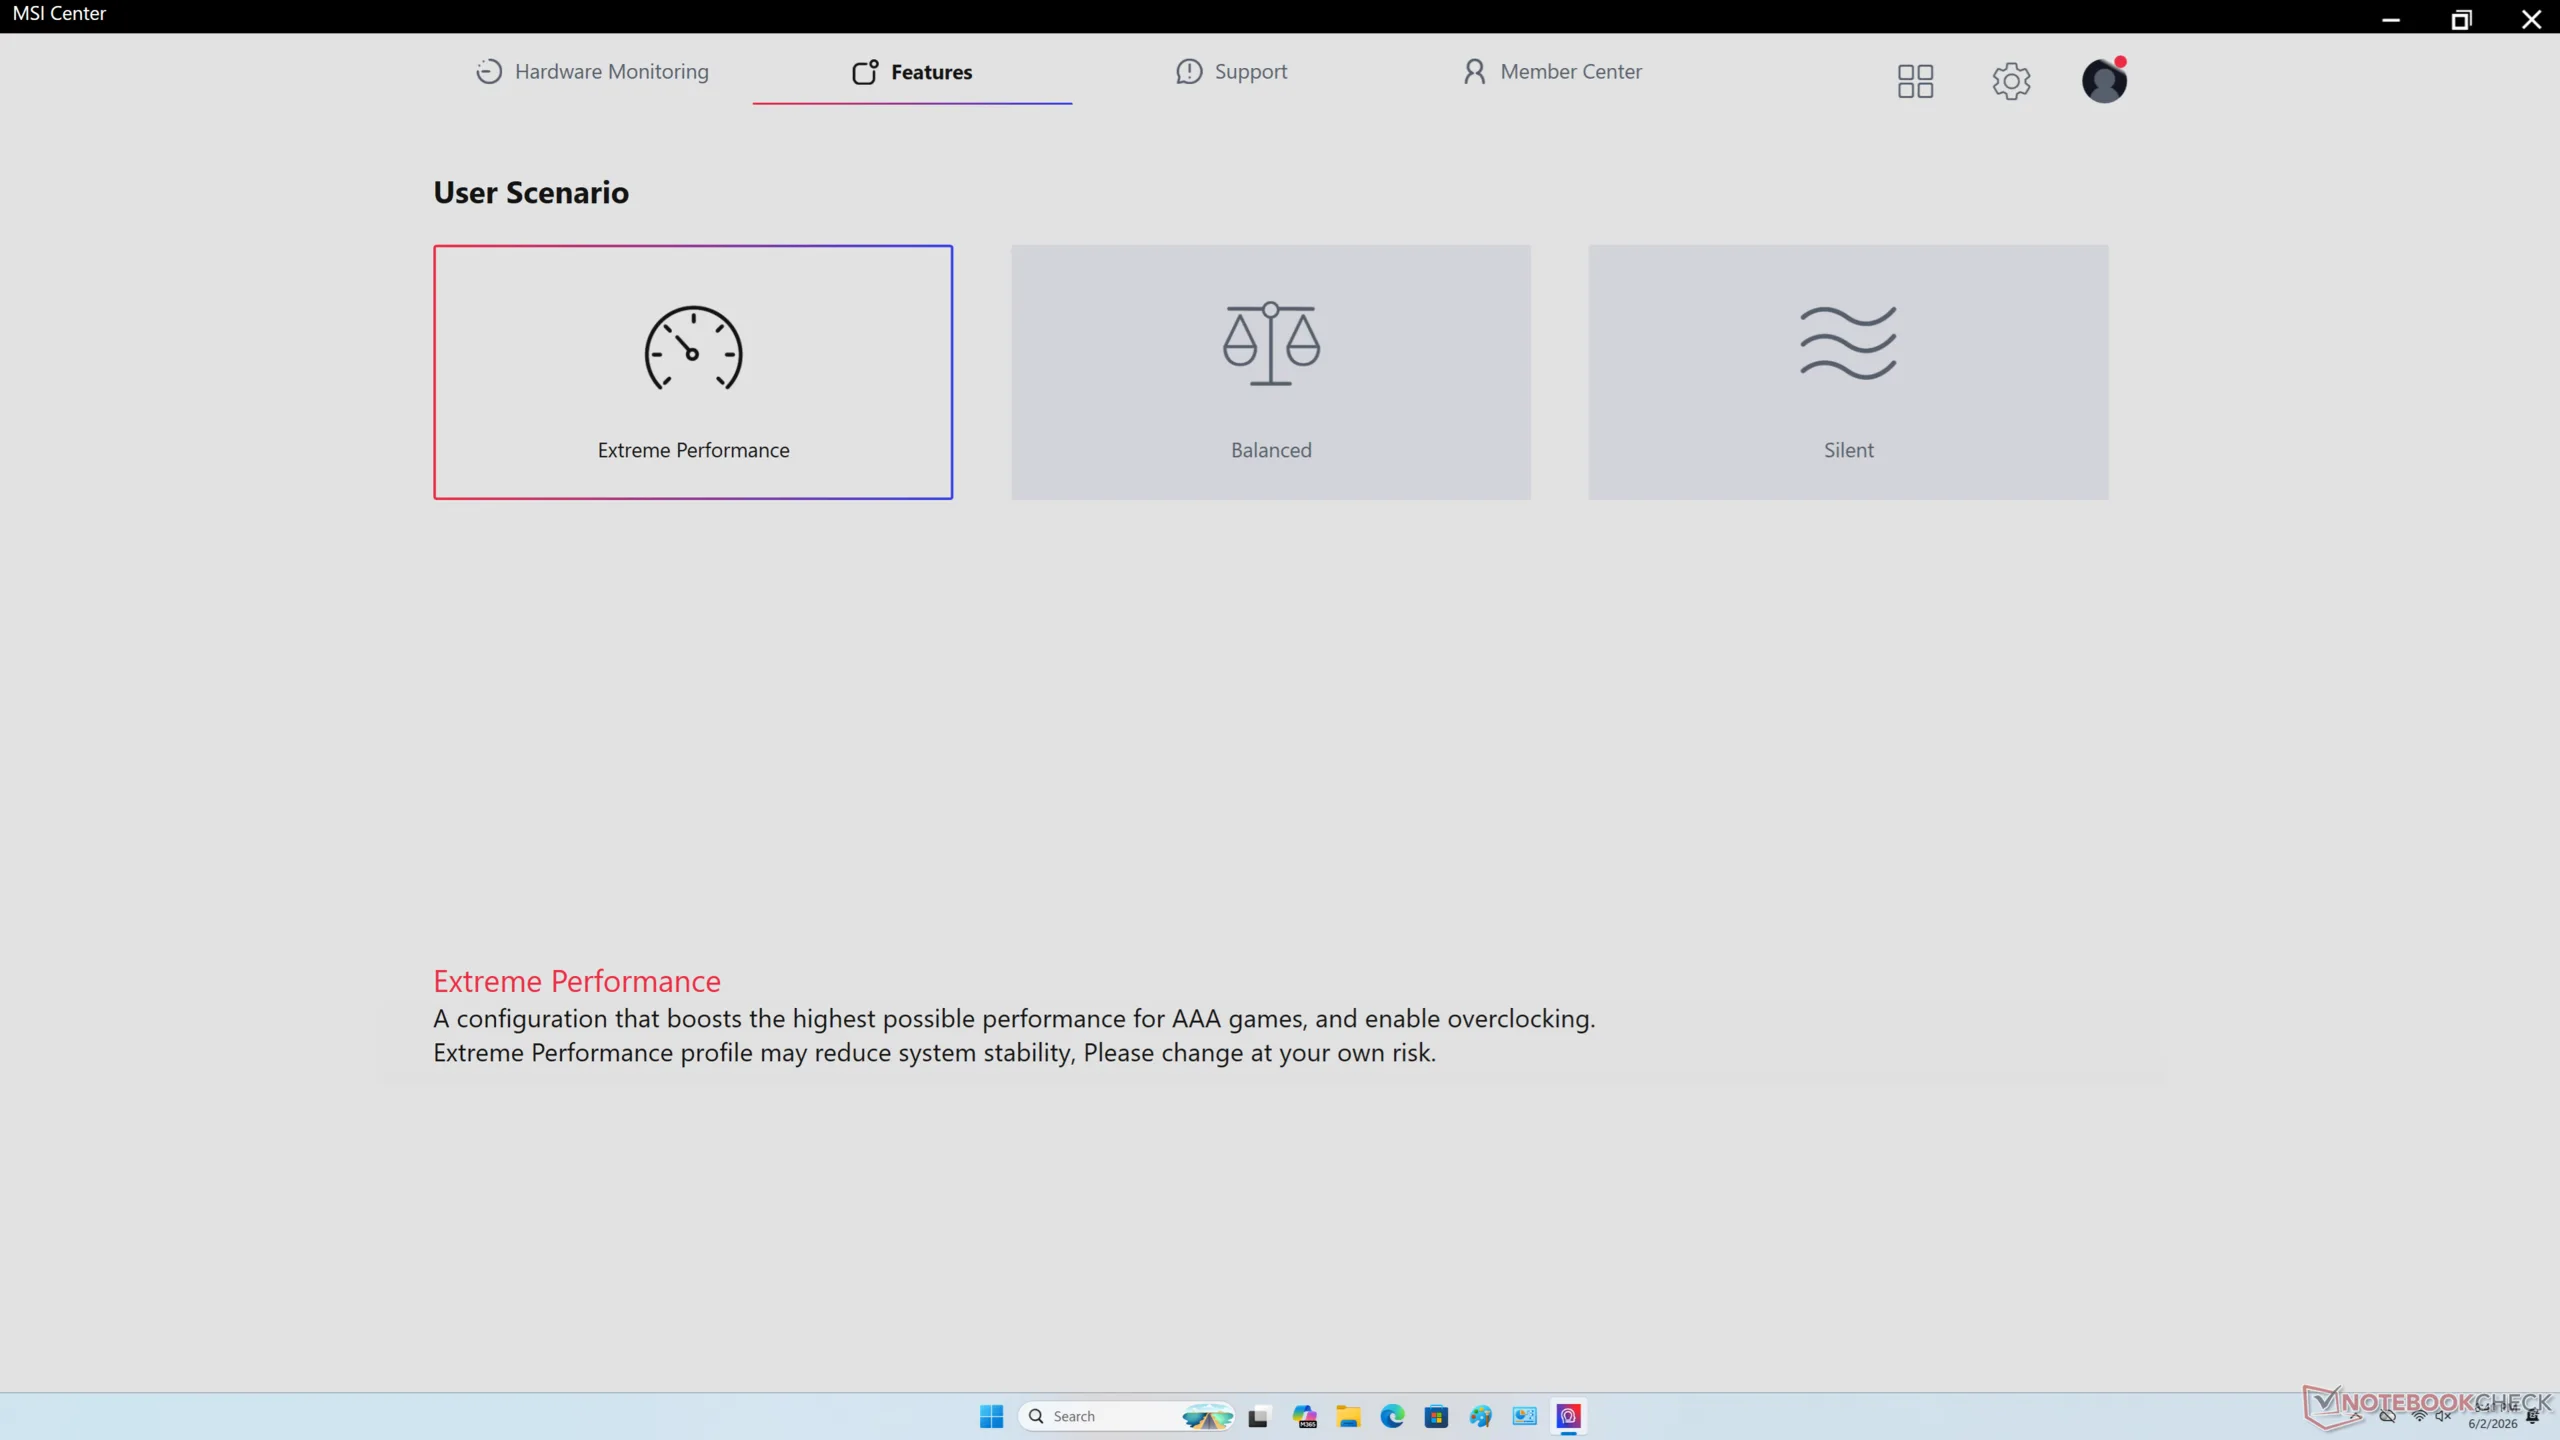
Colocamos o MSI Center no modo Desempenho antes de executar os benchmarks abaixo.
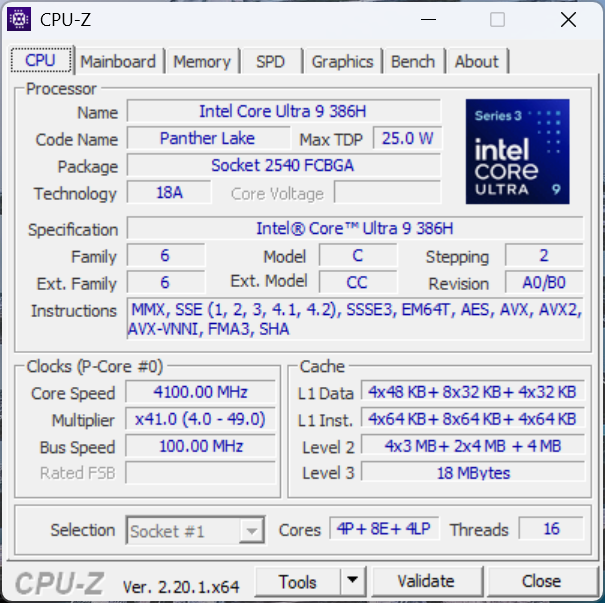
Processador
O Cubi AI 3MG é fornecido com o mesmo Core Ultra 9 386H Encontrada no mais recente Razer Blade 16. No entanto, o desempenho multi-thread bruto é cerca de 18% mais lento no MSI devido ao potencial limitado do Turbo Boost. Ao executar o CineBench R15 xT em um loop, por exemplo, a pontuação inicial de 2.792 pontos cairia para 2.380 pontos após apenas algumas rodadas, conforme mostrado em nosso gráfico de comparação abaixo.
No entanto, o desempenho bruto é muito mais rápido do que o do Cubi AI+ 2MG do ano passado em 50 a 60%, mesmo depois de considerar qualquer limitação.
Cinebench R15 Multi Loop
Cinebench R23: Multi Core | Single Core
Cinebench R20: CPU (Multi Core) | CPU (Single Core)
Cinebench R15: CPU Multi 64Bit | CPU Single 64Bit
Blender: v2.79 BMW27 CPU
7-Zip 18.03: 7z b 4 | 7z b 4 -mmt1
Geekbench 6.7: Multi-Core | Single-Core
Geekbench 5.5: Multi-Core | Single-Core
HWBOT x265 Benchmark v2.2: 4k Preset
LibreOffice : 20 Documents To PDF
R Benchmark 2.5: Overall mean
| CPU Performance rating | |
| Minisforum AI X1 Pro, HX 470 | |
| Asus NUC 15 Pro+ | |
| GMK EVO-T1 | |
| Média Intel Core Ultra 9 386H | |
| Peladn HO5, AI 9 HX 370 | |
| MSI Cubi NUC AI+ 3MG | |
| HP EliteBoard G1a AI | |
| GMK NucBox K13 | |
| MSI Cubi NUC AI+ 2MG | |
| GMK NucBox K16 | |
| MSI Cubi NUC 1M | |
| Minix Elite EU512-AI -2! | |
| Geekom A5 Pro | |
| Cinebench R23 / Multi Core | |
| Minisforum AI X1 Pro, HX 470 | |
| Asus NUC 15 Pro+ | |
| GMK EVO-T1 | |
| Peladn HO5, AI 9 HX 370 | |
| Média Intel Core Ultra 9 386H (12144 - 21186, n=8) | |
| MSI Cubi NUC AI+ 3MG | |
| Minix Elite EU512-AI | |
| GMK NucBox K16 | |
| HP EliteBoard G1a AI | |
| GMK NucBox K13 | |
| MSI Cubi NUC AI+ 2MG | |
| MSI Cubi NUC 1M | |
| Geekom A5 Pro | |
| Cinebench R23 / Single Core | |
| Asus NUC 15 Pro+ | |
| GMK EVO-T1 | |
| Minisforum AI X1 Pro, HX 470 | |
| Média Intel Core Ultra 9 386H (2010 - 2101, n=8) | |
| MSI Cubi NUC AI+ 3MG | |
| Peladn HO5, AI 9 HX 370 | |
| MSI Cubi NUC AI+ 2MG | |
| GMK NucBox K13 | |
| MSI Cubi NUC 1M | |
| HP EliteBoard G1a AI | |
| Minix Elite EU512-AI | |
| GMK NucBox K16 | |
| Geekom A5 Pro | |
| Cinebench R20 / CPU (Multi Core) | |
| Minisforum AI X1 Pro, HX 470 | |
| Asus NUC 15 Pro+ | |
| GMK EVO-T1 | |
| Peladn HO5, AI 9 HX 370 | |
| Média Intel Core Ultra 9 386H (4757 - 8405, n=8) | |
| MSI Cubi NUC AI+ 3MG | |
| Minix Elite EU512-AI | |
| GMK NucBox K16 | |
| HP EliteBoard G1a AI | |
| GMK NucBox K13 | |
| MSI Cubi NUC AI+ 2MG | |
| MSI Cubi NUC 1M | |
| Geekom A5 Pro | |
| Cinebench R20 / CPU (Single Core) | |
| Asus NUC 15 Pro+ | |
| Minisforum AI X1 Pro, HX 470 | |
| GMK EVO-T1 | |
| Média Intel Core Ultra 9 386H (762 - 796, n=8) | |
| MSI Cubi NUC AI+ 3MG | |
| MSI Cubi NUC AI+ 2MG | |
| Peladn HO5, AI 9 HX 370 | |
| GMK NucBox K13 | |
| MSI Cubi NUC 1M | |
| HP EliteBoard G1a AI | |
| Minix Elite EU512-AI | |
| GMK NucBox K16 | |
| Geekom A5 Pro | |
| Cinebench R15 / CPU Multi 64Bit | |
| Minisforum AI X1 Pro, HX 470 | |
| Asus NUC 15 Pro+ | |
| GMK EVO-T1 | |
| Peladn HO5, AI 9 HX 370 | |
| Média Intel Core Ultra 9 386H (2197 - 3347, n=8) | |
| MSI Cubi NUC AI+ 3MG | |
| Minix Elite EU512-AI | |
| GMK NucBox K16 | |
| HP EliteBoard G1a AI | |
| GMK NucBox K13 | |
| MSI Cubi NUC AI+ 2MG | |
| Geekom A5 Pro | |
| MSI Cubi NUC 1M | |
| Cinebench R15 / CPU Single 64Bit | |
| Asus NUC 15 Pro+ | |
| Minisforum AI X1 Pro, HX 470 | |
| GMK EVO-T1 | |
| Peladn HO5, AI 9 HX 370 | |
| MSI Cubi NUC AI+ 2MG | |
| Média Intel Core Ultra 9 386H (249 - 314, n=8) | |
| GMK NucBox K13 | |
| HP EliteBoard G1a AI | |
| MSI Cubi NUC AI+ 3MG | |
| MSI Cubi NUC 1M | |
| GMK NucBox K16 | |
| Minix Elite EU512-AI | |
| Geekom A5 Pro | |
| Blender / v2.79 BMW27 CPU | |
| MSI Cubi NUC 1M | |
| Geekom A5 Pro | |
| MSI Cubi NUC AI+ 2MG | |
| GMK NucBox K13 | |
| HP EliteBoard G1a AI | |
| GMK NucBox K16 | |
| Minix Elite EU512-AI | |
| MSI Cubi NUC AI+ 3MG | |
| Média Intel Core Ultra 9 386H (156 - 299, n=8) | |
| GMK EVO-T1 | |
| Asus NUC 15 Pro+ | |
| Peladn HO5, AI 9 HX 370 | |
| Minisforum AI X1 Pro, HX 470 | |
| 7-Zip 18.03 / 7z b 4 -mmt1 | |
| Minisforum AI X1 Pro, HX 470 | |
| Média Intel Core Ultra 9 386H (5488 - 6493, n=8) | |
| Asus NUC 15 Pro+ | |
| GMK EVO-T1 | |
| Peladn HO5, AI 9 HX 370 | |
| MSI Cubi NUC 1M | |
| MSI Cubi NUC AI+ 2MG | |
| GMK NucBox K13 | |
| HP EliteBoard G1a AI | |
| MSI Cubi NUC AI+ 3MG | |
| Geekom A5 Pro | |
| GMK NucBox K16 | |
| Minix Elite EU512-AI | |
| Geekbench 6.7 / Multi-Core | |
| Asus NUC 15 Pro+ | |
| Média Intel Core Ultra 9 386H (13776 - 17405, n=10) | |
| GMK EVO-T1 | |
| MSI Cubi NUC AI+ 3MG | |
| Peladn HO5, AI 9 HX 370 | |
| Minisforum AI X1 Pro, HX 470 | |
| HP EliteBoard G1a AI | |
| GMK NucBox K13 | |
| MSI Cubi NUC AI+ 2MG | |
| MSI Cubi NUC 1M | |
| Geekom A5 Pro | |
| GMK NucBox K16 | |
| Geekbench 6.7 / Single-Core | |
| Minisforum AI X1 Pro, HX 470 | |
| GMK EVO-T1 | |
| Média Intel Core Ultra 9 386H (2778 - 2919, n=10) | |
| Peladn HO5, AI 9 HX 370 | |
| MSI Cubi NUC AI+ 3MG | |
| GMK NucBox K13 | |
| MSI Cubi NUC AI+ 2MG | |
| Asus NUC 15 Pro+ | |
| MSI Cubi NUC 1M | |
| HP EliteBoard G1a AI | |
| Geekom A5 Pro | |
| GMK NucBox K16 | |
| Geekbench 5.5 / Multi-Core | |
| Média Intel Core Ultra 9 386H (13098 - 17557, n=8) | |
| Asus NUC 15 Pro+ | |
| GMK EVO-T1 | |
| Peladn HO5, AI 9 HX 370 | |
| MSI Cubi NUC AI+ 3MG | |
| Minisforum AI X1 Pro, HX 470 | |
| HP EliteBoard G1a AI | |
| Minix Elite EU512-AI | |
| GMK NucBox K13 | |
| MSI Cubi NUC 1M | |
| MSI Cubi NUC AI+ 2MG | |
| GMK NucBox K16 | |
| Geekom A5 Pro | |
| Geekbench 5.5 / Single-Core | |
| Média Intel Core Ultra 9 386H (1992 - 2162, n=8) | |
| Peladn HO5, AI 9 HX 370 | |
| GMK EVO-T1 | |
| MSI Cubi NUC AI+ 2MG | |
| GMK NucBox K13 | |
| MSI Cubi NUC AI+ 3MG | |
| Minisforum AI X1 Pro, HX 470 | |
| HP EliteBoard G1a AI | |
| MSI Cubi NUC 1M | |
| Asus NUC 15 Pro+ | |
| Minix Elite EU512-AI | |
| Geekom A5 Pro | |
| GMK NucBox K16 | |
| HWBOT x265 Benchmark v2.2 / 4k Preset | |
| Asus NUC 15 Pro+ | |
| Peladn HO5, AI 9 HX 370 | |
| Minisforum AI X1 Pro, HX 470 | |
| GMK EVO-T1 | |
| Média Intel Core Ultra 9 386H (13.2 - 25.1, n=8) | |
| MSI Cubi NUC AI+ 3MG | |
| HP EliteBoard G1a AI | |
| Minix Elite EU512-AI | |
| GMK NucBox K13 | |
| MSI Cubi NUC AI+ 2MG | |
| GMK NucBox K16 | |
| Geekom A5 Pro | |
| MSI Cubi NUC 1M | |
| LibreOffice / 20 Documents To PDF | |
| Minix Elite EU512-AI | |
| HP EliteBoard G1a AI | |
| Minisforum AI X1 Pro, HX 470 | |
| GMK NucBox K16 | |
| Geekom A5 Pro | |
| Peladn HO5, AI 9 HX 370 | |
| Asus NUC 15 Pro+ | |
| GMK EVO-T1 | |
| MSI Cubi NUC AI+ 3MG | |
| GMK NucBox K13 | |
| Média Intel Core Ultra 9 386H (38.5 - 56.1, n=8) | |
| MSI Cubi NUC AI+ 2MG | |
| MSI Cubi NUC 1M | |
| R Benchmark 2.5 / Overall mean | |
| Minix Elite EU512-AI | |
| GMK NucBox K16 | |
| Geekom A5 Pro | |
| MSI Cubi NUC AI+ 2MG | |
| HP EliteBoard G1a AI | |
| GMK NucBox K13 | |
| MSI Cubi NUC 1M | |
| GMK EVO-T1 | |
| Asus NUC 15 Pro+ | |
| MSI Cubi NUC AI+ 3MG | |
| Média Intel Core Ultra 9 386H (0.4055 - 0.4384, n=8) | |
| Peladn HO5, AI 9 HX 370 | |
| Minisforum AI X1 Pro, HX 470 | |
Cinebench R23: Multi Core | Single Core
Cinebench R20: CPU (Multi Core) | CPU (Single Core)
Cinebench R15: CPU Multi 64Bit | CPU Single 64Bit
Blender: v2.79 BMW27 CPU
7-Zip 18.03: 7z b 4 | 7z b 4 -mmt1
Geekbench 6.7: Multi-Core | Single-Core
Geekbench 5.5: Multi-Core | Single-Core
HWBOT x265 Benchmark v2.2: 4k Preset
LibreOffice : 20 Documents To PDF
R Benchmark 2.5: Overall mean
* ... menor é melhor
AIDA64: FP32 Ray-Trace | FPU Julia | CPU SHA3 | CPU Queen | FPU SinJulia | FPU Mandel | CPU AES | CPU ZLib | FP64 Ray-Trace | CPU PhotoWorxx | CPU CheckMate
| Performance rating | |
| Asus NUC 15 Pro+ -1! | |
| Média Intel Core Ultra 9 386H -1! | |
| GMK EVO-T1 | |
| MSI Cubi NUC AI+ 3MG -1! | |
| GMK NucBox K16 -1! | |
| MSI Cubi NUC AI+ 2MG -1! | |
| Geekom A5 Pro | |
| MSI Cubi NUC 1M -1! | |
| AIDA64 / FP32 Ray-Trace | |
| Asus NUC 15 Pro+ (v6.92.6600) | |
| GMK EVO-T1 (v6.92.6600) | |
| GMK EVO-T1 (v8.20.8100) | |
| Média Intel Core Ultra 9 386H (10001 - 21727, n=8) | |
| GMK NucBox K16 (v8.20.8100) | |
| MSI Cubi NUC AI+ 3MG (v8.20.8100) | |
| MSI Cubi NUC AI+ 2MG (v6.92.6600) | |
| Geekom A5 Pro (v8.20.8100) | |
| Geekom A5 Pro (v6.92.6600) | |
| MSI Cubi NUC 1M (v6.92.6600) | |
| AIDA64 / FPU Julia | |
| Asus NUC 15 Pro+ (v6.92.6600) | |
| GMK EVO-T1 (v6.92.6600) | |
| GMK EVO-T1 (v8.20.8100) | |
| Média Intel Core Ultra 9 386H (53370 - 113595, n=8) | |
| GMK NucBox K16 (v8.20.8100) | |
| MSI Cubi NUC AI+ 3MG (v8.20.8100) | |
| MSI Cubi NUC AI+ 2MG (v6.92.6600) | |
| Geekom A5 Pro (v8.20.8100) | |
| Geekom A5 Pro (v6.92.6600) | |
| MSI Cubi NUC 1M (v6.92.6600) | |
| AIDA64 / CPU SHA3 | |
| Asus NUC 15 Pro+ (v6.92.6600) | |
| GMK EVO-T1 (v6.92.6600) | |
| GMK EVO-T1 (v8.20.8100) | |
| Média Intel Core Ultra 9 386H (2776 - 5604, n=8) | |
| MSI Cubi NUC AI+ 3MG (v8.20.8100) | |
| GMK NucBox K16 (v8.20.8100) | |
| MSI Cubi NUC AI+ 2MG (v6.92.6600) | |
| MSI Cubi NUC 1M (v6.92.6600) | |
| Geekom A5 Pro (v6.92.6600) | |
| Geekom A5 Pro (v8.20.8100) | |
| AIDA64 / CPU Queen | |
| Asus NUC 15 Pro+ (v6.92.6600) | |
| Geekom A5 Pro (v6.92.6600) | |
| MSI Cubi NUC 1M (v6.92.6600) | |
| GMK EVO-T1 (v6.92.6600) | |
| MSI Cubi NUC AI+ 2MG (v6.92.6600) | |
| AIDA64 / FPU SinJulia | |
| GMK NucBox K16 (v8.20.8100) | |
| Asus NUC 15 Pro+ (v6.92.6600) | |
| GMK EVO-T1 (v6.92.6600) | |
| GMK EVO-T1 (v8.20.8100) | |
| Geekom A5 Pro (v6.92.6600) | |
| Geekom A5 Pro (v8.20.8100) | |
| Média Intel Core Ultra 9 386H (5314 - 7332, n=8) | |
| MSI Cubi NUC AI+ 3MG (v8.20.8100) | |
| MSI Cubi NUC AI+ 2MG (v6.92.6600) | |
| MSI Cubi NUC 1M (v6.92.6600) | |
| AIDA64 / FPU Mandel | |
| GMK EVO-T1 (v6.92.6600) | |
| GMK EVO-T1 (v8.20.8100) | |
| Asus NUC 15 Pro+ (v6.92.6600) | |
| GMK NucBox K16 (v8.20.8100) | |
| Média Intel Core Ultra 9 386H (28414 - 61578, n=8) | |
| MSI Cubi NUC AI+ 3MG (v8.20.8100) | |
| MSI Cubi NUC AI+ 2MG (v6.92.6600) | |
| Geekom A5 Pro (v6.92.6600) | |
| Geekom A5 Pro (v8.20.8100) | |
| MSI Cubi NUC 1M (v6.92.6600) | |
| AIDA64 / CPU AES | |
| Asus NUC 15 Pro+ (v6.92.6600) | |
| GMK EVO-T1 (v6.92.6600) | |
| GMK EVO-T1 (v8.20.8100) | |
| Média Intel Core Ultra 9 386H (46362 - 72112, n=8) | |
| GMK NucBox K16 (v8.20.8100) | |
| MSI Cubi NUC AI+ 3MG (v8.20.8100) | |
| MSI Cubi NUC AI+ 2MG (v6.92.6600) | |
| Geekom A5 Pro (v6.92.6600) | |
| Geekom A5 Pro (v8.20.8100) | |
| MSI Cubi NUC 1M (v6.92.6600) | |
| AIDA64 / CPU ZLib | |
| Asus NUC 15 Pro+ (v6.92.6600) | |
| GMK EVO-T1 (v6.92.6600) | |
| GMK EVO-T1 (v8.20.8100) | |
| Média Intel Core Ultra 9 386H (669 - 1271, n=8) | |
| MSI Cubi NUC AI+ 3MG (v8.20.8100) | |
| GMK NucBox K16 (v8.20.8100) | |
| MSI Cubi NUC AI+ 2MG (v6.92.6600) | |
| MSI Cubi NUC 1M (v6.92.6600) | |
| Geekom A5 Pro (v6.92.6600) | |
| Geekom A5 Pro (v8.20.8100) | |
| AIDA64 / FP64 Ray-Trace | |
| Asus NUC 15 Pro+ (v6.92.6600) | |
| GMK EVO-T1 (v6.92.6600) | |
| GMK EVO-T1 (v8.20.8100) | |
| Média Intel Core Ultra 9 386H (5138 - 11627, n=8) | |
| GMK NucBox K16 (v8.20.8100) | |
| MSI Cubi NUC AI+ 3MG (v8.20.8100) | |
| MSI Cubi NUC AI+ 2MG (v6.92.6600) | |
| Geekom A5 Pro (v8.20.8100) | |
| Geekom A5 Pro (v6.92.6600) | |
| MSI Cubi NUC 1M (v6.92.6600) | |
| AIDA64 / CPU PhotoWorxx | |
| Média Intel Core Ultra 9 386H (54042 - 89891, n=8) | |
| GMK EVO-T1 (v8.20.8100) | |
| GMK EVO-T1 (v6.92.6600) | |
| Asus NUC 15 Pro+ (v6.92.6600) | |
| MSI Cubi NUC AI+ 2MG (v6.92.6600) | |
| MSI Cubi NUC AI+ 3MG (v8.20.8100) | |
| MSI Cubi NUC 1M (v6.92.6600) | |
| Geekom A5 Pro (v6.92.6600) | |
| Geekom A5 Pro (v8.20.8100) | |
| GMK NucBox K16 (v8.20.8100) | |
| AIDA64 / CPU CheckMate | |
| Média Intel Core Ultra 9 386H (4051 - 4858, n=7) | |
| MSI Cubi NUC AI+ 3MG (v8.20.8100) | |
| GMK EVO-T1 (v8.20.8100) | |
| GMK NucBox K16 (v8.20.8100) | |
| Geekom A5 Pro (v8.20.8100) | |
Desempenho do sistema
Geekbench AI: Quantized GPU 1.7 | Half Precision GPU 1.7 | Single Precision GPU 1.7
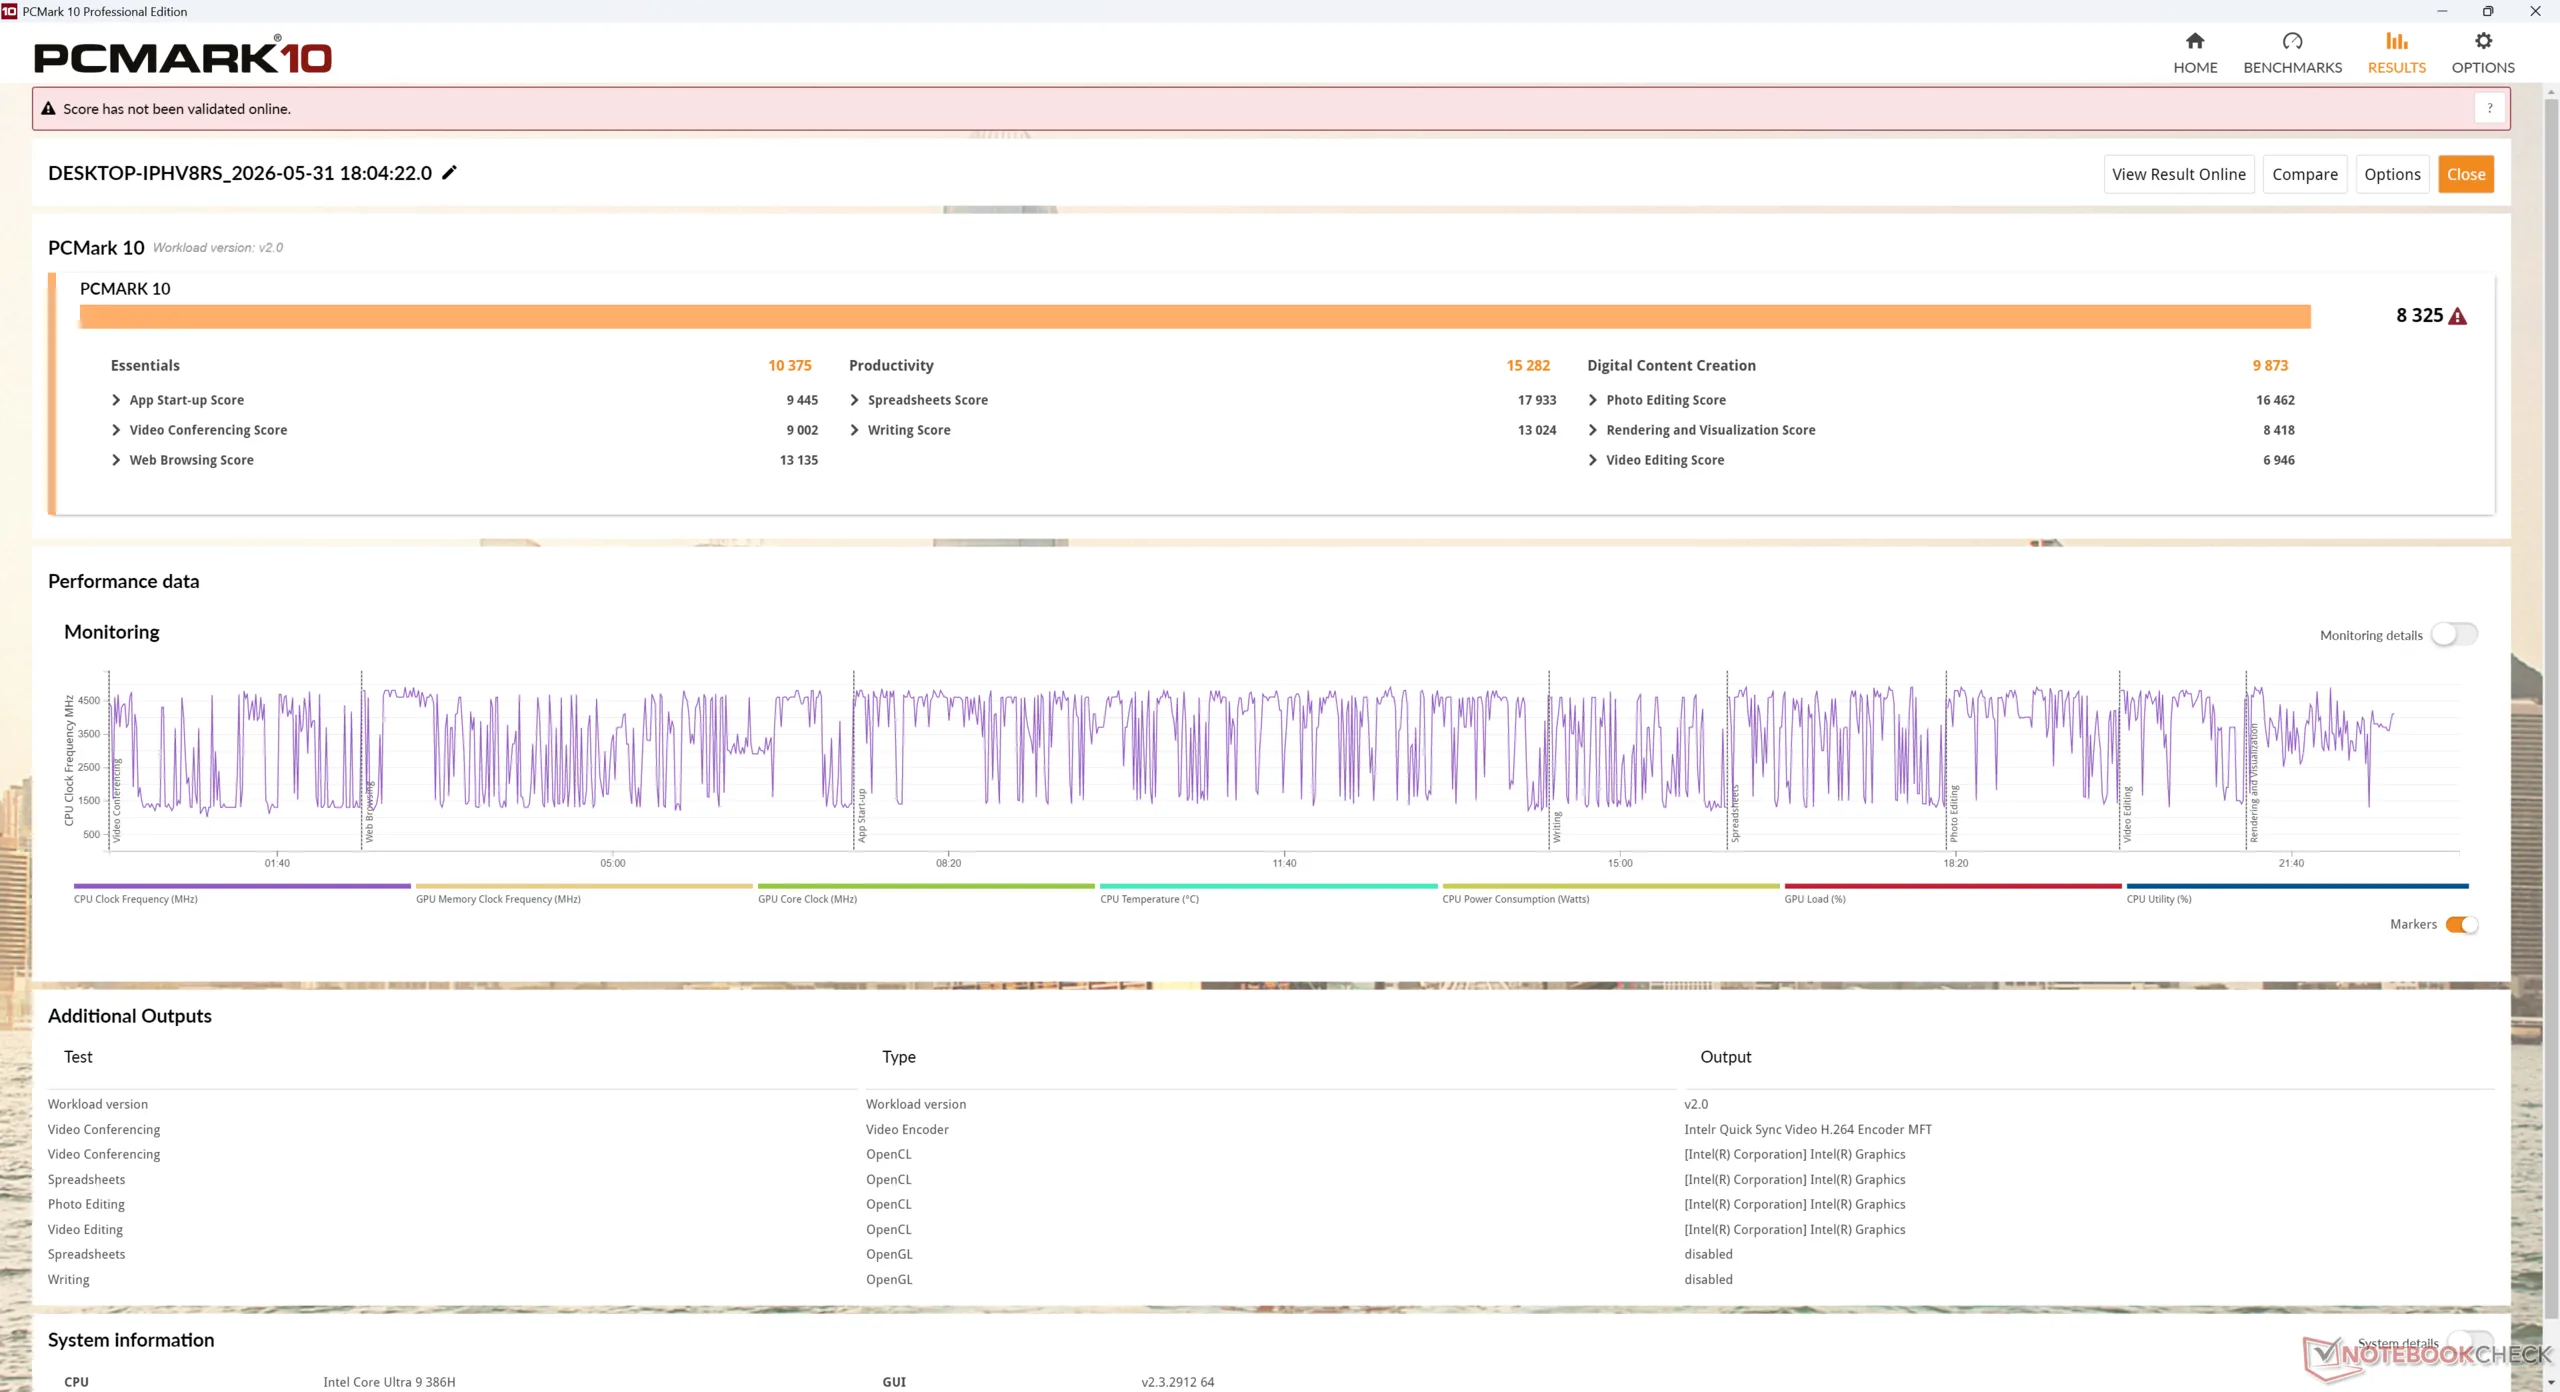
PCMark 10: Score | Essentials | Productivity | Digital Content Creation
CrossMark: Overall | Productivity | Creativity | Responsiveness
WebXPRT 3: Overall
WebXPRT 4: Overall
Mozilla Kraken 1.1: Total
| Performance rating | |
| GMK EVO-T1 | |
| MSI Cubi NUC AI+ 3MG | |
| MSI Cubi NUC AI+ 2MG | |
| Asus NUC 15 Pro+ | |
| MSI Cubi NUC 1M -3! | |
| GMK NucBox K16 -3! | |
| Geekom A5 Pro | |
| Geekbench AI / Quantized GPU 1.7 | |
| MSI Cubi NUC AI+ 2MG | |
| Asus NUC 15 Pro+ | |
| GMK EVO-T1 | |
| MSI Cubi NUC AI+ 3MG | |
| Geekom A5 Pro | |
| Geekbench AI / Half Precision GPU 1.7 | |
| MSI Cubi NUC AI+ 2MG | |
| MSI Cubi NUC AI+ 3MG | |
| GMK EVO-T1 | |
| Asus NUC 15 Pro+ | |
| Geekom A5 Pro | |
| Geekbench AI / Single Precision GPU 1.7 | |
| MSI Cubi NUC AI+ 2MG | |
| Asus NUC 15 Pro+ | |
| GMK EVO-T1 | |
| MSI Cubi NUC AI+ 3MG | |
| Geekom A5 Pro | |
| PCMark 10 / Score | |
| MSI Cubi NUC AI+ 3MG | |
| GMK EVO-T1 | |
| Asus NUC 15 Pro+ | |
| MSI Cubi NUC AI+ 2MG | |
| GMK NucBox K16 | |
| Geekom A5 Pro | |
| MSI Cubi NUC 1M | |
| PCMark 10 / Essentials | |
| MSI Cubi NUC 1M | |
| MSI Cubi NUC AI+ 3MG | |
| GMK EVO-T1 | |
| MSI Cubi NUC AI+ 2MG | |
| Asus NUC 15 Pro+ | |
| Geekom A5 Pro | |
| GMK NucBox K16 | |
| PCMark 10 / Productivity | |
| MSI Cubi NUC AI+ 3MG | |
| Geekom A5 Pro | |
| GMK NucBox K16 | |
| GMK EVO-T1 | |
| MSI Cubi NUC AI+ 2MG | |
| Asus NUC 15 Pro+ | |
| MSI Cubi NUC 1M | |
| PCMark 10 / Digital Content Creation | |
| GMK EVO-T1 | |
| Asus NUC 15 Pro+ | |
| MSI Cubi NUC AI+ 3MG | |
| MSI Cubi NUC AI+ 2MG | |
| GMK NucBox K16 | |
| MSI Cubi NUC 1M | |
| Geekom A5 Pro | |
| CrossMark / Overall | |
| GMK EVO-T1 | |
| MSI Cubi NUC AI+ 3MG | |
| Asus NUC 15 Pro+ | |
| MSI Cubi NUC 1M | |
| MSI Cubi NUC AI+ 2MG | |
| GMK NucBox K16 | |
| Geekom A5 Pro | |
| CrossMark / Productivity | |
| GMK EVO-T1 | |
| MSI Cubi NUC AI+ 3MG | |
| MSI Cubi NUC 1M | |
| Asus NUC 15 Pro+ | |
| MSI Cubi NUC AI+ 2MG | |
| GMK NucBox K16 | |
| Geekom A5 Pro | |
| CrossMark / Creativity | |
| MSI Cubi NUC AI+ 3MG | |
| GMK EVO-T1 | |
| Asus NUC 15 Pro+ | |
| MSI Cubi NUC AI+ 2MG | |
| MSI Cubi NUC 1M | |
| GMK NucBox K16 | |
| Geekom A5 Pro | |
| CrossMark / Responsiveness | |
| GMK EVO-T1 | |
| MSI Cubi NUC AI+ 3MG | |
| MSI Cubi NUC 1M | |
| Asus NUC 15 Pro+ | |
| MSI Cubi NUC AI+ 2MG | |
| GMK NucBox K16 | |
| Geekom A5 Pro | |
| WebXPRT 3 / Overall | |
| GMK EVO-T1 | |
| MSI Cubi NUC AI+ 2MG | |
| MSI Cubi NUC 1M | |
| MSI Cubi NUC AI+ 3MG | |
| Geekom A5 Pro | |
| Asus NUC 15 Pro+ | |
| GMK NucBox K16 | |
| WebXPRT 4 / Overall | |
| GMK EVO-T1 | |
| MSI Cubi NUC AI+ 3MG | |
| MSI Cubi NUC AI+ 2MG | |
| MSI Cubi NUC 1M | |
| Asus NUC 15 Pro+ | |
| Geekom A5 Pro | |
| GMK NucBox K16 | |
| Mozilla Kraken 1.1 / Total | |
| GMK NucBox K16 | |
| Geekom A5 Pro | |
| MSI Cubi NUC 1M | |
| MSI Cubi NUC AI+ 2MG | |
| Asus NUC 15 Pro+ | |
| GMK EVO-T1 | |
| MSI Cubi NUC AI+ 3MG | |
* ... menor é melhor
| PCMark 10 Score | 8325 pontos | |
Ajuda | ||
| AIDA64 / Memory Copy | |
| Média Intel Core Ultra 9 386H (75437 - 129946, n=8) | |
| MSI Cubi NUC AI+ 2MG | |
| Asus NUC 15 Pro+ | |
| GMK EVO-T1 | |
| GMK EVO-T1 | |
| MSI Cubi NUC AI+ 3MG | |
| MSI Cubi NUC 1M | |
| Geekom A5 Pro | |
| Geekom A5 Pro | |
| GMK NucBox K16 | |
| AIDA64 / Memory Read | |
| Média Intel Core Ultra 9 386H (81021 - 118858, n=8) | |
| Asus NUC 15 Pro+ | |
| MSI Cubi NUC AI+ 2MG | |
| MSI Cubi NUC AI+ 3MG | |
| GMK EVO-T1 | |
| GMK EVO-T1 | |
| MSI Cubi NUC 1M | |
| Geekom A5 Pro | |
| Geekom A5 Pro | |
| GMK NucBox K16 | |
| AIDA64 / Memory Write | |
| MSI Cubi NUC AI+ 2MG | |
| Média Intel Core Ultra 9 386H (75959 - 135096, n=8) | |
| Asus NUC 15 Pro+ | |
| GMK EVO-T1 | |
| GMK EVO-T1 | |
| MSI Cubi NUC AI+ 3MG | |
| MSI Cubi NUC 1M | |
| GMK NucBox K16 | |
| Geekom A5 Pro | |
| Geekom A5 Pro | |
| AIDA64 / Memory Latency | |
| GMK EVO-T1 | |
| GMK EVO-T1 | |
| MSI Cubi NUC AI+ 3MG | |
| GMK NucBox K16 | |
| Asus NUC 15 Pro+ | |
| Média Intel Core Ultra 9 386H (87.2 - 116.9, n=8) | |
| Geekom A5 Pro | |
| Geekom A5 Pro | |
| MSI Cubi NUC AI+ 2MG | |
| MSI Cubi NUC 1M | |
* ... menor é melhor
Latência DPC
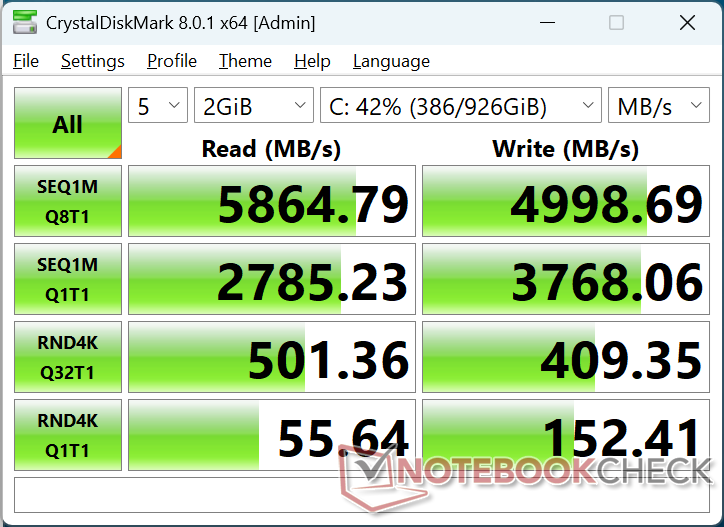
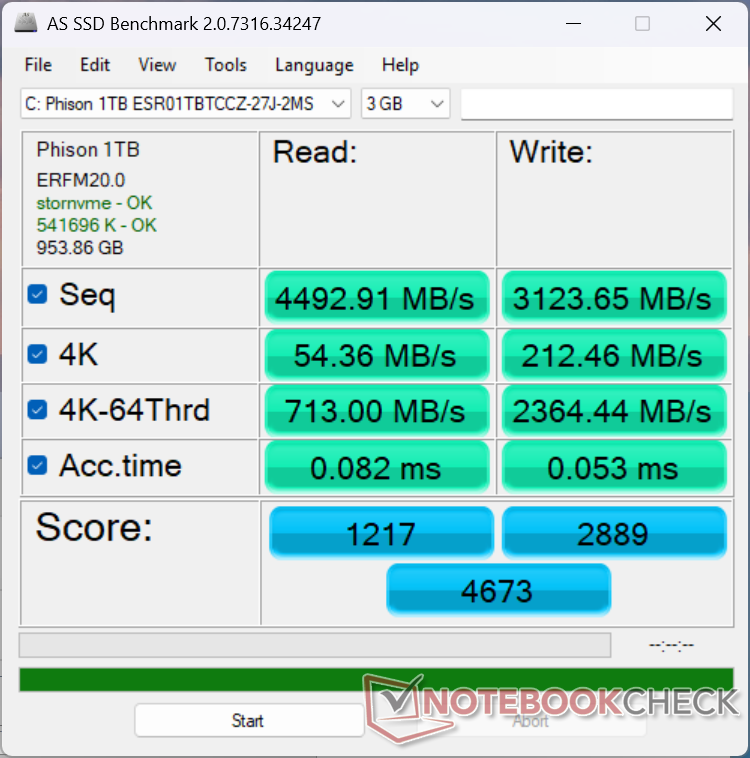
Dispositivos de armazenamento
O sistema é fornecido com o mesmo Phison 1 TB ESR01TBTCCZ PCIe4 NVMe SSD encontrado no Cubi 2MG do ano passado.

| Drive Performance rating - Percent | |
| GMK EVO-T1 | |
| Asus NUC 15 Pro+ | |
| MSI Cubi NUC AI+ 3MG | |
| MSI Cubi NUC 1M | |
| Geekom A5 Pro | |
| MSI Cubi NUC AI+ 2MG | |
| GMK NucBox K16 | |
* ... menor é melhor
Limitação de disco: Loop de leitura do DiskSpd, profundidade da fila 8
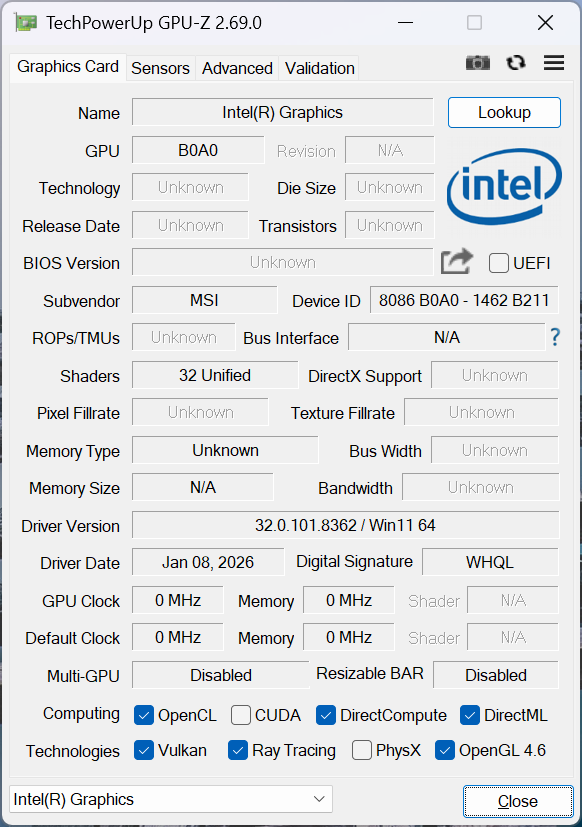
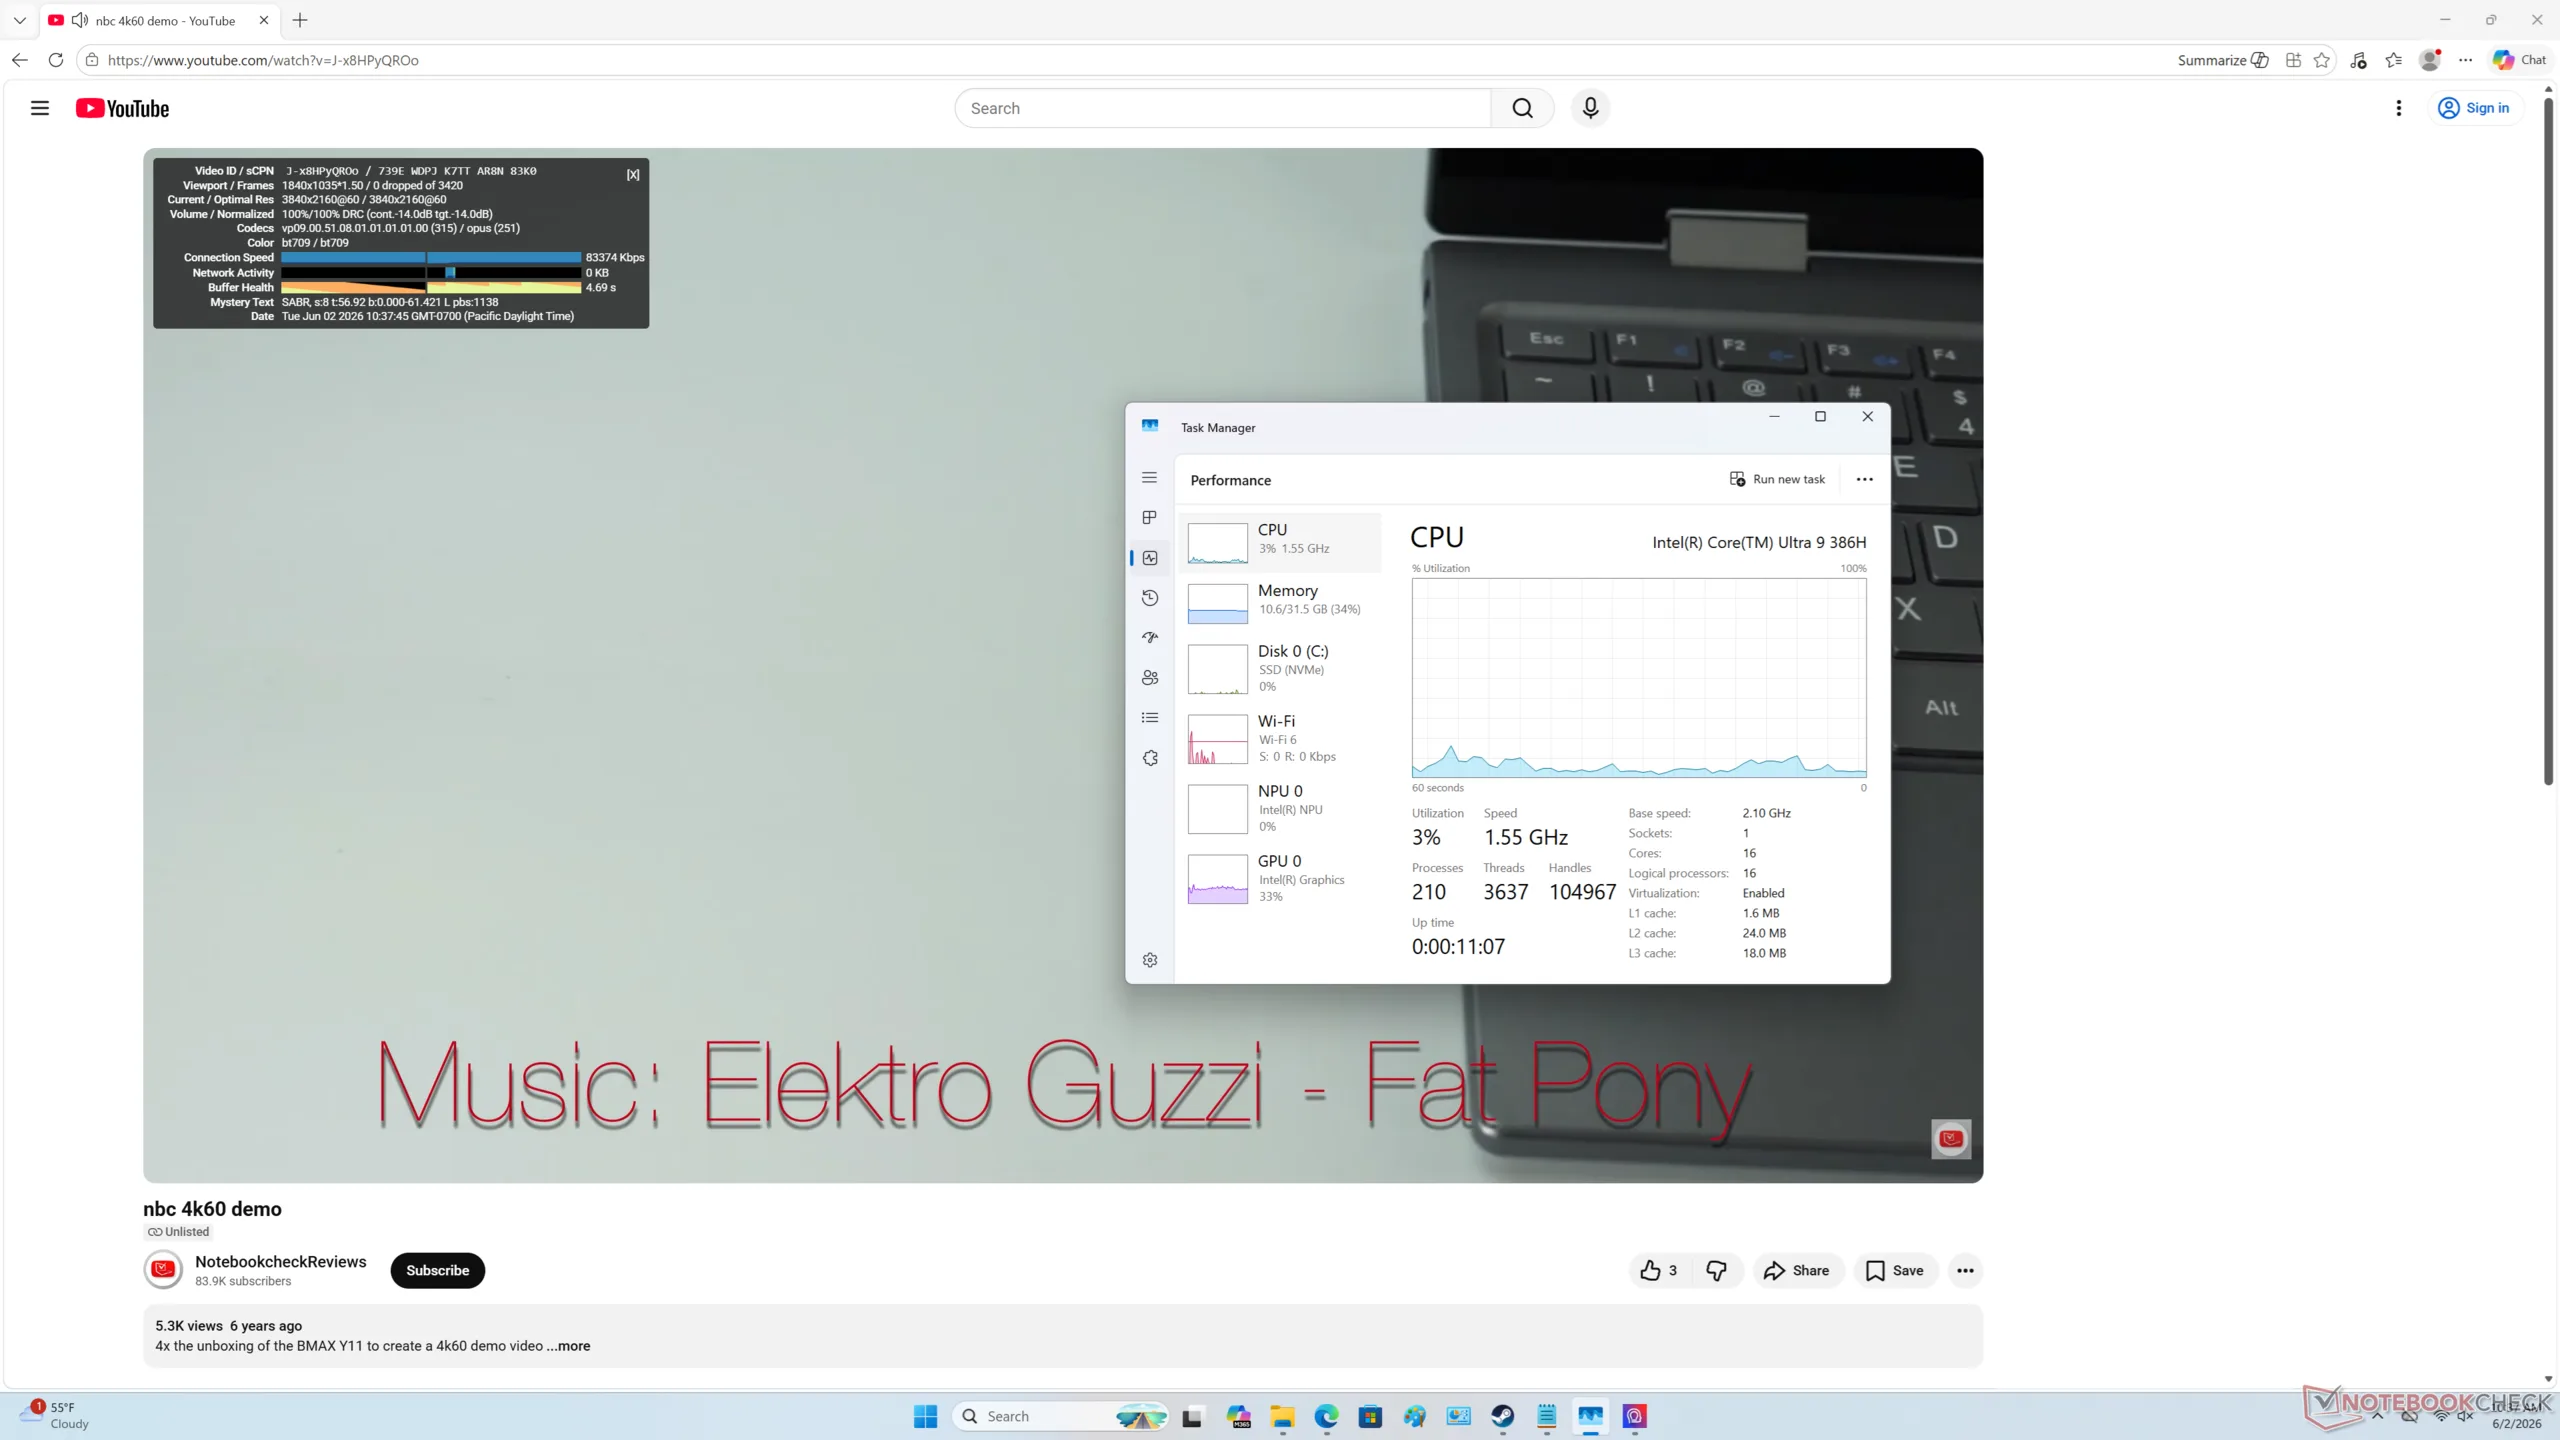
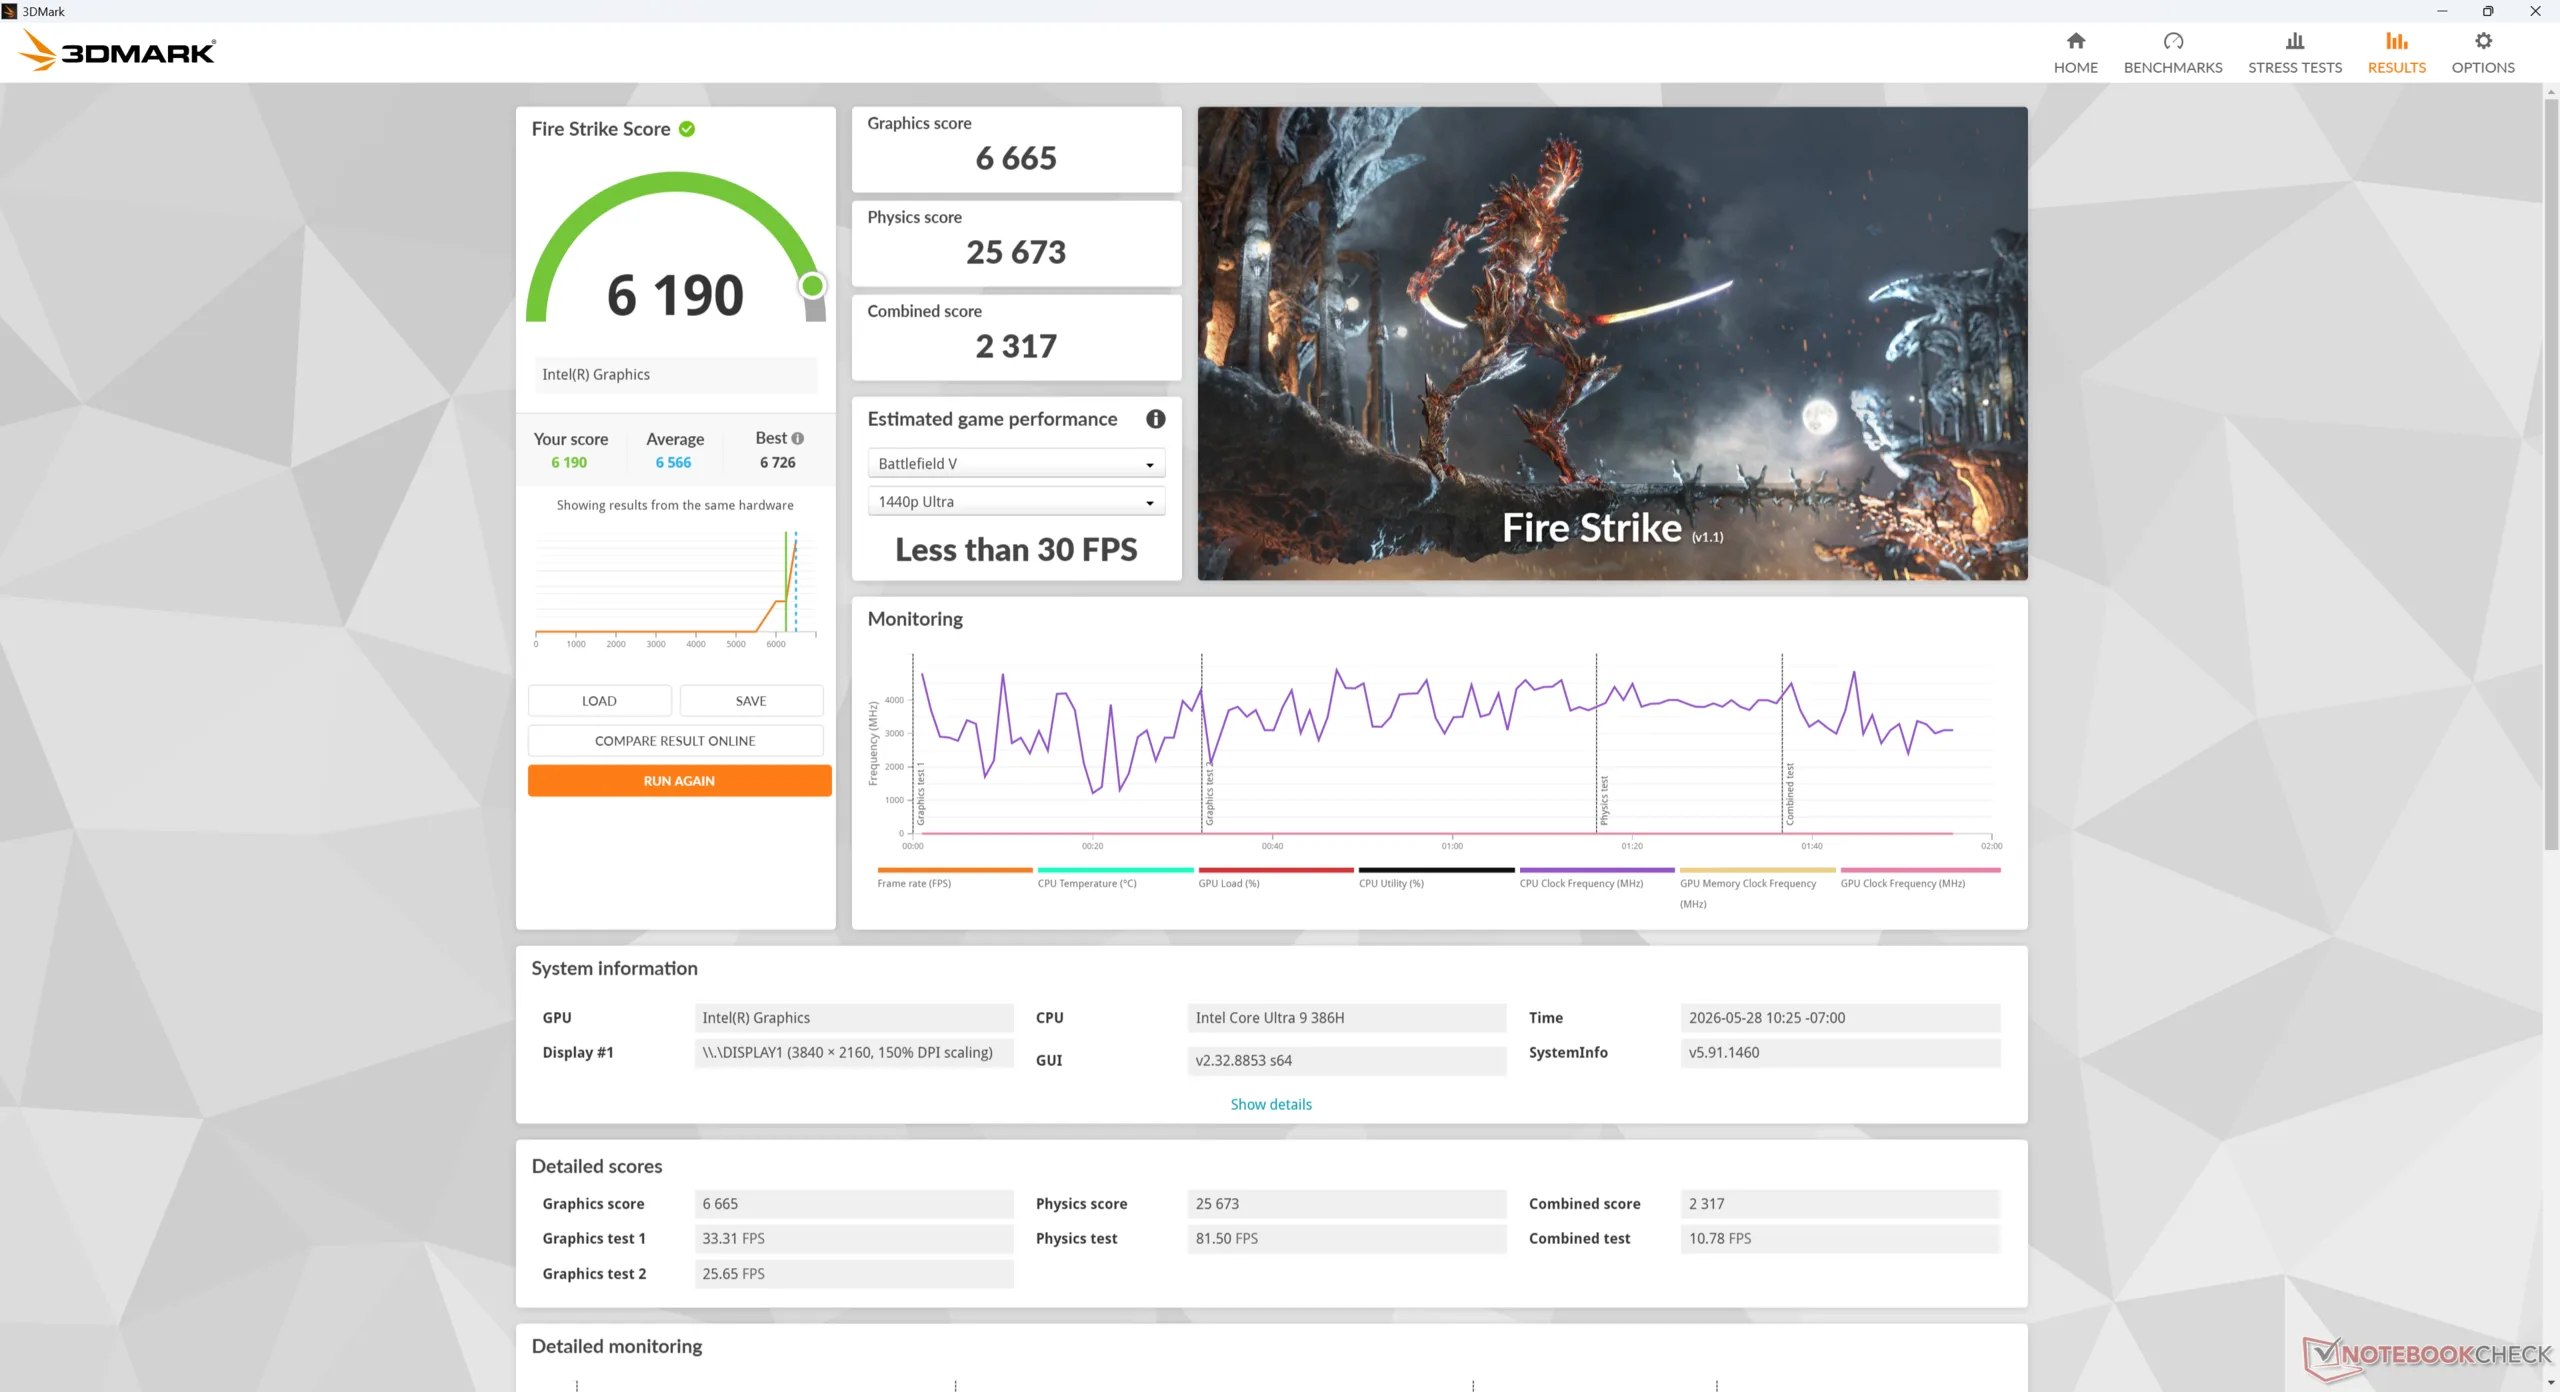
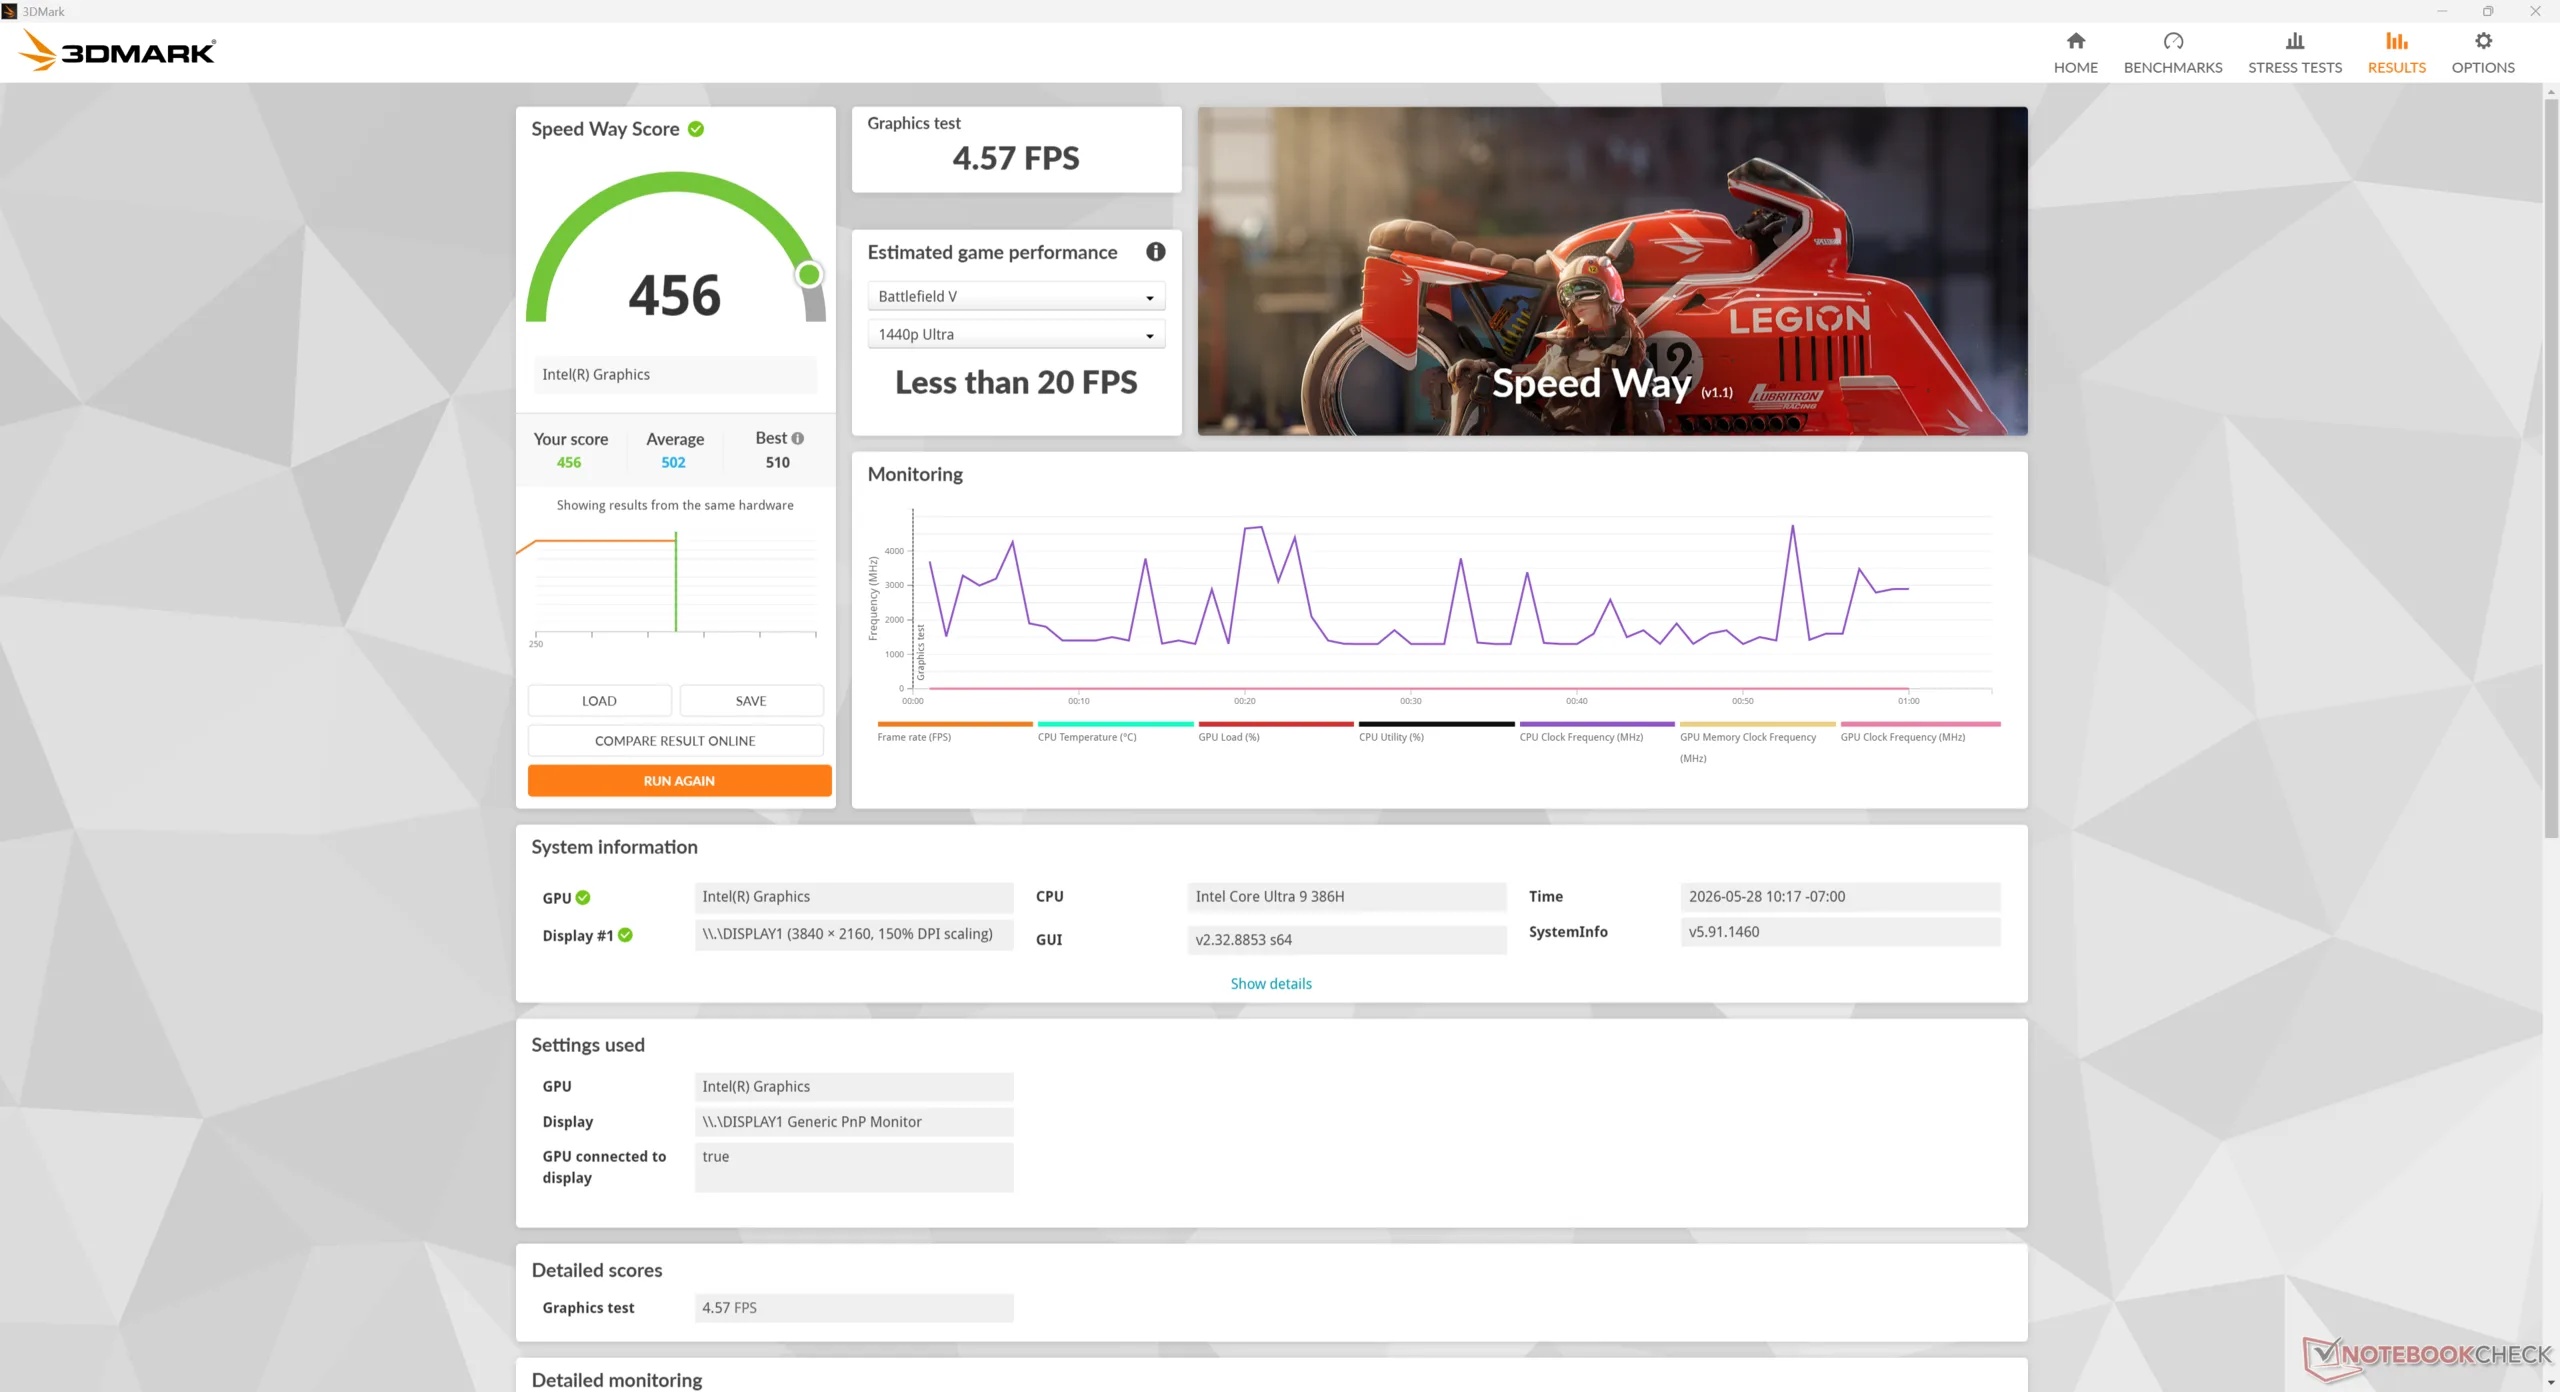
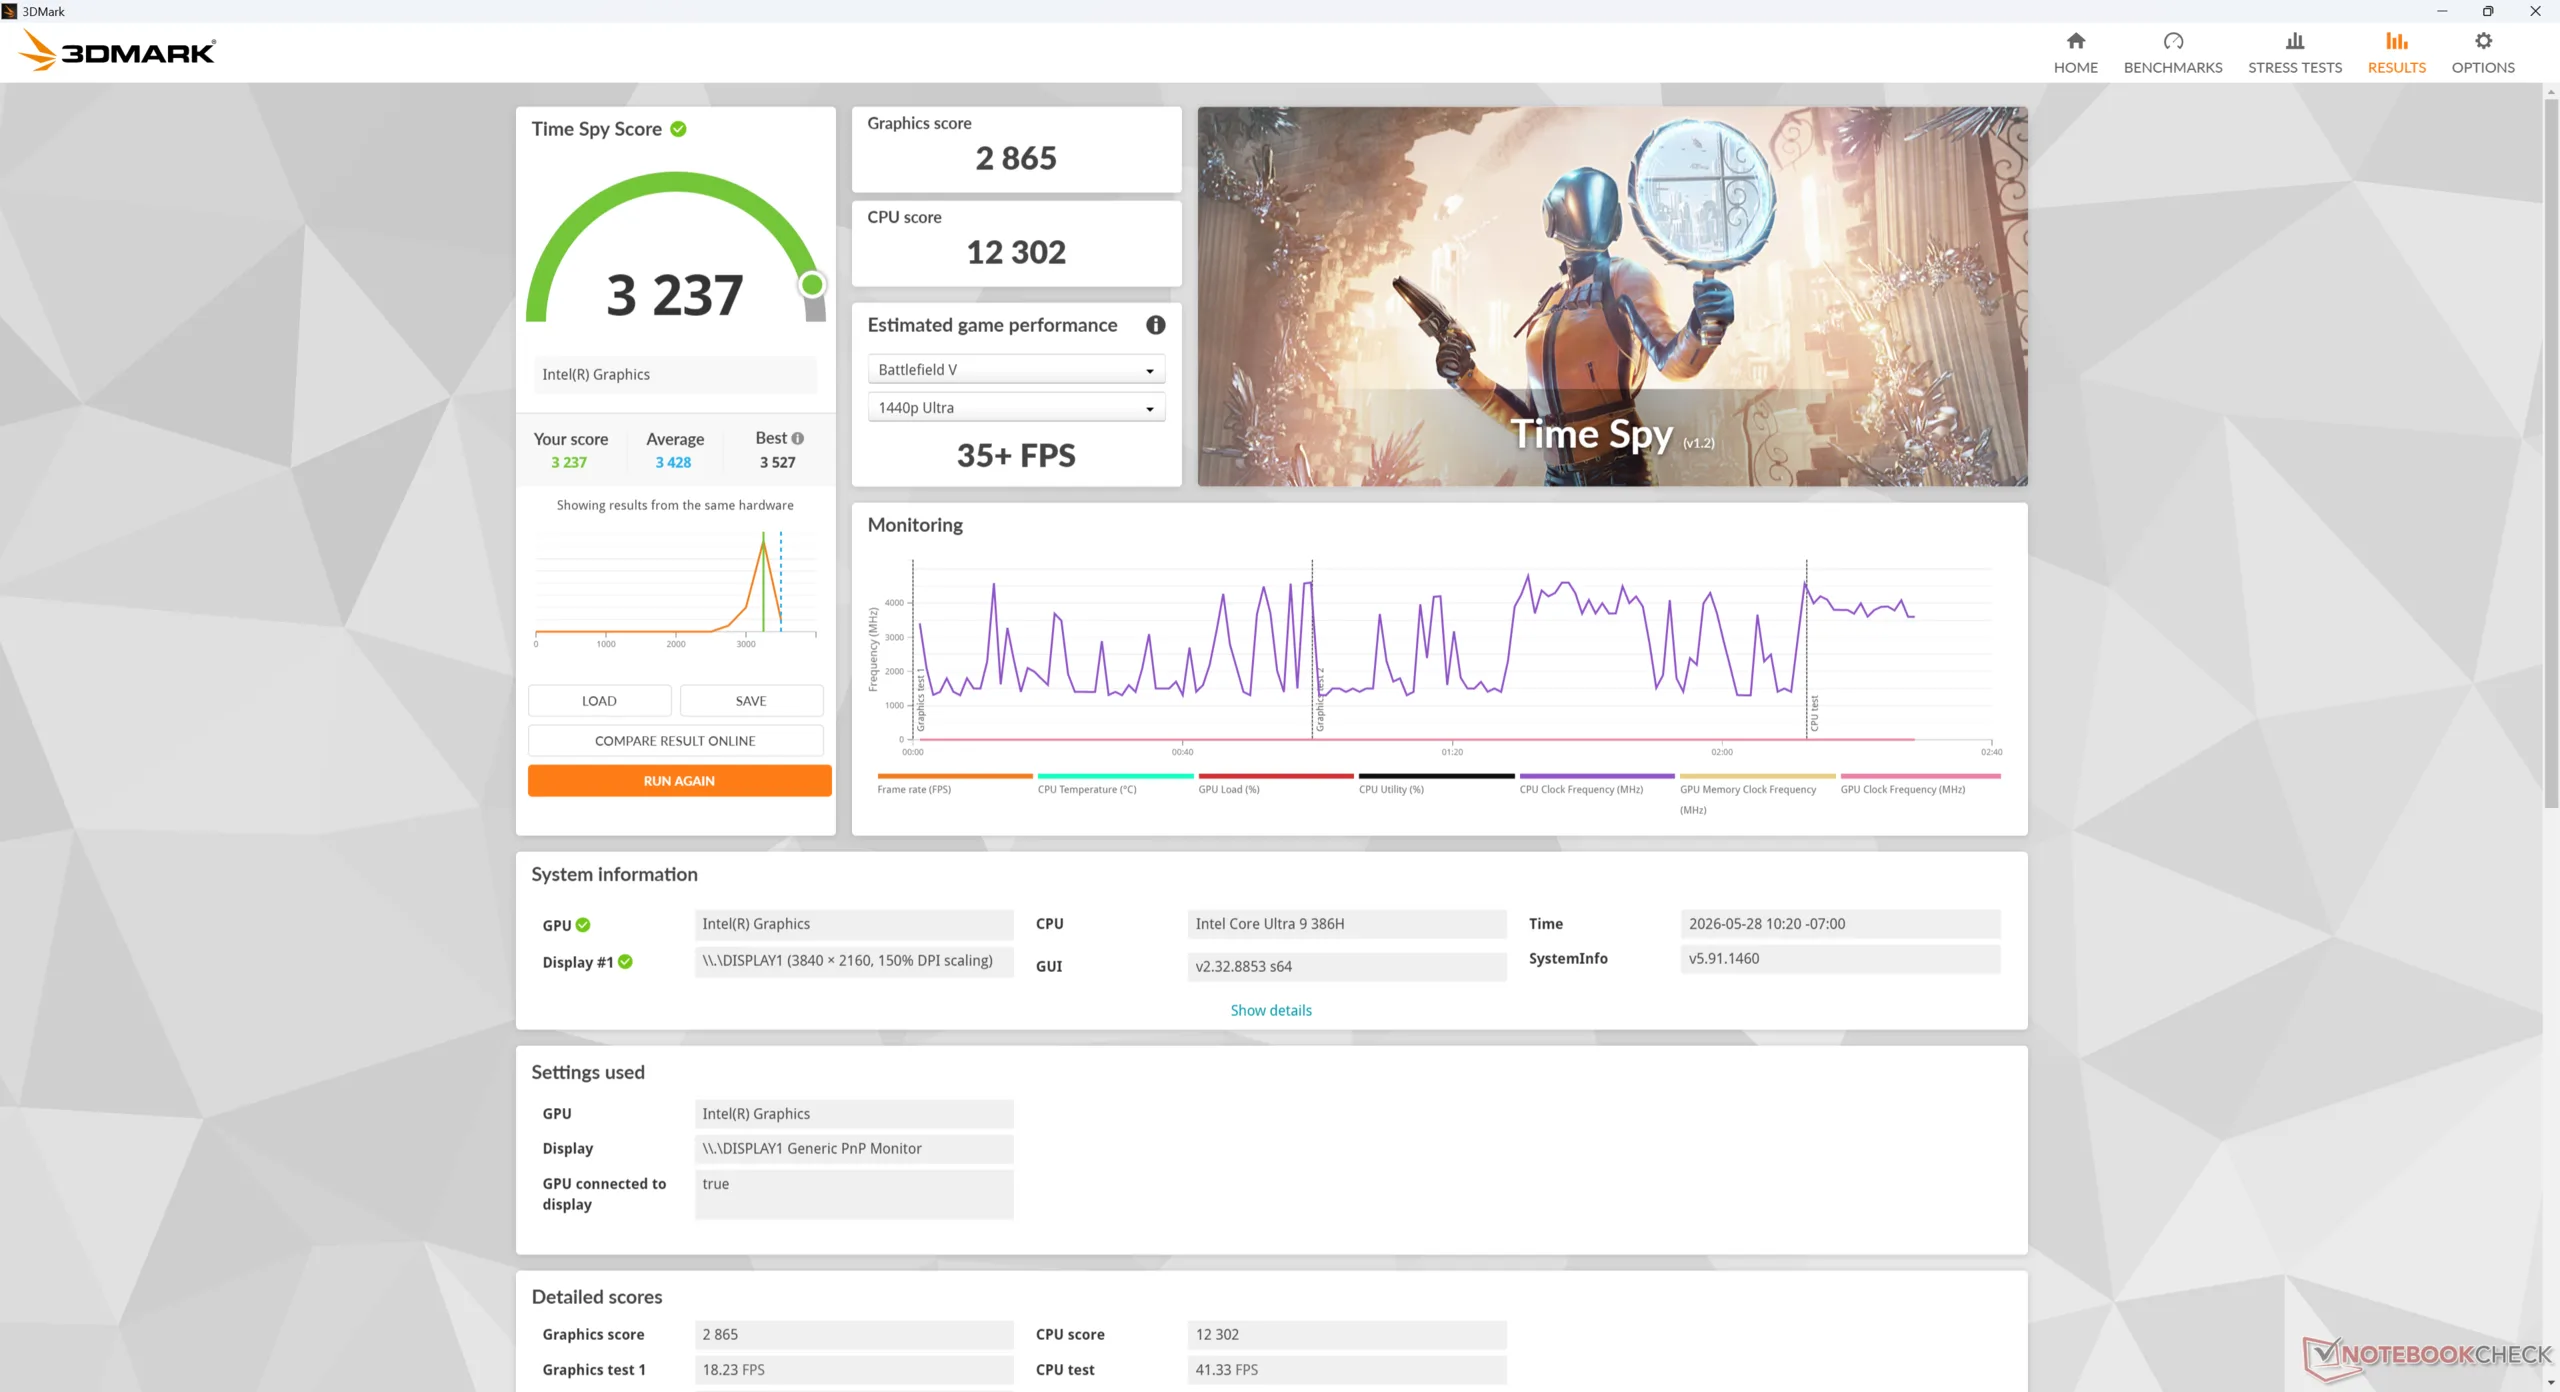
Desempenho da GPU
A placa de vídeo integrada Graphics 4 Xe3 tem um desempenho muito semelhante ao do ano passado Arc 140V do ano passado do ano passado, se não for ligeiramente mais rápida em alguns pontos percentuais, em média. O Core Ultra 9 386H não conta com o processador de elite Arc B390 da série Panther Lake X7 e, portanto, o desempenho gráfico não é um recurso principal do MSI Cubi.
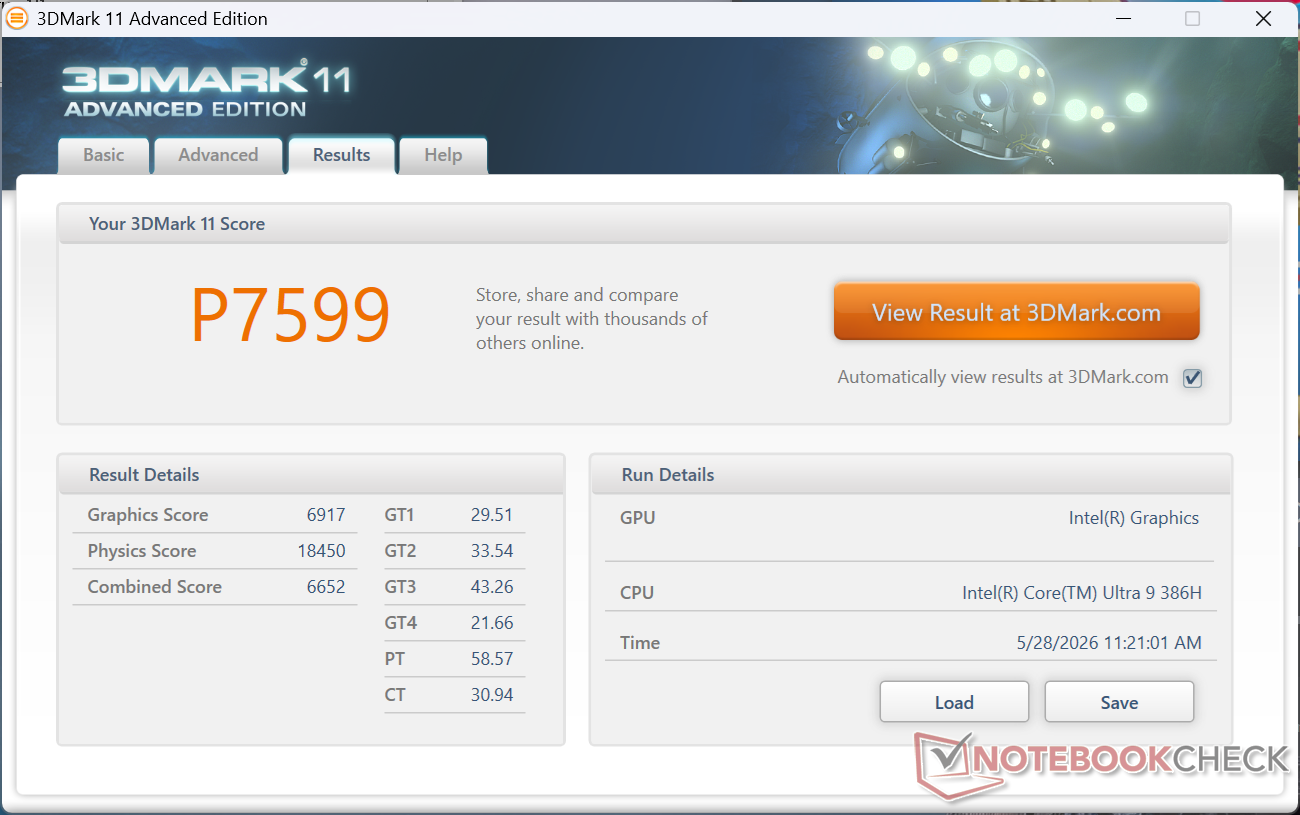
| 3DMark 11 Performance | 7599 pontos | |
| 3DMark Cloud Gate Standard Score | 30367 pontos | |
| 3DMark Fire Strike Score | 6190 pontos | |
| 3DMark Time Spy Score | 3237 pontos | |
Ajuda | ||
* ... menor é melhor
| Performance rating - Percent | |
| Asus NUC 15 Pro+ | |
| GMK EVO-T1 -1! | |
| MSI Cubi NUC AI+ 2MG | |
| MSI Cubi NUC AI+ 3MG | |
| GMK NucBox K16 | |
| MSI Cubi NUC 1M -2! | |
| Geekom A5 Pro -2! | |
| Cyberpunk 2077 - 1920x1080 Ultra Preset (FSR off) | |
| Asus NUC 15 Pro+ | |
| GMK EVO-T1 | |
| MSI Cubi NUC AI+ 3MG | |
| MSI Cubi NUC AI+ 2MG | |
| GMK NucBox K16 | |
| MSI Cubi NUC 1M | |
| Geekom A5 Pro | |
| Baldur's Gate 3 - 1920x1080 Ultra Preset AA:T | |
| MSI Cubi NUC AI+ 2MG | |
| Asus NUC 15 Pro+ | |
| GMK EVO-T1 | |
| MSI Cubi NUC AI+ 3MG | |
| GMK NucBox K16 | |
| GTA V - 1920x1080 Highest AA:4xMSAA + FX AF:16x | |
| MSI Cubi NUC AI+ 2MG | |
| MSI Cubi NUC AI+ 3MG | |
| Asus NUC 15 Pro+ | |
| GMK EVO-T1 | |
| GMK NucBox K16 | |
| MSI Cubi NUC 1M | |
| Geekom A5 Pro | |
| Final Fantasy XV Benchmark - 1920x1080 High Quality | |
| GMK EVO-T1 | |
| Asus NUC 15 Pro+ | |
| MSI Cubi NUC AI+ 2MG | |
| MSI Cubi NUC AI+ 3MG | |
| MSI Cubi NUC 1M | |
| GMK NucBox K16 | |
| Geekom A5 Pro | |
| Strange Brigade - 1920x1080 ultra AA:ultra AF:16 | |
| MSI Cubi NUC AI+ 2MG | |
| Asus NUC 15 Pro+ | |
| MSI Cubi NUC AI+ 3MG | |
| GMK NucBox K16 | |
| MSI Cubi NUC 1M | |
| Dota 2 Reborn - 1920x1080 ultra (3/3) best looking | |
| Asus NUC 15 Pro+ | |
| GMK EVO-T1 | |
| MSI Cubi NUC AI+ 3MG | |
| MSI Cubi NUC AI+ 2MG | |
| MSI Cubi NUC 1M | |
| GMK NucBox K16 | |
| Geekom A5 Pro | |
| X-Plane 11.11 - 1920x1080 high (fps_test=3) | |
| Asus NUC 15 Pro+ | |
| GMK EVO-T1 | |
| MSI Cubi NUC AI+ 2MG | |
| GMK NucBox K16 | |
| MSI Cubi NUC AI+ 3MG | |
| Geekom A5 Pro | |
| F1 24 | |
| 1920x1080 Low Preset AA:T AF:16x | |
| GMK EVO-T1 | |
| Asus NUC 15 Pro+ | |
| MSI Cubi NUC AI+ 2MG | |
| MSI Cubi NUC AI+ 3MG | |
| Média Intel Graphics 4 Xe3 Panther Lake iGPU (55.6 - 69.3, n=7) | |
| GMK NucBox K16 | |
| Geekom A5 Pro | |
| 1920x1080 Medium Preset AA:T AF:16x | |
| GMK EVO-T1 | |
| Asus NUC 15 Pro+ | |
| MSI Cubi NUC AI+ 3MG | |
| Média Intel Graphics 4 Xe3 Panther Lake iGPU (52.7 - 64.3, n=7) | |
| GMK NucBox K16 | |
| Geekom A5 Pro | |
| 1920x1080 High Preset AA:T AF:16x | |
| GMK EVO-T1 | |
| Asus NUC 15 Pro+ | |
| MSI Cubi NUC AI+ 2MG | |
| MSI Cubi NUC AI+ 3MG | |
| Média Intel Graphics 4 Xe3 Panther Lake iGPU (40.8 - 48, n=7) | |
| GMK NucBox K16 | |
| Geekom A5 Pro | |
| 1920x1080 Ultra High Preset AA:T AF:16x | |
| GMK EVO-T1 | |
| Asus NUC 15 Pro+ | |
| MSI Cubi NUC AI+ 2MG | |
| Média Intel Graphics 4 Xe3 Panther Lake iGPU (13.2 - 15.1, n=7) | |
| MSI Cubi NUC AI+ 3MG | |
| GMK NucBox K16 | |
Gráfico de ultra FPS do Cyberpunk 2077
| baixo | média | alto | ultra | |
|---|---|---|---|---|
| GTA V (2015) | 157.9 | 149.5 | 51.1 | 20.4 |
| Dota 2 Reborn (2015) | 104.1 | 80.3 | 81.2 | 79.9 |
| Final Fantasy XV Benchmark (2018) | 64.3 | 34.6 | 25.1 | |
| X-Plane 11.11 (2018) | 41.7 | 33.2 | 28.6 | |
| Strange Brigade (2018) | 172.6 | 68 | 56.9 | 48.5 |
| Baldur's Gate 3 (2023) | 31.6 | 26.3 | 23.1 | 22.8 |
| Cyberpunk 2077 (2023) | 37.1 | 28.4 | 24.5 | 21.1 |
| F1 24 (2024) | 66.9 | 61.5 | 45.8 | 14.2 |
Emissões
Ruído do sistema
A ventoinha interna está sempre ativa, independentemente da carga na tela, muito semelhante ao que observamos nos modelos Cubi mais antigos. Ela é silenciosa o suficiente, sem grandes problemas de estrangulamento, para ser imperceptível em um ambiente de escritório ou de varejo, mas pode atingir a faixa de 40 dB(A) ao executar cargas mais exigentes por períodos prolongados, chegando a ser tão barulhenta quanto alguns notebooks para jogos.
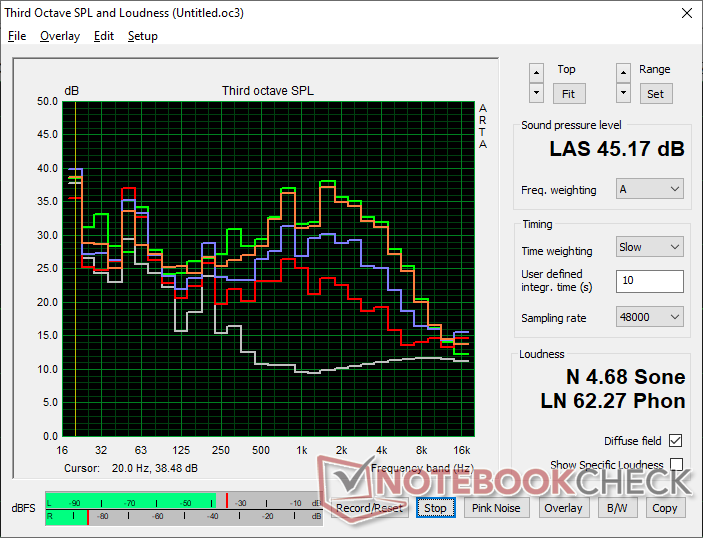
Barulho
| Ocioso |
| 28 / 33.2 / 33.5 dB |
| Carga |
| 39.1 / 45.2 dB |
 | ||
30 dB silencioso 40 dB(A) audível 50 dB(A) ruidosamente alto |
||
min: | ||
| MSI Cubi NUC AI+ 3MG Ultra 9 386H, Intel Graphics 4 Xe3 PTL | GMK NucBox K16 R7 7735HS, Radeon 680M | GMK EVO-T1 Ultra 9 285H, Arc 140T | Geekom A5 Pro R5 7530U, Vega 7 | Asus NUC 15 Pro+ Ultra 9 285H, Arc 140T | MSI Cubi NUC AI+ 2MG Core Ultra 7 258V, Arc 140V | MSI Cubi NUC 1M Core 7 150U, Iris Xe G7 96EUs | |
|---|---|---|---|---|---|---|---|
| Noise | -6% | -20% | 15% | -3% | -2% | 6% | |
| desligado / ambiente * (dB) | 23.6 | 23.6 -0% | 24.7 -5% | 25 -6% | 25.3 -7% | 24.8 -5% | 23.5 -0% |
| Idle Minimum * (dB) | 28 | 30.9 -10% | 38.7 -38% | 26.6 5% | 25.4 9% | 28 -0% | 29.9 -7% |
| Idle Average * (dB) | 33.2 | 31.6 5% | 38.8 -17% | 26.6 20% | 25.5 23% | 36.1 -9% | 29.9 10% |
| Idle Maximum * (dB) | 33.5 | 31.6 6% | 38.9 -16% | 26.7 20% | 37.3 -11% | 36.1 -8% | 32 4% |
| Load Average * (dB) | 39.1 | 45.3 -16% | 51.6 -32% | 33.5 14% | 44.4 -14% | 38.9 1% | 33.5 14% |
| Cyberpunk 2077 ultra * (dB) | 44.4 | 49.2 -11% | 52 -17% | 31.2 30% | 46.2 -4% | 37 17% | 39.1 12% |
| Load Maximum * (dB) | 45.2 | 51.7 -14% | 51.6 -14% | 33.8 25% | 52.7 -17% | 49.2 -9% | 40.5 10% |
| Witcher 3 ultra * (dB) | 38.7 | 31.2 | 47.7 |
* ... menor é melhor
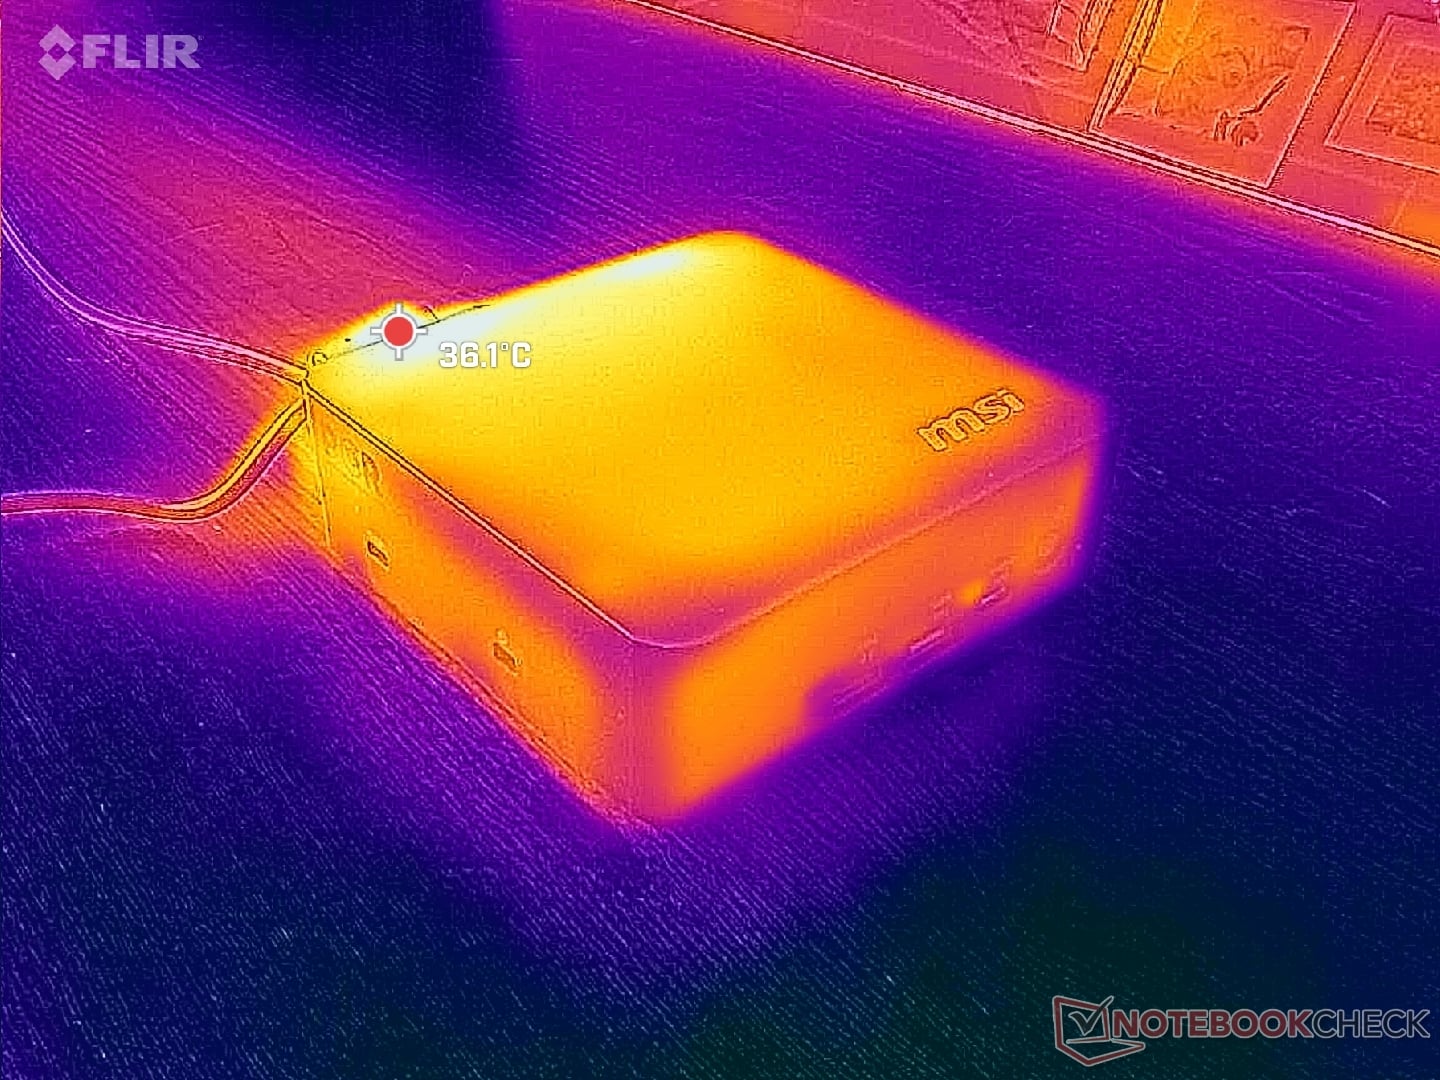
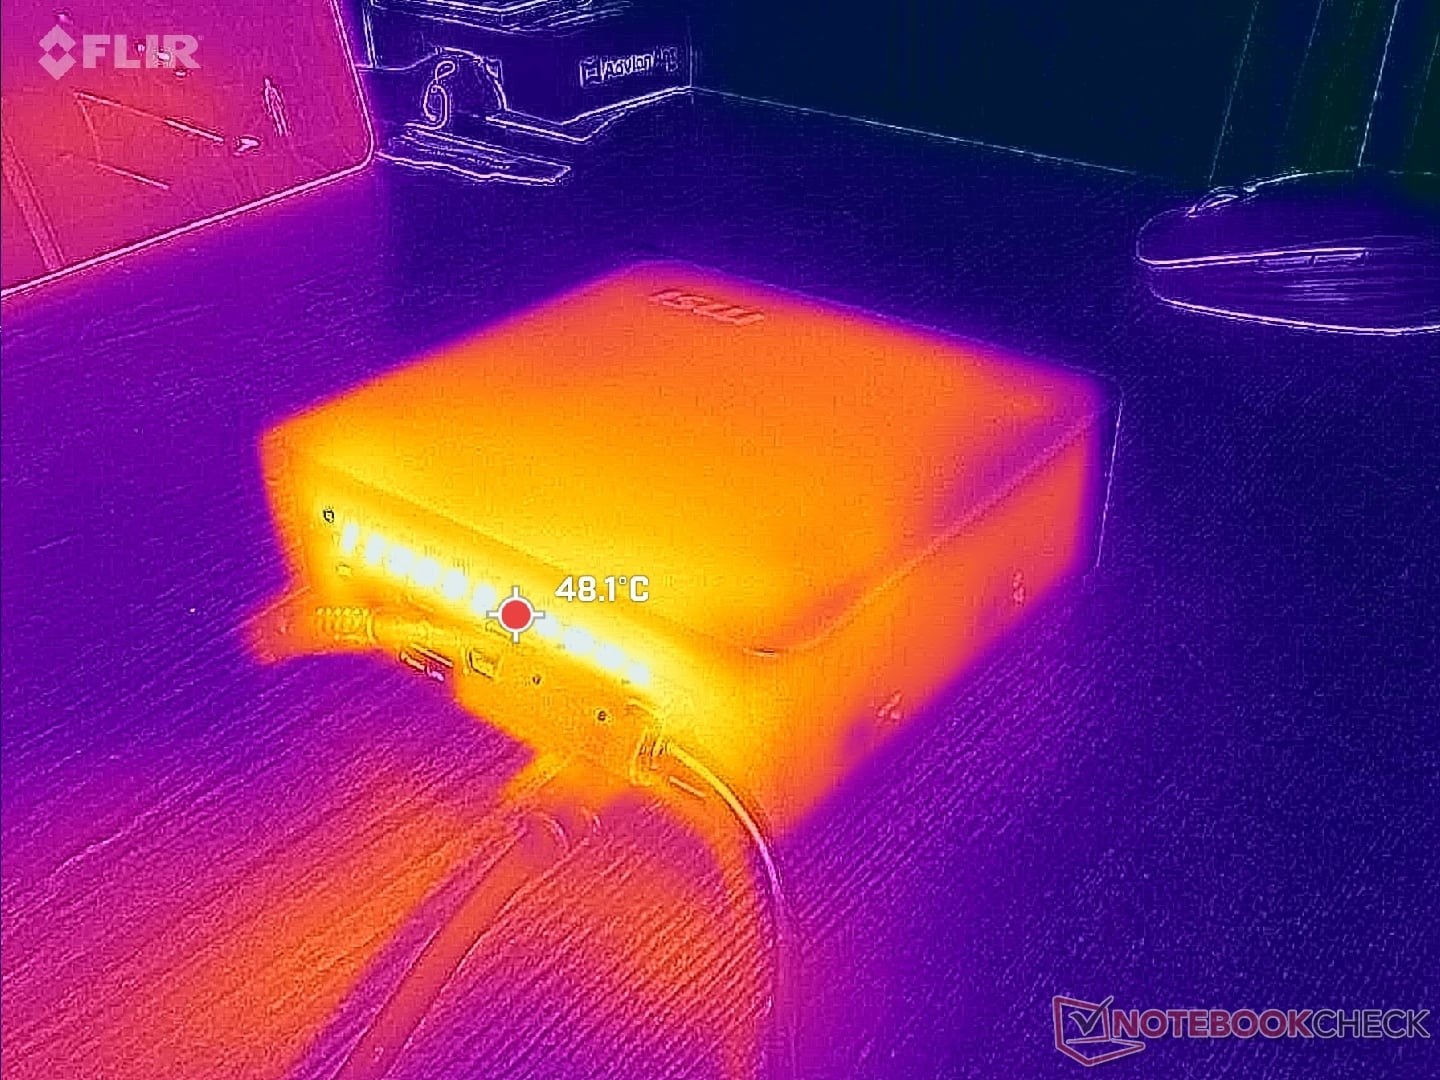
Temperatura
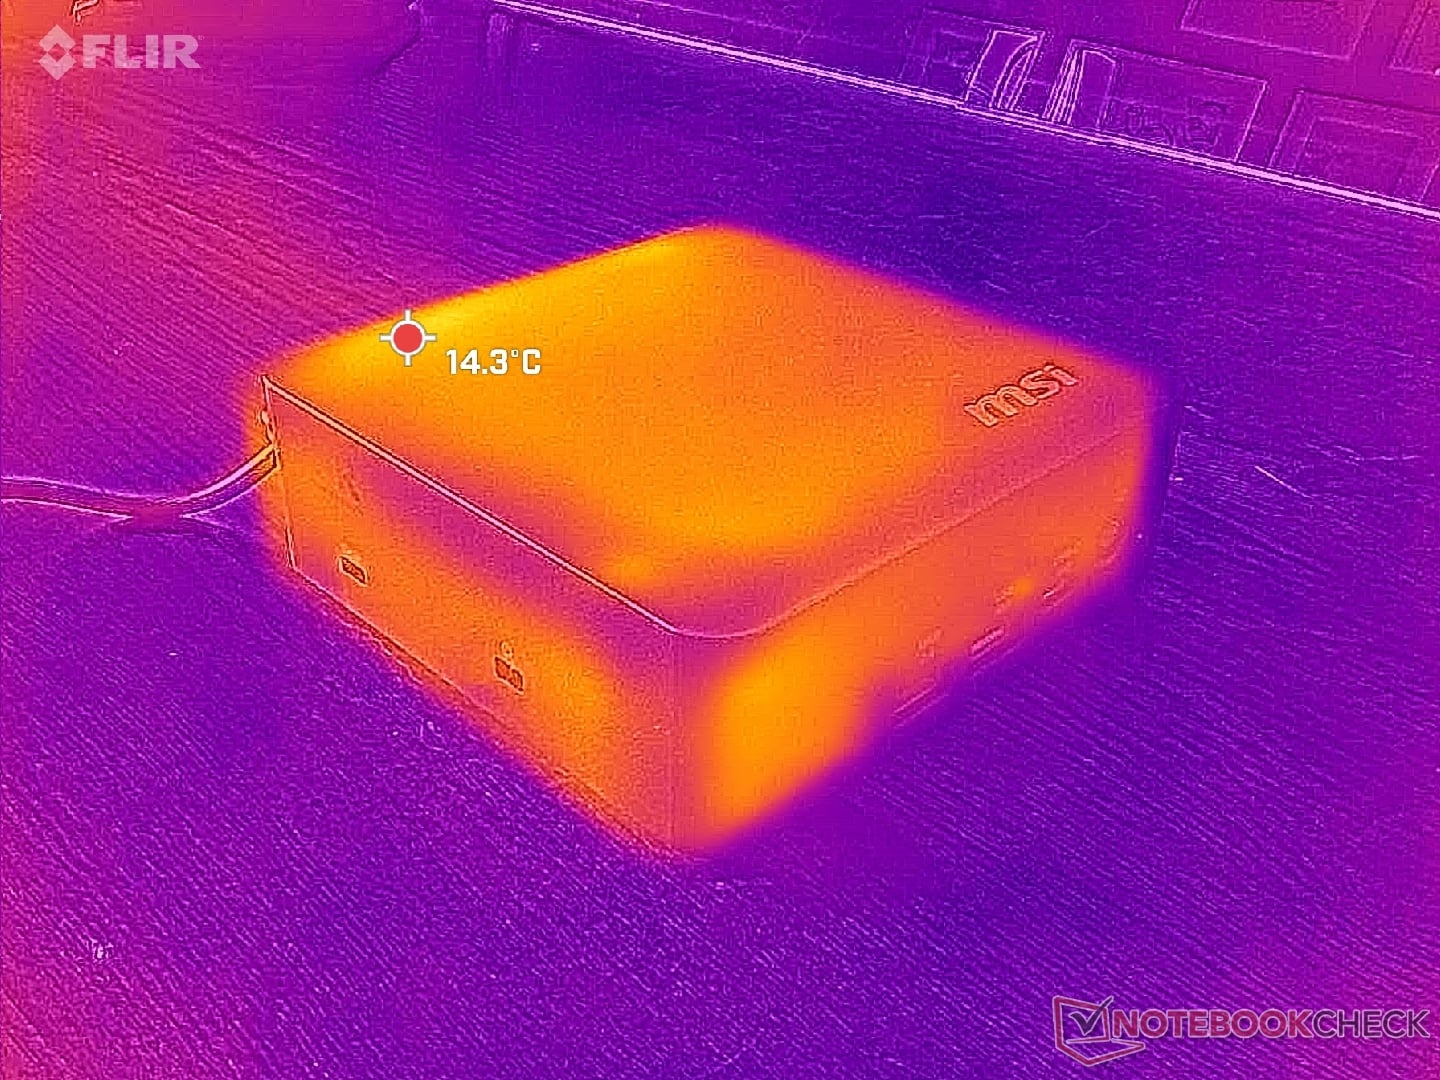
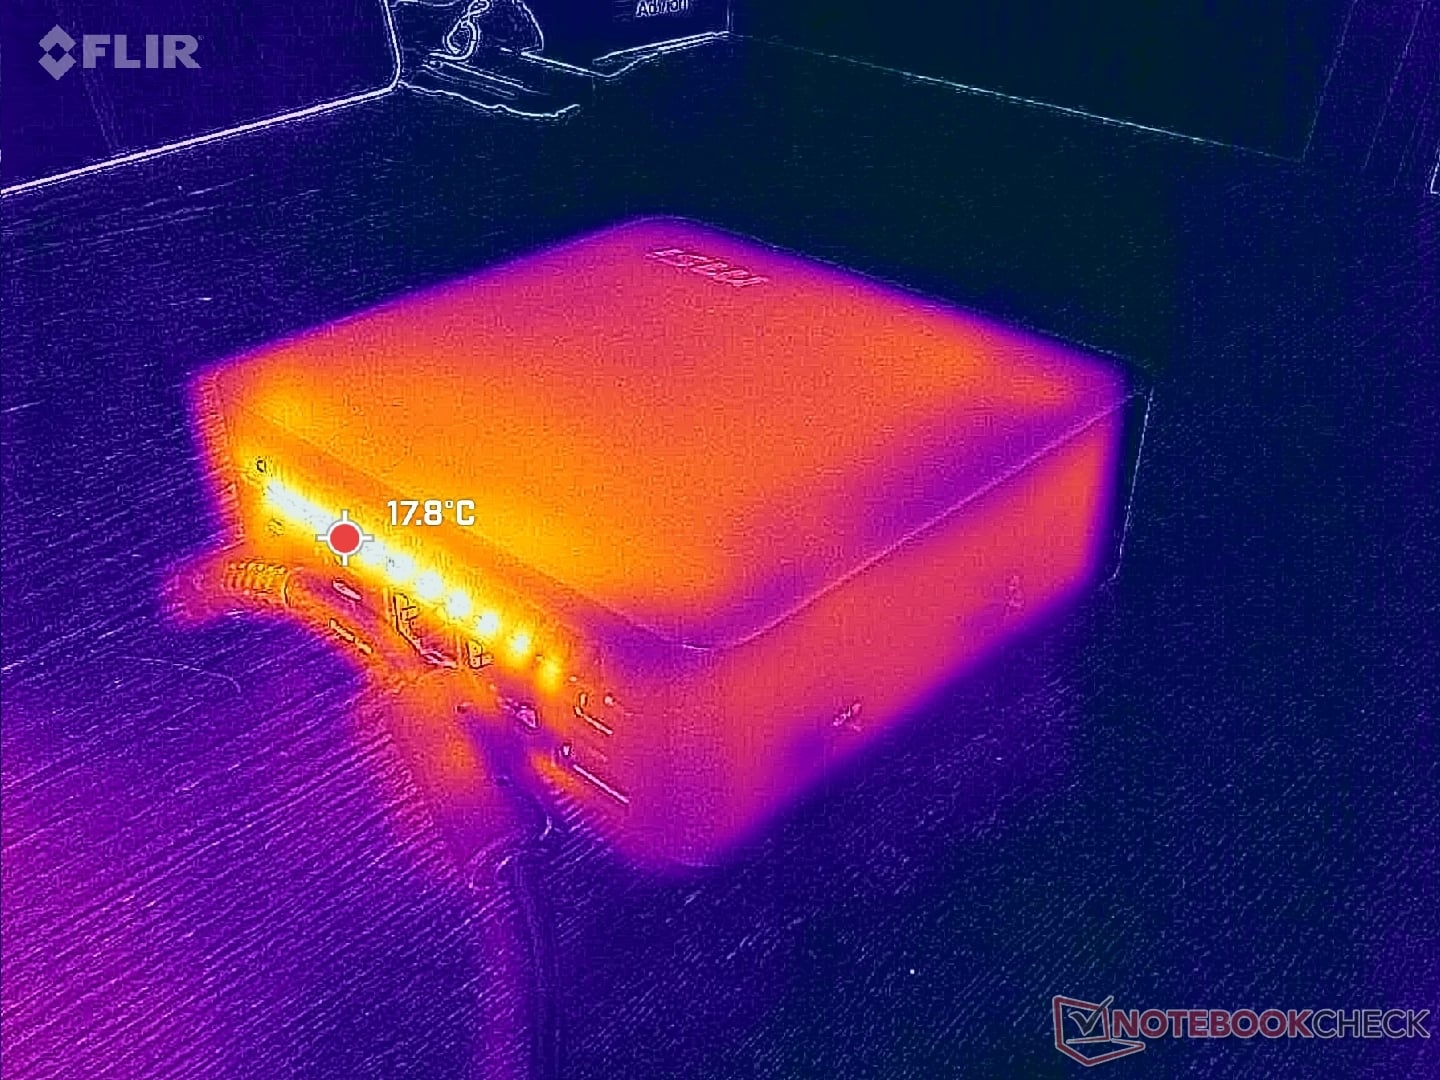
As temperaturas da superfície são relativamente baixas, em parte devido ao chassi de plástico e à CPU eficiente. A parte traseira fica um pouco mais quente do que a parte frontal, como era de se esperar.
As grades de ventilação são reduzidas ao mínimo, ao contrário de algumas alternativas, como a Série GMK EVO.
(+) A temperatura máxima no lado superior é 36.2 °C / 97 F, em comparação com a média de 35.4 °C / 96 F , variando de 20.6 a 69.5 °C para a classe Mini PC.
(+) A parte inferior aquece até um máximo de 34.6 °C / 94 F, em comparação com a média de 36.1 °C / 97 F
(+) Em uso inativo, a temperatura média para o lado superior é 22.8 °C / 73 F, em comparação com a média do dispositivo de 32.1 °C / ### class_avg_f### F.
| MSI Cubi NUC AI+ 3MG Ultra 9 386H, Intel Graphics 4 Xe3 PTL | GMK NucBox K16 R7 7735HS, Radeon 680M | GMK EVO-T1 Ultra 9 285H, Arc 140T | Geekom A5 Pro R5 7530U, Vega 7 | Asus NUC 15 Pro+ Ultra 9 285H, Arc 140T | MSI Cubi NUC AI+ 2MG Core Ultra 7 258V, Arc 140V | |
|---|---|---|---|---|---|---|
| Heat | 8% | -26% | -8% | -25% | 3% | |
| Maximum Upper Side * (°C) | 36.2 | 28.4 22% | 36.4 -1% | 36.7 -1% | 42.2 -17% | 30.8 15% |
| Maximum Bottom * (°C) | 34.6 | 29.4 15% | 48.5 -40% | 40.5 -17% | 31.3 10% | 26.4 24% |
| Idle Upper Side * (°C) | 23.2 | 23.4 -1% | 29.6 -28% | 23.1 -0% | 34.9 -50% | 26.4 -14% |
| Idle Bottom * (°C) | 22.4 | 23.6 -5% | 30 -34% | 25.1 -12% | 32.2 -44% | 25.4 -13% |
* ... menor é melhor
Teste de estresse
A CPU aumentaria para 3 GHz, 61 W e 92 C ao iniciar o estresse do Prime95. Após 20 segundos, no entanto, ela cairia para apenas 2,1 GHz e 30 W a fim de manter uma temperatura central de 88 C. O potencial limitado do Turbo Boost corrobora nosso consumo de energia e as observações do CineBench R15.
A temperatura do núcleo se estabilizaria em 80 °C ao executar o Cyberpunk 2077, em comparação com apenas 63 °C no NUC 2MG do ano passado.
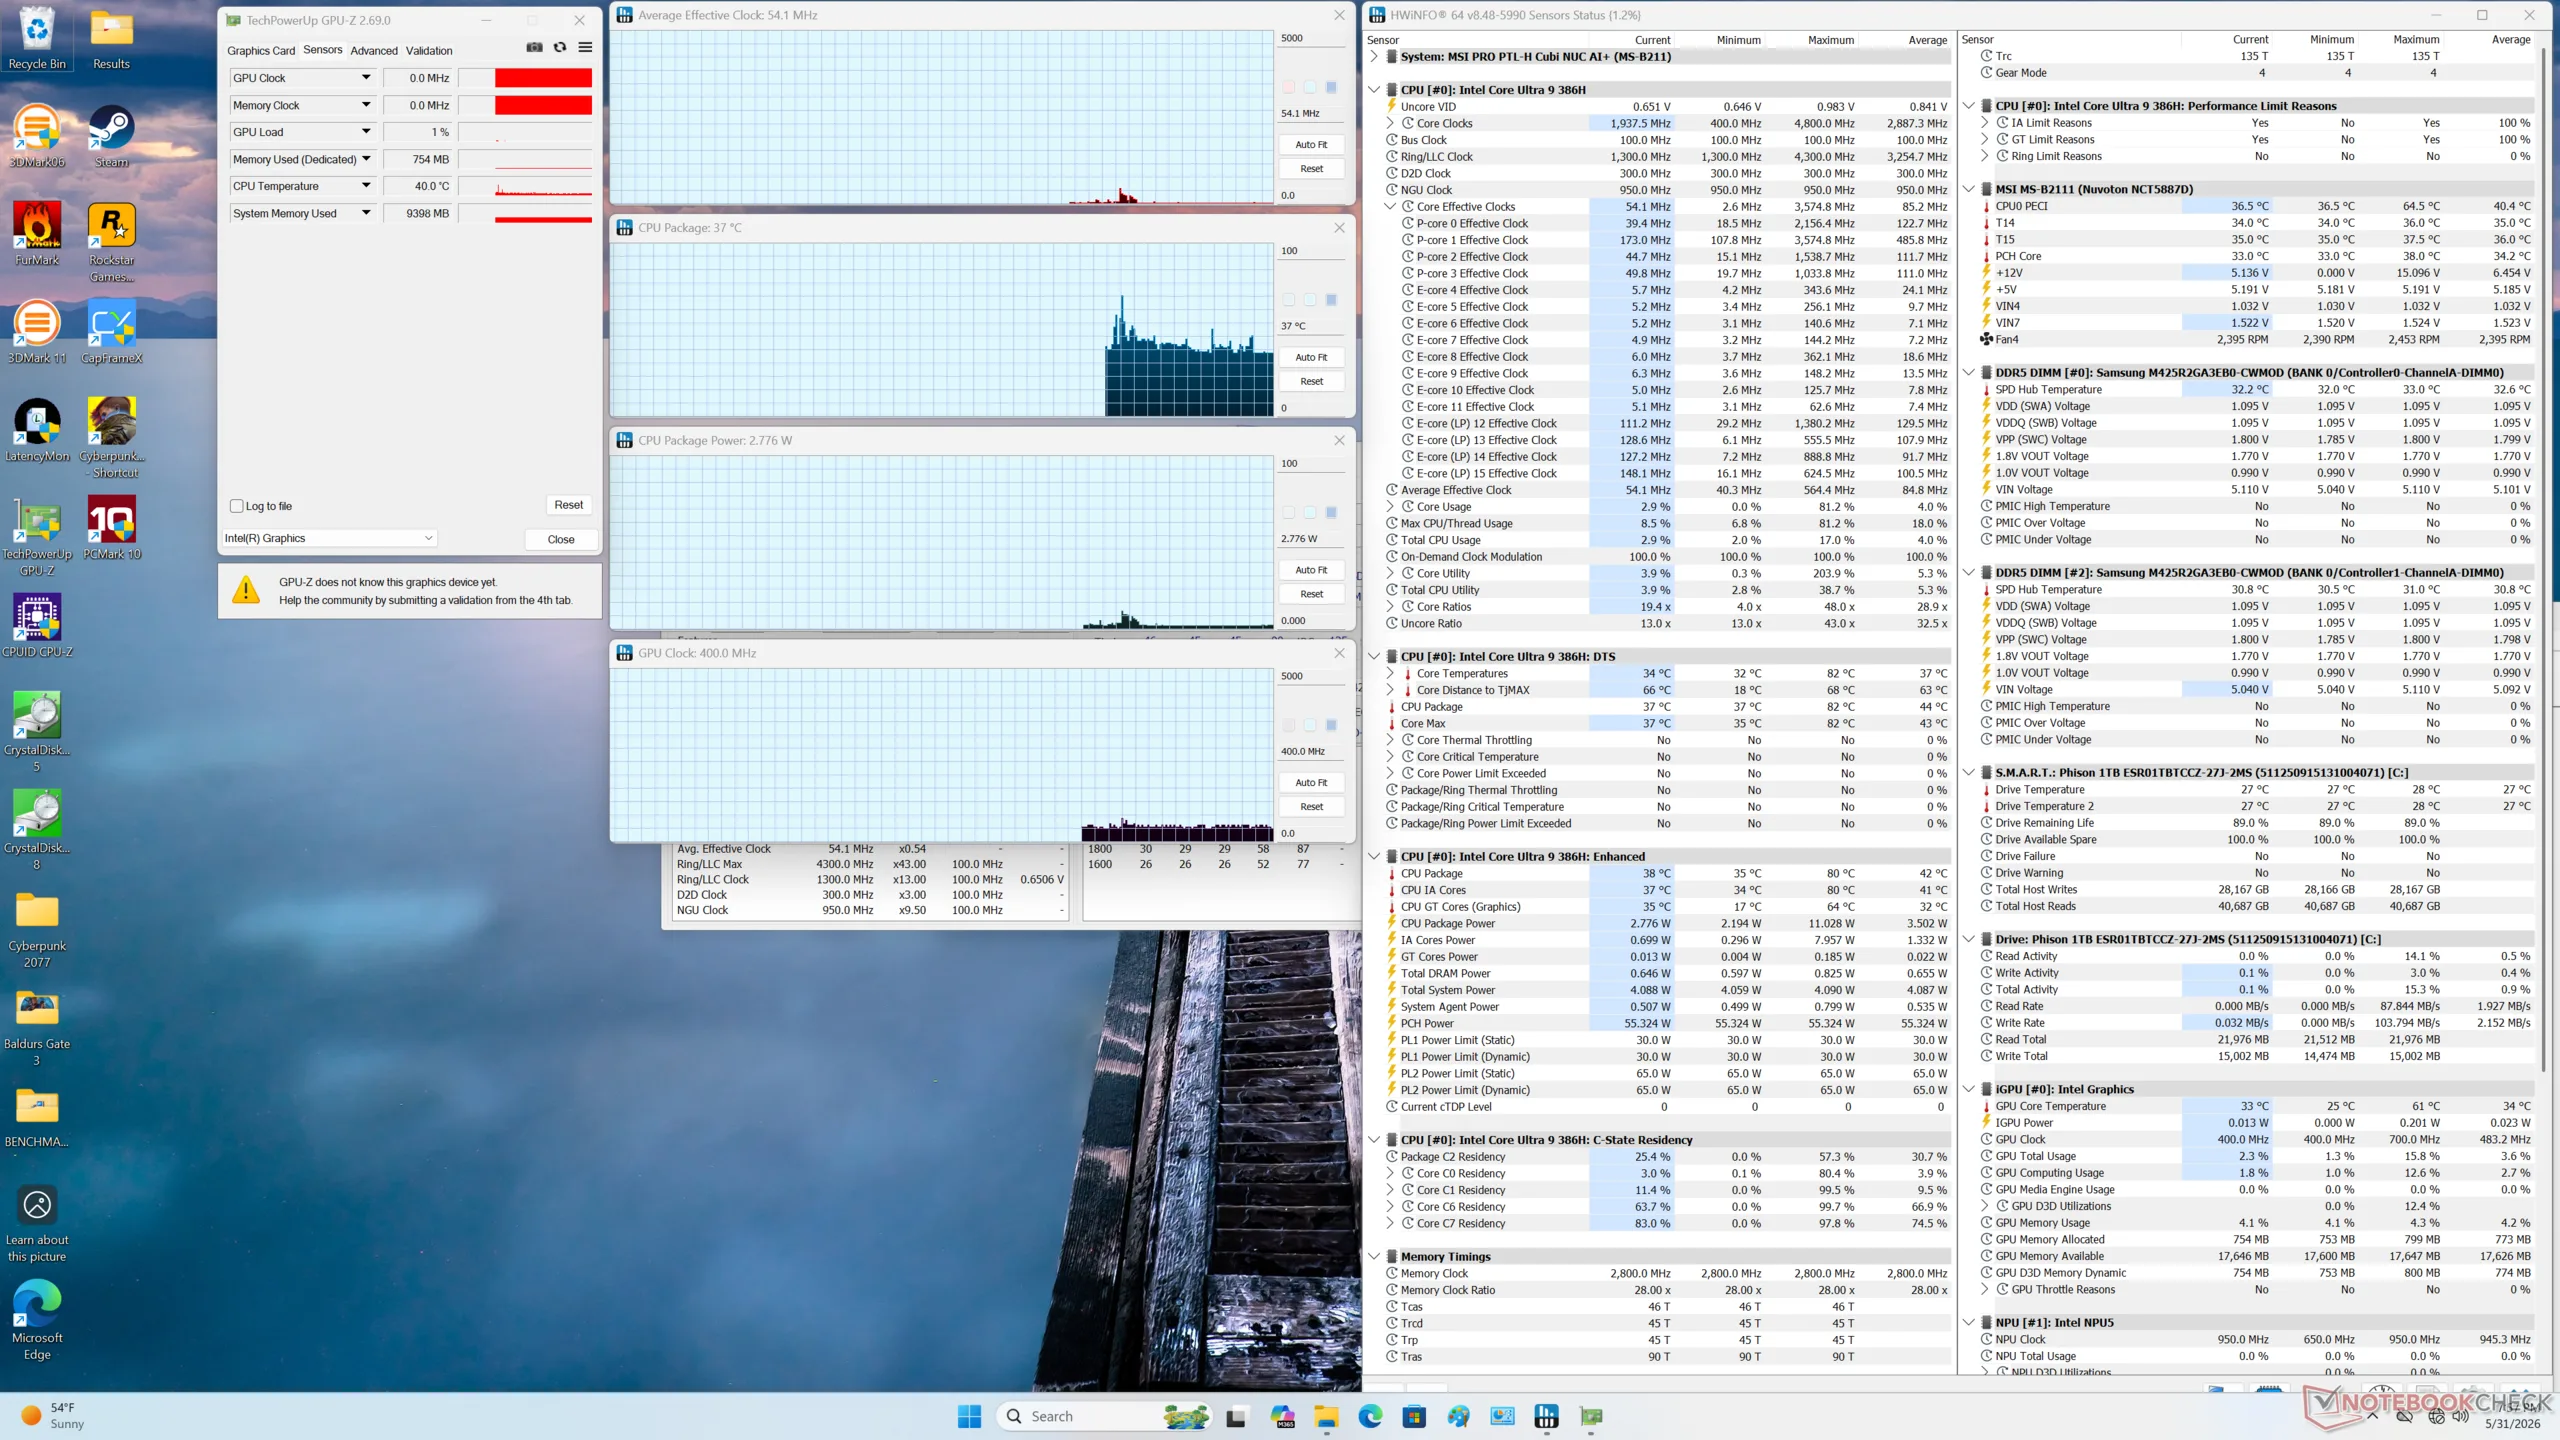
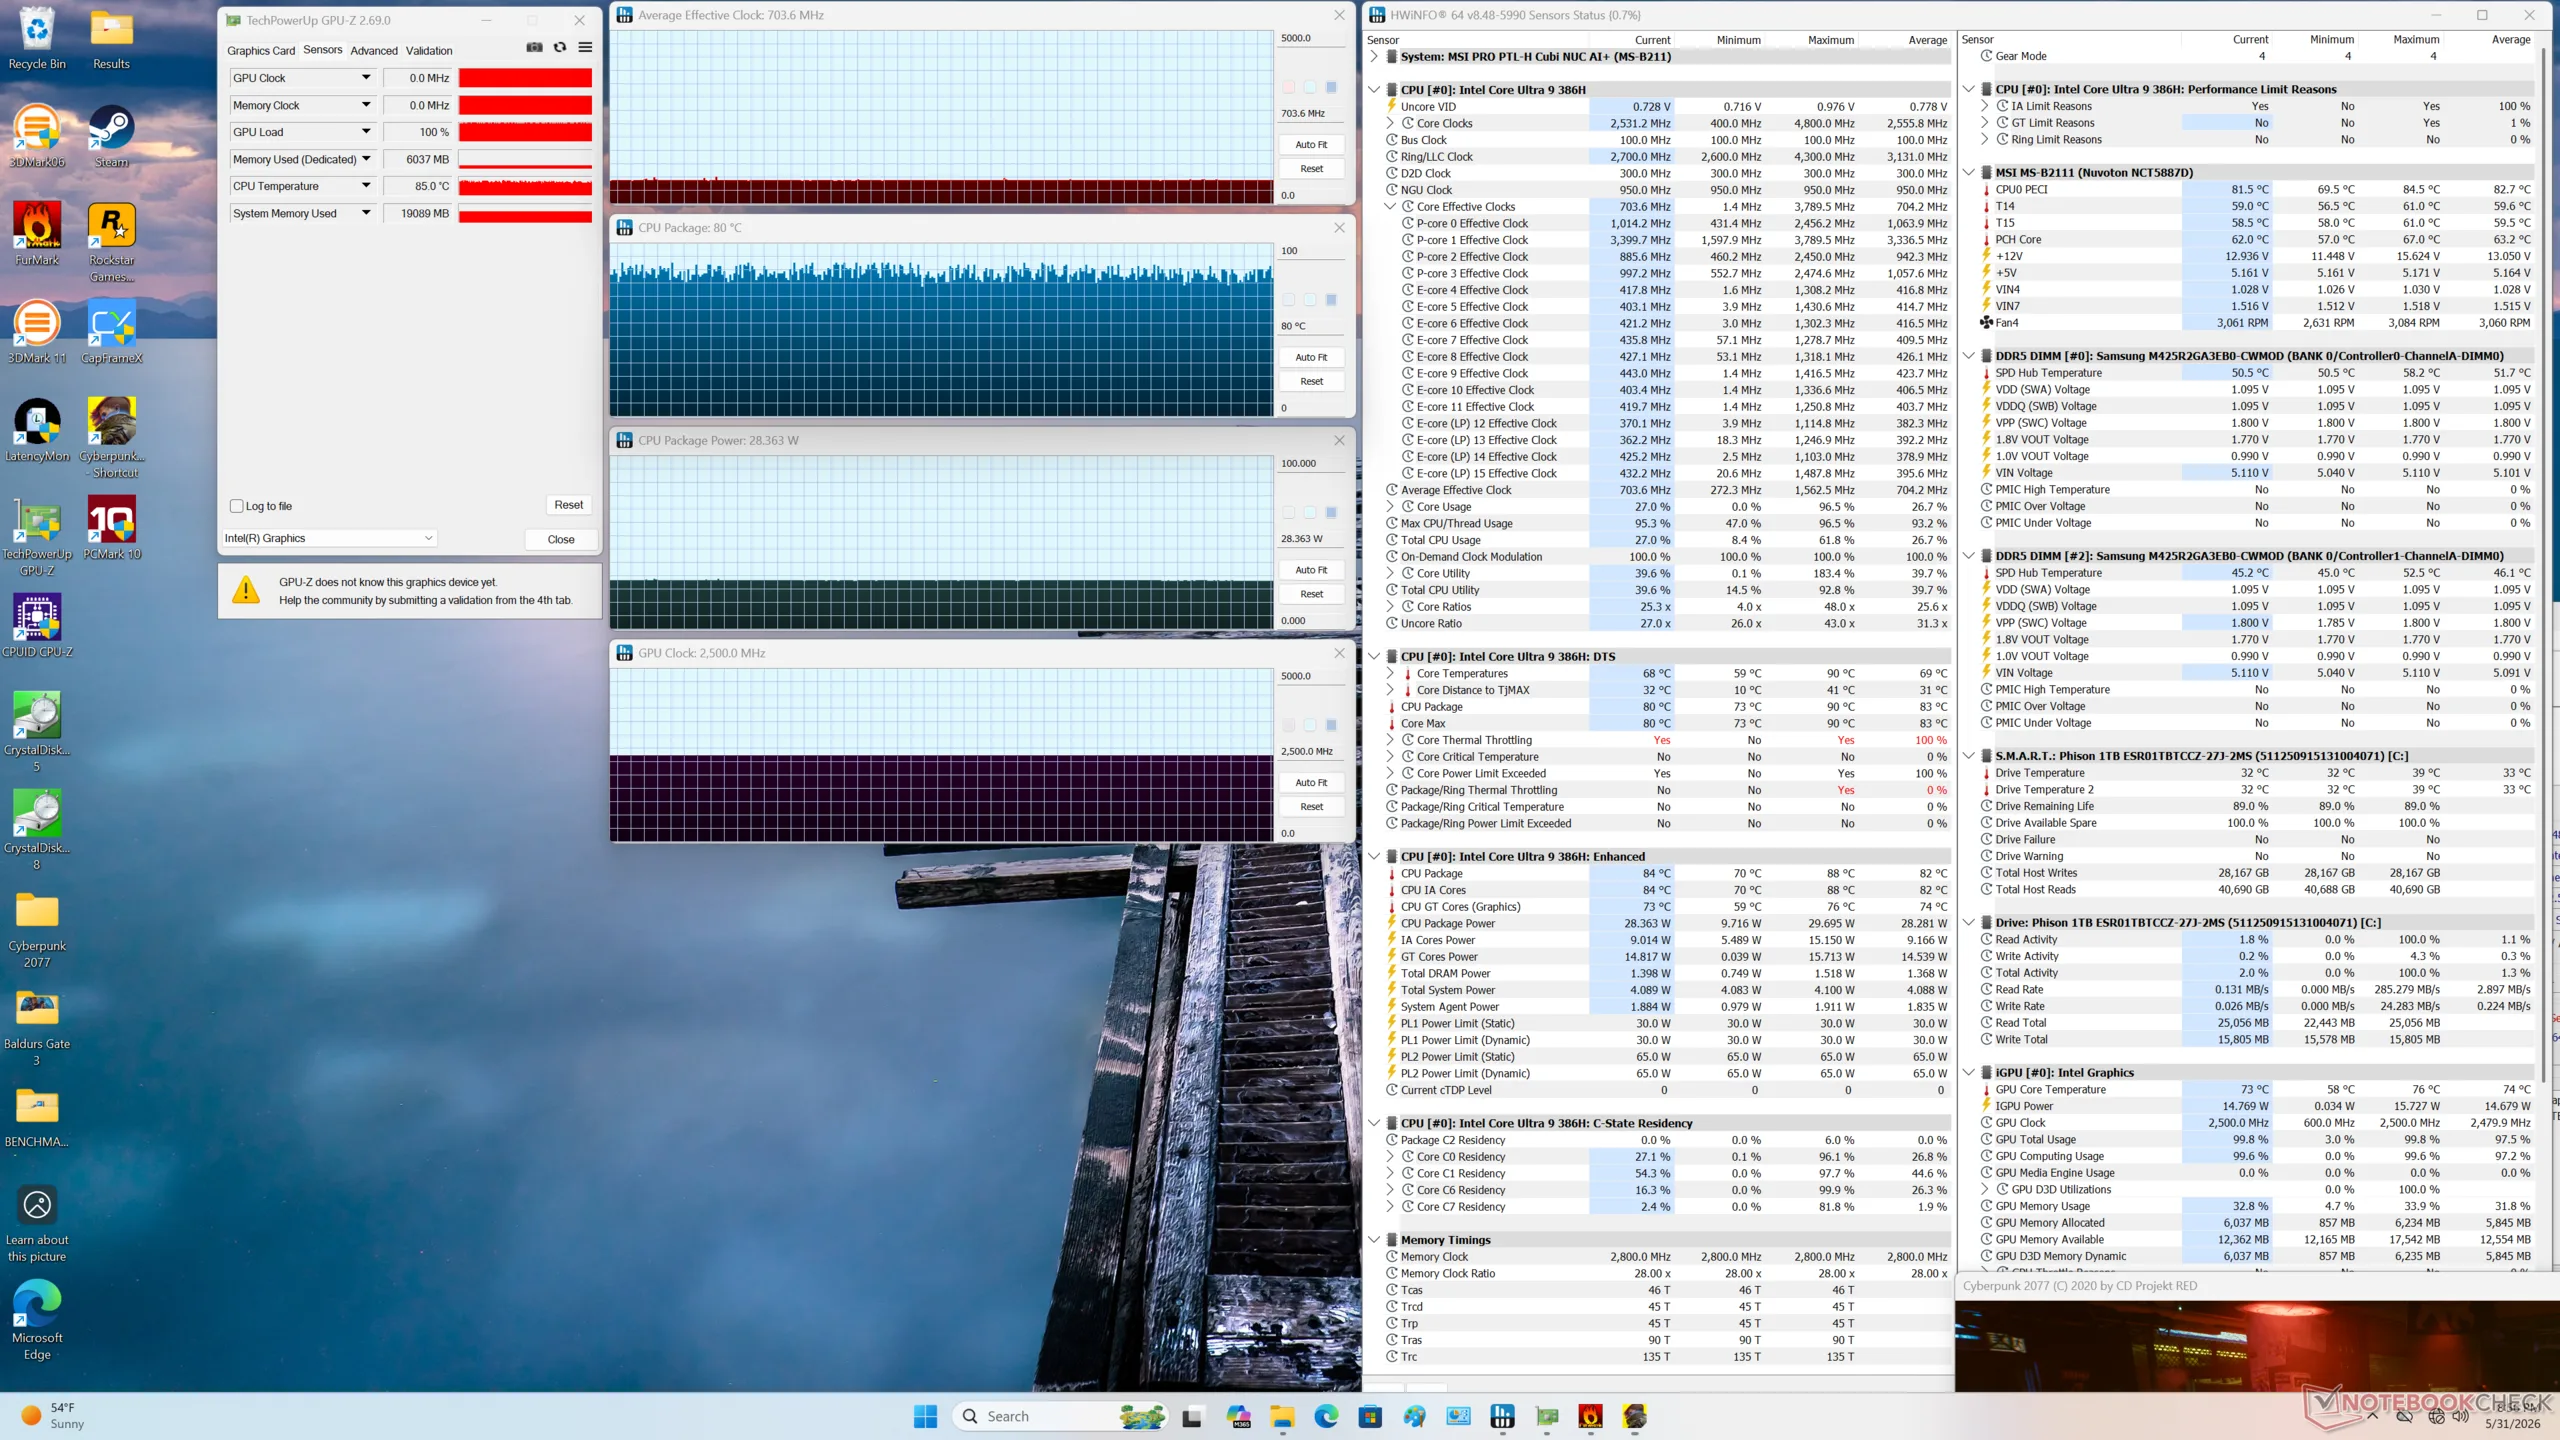
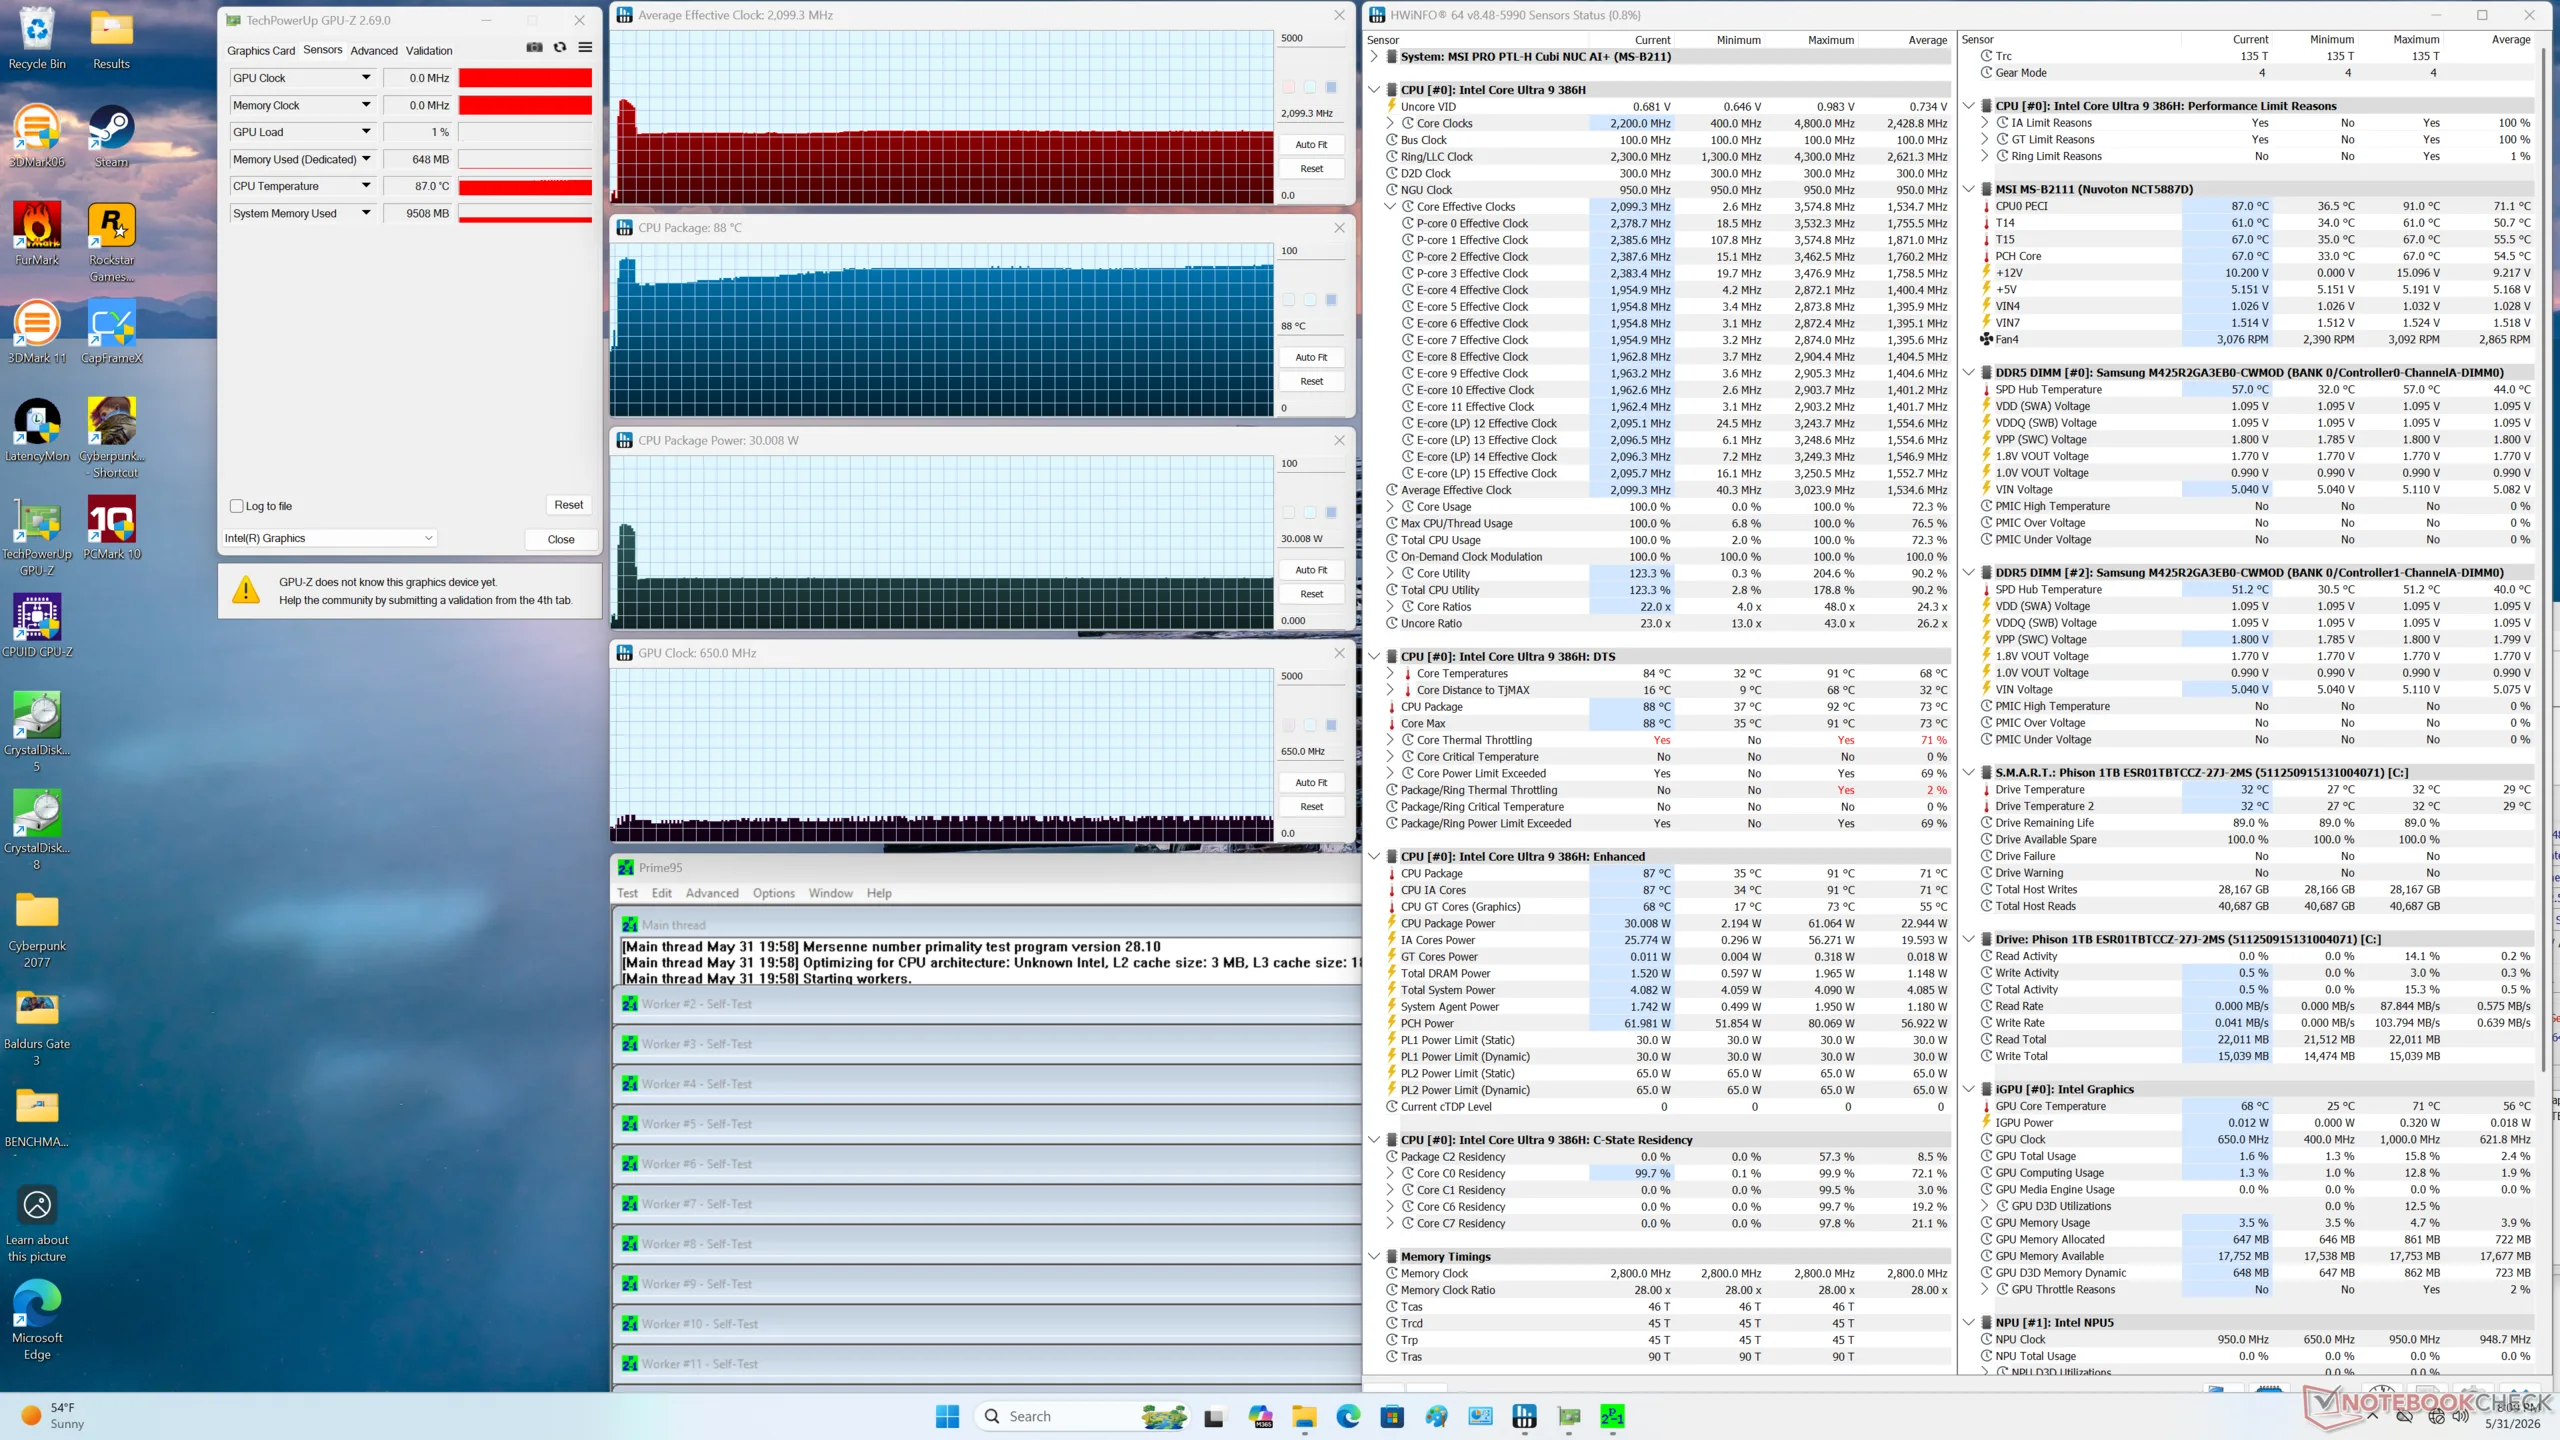
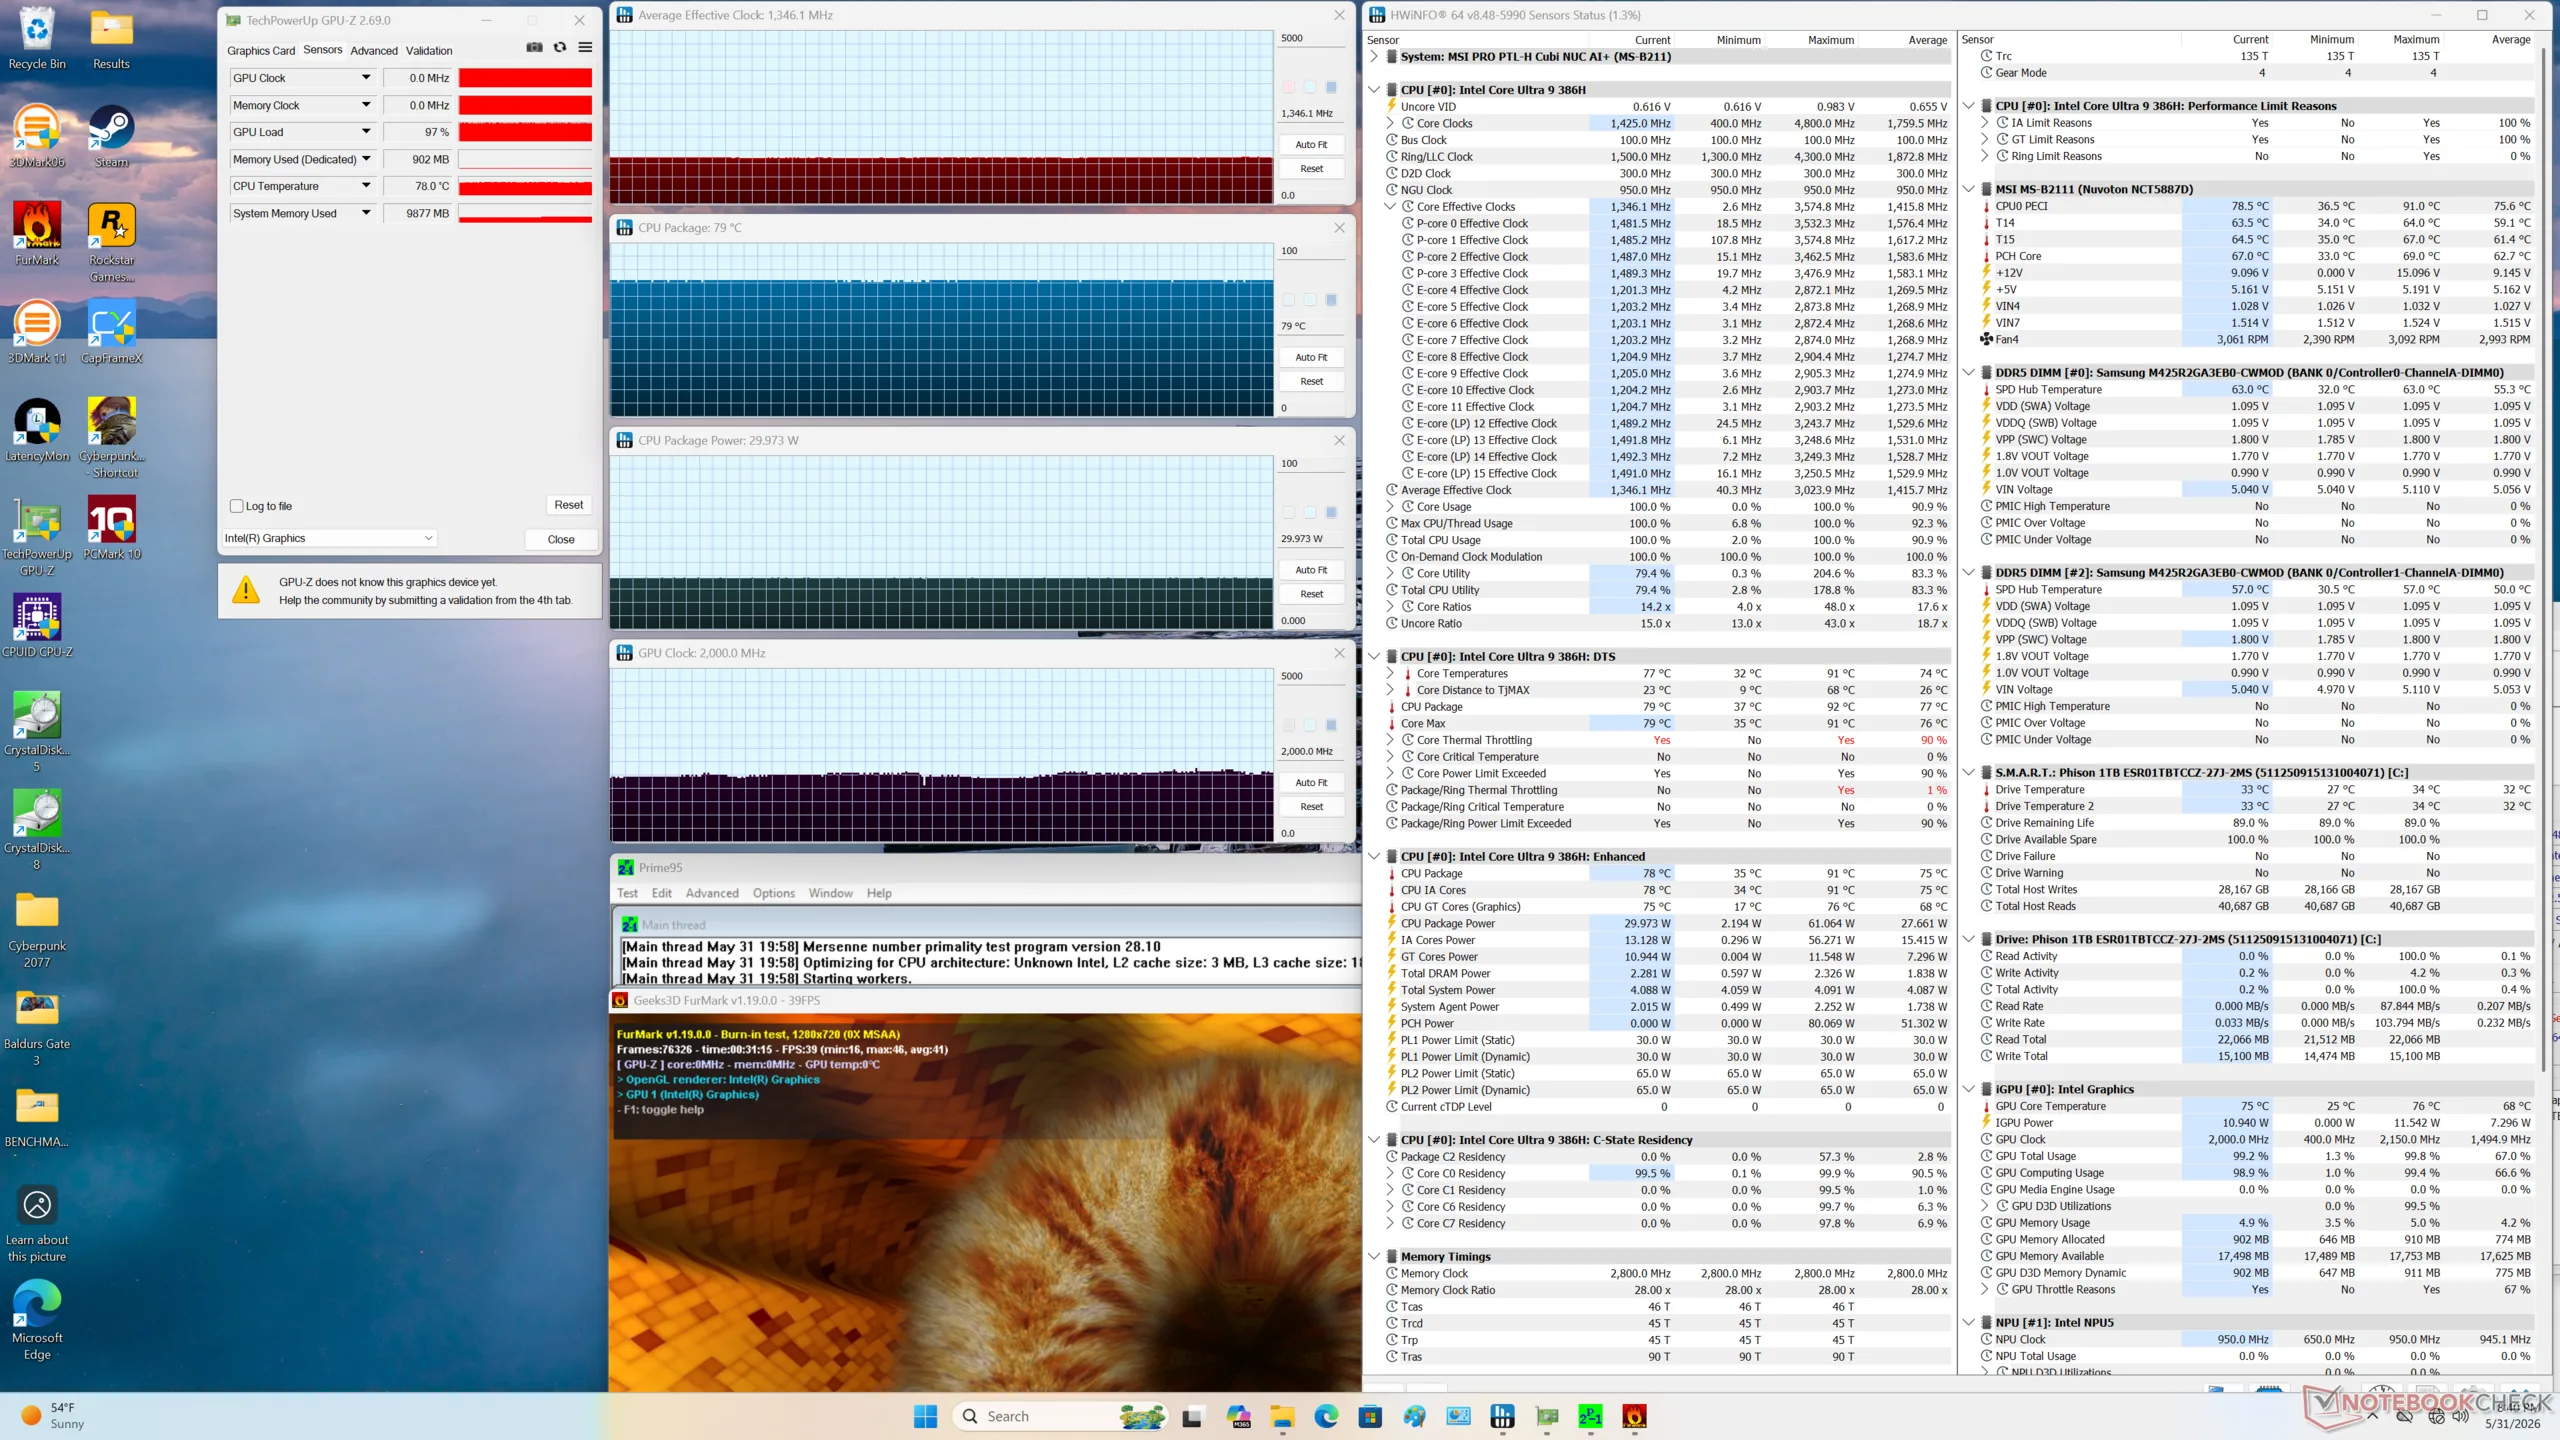
| Clock médio da CPU (GHz) | Clock da GPU (MHz) | Temperatura média da CPU (°C) | |
| Sistema ocioso | -- | -- | 37 |
| Estresse do Prime95 | 2.1 | -- | 88 |
| Prime95 + FurMark Stress | 1.4 | 2000 | 79 |
| Cyberpunk 2077 Stress | 0.7 | 2500 | ~80 |
Gerenciamento de energia
Consumo de energia
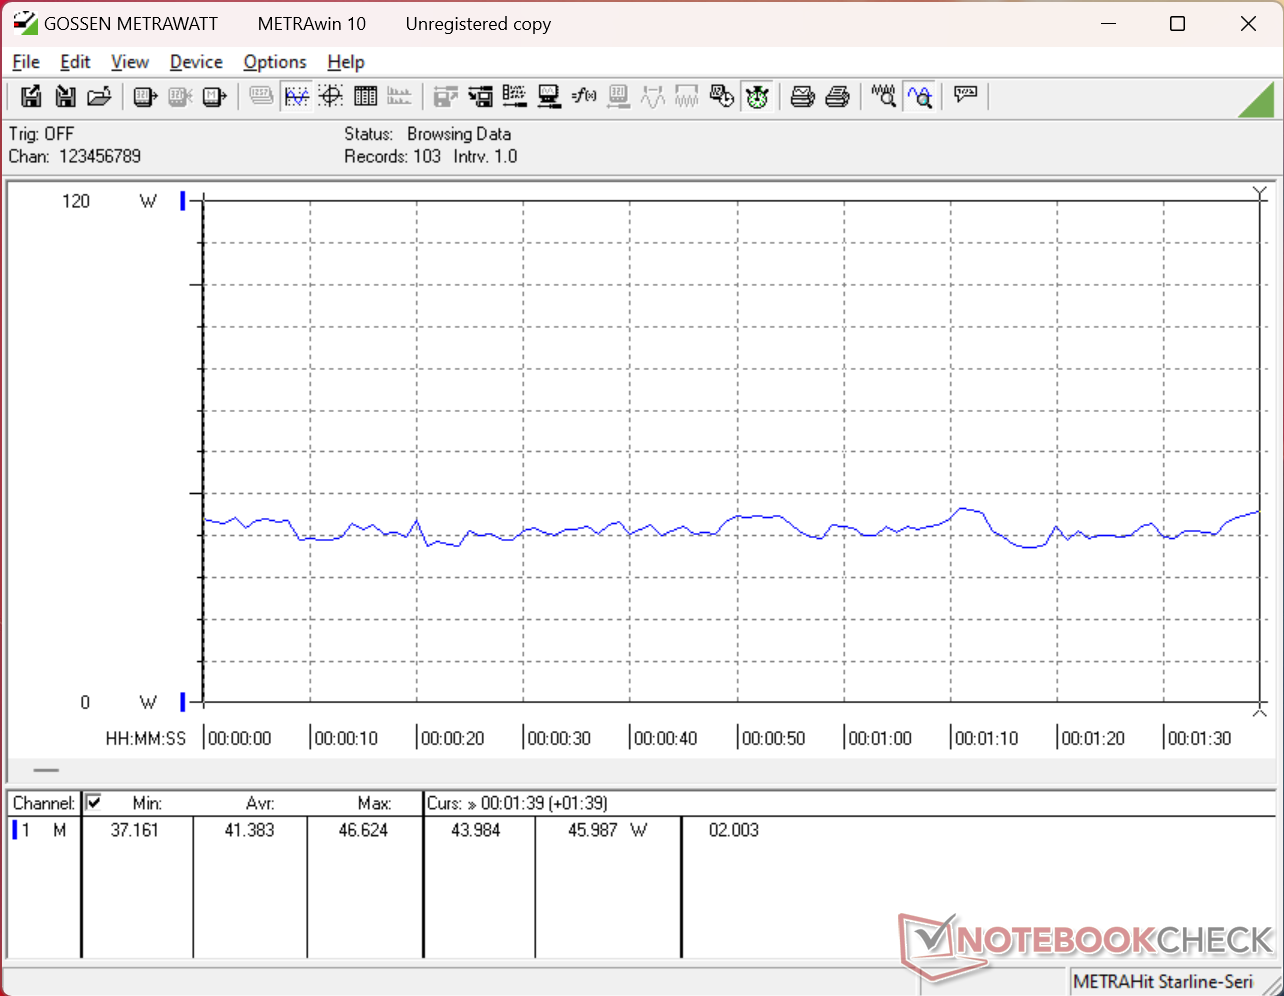
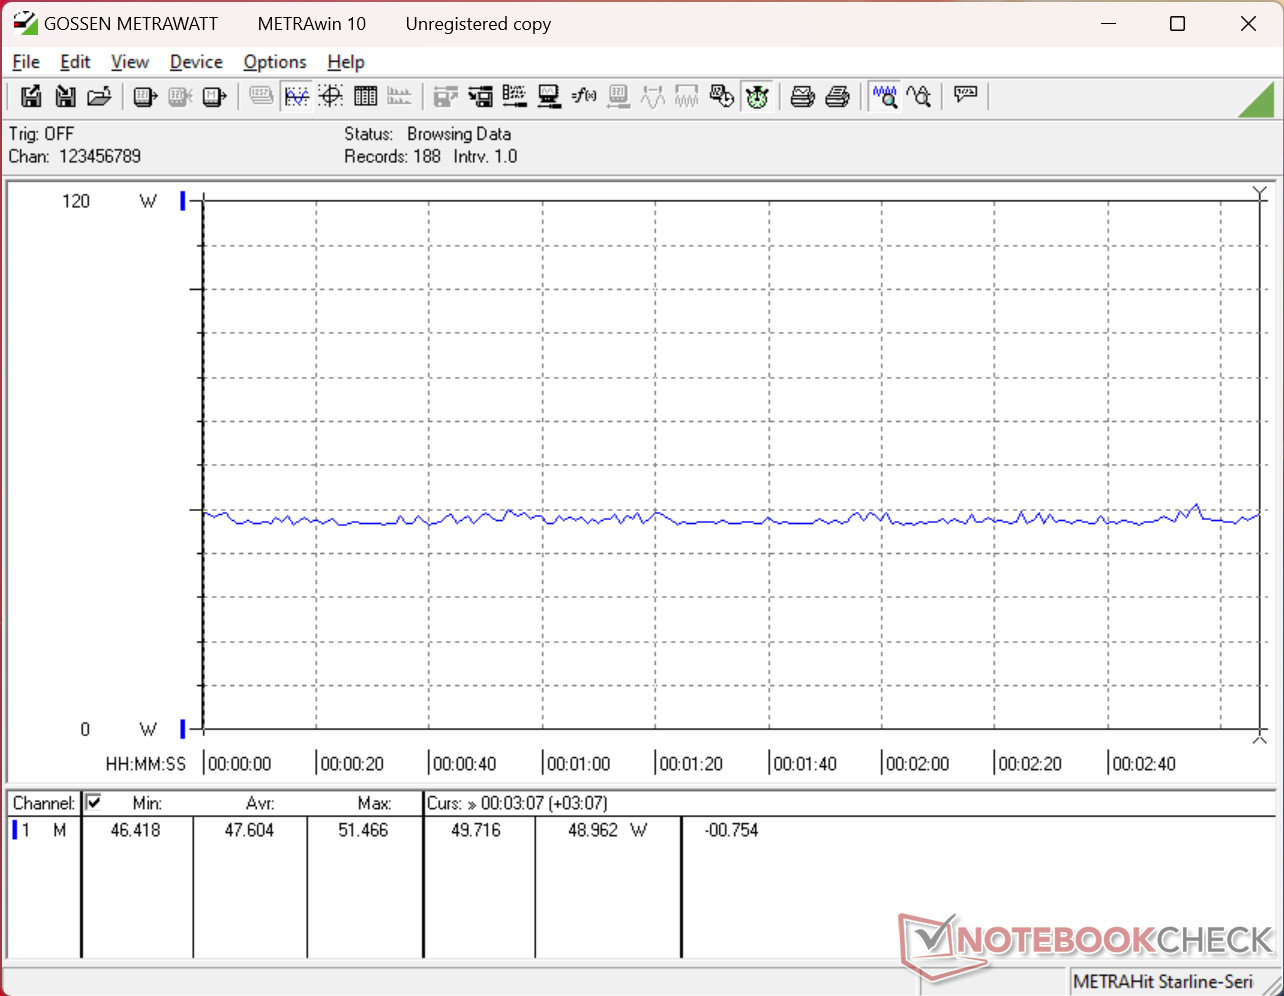
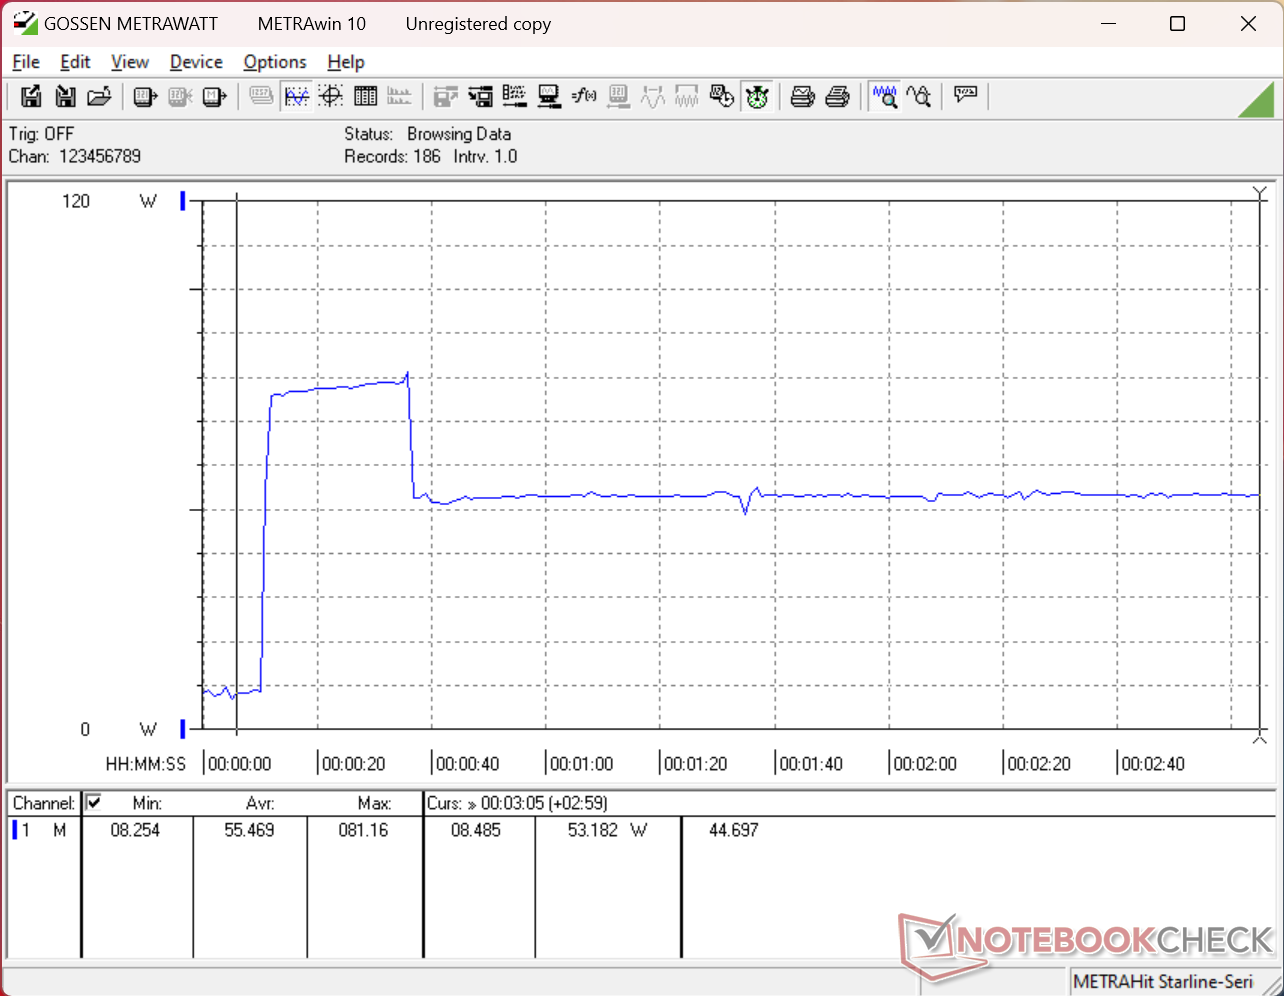
O Cubi AI+ 3MG é visivelmente mais eficiente do que o Cubi AI+ 2MG do ano passado Cubi AI+ 2MG do ano passado do ano passado, especialmente em termos de desempenho por watt. Ao executar o Prime95, por exemplo, o consumo se estabilizaria em torno de 52 W em comparação com 49 W no modelo mais antigo, apesar do enorme aumento de 60 a 65% no desempenho multi-thread. O desempenho gráfico por watt também aumentou, embora em um grau muito menor.
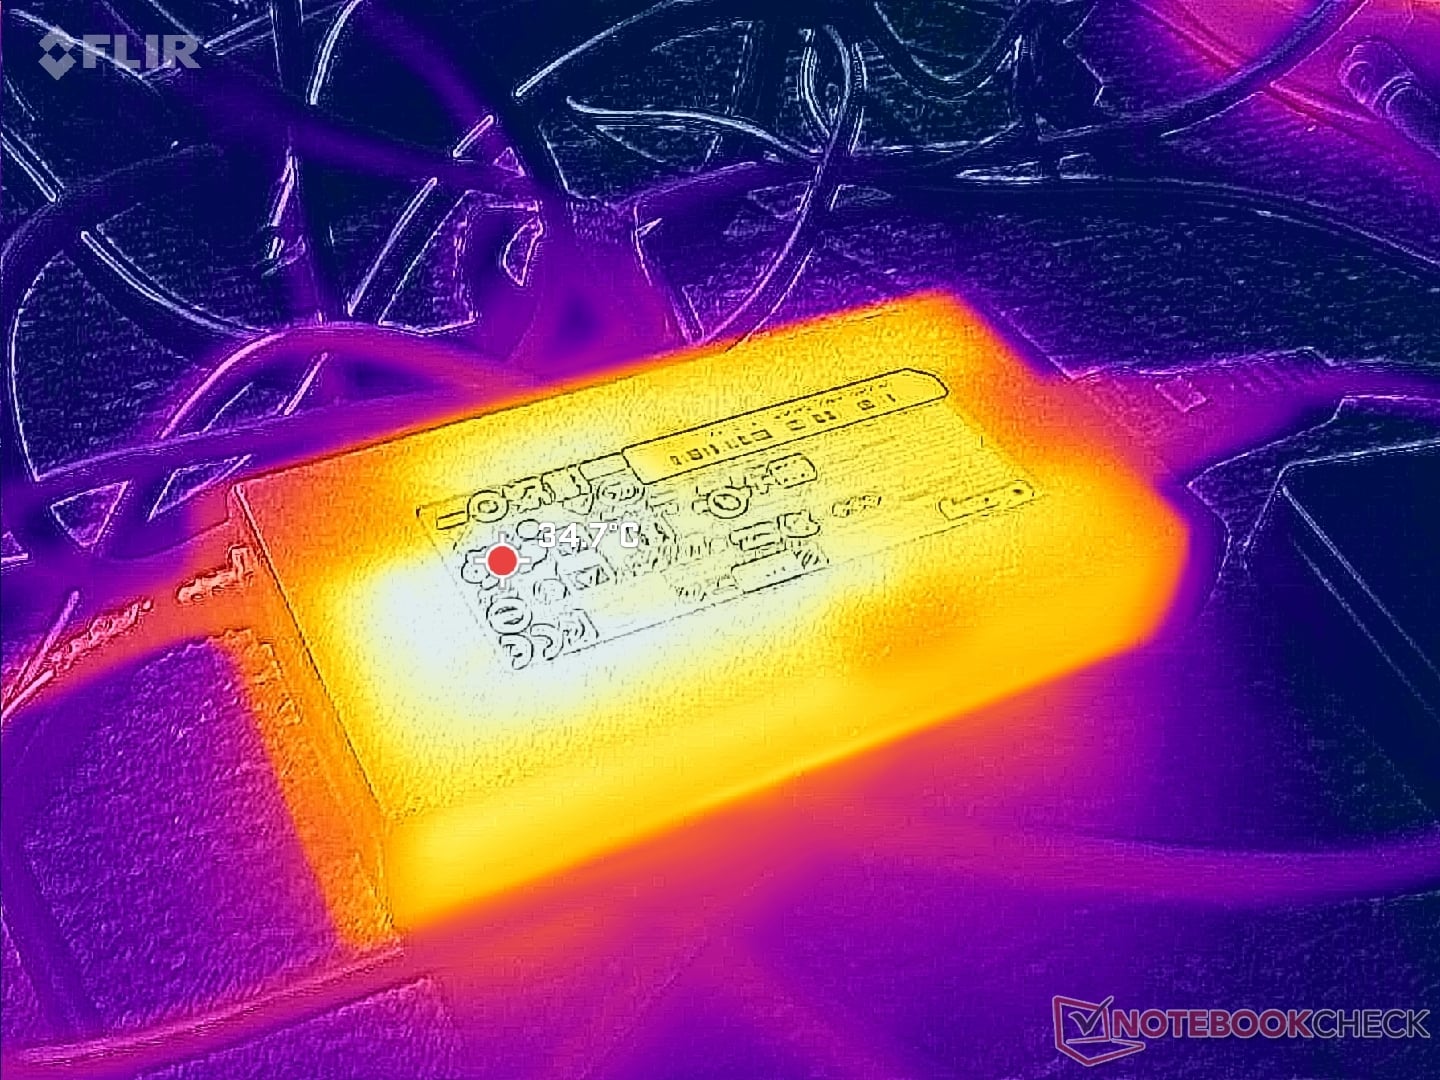
Observe que o consumo pode aumentar temporariamente até 98 W antes de cair novamente devido às limitações do Turbo Boost da CPU. O adaptador CA de 120 W (~13 x 6,9 x 2,5 cm) é mais do que suficiente nesse sentido, já que o mini PC em si mal ultrapassa a média de 50 W a 60 W quando está sob carga.

| desligado | |
| Ocioso | |
| Carga |
|
Key:
min: | |
| MSI Cubi NUC AI+ 3MG Ultra 9 386H, Intel Graphics 4 Xe3 PTL, Phison 1 TB ESR01TBTCCZ-27J, , x, | GMK NucBox K16 R7 7735HS, Radeon 680M, TWSC TSC3AN1T0-F6Q10S, , x, | GMK EVO-T1 Ultra 9 285H, Arc 140T, Crucial P3 Plus CT1000P3PSSD8, , x, | Geekom A5 Pro R5 7530U, Vega 7, Wodposit WPBSN4M8-1TGP, , x, | Asus NUC 15 Pro+ Ultra 9 285H, Arc 140T, Micron 3500 1TB MTFDKBA1T0TGD, , x, | MSI Cubi NUC AI+ 2MG Core Ultra 7 258V, Arc 140V, Phison 1 TB ESR01TBTCCZ-27J, , x, | MSI Cubi NUC 1M Core 7 150U, Iris Xe G7 96EUs, WD PC SN560 SDDPNQE-1T00, , x, | |
|---|---|---|---|---|---|---|---|
| Power Consumption | -10% | -27% | 42% | -12% | 20% | 8% | |
| Idle Minimum * (Watt) | 6.2 | 7.4 -19% | 6.1 2% | 3.2 48% | 3.9 37% | 2.9 53% | 6.4 -3% |
| Idle Average * (Watt) | 7.9 | 7.7 3% | 7.9 -0% | 4.3 46% | 6.1 23% | 5.7 28% | 8.3 -5% |
| Idle Maximum * (Watt) | 8.5 | 7.7 9% | 13.2 -55% | 5.1 40% | 8.2 4% | 10.2 -20% | 10.4 -22% |
| Load Average * (Watt) | 41.4 | 52 -26% | 60.7 -47% | 32.1 22% | 56.1 -36% | 38.7 7% | 38.5 7% |
| Cyberpunk 2077 ultra external monitor * (Watt) | 47.6 | 68 -43% | 67.4 -42% | 29.4 38% | 63.9 -34% | 41.1 14% | 36.1 24% |
| Load Maximum * (Watt) | 98 | 80.1 18% | 117.1 -19% | 43.5 56% | 160.6 -64% | 60 39% | 52.5 46% |
* ... menor é melhor
Consumo de energia Cyberpunk / Teste de estresse
Consumo de energia do monitor externo
Classificação do Notebookcheck
O MSI Cubi NUC AI+ 3MG é um dos menores minicomputadores que você pode encontrar com uma CPU Panther Lake Core Ultra 9. No entanto, alguns recursos ausentes impedem que ele seja a solução definitiva para varejo ou escritório.
MSI Cubi NUC AI+ 3MG
- 06/03/2026 v8
Allen Ngo
 Total Sustainability Score:
 Concorrentes potenciais em comparação
Imagem | Modelo / Análises | Preço | Peso | Altura | Tela |
|---|---|---|---|---|---|
1. 76.9%  | MSI Cubi NUC AI+ 3MG Intel Core Ultra 9 386H ⎘ Intel Graphics 4 Xe3 Panther Lake iGPU ⎘ 32 GB Memória, 1000 GB SSD | Amazon: Preço de tabela: 830 USD | 552 g | 37.5 mm | x |
2. 64.8%  | GMK NucBox K16 AMD Ryzen 7 7735HS ⎘ AMD Radeon 680M ⎘ 32 GB Memória, 1024 GB SSD | Amazon: 1. $639.97 GMKtec K16 Mini PC Gaming AM... Preço de tabela: 650 USD | 567 g | 63 mm | x |
3. 75.4%  | GMK EVO-T1 Intel Core Ultra 9 285H ⎘ Intel Arc Graphics 140T ⎘ 64 GB Memória, 1024 GB SSD | Amazon: Preço de tabela: 999€ | 946 g | 73.6 mm | x |
4. 72.6%  | Geekom A5 Pro AMD Ryzen 5 7530U ⎘ AMD Radeon RX Vega 7 ⎘ 16 GB Memória, 1024 GB SSD | Amazon: Preço de tabela: 619€ | 423 g | 37 mm | x |
5. 77.5% 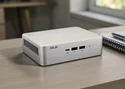 | Asus NUC 15 Pro+ Intel Core Ultra 9 285H ⎘ Intel Arc Graphics 140T ⎘ 32 GB Memória, 1024 GB SSD | Amazon: $1,240.00 Preço de tabela: 991€ | 690 g | 42 mm | x |
6. 75.2% 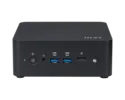 | MSI Cubi NUC AI+ 2MG Intel Core Ultra 7 258V ⎘ Intel Arc Graphics 140V ⎘ 32 GB Memória, 1000 GB SSD | Amazon: Preço de tabela: 900 USD | 669 g | 50.1 mm | x |
7. 66.1% 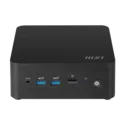 | MSI Cubi NUC 1M Intel Core 7 150U ⎘ Intel Iris Xe Graphics G7 96EUs ⎘ 16 GB Memória, 1024 GB SSD | Amazon: Preço de tabela: 950 USD | 660 g | 50.1 mm | x |
Transparência
A seleção dos dispositivos a serem analisados é feita pela nossa equipe editorial. A amostra de teste foi fornecida ao autor como empréstimo pelo fabricante ou varejista para fins desta revisão. O credor não teve influência nesta revisão, nem o fabricante recebeu uma cópia desta revisão antes da publicação. Não houve obrigação de publicar esta revisão. Como empresa de mídia independente, a Notebookcheck não está sujeita à autoridade de fabricantes, varejistas ou editores.
É assim que o Notebookcheck está testando
Todos os anos, o Notebookcheck analisa de forma independente centenas de laptops e smartphones usando procedimentos padronizados para garantir que todos os resultados sejam comparáveis. Desenvolvemos continuamente nossos métodos de teste há cerca de 20 anos e definimos padrões da indústria no processo. Em nossos laboratórios de teste, equipamentos de medição de alta qualidade são utilizados por técnicos e editores experientes. Esses testes envolvem um processo de validação em vários estágios. Nosso complexo sistema de classificação é baseado em centenas de medições e benchmarks bem fundamentados, o que mantém a objetividade.
