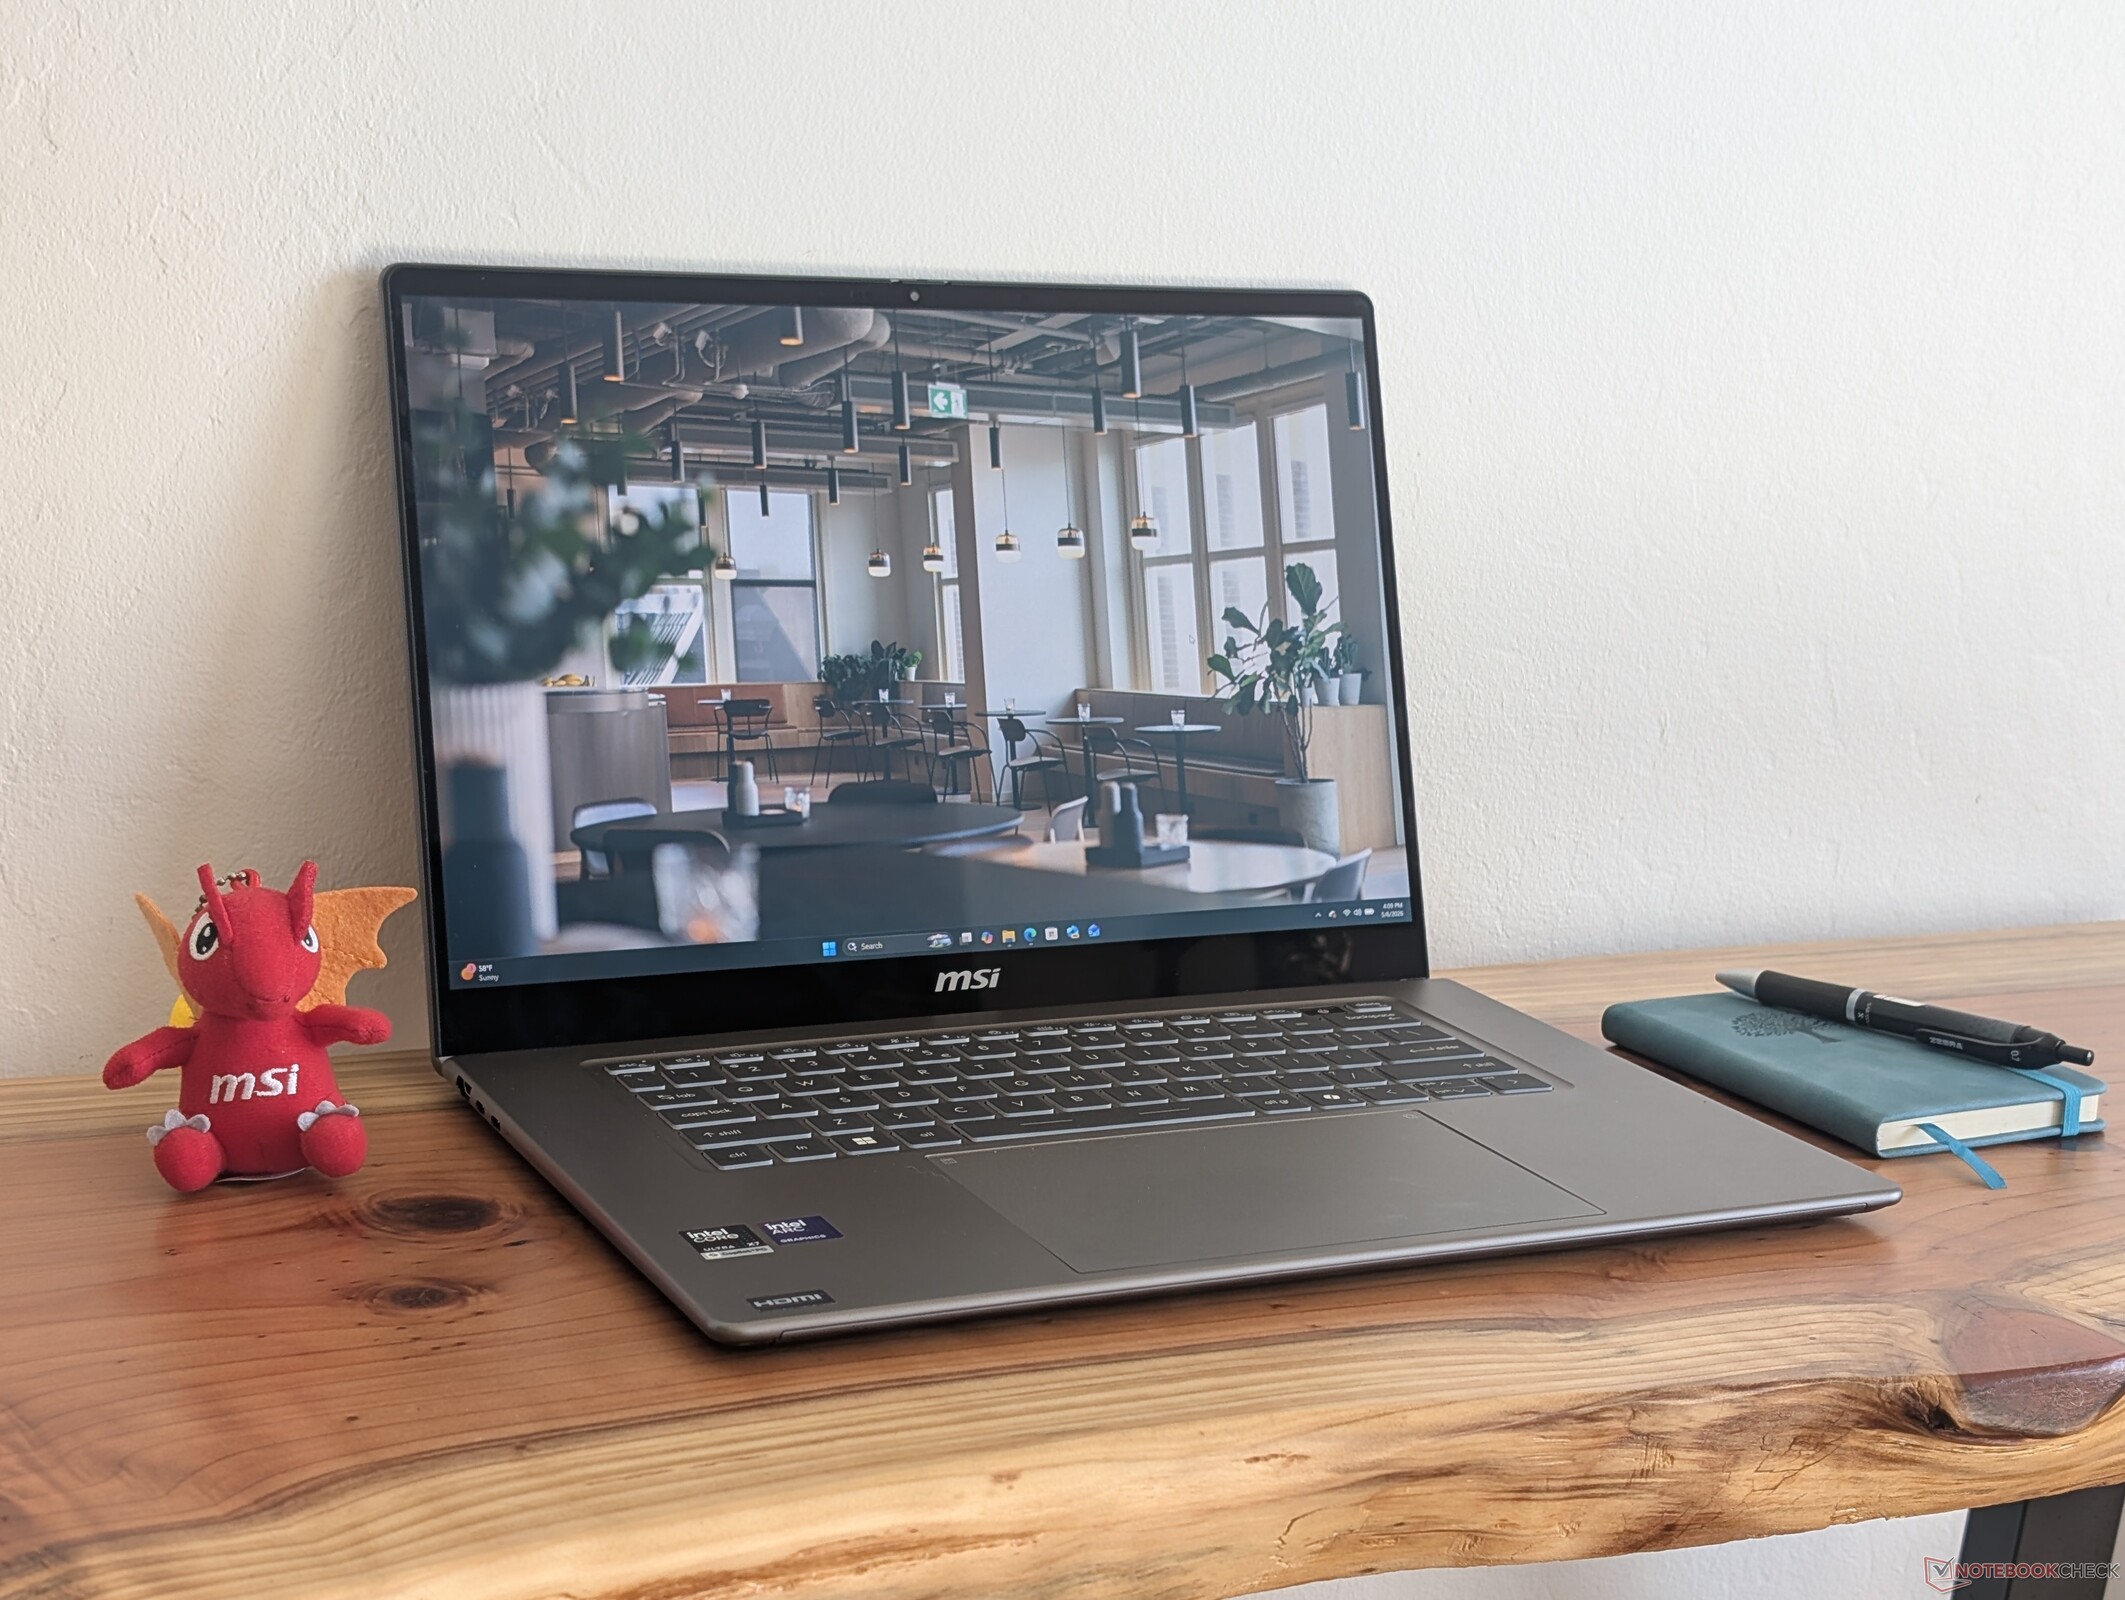
Veredicto - O laptop mais fino e mais profissional da MSI até o momento
Assim como a transformação do 2025 Dell 16 Premium para o 2026 XPS 16o Prestige 16 2026 é uma máquina mais enxuta, elegante e eficiente do que o 2025 Prestige 16. Grande parte disso se deve à mudança para o Intel Panther Lake X7, que oferece ganhos significativos no desempenho por watt em relação à geração anterior. O desempenho da GPU, em particular, é impressionante, já que o MSI é mais fino do que a maioria dos outros notebooks de 16 polegadas com opções de processador semelhantes.
Além da CPU, a MSI introduziu mudanças significativas este ano, desde as portas até a tela. A maioria delas é um salto à frente, incluindo o painel OLED de 120 Hz e uma estética mais profissional, mas as portas descartadas e a bateria menor são uma mistura. A temperatura do núcleo é mais quente do que a dos concorrentes, enquanto o adaptador CA USB-C de 65 W prejudica o desempenho do Turbo Boost e as taxas de carregamento em determinadas condições.
Os usuários que não se importam com um sistema um pouco mais grosso e mais pesado encontrarão no XPS 16 uma boa alternativa, pois ele oferece uma tela sensível ao toque de resolução ainda maior e uma webcam, embora com menos opções de portas e uma bateria de menor duração. Enquanto isso, o Asus Zenbook S16 com tecnologia AMD, é ainda mais leve e menor, com desempenho de CPU e opções de painel semelhantes, mas suas ventoinhas são mais barulhentas e o desempenho gráfico é pior. Um modelo pode ser melhor do que o outro, dependendo de suas necessidades específicas.
Pro
Contra
Preço e disponibilidade
O MSI Prestige 16 AI+ C3MTG clamshell ainda não está amplamente disponível no momento da publicação. No entanto, o Prestige 16 Flip AI+ C3MTG já está sendo enviado a partir de US$ 2150.
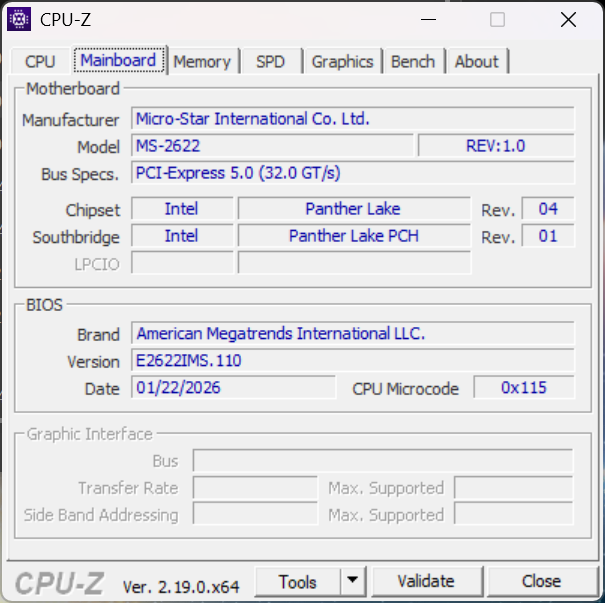
O Prestige 16 AI+ C3MG clamshell foi apresentado na CES 2026 juntamente com uma série de outros modelos Prestige, todos equipados com CPUs Intel Panther Lake. Esse Prestige 16 mais recente foi totalmente redesenhado em comparação com o modelo do ano passado, equipado com Arrow Lake, para proporcionar uma experiência de usuário renovada.
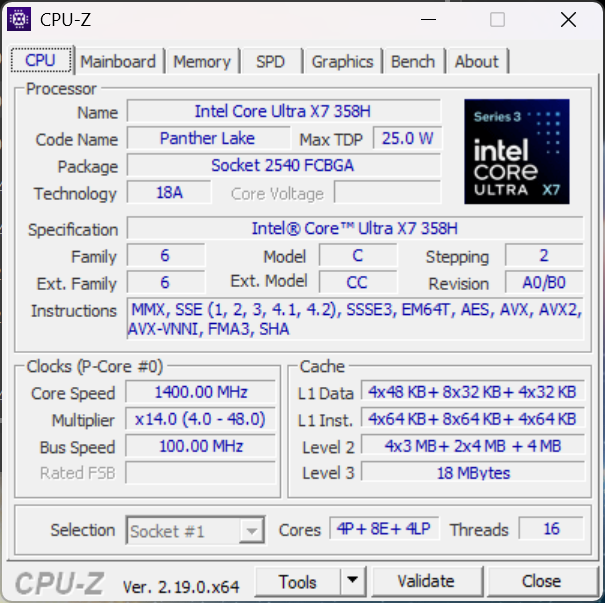
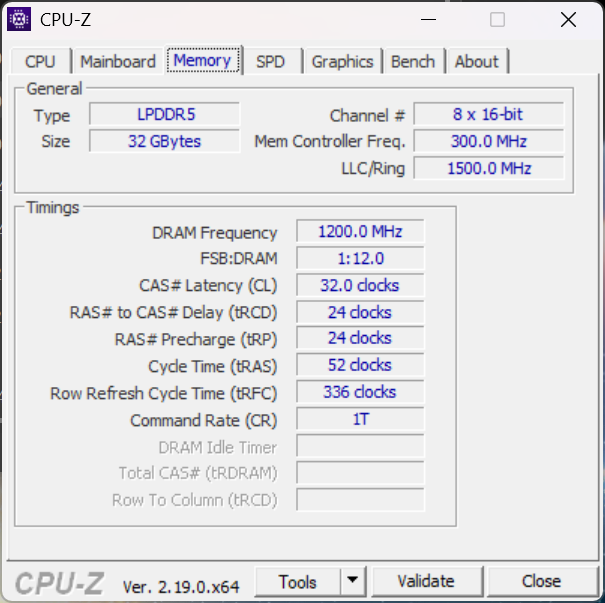
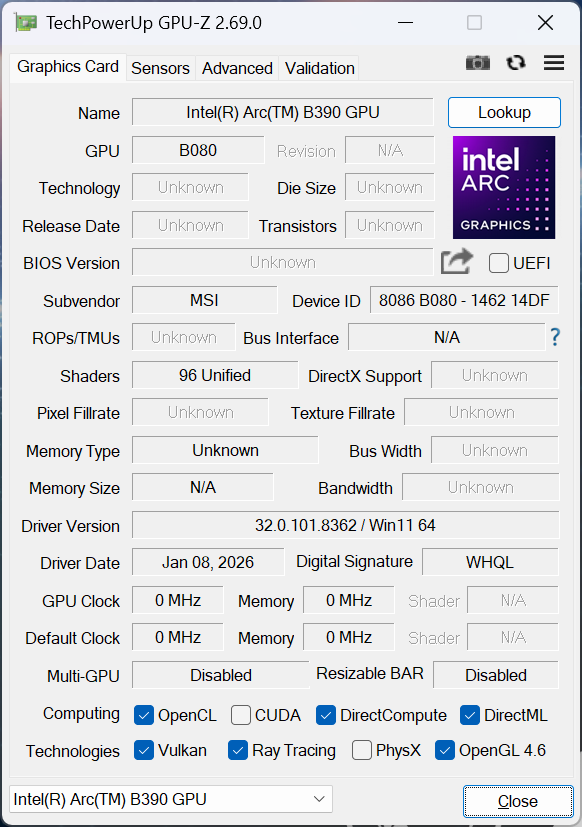
Nossa unidade de teste vem configurada com a CPU Core Ultra X7 358H, 32 GB de RAM e tela sensível ao toque OLED de 1800p por aproximadamente US$ 2100. Outras SKUs podem ser fornecidas com o Core Ultra X9 388H, mas o OLED 1800p e a GPU Arc B390 permanecem constantes.
Os modelos concorrentes incluem outros notebooks prosumer de ponta, como o Dell XPS 16, Lenovo Pro 9i 16 Auraou o Asus ZenBook S16 da Asus. Uma versão conversível com dobradiças de 360 graus também está disponível, chamada Prestige 16 Flip AI+ C3MG.
Mais análises da MSI:
Especificações
Caso
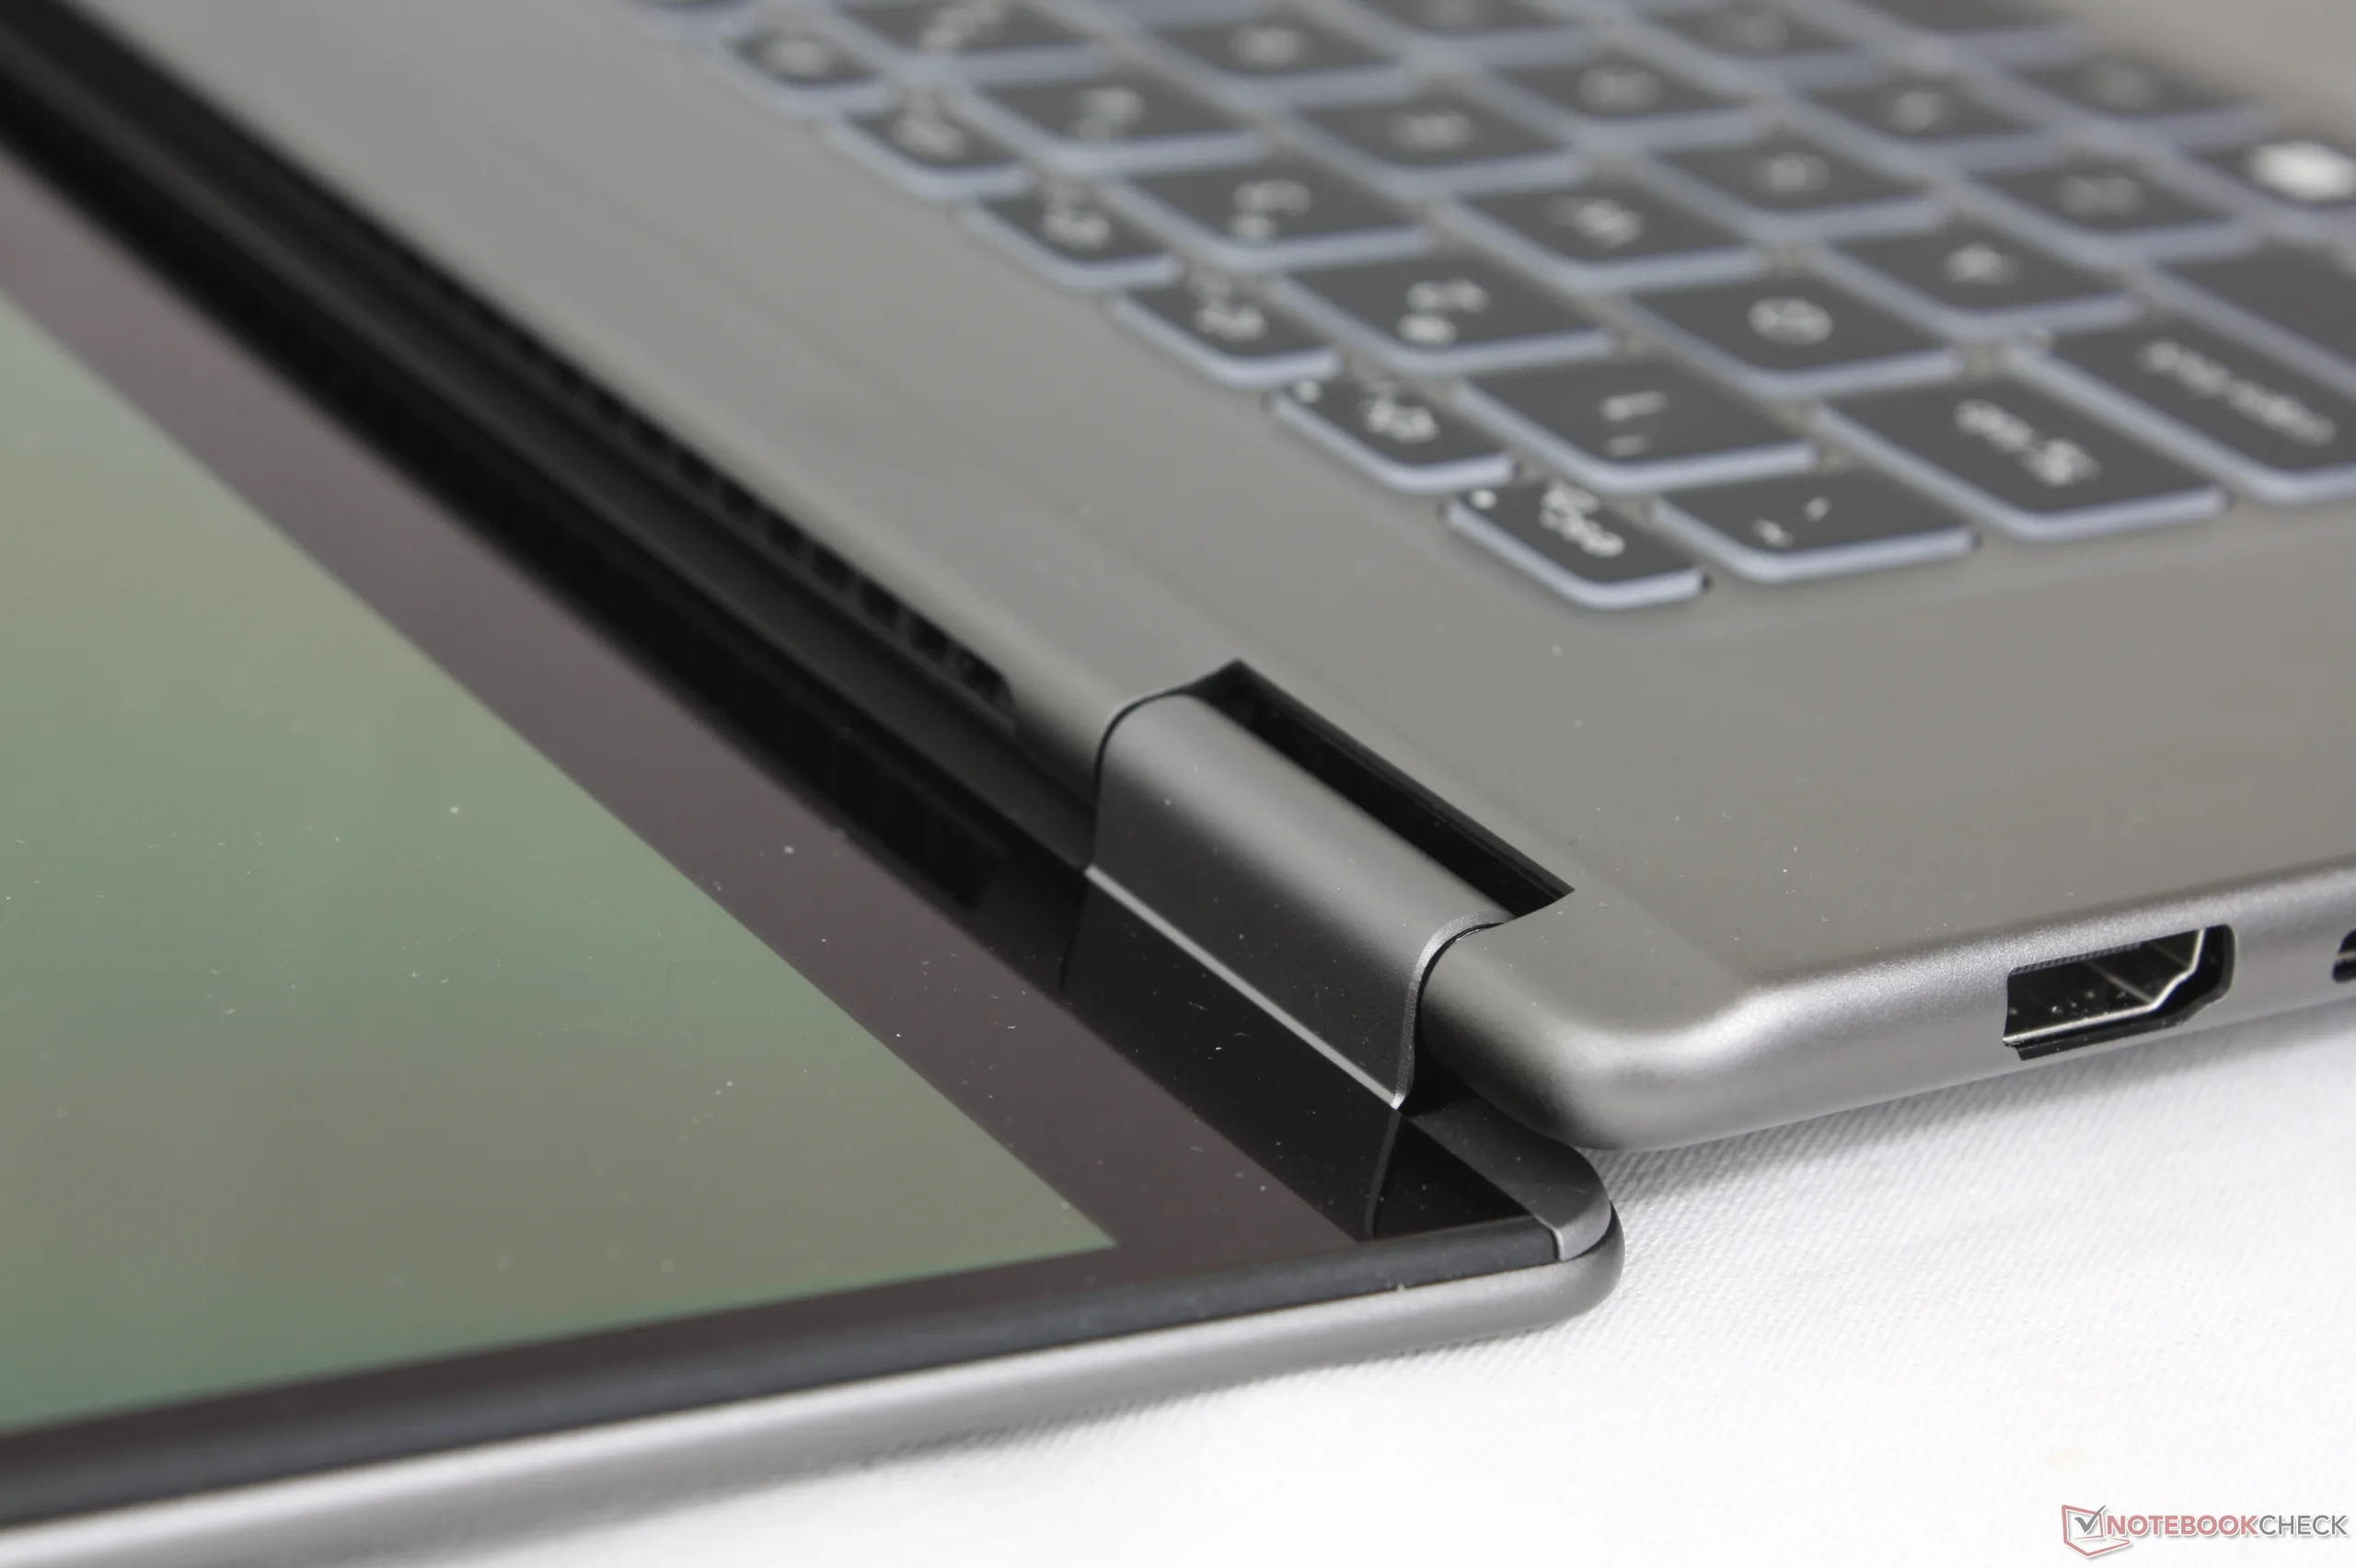
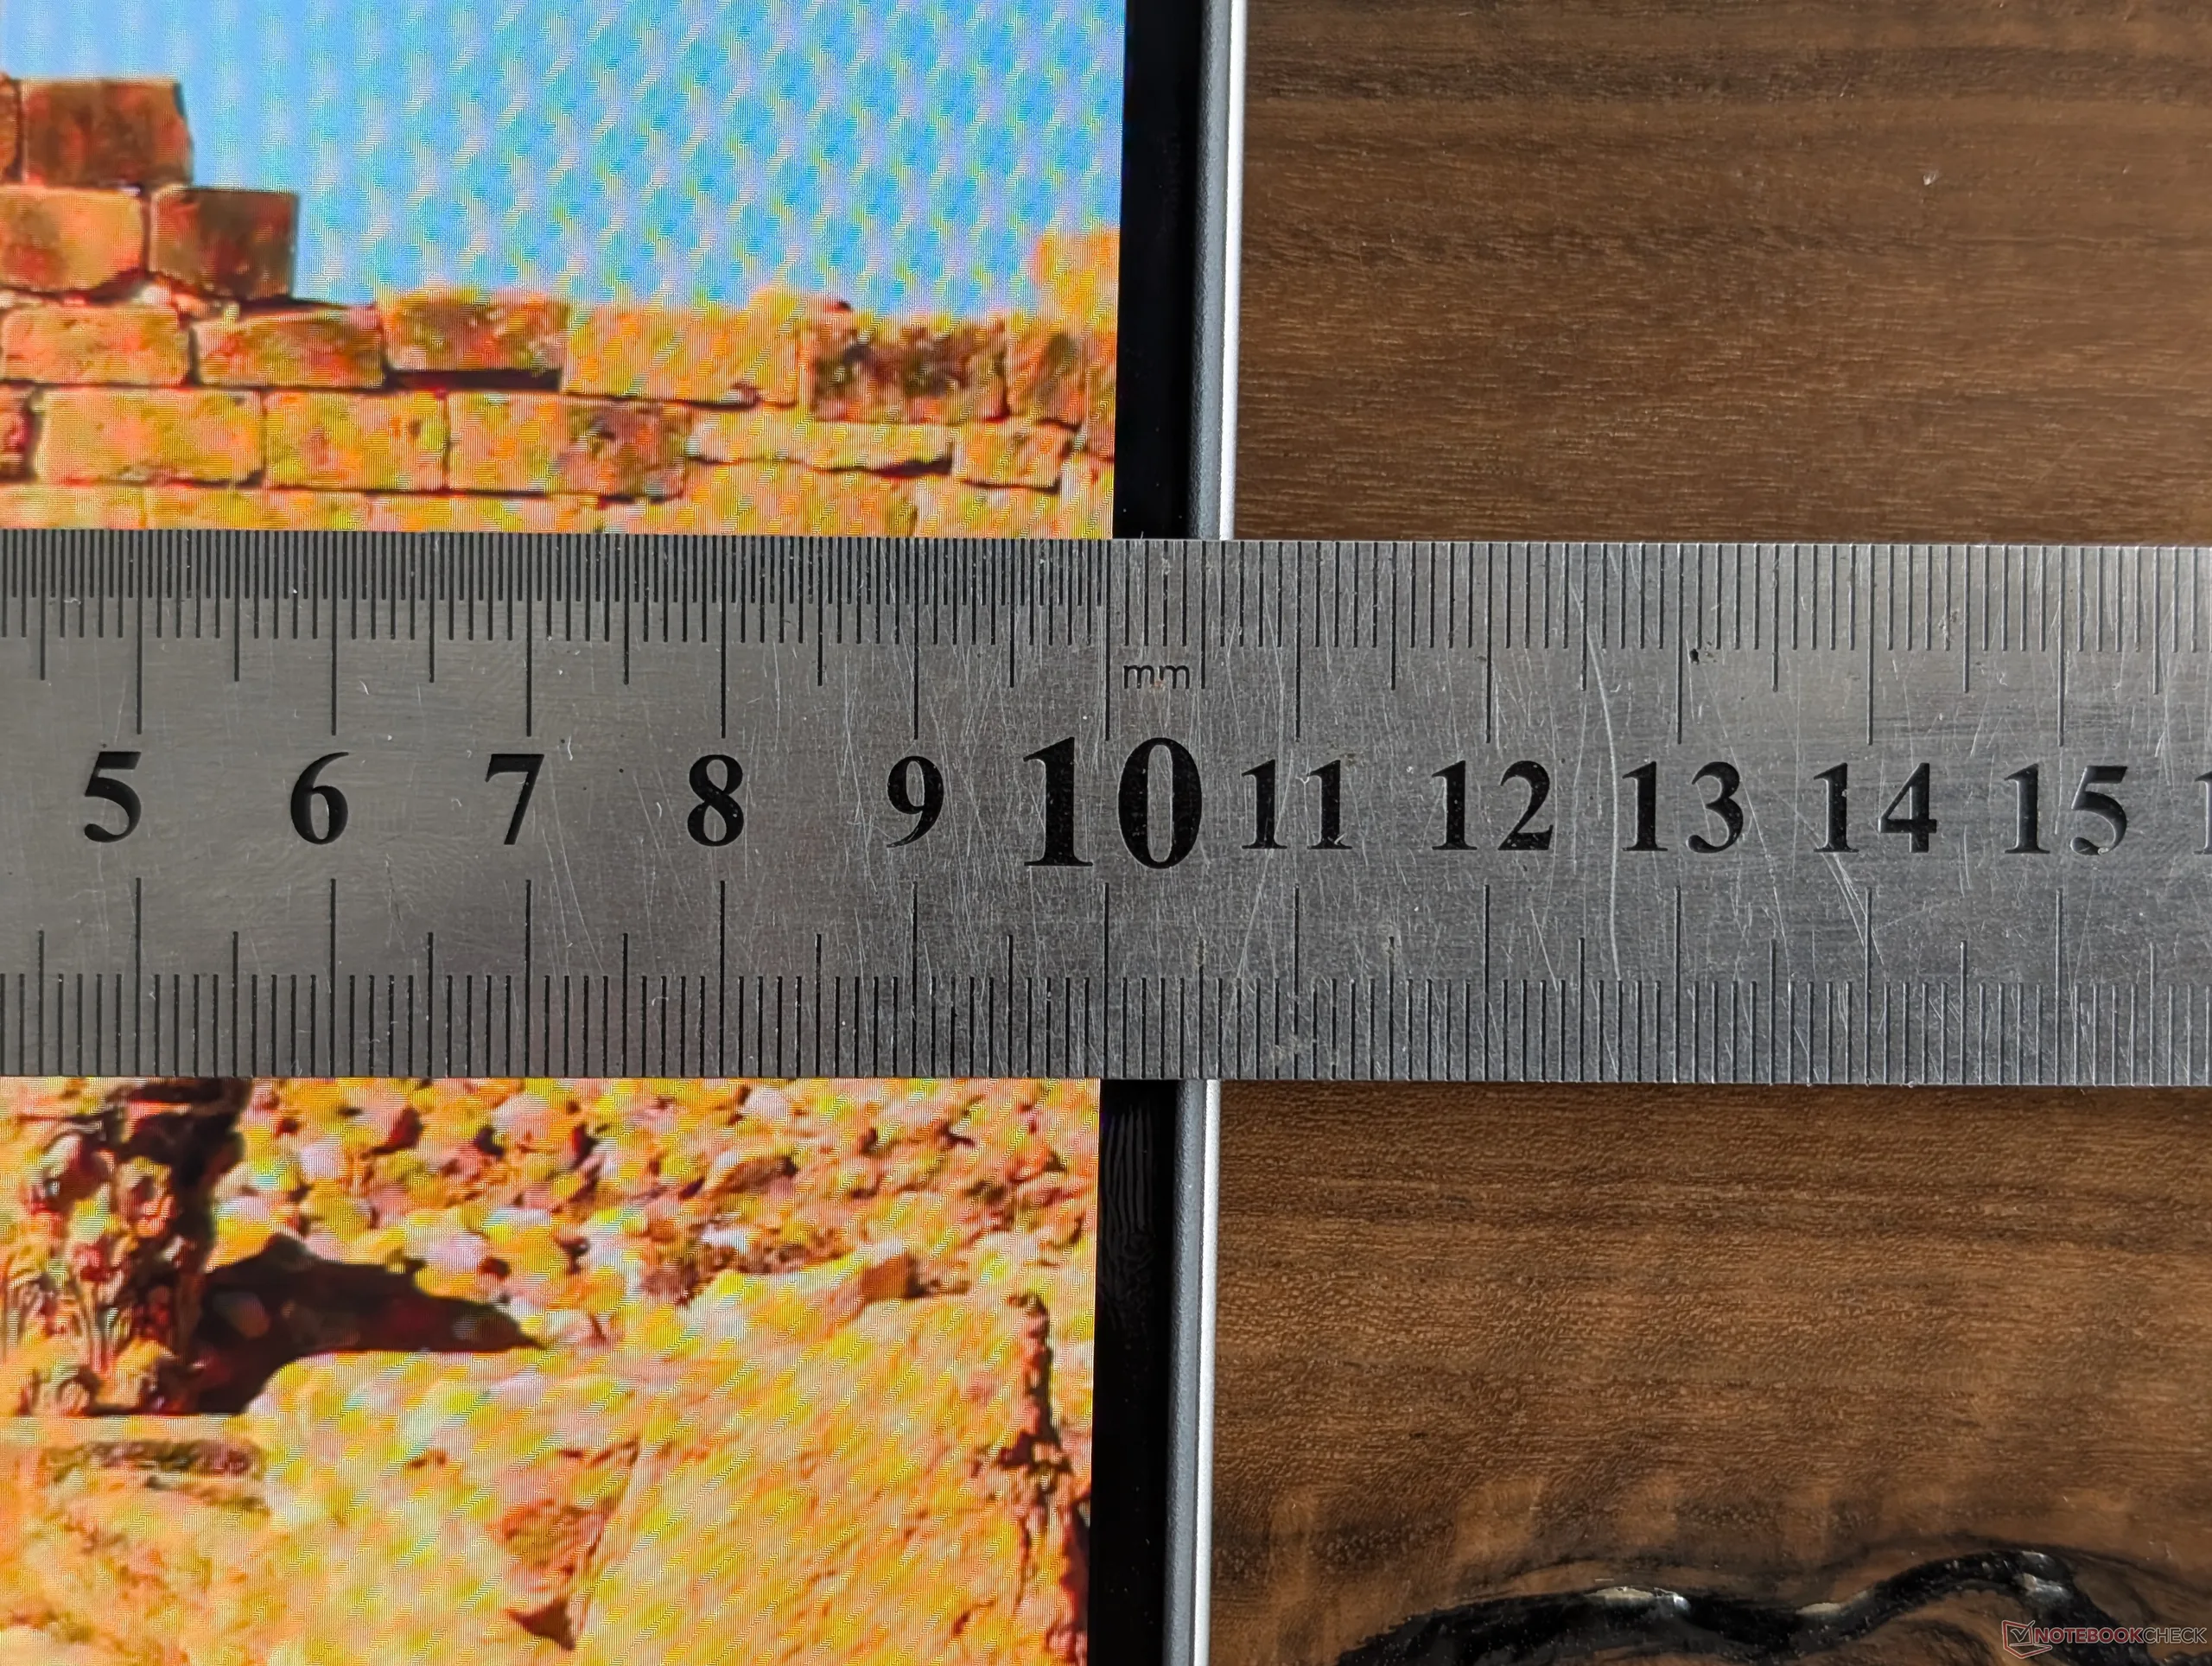
O chassi de liga de alumínio agora é mais fino e tem menos ângulos e linhas superficiais para dar um toque mais profissional. De fato, quando comparado ao modelo anterior, o 2026 Prestige 16 é indiscutivelmente mais elegante sem parecer muito chato ou minimalista.
A rigidez do chassi é forte, embora com um pouco mais de flexão do que o XPS 16 mais espesso ou o Lenovo Pro 9i 16 Aura.
A MSI também está introduzindo um logotipo atualizado este ano na tampa externa, começando com a linha 2026 Prestige. De acordo com o fabricante, a elegante gravação a laser pode aparecer em mais modelos comerciais de primeira linha em um futuro próximo para melhor separá-los das soluções da MSI centradas em jogos.
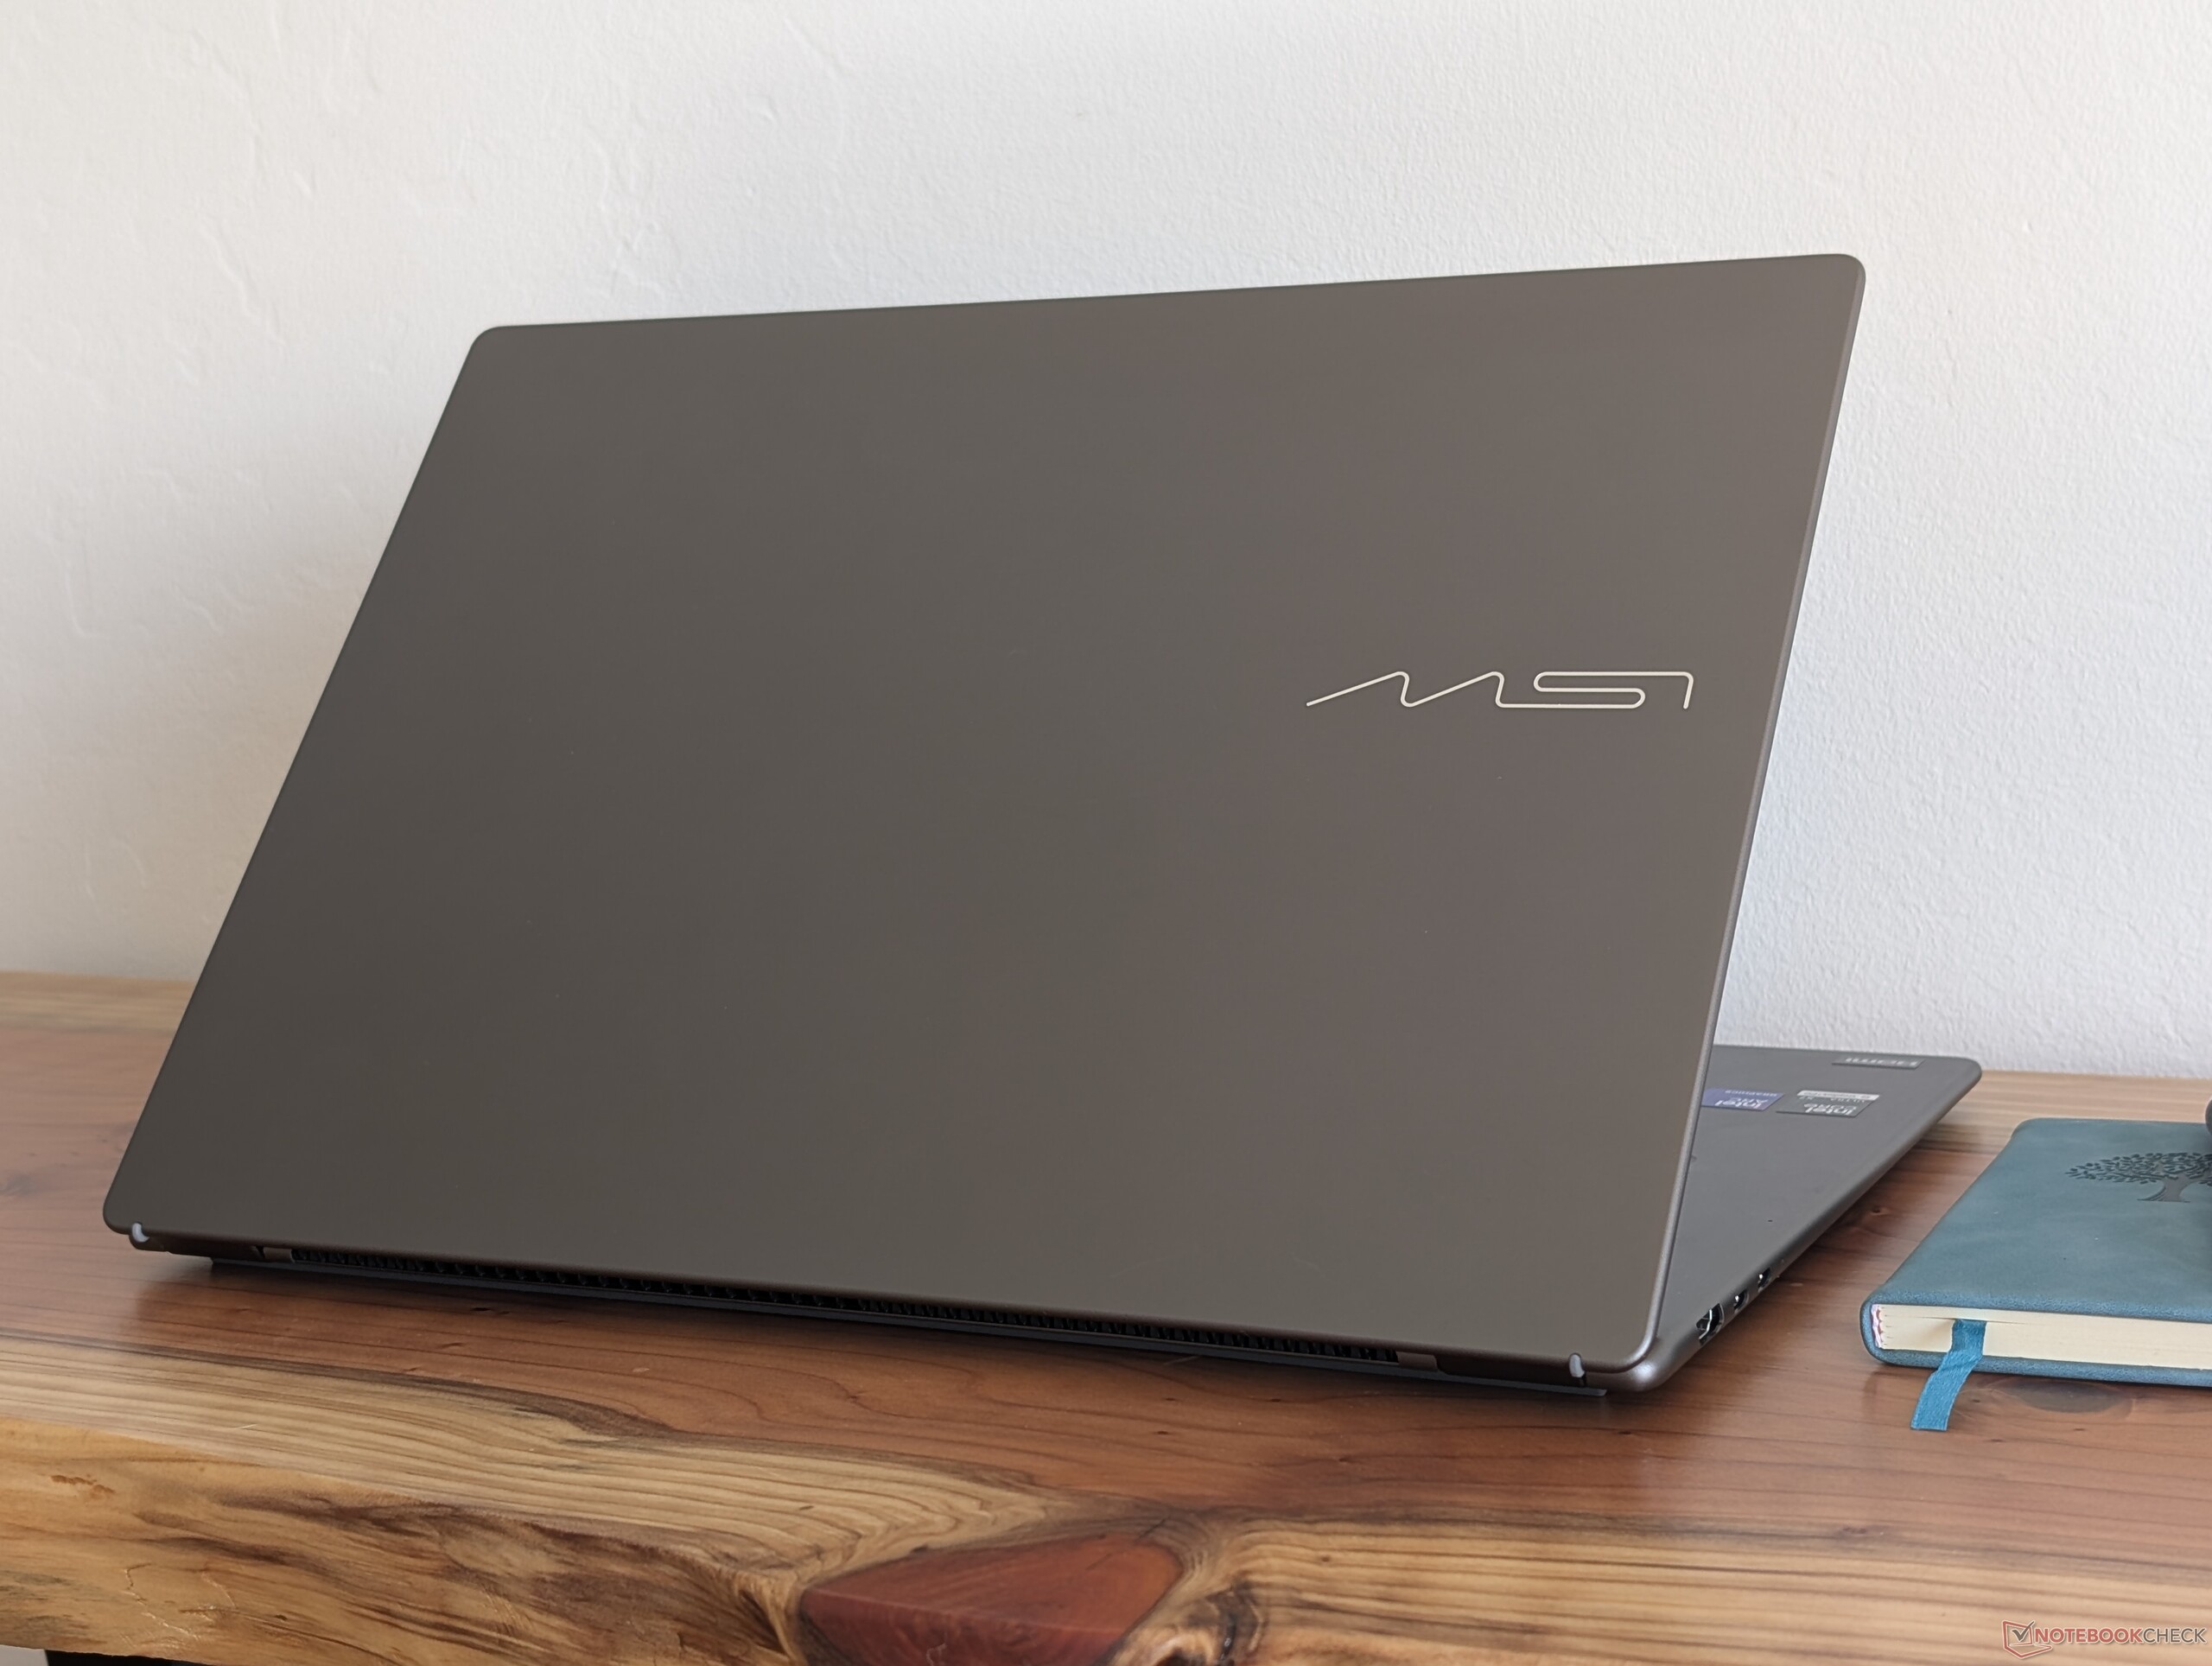
O sistema é visivelmente mais fino do que o design do ano passado, mas com quase nenhuma mudança de peso para uma sensação mais densa. Ele fica confortavelmente entre o XPS 16 e o ZenBook S16 no que diz respeito ao peso, embora seja um pouco maior do que ambos em termos de espaço.
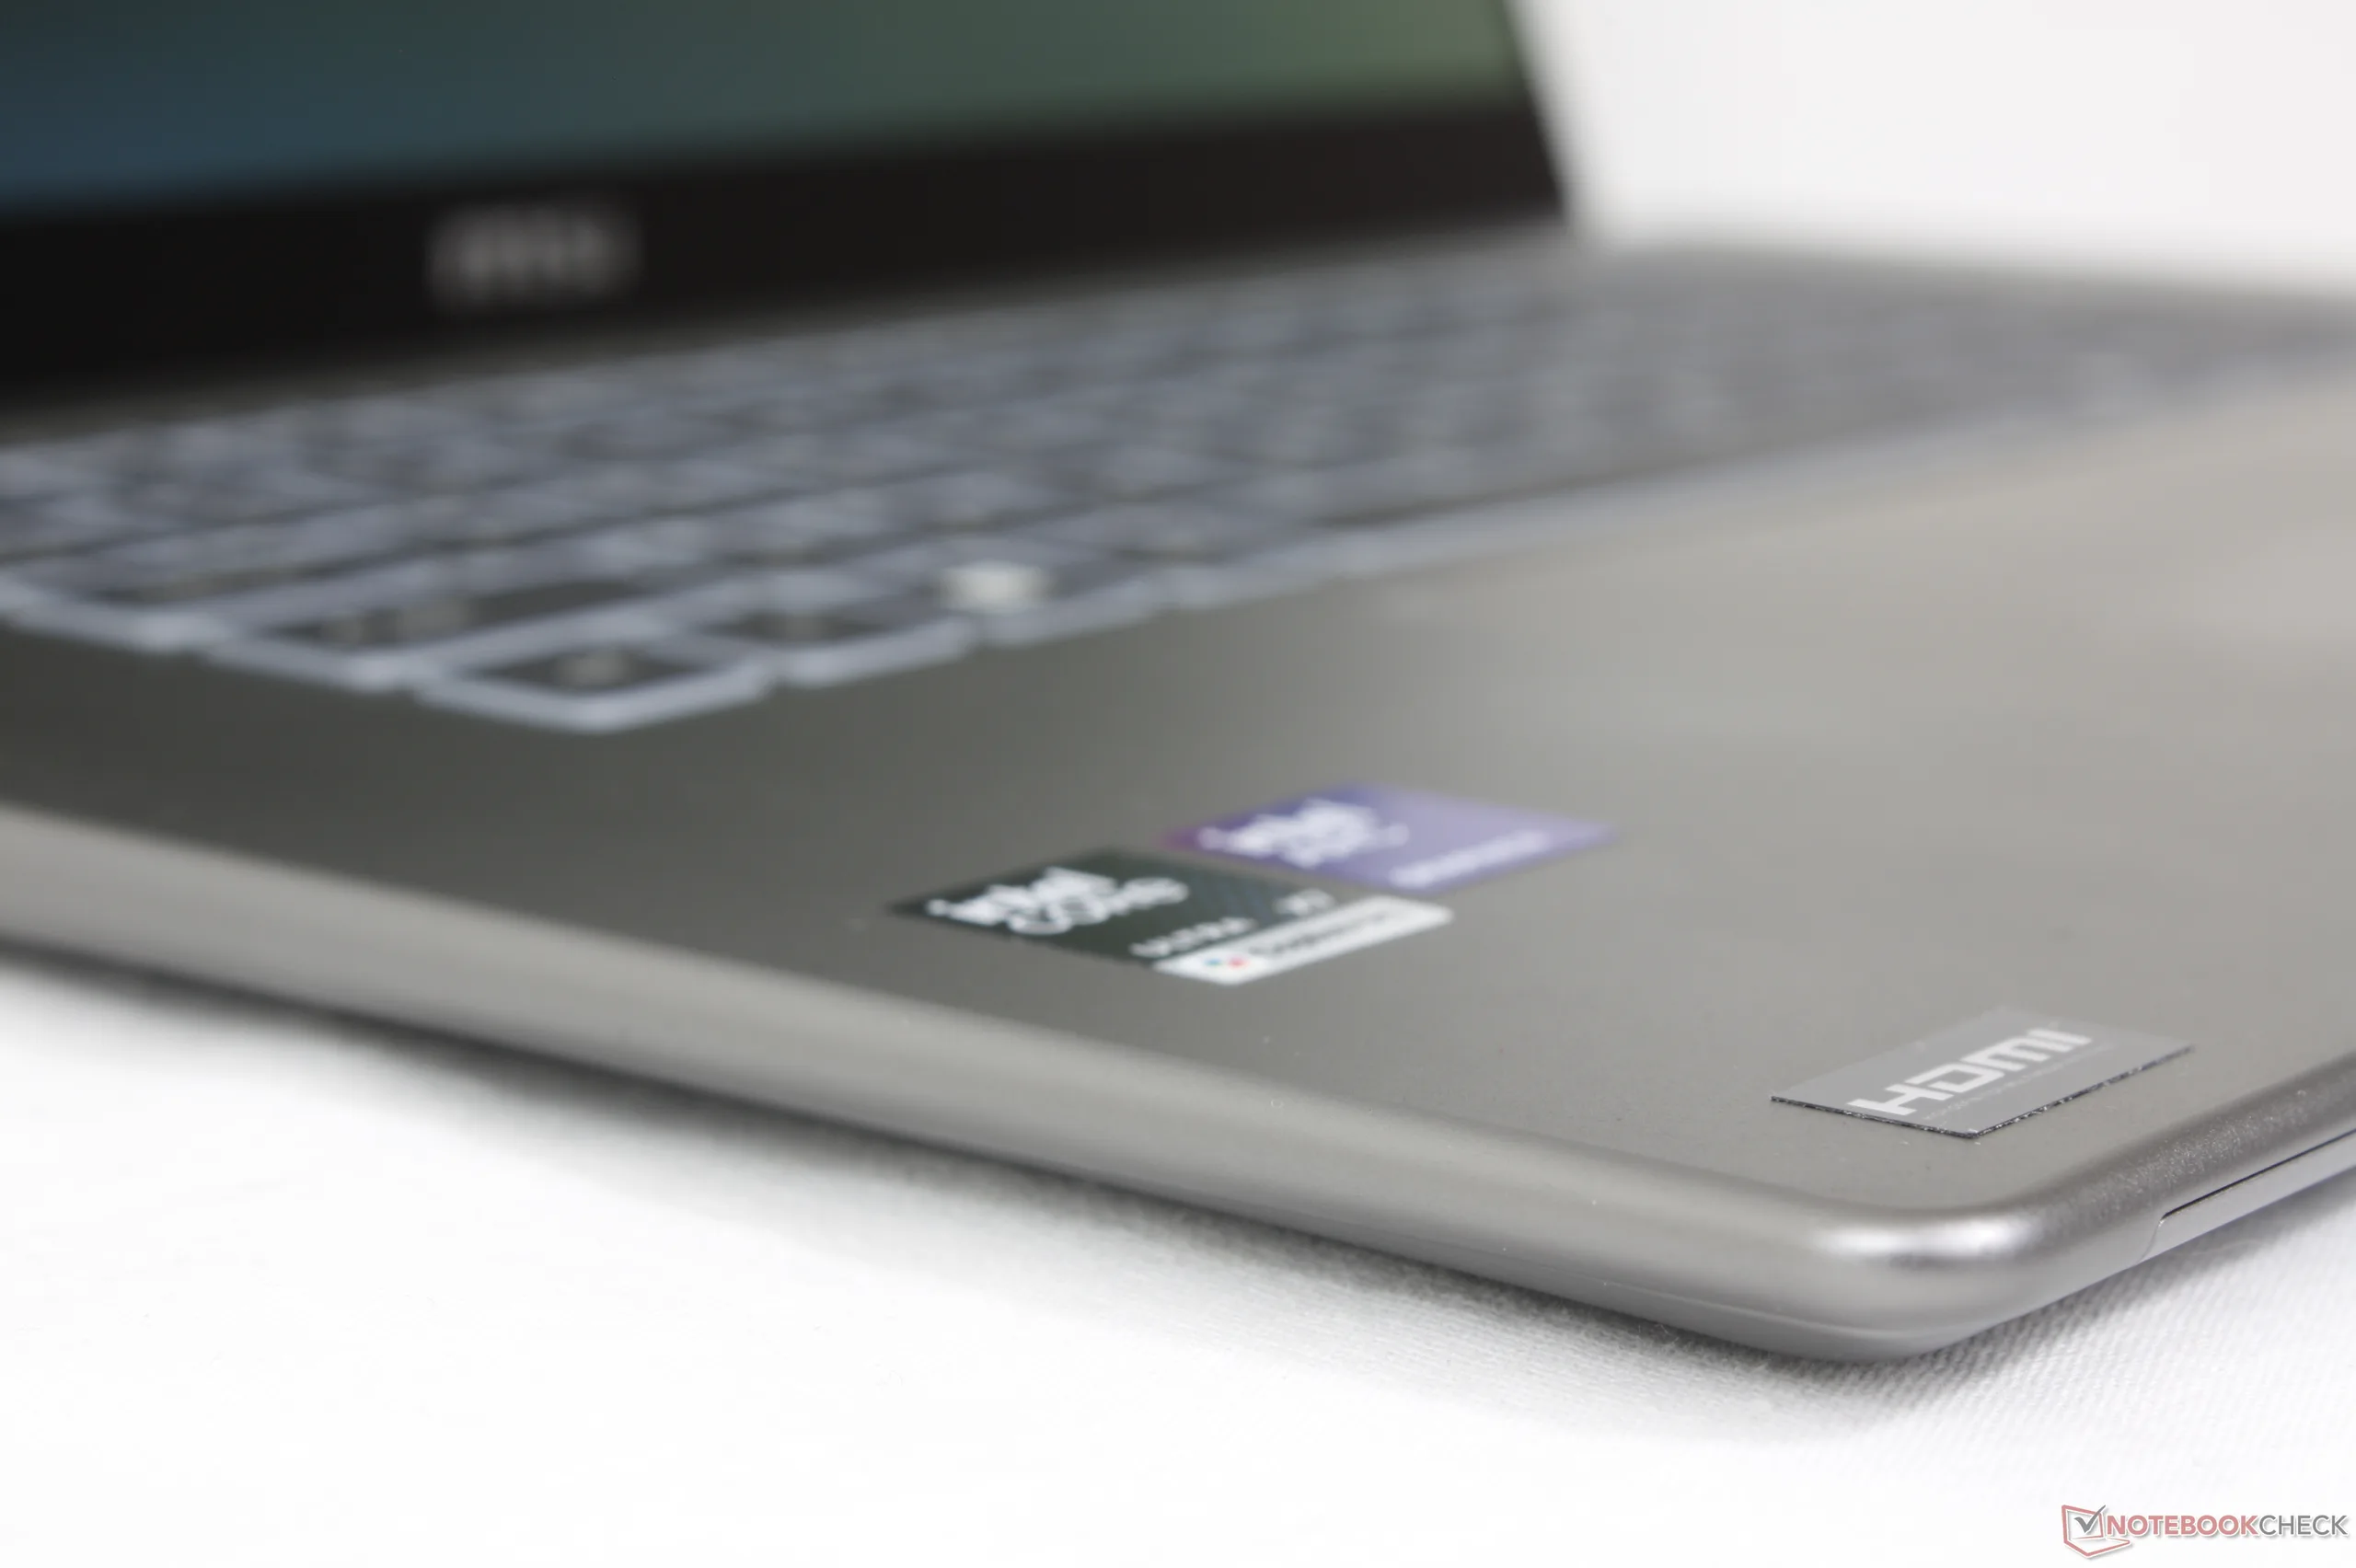
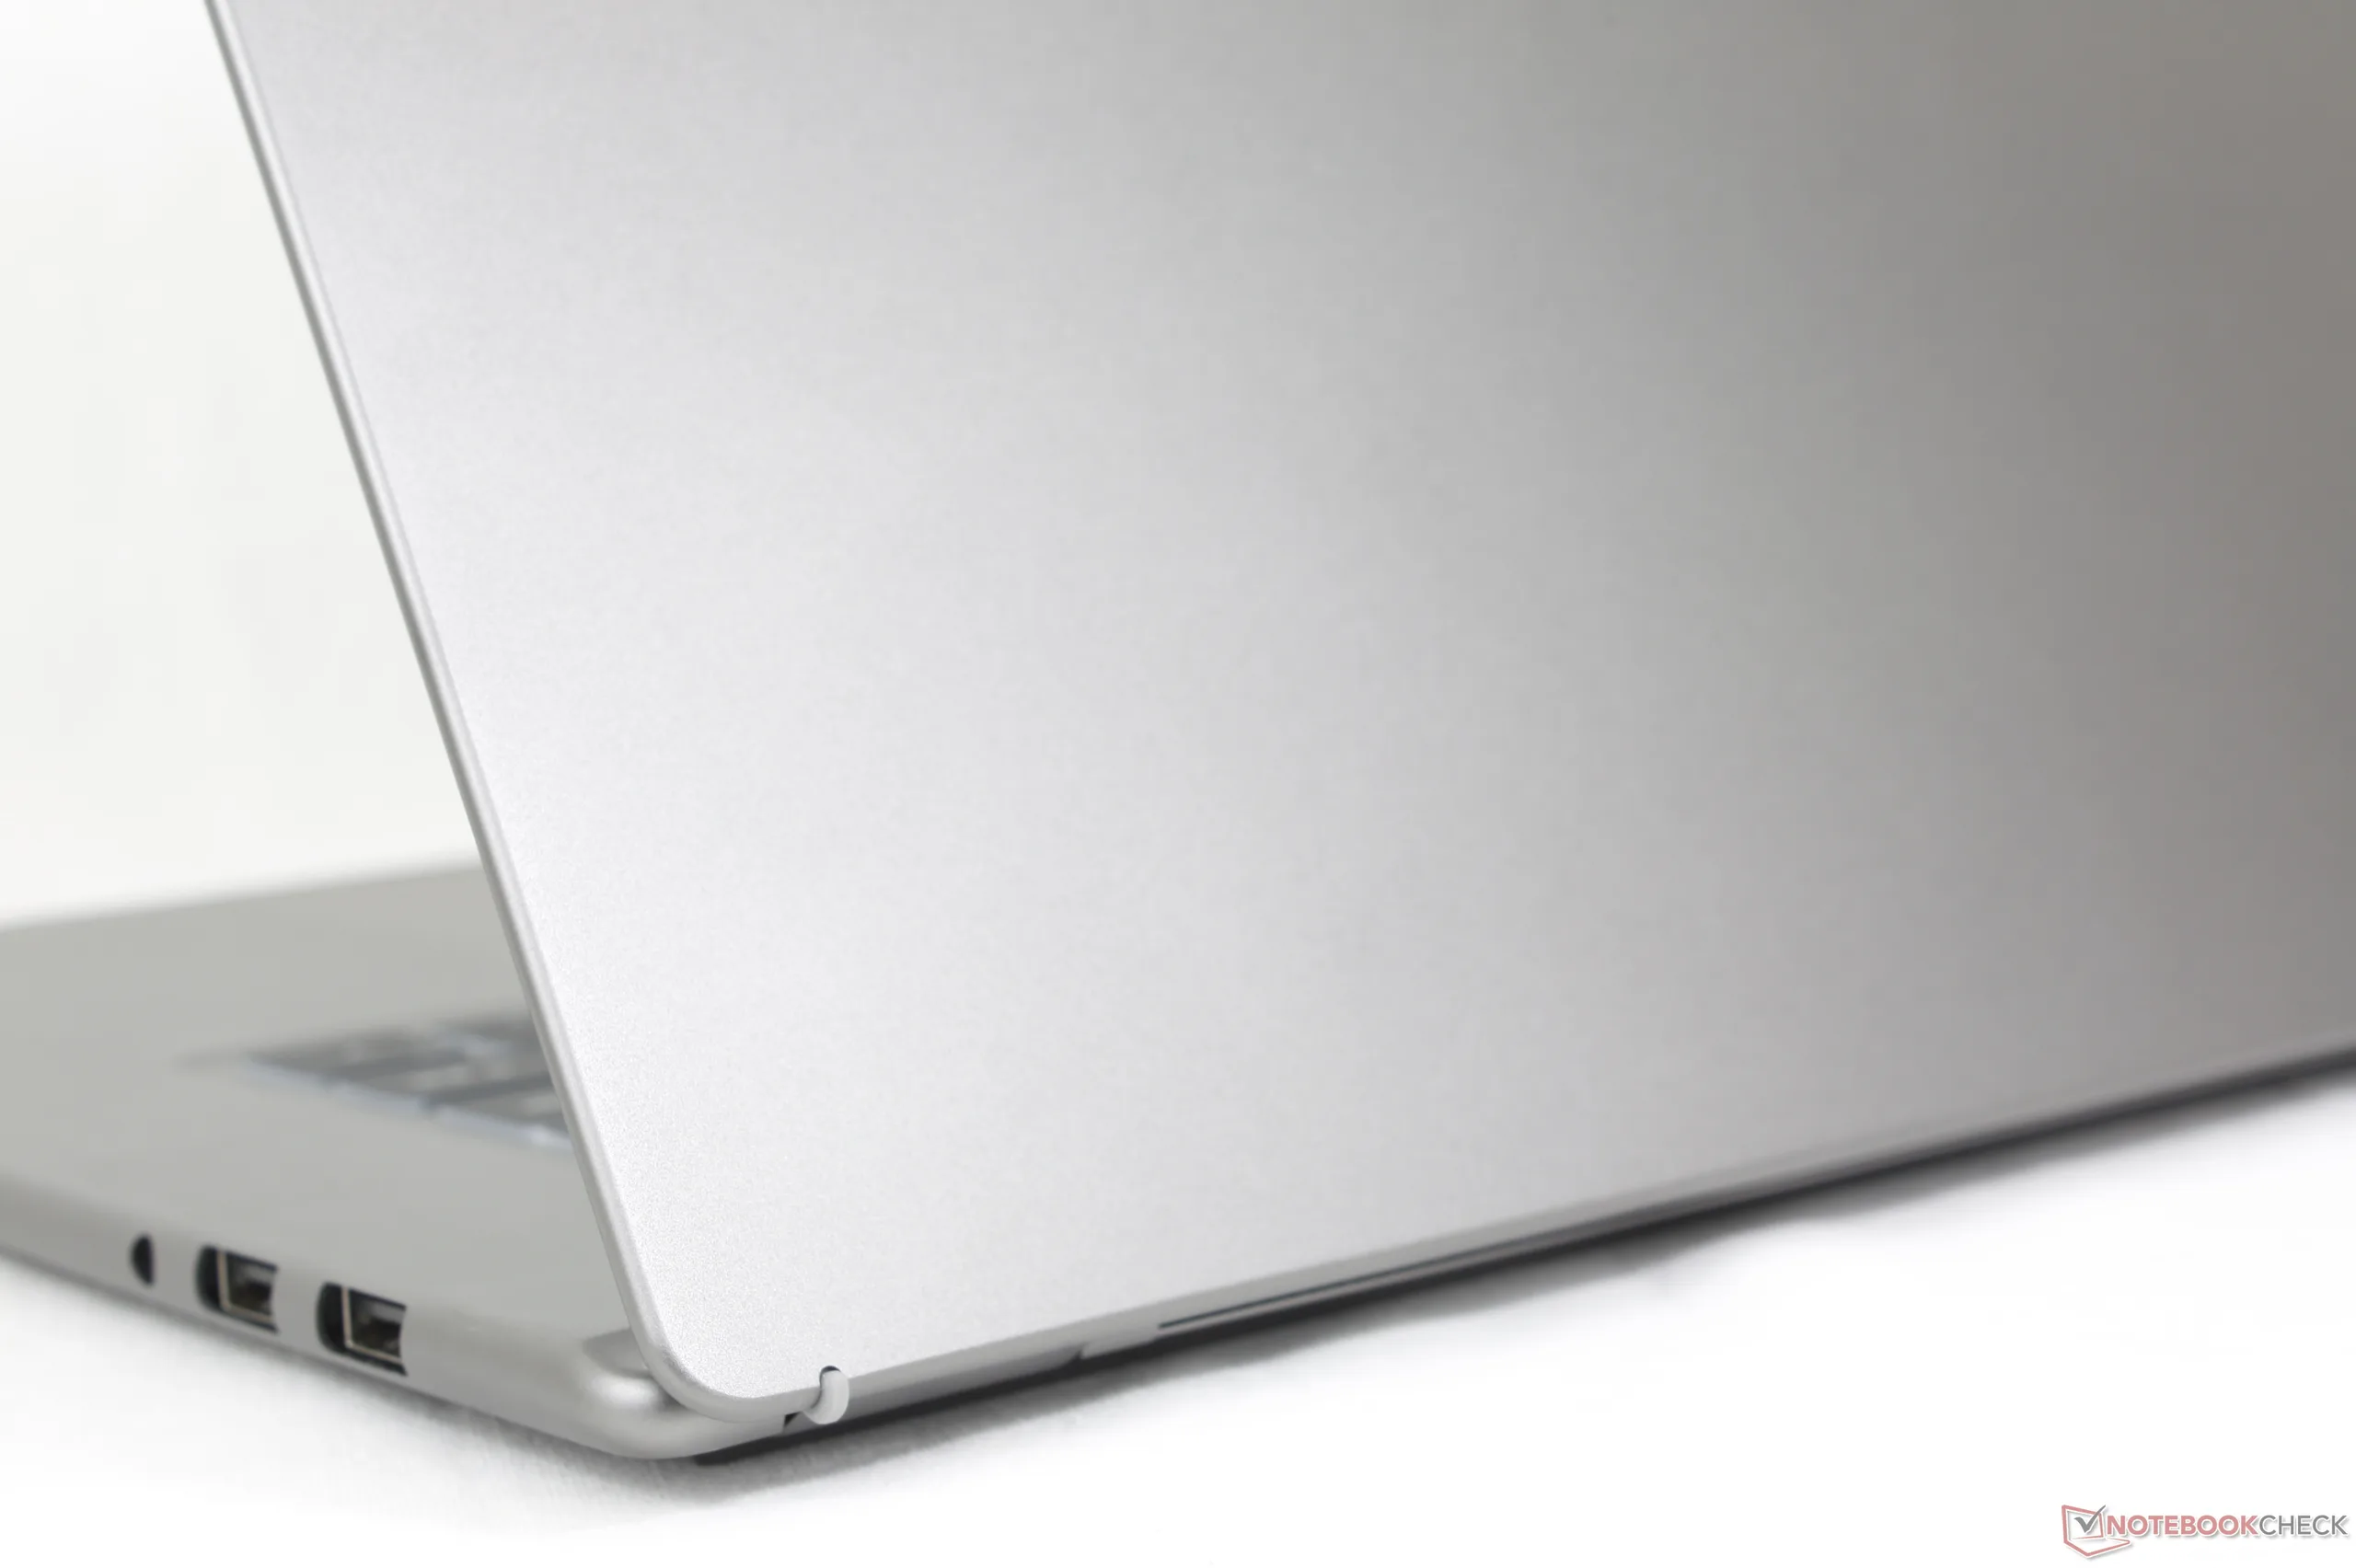
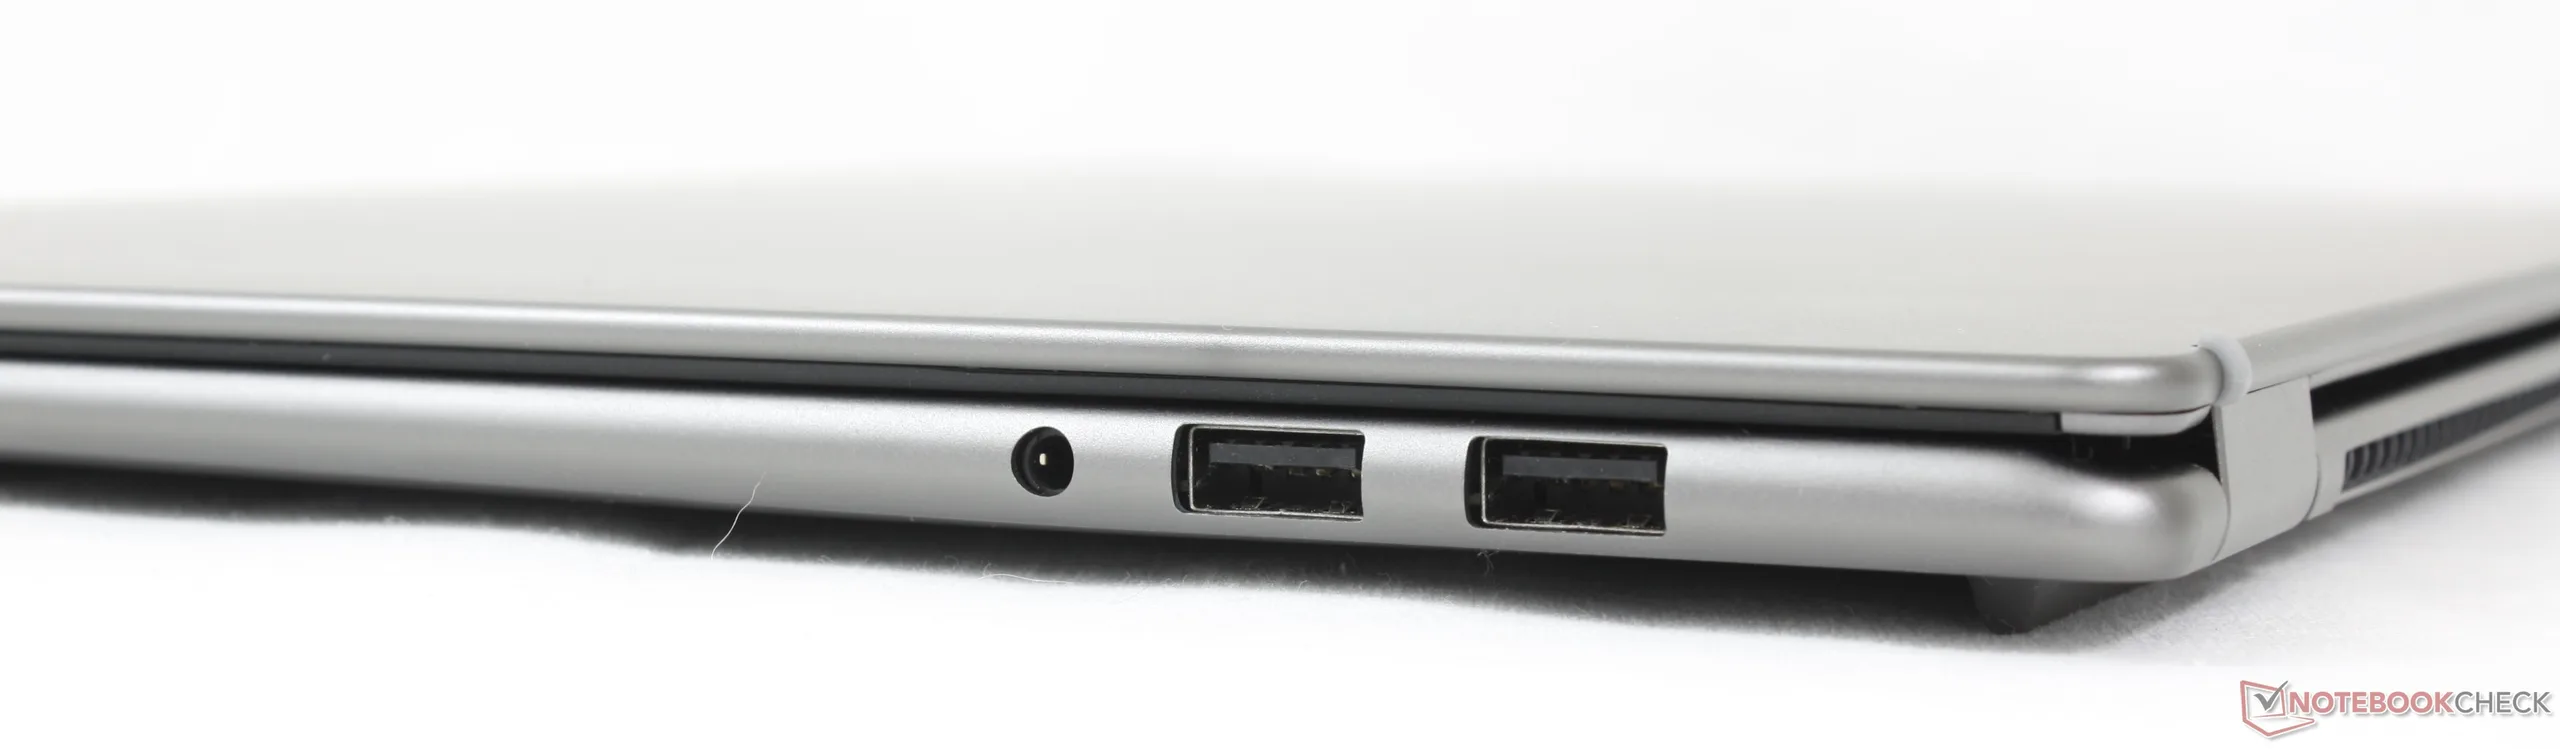
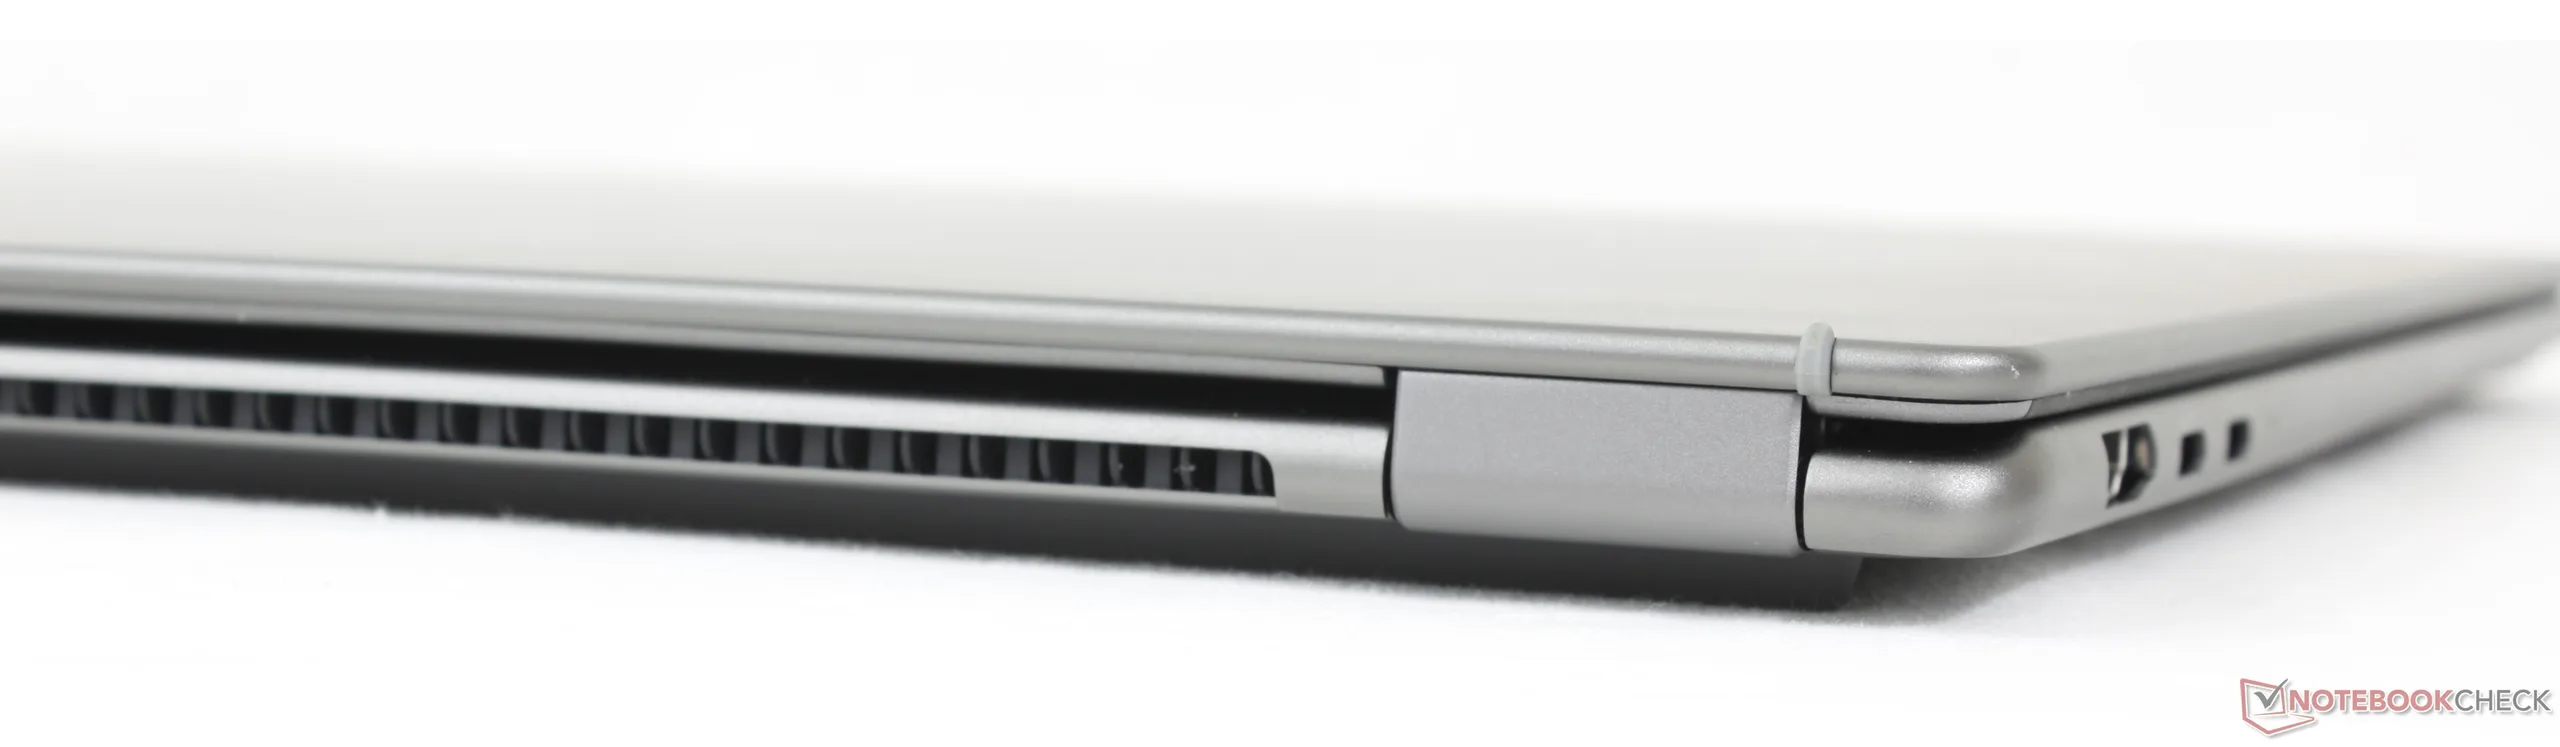
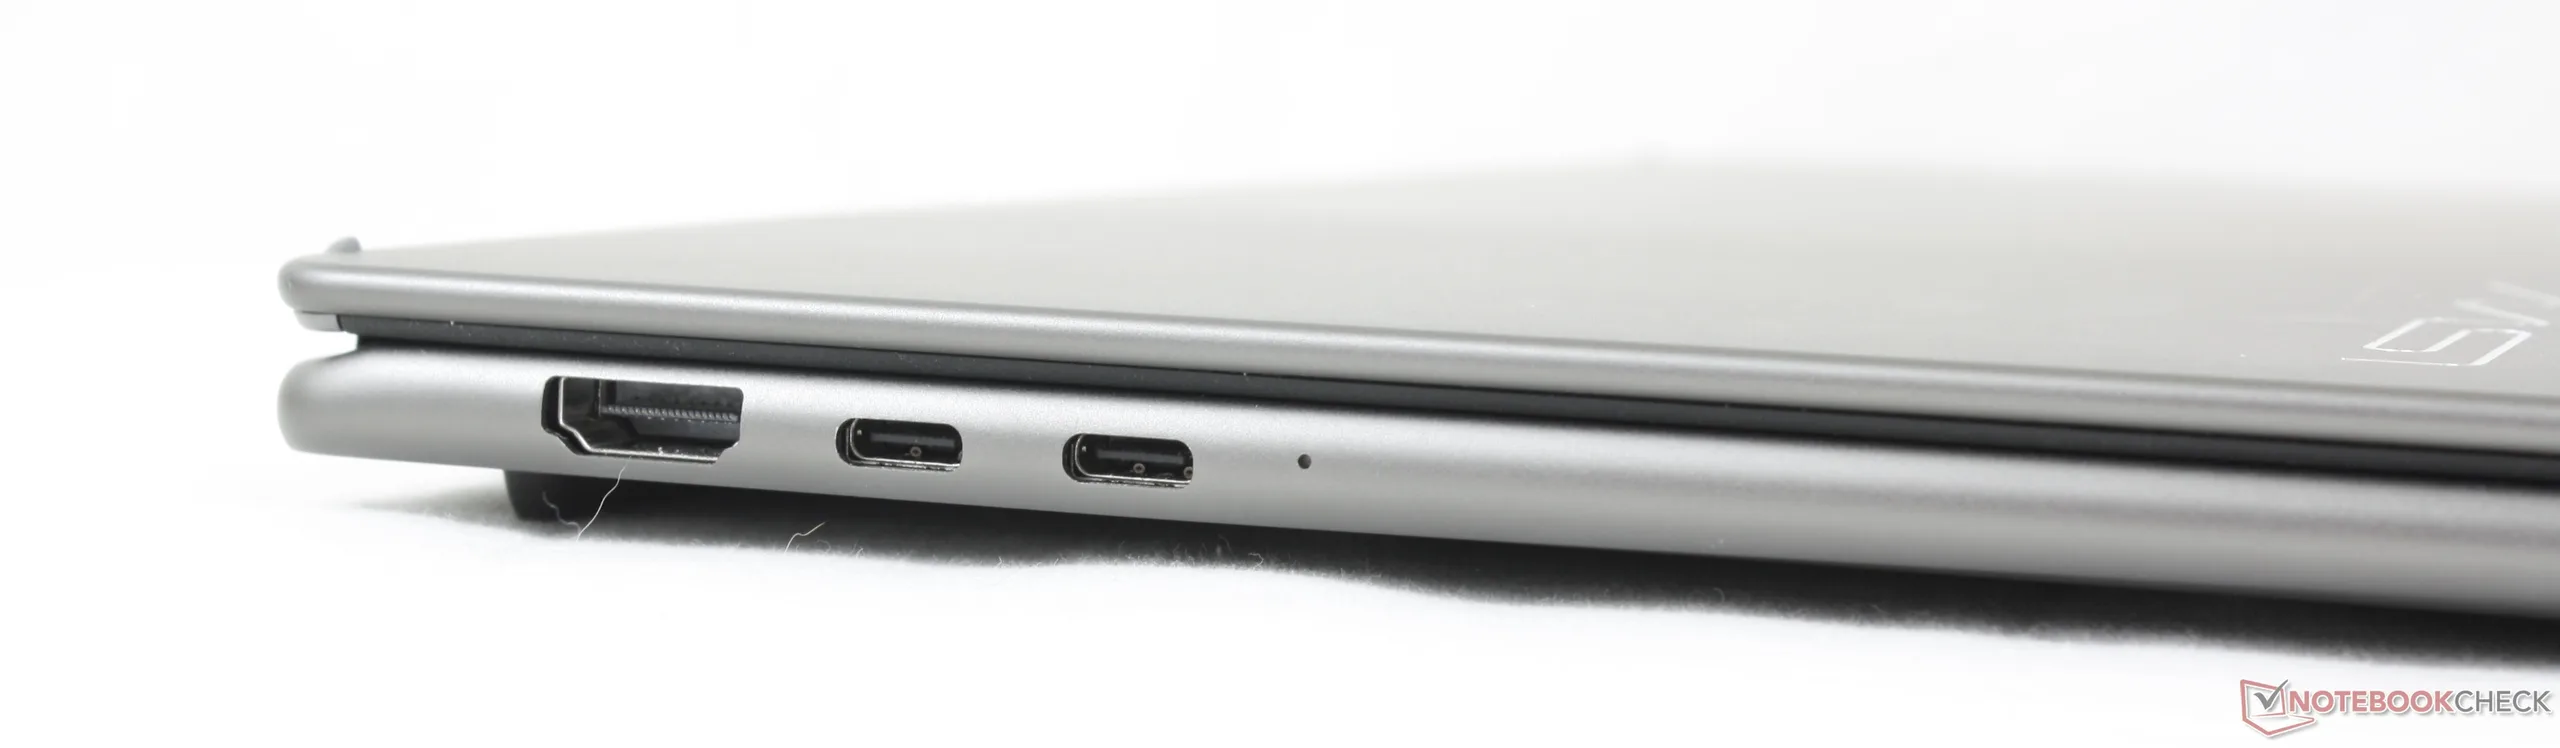
Conectividade
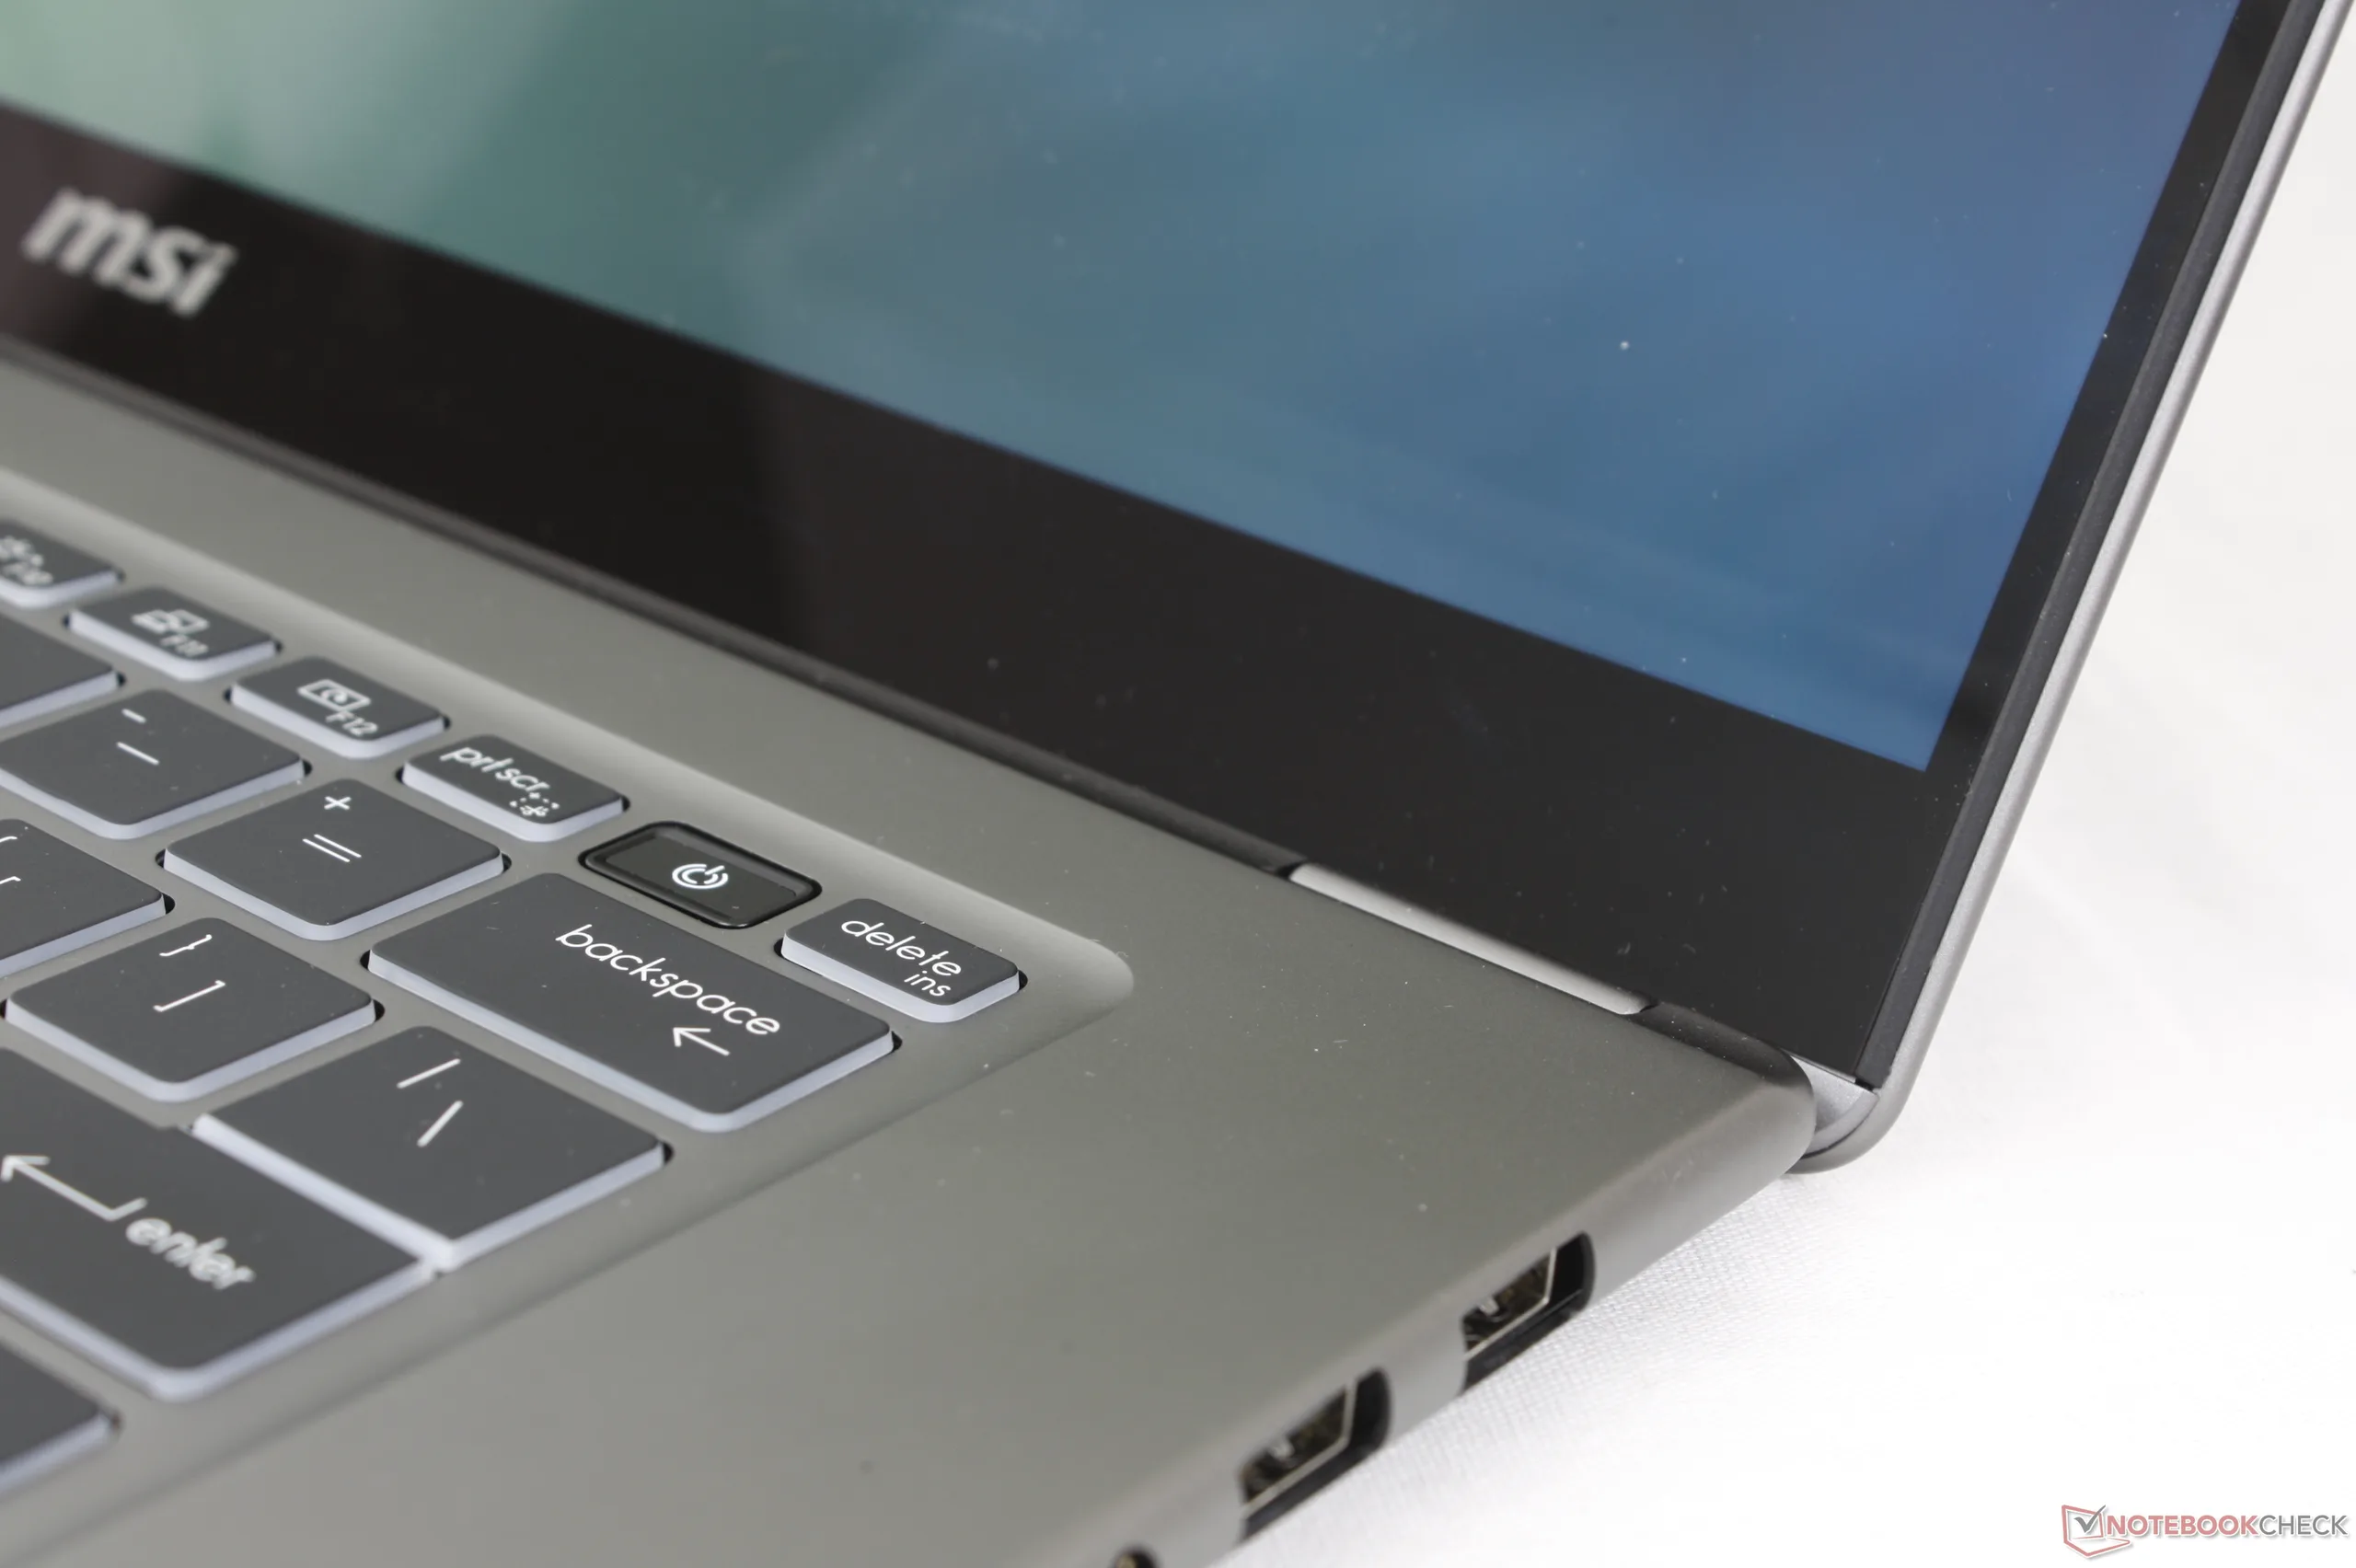
As opções de portas foram alteradas em relação ao modelo 2025. A MSI retirou a porta RJ-45, o leitor de cartão SD e a trava Kensington, enquanto adicionou uma segunda porta USB-A. As mudanças são um misto, dependendo das preferências do usuário.
O posicionamento das portas também poderia ter sido melhor, já que o carregamento USB-C está limitado apenas ao lado esquerdo do sistema.

Comunicação
Webcam
A webcam de 2 MP vem de fábrica com IR e um obturador de privacidade físico.


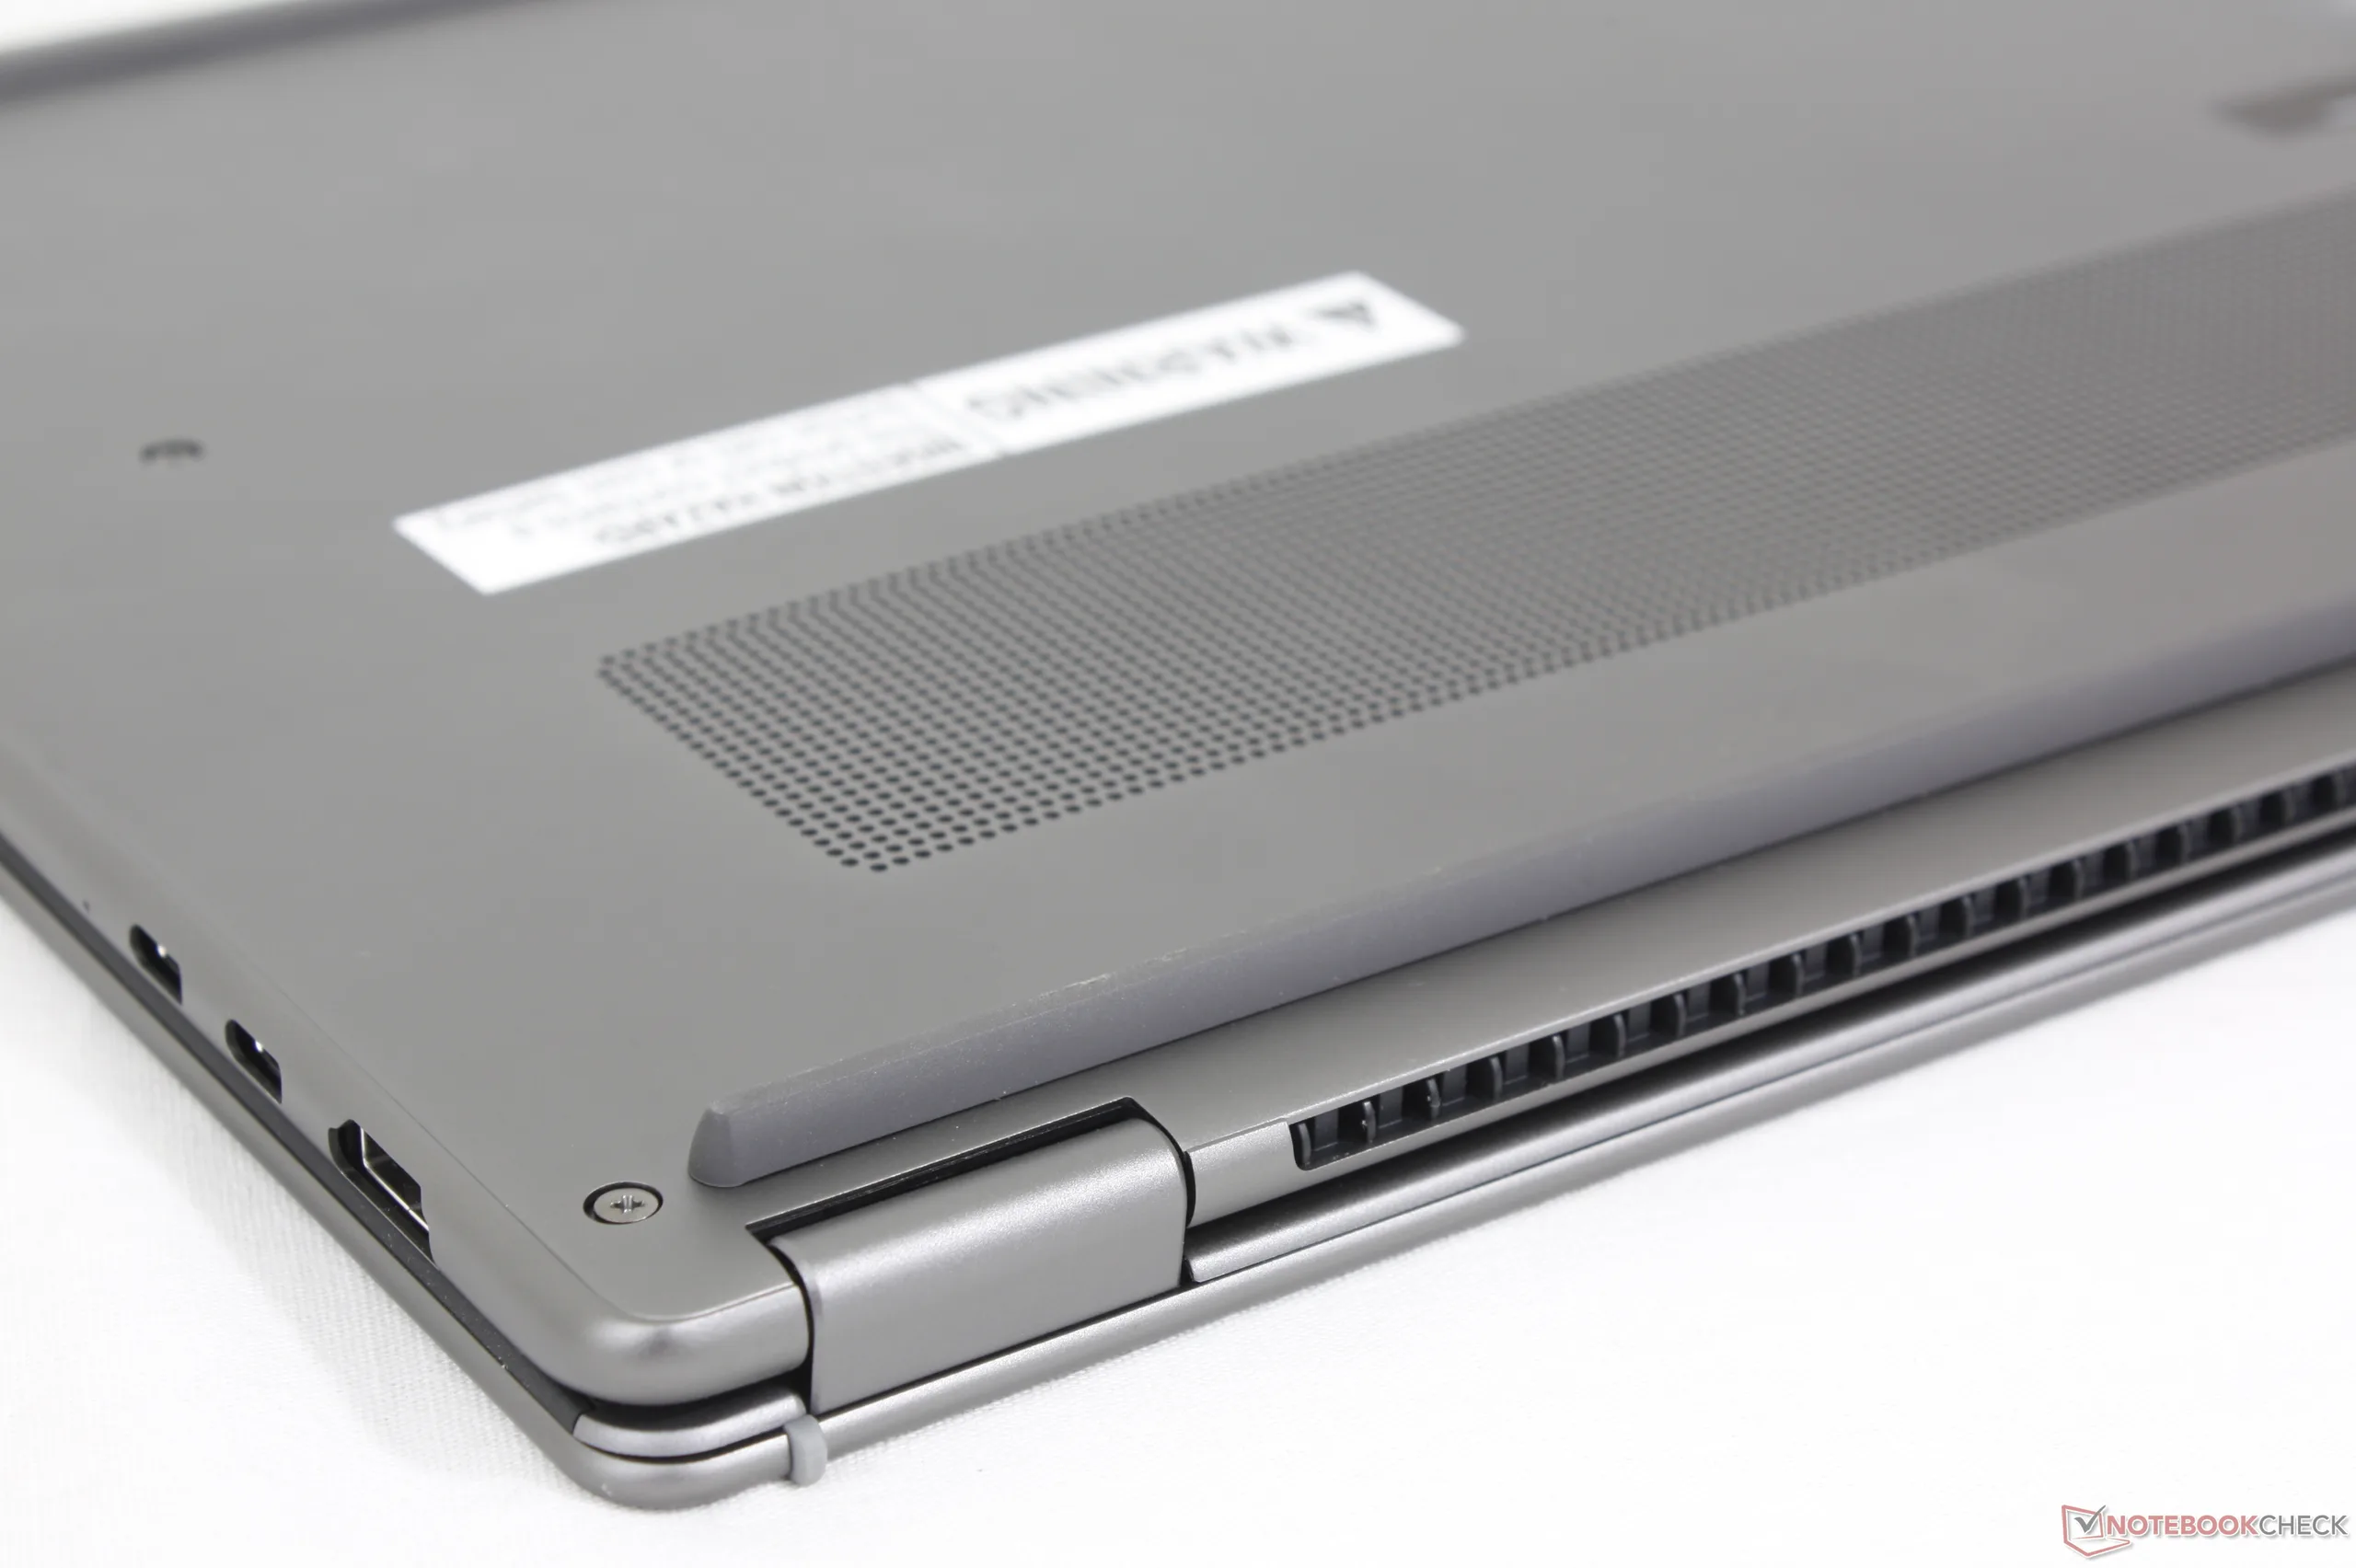
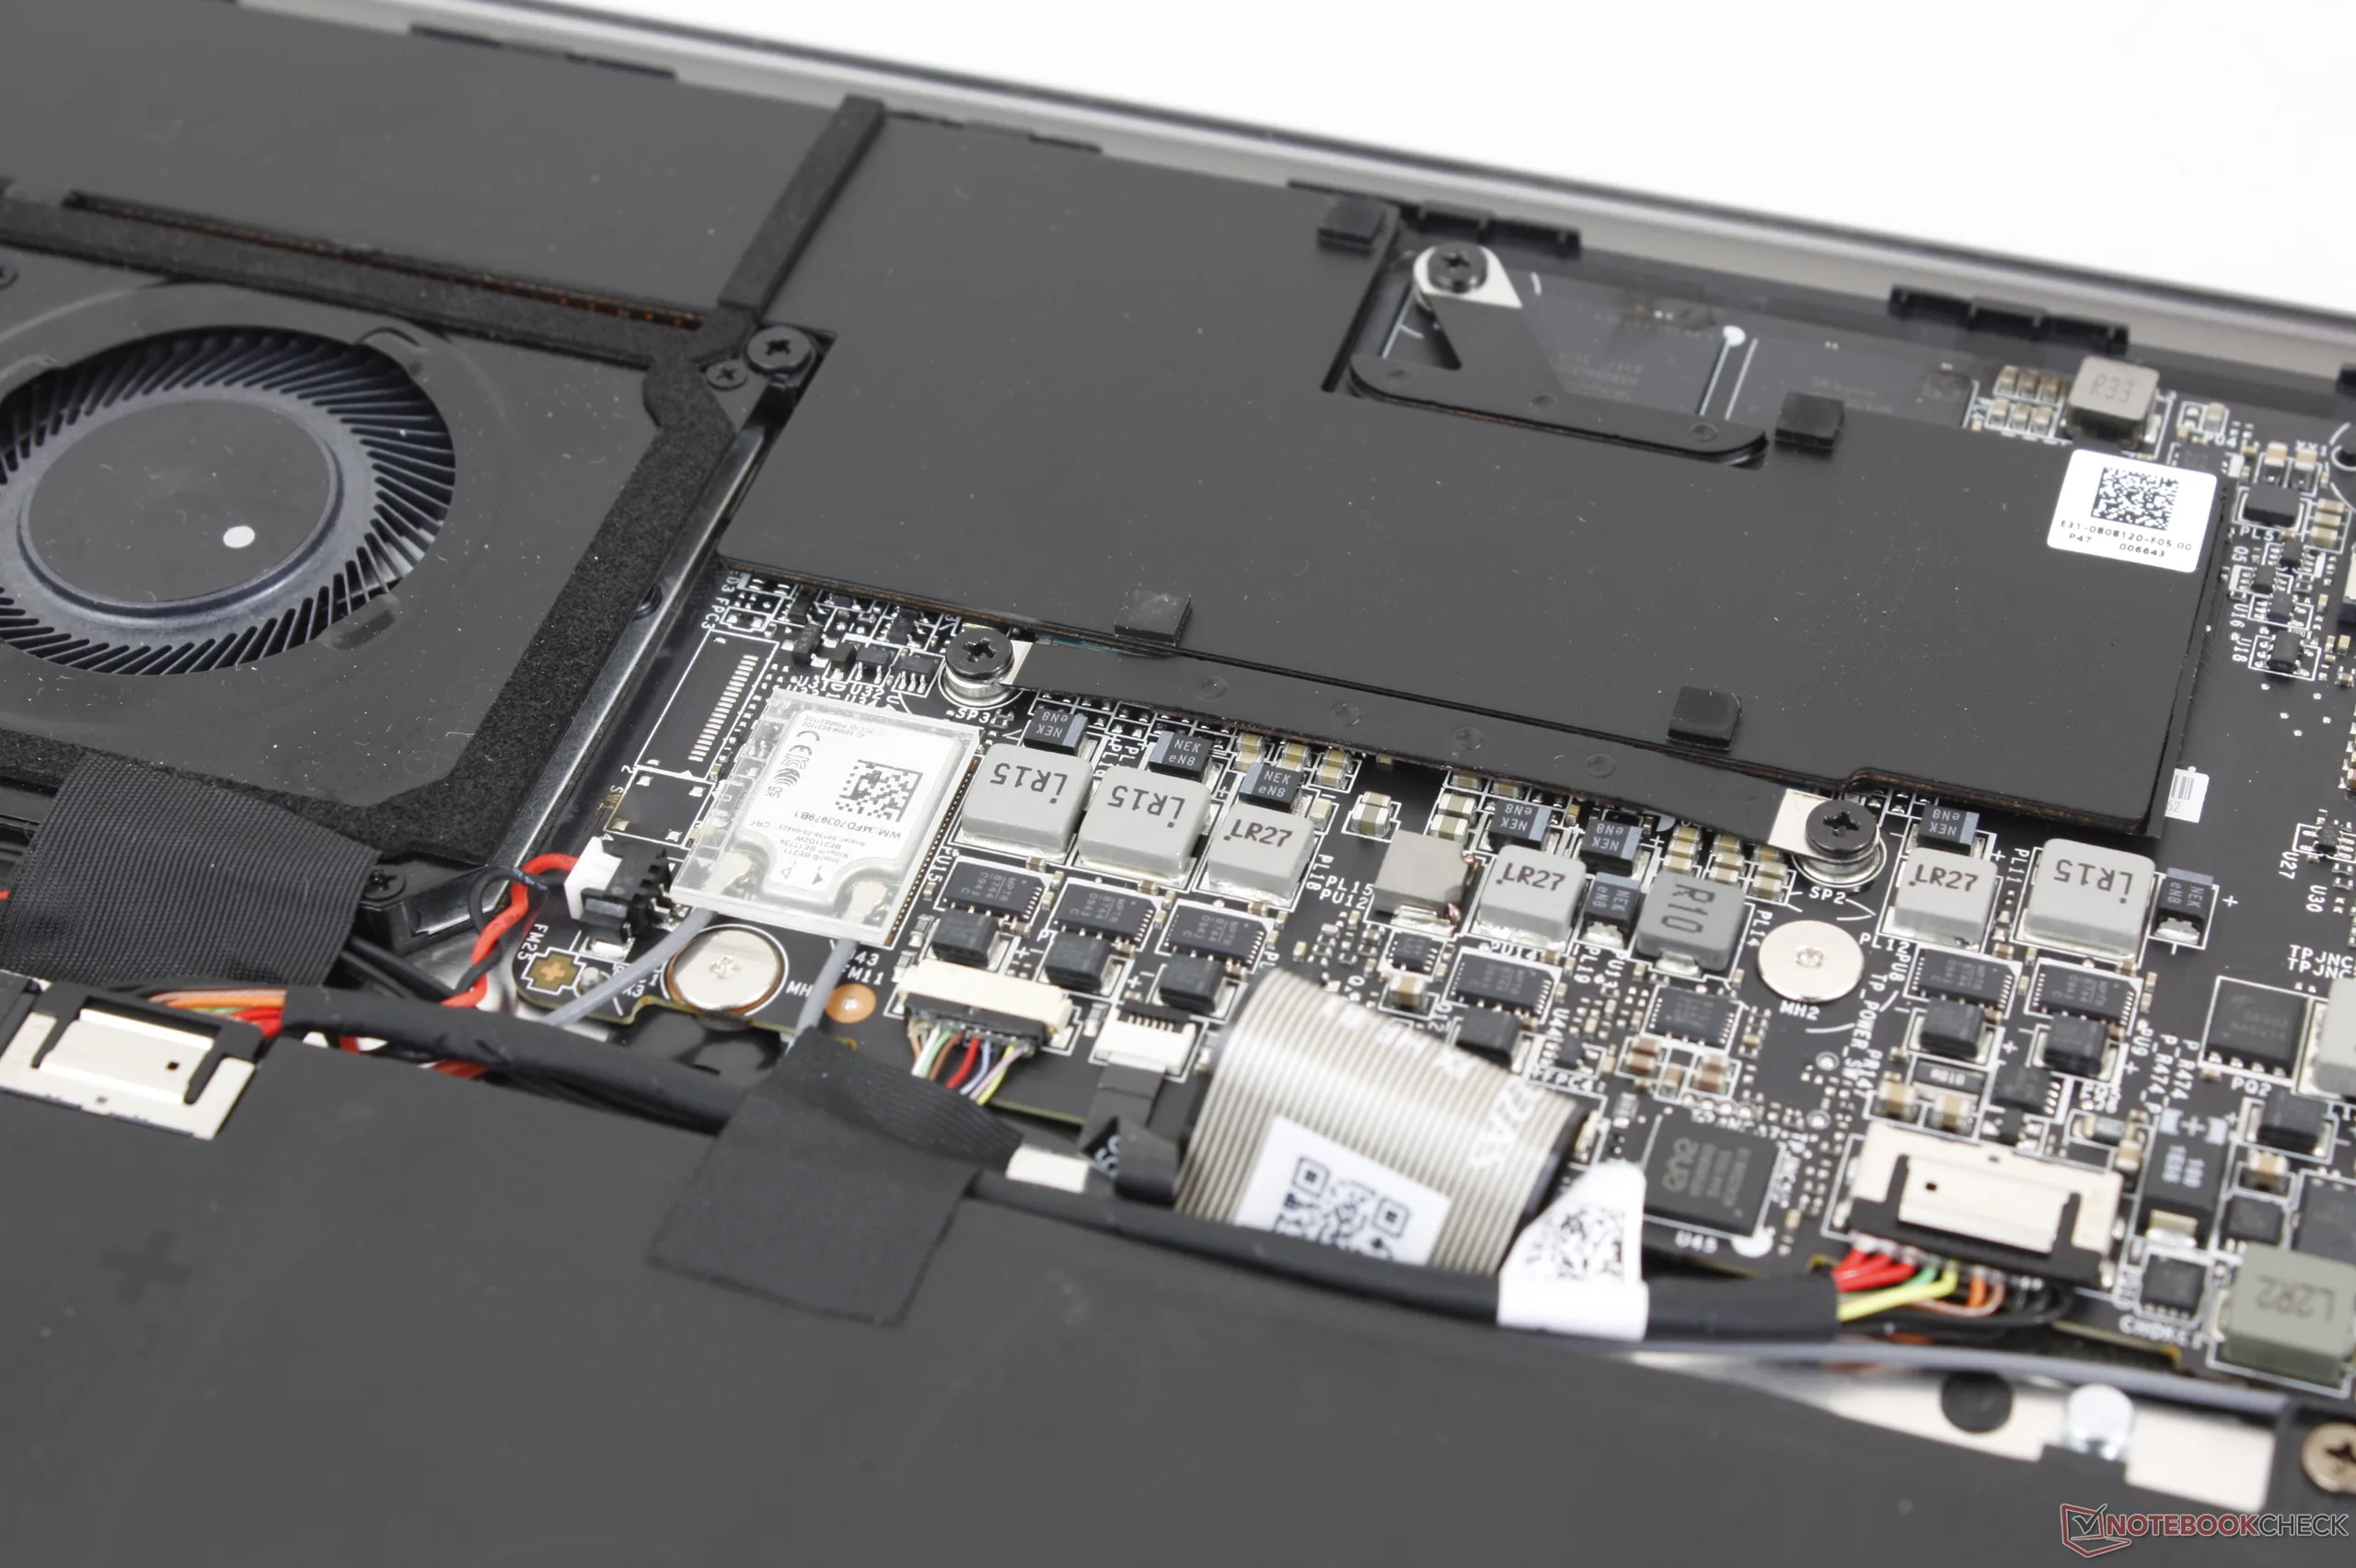
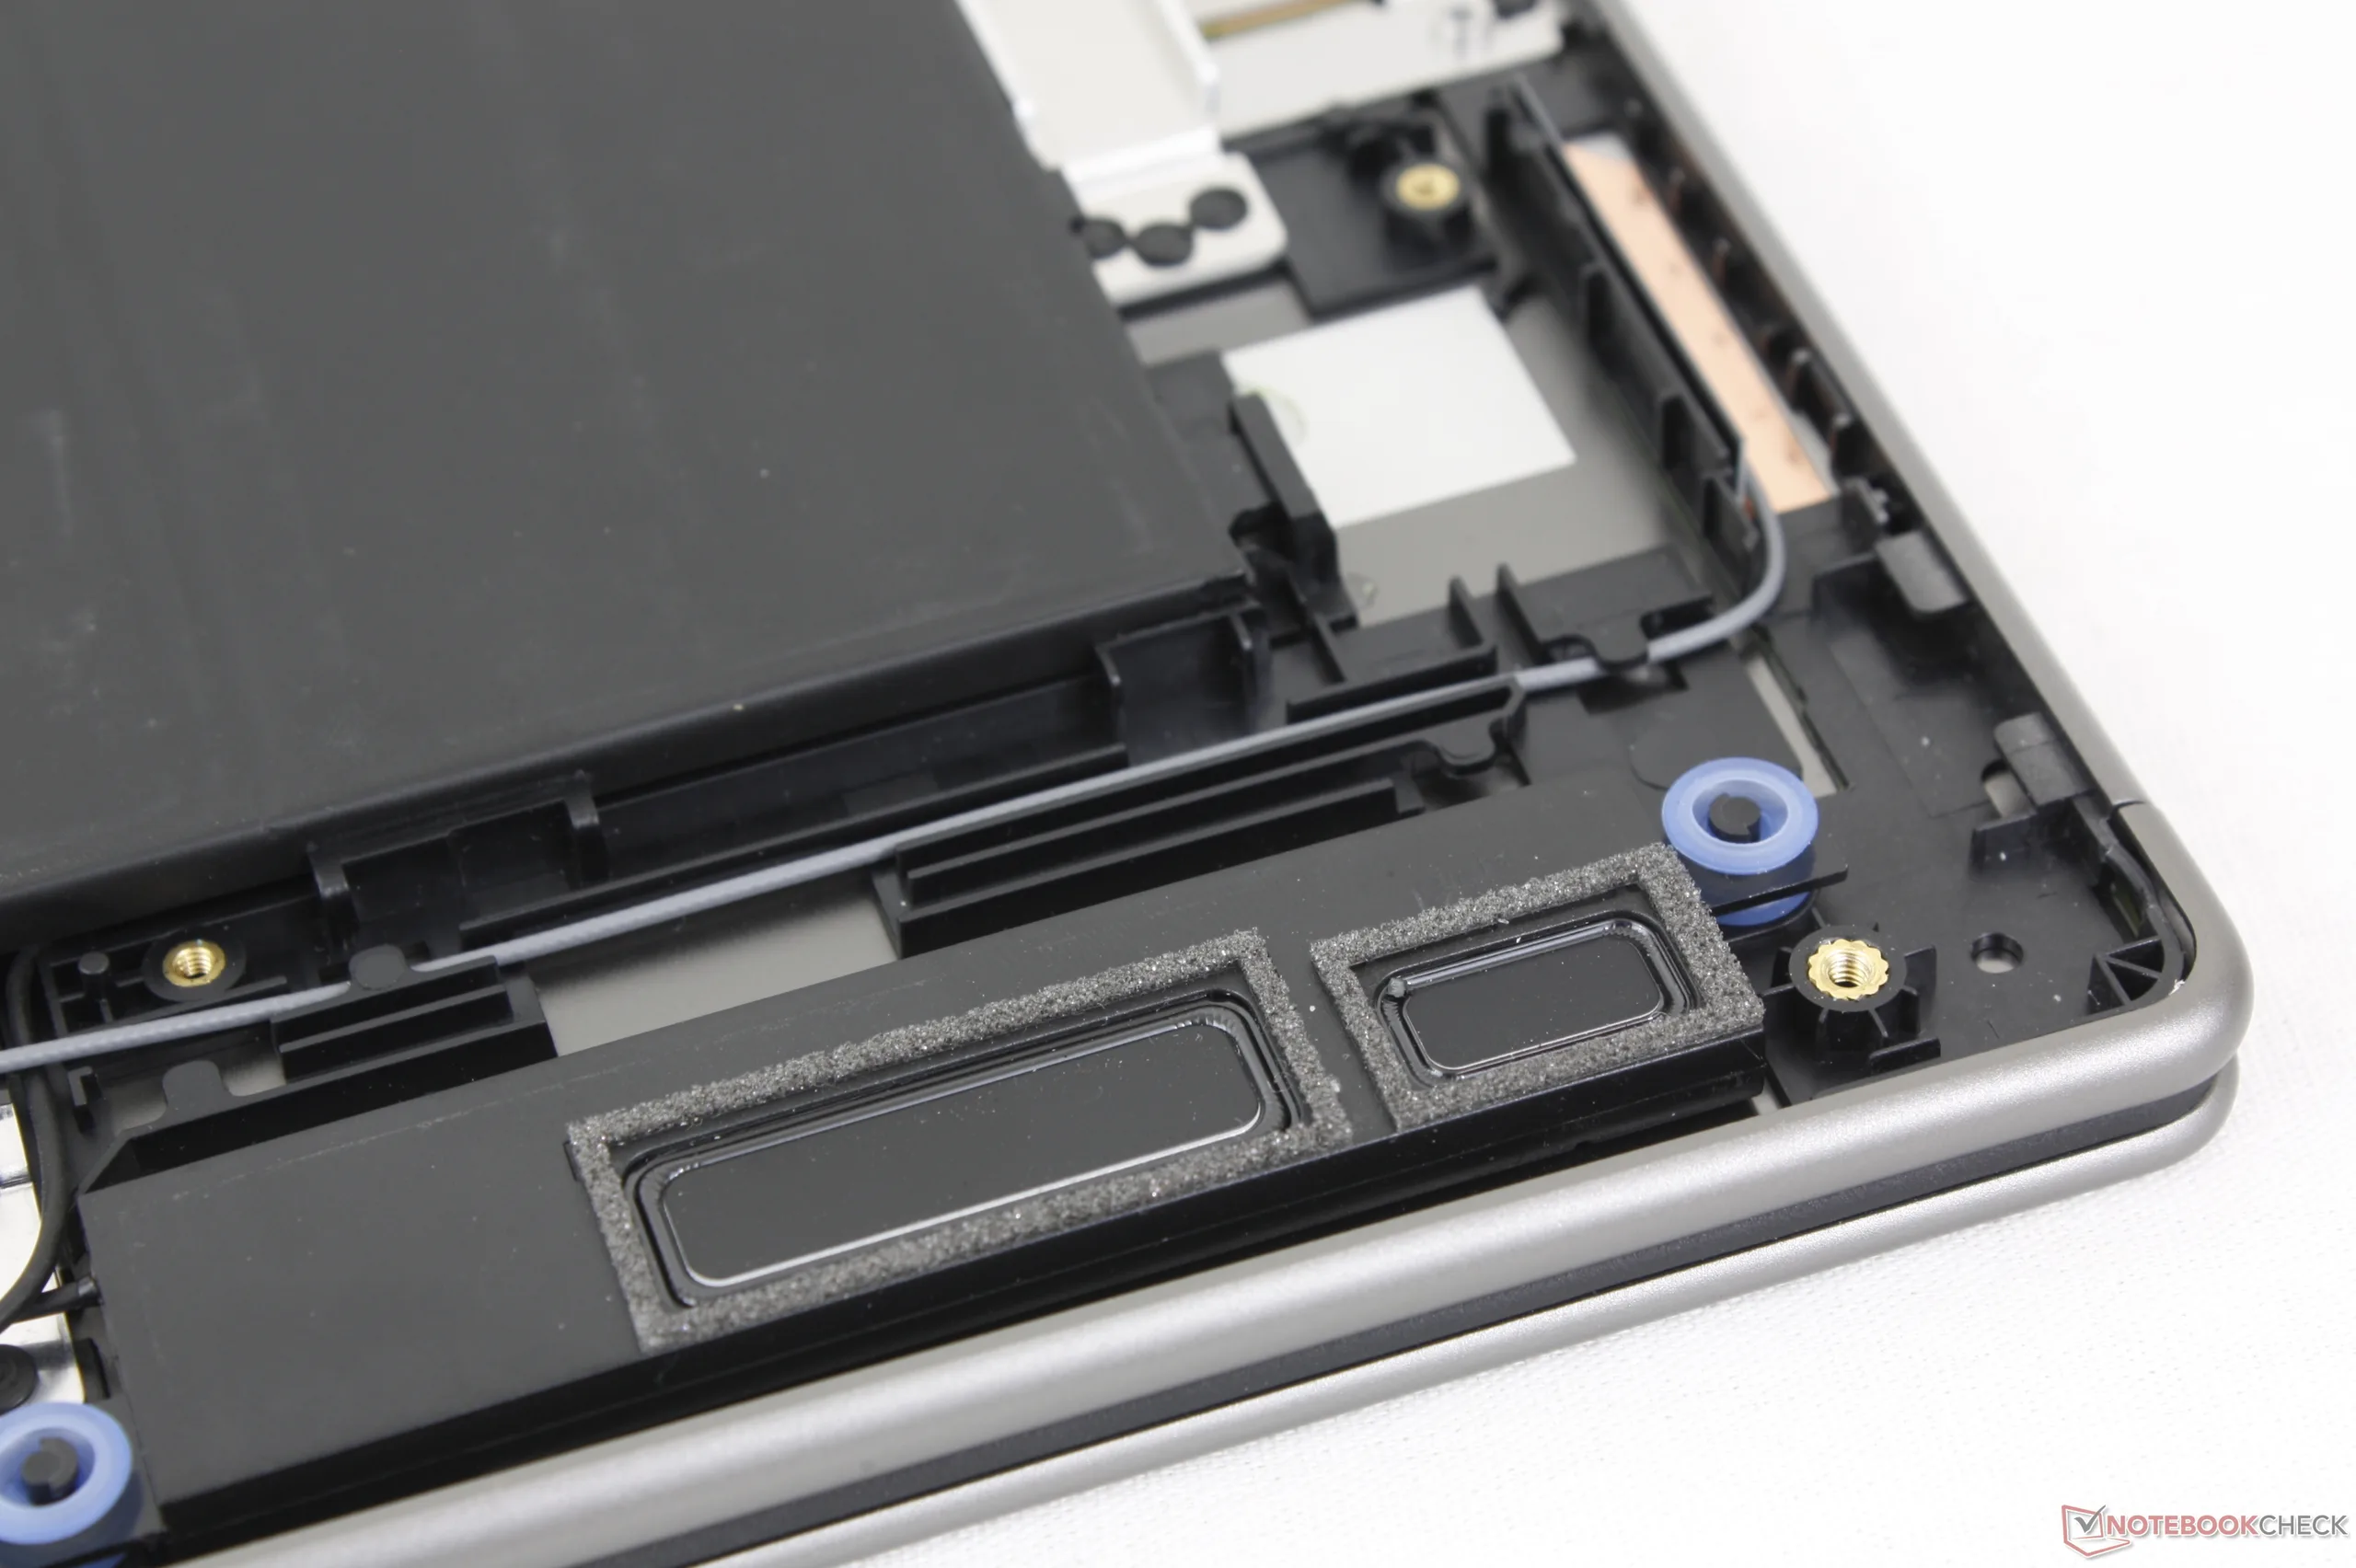
Manutenção
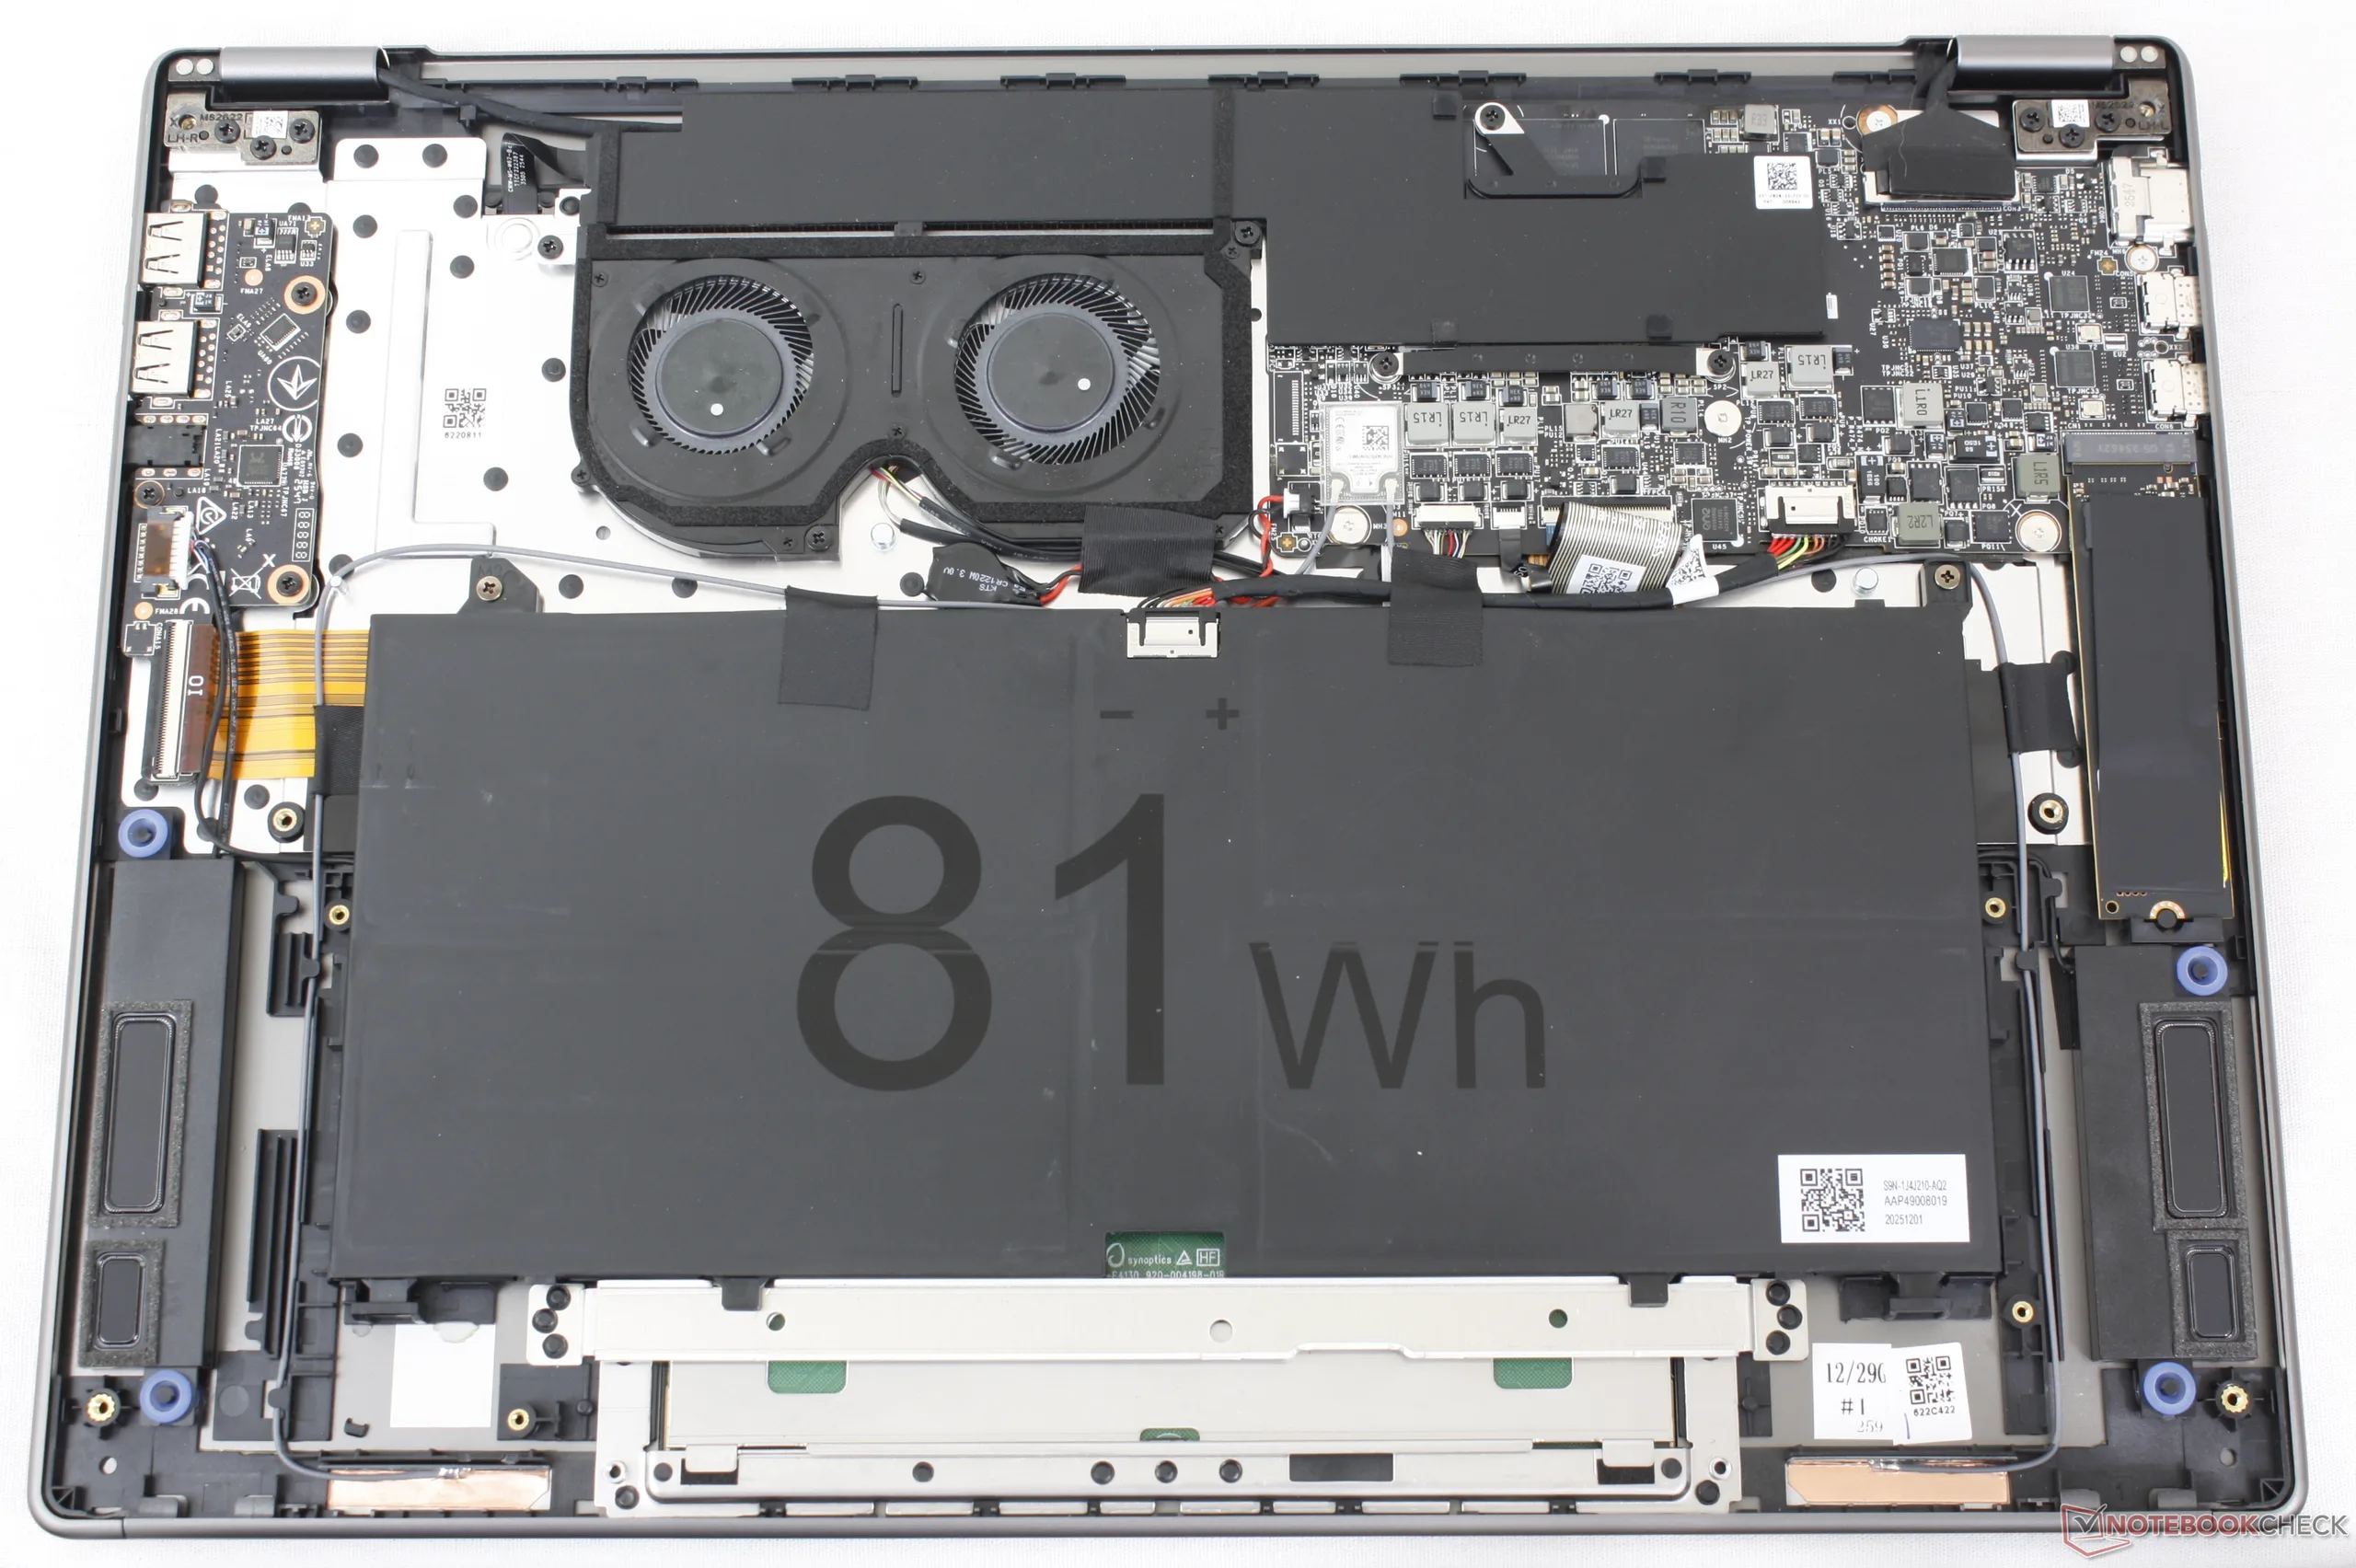
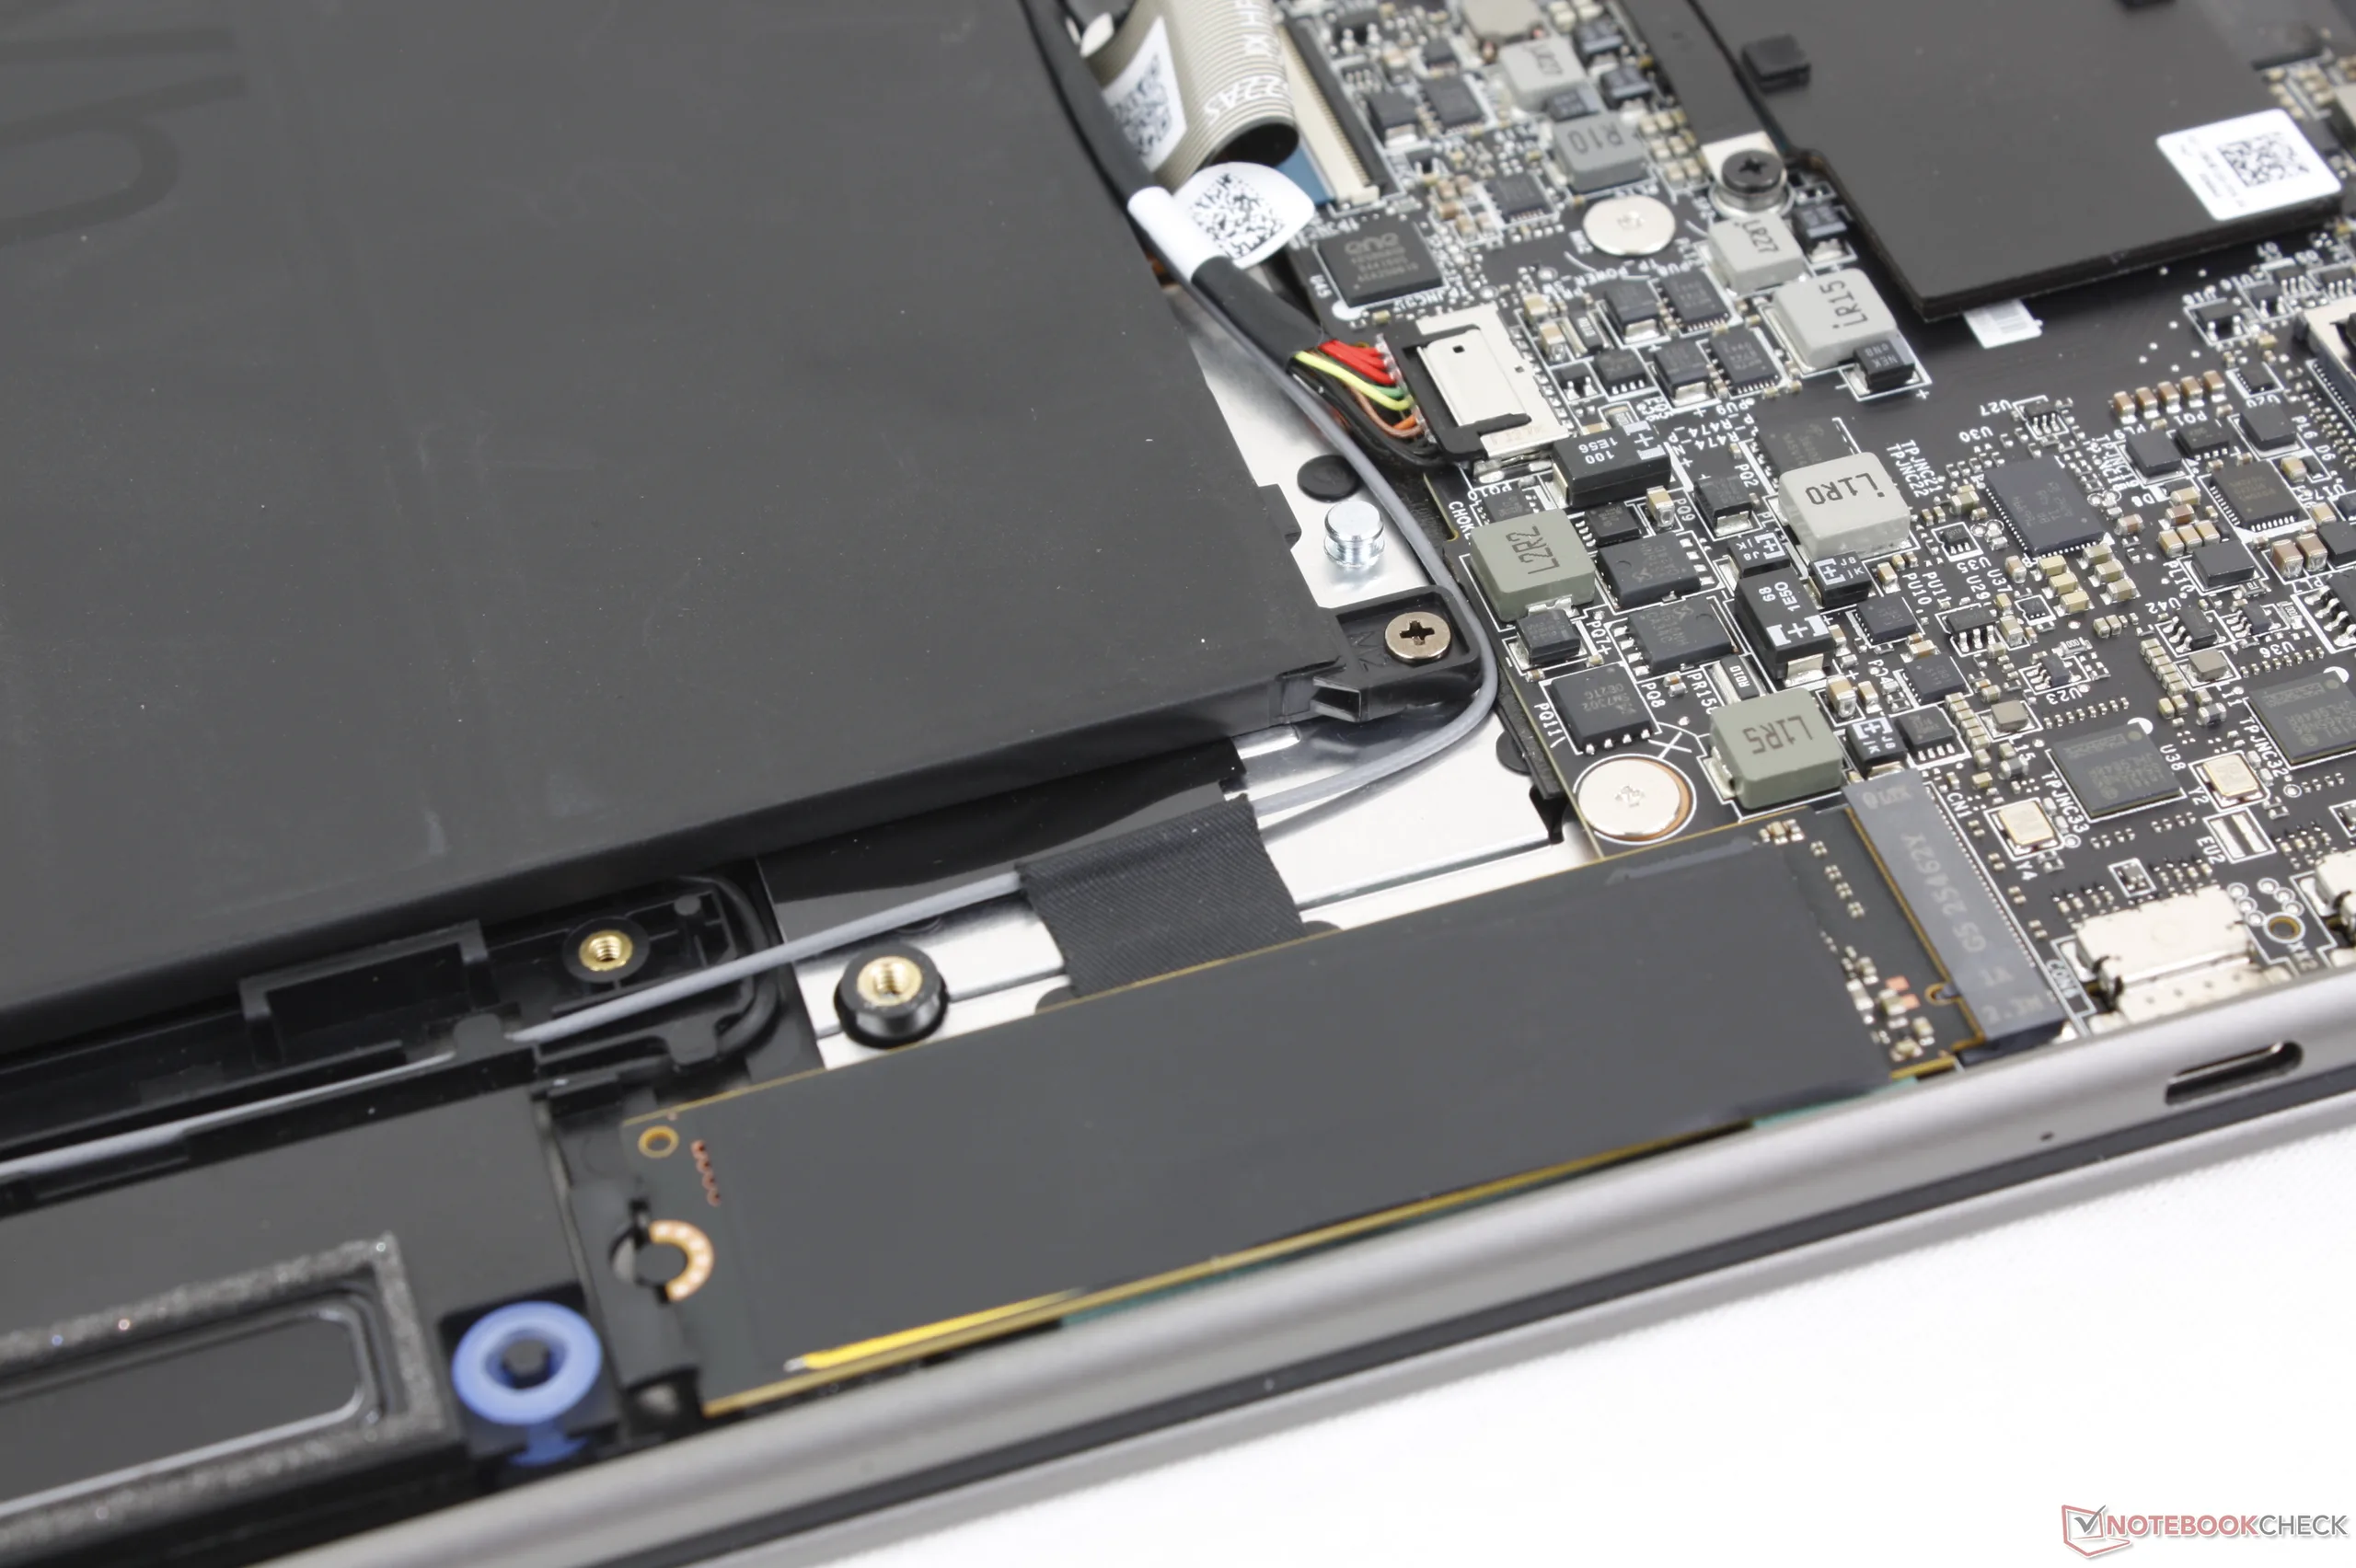
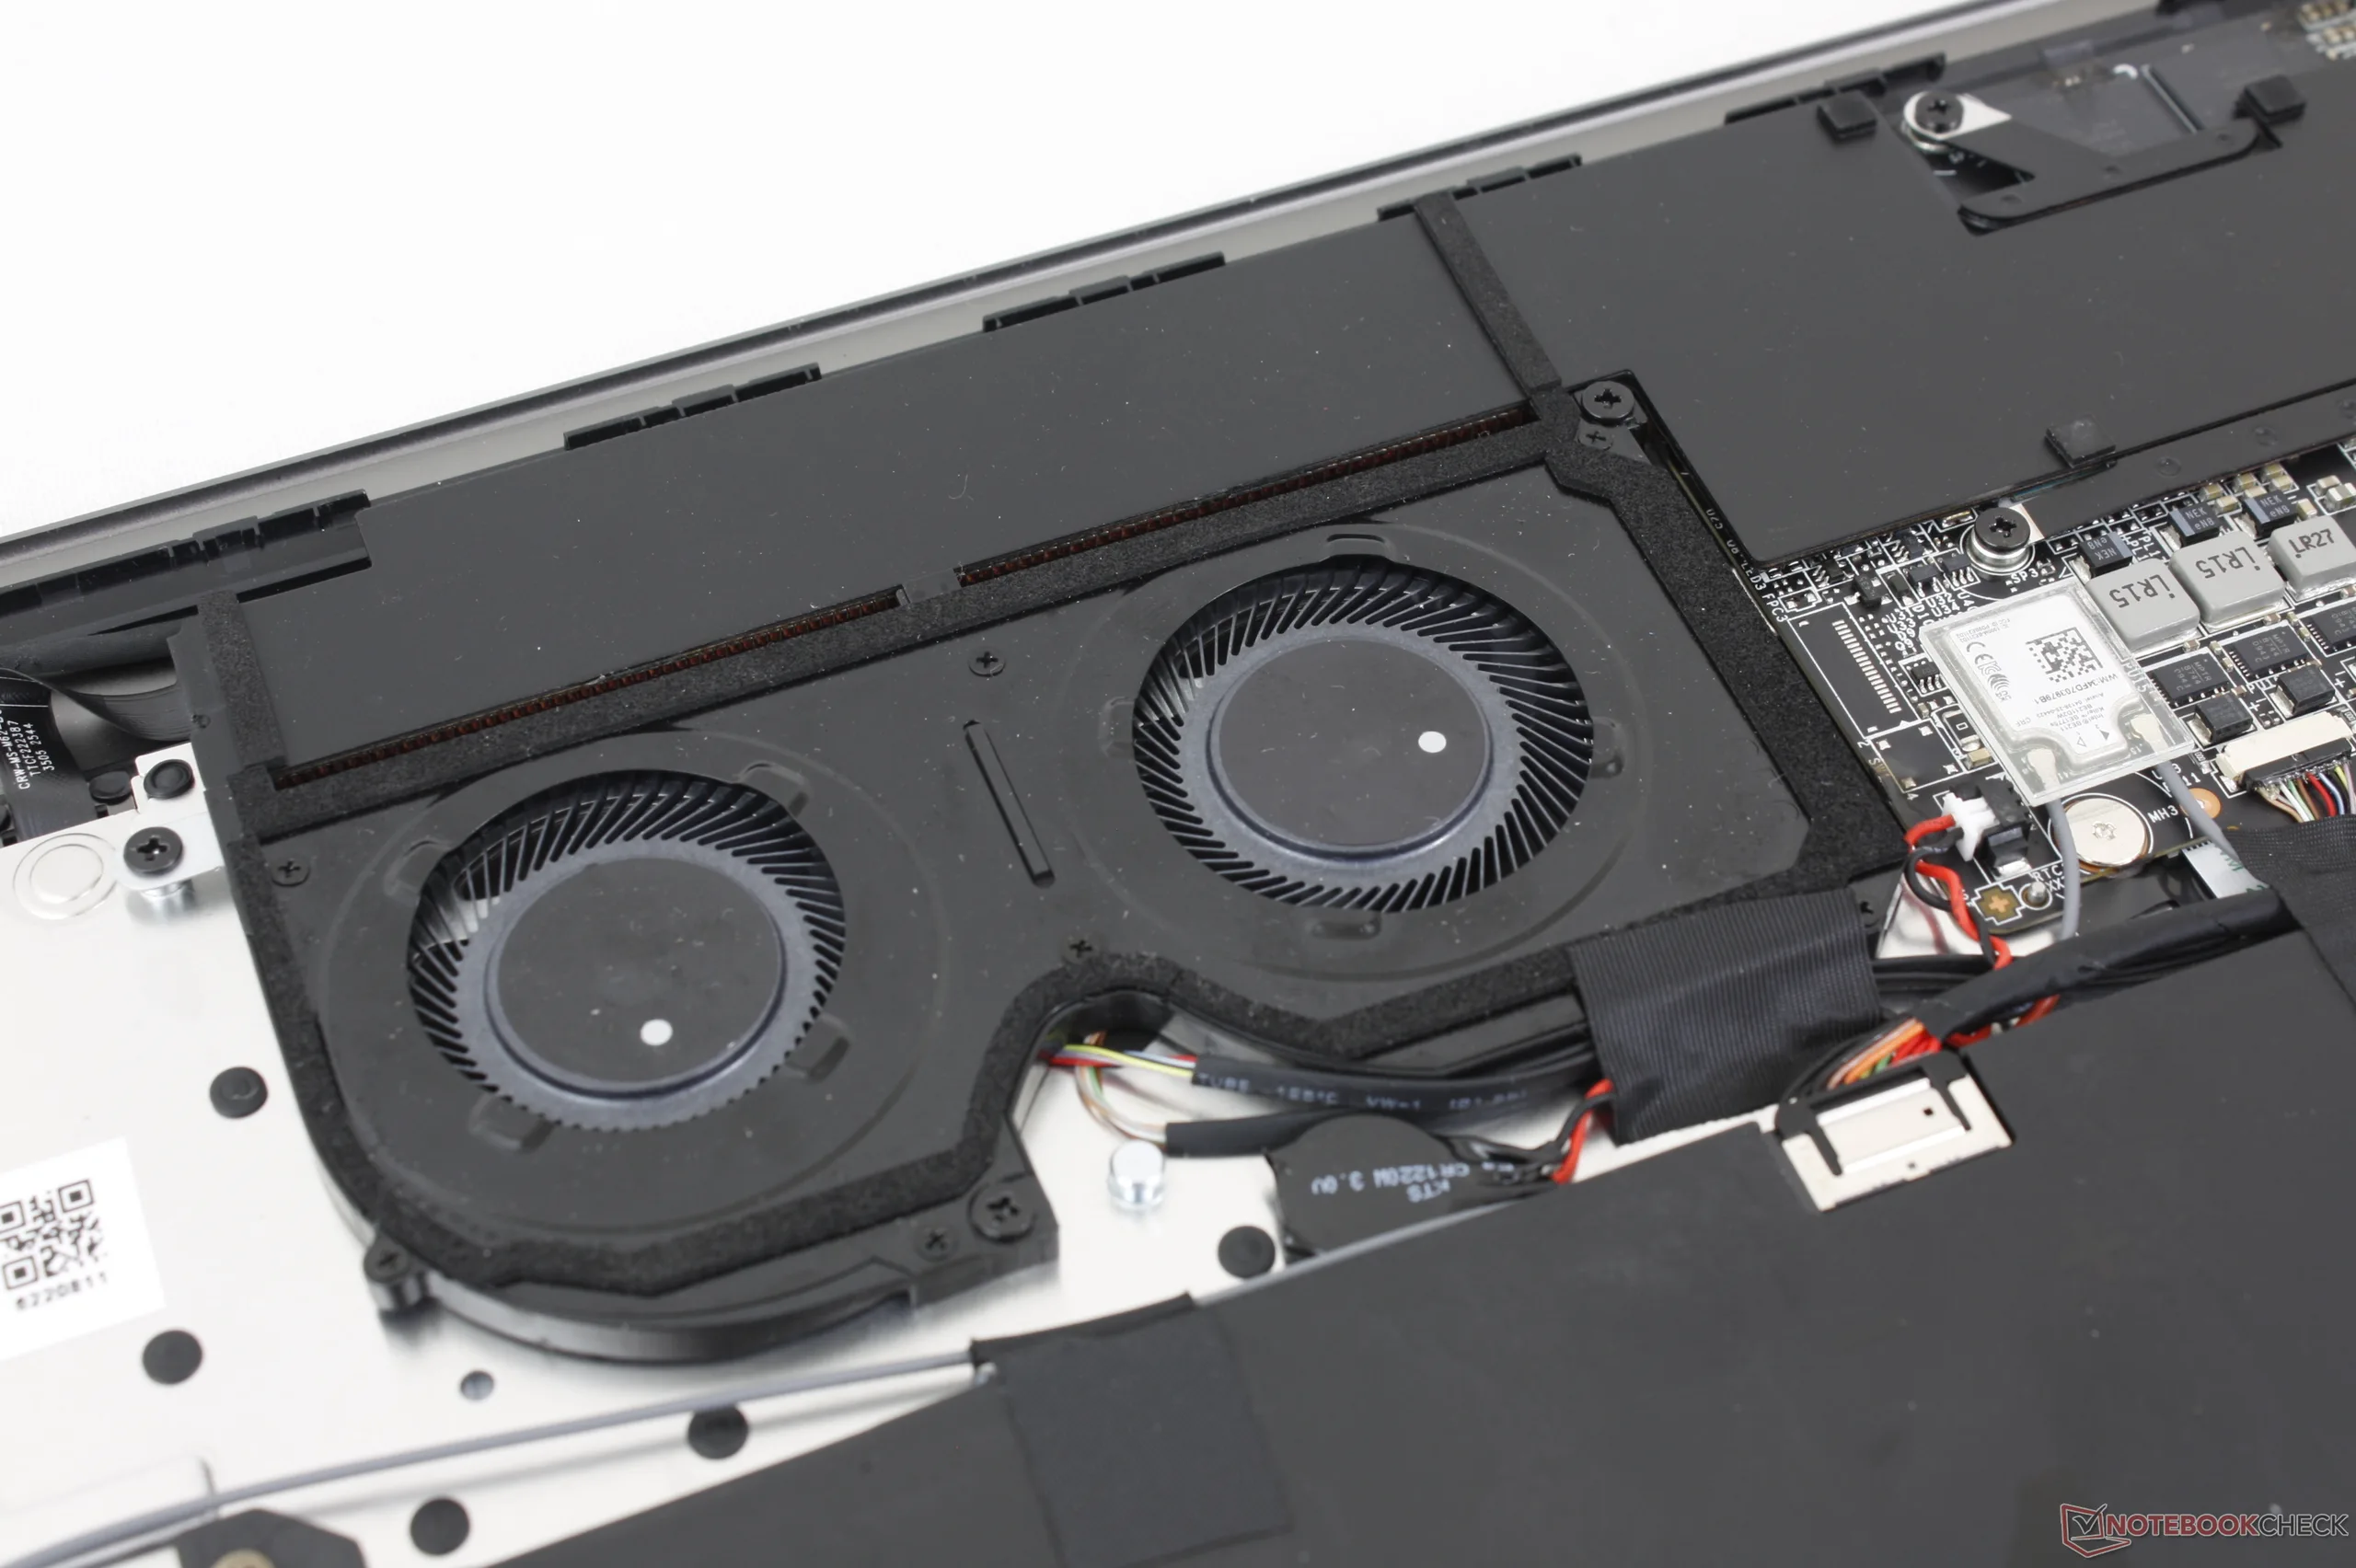
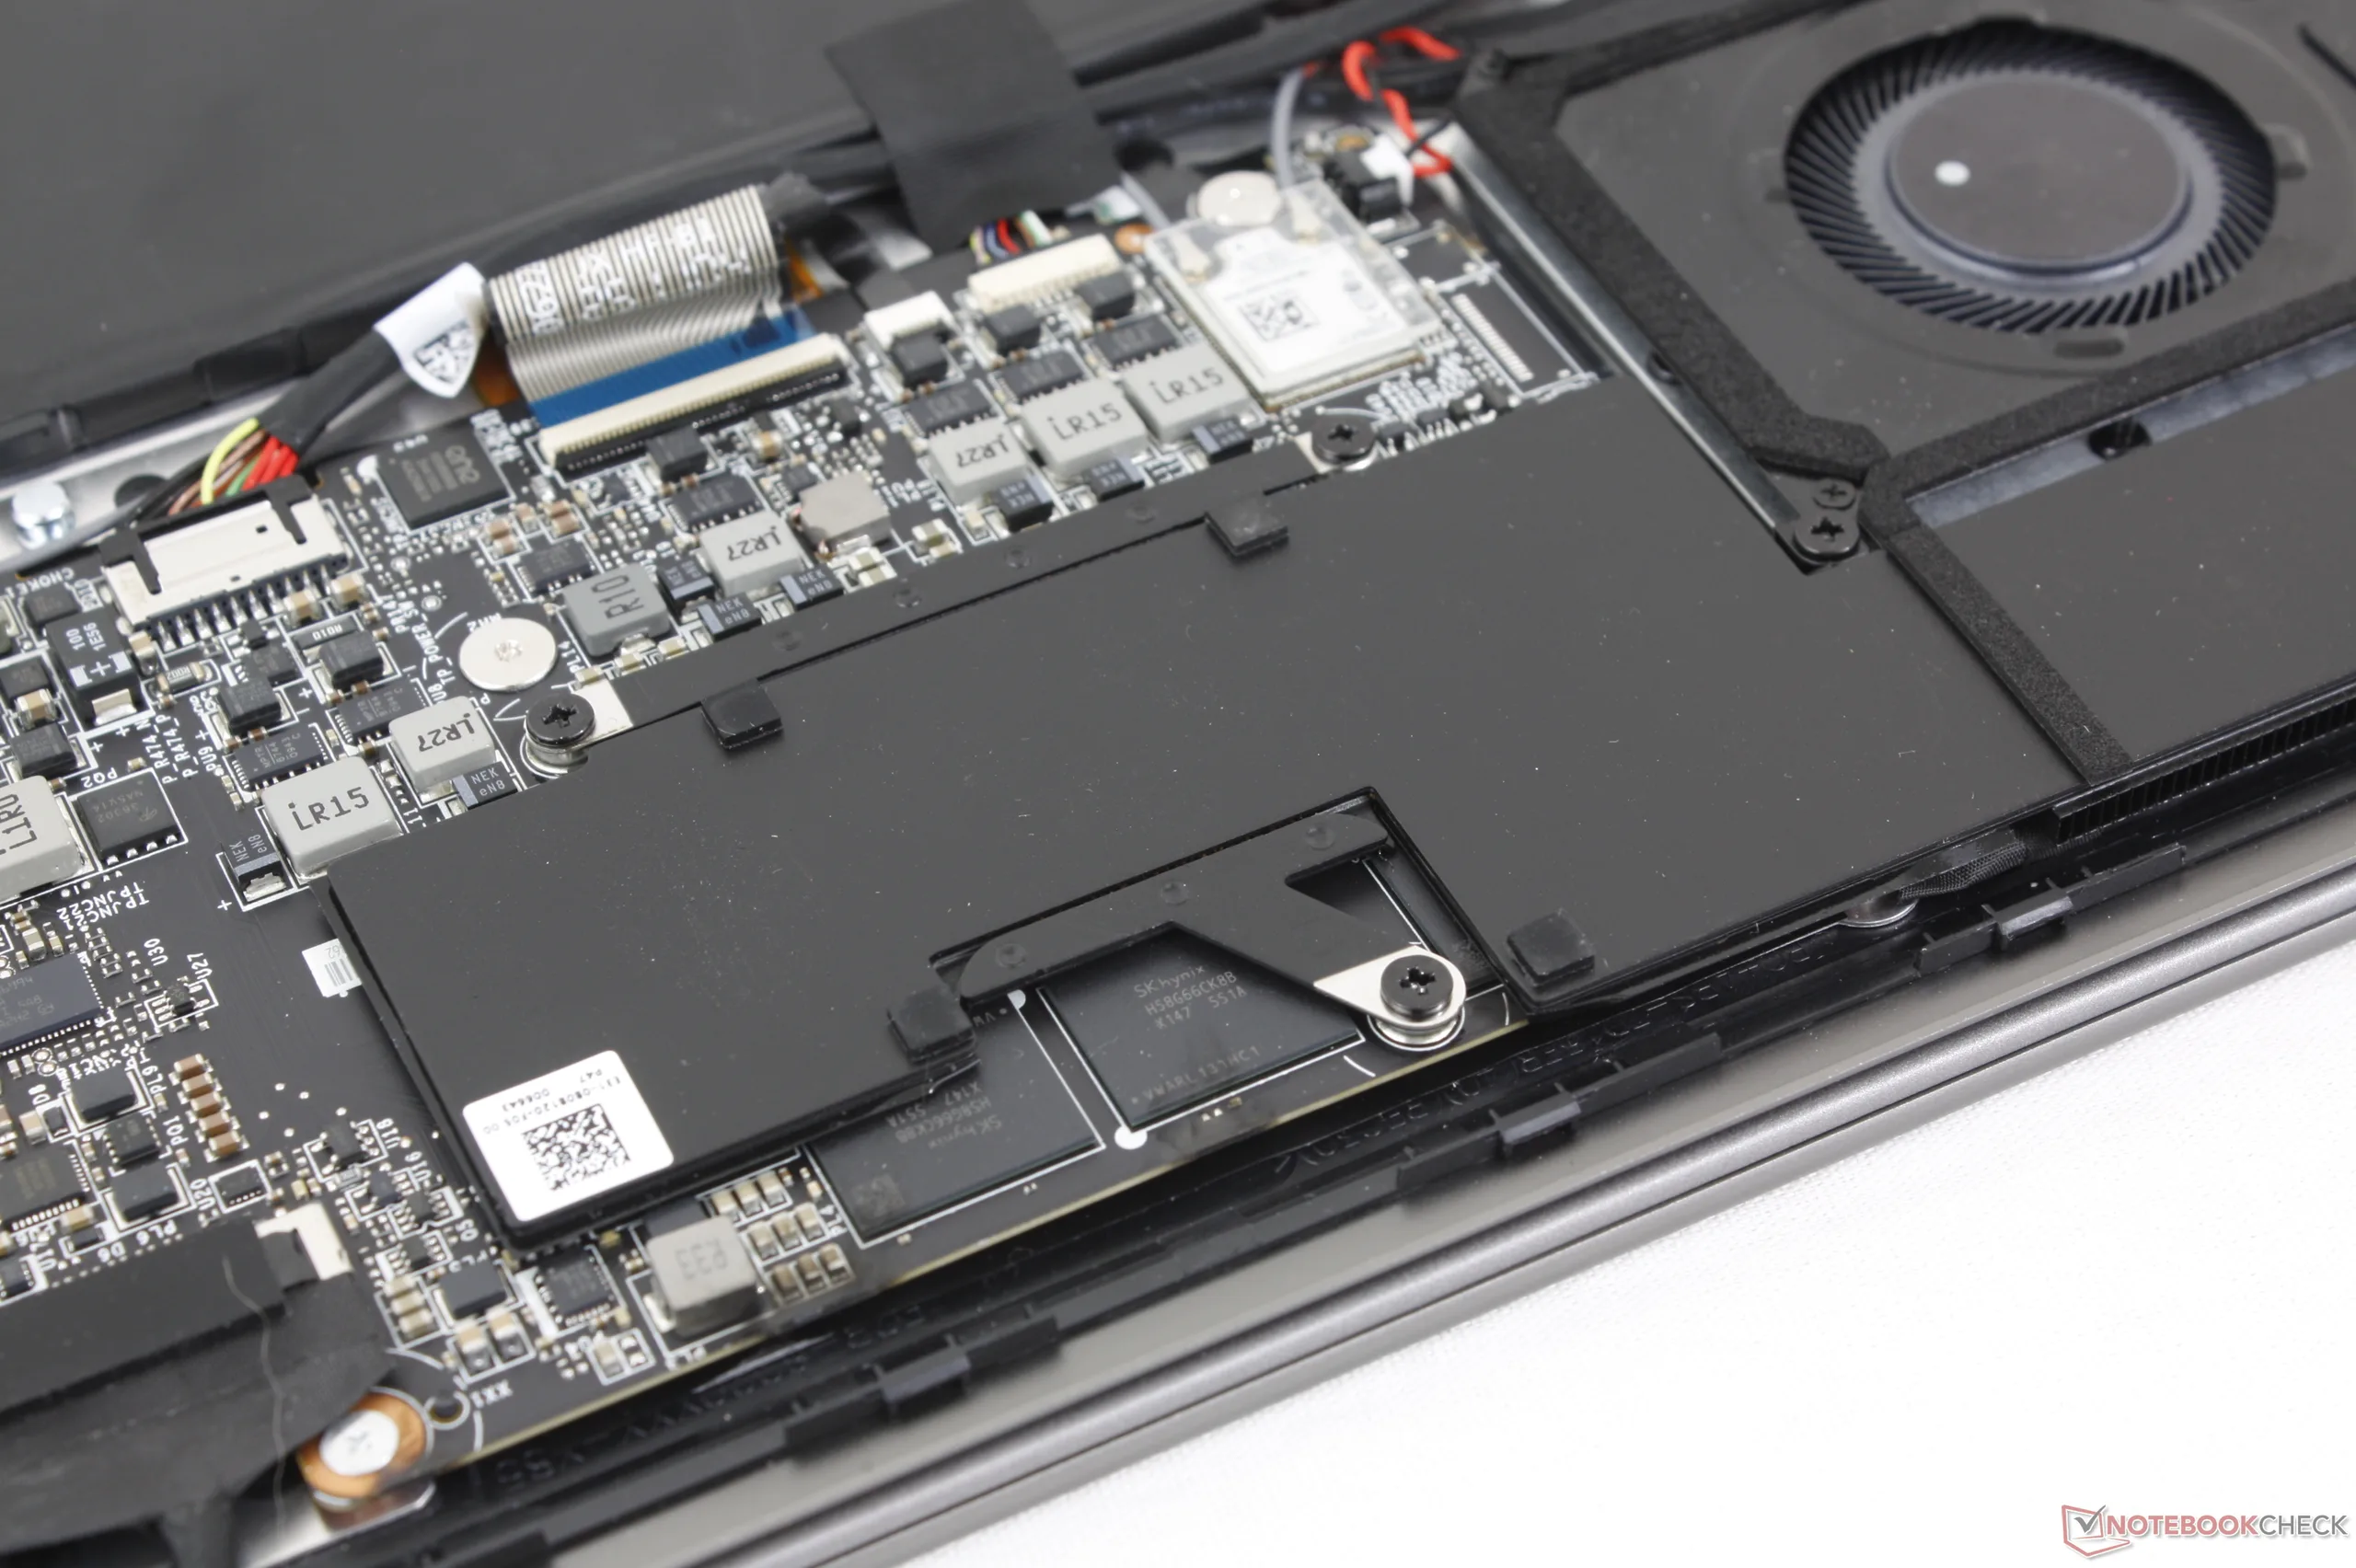
O painel inferior é facilmente removível com apenas uma chave de fenda Phillips e uma ponta afiada. A placa-mãe foi completamente revisada em relação ao modelo de 2025, conforme mostrado abaixo. Mais notavelmente, o modelo agora suporta apenas um SSD M.2 em vez de dois, enquanto a capacidade da bateria foi reduzida provavelmente para economizar peso.

Sustentabilidade
O uso de materiais reciclados durante a fabricação não é explicitamente declarado pelo fabricante. Entretanto, a embalagem é certificada pelo FSC e consiste em papel e plástico.
Acessórios e garantia
Não há extras na caixa além do adaptador CA e da documentação. A garantia limitada de um ano do fabricante se aplica se o produto for comprado nos EUA.
Dispositivos de entrada
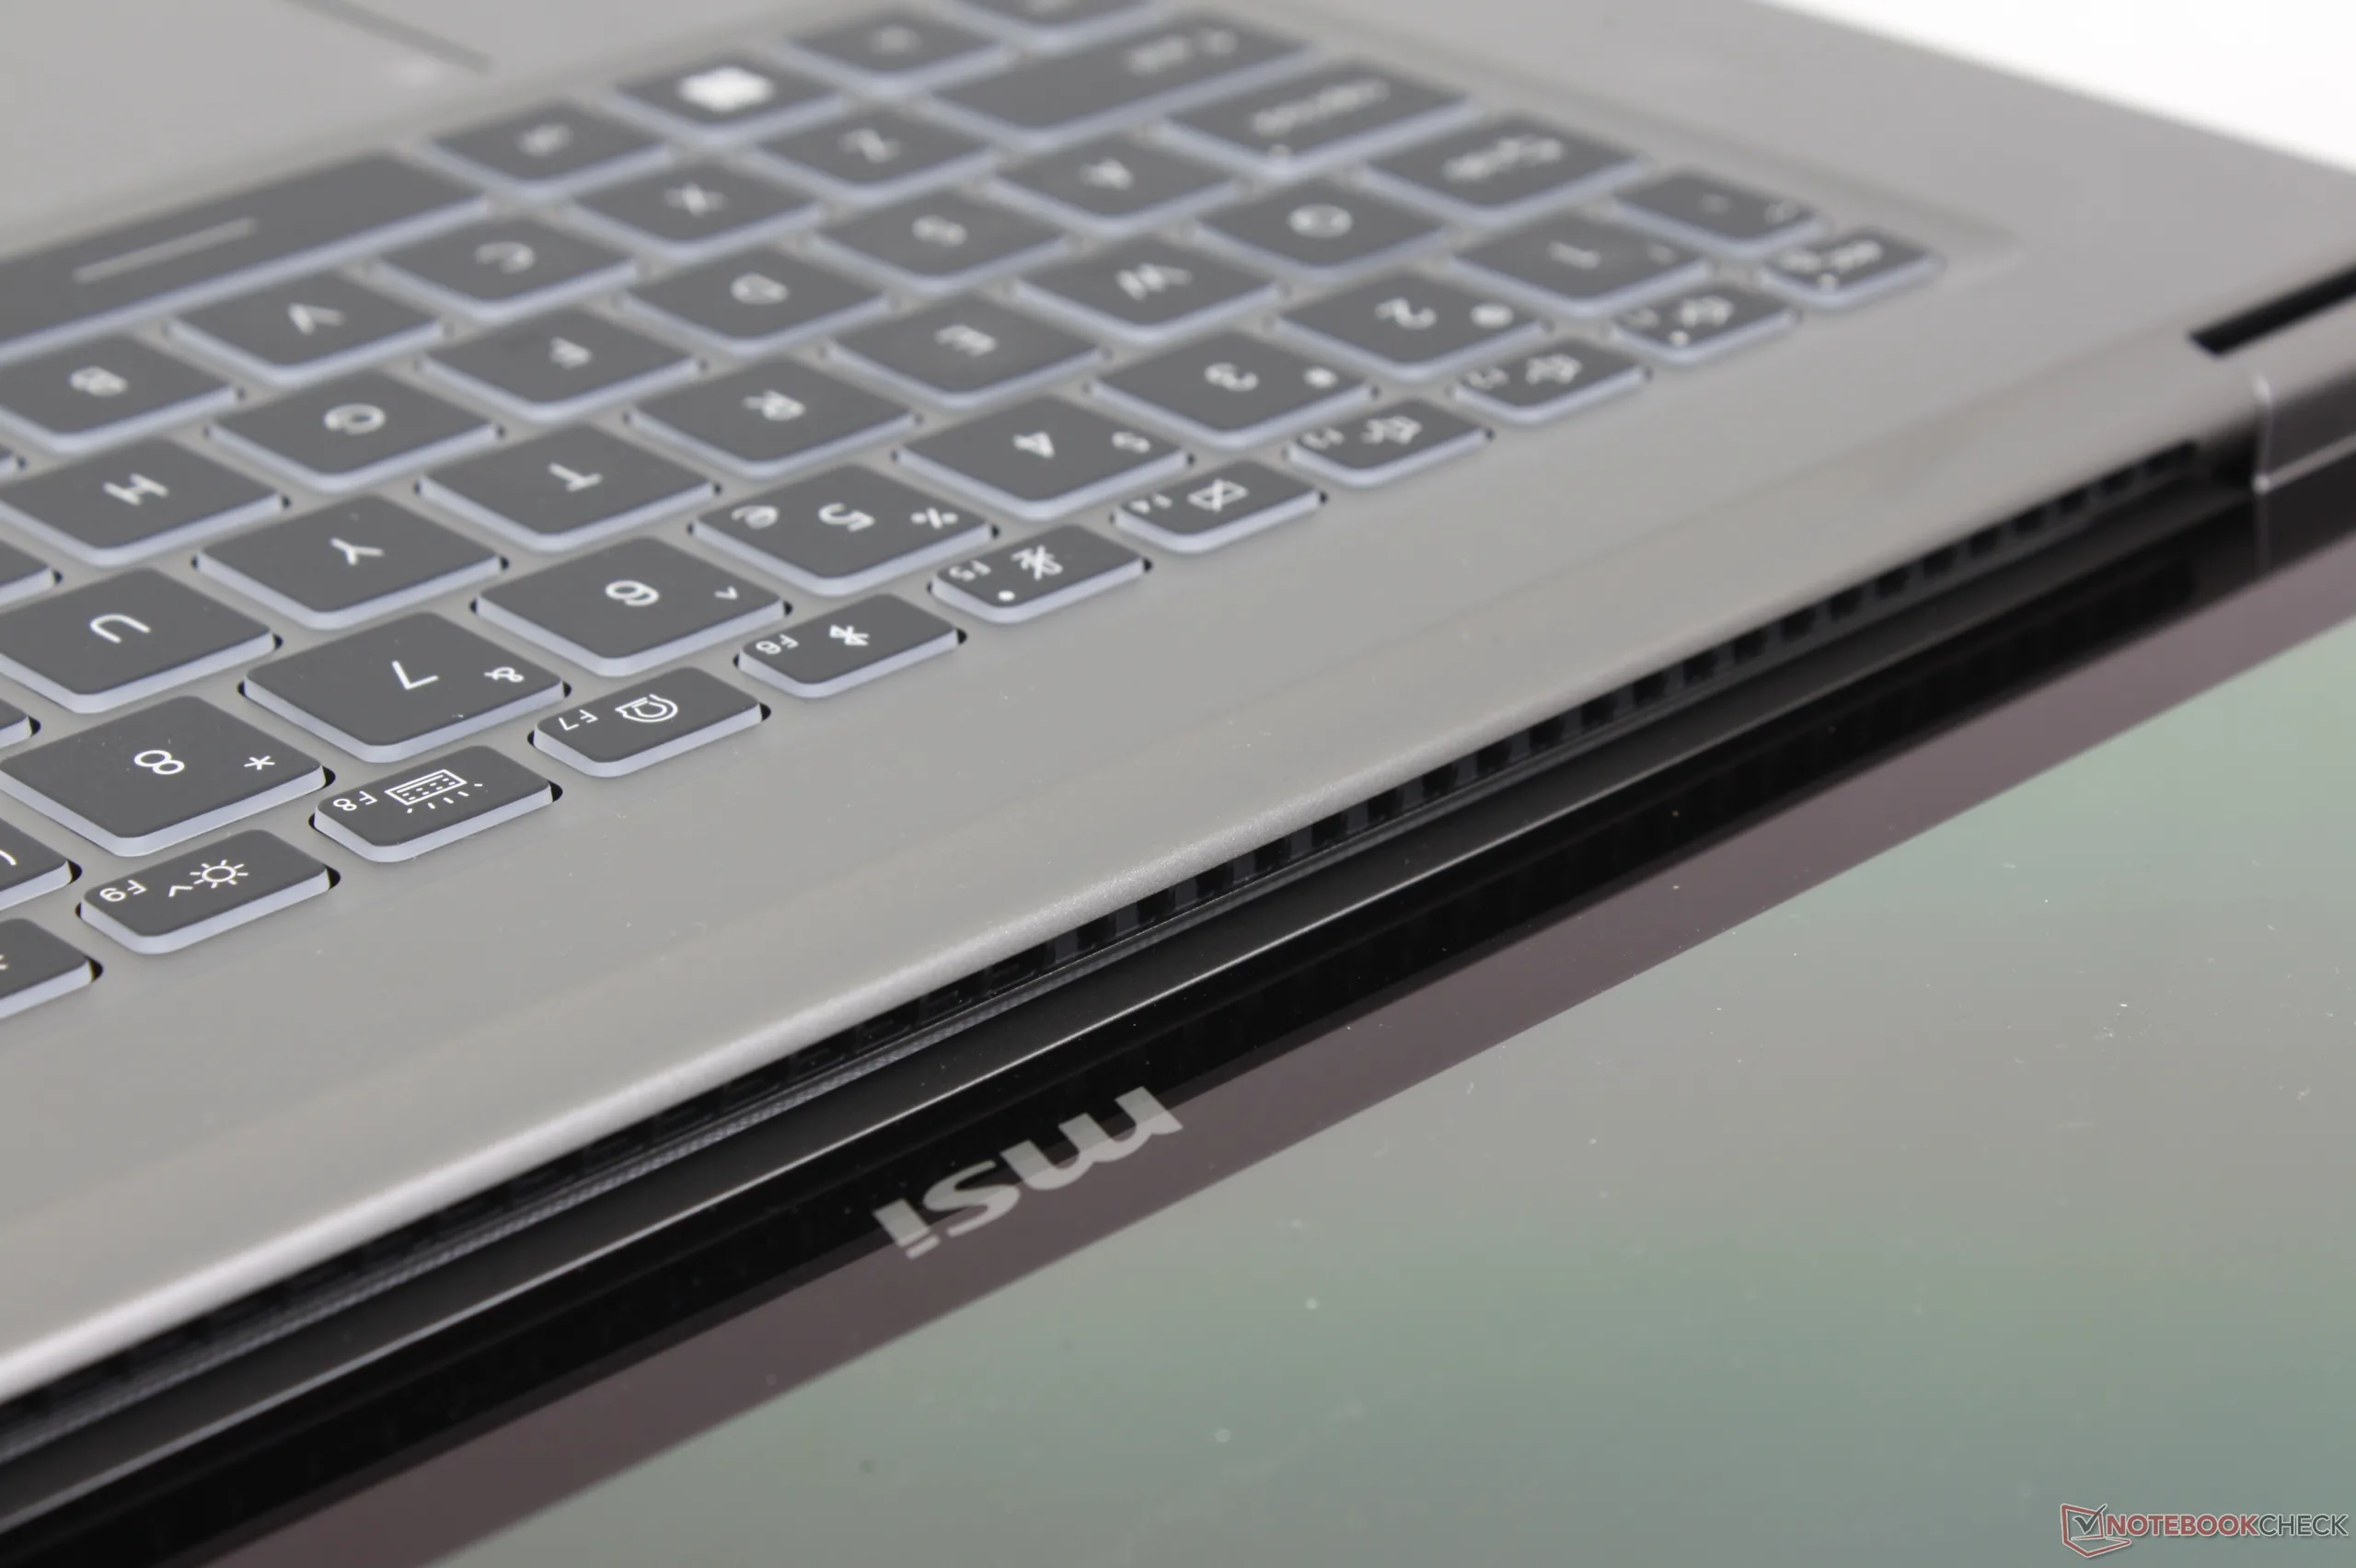
Teclado
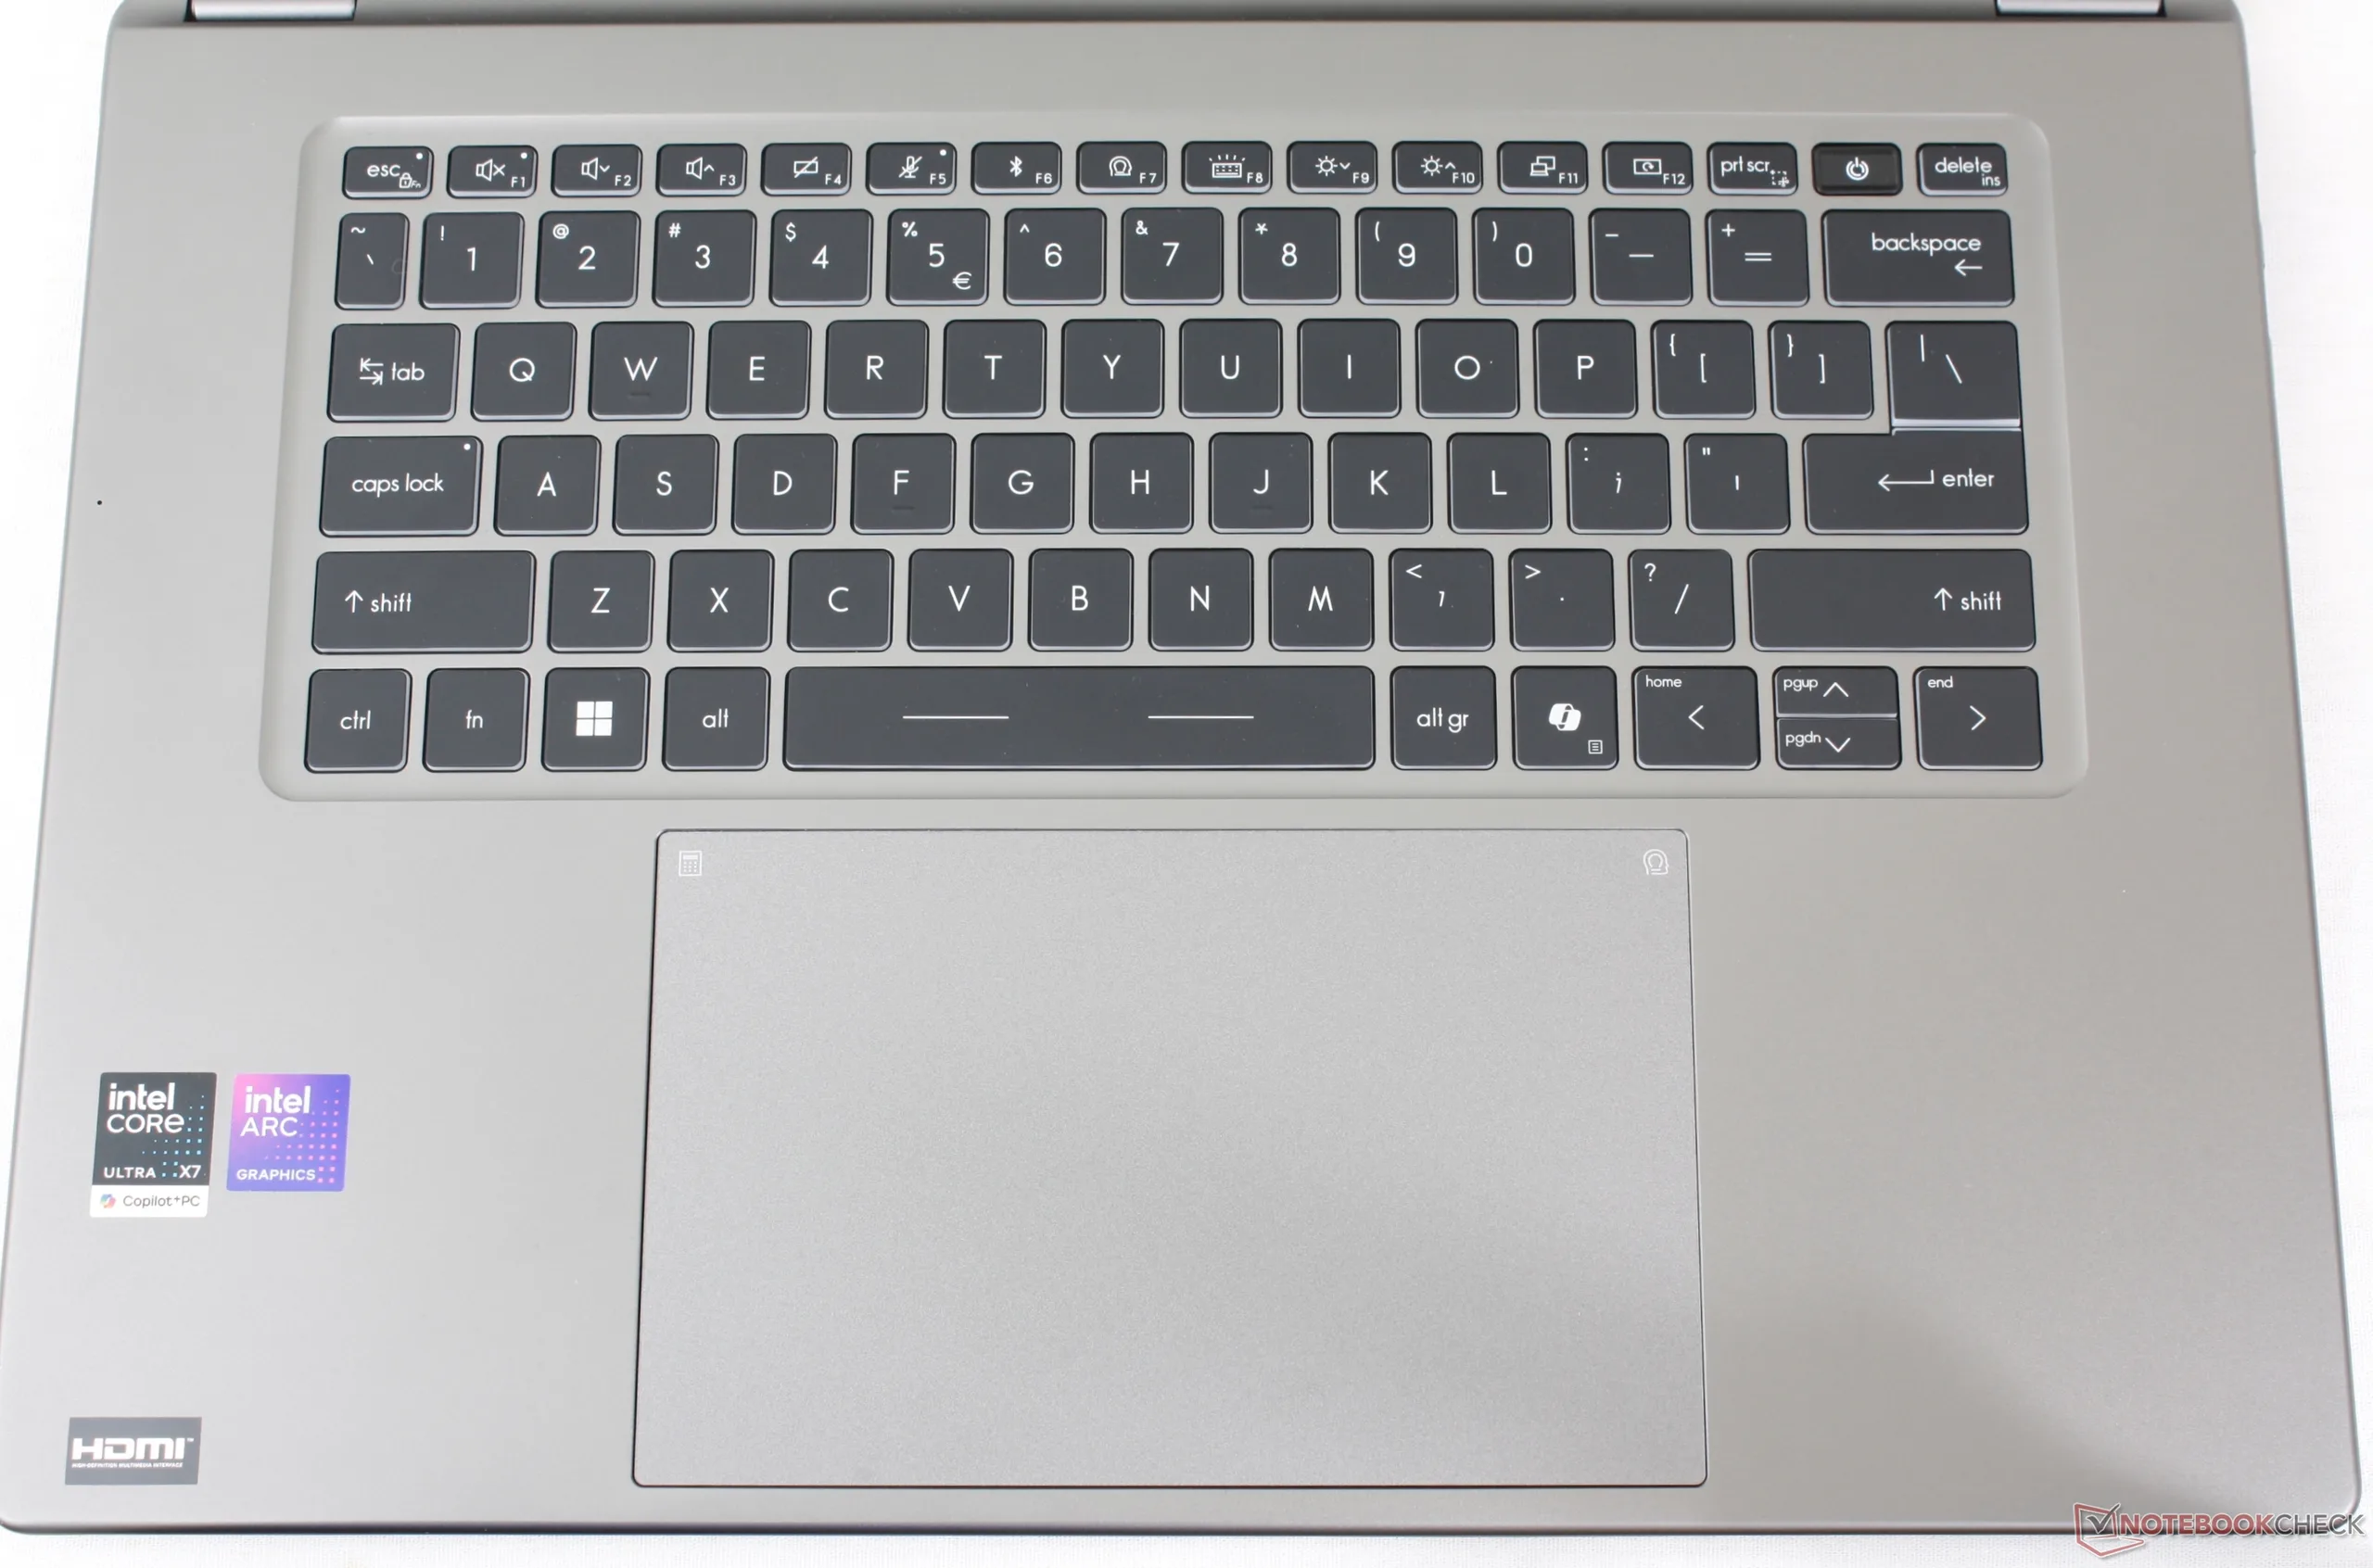
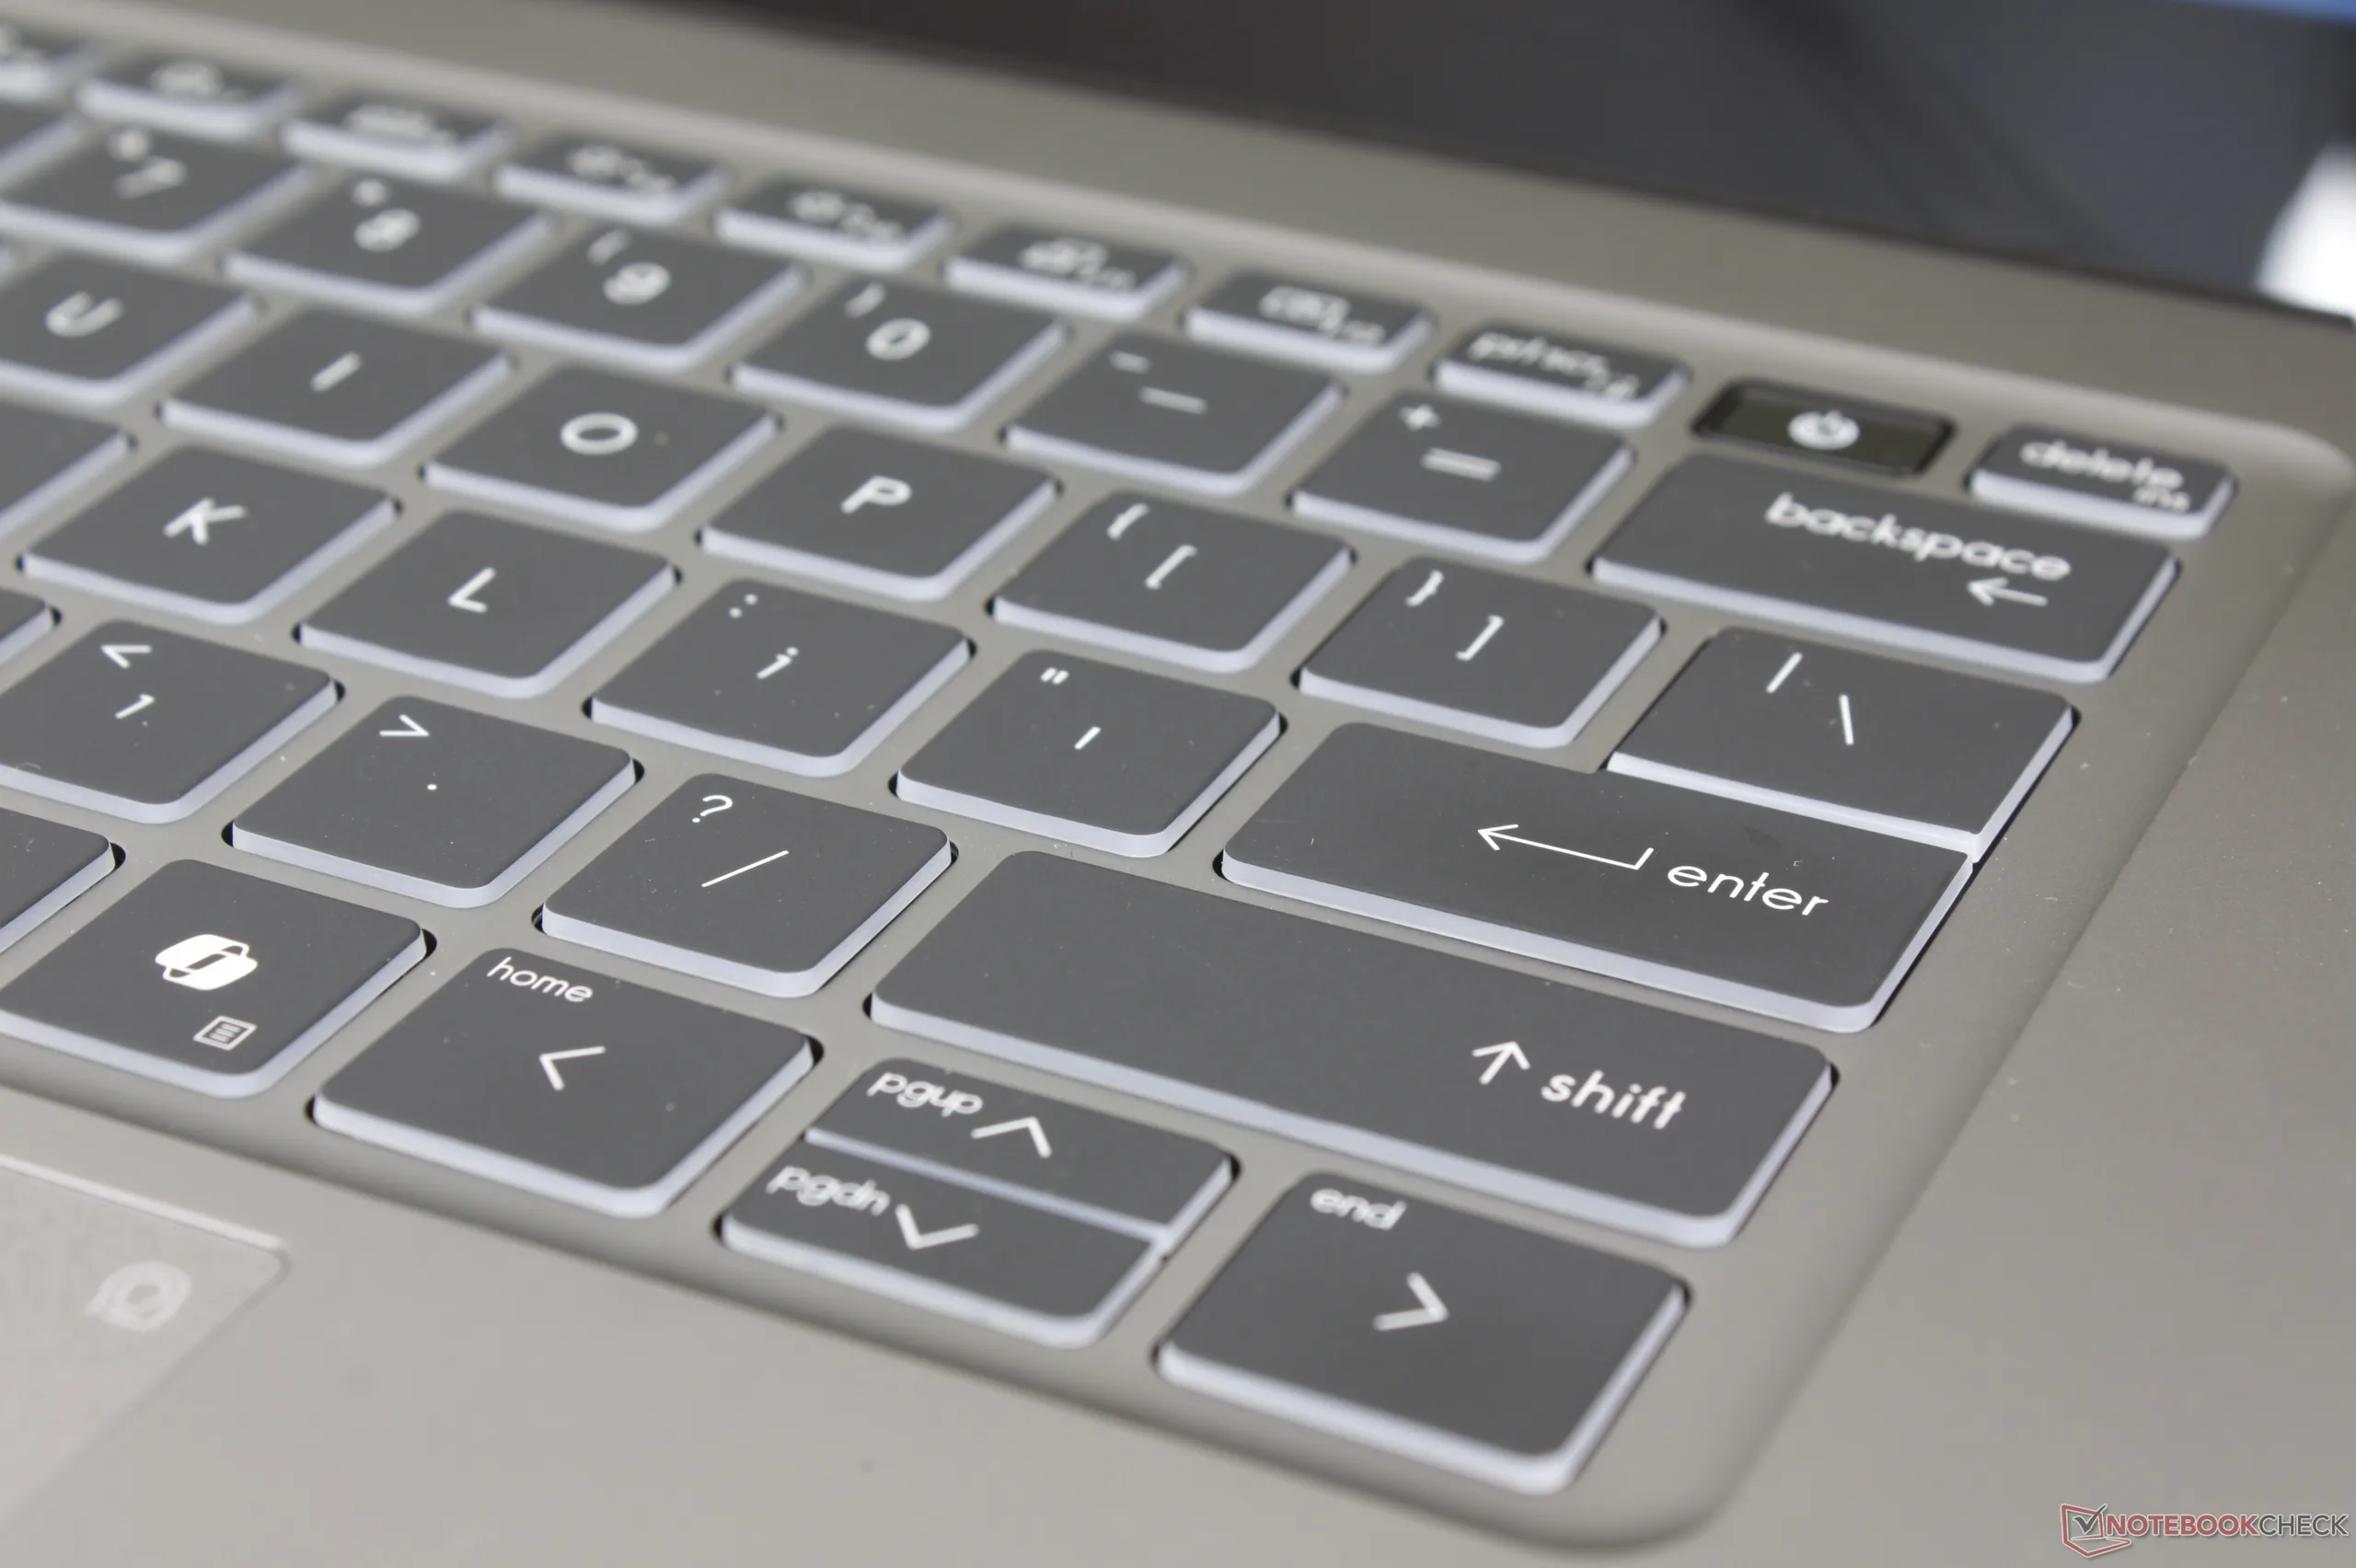
O teclado numérico desapareceu, para melhor ou pior. Por outro lado, a experiência de digitação parece mais leve e com deslocamento mais raso do que a dos notebooks clássicos de escritório da série Thinkpad T ou da série EliteBook. A digitação no muito mais barato Venture 16muito mais barato, por exemplo, tem a mesma sensação do que na linha Prestige principal. Embora a MSI tenha acertado em cheio no design geral do novo chassi do Prestige, o teclado não acompanhou o mesmo ritmo.
Touchpad
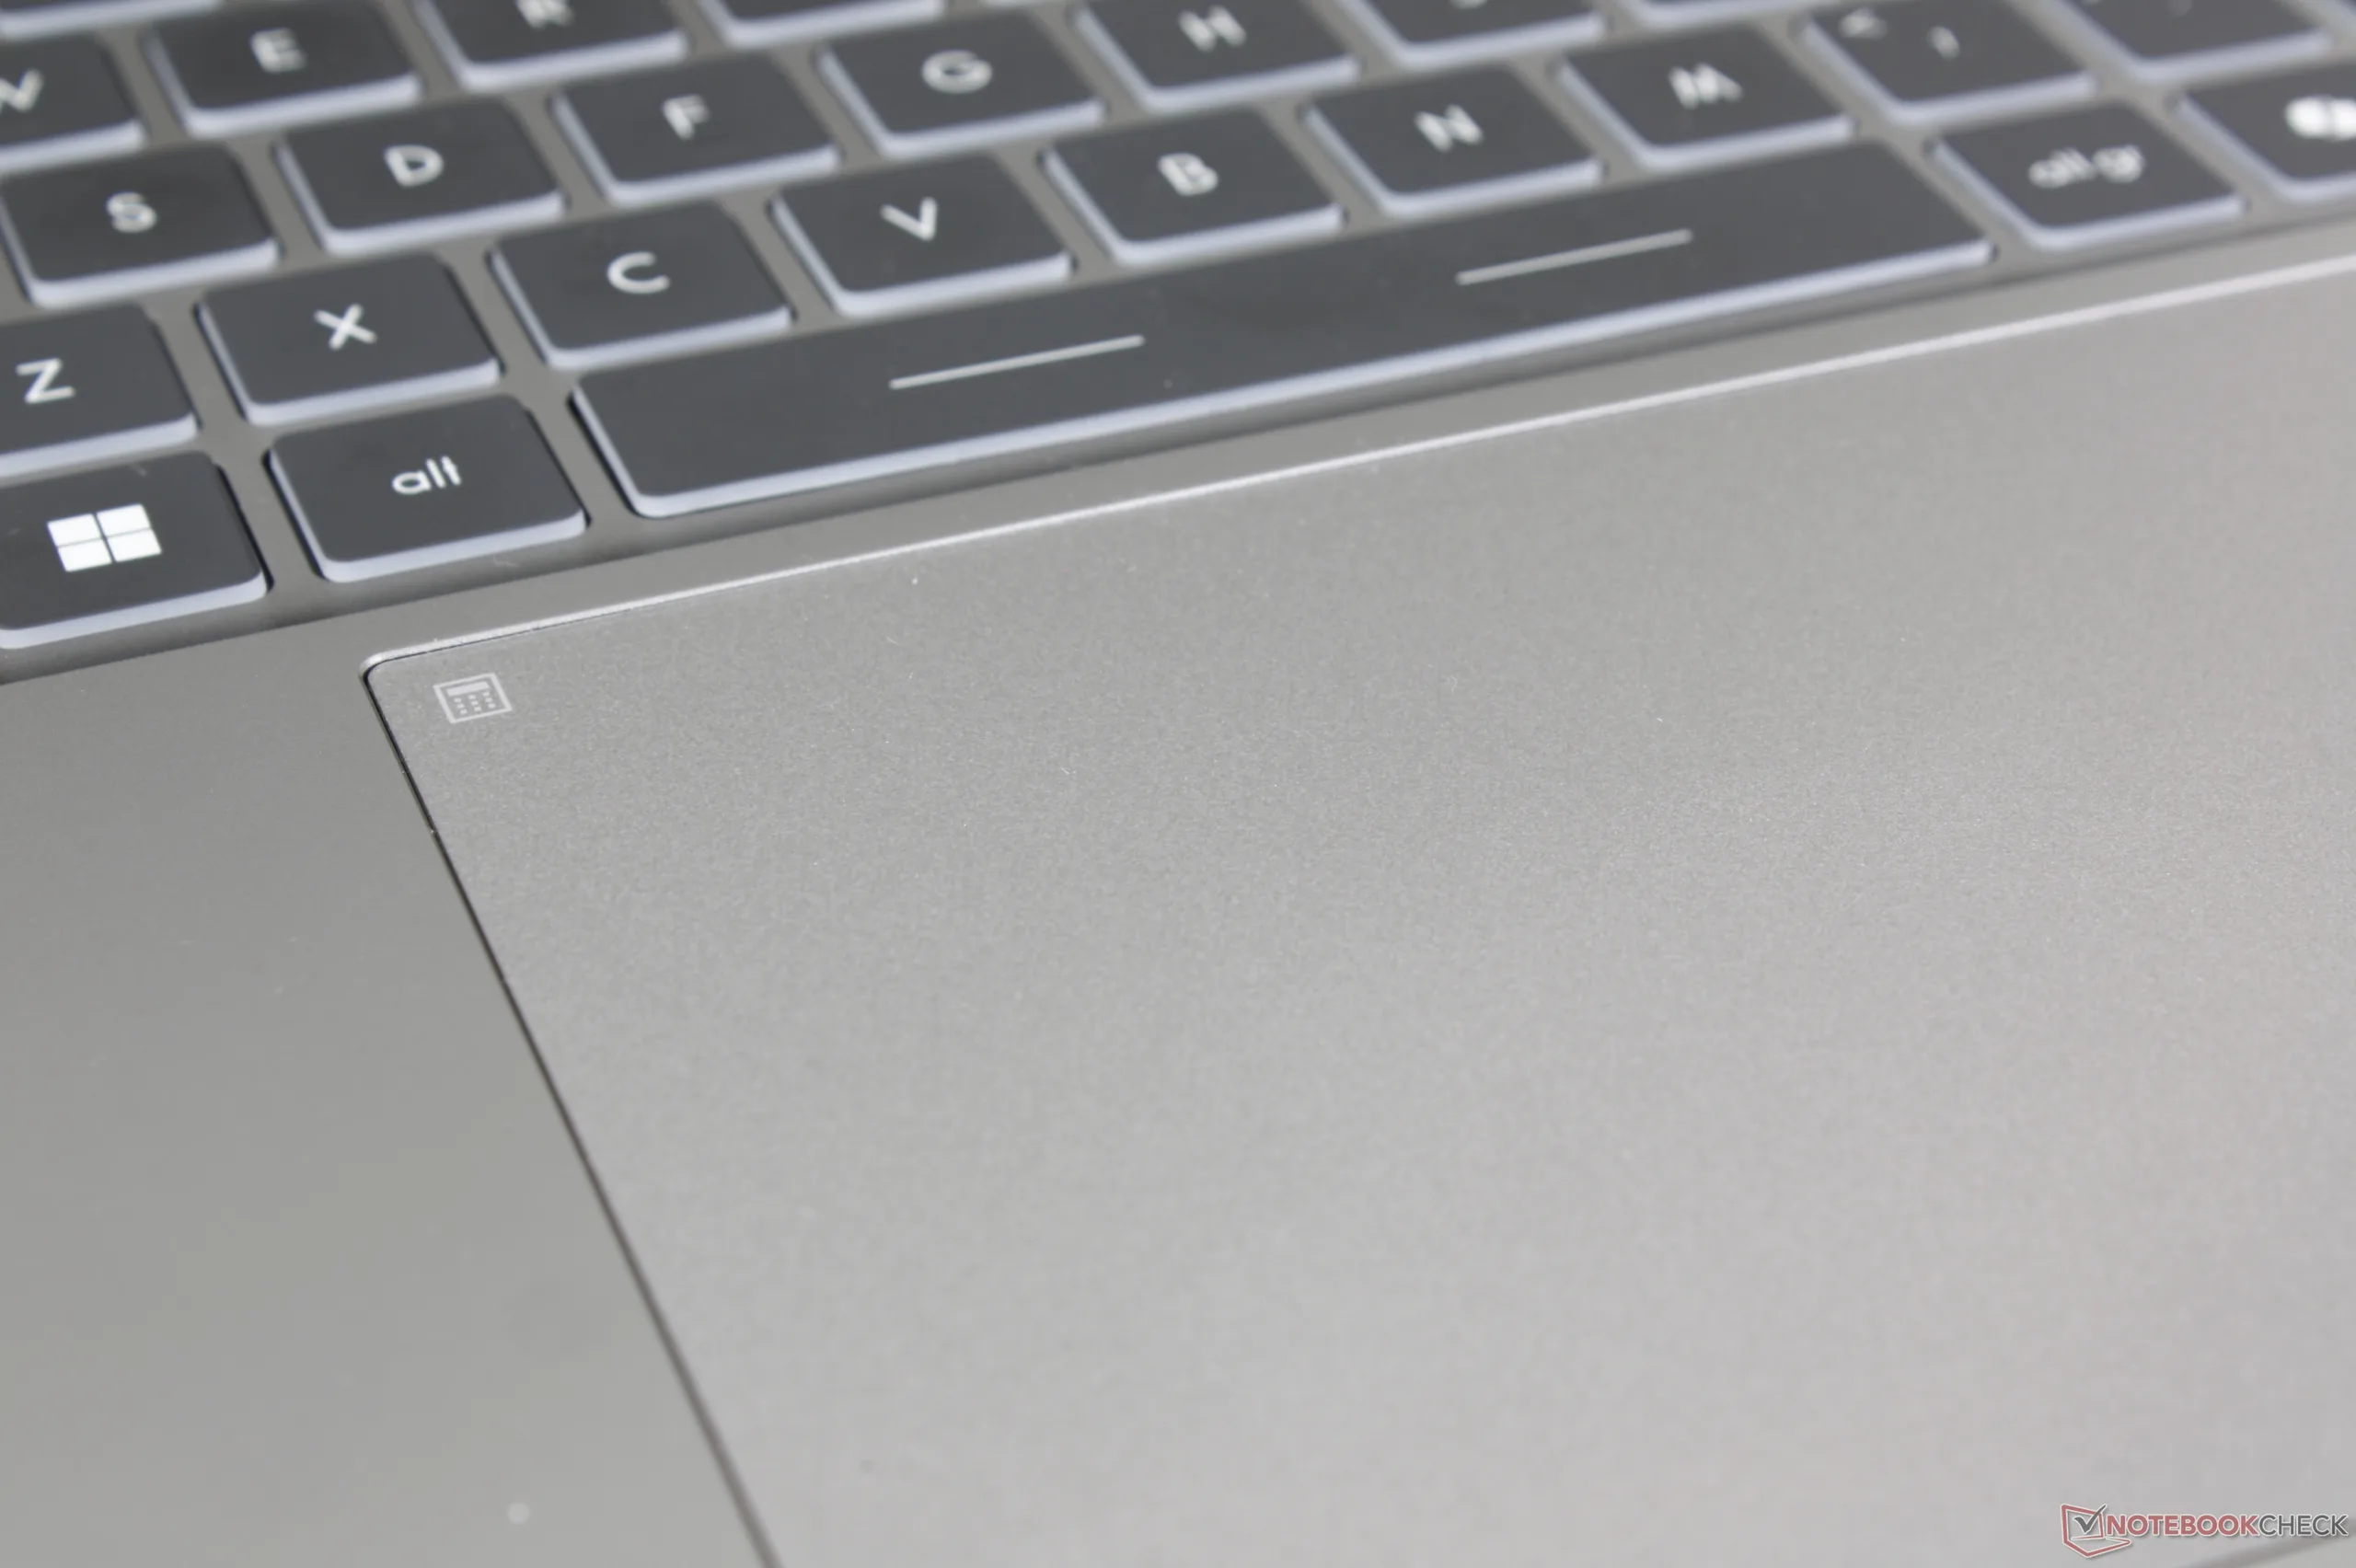
O clickpad é ainda maior do que antes, de 15 x 9 cm para 16 x 10 cm no modelo mais novo. A tração é suave e precisa, independentemente da velocidade de deslizamento, mas o feedback ao clicar continua relativamente fraco. O clique também só é confortável próximo aos dois cantos inferiores, onde a superfície do clickpad é pressionada com muito mais facilidade.

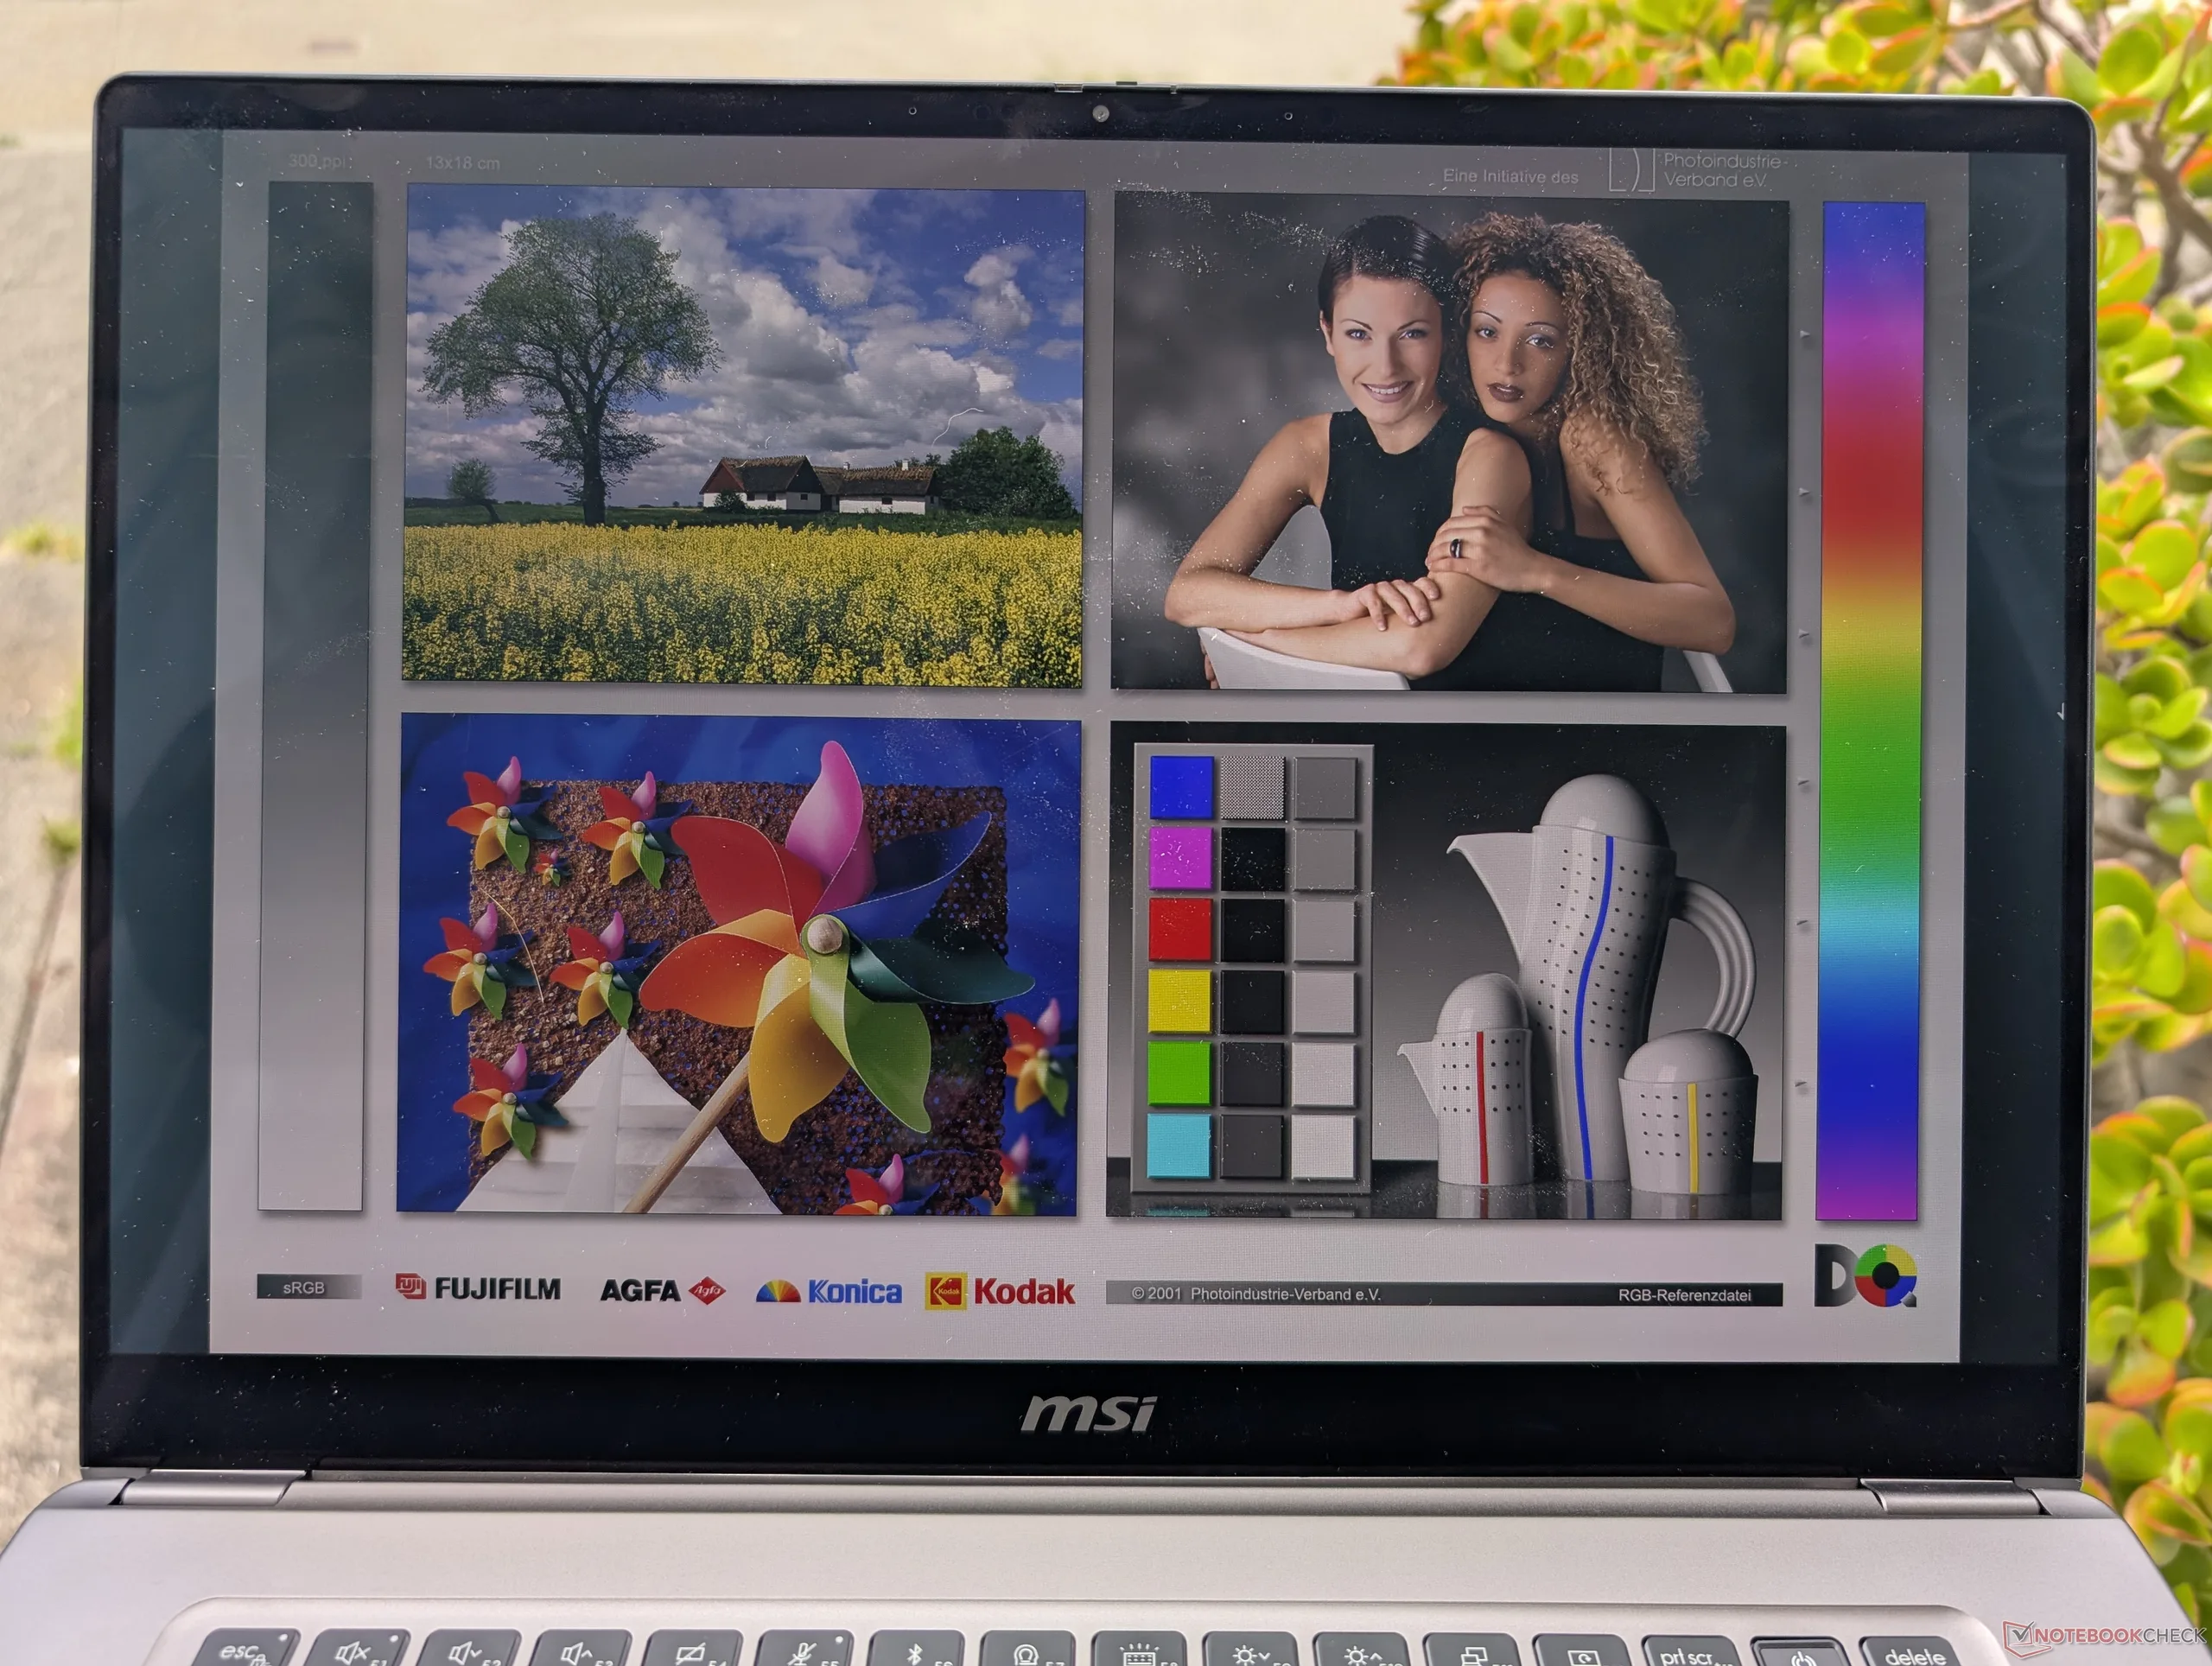
Tela
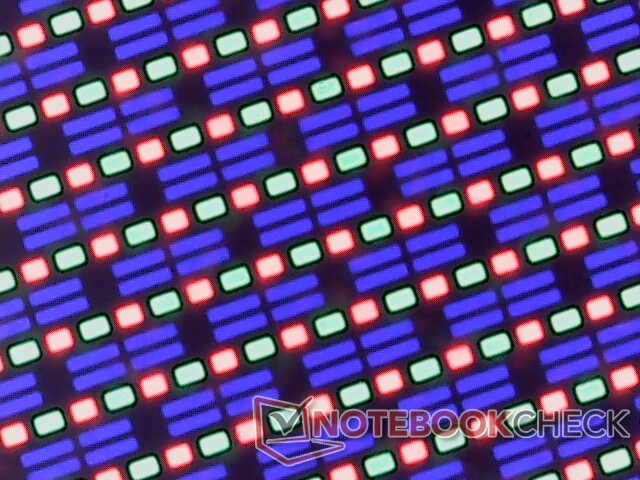
O painel OLED Samsung ATNA60CL11-0 é muito semelhante ao painel ATNA60CL10-0 encontrado no ZenBook S16. A taxa de atualização de 120 Hz e a resolução nativa de 1800p são uma melhoria em relação ao painel IPS do modelo do ano passado. Na verdade, não há mais opções IPS, o que coloca a série Prestige 16 diretamente na categoria de entusiastas.
O brilho, embora ainda excelente, é mais fraco do que o da tela IPS do Prestige 16 2025. Nossos testes mostram um brilho máximo de apenas 383 nits e 422 nits no modo SDR e no modo HDR, respectivamente, em comparação com 471 nits no modelo do ano passado. Algumas configurações suportam DisplayHDR1000 para obter máximos mais brilhantes, caso o senhor os encontre disponíveis, mas nossa unidade de teste não é uma delas.
| |||||||||||||||||||||||||
iluminação: 98 %
iluminação com acumulador: 375 cd/m²
Contraste: ∞:1 (Preto: 0 cd/m²)
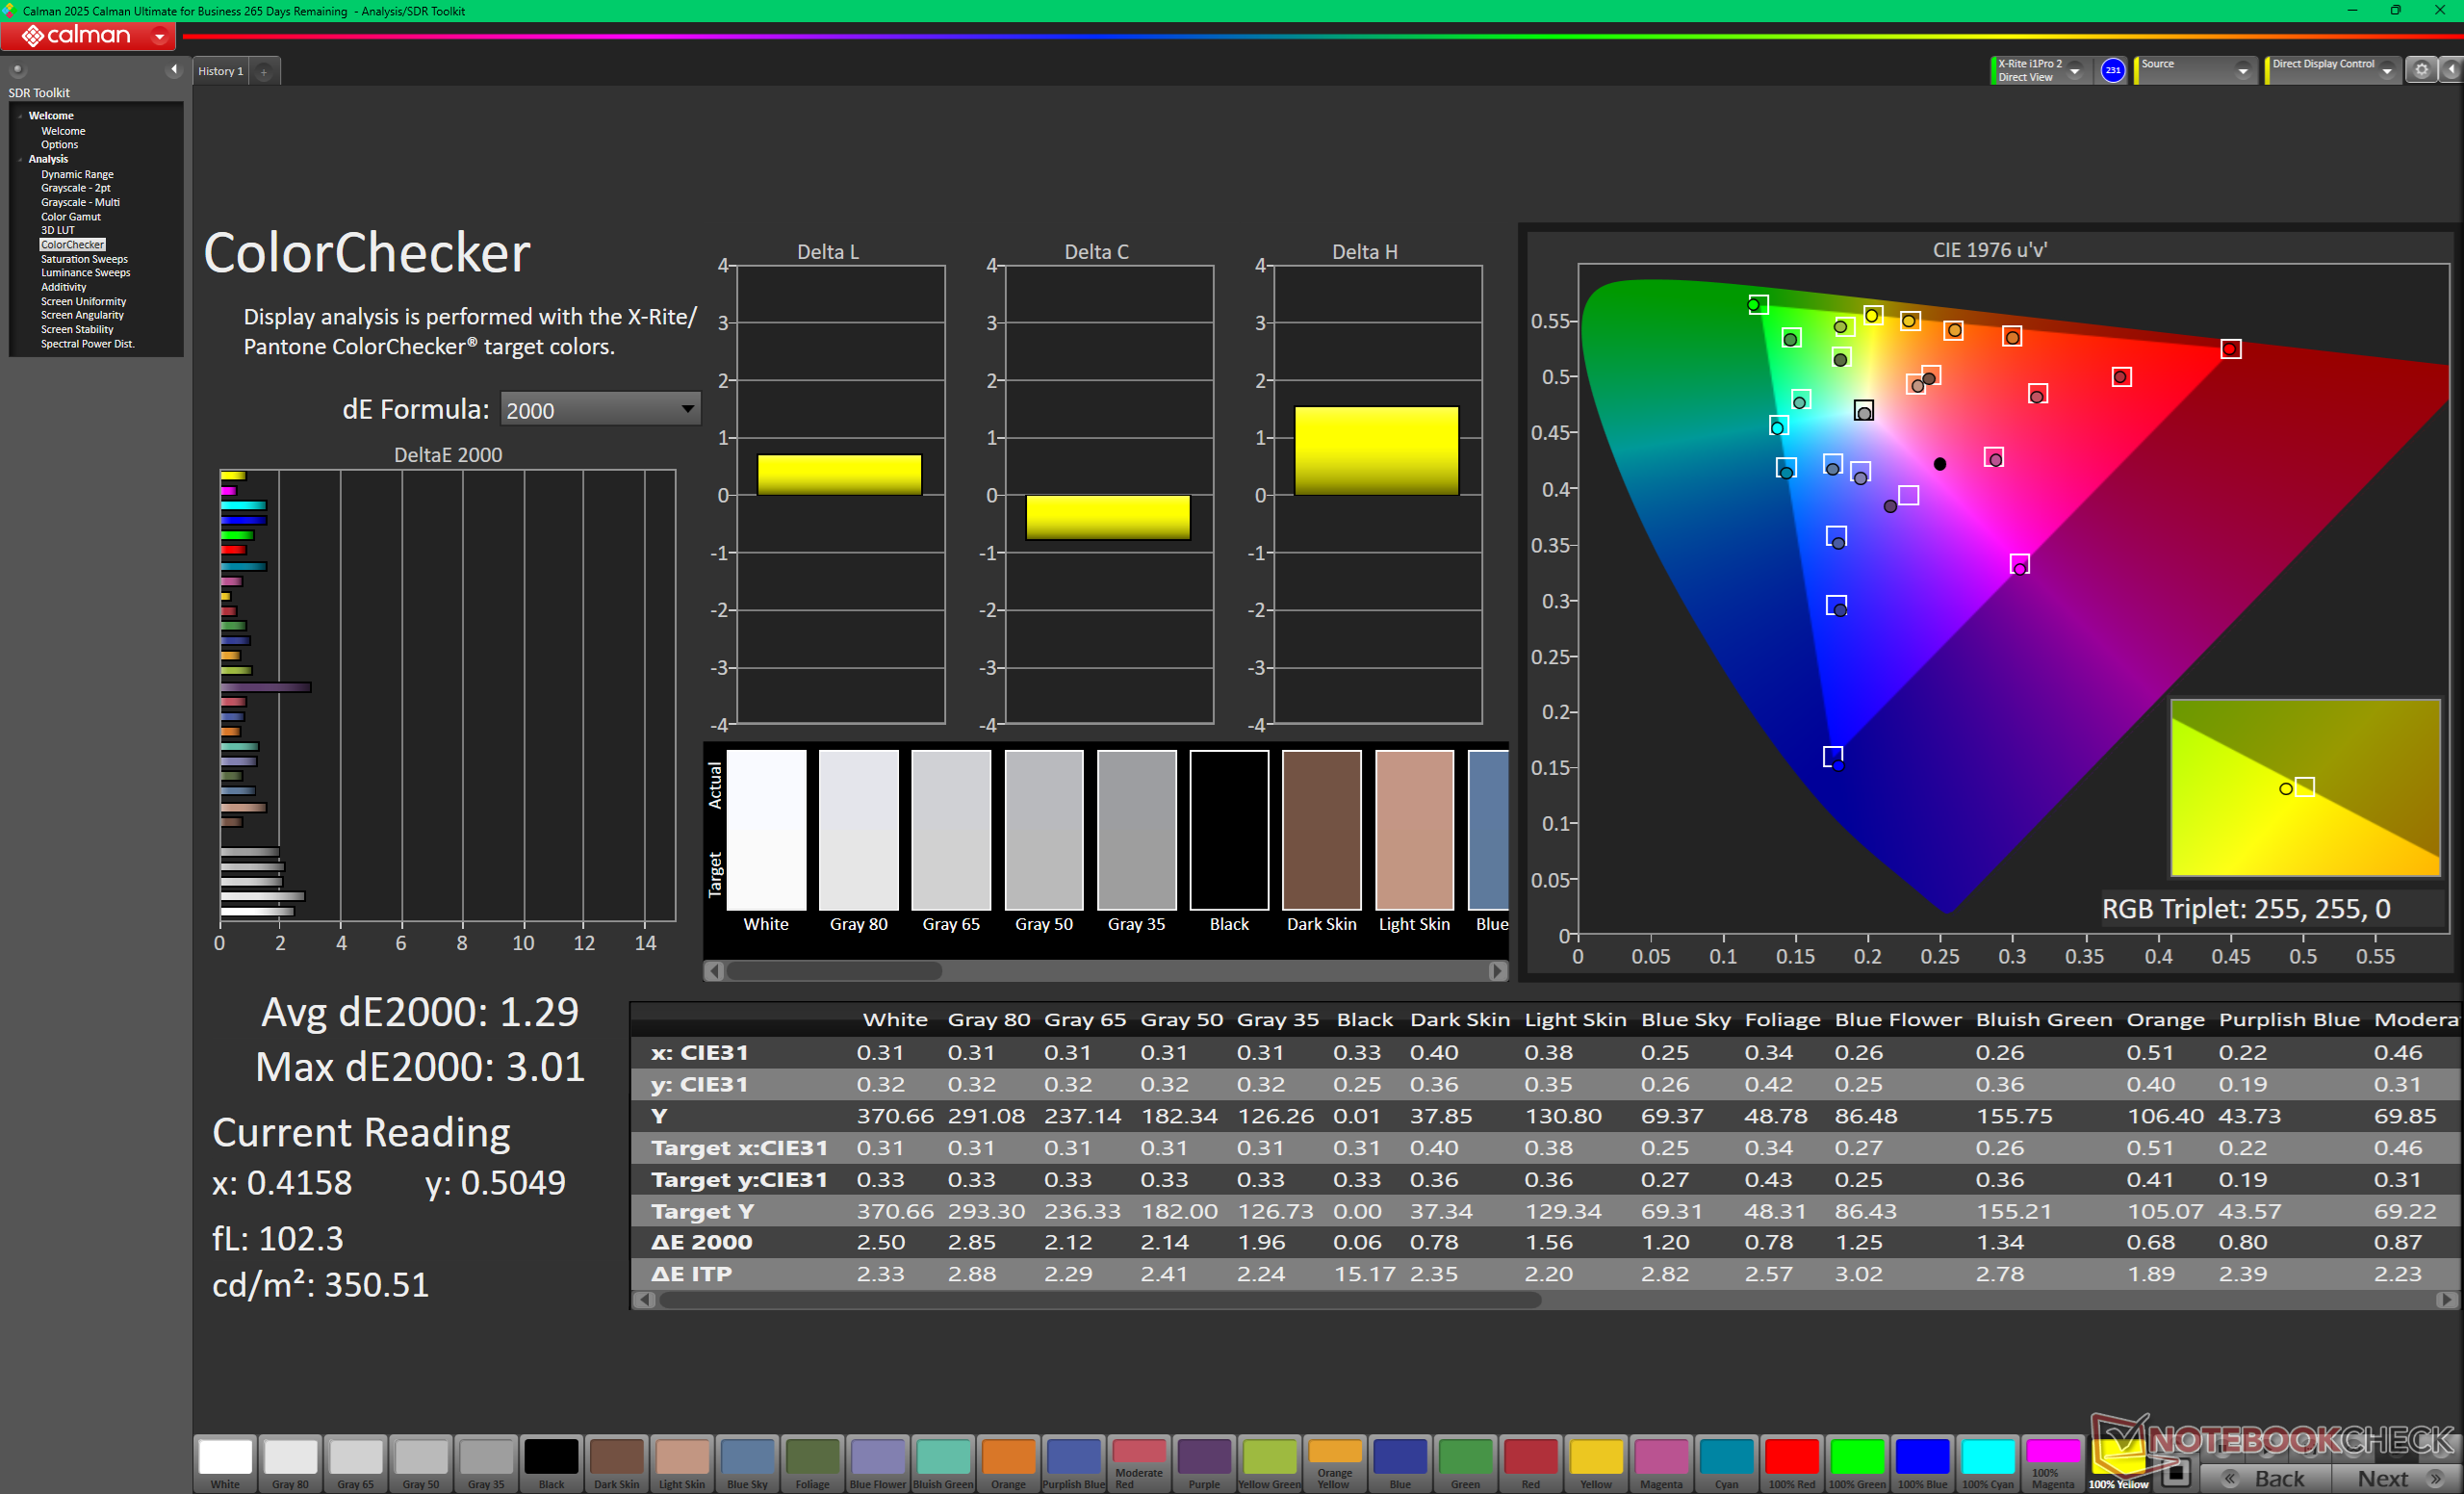
ΔE ColorChecker Calman: 1.29 | ∀{0.5-29.43 Ø4.73}
calibrated: 0.65
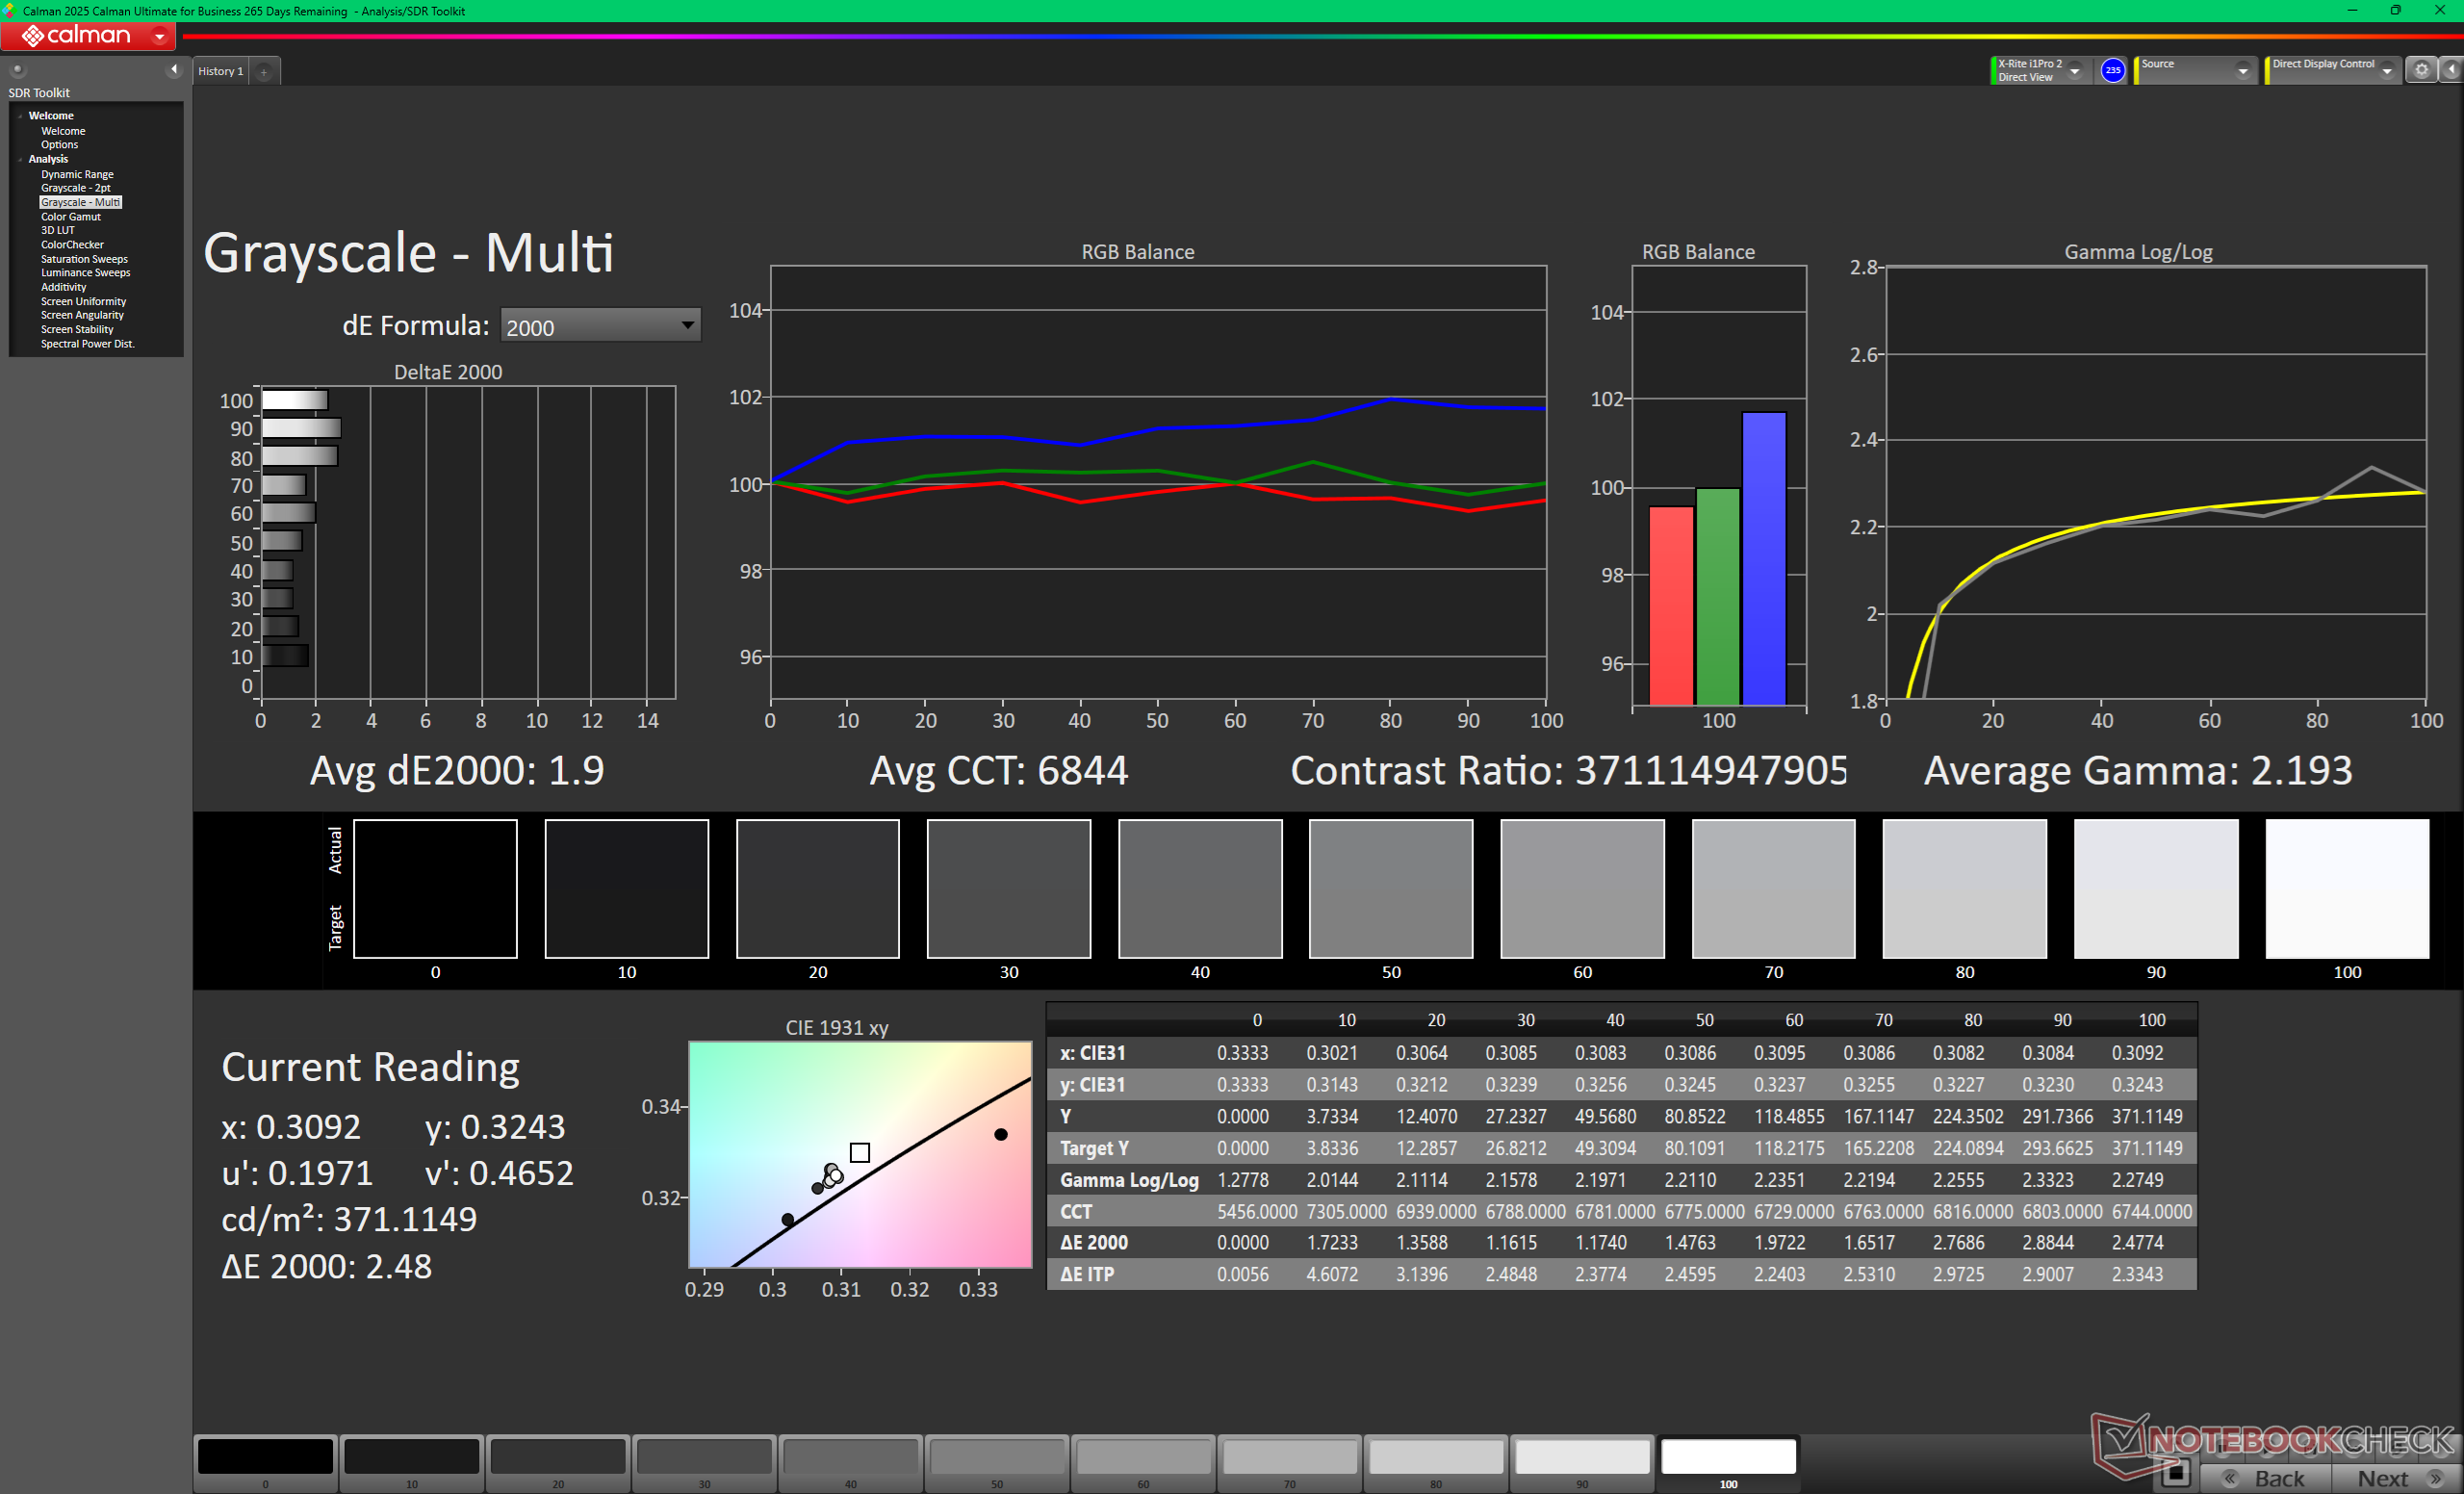
ΔE Greyscale Calman: 1.9 | ∀{0.09-98 Ø4.97}
98% AdobeRGB 1998 (Argyll 3D)
100% sRGB (Argyll 3D)
99.8% Display P3 (Argyll 3D)
Gamma: 2.19
CCT: 6844 K
| MSI Prestige 16 AI C3MTG Samsung ATNA60CL11-0, OLED, 2880x1800, 16", 120 Hz | MSI Prestige 16 AI Evo B2HMG B160QAN03_R, IPS, 2560x1600, 16", 60 Hz | Dell XPS 16 Core Ultra X7 358H LG Philips 160WV1, OLED, 3200x2000, 16", 120 Hz | Asus ZenBook S16 UM5606GA ATNA60HR07-0, OLED, 2880x1800, 16", 120 Hz | Lenovo ThinkBook 16 G7+ AMD LEN160-3.2K, IPS, 3200x2000, 16", 165 Hz | HP Envy x360 2-in-1 16-ad0097nr Samsung SDC41A6, OLED, 2880x1800, 16", 120 Hz | |
|---|---|---|---|---|---|---|
| Display | -6% | -1% | -1% | -5% | -1% | |
| Display P3 Coverage (%) | 99.8 | 96.4 -3% | 99.5 0% | 99.8 0% | 96.3 -4% | 99.6 0% |
| sRGB Coverage (%) | 100 | 99.7 0% | 100 0% | 100 0% | 100 0% | 100 0% |
| AdobeRGB 1998 Coverage (%) | 98 | 84.3 -14% | 96.5 -2% | 94 -4% | 86.9 -11% | 96.5 -2% |
| Response Times | -4924% | -21% | -80% | -1241% | -8% | |
| Response Time Grey 50% / Grey 80% * (ms) | 0.71 ? | 51.5 ? -7154% | 0.65 ? 8% | 1.27 ? -79% | 13.9 ? -1858% | 0.8 ? -13% |
| Response Time Black / White * (ms) | 0.87 ? | 24.3 ? -2693% | 0.87 ? -0% | 0.43 ? 51% | 6.3 ? -624% | 0.89 ? -2% |
| PWM Frequency (Hz) | 460.46 ? | 240.2 ? | 960 ? | 491.8 ? | ||
| PWM Amplitude * (%) | 18 | 31 -72% | 56 -211% | |||
| Screen | -153% | -50% | 12% | -9% | -48% | |
| Brightness middle (cd/m²) | 375 | 471 26% | 395.4 5% | 465 24% | 422 13% | 399.4 7% |
| Brightness (cd/m²) | 380 | 455 20% | 392 3% | 466 23% | 403 6% | 405 7% |
| Brightness Distribution (%) | 98 | 92 -6% | 95 -3% | 99 1% | 93 -5% | 98 0% |
| Black Level * (cd/m²) | 0.2 | 0.3 | ||||
| Colorchecker dE 2000 * | 1.29 | 5.8 -350% | 3.69 -186% | 1 22% | 1.7 -32% | 4.05 -214% |
| Colorchecker dE 2000 max. * | 3.01 | 10.8 -259% | 7.94 -164% | 3 -0% | 3.4 -13% | 6.69 -122% |
| Colorchecker dE 2000 calibrated * | 0.65 | 1.9 -192% | 0.68 -5% | 0.7 -8% | 1.02 -57% | |
| Greyscale dE 2000 * | 1.9 | 7.8 -311% | 1.9 -0% | 1.9 -0% | 2.4 -26% | 1.1 42% |
| Gamma | 2.19 100% | 2.07 106% | 2.28 96% | 2.19 100% | 2.19 100% | 2.27 97% |
| CCT | 6844 95% | 7262 90% | 6274 104% | 6458 101% | 6989 93% | 6419 101% |
| Contrast (:1) | 2355 | 1407 | ||||
| Média Total (Programa/Configurações) | -1694% /
-911% | -24% /
-32% | -23% /
-14% | -418% /
-214% | -19% /
-30% |
* ... menor é melhor
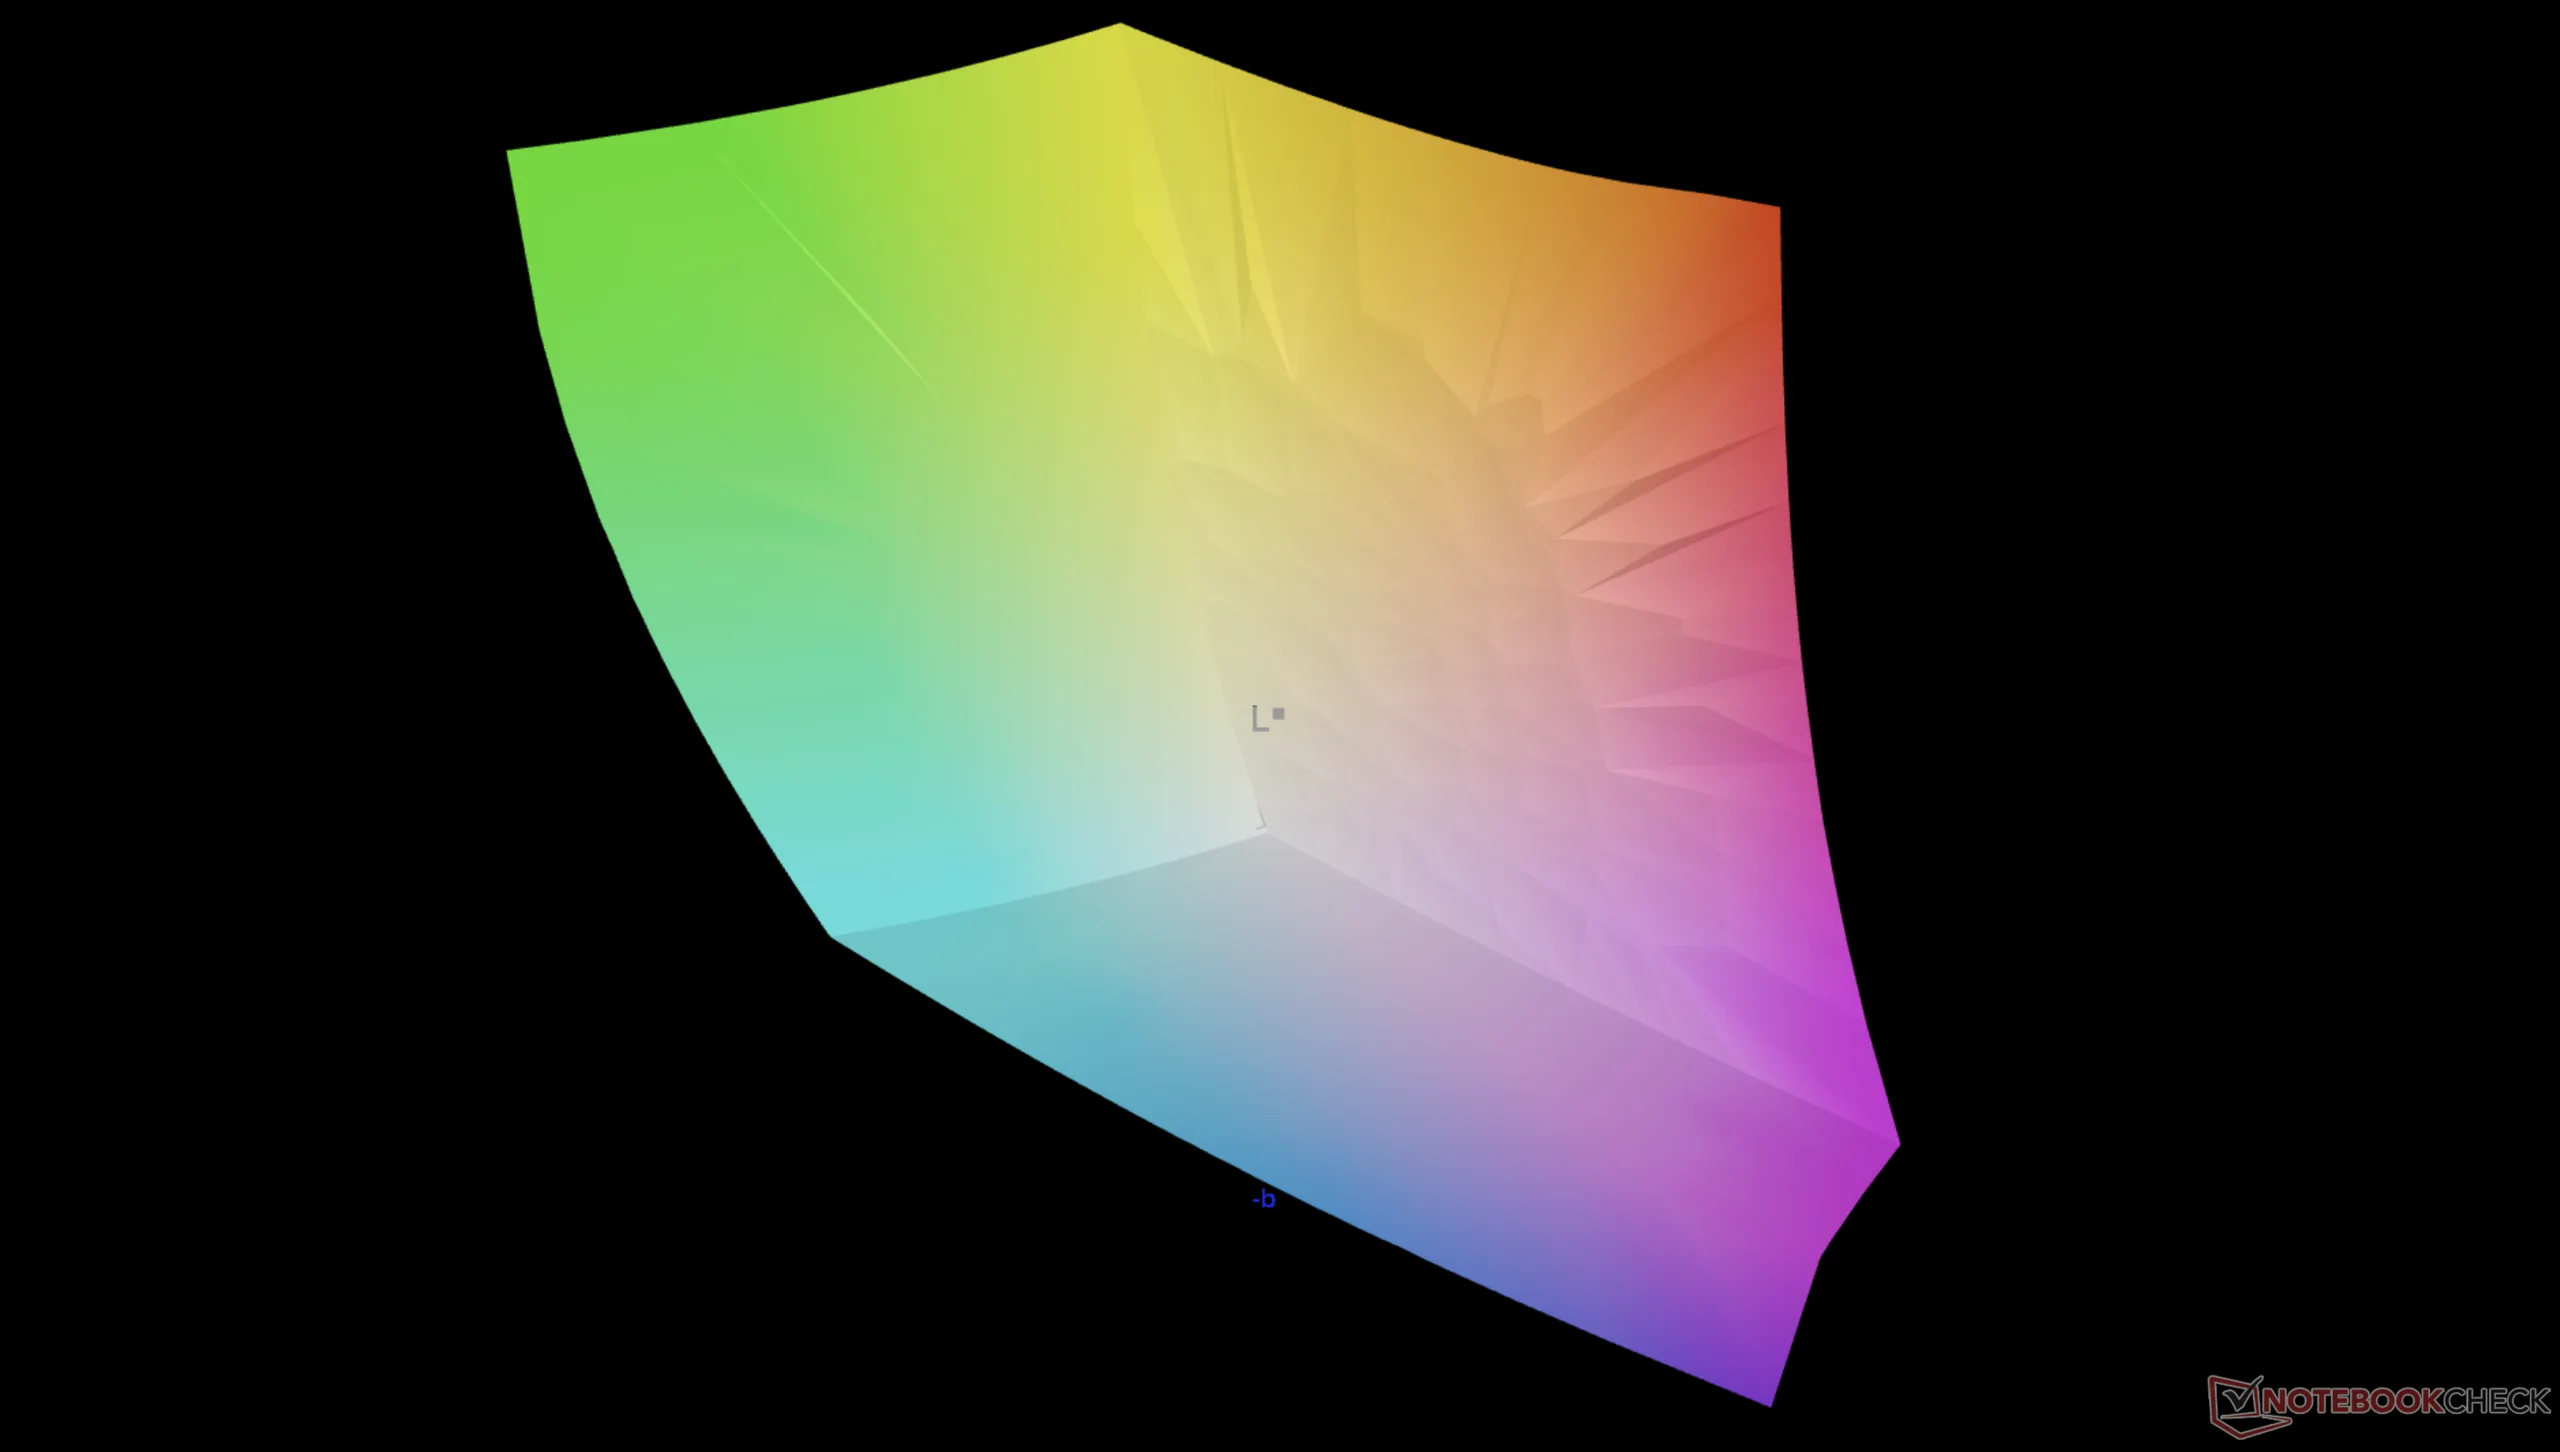
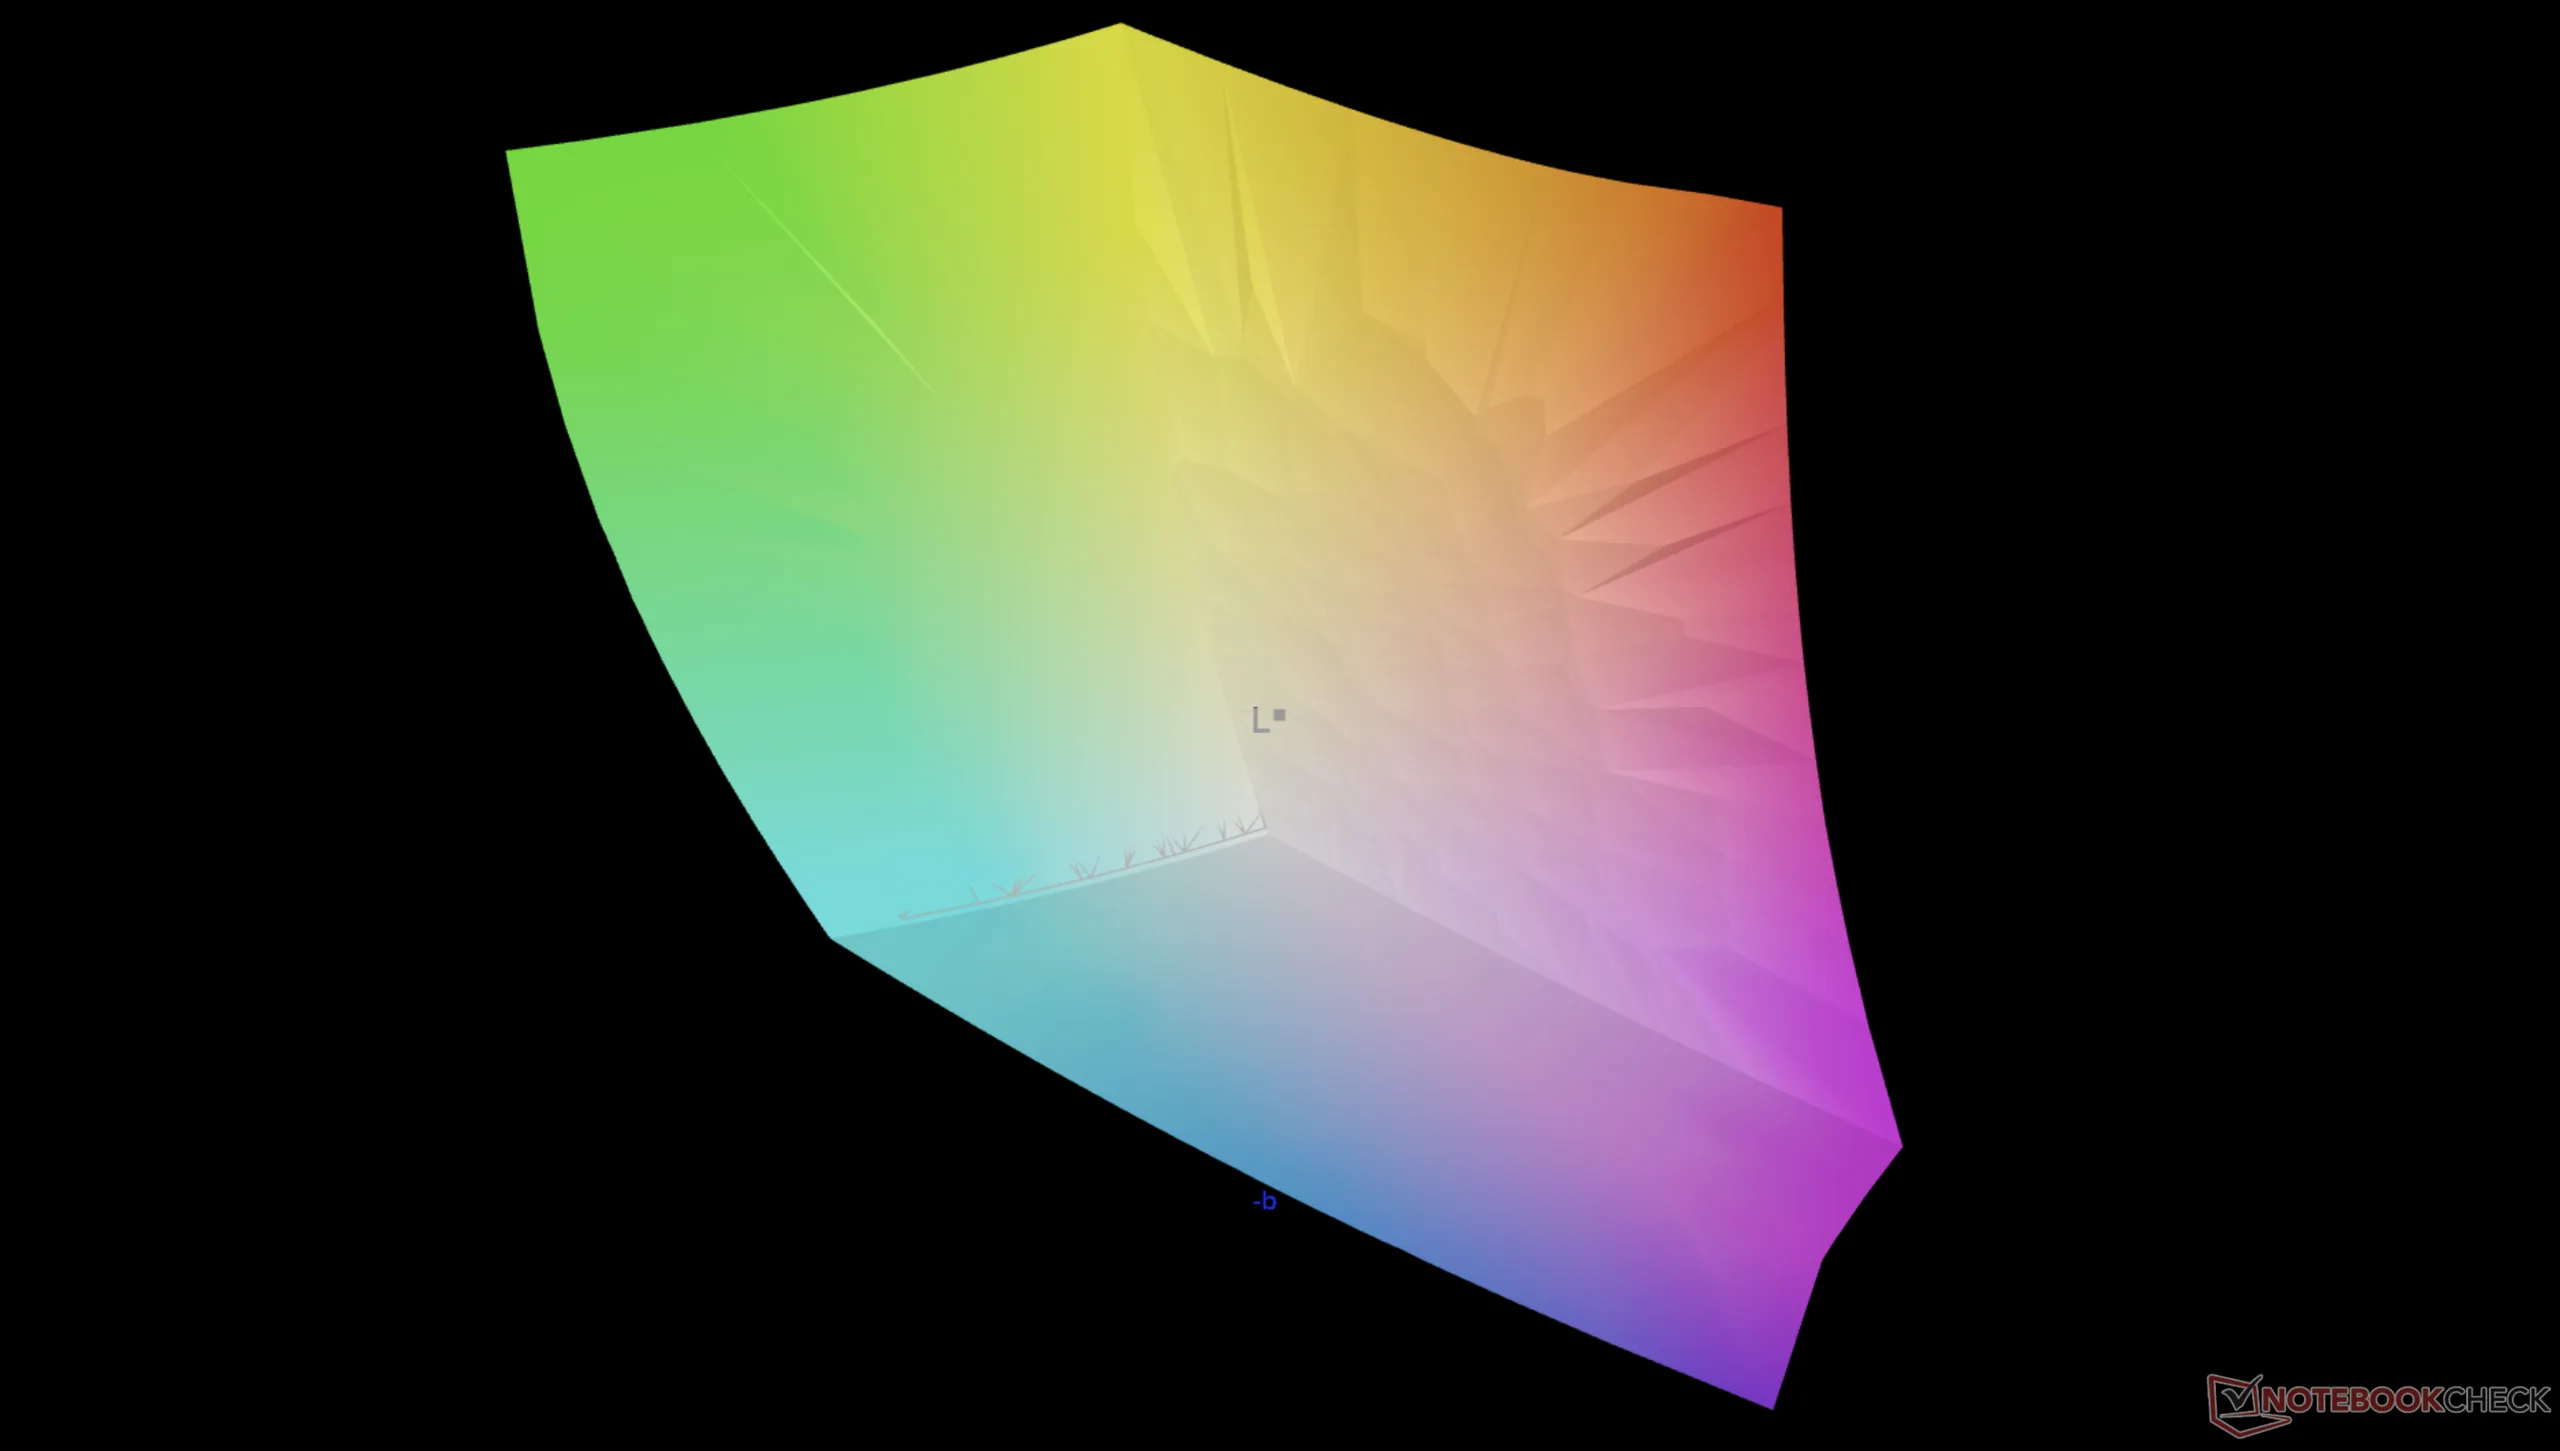
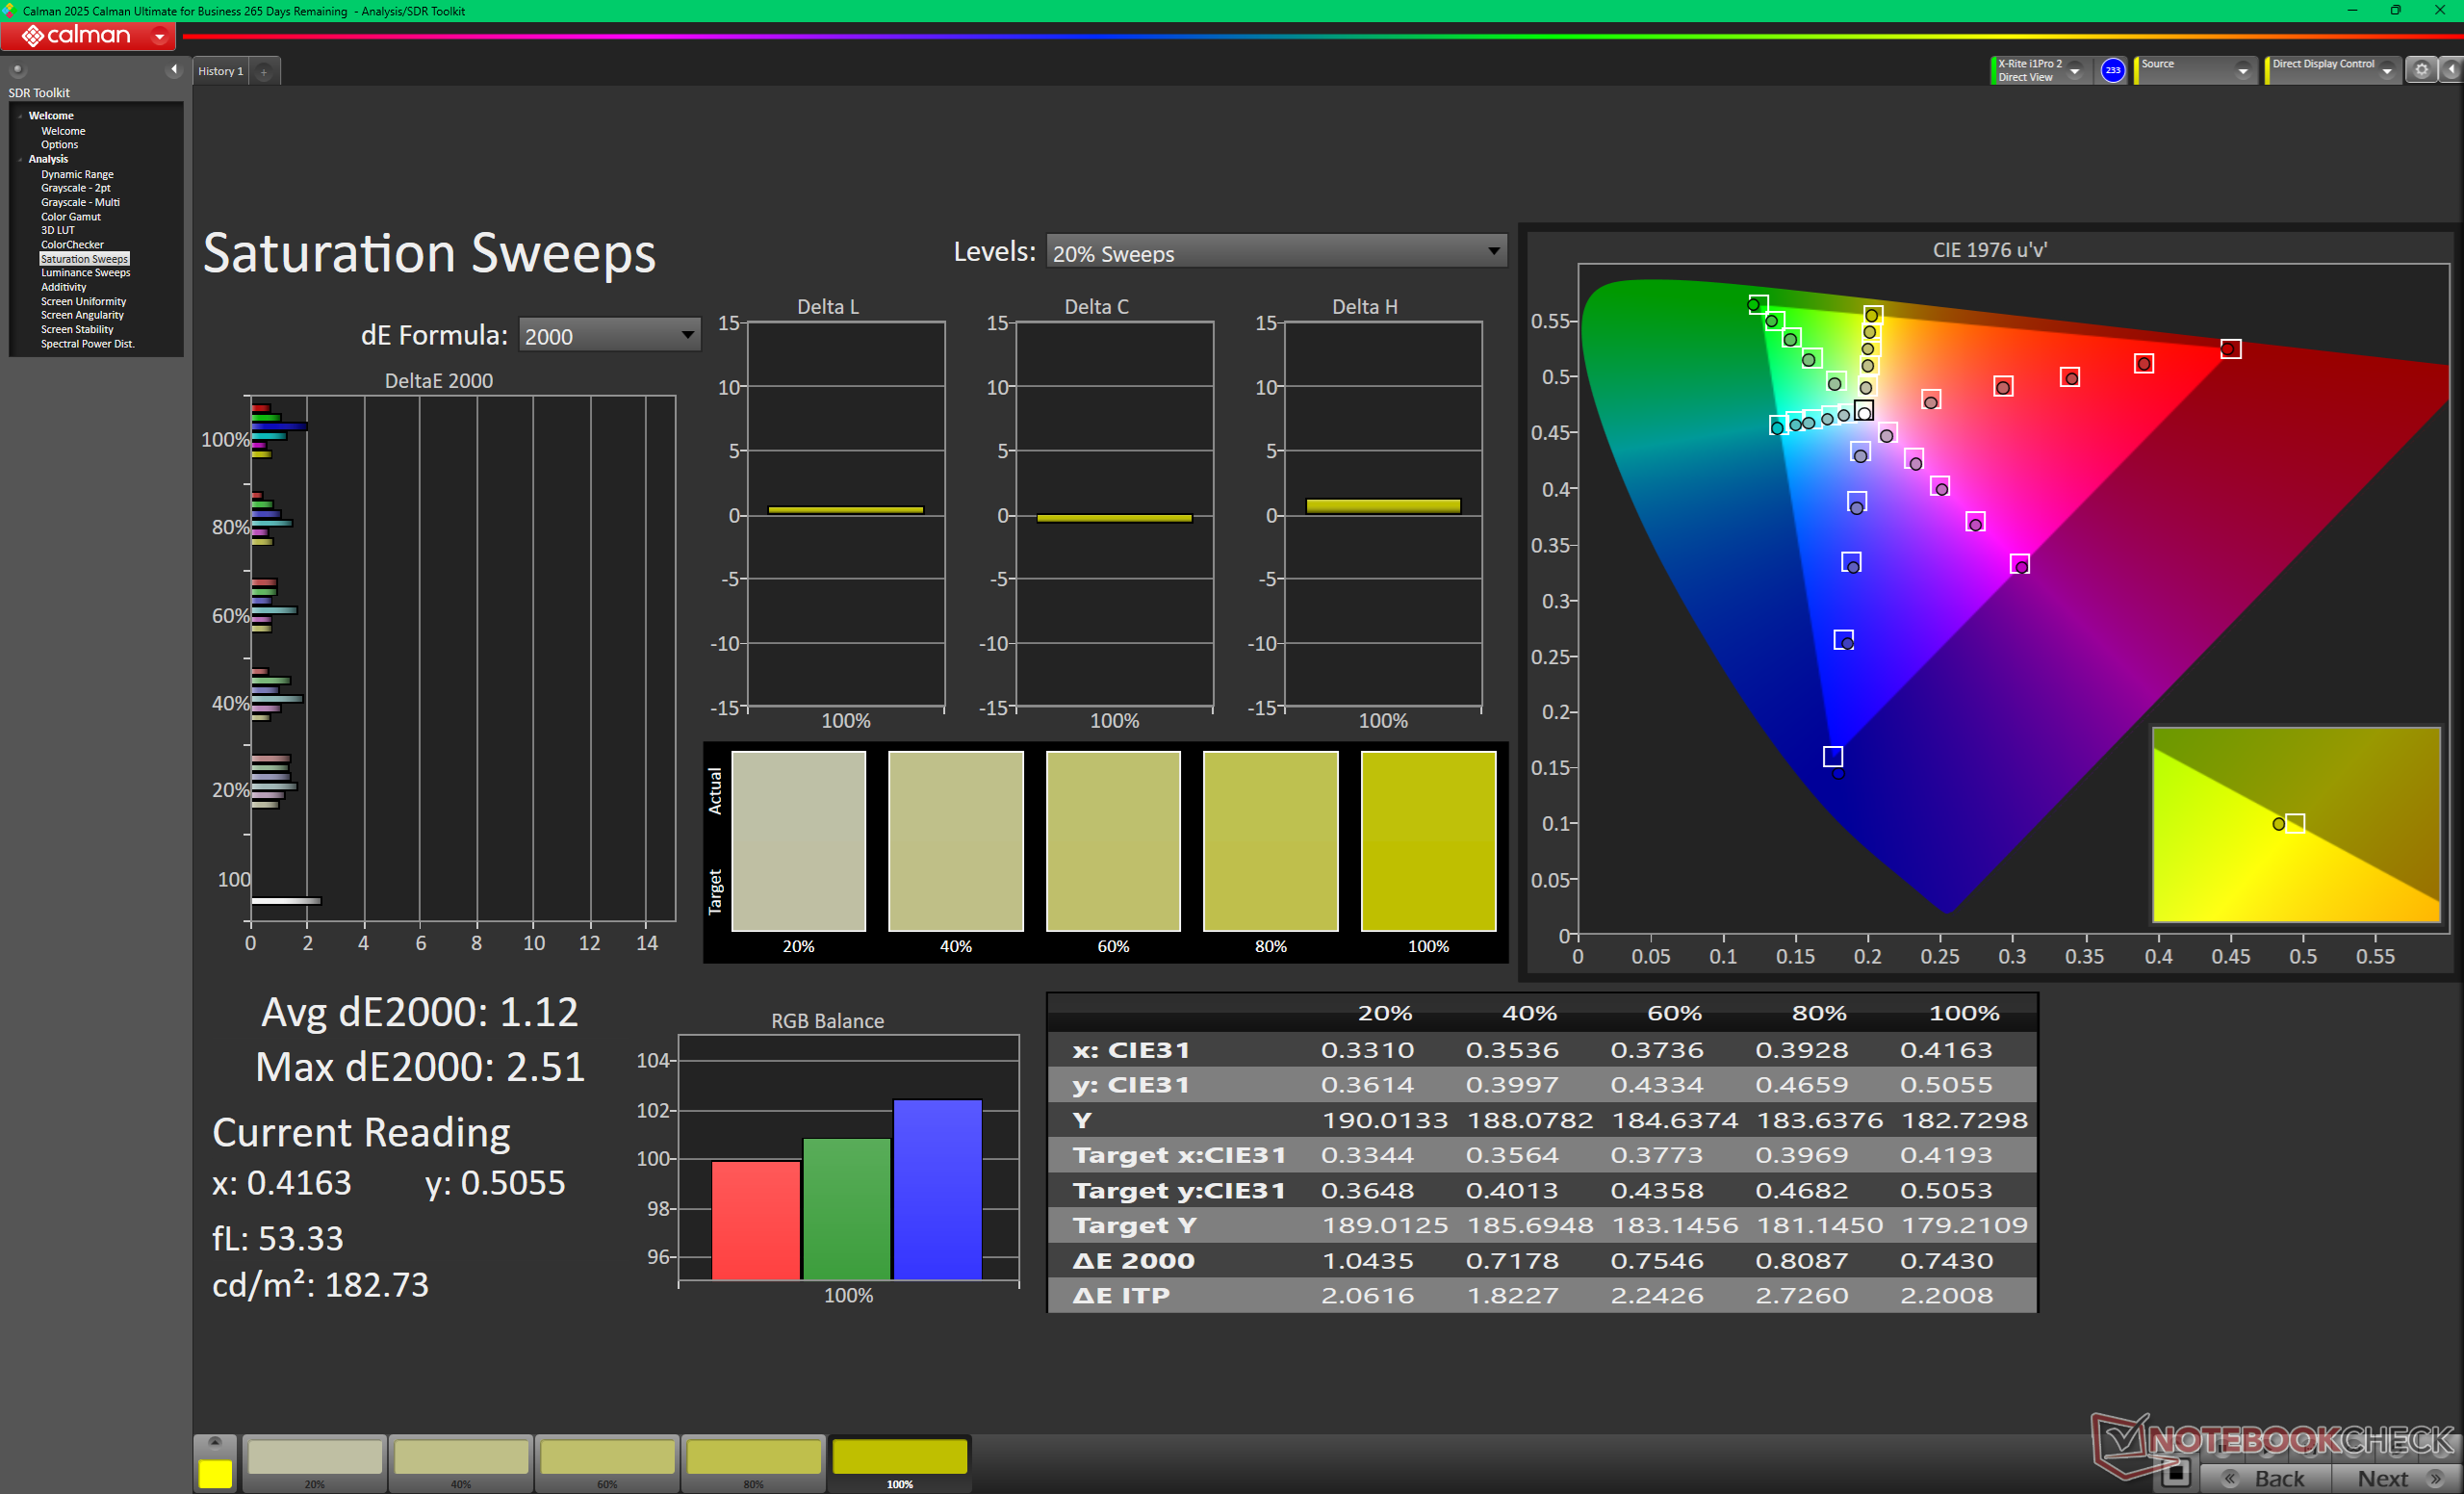
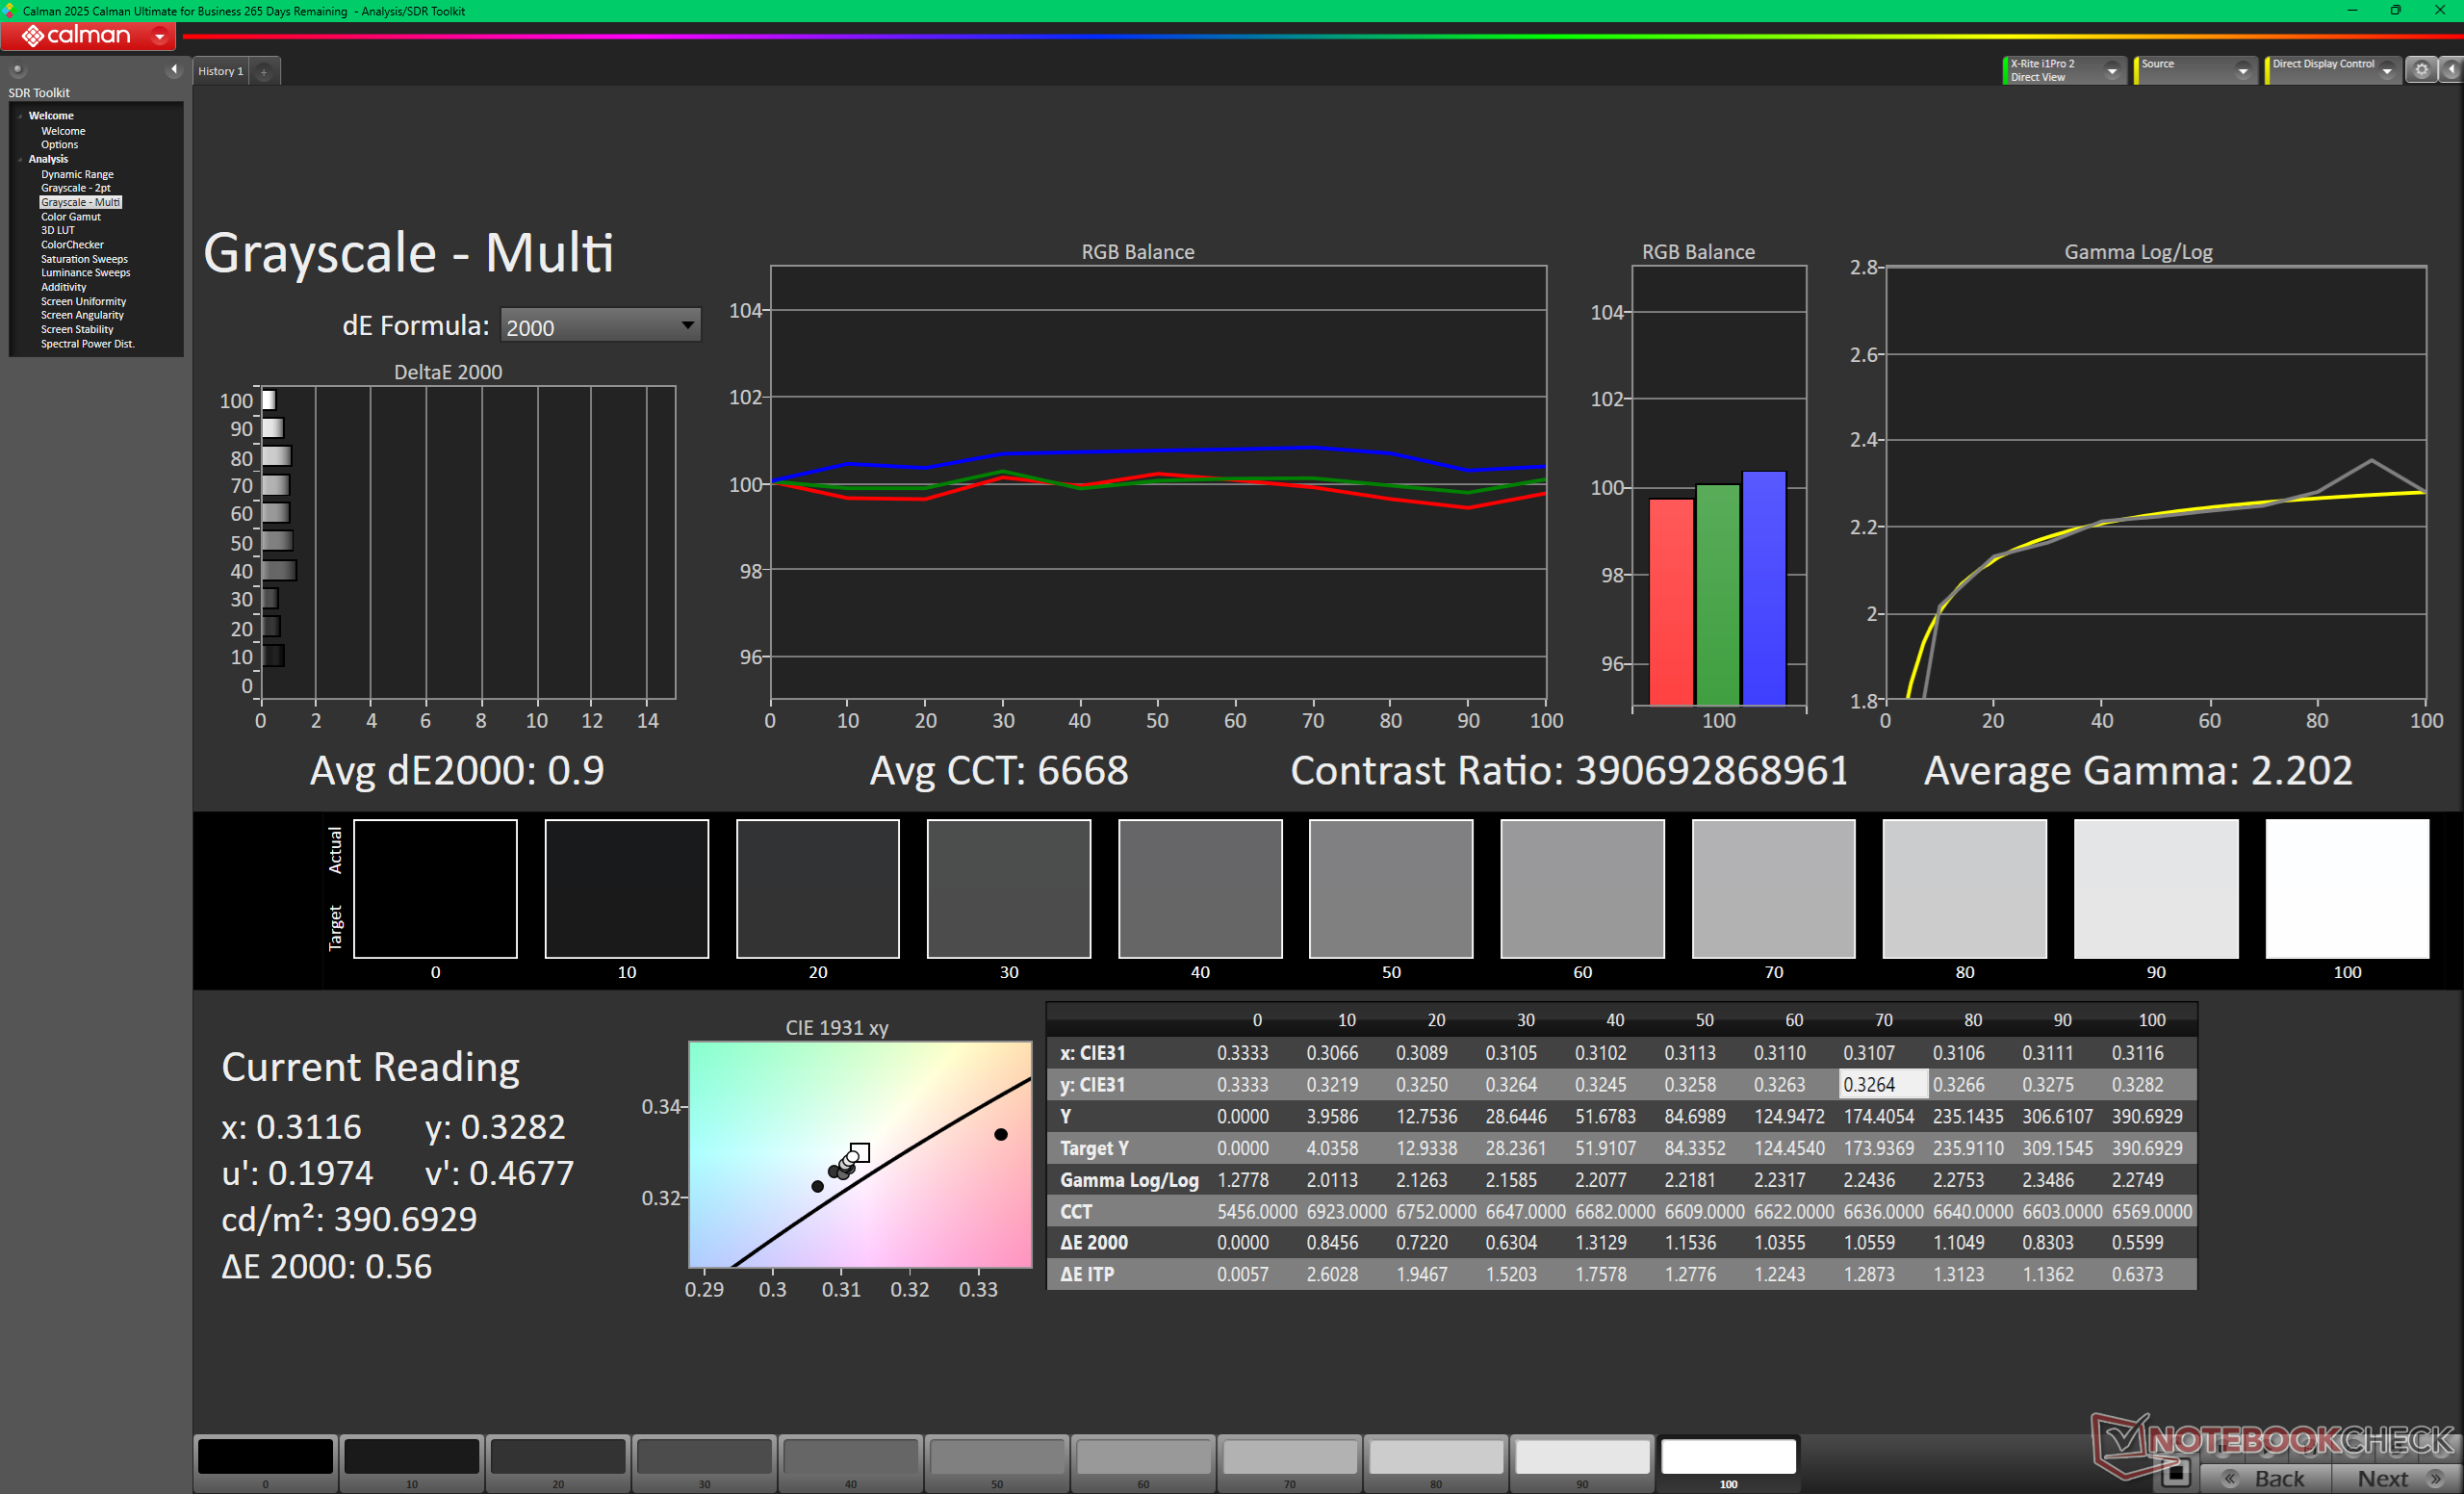
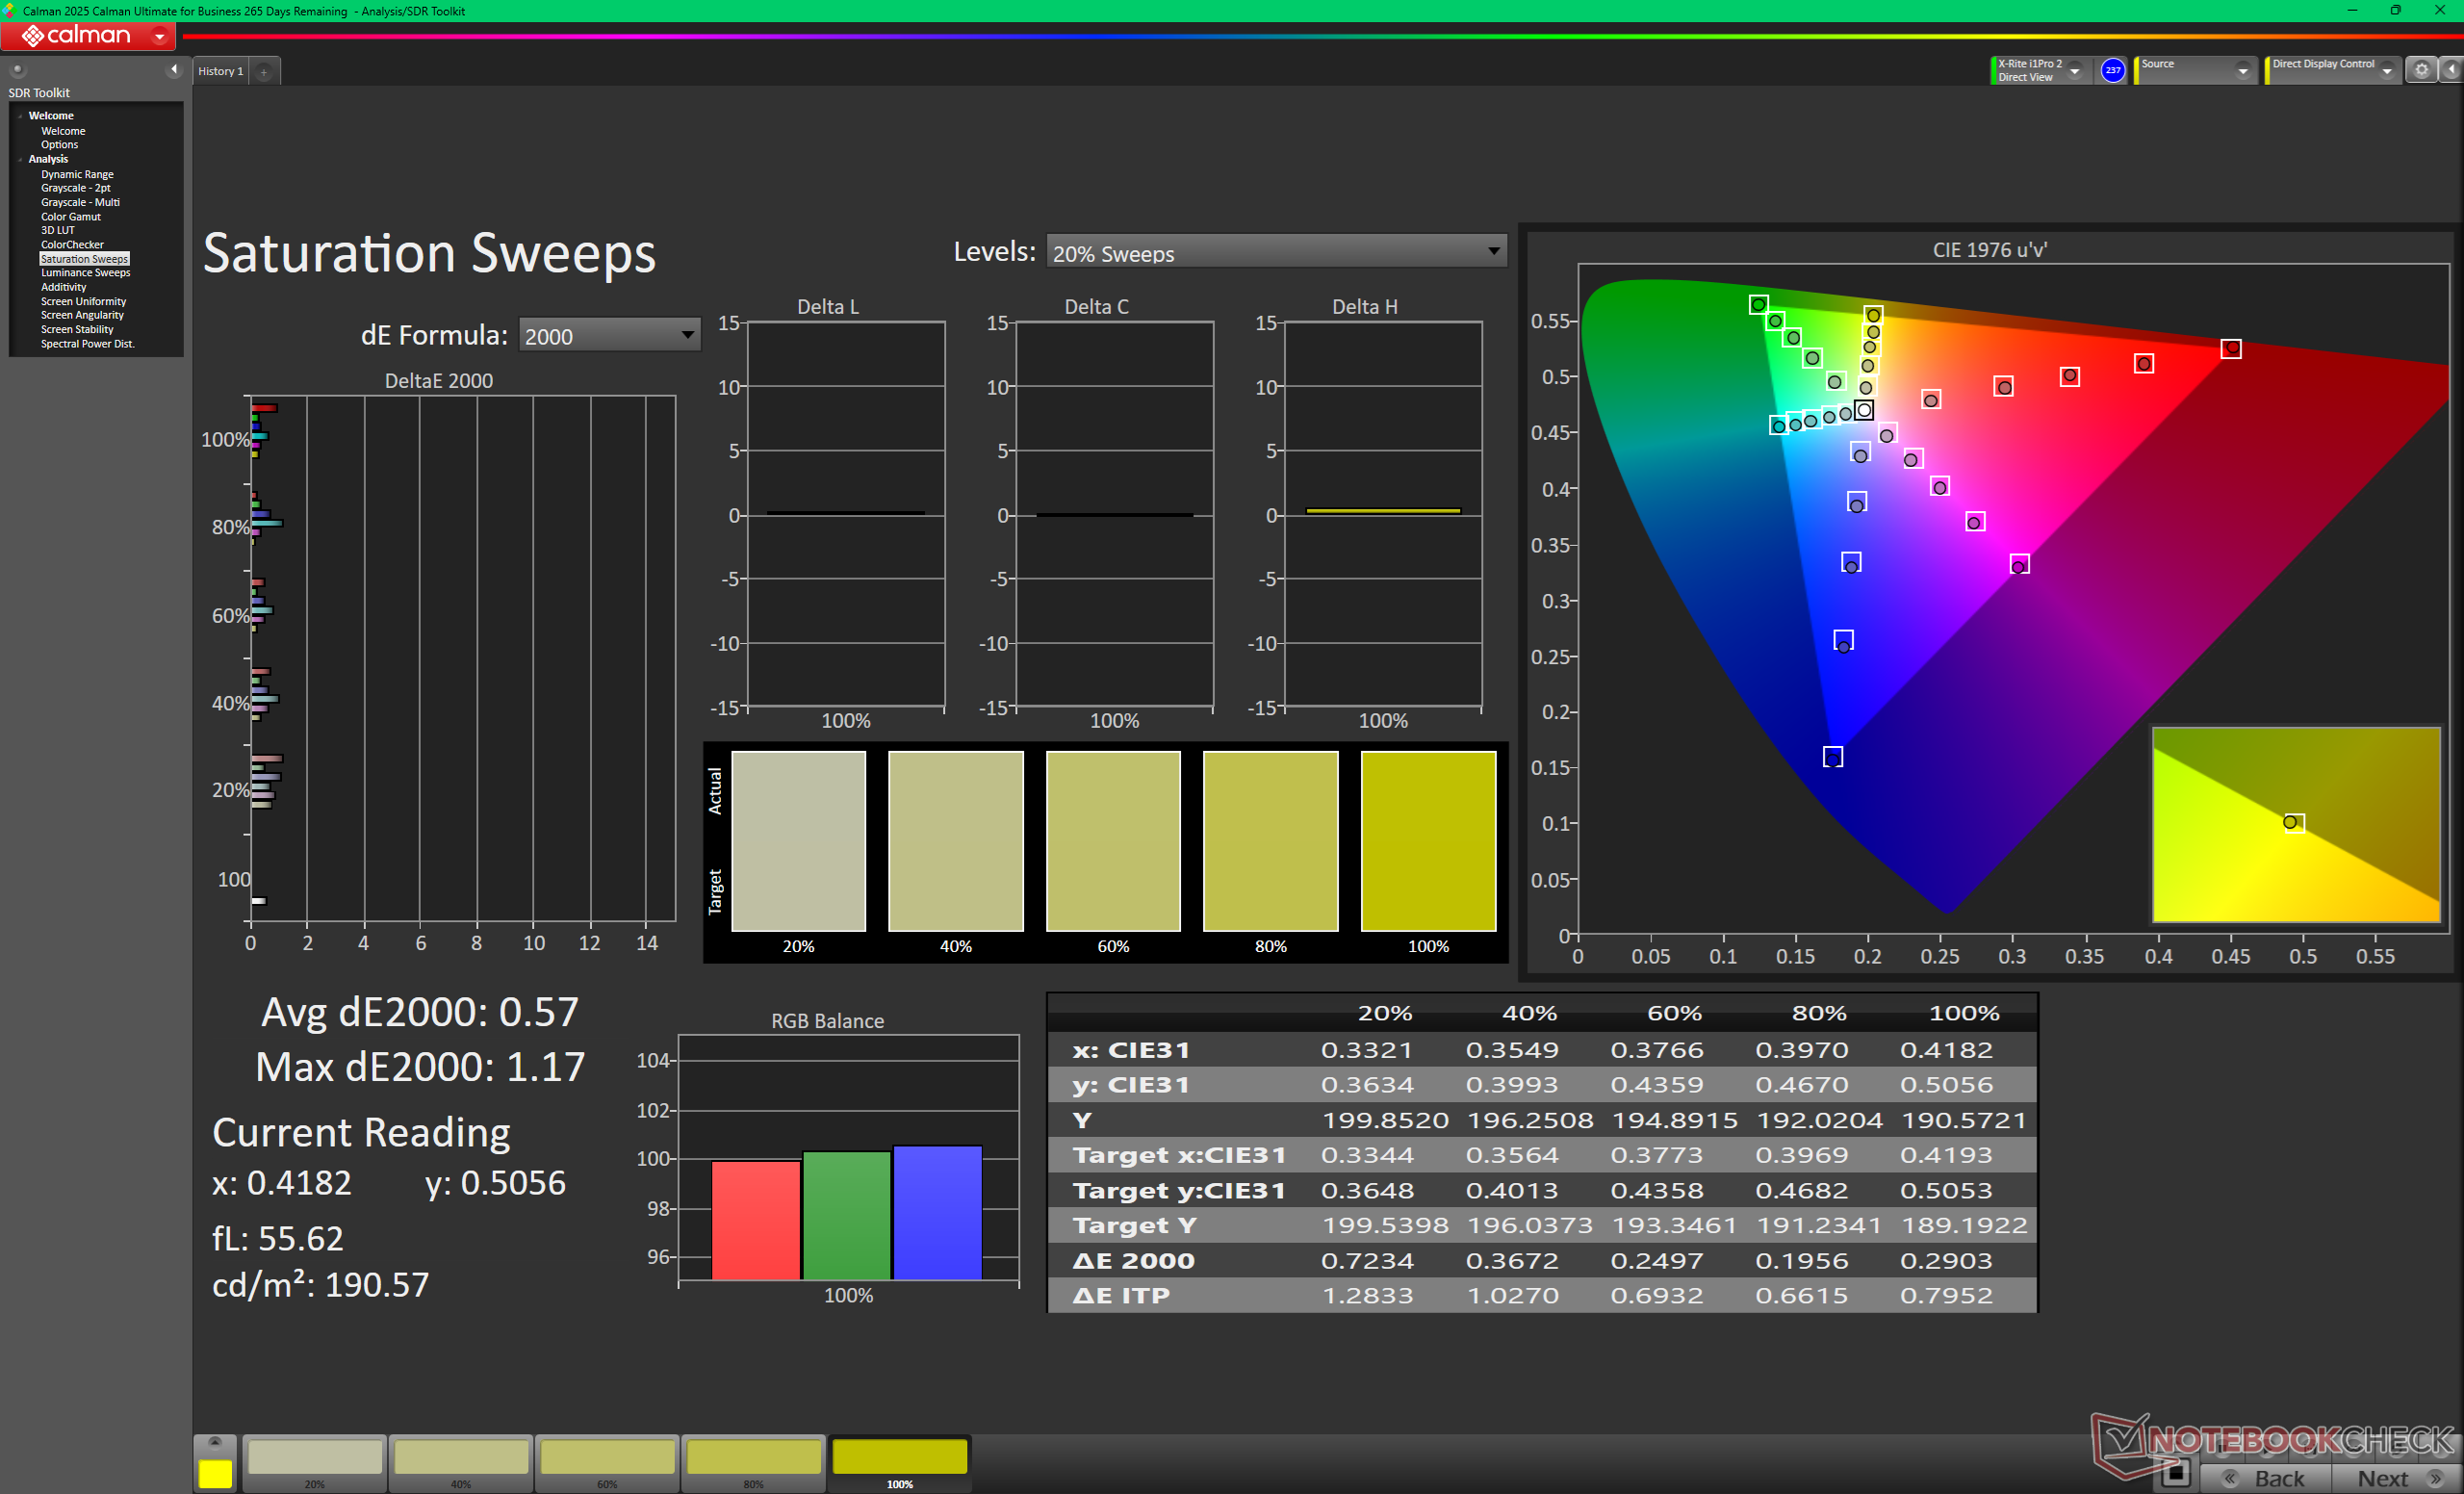
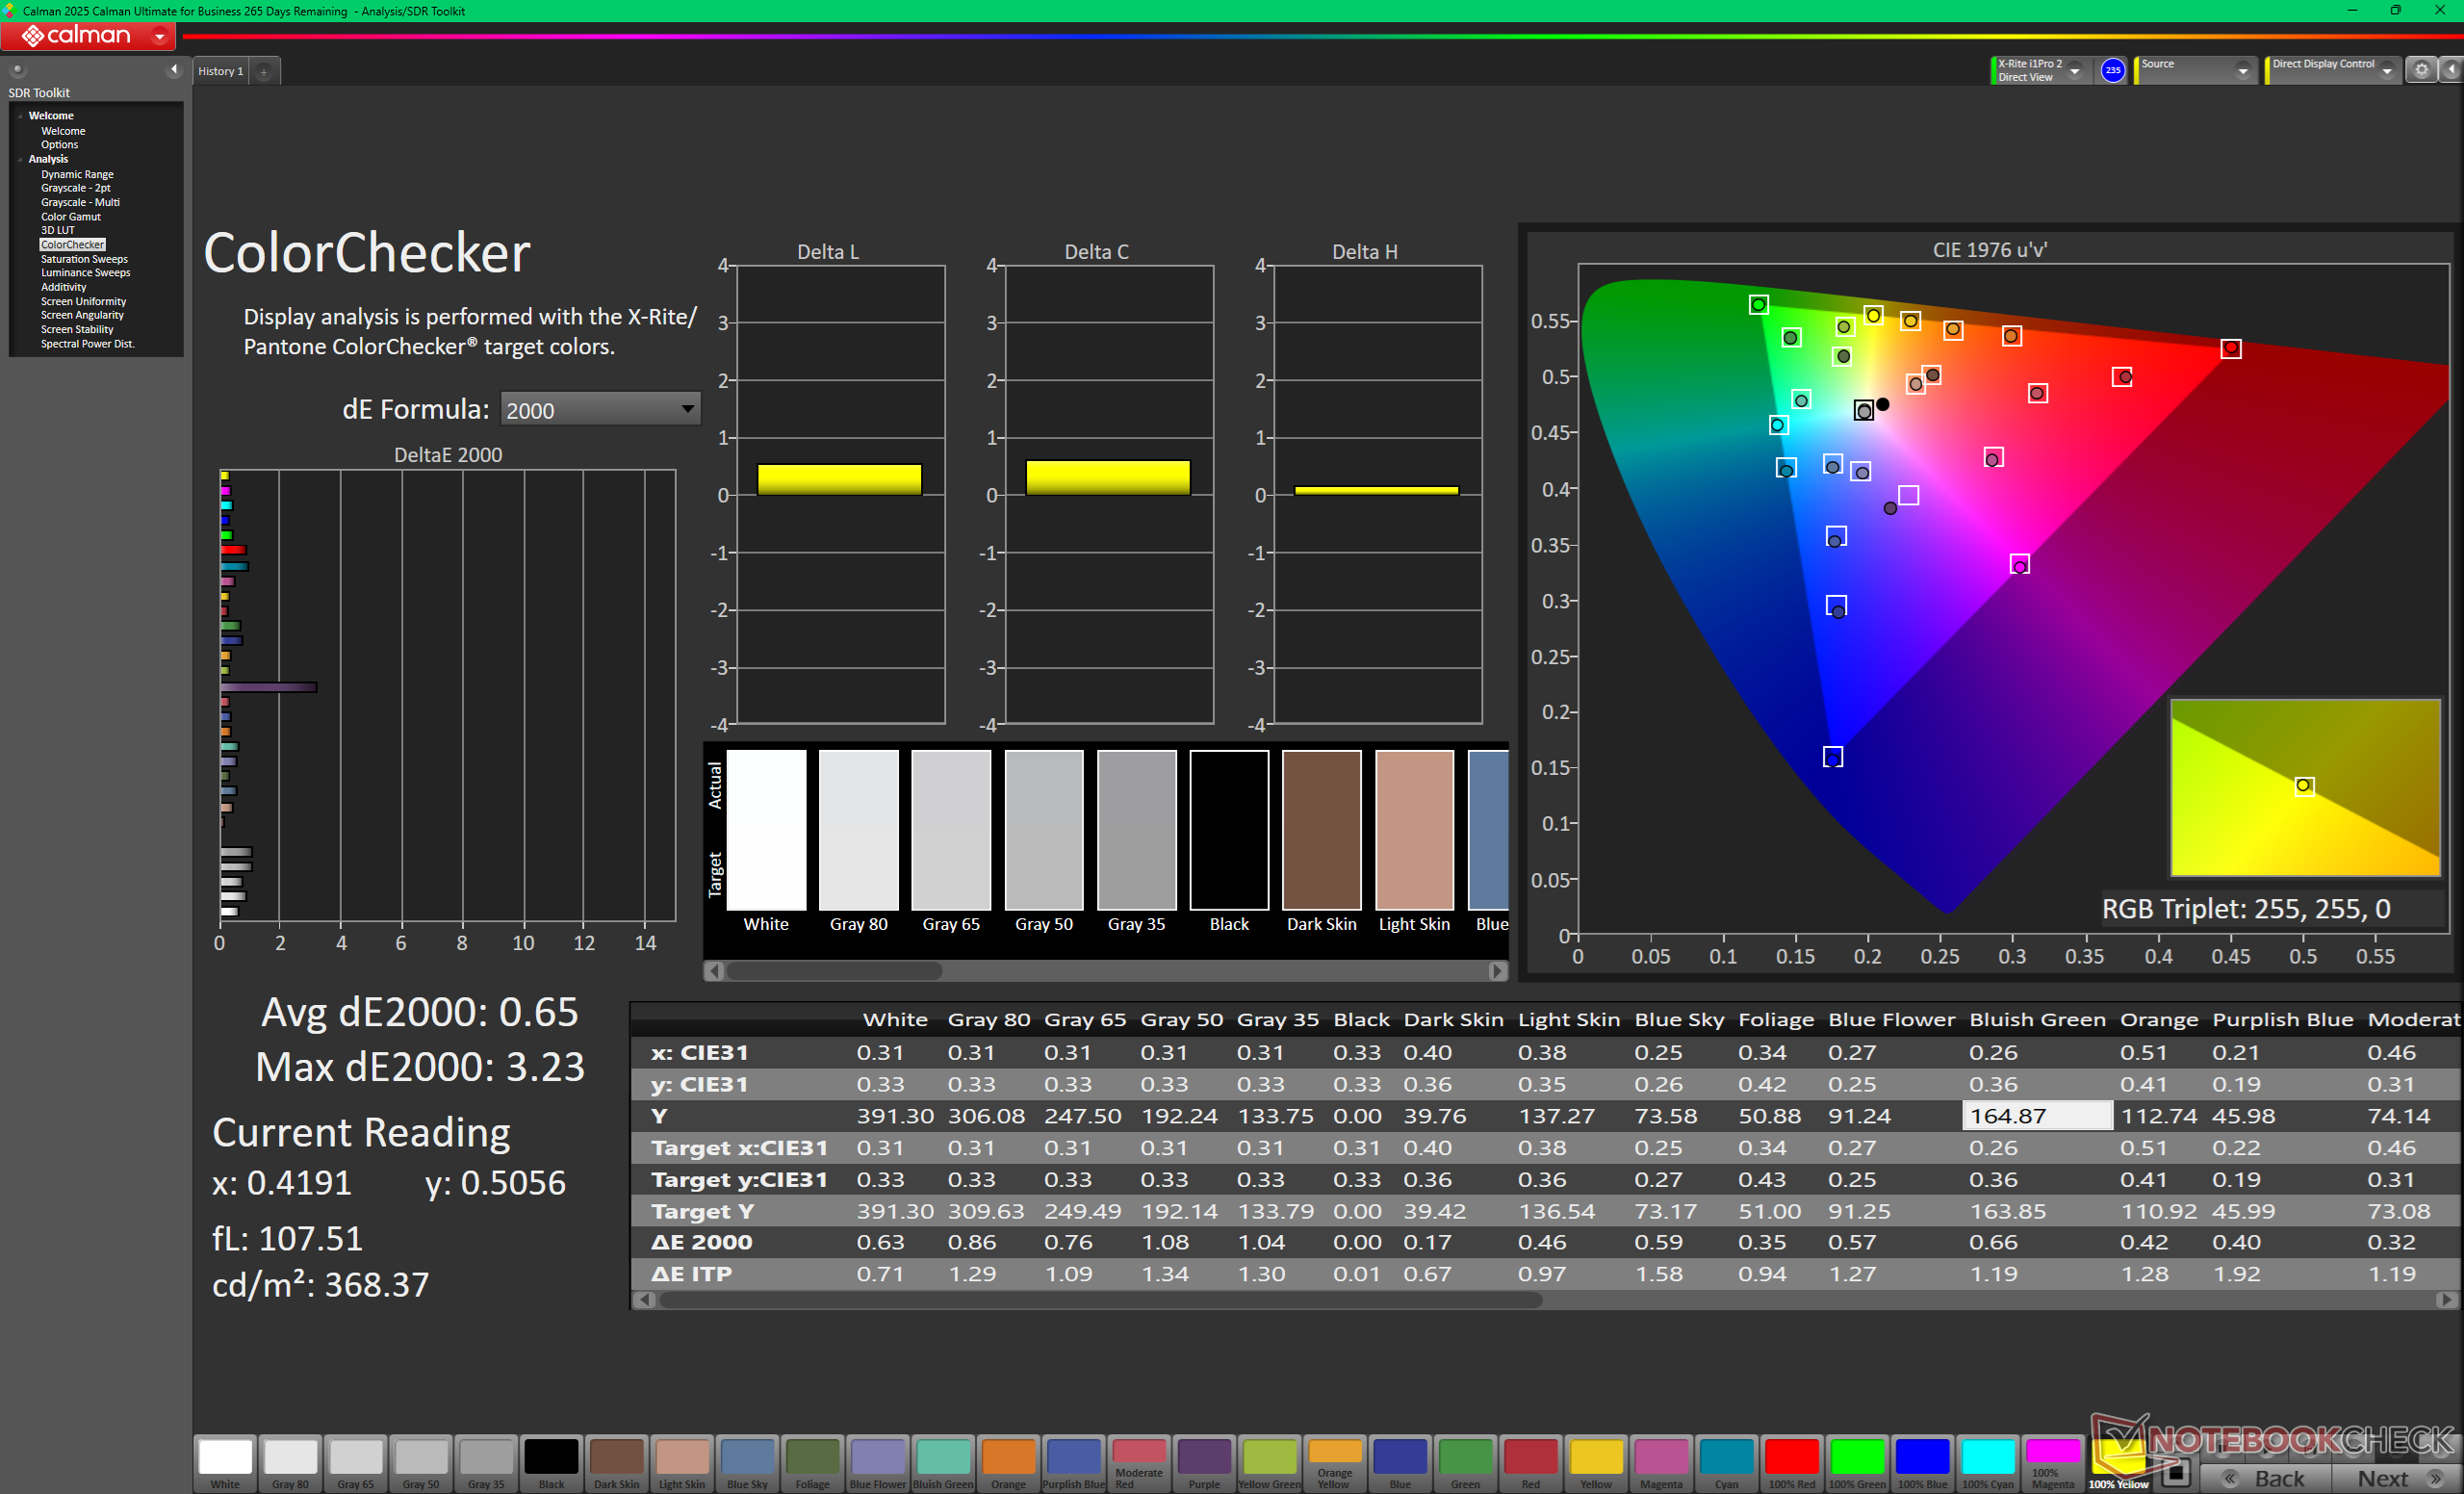
O sistema é predefinido e pré-calibrado para sRGB, embora a tela OLED suporte cores P3 completas. Os valores médios de escala de cinza e deltaE de cores já são muito precisos, com apenas 1,9 e 1,29, respectivamente, antes de qualquer esforço de calibração.
Exibir tempos de resposta
| ↔ Tempo de resposta preto para branco | ||
|---|---|---|
| 0.87 ms ... ascensão ↗ e queda ↘ combinadas | ↗ 0.41 ms ascensão | 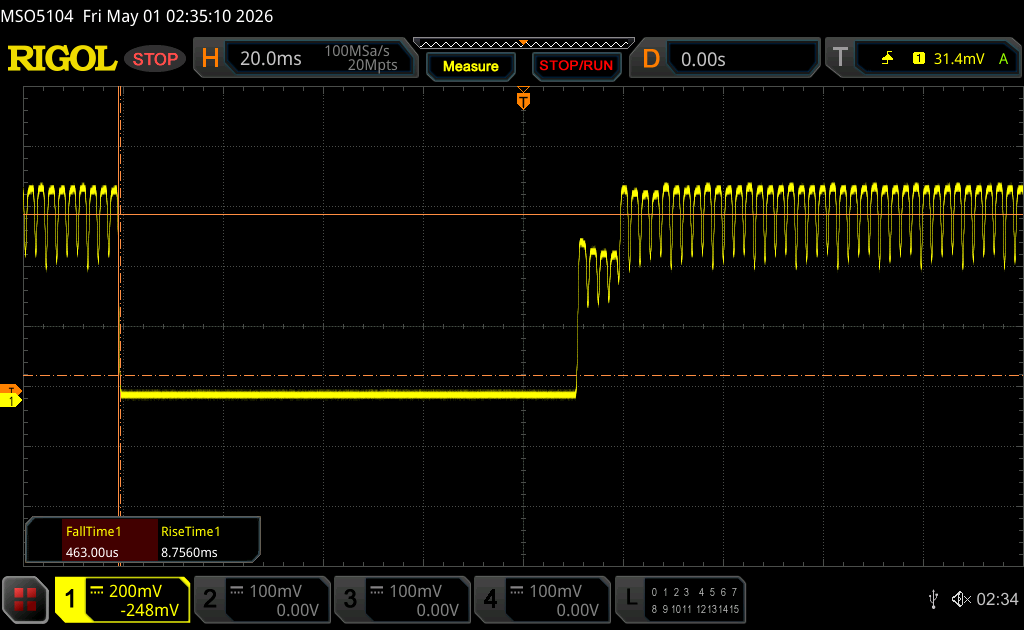 |
| ↘ 0.46 ms queda | ||
| A tela mostra taxas de resposta muito rápidas em nossos testes e deve ser muito adequada para jogos em ritmo acelerado. Em comparação, todos os dispositivos testados variam de 0.1 (mínimo) a 240 (máximo) ms. » 3 % de todos os dispositivos são melhores. Isso significa que o tempo de resposta medido é melhor que a média de todos os dispositivos testados (19.9 ms). | ||
| ↔ Tempo de resposta 50% cinza a 80% cinza | ||
| 0.71 ms ... ascensão ↗ e queda ↘ combinadas | ↗ 0.38 ms ascensão | 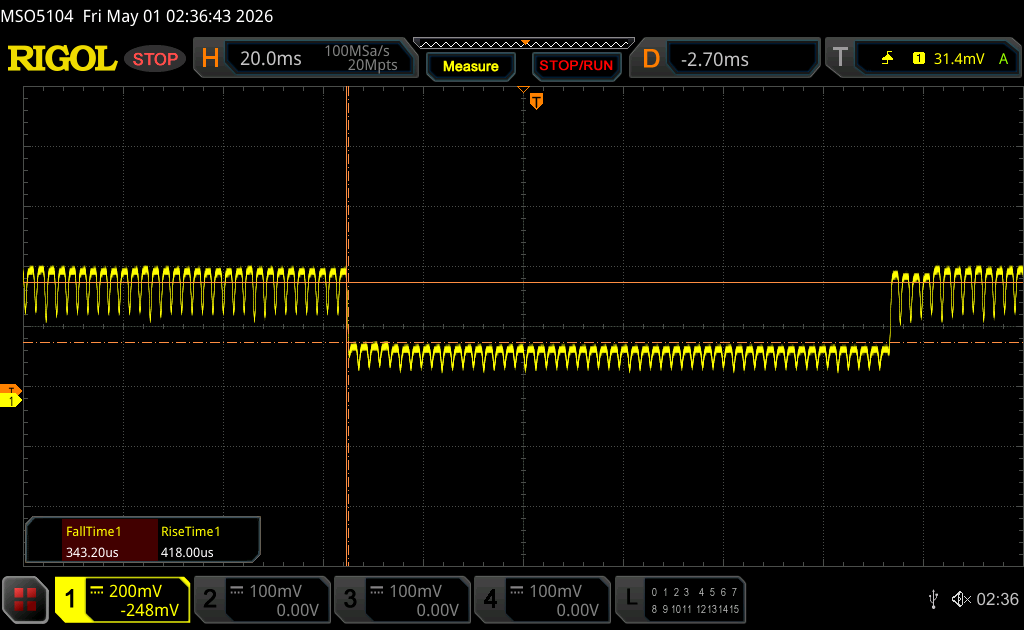 |
| ↘ 0.33 ms queda | ||
| A tela mostra taxas de resposta muito rápidas em nossos testes e deve ser muito adequada para jogos em ritmo acelerado. Em comparação, todos os dispositivos testados variam de 0.165 (mínimo) a 636 (máximo) ms. » 2 % de todos os dispositivos são melhores. Isso significa que o tempo de resposta medido é melhor que a média de todos os dispositivos testados (31.1 ms). | ||
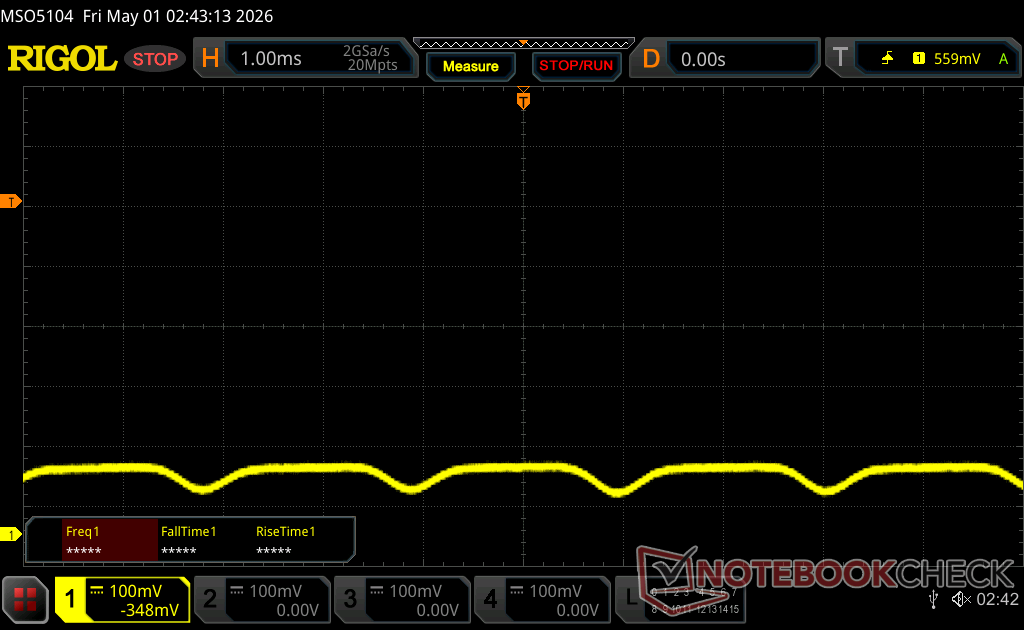
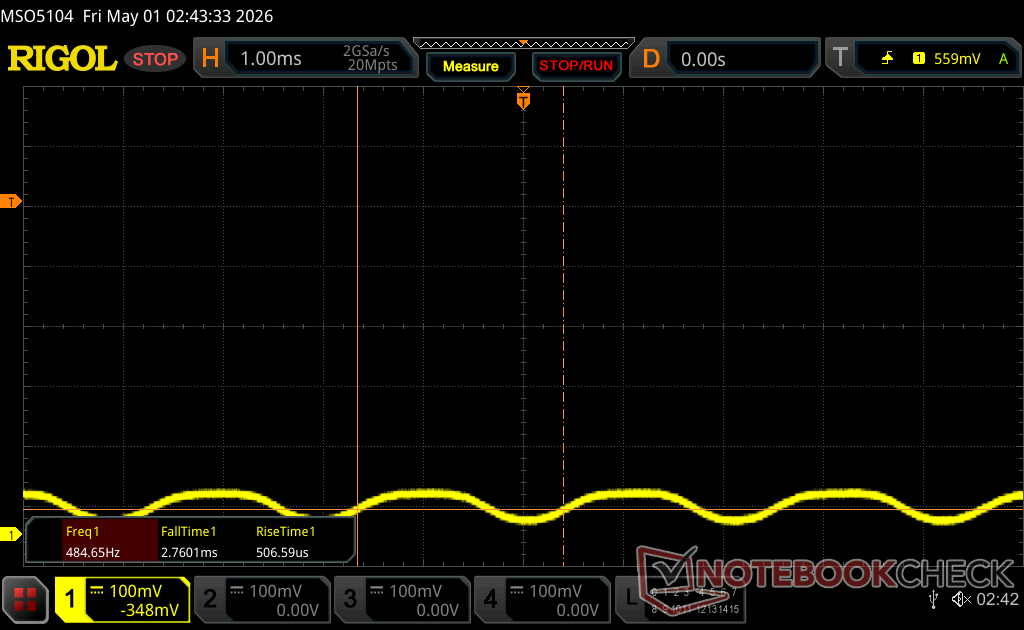
Cintilação da tela / PWM (modulação por largura de pulso)
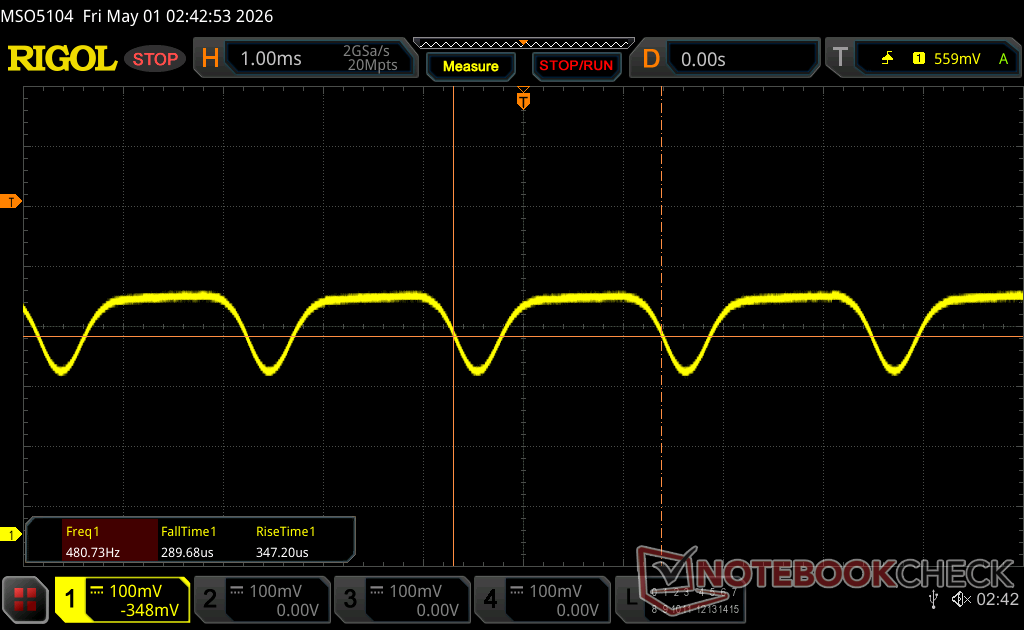
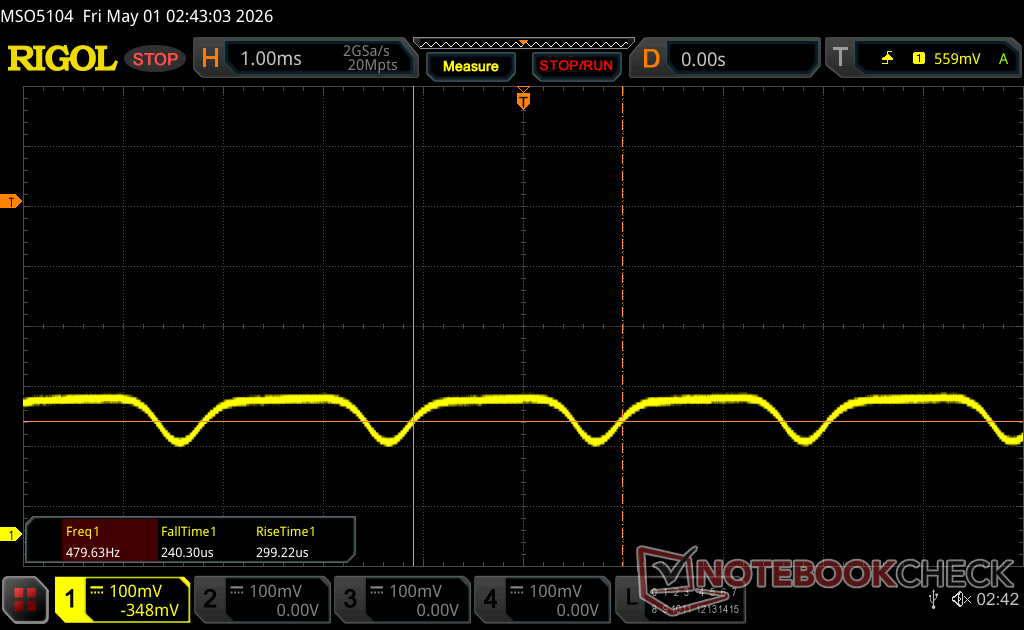
| Tela tremeluzindo/PWM detectado | 460.46 Hz Amplitude: 18 % | ≤ 100 % configuração de brilho | 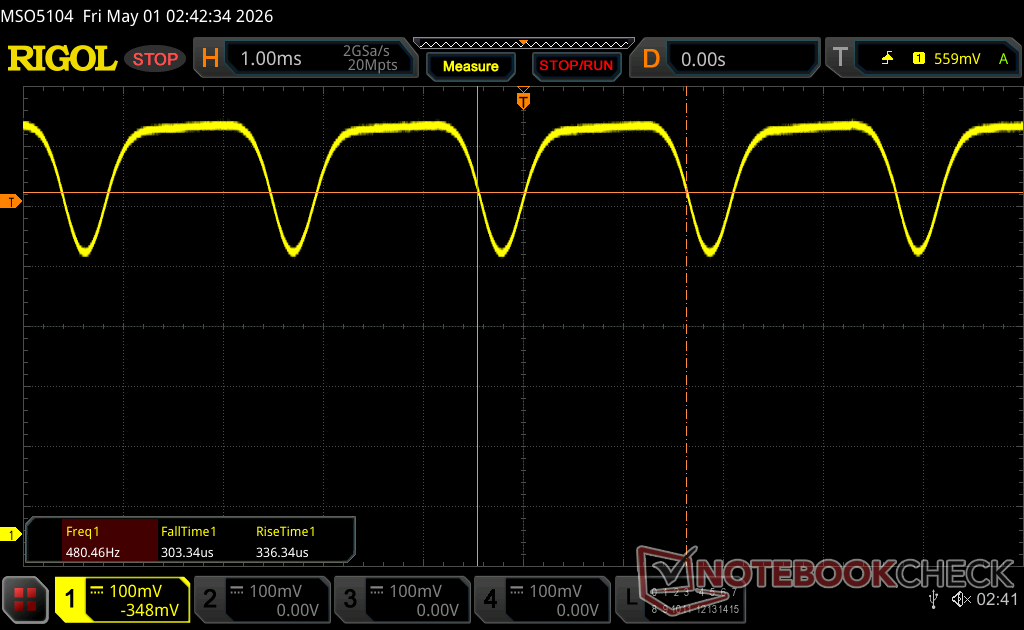 |
A luz de fundo da tela pisca em 460.46 Hz (pior caso, por exemplo, utilizando PWM) Cintilação detectada em uma configuração de brilho de 100 % e abaixo. Não deve haver cintilação ou PWM acima desta configuração de brilho. A frequência de 460.46 Hz é relativamente alta, portanto, a maioria dos usuários sensíveis ao PWM não deve notar nenhuma oscilação. No entanto, há relatos de que alguns usuários ainda são sensíveis ao PWM em 500 Hz e acima, portanto, esteja atento. [pwm_comparison] Em comparação: 52 % de todos os dispositivos testados não usam PWM para escurecer a tela. Se PWM foi detectado, uma média de 7801 (mínimo: 5 - máximo: 343500) Hz foi medida. | |||


Desempenho
Condições de teste
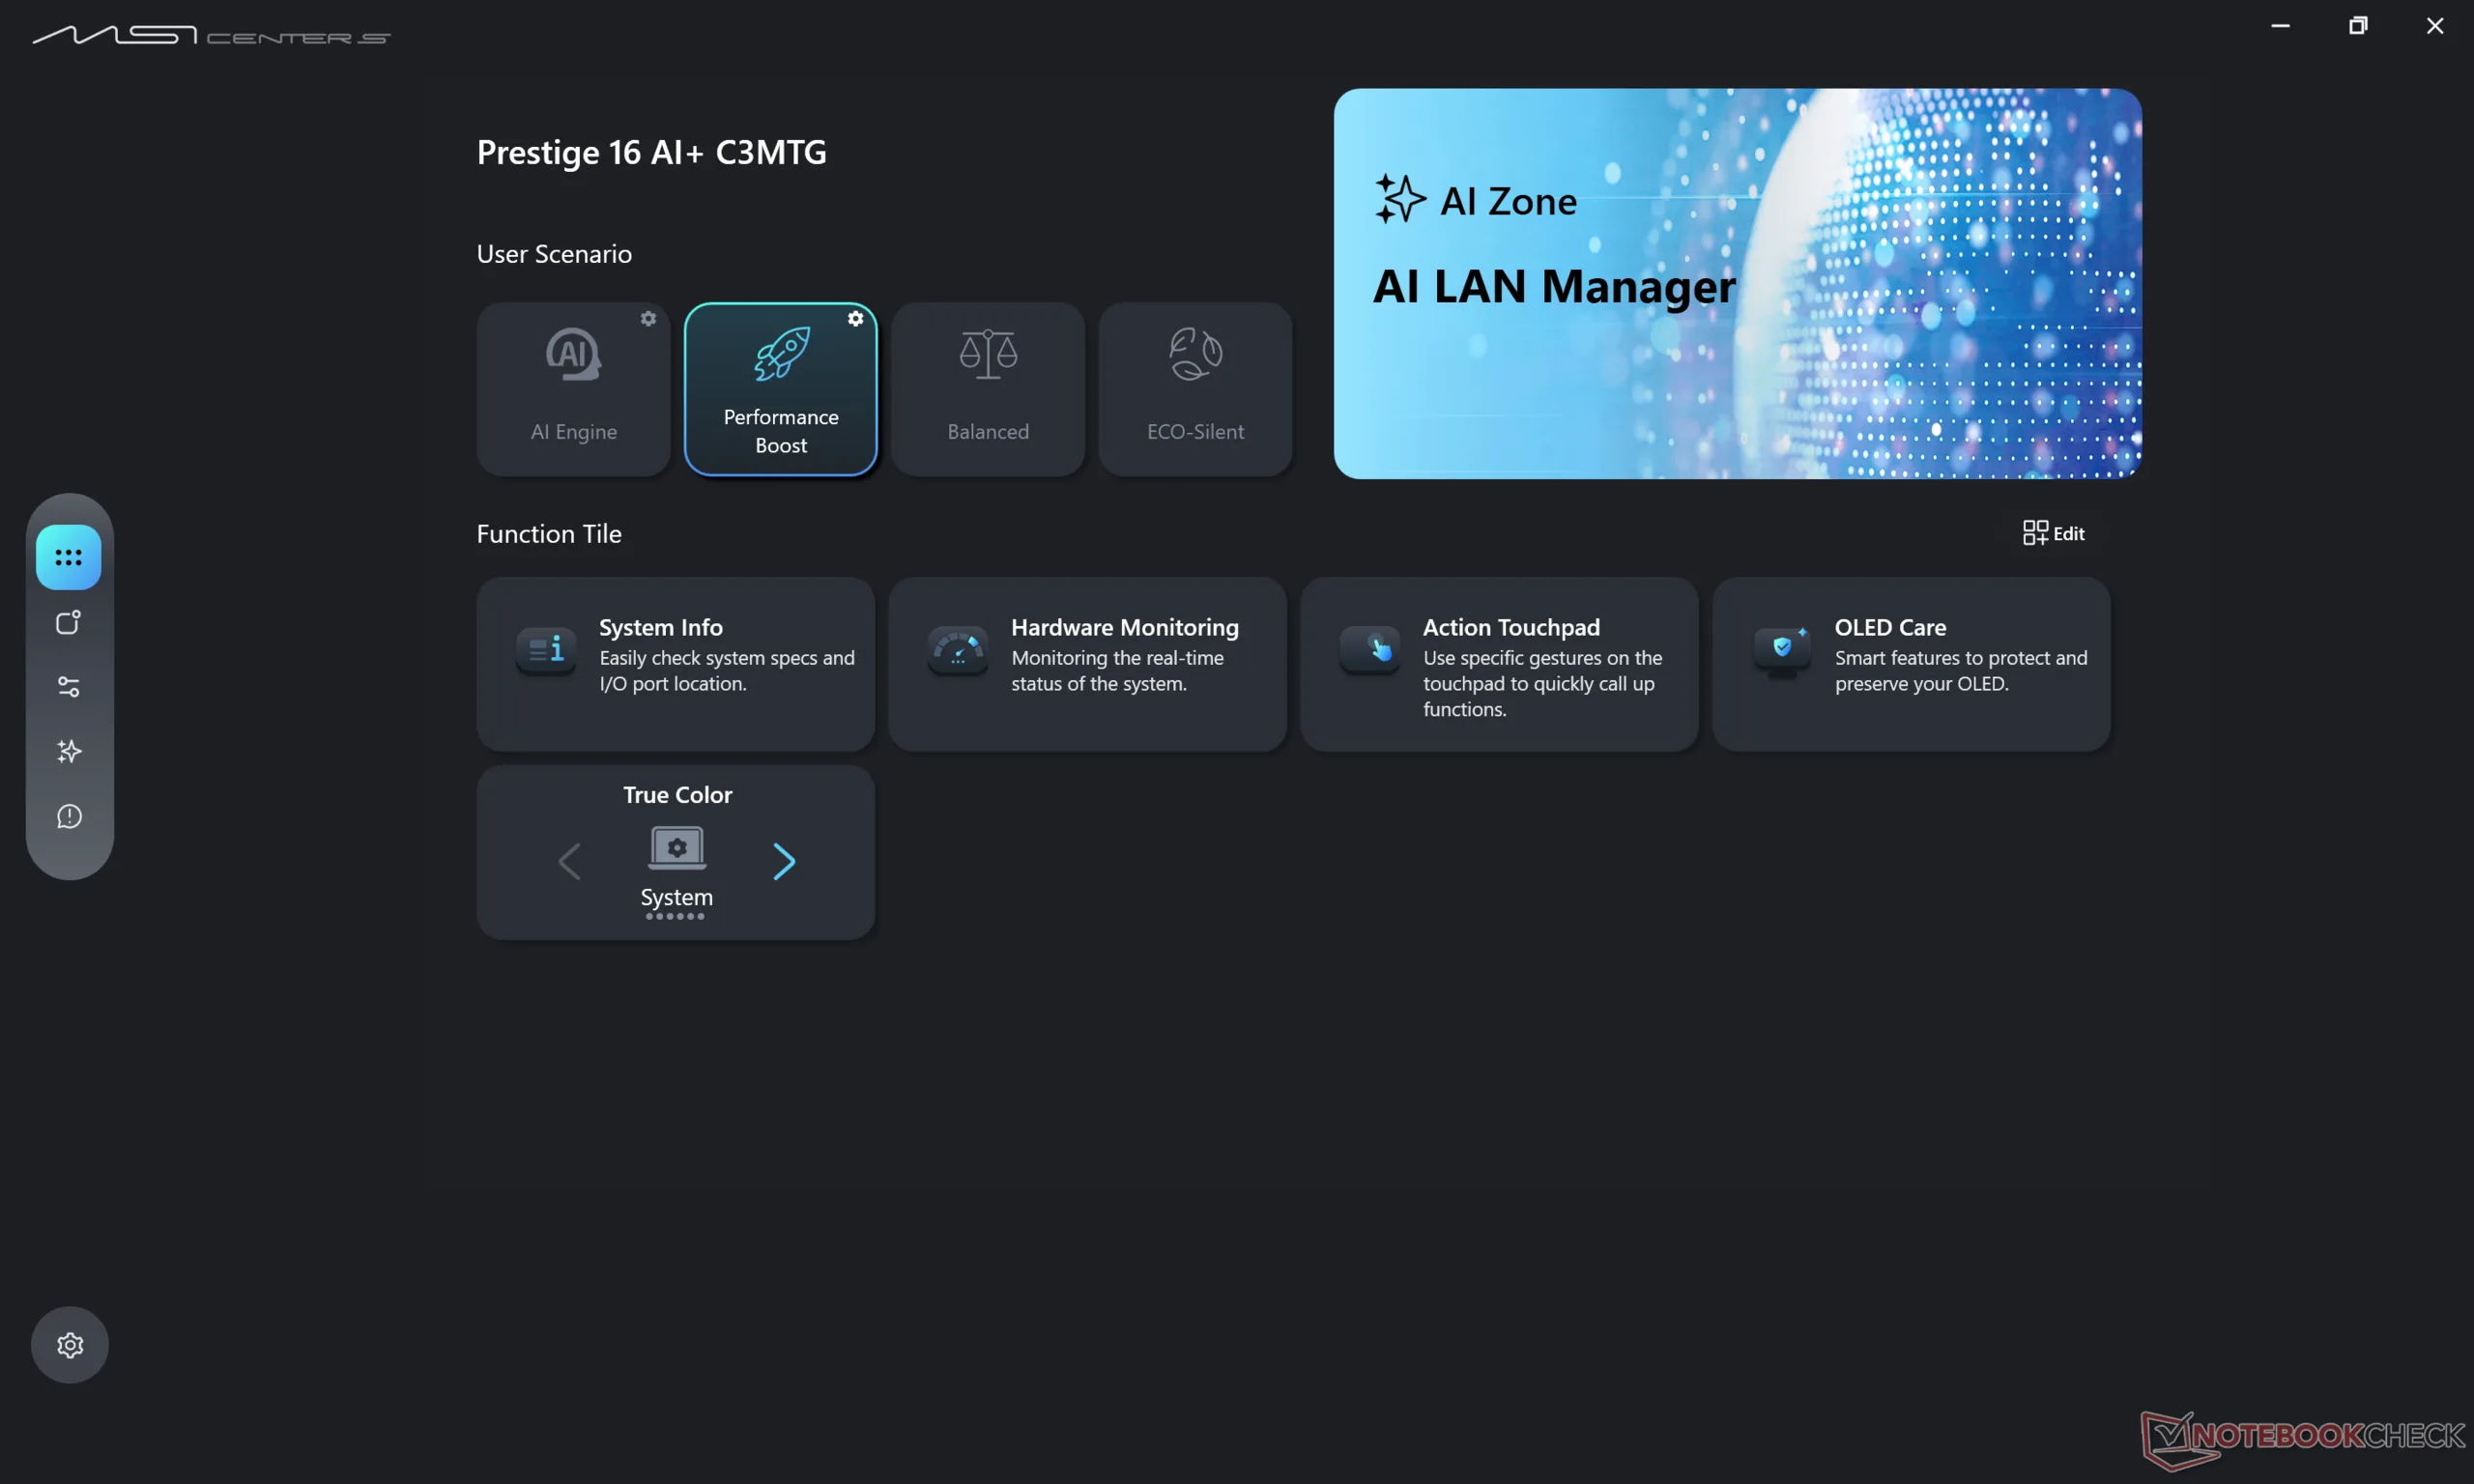
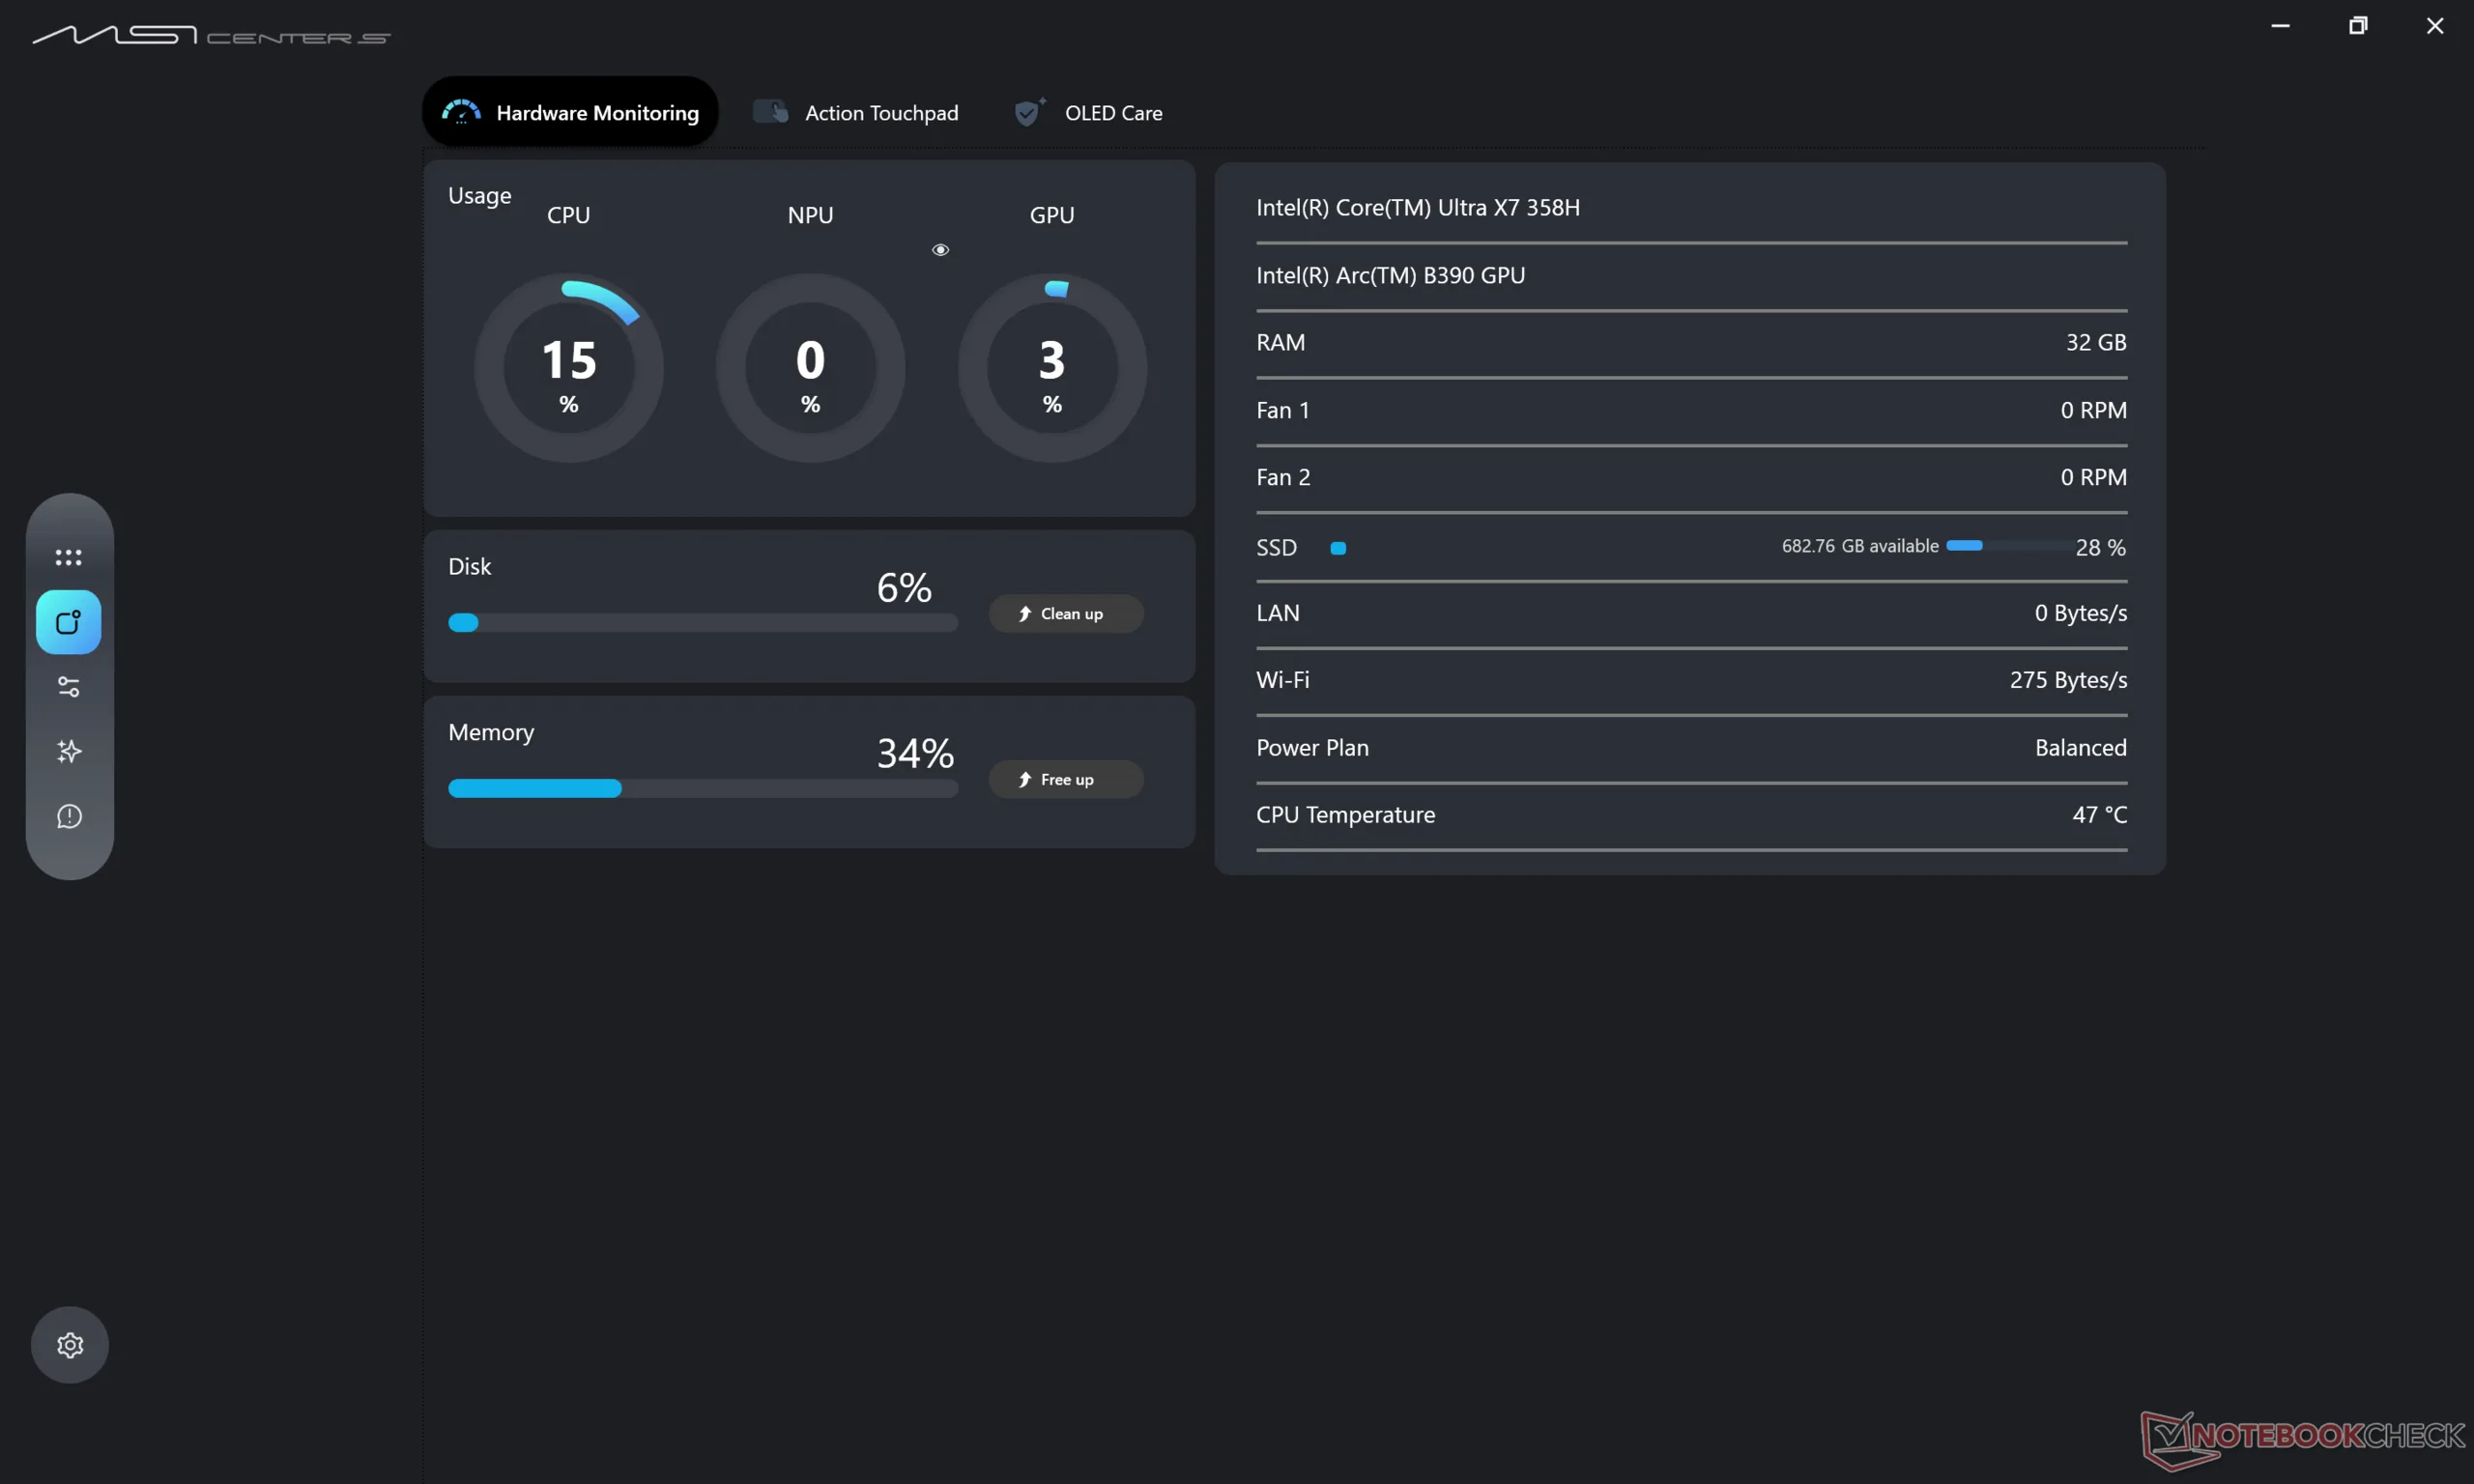
Definimos o MSI Center S e o Windows para o modo Desempenho antes de executar os benchmarks abaixo.
Processador
O Core Ultra X7 358H oferece um desempenho mais consistente do que o Core Ultra 9 285H no 2025 Prestige 16. Enquanto o último pode ser até 10% mais rápido quando o Turbo Boost é mais eficaz, o oposto é verdadeiro depois que o Turbo Boost se estabiliza. Isso pode ser observado ao executar o CineBench R15 xT em um loop em que o Prestige 16 2025 é a máquina mais rápida apenas durante o primeiro minuto, mais ou menos, antes que o Prestige 16 2026 o ultrapasse depois disso.
Atualizando para o Core Ultra X9 388H deverá aumentar o desempenho multi-thread em até 10%, com base em nosso tempo com o Asus ZenBook Duo UX8407AA.
Cinebench R15 Multi Loop
Cinebench R23: Multi Core | Single Core
Cinebench R20: CPU (Multi Core) | CPU (Single Core)
Cinebench R15: CPU Multi 64Bit | CPU Single 64Bit
Blender: v2.79 BMW27 CPU
7-Zip 18.03: 7z b 4 | 7z b 4 -mmt1
Geekbench 6.7: Multi-Core | Single-Core
Geekbench 5.5: Multi-Core | Single-Core
HWBOT x265 Benchmark v2.2: 4k Preset
LibreOffice : 20 Documents To PDF
R Benchmark 2.5: Overall mean
* ... menor é melhor
AIDA64: FP32 Ray-Trace | FPU Julia | CPU SHA3 | CPU Queen | FPU SinJulia | FPU Mandel | CPU AES | CPU ZLib | FP64 Ray-Trace | CPU PhotoWorxx | CPU CheckMate
| Performance rating | |
| Asus ZenBook S16 UM5606GA -1! | |
| Lenovo ThinkBook 16 G7+ AMD -1! | |
| Dell XPS 16 Core Ultra X7 358H -1! | |
| HP Envy x360 2-in-1 16-ad0097nr -1! | |
| MSI Prestige 16 AI C3MTG -1! | |
| MSI Prestige 16 AI Evo B2HMG -1! | |
| Média Intel Core Ultra X7 358H | |
| AIDA64 / FP32 Ray-Trace | |
| Lenovo ThinkBook 16 G7+ AMD (v6.92.6600) | |
| Asus ZenBook S16 UM5606GA (v6.92.6600) | |
| HP Envy x360 2-in-1 16-ad0097nr (v6.92.6600) | |
| MSI Prestige 16 AI Evo B2HMG (v6.92.6600) | |
| MSI Prestige 16 AI C3MTG (v8.20.8100) | |
| Dell XPS 16 Core Ultra X7 358H (v8.20.8100) | |
| Média Intel Core Ultra X7 358H (12221 - 17932, n=8) | |
| AIDA64 / FPU Julia | |
| Lenovo ThinkBook 16 G7+ AMD (v6.92.6600) | |
| Asus ZenBook S16 UM5606GA (v6.92.6600) | |
| MSI Prestige 16 AI Evo B2HMG (v6.92.6600) | |
| HP Envy x360 2-in-1 16-ad0097nr (v6.92.6600) | |
| MSI Prestige 16 AI C3MTG (v8.20.8100) | |
| Dell XPS 16 Core Ultra X7 358H (v8.20.8100) | |
| Média Intel Core Ultra X7 358H (29930 - 95525, n=8) | |
| AIDA64 / CPU SHA3 | |
| Lenovo ThinkBook 16 G7+ AMD (v6.92.6600) | |
| Asus ZenBook S16 UM5606GA (v6.92.6600) | |
| Média Intel Core Ultra X7 358H (3910 - 4911, n=8) | |
| MSI Prestige 16 AI Evo B2HMG (v6.92.6600) | |
| Dell XPS 16 Core Ultra X7 358H (v8.20.8100) | |
| MSI Prestige 16 AI C3MTG (v8.20.8100) | |
| HP Envy x360 2-in-1 16-ad0097nr (v6.92.6600) | |
| AIDA64 / CPU Queen | |
| HP Envy x360 2-in-1 16-ad0097nr (v6.92.6600) | |
| Asus ZenBook S16 UM5606GA (v6.92.6600) | |
| Lenovo ThinkBook 16 G7+ AMD (v6.92.6600) | |
| MSI Prestige 16 AI Evo B2HMG (v6.92.6600) | |
| Média Intel Core Ultra X7 358H (63425 - 63827, n=2) | |
| AIDA64 / FPU SinJulia | |
| Lenovo ThinkBook 16 G7+ AMD (v6.92.6600) | |
| Asus ZenBook S16 UM5606GA (v6.92.6600) | |
| HP Envy x360 2-in-1 16-ad0097nr (v6.92.6600) | |
| MSI Prestige 16 AI Evo B2HMG (v6.92.6600) | |
| Dell XPS 16 Core Ultra X7 358H (v8.20.8100) | |
| MSI Prestige 16 AI C3MTG (v8.20.8100) | |
| Média Intel Core Ultra X7 358H (4735 - 7038, n=8) | |
| AIDA64 / FPU Mandel | |
| Lenovo ThinkBook 16 G7+ AMD (v6.92.6600) | |
| Asus ZenBook S16 UM5606GA (v6.92.6600) | |
| MSI Prestige 16 AI Evo B2HMG (v6.92.6600) | |
| HP Envy x360 2-in-1 16-ad0097nr (v6.92.6600) | |
| Dell XPS 16 Core Ultra X7 358H (v8.20.8100) | |
| MSI Prestige 16 AI C3MTG (v8.20.8100) | |
| Média Intel Core Ultra X7 358H (14716 - 50734, n=8) | |
| AIDA64 / CPU AES | |
| Asus ZenBook S16 UM5606GA (v6.92.6600) | |
| HP Envy x360 2-in-1 16-ad0097nr (v6.92.6600) | |
| Lenovo ThinkBook 16 G7+ AMD (v6.92.6600) | |
| MSI Prestige 16 AI Evo B2HMG (v6.92.6600) | |
| MSI Prestige 16 AI C3MTG (v8.20.8100) | |
| Dell XPS 16 Core Ultra X7 358H (v8.20.8100) | |
| Média Intel Core Ultra X7 358H (5127 - 67510, n=8) | |
| AIDA64 / CPU ZLib | |
| Lenovo ThinkBook 16 G7+ AMD (v6.92.6600) | |
| Asus ZenBook S16 UM5606GA (v6.92.6600) | |
| Média Intel Core Ultra X7 358H (932 - 1179, n=8) | |
| MSI Prestige 16 AI Evo B2HMG (v6.92.6600) | |
| MSI Prestige 16 AI C3MTG (v8.20.8100) | |
| Dell XPS 16 Core Ultra X7 358H (v8.20.8100) | |
| HP Envy x360 2-in-1 16-ad0097nr (v6.92.6600) | |
| AIDA64 / FP64 Ray-Trace | |
| Lenovo ThinkBook 16 G7+ AMD (v6.92.6600) | |
| Asus ZenBook S16 UM5606GA (v6.92.6600) | |
| HP Envy x360 2-in-1 16-ad0097nr (v6.92.6600) | |
| MSI Prestige 16 AI Evo B2HMG (v6.92.6600) | |
| MSI Prestige 16 AI C3MTG (v8.20.8100) | |
| Dell XPS 16 Core Ultra X7 358H (v8.20.8100) | |
| Média Intel Core Ultra X7 358H (6506 - 9447, n=8) | |
| AIDA64 / CPU PhotoWorxx | |
| Dell XPS 16 Core Ultra X7 358H (v8.20.8100) | |
| MSI Prestige 16 AI C3MTG (v8.20.8100) | |
| Média Intel Core Ultra X7 358H (30538 - 88154, n=8) | |
| MSI Prestige 16 AI Evo B2HMG (v6.92.6600) | |
| Asus ZenBook S16 UM5606GA (v6.92.6600) | |
| Lenovo ThinkBook 16 G7+ AMD (v6.92.6600) | |
| HP Envy x360 2-in-1 16-ad0097nr (v6.92.6600) | |
| AIDA64 / CPU CheckMate | |
| Média Intel Core Ultra X7 358H (4187 - 4475, n=7) | |
| Dell XPS 16 Core Ultra X7 358H (v8.20.8100) | |
| MSI Prestige 16 AI C3MTG (v8.20.8100) | |
Desempenho do sistema
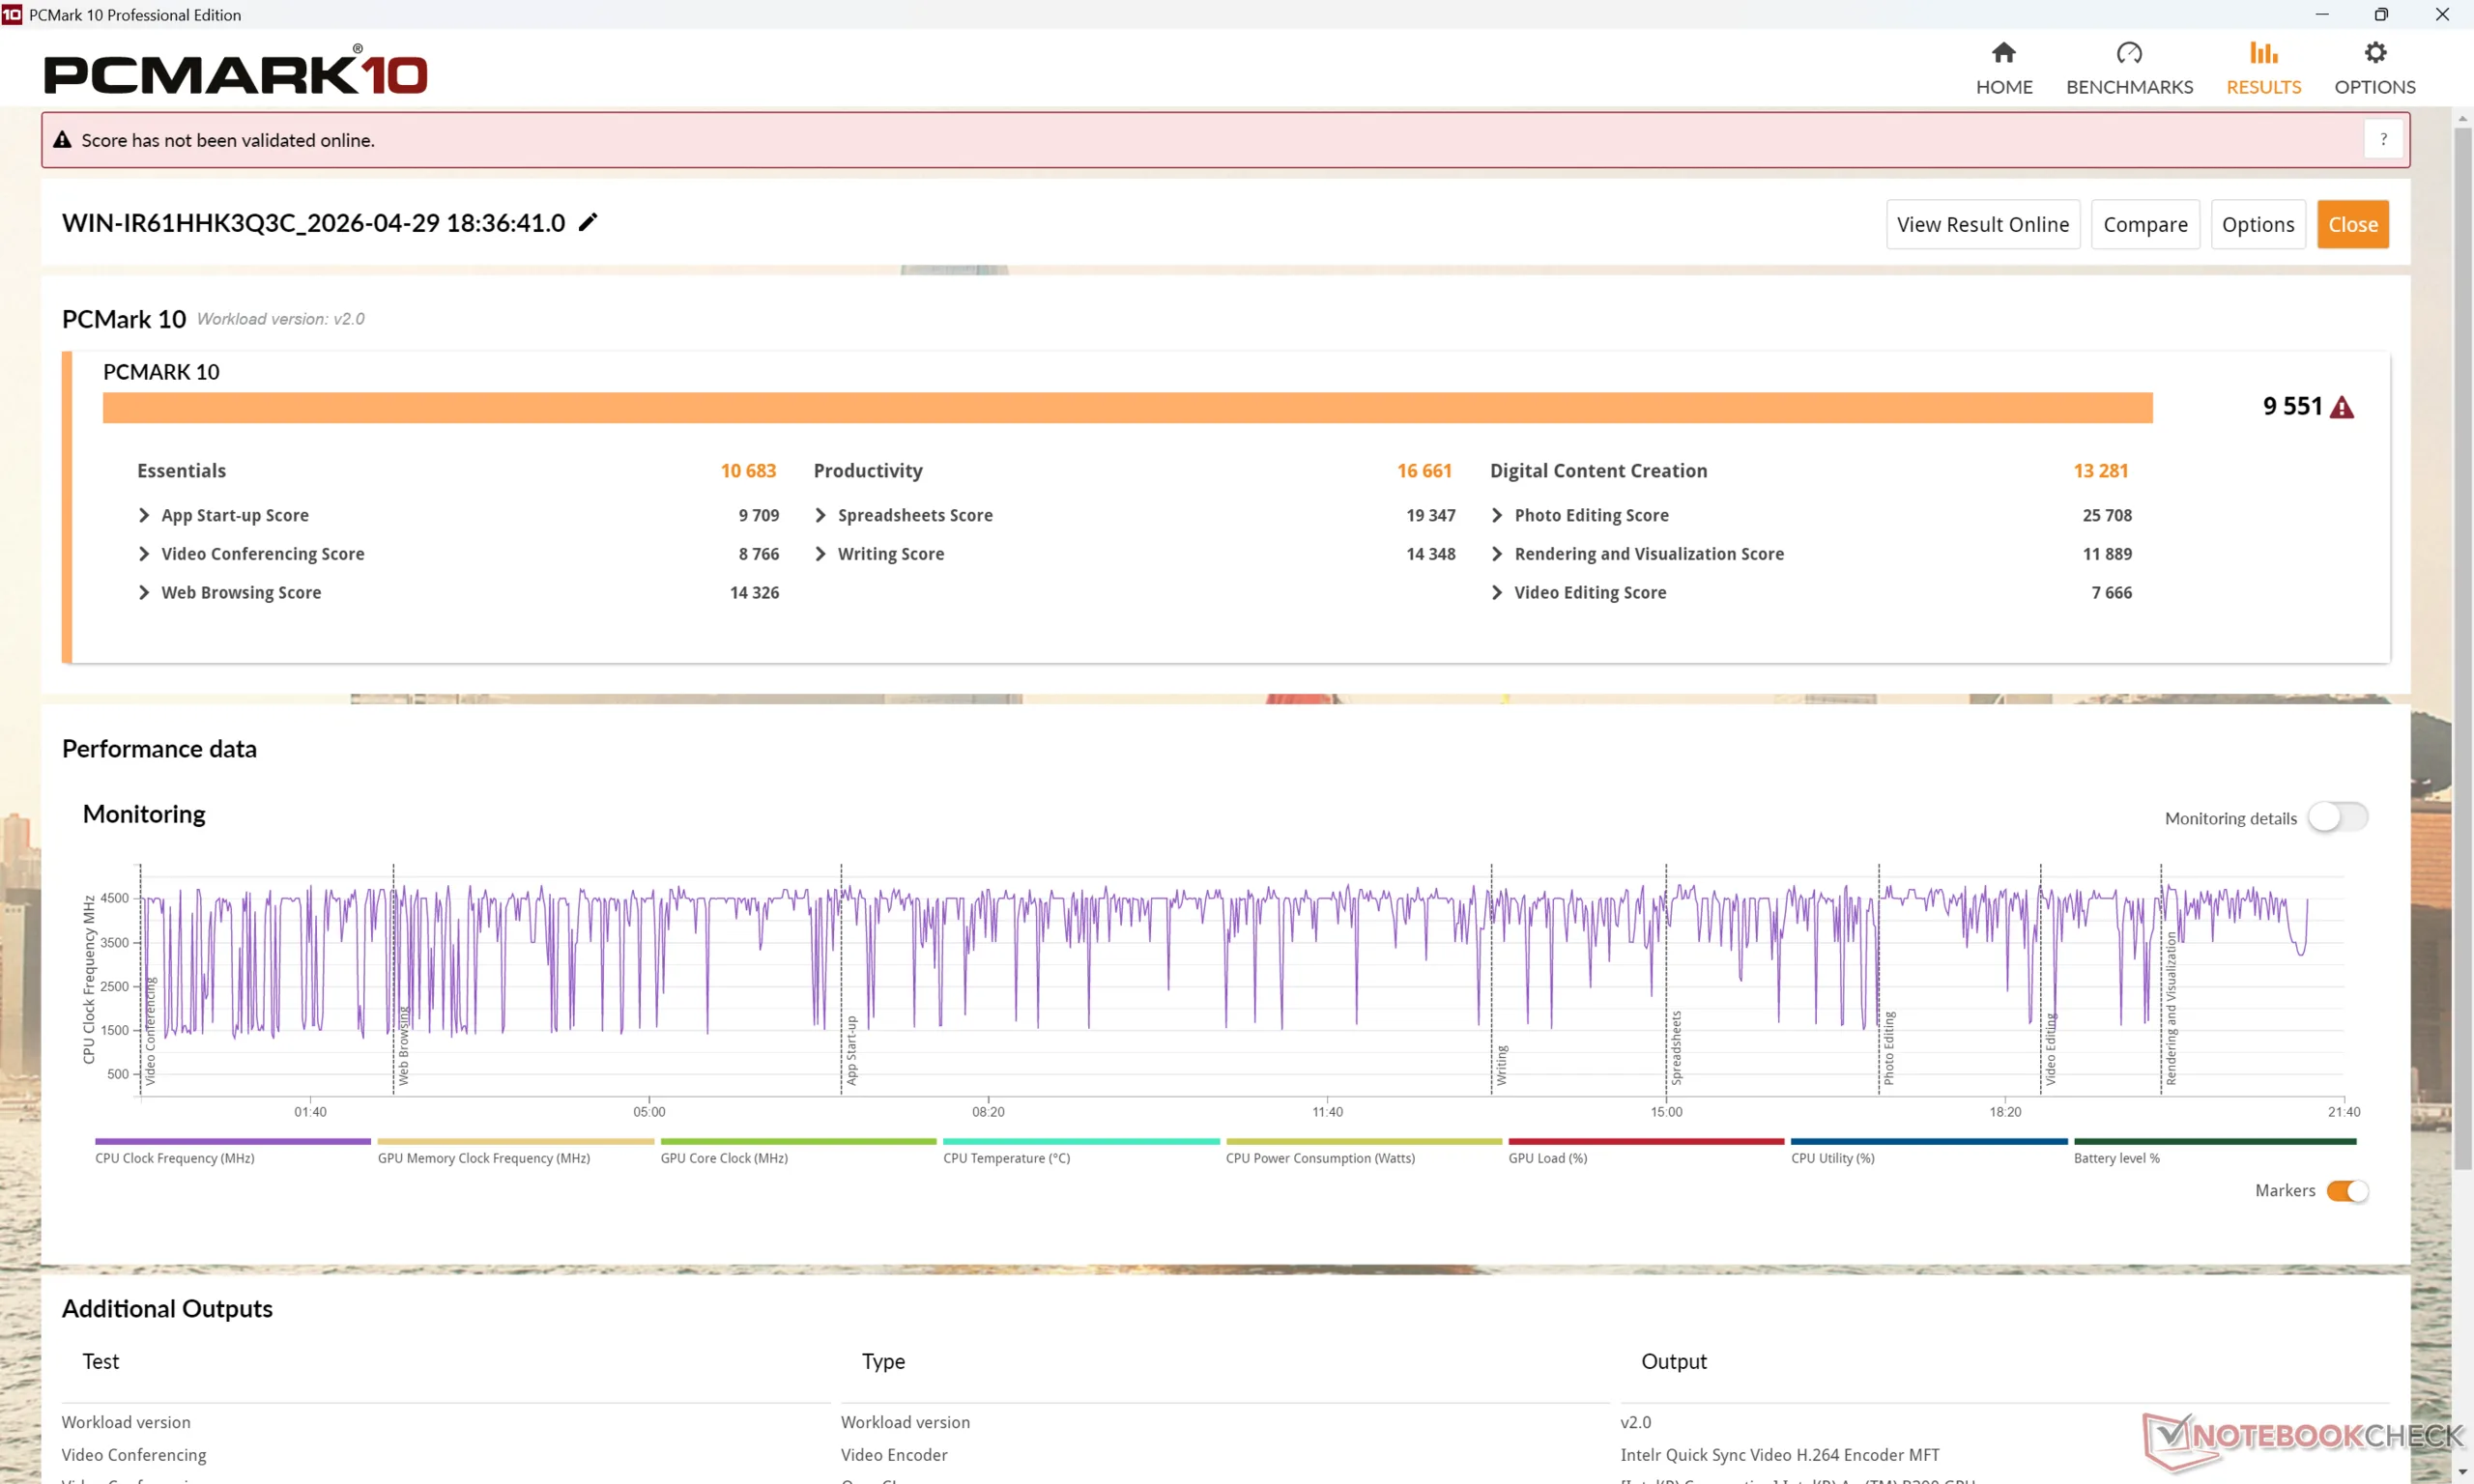
PCMark 10: Score | Essentials | Productivity | Digital Content Creation
CrossMark: Overall | Productivity | Creativity | Responsiveness
WebXPRT 3: Overall
WebXPRT 4: Overall
Mozilla Kraken 1.1: Total
Geekbench AI: Quantized GPU 1.7 | Half Precision GPU 1.7 | Single Precision GPU 1.7
| Performance rating | |
| Dell XPS 16 Core Ultra X7 358H | |
| MSI Prestige 16 AI C3MTG | |
| Média Intel Core Ultra X7 358H, Intel Arc B390 12 Xe3 Panther Lake iGPU | |
| MSI Prestige 16 AI Evo B2HMG -3! | |
| Asus ZenBook S16 UM5606GA -3! | |
| Lenovo ThinkBook 16 G7+ AMD -3! | |
| HP Envy x360 2-in-1 16-ad0097nr -3! | |
| PCMark 10 / Score | |
| Dell XPS 16 Core Ultra X7 358H | |
| MSI Prestige 16 AI C3MTG | |
| Média Intel Core Ultra X7 358H, Intel Arc B390 12 Xe3 Panther Lake iGPU (8834 - 9880, n=8) | |
| Asus ZenBook S16 UM5606GA | |
| MSI Prestige 16 AI Evo B2HMG | |
| Lenovo ThinkBook 16 G7+ AMD | |
| HP Envy x360 2-in-1 16-ad0097nr | |
| PCMark 10 / Essentials | |
| MSI Prestige 16 AI Evo B2HMG | |
| Dell XPS 16 Core Ultra X7 358H | |
| Média Intel Core Ultra X7 358H, Intel Arc B390 12 Xe3 Panther Lake iGPU (10282 - 11263, n=7) | |
| MSI Prestige 16 AI C3MTG | |
| Lenovo ThinkBook 16 G7+ AMD | |
| HP Envy x360 2-in-1 16-ad0097nr | |
| Asus ZenBook S16 UM5606GA | |
| PCMark 10 / Productivity | |
| MSI Prestige 16 AI C3MTG | |
| Dell XPS 16 Core Ultra X7 358H | |
| Asus ZenBook S16 UM5606GA | |
| Média Intel Core Ultra X7 358H, Intel Arc B390 12 Xe3 Panther Lake iGPU (13908 - 16780, n=7) | |
| Lenovo ThinkBook 16 G7+ AMD | |
| HP Envy x360 2-in-1 16-ad0097nr | |
| MSI Prestige 16 AI Evo B2HMG | |
| PCMark 10 / Digital Content Creation | |
| Dell XPS 16 Core Ultra X7 358H | |
| Média Intel Core Ultra X7 358H, Intel Arc B390 12 Xe3 Panther Lake iGPU (13082 - 13893, n=7) | |
| MSI Prestige 16 AI C3MTG | |
| MSI Prestige 16 AI Evo B2HMG | |
| Lenovo ThinkBook 16 G7+ AMD | |
| Asus ZenBook S16 UM5606GA | |
| HP Envy x360 2-in-1 16-ad0097nr | |
| CrossMark / Overall | |
| MSI Prestige 16 AI Evo B2HMG | |
| Dell XPS 16 Core Ultra X7 358H | |
| MSI Prestige 16 AI C3MTG | |
| Média Intel Core Ultra X7 358H, Intel Arc B390 12 Xe3 Panther Lake iGPU (1884 - 2119, n=8) | |
| Lenovo ThinkBook 16 G7+ AMD | |
| Asus ZenBook S16 UM5606GA | |
| HP Envy x360 2-in-1 16-ad0097nr | |
| CrossMark / Productivity | |
| MSI Prestige 16 AI Evo B2HMG | |
| Dell XPS 16 Core Ultra X7 358H | |
| MSI Prestige 16 AI C3MTG | |
| Média Intel Core Ultra X7 358H, Intel Arc B390 12 Xe3 Panther Lake iGPU (1678 - 1928, n=8) | |
| Asus ZenBook S16 UM5606GA | |
| HP Envy x360 2-in-1 16-ad0097nr | |
| Lenovo ThinkBook 16 G7+ AMD | |
| CrossMark / Creativity | |
| Dell XPS 16 Core Ultra X7 358H | |
| MSI Prestige 16 AI C3MTG | |
| Média Intel Core Ultra X7 358H, Intel Arc B390 12 Xe3 Panther Lake iGPU (2241 - 2529, n=8) | |
| MSI Prestige 16 AI Evo B2HMG | |
| Lenovo ThinkBook 16 G7+ AMD | |
| Asus ZenBook S16 UM5606GA | |
| HP Envy x360 2-in-1 16-ad0097nr | |
| CrossMark / Responsiveness | |
| MSI Prestige 16 AI Evo B2HMG | |
| Dell XPS 16 Core Ultra X7 358H | |
| Média Intel Core Ultra X7 358H, Intel Arc B390 12 Xe3 Panther Lake iGPU (1560 - 1837, n=8) | |
| MSI Prestige 16 AI C3MTG | |
| HP Envy x360 2-in-1 16-ad0097nr | |
| Lenovo ThinkBook 16 G7+ AMD | |
| Asus ZenBook S16 UM5606GA | |
| WebXPRT 3 / Overall | |
| MSI Prestige 16 AI Evo B2HMG | |
| MSI Prestige 16 AI C3MTG | |
| Média Intel Core Ultra X7 358H, Intel Arc B390 12 Xe3 Panther Lake iGPU (293 - 338, n=8) | |
| Lenovo ThinkBook 16 G7+ AMD | |
| Dell XPS 16 Core Ultra X7 358H | |
| HP Envy x360 2-in-1 16-ad0097nr | |
| Asus ZenBook S16 UM5606GA | |
| WebXPRT 4 / Overall | |
| MSI Prestige 16 AI Evo B2HMG | |
| MSI Prestige 16 AI C3MTG | |
| Dell XPS 16 Core Ultra X7 358H | |
| Média Intel Core Ultra X7 358H, Intel Arc B390 12 Xe3 Panther Lake iGPU (278 - 305, n=7) | |
| Lenovo ThinkBook 16 G7+ AMD | |
| HP Envy x360 2-in-1 16-ad0097nr | |
| Asus ZenBook S16 UM5606GA | |
| Mozilla Kraken 1.1 / Total | |
| HP Envy x360 2-in-1 16-ad0097nr | |
| Asus ZenBook S16 UM5606GA | |
| MSI Prestige 16 AI C3MTG | |
| Média Intel Core Ultra X7 358H, Intel Arc B390 12 Xe3 Panther Lake iGPU (445 - 460, n=8) | |
| Dell XPS 16 Core Ultra X7 358H | |
| Lenovo ThinkBook 16 G7+ AMD | |
| MSI Prestige 16 AI Evo B2HMG | |
| Geekbench AI / Quantized GPU 1.7 | |
| Dell XPS 16 Core Ultra X7 358H | |
| MSI Prestige 16 AI C3MTG | |
| Média Intel Core Ultra X7 358H, Intel Arc B390 12 Xe3 Panther Lake iGPU (6908 - 8011, n=6) | |
| Geekbench AI / Half Precision GPU 1.7 | |
| MSI Prestige 16 AI C3MTG | |
| Dell XPS 16 Core Ultra X7 358H | |
| Média Intel Core Ultra X7 358H, Intel Arc B390 12 Xe3 Panther Lake iGPU (16188 - 21963, n=6) | |
| Geekbench AI / Single Precision GPU 1.7 | |
| MSI Prestige 16 AI C3MTG | |
| Dell XPS 16 Core Ultra X7 358H | |
| Média Intel Core Ultra X7 358H, Intel Arc B390 12 Xe3 Panther Lake iGPU (9783 - 12255, n=6) | |
* ... menor é melhor
| PCMark 10 Score | 9551 pontos | |
Ajuda | ||
| AIDA64 / Memory Copy | |
| Dell XPS 16 Core Ultra X7 358H | |
| MSI Prestige 16 AI C3MTG | |
| Média Intel Core Ultra X7 358H (102745 - 132135, n=7) | |
| MSI Prestige 16 AI Evo B2HMG | |
| Asus ZenBook S16 UM5606GA | |
| Lenovo ThinkBook 16 G7+ AMD | |
| HP Envy x360 2-in-1 16-ad0097nr | |
| AIDA64 / Memory Read | |
| Dell XPS 16 Core Ultra X7 358H | |
| Média Intel Core Ultra X7 358H (97755 - 118888, n=8) | |
| MSI Prestige 16 AI C3MTG | |
| Asus ZenBook S16 UM5606GA | |
| Lenovo ThinkBook 16 G7+ AMD | |
| MSI Prestige 16 AI Evo B2HMG | |
| HP Envy x360 2-in-1 16-ad0097nr | |
| AIDA64 / Memory Write | |
| Dell XPS 16 Core Ultra X7 358H | |
| Média Intel Core Ultra X7 358H (105984 - 134998, n=8) | |
| MSI Prestige 16 AI C3MTG | |
| Asus ZenBook S16 UM5606GA | |
| Lenovo ThinkBook 16 G7+ AMD | |
| HP Envy x360 2-in-1 16-ad0097nr | |
| MSI Prestige 16 AI Evo B2HMG | |
| AIDA64 / Memory Latency | |
| MSI Prestige 16 AI Evo B2HMG | |
| HP Envy x360 2-in-1 16-ad0097nr | |
| Lenovo ThinkBook 16 G7+ AMD | |
| Asus ZenBook S16 UM5606GA | |
| MSI Prestige 16 AI C3MTG | |
| Dell XPS 16 Core Ultra X7 358H | |
| Média Intel Core Ultra X7 358H (84.6 - 101.9, n=8) | |
* ... menor é melhor
Latência DPC
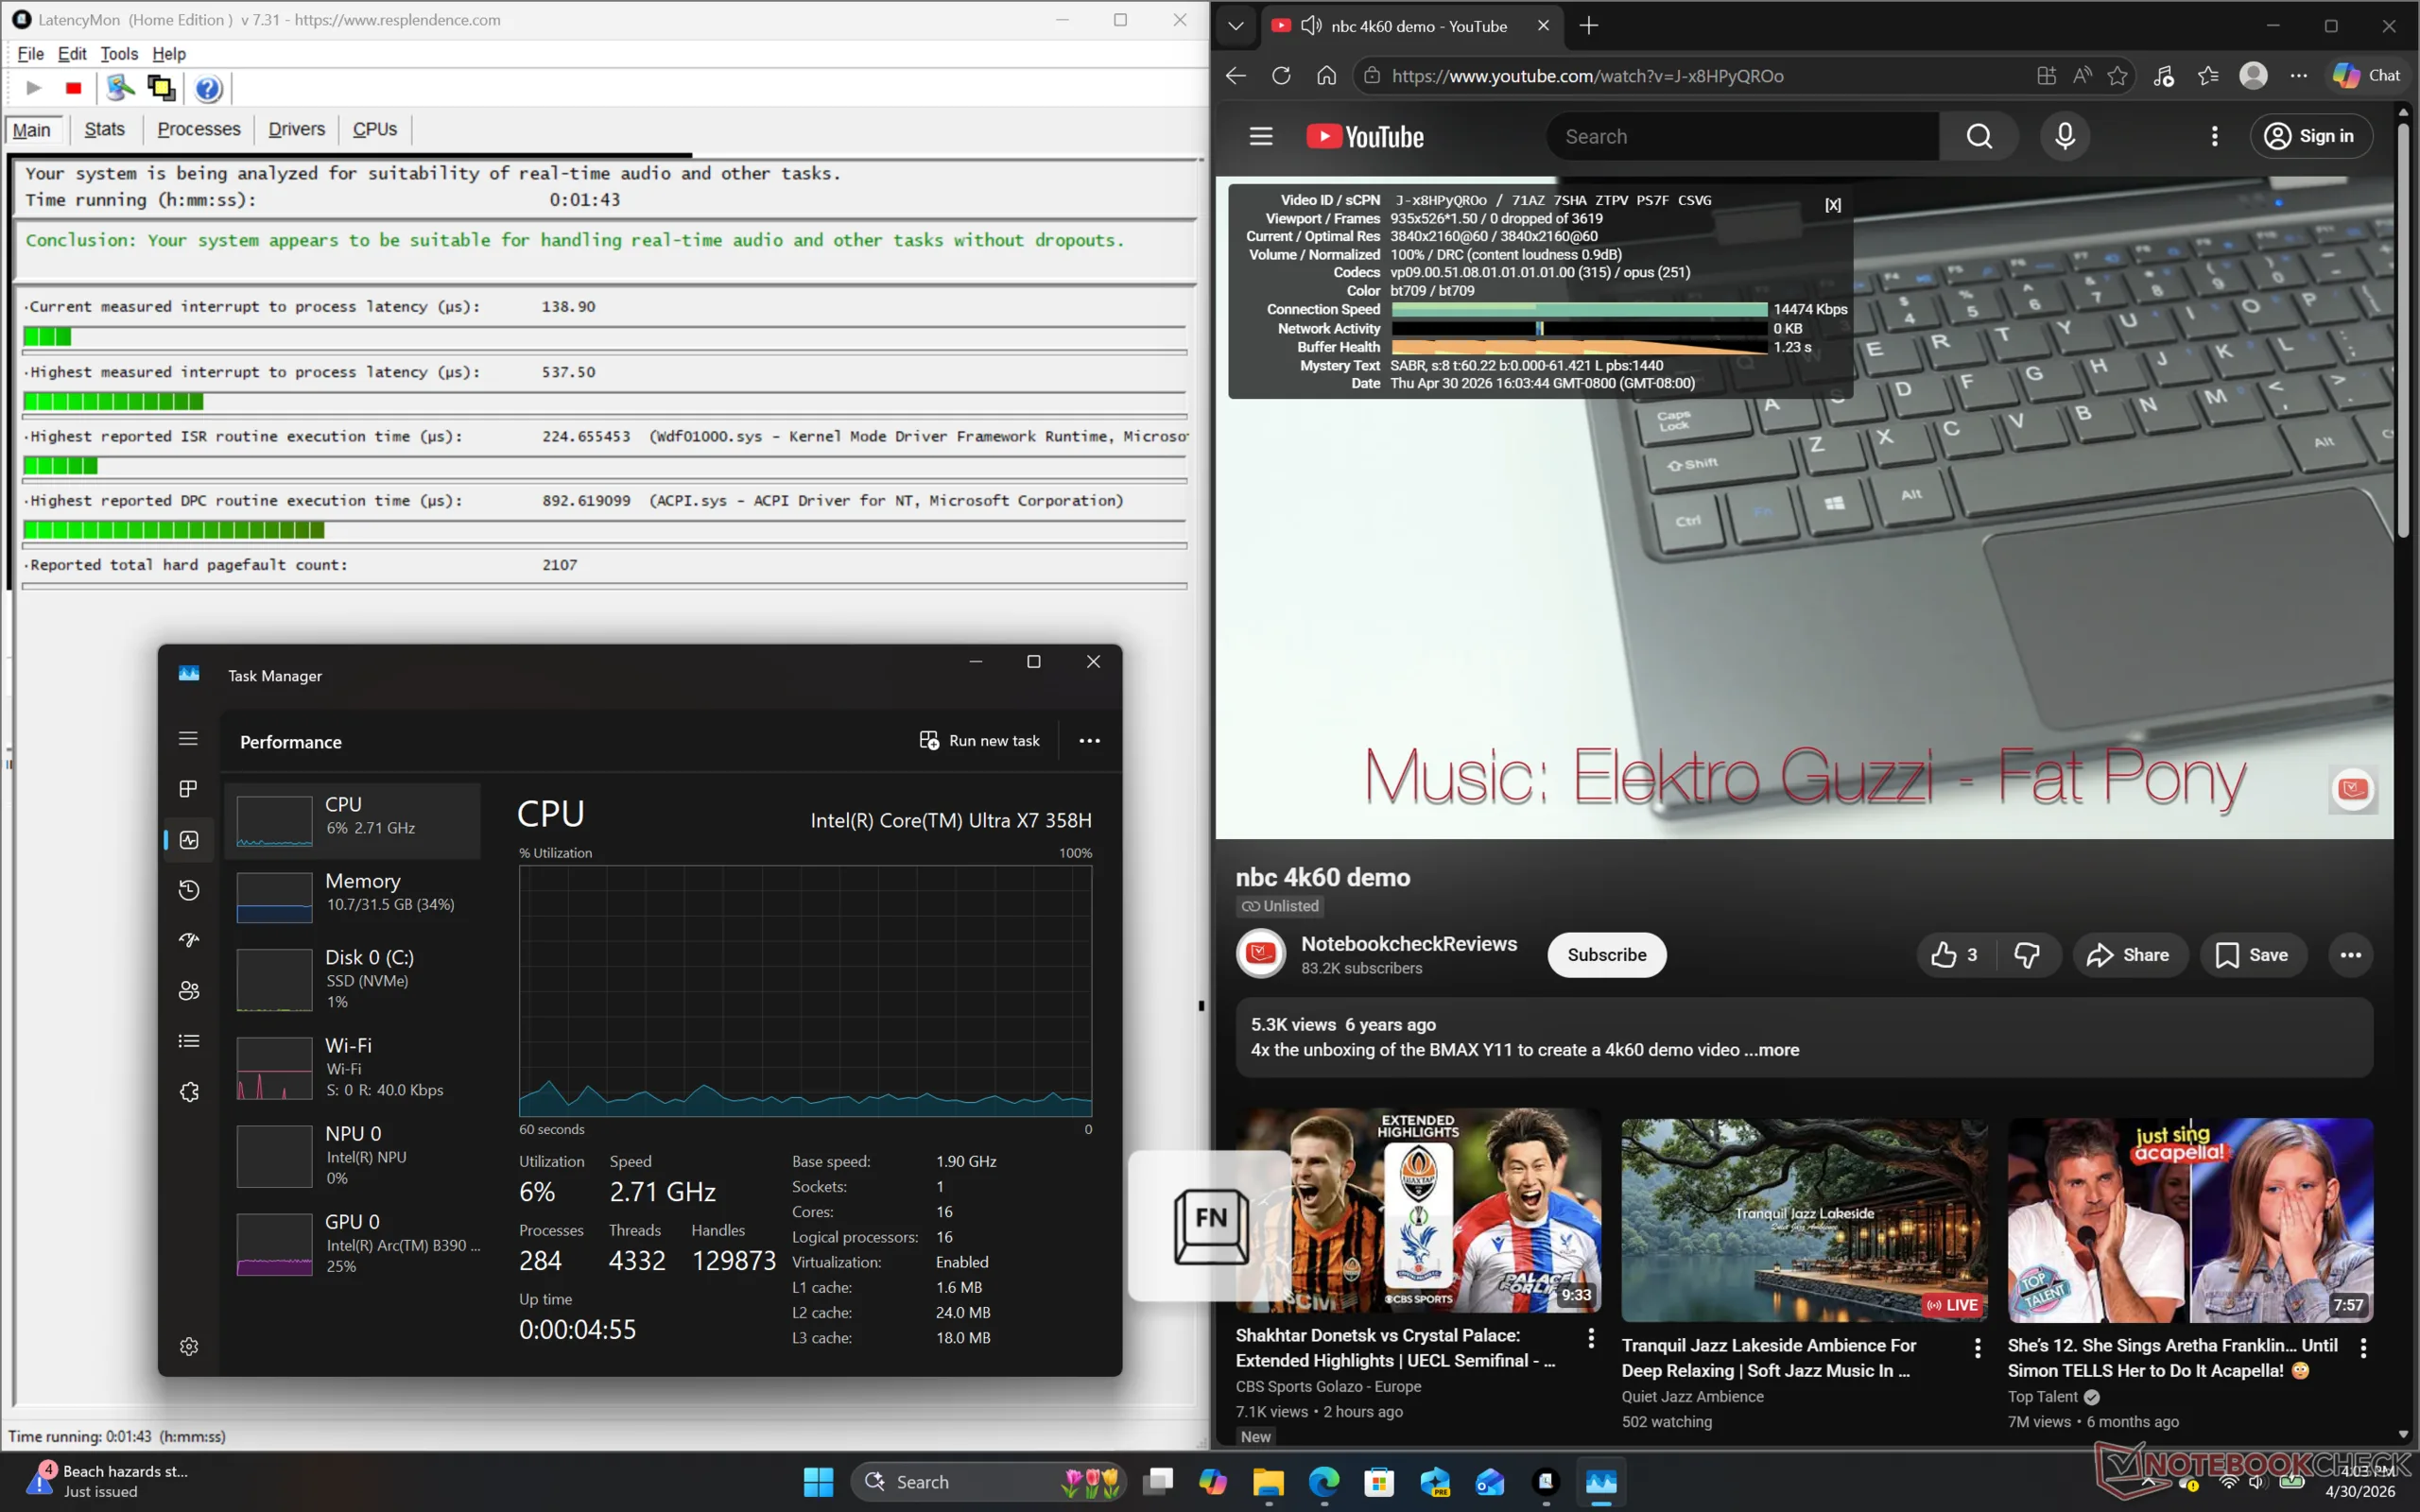
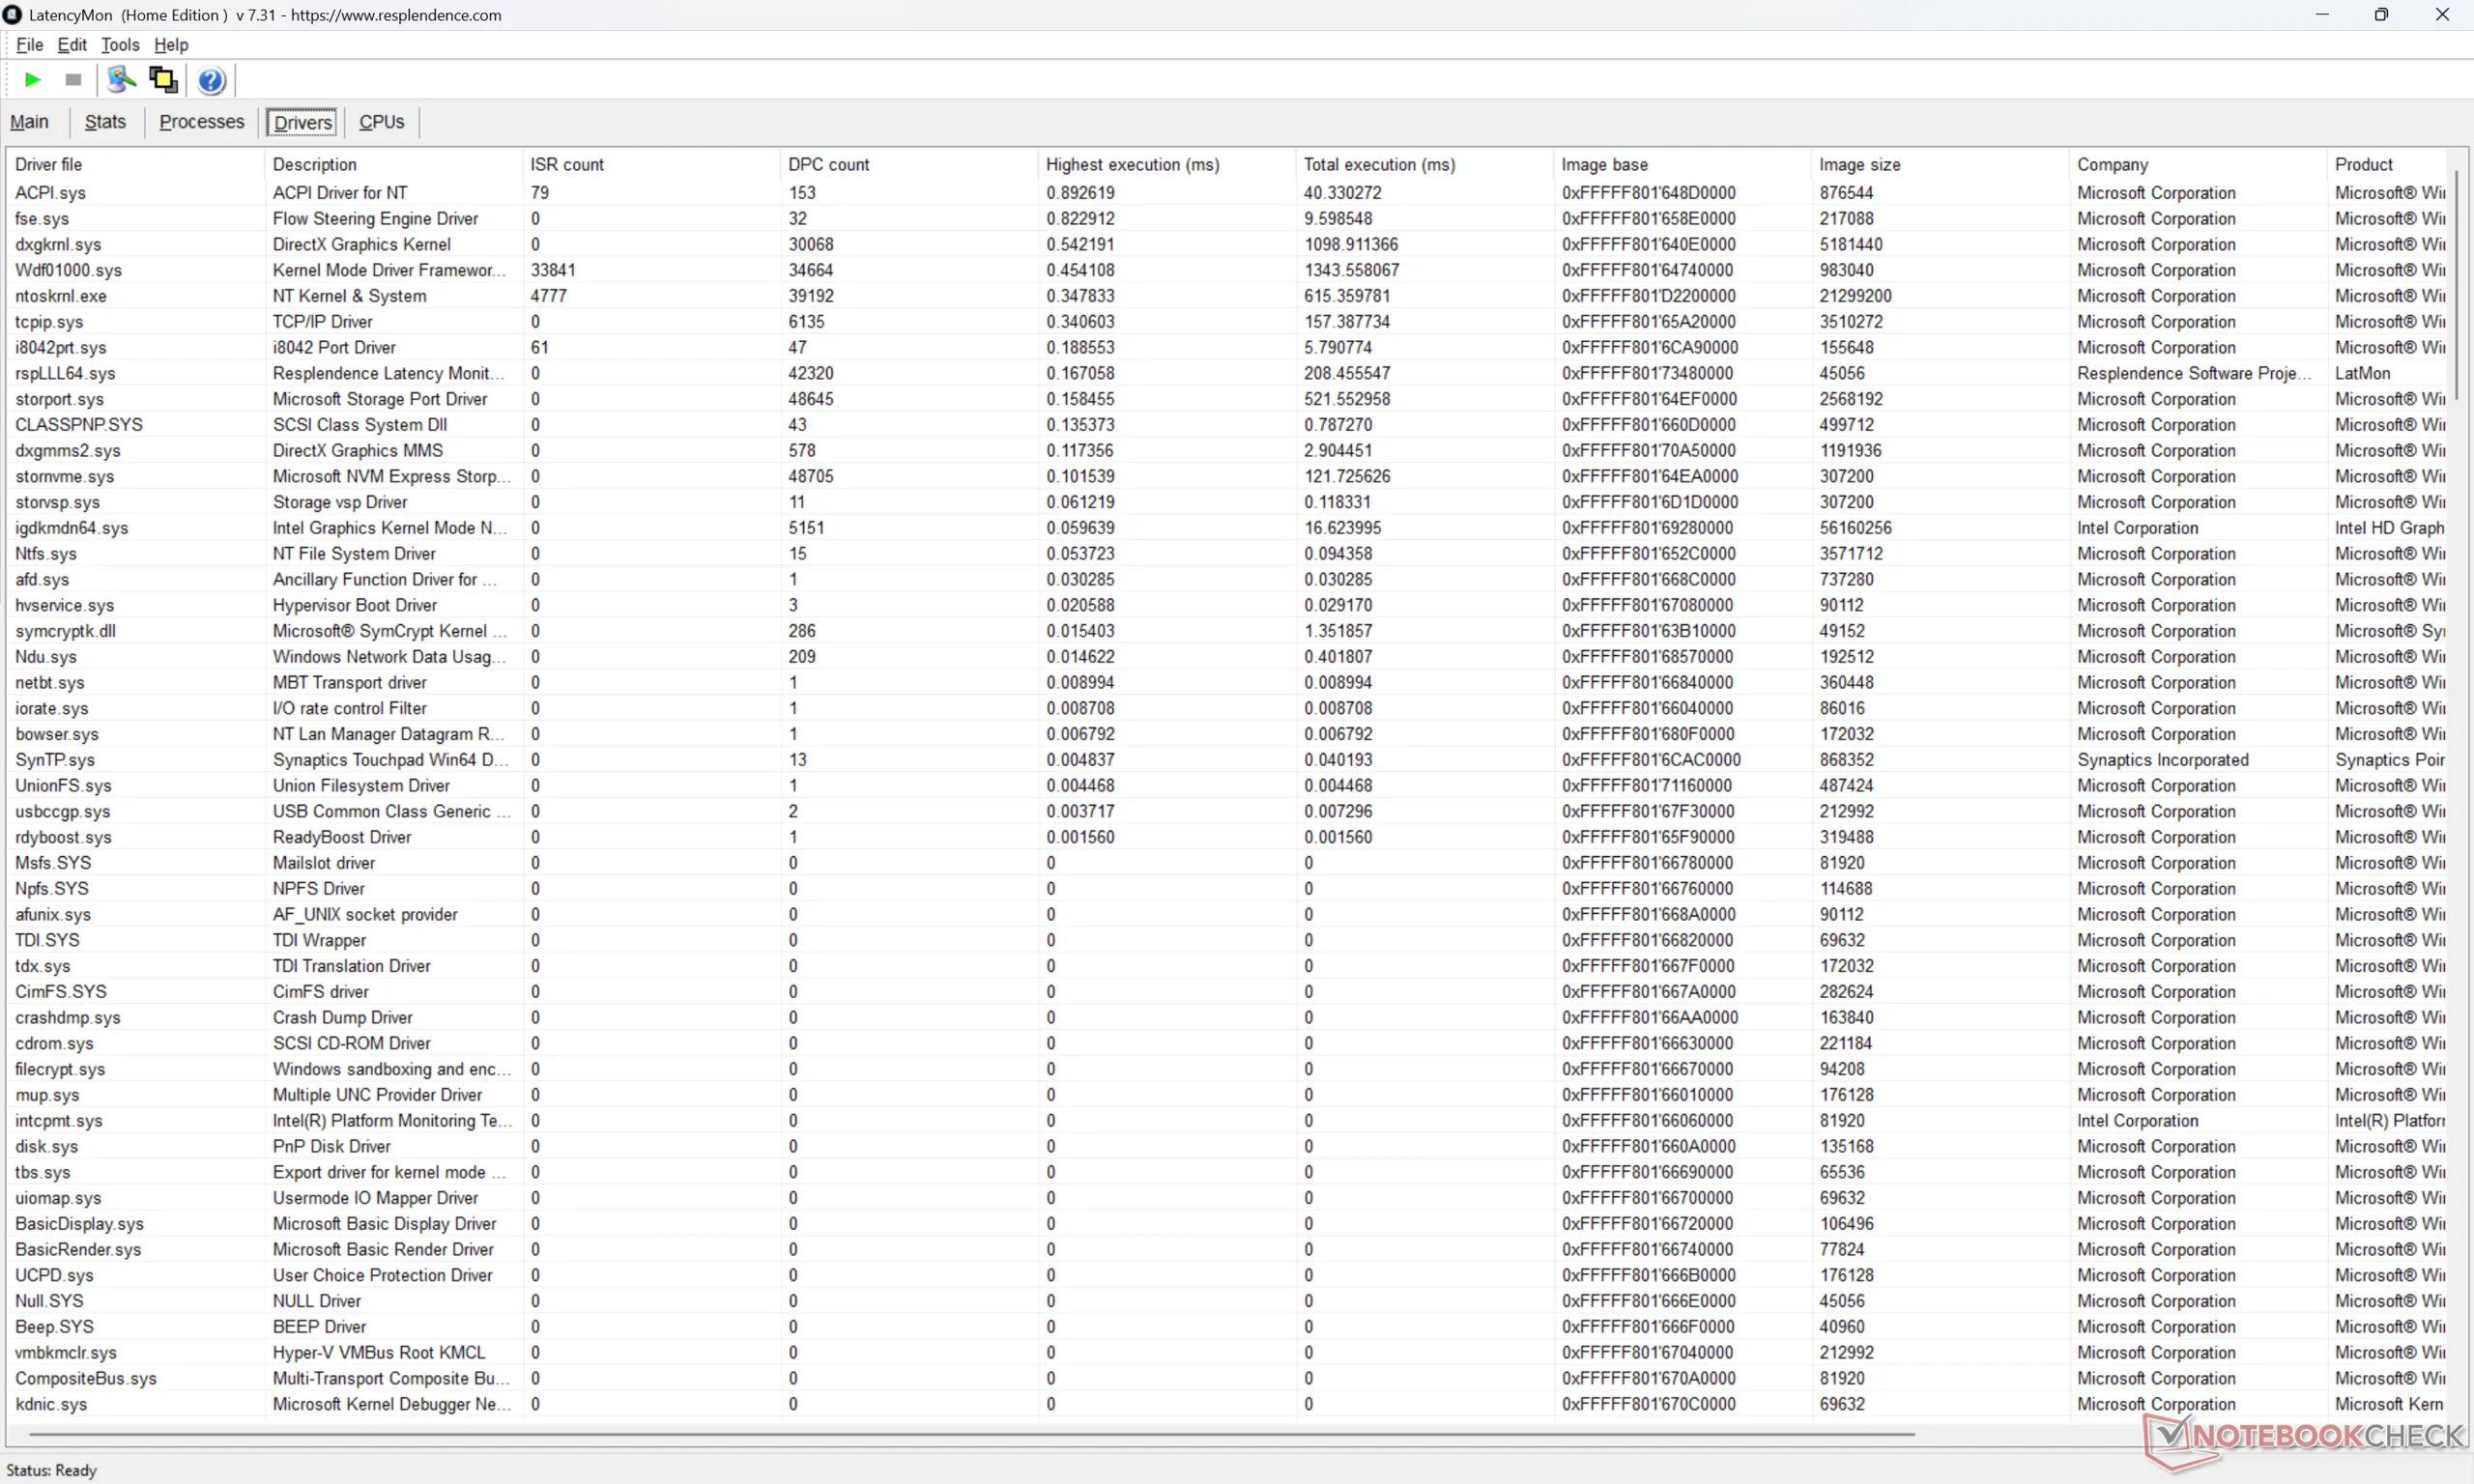
| DPC Latencies / LatencyMon - interrupt to process latency (max), Web, Youtube, Prime95 | |
| MSI Prestige 16 AI Evo B2HMG | |
| HP Envy x360 2-in-1 16-ad0097nr | |
| Lenovo ThinkBook 16 G7+ AMD | |
| Asus ZenBook S16 UM5606GA | |
| MSI Prestige 16 AI C3MTG | |
| Dell XPS 16 Core Ultra X7 358H | |
* ... menor é melhor
Dispositivos de armazenamento
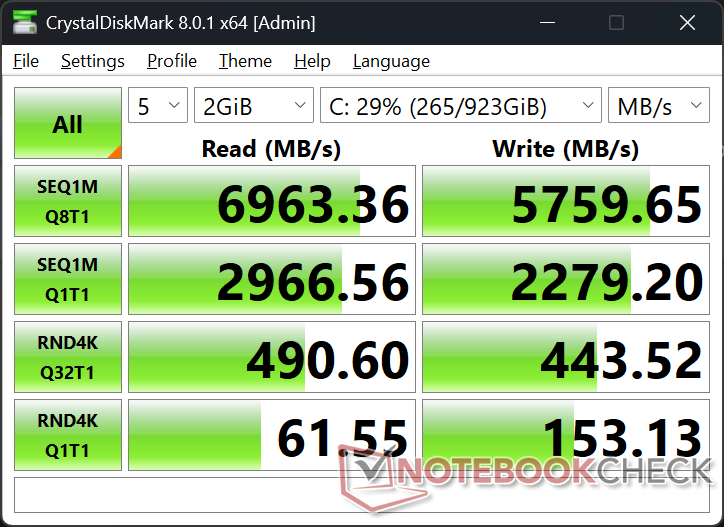
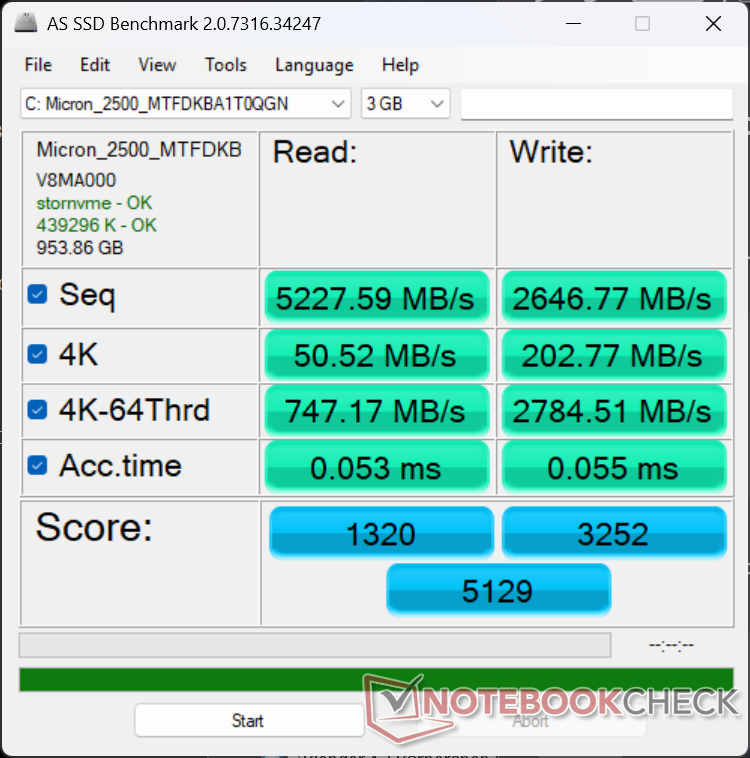
Nossa unidade de teste vem com o mesmo 1 TB Micron 2500 PCIe4 x4 NVMe de 1 TB que o modelo do ano passado para níveis de desempenho semelhantes e nenhum comportamento de limitação notável. Não há mais suporte para SSDs M.2 secundários, o que parece ser uma tendência nos notebooks de 16 polegadas mais recentes, como o XPS 16 ou o Asus Zenbook S16.

* ... menor é melhor
Limitação de disco: Loop de leitura do DiskSpd, profundidade da fila 8
Desempenho da GPU
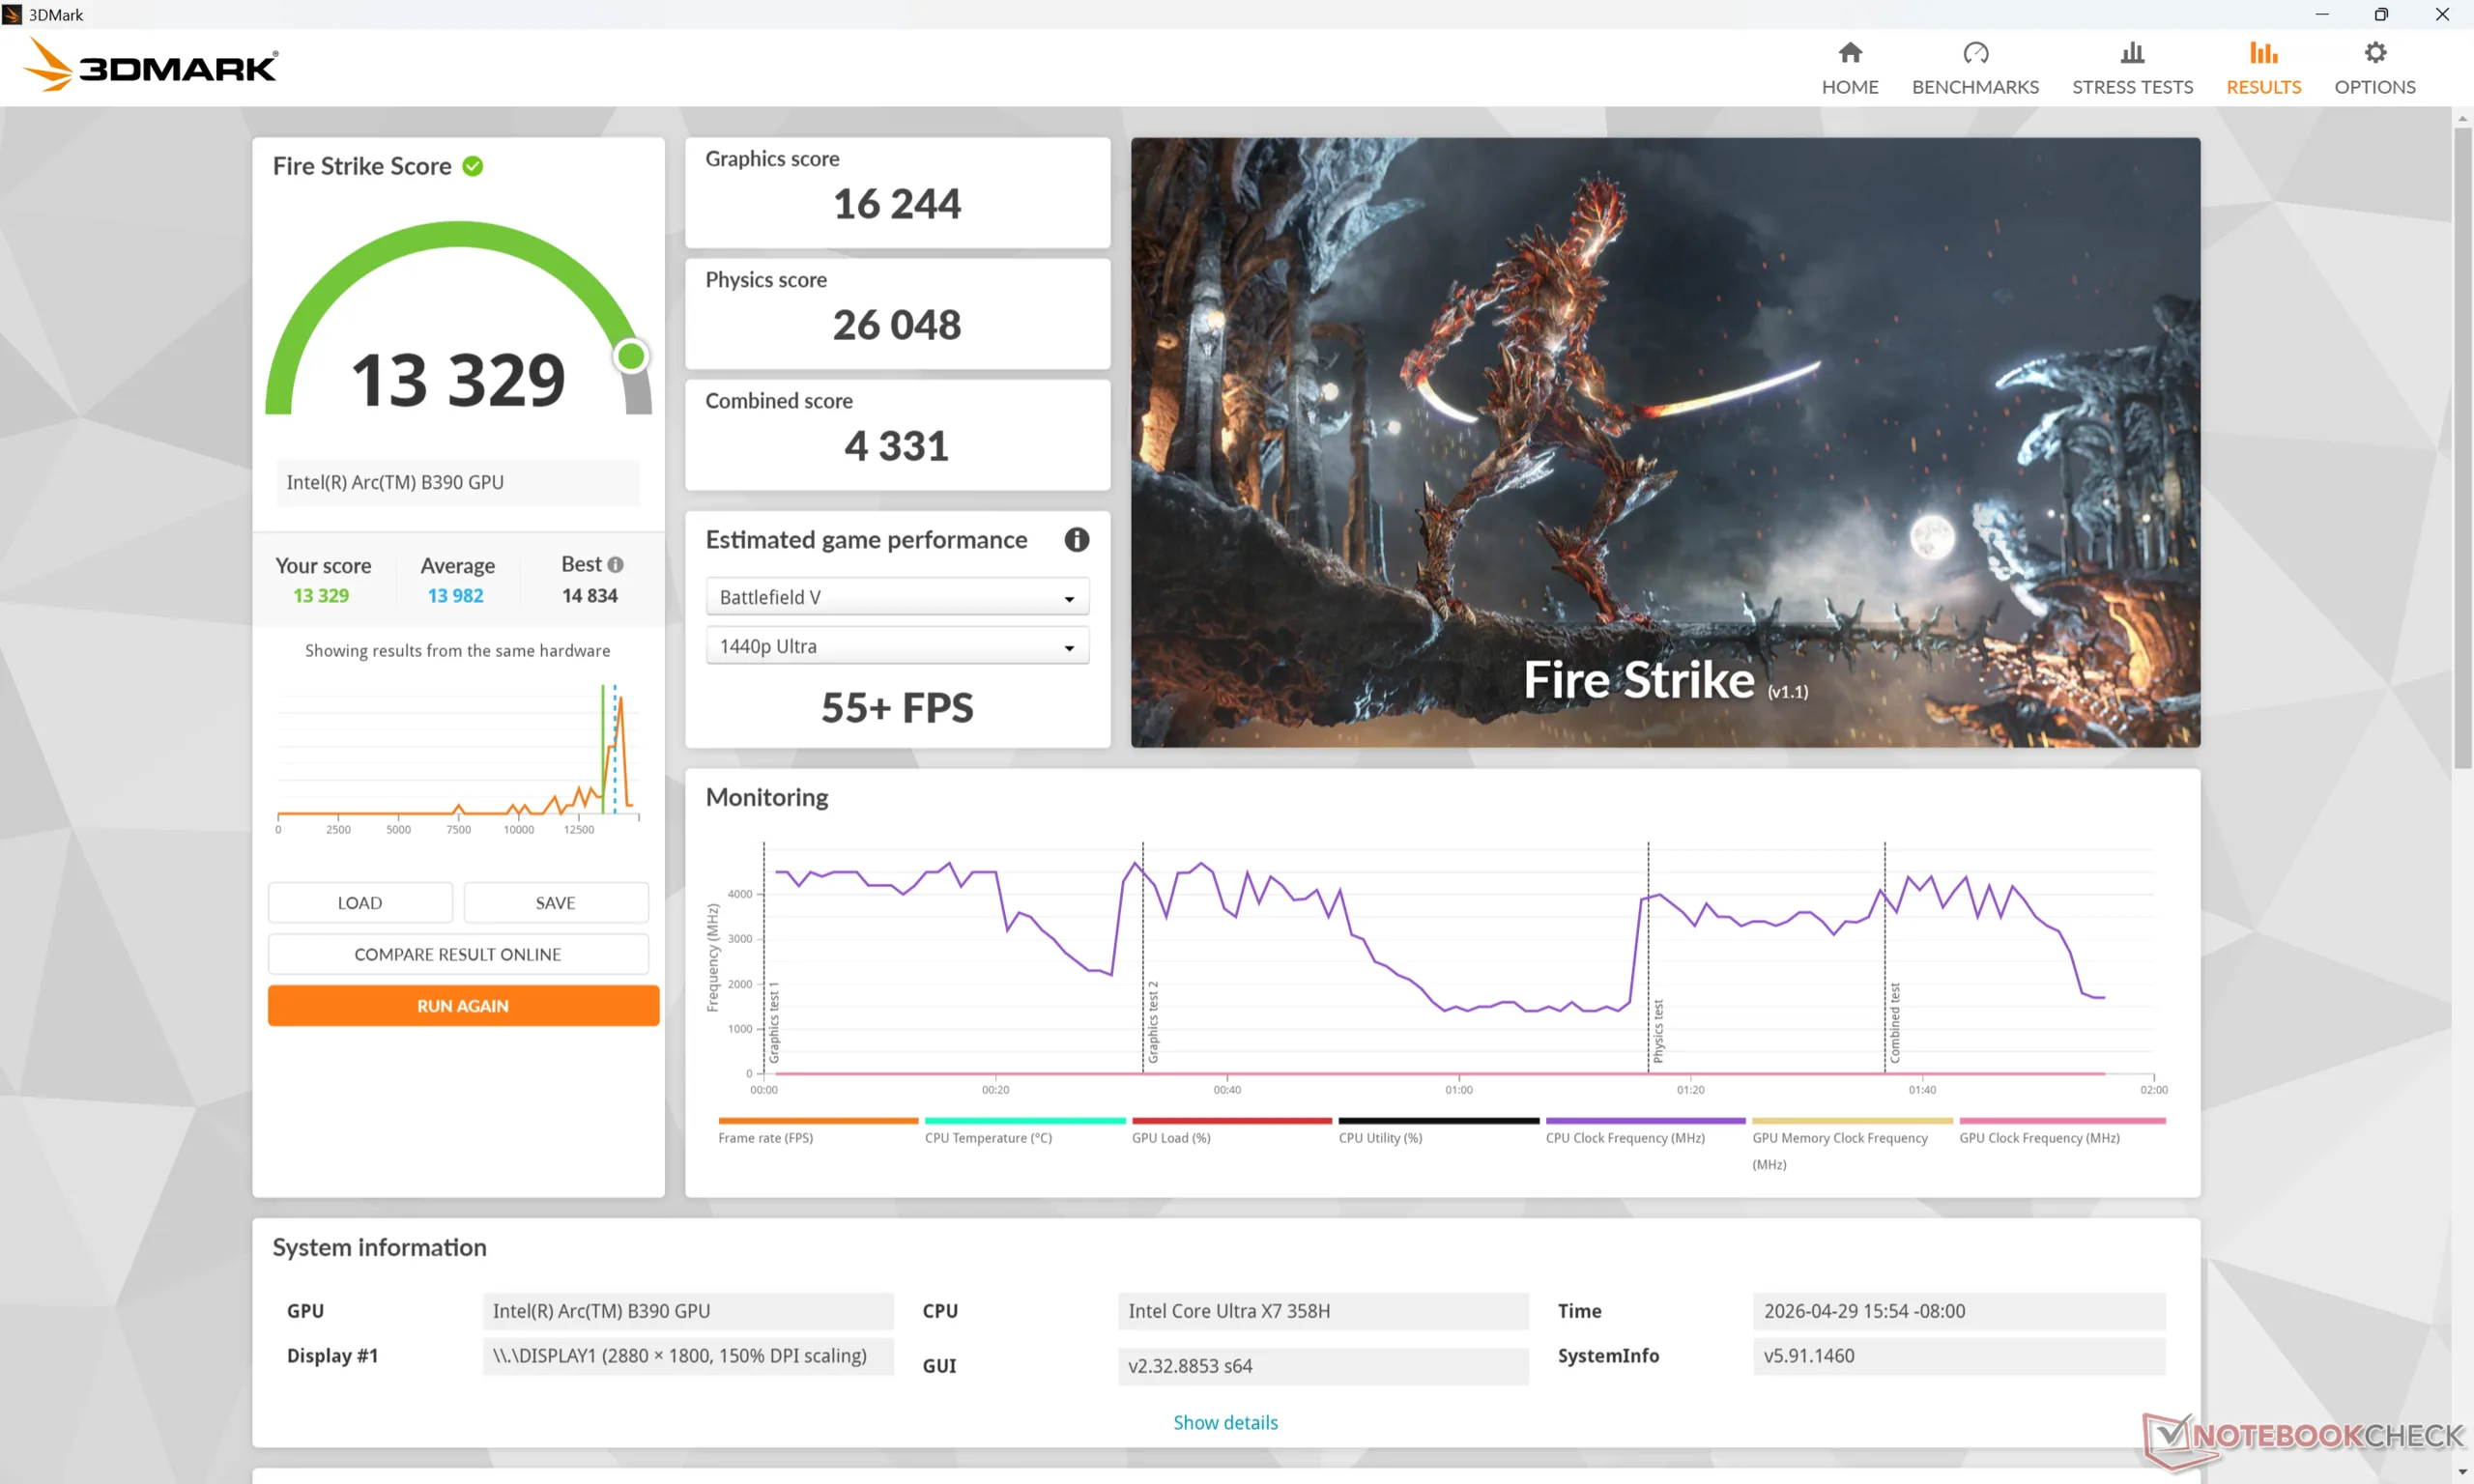
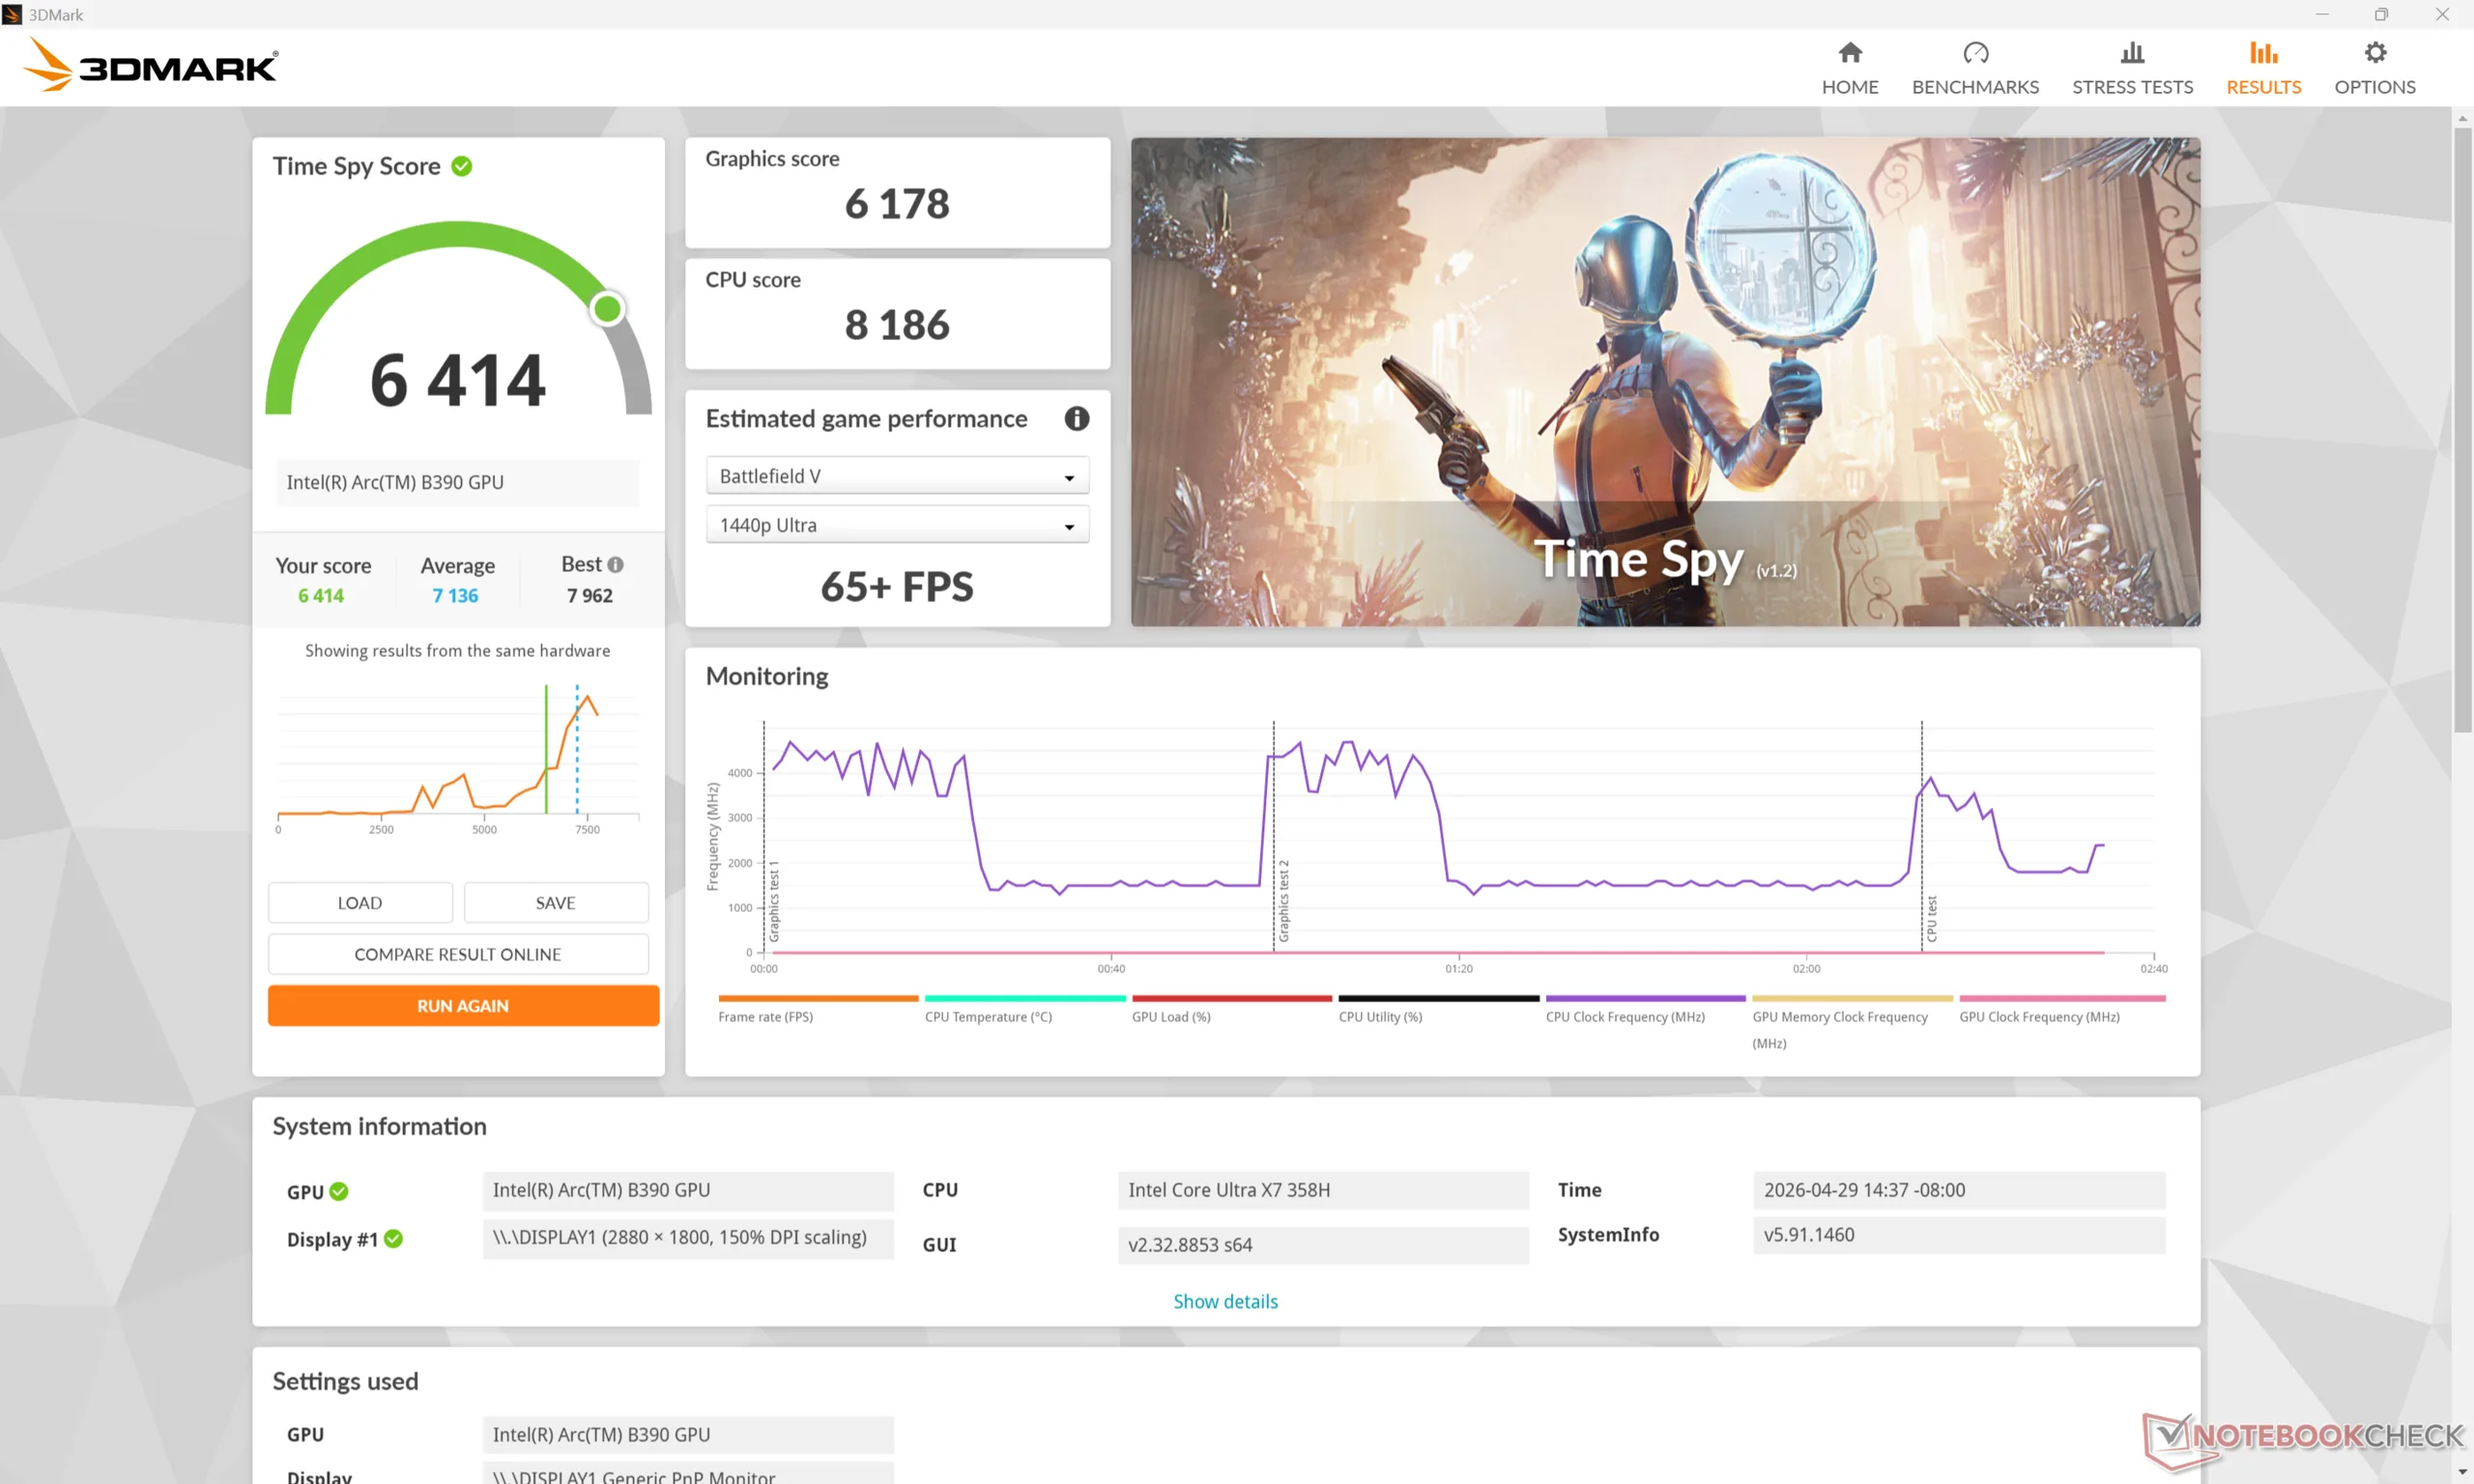
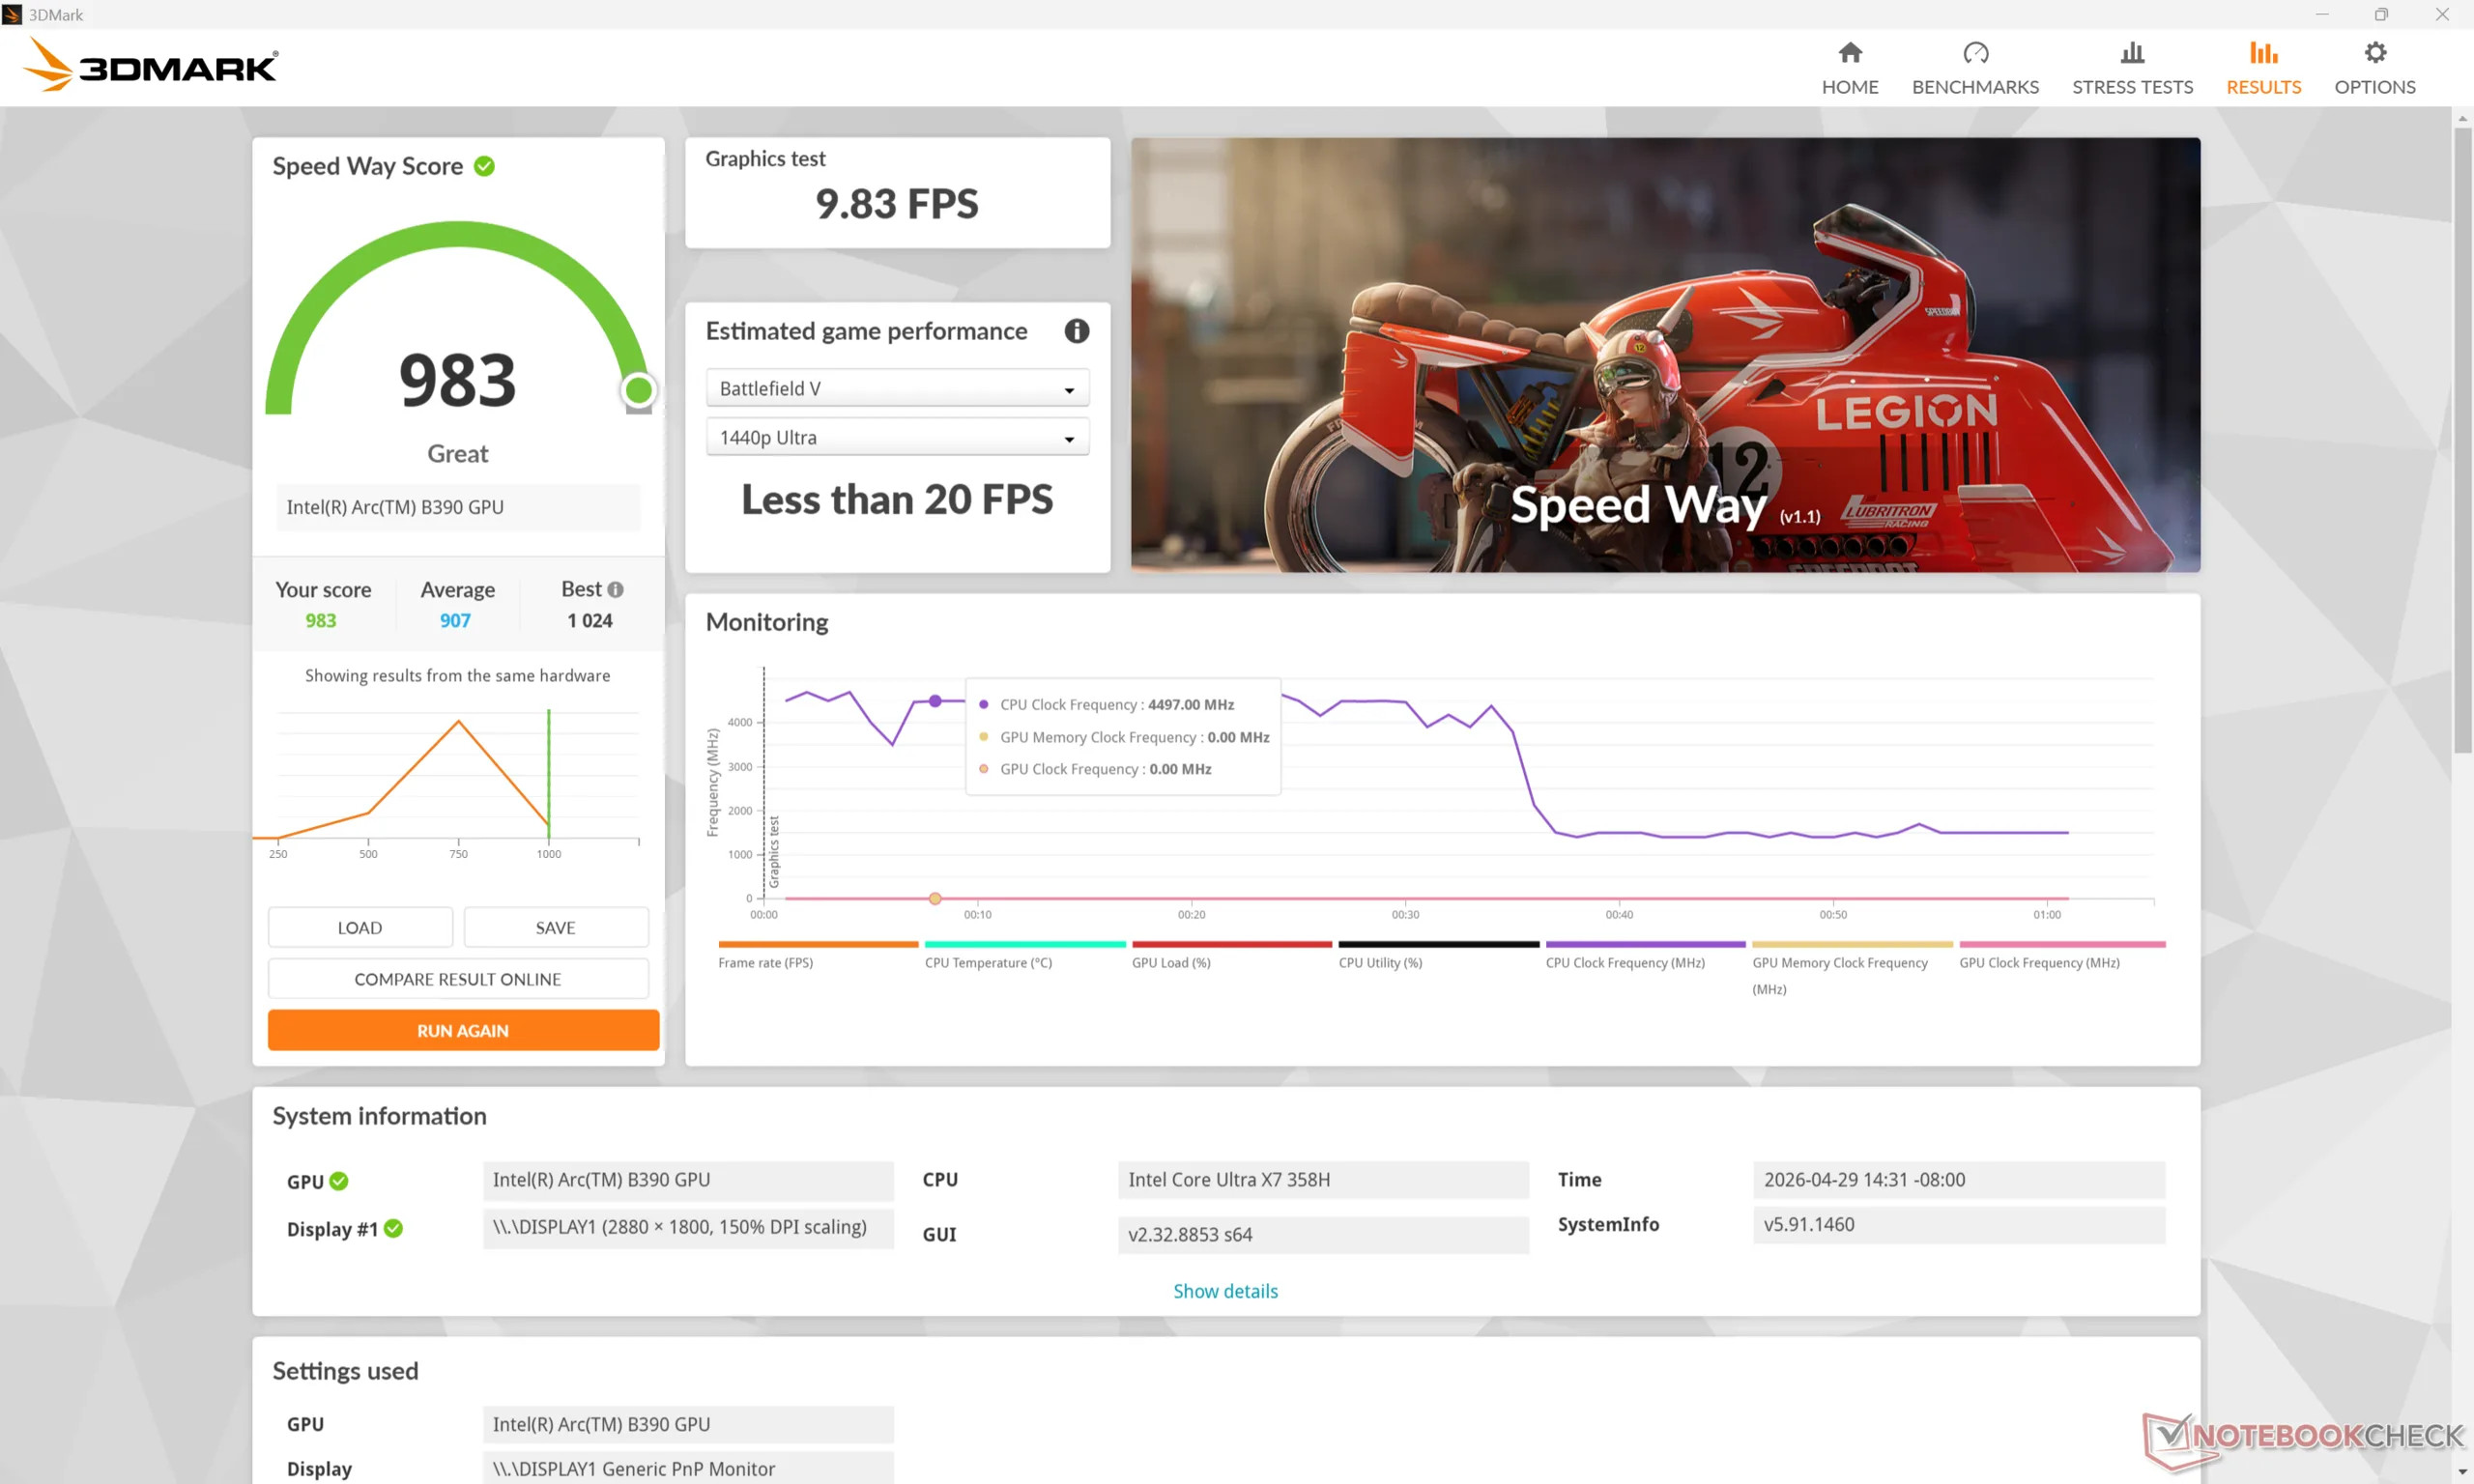
O desempenho gráfico está onde esperamos que esteja quando comparado a outros PCs com o mesmo desempenho Arc B390 Se não for ligeiramente mais lento em alguns pontos percentuais. O Arc B390 é significativamente mais rápido do que o Arc 140T do Prestige 16 do ano passado em até 50 a 80% e é um dos maiores motivos para fazer o upgrade para o Panther Lake.
A execução no modo Balanced em vez do modo Performance afetaria o desempenho de forma mais significativa do que o esperado, em até 25%, conforme mostra a tabela de resultados do site Fire Strike abaixo. Posteriormente, isso afetaria o ruído da ventoinha e o desempenho em jogos, como mostrarão as seções abaixo.
| Perfil de energia | Pontuação de gráficos | Pontuação de física | Pontuação combinada |
| Modo de desempenho | 16244 | 26048 | 4331 |
| Modo equilibrado | 15684 (-3%) | 19912 (-24%) | 4476 (-0%) |
| Energia da bateria | 16481 (-0%) | 20729 (-20%) | 4794 (-0%) |
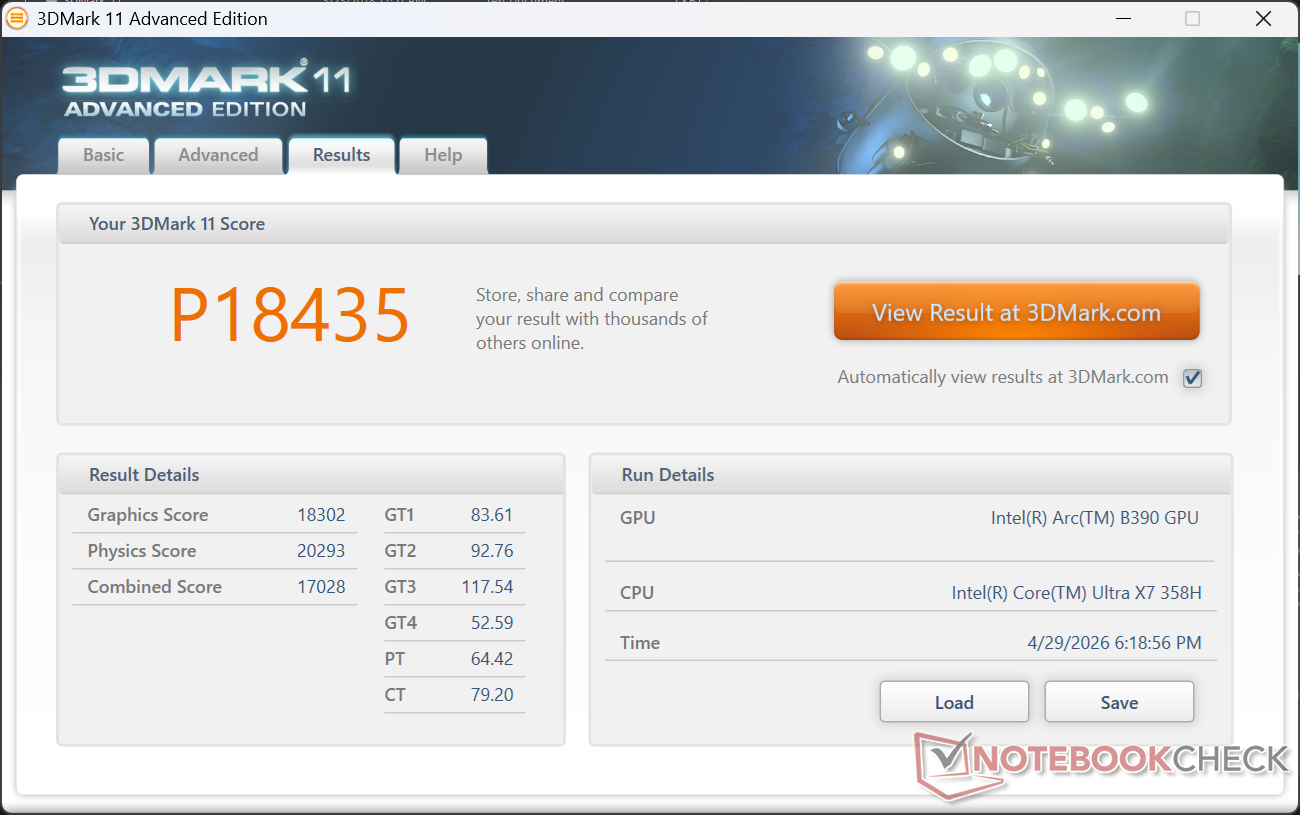
| 3DMark 11 Performance | 18435 pontos | |
| 3DMark Cloud Gate Standard Score | 35193 pontos | |
| 3DMark Fire Strike Score | 13329 pontos | |
| 3DMark Time Spy Score | 6414 pontos | |
Ajuda | ||
* ... menor é melhor
Desempenho em jogos
Embora não seja primordialmente uma máquina para jogos, os notebooks com a Arc B390 são totalmente capazes de executar até mesmo os títulos mais exigentes com configurações e taxas de quadros decentes de 1080p. O Cyberpunk 2077, por exemplo, tem uma média de 45 FPS em configurações Ultra de 1080p antes de aplicar qualquer upscaling XeSS.
O G-Sync não é compatível com a tela interna.
| Performance rating - Percent | |
| MSI Prestige 16 AI C3MTG | |
| Dell XPS 16 Core Ultra X7 358H | |
| Lenovo ThinkBook 16 G7+ AMD | |
| Asus ZenBook S16 UM5606GA | |
| MSI Prestige 16 AI Evo B2HMG | |
| HP Envy x360 2-in-1 16-ad0097nr -1! | |
| Cyberpunk 2077 - 1920x1080 Ultra Preset (FSR off) | |
| Dell XPS 16 Core Ultra X7 358H | |
| MSI Prestige 16 AI C3MTG | |
| MSI Prestige 16 AI Evo B2HMG | |
| Lenovo ThinkBook 16 G7+ AMD | |
| Asus ZenBook S16 UM5606GA | |
| HP Envy x360 2-in-1 16-ad0097nr | |
| Baldur's Gate 3 - 1920x1080 Ultra Preset AA:T | |
| Dell XPS 16 Core Ultra X7 358H | |
| MSI Prestige 16 AI C3MTG | |
| Lenovo ThinkBook 16 G7+ AMD | |
| Asus ZenBook S16 UM5606GA | |
| MSI Prestige 16 AI Evo B2HMG | |
| HP Envy x360 2-in-1 16-ad0097nr | |
| GTA V - 1920x1080 Highest AA:4xMSAA + FX AF:16x | |
| Dell XPS 16 Core Ultra X7 358H | |
| MSI Prestige 16 AI C3MTG | |
| Lenovo ThinkBook 16 G7+ AMD | |
| Asus ZenBook S16 UM5606GA | |
| MSI Prestige 16 AI Evo B2HMG | |
| Final Fantasy XV Benchmark - 1920x1080 High Quality | |
| Dell XPS 16 Core Ultra X7 358H | |
| MSI Prestige 16 AI C3MTG | |
| Lenovo ThinkBook 16 G7+ AMD | |
| MSI Prestige 16 AI Evo B2HMG | |
| Asus ZenBook S16 UM5606GA | |
| HP Envy x360 2-in-1 16-ad0097nr | |
| Strange Brigade - 1920x1080 ultra AA:ultra AF:16 | |
| Dell XPS 16 Core Ultra X7 358H | |
| MSI Prestige 16 AI C3MTG | |
| MSI Prestige 16 AI Evo B2HMG | |
| Lenovo ThinkBook 16 G7+ AMD | |
| Asus ZenBook S16 UM5606GA | |
| HP Envy x360 2-in-1 16-ad0097nr | |
| Dota 2 Reborn - 1920x1080 ultra (3/3) best looking | |
| MSI Prestige 16 AI C3MTG | |
| Dell XPS 16 Core Ultra X7 358H | |
| Lenovo ThinkBook 16 G7+ AMD | |
| Asus ZenBook S16 UM5606GA | |
| MSI Prestige 16 AI Evo B2HMG | |
| HP Envy x360 2-in-1 16-ad0097nr | |
| X-Plane 11.11 - 1920x1080 high (fps_test=3) | |
| Lenovo ThinkBook 16 G7+ AMD | |
| Asus ZenBook S16 UM5606GA | |
| MSI Prestige 16 AI C3MTG | |
| Dell XPS 16 Core Ultra X7 358H | |
| MSI Prestige 16 AI Evo B2HMG | |
| HP Envy x360 2-in-1 16-ad0097nr | |
Gráfico de ultra FPS do Cyberpunk 2077
| baixo | média | alto | ultra | |
|---|---|---|---|---|
| GTA V (2015) | 174.7 | 164.7 | 97.9 | 43 |
| Dota 2 Reborn (2015) | 122.1 | 98.4 | 104.3 | 111.8 |
| Final Fantasy XV Benchmark (2018) | 124.3 | 73.9 | 53.4 | |
| X-Plane 11.11 (2018) | 61.7 | 52.4 | 44.5 | |
| Strange Brigade (2018) | 304 | 118.7 | 98.5 | 88.5 |
| Baldur's Gate 3 (2023) | 69.4 | 58.5 | 52.6 | 51.7 |
| Cyberpunk 2077 (2023) | 77.2 | 62.3 | 53.8 | 44.8 |
| F1 24 (2024) | 144.9 | 135.3 | 104.3 | 37.4 |
Emissões
Ruído do sistema
A solução de resfriamento é muito menor do que a do XPS 16, o que contribui para as notáveis diferenças de temperatura do núcleo entre os dois modelos. Embora as ventoinhas do MSI possam permanecer mais silenciosas por mais tempo antes de precisarem aumentar o volume, elas ainda assim atingem níveis máximos semelhantes depois de algum tempo. O ruído da ventoinha ao executar o Cyberpunk 2077 no modo Performance, por exemplo, se estabilizaria em 41 dB(A) em comparação com 42 dB(A) no Dell.
Observe que o ruído da ventoinha diminuiria significativamente ao jogar no modo Balanceado em vez do modo Desempenho. Nesse caso, as ventoinhas atingiriam o máximo em pouco menos de 30 dB(A), o que pode justificar o déficit de desempenho de 20% mencionado acima, dependendo da preferência do usuário.
Barulho
| Ocioso |
| 23.3 / 23.3 / 25.9 dB |
| Carga |
| 30.1 / 44.7 dB |
 | ||
30 dB silencioso 40 dB(A) audível 50 dB(A) ruidosamente alto |
||
min: | ||
| MSI Prestige 16 AI C3MTG Ultra X7 358H, Arc B390 Panther Lake iGPU | MSI Prestige 16 AI Evo B2HMG Ultra 9 285H, Arc 140T | Dell XPS 16 Core Ultra X7 358H Ultra X7 358H, Arc B390 Panther Lake iGPU | Asus ZenBook S16 UM5606GA Ryzen AI 9 465, Radeon 880M | Lenovo ThinkBook 16 G7+ AMD Ryzen AI 9 365, Radeon 880M | HP Envy x360 2-in-1 16-ad0097nr R7 8840HS, Radeon 780M | |
|---|---|---|---|---|---|---|
| Noise | -4% | -4% | -15% | -3% | 6% | |
| desligado / ambiente * (dB) | 23.1 | 23.6 -2% | 23.3 -1% | 24.9 -8% | 24.5 -6% | 22.9 1% |
| Idle Minimum * (dB) | 23.3 | 23.6 -1% | 23.4 -0% | 24.9 -7% | 24.5 -5% | 23 1% |
| Idle Average * (dB) | 23.3 | 23.6 -1% | 23.4 -0% | 24.9 -7% | 24.5 -5% | 23 1% |
| Idle Maximum * (dB) | 25.9 | 26.2 -1% | 25.8 -0% | 24.9 4% | 25.9 -0% | 23 11% |
| Load Average * (dB) | 30.1 | 37.1 -23% | 38 -26% | 45.7 -52% | 36.2 -20% | 23.8 21% |
| Cyberpunk 2077 ultra * (dB) | 40.8 | 42.1 -3% | 38.1 7% | 49 -20% | 40.1 2% | |
| Load Maximum * (dB) | 44.7 | 42.1 6% | 48.6 -9% | 50.4 -13% | 40.1 10% | 43.8 2% |
| Witcher 3 ultra * (dB) | 43.8 |
* ... menor é melhor
Temperatura
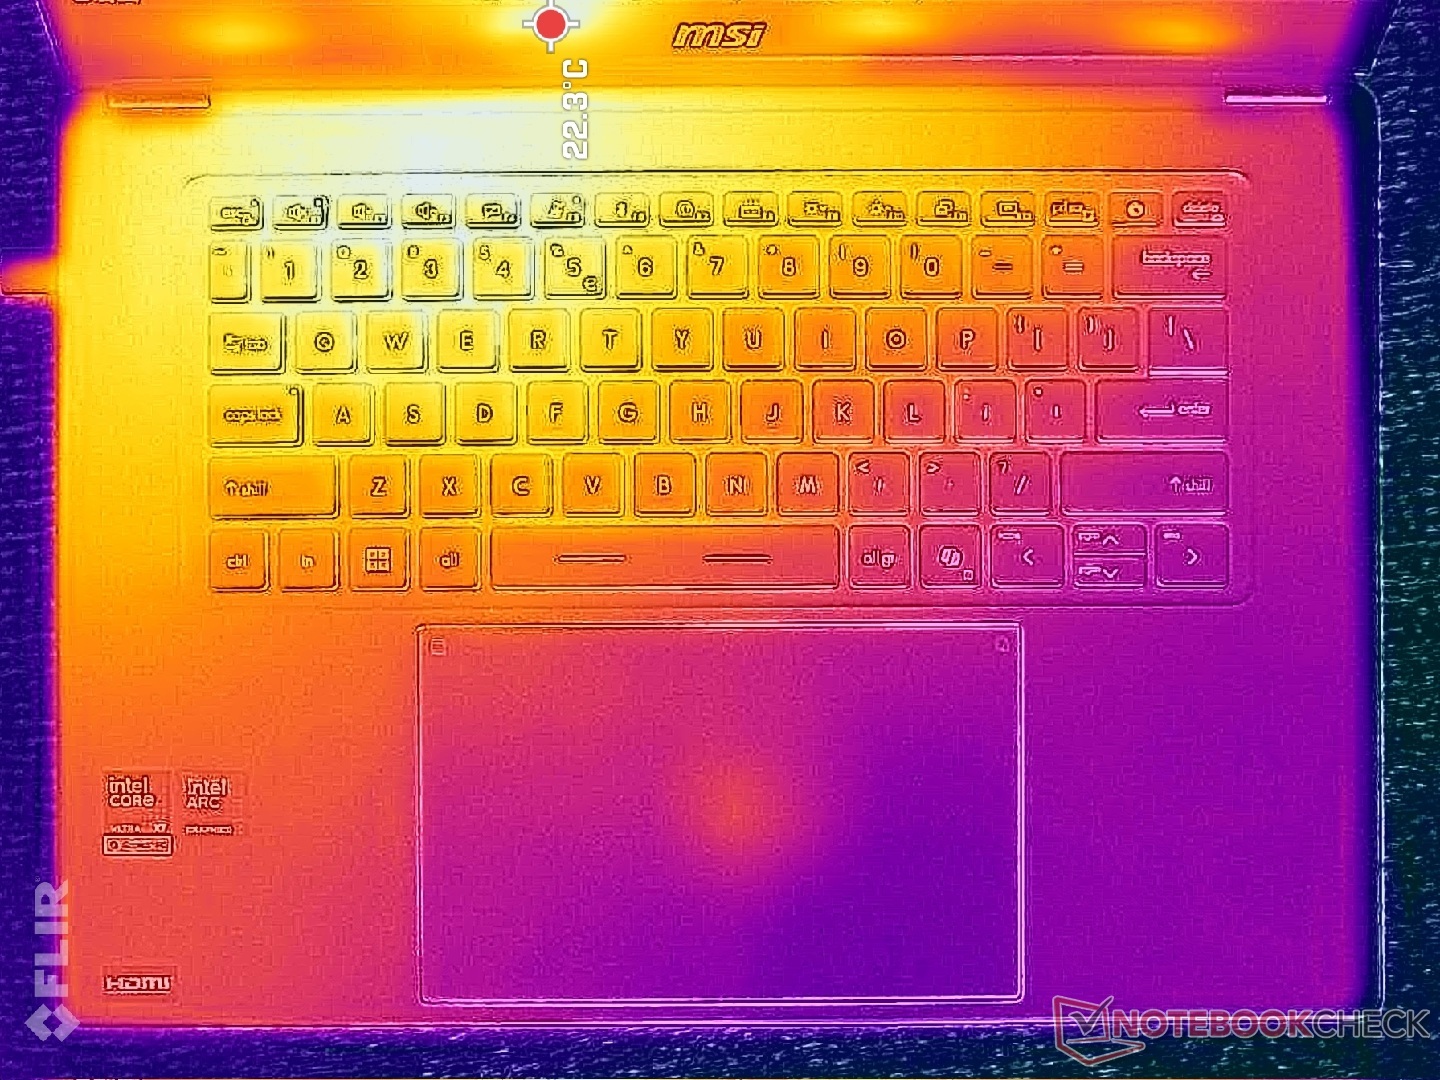
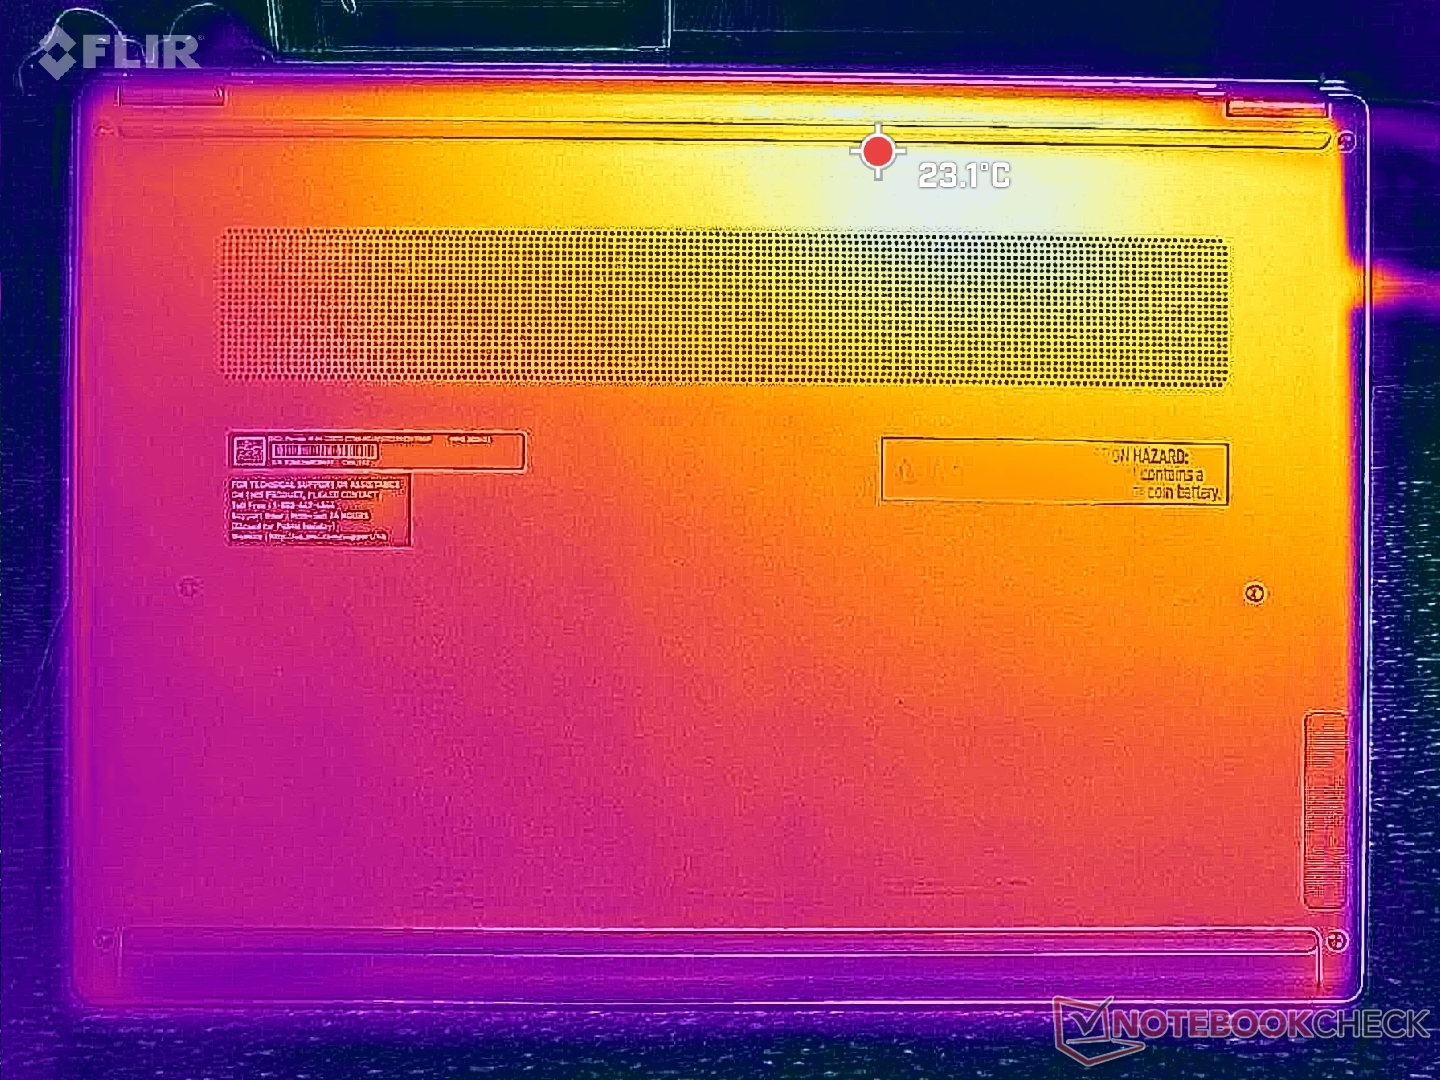
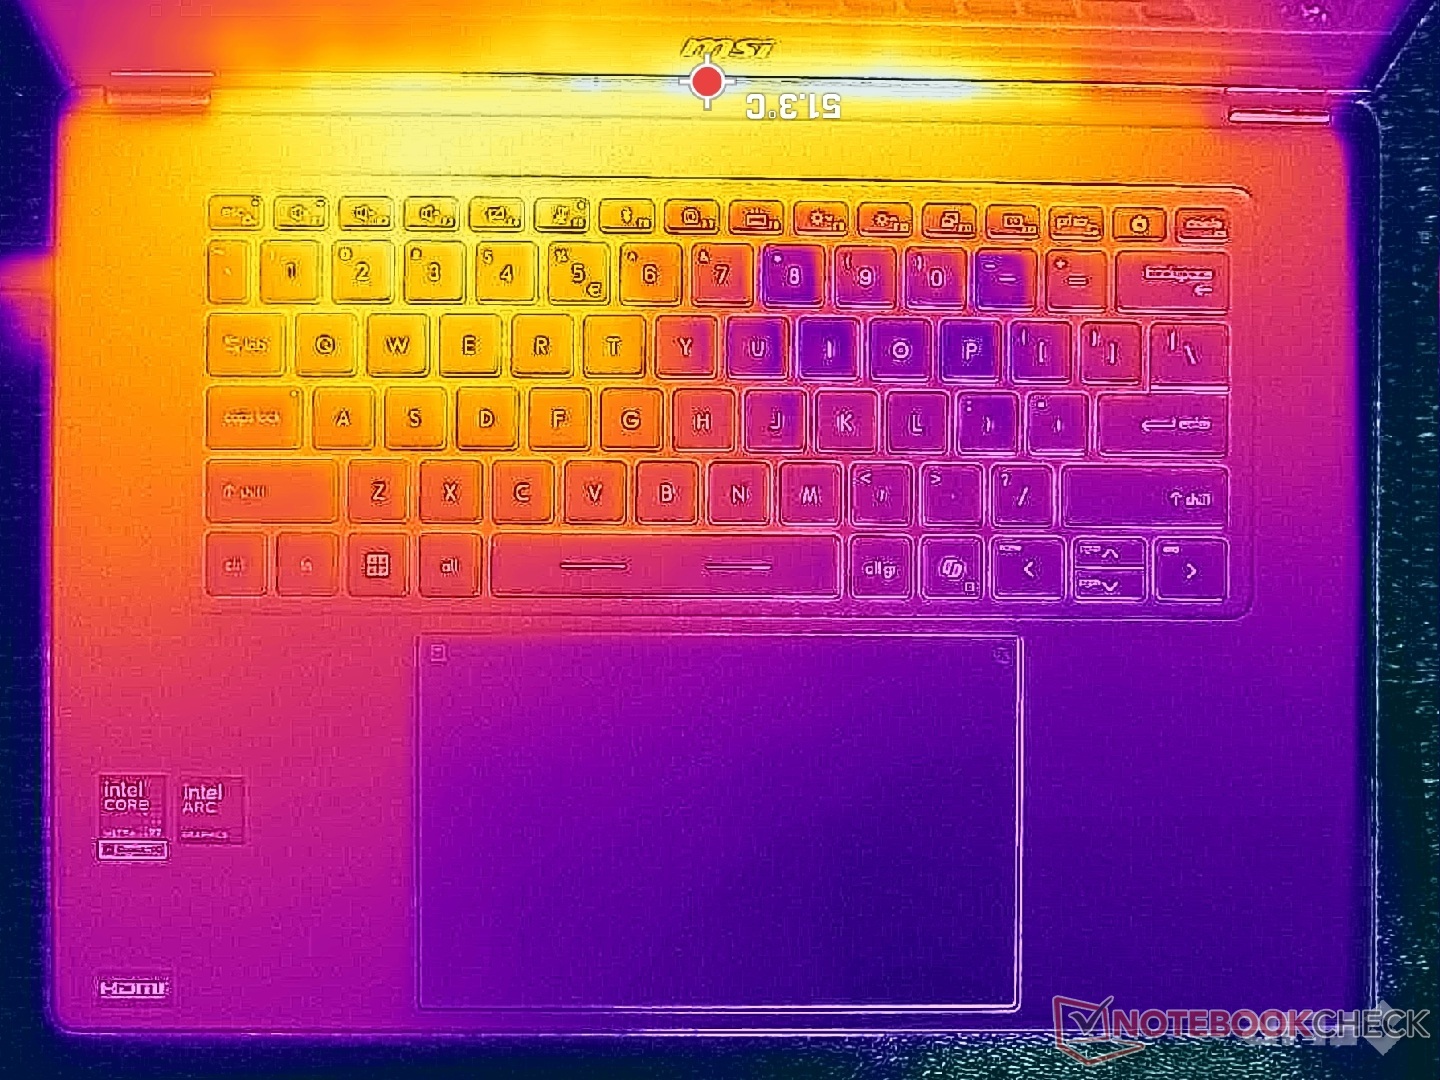
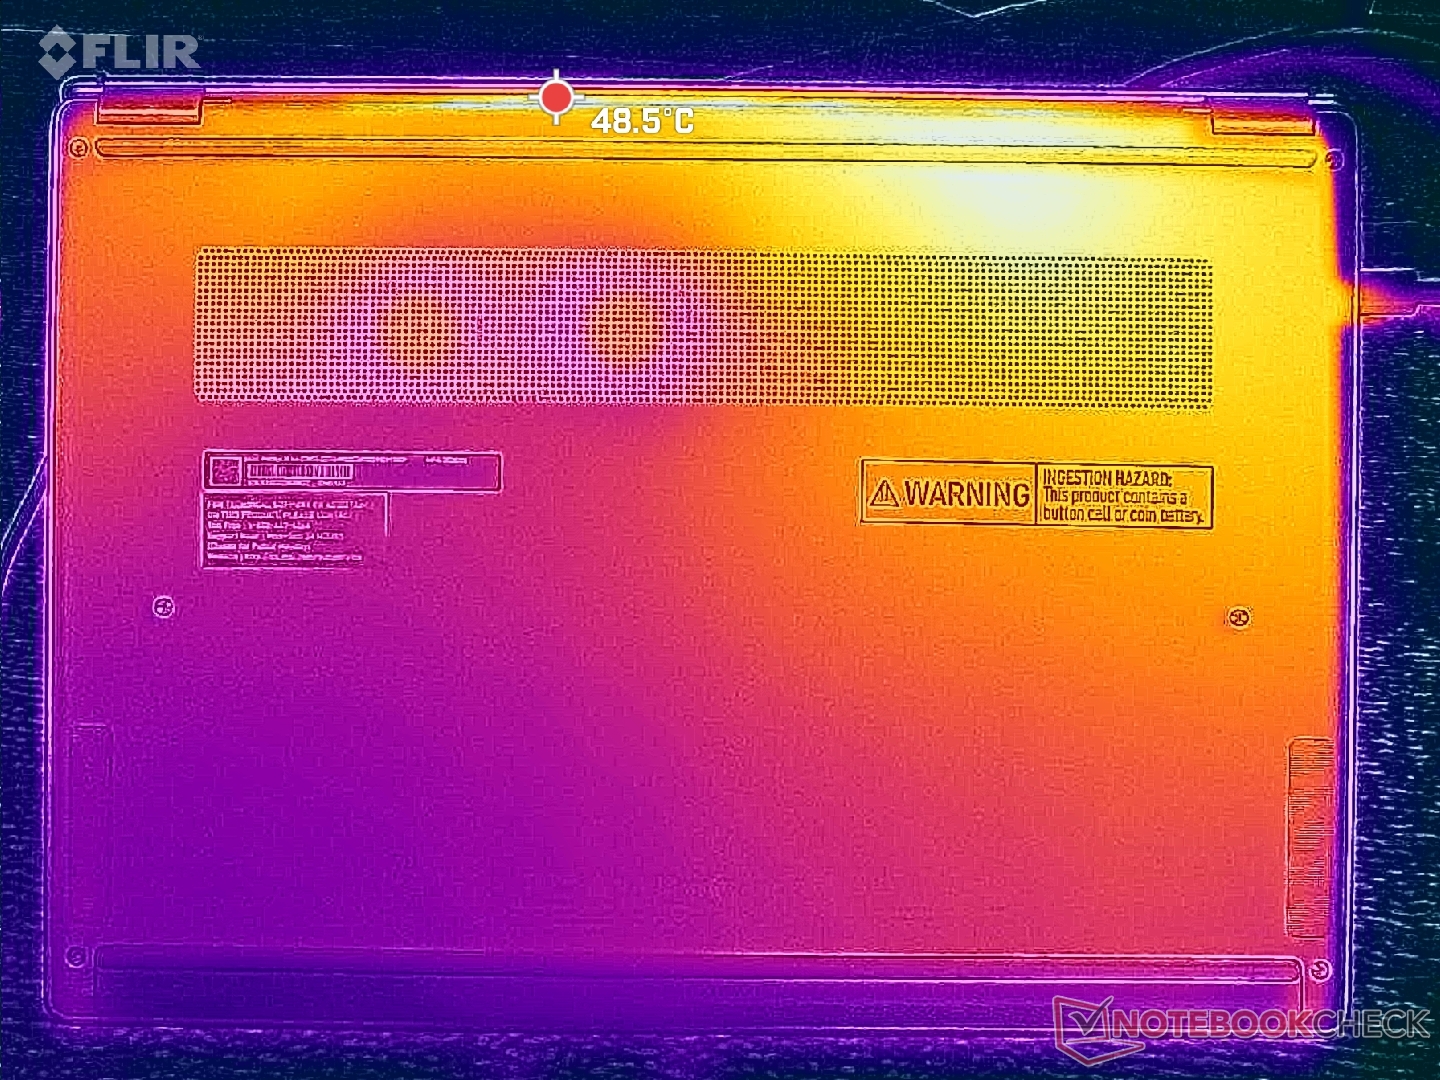
As temperaturas da superfície melhoraram em relação à geração anterior. Enquanto o Prestige 16 de 2025 atingia temperaturas de 47 C a 52 C, o modelo mais recente atinge o máximo de 40 C a 47 C. Os pontos quentes estão próximos ao canto traseiro do chassi, onde o contato com a pele é minimizado.
Mesmo assim, as temperaturas da superfície ainda são mais quentes do que no concorrente XPS 16 onde os pontos quentes atingiriam apenas 41 °C, independentemente do lado, para uma média mais fria.
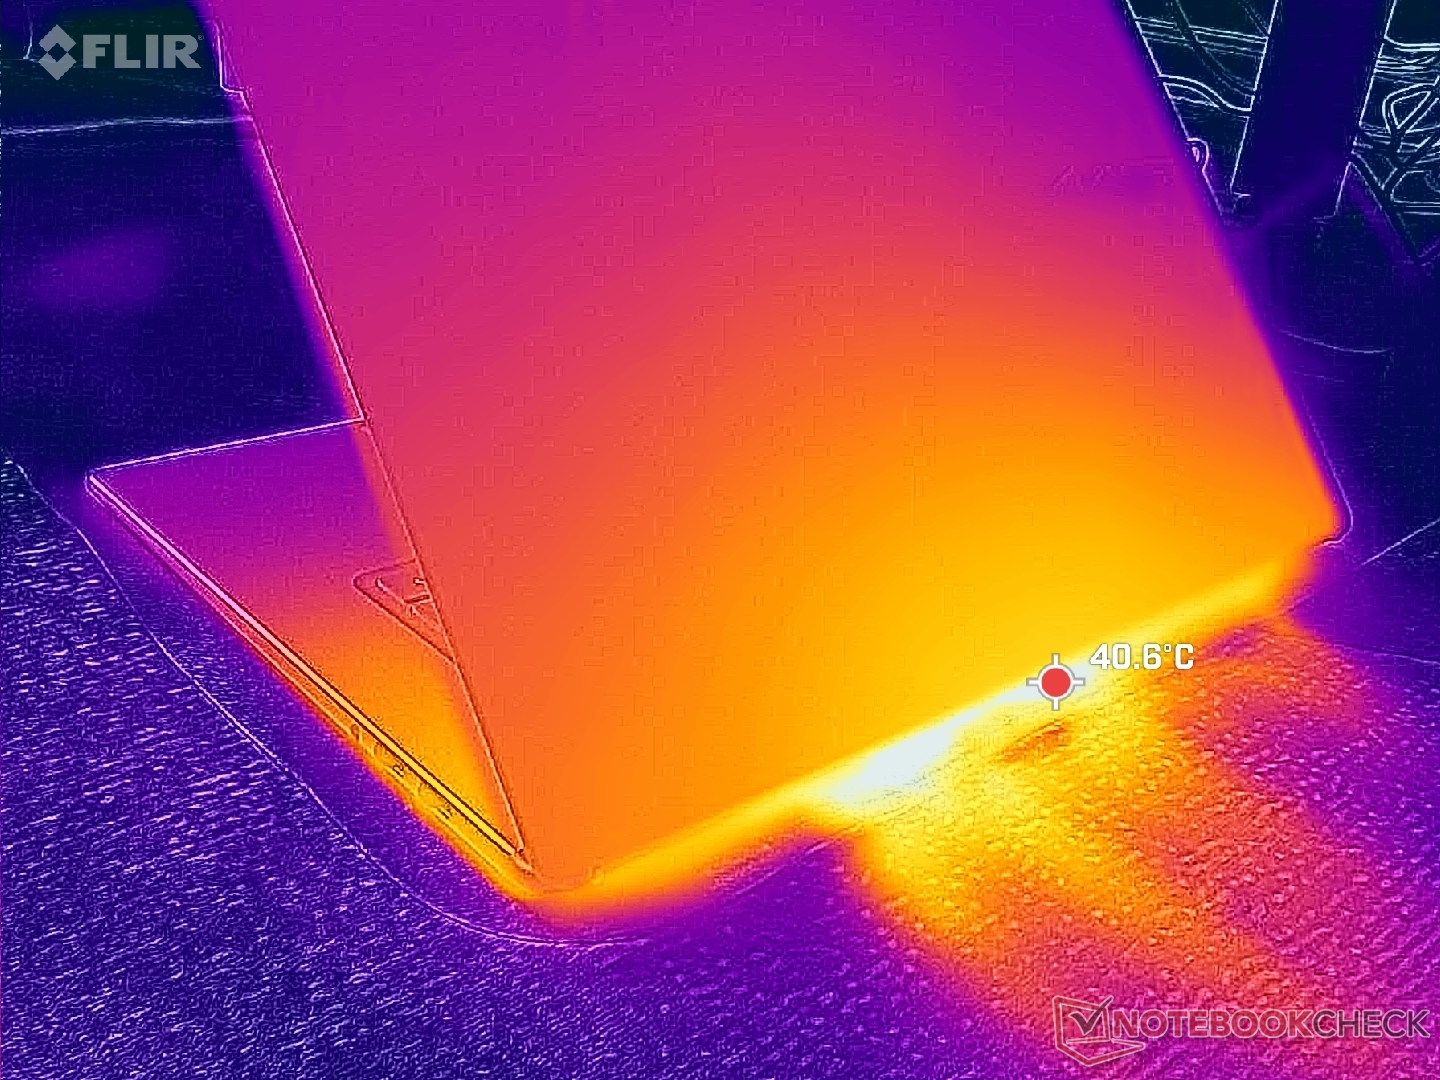
(-) A temperatura máxima no lado superior é 47 °C / 117 F, em comparação com a média de 36.8 °C / 98 F , variando de 21 a 71 °C para a classe Multimedia.
(±) A parte inferior aquece até um máximo de 40 °C / 104 F, em comparação com a média de 39.1 °C / 102 F
(+) Em uso inativo, a temperatura média para o lado superior é 24.8 °C / 77 F, em comparação com a média do dispositivo de 31.3 °C / ### class_avg_f### F.
(+) Os apoios para as mãos e o touchpad são mais frios que a temperatura da pele, com um máximo de 30.4 °C / 86.7 F e, portanto, são frios ao toque.
(±) A temperatura média da área do apoio para as mãos de dispositivos semelhantes foi 28.7 °C / 83.7 F (-1.7 °C / -3 F).
| MSI Prestige 16 AI C3MTG Ultra X7 358H, Arc B390 Panther Lake iGPU | MSI Prestige 16 AI Evo B2HMG Ultra 9 285H, Arc 140T | Dell XPS 16 Core Ultra X7 358H Ultra X7 358H, Arc B390 Panther Lake iGPU | Asus ZenBook S16 UM5606GA Ryzen AI 9 465, Radeon 880M | Lenovo ThinkBook 16 G7+ AMD Ryzen AI 9 365, Radeon 880M | HP Envy x360 2-in-1 16-ad0097nr R7 8840HS, Radeon 780M | |
|---|---|---|---|---|---|---|
| Heat | -5% | 11% | -1% | 9% | -3% | |
| Maximum Upper Side * (°C) | 47 | 48.1 -2% | 40.6 14% | 43.4 8% | 38.2 19% | 42.6 9% |
| Maximum Bottom * (°C) | 40 | 51.6 -29% | 39.8 1% | 46.2 -16% | 37.9 5% | 47.8 -19% |
| Idle Upper Side * (°C) | 27.4 | 25.9 5% | 23.2 15% | 26.5 3% | 25.4 7% | 27.4 -0% |
| Idle Bottom * (°C) | 27.4 | 25.2 8% | 23.8 13% | 27 1% | 25.7 6% | 27.8 -1% |
* ... menor é melhor
Teste de estresse
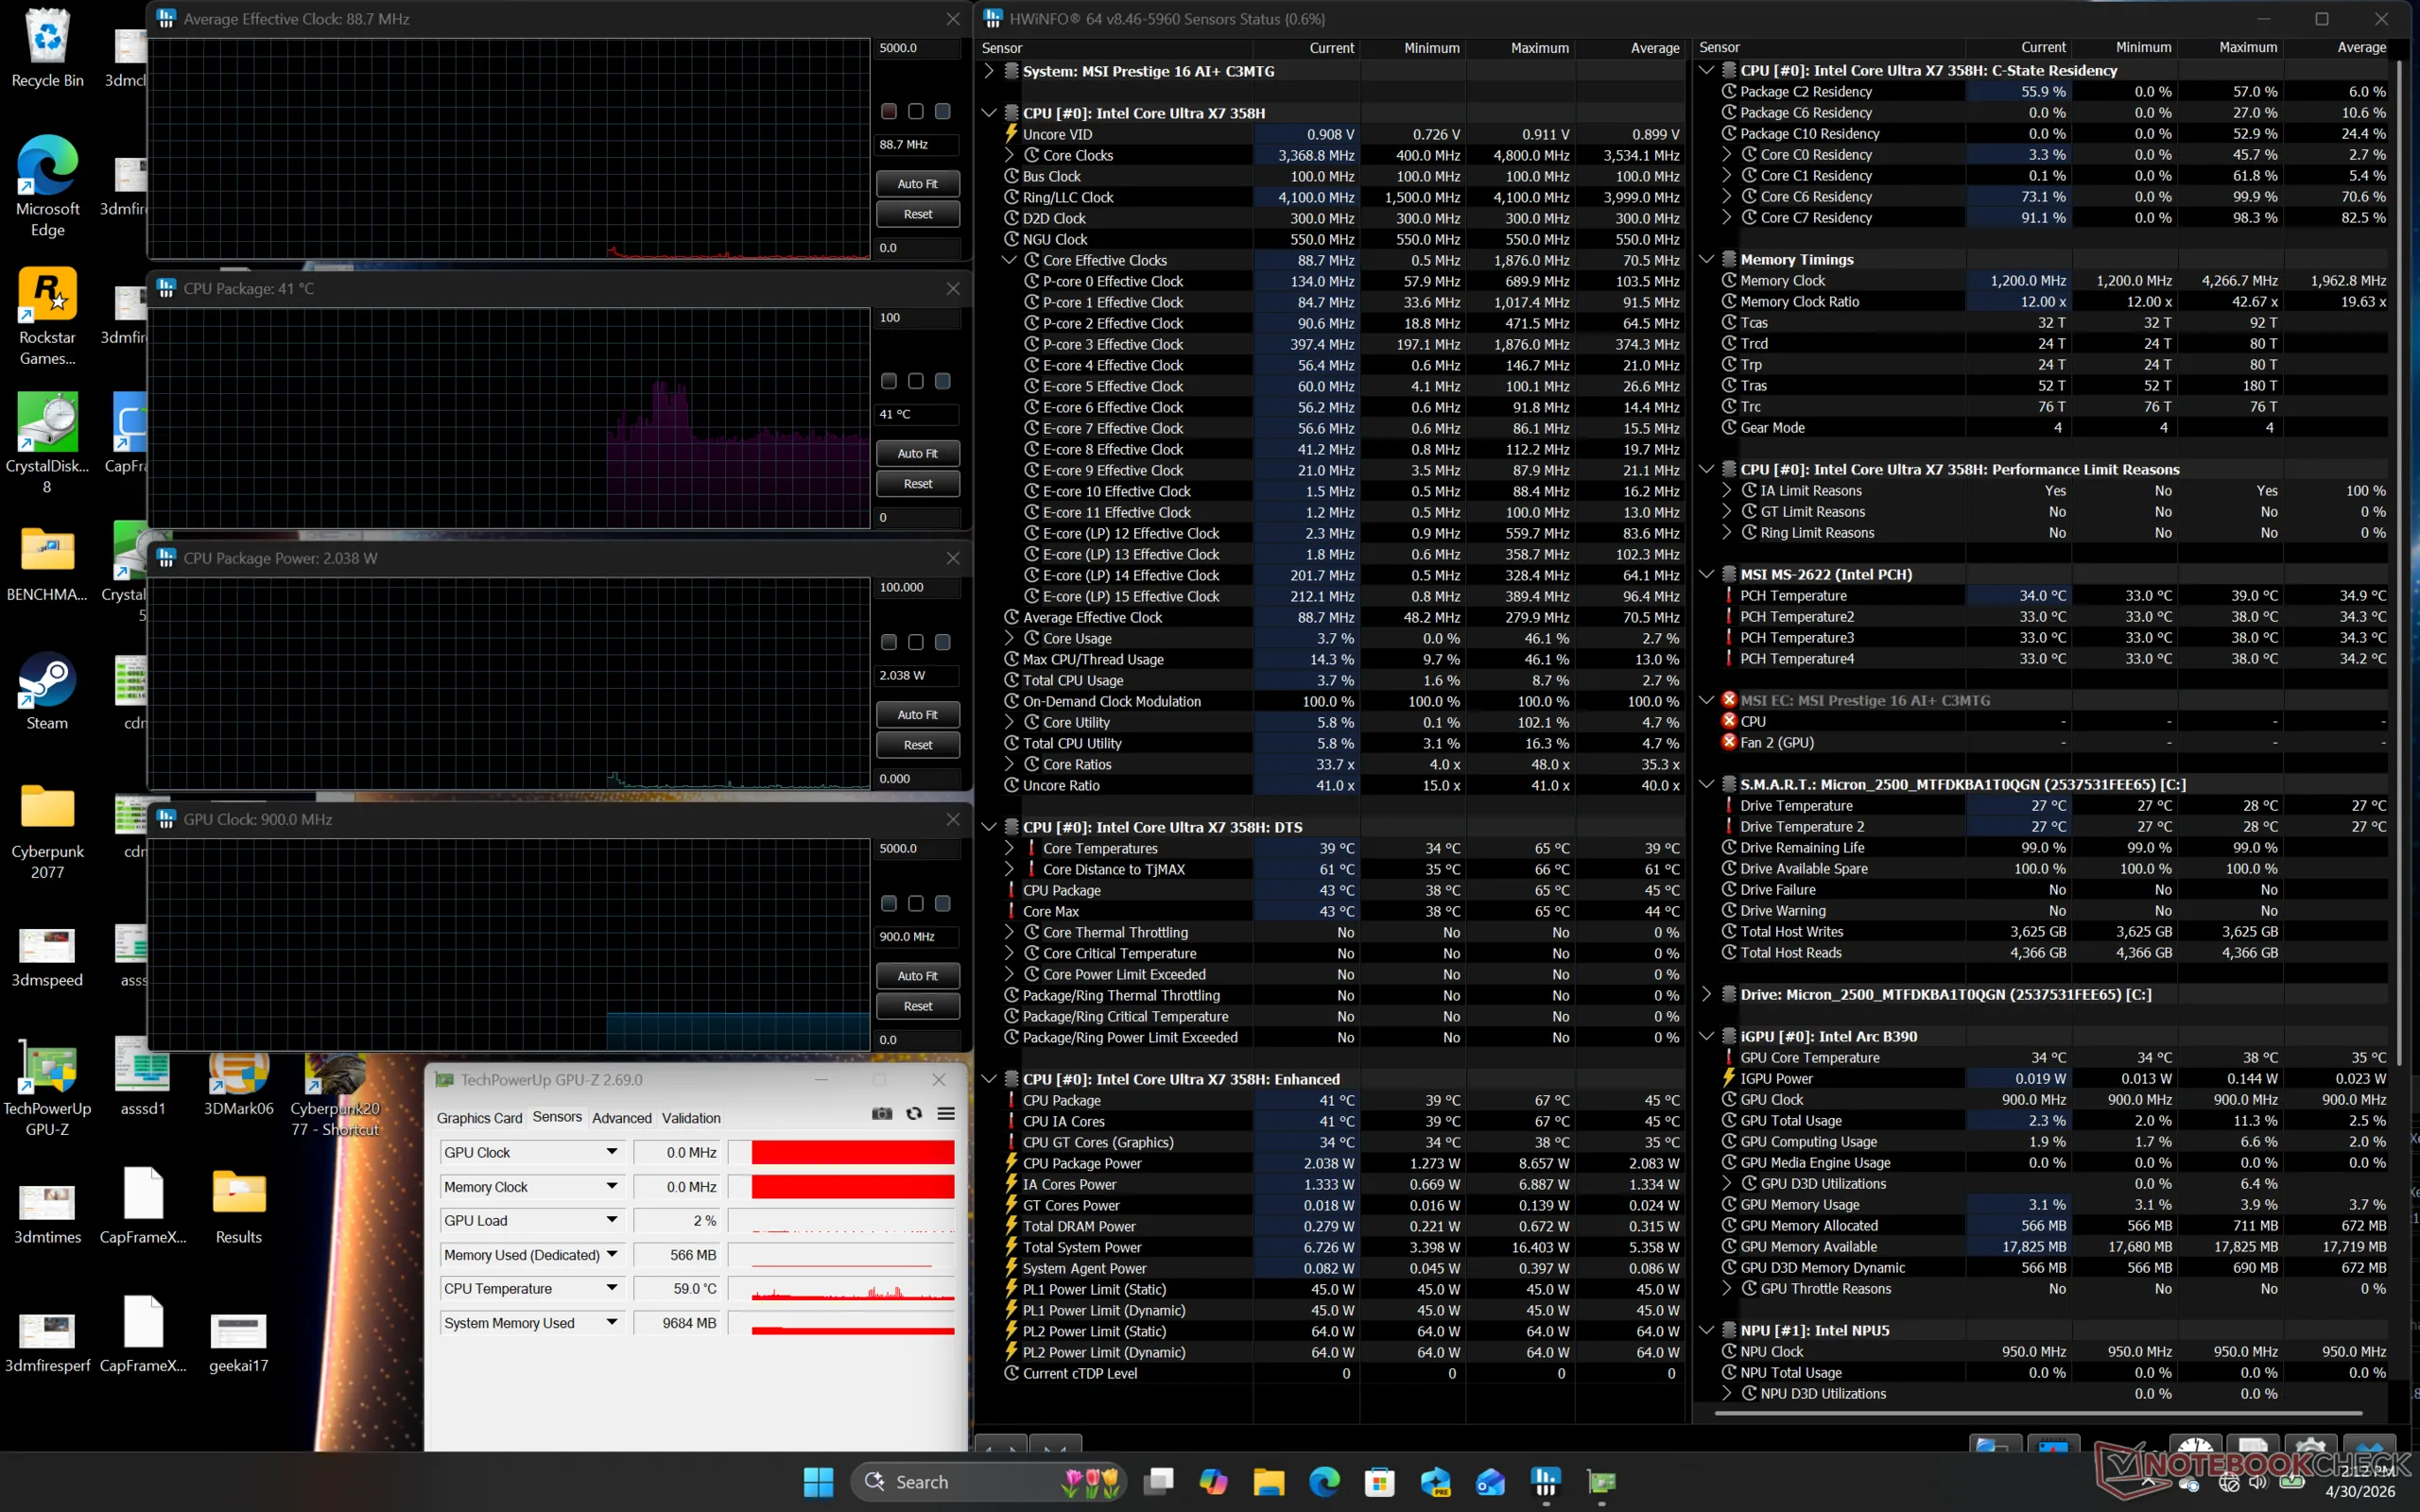
Ao executar o estresse do Prime95, a CPU aumentaria para 3 GHz, 64 W e 97 C antes de cair rapidamente para 2,3 GHz e 39 W para manter uma temperatura central estável de 90 C. Os resultados são mais quentes do que o que registramos no XPS 16 com exatamente a mesma CPU, em que a temperatura central se estabilizaria em apenas 78 C em comparação.
Ao executar o Cyberpunk 2077 no modo Desempenho para representar o estresse dos jogos, a GPU se estabilizaria em 2500 MHz, 38 W e 86 C, o que, mais uma vez, é muito mais quente do que o Dell mencionado anteriormente, em mais de 20 C. O ajuste do sistema para o modo Equilibrado faria com que a GPU alternasse entre 1220 MHz e 1850 MHz e 16 W e 26 W, o que se alinha com o desempenho gráfico mais lento mencionado acima e com o ruído mais baixo da ventoinha.
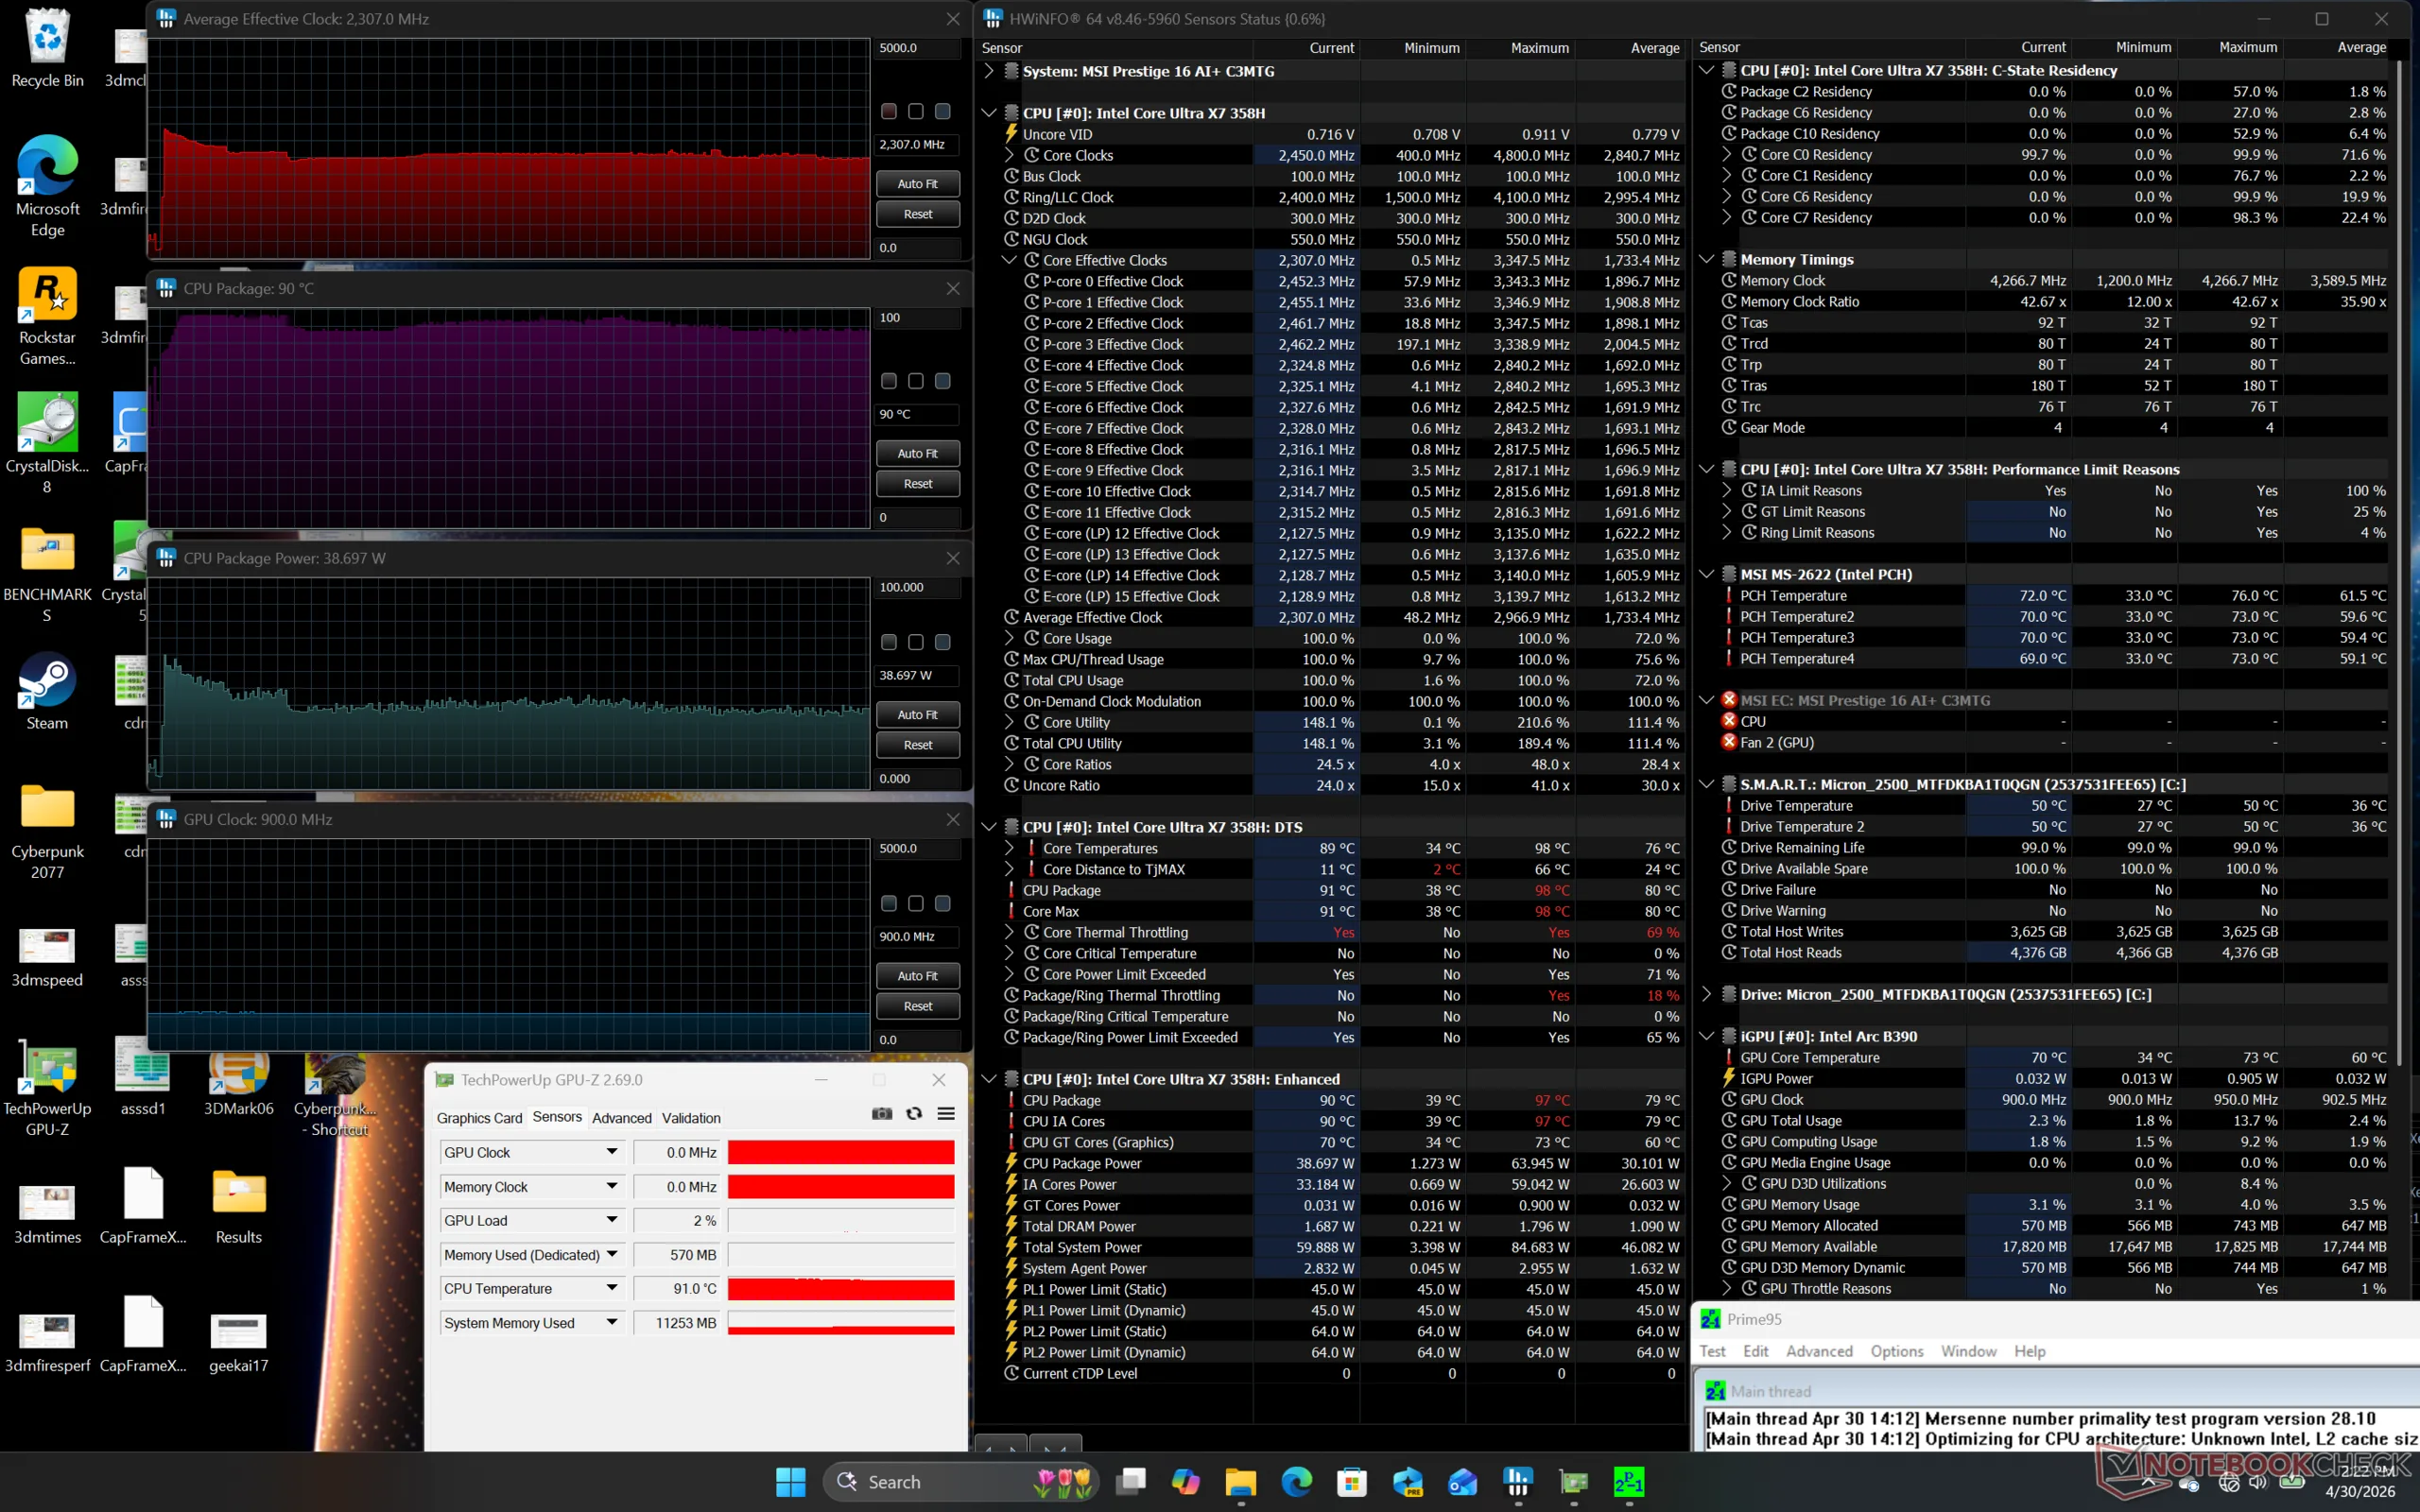
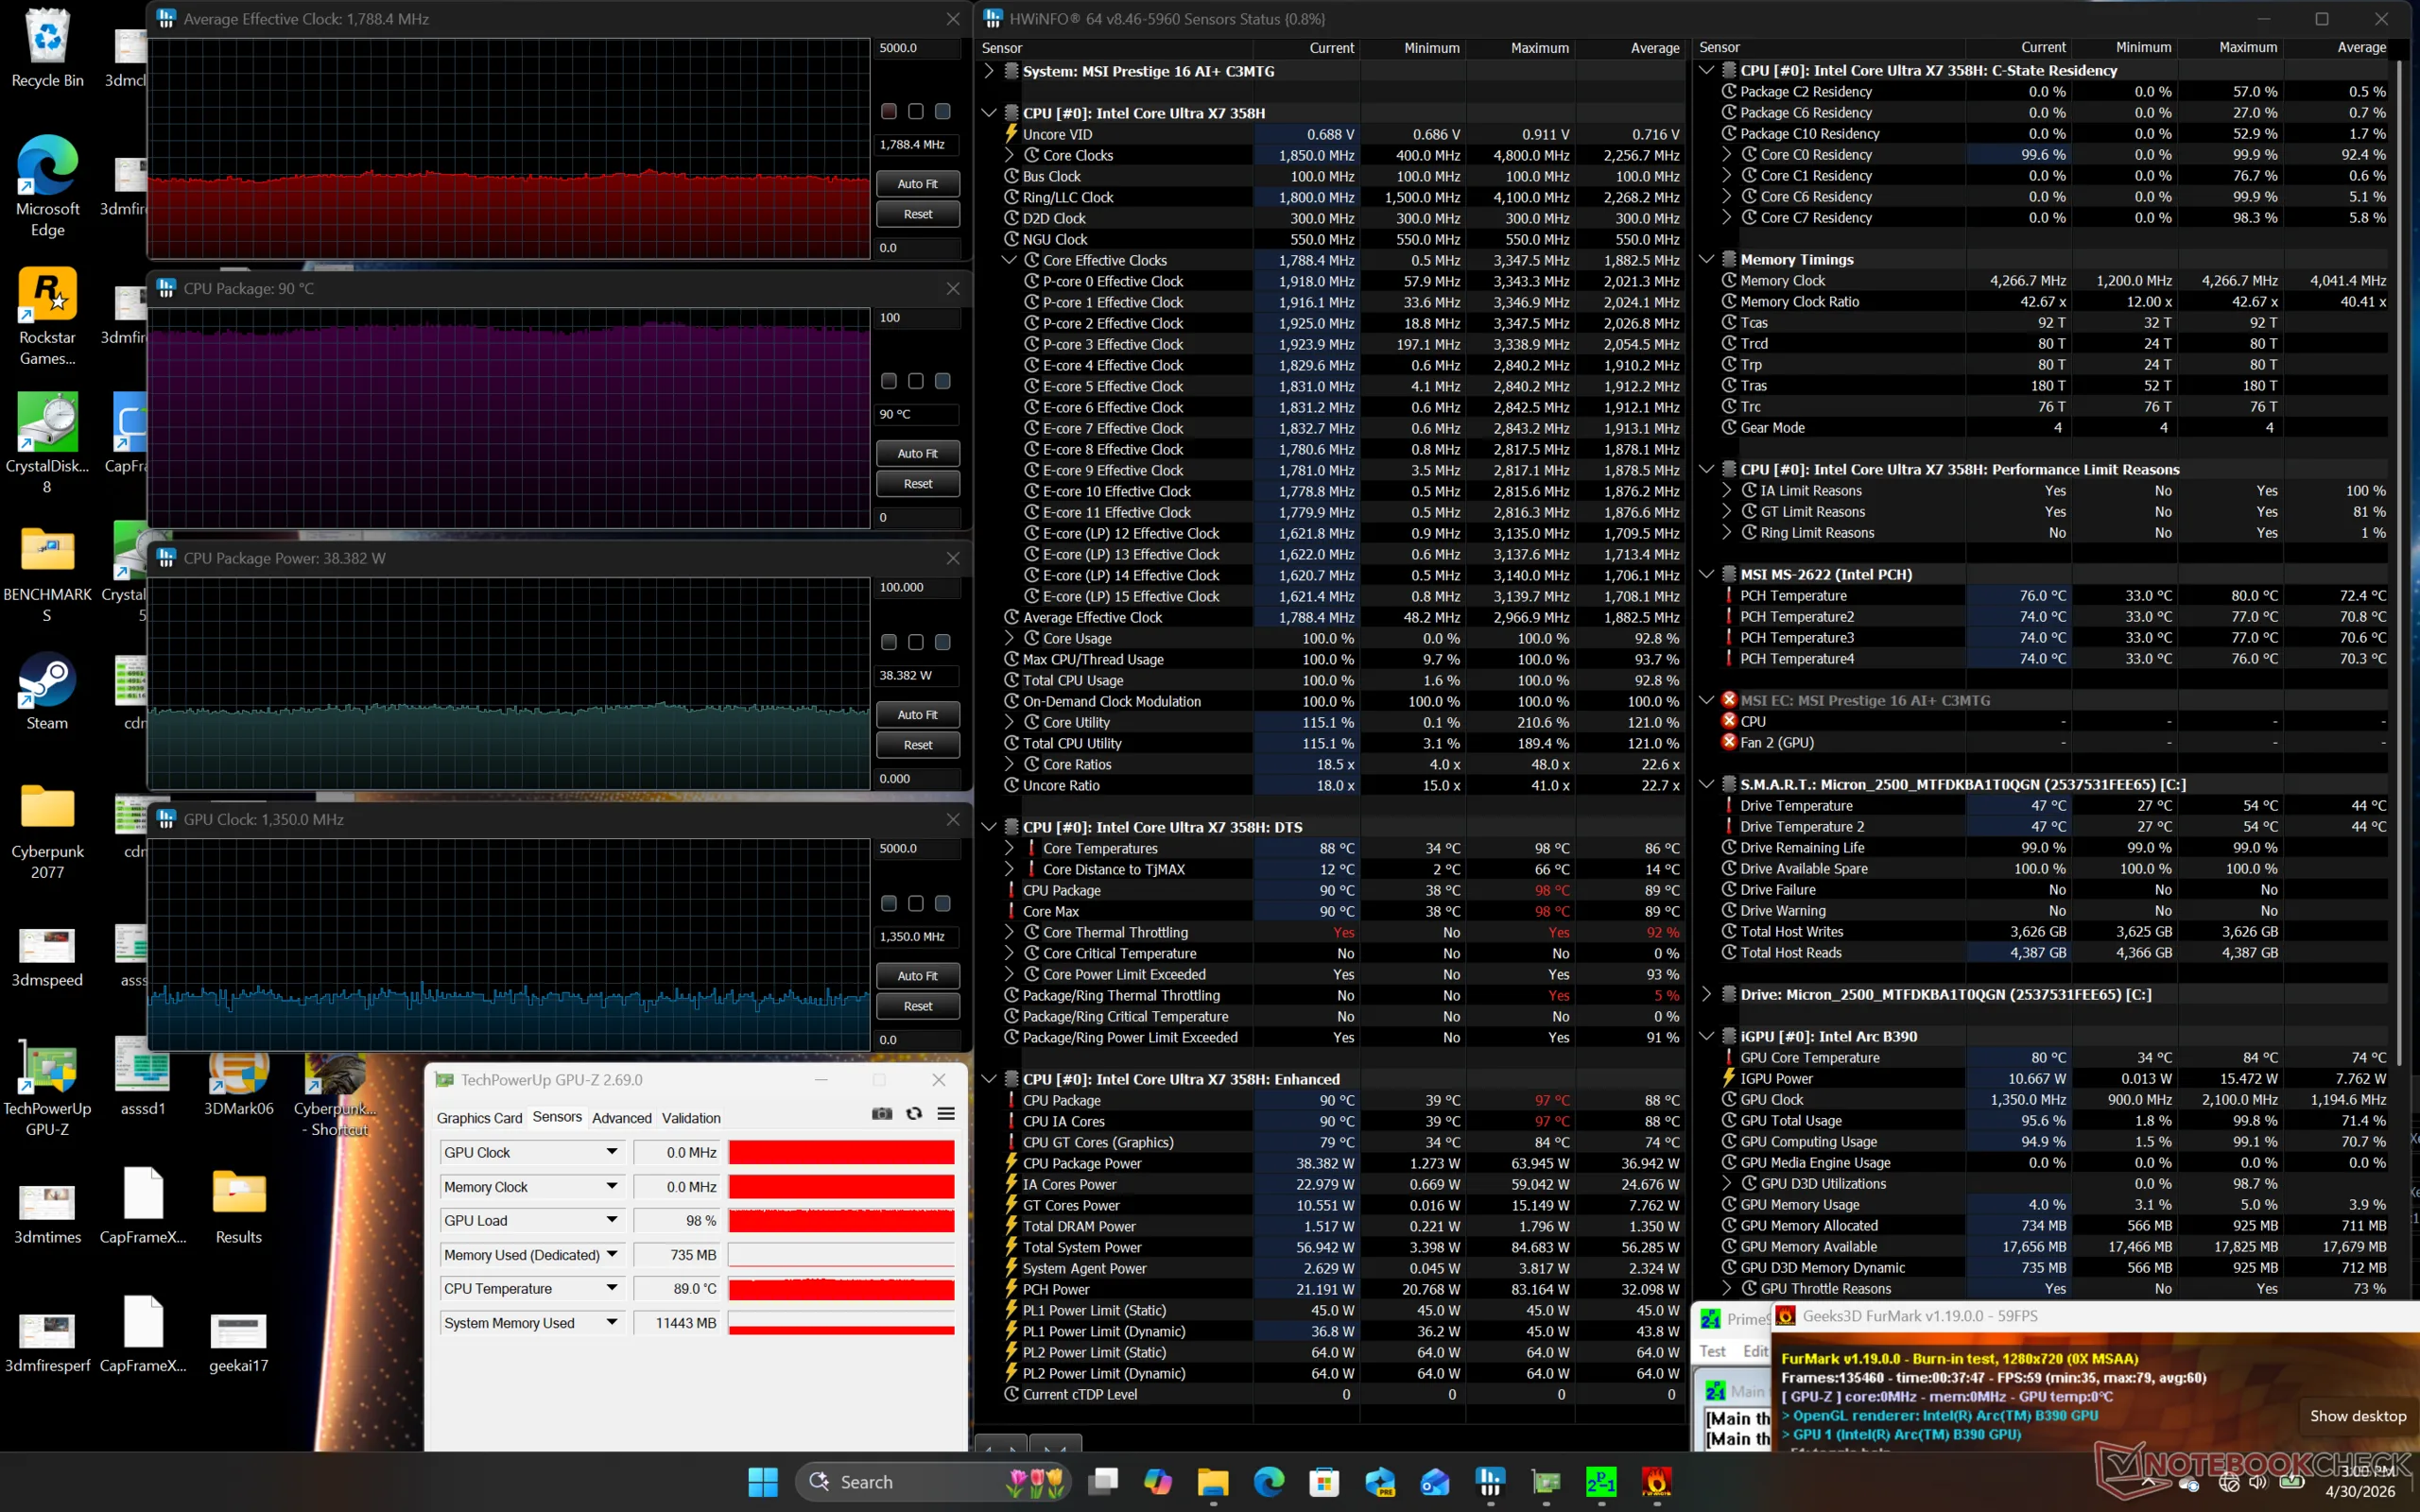
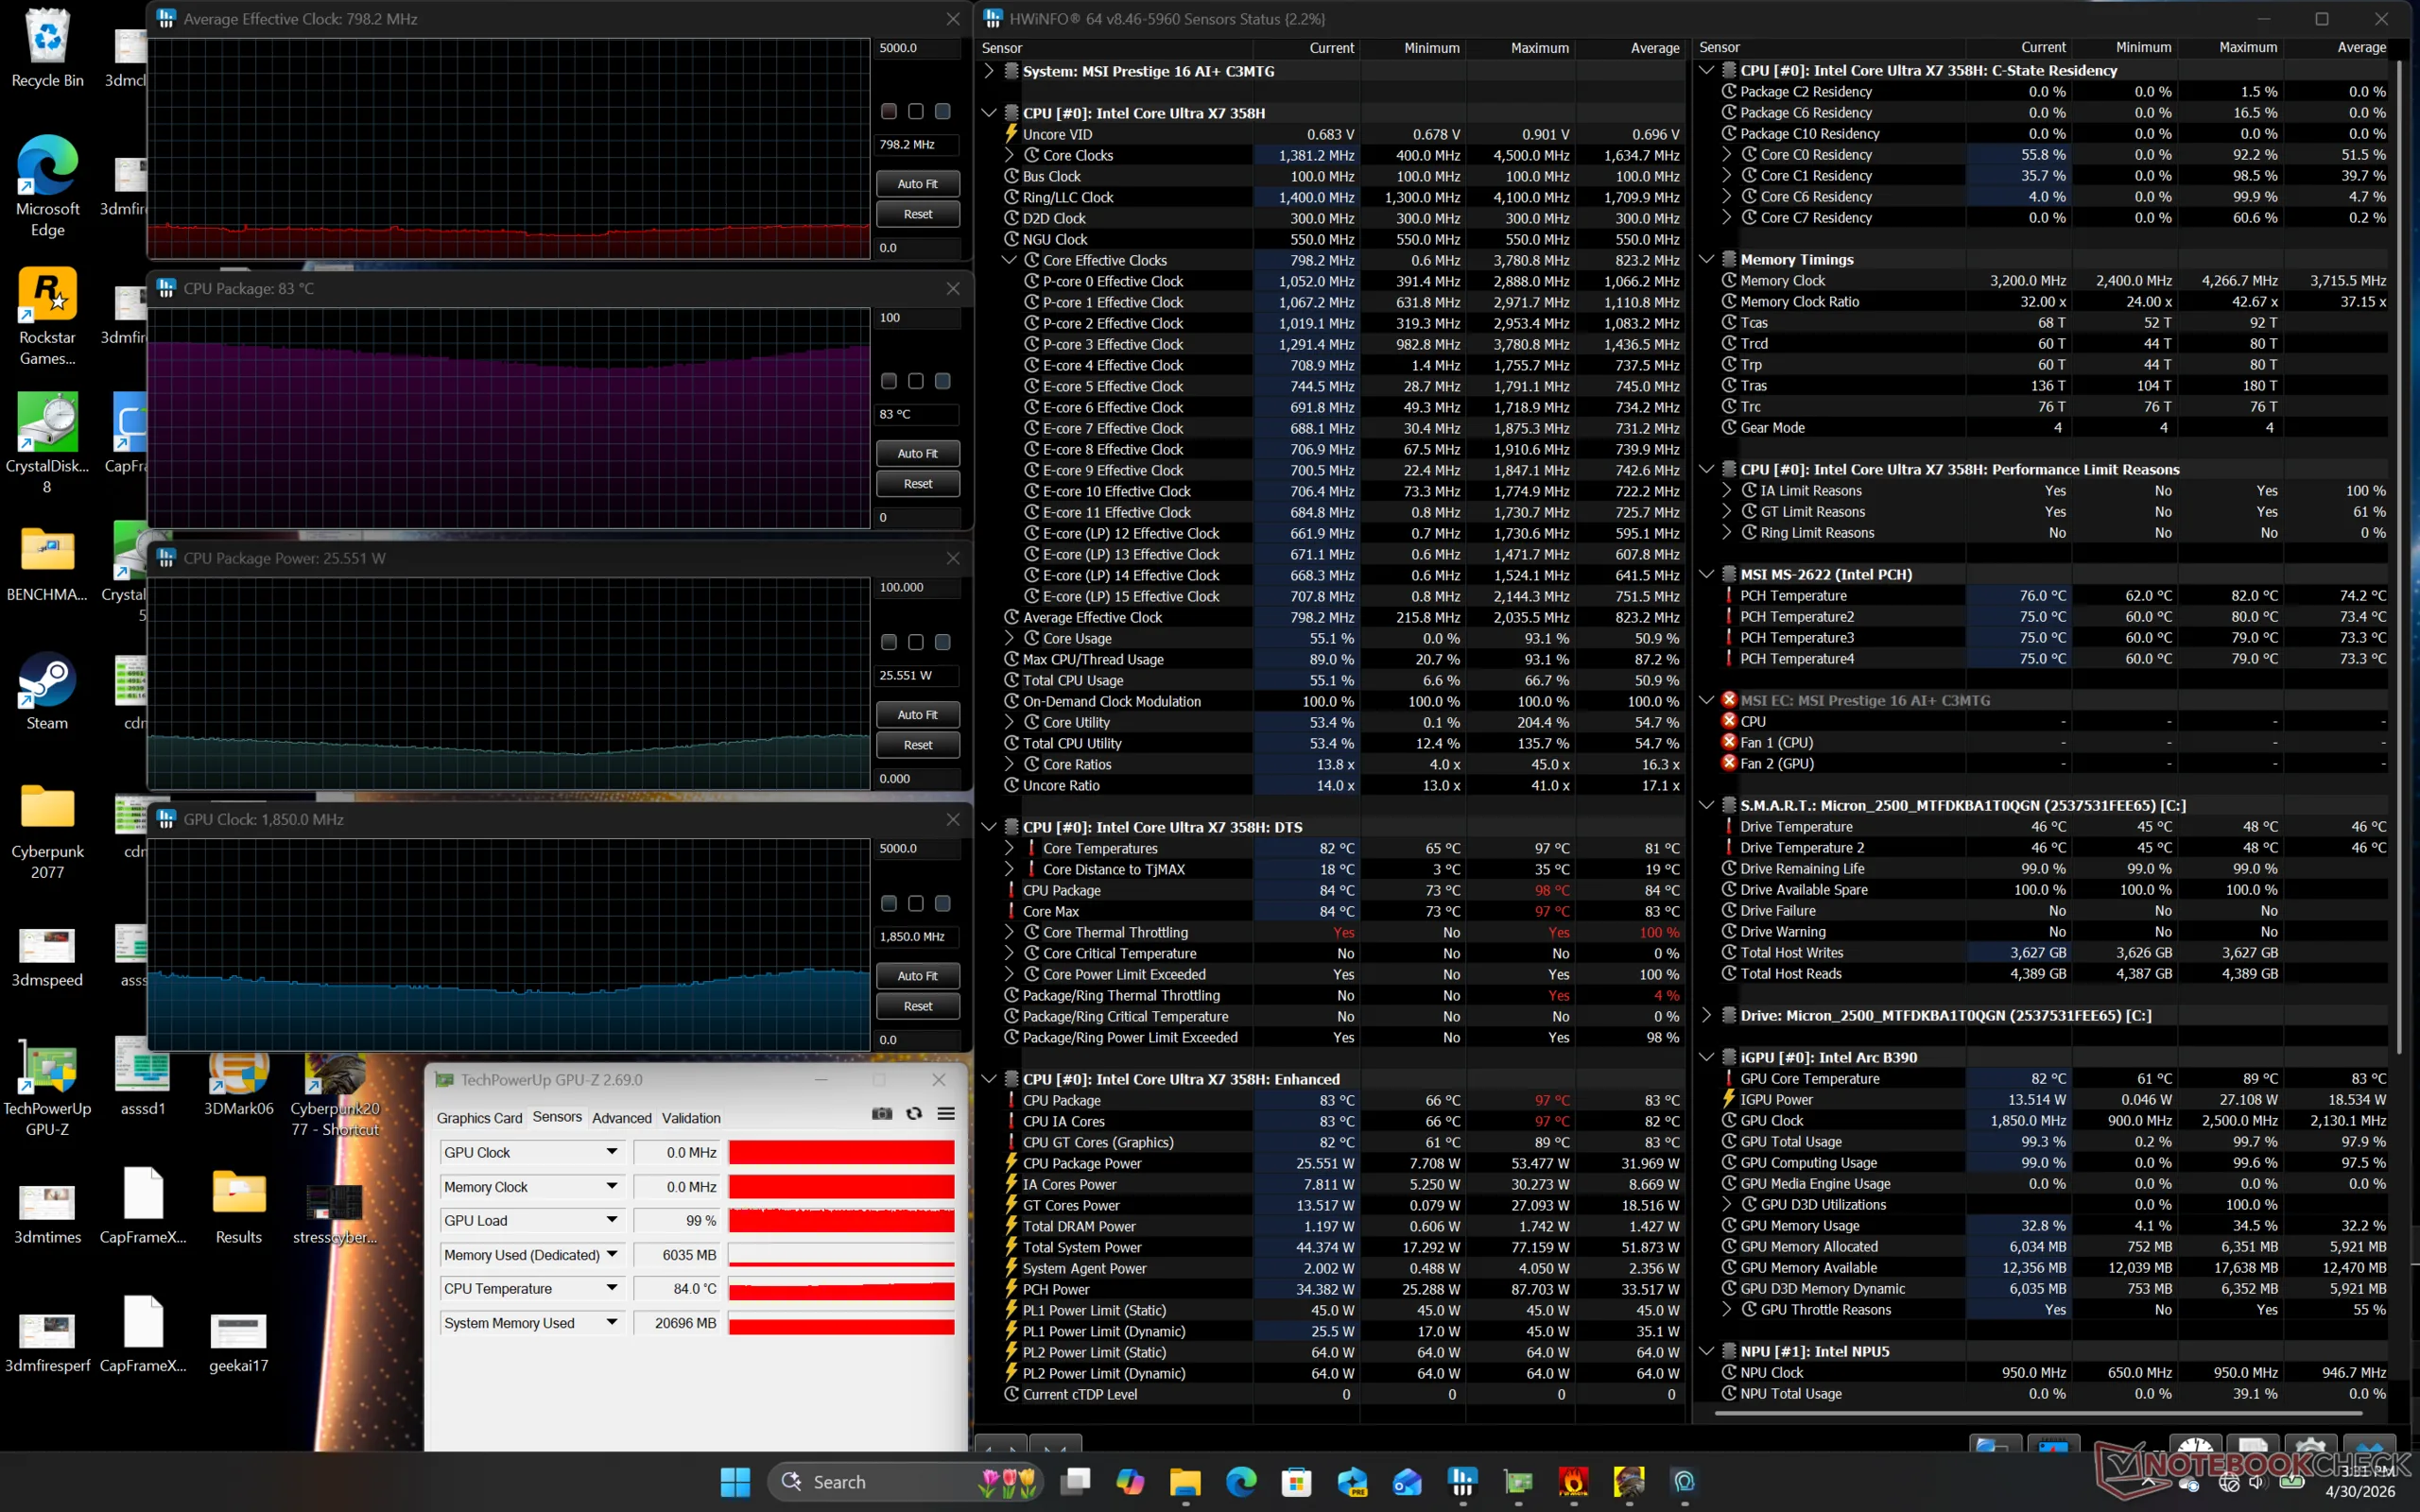
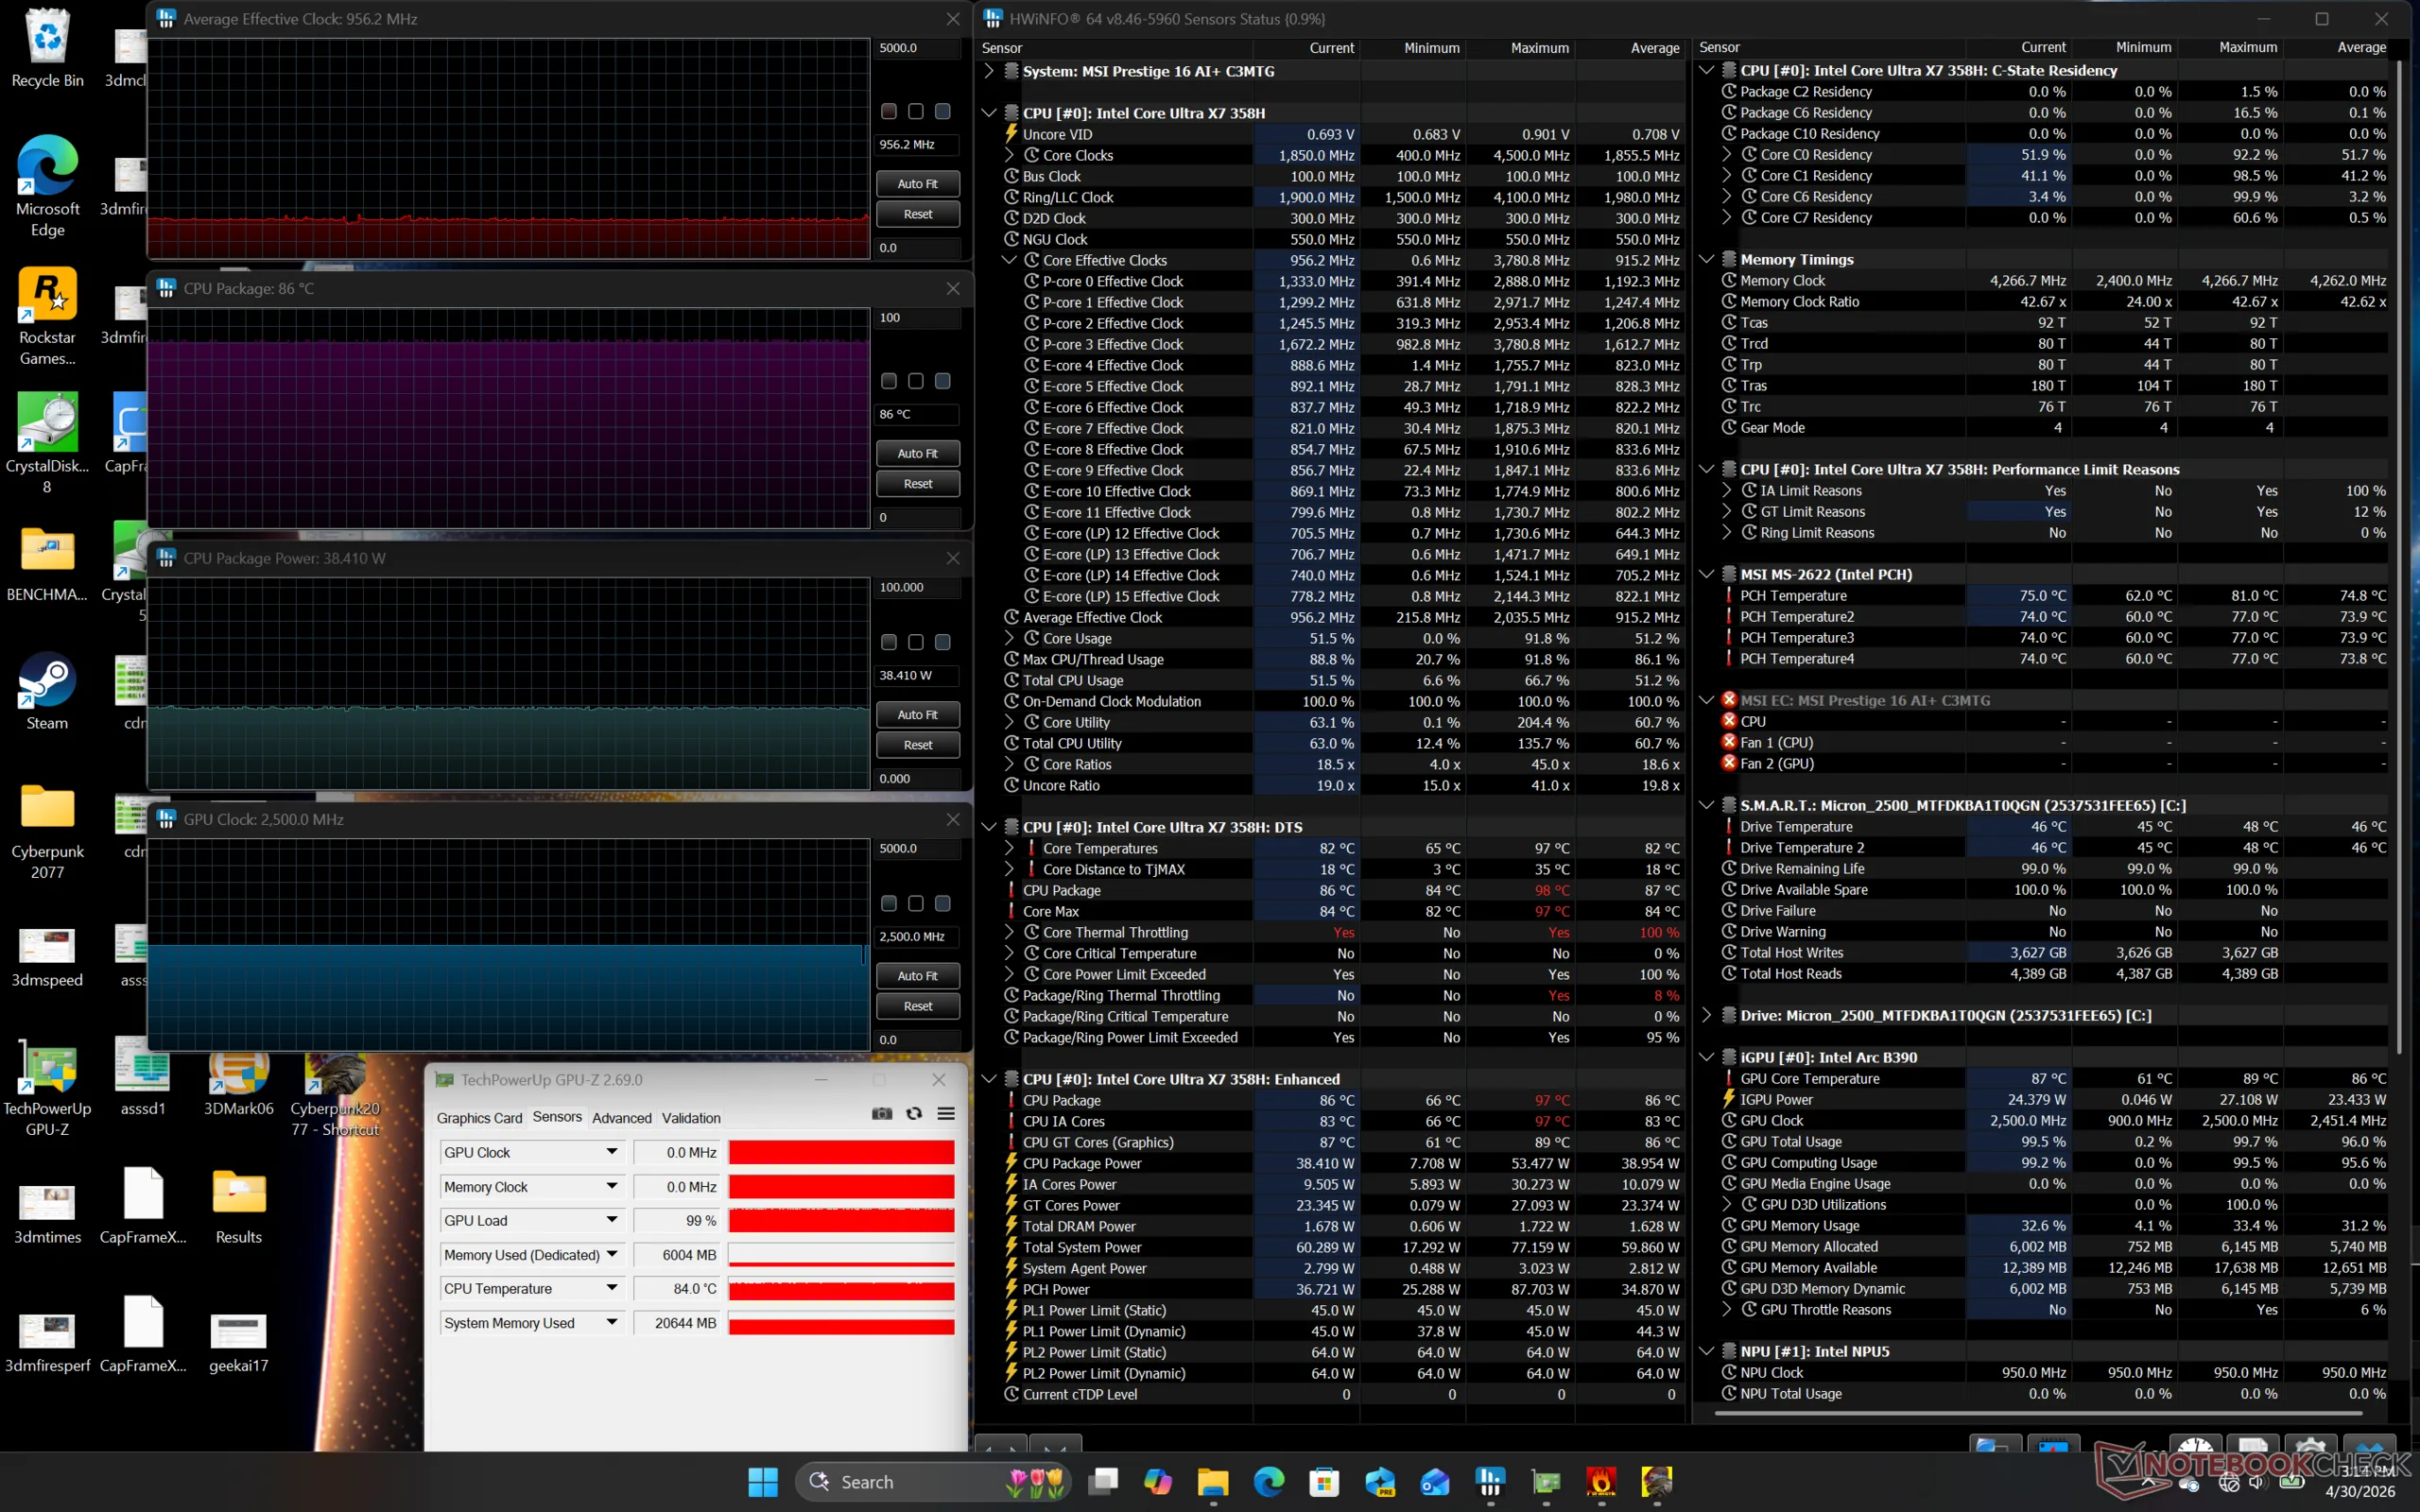
| Clock médio da CPU (GHz) | Clock da GPU (MHz) | Temperatura média da CPU (°C) | |
| Sistema inativo | -- | 900 | 41 |
| Estresse do Prime95 | 2.3 | -- | 90 |
| Prime95 + FurMark Stress | 1.8 | ~1350 | 90 |
| Estresse do Cyberpunk 2077 (modo balanceado) | 0,8 | 1220 - 1850 | 83 |
| Estresse do Cyberpunk 2077 (modo de desempenho) | 1.0 | 2500 | 86 |
Alto-falantes
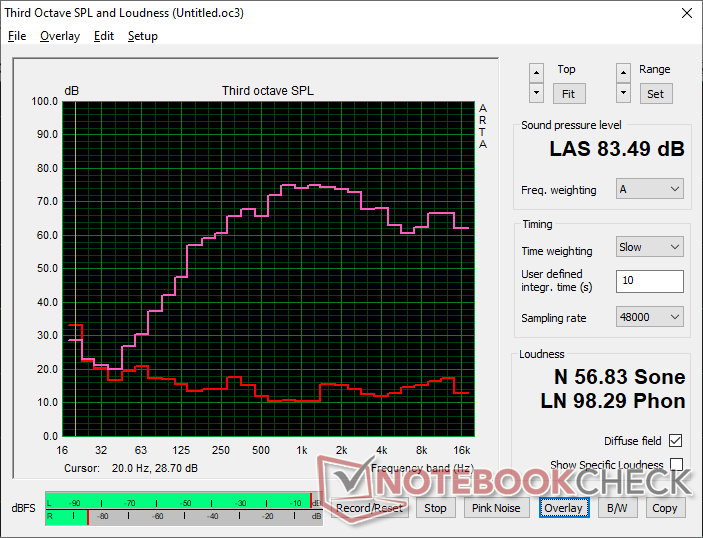
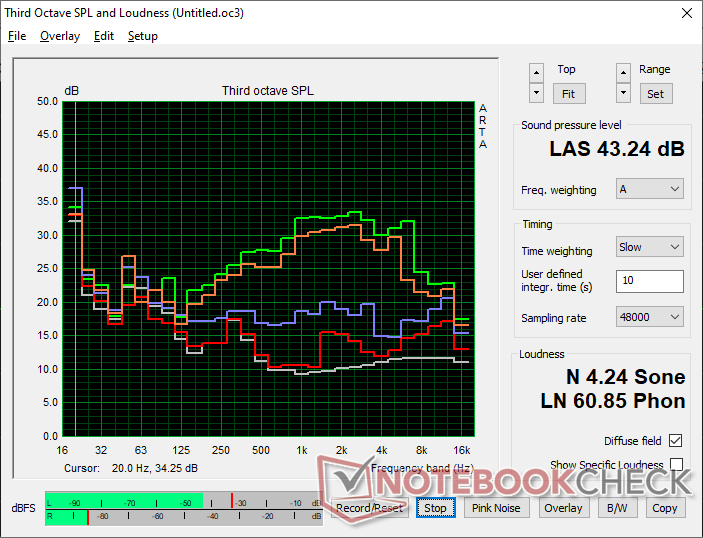
MSI Prestige 16 AI C3MTG análise de áudio
(+) | os alto-falantes podem tocar relativamente alto (###valor### dB)
Graves 100 - 315Hz
(±) | graves reduzidos - em média 11.2% menor que a mediana
(±) | a linearidade dos graves é média (9% delta para a frequência anterior)
Médios 400 - 2.000 Hz
(±) | médios mais altos - em média 5.9% maior que a mediana
(+) | médios são lineares (4% delta para frequência anterior)
Altos 2 - 16 kHz
(+) | agudos equilibrados - apenas 3.3% longe da mediana
(+) | os máximos são lineares (5.4% delta da frequência anterior)
Geral 100 - 16.000 Hz
(+) | o som geral é linear (12.8% diferença em relação à mediana)
Comparado com a mesma classe
» 24% de todos os dispositivos testados nesta classe foram melhores, 5% semelhantes, 71% piores
» O melhor teve um delta de 5%, a média foi 17%, o pior foi 45%
Comparado com todos os dispositivos testados
» 12% de todos os dispositivos testados foram melhores, 3% semelhantes, 85% piores
» O melhor teve um delta de 4%, a média foi 24%, o pior foi 134%
Apple MacBook Pro 16 2021 M1 Pro análise de áudio
(+) | os alto-falantes podem tocar relativamente alto (###valor### dB)
Graves 100 - 315Hz
(+) | bons graves - apenas 3.8% longe da mediana
(+) | o baixo é linear (5.2% delta para a frequência anterior)
Médios 400 - 2.000 Hz
(+) | médios equilibrados - apenas 1.3% longe da mediana
(+) | médios são lineares (2.1% delta para frequência anterior)
Altos 2 - 16 kHz
(+) | agudos equilibrados - apenas 1.9% longe da mediana
(+) | os máximos são lineares (2.7% delta da frequência anterior)
Geral 100 - 16.000 Hz
(+) | o som geral é linear (4.6% diferença em relação à mediana)
Comparado com a mesma classe
» 0% de todos os dispositivos testados nesta classe foram melhores, 0% semelhantes, 100% piores
» O melhor teve um delta de 5%, a média foi 17%, o pior foi 45%
Comparado com todos os dispositivos testados
» 0% de todos os dispositivos testados foram melhores, 0% semelhantes, 100% piores
» O melhor teve um delta de 4%, a média foi 24%, o pior foi 134%
Gerenciamento de energia
Consumo de energia
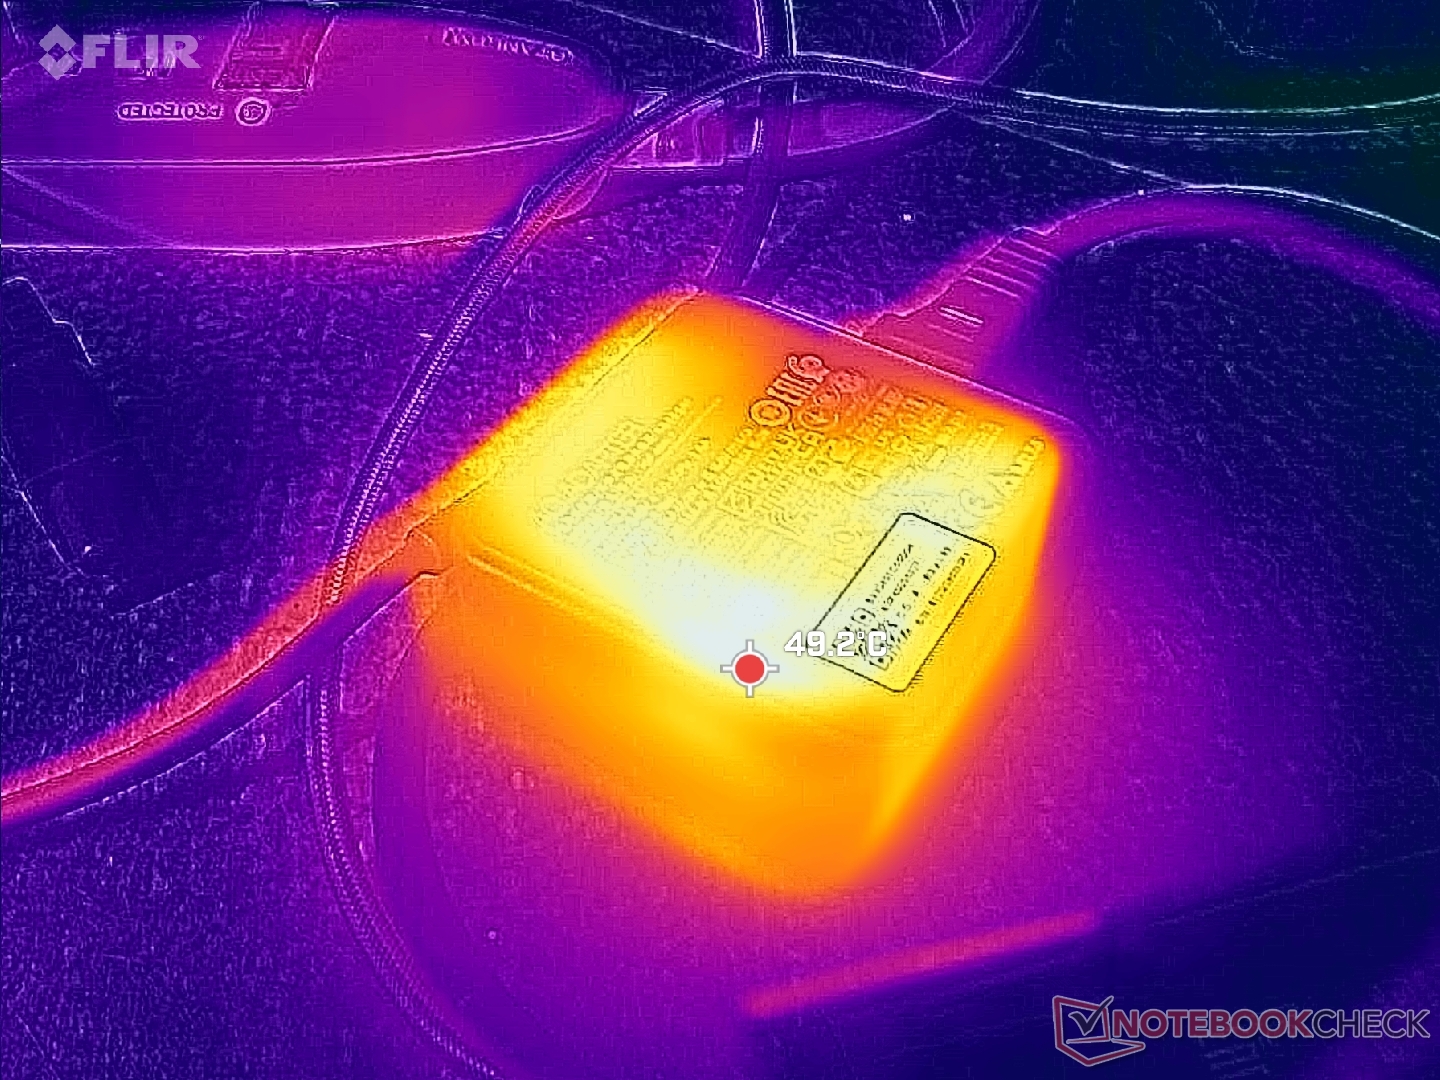
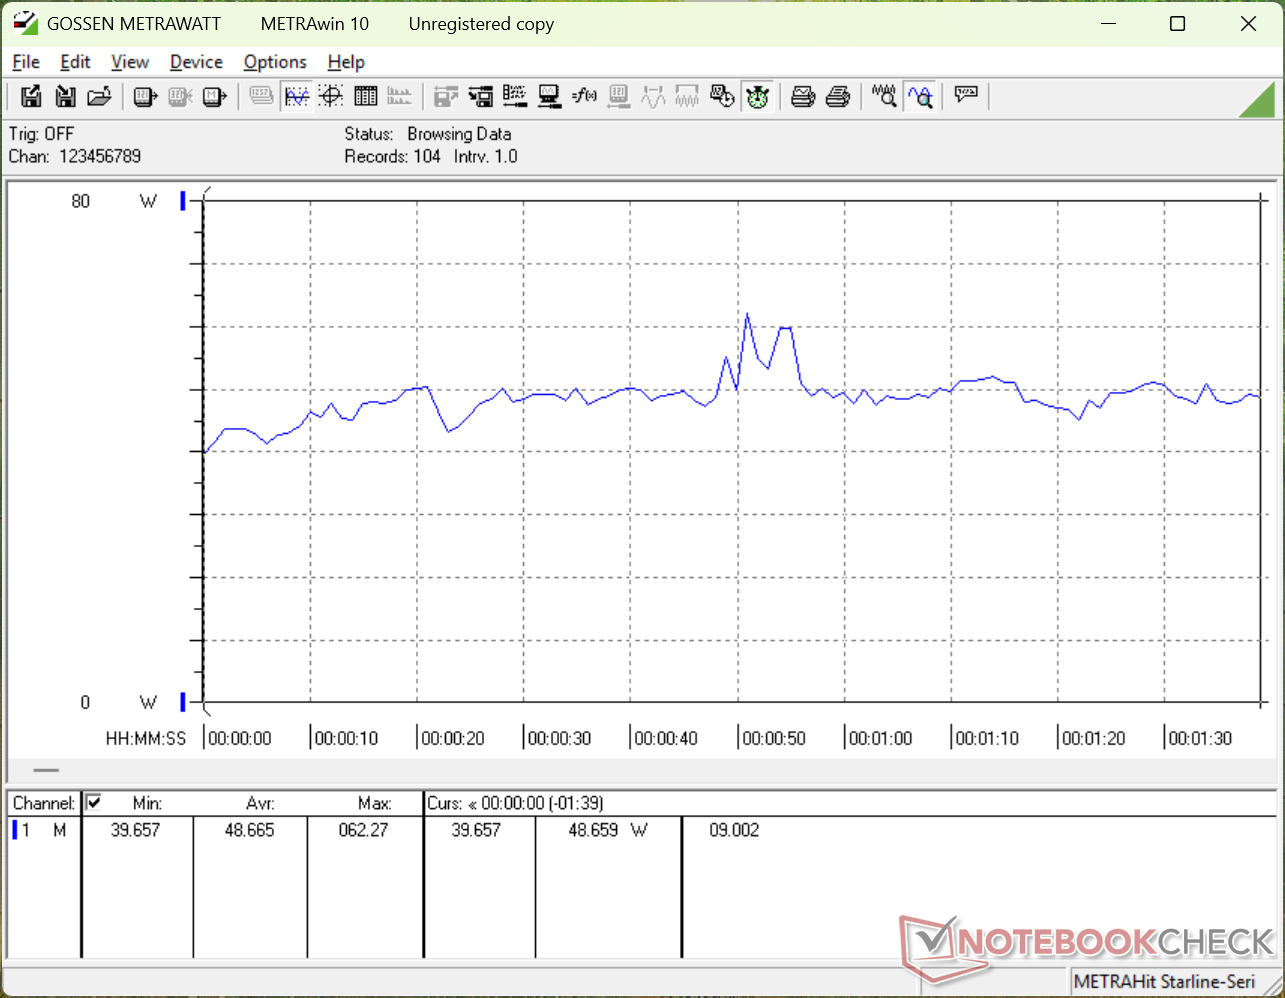
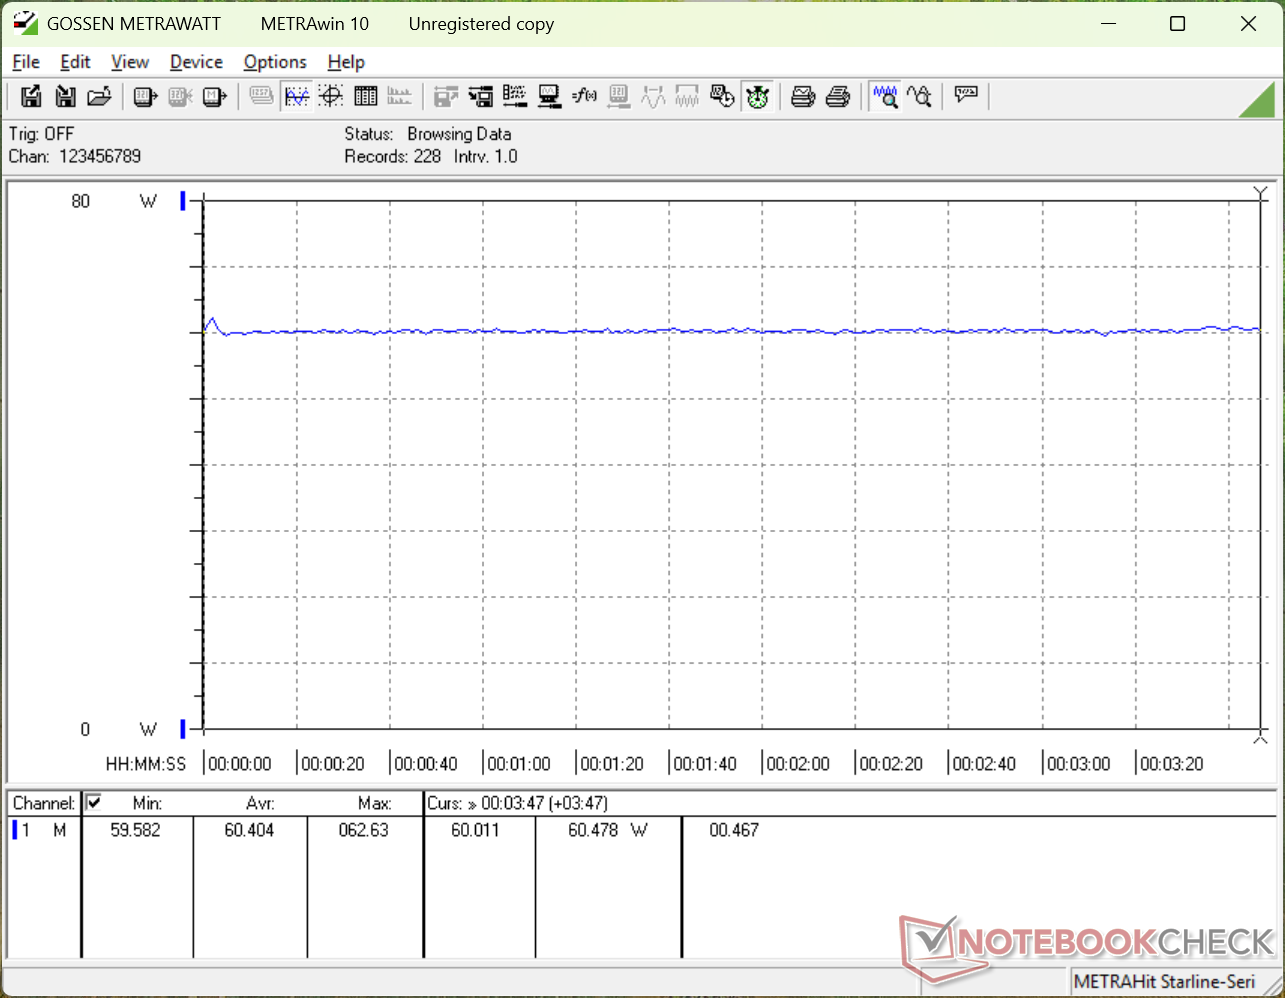
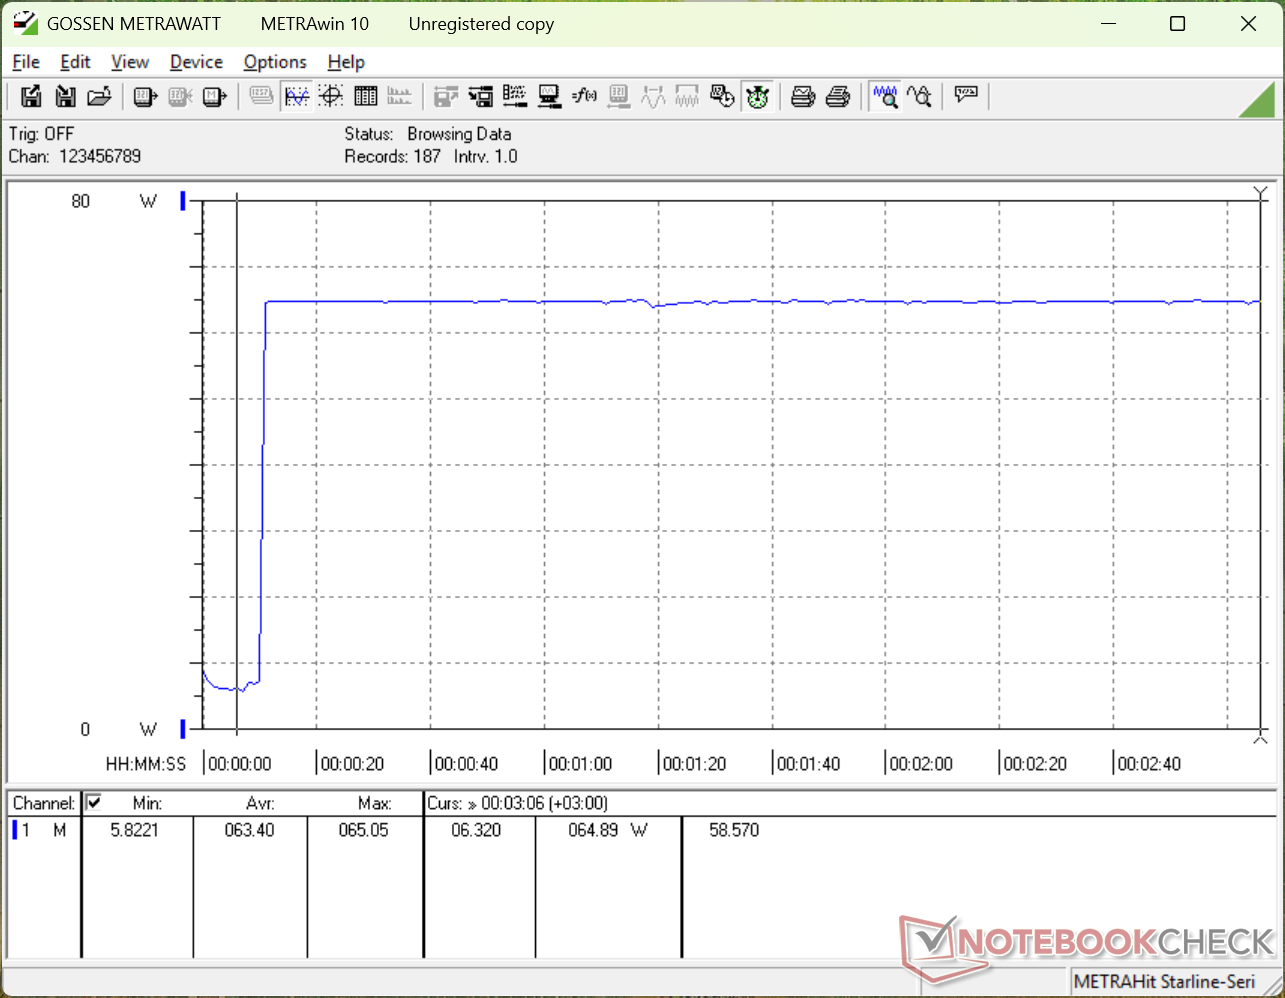
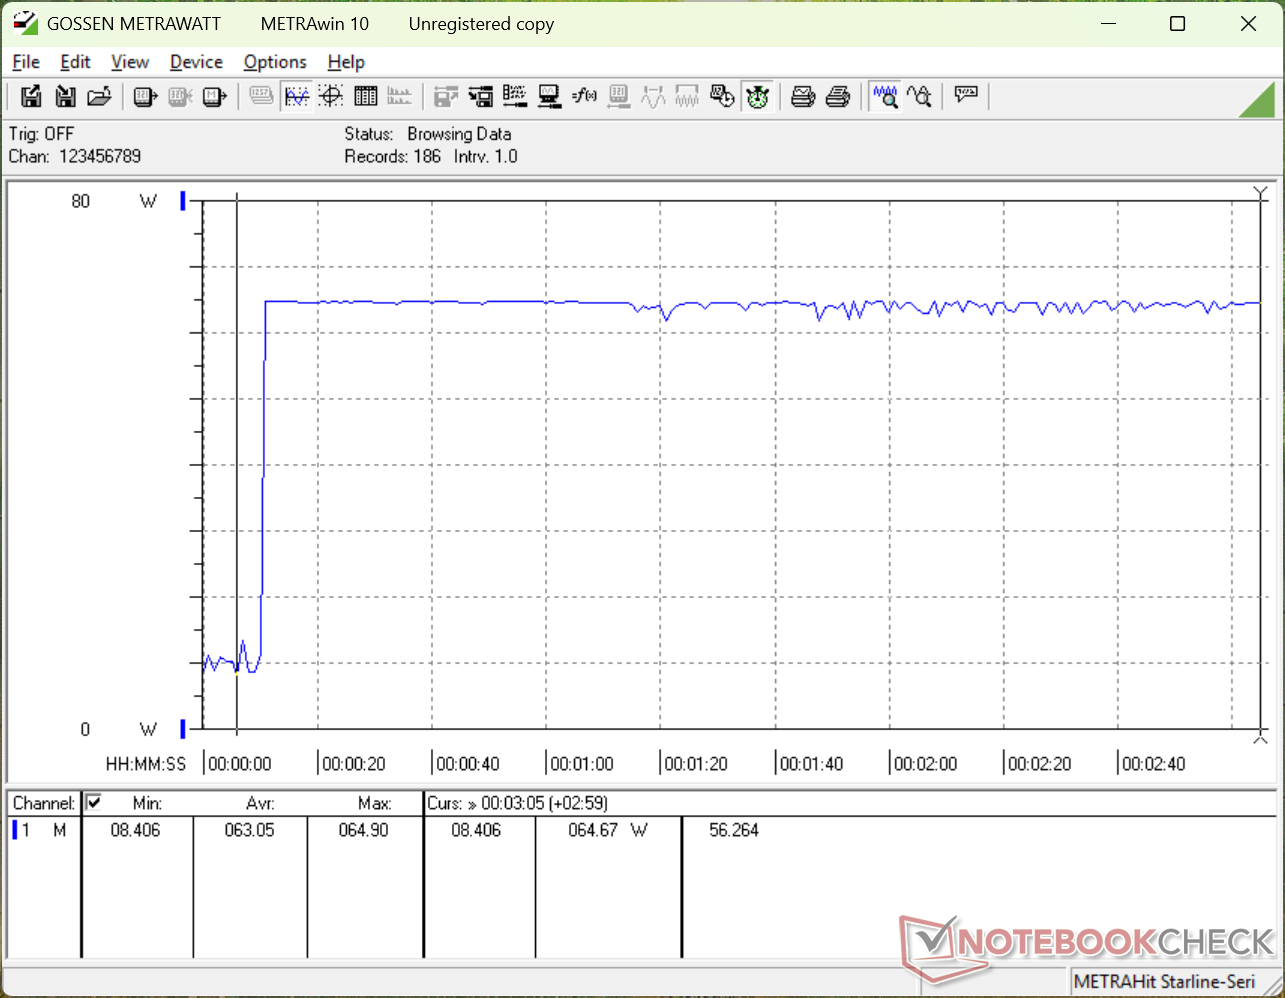
O modelo é fornecido com um adaptador CA USB-C menor, de 65 W (~6,5 x 6,5 x 3,0 cm), em vez do adaptador de 100 W fornecido com o modelo 2025. Apesar disso, o consumo geral entre os dois modelos é bastante semelhante, conforme mostram os gráficos abaixo. O desempenho por watt aumentou muito quando se trata de gráficos, pois o novo Prestige 16 é até 80% mais rápido, consumindo praticamente a mesma energia.
Uma consequência do adaptador CA menor, de 65 W, é o desempenho inferior do Turbo Boost. Ao executar o estresse do Prime95, por exemplo, o Prestige 16 2025 pode consumir até 103 W temporariamente, em comparação com apenas 66 W do nosso Prestige 16 2026. Portanto, o modelo mais antigo poderia superar ligeiramente o modelo mais novo em termos de desempenho bruto da CPU durante o primeiro minuto ou mais do teste de estresse, quando o Turbo Boost é mais eficaz.
Lembre-se de que as taxas de carregamento diminuem significativamente ao executar cargas exigentes simultaneamente, pois o adaptador CA de 65 W é indiscutivelmente insuficiente; a simples execução do Cyberpunk 2077 já consome mais de 60 W sozinho.
| desligado | |
| Ocioso | |
| Carga |
|
Key:
min: | |
| MSI Prestige 16 AI C3MTG Ultra X7 358H, Arc B390 Panther Lake iGPU, Micron 2500 1TB MTFDKBA1T0QGN, OLED, 2880x1800, 16" | MSI Prestige 16 AI Evo B2HMG Ultra 9 285H, Arc 140T, Micron 2500 1TB MTFDKBA1T0QGN, IPS, 2560x1600, 16" | Dell XPS 16 Core Ultra X7 358H Ultra X7 358H, Arc B390 Panther Lake iGPU, , OLED, 3200x2000, 16" | Asus ZenBook S16 UM5606GA Ryzen AI 9 465, Radeon 880M, SanDisk PC SN5100S, OLED, 2880x1800, 16" | Lenovo ThinkBook 16 G7+ AMD Ryzen AI 9 365, Radeon 880M, Samsung PM9C1a MZAL81T0HDLB, IPS, 3200x2000, 16" | HP Envy x360 2-in-1 16-ad0097nr R7 8840HS, Radeon 780M, KIOXIA BG5 KBG50ZNV1T02, OLED, 2880x1800, 16" | |
|---|---|---|---|---|---|---|
| Power Consumption | -22% | -0% | -2% | -55% | -10% | |
| Idle Minimum * (Watt) | 3.3 | 4.4 -33% | 4 -21% | 3.7 -12% | 6.4 -94% | 5 -52% |
| Idle Average * (Watt) | 7.4 | 9.2 -24% | 4.4 41% | 7.4 -0% | 14.1 -91% | 6.2 16% |
| Idle Maximum * (Watt) | 13 | 9.5 27% | 10.2 22% | 9.5 27% | 14.3 -10% | 14.7 -13% |
| Load Average * (Watt) | 48.7 | 66.9 -37% | 44.2 9% | 57.9 -19% | 83.4 -71% | 49.9 -2% |
| Cyberpunk 2077 ultra * (Watt) | 60.4 | 68.8 -14% | 62.6 -4% | 58.5 3% | 79.8 -32% | |
| Cyberpunk 2077 ultra external monitor * (Watt) | 60.4 | 67.4 -12% | 62.4 -3% | 57 6% | 77.5 -28% | |
| Load Maximum * (Watt) | 64.8 | 102.9 -59% | 94.6 -46% | 76.9 -19% | 102.9 -59% | 65 -0% |
| Witcher 3 ultra * (Watt) | 54.5 |
* ... menor é melhor
Consumo de energia Cyberpunk / Teste de estresse
Consumo de energia do monitor externo
Duração da bateria
Os tempos de execução estão mais curtos este ano, em parte devido à bateria menor (99 Wh vs. 81 Wh) e à mudança de IPS para OLED. No entanto, o impacto é ligeiramente compensado pelos ganhos de eficiência obtidos em outras partes do sistema. Conseguimos registrar um tempo de execução de WLAN de quase 13 horas, 3 a 4 horas a menos do que o modelo de 2025.
| MSI Prestige 16 AI C3MTG Ultra X7 358H, Arc B390 Panther Lake iGPU, 81 Wh | MSI Prestige 16 AI Evo B2HMG Ultra 9 285H, Arc 140T, 99.9 Wh | Dell XPS 16 Core Ultra X7 358H Ultra X7 358H, Arc B390 Panther Lake iGPU, 70 Wh | Asus ZenBook S16 UM5606GA Ryzen AI 9 465, Radeon 880M, 83 Wh | Lenovo ThinkBook 16 G7+ AMD Ryzen AI 9 365, Radeon 880M, 85 Wh | HP Envy x360 2-in-1 16-ad0097nr R7 8840HS, Radeon 780M, 68 Wh | |
|---|---|---|---|---|---|---|
| Duração da bateria | 31% | -18% | 4% | -14% | -39% | |
| WiFi v1.3 (h) | 12.6 | 16.5 31% | 10.3 -18% | 13.1 4% | 10.8 -14% | 7.7 -39% |
| H.264 (h) | 20.8 | 13.9 | ||||
| Load (h) | 2.4 | 1.9 | ||||
| Reader / Idle (h) | 15.6 |
Classificação do Notebookcheck
O MSI Prestige 16 2026 é um dos notebooks prosumer mais finos disponíveis com Intel Panther Lake, mas a concorrência é acirrada quando se trata de resolução de webcam, opções de tela e portas integradas.
MSI Prestige 16 AI C3MTG
- 05/07/2026 v8
Allen Ngo
 Total Sustainability Score:
 Concorrentes potenciais em comparação
Imagem | Modelo / Análises | Preço | Peso | Altura | Tela |
|---|---|---|---|---|---|
1. 86.4%  | MSI Prestige 16 AI C3MTG Intel Core Ultra X7 358H ⎘ Intel Arc B390 12 Xe3 Panther Lake iGPU ⎘ 32 GB Memória, 1024 GB SSD | Amazon: Preço de tabela: 2100 USD | 1.6 kg | 13.9 mm | 16.00" 2880x1800 212 PPI OLED |
2. 82.8%  | MSI Prestige 16 AI Evo B2HMG Intel Core Ultra 9 285H ⎘ Intel Arc Graphics 140T ⎘ 32 GB Memória, 1024 GB SSD | Amazon: 1. $1,479.00 MSI Prestige 16 AI+ Evo 16" ... 2. $1,397.87 MSI Prestige 14 AI+ EVO PRE1... 3. $1,199.00 msi Prestige A16 AI+ (2025) ... | 1.6 kg | 18.95 mm | 16.00" 2560x1600 189 PPI IPS |
3. 87.2%  | Dell XPS 16 Core Ultra X7 358H Intel Core Ultra X7 358H ⎘ Intel Arc B390 12 Xe3 Panther Lake iGPU ⎘ 32 GB Memória | Amazon: 1. $2,599.00 Dell Premium 16 (XPS 16 2025... 2. $1,977.99 Dell Premium 16 (Previously ... 3. $2,599.00 Dell Premium 16 (XPS 16 2025... Preço de tabela: 2350 USD | 1.7 kg | 14.62 mm | 16.00" 3200x2000 236 PPI OLED |
4. 86.6%  | Asus ZenBook S16 UM5606GA AMD Ryzen AI 9 465 ⎘ AMD Radeon 880M ⎘ 32 GB Memória, 1024 GB SSD | Amazon: Preço de tabela: 1799€ | 1.5 kg | 12.9 mm | 16.00" 2880x1800 212 PPI OLED |
5. 86.6%  | Lenovo ThinkBook 16 G7+ AMD AMD Ryzen AI 9 365 ⎘ AMD Radeon 880M ⎘ 32 GB Memória, 1024 GB SSD | Amazon: 1. $999.95 Lenovo ThinkBook 16 G7 Busin... 2. $1,199.99 Lenovo ThinkBook 16 G7 Busin... 3. $979.95 Oemgenuine Lenovo ThinkBook ... Preço de tabela: 1399€ | 1.9 kg | 16.9 mm | 16.00" 3200x2000 236 PPI IPS |
6. 87.2% v7 (old)  | HP Envy x360 2-in-1 16-ad0097nr AMD Ryzen 7 8840HS ⎘ AMD Radeon 780M ⎘ 16 GB Memória, 1024 GB SSD | Amazon: 1. $149.99 Replacement for HP Envy x360... 2. $256.99 Replacement for HP Envy x360... 3. $695.00 HP Envy x360 2-in-1 Laptop, ... Preço de tabela: 1300 USD | 1.8 kg | 18.3 mm | 16.00" 2880x1800 212 PPI OLED |
Transparência
A seleção dos dispositivos a serem analisados é feita pela nossa equipe editorial. A amostra de teste foi fornecida ao autor como empréstimo pelo fabricante ou varejista para fins desta revisão. O credor não teve influência nesta revisão, nem o fabricante recebeu uma cópia desta revisão antes da publicação. Não houve obrigação de publicar esta revisão. Como empresa de mídia independente, a Notebookcheck não está sujeita à autoridade de fabricantes, varejistas ou editores.
É assim que o Notebookcheck está testando
Todos os anos, o Notebookcheck analisa de forma independente centenas de laptops e smartphones usando procedimentos padronizados para garantir que todos os resultados sejam comparáveis. Desenvolvemos continuamente nossos métodos de teste há cerca de 20 anos e definimos padrões da indústria no processo. Em nossos laboratórios de teste, equipamentos de medição de alta qualidade são utilizados por técnicos e editores experientes. Esses testes envolvem um processo de validação em vários estágios. Nosso complexo sistema de classificação é baseado em centenas de medições e benchmarks bem fundamentados, o que mantém a objetividade.
