Notebookcheck Logo

Intel Core i7-14700K

Intel i7-14700K

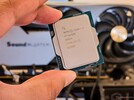
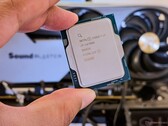
O Intel Core i5-14700K é um processador para desktop baseado na arquitetura Raptor Lake, que herda a 13ª geração de processadores Intel Core com pequenas melhorias. O processador oferece um clock base de 2,5 GHz ou 3,4 GHz e atinge até 5,6 GHz em Turbo. A estrutura básica da CPU permanece inalterada. Isso significa que o Intel Core i5-14700K também tem 8 núcleos P e 12 núcleos E, permitindo que até 28 threads sejam processados em paralelo. O Intel Core i5-14700K ainda oferece um multiplicador livremente selecionável, o que facilita muito o overclocking. Ele também é baseado no soquete LGA 1700, que já foi introduzido com o Alder Lake.

Desempenho

Em comparação com o Intel Core i5-13600K , o IPC do novo Core i5-14600K aumentou apenas ligeiramente. Isso significa que a diferença de desempenho também é pequena. A arquitetura híbrida conta com o Intel Thread Director, que é responsável pela alocação correta das tarefas. Como inovação adicional, o fabricante está contando cada vez mais com a IA, que também é usada para overclocking. Com um clique no Intel Extreme Utility, a ferramenta verifica todo o sistema e faz as configurações necessárias.

Unidade gráfica

Assim como o Intel Core i5-13700K, o Intel Core i5-14700K também tem uma unidade gráfica integrada. A arquitetura Intel Iris Xe continua a servir como base. Em termos de desempenho, no entanto, nada mudou com o Intel UHD Graphics 770.

Consumo de energia

O TDP do Intel Core i5-14700K é de 125 watts, com a opção de consumir até 253 watts no modo Turbo.

CodinomeRaptor Lake
SérieIntel Raptor Lake-R

Serie: Raptor Lake-R Raptor Lake

Intel Core i9-14900K3.2 - 6 GHz24 / 32 cores36 MB L3
Intel Core i7-14700K « 2.5 - 5.6 GHz20 / 28 cores33 MB L3
Intel Core i9-149002 - 5.8 GHz24 / 32 cores36 MB L3
Intel Core i7-147001.5 - 5.4 GHz20 / 28 cores33 MB L3
Intel Core i5-14600K3.5 - 5.3 GHz14 / 20 cores24 MB L3
Intel Core i5-145002.6 - 5 GHz14 / 20 cores24 MB L3
Intel Core i5-14500T1.7 - 4.8 GHz14 / 20 cores24 MB L3
Frequência2500 - 5600 MHz
Cache de Nível 228 MB
Cache de Nível 333 MB
Número de Núcelos / Subprocessos20 / 28
8 x 5.6 GHz Intel Raptor Cove P-Core
12 x 4.3 GHz Intel Gracemont E-Core
Consumo de Energia (TDP = Thermal Design Power)125 Watt
TDP Turbo PL2253 Watt
Tecnologia de Produção10 nm
Tempratura Máx.100 °C
ConectorLGA 1700
CaracterísticasIntel UHD Graphics 770, DDR5 5600 MT/s, DDR4 3200 MT/s
GPUIntel UHD Graphics 770 (300 - 1600 MHz)
64 BitSuporte para 64 Bit
Architecturex86
Preço Inicial$409 U.S.
Data do Anúncio10/17/2023
Link do Produto (externo)ark.intel.com

Benchmarks

Performance Rating - CB R15 + R20 + 7-Zip + X265 + Blender + 3DM11 CPU
47.6 pt (79%)
Cinebench 2024 - Cinebench 2024 CPU Single Core
min: 126     avg: 127     median: 127 (71%)     max: 127.9 Points
Cinebench 2024 - Cinebench 2024 CPU Multi Core
min: 1559     avg: 1771     median: 1770.5 (33%)     max: 1982 Points
Cinebench R23 - Cinebench R23 Multi Core
min: 30989     avg: 33441     median: 33440.5 (31%)     max: 35892 Points
202 -99%
...
28835 -14%
29289 -12%
29352 -12%
30428 -9%
30745 -8%
31070 -7%
32172 -4%
32782 -2%
33437 0%
Intel Core i7-14700K
33441
34133 2%
36291 9%
37310 12%
39400 18%
40924 22%
Intel Core Ultra 9 285K
42614 27%
AMD Ryzen Threadripper PRO 3975WX
42744 28%
AMD Ryzen Threadripper PRO 3995WX
61102 83%
107681 222%
0%
100%
Cinebench R23 - Cinebench R23 Single Core
min: 2153     avg: 2160     median: 2160 (92%)     max: 2167 Points
74.4 -97%
...
2044 -5%
2053 -5%
2064 -4%
2067 -4%
AMD Ryzen 7 9800X3D
2080 -4%
2081 -4%
2116 -2%
Intel Core Ultra 5 245K
2132 -1%
2151 0%
Intel Core i7-14700K
2160
2172 1%
2184 1%
2202 2%
2209 2%
2211 2%
2212 2%
2221 3%
2238 4%
2253 4%
...
Intel Core Ultra 9 285K
2348 9%
0%
100%
Cinebench R20 - Cinebench R20 CPU (Single Core)
min: 832     avg: 836     median: 836 (93%)     max: 840 Points
Cinebench R20 - Cinebench R20 CPU (Multi Core)
min: 11814     avg: 12743     median: 12743 (31%)     max: 13672 Points
Cinebench R15 - Cinebench R15 CPU Multi 64 Bit
min: 4611     avg: 5035     median: 5035 (32%)     max: 5459 Points
31 -99%
...
AMD Ryzen Threadripper 2970WX
4376 -13%
4431 -12%
4508 -10%
4522 -10%
4565 -9%
4724 -6%
4793 -5%
4818 -4%
5008 -1%
Intel Core i7-14700K
5035
5396 7%
5563 10%
5600 11%
5798 15%
5974 19%
6103 21%
6335 26%
Intel Core Ultra 9 285K
6492 29%
AMD Ryzen Threadripper PRO 3975WX
7053 40%
...
15842 215%
0%
100%
02755508251100137516501925220024752750302533003575385041254400467549505225Tooltip
Cinebench R15 - Cinebench R15 CPU Single 64 Bit
min: 313     avg: 313.5     median: 313.5 (88%)     max: 314 Points
19 -94%
...
302 -4%
303 -3%
303.6 -3%
305.1 -3%
305.6 -3%
305.9 -2%
307 -2%
308 -2%
311 -1%
Intel Core i7-14700K
313.5
313.7 0%
314.1 0%
315 0%
315 0%
315 0%
316 1%
Intel Core Ultra 5 245K
322 3%
322.2 3%
324.5 4%
...
Intel Core Ultra 9 285K
355.5 13%
0%
100%
Cinebench R11.5 - Cinebench R11.5 CPU Multi 64 Bit
min: 54.22     avg: 57.8     median: 57.8 (75%)     max: 61.44 Points
Cinebench R11.5 - Cinebench R11.5 CPU Single 64 Bit
min: 3.7     avg: 3.7     median: 3.7 (89%)     max: 3.77 Points
Cinebench R10 - Cinebench R10 Rend. Single (32bit)
min: 11745     avg: 11886     median: 11886 (72%)     max: 12027 pontos
Cinebench R10 - Cinebench R10 Rend. Multi (32bit)
min: 91081     avg: 91124     median: 91123.5 (66%)     max: 91166 pontos
Cinebench R10 - Cinebench R10 Rend. Multi (64bit)
min: 124651     avg: 130357     median: 130356 (83%)     max: 136062 Points
Cinebench R10 - Cinebench R10 Rend. Single (64bit)
min: 17400     avg: 17429     median: 17429 (21%)     max: 17458 Points
wPrime 2.10 - wPrime 2.0 1024m *
min: 50.891     avg: 80.3     median: 80.3 (1%)     max: 109.801 s
wPrime 2.10 - wPrime 2.0 32m *
min: 2.147     avg: 2.2     median: 2.2 (0%)     max: 2.252 s
WinRAR - WinRAR 4.0
min: 12800     avg: 12813     median: 12812.5 (20%)     max: 12825 pontos
7-Zip 18.03 - 7-Zip 18.03 Multi Thread 4 runs
min: 117224     avg: 126436     median: 126436 (73%)     max: 135648 MIPS
7-Zip 18.03 - 7-Zip 18.03 Single Thread 4 runs
min: 7040     avg: 7196     median: 7195.5 (85%)     max: 7351 MIPS
X264 HD Benchmark 4.0 - x264 Pass 2
min: 225.5     avg: 243.3     median: 243.3 (81%)     max: 261 fps
X264 HD Benchmark 4.0 - x264 Pass 1
min: 393.5     avg: 406.3     median: 406.3 (94%)     max: 419 fps
HWBOT x265 Benchmark v2.2 - HWBOT x265 4k Preset
min: 32.3     avg: 34.6     median: 34.6 (61%)     max: 36.8 fps
051015202530354045Tooltip
TrueCrypt - TrueCrypt Serpent
min: 2.2     avg: 2.4     median: 2.4 (71%)     max: 2.6 GB/s
TrueCrypt - TrueCrypt Twofish
min: 4.4     avg: 4.5     median: 4.5 (78%)     max: 4.6 GB/s
TrueCrypt - TrueCrypt AES
min: 18     avg: 21.8     median: 21.8 (57%)     max: 25.6 GB/s
Blender - Blender 3.3 Classroom CPU *
min: 155     avg: 181.5     median: 181.5 (2%)     max: 208 Seconds
Blender - Blender 2.79 BMW27 CPU *
min: 91     avg: 100     median: 100 (1%)     max: 109 Seconds
R Benchmark 2.5 - R Benchmark 2.5 *
min: 0.3788     avg: 0.4     median: 0.4 (8%)     max: 0.3826 sec
3DMark 06 - CPU - 3DMark 06 - CPU
min: 11741     avg: 16203     median: 16203 (34%)     max: 20665 Points
Super Pi mod 1.5 XS 1M - Super Pi mod 1.5 XS 1M *
min: 5.953     avg: 6     median: 6 (1%)     max: 5.98 s
Super Pi mod 1.5 XS 2M - Super Pi mod 1.5 XS 2M *
min: 12.844     avg: 12.9     median: 12.9 (1%)     max: 12.894 s
Super Pi Mod 1.5 XS 32M - Super Pi mod 1.5 XS 32M *
min: 305.942     avg: 311     median: 311 (1%)     max: 316.148 s
3DMark Vantage - 3DM Vant. Perf. CPU no Physx
96298 Points (74%)
3DMark 11 - 3DM11 Performance Physics
min: 28739     avg: 30538     median: 30537.5 (77%)     max: 32336 Points
3DMark - 3DMark Ice Storm Physics
82048 Points (67%)
3DMark - 3DMark Ice Storm Extreme Physics
81495 Points (66%)
3DMark - 3DMark Ice Storm Unlimited Physics
85692 Points (71%)
3DMark - 3DMark Cloud Gate Physics
23358 Points (59%)
3DMark - 3DMark Fire Strike Standard Physics
min: 40312     avg: 44727     median: 44727 (80%)     max: 49142 Points
3DMark - 3DMark Time Spy CPU
min: 15951     avg: 18746     median: 18746 (79%)     max: 21541 Points
Geekbench 6.3 - Geekbench 6.3 Single-Core
min: 2902     avg: 2922     median: 2922 (74%)     max: 2942 pontos
Geekbench 6.3 - Geekbench 6.3 Multi-Core
min: 18504     avg: 19147     median: 19147 (74%)     max: 19790 pontos
491 -97%
...
16817 -12%
16928 -12%
16957 -11%
16991 -11%
17394 -9%
17409 -9%
17564 -8%
Intel Core Ultra 5 245K
17575 -8%
AMD Ryzen 7 9800X3D
18074 -6%
Intel Core i7-14700K
19147
19249 1%
19688 3%
20380 6%
20422 7%
21254 11%
21326 11%
21383 12%
Intel Core Ultra 9 285K
21598 13%
22527 18%
...
25760 35%
0%
100%
Geekbench 5.5 - Geekbench 5.1 - 5.5 64 Bit Single-Core
min: 2092     avg: 2107     median: 2106.5 (82%)     max: 2121 pontos
Geekbench 5.5 - Geekbench 5.1 - 5.5 64 Bit Multi-Core
min: 19971     avg: 21565     median: 21565 (39%)     max: 23159 pontos
Geekbench 5.0 - Geekbench 5.0 64 Bit Single-Core
min: 2039     avg: 2042     median: 2042 (9%)     max: 2045 pontos
Geekbench 5.0 - Geekbench 5.0 64 Bit Multi-Core
min: 19766     avg: 21261     median: 21261 (67%)     max: 22756 pontos
Geekbench 4.4 - Geekbench 4.1 - 4.4 64 Bit Single-Core
min: 8874     avg: 9089     median: 9089 (91%)     max: 9304 pontos
Geekbench 4.4 - Geekbench 4.1 - 4.4 64 Bit Multi-Core
min: 72062     avg: 75782     median: 75781.5 (76%)     max: 79501 pontos
Mozilla Kraken 1.1 - Kraken 1.1 Total Score *
min: 439     avg: 439.5     median: 439.5 (1%)     max: 440 ms
WebXPRT 4 - WebXPRT 4 Score
min: 303     avg: 308.5     median: 308.5 (86%)     max: 314 Points
WebXPRT 3 - WebXPRT 3 Score
min: 311     avg: 325     median: 325 (60%)     max: 339 Points
CrossMark - CrossMark Overall
min: 2194     avg: 2241     median: 2241 (86%)     max: 2288 Points
Power Consumption - Prime95 Power Consumption - external Monitor *
min: 191.9     avg: 296     median: 296 (51%)     max: 400 Watt
0255075100125150175200225250275300325350375400425Tooltip
Power Consumption - Cinebench R15 Multi Power Consumption - external Monitor *
min: 287     avg: 357.5     median: 357.5 (65%)     max: 428 Watt
0255075100125150175200225250275300325350375400425Tooltip
Power Consumption - Idle Power Consumption - external Monitor *
min: 22.4     avg: 63.6     median: 63.6 (42%)     max: 104.8 Watt
0102030405060708090100110Tooltip
Power Consumption - Cinebench R15 Multi Power Efficiency - external Monitor
min: 12.8     avg: 14.5     median: 14.5 (11%)     max: 16.1 Points per Watt
- Gama de valores benchmark para essa solução gráfica
red legend - Média de valores benchmark para essa solução gráfica
* Smaller numbers mean a higher performance

v1.28
log 10. 20:17:33

#0 ran 0s before starting gpusingle class +0s ... 0s

#1 no ids found in url (should be separated by "_") +0s ... 0s

#2 not redirecting to Ajax server +0s ... 0s

#3 did not recreate cache, as it is less than 5 days old! Created at Tue, 10 Dec 2024 05:30:09 +0100 +0.001s ... 0.001s

#4 no comparison url found in template nbc.compare_page_2 needed +0.01s ... 0.011s

#5 no comparison url found in template nbc.compare_page_2 needed +0s ... 0.011s

#6 no comparison url found in template nbc.compare_page_2 needed +0s ... 0.011s

#7 no comparison url found in template nbc.compare_page_2 needed +0s ... 0.011s

#8 no comparison url found in template nbc.compare_page_2 needed +0s ... 0.012s

#9 no comparison url found in template nbc.compare_page_2 needed +0s ... 0.012s

#10 composed specs +0.001s ... 0.013s

#11 did output specs +0s ... 0.013s

#12 getting avg benchmarks for device 16391 +0.019s ... 0.031s

#13 got single benchmarks 16391 +0.012s ... 0.043s

#14 got avg benchmarks for devices +0s ... 0.043s

#15 min, max, avg, median took s +1.142s ... 1.185s

#16 no comparison url found in template nbc.compare_page_2 needed +0s ... 1.185s

#17 return log +0s ... 1.185s

Please share our article, every link counts!
Mail Logo

» Comparação de CPUs Móveis
Comparação de todas as séries de CPUs móveis

» Processadores Móveis - Benchmarklist
Benchmarklist de todos os CPUs conhecidos que são usados em portáteis (CPUs de desktop e laptop)

Outras CPUs da série Raptor Lake-R

» Intel Core i9-14900K
   24x 3.2 GHz - 6 GHz
» Intel Core i7-14700K
   20x 2.5 GHz - 5.6 GHz
» Intel Core i9-14900
   24x 2 GHz - 5.8 GHz
» Intel Core i7-14700
   20x 1.5 GHz - 5.4 GHz
» Intel Core i5-14600K
   14x 3.5 GHz - 5.3 GHz
» Intel Core i5-14500
   14x 2.6 GHz - 5 GHz
» Intel Core i5-14500T
   14x 1.7 GHz - 4.8 GHz

CPUs de ao redor

+ Intel Core i9-14900K
   24x 3.2 GHz - 6 GHz
+ AMD Ryzen 9 7950X
   16x 4.5 GHz - 5.7 GHz
+ Intel Core i9-13900K
   24x 3 GHz - 5.8 GHz
+ AMD Ryzen 9 7950X3D
   16x 4.2 GHz - 5.7 GHz
+ AMD Ryzen 9 9900X
   12x 4.4 GHz - 5.6 GHz
» Intel Core i7-14700K
   20x 2.5 GHz - 5.6 GHz
- AMD Ryzen 9 7900X
   12x 4.7 GHz - 5.6 GHz
- Intel Core i7-13700K
   16x 3.4 GHz - 5.4 GHz
- AMD Ryzen Threadripper PRO 3975WX
   32x 3.5 GHz - 4.2 GHz
- Intel Core i9-14900
   24x 2 GHz - 5.8 GHz
- Intel Core i7-14700
   20x 1.5 GHz - 5.4 GHz
> Análises e revisões de portáteis e celulares > FAQ/Técnica > Processadores de Notebook > Intel Raptor Lake-R i7-14700K Notebook Processor
Klaus Hinum (Update: 2024-01- 9)