
Veredicto - Pequeno, direto e profissional
O NucBox K16 é definido por seu processador. Embora tenha o mesmo chassi excelente que o conceituado EVO-X1a CPU Zen 3+ mais antiga do NucBox K16 significa que o sistema foi projetado para usuários com orçamentos mais apertados que podem valorizar os recursos físicos ou as portas do chassi, mas não precisam necessariamente do alto desempenho de um processador Zen 5. Para tarefas mais básicas de escritório, remotas ou relacionadas a servidores, o NucBox K16 não exagera nos recursos para proporcionar uma experiência de usuário mais simples.
Esse mesmo processador Zen 3+ também é responsável por muitas desvantagens do sistema. A CPU antiga mostra suas limitações ao analisar o consumo de energia, pois o desempenho por watt não é nem de longe tão alto quanto algumas das alternativas mais recentes da Intel, incluindo o próprio NucBox K13. O desempenho gráfico também é mais lento do que a média, mesmo para uma solução integrada.
Se a porta Oculink não tiver valor para suas cargas de trabalho, o NucBox K13, com preço semelhante, pode ser uma opção muito mais eficiente do que o K16, devido ao seu processador mais novo e à aparência mais fina. O MSI Cubi NUC também está disponível com níveis de desempenho semelhantes, mas com porta Thunderbolt 4 integrada em vez de Oculink.
Pro
Contra
Preço e disponibilidade
O NucBox K16 já está sendo vendido na Amazon com 32 GB de RAM e 512 GB de SSD por US$ 900 ou US$ 680 se comprado diretamente do fabricante.
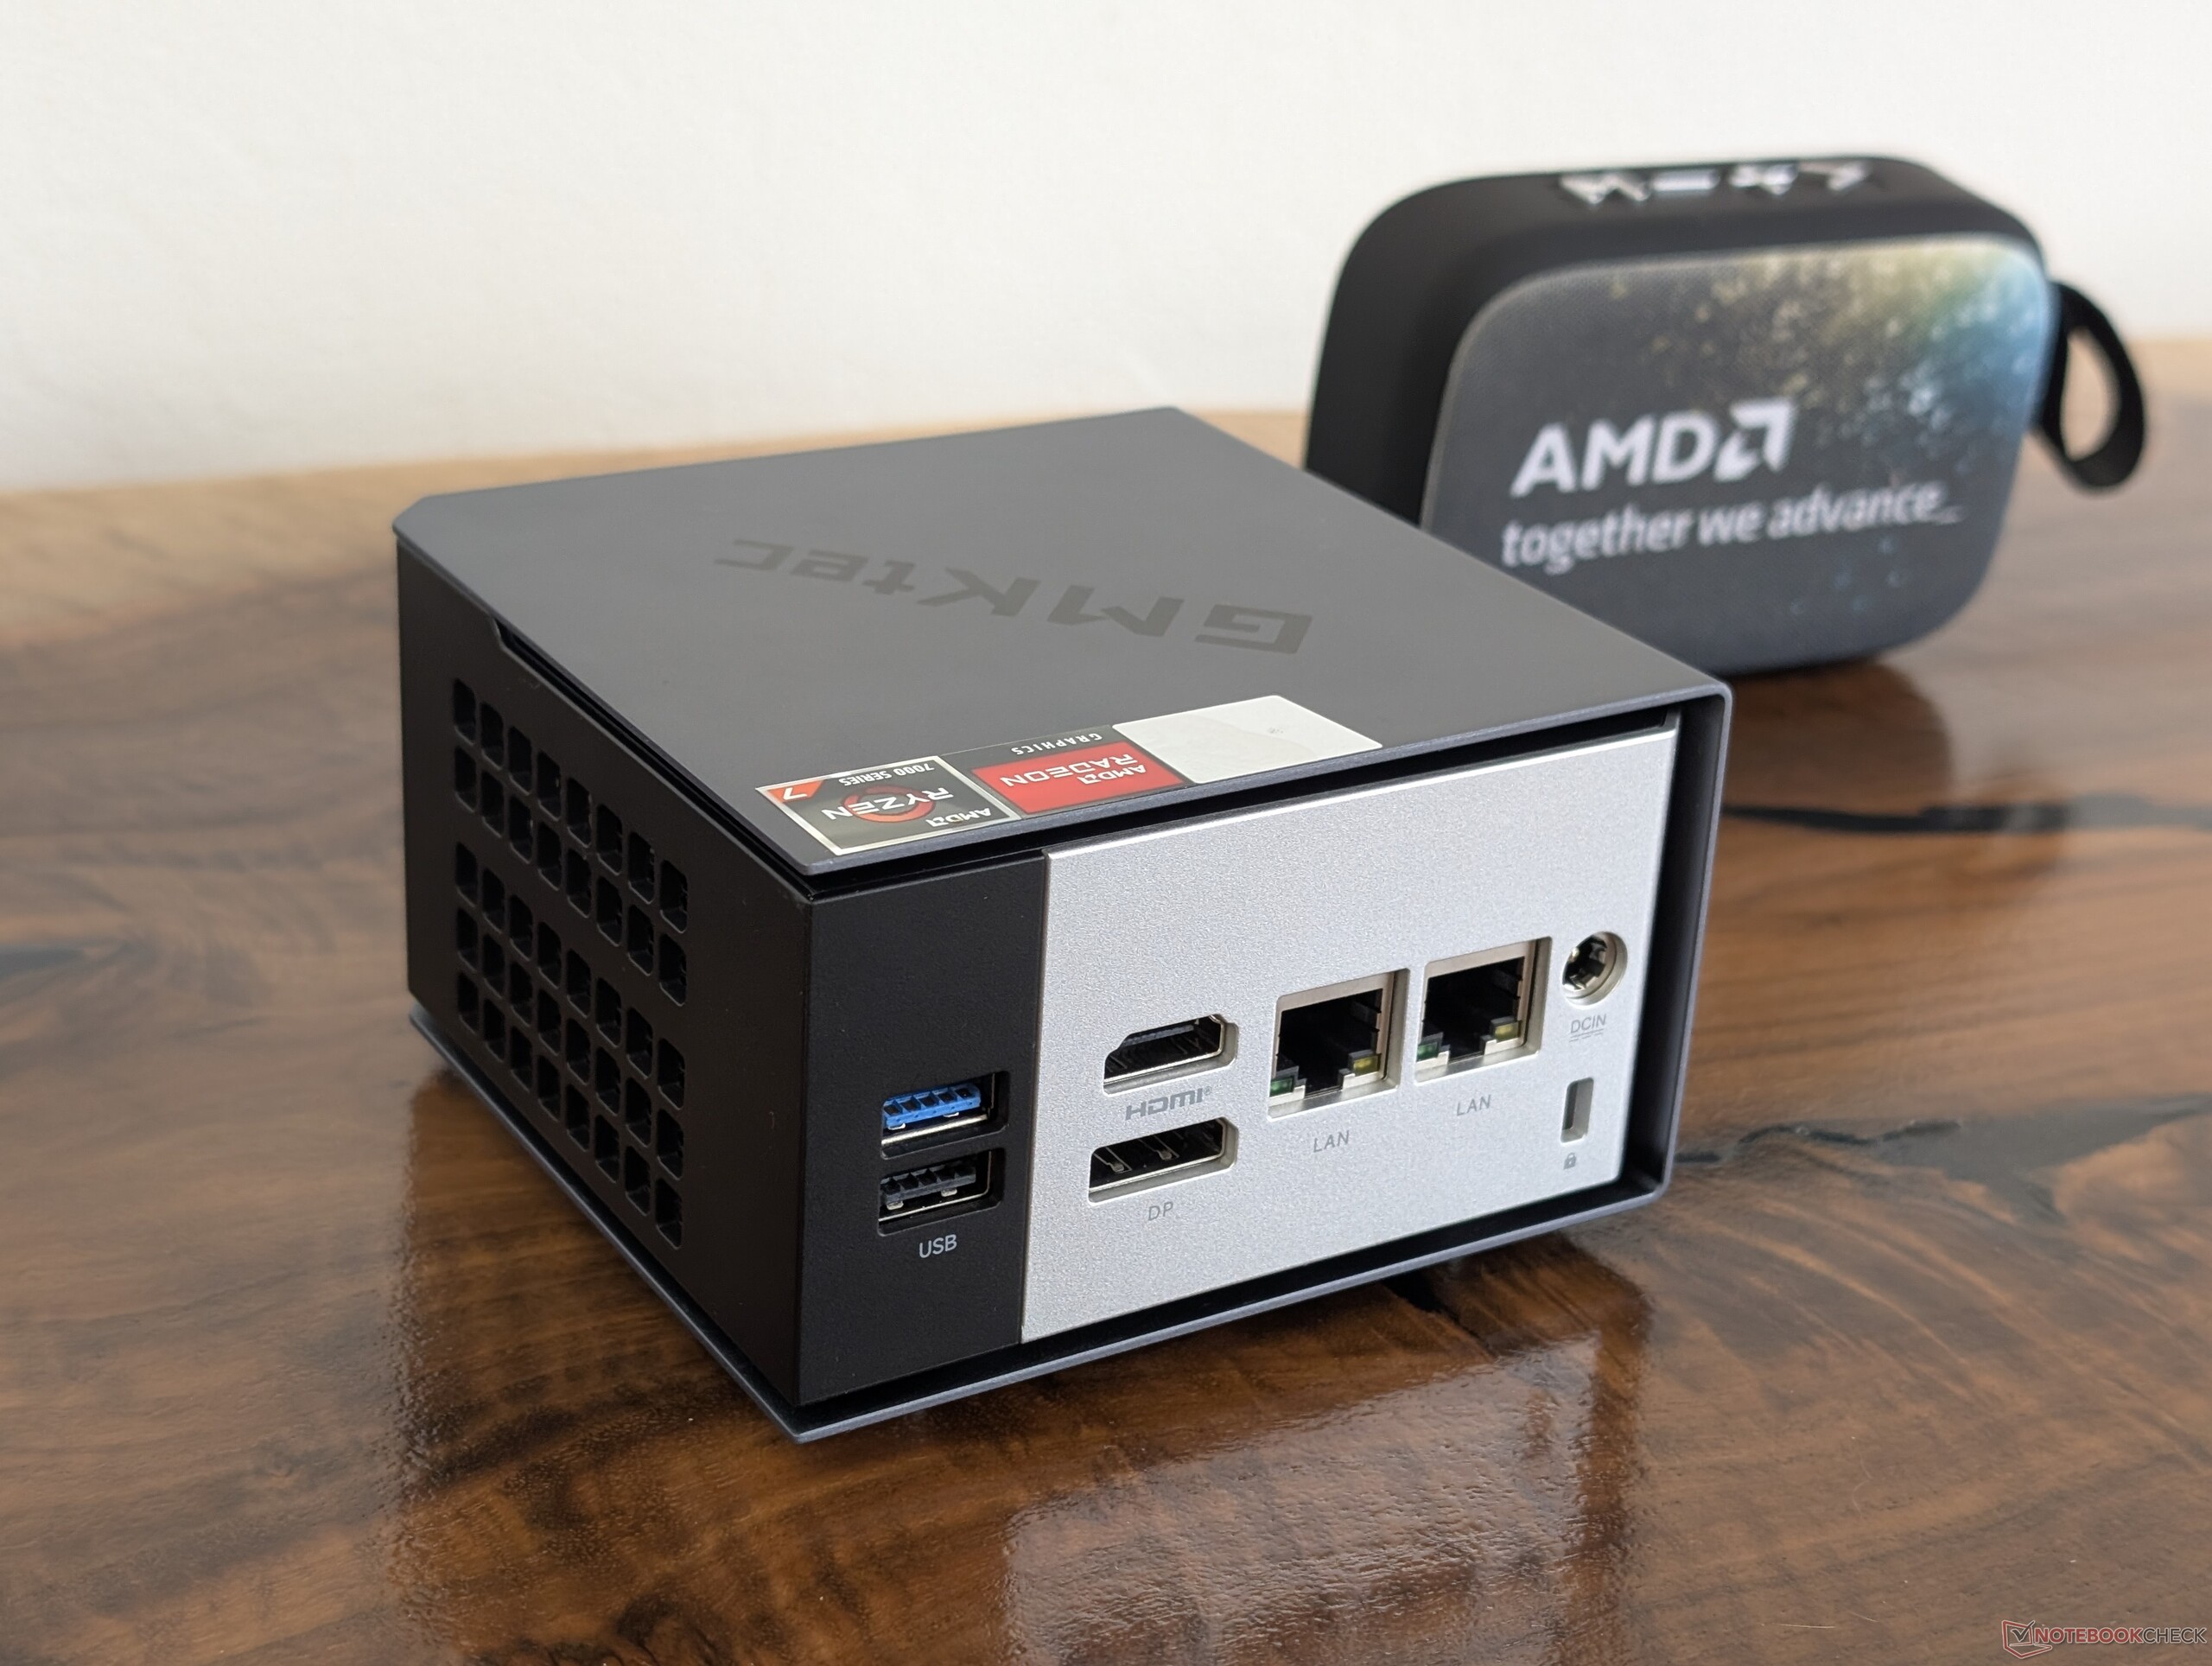
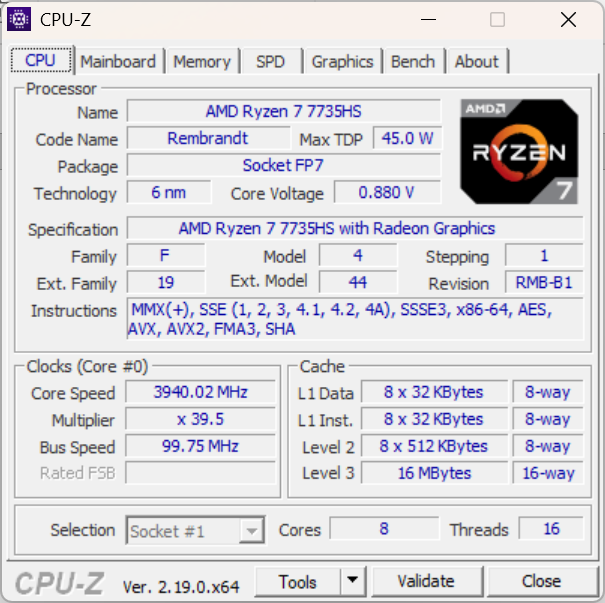
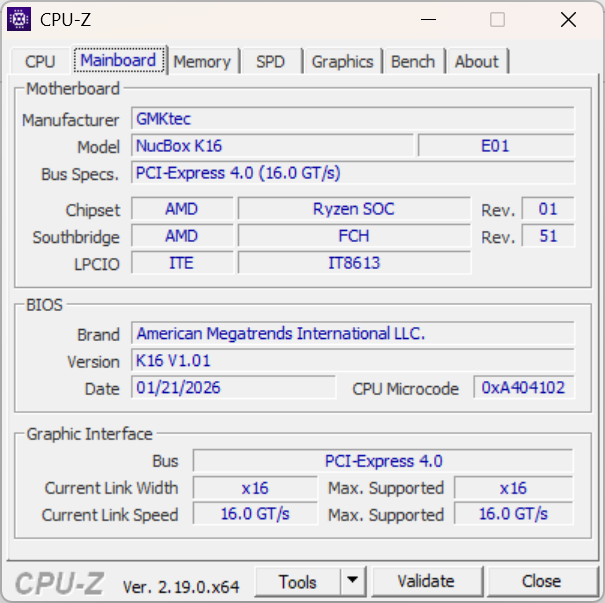
O NucBox K16 é o mais recente minicomputador da GMktec, voltado mais para profissionais do que para usuários de HTPC, devido à porta Oculink integrada. Observe que, embora o K16 seja tecnicamente um dos modelos mais novos da GMK, ele não é necessariamente melhor ou mais rápido do que o K15 ou modelos anteriores, pois o nome "K" não tem relação com o tipo de processador interno.
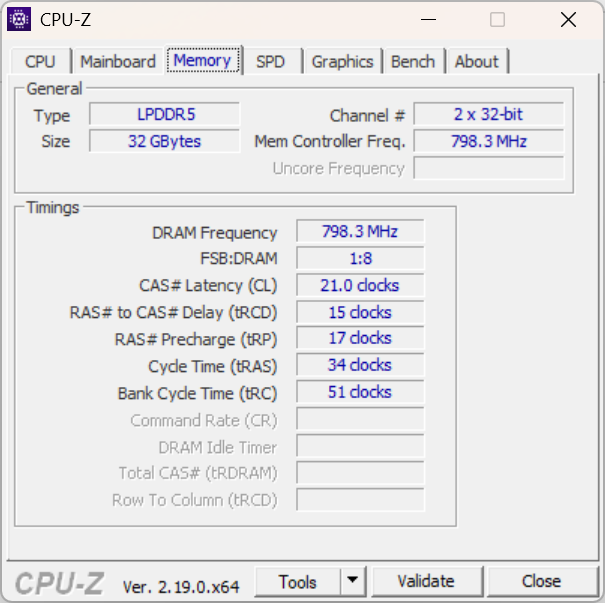
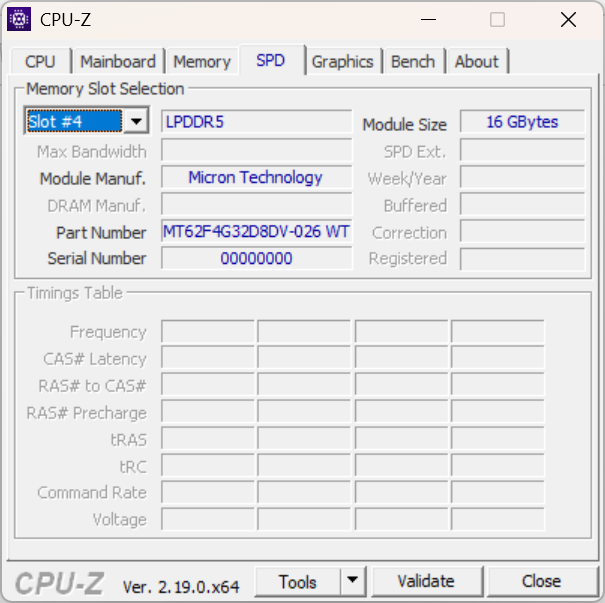
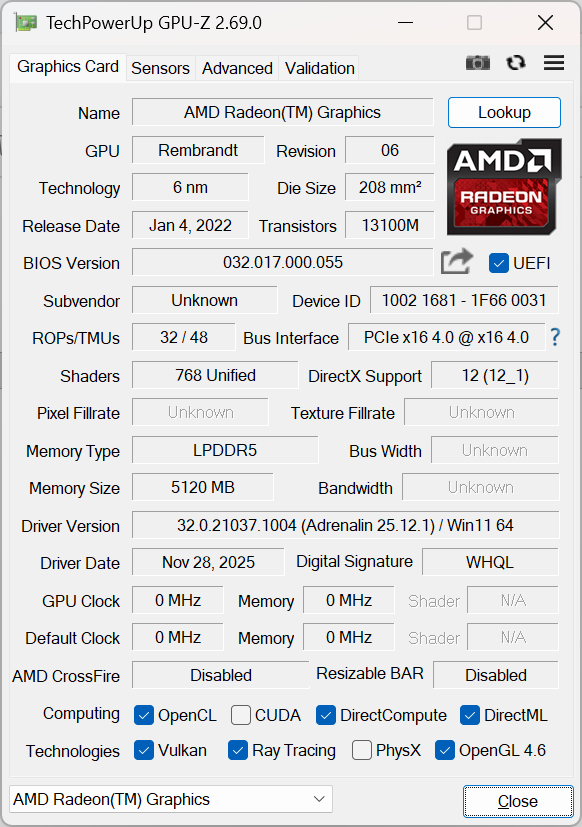
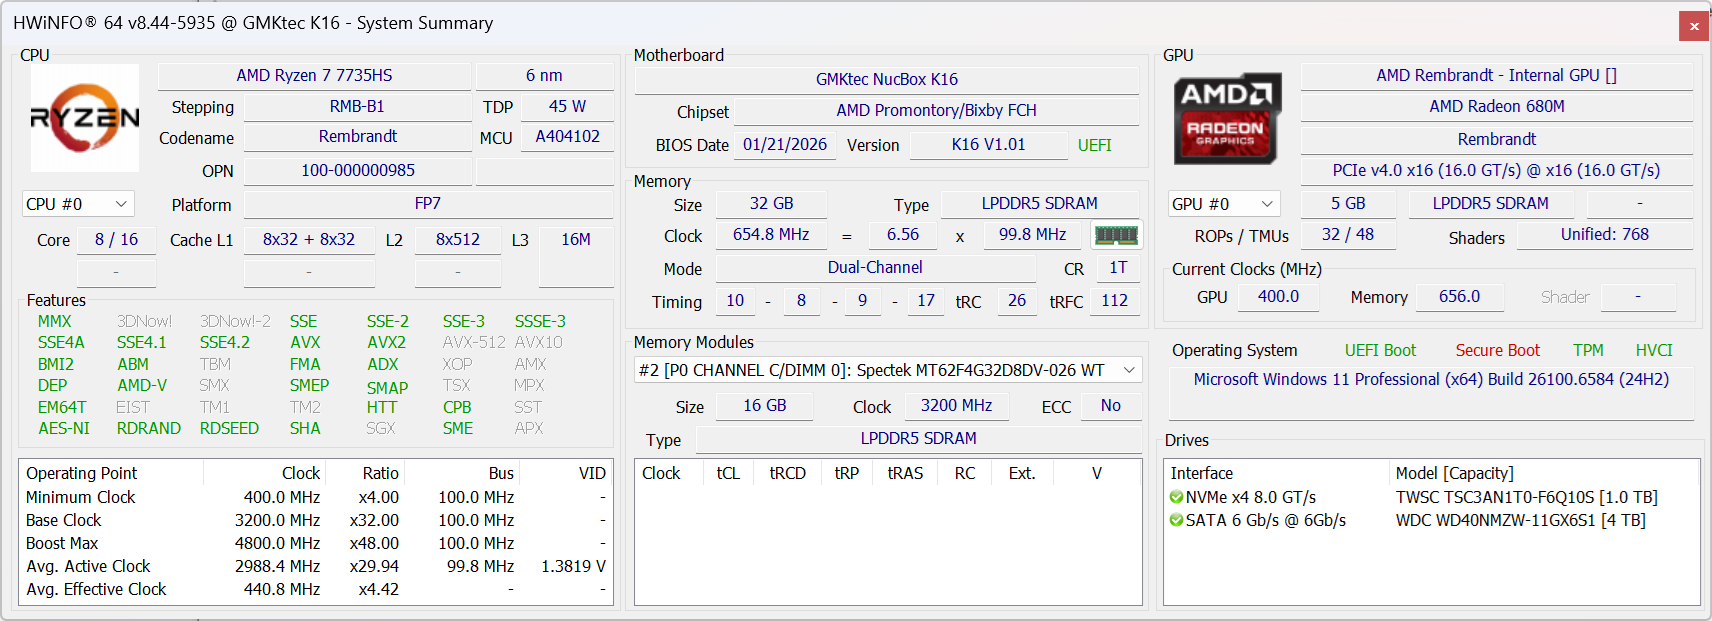
Apenas uma configuração principal está disponível no momento com a CPU Ryzen 7 7735HS, 32 GB de RAM e SSD de 512 GB. Outras configurações podem dobrar o armazenamento, mas a memória soldada de 32 GB e a CPU Zen 3+ mais antiga permanecem as mesmas.
Mais análises da GMKtec:
Especificações
Caso
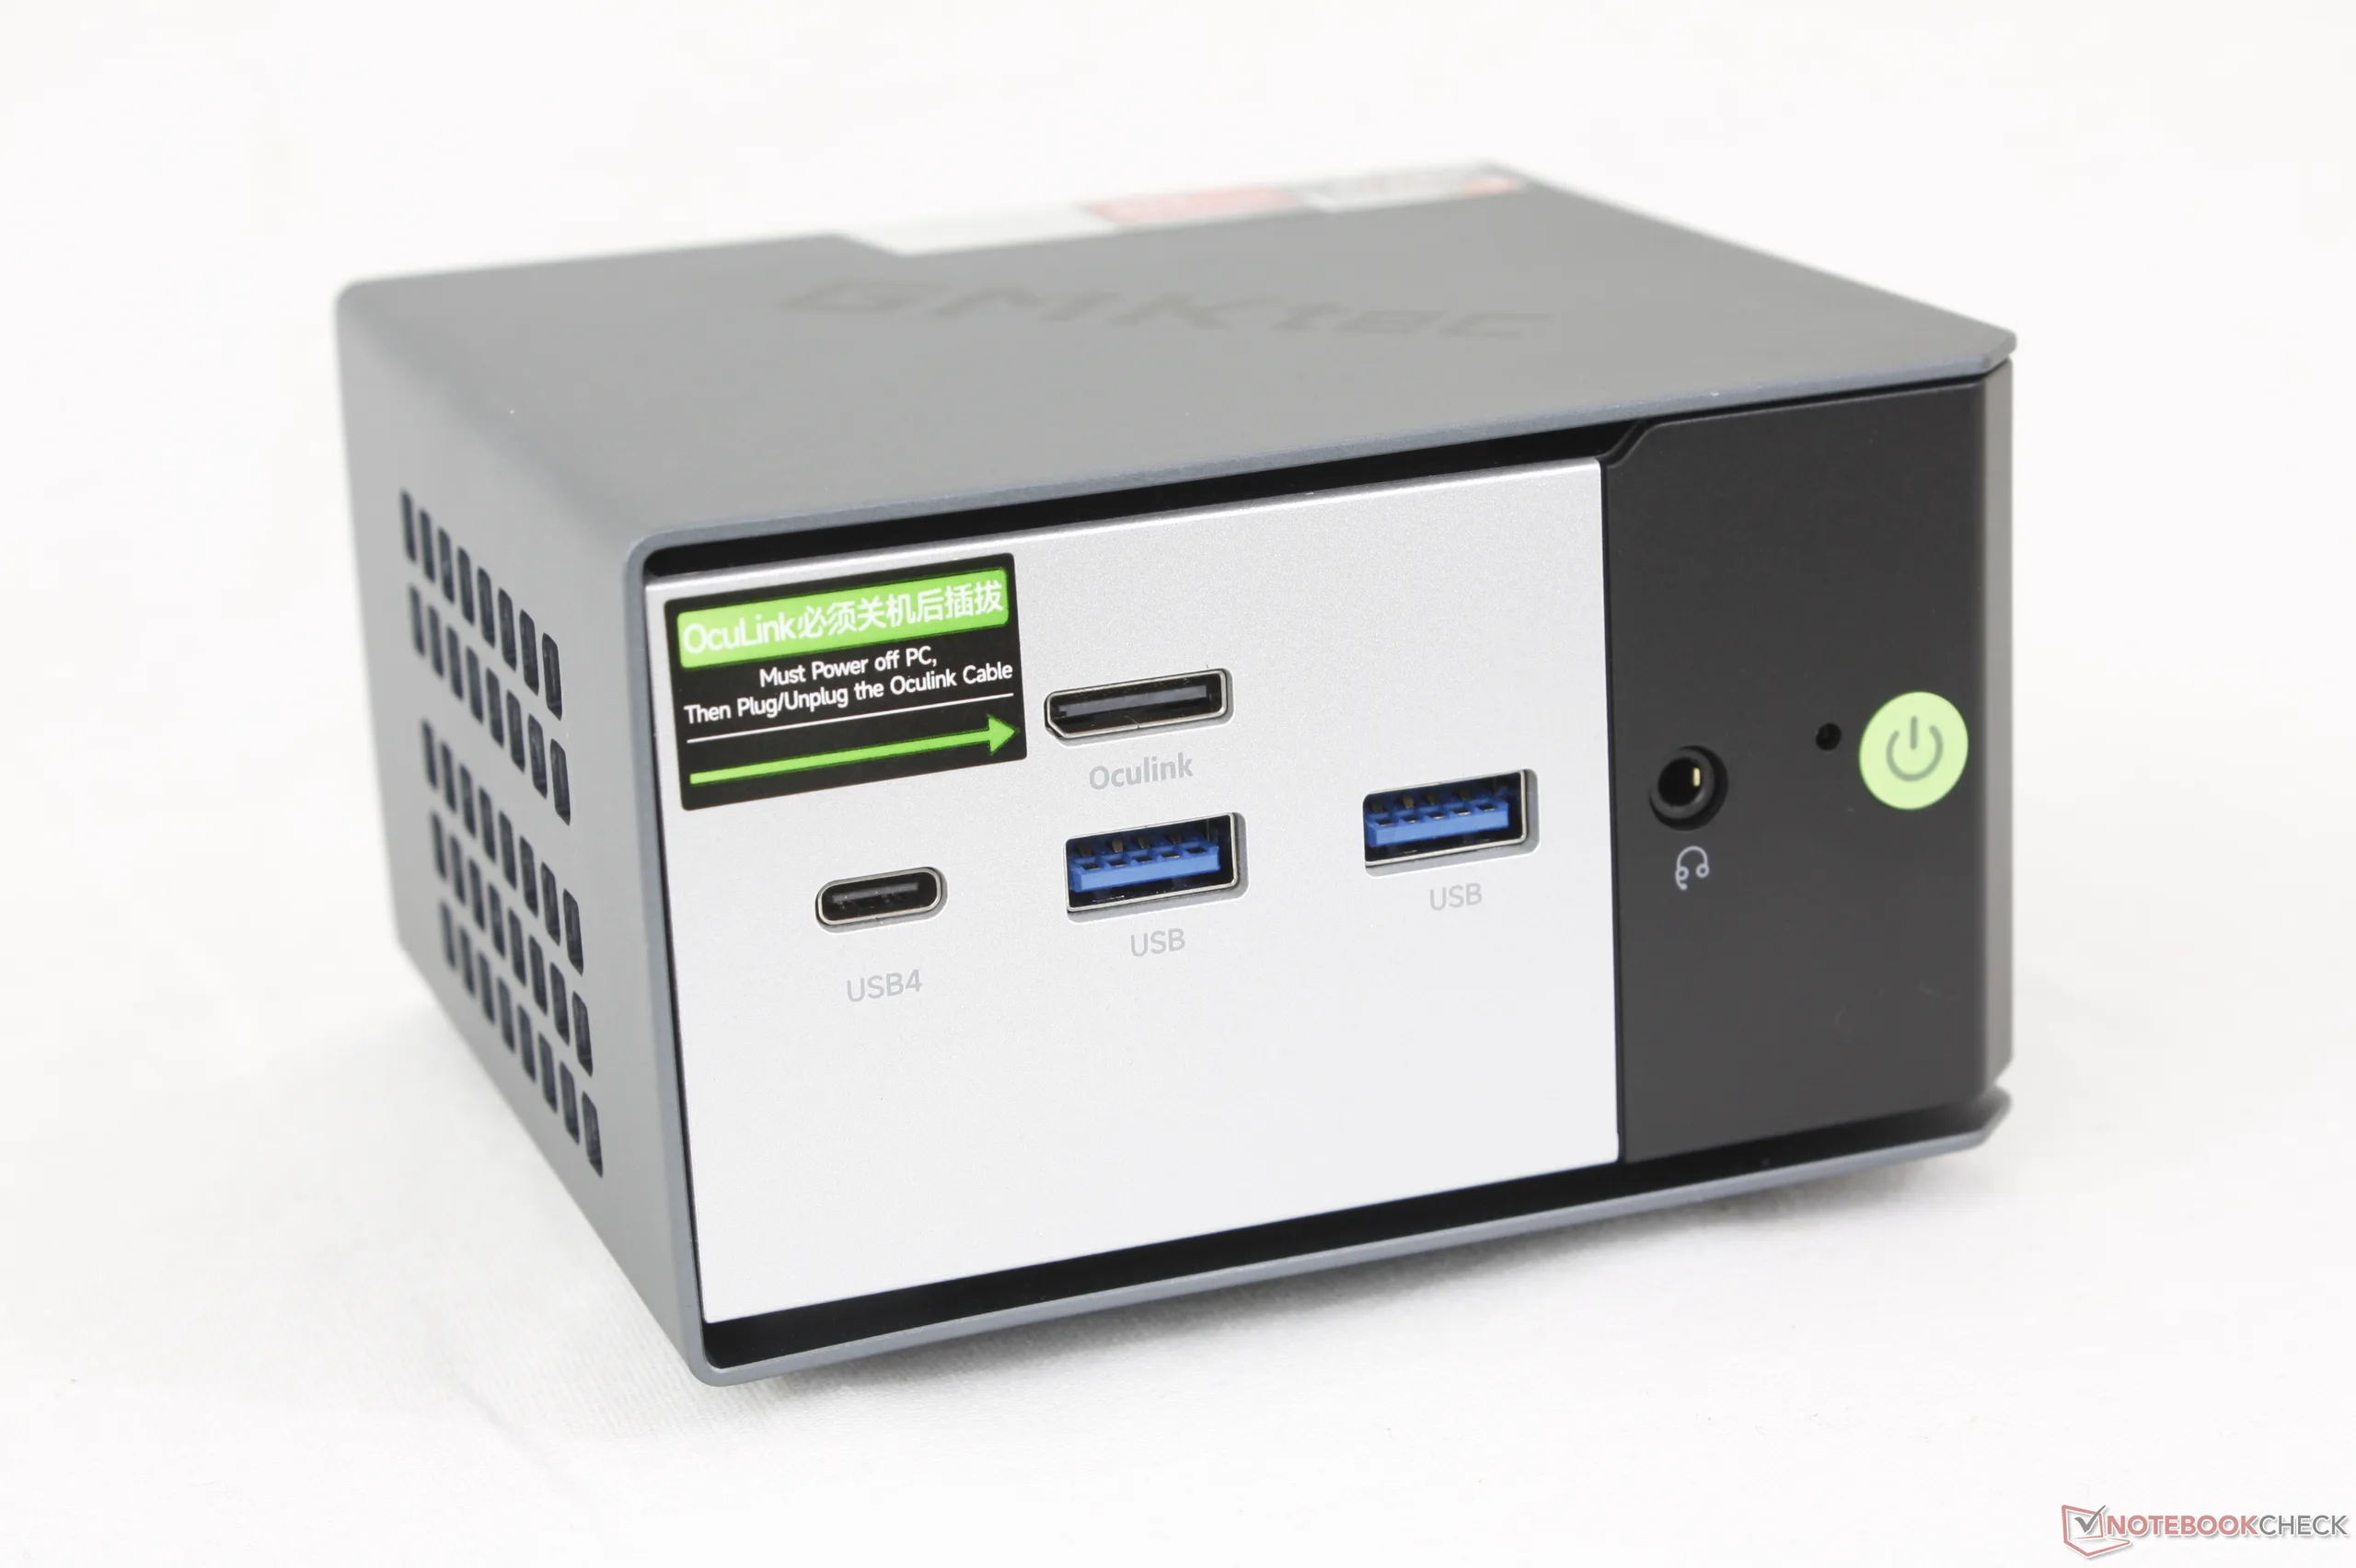
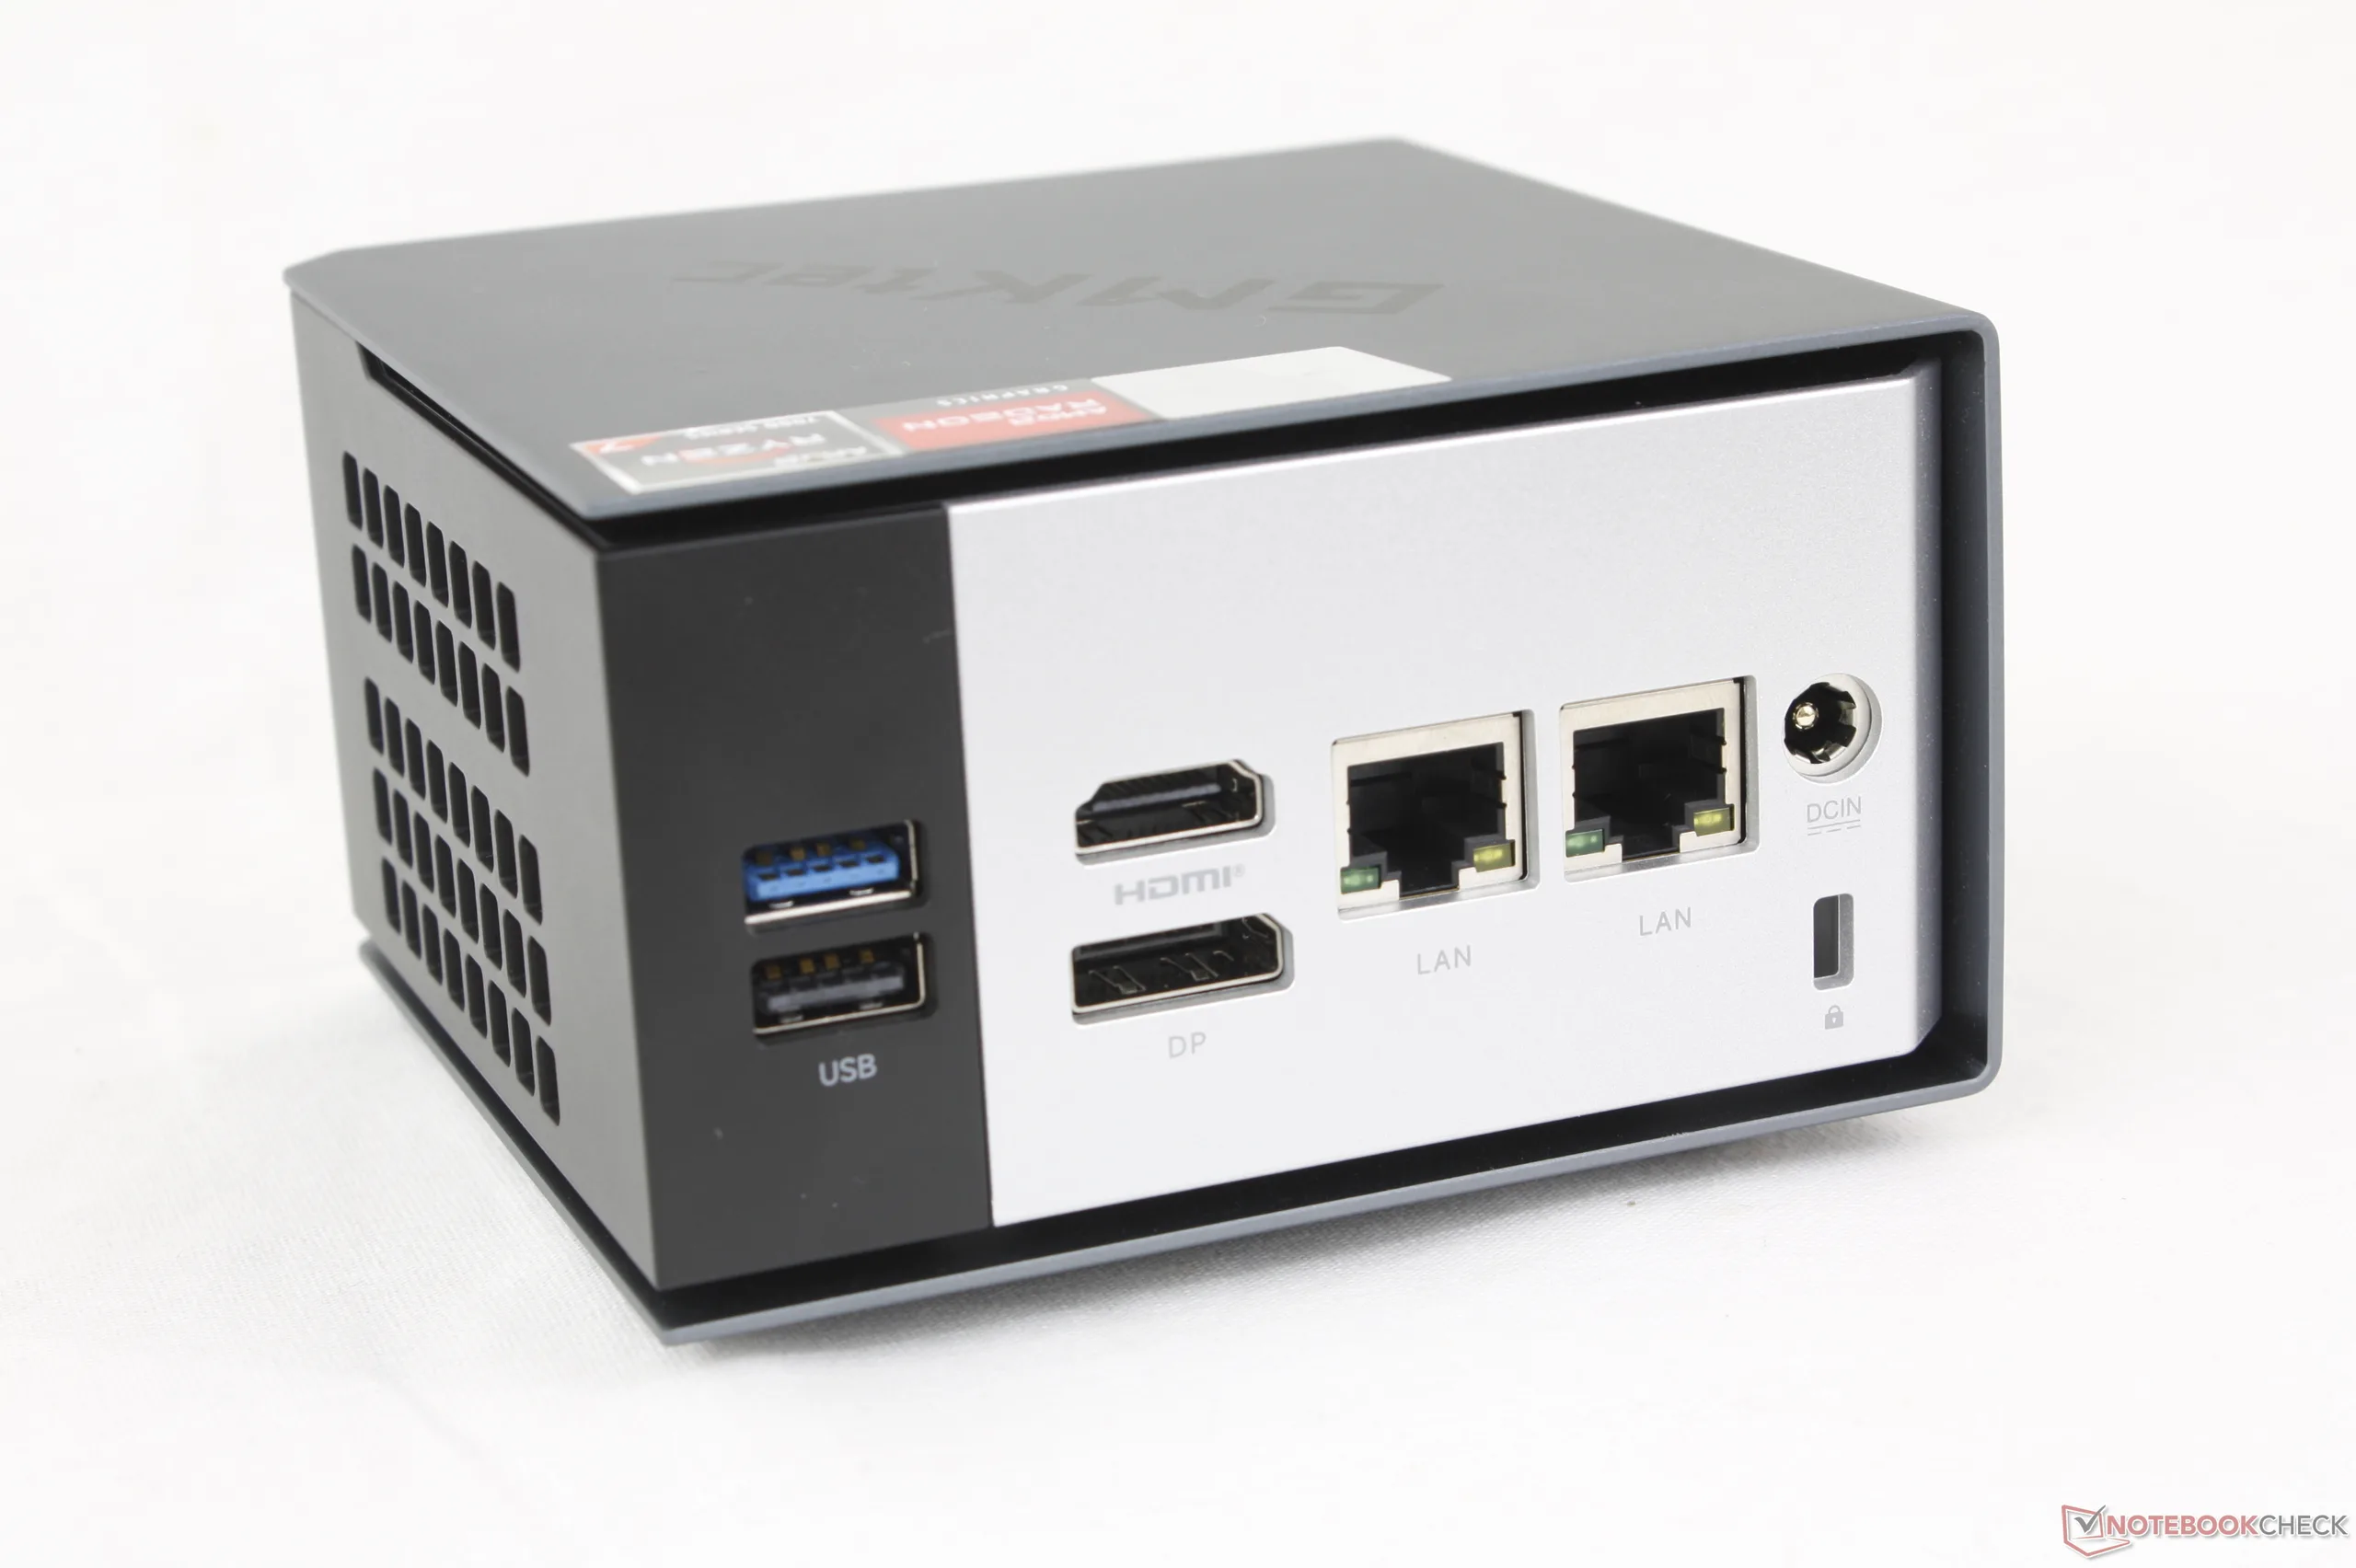
O chassi é idêntico ao do EVO-X1 do ano passado, que continua a ser um dos menores minicomputadores da linha da GMKtec. As opções de portas não mudaram, incluindo a importante porta Oculink, que ajuda a distinguir o modelo da maioria dos mini PCs concorrentes.
Conectividade
Comunicação
| Networking | |
| iperf3 transmit AXE11000 | |
| Asus NUC 15 Pro+ | |
| Geekom A7 Max, R9 7940HS | |
| MSI Cubi NUC AI+ 2MG | |
| GMK NucBox K16 | |
| GMK NucBox K13 | |
| Beelink SER9 Pro | |
| iperf3 receive AXE11000 | |
| Asus NUC 15 Pro+ | |
| MSI Cubi NUC AI+ 2MG | |
| Geekom A7 Max, R9 7940HS | |
| Beelink SER9 Pro | |
| GMK NucBox K13 | |
| GMK NucBox K16 | |
| iperf3 transmit AXE11000 6GHz | |
| GMK NucBox K16 | |
| Asus NUC 15 Pro+ | |
| MSI Cubi NUC AI+ 2MG | |
| GMK NucBox K13 | |
| Geekom A7 Max, R9 7940HS | |
| iperf3 receive AXE11000 6GHz | |
| GMK NucBox K16 | |
| GMK NucBox K13 | |
| MSI Cubi NUC AI+ 2MG | |
| Asus NUC 15 Pro+ | |
| Geekom A7 Max, R9 7940HS | |
Manutenção
Sustentabilidade
O fabricante não lista explicitamente nenhum material reciclado usado durante a produção. Além disso, a embalagem é toda de papel e plástico, com exceção do invólucro plástico externo.
Acessórios e garantia
A caixa de varejo inclui um cabo HDMI juntamente com o adaptador CA e a documentação habituais.
A garantia padrão limitada de um ano do fabricante se aplica quando comprada nos EUA.
Desempenho
Condições de teste
Configuramos o sistema para o modo Performance via BIOS antes de executar os benchmarks abaixo. Observe que o sistema é fornecido no modo Balanced por padrão.
Processador
O Ryzen 7 7735HS pode estar envelhecendo, mas o desempenho bruto do processador ainda é decente, com resultados comparáveis aos do mais recente Core Ultra 5 125H ou cerca de 20 a 25 por cento mais rápido do que o mais eficiente Core Ultra 7 256V. Observe que, ao contrário de muitas CPUs mais recentes, o Ryzen 7 7735HS não possui uma NPU integrada necessária para recursos locais de IA, como o Co-Pilot+.
Cinebench R15 Multi Loop
Cinebench R23: Multi Core | Single Core
Cinebench R20: CPU (Multi Core) | CPU (Single Core)
Cinebench R15: CPU Multi 64Bit | CPU Single 64Bit
Blender: v2.79 BMW27 CPU
7-Zip 18.03: 7z b 4 | 7z b 4 -mmt1
Geekbench 6.7: Multi-Core | Single-Core
Geekbench 5.5: Multi-Core | Single-Core
HWBOT x265 Benchmark v2.2: 4k Preset
LibreOffice : 20 Documents To PDF
R Benchmark 2.5: Overall mean
| CPU Performance rating | |
| Asus NUC 15 Pro+ | |
| Khadas Mind Pro | |
| Beelink SER9 Pro | |
| Geekom A7 Max, R9 7940HS | |
| GMK NucBox K13 | |
| MSI Cubi NUC AI+ 2MG | |
| Média AMD Ryzen 7 7735HS | |
| GMK NucBox M7 Ultra | |
| GMK NucBox M3 Ultra | |
| GMK NucBox K16 | |
| MSI Cubi NUC 1M | |
| Minix Elite EU512-AI -2! | |
| BMAX B4 Turbo | |
| Cinebench R20 / CPU (Multi Core) | |
| Asus NUC 15 Pro+ | |
| Khadas Mind Pro | |
| Geekom A7 Max, R9 7940HS | |
| Beelink SER9 Pro | |
| Minix Elite EU512-AI | |
| GMK NucBox M7 Ultra | |
| GMK NucBox K16 | |
| Média AMD Ryzen 7 7735HS (3968 - 5502, n=15) | |
| GMK NucBox K13 | |
| MSI Cubi NUC AI+ 2MG | |
| GMK NucBox M3 Ultra | |
| MSI Cubi NUC 1M | |
| BMAX B4 Turbo | |
| Cinebench R20 / CPU (Single Core) | |
| Asus NUC 15 Pro+ | |
| Khadas Mind Pro | |
| MSI Cubi NUC AI+ 2MG | |
| GMK NucBox K13 | |
| MSI Cubi NUC 1M | |
| GMK NucBox M3 Ultra | |
| Geekom A7 Max, R9 7940HS | |
| Beelink SER9 Pro | |
| Minix Elite EU512-AI | |
| Média AMD Ryzen 7 7735HS (502 - 613, n=15) | |
| GMK NucBox K16 | |
| GMK NucBox M7 Ultra | |
| BMAX B4 Turbo | |
| Cinebench R15 / CPU Multi 64Bit | |
| Asus NUC 15 Pro+ | |
| Khadas Mind Pro | |
| Geekom A7 Max, R9 7940HS | |
| Beelink SER9 Pro | |
| Média AMD Ryzen 7 7735HS (1758 - 2355, n=17) | |
| GMK NucBox M7 Ultra | |
| Minix Elite EU512-AI | |
| GMK NucBox K16 | |
| GMK NucBox K13 | |
| GMK NucBox M3 Ultra | |
| MSI Cubi NUC AI+ 2MG | |
| MSI Cubi NUC 1M | |
| BMAX B4 Turbo | |
| Cinebench R15 / CPU Single 64Bit | |
| Asus NUC 15 Pro+ | |
| Khadas Mind Pro | |
| MSI Cubi NUC AI+ 2MG | |
| GMK NucBox K13 | |
| Geekom A7 Max, R9 7940HS | |
| Beelink SER9 Pro | |
| MSI Cubi NUC 1M | |
| GMK NucBox M3 Ultra | |
| Média AMD Ryzen 7 7735HS (206 - 255, n=16) | |
| GMK NucBox M7 Ultra | |
| GMK NucBox K16 | |
| Minix Elite EU512-AI | |
| BMAX B4 Turbo | |
| Geekbench 6.7 / Multi-Core | |
| Asus NUC 15 Pro+ | |
| Khadas Mind Pro | |
| Beelink SER9 Pro | |
| GMK NucBox K13 | |
| Geekom A7 Max, R9 7940HS | |
| GMK NucBox M7 Ultra | |
| Média AMD Ryzen 7 7735HS (7046 - 11035, n=9) | |
| MSI Cubi NUC AI+ 2MG | |
| MSI Cubi NUC 1M | |
| GMK NucBox M3 Ultra | |
| GMK NucBox K16 | |
| BMAX B4 Turbo | |
| Geekbench 6.7 / Single-Core | |
| Khadas Mind Pro | |
| GMK NucBox K13 | |
| MSI Cubi NUC AI+ 2MG | |
| Asus NUC 15 Pro+ | |
| MSI Cubi NUC 1M | |
| Geekom A7 Max, R9 7940HS | |
| Beelink SER9 Pro | |
| GMK NucBox M3 Ultra | |
| Média AMD Ryzen 7 7735HS (1949 - 2153, n=9) | |
| GMK NucBox M7 Ultra | |
| GMK NucBox K16 | |
| BMAX B4 Turbo | |
| HWBOT x265 Benchmark v2.2 / 4k Preset | |
| Asus NUC 15 Pro+ | |
| Khadas Mind Pro | |
| Beelink SER9 Pro | |
| Geekom A7 Max, R9 7940HS | |
| GMK NucBox M7 Ultra | |
| Média AMD Ryzen 7 7735HS (10.8 - 17.9, n=15) | |
| Minix Elite EU512-AI | |
| GMK NucBox K13 | |
| MSI Cubi NUC AI+ 2MG | |
| GMK NucBox K16 | |
| GMK NucBox M3 Ultra | |
| MSI Cubi NUC 1M | |
| BMAX B4 Turbo | |
| LibreOffice / 20 Documents To PDF | |
| BMAX B4 Turbo | |
| GMK NucBox M7 Ultra | |
| Minix Elite EU512-AI | |
| GMK NucBox M3 Ultra | |
| GMK NucBox K16 | |
| Asus NUC 15 Pro+ | |
| Média AMD Ryzen 7 7735HS (44.3 - 63.9, n=15) | |
| Geekom A7 Max, R9 7940HS | |
| Beelink SER9 Pro | |
| GMK NucBox K13 | |
| Khadas Mind Pro | |
| MSI Cubi NUC AI+ 2MG | |
| MSI Cubi NUC 1M | |
Cinebench R23: Multi Core | Single Core
Cinebench R20: CPU (Multi Core) | CPU (Single Core)
Cinebench R15: CPU Multi 64Bit | CPU Single 64Bit
Blender: v2.79 BMW27 CPU
7-Zip 18.03: 7z b 4 | 7z b 4 -mmt1
Geekbench 6.7: Multi-Core | Single-Core
Geekbench 5.5: Multi-Core | Single-Core
HWBOT x265 Benchmark v2.2: 4k Preset
LibreOffice : 20 Documents To PDF
R Benchmark 2.5: Overall mean
* ... menor é melhor
AIDA64: FP32 Ray-Trace | FPU Julia | CPU SHA3 | CPU Queen | FPU SinJulia | FPU Mandel | CPU AES | CPU ZLib | FP64 Ray-Trace | CPU PhotoWorxx | CPU CheckMate
| Performance rating | |
| Beelink SER9 Pro -1! | |
| Geekom A7 Max, R9 7940HS -1! | |
| Asus NUC 15 Pro+ -1! | |
| Média AMD Ryzen 7 7735HS | |
| GMK NucBox K16 -1! | |
| GMK NucBox K13 -1! | |
| MSI Cubi NUC AI+ 2MG -1! | |
| AIDA64 / FP32 Ray-Trace | |
| Beelink SER9 Pro (v6.92.6600) | |
| Geekom A7 Max, R9 7940HS (v6.92.6600) | |
| Asus NUC 15 Pro+ (v6.92.6600) | |
| GMK NucBox K16 (v8.20.8100) | |
| Média AMD Ryzen 7 7735HS (11831 - 17161, n=16) | |
| GMK NucBox K13 (v8.20.8100) | |
| MSI Cubi NUC AI+ 2MG (v6.92.6600) | |
| AIDA64 / FPU Julia | |
| Asus NUC 15 Pro+ (v6.92.6600) | |
| Geekom A7 Max, R9 7940HS (v6.92.6600) | |
| Beelink SER9 Pro (v6.92.6600) | |
| GMK NucBox K16 (v8.20.8100) | |
| Média AMD Ryzen 7 7735HS (75370 - 105483, n=16) | |
| GMK NucBox K13 (v8.20.8100) | |
| MSI Cubi NUC AI+ 2MG (v6.92.6600) | |
| AIDA64 / CPU SHA3 | |
| Asus NUC 15 Pro+ (v6.92.6600) | |
| Geekom A7 Max, R9 7940HS (v6.92.6600) | |
| Beelink SER9 Pro (v6.92.6600) | |
| GMK NucBox K16 (v8.20.8100) | |
| Média AMD Ryzen 7 7735HS (2499 - 3494, n=16) | |
| GMK NucBox K13 (v8.20.8100) | |
| MSI Cubi NUC AI+ 2MG (v6.92.6600) | |
| AIDA64 / CPU Queen | |
| Geekom A7 Max, R9 7940HS (v6.92.6600) | |
| Beelink SER9 Pro (v6.92.6600) | |
| Média AMD Ryzen 7 7735HS (87486 - 108729, n=15) | |
| Asus NUC 15 Pro+ (v6.92.6600) | |
| MSI Cubi NUC AI+ 2MG (v6.92.6600) | |
| AIDA64 / FPU SinJulia | |
| Beelink SER9 Pro (v6.92.6600) | |
| Geekom A7 Max, R9 7940HS (v6.92.6600) | |
| GMK NucBox K16 (v8.20.8100) | |
| Média AMD Ryzen 7 7735HS (11233 - 13097, n=16) | |
| Asus NUC 15 Pro+ (v6.92.6600) | |
| GMK NucBox K13 (v8.20.8100) | |
| MSI Cubi NUC AI+ 2MG (v6.92.6600) | |
| AIDA64 / FPU Mandel | |
| Asus NUC 15 Pro+ (v6.92.6600) | |
| Geekom A7 Max, R9 7940HS (v6.92.6600) | |
| Beelink SER9 Pro (v6.92.6600) | |
| GMK NucBox K16 (v8.20.8100) | |
| Média AMD Ryzen 7 7735HS (41400 - 58232, n=16) | |
| GMK NucBox K13 (v8.20.8100) | |
| MSI Cubi NUC AI+ 2MG (v6.92.6600) | |
| AIDA64 / CPU AES | |
| Geekom A7 Max, R9 7940HS (v6.92.6600) | |
| Beelink SER9 Pro (v6.92.6600) | |
| Asus NUC 15 Pro+ (v6.92.6600) | |
| Média AMD Ryzen 7 7735HS (44013 - 137629, n=16) | |
| GMK NucBox K13 (v8.20.8100) | |
| GMK NucBox K16 (v8.20.8100) | |
| MSI Cubi NUC AI+ 2MG (v6.92.6600) | |
| AIDA64 / CPU ZLib | |
| Asus NUC 15 Pro+ (v6.92.6600) | |
| Geekom A7 Max, R9 7940HS (v6.92.6600) | |
| Beelink SER9 Pro (v6.92.6600) | |
| GMK NucBox K16 (v8.20.8100) | |
| Média AMD Ryzen 7 7735HS (651 - 906, n=16) | |
| GMK NucBox K13 (v8.20.8100) | |
| MSI Cubi NUC AI+ 2MG (v6.92.6600) | |
| AIDA64 / FP64 Ray-Trace | |
| Beelink SER9 Pro (v6.92.6600) | |
| Geekom A7 Max, R9 7940HS (v6.92.6600) | |
| Asus NUC 15 Pro+ (v6.92.6600) | |
| GMK NucBox K16 (v8.20.8100) | |
| Média AMD Ryzen 7 7735HS (1459 - 9094, n=16) | |
| GMK NucBox K13 (v8.20.8100) | |
| MSI Cubi NUC AI+ 2MG (v6.92.6600) | |
| AIDA64 / CPU PhotoWorxx | |
| GMK NucBox K13 (v8.20.8100) | |
| Asus NUC 15 Pro+ (v6.92.6600) | |
| MSI Cubi NUC AI+ 2MG (v6.92.6600) | |
| Beelink SER9 Pro (v6.92.6600) | |
| Média AMD Ryzen 7 7735HS (17524 - 30542, n=16) | |
| Geekom A7 Max, R9 7940HS (v6.92.6600) | |
| GMK NucBox K16 (v8.20.8100) | |
| AIDA64 / CPU CheckMate | |
| GMK NucBox K16 (v8.20.8100) | |
| Média AMD Ryzen 7 7735HS (n=1) | |
| GMK NucBox K13 (v8.20.8100) | |
Desempenho do sistema
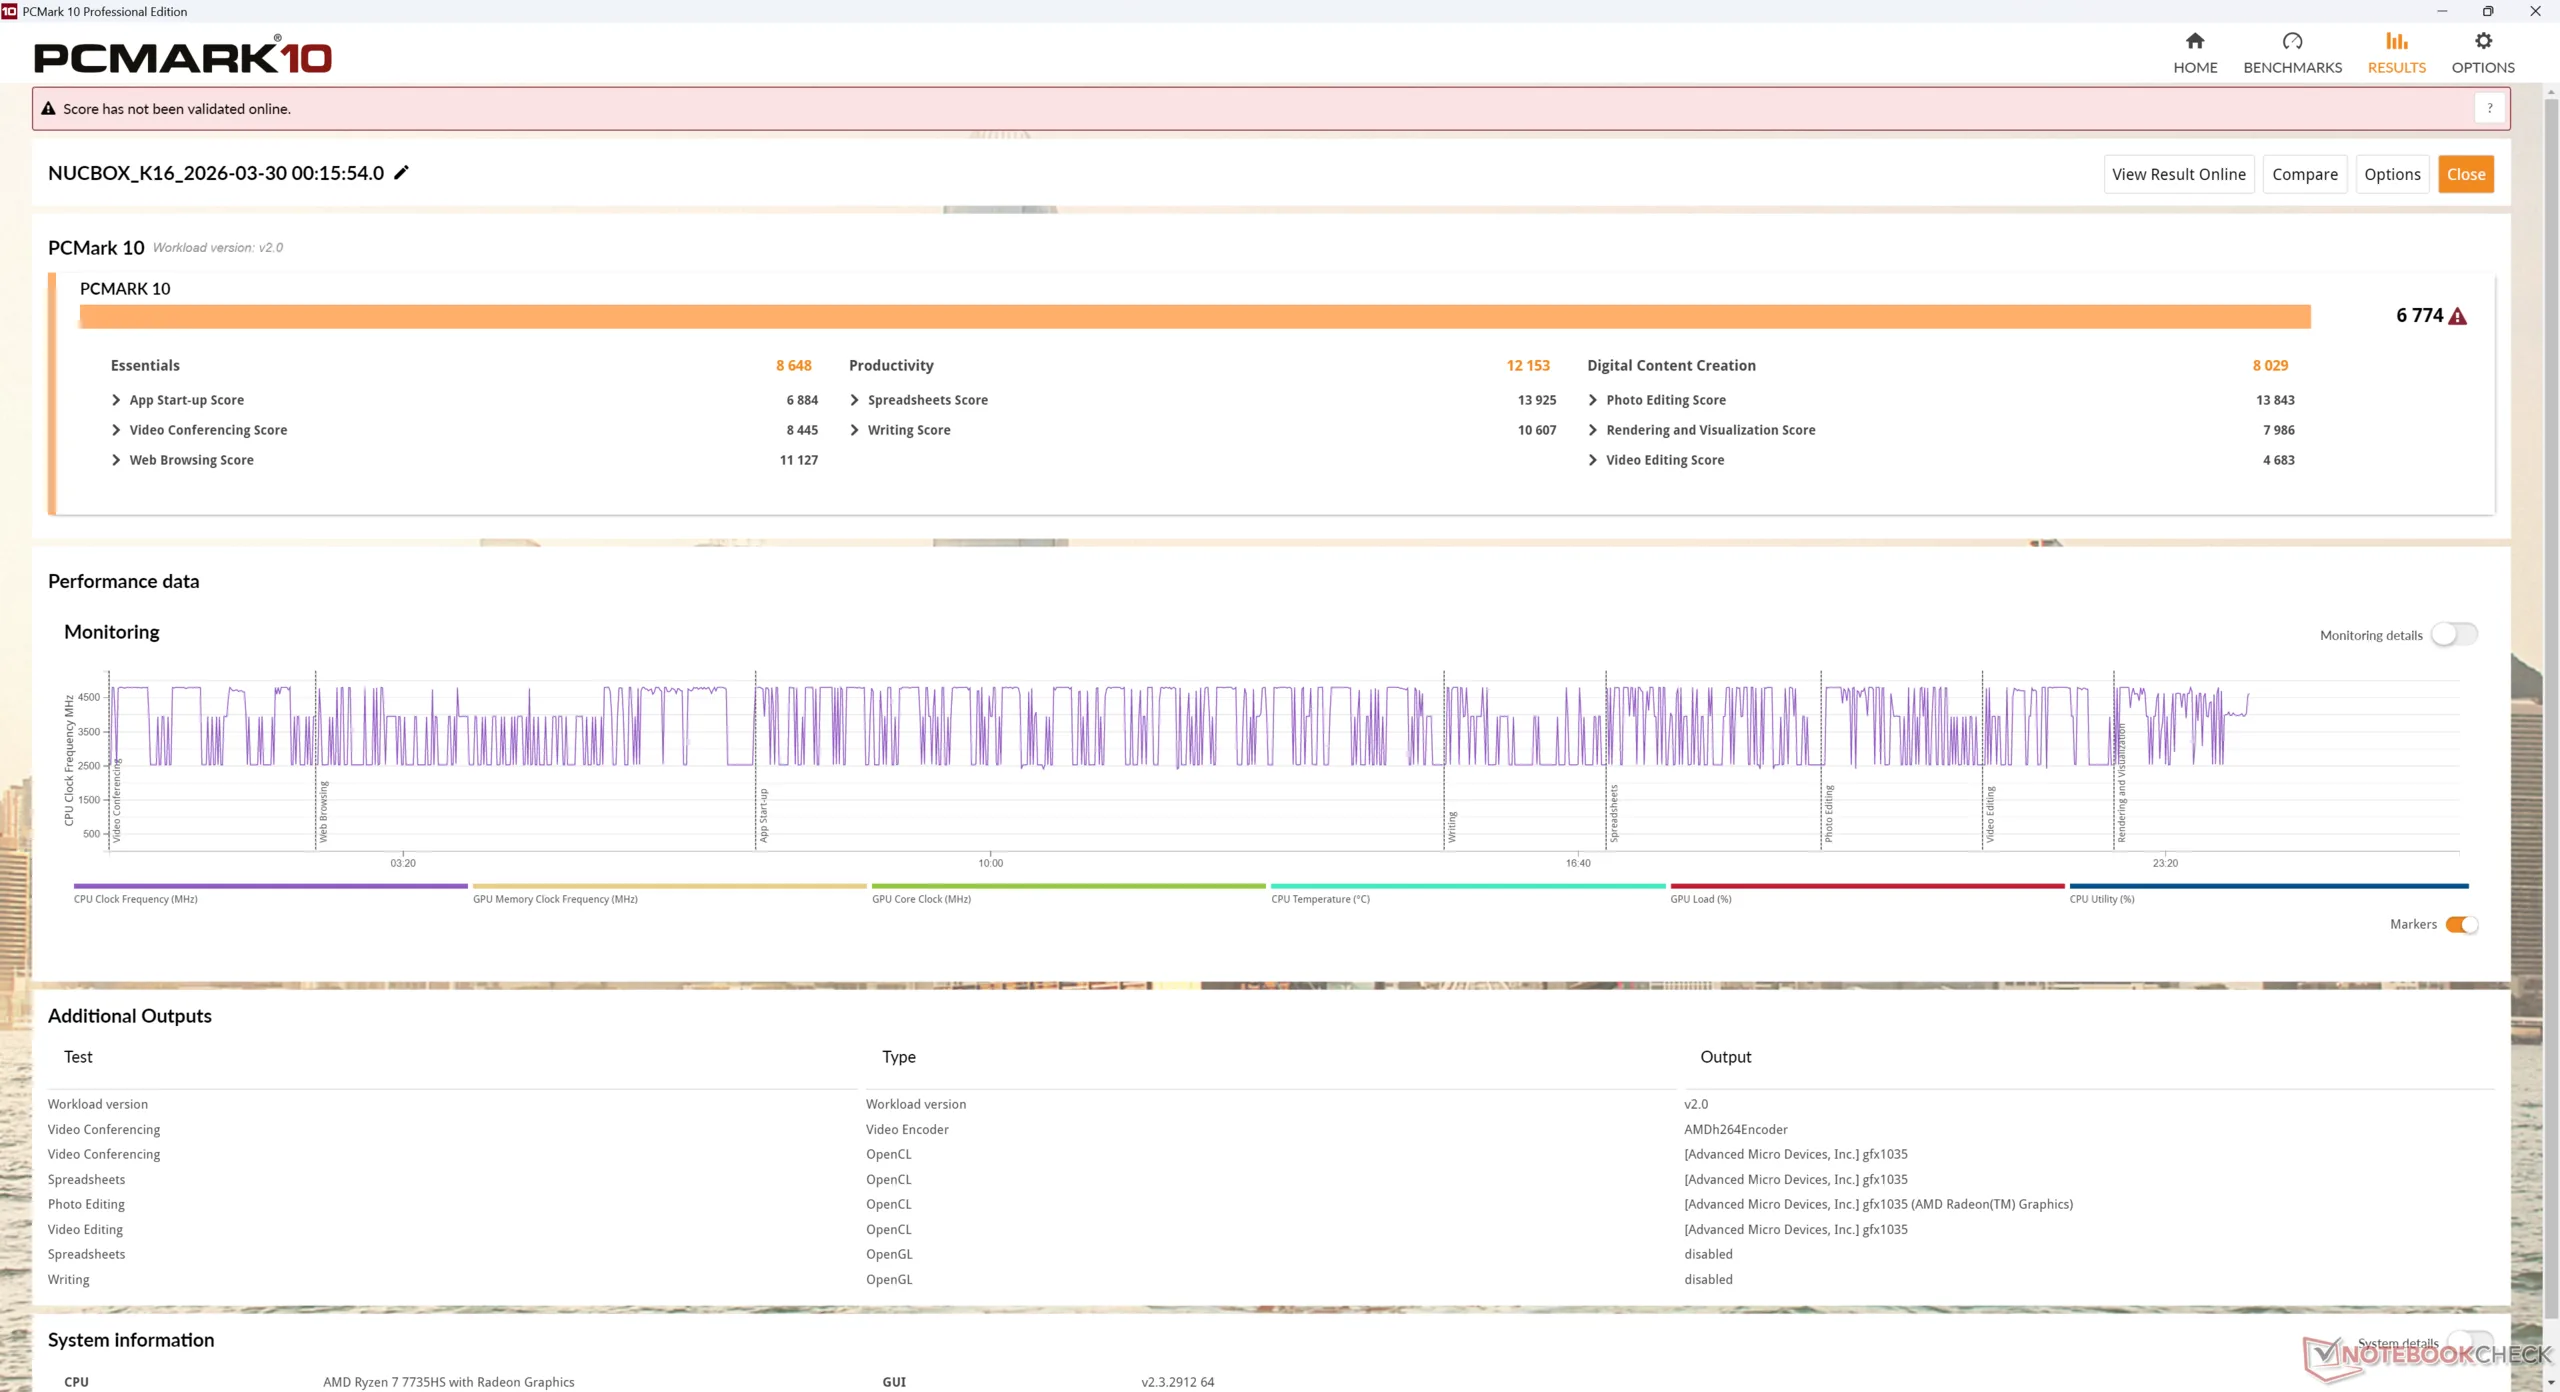
PCMark 10: Score | Essentials | Productivity | Digital Content Creation
CrossMark: Overall | Productivity | Creativity | Responsiveness
WebXPRT 3: Overall
WebXPRT 4: Overall
Mozilla Kraken 1.1: Total
| Performance rating | |
| GMK NucBox K13 | |
| Beelink SER9 Pro | |
| Asus NUC 15 Pro+ | |
| MSI Cubi NUC AI+ 2MG | |
| Geekom A7 Max, R9 7940HS | |
| Média AMD Ryzen 7 7735HS, AMD Radeon 680M | |
| GMK NucBox K16 | |
| PCMark 10 / Score | |
| GMK NucBox K13 | |
| Asus NUC 15 Pro+ | |
| Beelink SER9 Pro | |
| MSI Cubi NUC AI+ 2MG | |
| GMK NucBox K16 | |
| Geekom A7 Max, R9 7940HS | |
| Média AMD Ryzen 7 7735HS, AMD Radeon 680M (5722 - 7000, n=8) | |
| PCMark 10 / Essentials | |
| Beelink SER9 Pro | |
| Média AMD Ryzen 7 7735HS, AMD Radeon 680M (8648 - 11124, n=8) | |
| MSI Cubi NUC AI+ 2MG | |
| Geekom A7 Max, R9 7940HS | |
| GMK NucBox K13 | |
| Asus NUC 15 Pro+ | |
| GMK NucBox K16 | |
| PCMark 10 / Productivity | |
| GMK NucBox K13 | |
| GMK NucBox K16 | |
| Média AMD Ryzen 7 7735HS, AMD Radeon 680M (8428 - 12153, n=8) | |
| Geekom A7 Max, R9 7940HS | |
| Beelink SER9 Pro | |
| MSI Cubi NUC AI+ 2MG | |
| Asus NUC 15 Pro+ | |
| PCMark 10 / Digital Content Creation | |
| Asus NUC 15 Pro+ | |
| GMK NucBox K13 | |
| MSI Cubi NUC AI+ 2MG | |
| Beelink SER9 Pro | |
| Geekom A7 Max, R9 7940HS | |
| GMK NucBox K16 | |
| Média AMD Ryzen 7 7735HS, AMD Radeon 680M (5798 - 8726, n=8) | |
| CrossMark / Overall | |
| Beelink SER9 Pro | |
| Asus NUC 15 Pro+ | |
| GMK NucBox K13 | |
| Geekom A7 Max, R9 7940HS | |
| MSI Cubi NUC AI+ 2MG | |
| Média AMD Ryzen 7 7735HS, AMD Radeon 680M (1280 - 1736, n=8) | |
| GMK NucBox K16 | |
| CrossMark / Productivity | |
| Beelink SER9 Pro | |
| Geekom A7 Max, R9 7940HS | |
| GMK NucBox K13 | |
| Asus NUC 15 Pro+ | |
| Média AMD Ryzen 7 7735HS, AMD Radeon 680M (1336 - 1725, n=8) | |
| MSI Cubi NUC AI+ 2MG | |
| GMK NucBox K16 | |
| CrossMark / Creativity | |
| Asus NUC 15 Pro+ | |
| GMK NucBox K13 | |
| Beelink SER9 Pro | |
| MSI Cubi NUC AI+ 2MG | |
| Geekom A7 Max, R9 7940HS | |
| Média AMD Ryzen 7 7735HS, AMD Radeon 680M (1273 - 1785, n=8) | |
| GMK NucBox K16 | |
| CrossMark / Responsiveness | |
| Beelink SER9 Pro | |
| Geekom A7 Max, R9 7940HS | |
| Média AMD Ryzen 7 7735HS, AMD Radeon 680M (1144 - 1653, n=8) | |
| GMK NucBox K13 | |
| Asus NUC 15 Pro+ | |
| MSI Cubi NUC AI+ 2MG | |
| GMK NucBox K16 | |
| WebXPRT 3 / Overall | |
| MSI Cubi NUC AI+ 2MG | |
| Beelink SER9 Pro | |
| GMK NucBox K13 | |
| Geekom A7 Max, R9 7940HS | |
| Média AMD Ryzen 7 7735HS, AMD Radeon 680M (228 - 307, n=7) | |
| Asus NUC 15 Pro+ | |
| GMK NucBox K16 | |
| WebXPRT 4 / Overall | |
| GMK NucBox K13 | |
| MSI Cubi NUC AI+ 2MG | |
| Beelink SER9 Pro | |
| Geekom A7 Max, R9 7940HS | |
| Asus NUC 15 Pro+ | |
| Média AMD Ryzen 7 7735HS, AMD Radeon 680M (176 - 231, n=8) | |
| GMK NucBox K16 | |
| Mozilla Kraken 1.1 / Total | |
| GMK NucBox K16 | |
| Média AMD Ryzen 7 7735HS, AMD Radeon 680M (580 - 655, n=8) | |
| Beelink SER9 Pro | |
| Geekom A7 Max, R9 7940HS | |
| MSI Cubi NUC AI+ 2MG | |
| Asus NUC 15 Pro+ | |
| GMK NucBox K13 | |
* ... menor é melhor
| PCMark 10 Score | 6774 pontos | |
Ajuda | ||
| AIDA64 / Memory Copy | |
| MSI Cubi NUC AI+ 2MG | |
| GMK NucBox K13 | |
| Asus NUC 15 Pro+ | |
| Beelink SER9 Pro | |
| Média AMD Ryzen 7 7735HS (30324 - 52012, n=16) | |
| GMK NucBox K16 | |
| Geekom A7 Max, R9 7940HS | |
| AIDA64 / Memory Read | |
| GMK NucBox K13 | |
| Asus NUC 15 Pro+ | |
| MSI Cubi NUC AI+ 2MG | |
| Beelink SER9 Pro | |
| Média AMD Ryzen 7 7735HS (33938 - 51856, n=16) | |
| GMK NucBox K16 | |
| Geekom A7 Max, R9 7940HS | |
| AIDA64 / Memory Write | |
| MSI Cubi NUC AI+ 2MG | |
| GMK NucBox K13 | |
| Beelink SER9 Pro | |
| Asus NUC 15 Pro+ | |
| Média AMD Ryzen 7 7735HS (33175 - 55284, n=16) | |
| GMK NucBox K16 | |
| Geekom A7 Max, R9 7940HS | |
| AIDA64 / Memory Latency | |
| GMK NucBox K16 | |
| Asus NUC 15 Pro+ | |
| Beelink SER9 Pro | |
| GMK NucBox K13 | |
| MSI Cubi NUC AI+ 2MG | |
| Geekom A7 Max, R9 7940HS | |
| Média AMD Ryzen 7 7735HS (78.2 - 109.8, n=16) | |
* ... menor é melhor
Latência DPC
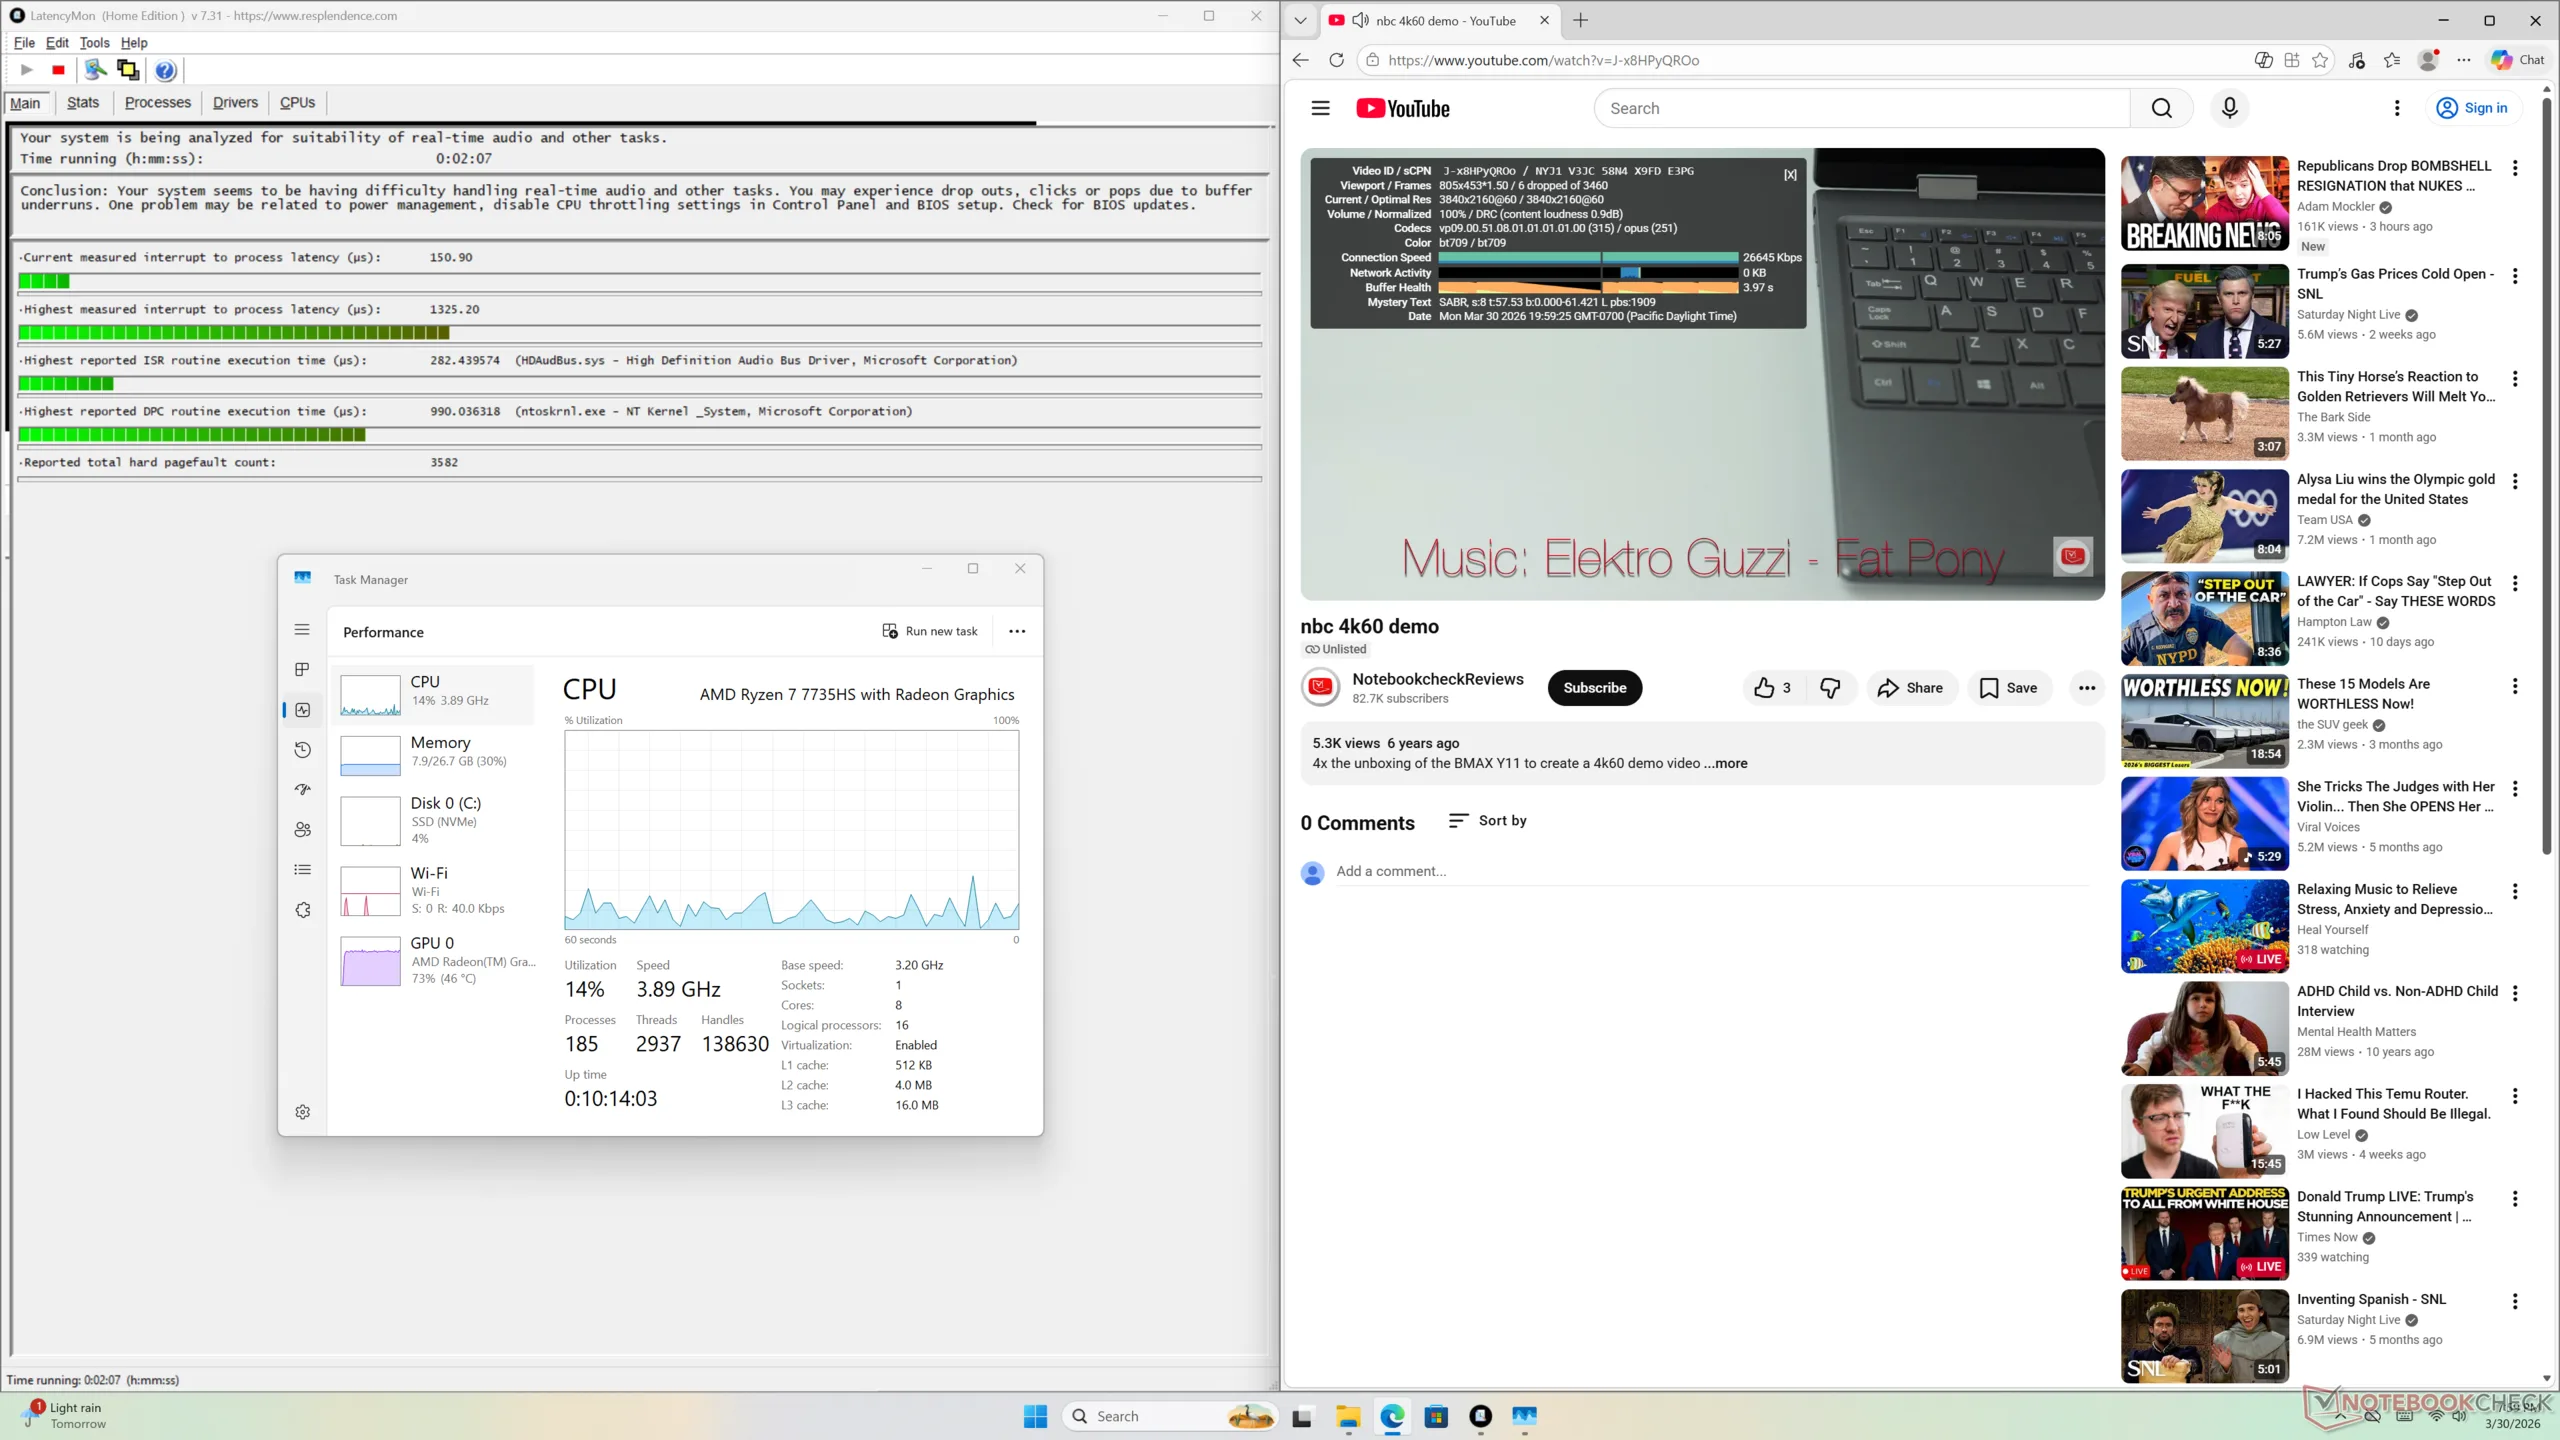
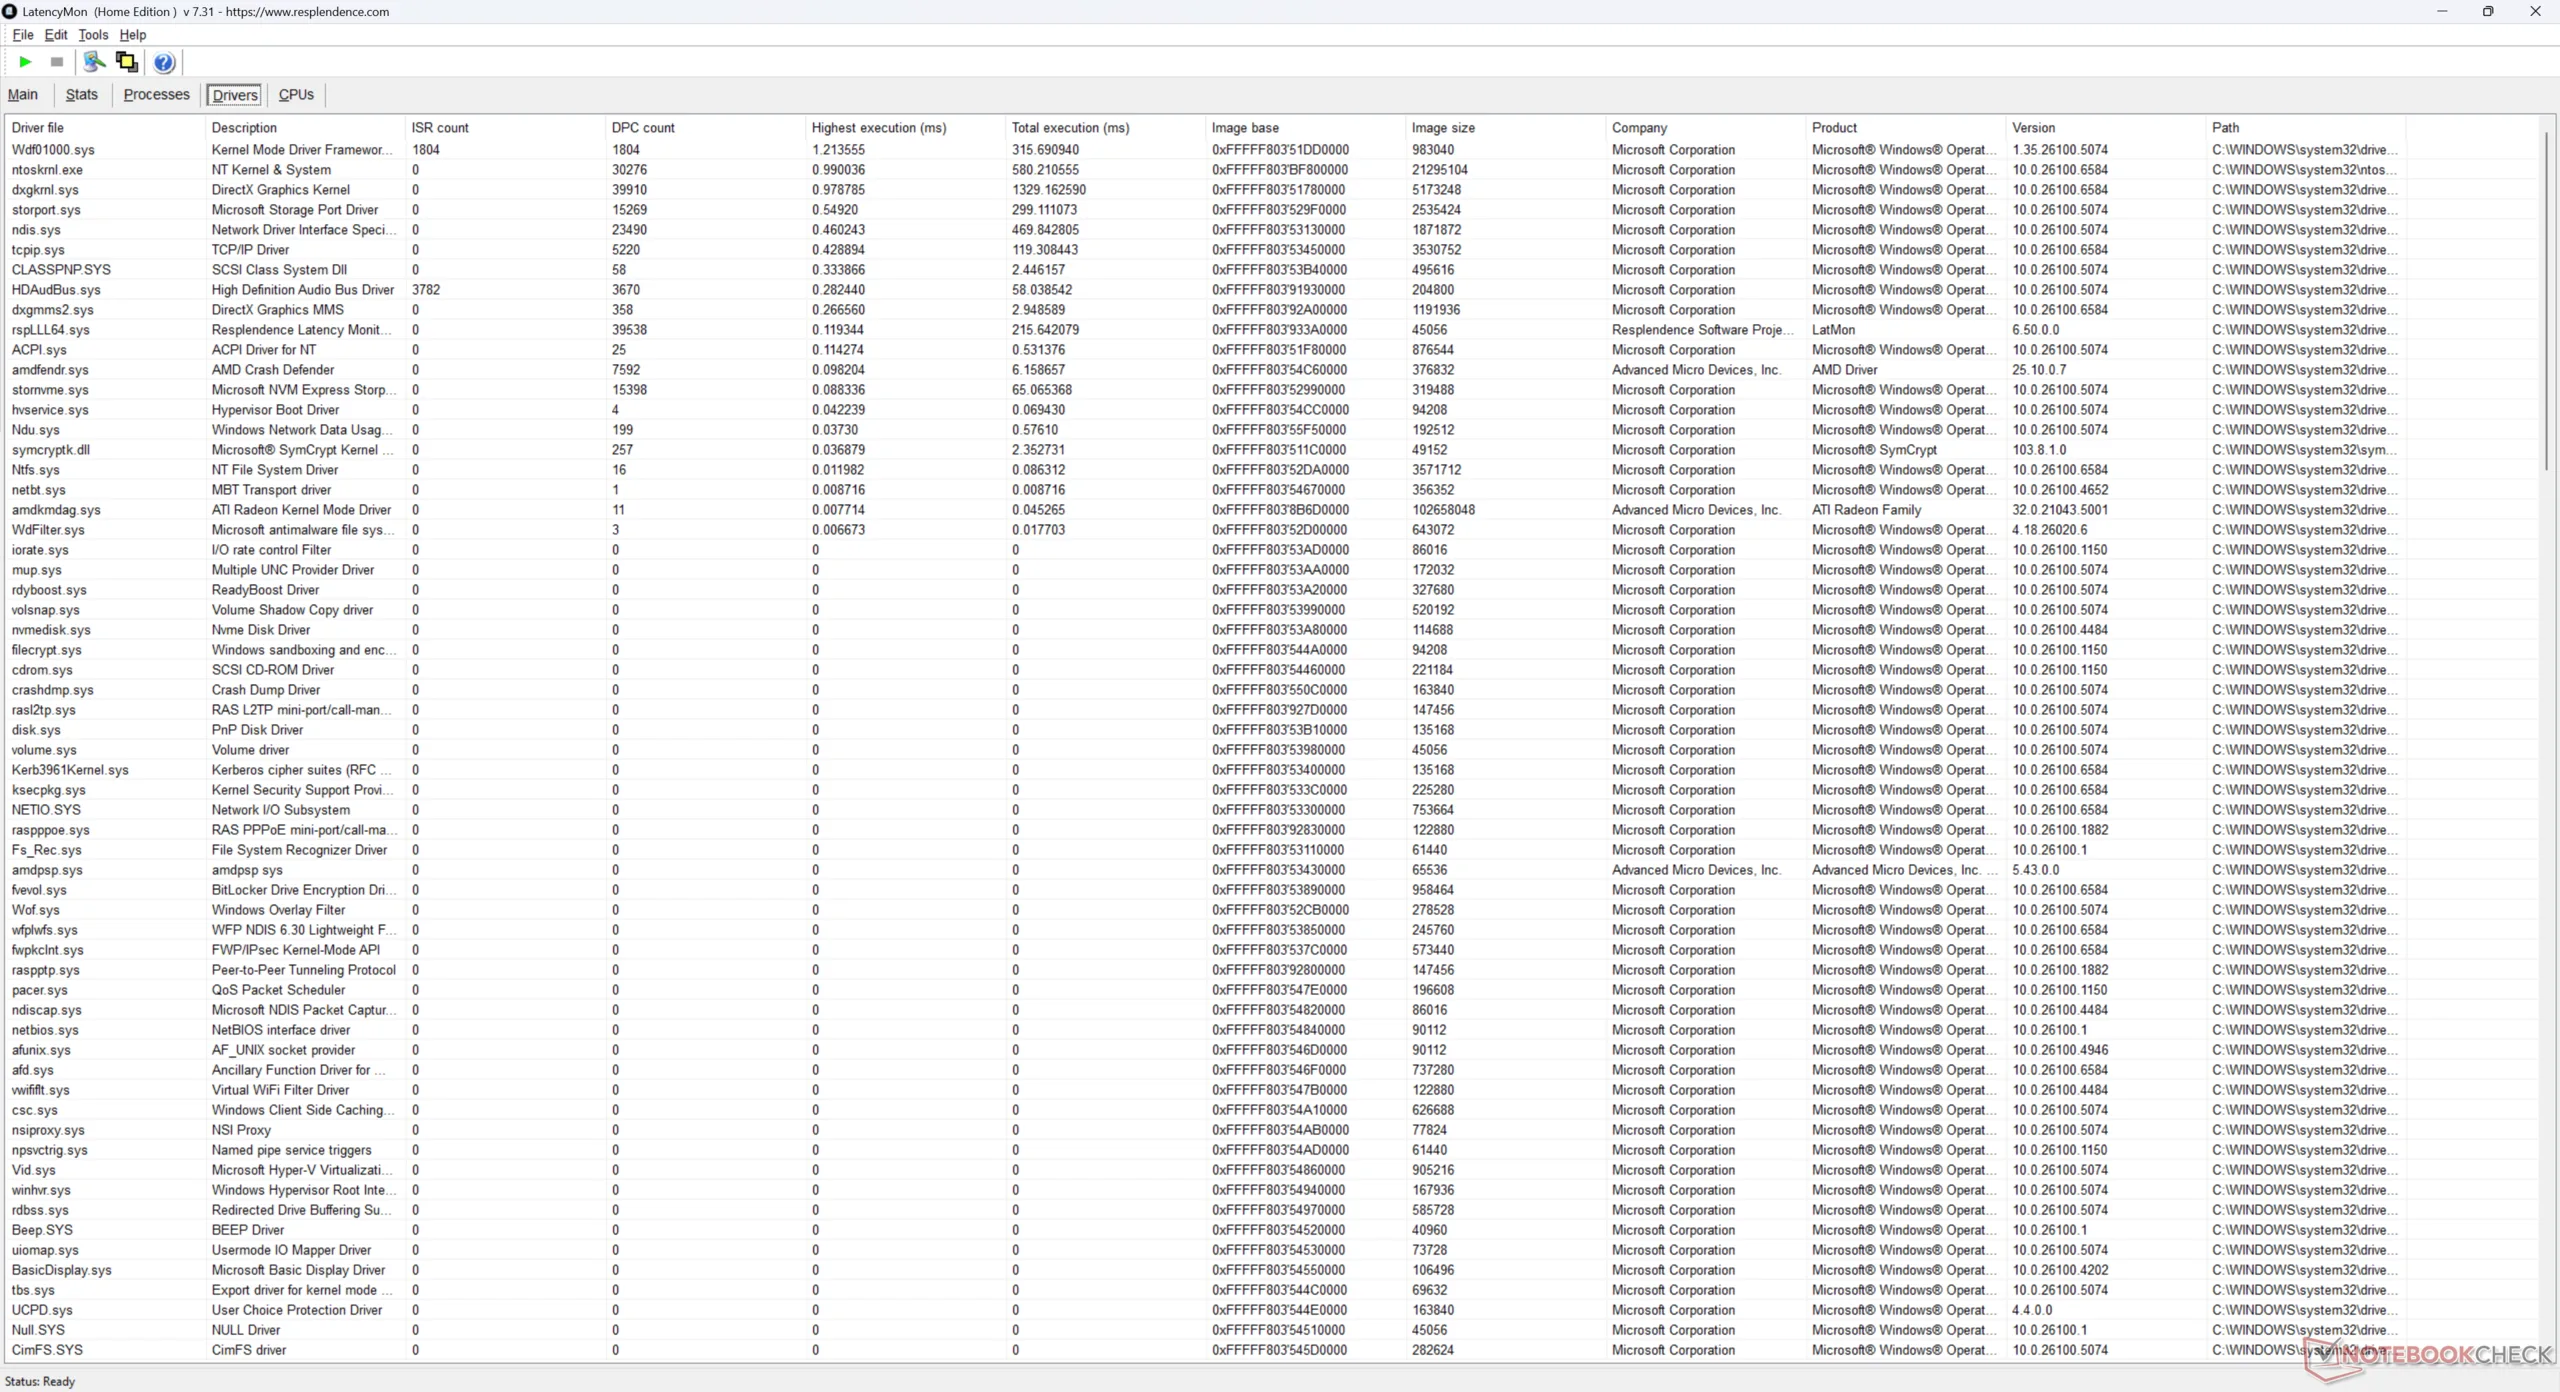
| DPC Latencies / LatencyMon - interrupt to process latency (max), Web, Youtube, Prime95 | |
| Geekom A7 Max, R9 7940HS | |
| GMK NucBox K13 | |
| GMK NucBox K16 | |
| Asus NUC 15 Pro+ | |
| MSI Cubi NUC AI+ 2MG | |
| Beelink SER9 Pro | |
* ... menor é melhor
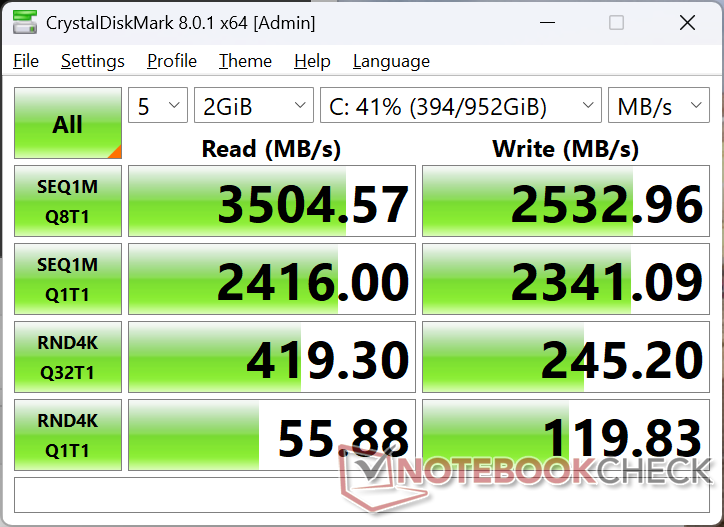
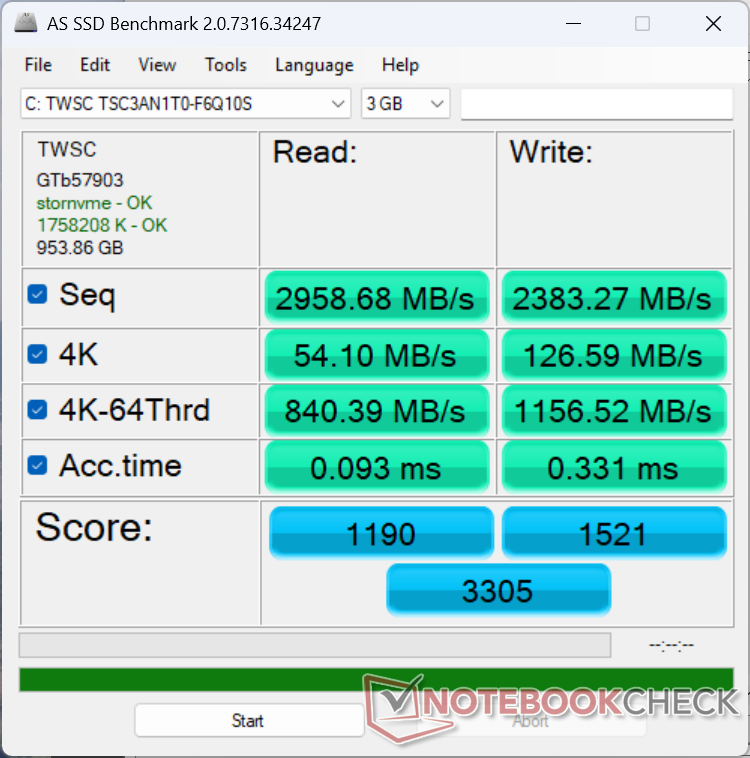
Dispositivos de armazenamento
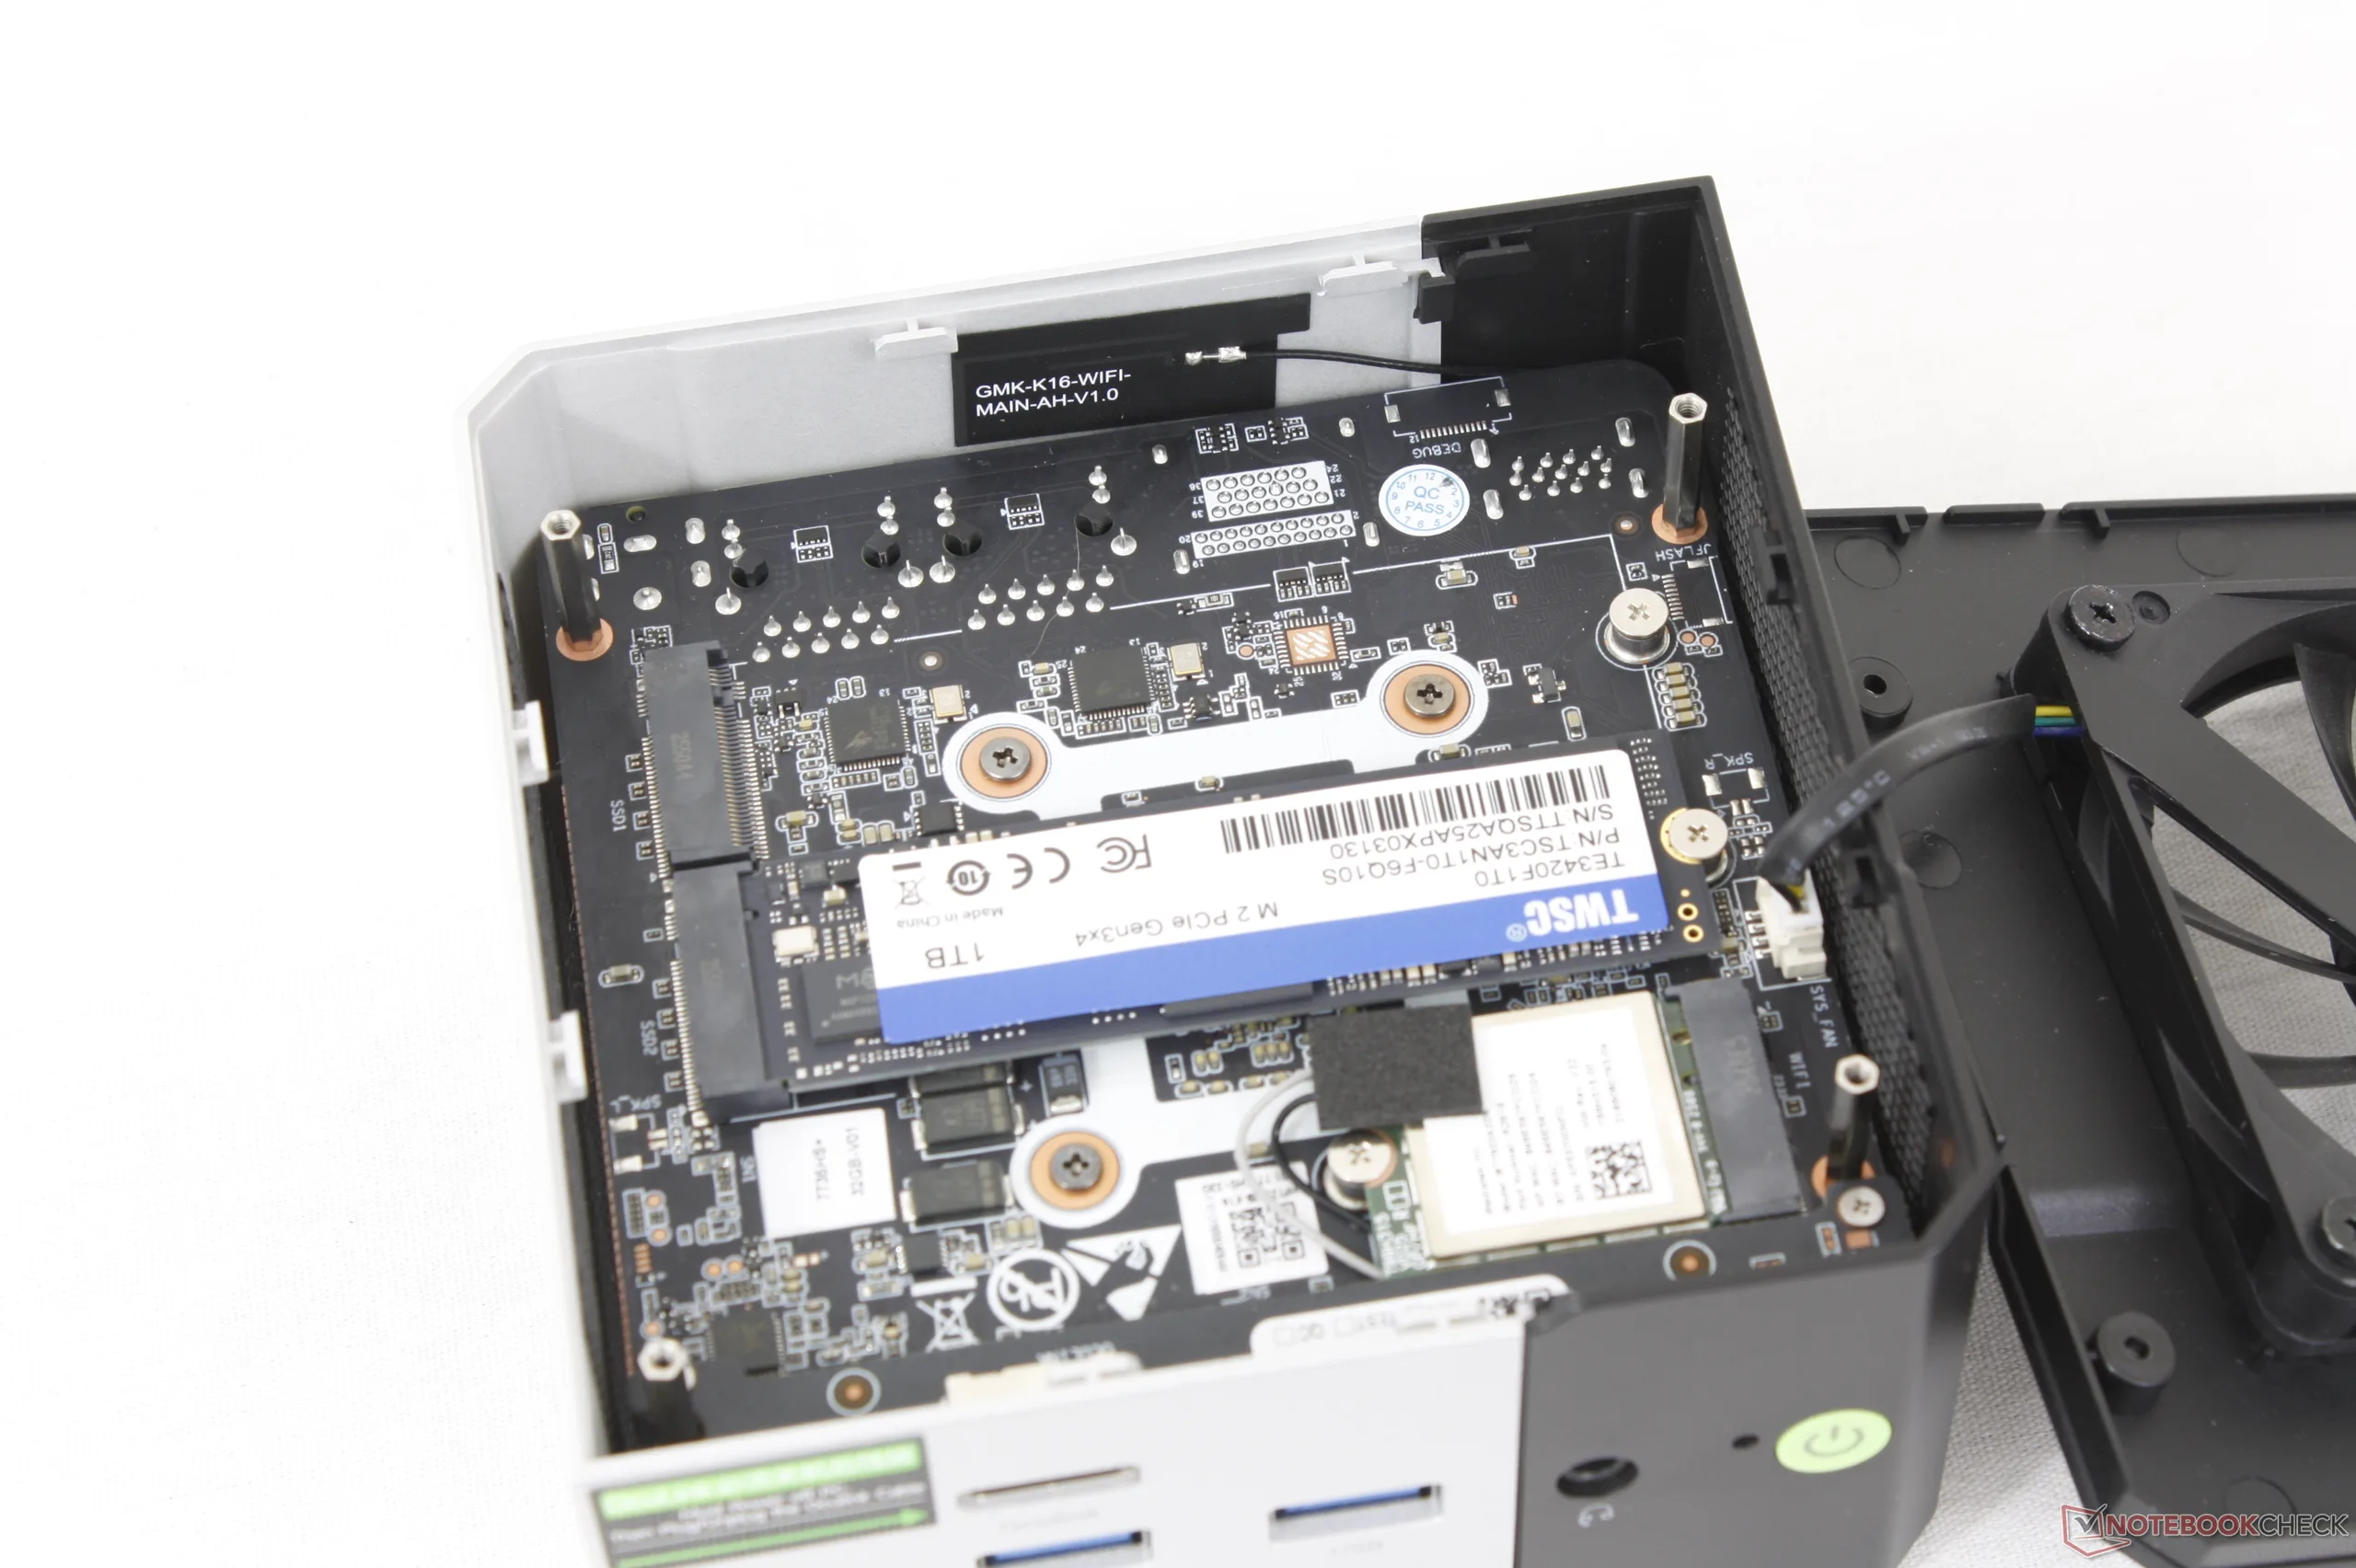
Nossa unidade de teste é fornecida com um TWSC TSC3AN1T0-F6Q10S em vez do Crucial P3 Plus, como encontrado no EVO-X1 mais caro do ano passado, provavelmente para economizar nos custos. O desempenho é um pouco mais lento, com taxas de transferência que chegam a 3.500 MB/s, conforme mostrado em nosso teste de estresse abaixo.

| Drive Performance rating - Percent | |
| Geekom A7 Max, R9 7940HS | |
| Asus NUC 15 Pro+ | |
| Beelink SER9 Pro | |
| MSI Cubi NUC AI+ 2MG | |
| GMK NucBox K13 | |
| GMK NucBox K16 | |
* ... menor é melhor
Limitação de disco: Loop de leitura do DiskSpd, profundidade da fila 8
Desempenho da GPU
O desempenho gráfico é mais lento do que o esperado, mesmo após a atualização para os drivers mais recentes, conforme publicado. as pontuações do 3DMark são cerca de 30% mais lentas do que a média dos PCs em nosso banco de dados equipados com a mesma Radeon 680M INTEGRADA. O desempenho decepcionante pode ser atribuído à lentidão dos resultados de leitura, gravação e cópia da RAM, conforme demonstrado pelos resultados do benchmark AIDA64 acima.
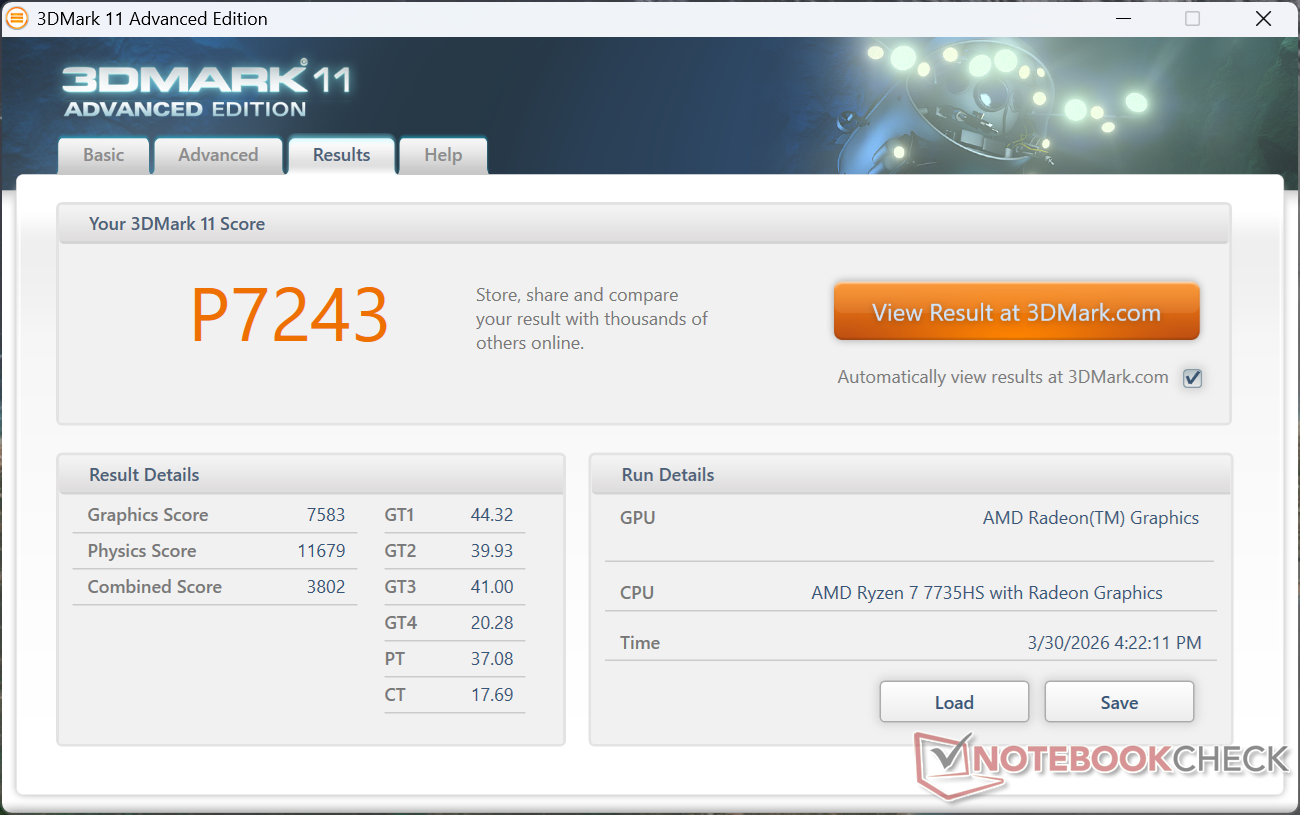
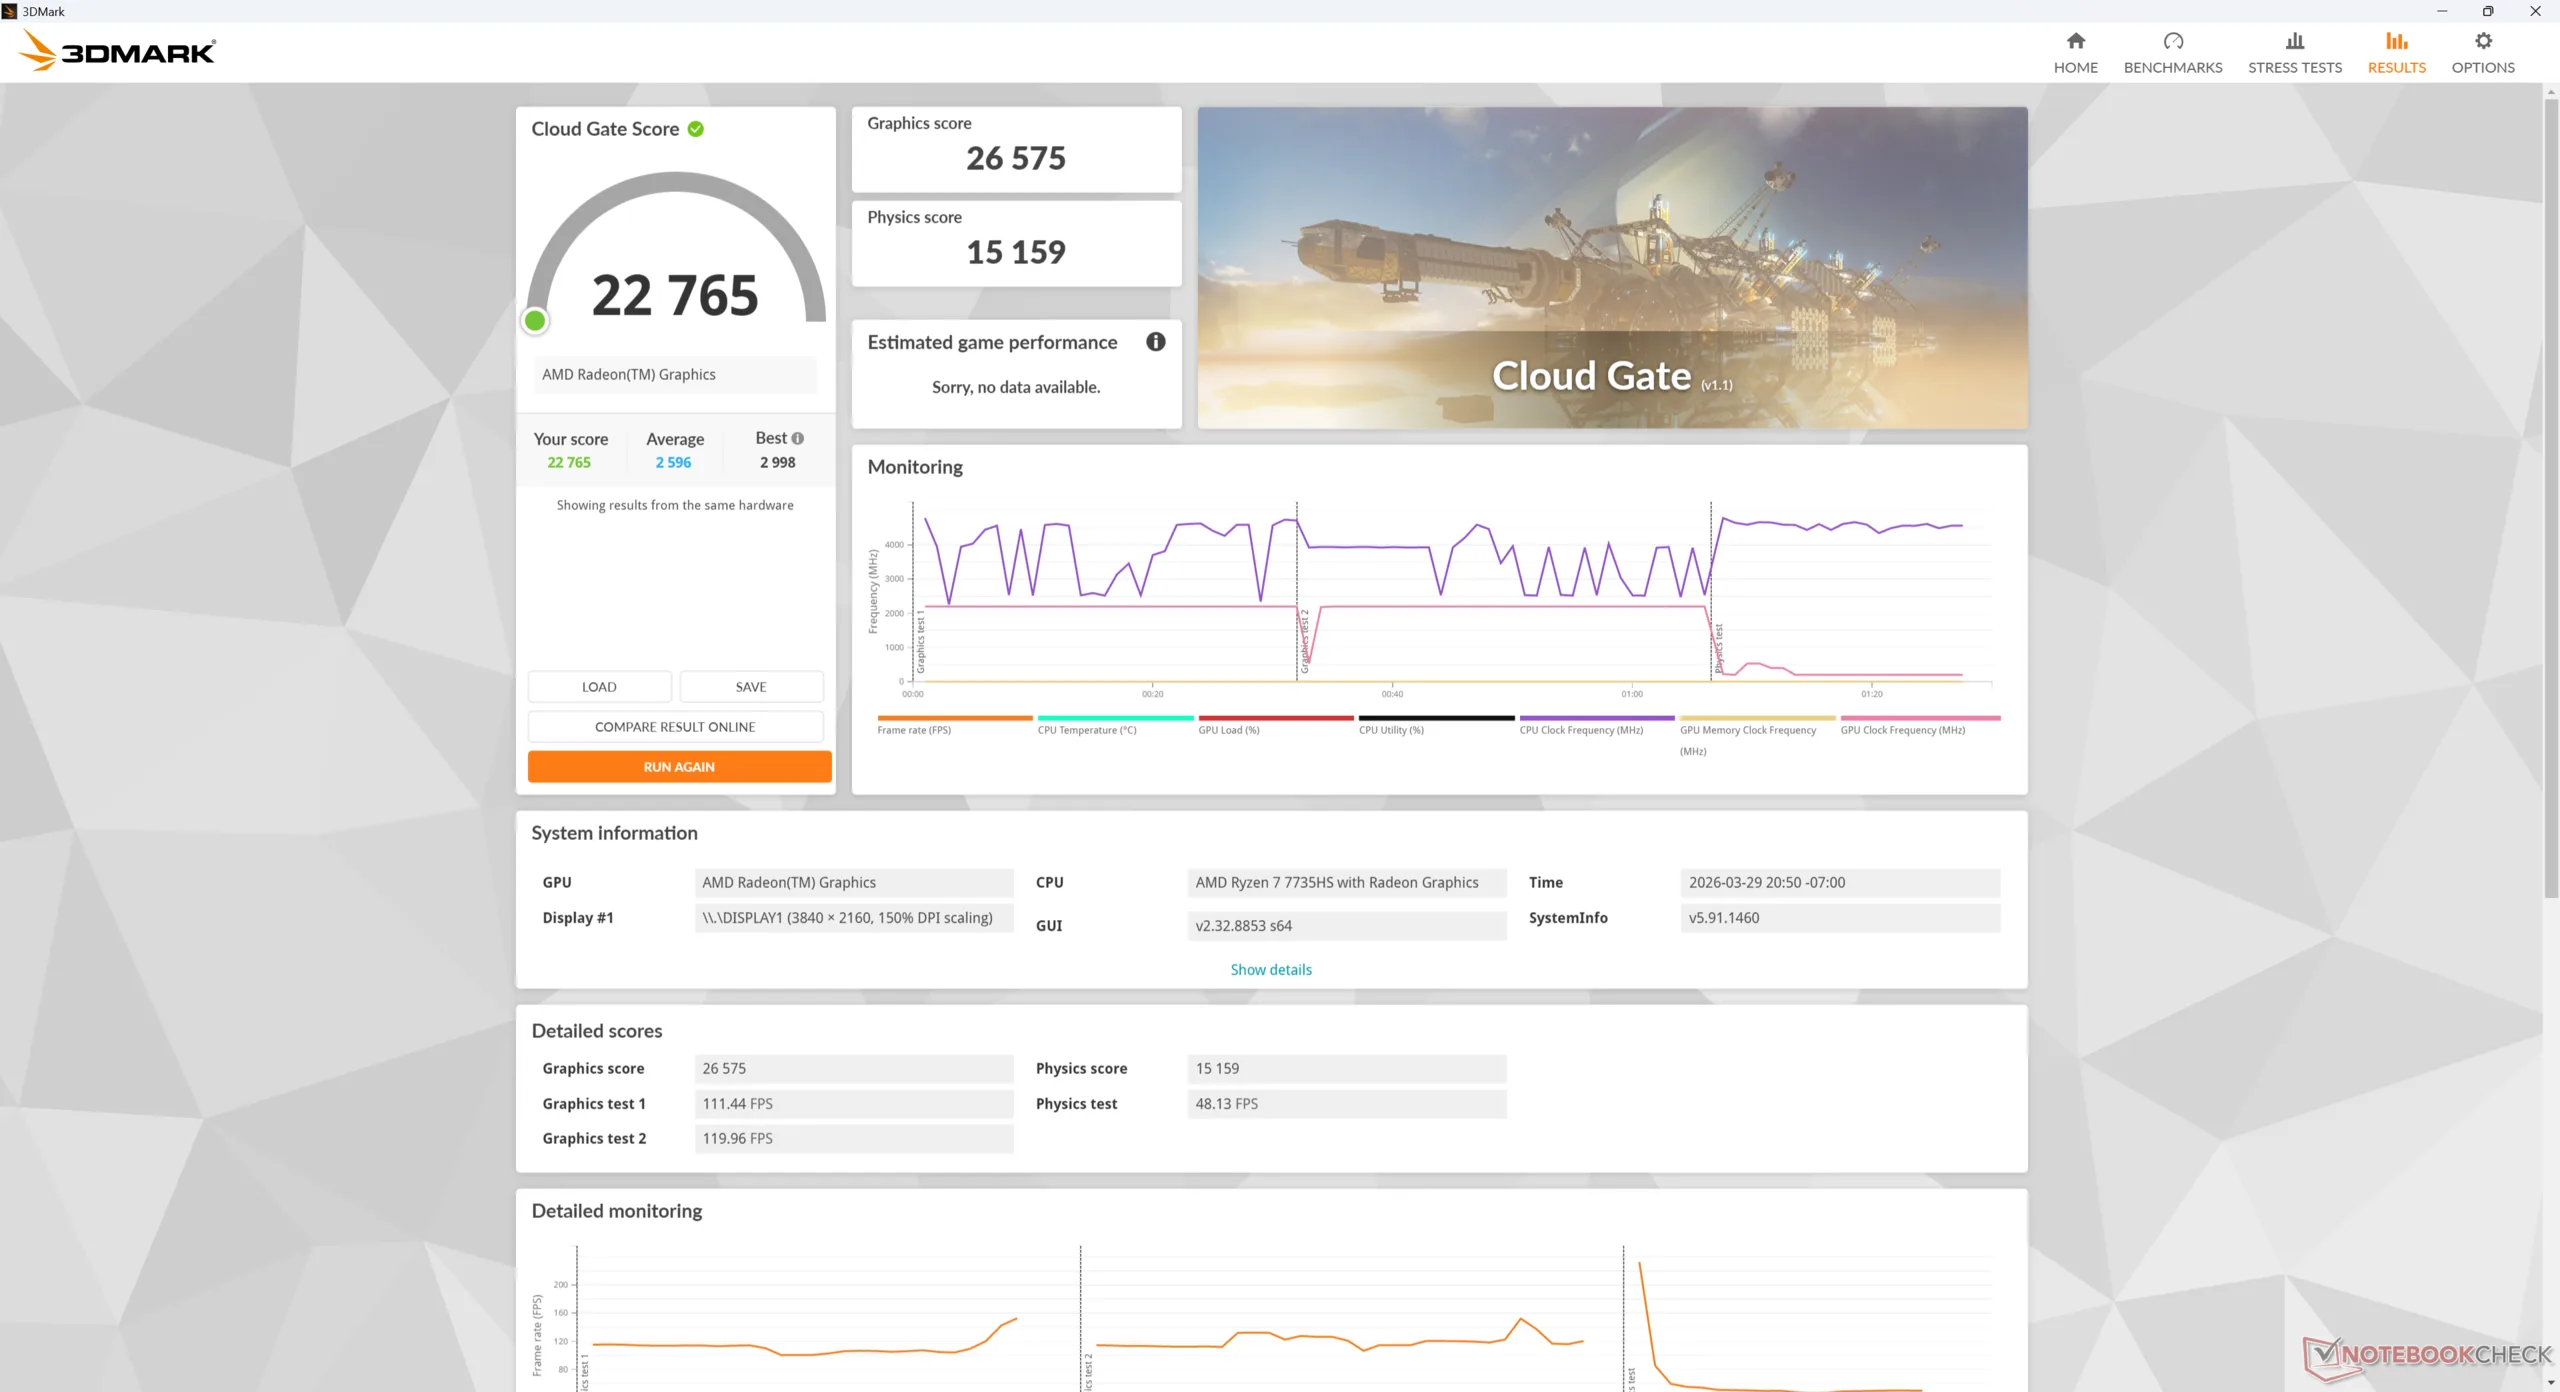
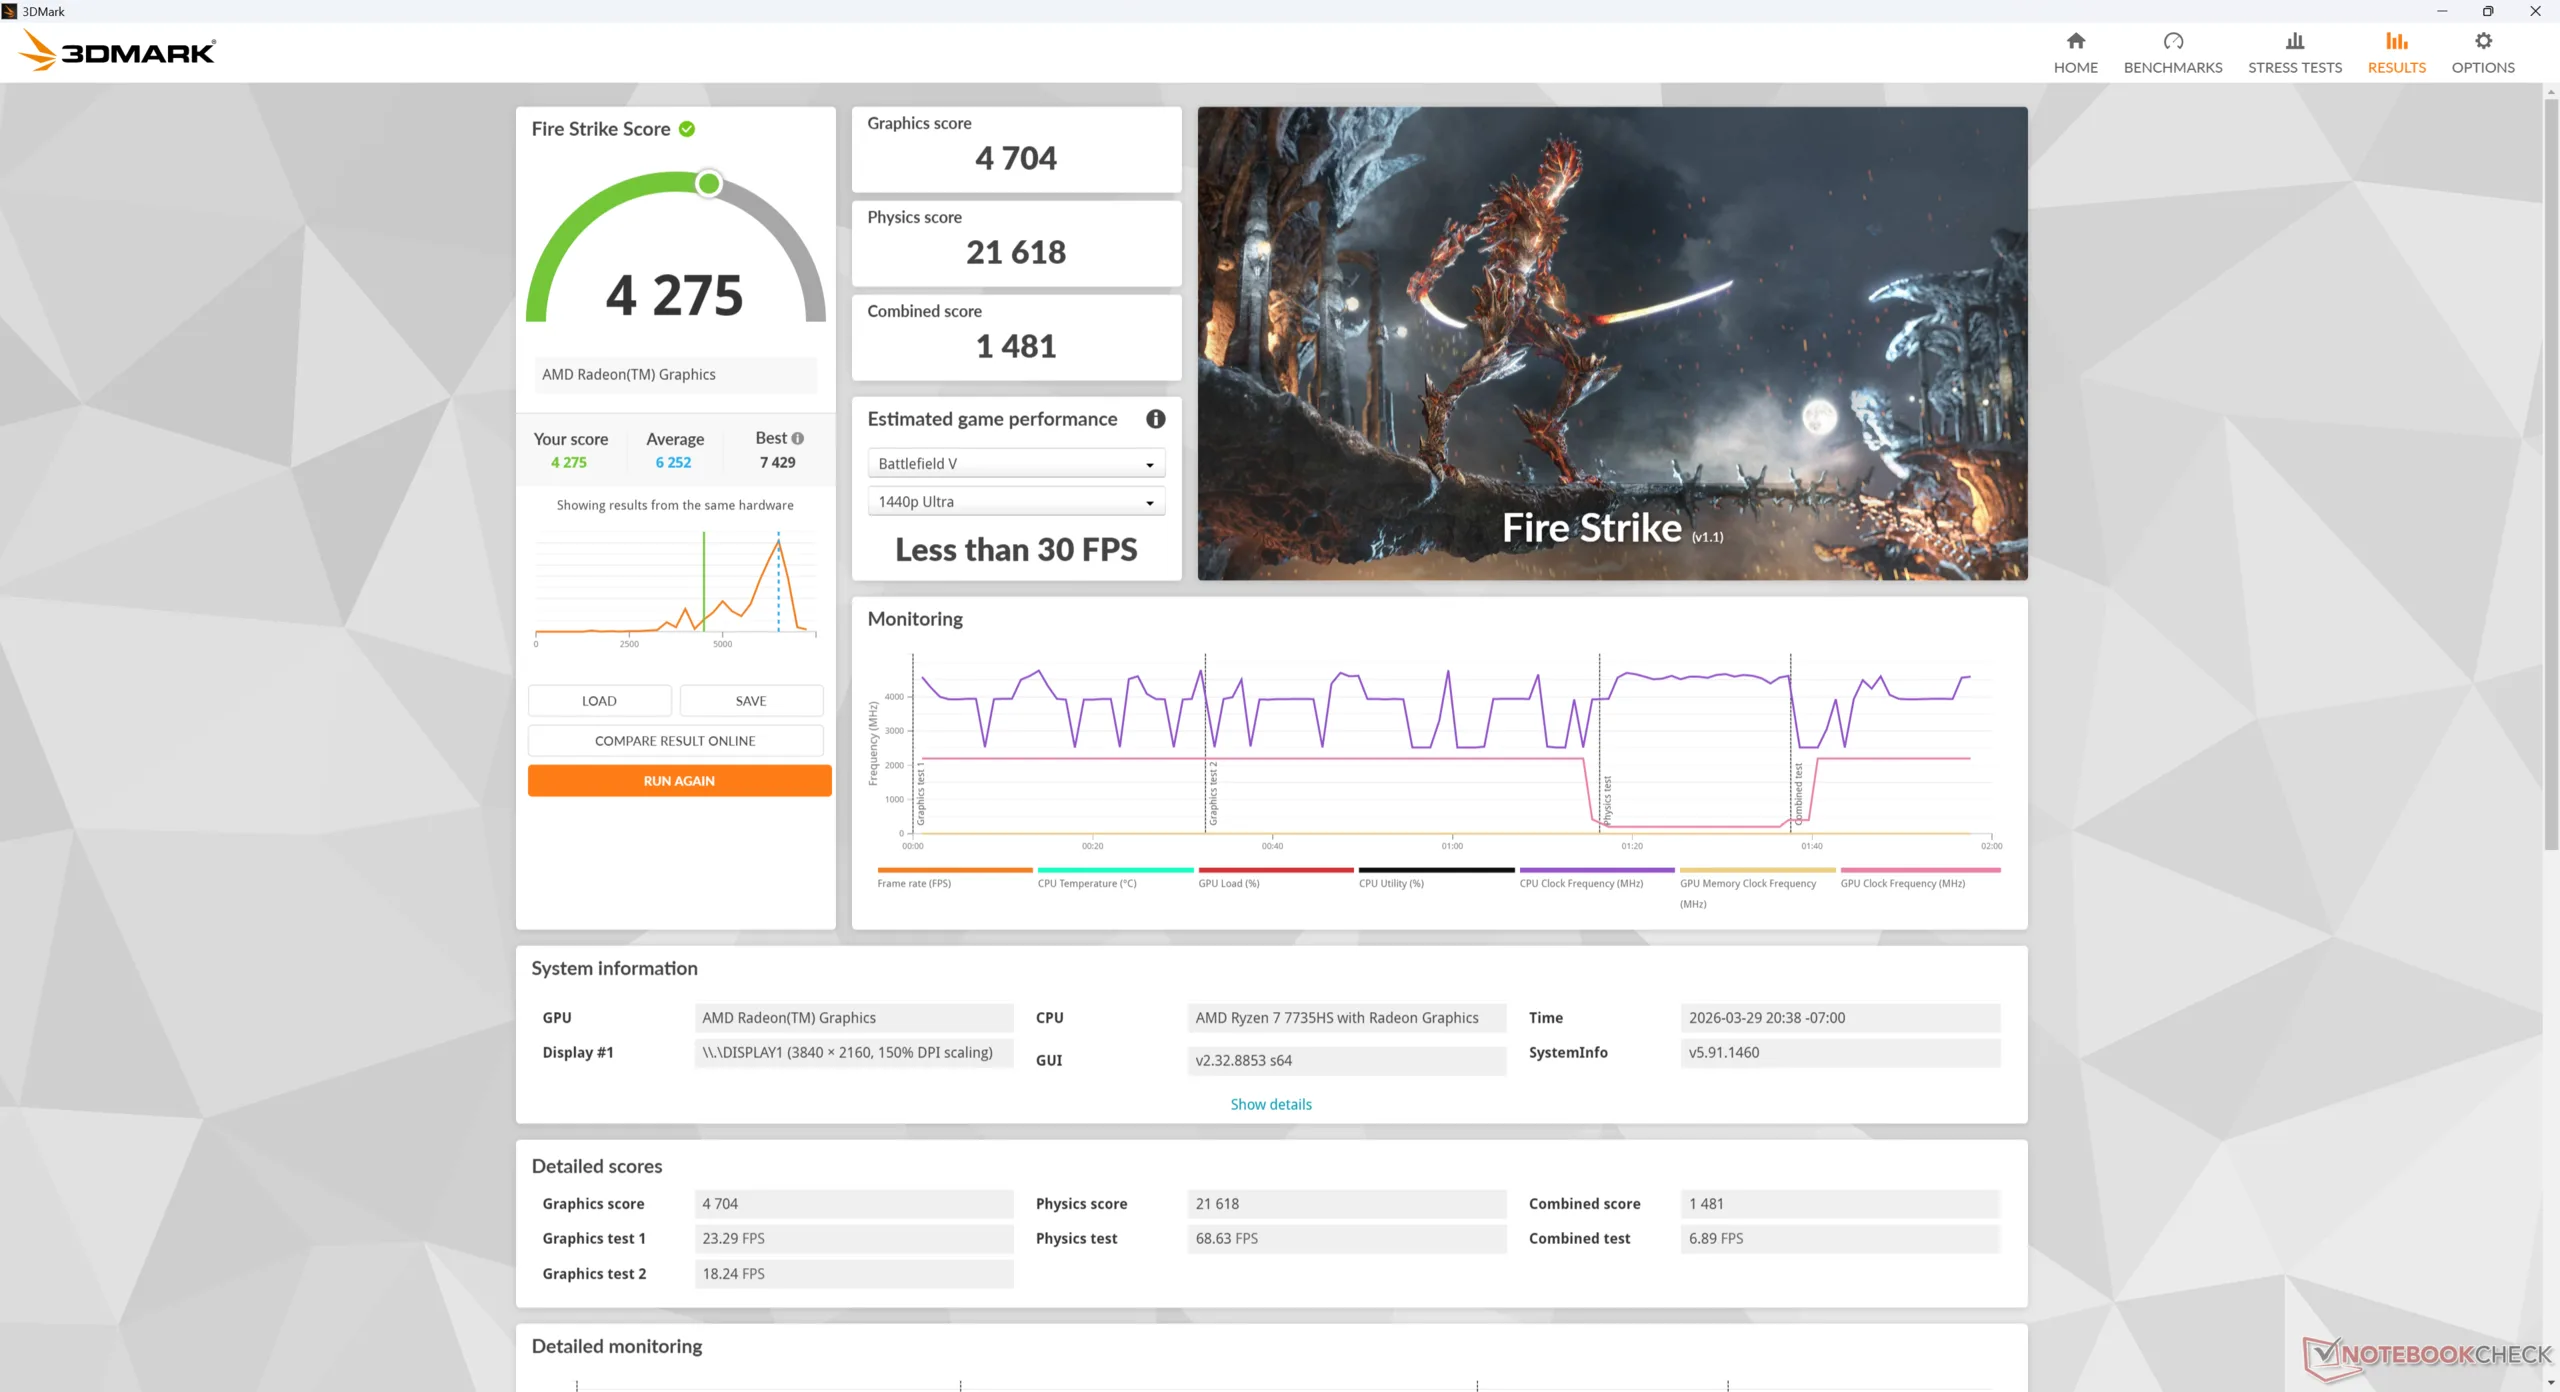
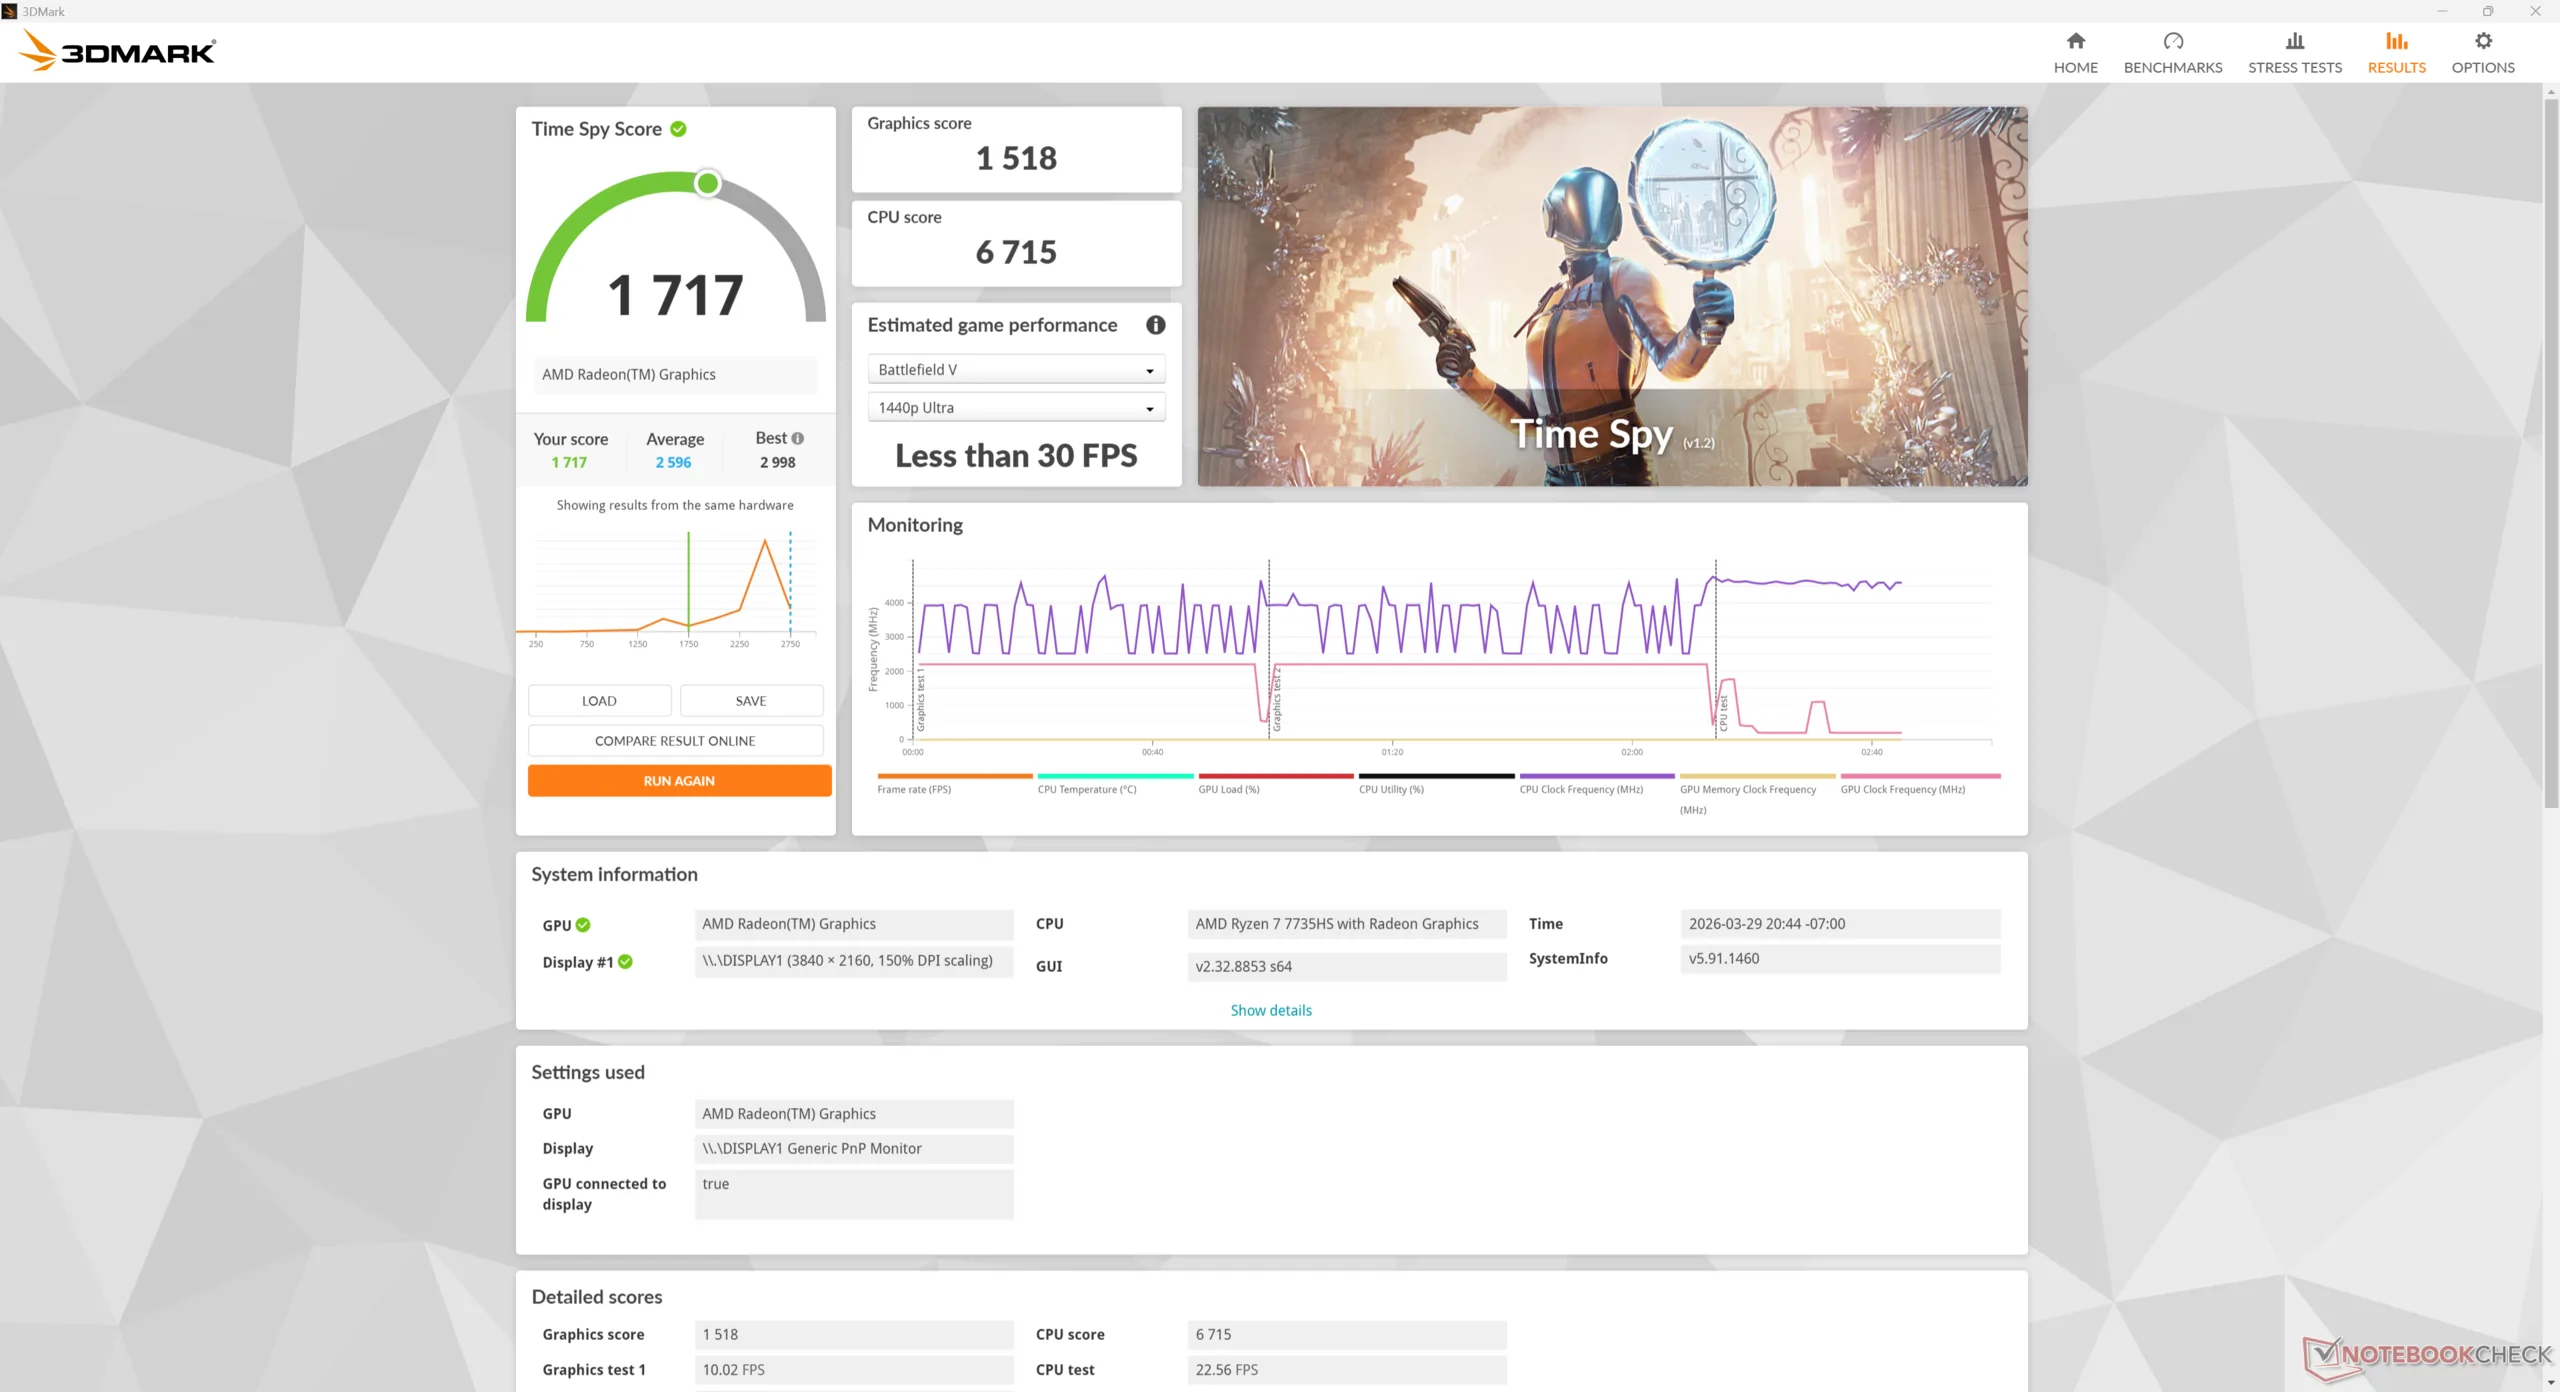
| 3DMark 11 Performance | 7243 pontos | |
| 3DMark Cloud Gate Standard Score | 22765 pontos | |
| 3DMark Fire Strike Score | 4275 pontos | |
| 3DMark Time Spy Score | 1717 pontos | |
Ajuda | ||
* ... menor é melhor
| Performance rating - Percent | |
| Asus NUC 15 Pro+ | |
| Beelink SER9 Pro | |
| MSI Cubi NUC AI+ 2MG | |
| GMK NucBox K13 | |
| Geekom A7 Max, R9 7940HS -1! | |
| GMK NucBox K16 | |
| Cyberpunk 2077 - 1920x1080 Ultra Preset (FSR off) | |
| Asus NUC 15 Pro+ | |
| Beelink SER9 Pro | |
| GMK NucBox K13 | |
| MSI Cubi NUC AI+ 2MG | |
| Geekom A7 Max, R9 7940HS | |
| GMK NucBox K16 | |
| Baldur's Gate 3 - 1920x1080 Ultra Preset AA:T | |
| Beelink SER9 Pro | |
| MSI Cubi NUC AI+ 2MG | |
| Asus NUC 15 Pro+ | |
| GMK NucBox K13 | |
| GMK NucBox K16 | |
| Geekom A7 Max, R9 7940HS | |
| GTA V - 1920x1080 Highest AA:4xMSAA + FX AF:16x | |
| Beelink SER9 Pro | |
| MSI Cubi NUC AI+ 2MG | |
| GMK NucBox K13 | |
| Asus NUC 15 Pro+ | |
| Geekom A7 Max, R9 7940HS | |
| GMK NucBox K16 | |
| Final Fantasy XV Benchmark - 1920x1080 High Quality | |
| Asus NUC 15 Pro+ | |
| Beelink SER9 Pro | |
| MSI Cubi NUC AI+ 2MG | |
| GMK NucBox K13 | |
| Geekom A7 Max, R9 7940HS | |
| GMK NucBox K16 | |
| Strange Brigade - 1920x1080 ultra AA:ultra AF:16 | |
| MSI Cubi NUC AI+ 2MG | |
| Asus NUC 15 Pro+ | |
| GMK NucBox K13 | |
| Beelink SER9 Pro | |
| GMK NucBox K16 | |
| Dota 2 Reborn - 1920x1080 ultra (3/3) best looking | |
| Asus NUC 15 Pro+ | |
| GMK NucBox K13 | |
| Beelink SER9 Pro | |
| MSI Cubi NUC AI+ 2MG | |
| Geekom A7 Max, R9 7940HS | |
| GMK NucBox K16 | |
| X-Plane 11.11 - 1920x1080 high (fps_test=3) | |
| Asus NUC 15 Pro+ | |
| Beelink SER9 Pro | |
| MSI Cubi NUC AI+ 2MG | |
| Geekom A7 Max, R9 7940HS | |
| GMK NucBox K16 | |
| GMK NucBox K13 | |
| F1 24 | |
| 1920x1080 Low Preset AA:T AF:16x | |
| Khadas Mind Pro | |
| Beelink SER9 Pro | |
| Asus NUC 15 Pro+ | |
| GMK NucBox K13 | |
| MSI Cubi NUC AI+ 2MG | |
| GMK NucBox M7 Ultra | |
| Média AMD Radeon 680M (42.8 - 72.2, n=5) | |
| Geekom A7 Max, R9 7940HS | |
| GMK NucBox K16 | |
| 1920x1080 Medium Preset AA:T AF:16x | |
| Khadas Mind Pro | |
| GMK NucBox K13 | |
| Beelink SER9 Pro | |
| Asus NUC 15 Pro+ | |
| GMK NucBox M7 Ultra | |
| Média AMD Radeon 680M (35.8 - 64.3, n=5) | |
| Geekom A7 Max, R9 7940HS | |
| GMK NucBox K16 | |
| 1920x1080 High Preset AA:T AF:16x | |
| Khadas Mind Pro | |
| GMK NucBox K13 | |
| Asus NUC 15 Pro+ | |
| Beelink SER9 Pro | |
| MSI Cubi NUC AI+ 2MG | |
| GMK NucBox M7 Ultra | |
| Média AMD Radeon 680M (23.7 - 46, n=5) | |
| Geekom A7 Max, R9 7940HS | |
| GMK NucBox K16 | |
| 1920x1080 Ultra High Preset AA:T AF:16x | |
| Khadas Mind Pro | |
| Asus NUC 15 Pro+ | |
| GMK NucBox K13 | |
| MSI Cubi NUC AI+ 2MG | |
| Beelink SER9 Pro | |
| Média AMD Radeon 680M (7.41 - 9.53, n=4) | |
| GMK NucBox K16 | |
| 1280x720 Ultra Low Preset AA:T | |
| MSI Cubi NUC AI+ 2MG | |
Gráfico de ultra FPS do Cyberpunk 2077
| baixo | média | alto | ultra | |
|---|---|---|---|---|
| GTA V (2015) | 88.3 | 82.2 | 29.4 | 13.1 |
| Dota 2 Reborn (2015) | 101.2 | 82.8 | 59.8 | 52.2 |
| Final Fantasy XV Benchmark (2018) | 41.2 | 22.1 | 15.8 | |
| X-Plane 11.11 (2018) | 42.3 | 34.2 | 30 | |
| Strange Brigade (2018) | 85.7 | 35.5 | 30.4 | 25.3 |
| Baldur's Gate 3 (2023) | 24.8 | 20.7 | 16.6 | 16.5 |
| Cyberpunk 2077 (2023) | 23.3 | 18.6 | 14.3 | 12.6 |
| F1 24 (2024) | 42.8 | 35.8 | 23.7 | 7.62 |
Emissões
Ruído do sistema
As ventoinhas estão sempre ativas, independentemente da carga na tela. Embora não seja muito alto, há um zumbido constante mesmo durante cargas baixas, como navegação na Web ou streaming de vídeo. Cargas mais altas, como jogos, podem aumentar o ruído da ventoinha em até 50 dB(A), sendo mais alto do que na maioria dos laptops ultrafinos.
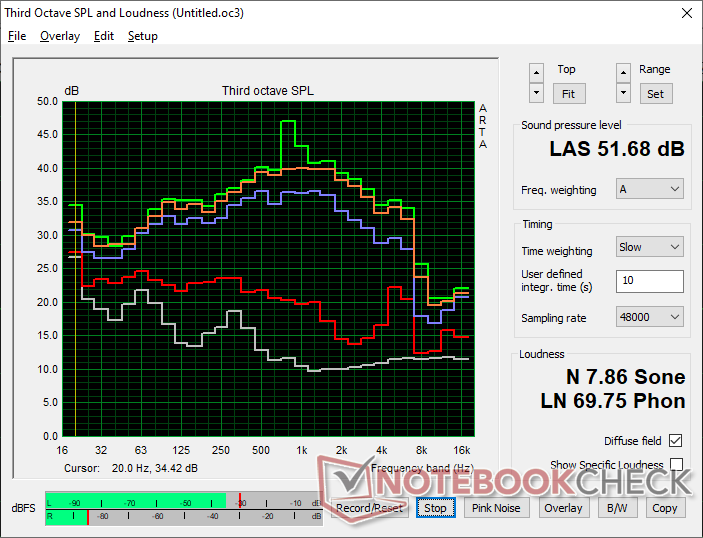
Barulho
| Ocioso |
| 30.9 / 31.6 / 31.6 dB |
| Carga |
| 45.3 / 51.7 dB |
 | ||
30 dB silencioso 40 dB(A) audível 50 dB(A) ruidosamente alto |
||
min: | ||
| GMK NucBox K16 R7 7735HS, Radeon 680M | GMK NucBox K13 Core Ultra 7 256V, Arc 140V | Beelink SER9 Pro Ryzen 7 H 255, Radeon 780M | Geekom A7 Max, R9 7940HS R9 7940HS, Radeon 780M | Asus NUC 15 Pro+ Ultra 9 285H, Arc 140T | MSI Cubi NUC AI+ 2MG Core Ultra 7 258V, Arc 140V | |
|---|---|---|---|---|---|---|
| Noise | 14% | 15% | 11% | 3% | 3% | |
| desligado / ambiente * (dB) | 23.6 | 23.3 1% | 23 3% | 24.7 -5% | 25.3 -7% | 24.8 -5% |
| Idle Minimum * (dB) | 30.9 | 24.5 21% | 29.1 6% | 25.5 17% | 25.4 18% | 28 9% |
| Idle Average * (dB) | 31.6 | 25 21% | 30.1 5% | 25.6 19% | 25.5 19% | 36.1 -14% |
| Idle Maximum * (dB) | 31.6 | 25.1 21% | 31.7 -0% | 25.7 19% | 37.3 -18% | 36.1 -14% |
| Load Average * (dB) | 45.3 | 40.1 11% | 33.7 26% | 43 5% | 44.4 2% | 38.9 14% |
| Cyberpunk 2077 ultra * (dB) | 49.2 | 44.2 10% | 33.8 31% | 44.9 9% | 46.2 6% | 37 25% |
| Load Maximum * (dB) | 51.7 | 45.1 13% | 35.2 32% | 45 13% | 52.7 -2% | 49.2 5% |
| Witcher 3 ultra * (dB) | 44.9 | 47.7 |
* ... menor é melhor
Temperatura
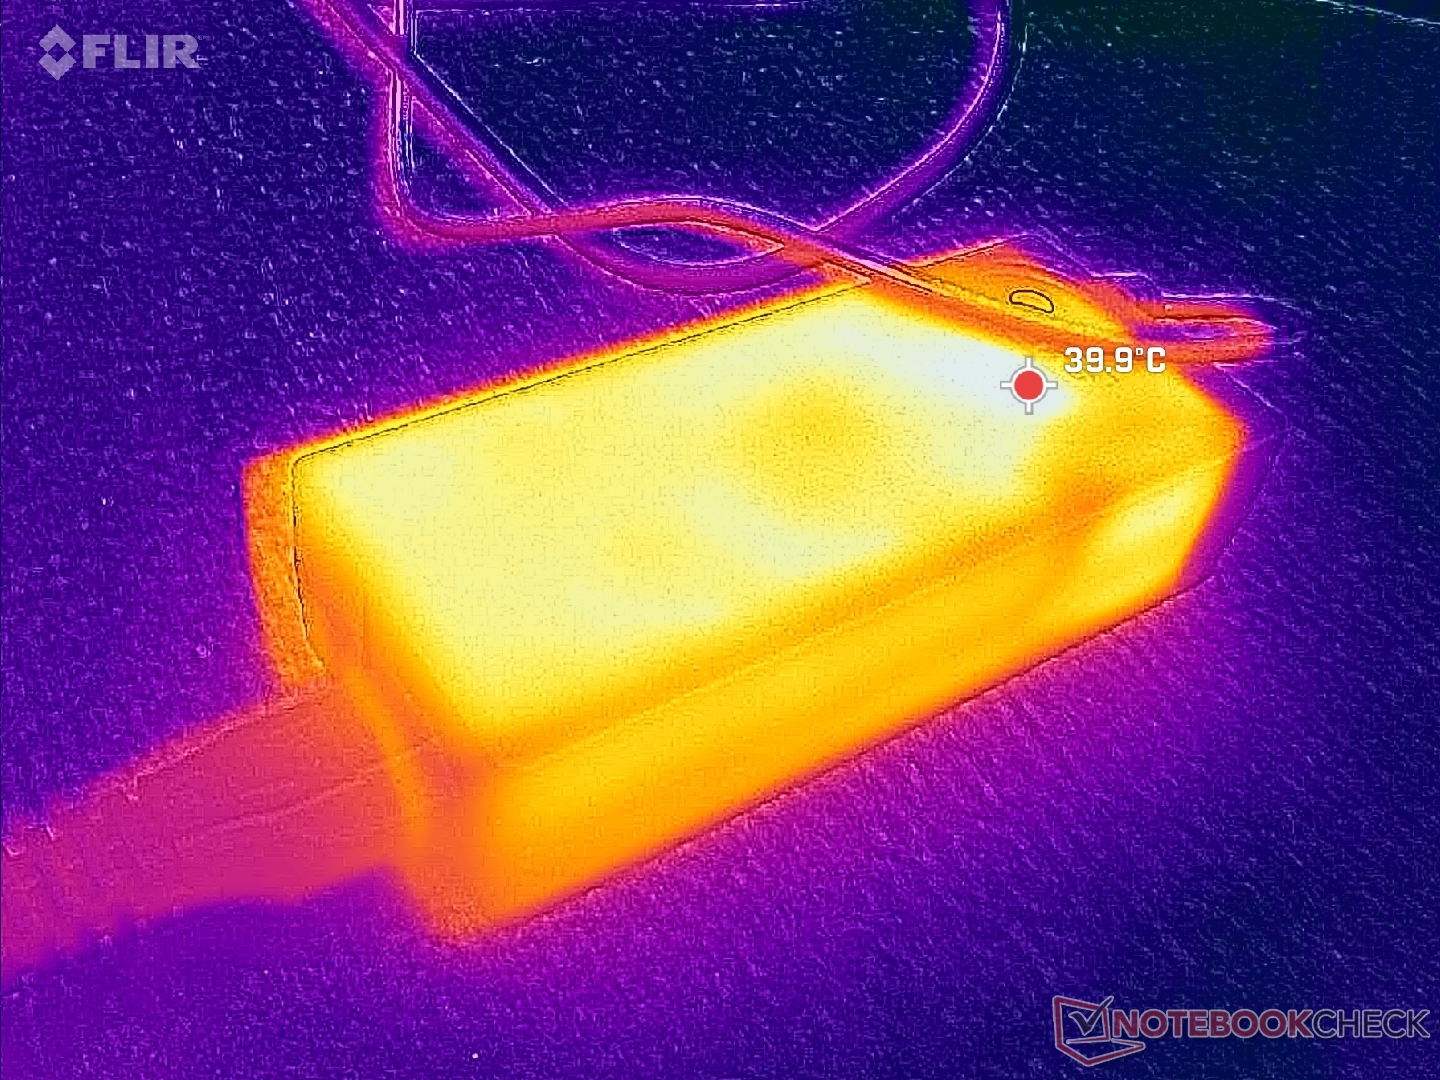
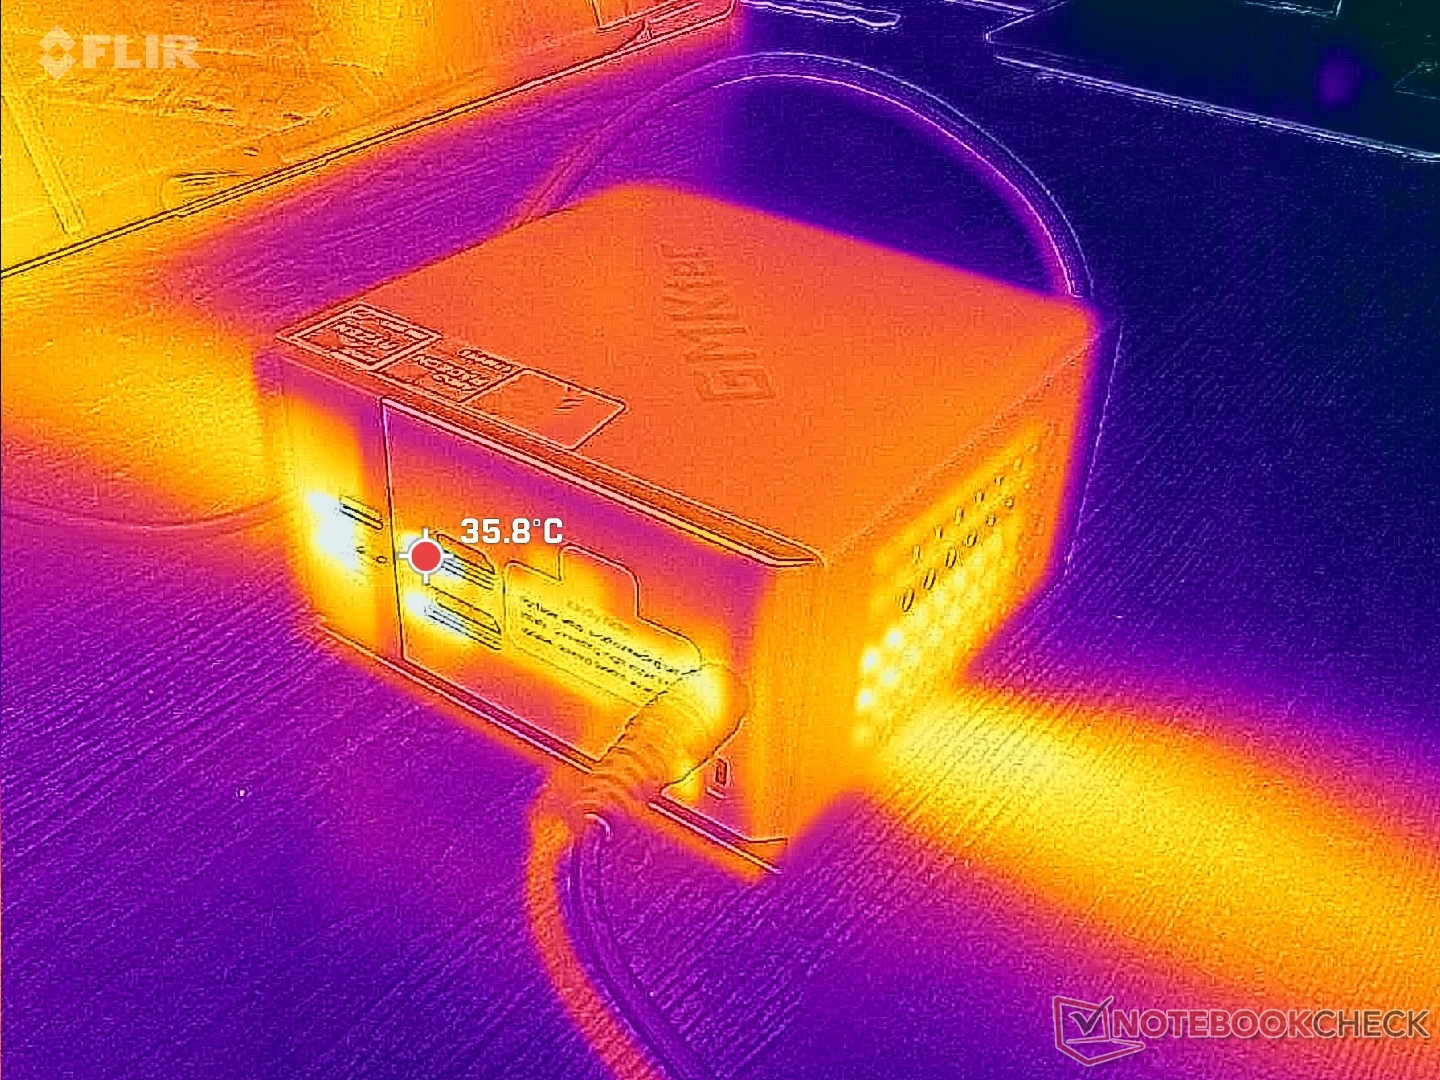
O ar fresco entra pelas fendas ao longo da borda superior da unidade antes de sair pelos dois lados da unidade. Em contrapartida, o calor residual sai pela parte traseira na maioria dos outros designs de minicomputadores. Posicionar o NucBox K16 de lado, portanto, cobriria as grades de exaustão e poderia afetar a temperatura e o desempenho.
(+) A temperatura máxima no lado superior é 28.4 °C / 83 F, em comparação com a média de 35.4 °C / 96 F , variando de 20.6 a 69.5 °C para a classe Mini PC.
(+) A parte inferior aquece até um máximo de 29.4 °C / 85 F, em comparação com a média de 36.1 °C / 97 F
(+) Em uso inativo, a temperatura média para o lado superior é 23.2 °C / 74 F, em comparação com a média do dispositivo de 32.1 °C / ### class_avg_f### F.
Teste de estresse
A CPU se estabilizaria em 4,1 GHz, 50 W e 81 C ao executar o estresse do Prime95, que é realmente mais quente do que o que registramos no EVO-X1 com a CPU Zen 5 mais nova e mais rápida. A temperatura central continuaria a ser mais quente em alguns graus C durante a execução de jogos também. O NucBox K13 com o Core Ultra 7 256V, mais eficiente, oferece um desempenho mais rápido em jogos e uma temperatura de funcionamento mais baixa.
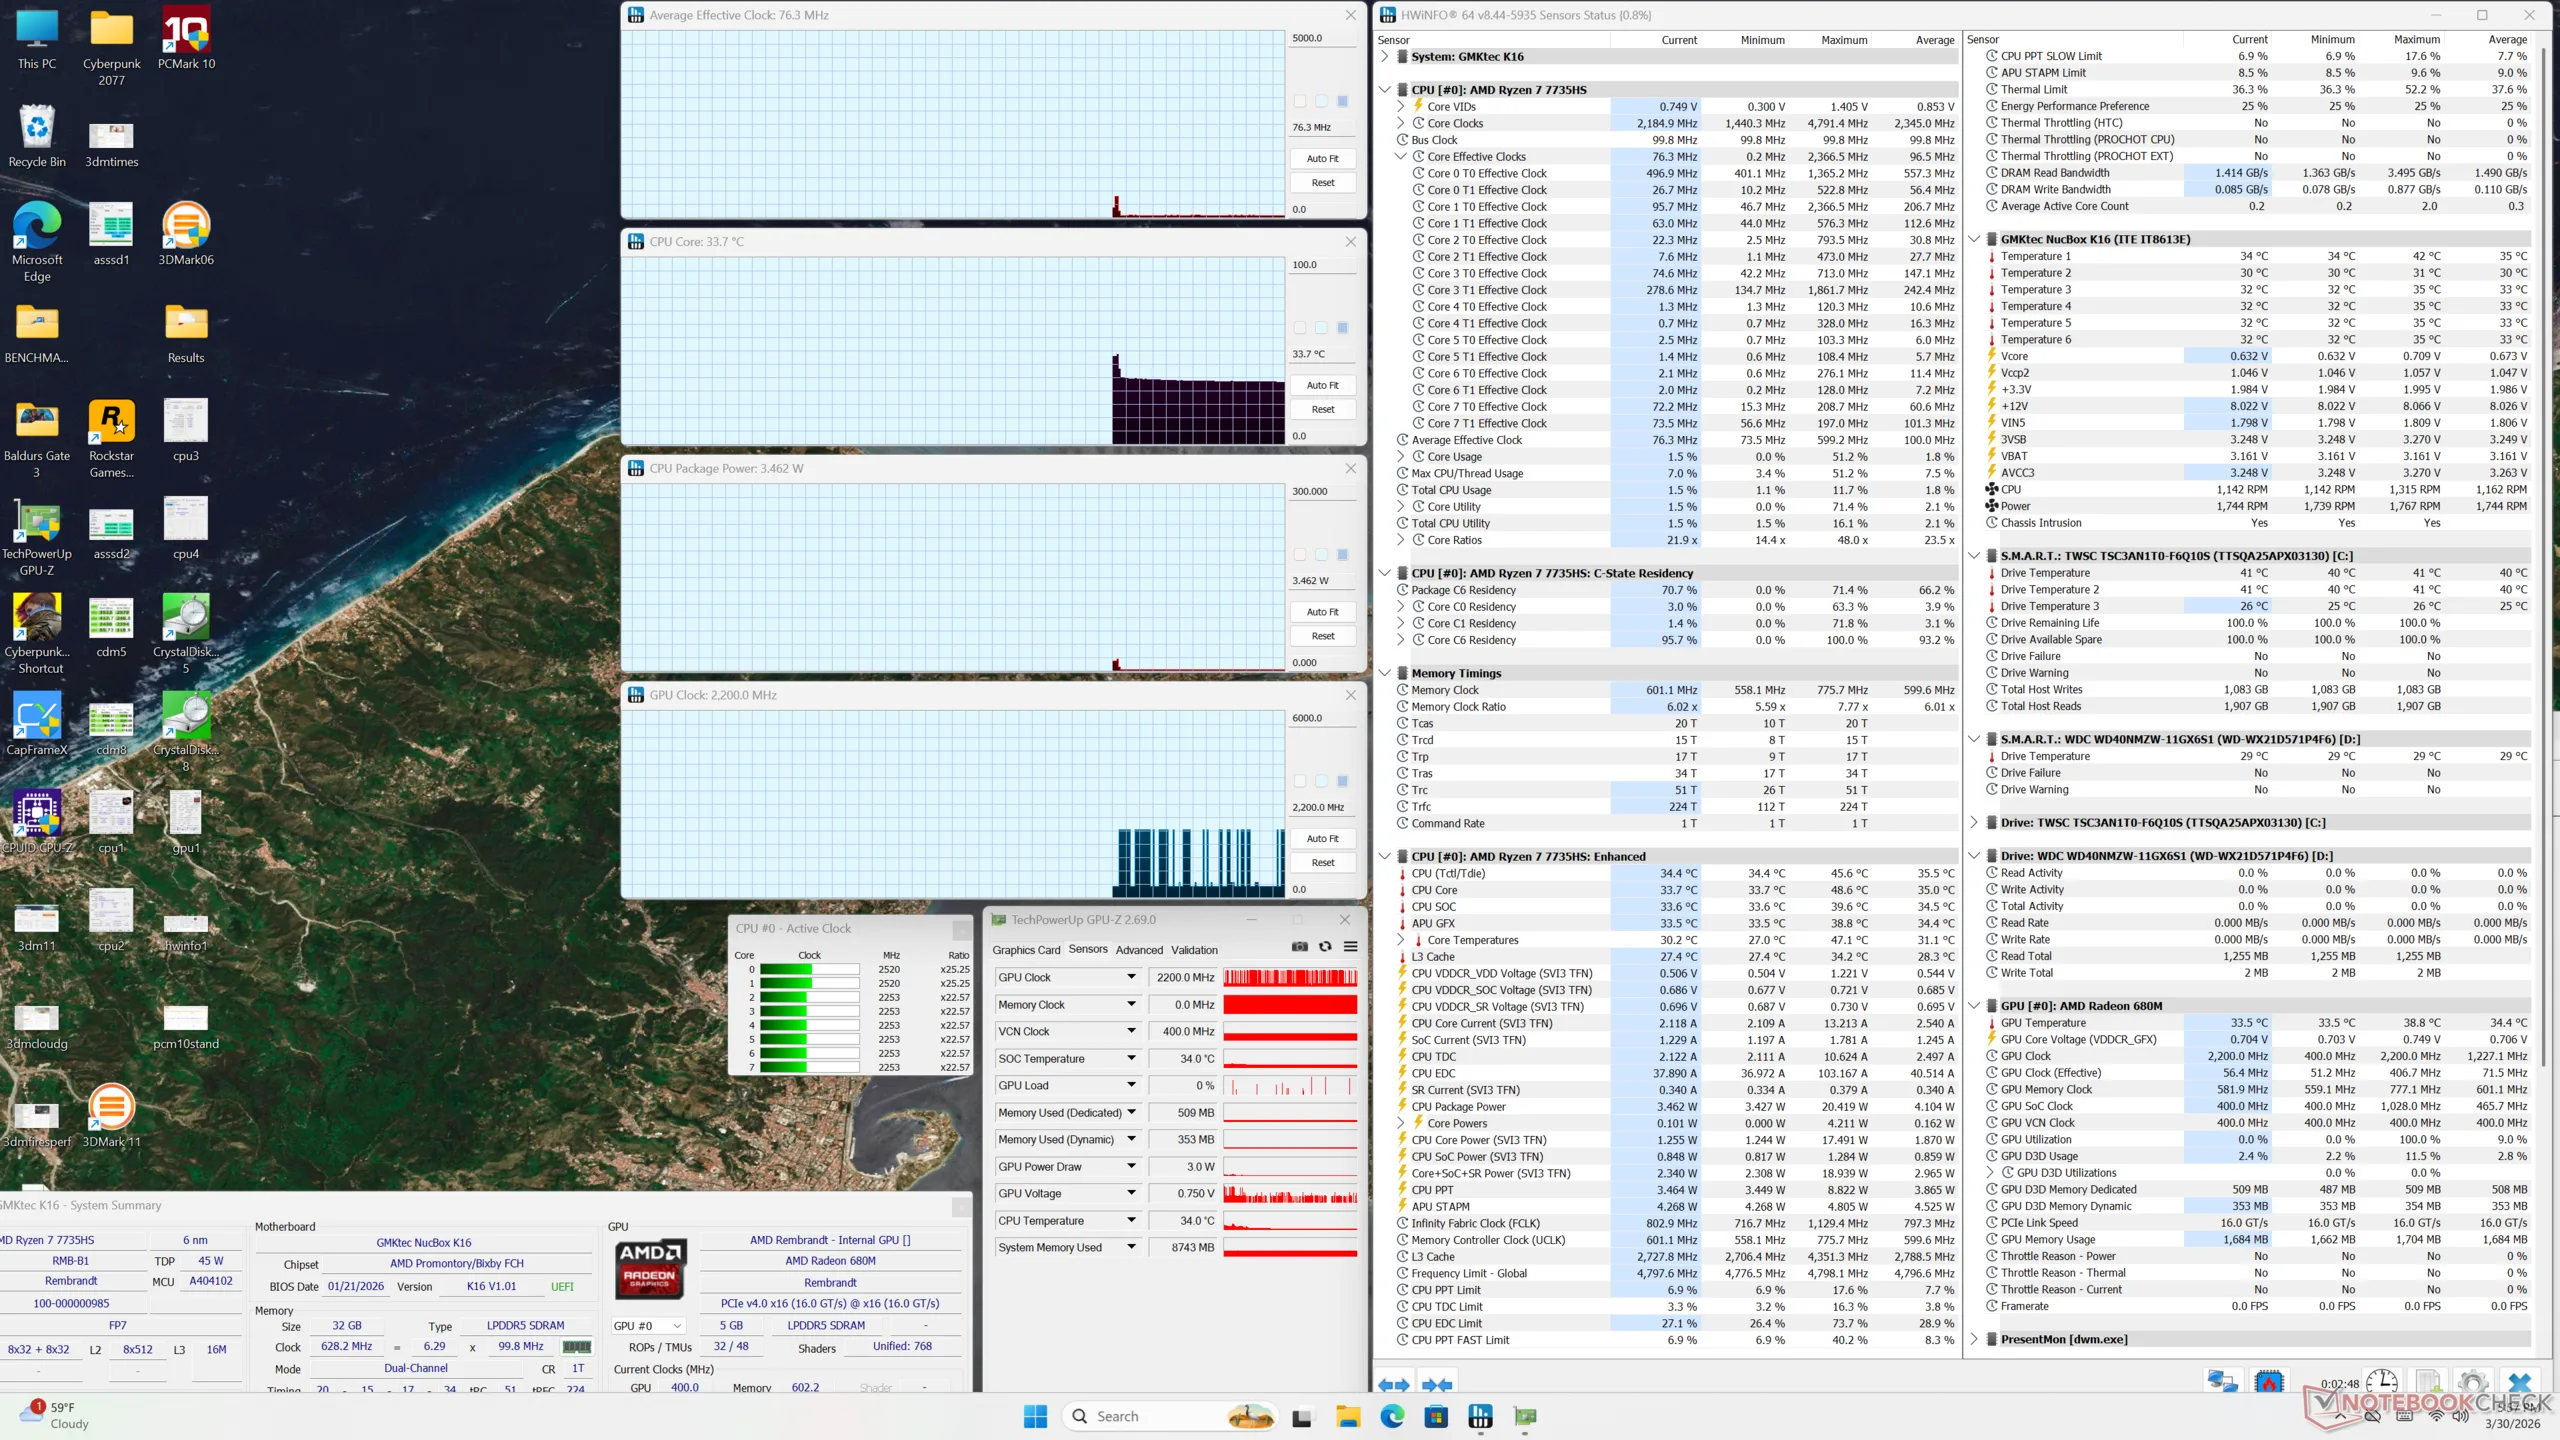
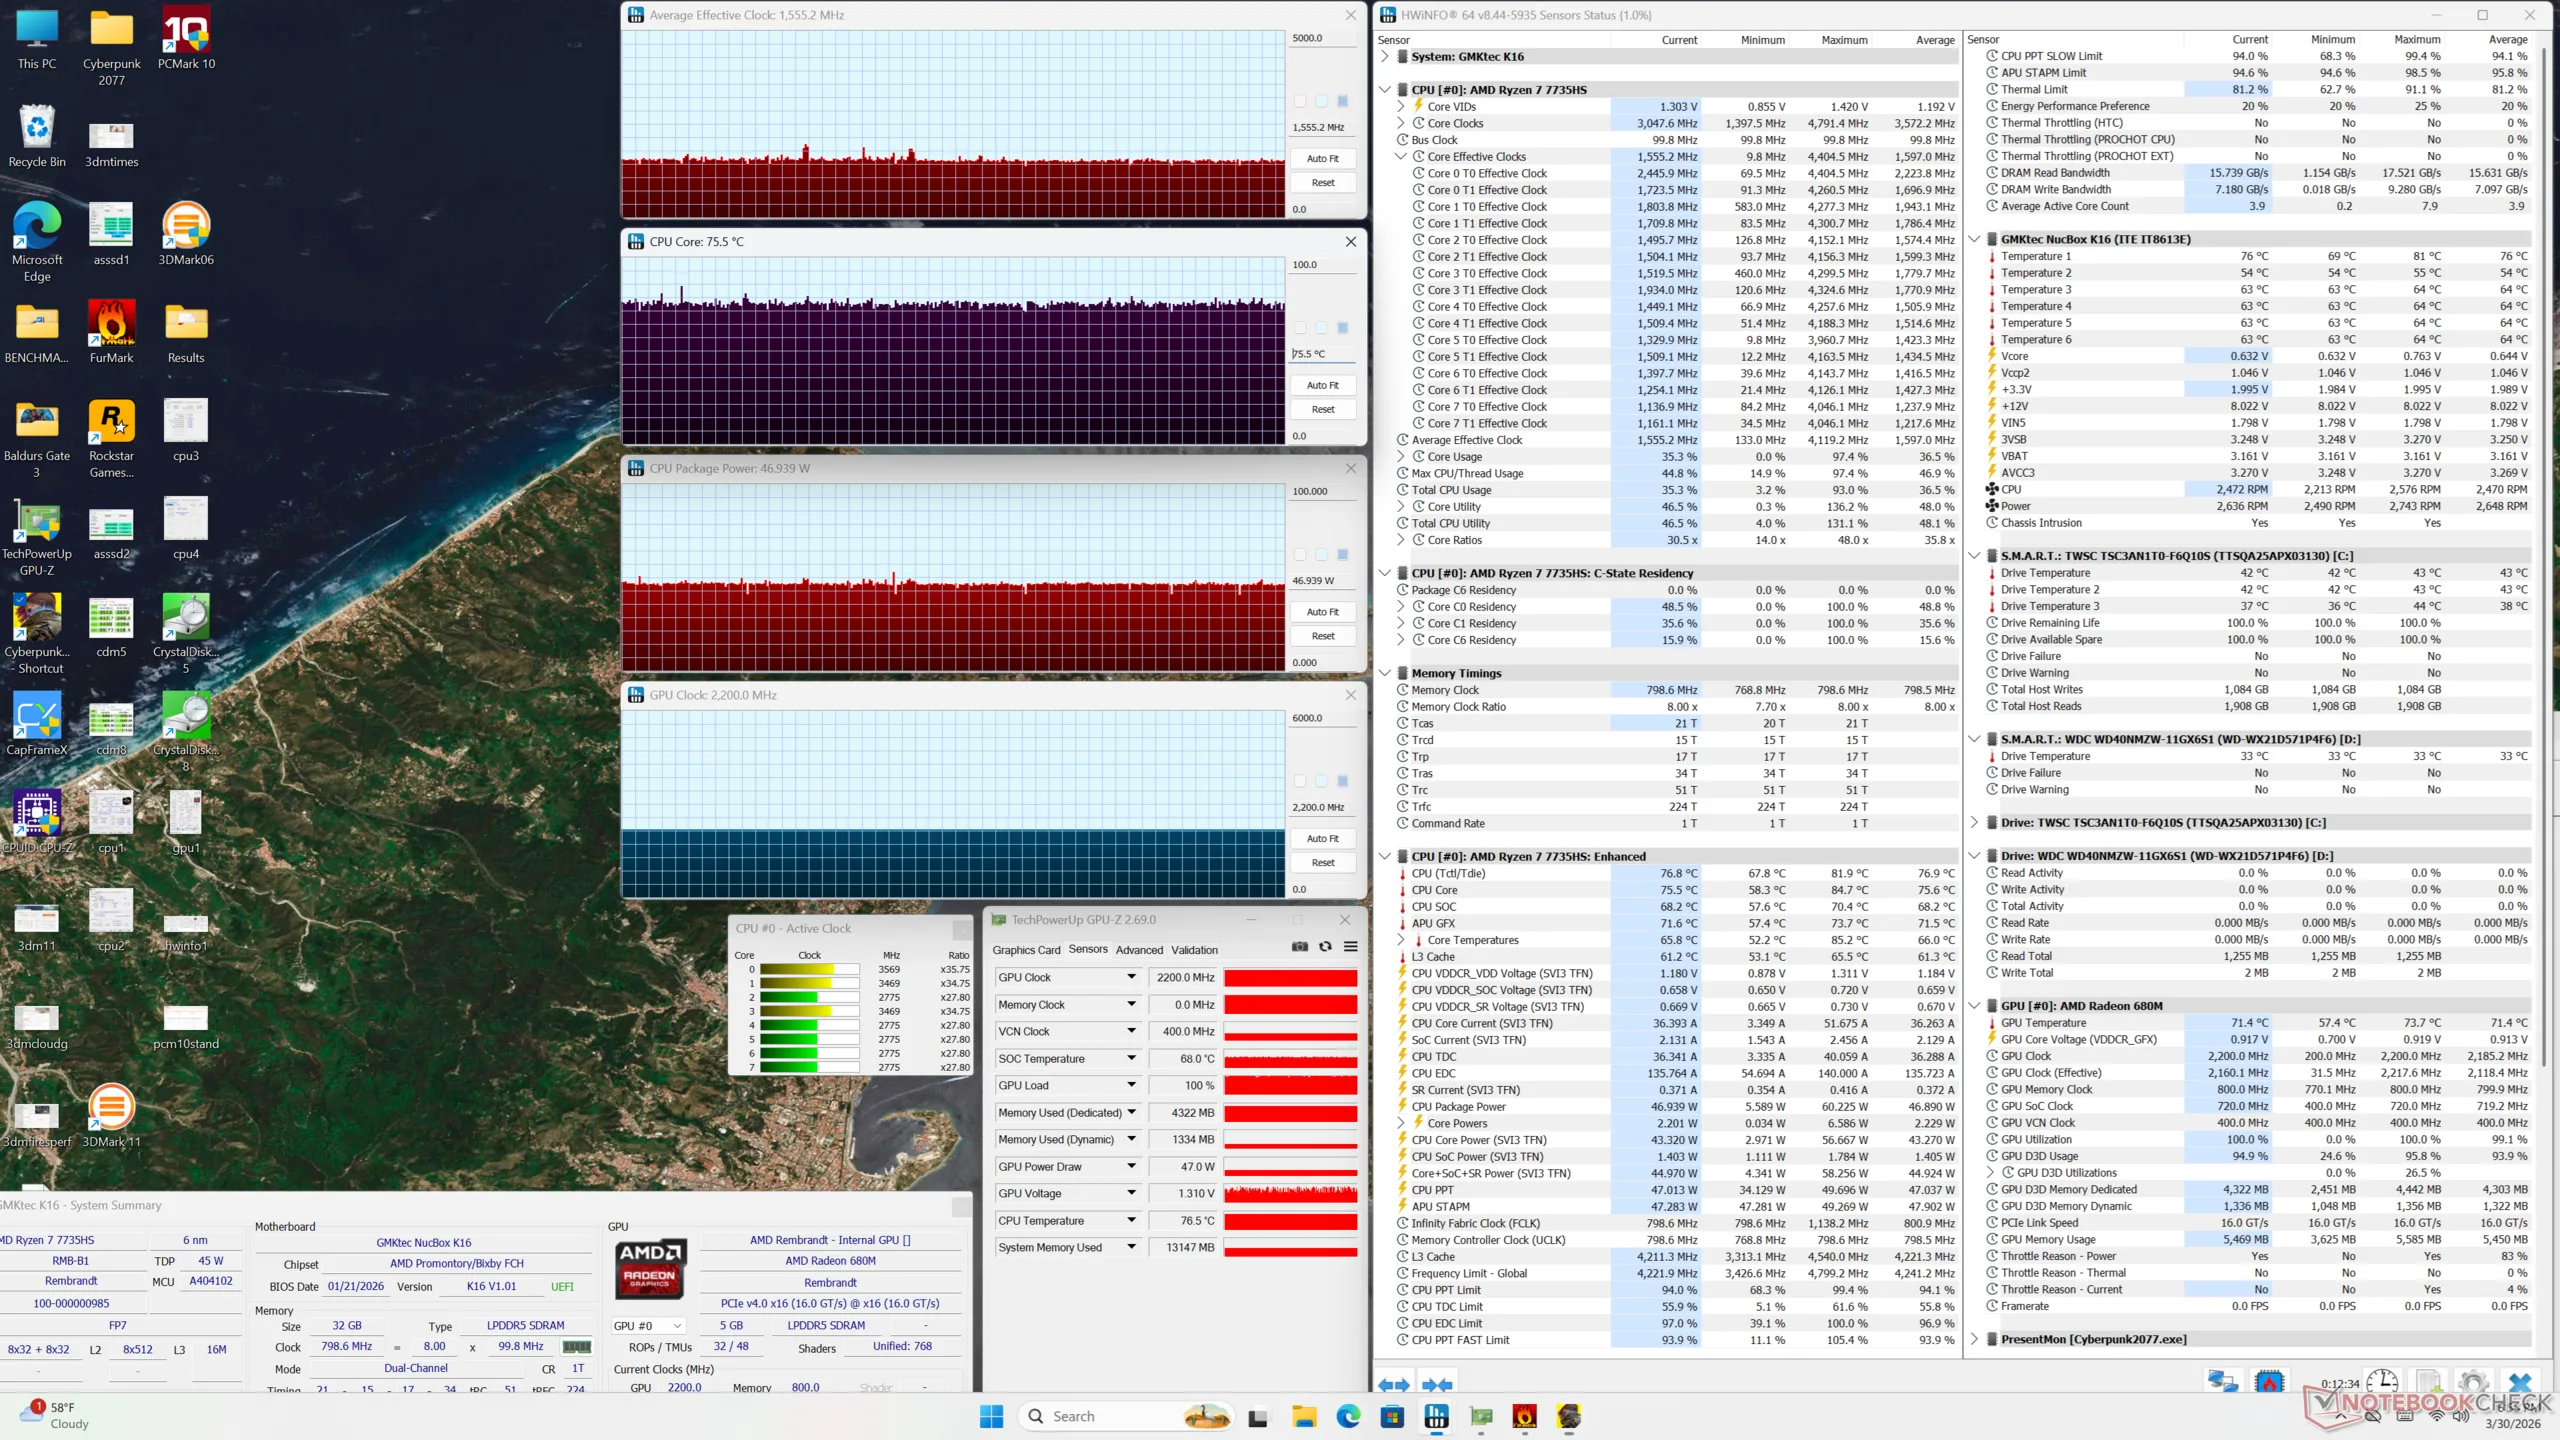
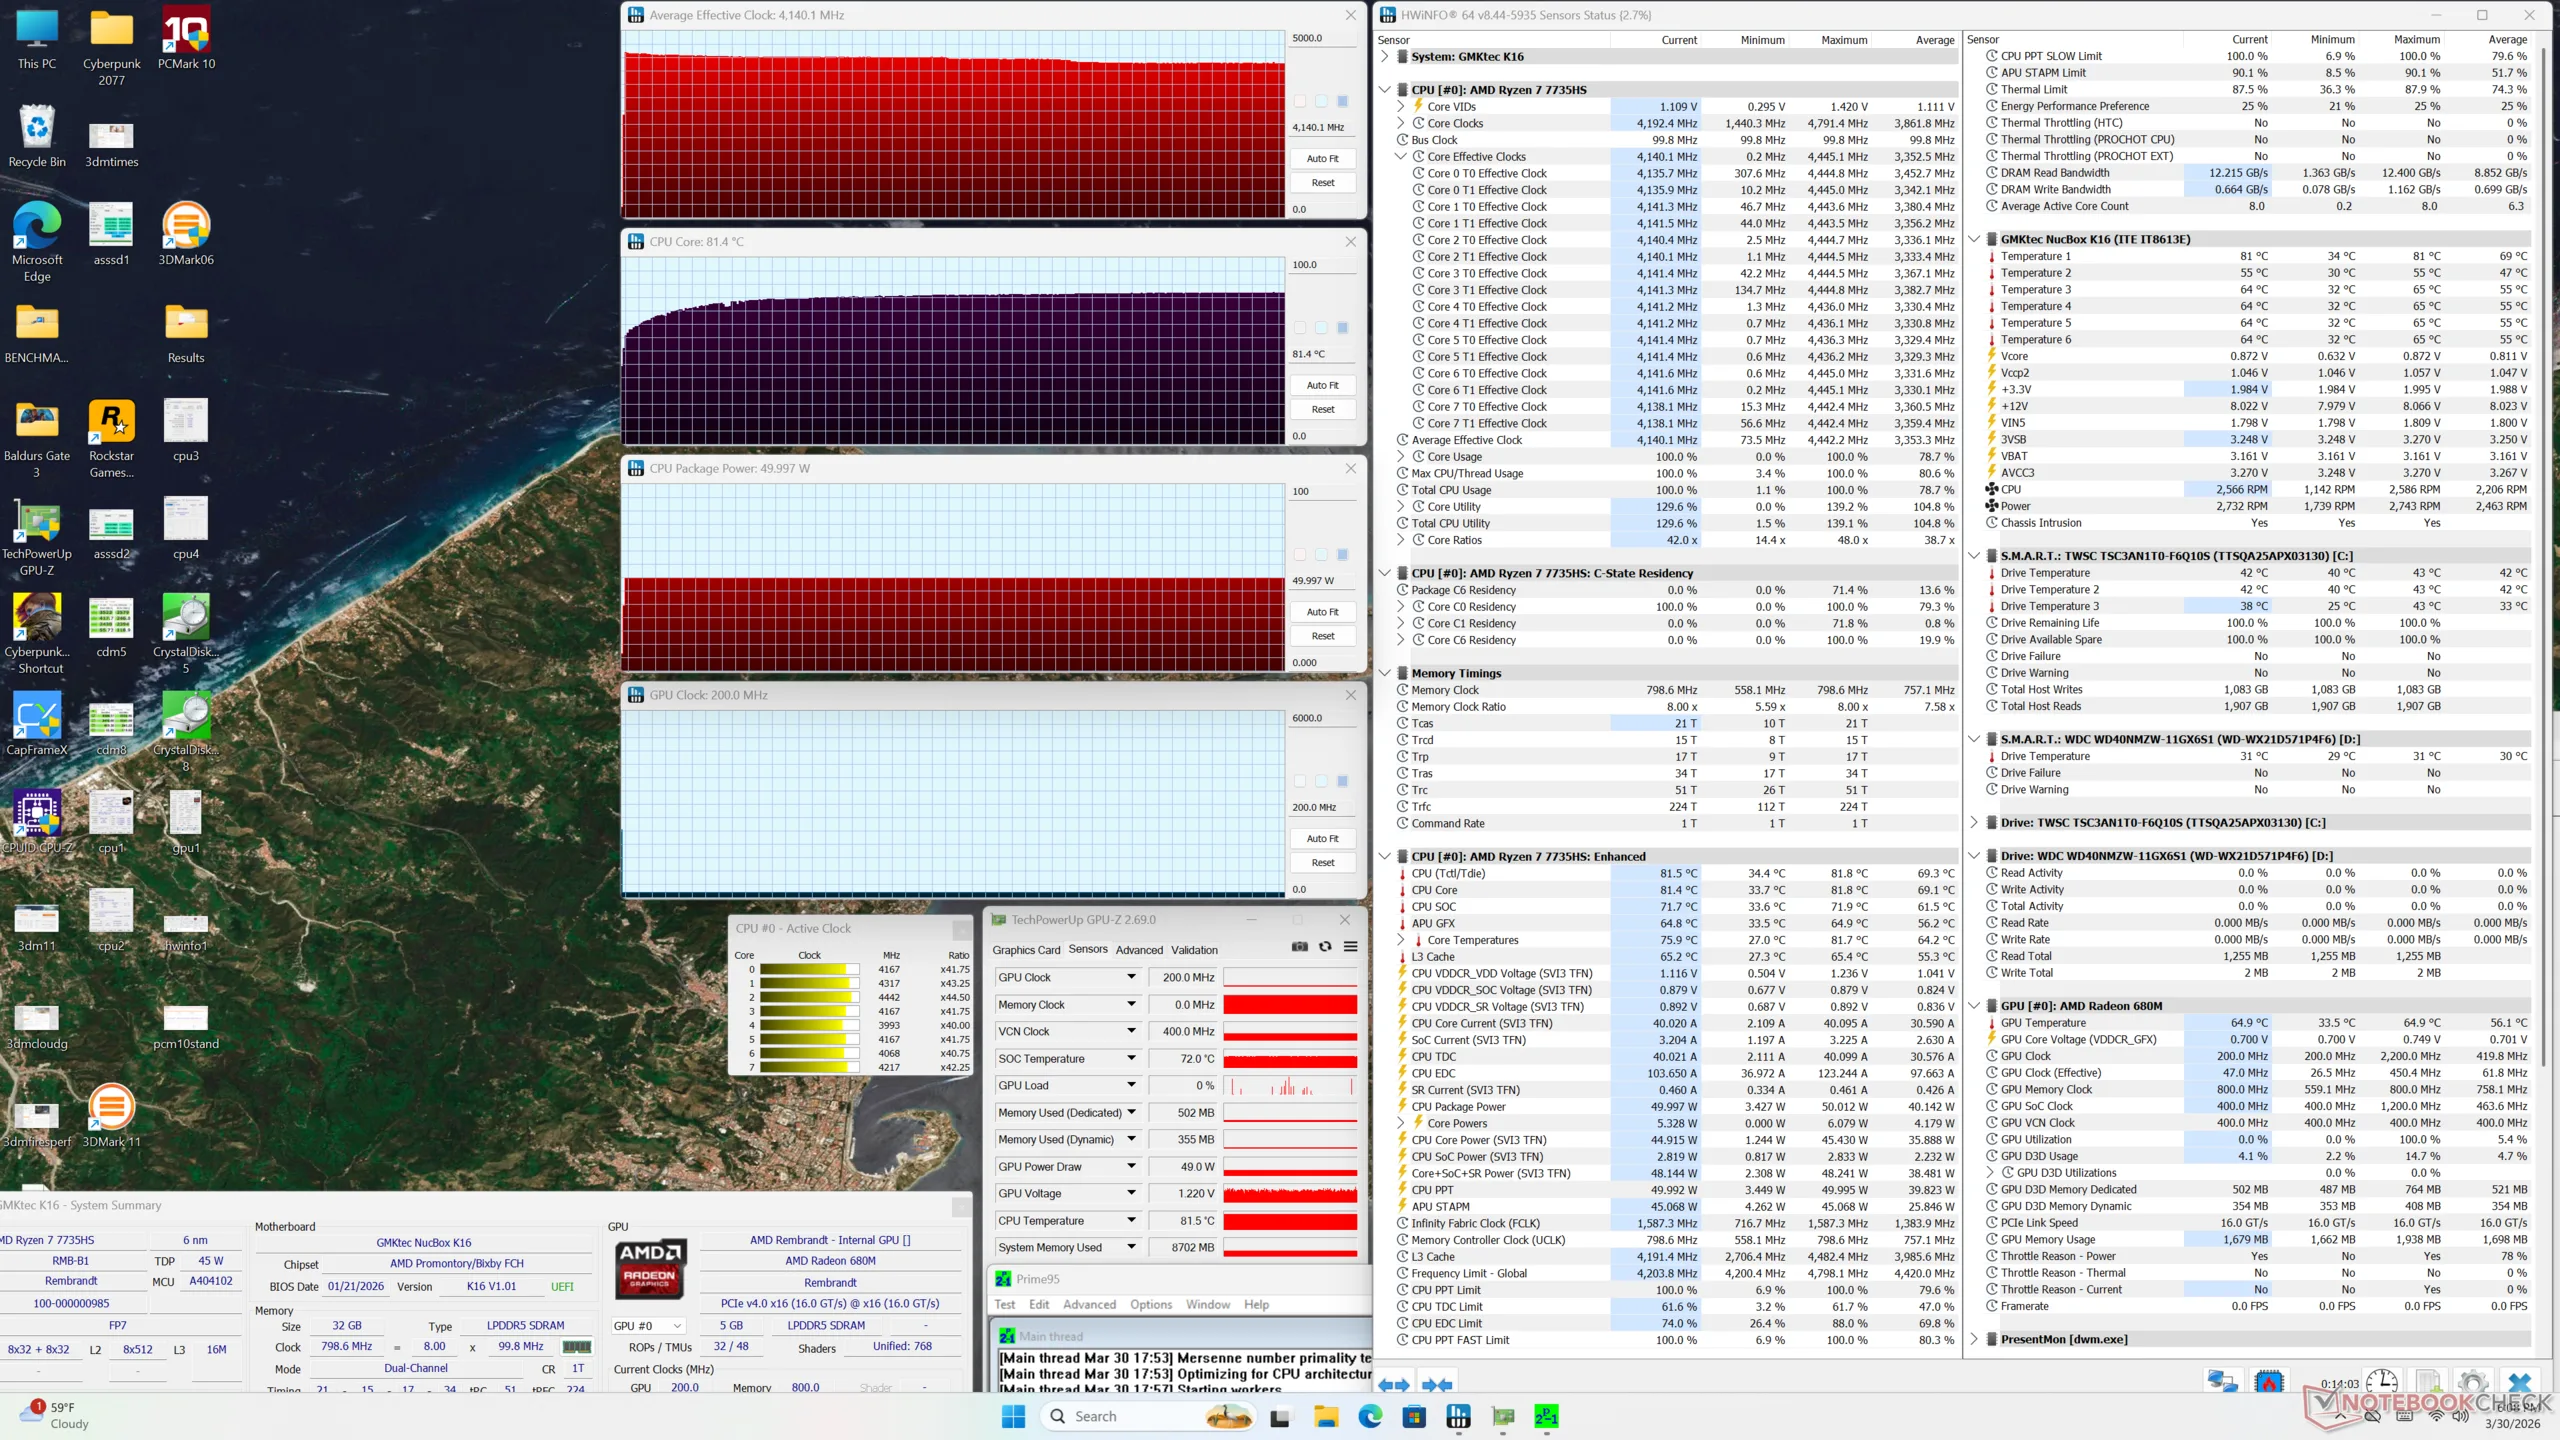
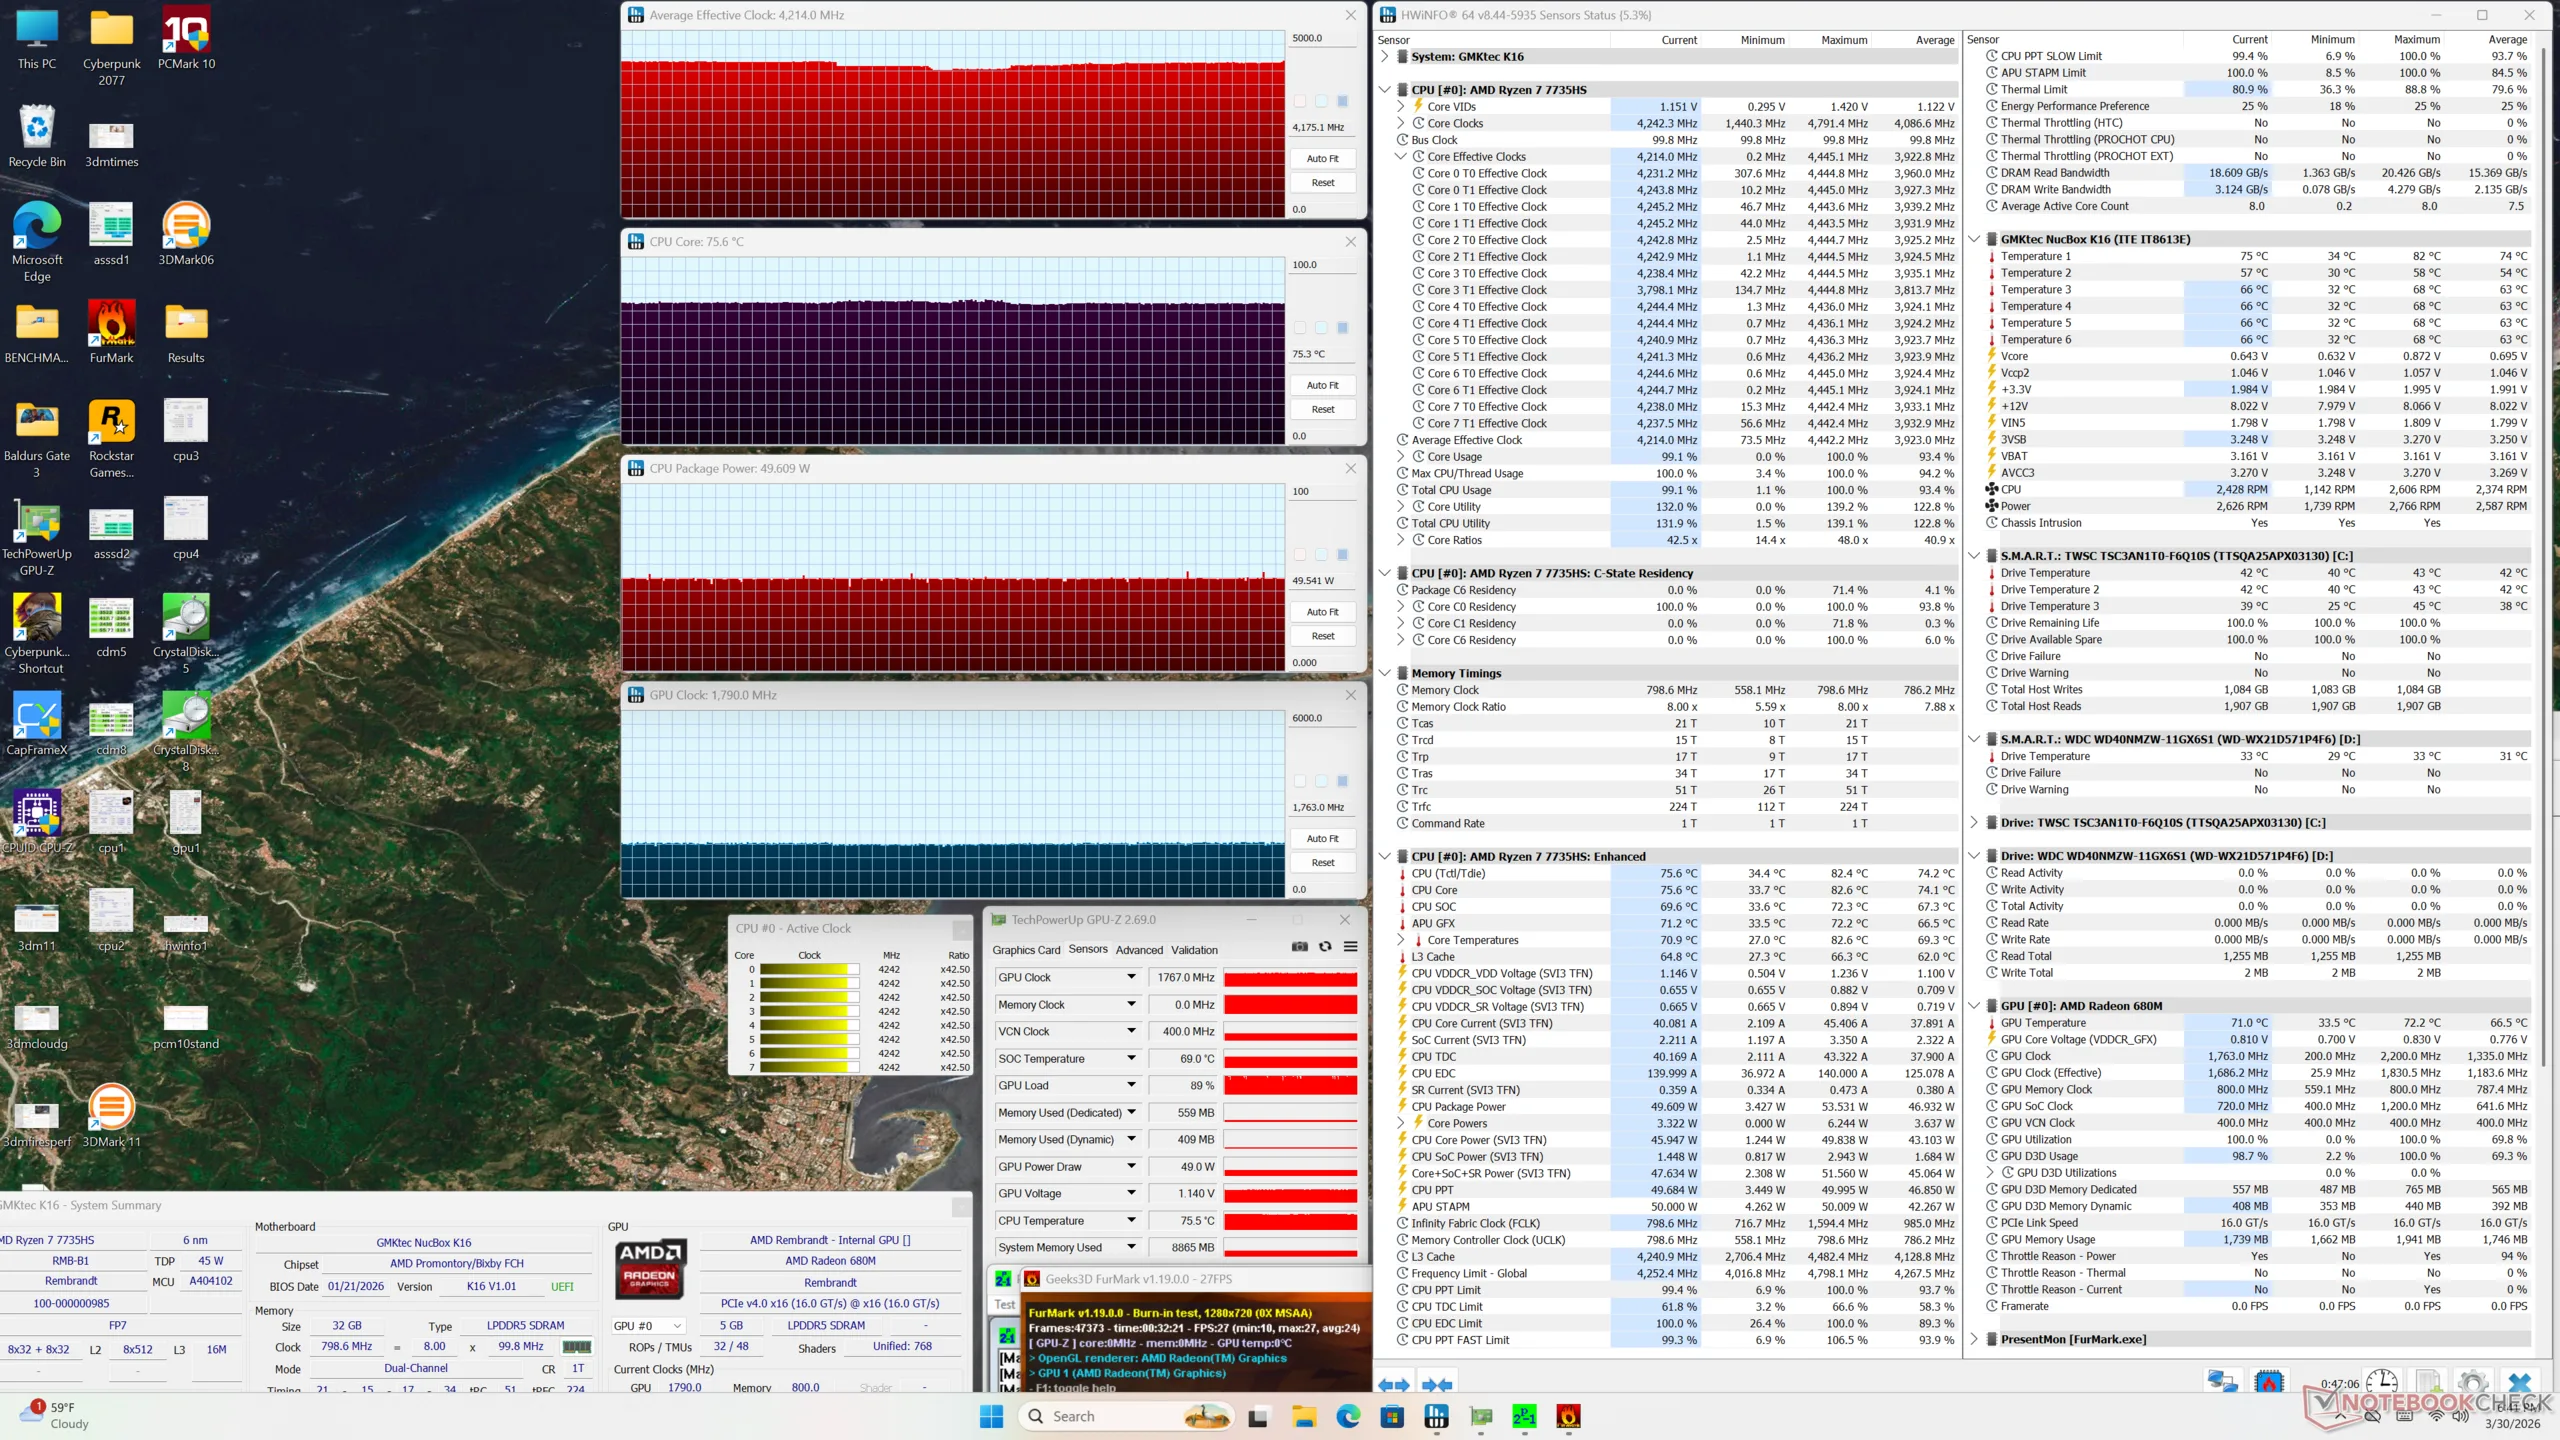
| Clock médio da CPU (GHz) | Clock da GPU (MHz) | Temperatura média da CPU (°C) | |
| Sistema ocioso | -- | 400 | 34 |
| Estresse do Prime95 | 4.1 | -- | 81 |
| Prime95 + FurMark Stress | 4.2 | 1763 | 75 |
| Cyberpunk 2077 Stress | 1.6 | 2200 | 76 |
Gerenciamento de energia
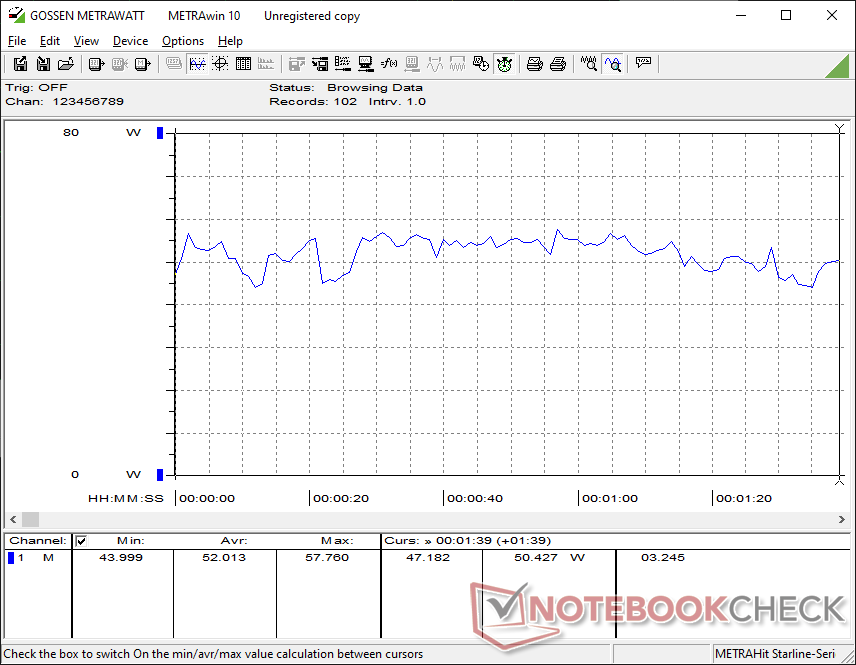
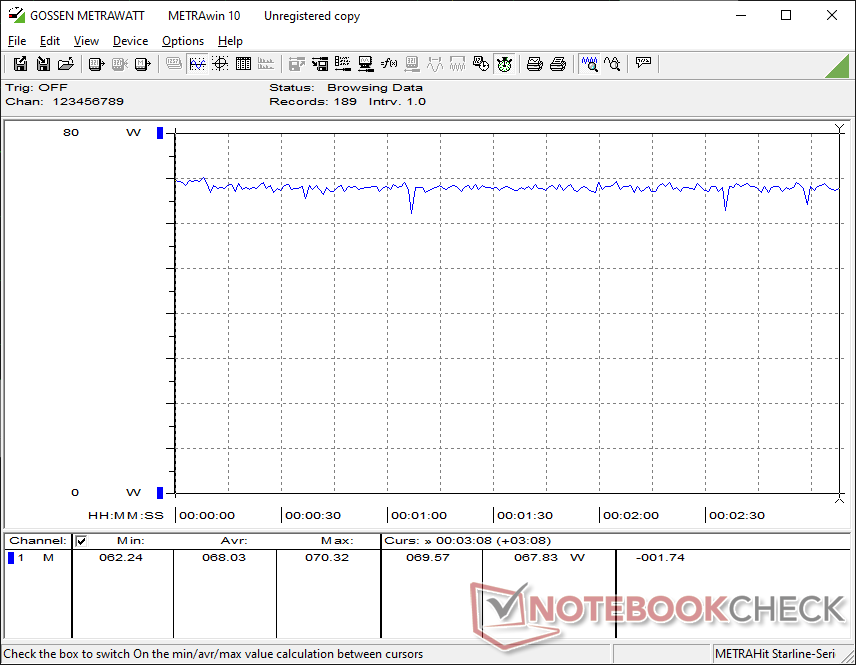
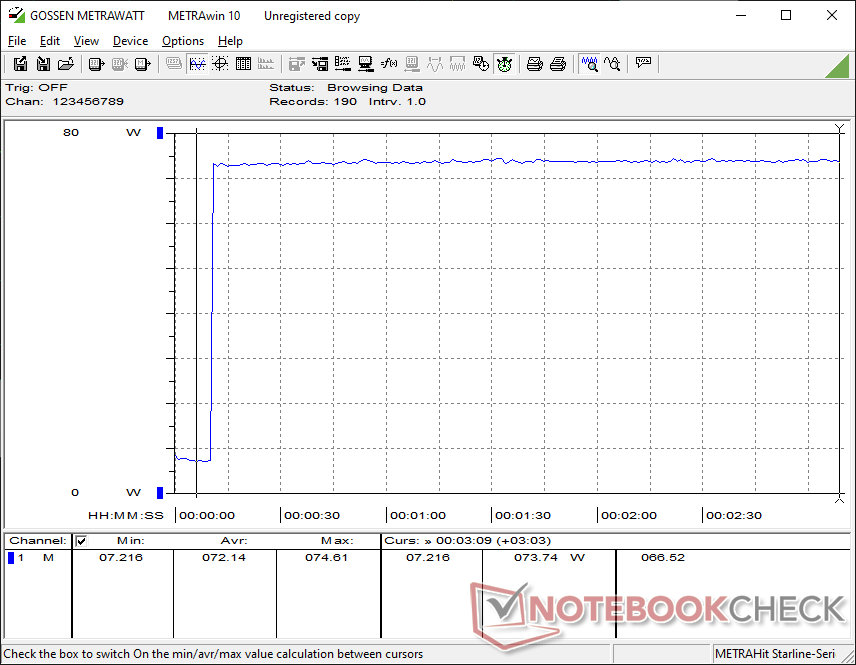
Consumo de energia
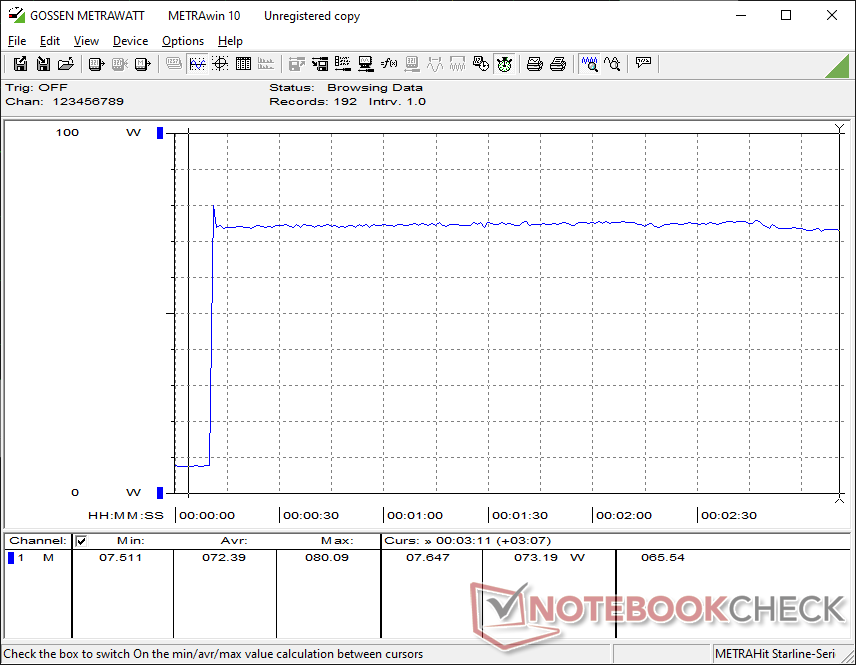
É no consumo de energia que o sistema Zen 3+ começa a mostrar sua idade. Ao jogar, o sistema consome quase 70 W ou duas vezes mais do que o NucBox K13 com tecnologia Lunar Lake, embora o último ofereça um desempenho gráfico de 60% a 90% melhor. Da mesma forma, ao executar o Prime95, o NucBox K16 exigiria o dobro da energia para um aumento medíocre de apenas 20% no desempenho do processador.
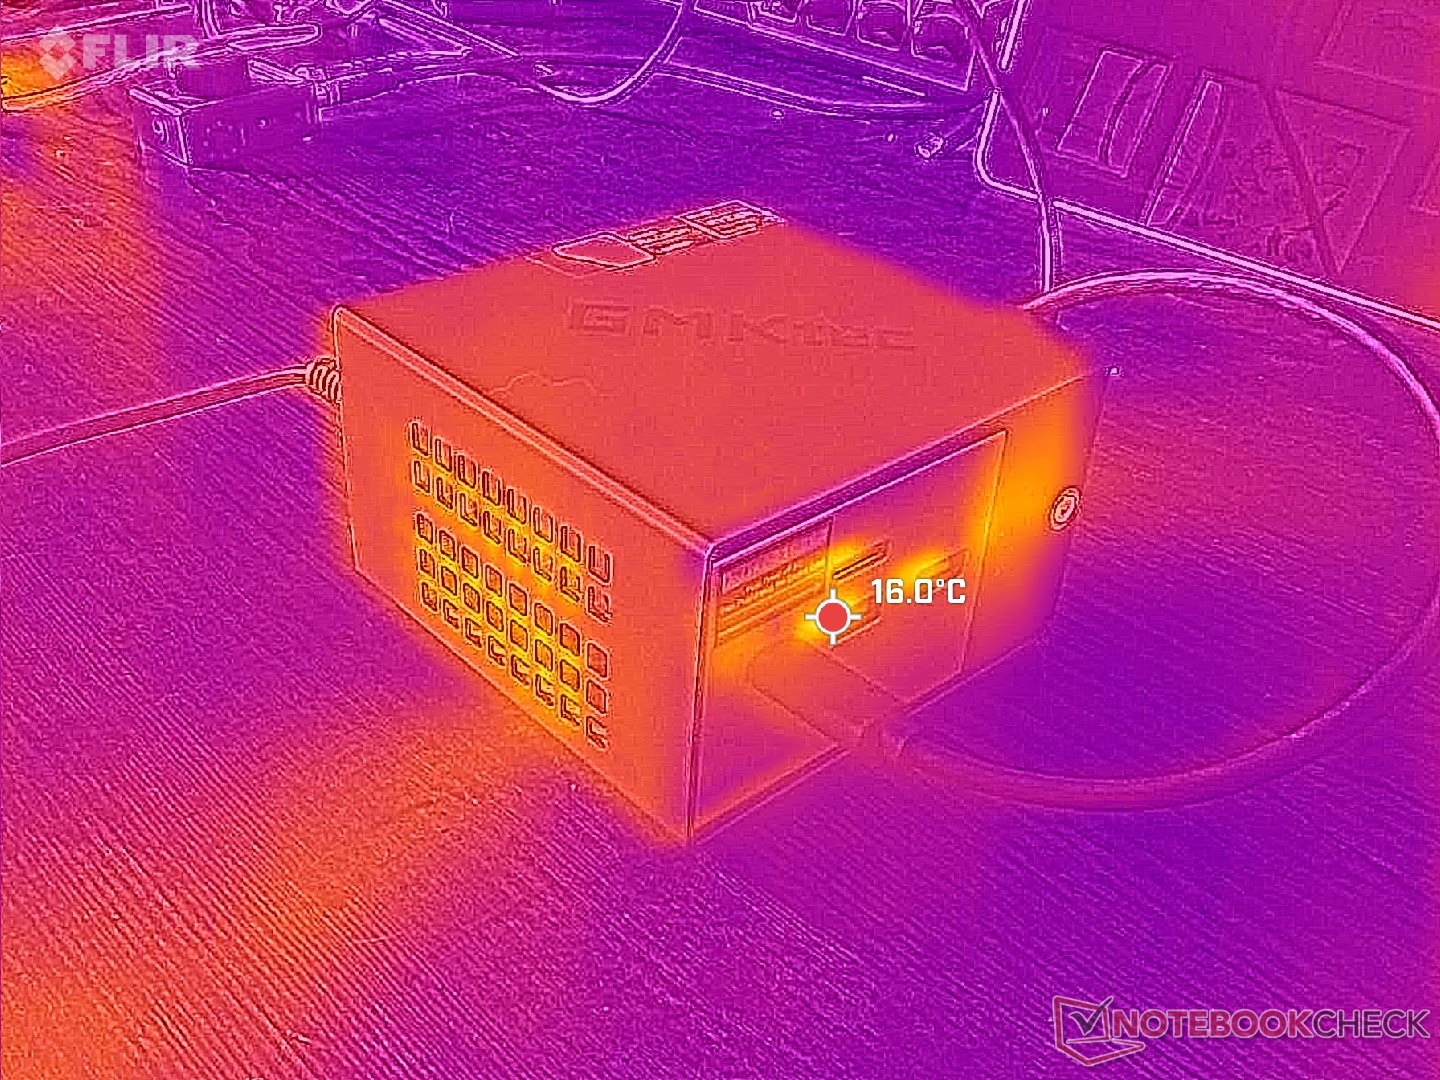
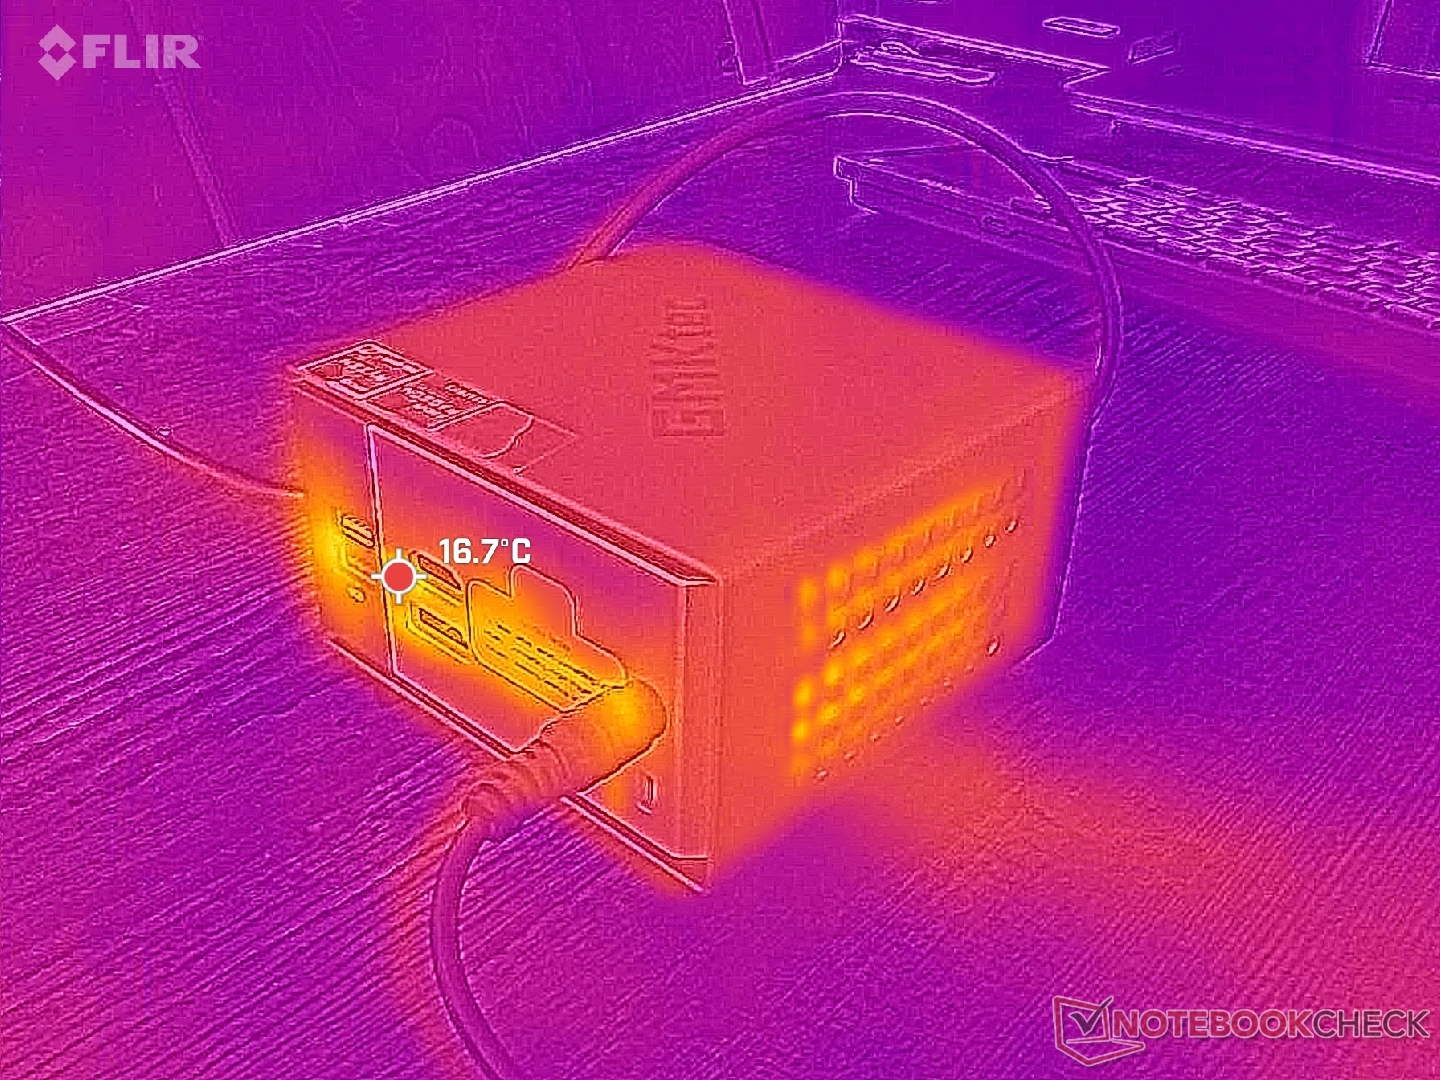
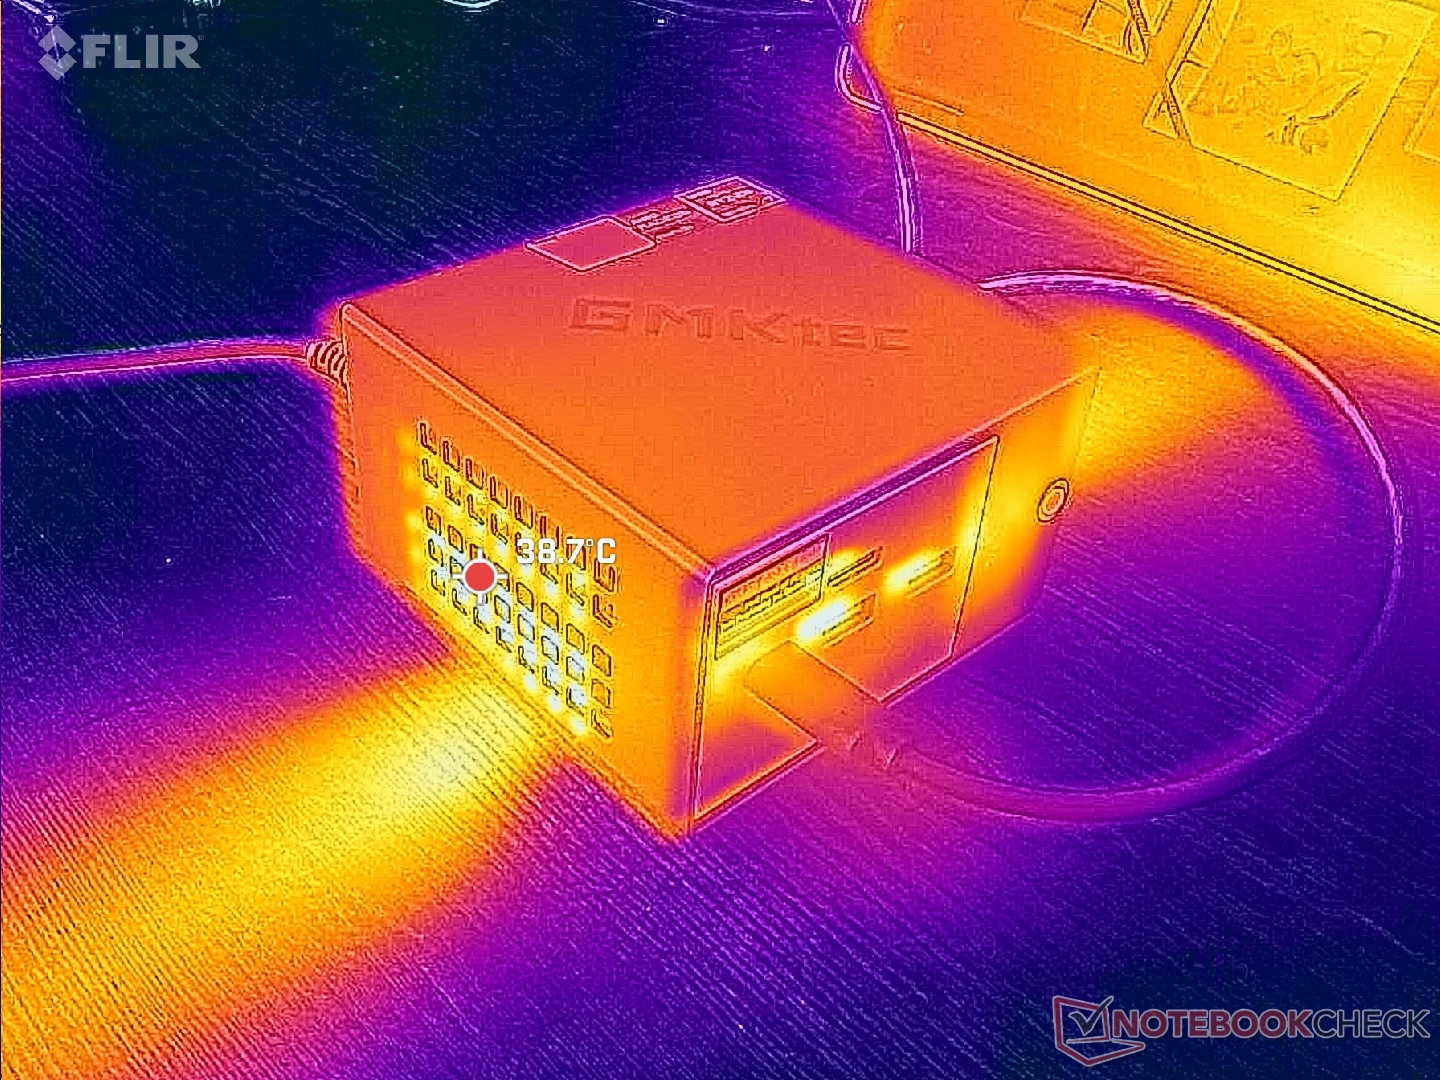
Conseguimos medir um consumo máximo de 80 W do adaptador CA de 120 W de tamanho médio (~13,3 x 5,8 x 3,2 cm).
| desligado | |
| Ocioso | |
| Carga |
|
Key:
min: | |
| GMK NucBox K16 R7 7735HS, Radeon 680M, TWSC TSC3AN1T0-F6Q10S, , x, | GMK NucBox K13 Core Ultra 7 256V, Arc 140V, Huawei eKitStor Xtreme 200e 1 TB, , x, | Beelink SER9 Pro Ryzen 7 H 255, Radeon 780M, Crucial P3 Plus CT1000P3PSSD8, , x, | Geekom A7 Max, R9 7940HS R9 7940HS, Radeon 780M, Wodposit WPBSN4M8-1TGP, , x, | Asus NUC 15 Pro+ Ultra 9 285H, Arc 140T, Micron 3500 1TB MTFDKBA1T0TGD, , x, | MSI Cubi NUC AI+ 2MG Core Ultra 7 258V, Arc 140V, Phison 1 TB ESR01TBTCCZ-27J, , x, | |
|---|---|---|---|---|---|---|
| Power Consumption | 50% | -4% | -1% | -7% | 24% | |
| Idle Minimum * (Watt) | 7.4 | 2.3 69% | 7 5% | 5.6 24% | 3.9 47% | 2.9 61% |
| Idle Average * (Watt) | 7.7 | 3.6 53% | 7.1 8% | 7.1 8% | 6.1 21% | 5.7 26% |
| Idle Maximum * (Watt) | 7.7 | 5.8 25% | 7.5 3% | 8.4 -9% | 8.2 -6% | 10.2 -32% |
| Load Average * (Watt) | 52 | 27.3 47% | 62.3 -20% | 57.5 -11% | 56.1 -8% | 38.7 26% |
| Cyberpunk 2077 ultra external monitor * (Watt) | 68 | 31.6 54% | 80.1 -18% | 67.4 1% | 63.9 6% | 41.1 40% |
| Load Maximum * (Watt) | 80.1 | 39.6 51% | 82.9 -3% | 92.9 -16% | 160.6 -100% | 60 25% |
* ... menor é melhor
Consumo de energia Cyberpunk / Teste de estresse
Consumo de energia do monitor externo
Classificação do Notebookcheck
O NucBox K16 integra uma CPU AMD Zen 3+ mais antiga com um design de chassi mais recente, completo com Oculink e portas RJ-45 duplas que os profissionais podem apreciar.
GMK NucBox K16
- 04/01/2026 v8
Allen Ngo
 Total Sustainability Score:
 Concorrentes potenciais em comparação
Imagem | Modelo / Análises | Preço | Peso | Altura | Tela |
|---|---|---|---|---|---|
1. 64.8%  | GMK NucBox K16 AMD Ryzen 7 7735HS ⎘ AMD Radeon 680M ⎘ 32 GB Memória, 1024 GB SSD | Amazon: Preço de tabela: 650 USD | 567 g | 63 mm | x |
2. 77.4%  | GMK NucBox K13 Intel Core Ultra 7 256V ⎘ Intel Arc Graphics 140V ⎘ 16 GB Memória, 1024 GB SSD | Amazon: Preço de tabela: 670 USD | 506 g | 36.6 mm | x |
3. 80.2%  | Beelink SER9 Pro AMD Ryzen 7 H 255 ⎘ AMD Radeon 780M ⎘ 32 GB Memória, 1024 GB SSD | Amazon: Preço de tabela: 520 USD | 812 g | 44.7 mm | x |
4. 78.2%  | Geekom A7 Max, R9 7940HS AMD Ryzen 9 7940HS ⎘ AMD Radeon 780M ⎘ 16 GB Memória, 1024 GB SSD | Amazon: Preço de tabela: 749€ | 681 g | 46.9 mm | x |
5. 77.5% 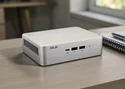 | Asus NUC 15 Pro+ Intel Core Ultra 9 285H ⎘ Intel Arc Graphics 140T ⎘ 32 GB Memória, 1024 GB SSD | Amazon: $1,642.00 Preço de tabela: 991€ | 690 g | 42 mm | x |
6. 75.2% 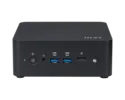 | MSI Cubi NUC AI+ 2MG Intel Core Ultra 7 258V ⎘ Intel Arc Graphics 140V ⎘ 32 GB Memória, 1000 GB SSD | Amazon: Preço de tabela: 900 USD | 669 g | 50.1 mm | x |
Transparência
A seleção dos dispositivos a serem analisados é feita pela nossa equipe editorial. A amostra de teste foi fornecida ao autor como empréstimo pelo fabricante ou varejista para fins desta revisão. O credor não teve influência nesta revisão, nem o fabricante recebeu uma cópia desta revisão antes da publicação. Não houve obrigação de publicar esta revisão. Como empresa de mídia independente, a Notebookcheck não está sujeita à autoridade de fabricantes, varejistas ou editores.
É assim que o Notebookcheck está testando
Todos os anos, o Notebookcheck analisa de forma independente centenas de laptops e smartphones usando procedimentos padronizados para garantir que todos os resultados sejam comparáveis. Desenvolvemos continuamente nossos métodos de teste há cerca de 20 anos e definimos padrões da indústria no processo. Em nossos laboratórios de teste, equipamentos de medição de alta qualidade são utilizados por técnicos e editores experientes. Esses testes envolvem um processo de validação em vários estágios. Nosso complexo sistema de classificação é baseado em centenas de medições e benchmarks bem fundamentados, o que mantém a objetividade.
