

Notebookcheck Logo
Teaser

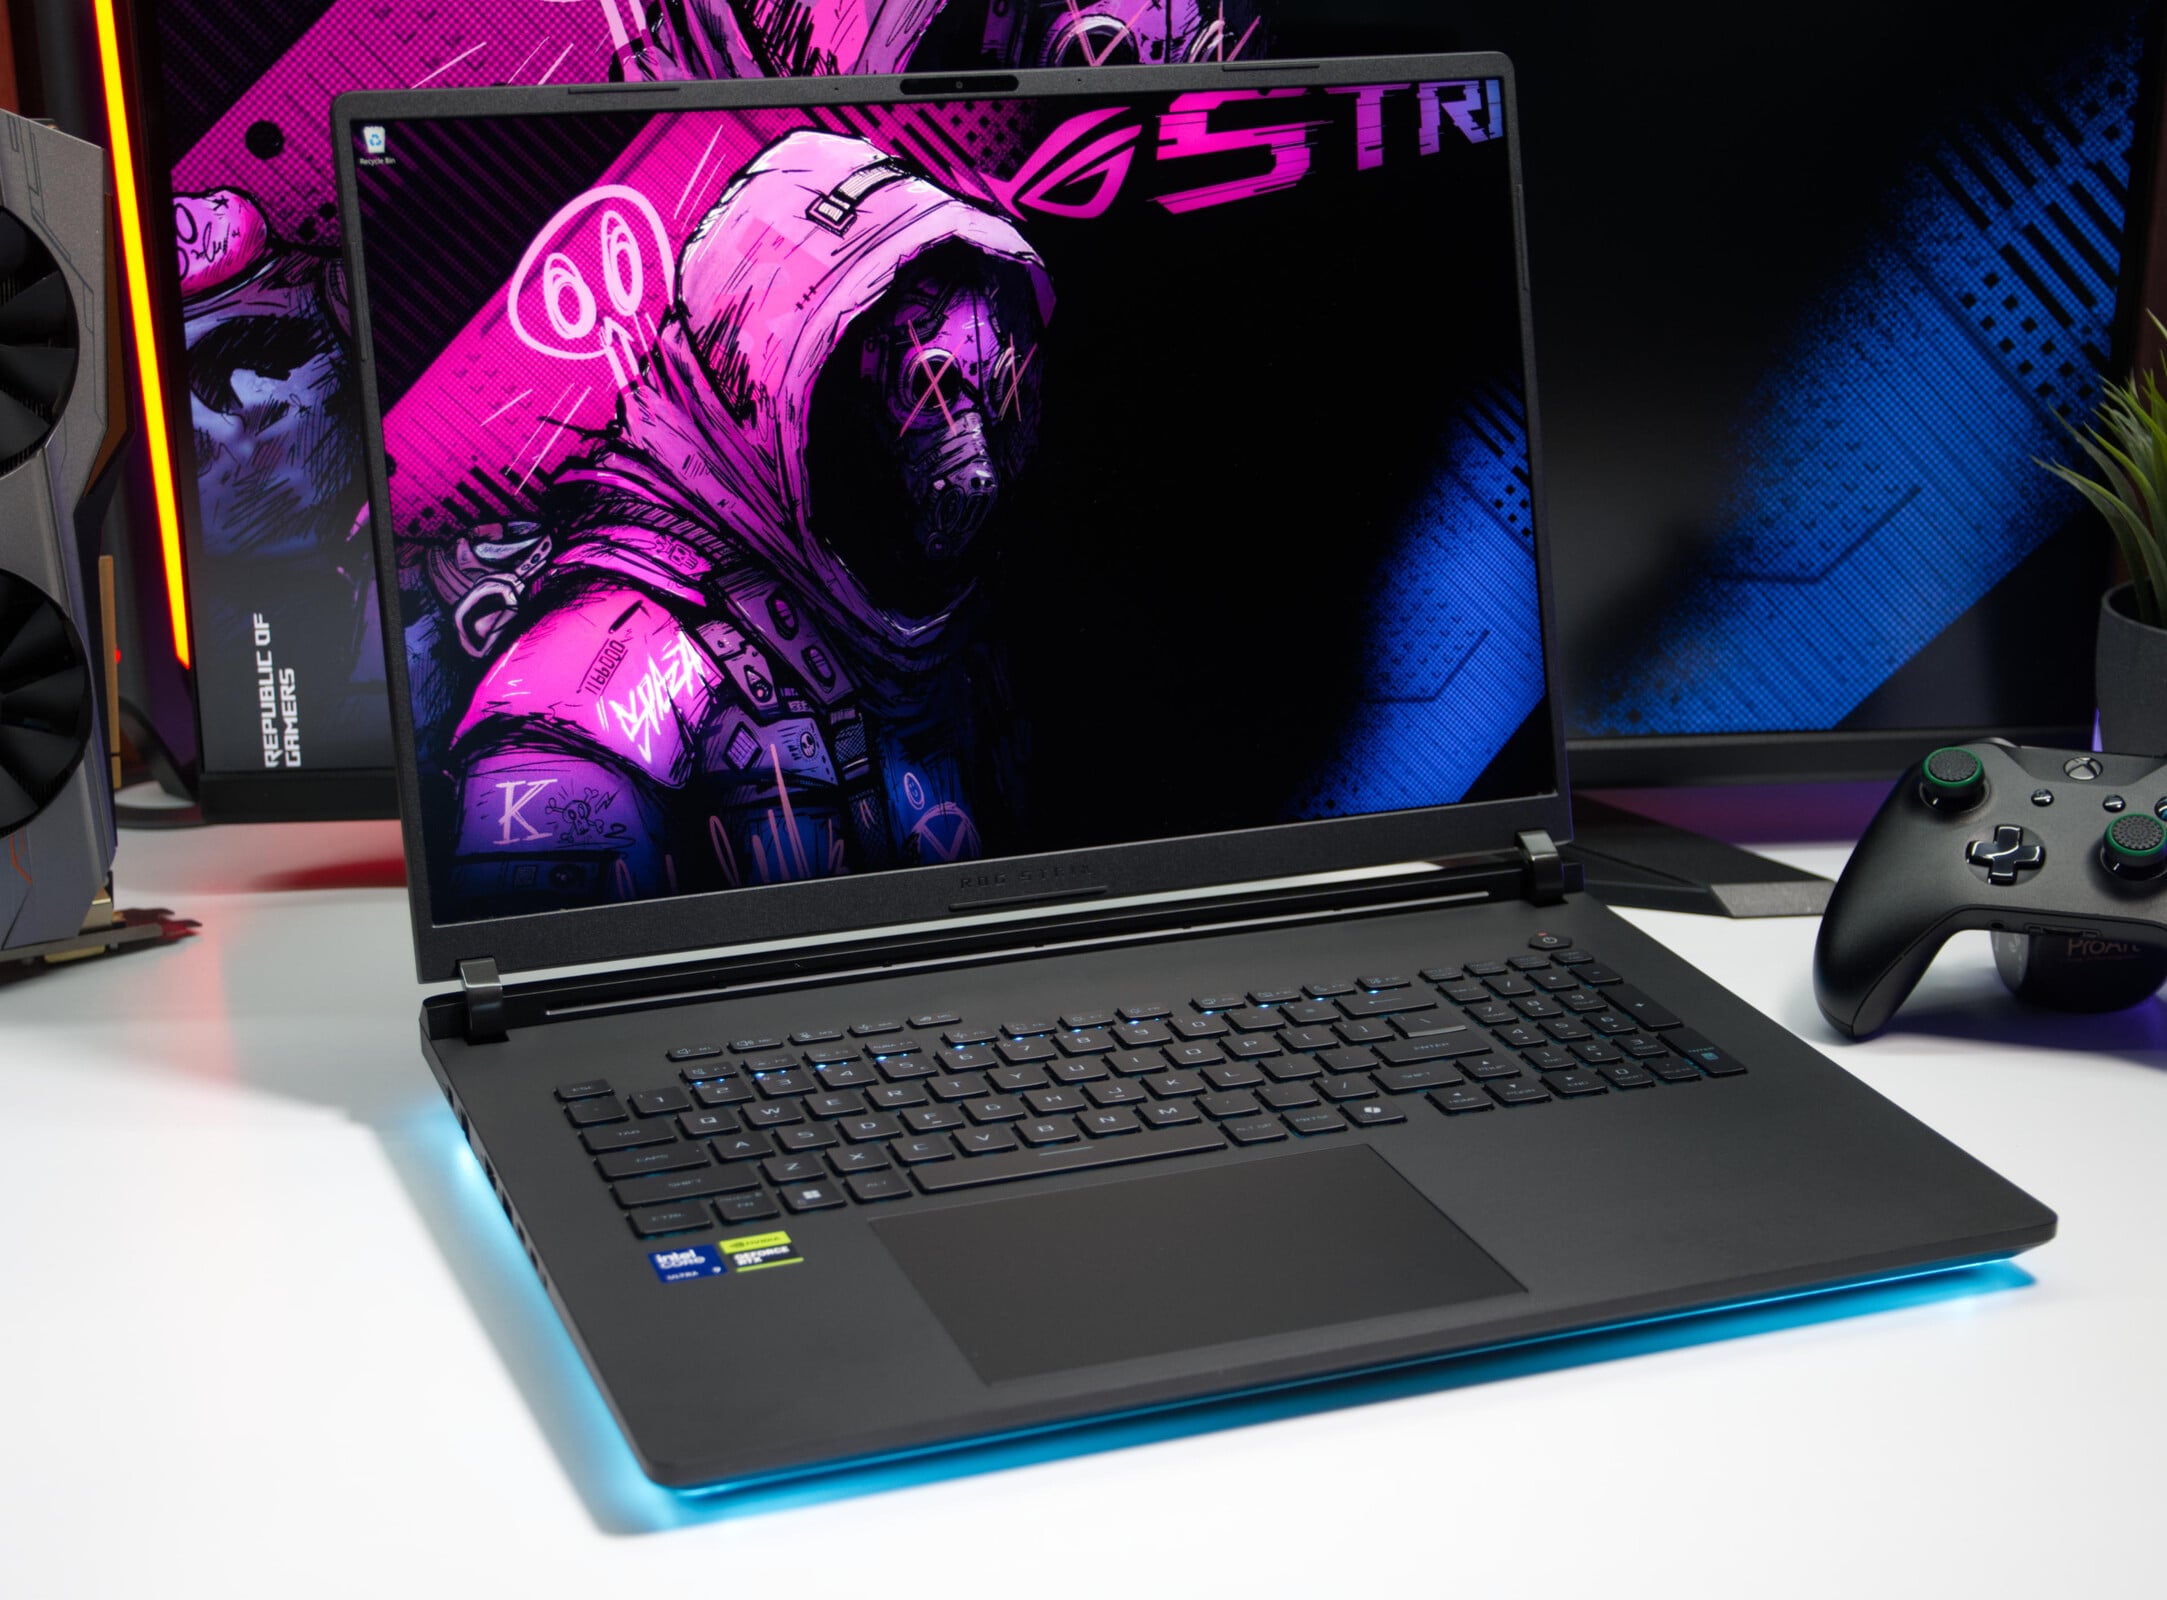
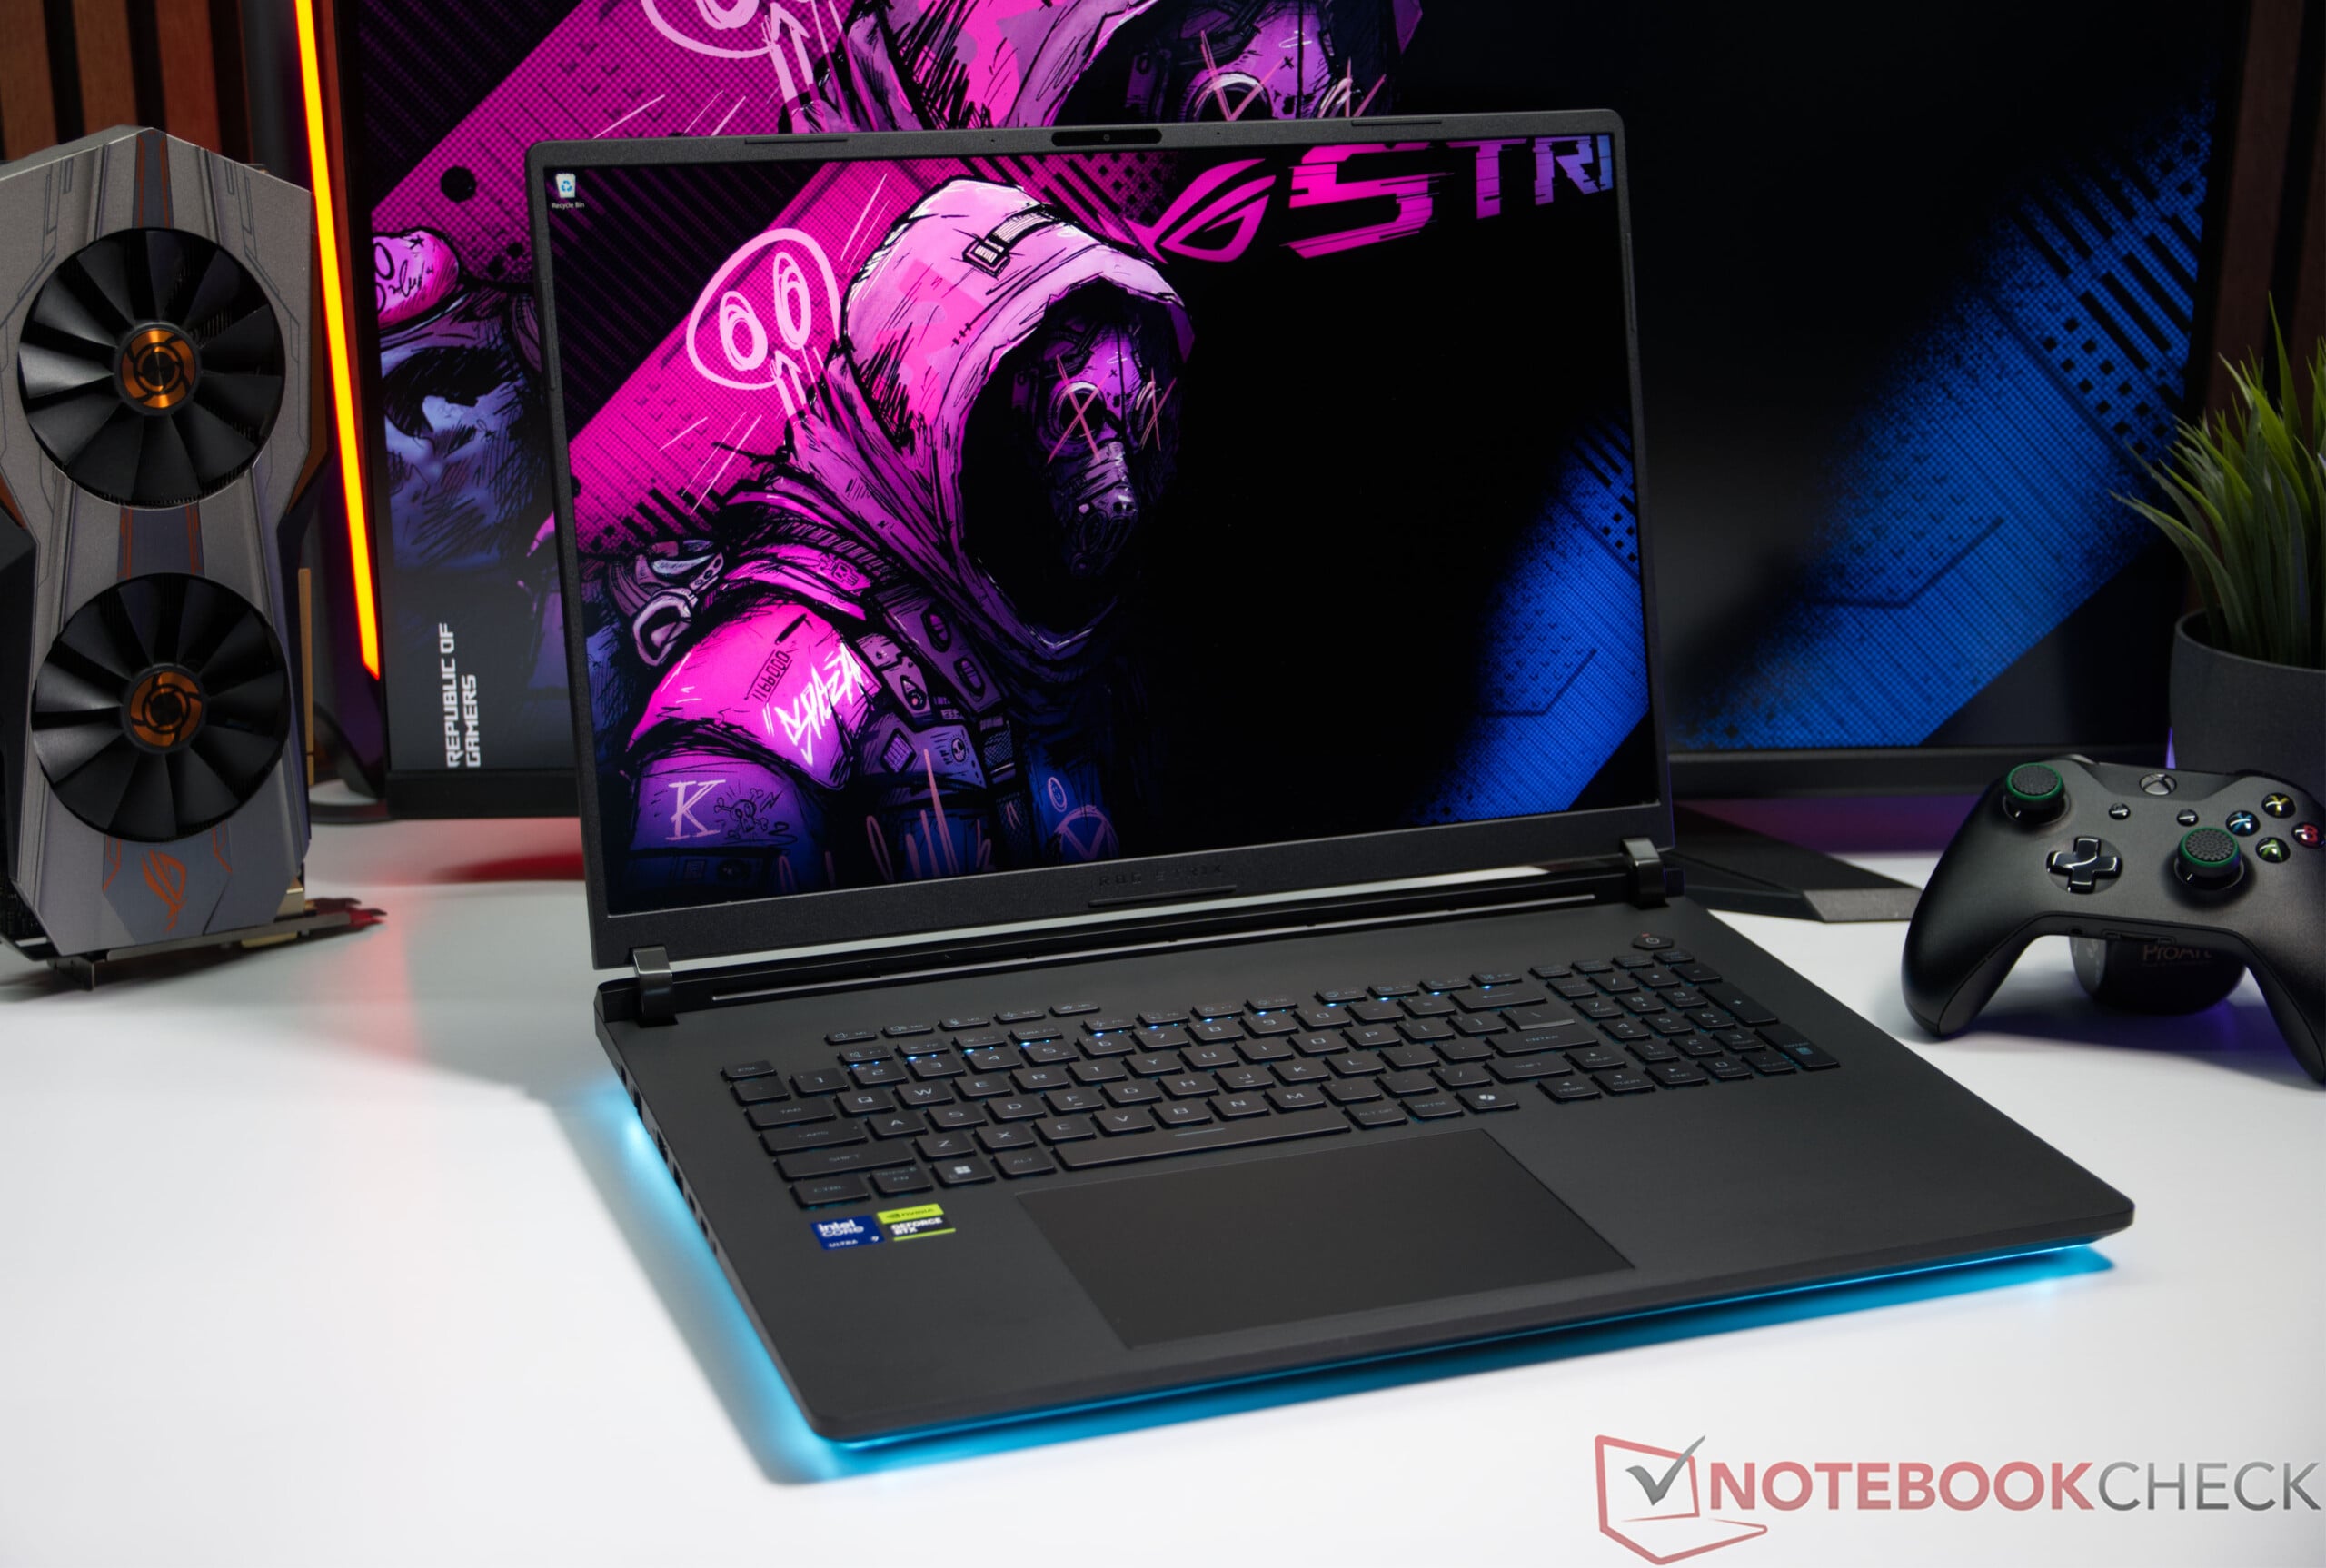
Monstro dos jogos com Mini-LED 4K, RTX 5090 e 128 GB de RAM – Análise do Asus ROG Strix SCAR 18 G835LXG

Jogos de alta qualidade com desempenho sem concessões.

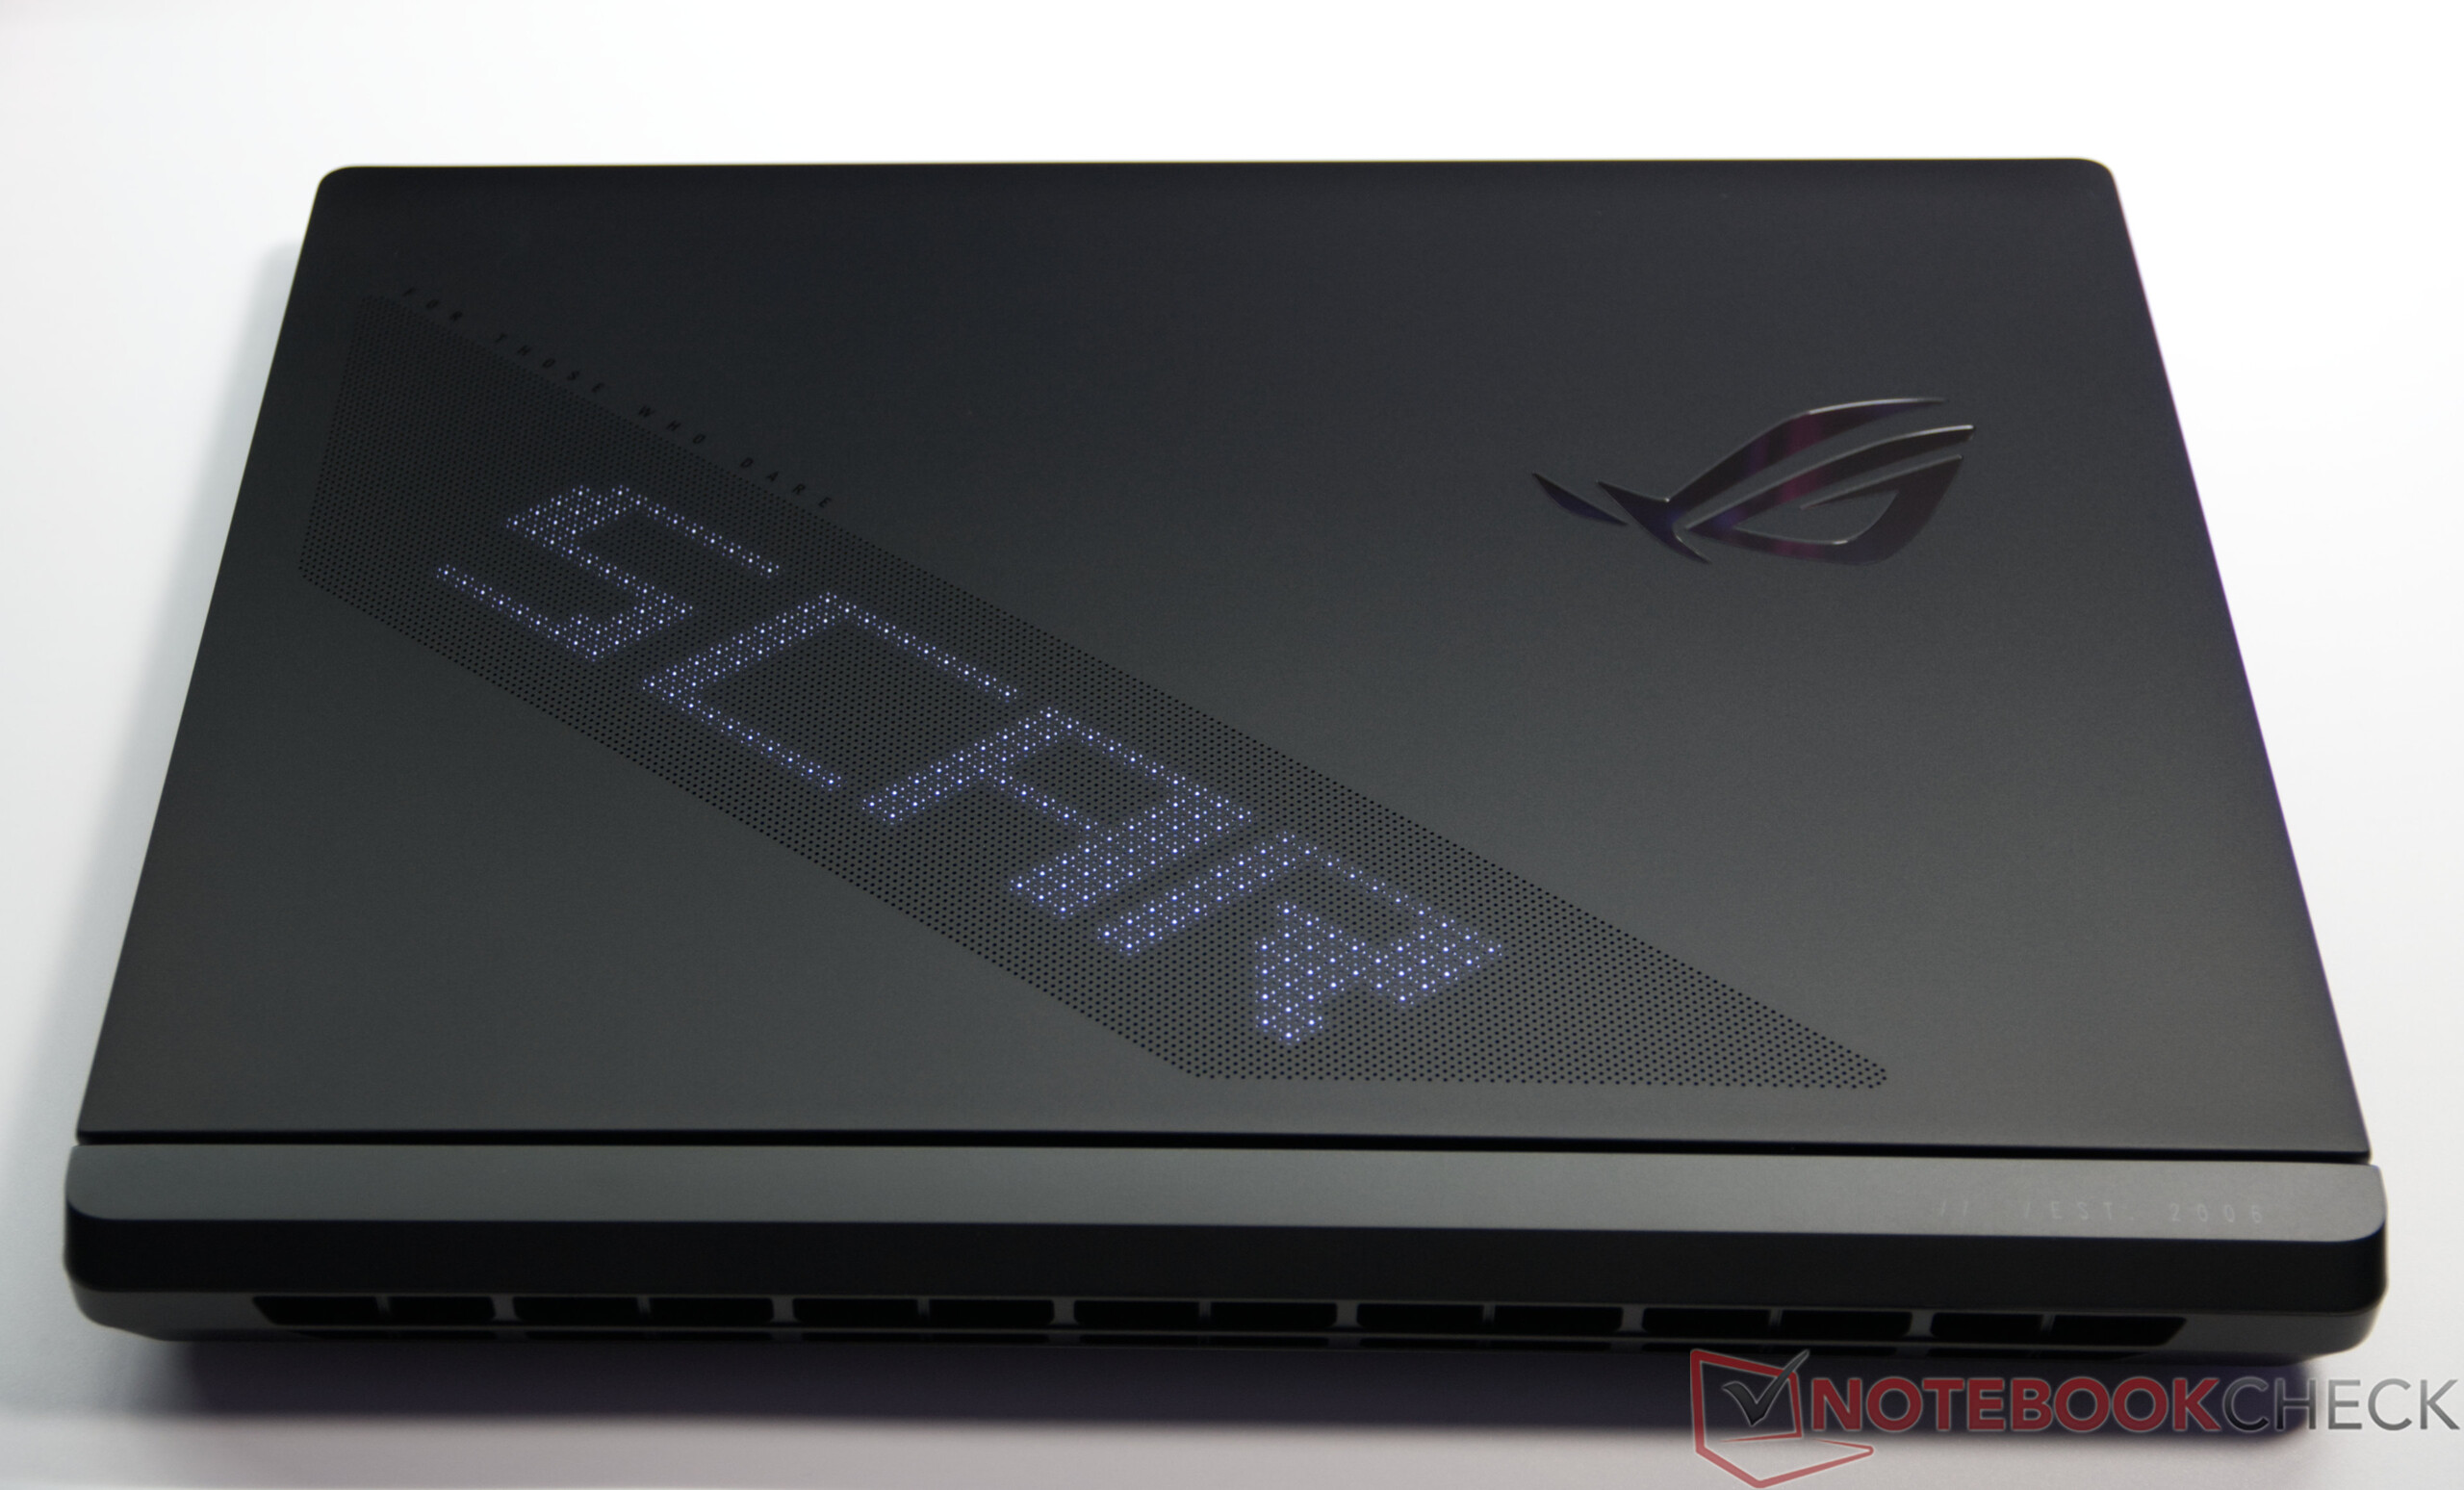
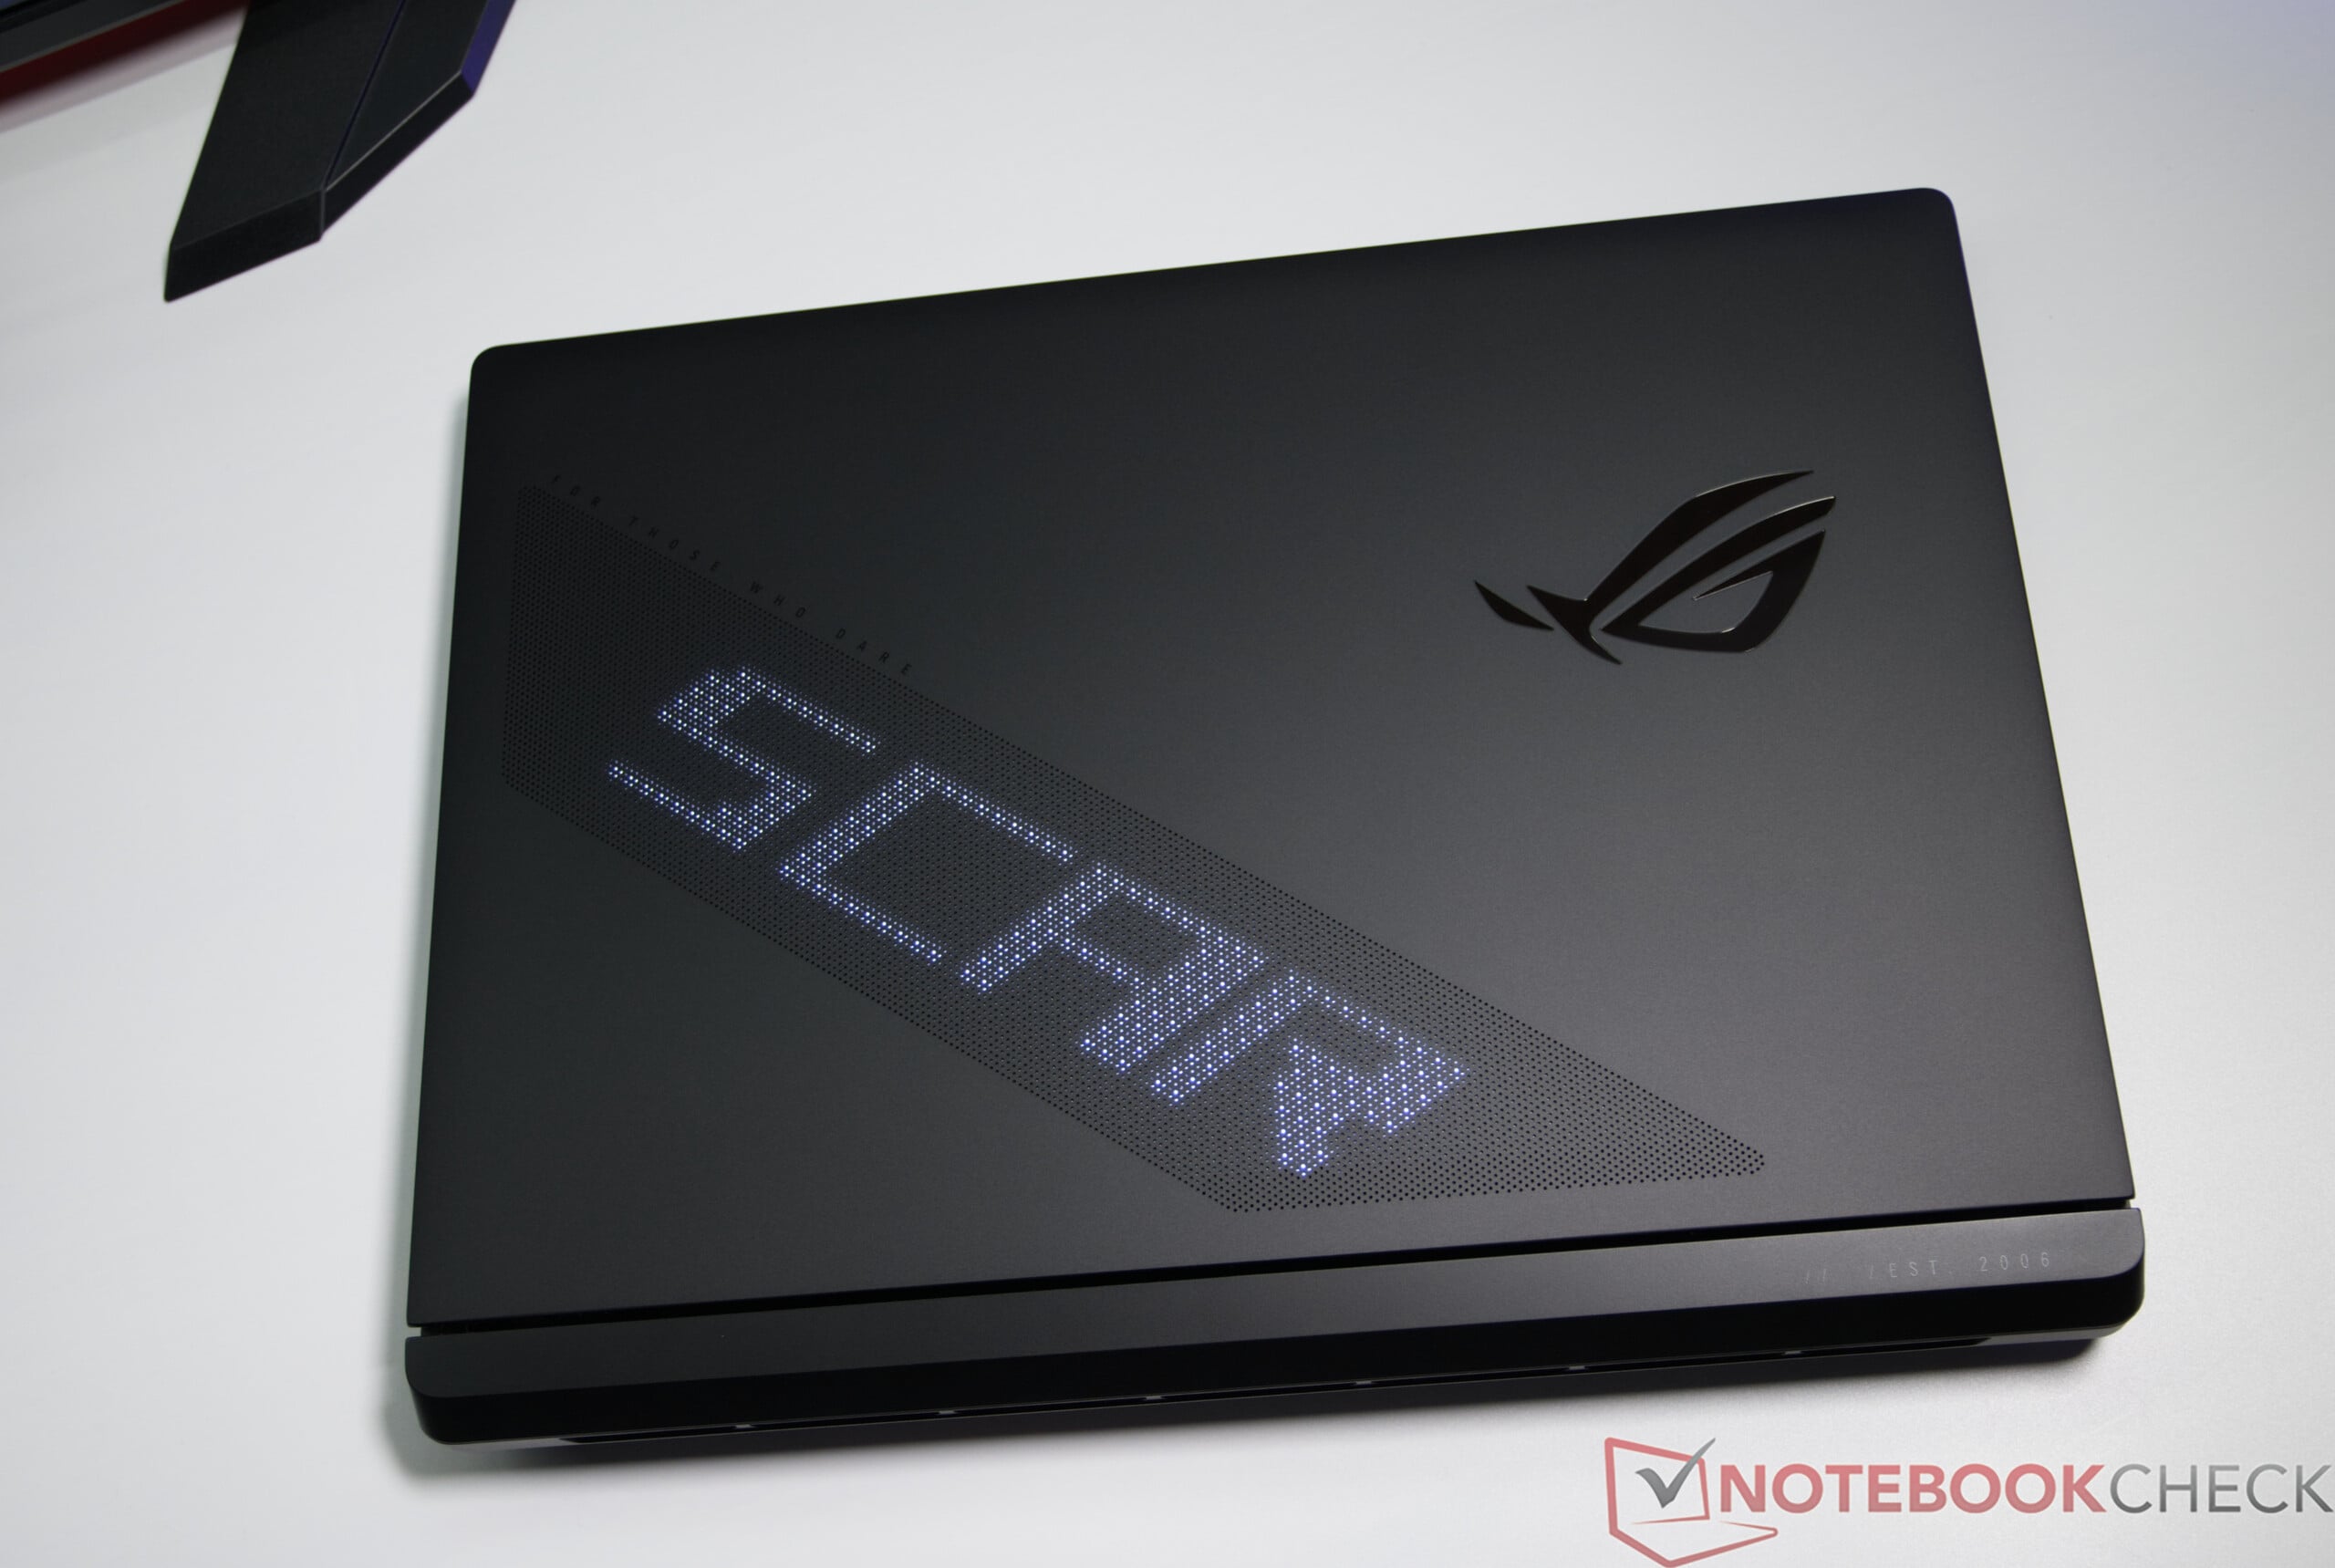
A Asus está atualizando seu ROG Strix SCAR 18 G835LXG com o processador Intel Core Ultra 9 290HX, uma GPU para notebook NVIDIA GeForce RTX 5090 e uma tela Mini-LED 4K de 18 polegadas com taxa de atualização de 240 Hz e 2.000 zonas de escurecimento. Ele também oferece excelente facilidade de manutenção graças ao acesso simplificado aos componentes e às amplas opções de personalização com o AniME Vision e iluminação RGB versátil.
Sebastian Bade, 👁 Sebastian Bade (traduzido por DeepL / Ninh Duy) Publicado 🇺🇸 🇩🇪 ...
AI Blackwell RTX 5000 Nvidia Arrow Lake Intel Laptop / Notebook Windows Gaming Wi-Fi 7 Thunderbolt

Veredicto — Desempenho máximo em jogos, com poucas deficiências

O Asus ROG Strix SCAR 18 G835LXG é um dos notebooks para jogos mais potentes atualmente disponíveis no mercado. Equipado com o processador Intel Core Ultra 9 290HX, a placa de vídeo NVIDIA GeForce RTX 5090 para notebook com TGP de 175 watts e 128 GB de RAM, o modelo testado oferece enormes reservas de desempenho para os jogos AAA mais recentes, criação de conteúdo profissional e cargas de trabalho exigentes de IA. O desempenho da CPU e da GPU permanece estável mesmo sob carga prolongada.

A tela Mini-LED de 18 polegadas com resolução 4K, 2.000 zonas de escurecimento e taxa de atualização de 240 Hz é um dos maiores pontos fortes do notebook. Ela impressiona pela alta nitidez, excelentes recursos HDR e alto brilho máximo. As únicas limitações estão na calibração de cores de fábrica, que, no entanto, pode ser significativamente melhorada por meio de calibração. Além disso, a taxa de atualização de 240 Hz está disponível exclusivamente no Modo GPU Ultimate — em todos os outros modos gráficos, ainda é possível atingir 120 Hz.

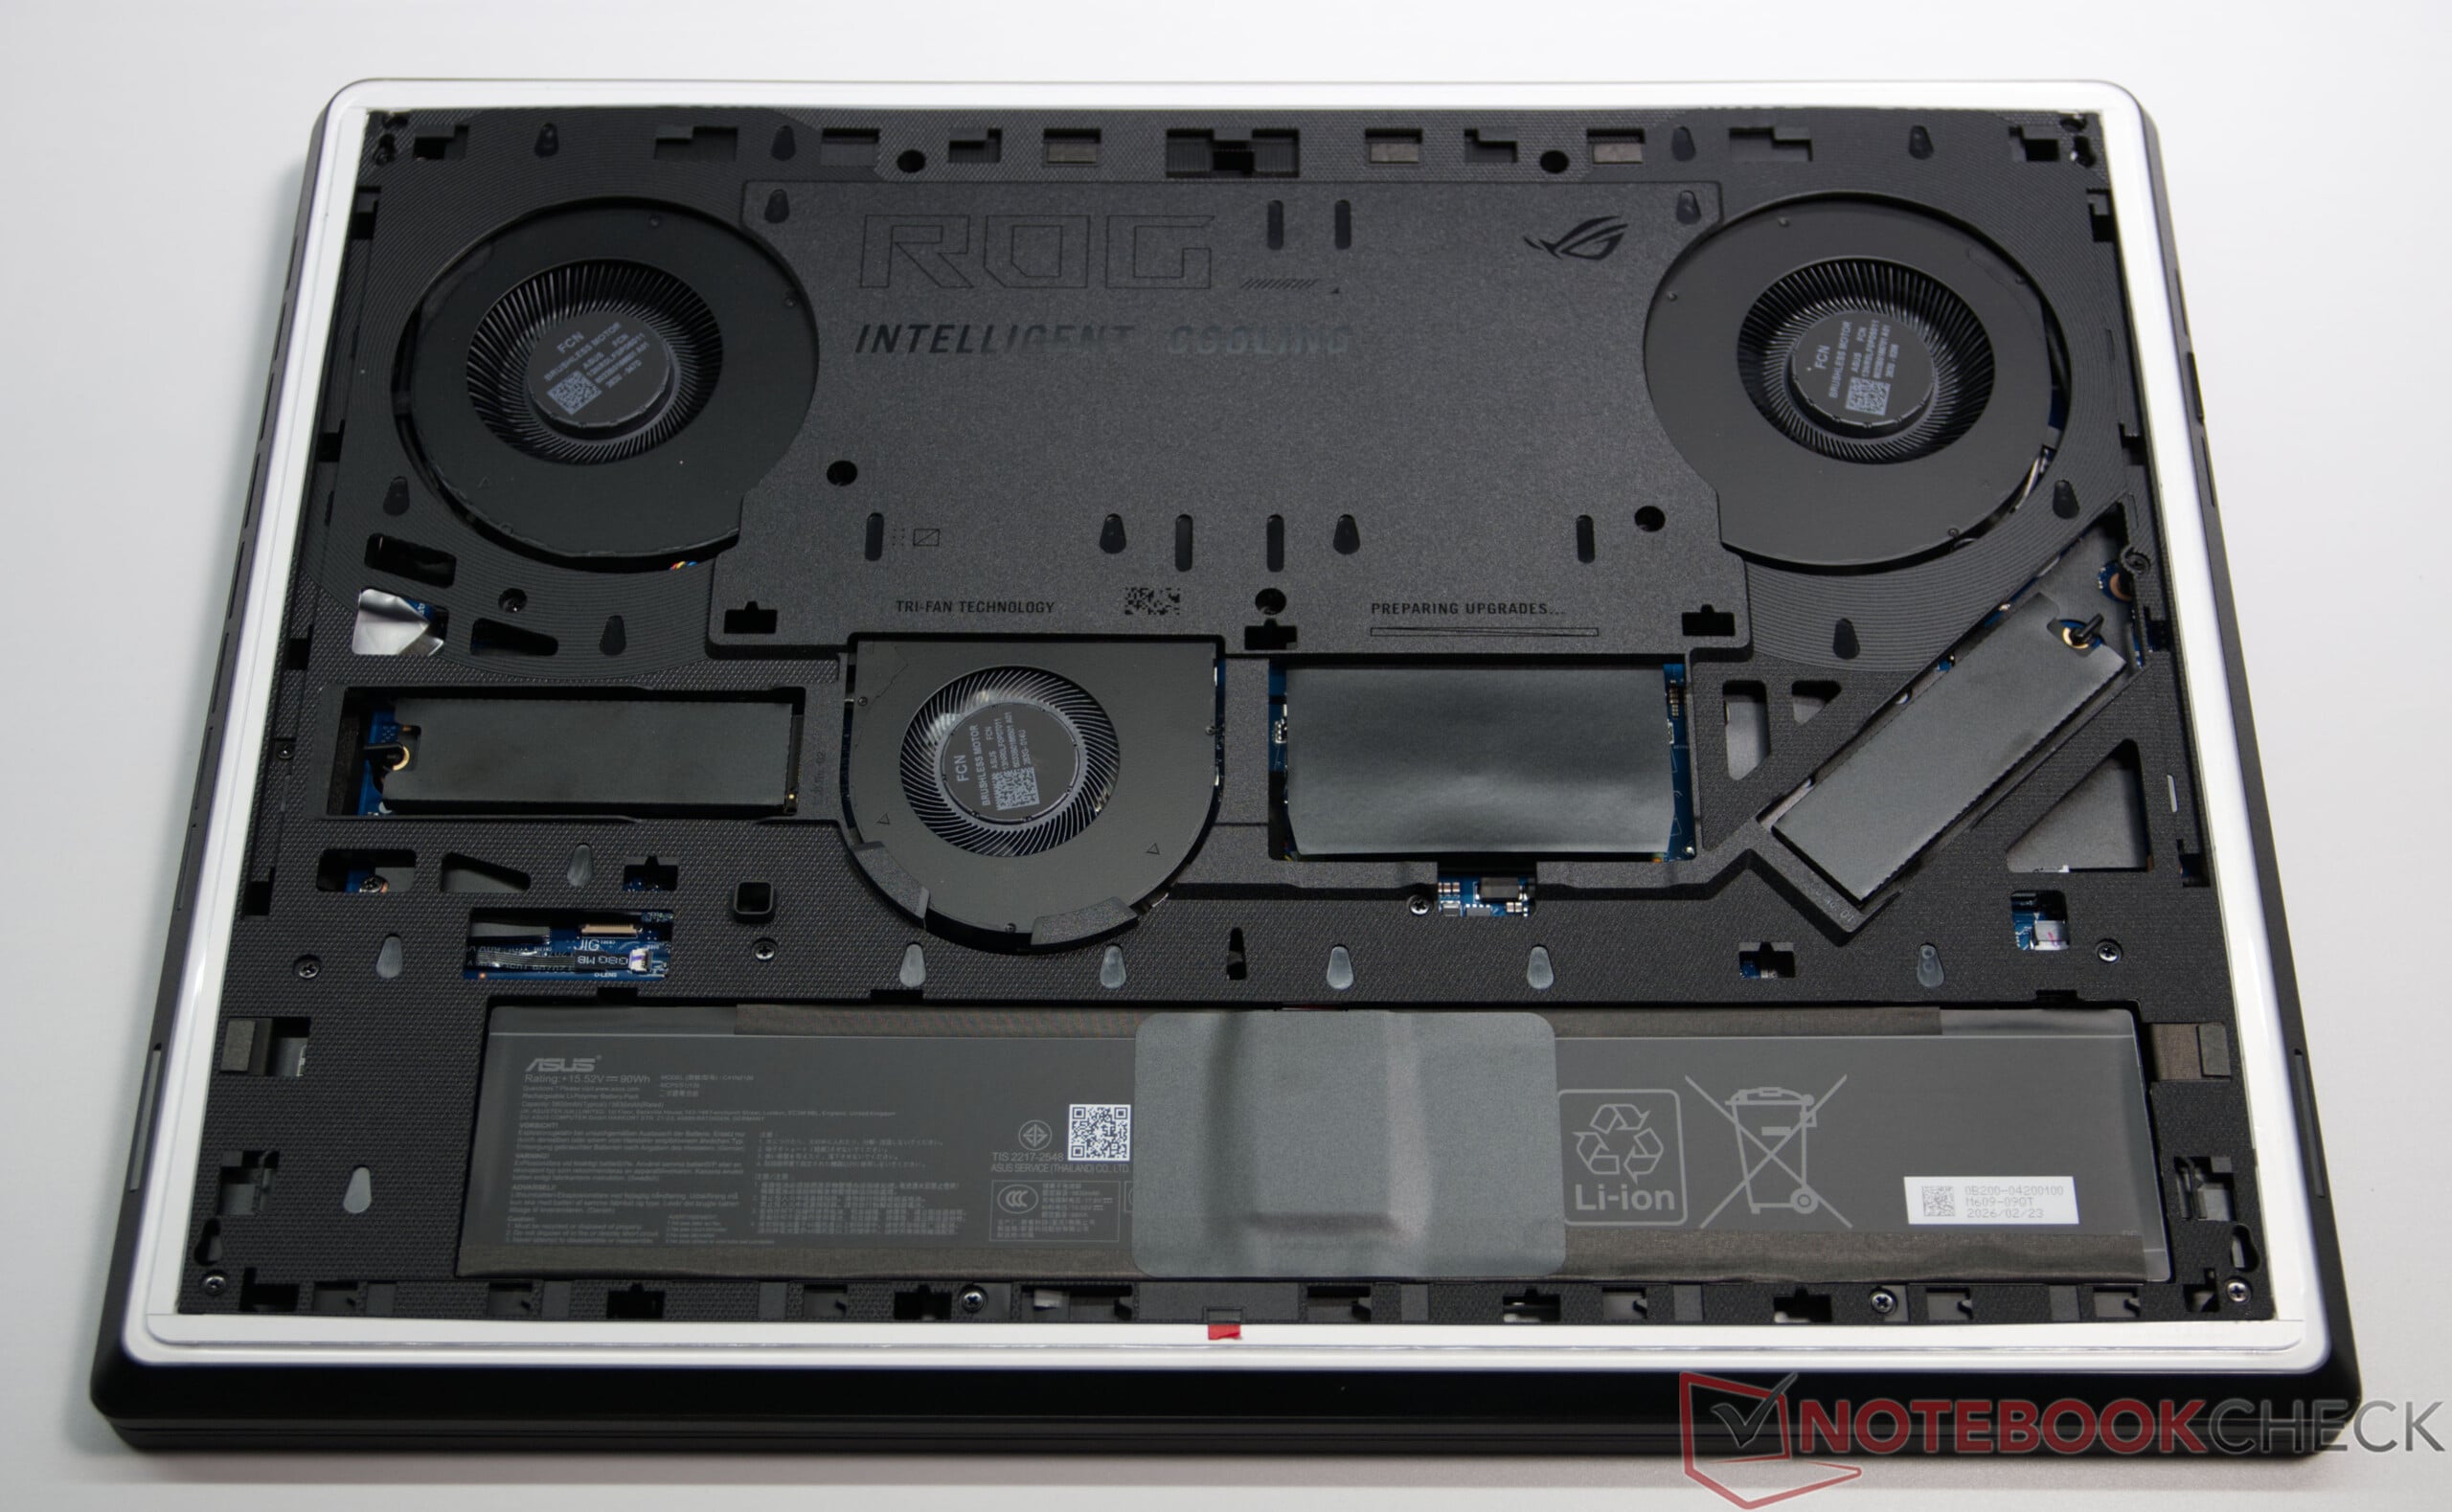
O gabinete também transmite uma impressão de alta qualidade. A iluminação RGB abrangente, incluindo o AniME Vision, bem como a facilidade de manutenção, reforçam seu apelo premium. Menos impressionantes são a delicada superfície plástica da unidade base, que fica rapidamente marcada com impressões digitais, e o sistema de resfriamento, que é claramente audível sob carga. Somam-se a isso o alto consumo de energia e a duração da bateria, que é meramente mediana para esta classe de desempenho.

Se você está procurando um substituto para o desktop sem concessões, com desempenho máximo em jogos e aplicativos, o Asus ROG Strix SCAR 18 G835LXG é um dos notebooks para jogos de 18 polegadas mais potentes disponíveis atualmente. No entanto, isso tem como contrapartida um preço de compra muito elevado, bem como altos níveis de ruído e consumo de energia — compromissos típicos para essa classe de desempenho.

Pro

+ Excelente desempenho em jogos e do sistema
+ Notebook GeForce RTX 5090 com TGP de 175 watts
+ 128 GB de memória RAM DDR5
+ Um total de 8 TB de armazenamento (2x 4 TB em RAID 0)
+ Excelente tela Mini-LED de 18 polegadas
+ Duas portas Thunderbolt 5
+ Excelentes opções de manutenção e atualização
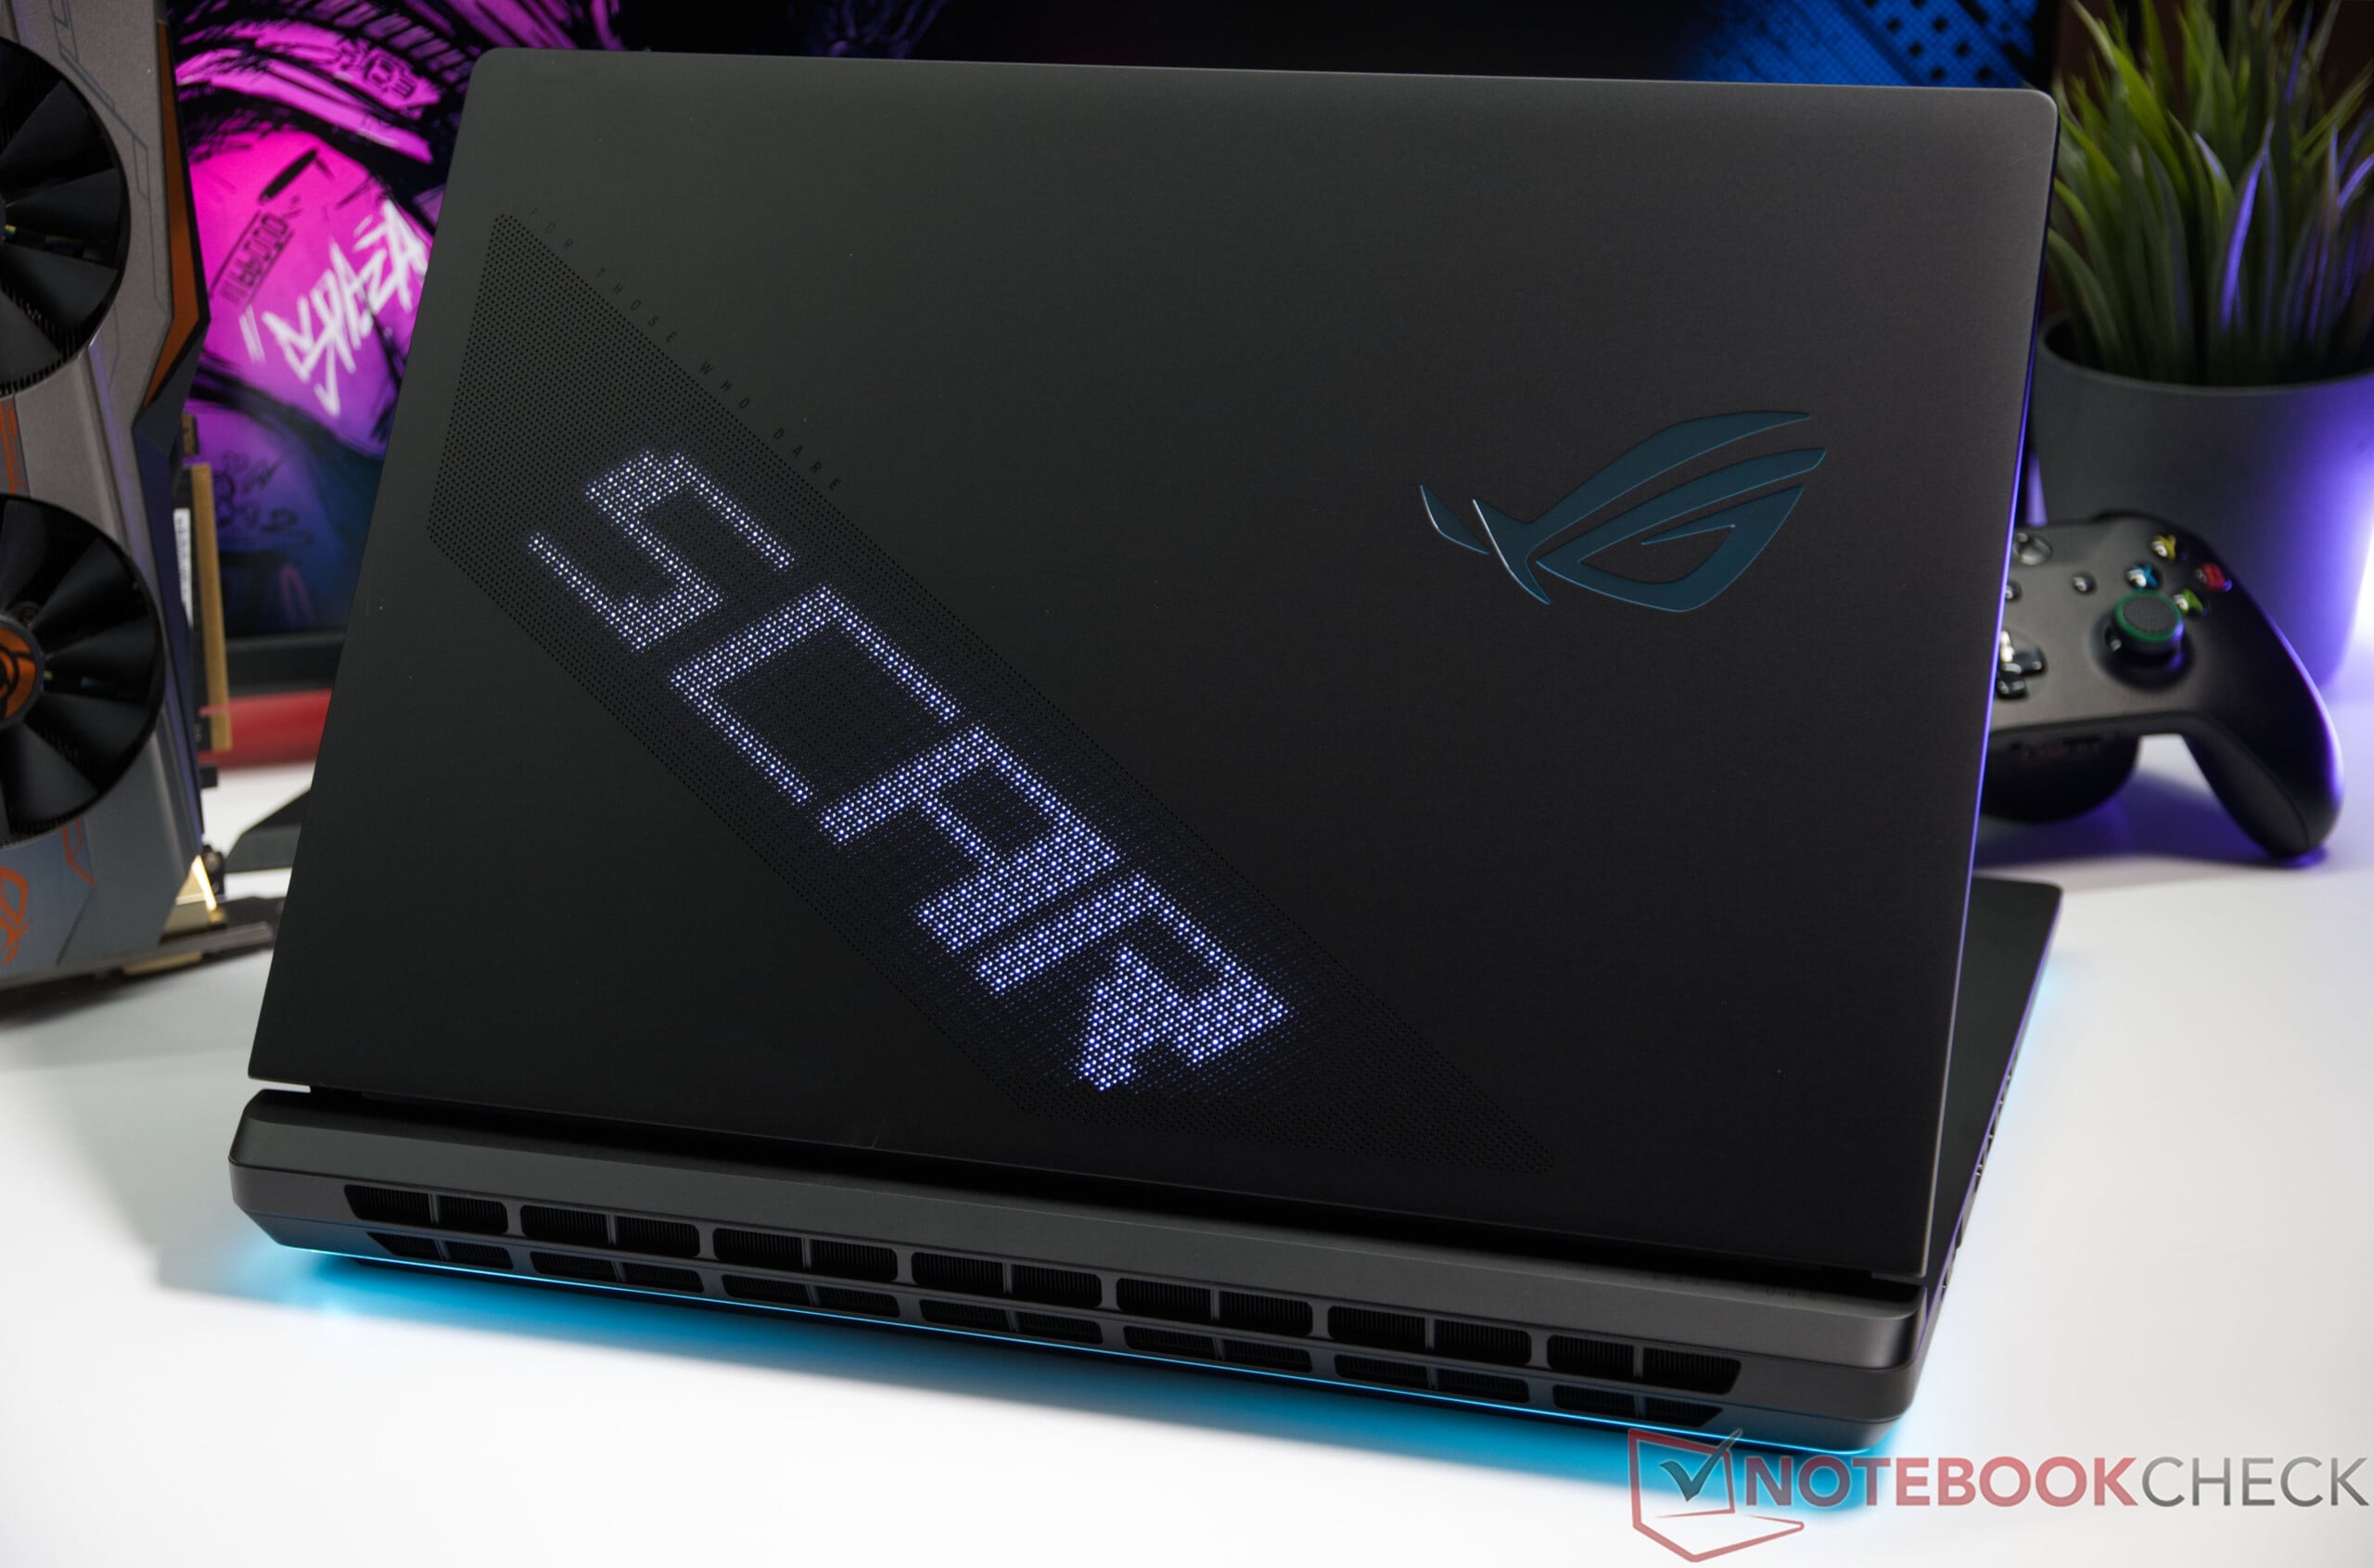
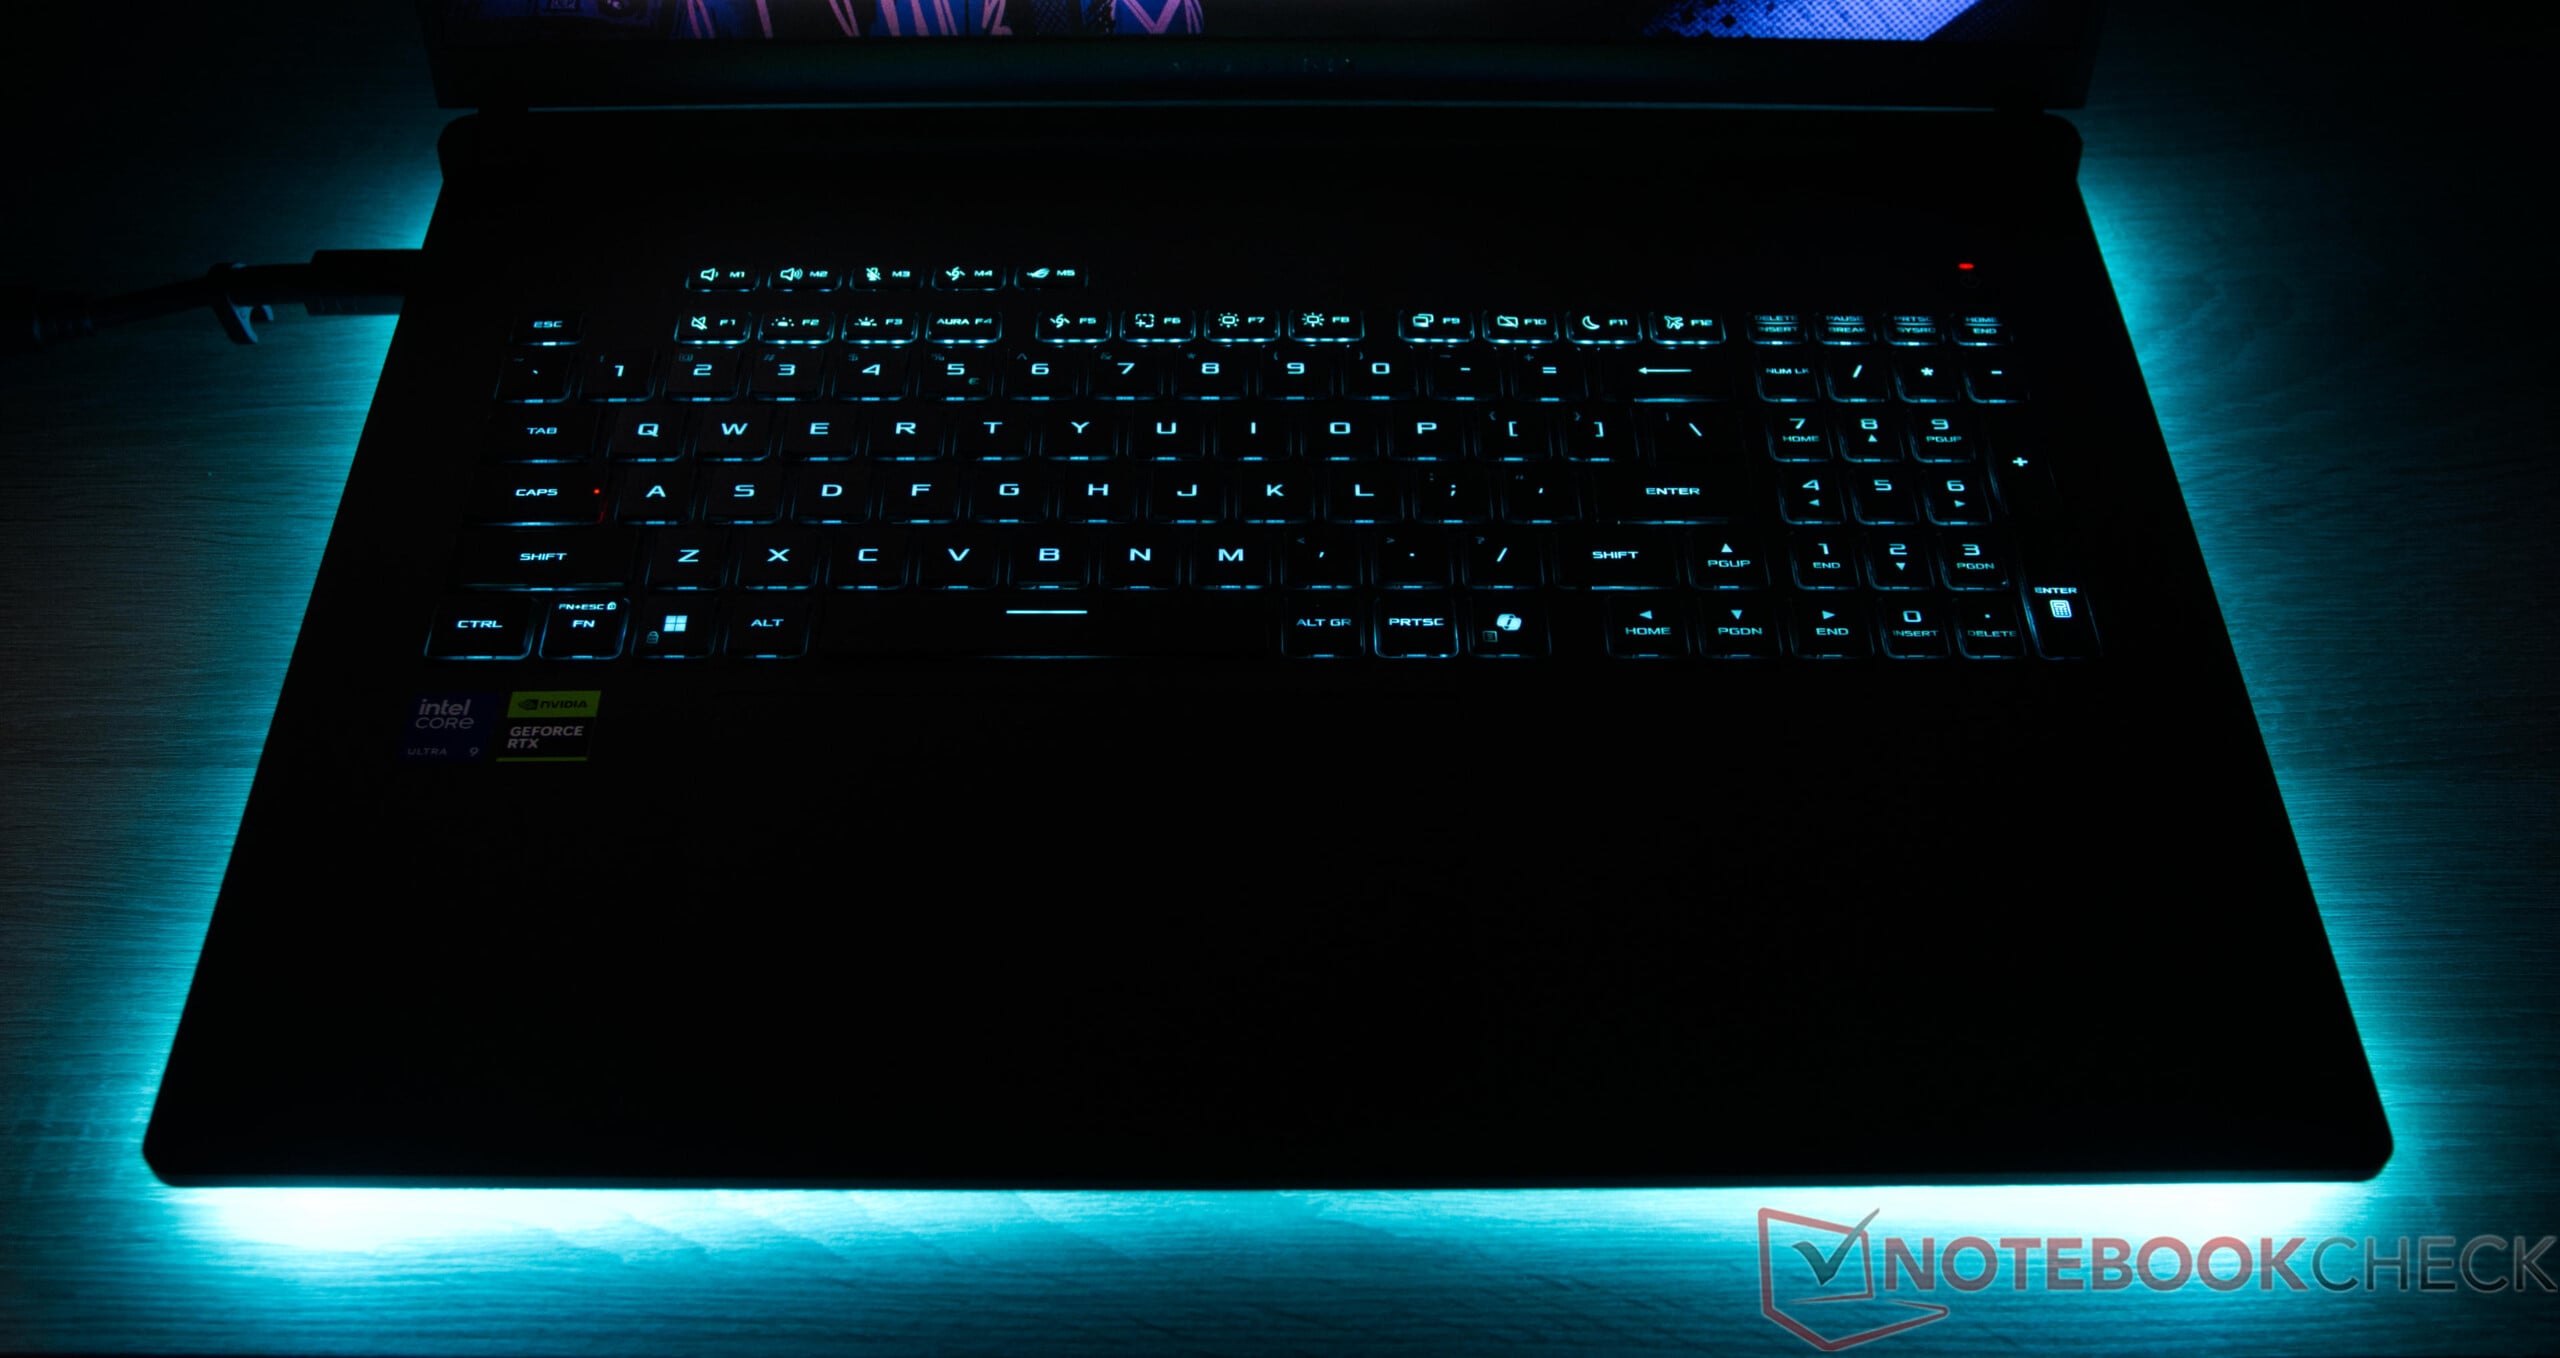
+ Iluminação RGB e AniME Vision versátil e configurável
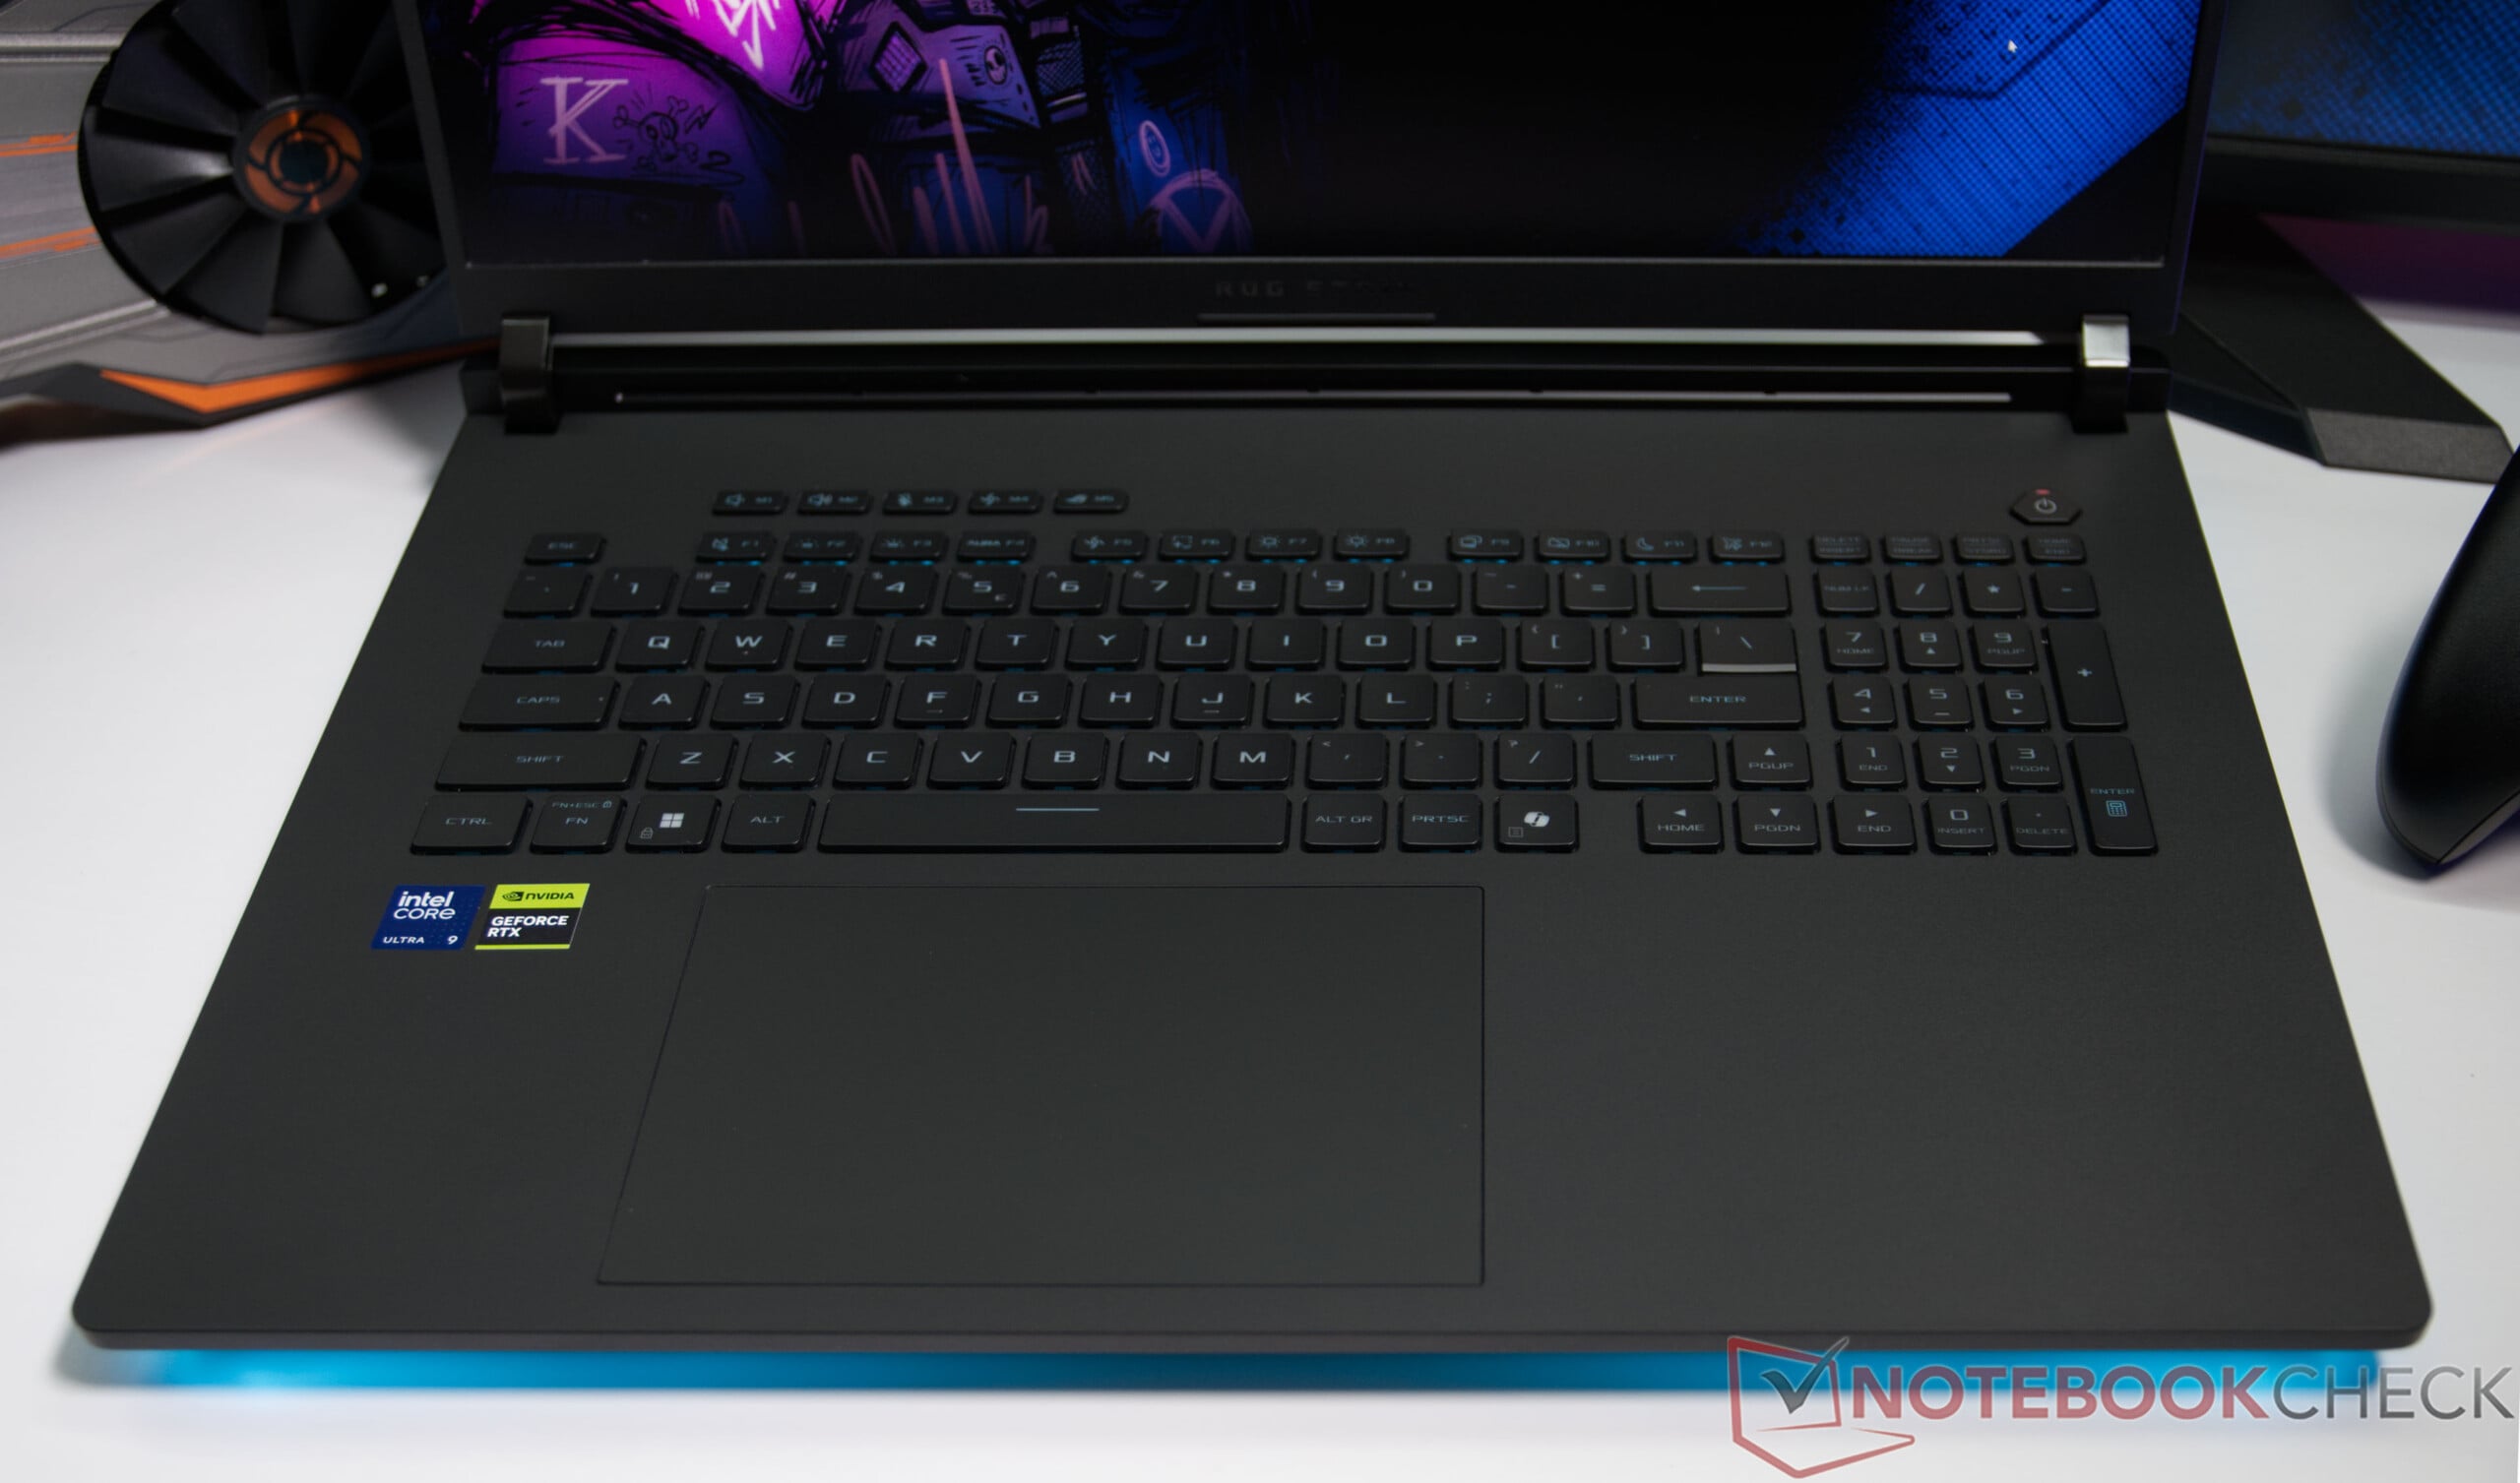
+ Teclado confortável com digitação precisa

Contra

- Altos níveis de ruído sob carga de jogos
- A base de plástico fica muito marcada por impressões digitais
- Alto consumo de energia sob carga
- Sem portas na parte traseira do gabinete

Preço e disponibilidade

Espera-se que o novo Asus ROG Strix SCAR 18 esteja disponível nas lojas em breve.

Amazon Logo
  • $7,439.00
    HIDevolution [2026] ASUS ROG Strix Scar 18 G835LXG 18" 4K 240Hz Mini LED, 2.7 GHz Ultra 9-290HX Plus, RTX 5090, 128 GB DDR5 RAM, 4 TB PCIe SSD, Windows 11 Pro
  • $6,284.00
    HIDevolution [2026] ASUS ROG Strix Scar 18 G835LXG 18" 4K 240Hz Mini LED, 2.7 GHz Ultra 9-290HX Plus, RTX 5090, 64 GB DDR5 RAM, 2 TB PCIe SSD, Windows 11 Home
  • $6,019.00
    HIDevolution [2026] ASUS ROG Strix Scar 18 G835LXG 18" 4K 240Hz Mini LED, 2.7 GHz Ultra 9-290HX Plus, RTX 5090, 64 GB DDR5 RAM, 1 TB PCIe SSD, Windows 11 Home

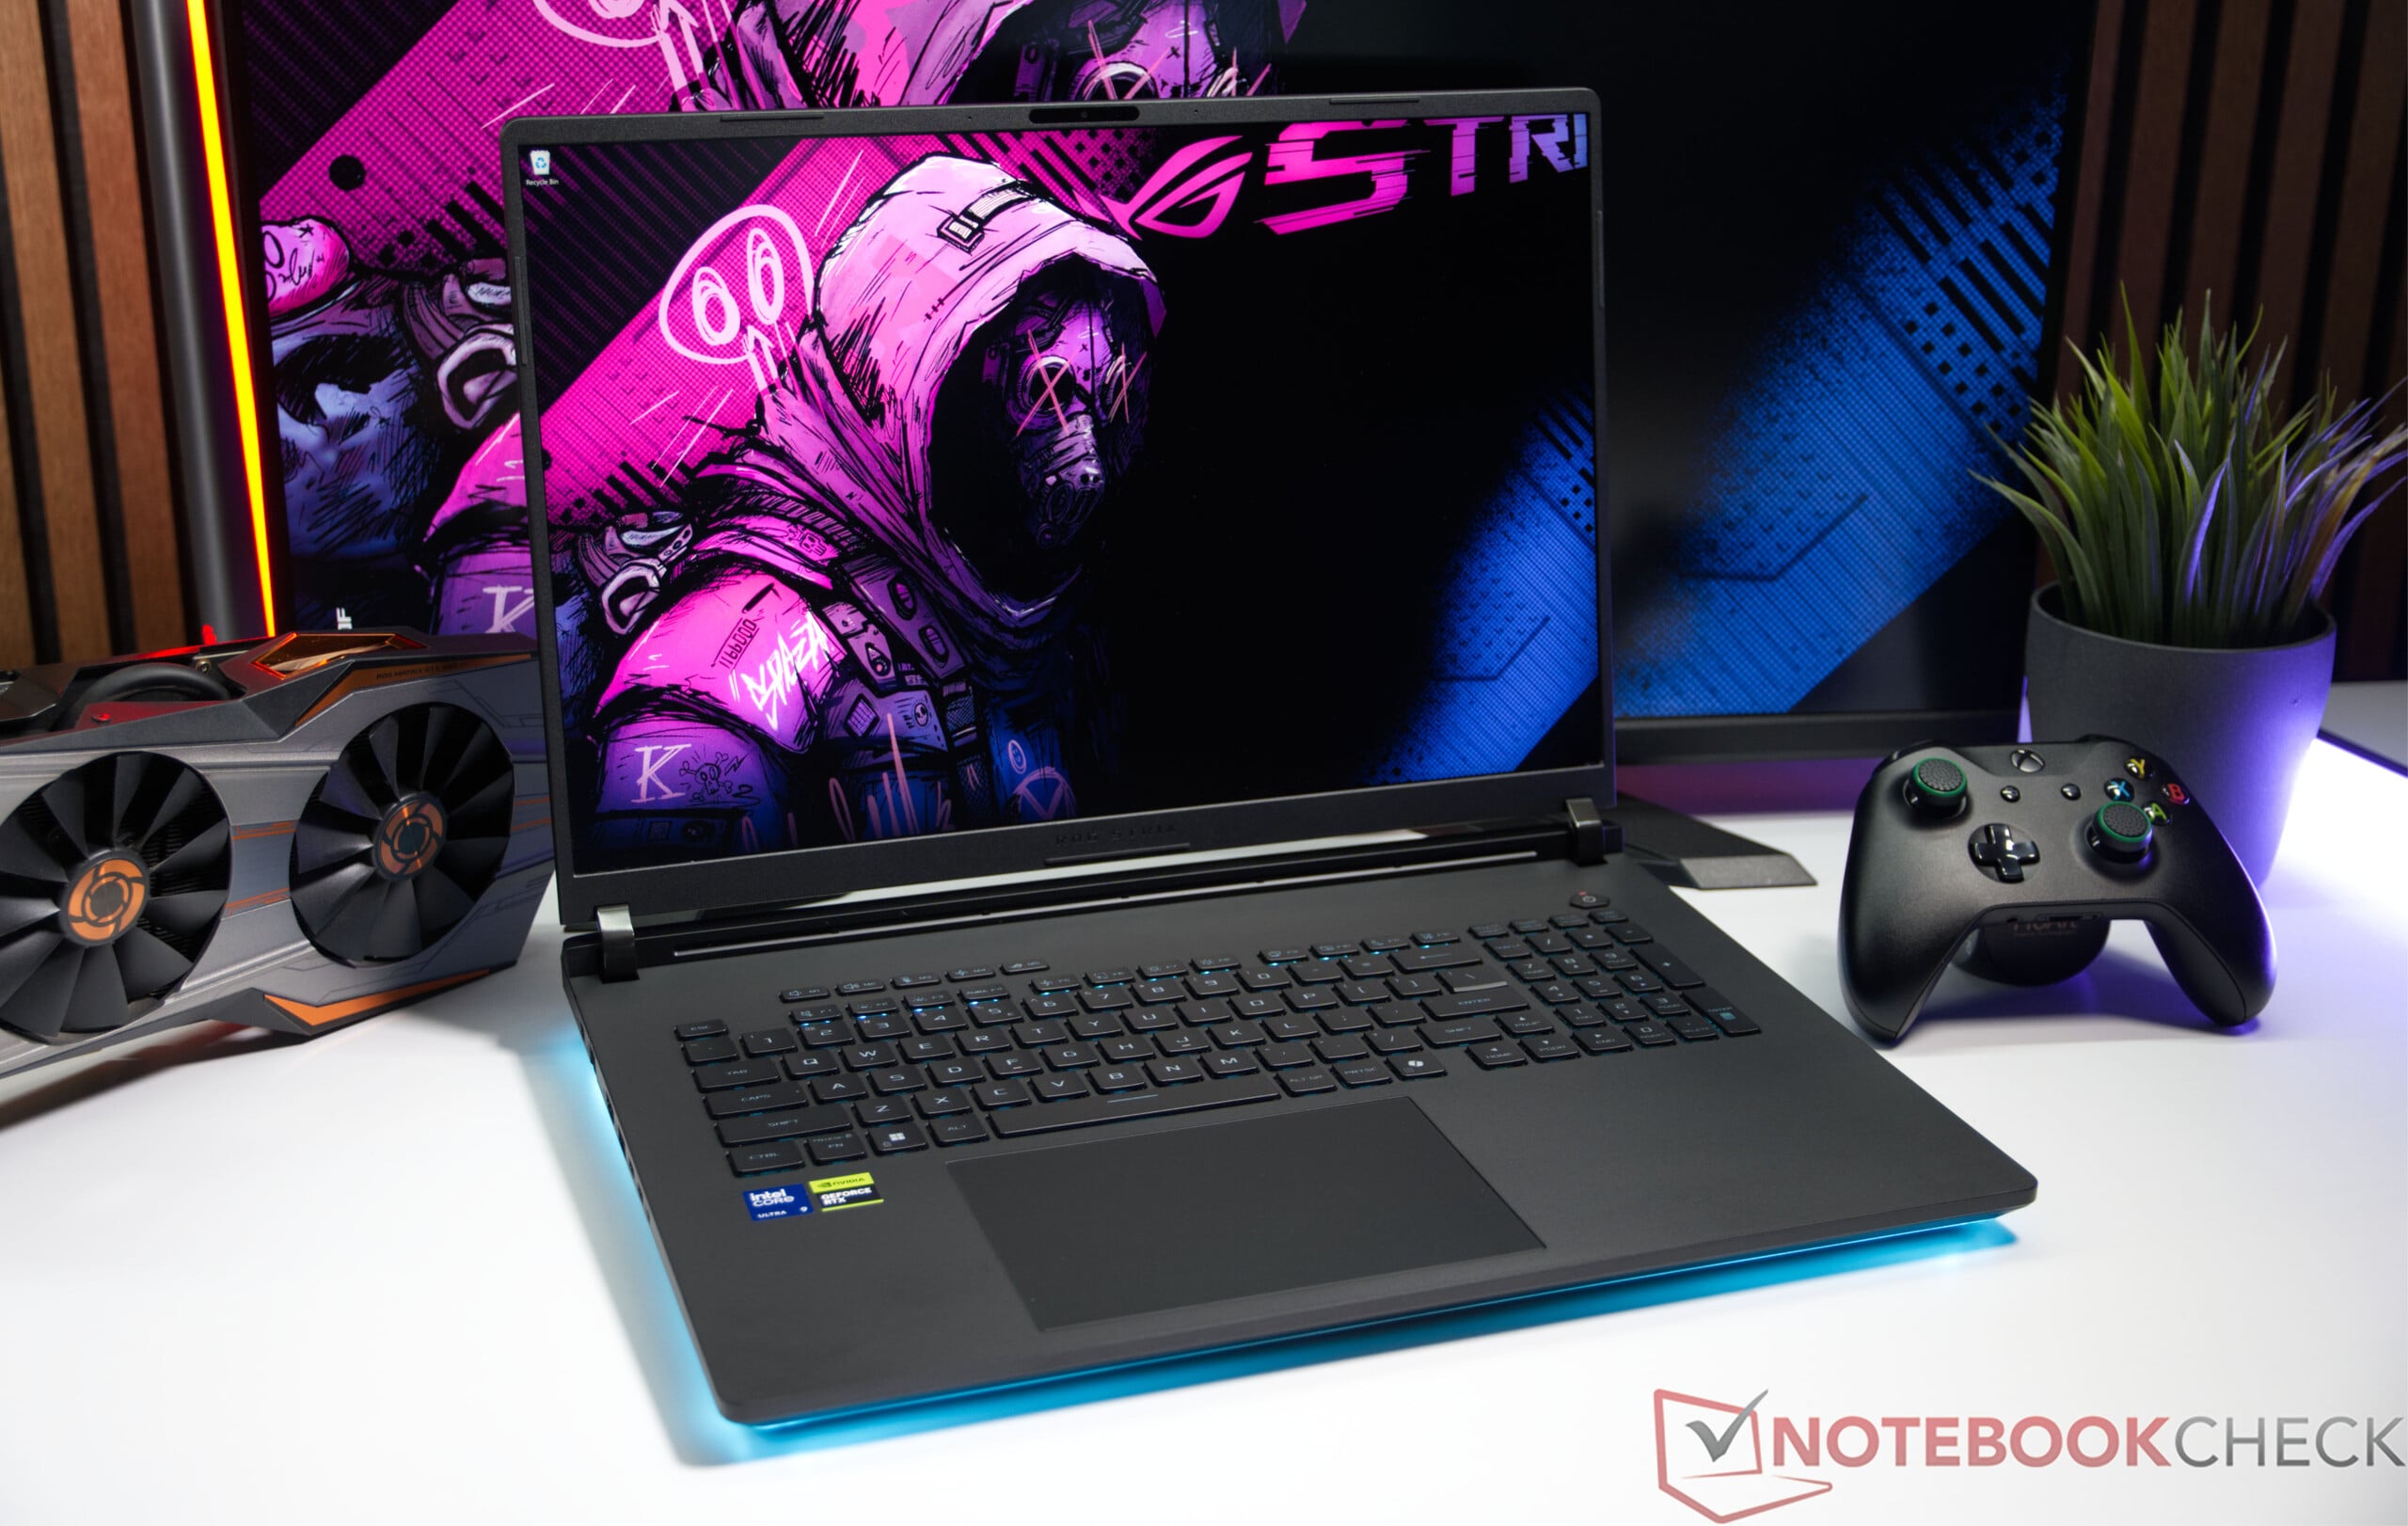
O Asus ROG Strix SCAR 18 G835LXG é o notebook para jogos carro-chefe da Asus e foi projetado para usuários com as mais altas exigências de desempenho. Nossa unidade de teste combina o processador Intel Core Ultra 9 290HX com uma placa de vídeo Nvidia GeForce RTX 5090 para notebooks e também conta com 128 GB de RAM, dois SSDs rápidos de 4 TB em uma matriz RAID 0 e uma tela Mini-LED de 18 polegadas com taxa de atualização de 240 Hz. Isso torna o notebook de ponta igualmente adequado para jogos exigentes e para a criação de conteúdo profissional.

Especificações

Asus ROG Strix Scar 18 G835LXG (Strix Scar 18 Serie)
Processador
Intel Core Ultra 9 290HX Plus 24c/24t, 8 x 5.5 GHz Intel Lion Cove P-Core, 16 x 4.7 GHz Intel Skymont E-Core, 200 W PL2 / Short Burst, 180 W PL1 / Sustained, Arrow Lake-HX
Placa gráfica
NVIDIA GeForce RTX 5090 Laptop - 24 GB VRAM, Análises do: 1597 MHz, Memoría: 1750 MHz, 175 W TDP ( incluindo 25 W Dynamic Boost), GDDR7, Nvidia 610.62, Advanced Optimus
Memória
128 GB 
, DDR5-6400, 2x SO-DIMM, Dual-Channel
Pantalha
18.00 polegadas 16:10, 3840 x 2400 pixel 252 PPI, NE180QA1-MM0, Mini LED, Brilhante: não, HDR, 240 Hz, Adaptive Sync
placa mãe
Intel HM870 (Arrow Lake-HX PCH)
Disco rígido
2x Samsung PM9E1 MZVLC4T0HBL1 (RAID 0), 8192 GB 
, M.2 PCIe, RAID 0, 7280 GB livre
Placa de Som
Intel Arrow Lake-S PCH - ACE (Audio Context Engine)
Conexões
3 USB 3.1 Gen2, 2 Thunderbolt 5, USB-C Power Delivery (PD), 1 HDMI, 2 DisplayPort, 1 Docking Station Port, Conexões Audio: 3.5 mm Stereo
Funcionamento em rede
Realtek RTL8125 2.5GBe Family Ethernet Controller (10/100/1000/2500MBit/s), Intel Wi-Fi 7 BE200 320MHz (a/b/g/n = Wi-Fi 4/ac = Wi-Fi 5/ax = Wi-Fi 6/ Wi-Fi 6E 6 GHz be = Wi-Fi 7), Bluetooth 5.4
Tamanho
altura x largura x profundidade (em mm): 35 x 399 x 298
Bateria
90 Wh Lítio-Polímero, 4-cell
Sistema Operativo
Microsoft Windows 11 Home
Câmera
Webcam: 1080P FHD IR Camera for Windows Hello
Câmera principal: 2 MPix
Características adicionais
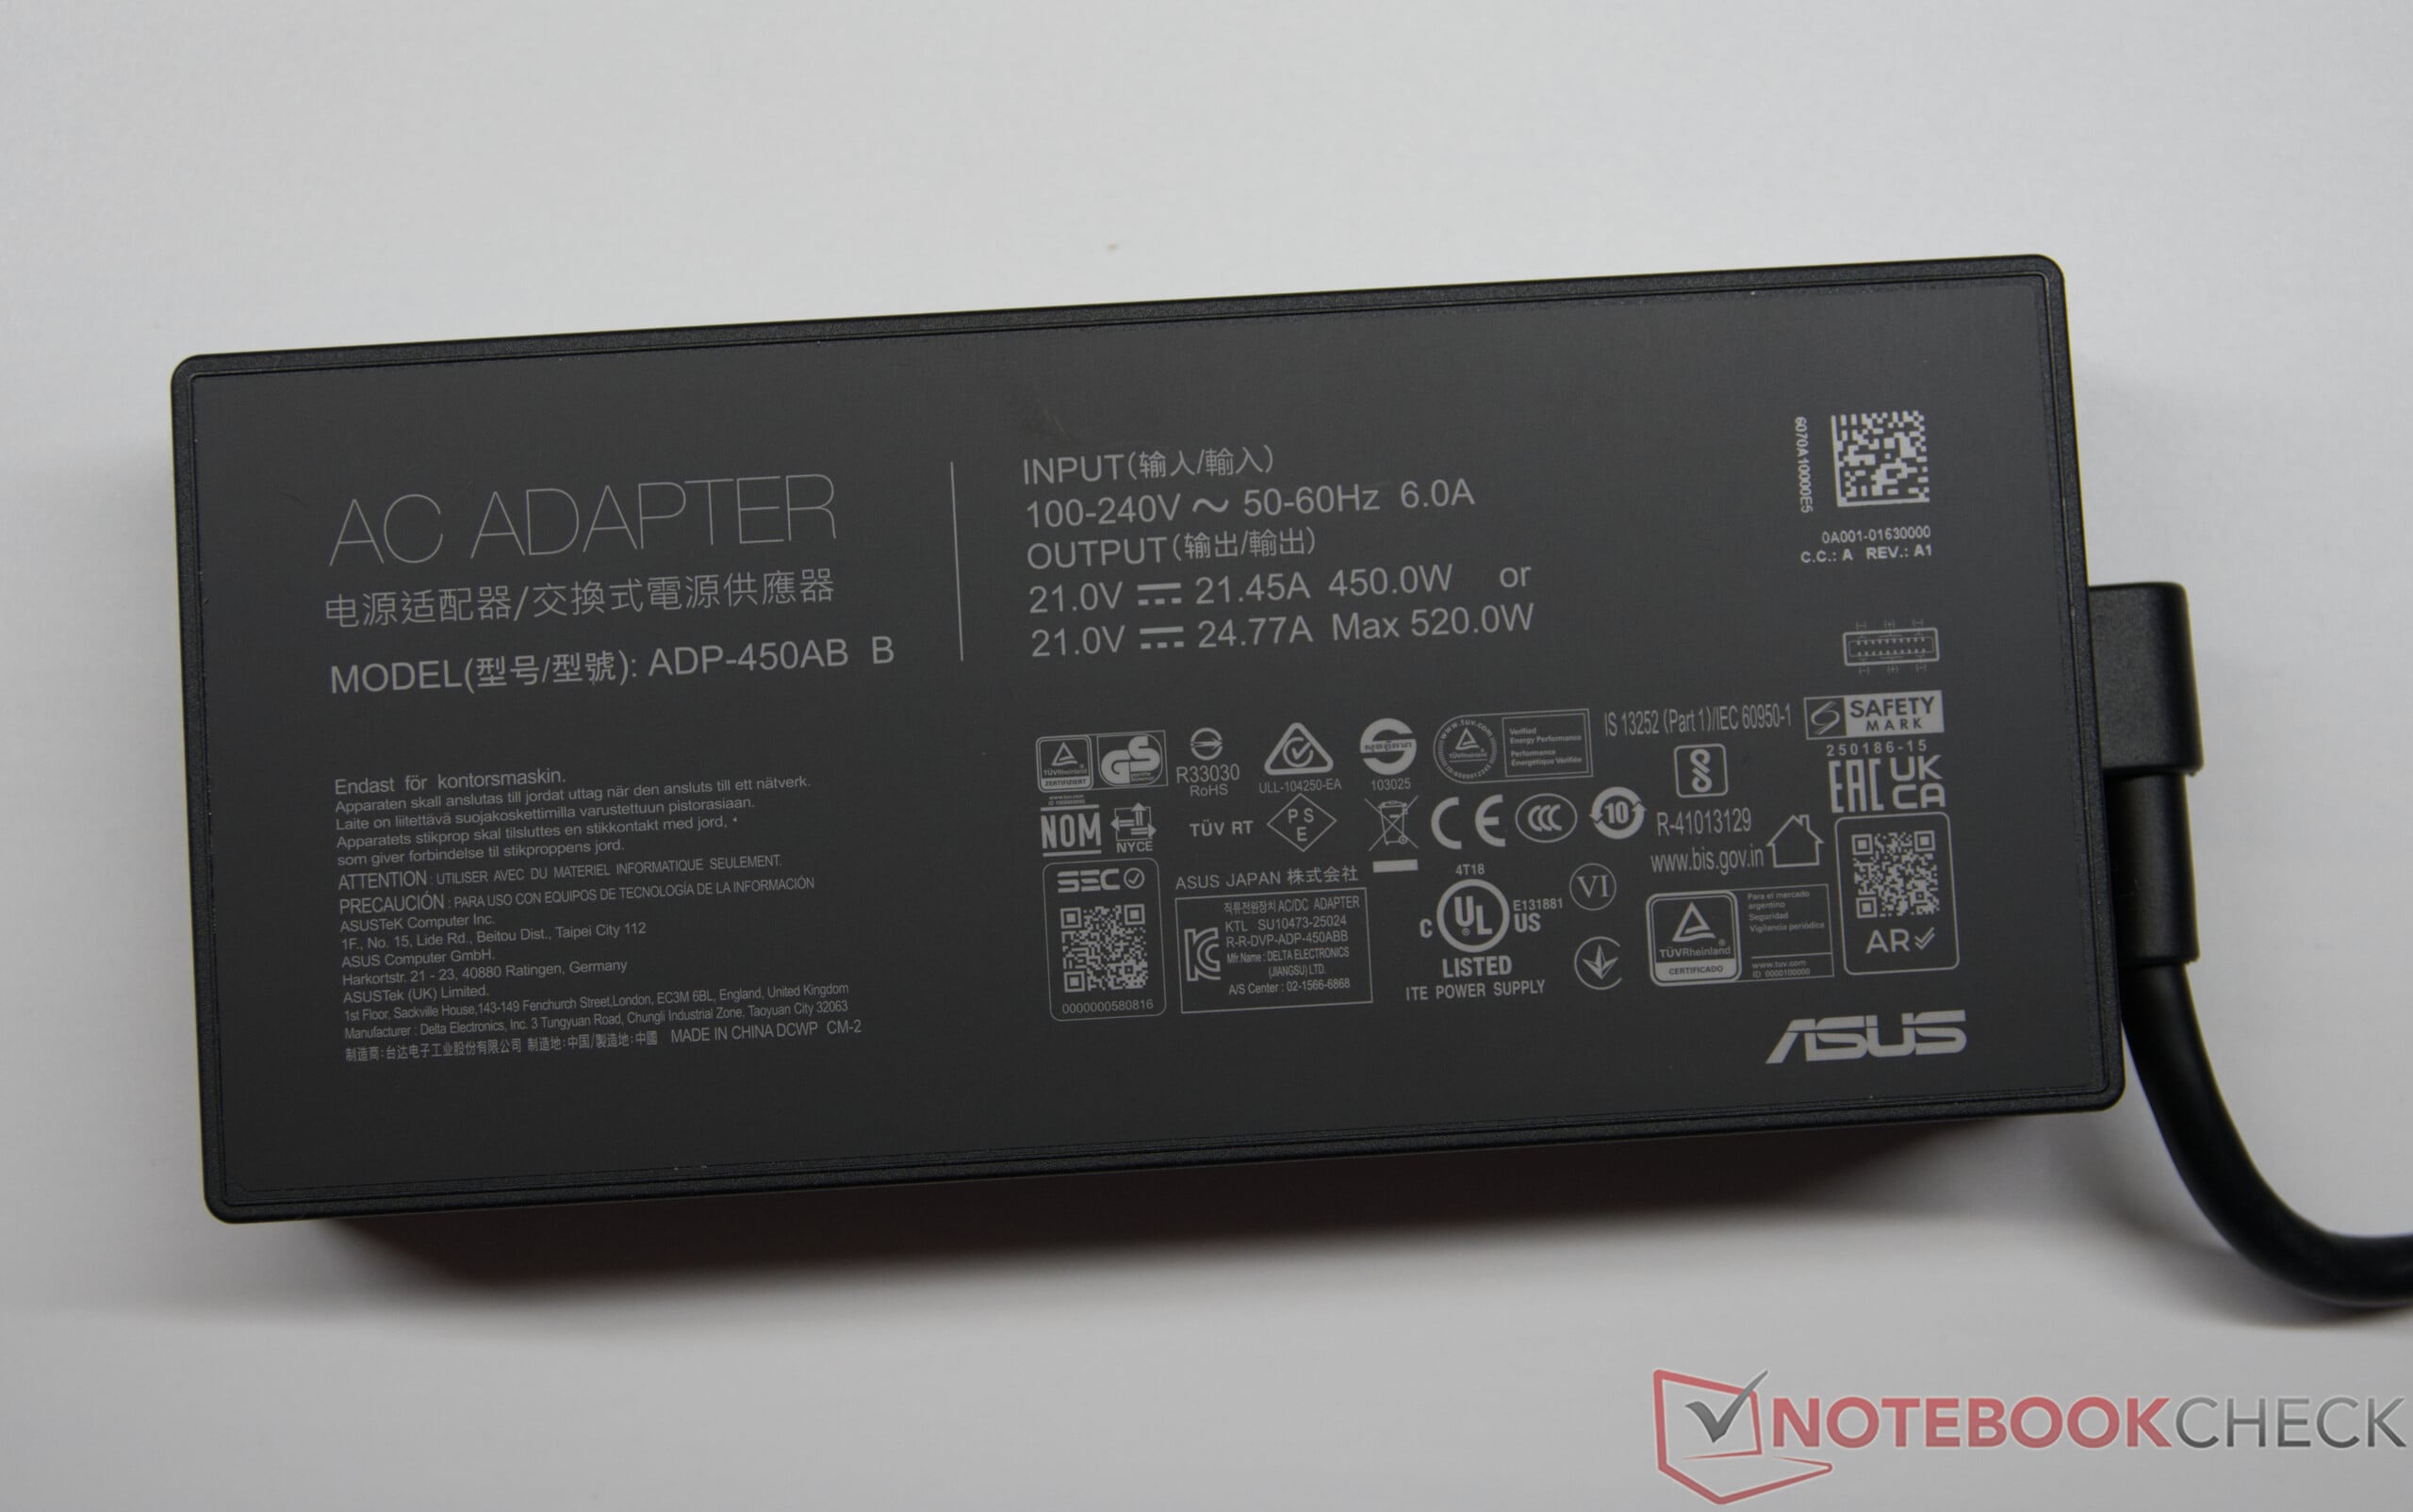
Alto falantes: 4-speaker system, Teclado: Chiclet, Iluminação do Teclado: sim, 450W PSU, Armoury Crate, 24 Meses Garantia
peso
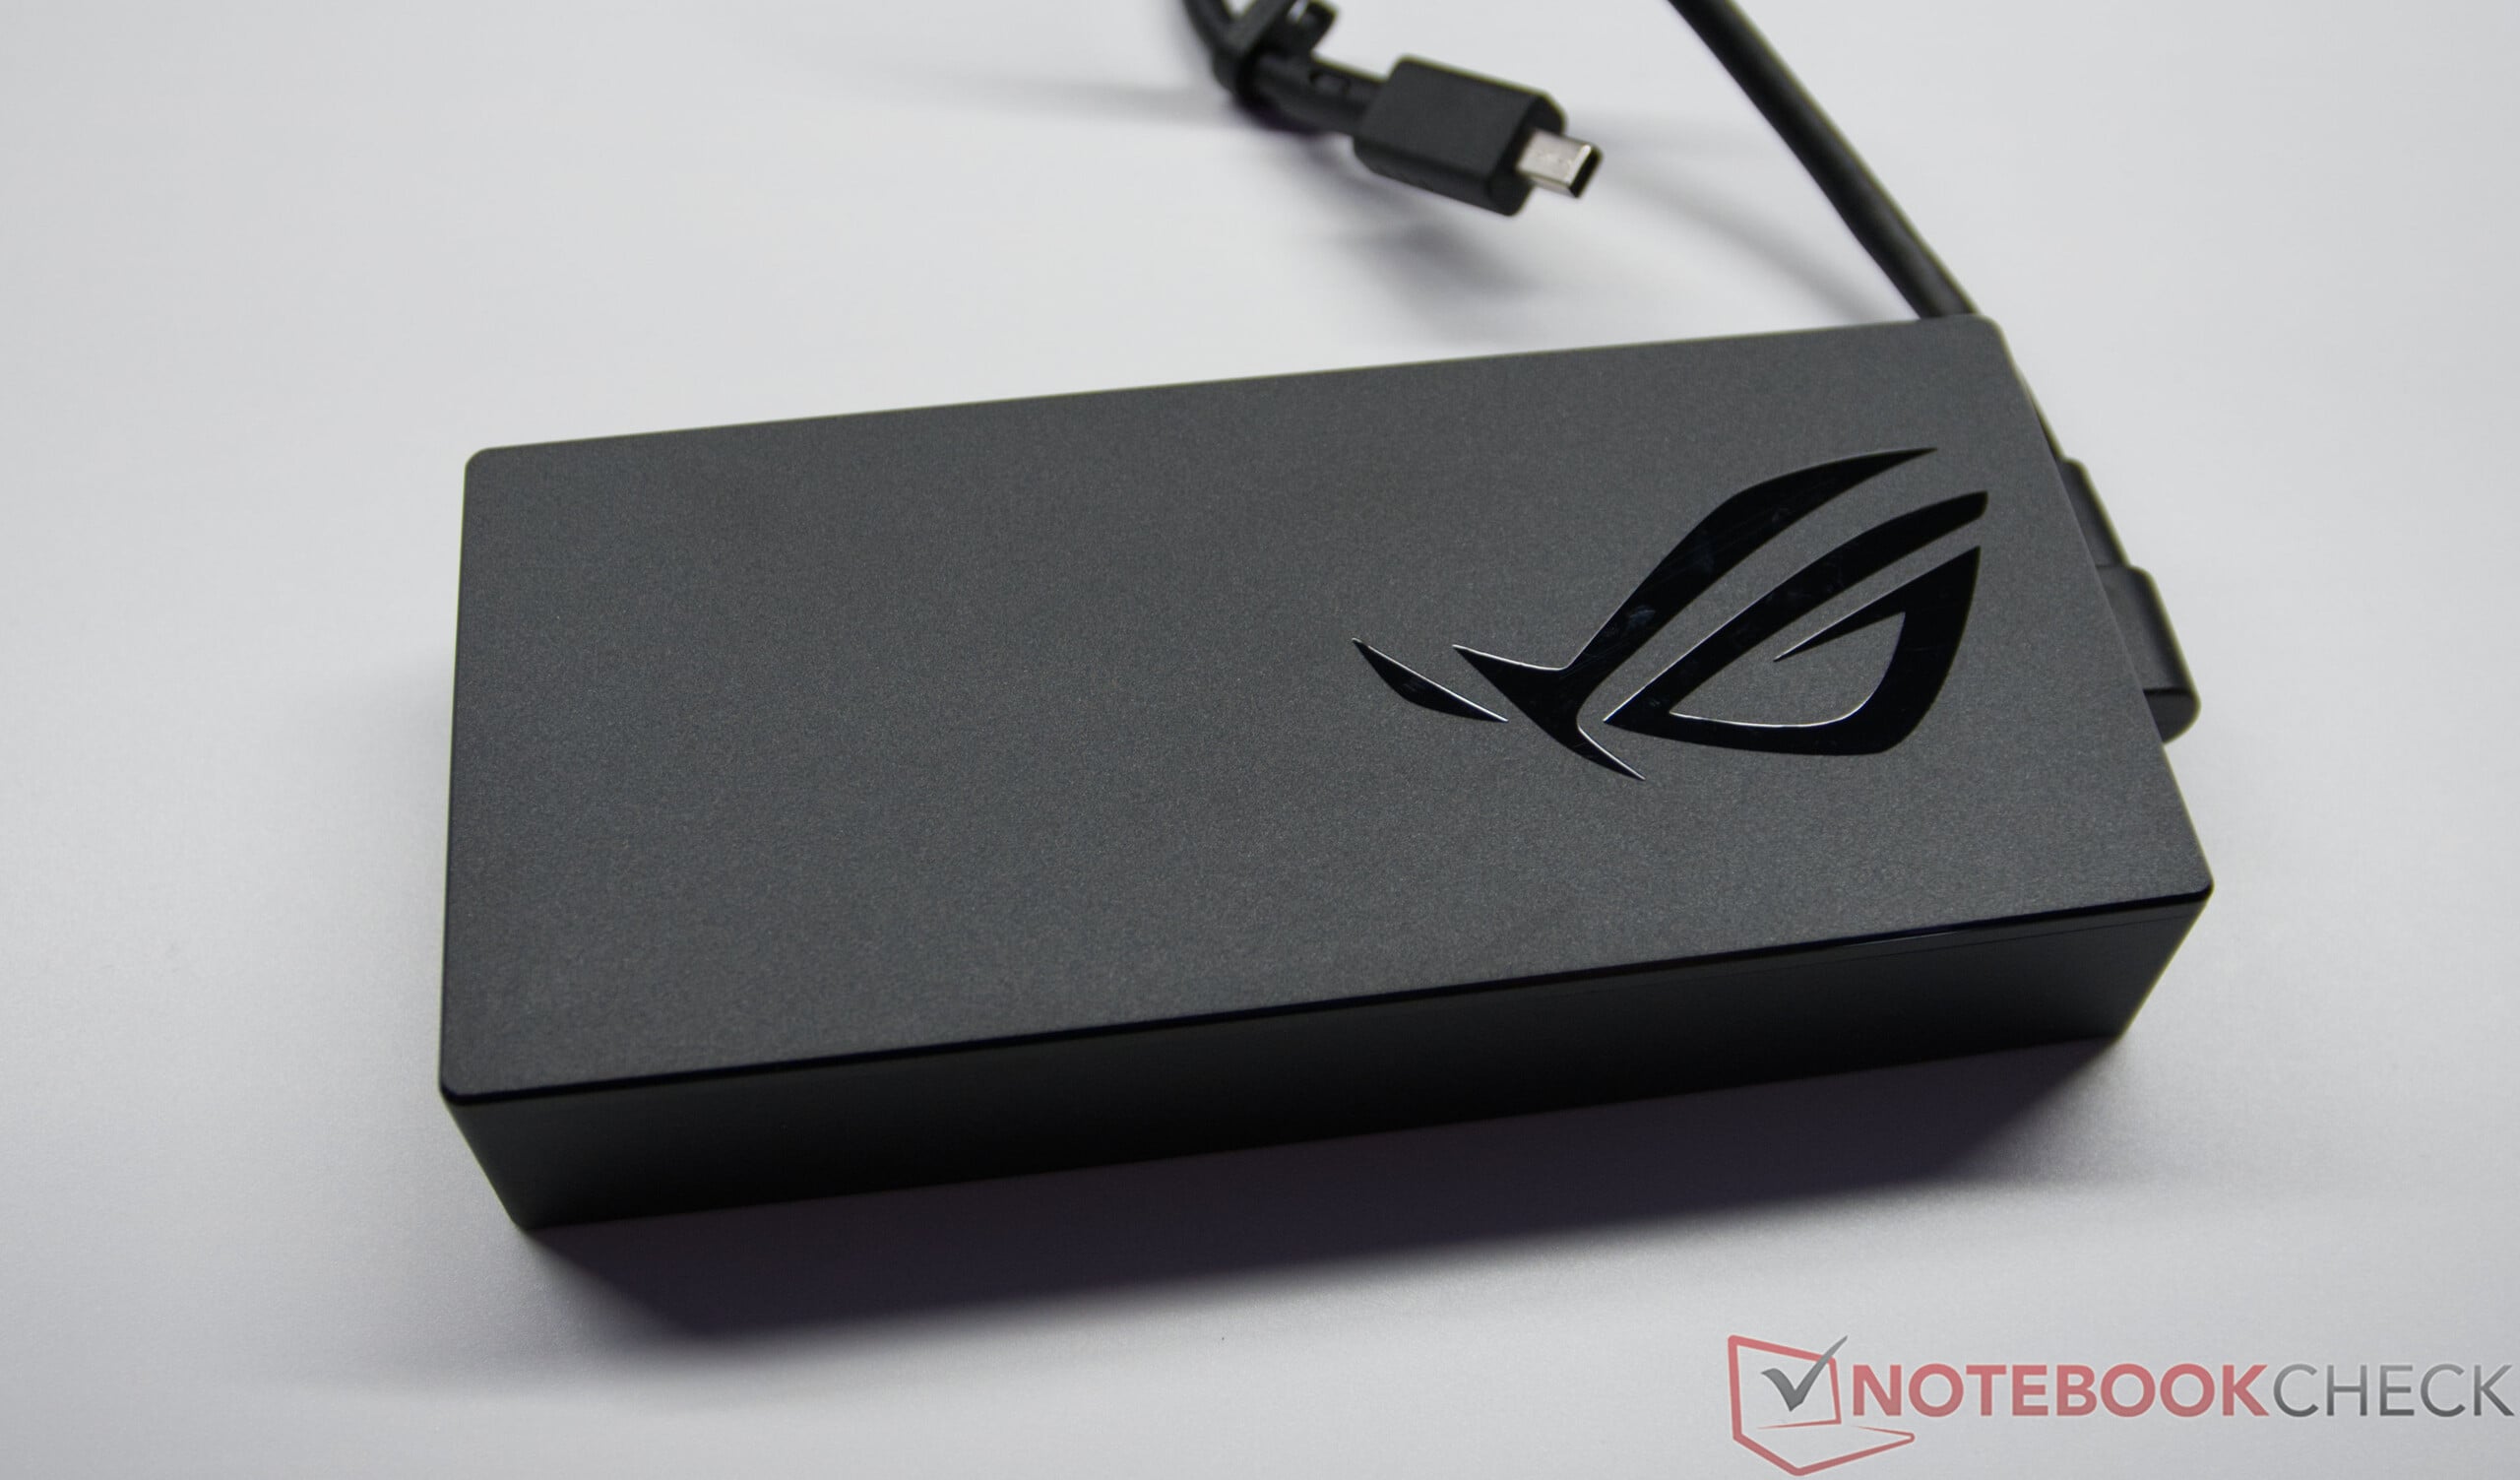
3.605 kg, Suprimento de energia: 821 g
Preço
8999 Euro
Nota: O fabricante pode utilizar componentes de diferentes fornecedores, incluindo painéis de exibição, unidades ou cartões de memória com especificações semelhantes.


Caixa, Recursos e Dispositivos de Entrada

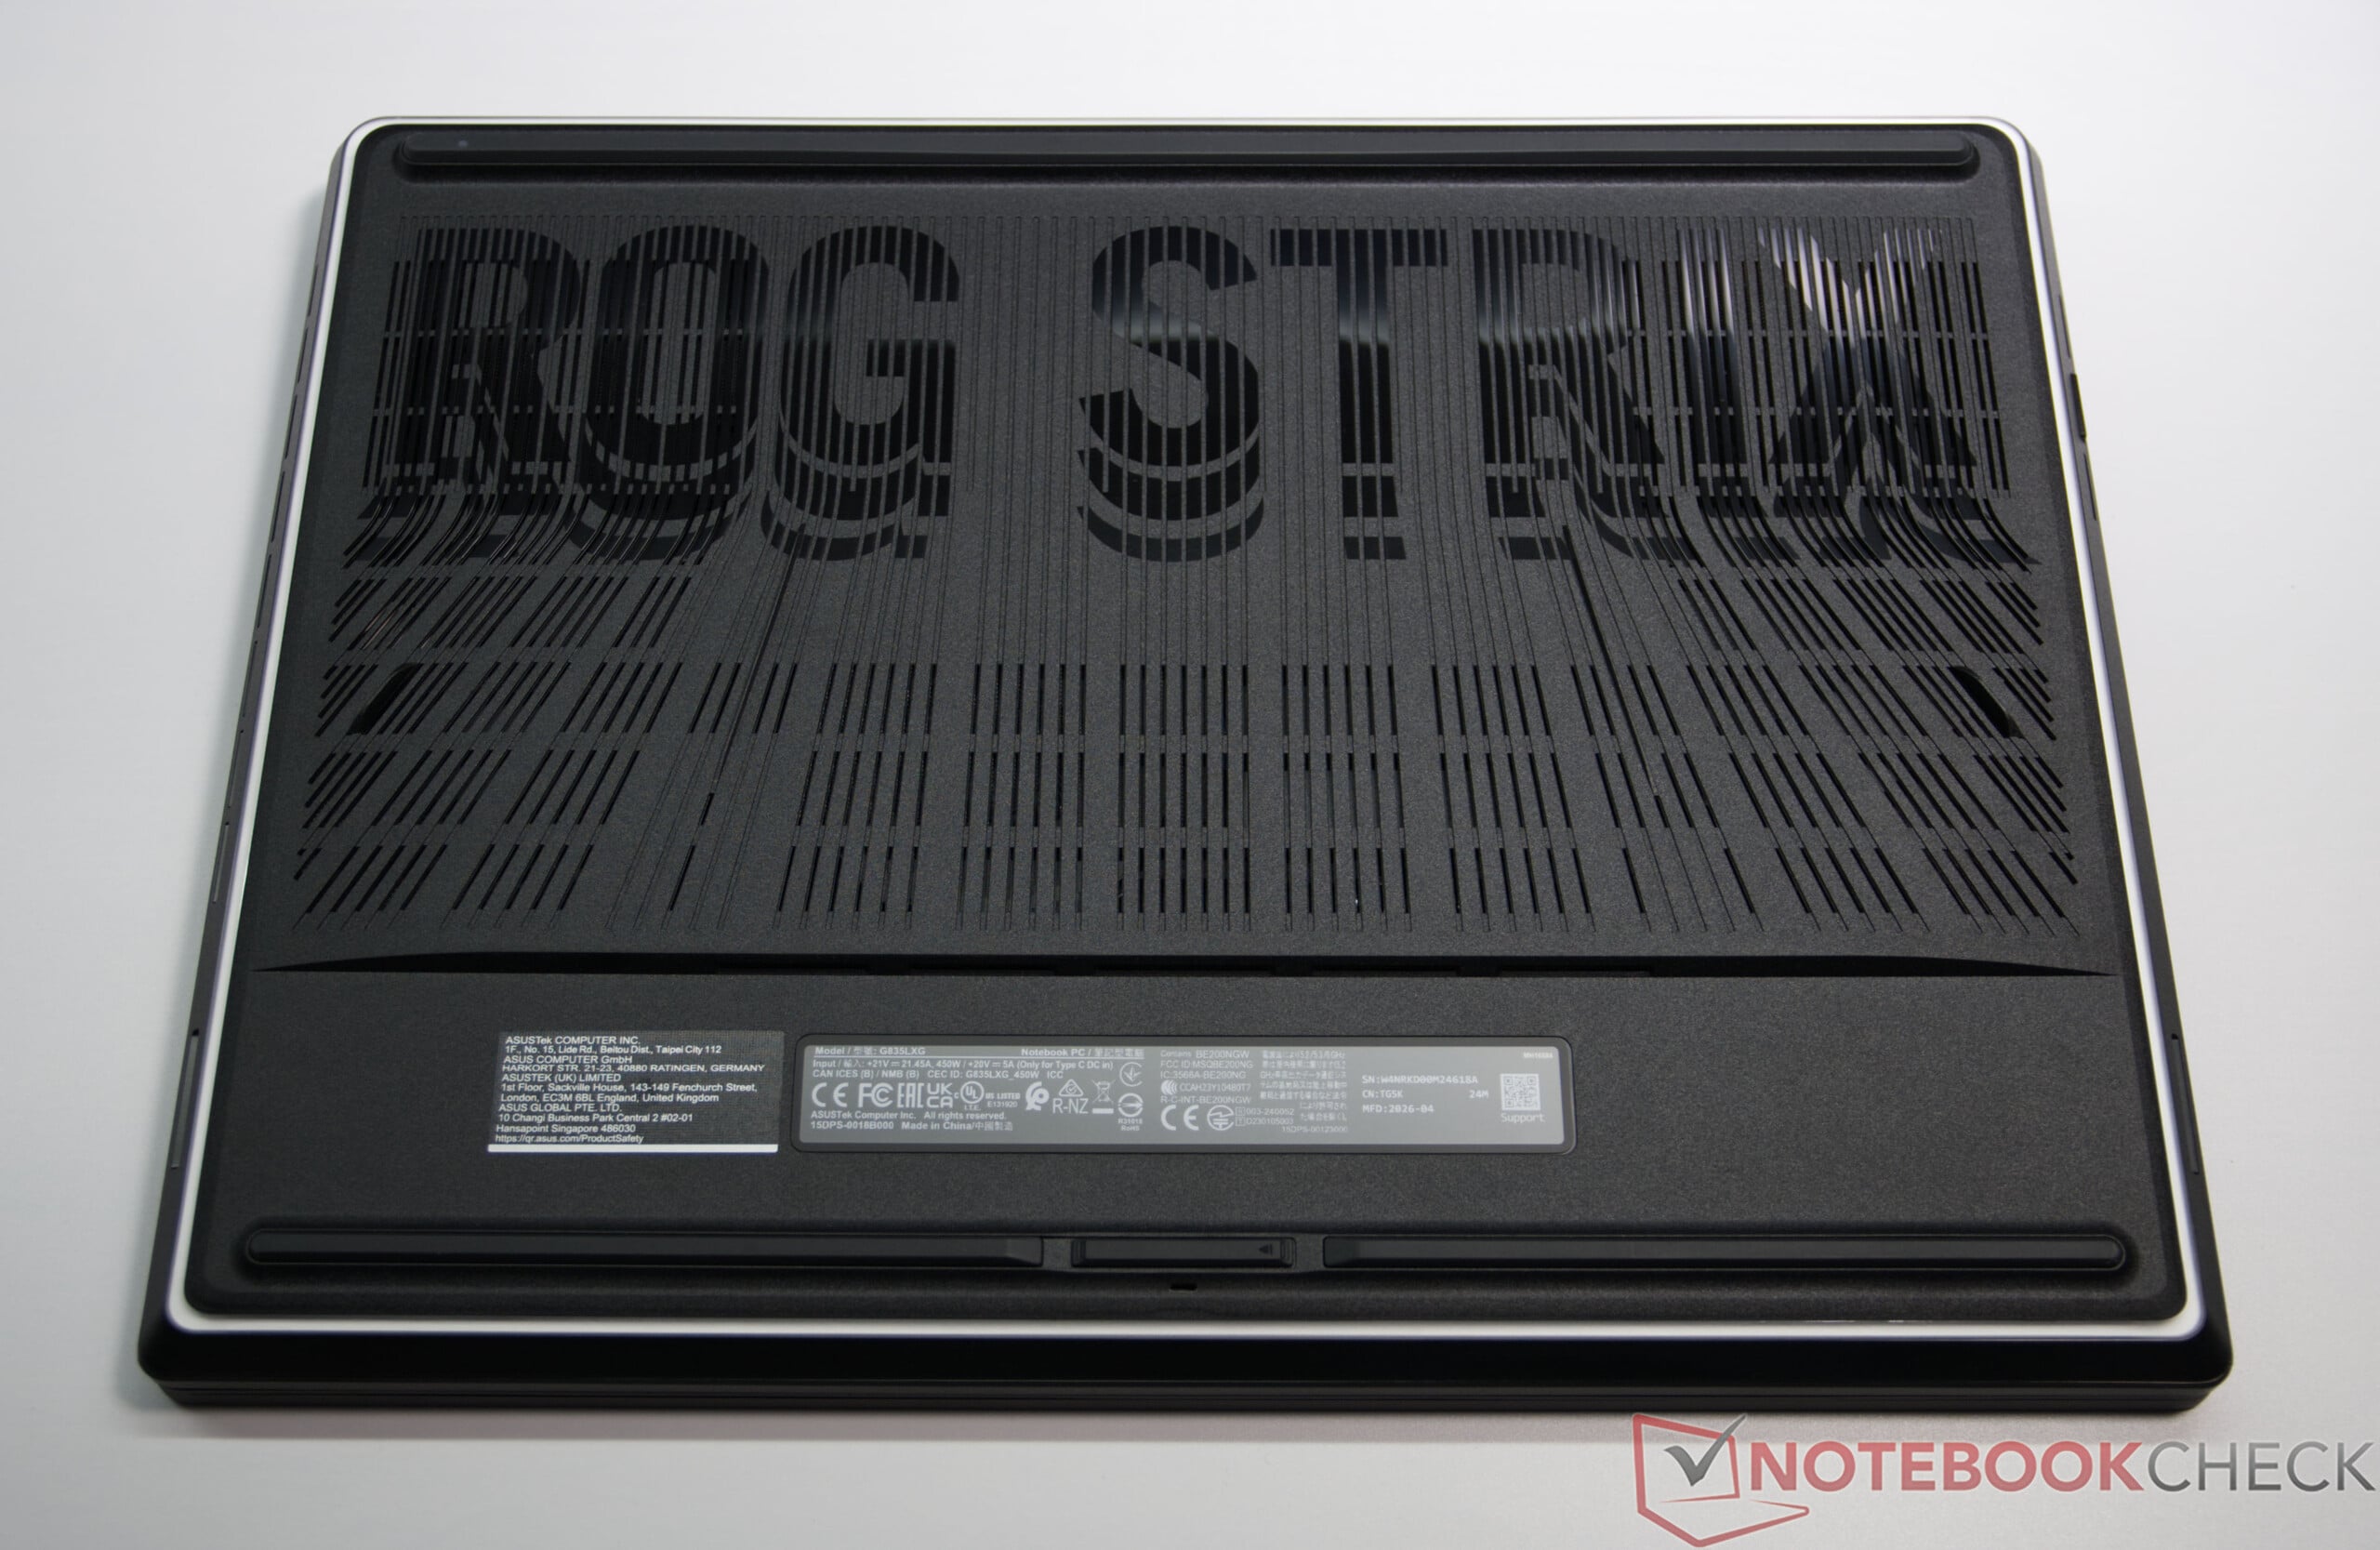
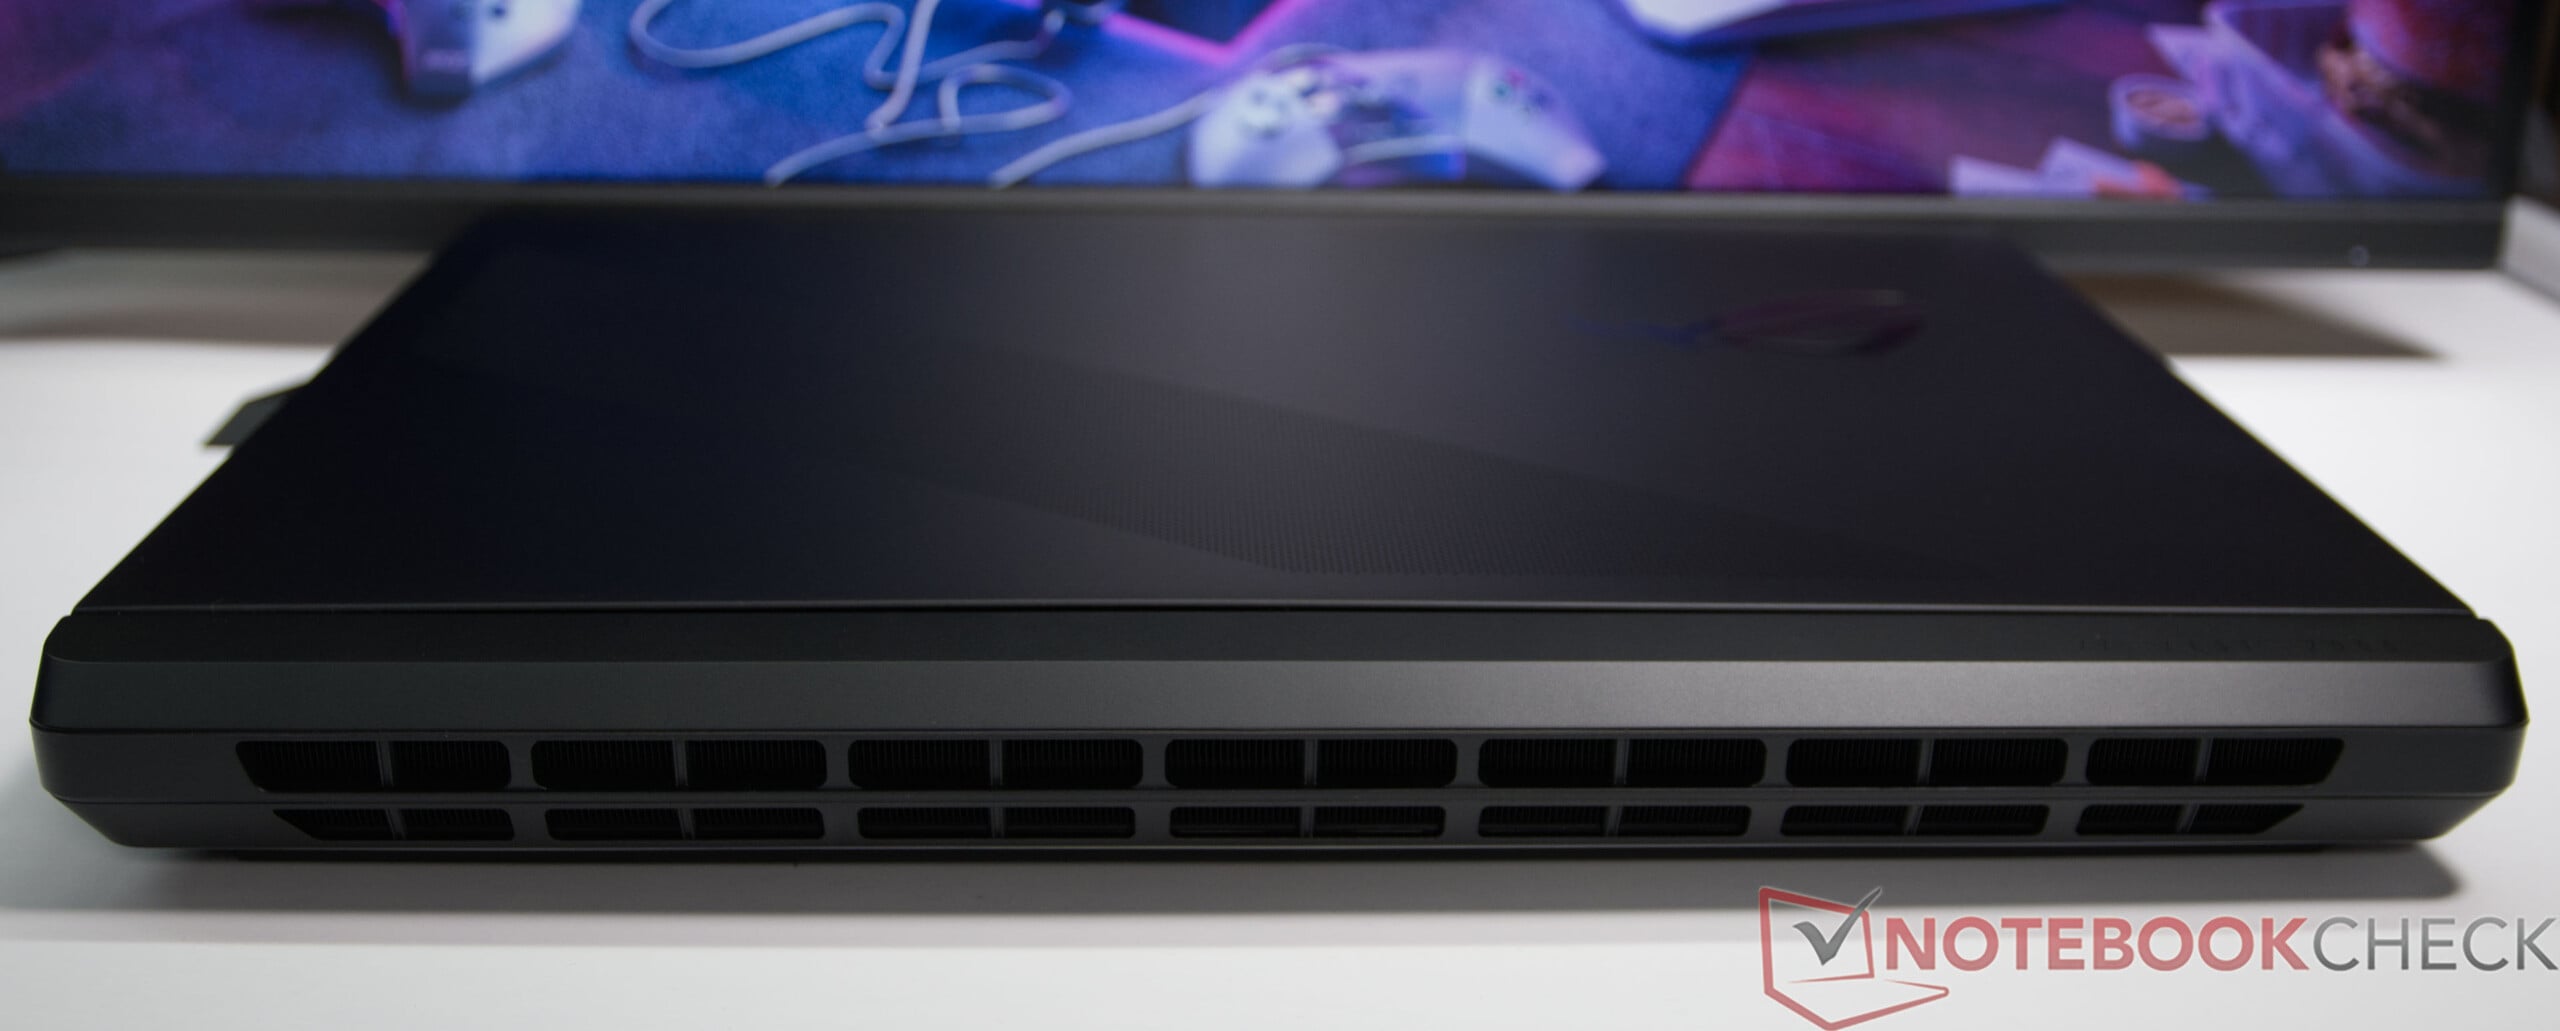
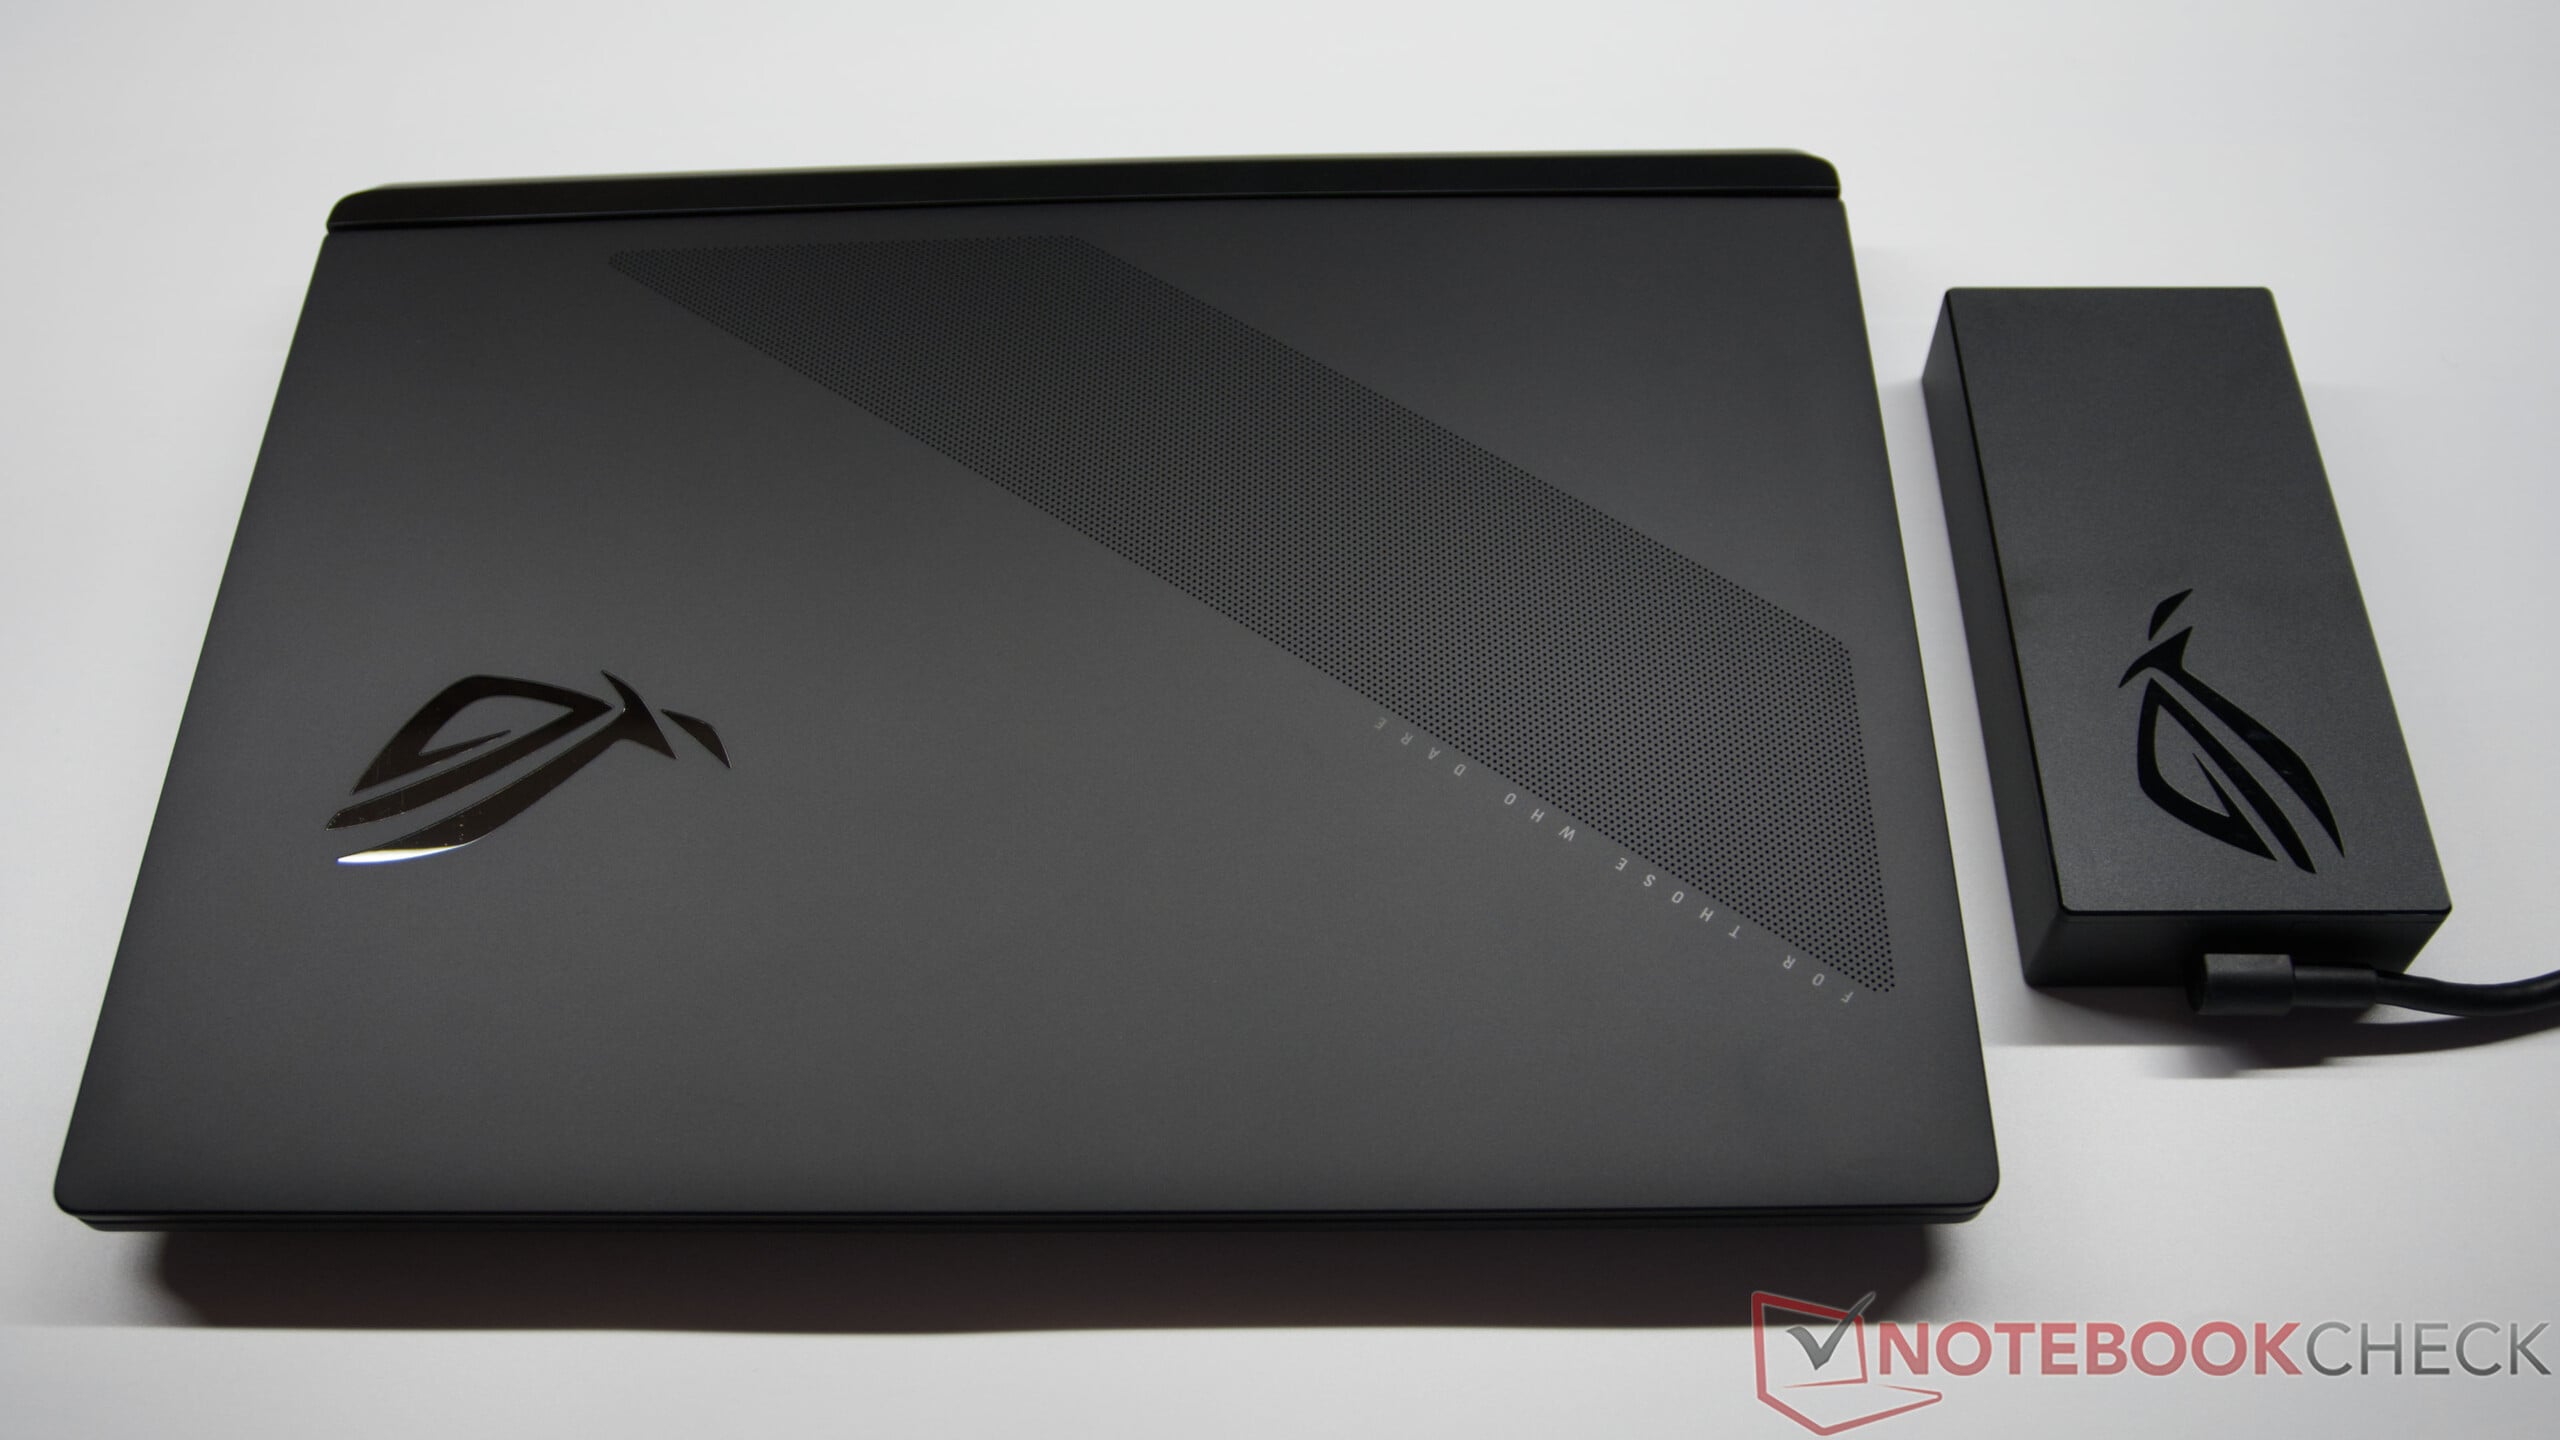
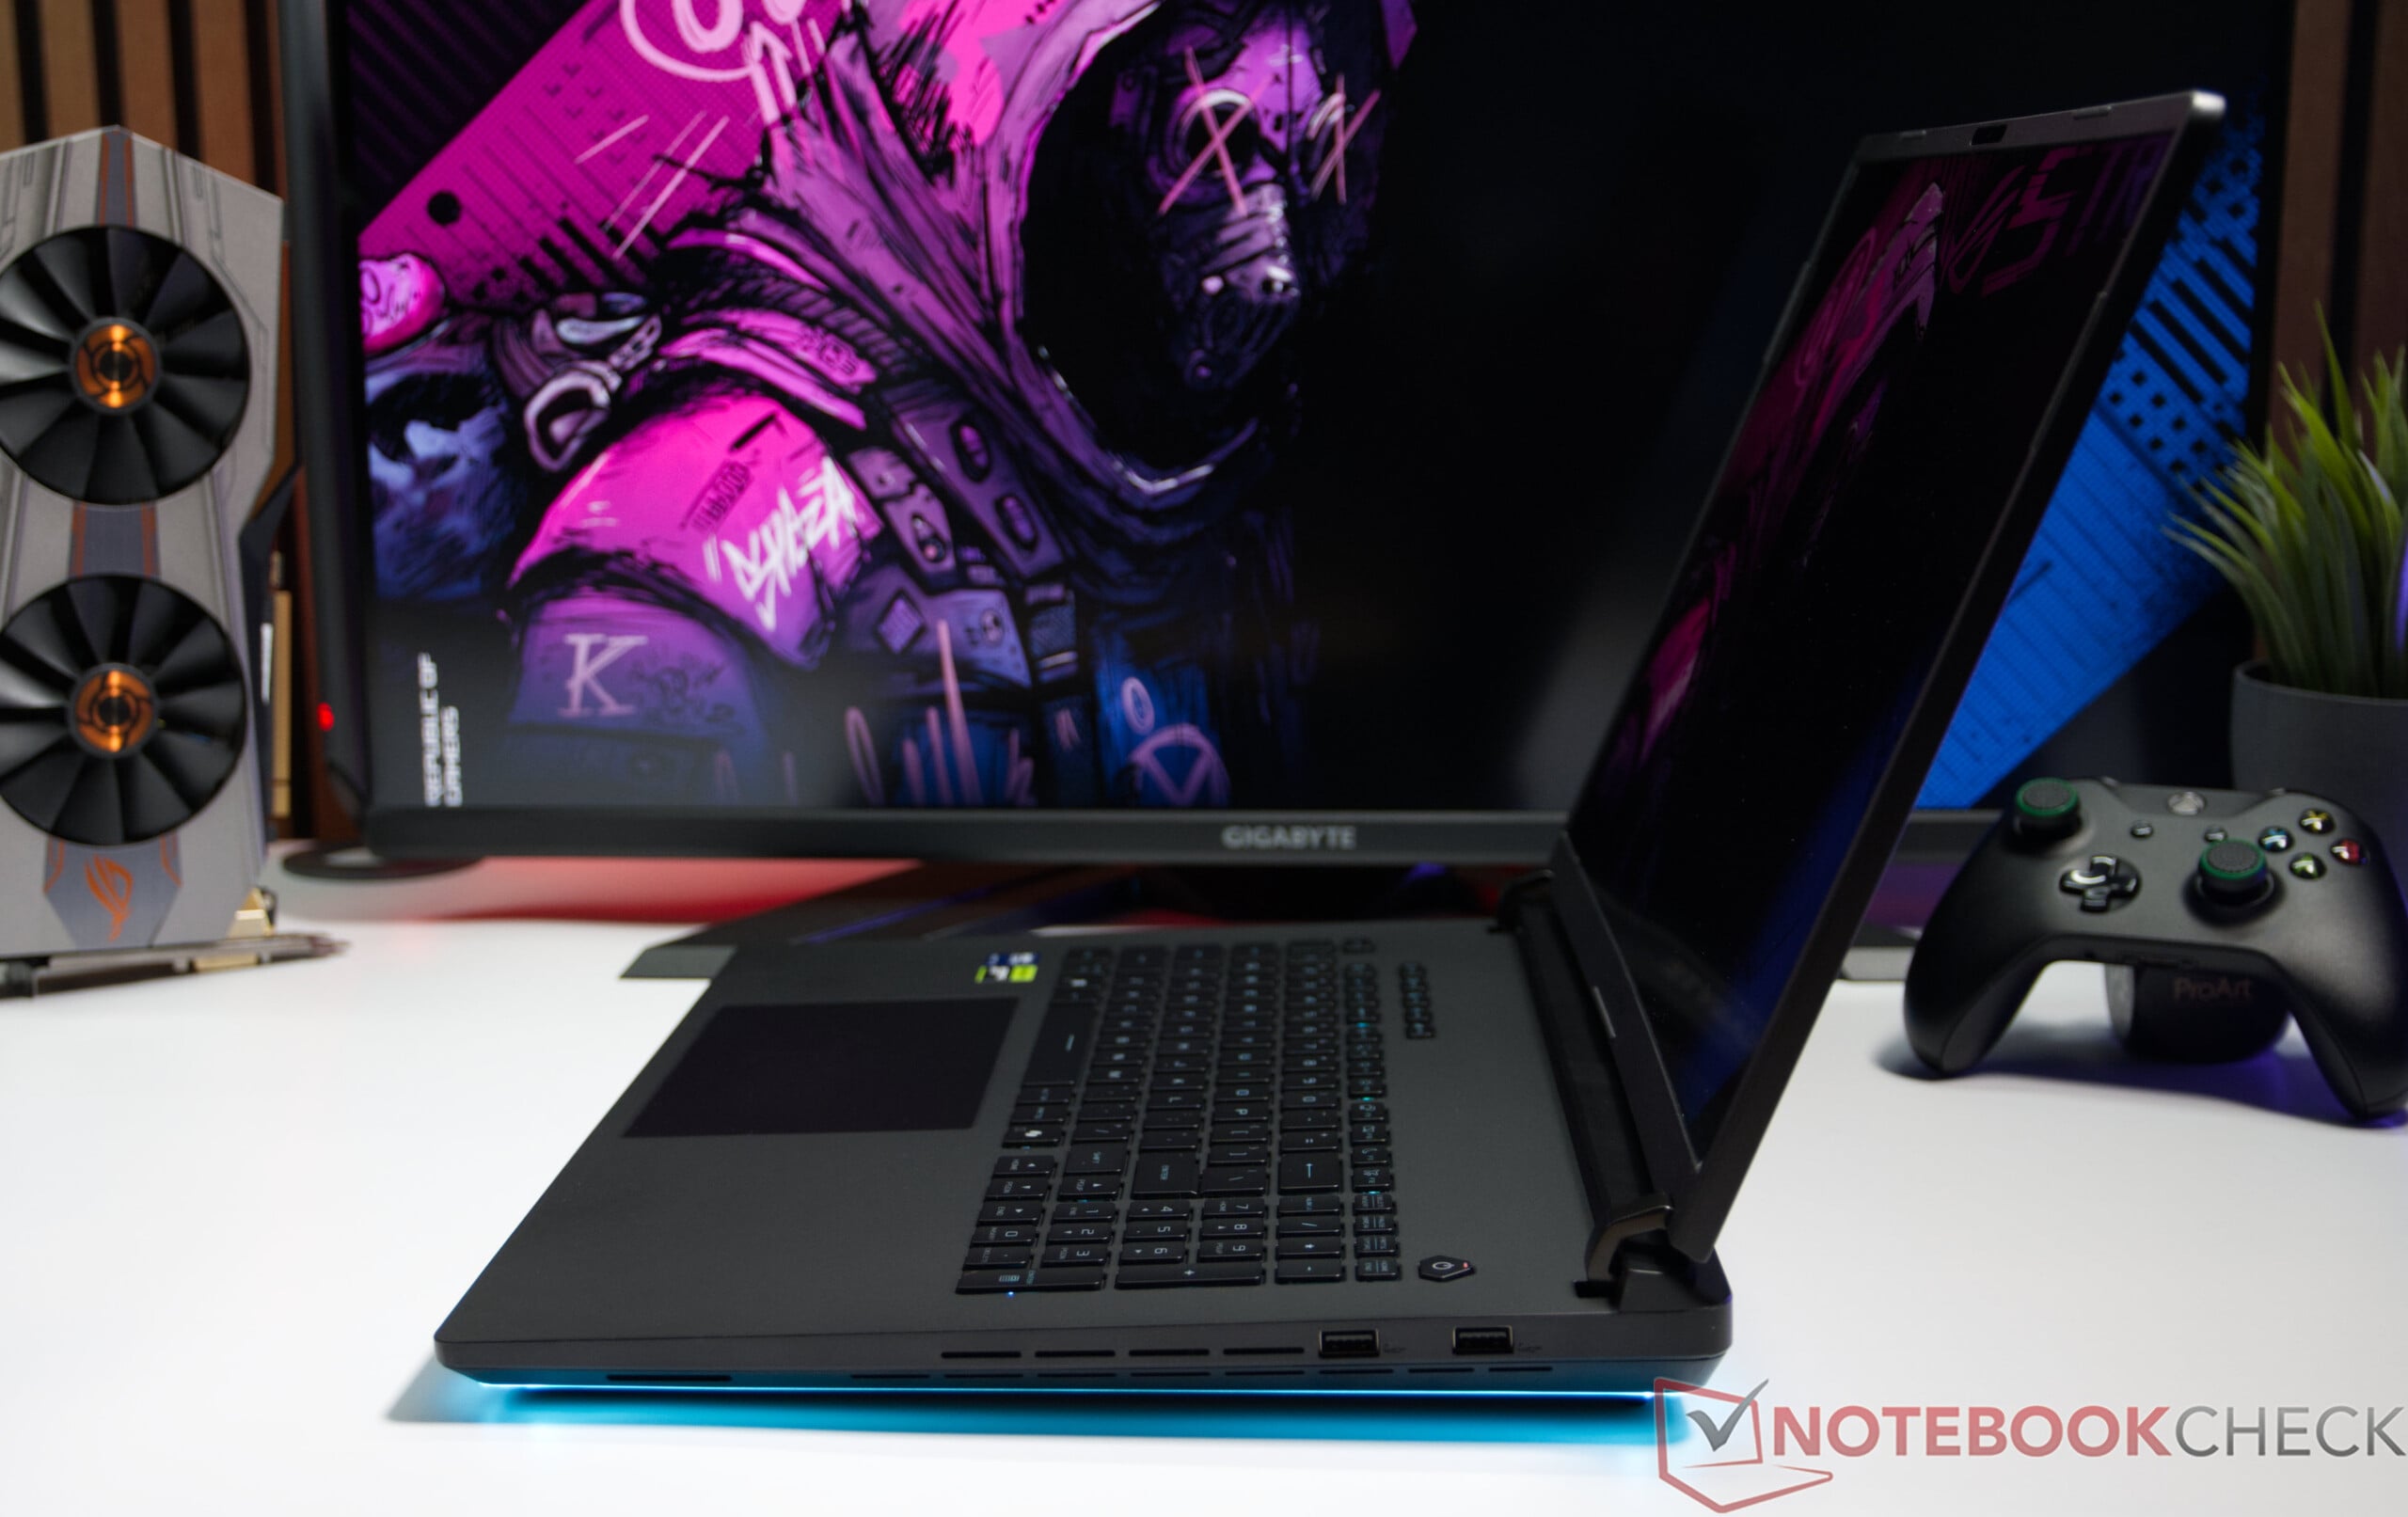
Como o Asus ROG Strix SCAR 18 G835LXG é baseado no mesmo chassi do ROG Strix SCAR 18 G835LX, analisado anteriormente, a qualidade de construção e o design permanecem inalterados. Para uma análise detalhada do chassi, das portas e dos dispositivos de entrada, consulte nossa análise separada do modelo irmão.
Comparação de tamanhos

410.3 mm 319.9 mm 26.7 mm 4 kg404 mm 307.5 mm 32.1 mm 3.6 kg405 mm 312 mm 29.5 mm 3.3 kg399 mm 298 mm 35 mm 3.6 kg399 mm 298 mm 32 mm 3.3 kg399.9 mm 275.4 mm 21.9 mm 3.1 kg396 mm 278 mm 24.9 mm 3.4 kg297 mm 210 mm 1 mm 5.7 g
Esquerda: Adaptador de alimentação, LAN 2,5G, HDMI 2.1, USB-A 3.2 Gen. 2 (10 Gbit/s), 2x Thunderbolt 5 (DisplayPort, fornecimento de energia, G-SYNC (velocidade de dados de até 120 Gbps), áudio de 3,5 mm
Correto: 2x USB-A 3.2 Gen. 2 (10 Gbit/s)
Networking
iperf3 transmit Wi-Fi6/7 RT-BE96U
Média Intel Wi-Fi 7 BE200 320MHz
  (3270 - 3587, n=2)
3429 MBit/s +5%
Asus ROG Strix Scar 18 G835LXG
Intel Wi-Fi 7 BE200 320MHz
3270 (3115min - 3471max) MBit/s
Média da turma Gaming
  (872 - 4473, n=6, últimos 2 anos)
2376 MBit/s -27%
iperf3 receive Wi-Fi6/7 RT-BE96U
Média Intel Wi-Fi 7 BE200 320MHz
  (3047 - 3487, n=2)
3267 MBit/s +7%
Asus ROG Strix Scar 18 G835LXG
Intel Wi-Fi 7 BE200 320MHz
3047 (2765min - 3114max) MBit/s
Média da turma Gaming
  (788 - 3208, n=6, últimos 2 anos)
2082 MBit/s -32%
iperf3 receive AXE11000 6GHz
Schenker Key 17 Pro (M24)
Intel Wi-Fi 7 BE200 320MHz
1714 (853min - 1741max) MBit/s
Média da turma Gaming
  (975 - 1775, n=35, últimos 2 anos)
1556 MBit/s
Média Intel Wi-Fi 7 BE200 320MHz
  (725 - 1770, n=29)
1483 MBit/s
MSI Titan 18 HX A14VIG
Intel Killer Wi-Fi 7 BE1750x BE200NGW
1379 (709min - 1426max) MBit/s
Razer Blade 18 2024 RZ09-0509
Intel Wi-Fi 7 BE200 320MHz
1315 (1269min - 1369max) MBit/s
Alienware m18 R2
Intel Killer Wi-Fi 7 BE1750x BE200NGW
1292 (1215min - 1327max) MBit/s
iperf3 transmit AXE11000 6GHz
Schenker Key 17 Pro (M24)
Intel Wi-Fi 7 BE200 320MHz
1634 (812min - 1725max) MBit/s
Média da turma Gaming
  (723 - 1868, n=36, últimos 2 anos)
1449 MBit/s
Média Intel Wi-Fi 7 BE200 320MHz
  (693 - 1653, n=29)
1293 MBit/s
Razer Blade 18 2024 RZ09-0509
Intel Wi-Fi 7 BE200 320MHz
1199 (1057min - 1319max) MBit/s
MSI Titan 18 HX A14VIG
Intel Killer Wi-Fi 7 BE1750x BE200NGW
1096 (900min - 1242max) MBit/s
Alienware m18 R2
Intel Killer Wi-Fi 7 BE1750x BE200NGW
648 (595min - 759max) MBit/s
01002003004005006007008009001000110012001300140015001600170018001900200021002200230024002500260027002800290030003100320033003400Tooltip
Asus ROG Strix Scar 18 G835LXG; iperf3 transmit Wi-Fi6/7 RT-BE96U; iperf 3.1.3: Ø3270 (3115-3471) MBit/s
Asus ROG Strix Scar 18 G835LXG; iperf3 receive Wi-Fi6/7 RT-BE96U; iperf 3.1.3: Ø3046 (2765-3114) MBit/s
ColorChecker
7.7 ∆E
3.5 ∆E
9.6 ∆E
12.7 ∆E
7.5 ∆E
7.8 ∆E
5.1 ∆E
10.1 ∆E
3.8 ∆E
2.6 ∆E
8.5 ∆E
6.4 ∆E
3.1 ∆E
13.4 ∆E
10.5 ∆E
3.1 ∆E
2.6 ∆E
14.3 ∆E
6.7 ∆E
2.4 ∆E
3.1 ∆E
5.2 ∆E
2.1 ∆E
5.9 ∆E
ColorChecker Asus ROG Strix Scar 18 G835LXG: 6.57 ∆E min: 2.09 - max: 14.27 ∆E

Exibição

Estrutura de subpixel
Sem halos visíveis
Sem halos visíveis

A tela Mini-LED de 18 polegadas do Asus ROG Strix SCAR 18 G835LXG apresenta uma resolução de 3.840 x 2.400 pixels no formato 16:10 e conta com 2.000 zonas de escurecimento, além de uma taxa de atualização de 240 Hz. A qualidade da imagem impressiona pela alta nitidez, cores vibrantes e retroiluminação uniforme. Graças à alta taxa de atualização, os movimentos são reproduzidos com extrema suavidade, o que é particularmente vantajoso para jogos. A taxa de atualização máxima de 240 Hz está disponível apenas no Modo GPU Ultimate, que pode ser ativado por meio do Armoury Crate. Em todos os outros modos de GPU, a tela fica limitada a 120 Hz.

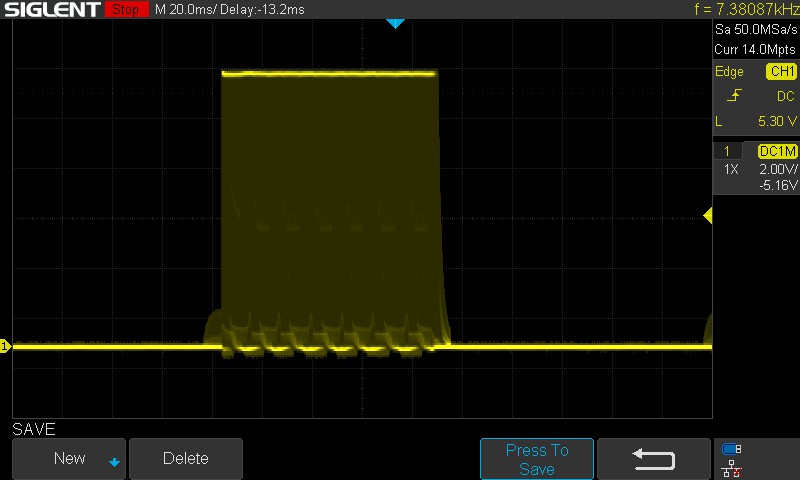
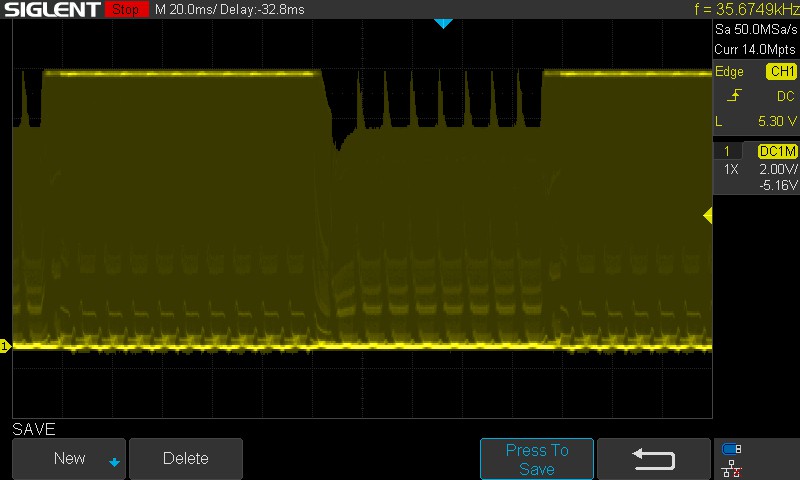
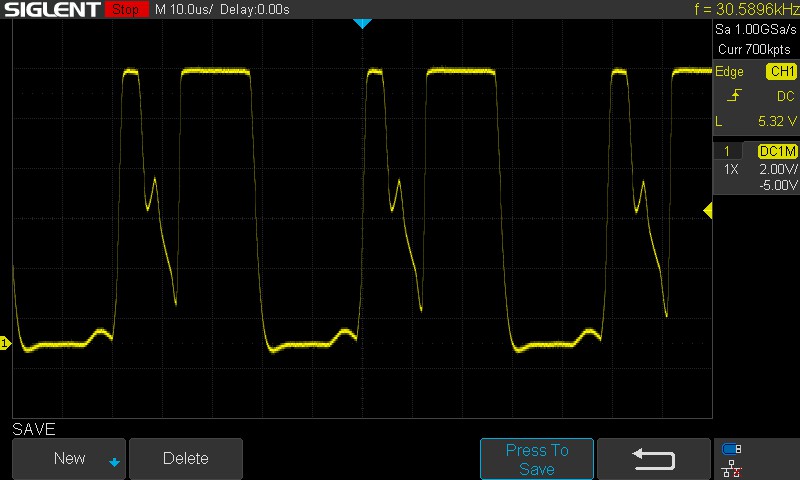
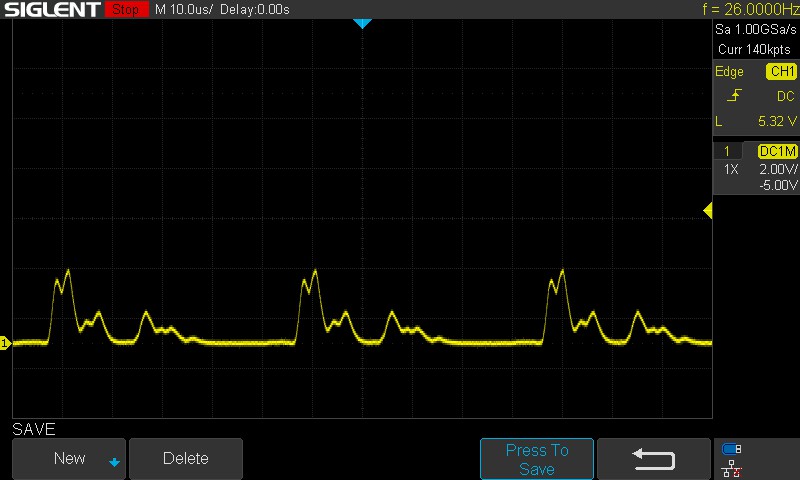
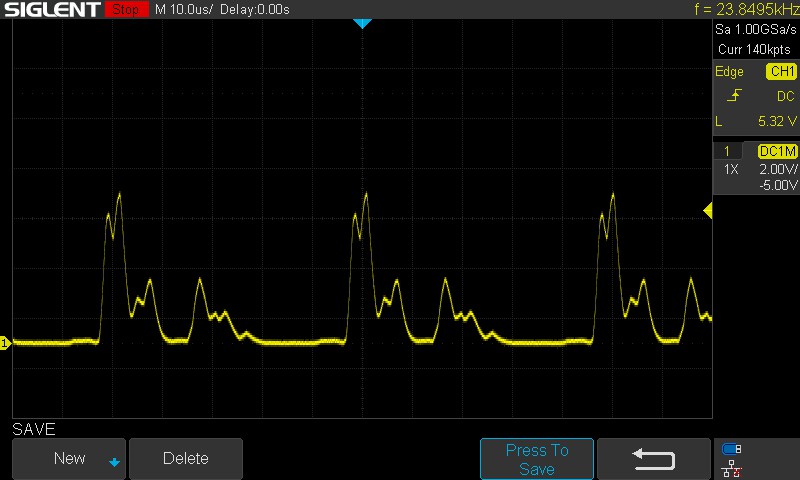
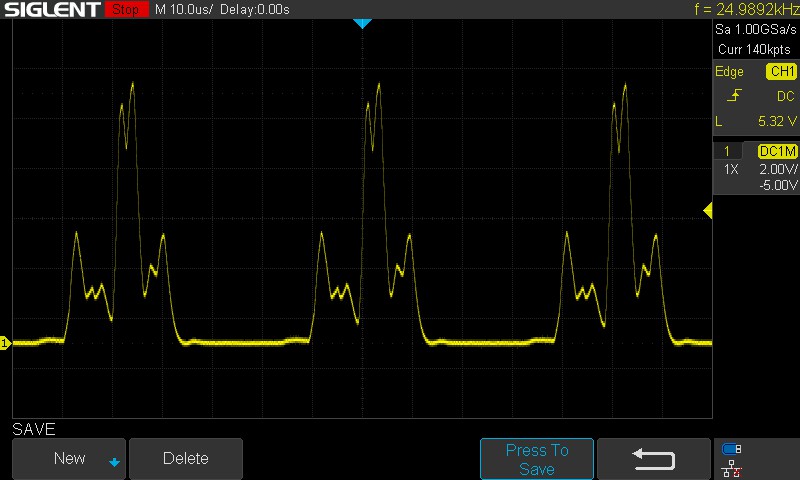
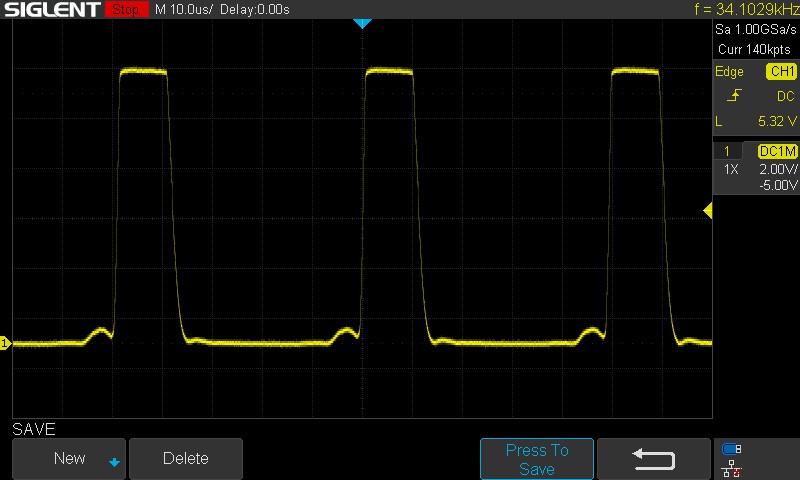
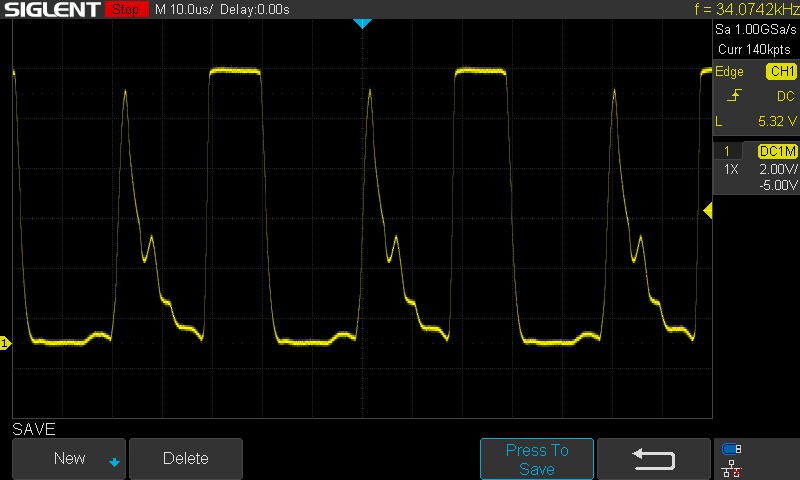
A ASUS oferece vários perfis de exibição com e sem escurecimento local, permitindo que o painel seja personalizado tanto para jogos quanto para edição de imagens. No modo HDR, a tela atinge um brilho de pico muito alto e se beneficia de um excelente contraste com pretos profundos. Com um brilho SDR máximo de cerca de 600 cd/m², o painel continua sendo um dos mais brilhantes de sua categoria e é adequado para ambientes bem iluminados. O brilho total também está disponível quando o aparelho está funcionando com bateria. Como é típico em painéis Mini-LED, a retroiluminação utiliza PWM; no entanto, é improvável que a frequência muito alta, de cerca de 30 kHz, cause quaisquer problemas na prática, mesmo para usuários sensíveis.

662
cd/m²
624
cd/m²
595
cd/m²
613
cd/m²
600
cd/m²
581
cd/m²
618
cd/m²
588
cd/m²
559
cd/m²
Distribuição do brilho
NE180QA1-MM0 testado com X-Rite i1Pro 3
Máximo: 662 cd/m² (Nits) Médio: 604.4 cd/m² Minimum: 44.1 cd/m²
iluminação: 84 %
iluminação com acumulador: 589 cd/m²
Contraste: ∞:1 (Preto: 0 cd/m²)
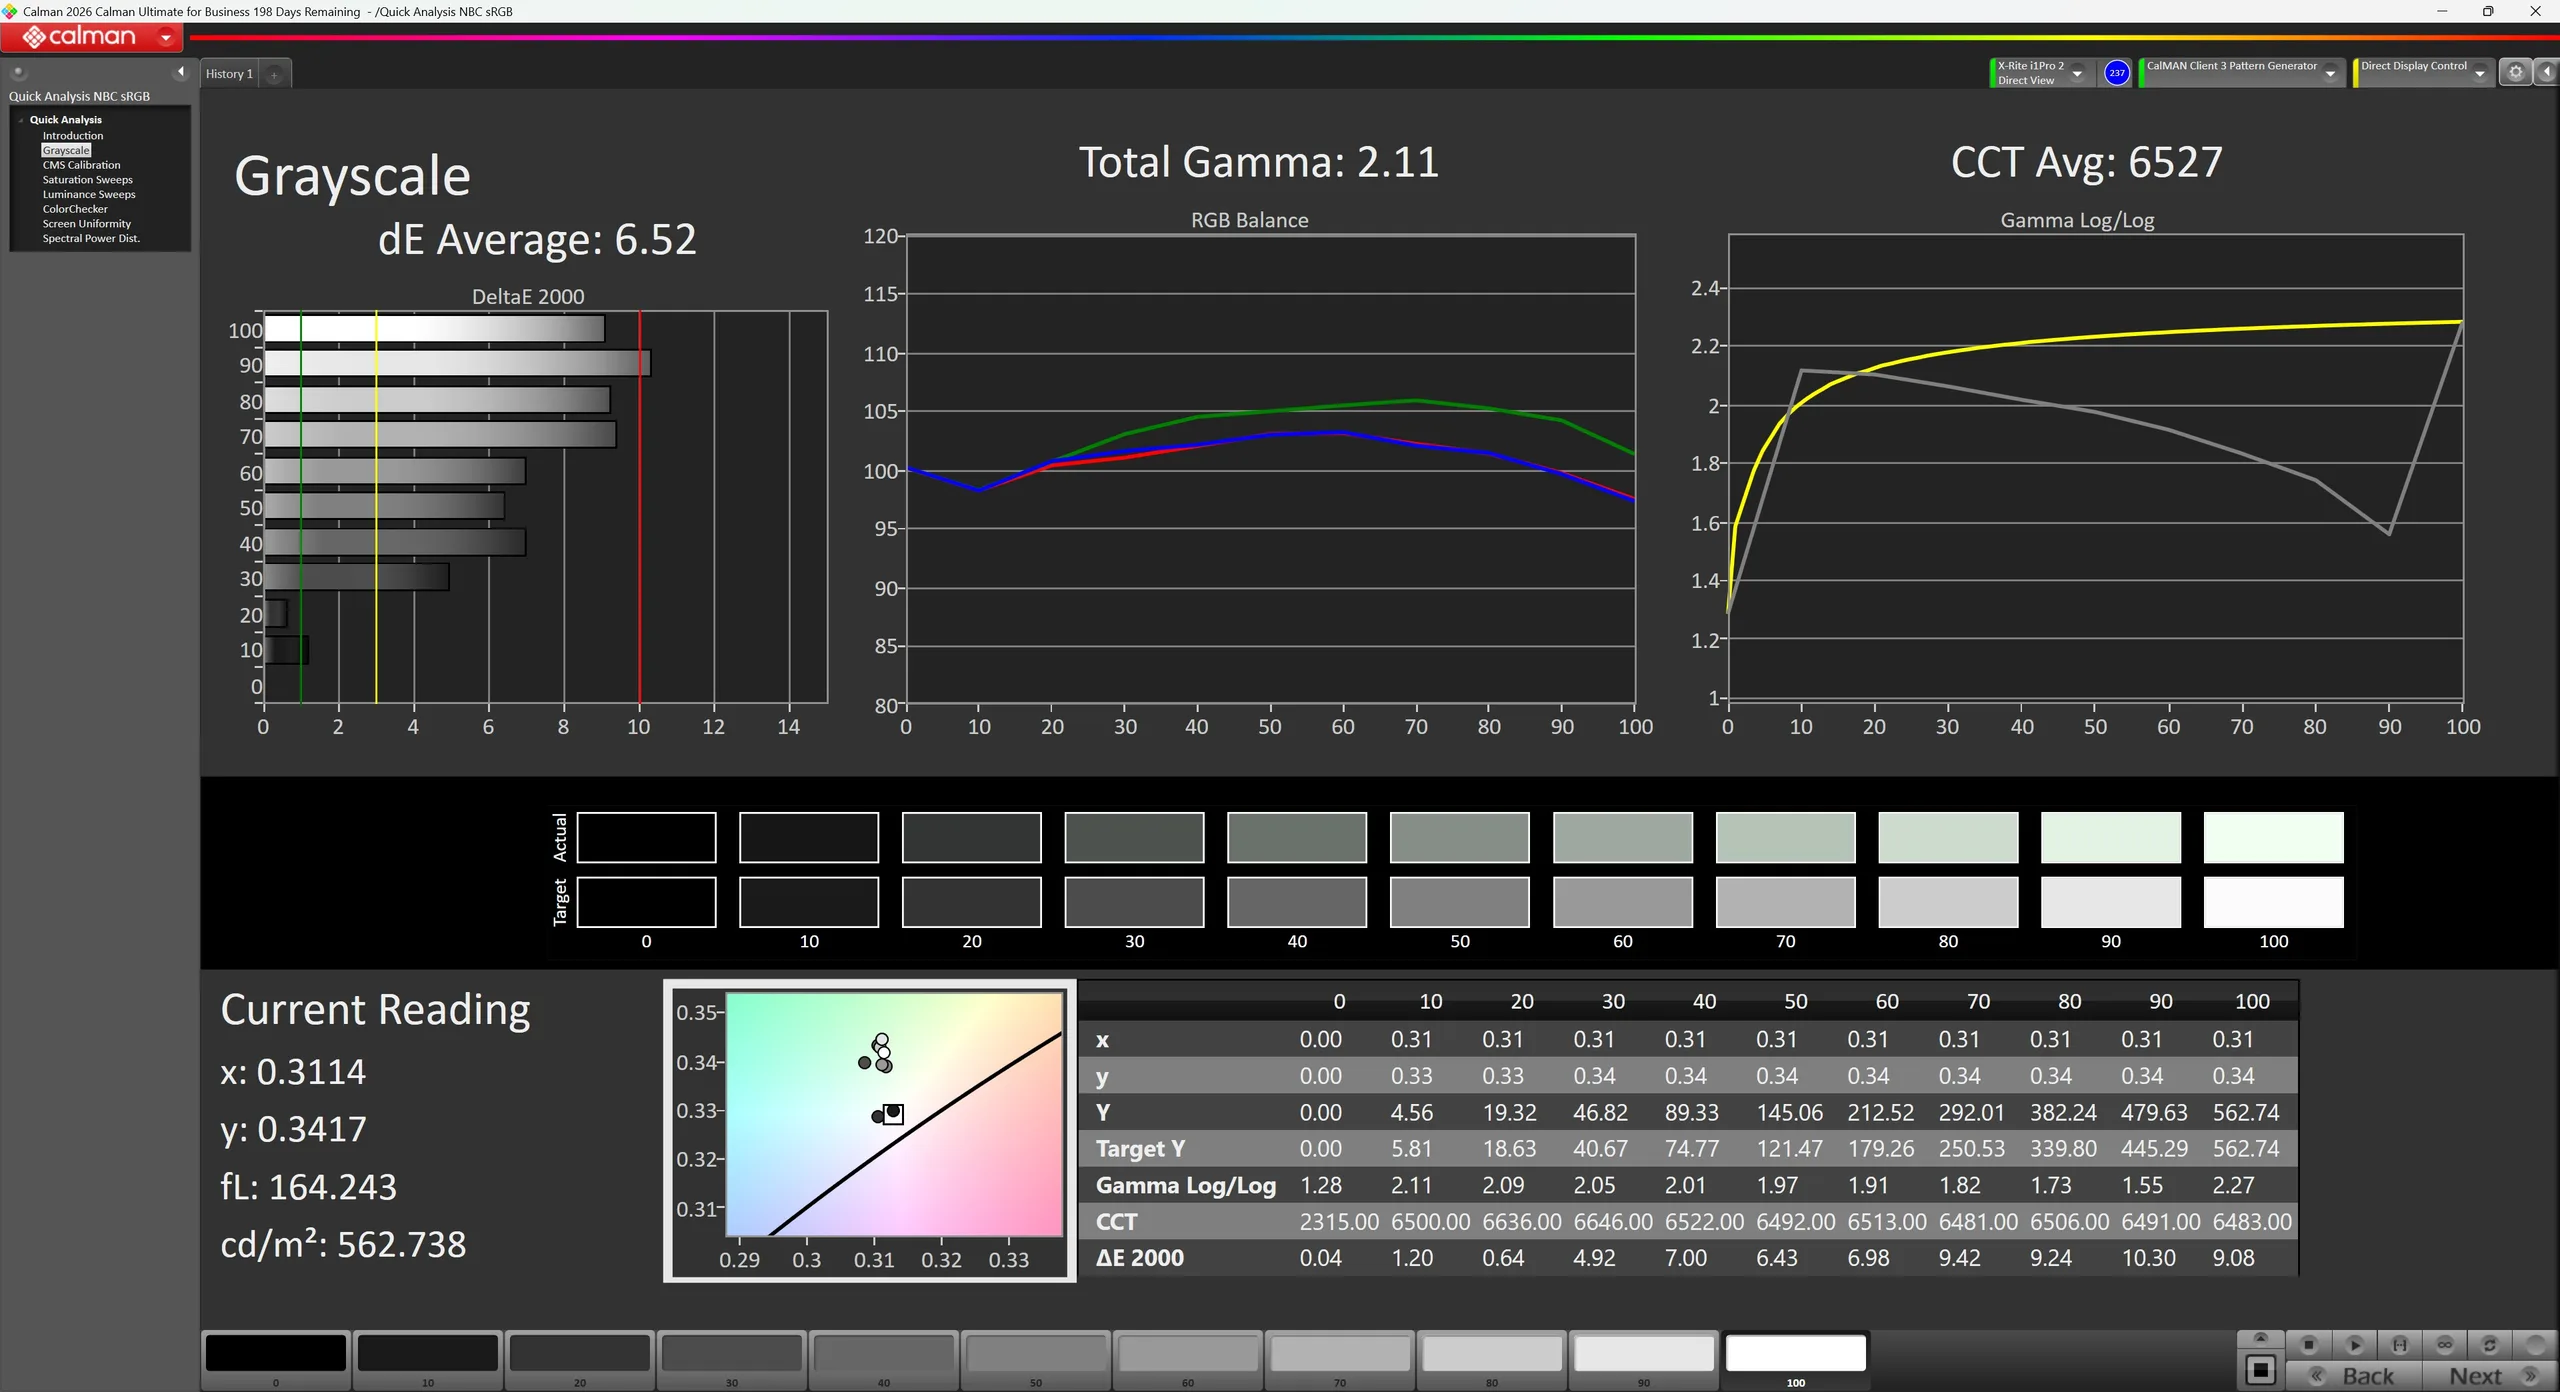
ΔE ColorChecker Calman: 7.12 | ∀{0.5-29.43 Ø4.71}
calibrated: 4.92
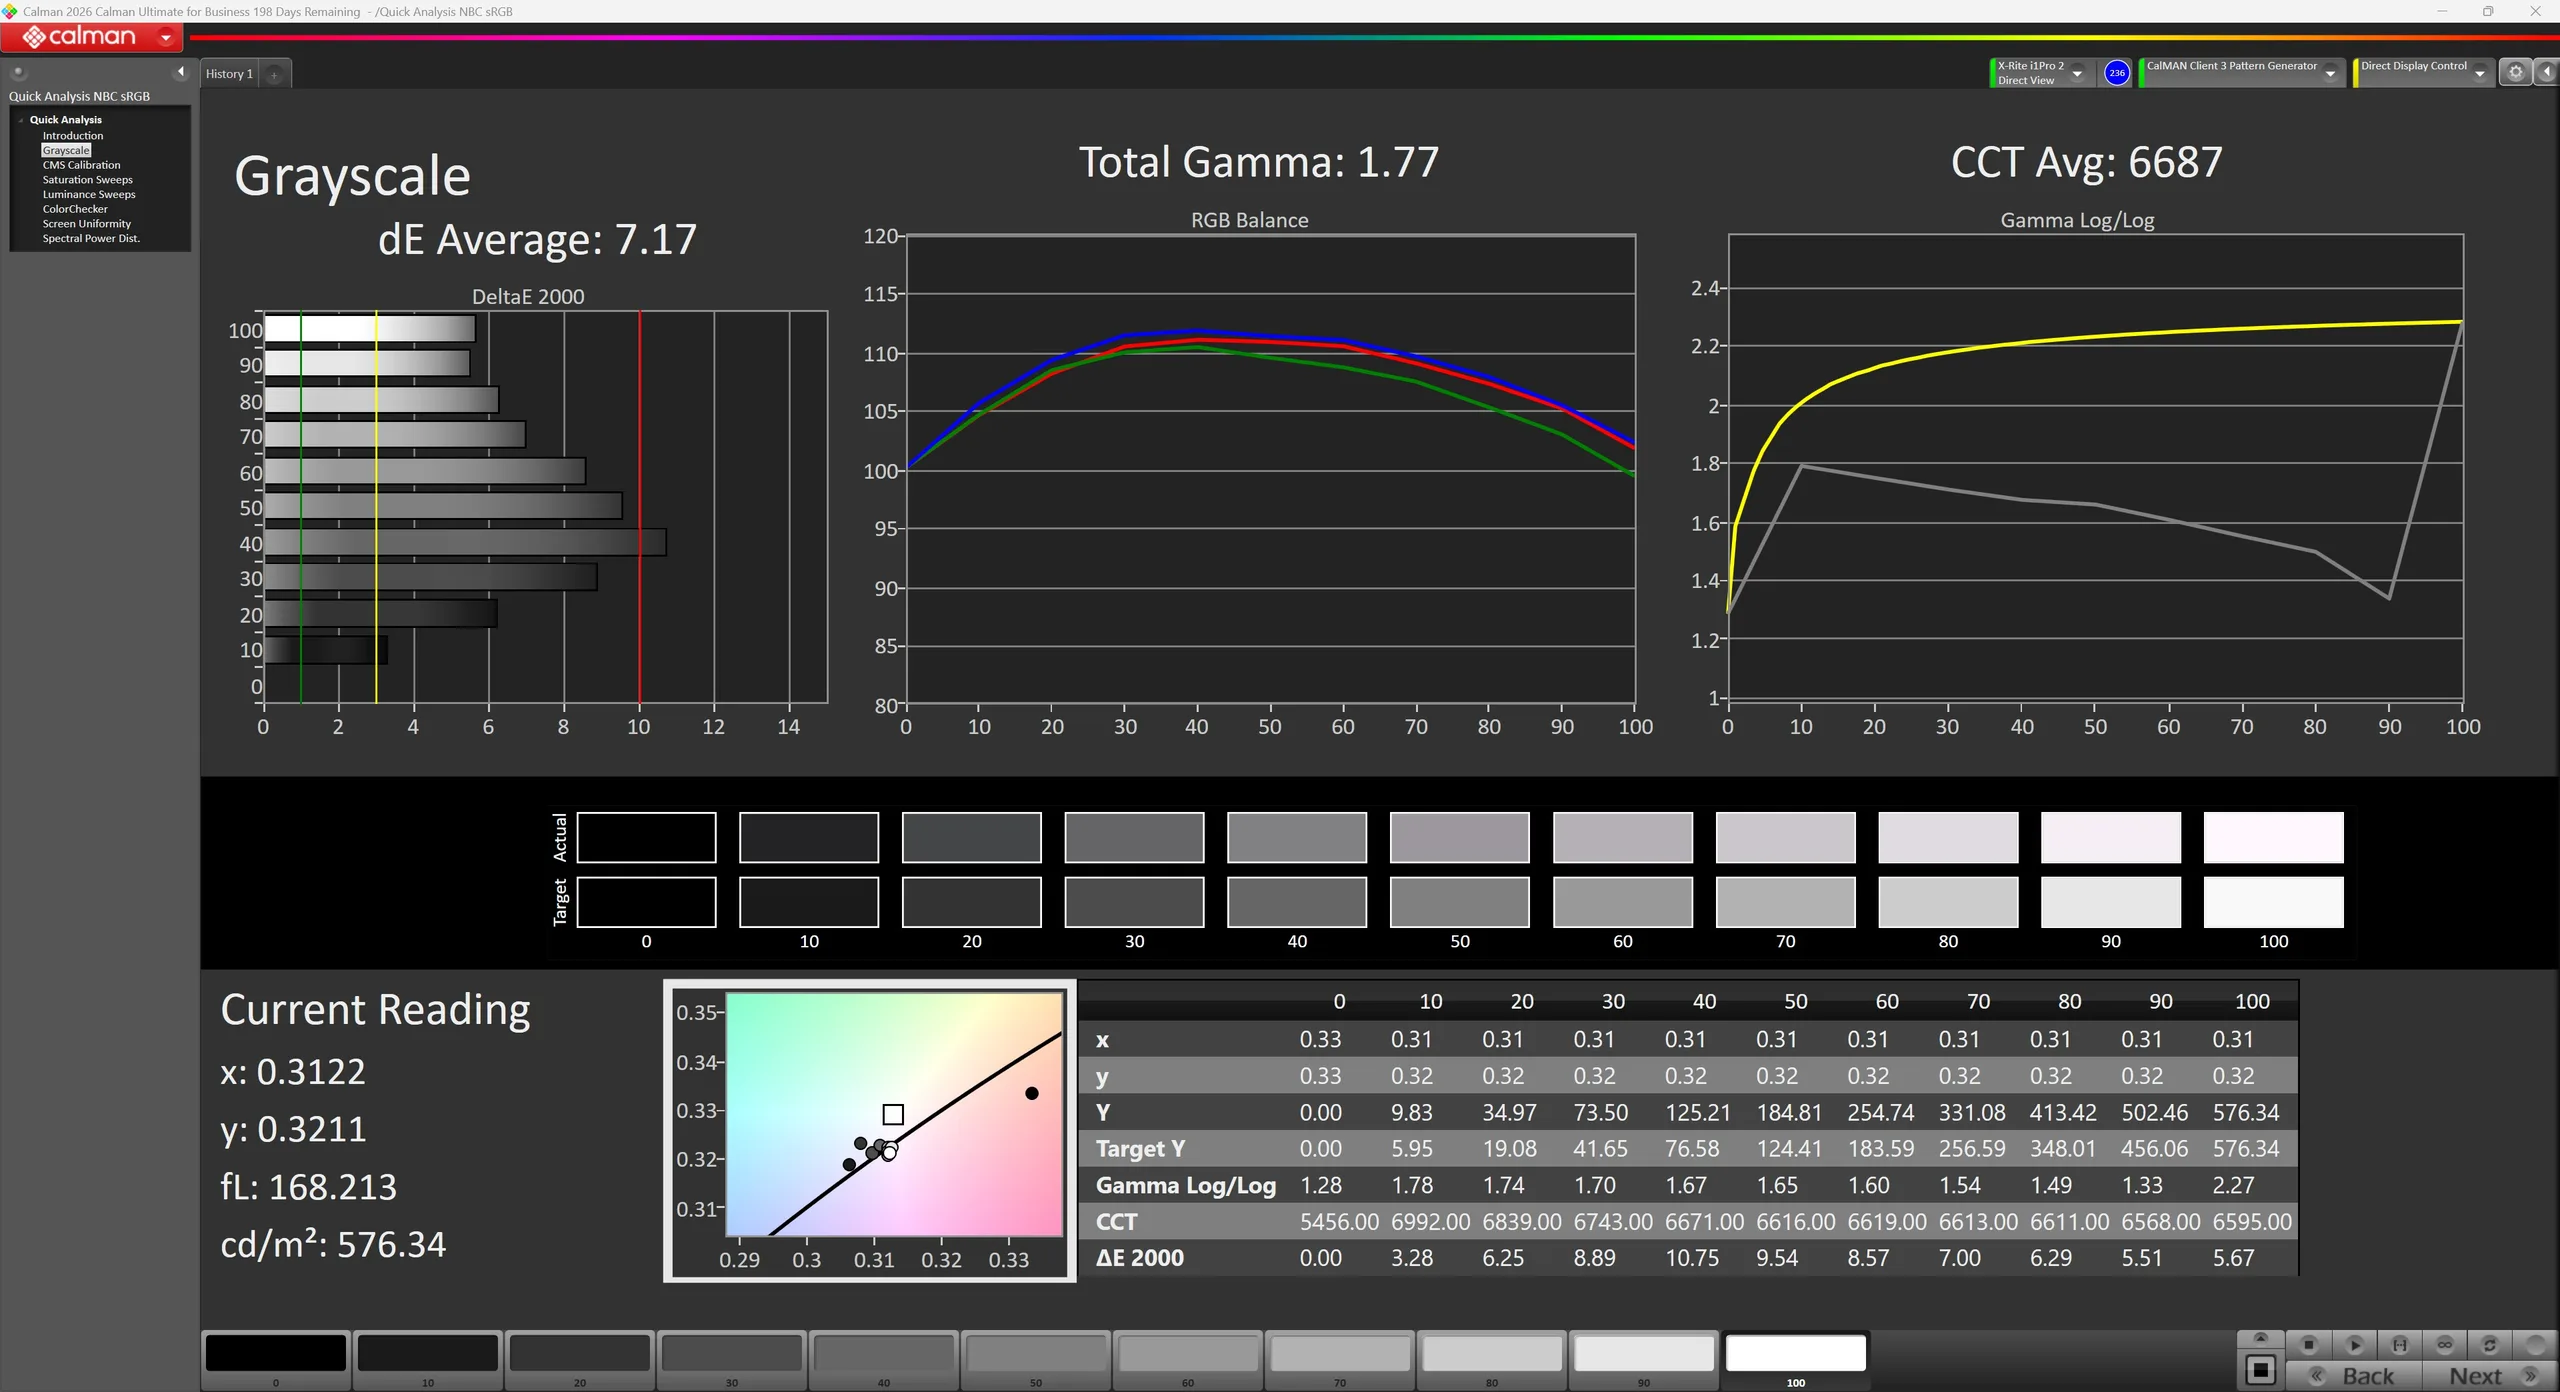
ΔE Greyscale Calman: 7.17 | ∀{0.09-98 Ø4.96}
92.8% AdobeRGB 1998 (Argyll 3D)
99.9% sRGB (Argyll 3D)
99.9% Display P3 (Argyll 3D)
Gamma: 1.77
CCT: 6687 K
Asus ROG Strix Scar 18 G835LXG
NE180QA1-MM0, Mini LED, 3840x2400, 18", 240 Hz
Asus Strix Scar 18 G835LX
N180QDM-NM2, Mini-LED, 2560x1600, 18", 240 Hz
Razer Blade 18 2024 RZ09-0509
BOE NE180QDM-NM1, Mini-LED, 2560x1600, 18", 300 Hz
Alienware m18 R2
BOE NE18NZ1, IPS, 2560x1600, 18", 165 Hz
Acer Predator Helios 18 PH18-72-98MW
B180QAN01.2 (AUO45A8), Mini-LED, 2560x1600, 18", 250 Hz
MSI Titan 18 HX A14VIG
AU Optronics B180ZAN01.0, Mini-LED, 3840x2400, 18", 120 Hz
Schenker Key 17 Pro (M24)
BOE, IPS, 3840x2160, 17.3", 144 Hz
Display
-2%
-2%
-2%
-0%
-3%
-5%
HDR Peak Brightness (cd/m²)
1264
Display P3 Coverage (%)
99.9
99
-1%
99
-1%
97.8
-2%
99.7
0%
98.1
-2%
93.51
-6%
sRGB Coverage (%)
99.9
100
0%
100
0%
99.5
0%
100
0%
99.8
0%
99.86
0%
AdobeRGB 1998 Coverage (%)
92.8
87.2
-6%
86.9
-6%
88.9
-4%
91.6
-1%
86.2
-7%
84.33
-9%
Response Times
-19%
-53%
-11%
-79%
-486%
-38%
Response Time Grey 50% / Grey 80% * (ms)
5.8 ?(2.1, 3.7)
7.4 ?(2.4, 5)
-28%
7.6 ?(3.6, 4)
-31%
5.3 ?(2.2, 3.1)
9%
8 ?(4.9, 3.1)
-38%
8.6 ?(4.2, 4.4)
-48%
11.593 ?(5.307, 6.286)
-100%
Response Time Black / White * (ms)
8 ?(4, 4)
10.4 ?(0.6, 9.8)
-30%
14 ?(6.6, 7.4)
-75%
10.4 ?(4.8, 5.6)
-30%
17.6 ?(15.2, 2.4)
-120%
81.8 ?(76, 5.8)
-923%
6 ?(1.5, 4.5)
25%
PWM Frequency (Hz)
30589
20610 ?(100)
26444 ?(100)
4832 ?(100)
2592 ?(100)
PWM Amplitude * (%)
100
100
-0%
Screen
50%
36%
19%
38%
21%
17%
Brightness middle (cd/m²)
600
764
27%
605.4
1%
271.8
-55%
722
20%
467.5
-22%
548
-9%
Brightness (cd/m²)
604
747
24%
600
-1%
275
-54%
724
20%
459
-24%
505
-16%
Brightness Distribution (%)
84
93
11%
97
15%
78
-7%
93
11%
90
7%
86
2%
Black Level * (cd/m²)
0.1
0.62
0.27
0.04
0.54
Colorchecker dE 2000 *
7.12
1.2
83%
1.53
79%
2.48
65%
3.4
52%
3.77
47%
3.81
46%
Colorchecker dE 2000 max. *
10.42
2.8
73%
4.15
60%
5.59
46%
5.32
49%
6.12
41%
7.9
24%
Colorchecker dE 2000 calibrated *
4.92
0.56
89%
1.6
67%
2.94
40%
2.54
48%
Greyscale dE 2000 *
7.17
1.5
79%
2.6
64%
3.7
48%
3.8
47%
3.2
55%
5.4
25%
Gamma
1.77 124%
2.17 101%
2.22 99%
2.2 100%
2.383 92%
2.43 91%
2.062 107%
CCT
6687 97%
6556 99%
6843 95%
6355 102%
7051 92%
6478 100%
7224 90%
Contrast (:1)
7640
976
1007
18050
1015
Média Total (Programa/Configurações)
10% / 19%
-6% / 10%
2% / 9%
-14% / 9%
-156% / -70%
-9% / 3%

* ... menor é melhor

Escala de cinza do CalMAN (Perfil: Display P3)
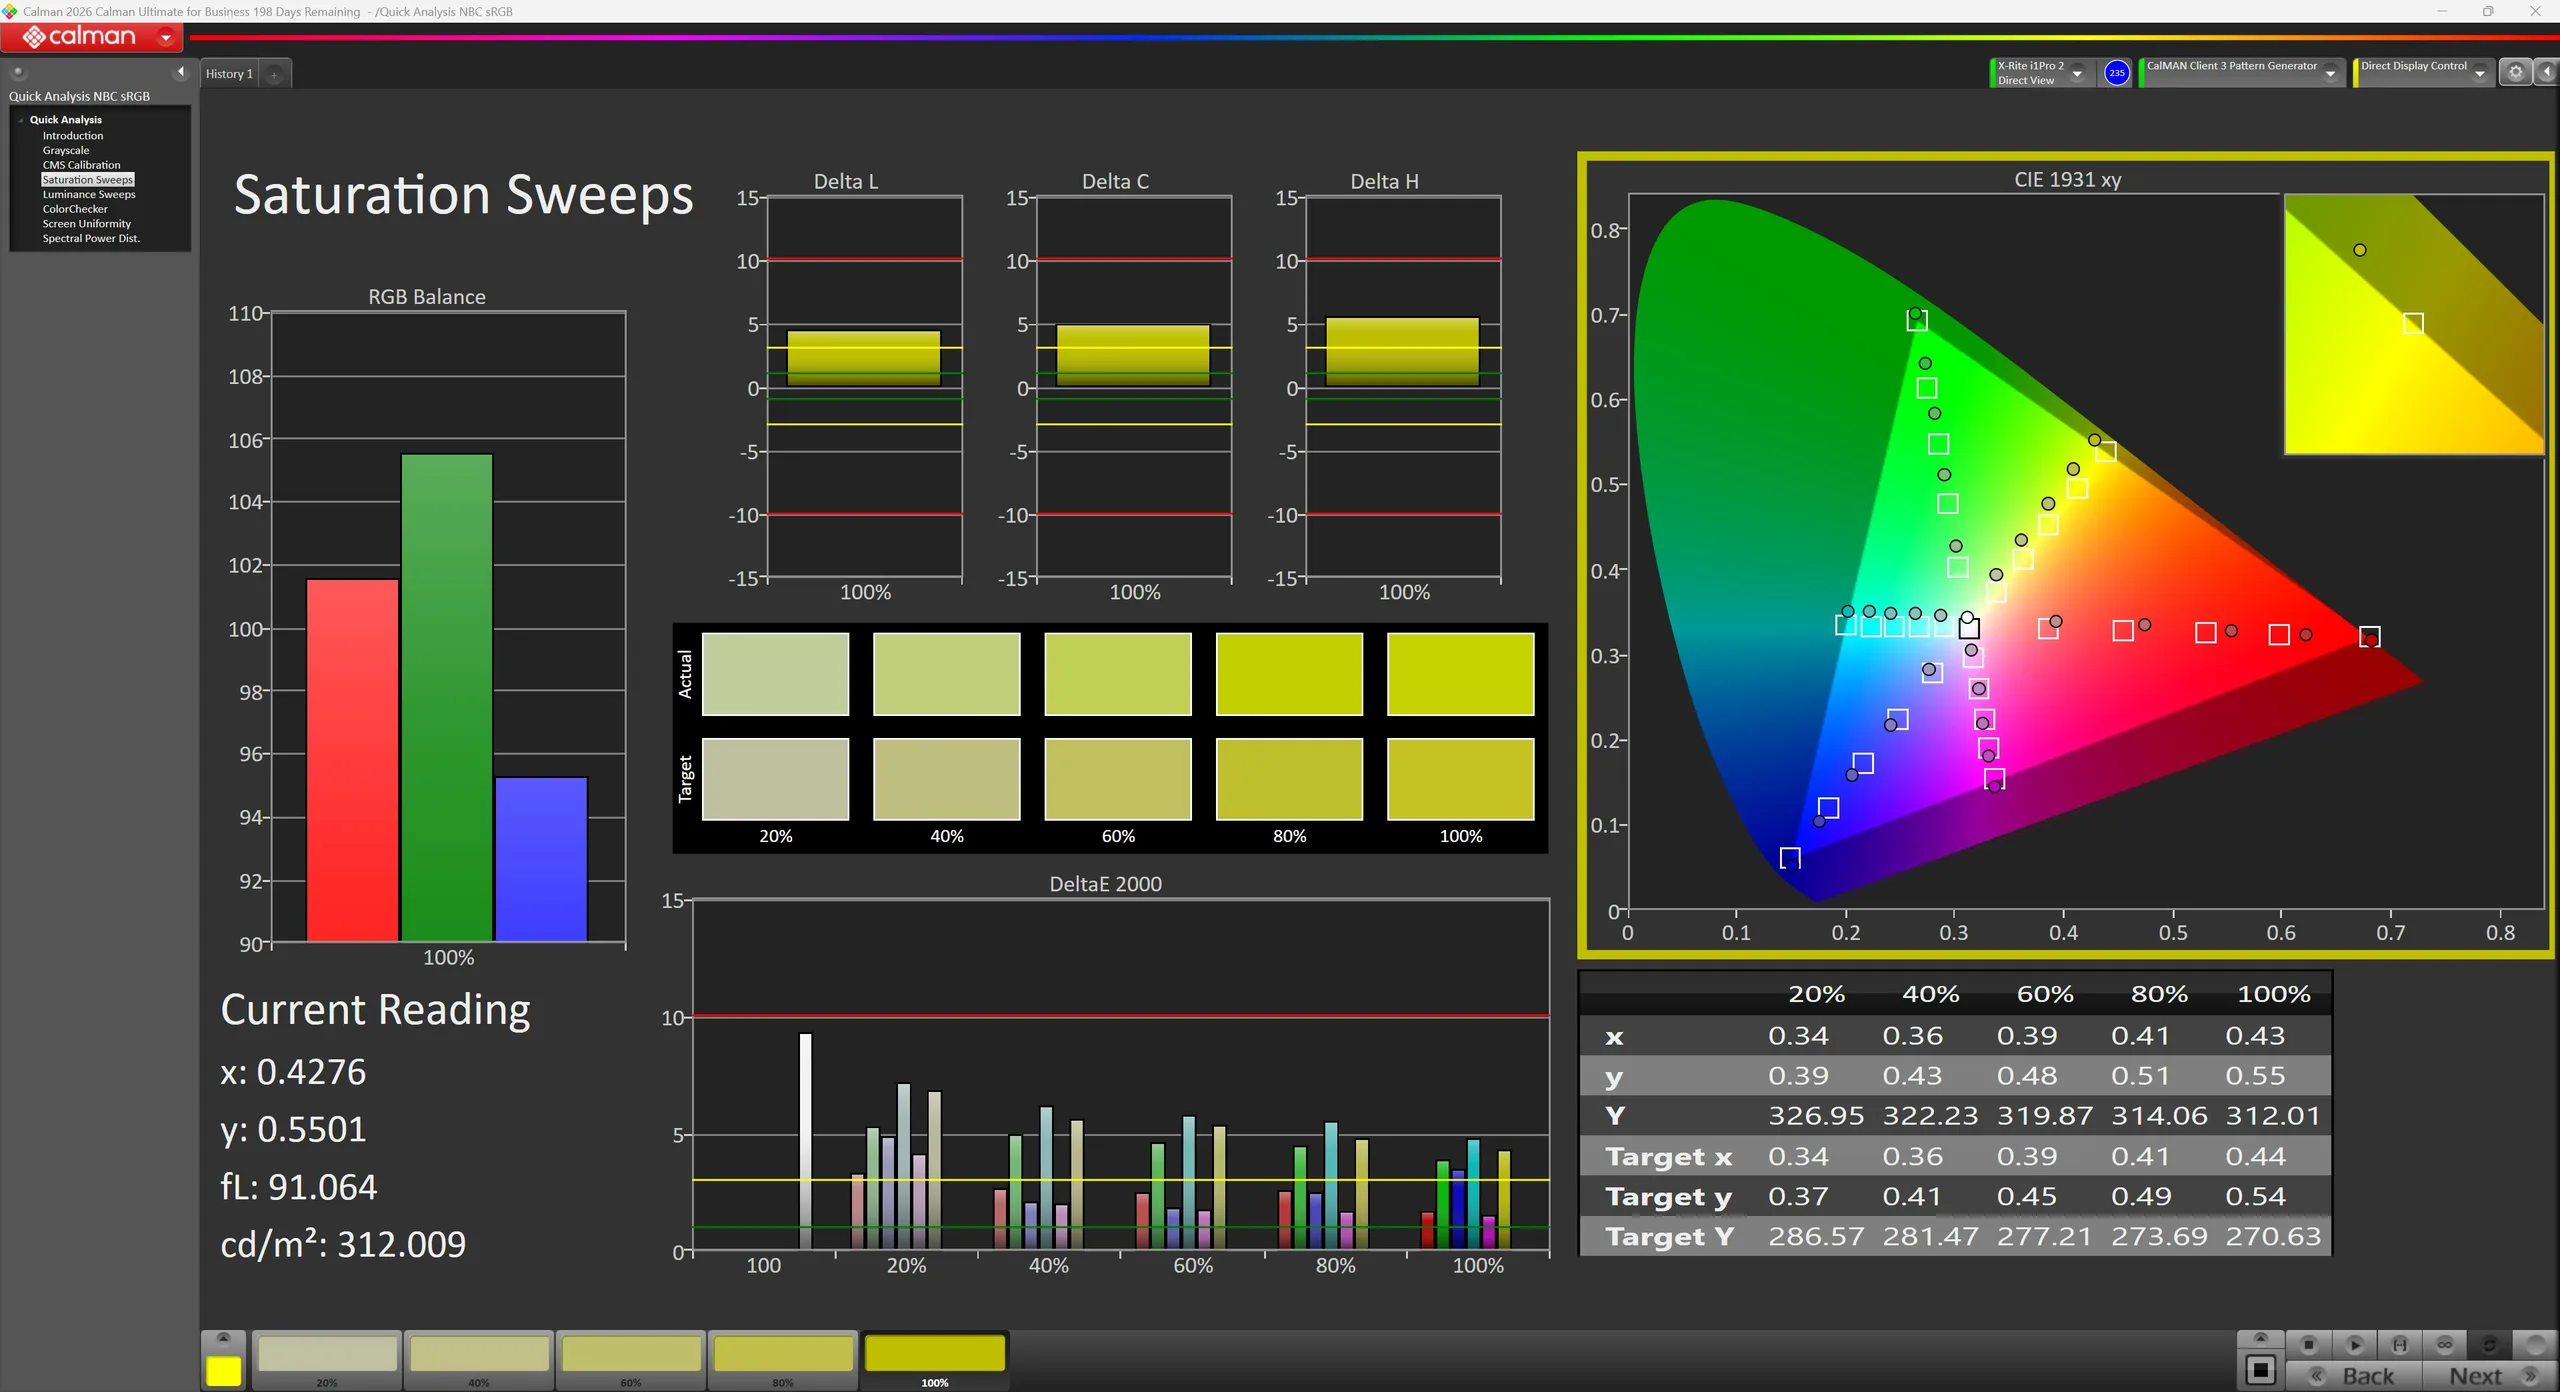
Saturação do CalMAN (Perfil: Display P3)
CalMAN ColorChecker (Perfil: Display P3)
Escala de cinza do CalMAN (Perfil: Nativo)
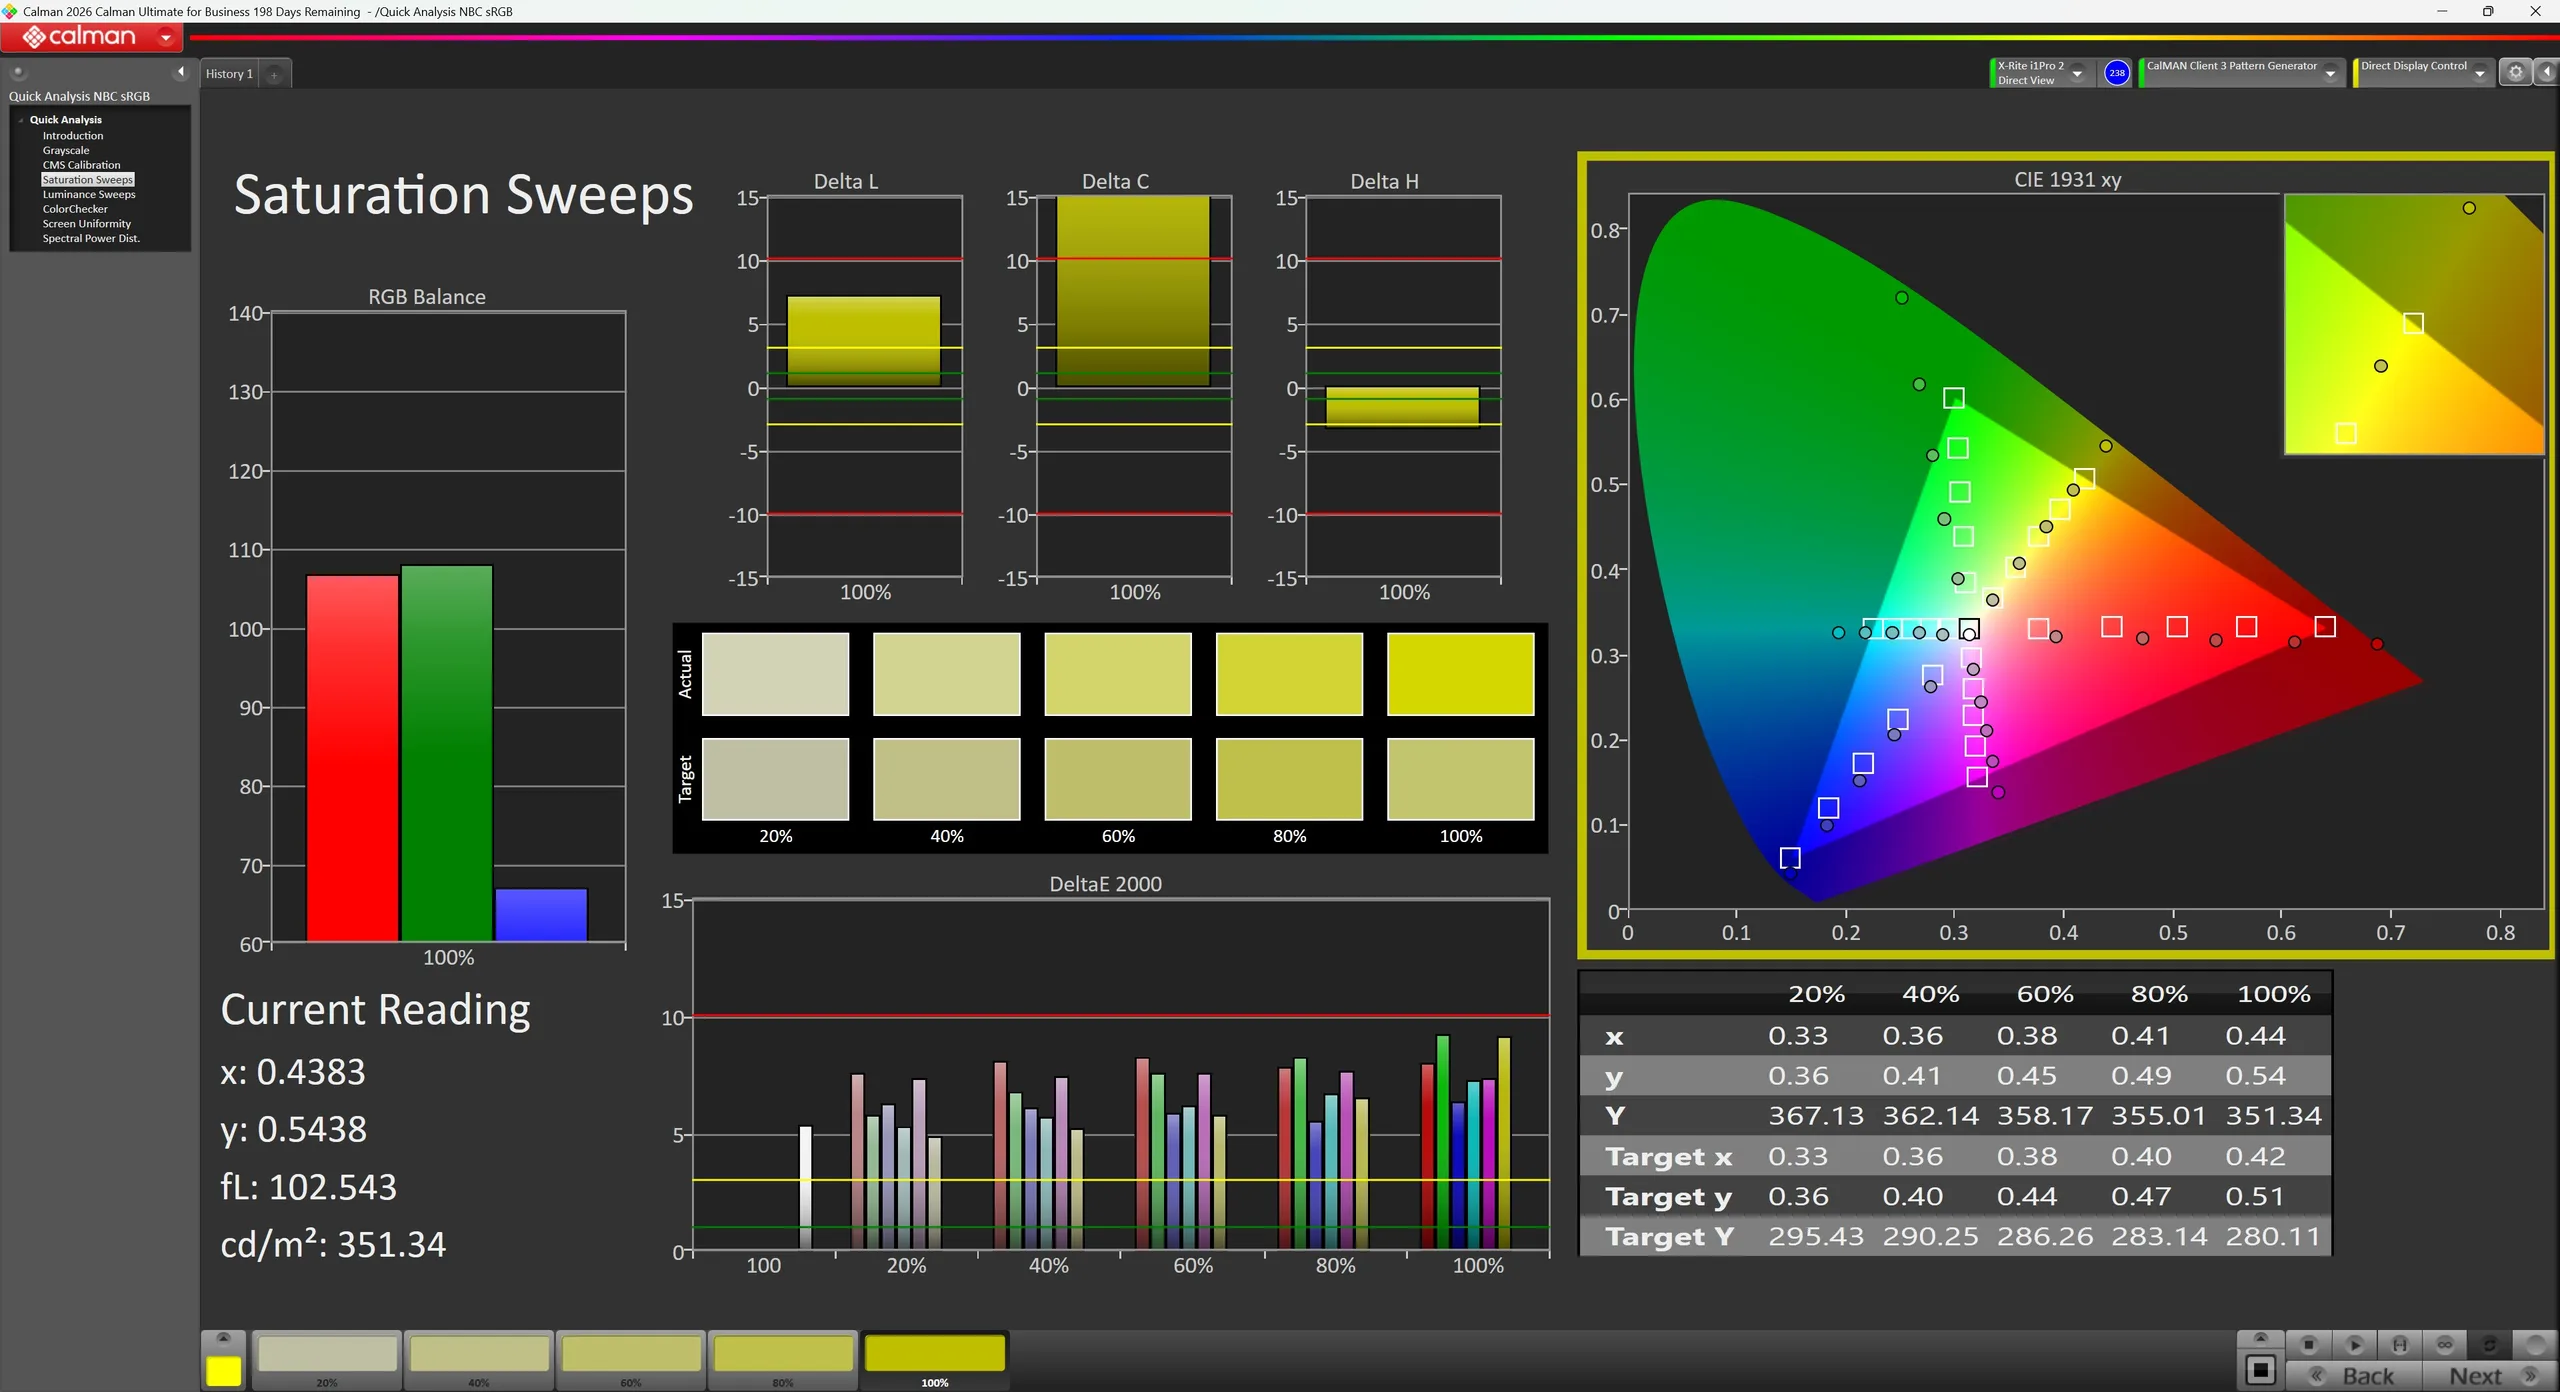
Saturação do CalMAN (Perfil: Nativo)
CalMAN ColorChecker (Perfil: Nativo)

Cobertura do espaço de cores

sRGB
sRGB
AdobeRGB
AdobeRGB
DCI-P3
DCI-P3

A Asus também oferece 18 perfis de cor diferentes para o ROG Strix SCAR. No entanto, em sua configuração padrão, nossa unidade de teste apresenta desvios de cor comparativamente elevados, o que significa que a precisão das cores fica aquém do que se espera de um laptop de ponta. Somente após a calibração é que a tela apresenta uma melhora significativa, e os desvios de cor são visivelmente reduzidos, tornando o painel muito mais adequado para aplicações em que a precisão das cores é fundamental.

Exibir tempos de resposta

Os tempos de resposta do display mostram a rapidez com que a tela é capaz de mudar de uma cor para outra. Tempos de resposta lentos podem gerar imagens residuais e fazer com que objetos em movimento pareçam desfocados (fantasmas). Os jogadores de títulos 3D de ritmo acelerado devem prestar atenção especial aos tempos de resposta rápidos.
       Tempo de resposta preto para branco
8 ms ... ascensão ↗ e queda ↘ combinadas↗ 4 ms ascensão
↘ 4 ms queda
A tela mostra taxas de resposta rápidas em nossos testes e deve ser adequada para jogos.
Em comparação, todos os dispositivos testados variam de 0.1 (mínimo) a 240 (máximo) ms. » 22 % de todos os dispositivos são melhores.
Isso significa que o tempo de resposta medido é melhor que a média de todos os dispositivos testados (19.8 ms).
       Tempo de resposta 50% cinza a 80% cinza
5.8 ms ... ascensão ↗ e queda ↘ combinadas↗ 2.1 ms ascensão
↘ 3.7 ms queda
A tela mostra taxas de resposta muito rápidas em nossos testes e deve ser muito adequada para jogos em ritmo acelerado.
Em comparação, todos os dispositivos testados variam de 0.165 (mínimo) a 636 (máximo) ms. » 19 % de todos os dispositivos são melhores.
Isso significa que o tempo de resposta medido é melhor que a média de todos os dispositivos testados (31 ms).

Cintilação da tela / PWM (modulação por largura de pulso)

Para escurecer a tela, alguns notebooks simplesmente ligam e desligam a luz de fundo em rápida sucessão - um método chamado Modulação por Largura de Pulso (PWM). Idealmente, esta frequência de ciclagem deve ser indetectável ao olho humano. Se a frequência for muito baixa, os usuários com olhos sensíveis podem sentir cansaço ou dores de cabeça ou até mesmo notar a oscilação total.
Tela tremeluzindo/PWM detectado 30589 Hz
Amplitude: 100 %

A luz de fundo da tela pisca em 30589 Hz (pior caso, por exemplo, utilizando PWM) .

A frequência de 30589 Hz é bastante alta, então a maioria dos usuários sensíveis ao PWM não deve notar nenhuma oscilação.

[pwm_comparison] Em comparação: 52 % de todos os dispositivos testados não usam PWM para escurecer a tela. Se PWM foi detectado, uma média de 7754 (mínimo: 5 - máximo: 343500) Hz foi medida.

Cintilação PWM (0% de brilho)
Cintilação PWM (20% de brilho)
Cintilação PWM (40% de brilho)
Cintilação PWM (60% de brilho)
Cintilação PWM (80% de brilho)
Cintilação PWM (100% de brilho)
Sob um céu nublado
Sob um céu nublado
Sob o sol
Sob o sol
Sob o sol
Sob o sol
Estabilidade do ângulo de visão

Desempenho

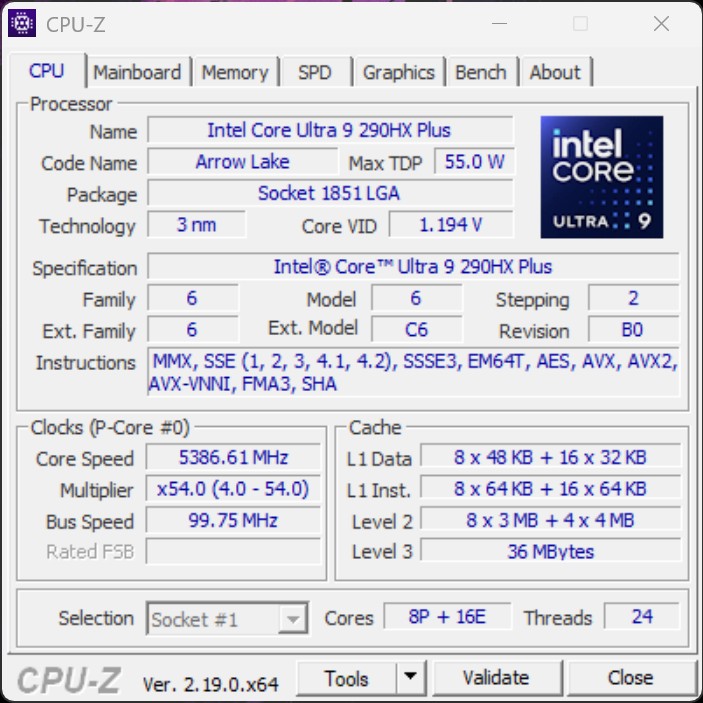
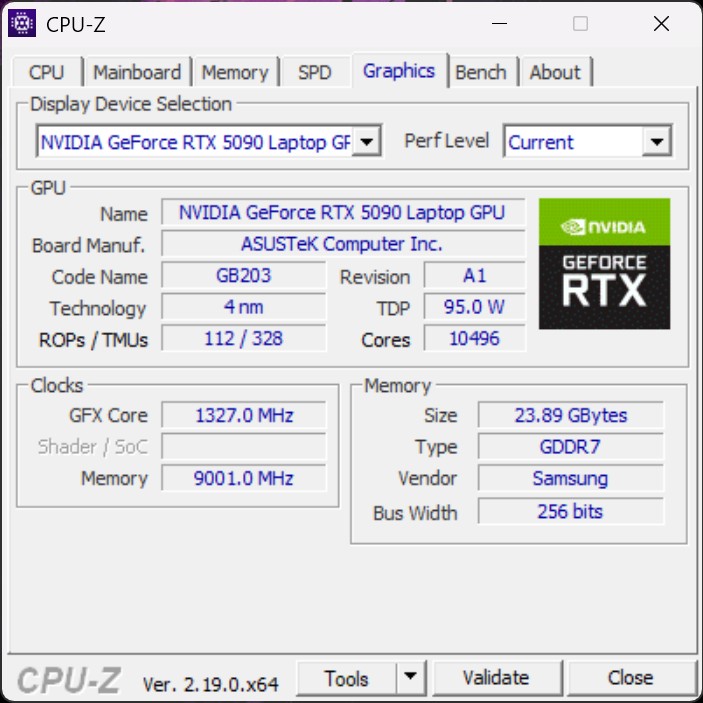
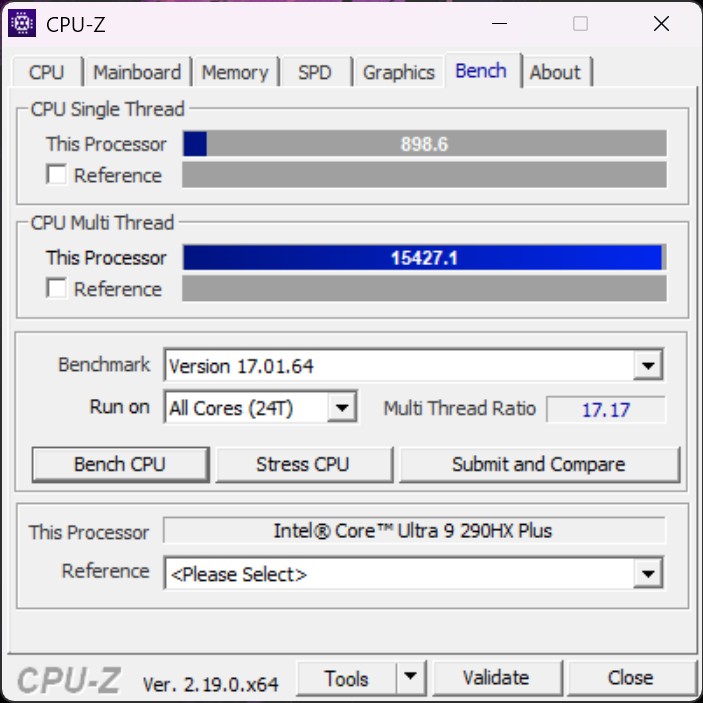
CPU-Z
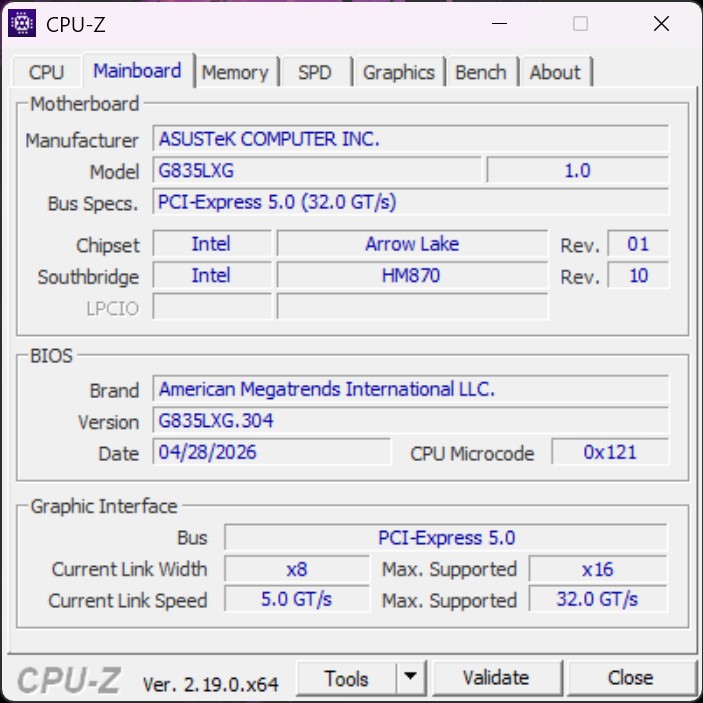
CPU-Z
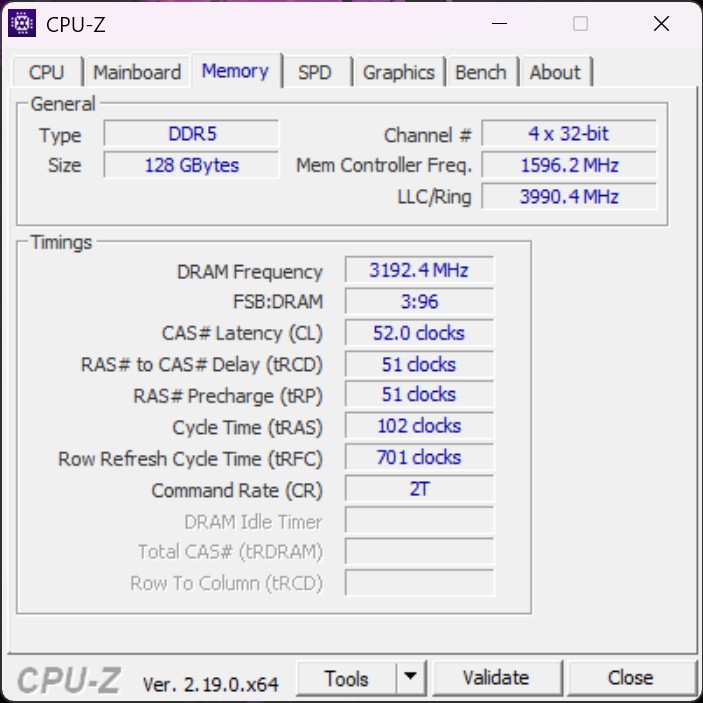
CPU-Z
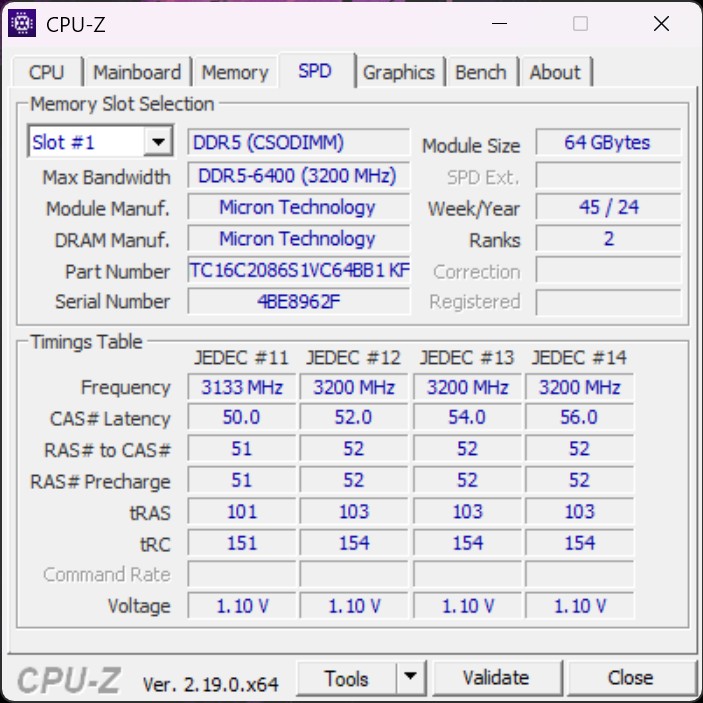
CPU-Z
CPU-Z
CPU-Z
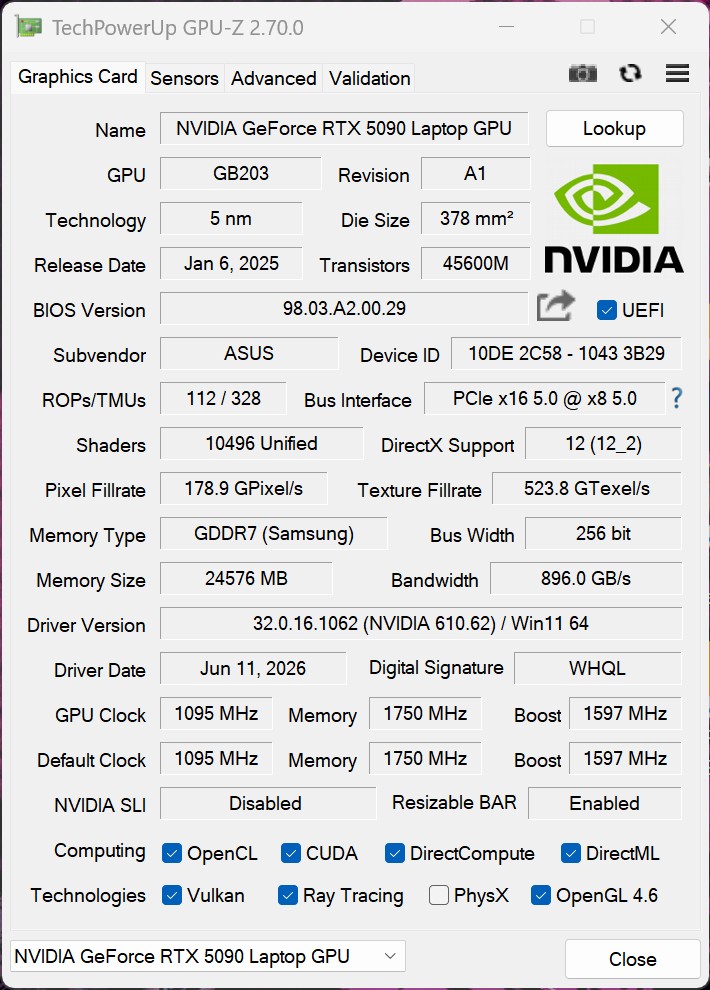
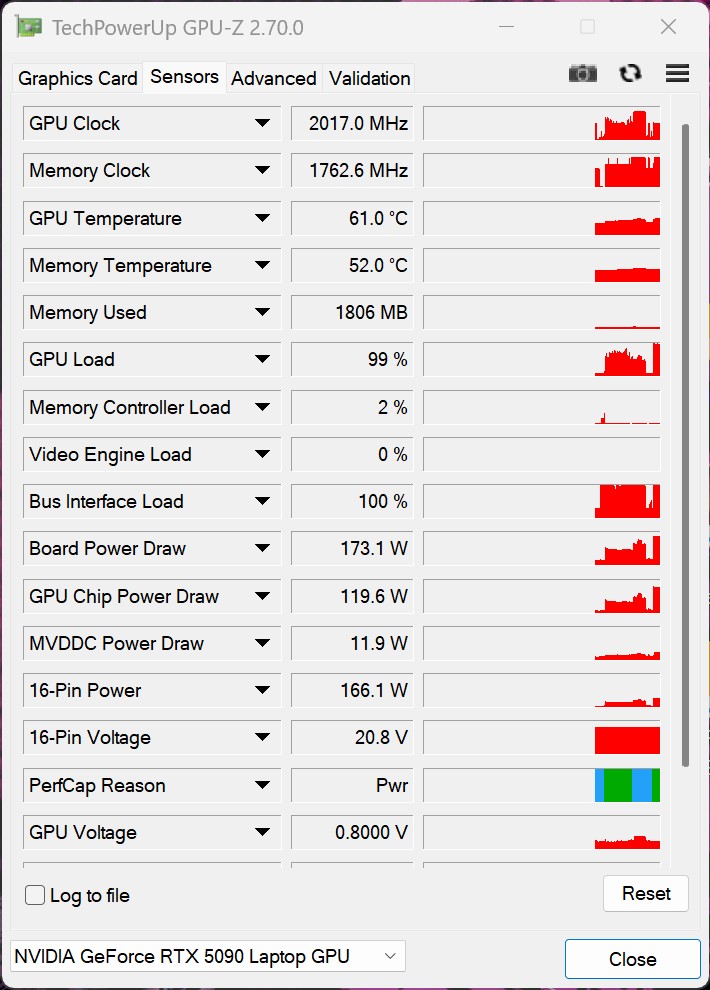
GPU-Z
GPU-Z
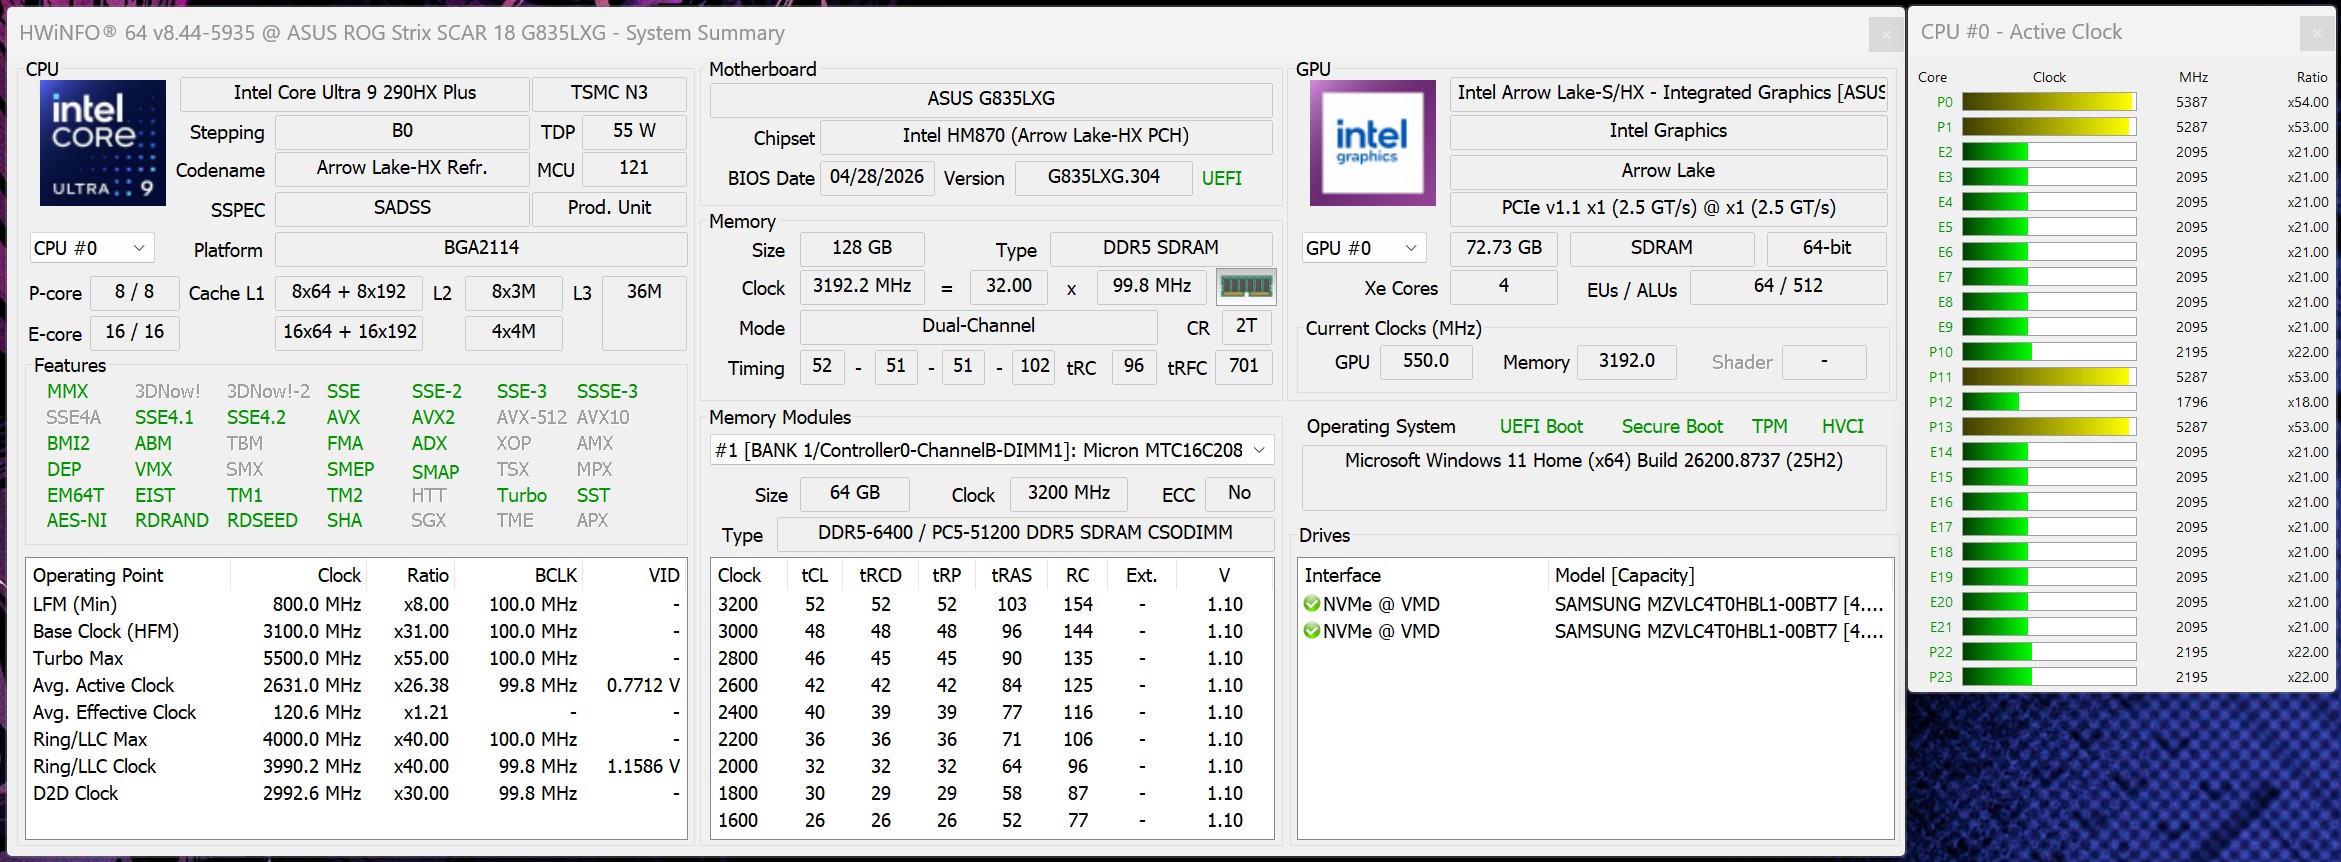
HWiNFO

Condições de teste

O Asus ROG Strix SCAR 18 oferece os três perfis de energia já conhecidos: Silencioso, Desempenho e Turbo. O modo Turbo, que libera o desempenho máximo, foi utilizado em todos os testes de desempenho e medições. Além disso, está disponível um modo manual, no qual, entre outras coisas, é possível personalizar as velocidades de clock da GPU e o controle dos ventiladores. No entanto, o modo Turbo não está disponível quando o aparelho está funcionando com bateria.

Perfil de potência TDP da CPU CBR24Multi TGP da GPU TimeSpy Graphics CP2077QHD Ruído máximodo ventilador
Silencioso 100/80 watts 1.953 pontos 95 watts 16.321 pontos 80,2 FPS 34,8 dB(A)
Desempenho 125/100 watts 2.133 pontos 150 watts 23.177 pontos 110,0 FPS 49 dB(A)
Turbo 200/180 watts 2.318 pontos 175 watts 25.256 pontos 118,7 FPS 53,7 dB(A)

Processador - Core Ultra 9 290HX Plus

O Intel Core Ultra 9 290HX é um dos processadores móveis mais rápidos da atual geração Arrow Lake-HX e foi projetado para notebooks de jogos de ponta e estações de trabalho móveis. Com seu alto desempenho em múltiplos núcleos, ele lida com aplicativos exigentes, como renderização, edição de vídeo ou desenvolvimento de software, com a mesma facilidade com que lida com os jogos mais recentes. Nos testes, o processador apresenta um desempenho consistentemente alto e está entre as melhores CPUs para notebooks disponíveis atualmente. No Asus ROG Strix SCAR 18, o fabricante oferece três modos de desempenho predefinidos com até 200 watts de potência de pico. Os usuários que desejarem ajustar as configurações manualmente podem até mesmo alocar até 240 watts ao processador móvel.

Cinebench R15 Multi Loop

0125250375500625750875100011251250137515001625175018752000212522502375250026252750287530003125325033753500362537503875400041254250437545004625475048755000512552505375550056255750587560006125Tooltip
Asus ROG Strix Scar 18 G835LXG Intel Core Ultra 9 290HX Plus: Ø6190 (6119.95-6230.53) Points
Asus Strix Scar 18 G835LX Intel Core Ultra 9 275HX: Ø5942 (5879.76-6059.69) Points
Razer Blade 18 2024 RZ09-0509 Intel Core i9-14900HX: Ø4163 (3956.09-4227.88) Points
Alienware m18 R2 Intel Core i9-14900HX: Ø4743 (4458.81-4807.11) Points
Acer Predator Helios 18 PH18-72-98MW Intel Core i9-14900HX: Ø4064 (3787.52-4673.44) Points
MSI Titan 18 HX A14VIG Intel Core i9-14900HX: Ø4753 (4700.35-4782.4) Points
Schenker Key 17 Pro (M24) Intel Core i9-14900HX: Ø3786 (3488.57-4363) Points
CPU Performance rating: Percent
Cinebench R23: Multi Core | Single Core
Cinebench R20: CPU (Multi Core) | CPU (Single Core)
Cinebench R15: CPU Multi 64Bit | CPU Single 64Bit
Blender: v2.79 BMW27 CPU
7-Zip 18.03: 7z b 4 | 7z b 4 -mmt1
Geekbench 6.7: Multi-Core | Single-Core
Geekbench 5.5: Multi-Core | Single-Core
HWBOT x265 Benchmark v2.2: 4k Preset
LibreOffice : 20 Documents To PDF
R Benchmark 2.5: Overall mean
CPU Performance rating
Asus ROG Strix Scar 18 G835LXG
Intel Core Ultra 9 290HX Plus
86 pt
Asus Strix Scar 18 G835LX
Intel Core Ultra 9 275HX
83.4 pt
Média Intel Core Ultra 9 290HX Plus
 
83.3 pt
Alienware m18 R2
Intel Core i9-14900HX
74.8 pt
MSI Titan 18 HX A14VIG
Intel Core i9-14900HX
71.6 pt
Razer Blade 18 2024 RZ09-0509
Intel Core i9-14900HX
67.9 pt
Schenker Key 17 Pro (M24)
Intel Core i9-14900HX
66.1 pt
Acer Predator Helios 18 PH18-72-98MW
Intel Core i9-14900HX
65.2 pt
Média da turma Gaming
 
63.4 pt
Cinebench R23 / Multi Core
Asus ROG Strix Scar 18 G835LXG
Intel Core Ultra 9 290HX Plus
42661 Points
Média Intel Core Ultra 9 290HX Plus
  (37038 - 42661, n=5)
39891 Points -6%
Asus Strix Scar 18 G835LX
Intel Core Ultra 9 275HX
39001 Points -9%
MSI Titan 18 HX A14VIG
Intel Core i9-14900HX
32428 (29693.8min - 32428.3max) Points -24%
Alienware m18 R2
Intel Core i9-14900HX
31391 (28656min - 31390.7max) Points -26%
Razer Blade 18 2024 RZ09-0509
Intel Core i9-14900HX
27657 (23328.1min - 27657.5max) Points -35%
Schenker Key 17 Pro (M24)
Intel Core i9-14900HX
27338 Points -36%
Média da turma Gaming
  (10488 - 42661, n=107, últimos 2 anos)
26304 Points -38%
Acer Predator Helios 18 PH18-72-98MW
Intel Core i9-14900HX
26171 Points -39%
Cinebench R23 / Single Core
Asus ROG Strix Scar 18 G835LXG
Intel Core Ultra 9 290HX Plus
2415 Points
Média Intel Core Ultra 9 290HX Plus
  (2319 - 2415, n=5)
2361 Points -2%
Asus Strix Scar 18 G835LX
Intel Core Ultra 9 275HX
2252 Points -7%
Alienware m18 R2
Intel Core i9-14900HX
2235 Points -7%
Acer Predator Helios 18 PH18-72-98MW
Intel Core i9-14900HX
2176 Points -10%
MSI Titan 18 HX A14VIG
Intel Core i9-14900HX
2143 Points -11%
Razer Blade 18 2024 RZ09-0509
Intel Core i9-14900HX
2088 Points -14%
Schenker Key 17 Pro (M24)
Intel Core i9-14900HX
2028 Points -16%
Média da turma Gaming
  (1166 - 2415, n=107, últimos 2 anos)
2015 Points -17%
Cinebench R20 / CPU (Multi Core)
Asus ROG Strix Scar 18 G835LXG
Intel Core Ultra 9 290HX Plus
16433 Points
Asus Strix Scar 18 G835LX
Intel Core Ultra 9 275HX
15517 Points -6%
Média Intel Core Ultra 9 290HX Plus
  (14397 - 16433, n=5)
15445 Points -6%
MSI Titan 18 HX A14VIG
Intel Core i9-14900HX
12103 Points -26%
Alienware m18 R2
Intel Core i9-14900HX
11816 Points -28%
Razer Blade 18 2024 RZ09-0509
Intel Core i9-14900HX
10871 Points -34%
Schenker Key 17 Pro (M24)
Intel Core i9-14900HX
10276 Points -37%
Média da turma Gaming
  (4029 - 16433, n=106, últimos 2 anos)
10226 Points -38%
Acer Predator Helios 18 PH18-72-98MW
Intel Core i9-14900HX
9881 Points -40%
Cinebench R20 / CPU (Single Core)
Asus ROG Strix Scar 18 G835LXG
Intel Core Ultra 9 290HX Plus
913 Points
Média Intel Core Ultra 9 290HX Plus
  (864 - 913, n=5)
891 Points -2%
Asus Strix Scar 18 G835LX
Intel Core Ultra 9 275HX
866 Points -5%
Alienware m18 R2
Intel Core i9-14900HX
853 Points -7%
Acer Predator Helios 18 PH18-72-98MW
Intel Core i9-14900HX
832 Points -9%
MSI Titan 18 HX A14VIG
Intel Core i9-14900HX
823 Points -10%
Razer Blade 18 2024 RZ09-0509
Intel Core i9-14900HX
814 Points -11%
Média da turma Gaming
  (442 - 913, n=106, últimos 2 anos)
780 Points -15%
Schenker Key 17 Pro (M24)
Intel Core i9-14900HX
779 Points -15%
Cinebench R15 / CPU Multi 64Bit
Asus ROG Strix Scar 18 G835LXG
Intel Core Ultra 9 290HX Plus
6330 Points
Asus Strix Scar 18 G835LX
Intel Core Ultra 9 275HX
6060 (5879.76min - 6059.69max) Points -4%
Média Intel Core Ultra 9 290HX Plus
  (5617 - 6330, n=5)
6002 Points -5%
Alienware m18 R2
Intel Core i9-14900HX
4807 (4458.81min - 4807.11max) Points -24%
MSI Titan 18 HX A14VIG
Intel Core i9-14900HX
4782 (4700.35min - 4782.4max) Points -24%
Acer Predator Helios 18 PH18-72-98MW
Intel Core i9-14900HX
4673 (3787.52min - 4673.44max) Points -26%
Schenker Key 17 Pro (M24)
Intel Core i9-14900HX
4363 (3488.57min - 4363max) Points -31%
Razer Blade 18 2024 RZ09-0509
Intel Core i9-14900HX
4228 (3956.09min - 4227.88max) Points -33%
Média da turma Gaming
  (1578 - 6330, n=105, últimos 2 anos)
4079 Points -36%
Cinebench R15 / CPU Single 64Bit
Asus ROG Strix Scar 18 G835LXG
Intel Core Ultra 9 290HX Plus
350 Points
Asus Strix Scar 18 G835LX
Intel Core Ultra 9 275HX
343 Points -2%
Média Intel Core Ultra 9 290HX Plus
  (324 - 350, n=5)
339 Points -3%
Alienware m18 R2
Intel Core i9-14900HX
318 Points -9%
Acer Predator Helios 18 PH18-72-98MW
Intel Core i9-14900HX
312 Points -11%
Razer Blade 18 2024 RZ09-0509
Intel Core i9-14900HX
304 Points -13%
MSI Titan 18 HX A14VIG
Intel Core i9-14900HX
300 Points -14%
Média da turma Gaming
  (188.8 - 350, n=106, últimos 2 anos)
297 Points -15%
Schenker Key 17 Pro (M24)
Intel Core i9-14900HX
288 Points -18%
Blender / v2.79 BMW27 CPU
Média da turma Gaming
  (79 - 330, n=104, últimos 2 anos)
149.9 Seconds * -90%
Acer Predator Helios 18 PH18-72-98MW
Intel Core i9-14900HX
125 Seconds * -58%
Schenker Key 17 Pro (M24)
Intel Core i9-14900HX
121 Seconds * -53%
Razer Blade 18 2024 RZ09-0509
Intel Core i9-14900HX
117 Seconds * -48%
MSI Titan 18 HX A14VIG
Intel Core i9-14900HX
104 Seconds * -32%
Alienware m18 R2
Intel Core i9-14900HX
102 Seconds * -29%
Asus Strix Scar 18 G835LX
Intel Core Ultra 9 275HX
87 Seconds * -10%
Média Intel Core Ultra 9 290HX Plus
  (79 - 94, n=5)
86.2 Seconds * -9%
Asus ROG Strix Scar 18 G835LXG
Intel Core Ultra 9 290HX Plus
79 Seconds *
7-Zip 18.03 / 7z b 4
Asus ROG Strix Scar 18 G835LXG
Intel Core Ultra 9 290HX Plus
131933 MIPS
Asus Strix Scar 18 G835LX
Intel Core Ultra 9 275HX
122818 MIPS -7%
Alienware m18 R2
Intel Core i9-14900HX
122772 MIPS -7%
MSI Titan 18 HX A14VIG
Intel Core i9-14900HX
121266 MIPS -8%
Média Intel Core Ultra 9 290HX Plus
  (103986 - 131933, n=5)
119559 MIPS -9%
Schenker Key 17 Pro (M24)
Intel Core i9-14900HX
109204 MIPS -17%
Razer Blade 18 2024 RZ09-0509
Intel Core i9-14900HX
107527 MIPS -18%
Acer Predator Helios 18 PH18-72-98MW
Intel Core i9-14900HX
106977 MIPS -19%
Média da turma Gaming
  (33491 - 148086, n=105, últimos 2 anos)
90547 MIPS -31%
7-Zip 18.03 / 7z b 4 -mmt1
Asus ROG Strix Scar 18 G835LXG
Intel Core Ultra 9 290HX Plus
7143 MIPS
Alienware m18 R2
Intel Core i9-14900HX
7103 MIPS -1%
Asus Strix Scar 18 G835LX
Intel Core Ultra 9 275HX
7027 MIPS -2%
Schenker Key 17 Pro (M24)
Intel Core i9-14900HX
6858 MIPS -4%
Média Intel Core Ultra 9 290HX Plus
  (6562 - 7143, n=5)
6850 MIPS -4%
MSI Titan 18 HX A14VIG
Intel Core i9-14900HX
6504 MIPS -9%
Razer Blade 18 2024 RZ09-0509
Intel Core i9-14900HX
6497 MIPS -9%
Média da turma Gaming
  (4199 - 7436, n=105, últimos 2 anos)
6417 MIPS -10%
Acer Predator Helios 18 PH18-72-98MW
Intel Core i9-14900HX
6206 MIPS -13%
Geekbench 6.7 / Multi-Core
Asus ROG Strix Scar 18 G835LXG
Intel Core Ultra 9 290HX Plus
22850 Points
Asus Strix Scar 18 G835LX
Intel Core Ultra 9 275HX
21668 Points -5%
Média Intel Core Ultra 9 290HX Plus
  (19855 - 22850, n=6)
21145 Points -7%
Alienware m18 R2
Intel Core i9-14900HX
18233 Points -20%
Acer Predator Helios 18 PH18-72-98MW
Intel Core i9-14900HX
17403 Points -24%
Razer Blade 18 2024 RZ09-0509
Intel Core i9-14900HX
17231 Points -25%
MSI Titan 18 HX A14VIG
Intel Core i9-14900HX
16652 Points -27%
Schenker Key 17 Pro (M24)
Intel Core i9-14900HX
16482 Points -28%
Média da turma Gaming
  (6625 - 22850, n=106, últimos 2 anos)
16010 Points -30%
Geekbench 6.7 / Single-Core
Asus ROG Strix Scar 18 G835LXG
Intel Core Ultra 9 290HX Plus
3228 Points
Média Intel Core Ultra 9 290HX Plus
  (3147 - 3228, n=6)
3186 Points -1%
Asus Strix Scar 18 G835LX
Intel Core Ultra 9 275HX
3158 Points -2%
Alienware m18 R2
Intel Core i9-14900HX
3057 Points -5%
Acer Predator Helios 18 PH18-72-98MW
Intel Core i9-14900HX
2965 Points -8%
Média da turma Gaming
  (1490 - 3259, n=106, últimos 2 anos)
2848 Points -12%
MSI Titan 18 HX A14VIG
Intel Core i9-14900HX
2843 Points -12%
Razer Blade 18 2024 RZ09-0509
Intel Core i9-14900HX
2842 Points -12%
Schenker Key 17 Pro (M24)
Intel Core i9-14900HX
2611 Points -19%
Geekbench 5.5 / Multi-Core
Asus ROG Strix Scar 18 G835LXG
Intel Core Ultra 9 290HX Plus
28263 Points
Asus Strix Scar 18 G835LX
Intel Core Ultra 9 275HX
25855 Points -9%
Média Intel Core Ultra 9 290HX Plus
  (23839 - 28263, n=5)
25396 Points -10%
Alienware m18 R2
Intel Core i9-14900HX
21284 Points -25%
Acer Predator Helios 18 PH18-72-98MW
Intel Core i9-14900HX
20029 Points -29%
Schenker Key 17 Pro (M24)
Intel Core i9-14900HX
19316 Points -32%
Razer Blade 18 2024 RZ09-0509
Intel Core i9-14900HX
19310 Points -32%
MSI Titan 18 HX A14VIG
Intel Core i9-14900HX
19137 Points -32%
Média da turma Gaming
  (6460 - 28263, n=105, últimos 2 anos)
17266 Points -39%
Geekbench 5.5 / Single-Core
Asus ROG Strix Scar 18 G835LXG
Intel Core Ultra 9 290HX Plus
2350 Points
Média Intel Core Ultra 9 290HX Plus
  (2282 - 2357, n=5)
2318 Points -1%
Asus Strix Scar 18 G835LX
Intel Core Ultra 9 275HX
2292 Points -2%
Alienware m18 R2
Intel Core i9-14900HX
2193 Points -7%
MSI Titan 18 HX A14VIG
Intel Core i9-14900HX
2098 Points -11%
Média da turma Gaming
  (986 - 2474, n=105, últimos 2 anos)
2060 Points -12%
Razer Blade 18 2024 RZ09-0509
Intel Core i9-14900HX
2015 Points -14%
Acer Predator Helios 18 PH18-72-98MW
Intel Core i9-14900HX
2009 Points -15%
Schenker Key 17 Pro (M24)
Intel Core i9-14900HX
1924 Points -18%
HWBOT x265 Benchmark v2.2 / 4k Preset
Asus ROG Strix Scar 18 G835LXG
Intel Core Ultra 9 290HX Plus
44.4 fps
Média Intel Core Ultra 9 290HX Plus
  (38.2 - 44.4, n=5)
41.4 fps -7%
Asus Strix Scar 18 G835LX
Intel Core Ultra 9 275HX
41.2 fps -7%
Alienware m18 R2
Intel Core i9-14900HX
32.1 fps -28%
MSI Titan 18 HX A14VIG
Intel Core i9-14900HX
30.9 fps -30%
Acer Predator Helios 18 PH18-72-98MW
Intel Core i9-14900HX
29.5 fps -34%
Média da turma Gaming
  (11.5 - 44.4, n=105, últimos 2 anos)
28.8 fps -35%
Razer Blade 18 2024 RZ09-0509
Intel Core i9-14900HX
27.7 fps -38%
Schenker Key 17 Pro (M24)
Intel Core i9-14900HX
27.1 fps -39%
LibreOffice / 20 Documents To PDF
Acer Predator Helios 18 PH18-72-98MW
Intel Core i9-14900HX
85.1 s * -25%
Asus ROG Strix Scar 18 G835LXG
Intel Core Ultra 9 290HX Plus
68.2 s *
Média da turma Gaming
  (33.2 - 88.8, n=105, últimos 2 anos)
49.7 s * +27%
Razer Blade 18 2024 RZ09-0509
Intel Core i9-14900HX
48.5 s * +29%
Schenker Key 17 Pro (M24)
Intel Core i9-14900HX
46.6 s * +32%
MSI Titan 18 HX A14VIG
Intel Core i9-14900HX
46.2 s * +32%
Média Intel Core Ultra 9 290HX Plus
  (38.9 - 68.2, n=5)
45.5 s * +33%
Alienware m18 R2
Intel Core i9-14900HX
44.8 s * +34%
Asus Strix Scar 18 G835LX
Intel Core Ultra 9 275HX
41.3 s * +39%
R Benchmark 2.5 / Overall mean
Média da turma Gaming
  (0.3439 - 0.759, n=106, últimos 2 anos)
0.4284 sec * -10%
Acer Predator Helios 18 PH18-72-98MW
Intel Core i9-14900HX
0.4225 sec * -8%
Schenker Key 17 Pro (M24)
Intel Core i9-14900HX
0.4143 sec * -6%
Asus Strix Scar 18 G835LX
Intel Core Ultra 9 275HX
0.3943 sec * -1%
Razer Blade 18 2024 RZ09-0509
Intel Core i9-14900HX
0.3937 sec * -1%
MSI Titan 18 HX A14VIG
Intel Core i9-14900HX
0.3919 sec * -1%
Asus ROG Strix Scar 18 G835LXG
Intel Core Ultra 9 290HX Plus
0.3899 sec *
Média Intel Core Ultra 9 290HX Plus
  (0.3788 - 0.3951, n=5)
0.3887 sec * -0%
Alienware m18 R2
Intel Core i9-14900HX
0.3767 sec * +3%

* ... menor é melhor

Cinebench R10 Rendering Single 32Bit
12575
Cinebench R10 Shading 64Bit
13665 Points
Cinebench R10 Rendering Multiple CPUs 64Bit
165835 Points
Cinebench R10 Rendering Single CPUs 64Bit
19487 Points
Cinebench R10 Shading 32Bit
13696
Cinebench R10 Rendering Multiple CPUs 32Bit
102066
Cinebench R11.5 CPU Single 32Bit
3.66 Points
Cinebench R11.5 CPU Multi 32Bit
67.85 Points
Cinebench R11.5 OpenGL 32Bit
199.32 fps
Cinebench R11.5 CPU Single 64Bit
4.16 Points
Cinebench R11.5 CPU Multi 64Bit
76.69 Points
Cinebench R11.5 OpenGL 64Bit
220.23 fps
Cinebench R15 CPU Single 64Bit
350 Points
Cinebench R15 CPU Multi 64Bit
6330 Points
Cinebench R15 Ref. Match 64Bit
99.6 %
Cinebench R15 OpenGL 64Bit
321.54 fps
Cinebench R20 CPU (Single Core)
913 Points
Cinebench R20 CPU (Multi Core)
16433 Points
Cinebench R23 Multi Core
42661 Points
Cinebench R23 Single Core
2415 Points
Cinebench 2024 CPU Single Core
141 Points
Cinebench 2024 CPU Multi Core
2327 Points
Cinebench 2026 CPU Multi
9542 Points
Cinebench 2026 CPU Single Thread
581 Points
Ajuda
Performance rating
Asus ROG Strix Scar 18 G835LXG
Intel Core Ultra 9 290HX Plus, GeForce RTX 5090 Laptop
97.5 pt
Média Intel Core Ultra 9 290HX Plus
 
91.7 pt
Asus Strix Scar 18 G835LX -1!
Intel Core Ultra 9 275HX, GeForce RTX 5090 Laptop
90.1 pt
MSI Titan 18 HX A14VIG -1!
Intel Core i9-14900HX, GeForce RTX 4090 Laptop GPU
77.8 pt
Alienware m18 R2 -1!
Intel Core i9-14900HX, GeForce RTX 4090 Laptop GPU
77.4 pt
Média da turma Gaming
 
71.2 pt
Razer Blade 18 2024 RZ09-0509 -1!
Intel Core i9-14900HX, GeForce RTX 4090 Laptop GPU
69.8 pt
Acer Predator Helios 18 PH18-72-98MW -1!
Intel Core i9-14900HX, GeForce RTX 4090 Laptop GPU
67 pt
Schenker Key 17 Pro (M24) -1!
Intel Core i9-14900HX, GeForce RTX 4090 Laptop GPU
64.8 pt
AIDA64 / FP32 Ray-Trace
Asus ROG Strix Scar 18 G835LXG
Intel Core Ultra 9 290HX Plus, GeForce RTX 5090 Laptop (v6.92.6600)
43239 KRay/s
Asus ROG Strix Scar 18 G835LXG
Intel Core Ultra 9 290HX Plus, GeForce RTX 5090 Laptop (v8.20.8100)
43116 KRay/s 0%
Média Intel Core Ultra 9 290HX Plus
  (34761 - 43239, n=6)
40296 KRay/s -7%
Asus Strix Scar 18 G835LX
Intel Core Ultra 9 275HX, GeForce RTX 5090 Laptop (v6.92.6600)
39458 KRay/s -9%
Média da turma Gaming
  (10227 - 85542, n=105, últimos 2 anos)
32356 KRay/s -25%
MSI Titan 18 HX A14VIG
Intel Core i9-14900HX, GeForce RTX 4090 Laptop GPU (v6.92.6600)
29351 KRay/s -32%
Alienware m18 R2
Intel Core i9-14900HX, GeForce RTX 4090 Laptop GPU (v6.92.6600)
29280 KRay/s -32%
Razer Blade 18 2024 RZ09-0509
Intel Core i9-14900HX, GeForce RTX 4090 Laptop GPU (v6.85.6300)
25098 KRay/s -42%
Acer Predator Helios 18 PH18-72-98MW
Intel Core i9-14900HX, GeForce RTX 4090 Laptop GPU (v6.92.6600)
23862 KRay/s -45%
Schenker Key 17 Pro (M24)
Intel Core i9-14900HX, GeForce RTX 4090 Laptop GPU (v6.92.6600)
21858 KRay/s -49%
AIDA64 / FPU Julia
Asus ROG Strix Scar 18 G835LXG
Intel Core Ultra 9 290HX Plus, GeForce RTX 5090 Laptop (v8.20.8100)
218895 Points
Asus ROG Strix Scar 18 G835LXG
Intel Core Ultra 9 290HX Plus, GeForce RTX 5090 Laptop (v6.92.6600)
217175 Points -1%
Média Intel Core Ultra 9 290HX Plus
  (174665 - 218895, n=6)
204722 Points -6%
Asus Strix Scar 18 G835LX
Intel Core Ultra 9 275HX, GeForce RTX 5090 Laptop (v6.92.6600)
194867 Points -11%
MSI Titan 18 HX A14VIG
Intel Core i9-14900HX, GeForce RTX 4090 Laptop GPU (v6.92.6600)
148888 Points -32%
Alienware m18 R2
Intel Core i9-14900HX, GeForce RTX 4090 Laptop GPU (v6.92.6600)
142791 Points -35%
Média da turma Gaming
  (51376 - 238426, n=105, últimos 2 anos)
140193 Points -36%
Razer Blade 18 2024 RZ09-0509
Intel Core i9-14900HX, GeForce RTX 4090 Laptop GPU (v6.85.6300)
128369 Points -41%
Acer Predator Helios 18 PH18-72-98MW
Intel Core i9-14900HX, GeForce RTX 4090 Laptop GPU (v6.92.6600)
118469 Points -46%
Schenker Key 17 Pro (M24)
Intel Core i9-14900HX, GeForce RTX 4090 Laptop GPU (v6.92.6600)
113270 Points -48%
AIDA64 / CPU SHA3
Asus ROG Strix Scar 18 G835LXG
Intel Core Ultra 9 290HX Plus, GeForce RTX 5090 Laptop (v8.20.8100)
10115 MB/s
Asus ROG Strix Scar 18 G835LXG
Intel Core Ultra 9 290HX Plus, GeForce RTX 5090 Laptop (v6.92.6600)
10055 MB/s -1%
Média Intel Core Ultra 9 290HX Plus
  (8352 - 10115, n=6)
9565 MB/s -5%
Asus Strix Scar 18 G835LX
Intel Core Ultra 9 275HX, GeForce RTX 5090 Laptop (v6.92.6600)
9482 MB/s -6%
MSI Titan 18 HX A14VIG
Intel Core i9-14900HX, GeForce RTX 4090 Laptop GPU (v6.92.6600)
7229 MB/s -29%
Alienware m18 R2
Intel Core i9-14900HX, GeForce RTX 4090 Laptop GPU (v6.92.6600)
7095 MB/s -30%
Média da turma Gaming
  (2180 - 10115, n=105, últimos 2 anos)
6367 MB/s -37%
Razer Blade 18 2024 RZ09-0509
Intel Core i9-14900HX, GeForce RTX 4090 Laptop GPU (v6.85.6300)
6159 MB/s -39%
Acer Predator Helios 18 PH18-72-98MW
Intel Core i9-14900HX, GeForce RTX 4090 Laptop GPU (v6.92.6600)
5804 MB/s -43%
Schenker Key 17 Pro (M24)
Intel Core i9-14900HX, GeForce RTX 4090 Laptop GPU (v6.92.6600)
5598 MB/s -45%
AIDA64 / CPU Queen
MSI Titan 18 HX A14VIG
Intel Core i9-14900HX, GeForce RTX 4090 Laptop GPU (v6.92.6600)
148773 Points +5%
Asus ROG Strix Scar 18 G835LXG
Intel Core Ultra 9 290HX Plus, GeForce RTX 5090 Laptop (v6.92.6600)
141622 Points
Média Intel Core Ultra 9 290HX Plus
  (n=1)
141622 Points 0%
Asus Strix Scar 18 G835LX
Intel Core Ultra 9 275HX, GeForce RTX 5090 Laptop (v6.92.6600)
139608 Points -1%
Alienware m18 R2
Intel Core i9-14900HX, GeForce RTX 4090 Laptop GPU (v6.92.6600)
139323 Points -2%
Acer Predator Helios 18 PH18-72-98MW
Intel Core i9-14900HX, GeForce RTX 4090 Laptop GPU (v6.92.6600)
139146 Points -2%
Schenker Key 17 Pro (M24)
Intel Core i9-14900HX, GeForce RTX 4090 Laptop GPU (v6.92.6600)
138708 Points -2%
Razer Blade 18 2024 RZ09-0509
Intel Core i9-14900HX, GeForce RTX 4090 Laptop GPU (v6.85.6300)
136621 Points -4%
Média da turma Gaming
  (49785 - 173351, n=90, últimos 2 anos)
116544 Points -18%
AIDA64 / FPU SinJulia
MSI Titan 18 HX A14VIG
Intel Core i9-14900HX, GeForce RTX 4090 Laptop GPU (v6.92.6600)
18256 Points +23%
Alienware m18 R2
Intel Core i9-14900HX, GeForce RTX 4090 Laptop GPU (v6.92.6600)
16279 Points +9%
Razer Blade 18 2024 RZ09-0509
Intel Core i9-14900HX, GeForce RTX 4090 Laptop GPU (v6.85.6300)
15500 Points +4%
Acer Predator Helios 18 PH18-72-98MW
Intel Core i9-14900HX, GeForce RTX 4090 Laptop GPU (v6.92.6600)
15099 Points +2%
Asus ROG Strix Scar 18 G835LXG
Intel Core Ultra 9 290HX Plus, GeForce RTX 5090 Laptop (v8.20.8100)
14874 Points
Asus ROG Strix Scar 18 G835LXG
Intel Core Ultra 9 290HX Plus, GeForce RTX 5090 Laptop (v6.92.6600)
14857 Points 0%
Média da turma Gaming
  (4424 - 33636, n=105, últimos 2 anos)
14619 Points -2%
Média Intel Core Ultra 9 290HX Plus
  (13612 - 14874, n=6)
14247 Points -4%
Asus Strix Scar 18 G835LX
Intel Core Ultra 9 275HX, GeForce RTX 5090 Laptop (v6.92.6600)
14112 Points -5%
Schenker Key 17 Pro (M24)
Intel Core i9-14900HX, GeForce RTX 4090 Laptop GPU (v6.92.6600)
13903 Points -7%
AIDA64 / FPU Mandel
Asus ROG Strix Scar 18 G835LXG
Intel Core Ultra 9 290HX Plus, GeForce RTX 5090 Laptop (v6.92.6600)
115371 Points
Asus ROG Strix Scar 18 G835LXG
Intel Core Ultra 9 290HX Plus, GeForce RTX 5090 Laptop (v8.20.8100)
115355 Points 0%
Média Intel Core Ultra 9 290HX Plus
  (91215 - 115371, n=6)
107382 Points -7%
Asus Strix Scar 18 G835LX
Intel Core Ultra 9 275HX, GeForce RTX 5090 Laptop (v6.92.6600)
104057 Points -10%
Média da turma Gaming
  (25115 - 128721, n=105, últimos 2 anos)
73608 Points -36%
Alienware m18 R2
Intel Core i9-14900HX, GeForce RTX 4090 Laptop GPU (v6.92.6600)
72594 Points -37%
MSI Titan 18 HX A14VIG
Intel Core i9-14900HX, GeForce RTX 4090 Laptop GPU (v6.92.6600)
72355 Points -37%
Razer Blade 18 2024 RZ09-0509
Intel Core i9-14900HX, GeForce RTX 4090 Laptop GPU (v6.85.6300)
62867 Points -46%
Acer Predator Helios 18 PH18-72-98MW
Intel Core i9-14900HX, GeForce RTX 4090 Laptop GPU (v6.92.6600)
59005 Points -49%
Schenker Key 17 Pro (M24)
Intel Core i9-14900HX, GeForce RTX 4090 Laptop GPU (v6.92.6600)
54428 Points -53%
AIDA64 / CPU AES
Asus ROG Strix Scar 18 G835LXG
Intel Core Ultra 9 290HX Plus, GeForce RTX 5090 Laptop (v6.92.6600)
143205 MB/s
Asus ROG Strix Scar 18 G835LXG
Intel Core Ultra 9 290HX Plus, GeForce RTX 5090 Laptop (v8.20.8100)
143046 MB/s 0%
MSI Titan 18 HX A14VIG
Intel Core i9-14900HX, GeForce RTX 4090 Laptop GPU (v6.92.6600)
138830 MB/s -3%
Média Intel Core Ultra 9 290HX Plus
  (127585 - 143205, n=6)
136036 MB/s -5%
Asus Strix Scar 18 G835LX
Intel Core Ultra 9 275HX, GeForce RTX 5090 Laptop (v6.92.6600)
134920 MB/s -6%
Alienware m18 R2
Intel Core i9-14900HX, GeForce RTX 4090 Laptop GPU (v6.92.6600)
134675 MB/s -6%
Razer Blade 18 2024 RZ09-0509
Intel Core i9-14900HX, GeForce RTX 4090 Laptop GPU (v6.85.6300)
117887 MB/s -18%
Acer Predator Helios 18 PH18-72-98MW
Intel Core i9-14900HX, GeForce RTX 4090 Laptop GPU (v6.92.6600)
112197 MB/s -22%
Média da turma Gaming
  (39258 - 247074, n=105, últimos 2 anos)
108017 MB/s -25%
Schenker Key 17 Pro (M24)
Intel Core i9-14900HX, GeForce RTX 4090 Laptop GPU (v6.92.6600)
106371 MB/s -26%
AIDA64 / CPU ZLib
Asus ROG Strix Scar 18 G835LXG
Intel Core Ultra 9 290HX Plus, GeForce RTX 5090 Laptop (v6.92.6600)
2340 MB/s
Asus ROG Strix Scar 18 G835LXG
Intel Core Ultra 9 290HX Plus, GeForce RTX 5090 Laptop (v8.20.8100)
2334 MB/s 0%
Asus Strix Scar 18 G835LX
Intel Core Ultra 9 275HX, GeForce RTX 5090 Laptop (v6.92.6600)
2220 MB/s -5%
Média Intel Core Ultra 9 290HX Plus
  (1967 - 2340, n=6)
2202 MB/s -6%
MSI Titan 18 HX A14VIG
Intel Core i9-14900HX, GeForce RTX 4090 Laptop GPU (v6.92.6600)
2149 MB/s -8%
Alienware m18 R2
Intel Core i9-14900HX, GeForce RTX 4090 Laptop GPU (v6.92.6600)
2053 MB/s -12%
Razer Blade 18 2024 RZ09-0509
Intel Core i9-14900HX, GeForce RTX 4090 Laptop GPU (v6.85.6300)
1794 MB/s -23%
Acer Predator Helios 18 PH18-72-98MW
Intel Core i9-14900HX, GeForce RTX 4090 Laptop GPU (v6.92.6600)
1696 MB/s -28%
Schenker Key 17 Pro (M24)
Intel Core i9-14900HX, GeForce RTX 4090 Laptop GPU (v6.92.6600)
1691 MB/s -28%
Média da turma Gaming
  (574 - 2531, n=105, últimos 2 anos)
1569 MB/s -33%
AIDA64 / FP64 Ray-Trace
Asus ROG Strix Scar 18 G835LXG
Intel Core Ultra 9 290HX Plus, GeForce RTX 5090 Laptop (v6.92.6600)
23843 KRay/s
Asus ROG Strix Scar 18 G835LXG
Intel Core Ultra 9 290HX Plus, GeForce RTX 5090 Laptop (v8.20.8100)
23227 KRay/s -3%
Média Intel Core Ultra 9 290HX Plus
  (18611 - 23843, n=6)
21823 KRay/s -8%
Asus Strix Scar 18 G835LX
Intel Core Ultra 9 275HX, GeForce RTX 5090 Laptop (v6.92.6600)
21372 KRay/s -10%
Média da turma Gaming
  (5509 - 45446, n=105, últimos 2 anos)
17303 KRay/s -27%
Alienware m18 R2
Intel Core i9-14900HX, GeForce RTX 4090 Laptop GPU (v6.92.6600)
16128 KRay/s -32%
MSI Titan 18 HX A14VIG
Intel Core i9-14900HX, GeForce RTX 4090 Laptop GPU (v6.92.6600)
16104 KRay/s -32%
Razer Blade 18 2024 RZ09-0509
Intel Core i9-14900HX, GeForce RTX 4090 Laptop GPU (v6.85.6300)
13680 KRay/s -43%
Acer Predator Helios 18 PH18-72-98MW
Intel Core i9-14900HX, GeForce RTX 4090 Laptop GPU (v6.92.6600)
12565 KRay/s -47%
Schenker Key 17 Pro (M24)
Intel Core i9-14900HX, GeForce RTX 4090 Laptop GPU (v6.92.6600)
11838 KRay/s -50%
AIDA64 / CPU PhotoWorxx
Asus ROG Strix Scar 18 G835LXG
Intel Core Ultra 9 290HX Plus, GeForce RTX 5090 Laptop (v8.20.8100)
65272 MPixel/s
Asus ROG Strix Scar 18 G835LXG
Intel Core Ultra 9 290HX Plus, GeForce RTX 5090 Laptop (v6.92.6600)
62686 MPixel/s -4%
Média Intel Core Ultra 9 290HX Plus
  (51134 - 65272, n=6)
56956 MPixel/s -13%
Asus Strix Scar 18 G835LX
Intel Core Ultra 9 275HX, GeForce RTX 5090 Laptop (v6.92.6600)
56601 MPixel/s -13%
Schenker Key 17 Pro (M24)
Intel Core i9-14900HX, GeForce RTX 4090 Laptop GPU (v6.92.6600)
50465 MPixel/s -23%
Alienware m18 R2
Intel Core i9-14900HX, GeForce RTX 4090 Laptop GPU (v6.92.6600)
49716 MPixel/s -24%
Razer Blade 18 2024 RZ09-0509
Intel Core i9-14900HX, GeForce RTX 4090 Laptop GPU (v6.85.6300)
47472 MPixel/s -27%
Acer Predator Helios 18 PH18-72-98MW
Intel Core i9-14900HX, GeForce RTX 4090 Laptop GPU (v6.92.6600)
47343 MPixel/s -27%
Média da turma Gaming
  (12271 - 89891, n=105, últimos 2 anos)
44630 MPixel/s -32%
MSI Titan 18 HX A14VIG
Intel Core i9-14900HX, GeForce RTX 4090 Laptop GPU (v6.92.6600)
33960 MPixel/s -48%
AIDA64 / CPU CheckMate
Asus ROG Strix Scar 18 G835LXG
Intel Core Ultra 9 290HX Plus, GeForce RTX 5090 Laptop (v8.20.8100)
8765 MP/s
Média Intel Core Ultra 9 290HX Plus
  (7624 - 8765, n=5)
8207 MP/s -6%
Média da turma Gaming
  (2930 - 11788, n=14, últimos 2 anos)
6635 MP/s -24%

Desempenho do sistema e do armazenamento

O Asus ROG Strix SCAR 18 impressiona no uso diário com velocidades de sistema muito altas e tempos de carregamento curtos. Aplicativos e jogos são iniciados rapidamente, de modo que o notebook sempre parece extremamente ágil. A alternância entre os modos gráficos por meio do Nvidia Advanced Optimus causa um breve atraso ao iniciar alguns jogos; isso se deve a limitações técnicas e não causa quaisquer outras restrições durante a operação.

Performance rating: Percent
PCMark 10: Score | Essentials | Productivity | Digital Content Creation
CrossMark: Overall | Productivity | Creativity | Responsiveness
WebXPRT 3: Overall
WebXPRT 4: Overall
Mozilla Kraken 1.1: Total
Performance rating
Asus ROG Strix Scar 18 G835LXG
GeForce RTX 5090 Laptop, Ultra 9 290HX Plus, 2x Samsung PM9E1 MZVLC4T0HBL1 (RAID 0)
91.6 pt
Média Intel Core Ultra 9 290HX Plus, NVIDIA GeForce RTX 5090 Laptop
 
89.1 pt
Asus Strix Scar 18 G835LX
GeForce RTX 5090 Laptop, Ultra 9 275HX, WD PC SN8000S 2TB
79.4 pt
Alienware m18 R2
GeForce RTX 4090 Laptop GPU, i9-14900HX, SK Hynix PC811 HFS002TEM9X152N
77.2 pt
Razer Blade 18 2024 RZ09-0509 -1!
GeForce RTX 4090 Laptop GPU, i9-14900HX
74.1 pt
MSI Titan 18 HX A14VIG
GeForce RTX 4090 Laptop GPU, i9-14900HX, 2x Samsung PM9A1a MZVL22T0HDLB (RAID 0)
72.3 pt
Média da turma Gaming
 
72.1 pt
Schenker Key 17 Pro (M24) -4!
GeForce RTX 4090 Laptop GPU, i9-14900HX, Samsung 990 Pro 1 TB
63 pt
Acer Predator Helios 18 PH18-72-98MW -6!
GeForce RTX 4090 Laptop GPU, i9-14900HX, 2x SK Hynix HFS001TEJ9X115N (RAID 0)
56.2 pt
PCMark 10 / Score
Asus ROG Strix Scar 18 G835LXG
GeForce RTX 5090 Laptop, Ultra 9 290HX Plus, 2x Samsung PM9E1 MZVLC4T0HBL1 (RAID 0)
12414 Points
Média Intel Core Ultra 9 290HX Plus, NVIDIA GeForce RTX 5090 Laptop
  (11015 - 12414, n=3)
11720 Points -6%
Alienware m18 R2
GeForce RTX 4090 Laptop GPU, i9-14900HX, SK Hynix PC811 HFS002TEM9X152N
9234 Points -26%
MSI Titan 18 HX A14VIG
GeForce RTX 4090 Laptop GPU, i9-14900HX, 2x Samsung PM9A1a MZVL22T0HDLB (RAID 0)
8968 Points -28%
Razer Blade 18 2024 RZ09-0509
GeForce RTX 4090 Laptop GPU, i9-14900HX
8805 Points -29%
Asus Strix Scar 18 G835LX
GeForce RTX 5090 Laptop, Ultra 9 275HX, WD PC SN8000S 2TB
8623 Points -31%
Média da turma Gaming
  (5828 - 12414, n=93, últimos 2 anos)
8463 Points -32%
Schenker Key 17 Pro (M24)
GeForce RTX 4090 Laptop GPU, i9-14900HX, Samsung 990 Pro 1 TB
8277 Points -33%
Acer Predator Helios 18 PH18-72-98MW
GeForce RTX 4090 Laptop GPU, i9-14900HX, 2x SK Hynix HFS001TEJ9X115N (RAID 0)
8230 Points -34%
PCMark 10 / Essentials
MSI Titan 18 HX A14VIG
GeForce RTX 4090 Laptop GPU, i9-14900HX, 2x Samsung PM9A1a MZVL22T0HDLB (RAID 0)
11628 Points 0%
Asus ROG Strix Scar 18 G835LXG
GeForce RTX 5090 Laptop, Ultra 9 290HX Plus, 2x Samsung PM9E1 MZVLC4T0HBL1 (RAID 0)
11604 Points
Média Intel Core Ultra 9 290HX Plus, NVIDIA GeForce RTX 5090 Laptop
  (11316 - 11604, n=3)
11468 Points -1%
Alienware m18 R2
GeForce RTX 4090 Laptop GPU, i9-14900HX, SK Hynix PC811 HFS002TEM9X152N
11415 Points -2%
Razer Blade 18 2024 RZ09-0509
GeForce RTX 4090 Laptop GPU, i9-14900HX
11378 Points -2%
Acer Predator Helios 18 PH18-72-98MW
GeForce RTX 4090 Laptop GPU, i9-14900HX, 2x SK Hynix HFS001TEJ9X115N (RAID 0)
11032 Points -5%
Asus Strix Scar 18 G835LX
GeForce RTX 5090 Laptop, Ultra 9 275HX, WD PC SN8000S 2TB
10966 Points -5%
Schenker Key 17 Pro (M24)
GeForce RTX 4090 Laptop GPU, i9-14900HX, Samsung 990 Pro 1 TB
10778 Points -7%
Média da turma Gaming
  (8810 - 11935, n=97, últimos 2 anos)
10660 Points -8%
PCMark 10 / Productivity
Asus ROG Strix Scar 18 G835LXG
GeForce RTX 5090 Laptop, Ultra 9 290HX Plus, 2x Samsung PM9E1 MZVLC4T0HBL1 (RAID 0)
25323 Points
Média Intel Core Ultra 9 290HX Plus, NVIDIA GeForce RTX 5090 Laptop
  (16305 - 25323, n=3)
20246 Points -20%
Alienware m18 R2
GeForce RTX 4090 Laptop GPU, i9-14900HX, SK Hynix PC811 HFS002TEM9X152N
11415 Points -55%
Média da turma Gaming
  (6845 - 25323, n=95, últimos 2 anos)
11222 Points -56%
MSI Titan 18 HX A14VIG
GeForce RTX 4090 Laptop GPU, i9-14900HX, 2x Samsung PM9A1a MZVL22T0HDLB (RAID 0)
10225 Points -60%
Razer Blade 18 2024 RZ09-0509
GeForce RTX 4090 Laptop GPU, i9-14900HX
10186 Points -60%
Acer Predator Helios 18 PH18-72-98MW
GeForce RTX 4090 Laptop GPU, i9-14900HX, 2x SK Hynix HFS001TEJ9X115N (RAID 0)
9951 Points -61%
Schenker Key 17 Pro (M24)
GeForce RTX 4090 Laptop GPU, i9-14900HX, Samsung 990 Pro 1 TB
9458 Points -63%
Asus Strix Scar 18 G835LX
GeForce RTX 5090 Laptop, Ultra 9 275HX, WD PC SN8000S 2TB
9444 Points -63%
PCMark 10 / Digital Content Creation
Média Intel Core Ultra 9 290HX Plus, NVIDIA GeForce RTX 5090 Laptop
  (17665 - 19954, n=3)
19092 Points +8%
Asus ROG Strix Scar 18 G835LXG
GeForce RTX 5090 Laptop, Ultra 9 290HX Plus, 2x Samsung PM9E1 MZVLC4T0HBL1 (RAID 0)
17665 Points
Asus Strix Scar 18 G835LX
GeForce RTX 5090 Laptop, Ultra 9 275HX, WD PC SN8000S 2TB
16802 Points -5%
MSI Titan 18 HX A14VIG
GeForce RTX 4090 Laptop GPU, i9-14900HX, 2x Samsung PM9A1a MZVL22T0HDLB (RAID 0)
16462 Points -7%
Alienware m18 R2
GeForce RTX 4090 Laptop GPU, i9-14900HX, SK Hynix PC811 HFS002TEM9X152N
16398 Points -7%
Razer Blade 18 2024 RZ09-0509
GeForce RTX 4090 Laptop GPU, i9-14900HX
15985 Points -10%
Schenker Key 17 Pro (M24)
GeForce RTX 4090 Laptop GPU, i9-14900HX, Samsung 990 Pro 1 TB
15093 Points -15%
Média da turma Gaming
  (7602 - 19954, n=95, últimos 2 anos)
14060 Points -20%
Acer Predator Helios 18 PH18-72-98MW
GeForce RTX 4090 Laptop GPU, i9-14900HX, 2x SK Hynix HFS001TEJ9X115N (RAID 0)
13779 Points -22%
CrossMark / Overall
Asus ROG Strix Scar 18 G835LXG
GeForce RTX 5090 Laptop, Ultra 9 290HX Plus, 2x Samsung PM9E1 MZVLC4T0HBL1 (RAID 0)
2345 Points
Média Intel Core Ultra 9 290HX Plus, NVIDIA GeForce RTX 5090 Laptop
  (2177 - 2401, n=3)
2308 Points -2%
Asus Strix Scar 18 G835LX
GeForce RTX 5090 Laptop, Ultra 9 275HX, WD PC SN8000S 2TB
2221 Points -5%
Alienware m18 R2
GeForce RTX 4090 Laptop GPU, i9-14900HX, SK Hynix PC811 HFS002TEM9X152N
2073 Points -12%
Razer Blade 18 2024 RZ09-0509
GeForce RTX 4090 Laptop GPU, i9-14900HX
2048 Points -13%
Média da turma Gaming
  (1366 - 2409, n=94, últimos 2 anos)
1986 Points -15%
MSI Titan 18 HX A14VIG
GeForce RTX 4090 Laptop GPU, i9-14900HX, 2x Samsung PM9A1a MZVL22T0HDLB (RAID 0)
1877 Points -20%
CrossMark / Productivity
Asus ROG Strix Scar 18 G835LXG
GeForce RTX 5090 Laptop, Ultra 9 290HX Plus, 2x Samsung PM9E1 MZVLC4T0HBL1 (RAID 0)
2110 Points
Média Intel Core Ultra 9 290HX Plus, NVIDIA GeForce RTX 5090 Laptop
  (1994 - 2213, n=3)
2106 Points 0%
Asus Strix Scar 18 G835LX
GeForce RTX 5090 Laptop, Ultra 9 275HX, WD PC SN8000S 2TB
2025 Points -4%
Razer Blade 18 2024 RZ09-0509
GeForce RTX 4090 Laptop GPU, i9-14900HX
1902 Points -10%
Alienware m18 R2
GeForce RTX 4090 Laptop GPU, i9-14900HX, SK Hynix PC811 HFS002TEM9X152N
1881 Points -11%
Média da turma Gaming
  (1386 - 2254, n=94, últimos 2 anos)
1856 Points -12%
MSI Titan 18 HX A14VIG
GeForce RTX 4090 Laptop GPU, i9-14900HX, 2x Samsung PM9A1a MZVL22T0HDLB (RAID 0)
1738 Points -18%
CrossMark / Creativity
Asus ROG Strix Scar 18 G835LXG
GeForce RTX 5090 Laptop, Ultra 9 290HX Plus, 2x Samsung PM9E1 MZVLC4T0HBL1 (RAID 0)
2786 Points
Média Intel Core Ultra 9 290HX Plus, NVIDIA GeForce RTX 5090 Laptop
  (2548 - 2786, n=3)
2665 Points -4%
Asus Strix Scar 18 G835LX
GeForce RTX 5090 Laptop, Ultra 9 275HX, WD PC SN8000S 2TB
2606 Points -6%
Alienware m18 R2
GeForce RTX 4090 Laptop GPU, i9-14900HX, SK Hynix PC811 HFS002TEM9X152N
2393 Points -14%
Razer Blade 18 2024 RZ09-0509
GeForce RTX 4090 Laptop GPU, i9-14900HX
2316 Points -17%
Média da turma Gaming
  (1343 - 2786, n=94, últimos 2 anos)
2241 Points -20%
MSI Titan 18 HX A14VIG
GeForce RTX 4090 Laptop GPU, i9-14900HX, 2x Samsung PM9A1a MZVL22T0HDLB (RAID 0)
2195 Points -21%
CrossMark / Responsiveness
Média Intel Core Ultra 9 290HX Plus, NVIDIA GeForce RTX 5090 Laptop
  (1766 - 2249, n=3)
1979 Points +3%
Asus ROG Strix Scar 18 G835LXG
GeForce RTX 5090 Laptop, Ultra 9 290HX Plus, 2x Samsung PM9E1 MZVLC4T0HBL1 (RAID 0)
1922 Points
Asus Strix Scar 18 G835LX
GeForce RTX 5090 Laptop, Ultra 9 275HX, WD PC SN8000S 2TB
1813 Points -6%
Alienware m18 R2
GeForce RTX 4090 Laptop GPU, i9-14900HX, SK Hynix PC811 HFS002TEM9X152N
1806 Points -6%
Razer Blade 18 2024 RZ09-0509
GeForce RTX 4090 Laptop GPU, i9-14900HX
1765 Points -8%
Média da turma Gaming
  (1226 - 2334, n=94, últimos 2 anos)
1705 Points -11%
MSI Titan 18 HX A14VIG
GeForce RTX 4090 Laptop GPU, i9-14900HX, 2x Samsung PM9A1a MZVL22T0HDLB (RAID 0)
1478 Points -23%
WebXPRT 3 / Overall
Asus ROG Strix Scar 18 G835LXG
GeForce RTX 5090 Laptop, Ultra 9 290HX Plus, 2x Samsung PM9E1 MZVLC4T0HBL1 (RAID 0)
369 Points
Média Intel Core Ultra 9 290HX Plus, NVIDIA GeForce RTX 5090 Laptop
  (354 - 369, n=3)
361 Points -2%
Asus Strix Scar 18 G835LX
GeForce RTX 5090 Laptop, Ultra 9 275HX, WD PC SN8000S 2TB
346 Points -6%
Razer Blade 18 2024 RZ09-0509
GeForce RTX 4090 Laptop GPU, i9-14900HX
339 Points -8%
MSI Titan 18 HX A14VIG
GeForce RTX 4090 Laptop GPU, i9-14900HX, 2x Samsung PM9A1a MZVL22T0HDLB (RAID 0)
327 Points -11%
Alienware m18 R2
GeForce RTX 4090 Laptop GPU, i9-14900HX, SK Hynix PC811 HFS002TEM9X152N
326 Points -12%
Média da turma Gaming
  (220 - 532, n=98, últimos 2 anos)
318 Points -14%
Schenker Key 17 Pro (M24)
GeForce RTX 4090 Laptop GPU, i9-14900HX, Samsung 990 Pro 1 TB
308 Points -17%
WebXPRT 4 / Overall
Asus ROG Strix Scar 18 G835LXG
GeForce RTX 5090 Laptop, Ultra 9 290HX Plus, 2x Samsung PM9E1 MZVLC4T0HBL1 (RAID 0)
336 Points
Asus Strix Scar 18 G835LX
GeForce RTX 5090 Laptop, Ultra 9 275HX, WD PC SN8000S 2TB
335 Points 0%
Média Intel Core Ultra 9 290HX Plus, NVIDIA GeForce RTX 5090 Laptop
  (310 - 336, n=3)
327 Points -3%
Alienware m18 R2
GeForce RTX 4090 Laptop GPU, i9-14900HX, SK Hynix PC811 HFS002TEM9X152N
309 Points -8%
MSI Titan 18 HX A14VIG
GeForce RTX 4090 Laptop GPU, i9-14900HX, 2x Samsung PM9A1a MZVL22T0HDLB (RAID 0)
287 Points -15%
Média da turma Gaming
  (165 - 354, n=98, últimos 2 anos)
285 Points -15%
Schenker Key 17 Pro (M24)
GeForce RTX 4090 Laptop GPU, i9-14900HX, Samsung 990 Pro 1 TB
275 Points -18%
Mozilla Kraken 1.1 / Total
Schenker Key 17 Pro (M24)
GeForce RTX 4090 Laptop GPU, i9-14900HX, Samsung 990 Pro 1 TB
481 ms * -22%
Média da turma Gaming
  (391 - 590, n=100, últimos 2 anos)
459 ms * -17%
MSI Titan 18 HX A14VIG
GeForce RTX 4090 Laptop GPU, i9-14900HX, 2x Samsung PM9A1a MZVL22T0HDLB (RAID 0)
452 ms * -15%
Razer Blade 18 2024 RZ09-0509
GeForce RTX 4090 Laptop GPU, i9-14900HX
449 ms * -14%
Acer Predator Helios 18 PH18-72-98MW
GeForce RTX 4090 Laptop GPU, i9-14900HX, 2x SK Hynix HFS001TEJ9X115N (RAID 0)
441 ms * -12%
Alienware m18 R2
GeForce RTX 4090 Laptop GPU, i9-14900HX, SK Hynix PC811 HFS002TEM9X152N
430 ms * -9%
Asus Strix Scar 18 G835LX
GeForce RTX 5090 Laptop, Ultra 9 275HX, WD PC SN8000S 2TB
409 ms * -4%
Média Intel Core Ultra 9 290HX Plus, NVIDIA GeForce RTX 5090 Laptop
  (393 - 399, n=3)
395 ms * -1%
Asus ROG Strix Scar 18 G835LXG
GeForce RTX 5090 Laptop, Ultra 9 290HX Plus, 2x Samsung PM9E1 MZVLC4T0HBL1 (RAID 0)
393 ms *

* ... menor é melhor

PCMark 10 Score
12414 pontos
Ajuda
AIDA64 / Memory Copy
Asus ROG Strix Scar 18 G835LXG
Intel Core Ultra 9 290HX Plus, GeForce RTX 5090 Laptop (v8.20.8100)
93930 MB/s
Asus ROG Strix Scar 18 G835LXG
Intel Core Ultra 9 290HX Plus, GeForce RTX 5090 Laptop (v6.92.6600)
93592 MB/s 0%
Média Intel Core Ultra 9 290HX Plus
  (76912 - 93930, n=6)
85886 MB/s -9%
Asus Strix Scar 18 G835LX
Intel Core Ultra 9 275HX, GeForce RTX 5090 Laptop (v6.92.6600)
84432 MB/s -10%
Alienware m18 R2
Intel Core i9-14900HX, GeForce RTX 4090 Laptop GPU (v6.92.6600)
79243 MB/s -16%
Schenker Key 17 Pro (M24)
Intel Core i9-14900HX, GeForce RTX 4090 Laptop GPU (v6.92.6600)
78820 MB/s -16%
Acer Predator Helios 18 PH18-72-98MW
Intel Core i9-14900HX, GeForce RTX 4090 Laptop GPU (v6.92.6600)
78016 MB/s -17%
Razer Blade 18 2024 RZ09-0509
Intel Core i9-14900HX, GeForce RTX 4090 Laptop GPU (v6.85.6300)
76268 MB/s -19%
Média da turma Gaming
  (21750 - 129946, n=105, últimos 2 anos)
72521 MB/s -23%
MSI Titan 18 HX A14VIG
Intel Core i9-14900HX, GeForce RTX 4090 Laptop GPU (v6.92.6600)
56992 MB/s -39%
AIDA64 / Memory Read
Asus ROG Strix Scar 18 G835LXG
Intel Core Ultra 9 290HX Plus, GeForce RTX 5090 Laptop (v8.20.8100)
98574 MB/s
Asus ROG Strix Scar 18 G835LXG
Intel Core Ultra 9 290HX Plus, GeForce RTX 5090 Laptop (v6.92.6600)
98471 MB/s 0%
Média Intel Core Ultra 9 290HX Plus
  (84638 - 98574, n=6)
92870 MB/s -6%
Asus Strix Scar 18 G835LX
Intel Core Ultra 9 275HX, GeForce RTX 5090 Laptop (v6.92.6600)
86194 MB/s -13%
Alienware m18 R2
Intel Core i9-14900HX, GeForce RTX 4090 Laptop GPU (v6.92.6600)
85791 MB/s -13%
Schenker Key 17 Pro (M24)
Intel Core i9-14900HX, GeForce RTX 4090 Laptop GPU (v6.92.6600)
85763 MB/s -13%
Acer Predator Helios 18 PH18-72-98MW
Intel Core i9-14900HX, GeForce RTX 4090 Laptop GPU (v6.92.6600)
85323 MB/s -13%
Razer Blade 18 2024 RZ09-0509
Intel Core i9-14900HX, GeForce RTX 4090 Laptop GPU (v6.85.6300)
82992 MB/s -16%
Média da turma Gaming
  (22956 - 118858, n=105, últimos 2 anos)
74162 MB/s -25%
MSI Titan 18 HX A14VIG
Intel Core i9-14900HX, GeForce RTX 4090 Laptop GPU (v6.92.6600)
54443 MB/s -45%
AIDA64 / Memory Write
Asus ROG Strix Scar 18 G835LXG
Intel Core Ultra 9 290HX Plus, GeForce RTX 5090 Laptop (v6.92.6600)
100988 MB/s
Asus ROG Strix Scar 18 G835LXG
Intel Core Ultra 9 290HX Plus, GeForce RTX 5090 Laptop (v8.20.8100)
89856 MB/s -11%
Média Intel Core Ultra 9 290HX Plus
  (76094 - 100988, n=6)
85213 MB/s -16%
Asus Strix Scar 18 G835LX
Intel Core Ultra 9 275HX, GeForce RTX 5090 Laptop (v6.92.6600)
82198 MB/s -19%
Schenker Key 17 Pro (M24)
Intel Core i9-14900HX, GeForce RTX 4090 Laptop GPU (v6.92.6600)
77439 MB/s -23%
Alienware m18 R2
Intel Core i9-14900HX, GeForce RTX 4090 Laptop GPU (v6.92.6600)
77089 MB/s -24%
Média da turma Gaming
  (22297 - 135096, n=105, últimos 2 anos)
76303 MB/s -24%
Acer Predator Helios 18 PH18-72-98MW
Intel Core i9-14900HX, GeForce RTX 4090 Laptop GPU (v6.92.6600)
70089 MB/s -31%
Razer Blade 18 2024 RZ09-0509
Intel Core i9-14900HX, GeForce RTX 4090 Laptop GPU (v6.85.6300)
67801 MB/s -33%
MSI Titan 18 HX A14VIG
Intel Core i9-14900HX, GeForce RTX 4090 Laptop GPU (v6.92.6600)
51387 MB/s -49%
AIDA64 / Memory Latency
Asus Strix Scar 18 G835LX
Intel Core Ultra 9 275HX, GeForce RTX 5090 Laptop (v6.92.6600)
108.9 ns * -4%
Média da turma Gaming
  (75.3 - 259, n=105, últimos 2 anos)
107 ns * -2%
Asus ROG Strix Scar 18 G835LXG
Intel Core Ultra 9 290HX Plus, GeForce RTX 5090 Laptop (v6.92.6600)
105.2 ns *
Asus ROG Strix Scar 18 G835LXG
Intel Core Ultra 9 290HX Plus, GeForce RTX 5090 Laptop (v8.20.8100)
104.8 ns * -0%
MSI Titan 18 HX A14VIG
Intel Core i9-14900HX, GeForce RTX 4090 Laptop GPU (v6.92.6600)
105 ns * -0%
Média Intel Core Ultra 9 290HX Plus
  (100.7 - 108.4, n=6)
105 ns * -0%
Razer Blade 18 2024 RZ09-0509
Intel Core i9-14900HX, GeForce RTX 4090 Laptop GPU (v6.85.6300)
87.6 ns * +17%
Alienware m18 R2
Intel Core i9-14900HX, GeForce RTX 4090 Laptop GPU (v6.92.6600)
86.4 ns * +18%
Schenker Key 17 Pro (M24)
Intel Core i9-14900HX, GeForce RTX 4090 Laptop GPU (v6.92.6600)
84.5 ns * +20%
Acer Predator Helios 18 PH18-72-98MW
Intel Core i9-14900HX, GeForce RTX 4090 Laptop GPU (v6.92.6600)
83 ns * +21%

* ... menor é melhor

Latências de DPC

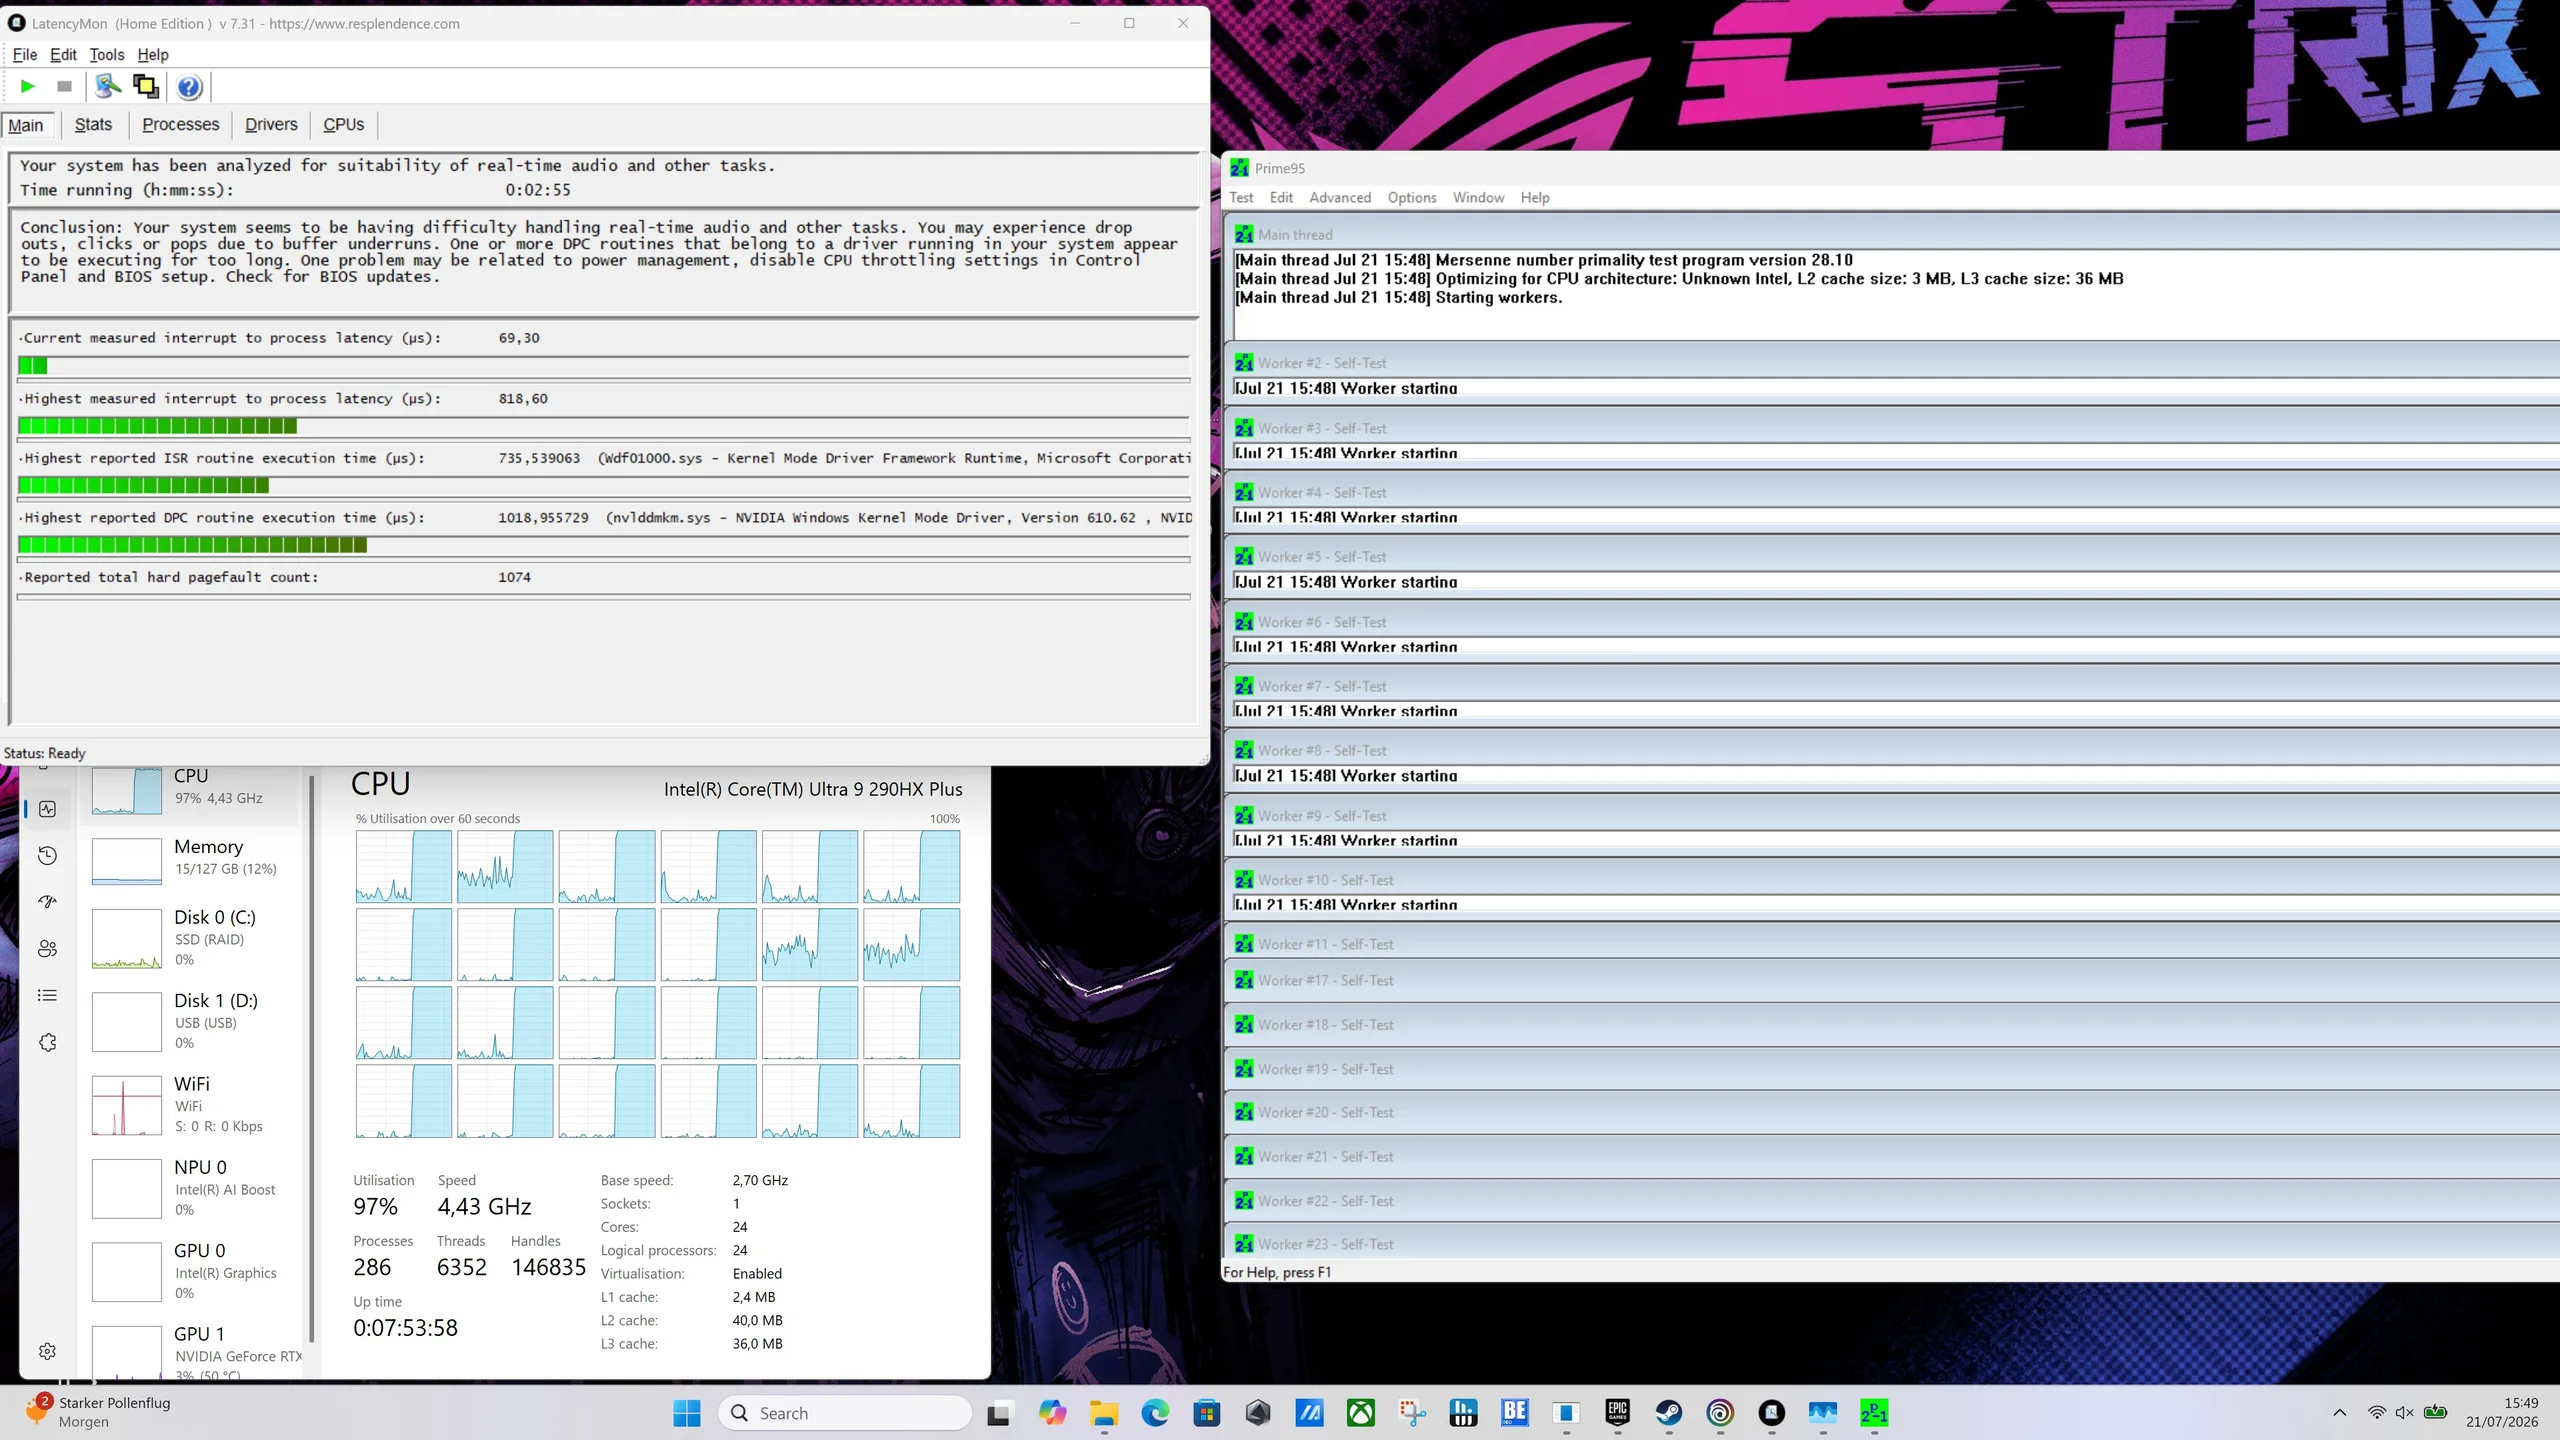
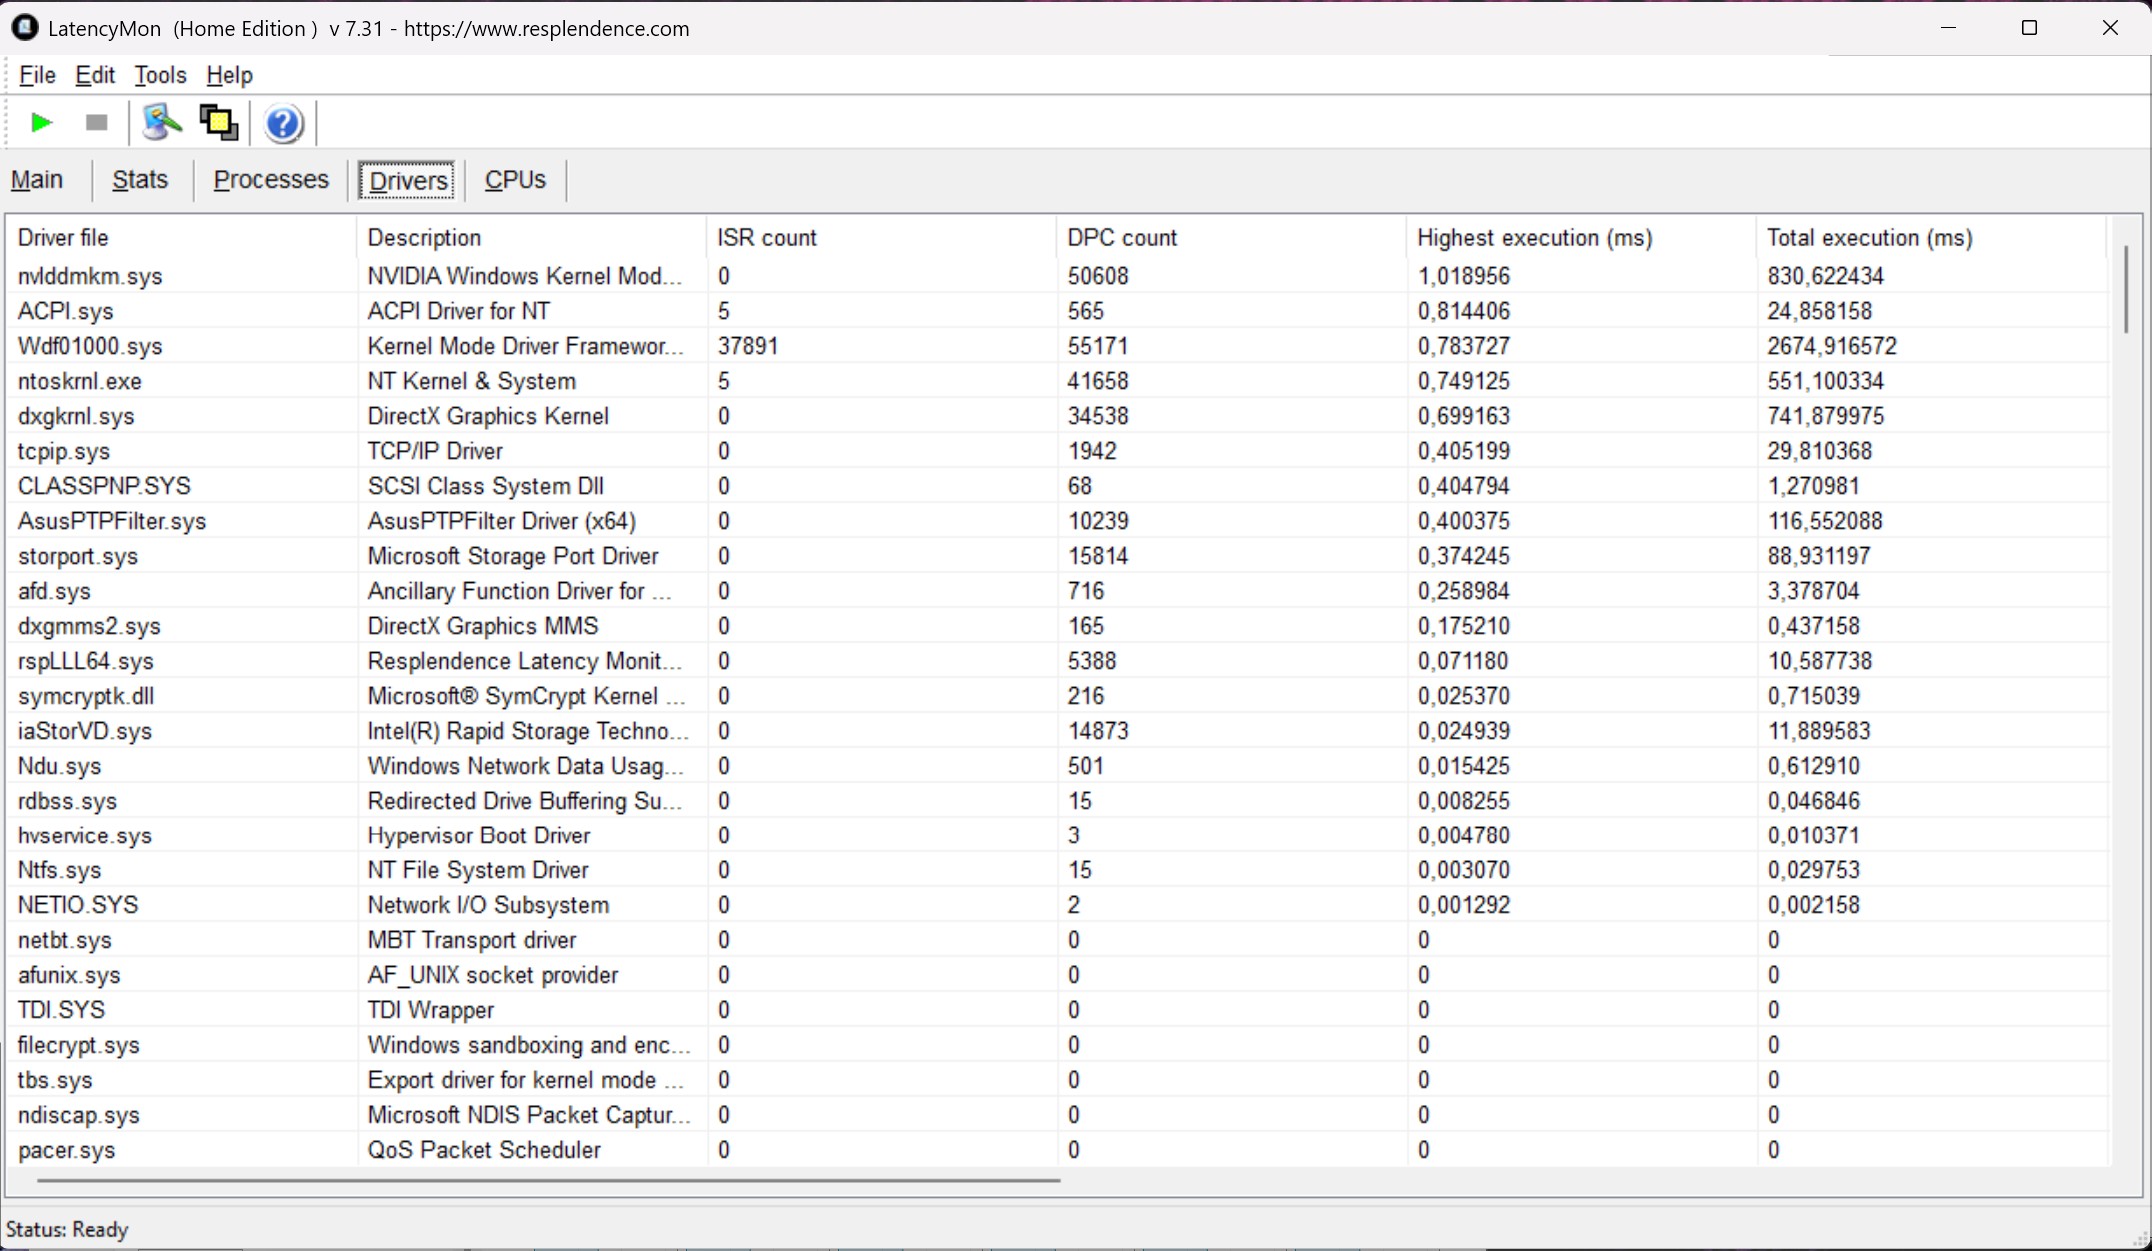
No teste padronizado do LatencyMon (navegação na web, reprodução de vídeos em 4K no YouTube e carga da CPU), o Asus ROG Strix SCAR 18 G835LXG apresenta um bom desempenho geral. Apenas o driver gráfico da NVIDIA (nvlddmkm.sys) causa aumento na latência durante a reprodução de vídeos.
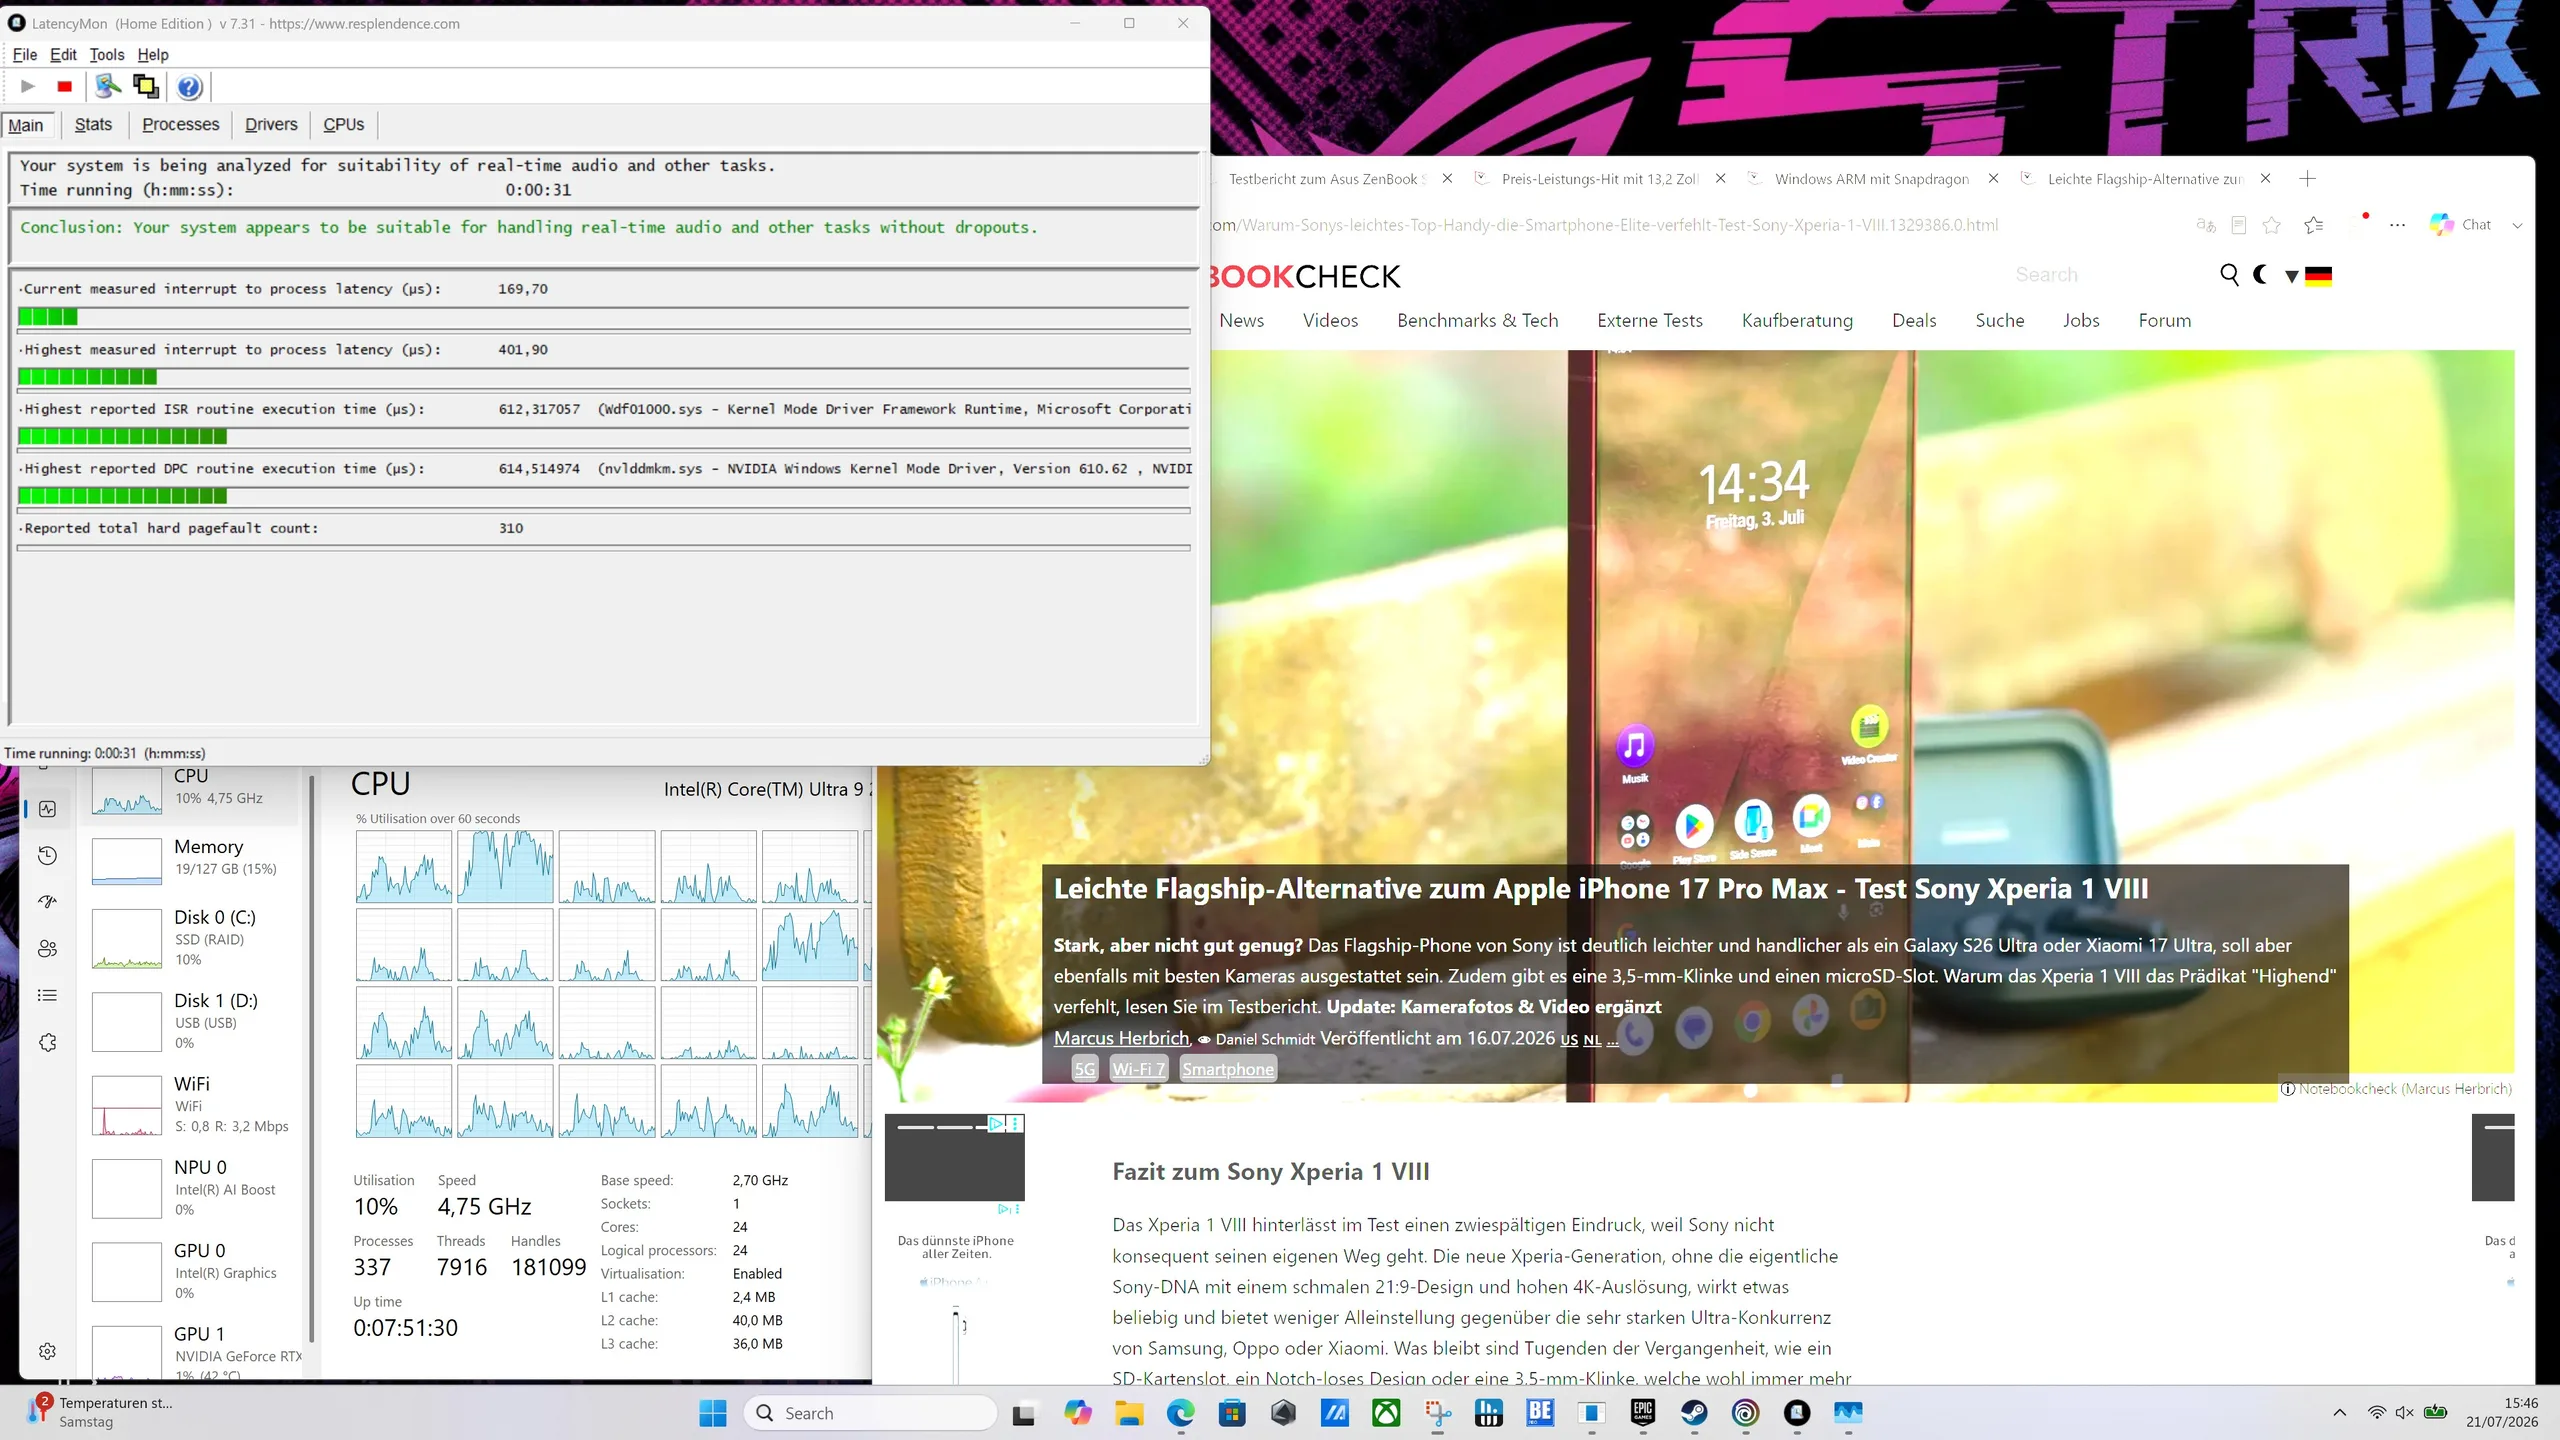
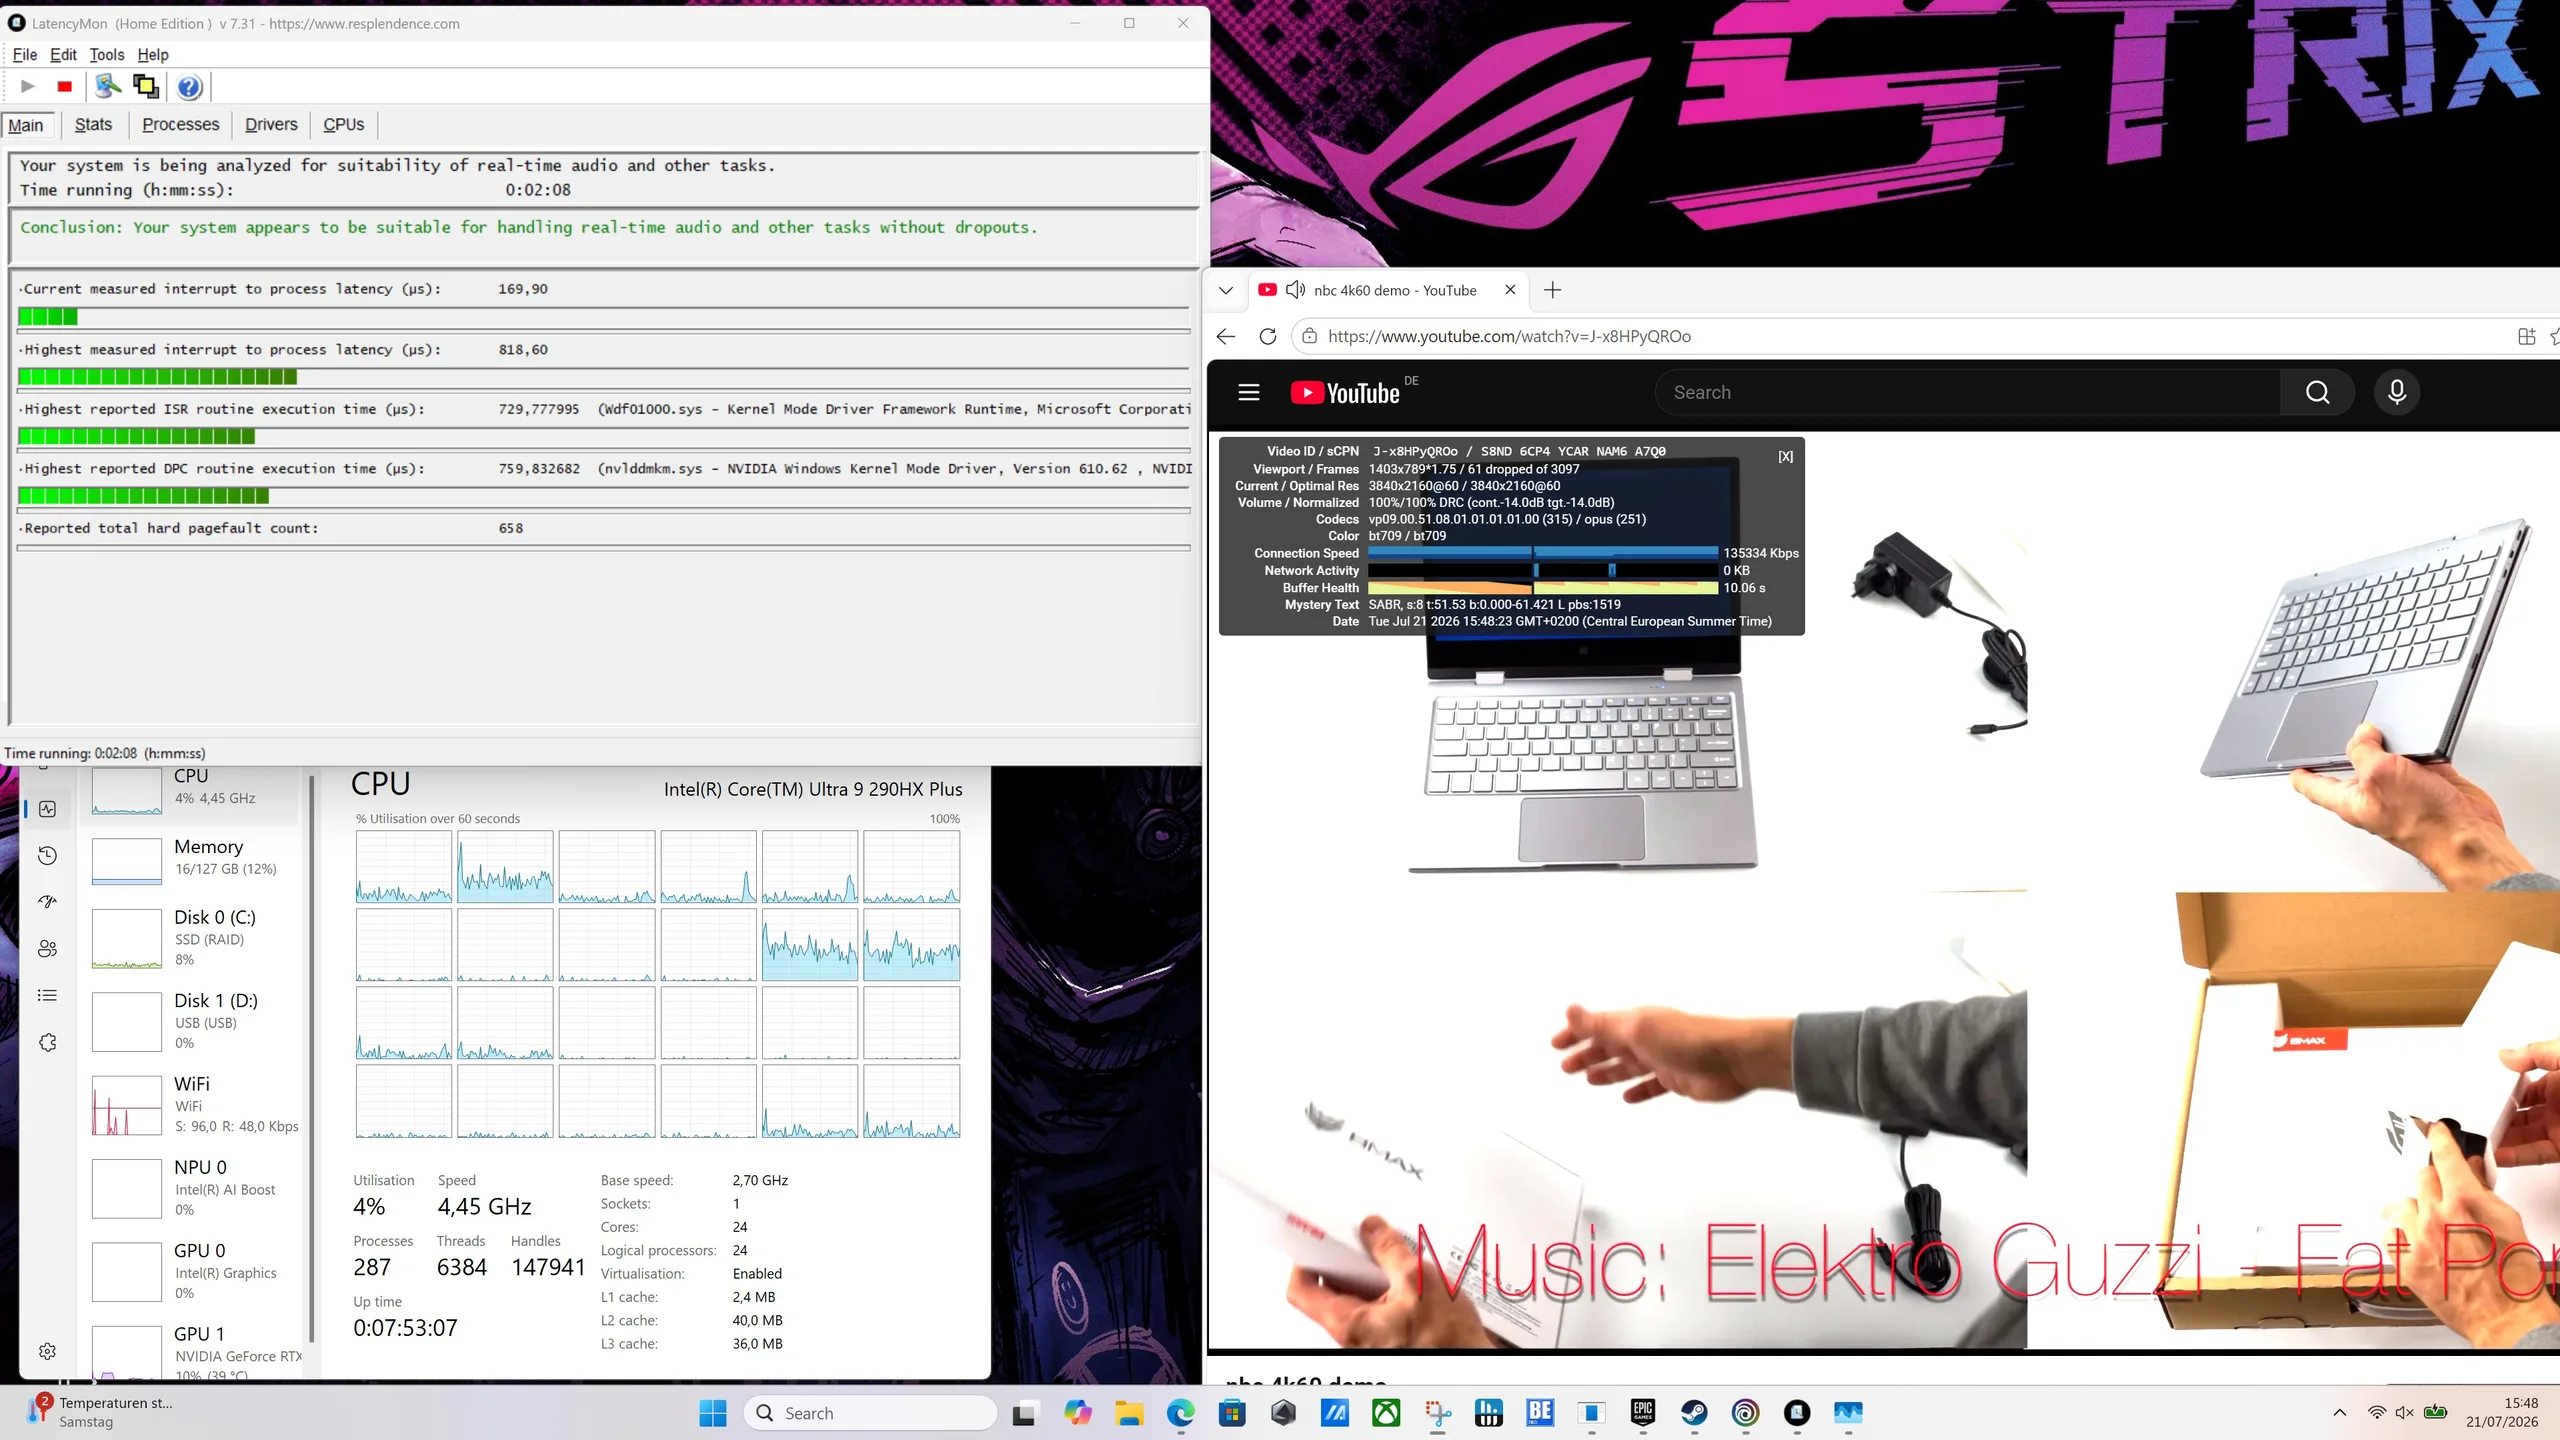
Latência máxima ao abrir várias abas no navegador
Latência máxima durante a reprodução de vídeos em 4K
Latência máxima após dez segundos do Prime95
Drivers classificados pelo maior tempo de execução
DPC Latencies / LatencyMon - interrupt to process latency (max), Web, Youtube, Prime95
Acer Predator Helios 18 PH18-72-98MW
GeForce RTX 4090 Laptop GPU, i9-14900HX, 2x SK Hynix HFS001TEJ9X115N (RAID 0)
3388 μs * -233%
Alienware m18 R2
GeForce RTX 4090 Laptop GPU, i9-14900HX, SK Hynix PC811 HFS002TEM9X152N
2815.1 μs * -177%
Média da turma Gaming
  (410 - 11799, n=93, últimos 2 anos)
2500 μs * -146%
MSI Titan 18 HX A14VIG
GeForce RTX 4090 Laptop GPU, i9-14900HX, 2x Samsung PM9A1a MZVL22T0HDLB (RAID 0)
2384.5 μs * -134%
Schenker Key 17 Pro (M24)
GeForce RTX 4090 Laptop GPU, i9-14900HX, Samsung 990 Pro 1 TB
1955.8 μs * -92%
Razer Blade 18 2024 RZ09-0509
GeForce RTX 4090 Laptop GPU, i9-14900HX
1479.7 μs * -45%
Asus ROG Strix Scar 18 G835LXG
GeForce RTX 5090 Laptop, Ultra 9 290HX Plus, 2x Samsung PM9E1 MZVLC4T0HBL1 (RAID 0)
1018 μs *
Asus Strix Scar 18 G835LX
GeForce RTX 5090 Laptop, Ultra 9 275HX, WD PC SN8000S 2TB
810 μs * +20%

* ... menor é melhor

Dispositivos de armazenamento

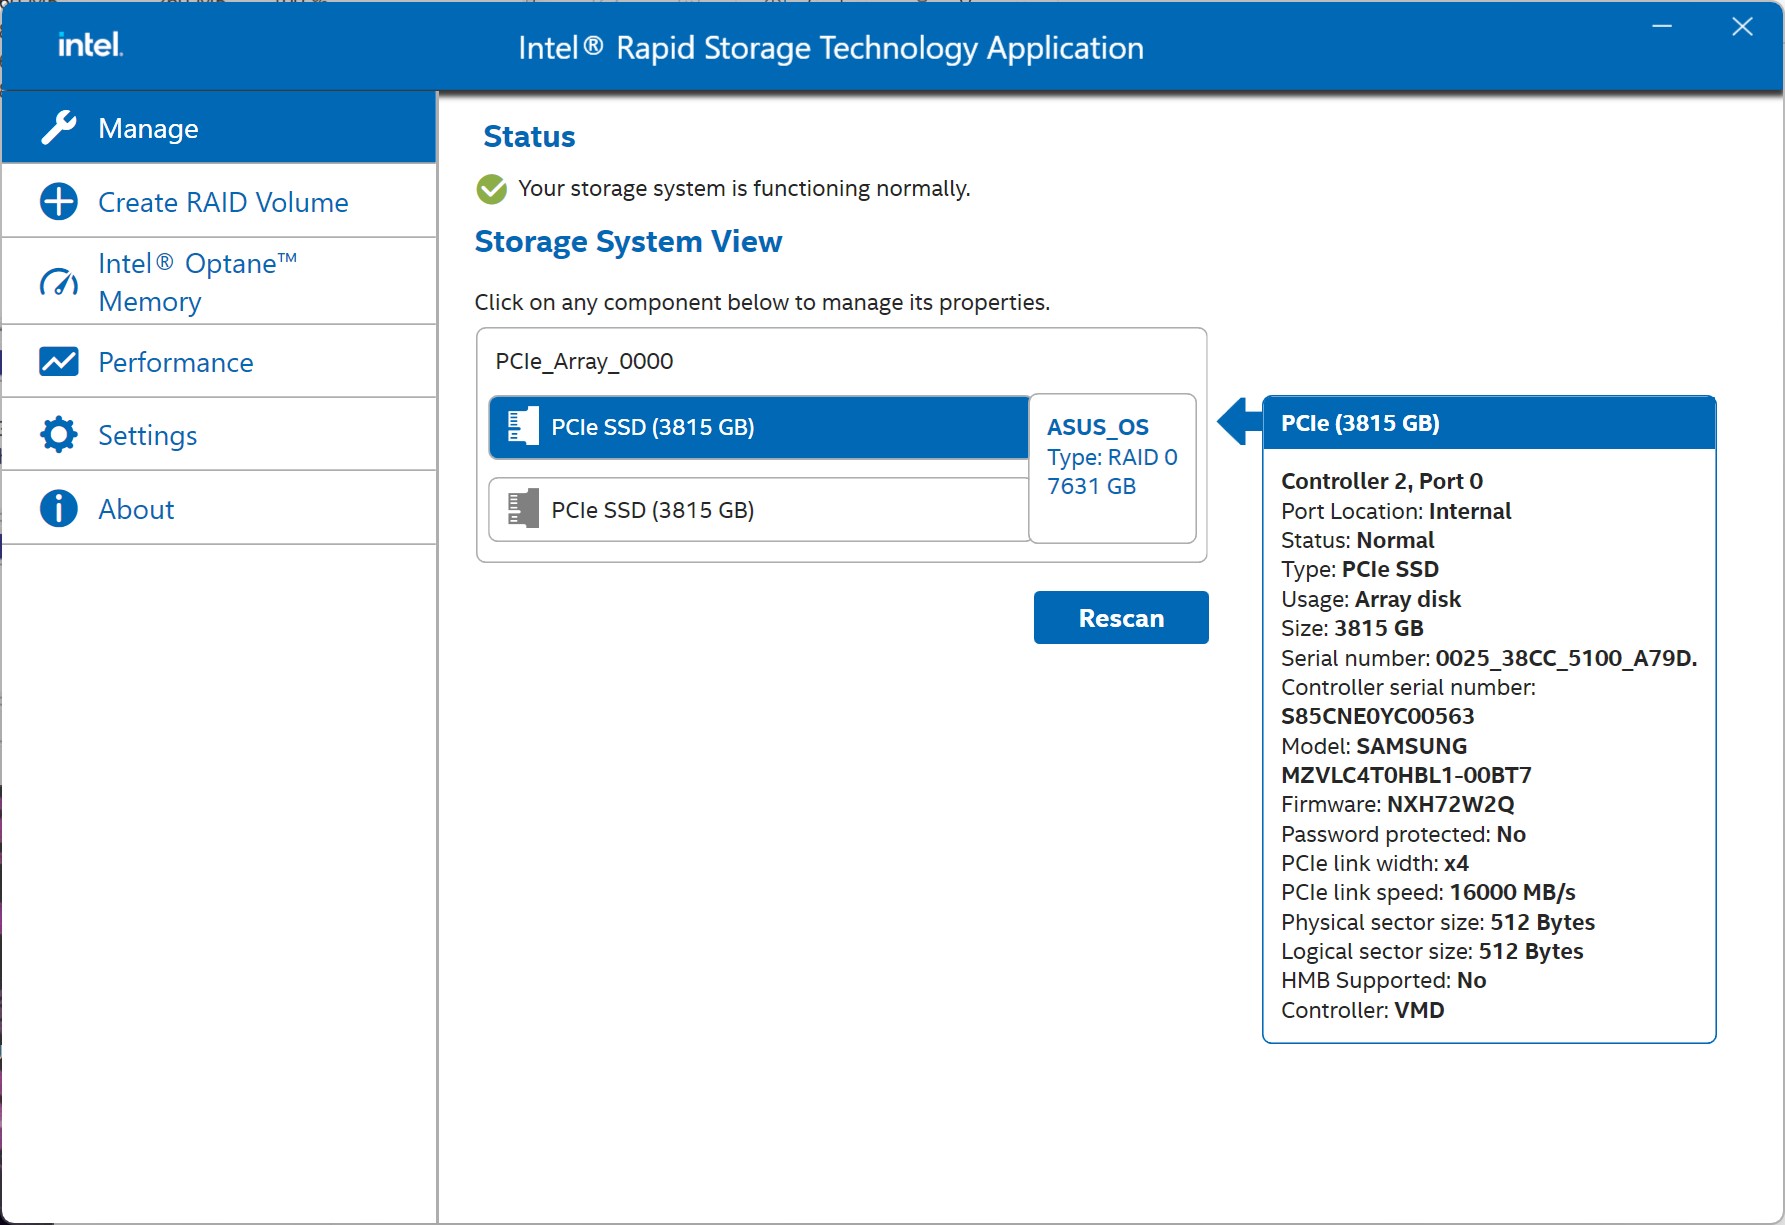
Nossa configuração de teste está equipada com dois SSDs PCIe 5.0 de 4 TB (Samsung PM9E1), proporcionando um total de 8 TB de armazenamento em massa de alta velocidade. As unidades impressionam com taxas de transferência muito altas e tempos de acesso curtos, permitindo que programas, jogos e arquivos grandes sejam carregados com especial rapidez. Sob carga sustentada, no entanto, o desempenho diminui após algum tempo; portanto, é de se esperar perdas perceptíveis de desempenho durante processos mais longos de cópia ou instalação.
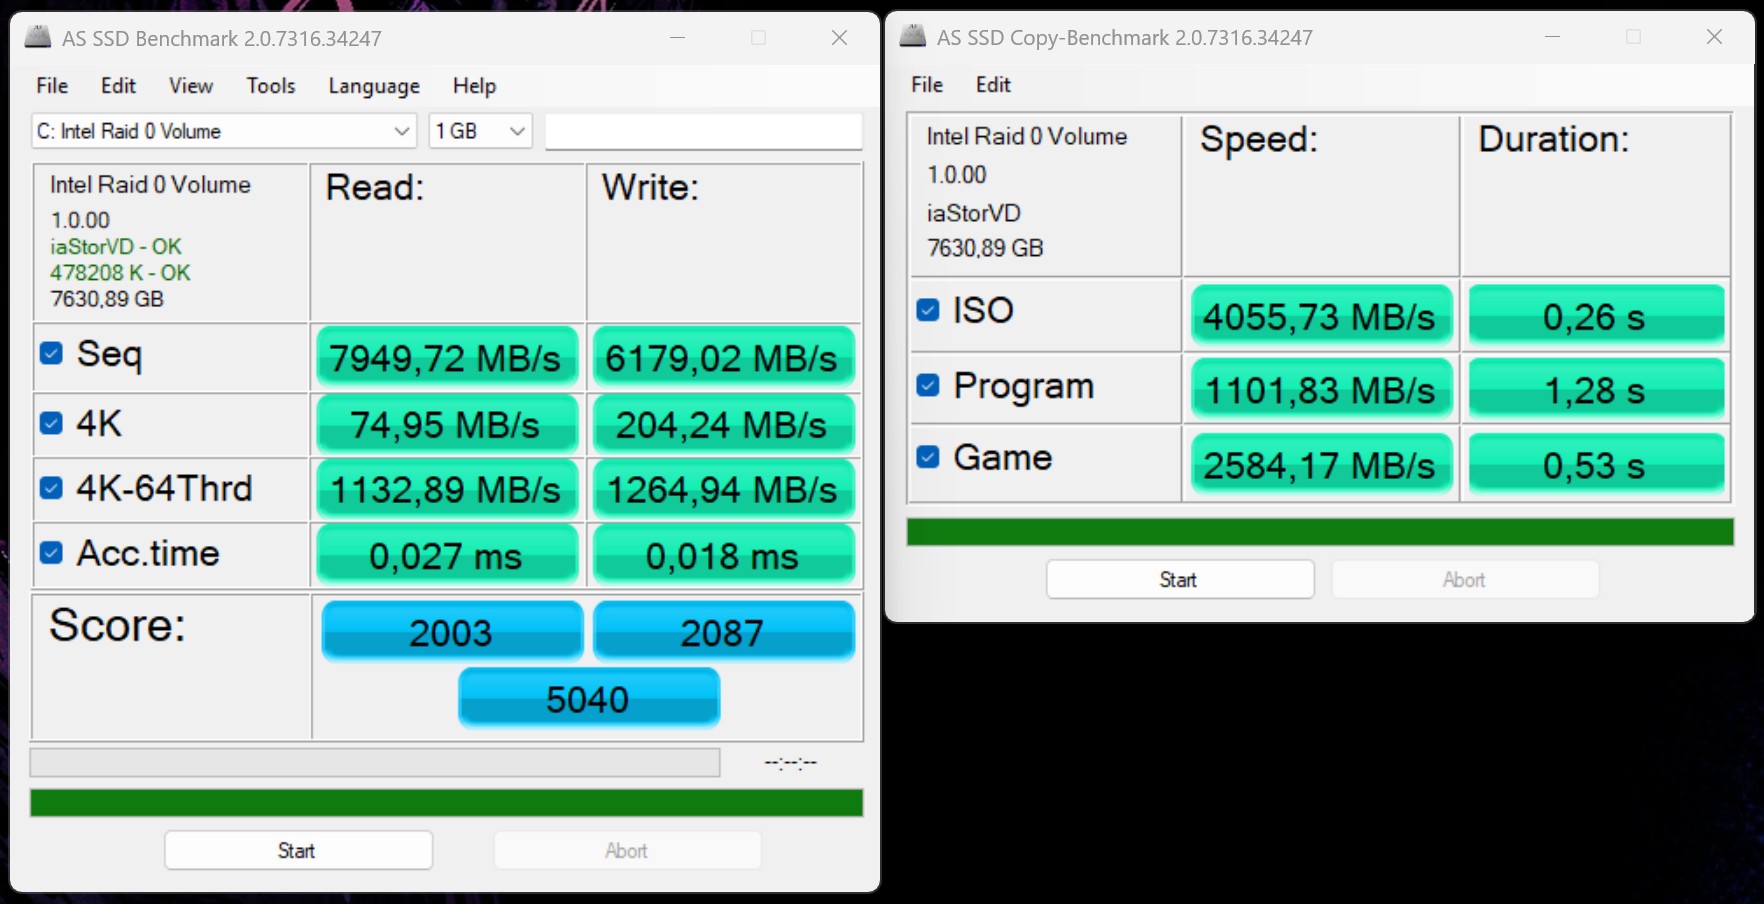
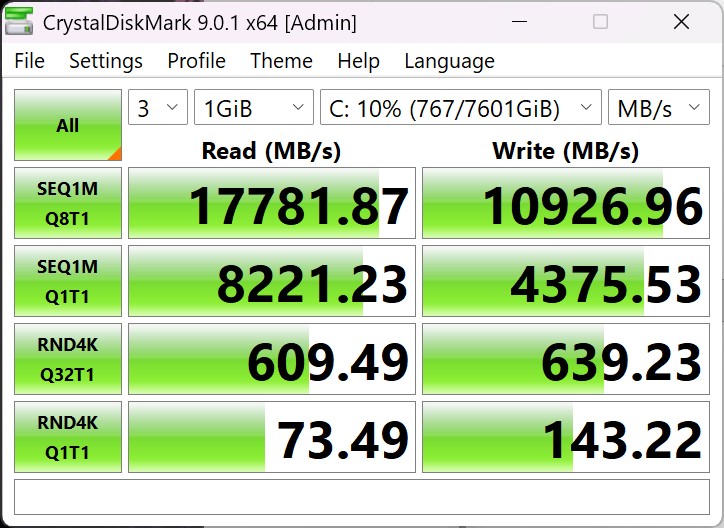
AS SSD
AS SSD
CDM9
CDM9
Configuração do SSD
Configuração do SSD
2x Samsung PM9E1 MZVLC4T0HBL1 (RAID 0)
Sequential Read: 7949MB/s
Sequential Write: 6179MB/s
4K Read: 75MB/s
4K Write: 204MB/s
4K-64 Read: 1133MB/s
4K-64 Write: 1265MB/s
Access Time Read: 0.027ms
Access Time Write: 0.018ms
Copy ISO: 4055.73MB/s
Copy Program: 1101.83MB/s
Copy Game: 2584.17MB/s
Score Read: 2003Points
Score Write: 2087Points
Score Total: 5040Points
Drive Performance rating - Percent
Alienware m18 R2
SK Hynix PC811 HFS002TEM9X152N
78.1 pt
Schenker Key 17 Pro (M24)
Samsung 990 Pro 1 TB
78 pt
Acer Predator Helios 18 PH18-72-98MW
2x SK Hynix HFS001TEJ9X115N (RAID 0)
64.2 pt
Asus ROG Strix Scar 18 G835LXG
2x Samsung PM9E1 MZVLC4T0HBL1 (RAID 0)
63.2 pt
Média 2x Samsung PM9E1 MZVLC4T0HBL1 (RAID 0)
 
63.2 pt
MSI Titan 18 HX A14VIG
2x Samsung PM9A1a MZVL22T0HDLB (RAID 0)
56.8 pt
Média da turma Gaming
 
54.9 pt
Asus Strix Scar 18 G835LX
WD PC SN8000S 2TB
48.3 pt
Razer Blade 18 2024 RZ09-0509
 
46.1 pt
DiskSpd
seq read
Asus ROG Strix Scar 18 G835LXG
2x Samsung PM9E1 MZVLC4T0HBL1 (RAID 0)
7917 (7533.6min - 7917.48max) MB/s
Média 2x Samsung PM9E1 MZVLC4T0HBL1 (RAID 0)
  (n=1)
7917 MB/s 0%
Acer Predator Helios 18 PH18-72-98MW
2x SK Hynix HFS001TEJ9X115N (RAID 0)
7045 (6975.86min - 7044.54max) MB/s -11%
Alienware m18 R2
SK Hynix PC811 HFS002TEM9X152N
5588 (5540.05min - 5587.65max) MB/s -29%
MSI Titan 18 HX A14VIG
2x Samsung PM9A1a MZVL22T0HDLB (RAID 0)
5424 (5395.57min - 5423.86max) MB/s -31%
Asus Strix Scar 18 G835LX
WD PC SN8000S 2TB
3799 (23.02min - 3799.36max) MB/s -52%
Razer Blade 18 2024 RZ09-0509
 
3560 (3002.28min - 3559.93max) MB/s -55%
Média da turma Gaming
  (281 - 9494, n=99, últimos 2 anos)
3556 MB/s -55%
Schenker Key 17 Pro (M24)
Samsung 990 Pro 1 TB
3142 (3005.43min - 3141.53max) MB/s -60%
seq write
Acer Predator Helios 18 PH18-72-98MW
2x SK Hynix HFS001TEJ9X115N (RAID 0)
8992 (8801.75min - 8992.01max) MB/s +53%
MSI Titan 18 HX A14VIG
2x Samsung PM9A1a MZVL22T0HDLB (RAID 0)
7291 (7191.64min - 7291.38max) MB/s +24%
Asus ROG Strix Scar 18 G835LXG
2x Samsung PM9E1 MZVLC4T0HBL1 (RAID 0)
5867 (5141.17min - 5866.57max) MB/s
Média 2x Samsung PM9E1 MZVLC4T0HBL1 (RAID 0)
  (n=1)
5867 MB/s 0%
Alienware m18 R2
SK Hynix PC811 HFS002TEM9X152N
5153 (5139.7min - 5152.91max) MB/s -12%
Schenker Key 17 Pro (M24)
Samsung 990 Pro 1 TB
4891 (4759.07min - 4890.56max) MB/s -17%
Asus Strix Scar 18 G835LX
WD PC SN8000S 2TB
4437 (4373.88min - 4437.36max) MB/s -24%
Média da turma Gaming
  (1057 - 9832, n=99, últimos 2 anos)
3957 MB/s -33%
Razer Blade 18 2024 RZ09-0509
 
3367 (3255.82min - 3366.95max) MB/s -43%
seq q8 t1 read
Asus ROG Strix Scar 18 G835LXG
2x Samsung PM9E1 MZVLC4T0HBL1 (RAID 0)
17459 (12476.6min - 17459.1max) MB/s
Média 2x Samsung PM9E1 MZVLC4T0HBL1 (RAID 0)
  (n=1)
17459 MB/s 0%
MSI Titan 18 HX A14VIG
2x Samsung PM9A1a MZVL22T0HDLB (RAID 0)
13588 (10727.3min - 13588.3max) MB/s -22%
Asus Strix Scar 18 G835LX
WD PC SN8000S 2TB
12470 (11207.2min - 12469.7max) MB/s -29%
Acer Predator Helios 18 PH18-72-98MW
2x SK Hynix HFS001TEJ9X115N (RAID 0)
11019 (9854.1min - 11018.8max) MB/s -37%
Média da turma Gaming
  (3772 - 17459, n=99, últimos 2 anos)
7552 MB/s -57%
Alienware m18 R2
SK Hynix PC811 HFS002TEM9X152N
7110 (6256.85min - 7110.18max) MB/s -59%
Schenker Key 17 Pro (M24)
Samsung 990 Pro 1 TB
7033 (6025.44min - 7033.01max) MB/s -60%
Razer Blade 18 2024 RZ09-0509
 
6797 (5573.18min - 6797.33max) MB/s -61%
seq q8 t1 write
Acer Predator Helios 18 PH18-72-98MW
2x SK Hynix HFS001TEJ9X115N (RAID 0)
11472 (11391min - 11471.6max) MB/s 0%
Asus ROG Strix Scar 18 G835LXG
2x Samsung PM9E1 MZVLC4T0HBL1 (RAID 0)
11431 (10787.1min - 11430.9max) MB/s
Média 2x Samsung PM9E1 MZVLC4T0HBL1 (RAID 0)
  (n=1)
11431 MB/s 0%
MSI Titan 18 HX A14VIG
2x Samsung PM9A1a MZVL22T0HDLB (RAID 0)
10571 (10519.3min - 10571.3max) MB/s -8%
Asus Strix Scar 18 G835LX
WD PC SN8000S 2TB
8696 (8611.54min - 8696.26max) MB/s -24%
Alienware m18 R2
SK Hynix PC811 HFS002TEM9X152N
6779 (6710.47min - 6778.83max) MB/s -41%
Schenker Key 17 Pro (M24)
Samsung 990 Pro 1 TB
6620 (6576.94min - 6620.29max) MB/s -42%
Média da turma Gaming
  (1218 - 13519, n=99, últimos 2 anos)
5961 MB/s -48%
Razer Blade 18 2024 RZ09-0509
 
4902 (4309.42min - 4901.73max) MB/s -57%
4k q1 t1 read
Schenker Key 17 Pro (M24)
Samsung 990 Pro 1 TB
99 (97.84min - 99.01max) MB/s +21%
Acer Predator Helios 18 PH18-72-98MW
2x SK Hynix HFS001TEJ9X115N (RAID 0)
81.6 (81.02min - 81.62max) MB/s 0%
Asus ROG Strix Scar 18 G835LXG
2x Samsung PM9E1 MZVLC4T0HBL1 (RAID 0)
81.6 (80.95min - 81.61max) MB/s
Média 2x Samsung PM9E1 MZVLC4T0HBL1 (RAID 0)
  (n=1)
81.6 MB/s 0%
Alienware m18 R2
SK Hynix PC811 HFS002TEM9X152N
75.4 (73.49min - 75.43max) MB/s -8%
Média da turma Gaming
  (32.2 - 111.2, n=99, últimos 2 anos)
70.3 MB/s -14%
MSI Titan 18 HX A14VIG
2x Samsung PM9A1a MZVL22T0HDLB (RAID 0)
69.6 (68.6min - 69.57max) MB/s -15%
Asus Strix Scar 18 G835LX
WD PC SN8000S 2TB
63.4 (62.2min - 63.4max) MB/s -22%
Razer Blade 18 2024 RZ09-0509
 
61.8 (61.2min - 61.81max) MB/s -24%
4k q1 t1 write
Schenker Key 17 Pro (M24)
Samsung 990 Pro 1 TB
316 (303.92min - 316.48max) MB/s +61%
Alienware m18 R2
SK Hynix PC811 HFS002TEM9X152N
300 (297.27min - 299.6max) MB/s +53%
Acer Predator Helios 18 PH18-72-98MW
2x SK Hynix HFS001TEJ9X115N (RAID 0)
259 (250.68min - 258.82max) MB/s +32%
Média da turma Gaming
  (78 - 345, n=99, últimos 2 anos)
195.9 MB/s 0%
Asus ROG Strix Scar 18 G835LXG
2x Samsung PM9E1 MZVLC4T0HBL1 (RAID 0)
195.8 (125.81min - 195.77max) MB/s
Média 2x Samsung PM9E1 MZVLC4T0HBL1 (RAID 0)
  (n=1)
195.8 MB/s 0%
Razer Blade 18 2024 RZ09-0509
 
164 (110.95min - 164max) MB/s -16%
MSI Titan 18 HX A14VIG
2x Samsung PM9A1a MZVL22T0HDLB (RAID 0)
152.1 (149.74min - 152.09max) MB/s -22%
Asus Strix Scar 18 G835LX
WD PC SN8000S 2TB
136.4 (134.95min - 136.4max) MB/s -30%
4k q32 t16 read
Alienware m18 R2
SK Hynix PC811 HFS002TEM9X152N
6067 (5596.15min - 6066.73max) MB/s +626%
Schenker Key 17 Pro (M24)
Samsung 990 Pro 1 TB
4926 (4895.9min - 4926.27max) MB/s +489%
Média da turma Gaming
  (539 - 8067, n=99, últimos 2 anos)
2264 MB/s +171%
MSI Titan 18 HX A14VIG
2x Samsung PM9A1a MZVL22T0HDLB (RAID 0)
1623 (1464.8min - 1623.24max) MB/s +94%
Acer Predator Helios 18 PH18-72-98MW
2x SK Hynix HFS001TEJ9X115N (RAID 0)
1385 (1275.7min - 1385.11max) MB/s +66%
Razer Blade 18 2024 RZ09-0509
 
1005 (964.75min - 1004.59max) MB/s +20%
Asus ROG Strix Scar 18 G835LXG
2x Samsung PM9E1 MZVLC4T0HBL1 (RAID 0)
836 (795.8min - 835.68max) MB/s
Média 2x Samsung PM9E1 MZVLC4T0HBL1 (RAID 0)
  (n=1)
836 MB/s 0%
Asus Strix Scar 18 G835LX
WD PC SN8000S 2TB
746 (519.37min - 746.01max) MB/s -11%
4k q32 t16 write
Alienware m18 R2
SK Hynix PC811 HFS002TEM9X152N
4176 (3805.57min - 4175.9max) MB/s +551%
Schenker Key 17 Pro (M24)
Samsung 990 Pro 1 TB
3579 (3433.86min - 3579.4max) MB/s +458%
Média da turma Gaming
  (227 - 5653, n=99, últimos 2 anos)
1832 MB/s +186%
MSI Titan 18 HX A14VIG
2x Samsung PM9A1a MZVL22T0HDLB (RAID 0)
1377 (1306.51min - 1377.05max) MB/s +115%
Acer Predator Helios 18 PH18-72-98MW
2x SK Hynix HFS001TEJ9X115N (RAID 0)
1330 (1184.45min - 1330.4max) MB/s +107%
Asus ROG Strix Scar 18 G835LXG
2x Samsung PM9E1 MZVLC4T0HBL1 (RAID 0)
641 (632.54min - 640.8max) MB/s
Média 2x Samsung PM9E1 MZVLC4T0HBL1 (RAID 0)
  (n=1)
641 MB/s 0%
Razer Blade 18 2024 RZ09-0509
 
442 (336.87min - 441.83max) MB/s -31%
Asus Strix Scar 18 G835LX
WD PC SN8000S 2TB
284 (254.39min - 283.58max) MB/s -56%
AS SSD
Score Total
Alienware m18 R2
SK Hynix PC811 HFS002TEM9X152N
10655 Points +111%
Schenker Key 17 Pro (M24)
Samsung 990 Pro 1 TB
10591 Points +110%
Média da turma Gaming
  (2912 - 14159, n=97, últimos 2 anos)
6872 Points +36%
MSI Titan 18 HX A14VIG
2x Samsung PM9A1a MZVL22T0HDLB (RAID 0)
5369 Points +7%
Acer Predator Helios 18 PH18-72-98MW
2x SK Hynix HFS001TEJ9X115N (RAID 0)
5102 Points +1%
Asus ROG Strix Scar 18 G835LXG
2x Samsung PM9E1 MZVLC4T0HBL1 (RAID 0)
5040 Points
Média 2x Samsung PM9E1 MZVLC4T0HBL1 (RAID 0)
  (n=1)
5040 Points 0%
Razer Blade 18 2024 RZ09-0509
 
4927 Points -2%
Asus Strix Scar 18 G835LX
WD PC SN8000S 2TB
4764 Points -5%
Score Read
Schenker Key 17 Pro (M24)
Samsung 990 Pro 1 TB
3807 Points +90%
Alienware m18 R2
SK Hynix PC811 HFS002TEM9X152N
3753 Points +87%
Média da turma Gaming
  (953 - 5082, n=97, últimos 2 anos)
2248 Points +12%
MSI Titan 18 HX A14VIG
2x Samsung PM9A1a MZVL22T0HDLB (RAID 0)
2194 Points +10%
Acer Predator Helios 18 PH18-72-98MW
2x SK Hynix HFS001TEJ9X115N (RAID 0)
2049 Points +2%
Asus ROG Strix Scar 18 G835LXG
2x Samsung PM9E1 MZVLC4T0HBL1 (RAID 0)
2003 Points
Média 2x Samsung PM9E1 MZVLC4T0HBL1 (RAID 0)
  (n=1)
2003 Points 0%
Razer Blade 18 2024 RZ09-0509
 
1667 Points -17%
Asus Strix Scar 18 G835LX
WD PC SN8000S 2TB
1653 Points -17%
Score Write
Alienware m18 R2
SK Hynix PC811 HFS002TEM9X152N
4993 Points +139%
Schenker Key 17 Pro (M24)
Samsung 990 Pro 1 TB
4852 Points +132%
Média da turma Gaming
  (1136 - 6457, n=97, últimos 2 anos)
3547 Points +70%
Razer Blade 18 2024 RZ09-0509
 
2518 Points +21%
Asus Strix Scar 18 G835LX
WD PC SN8000S 2TB
2267 Points +9%
MSI Titan 18 HX A14VIG
2x Samsung PM9A1a MZVL22T0HDLB (RAID 0)
2092 Points 0%
Asus ROG Strix Scar 18 G835LXG
2x Samsung PM9E1 MZVLC4T0HBL1 (RAID 0)
2087 Points
Média 2x Samsung PM9E1 MZVLC4T0HBL1 (RAID 0)
  (n=1)
2087 Points 0%
Acer Predator Helios 18 PH18-72-98MW
2x SK Hynix HFS001TEJ9X115N (RAID 0)
2038 Points -2%
Seq Read
MSI Titan 18 HX A14VIG
2x Samsung PM9A1a MZVL22T0HDLB (RAID 0)
9576.8 MB/s +20%
Acer Predator Helios 18 PH18-72-98MW
2x SK Hynix HFS001TEJ9X115N (RAID 0)
8496.25 MB/s +7%
Asus ROG Strix Scar 18 G835LXG
2x Samsung PM9E1 MZVLC4T0HBL1 (RAID 0)
7949 MB/s
Média 2x Samsung PM9E1 MZVLC4T0HBL1 (RAID 0)
  (n=1)
7949 MB/s 0%
Alienware m18 R2
SK Hynix PC811 HFS002TEM9X152N
5916.27 MB/s -26%
Asus Strix Scar 18 G835LX
WD PC SN8000S 2TB
5595 MB/s -30%
Média da turma Gaming
  (2346 - 10091, n=97, últimos 2 anos)
5591 MB/s -30%
Razer Blade 18 2024 RZ09-0509
 
5476.6 MB/s -31%
Schenker Key 17 Pro (M24)
Samsung 990 Pro 1 TB
5346 MB/s -33%
Seq Write
MSI Titan 18 HX A14VIG
2x Samsung PM9A1a MZVL22T0HDLB (RAID 0)
8685.54 MB/s +41%
Acer Predator Helios 18 PH18-72-98MW
2x SK Hynix HFS001TEJ9X115N (RAID 0)
7597.23 MB/s +23%
Asus ROG Strix Scar 18 G835LXG
2x Samsung PM9E1 MZVLC4T0HBL1 (RAID 0)
6179 MB/s
Média 2x Samsung PM9E1 MZVLC4T0HBL1 (RAID 0)
  (n=1)
6179 MB/s 0%
Alienware m18 R2
SK Hynix PC811 HFS002TEM9X152N
5929.42 MB/s -4%
Asus Strix Scar 18 G835LX
WD PC SN8000S 2TB
5305 MB/s -14%
Schenker Key 17 Pro (M24)
Samsung 990 Pro 1 TB
5012 MB/s -19%
Média da turma Gaming
  (114.5 - 10726, n=97, últimos 2 anos)
3972 MB/s -36%
Razer Blade 18 2024 RZ09-0509
 
2995.22 MB/s -52%
4K Read
Schenker Key 17 Pro (M24)
Samsung 990 Pro 1 TB
90.9 MB/s +21%
Asus ROG Strix Scar 18 G835LXG
2x Samsung PM9E1 MZVLC4T0HBL1 (RAID 0)
75 MB/s
Média 2x Samsung PM9E1 MZVLC4T0HBL1 (RAID 0)
  (n=1)
75 MB/s 0%
Média da turma Gaming
  (36.4 - 108.4, n=97, últimos 2 anos)
71.1 MB/s -5%
Acer Predator Helios 18 PH18-72-98MW
2x SK Hynix HFS001TEJ9X115N (RAID 0)
69.86 MB/s -7%
Razer Blade 18 2024 RZ09-0509
 
65.49 MB/s -13%
Asus Strix Scar 18 G835LX
WD PC SN8000S 2TB
65.1 MB/s -13%
Alienware m18 R2
SK Hynix PC811 HFS002TEM9X152N
64.97 MB/s -13%
MSI Titan 18 HX A14VIG
2x Samsung PM9A1a MZVL22T0HDLB (RAID 0)
63.69 MB/s -15%
4K Write
Schenker Key 17 Pro (M24)
Samsung 990 Pro 1 TB
260 MB/s +27%
Alienware m18 R2
SK Hynix PC811 HFS002TEM9X152N
238.28 MB/s +17%
Razer Blade 18 2024 RZ09-0509
 
219.58 MB/s +8%
Média da turma Gaming
  (75.6 - 307, n=97, últimos 2 anos)
215 MB/s +5%
Asus ROG Strix Scar 18 G835LXG
2x Samsung PM9E1 MZVLC4T0HBL1 (RAID 0)
204 MB/s
Média 2x Samsung PM9E1 MZVLC4T0HBL1 (RAID 0)
  (n=1)
204 MB/s 0%
Acer Predator Helios 18 PH18-72-98MW
2x SK Hynix HFS001TEJ9X115N (RAID 0)
200.92 MB/s -2%
Asus Strix Scar 18 G835LX
WD PC SN8000S 2TB
189.8 MB/s -7%
MSI Titan 18 HX A14VIG
2x Samsung PM9A1a MZVL22T0HDLB (RAID 0)
134.66 MB/s -34%
4K-64 Read
Schenker Key 17 Pro (M24)
Samsung 990 Pro 1 TB
3182 MB/s +181%
Alienware m18 R2
SK Hynix PC811 HFS002TEM9X152N
3096 MB/s +173%
Média da turma Gaming
  (517 - 3977, n=97, últimos 2 anos)
1618 MB/s +43%
MSI Titan 18 HX A14VIG
2x Samsung PM9A1a MZVL22T0HDLB (RAID 0)
1172.14 MB/s +3%
Asus ROG Strix Scar 18 G835LXG
2x Samsung PM9E1 MZVLC4T0HBL1 (RAID 0)
1133 MB/s
Média 2x Samsung PM9E1 MZVLC4T0HBL1 (RAID 0)
  (n=1)
1133 MB/s 0%
Acer Predator Helios 18 PH18-72-98MW
2x SK Hynix HFS001TEJ9X115N (RAID 0)
1129.76 MB/s 0%
Razer Blade 18 2024 RZ09-0509
 
1053.83 MB/s -7%
Asus Strix Scar 18 G835LX
WD PC SN8000S 2TB
1029 MB/s -9%
4K-64 Write
Alienware m18 R2
SK Hynix PC811 HFS002TEM9X152N
4161.9 MB/s +229%
Schenker Key 17 Pro (M24)
Samsung 990 Pro 1 TB
4090 MB/s +223%
Média da turma Gaming
  (850 - 5356, n=97, últimos 2 anos)
2935 MB/s +132%
Razer Blade 18 2024 RZ09-0509
 
1998.53 MB/s +58%
Asus Strix Scar 18 G835LX
WD PC SN8000S 2TB
1546 MB/s +22%
Asus ROG Strix Scar 18 G835LXG
2x Samsung PM9E1 MZVLC4T0HBL1 (RAID 0)
1265 MB/s
Média 2x Samsung PM9E1 MZVLC4T0HBL1 (RAID 0)
  (n=1)
1265 MB/s 0%
MSI Titan 18 HX A14VIG
2x Samsung PM9A1a MZVL22T0HDLB (RAID 0)
1088.59 MB/s -14%
Acer Predator Helios 18 PH18-72-98MW
2x SK Hynix HFS001TEJ9X115N (RAID 0)
1077.68 MB/s -15%
Access Time Read
Asus Strix Scar 18 G835LX
WD PC SN8000S 2TB
0.067 ms * -148%
Média da turma Gaming
  (0.017 - 0.623, n=97, últimos 2 anos)
0.06364 ms * -136%
Schenker Key 17 Pro (M24)
Samsung 990 Pro 1 TB
0.046 ms * -70%
Acer Predator Helios 18 PH18-72-98MW
2x SK Hynix HFS001TEJ9X115N (RAID 0)
0.044 ms * -63%
MSI Titan 18 HX A14VIG
2x Samsung PM9A1a MZVL22T0HDLB (RAID 0)
0.036 ms * -33%
Alienware m18 R2
SK Hynix PC811 HFS002TEM9X152N
0.029 ms * -7%
Asus ROG Strix Scar 18 G835LXG
2x Samsung PM9E1 MZVLC4T0HBL1 (RAID 0)
0.027 ms *
Média 2x Samsung PM9E1 MZVLC4T0HBL1 (RAID 0)
  (n=1)
0.027 ms * -0%
Razer Blade 18 2024 RZ09-0509
 
0.025 ms * +7%
Access Time Write
MSI Titan 18 HX A14VIG
2x Samsung PM9A1a MZVL22T0HDLB (RAID 0)
0.091 ms * -406%
Razer Blade 18 2024 RZ09-0509
 
0.057 ms * -217%
Alienware m18 R2
SK Hynix PC811 HFS002TEM9X152N
0.055 ms * -206%
Média da turma Gaming
  (0.012 - 0.277, n=97, últimos 2 anos)
0.03794 ms * -111%
Acer Predator Helios 18 PH18-72-98MW
2x SK Hynix HFS001TEJ9X115N (RAID 0)
0.019 ms * -6%
Asus Strix Scar 18 G835LX
WD PC SN8000S 2TB
0.019 ms * -6%
Asus ROG Strix Scar 18 G835LXG
2x Samsung PM9E1 MZVLC4T0HBL1 (RAID 0)
0.018 ms *
Média 2x Samsung PM9E1 MZVLC4T0HBL1 (RAID 0)
  (n=1)
0.018 ms * -0%
Schenker Key 17 Pro (M24)
Samsung 990 Pro 1 TB
0.015 ms * +17%

* ... menor é melhor

Limitação de disco: Loop de leitura do DiskSpd, profundidade da fila 8

035571010651420177521302485284031953550390542604615497053255680603563906745710074557810816585208875923095859940102951065011005113601171512070124251278013135134901384514200145551491015265156201597516330166851704017395Tooltip
Asus ROG Strix Scar 18 G835LXG; diskspd 2.0.17 f: Ø17083 (13259.78-17590.28) MB/s

Desempenho da GPU e em jogos

O Asus ROG Strix SCAR 18 está equipado com uma GPU para notebook Nvidia GeForce RTX 5090 com 24 GB de VRAM GDDR7. Em nosso teste, a GPU opera com um TGP máximo de 175 watts (150 watts + 25 watts de Dynamic Boost), tornando-a a configuração mais rápida disponível. O desempenho em jogos e aplicativos é, consequentemente, muito alto, oferecendo amplas reservas de desempenho mesmo para títulos exigentes em altas resoluções.

No modo manual, as velocidades de clock da GPU e da memória podem ser ainda mais aumentadas, permitindo um ligeiro aumento adicional no desempenho gráfico. Outro aspecto positivo é que o desempenho da RTX 5090 para laptop permanece estável mesmo sob carga sustentada e não apresenta quedas significativas. No modo de bateria, no entanto, o orçamento de energia disponível é significativamente menor, razão pela qual o desempenho da GPU diminui visivelmente.

3DMark Performance rating - Percent
Asus ROG Strix Scar 18 G835LXG
NVIDIA GeForce RTX 5090 Laptop, Intel Core Ultra 9 290HX Plus
100 pt
Média NVIDIA GeForce RTX 5090 Laptop
 
91.3 pt
Asus Strix Scar 18 G835LX
NVIDIA GeForce RTX 5090 Laptop, Intel Core Ultra 9 275HX
90.4 pt
MSI Titan 18 HX A14VIG
NVIDIA GeForce RTX 4090 Laptop GPU, Intel Core i9-14900HX
87.4 pt
Alienware m18 R2
NVIDIA GeForce RTX 4090 Laptop GPU, Intel Core i9-14900HX
86 pt
Razer Blade 18 2024 RZ09-0509
NVIDIA GeForce RTX 4090 Laptop GPU, Intel Core i9-14900HX
82.9 pt
Schenker Key 17 Pro (M24)
NVIDIA GeForce RTX 4090 Laptop GPU, Intel Core i9-14900HX
79.2 pt
Acer Predator Helios 18 PH18-72-98MW
NVIDIA GeForce RTX 4090 Laptop GPU, Intel Core i9-14900HX
76.6 pt
Média da turma Gaming
 
65.8 pt
3DMark 11 - 1280x720 Performance GPU
Asus ROG Strix Scar 18 G835LXG
NVIDIA GeForce RTX 5090 Laptop, Intel Core Ultra 9 290HX Plus
77229 Points
Alienware m18 R2
NVIDIA GeForce RTX 4090 Laptop GPU, Intel Core i9-14900HX
69254 Points -10%
Média NVIDIA GeForce RTX 5090 Laptop
  (26378 - 80022, n=24)
66542 Points -14%
Asus Strix Scar 18 G835LX
NVIDIA GeForce RTX 5090 Laptop, Intel Core Ultra 9 275HX
66337 Points -14%
Razer Blade 18 2024 RZ09-0509
NVIDIA GeForce RTX 4090 Laptop GPU, Intel Core i9-14900HX
64952 Points -16%
MSI Titan 18 HX A14VIG
NVIDIA GeForce RTX 4090 Laptop GPU, Intel Core i9-14900HX
63978 Points -17%
Acer Predator Helios 18 PH18-72-98MW
NVIDIA GeForce RTX 4090 Laptop GPU, Intel Core i9-14900HX
59871 Points -22%
Schenker Key 17 Pro (M24)
NVIDIA GeForce RTX 4090 Laptop GPU, Intel Core i9-14900HX
59715 Points -23%
Média da turma Gaming
  (21841 - 80022, n=104, últimos 2 anos)
50006 Points -35%
3DMark
2560x1440 Time Spy Graphics
Asus ROG Strix Scar 18 G835LXG
NVIDIA GeForce RTX 5090 Laptop, Intel Core Ultra 9 290HX Plus
25562 Points
Asus Strix Scar 18 G835LX
NVIDIA GeForce RTX 5090 Laptop, Intel Core Ultra 9 275HX
24599 Points -4%
Média NVIDIA GeForce RTX 5090 Laptop
  (19216 - 26212, n=27)
23833 Points -7%
Alienware m18 R2
NVIDIA GeForce RTX 4090 Laptop GPU, Intel Core i9-14900HX
22290 Points -13%
MSI Titan 18 HX A14VIG
NVIDIA GeForce RTX 4090 Laptop GPU, Intel Core i9-14900HX
22256 Points -13%
Razer Blade 18 2024 RZ09-0509
NVIDIA GeForce RTX 4090 Laptop GPU, Intel Core i9-14900HX
21246 Points -17%
Schenker Key 17 Pro (M24)
NVIDIA GeForce RTX 4090 Laptop GPU, Intel Core i9-14900HX
19741 Points -23%
Acer Predator Helios 18 PH18-72-98MW
NVIDIA GeForce RTX 4090 Laptop GPU, Intel Core i9-14900HX
18814 Points -26%
Média da turma Gaming
  (5012 - 26212, n=115, últimos 2 anos)
15813 Points -38%
1920x1080 Fire Strike Graphics
Asus ROG Strix Scar 18 G835LXG
NVIDIA GeForce RTX 5090 Laptop, Intel Core Ultra 9 290HX Plus
54821 Points
Média NVIDIA GeForce RTX 5090 Laptop
  (42175 - 62849, n=29)
51817 Points -5%
MSI Titan 18 HX A14VIG
NVIDIA GeForce RTX 4090 Laptop GPU, Intel Core i9-14900HX
50532 Points -8%
Asus Strix Scar 18 G835LX
NVIDIA GeForce RTX 5090 Laptop, Intel Core Ultra 9 275HX
48863 Points -11%
Schenker Key 17 Pro (M24)
NVIDIA GeForce RTX 4090 Laptop GPU, Intel Core i9-14900HX
45600 Points -17%
Razer Blade 18 2024 RZ09-0509
NVIDIA GeForce RTX 4090 Laptop GPU, Intel Core i9-14900HX
44702 Points -18%
Alienware m18 R2
NVIDIA GeForce RTX 4090 Laptop GPU, Intel Core i9-14900HX
44492 Points -19%
Acer Predator Helios 18 PH18-72-98MW
NVIDIA GeForce RTX 4090 Laptop GPU, Intel Core i9-14900HX
43140 Points -21%
Média da turma Gaming
  (12242 - 62849, n=115, últimos 2 anos)
38781 Points -29%
3DMark 06 Standard Score
69318 pontos
3DMark Vantage P Result
145142 pontos
3DMark 11 Performance
54427 pontos
3DMark Ice Storm Standard Score
328157 pontos
3DMark Cloud Gate Standard Score
79173 pontos
3DMark Fire Strike Score
42509 pontos
3DMark Fire Strike Extreme Score
30184 pontos
3DMark Time Spy Score
24092 pontos
3DMark Steel Nomad Score
6277 pontos
Ajuda
Blender
v3.3 Classroom OPTIX/RTX
Média da turma Gaming
  (9 - 32, n=106, últimos 2 anos)
18.3 Seconds * -31%
Razer Blade 18 2024 RZ09-0509
NVIDIA GeForce RTX 4090 Laptop GPU, Intel Core i9-14900HX
14 Seconds * -0%
Asus ROG Strix Scar 18 G835LXG
NVIDIA GeForce RTX 5090 Laptop, Intel Core Ultra 9 290HX Plus
14 Seconds *
Acer Predator Helios 18 PH18-72-98MW
NVIDIA GeForce RTX 4090 Laptop GPU, Intel Core i9-14900HX
13 Seconds * +7%
Schenker Key 17 Pro (M24)
NVIDIA GeForce RTX 4090 Laptop GPU, Intel Core i9-14900HX
13 Seconds * +7%
Alienware m18 R2
NVIDIA GeForce RTX 4090 Laptop GPU, Intel Core i9-14900HX
12 Seconds * +14%
Média NVIDIA GeForce RTX 5090 Laptop
  (9 - 18, n=23)
11.8 Seconds * +16%
MSI Titan 18 HX A14VIG
NVIDIA GeForce RTX 4090 Laptop GPU, Intel Core i9-14900HX
10 Seconds * +29%
Asus Strix Scar 18 G835LX
NVIDIA GeForce RTX 5090 Laptop, Intel Core Ultra 9 275HX
10 Seconds * +29%
v3.3 Classroom CUDA
Média da turma Gaming
  (15 - 228, n=106, últimos 2 anos)
32.4 Seconds * -91%
Razer Blade 18 2024 RZ09-0509
NVIDIA GeForce RTX 4090 Laptop GPU, Intel Core i9-14900HX
19 Seconds * -12%
MSI Titan 18 HX A14VIG
NVIDIA GeForce RTX 4090 Laptop GPU, Intel Core i9-14900HX
18 Seconds * -6%
Acer Predator Helios 18 PH18-72-98MW
NVIDIA GeForce RTX 4090 Laptop GPU, Intel Core i9-14900HX
18 Seconds * -6%
Alienware m18 R2
NVIDIA GeForce RTX 4090 Laptop GPU, Intel Core i9-14900HX
18 Seconds * -6%
Schenker Key 17 Pro (M24)
NVIDIA GeForce RTX 4090 Laptop GPU, Intel Core i9-14900HX
18 Seconds * -6%
Média NVIDIA GeForce RTX 5090 Laptop
  (15 - 37, n=22)
17.6 Seconds * -4%
Asus ROG Strix Scar 18 G835LXG
NVIDIA GeForce RTX 5090 Laptop, Intel Core Ultra 9 290HX Plus
17 Seconds *
Asus Strix Scar 18 G835LX
NVIDIA GeForce RTX 5090 Laptop, Intel Core Ultra 9 275HX
16 Seconds * +6%
v3.3 Classroom CPU
Média da turma Gaming
  (122 - 565, n=102, últimos 2 anos)
247 Seconds * -96%
Acer Predator Helios 18 PH18-72-98MW
NVIDIA GeForce RTX 4090 Laptop GPU, Intel Core i9-14900HX
225 Seconds * -79%
Schenker Key 17 Pro (M24)
NVIDIA GeForce RTX 4090 Laptop GPU, Intel Core i9-14900HX
218 Seconds * -73%
Razer Blade 18 2024 RZ09-0509
NVIDIA GeForce RTX 4090 Laptop GPU, Intel Core i9-14900HX
207 Seconds * -64%
Alienware m18 R2
NVIDIA GeForce RTX 4090 Laptop GPU, Intel Core i9-14900HX
180 Seconds * -43%
MSI Titan 18 HX A14VIG
NVIDIA GeForce RTX 4090 Laptop GPU, Intel Core i9-14900HX
179 Seconds * -42%
Média NVIDIA GeForce RTX 5090 Laptop
  (123 - 282, n=23)
164.3 Seconds * -30%
Asus Strix Scar 18 G835LX
NVIDIA GeForce RTX 5090 Laptop, Intel Core Ultra 9 275HX
137 Seconds * -9%
Asus ROG Strix Scar 18 G835LXG
NVIDIA GeForce RTX 5090 Laptop, Intel Core Ultra 9 290HX Plus
126 Seconds *

* ... menor é melhor

Performance rating - Percent
Asus ROG Strix Scar 18 G835LXG
Intel Core Ultra 9 290HX Plus, NVIDIA GeForce RTX 5090 Laptop
98 pt
Asus Strix Scar 18 G835LX
Intel Core Ultra 9 275HX, NVIDIA GeForce RTX 5090 Laptop
91.6 pt
Alienware m18 R2
Intel Core i9-14900HX, NVIDIA GeForce RTX 4090 Laptop GPU
87.8 pt
MSI Titan 18 HX A14VIG
Intel Core i9-14900HX, NVIDIA GeForce RTX 4090 Laptop GPU
86.6 pt
Schenker Key 17 Pro (M24)
Intel Core i9-14900HX, NVIDIA GeForce RTX 4090 Laptop GPU
82.4 pt
Acer Predator Helios 18 PH18-72-98MW -2!
Intel Core i9-14900HX, NVIDIA GeForce RTX 4090 Laptop GPU
78.1 pt
Razer Blade 18 2024 RZ09-0509
Intel Core i9-14900HX, NVIDIA GeForce RTX 4090 Laptop GPU
75.9 pt
Média da turma Gaming
 
70 pt
Cyberpunk 2077 - 1920x1080 Ultra Preset (FSR off)
Asus ROG Strix Scar 18 G835LXG
Intel Core Ultra 9 290HX Plus, NVIDIA GeForce RTX 5090 Laptop
169.4 (133.9min) fps
Asus Strix Scar 18 G835LX
Intel Core Ultra 9 275HX, NVIDIA GeForce RTX 5090 Laptop
154.9 (126.3min) fps -9%
Alienware m18 R2
Intel Core i9-14900HX, NVIDIA GeForce RTX 4090 Laptop GPU
133.9 (67.5min) fps -21%
MSI Titan 18 HX A14VIG
Intel Core i9-14900HX, NVIDIA GeForce RTX 4090 Laptop GPU
129.8 (26.2min) fps -23%
Schenker Key 17 Pro (M24)
Intel Core i9-14900HX, NVIDIA GeForce RTX 4090 Laptop GPU
113.5 (84.3min) fps -33%
Média da turma Gaming
  (17.7 - 169.9, n=115, últimos 2 anos)
108.4 fps -36%
Razer Blade 18 2024 RZ09-0509
Intel Core i9-14900HX, NVIDIA GeForce RTX 4090 Laptop GPU
101.25 (77.2min) fps -40%
Baldur's Gate 3 - 1920x1080 Ultra Preset AA:T
MSI Titan 18 HX A14VIG
Intel Core i9-14900HX, NVIDIA GeForce RTX 4090 Laptop GPU
207.7 fps 0%
Asus ROG Strix Scar 18 G835LXG
Intel Core Ultra 9 290HX Plus, NVIDIA GeForce RTX 5090 Laptop
207 (90.2min, 154.6P0.1, 186.9P1) fps
Alienware m18 R2
Intel Core i9-14900HX, NVIDIA GeForce RTX 4090 Laptop GPU
202 fps -2%
Asus Strix Scar 18 G835LX
Intel Core Ultra 9 275HX, NVIDIA GeForce RTX 5090 Laptop
193.7 fps -6%
Schenker Key 17 Pro (M24)
Intel Core i9-14900HX, NVIDIA GeForce RTX 4090 Laptop GPU
177 fps -14%
Razer Blade 18 2024 RZ09-0509
Intel Core i9-14900HX, NVIDIA GeForce RTX 4090 Laptop GPU
160.5 (65P0.1, 99.5P1) fps -22%
Média da turma Gaming
  (59.4 - 246, n=104, últimos 2 anos)
139.9 fps -32%
GTA V - 1920x1080 Highest AA:4xMSAA + FX AF:16x
Asus ROG Strix Scar 18 G835LXG
Intel Core Ultra 9 290HX Plus, NVIDIA GeForce RTX 5090 Laptop
173 (3.12min, 125P1) fps
Asus Strix Scar 18 G835LX
Intel Core Ultra 9 275HX, NVIDIA GeForce RTX 5090 Laptop
161.9 (2.78min, 111.1P1) fps -6%
MSI Titan 18 HX A14VIG
Intel Core i9-14900HX, NVIDIA GeForce RTX 4090 Laptop GPU
139.2 (3.73min, 90.9P1) fps -20%
Alienware m18 R2
Intel Core i9-14900HX, NVIDIA GeForce RTX 4090 Laptop GPU
137 (7.81min, 83.3P1) fps -21%
Acer Predator Helios 18 PH18-72-98MW
Intel Core i9-14900HX, NVIDIA GeForce RTX 4090 Laptop GPU
134 (22.7min, 90.9P1) fps -23%
Média da turma Gaming
  (48.3 - 186.9, n=94, últimos 2 anos)
132.3 fps -24%
Razer Blade 18 2024 RZ09-0509
Intel Core i9-14900HX, NVIDIA GeForce RTX 4090 Laptop GPU
129.8 (16.1min, 90.9P1) fps -25%
Schenker Key 17 Pro (M24)
Intel Core i9-14900HX, NVIDIA GeForce RTX 4090 Laptop GPU
126.7 (8.43min, 83.3P1) fps -27%
Final Fantasy XV Benchmark - 1920x1080 High Quality
Asus ROG Strix Scar 18 G835LXG
Intel Core Ultra 9 290HX Plus, NVIDIA GeForce RTX 5090 Laptop
214 fps
Asus Strix Scar 18 G835LX
Intel Core Ultra 9 275HX, NVIDIA GeForce RTX 5090 Laptop
199.3 fps -7%
Alienware m18 R2
Intel Core i9-14900HX, NVIDIA GeForce RTX 4090 Laptop GPU
193.2 fps -10%
MSI Titan 18 HX A14VIG
Intel Core i9-14900HX, NVIDIA GeForce RTX 4090 Laptop GPU
184 fps -14%
Schenker Key 17 Pro (M24)
Intel Core i9-14900HX, NVIDIA GeForce RTX 4090 Laptop GPU
174.6 fps -18%
Acer Predator Helios 18 PH18-72-98MW
Intel Core i9-14900HX, NVIDIA GeForce RTX 4090 Laptop GPU
157.1 fps -27%
Razer Blade 18 2024 RZ09-0509
Intel Core i9-14900HX, NVIDIA GeForce RTX 4090 Laptop GPU
156.9 fps -27%
Média da turma Gaming
  (41 - 215, n=95, últimos 2 anos)
150.1 fps -30%
Strange Brigade - 1920x1080 ultra AA:ultra AF:16
Asus ROG Strix Scar 18 G835LXG
Intel Core Ultra 9 290HX Plus, NVIDIA GeForce RTX 5090 Laptop
458 (143.1min, 329P1) fps
Asus Strix Scar 18 G835LX
Intel Core Ultra 9 275HX, NVIDIA GeForce RTX 5090 Laptop
401 (103.4min, 236P1) fps -12%
MSI Titan 18 HX A14VIG
Intel Core i9-14900HX, NVIDIA GeForce RTX 4090 Laptop GPU
385 (27.2min, 274P1) fps -16%
Alienware m18 R2
Intel Core i9-14900HX, NVIDIA GeForce RTX 4090 Laptop GPU
369 (31.4min, 266P1) fps -19%
Schenker Key 17 Pro (M24)
Intel Core i9-14900HX, NVIDIA GeForce RTX 4090 Laptop GPU
360 (22.5min, 268P1) fps -21%
Razer Blade 18 2024 RZ09-0509
Intel Core i9-14900HX, NVIDIA GeForce RTX 4090 Laptop GPU
325 (49.1min, 213P1) fps -29%
Acer Predator Helios 18 PH18-72-98MW
Intel Core i9-14900HX, NVIDIA GeForce RTX 4090 Laptop GPU
305 (14.5min, 223P1) fps -33%
Média da turma Gaming
  (76.3 - 458, n=87, últimos 2 anos)
288 fps -37%
Dota 2 Reborn - 1920x1080 ultra (3/3) best looking
Asus ROG Strix Scar 18 G835LXG
Intel Core Ultra 9 290HX Plus, NVIDIA GeForce RTX 5090 Laptop
194.7 (163.7min) fps
Asus Strix Scar 18 G835LX
Intel Core Ultra 9 275HX, NVIDIA GeForce RTX 5090 Laptop
186.6 (157.4min) fps -4%
Schenker Key 17 Pro (M24)
Intel Core i9-14900HX, NVIDIA GeForce RTX 4090 Laptop GPU
178.4 (149.2min) fps -8%
Acer Predator Helios 18 PH18-72-98MW
Intel Core i9-14900HX, NVIDIA GeForce RTX 4090 Laptop GPU
178.3 (150.2min) fps -8%
MSI Titan 18 HX A14VIG
Intel Core i9-14900HX, NVIDIA GeForce RTX 4090 Laptop GPU
174.5 (151.1min) fps -10%
Alienware m18 R2
Intel Core i9-14900HX, NVIDIA GeForce RTX 4090 Laptop GPU
171.8 (143.6min) fps -12%
Razer Blade 18 2024 RZ09-0509
Intel Core i9-14900HX, NVIDIA GeForce RTX 4090 Laptop GPU
164 (140min) fps -16%
Média da turma Gaming
  (84.8 - 248, n=107, últimos 2 anos)
153.7 fps -21%
X-Plane 11.11 - 1920x1080 high (fps_test=3)
Alienware m18 R2
Intel Core i9-14900HX, NVIDIA GeForce RTX 4090 Laptop GPU
140.6 fps +15%
Schenker Key 17 Pro (M24)
Intel Core i9-14900HX, NVIDIA GeForce RTX 4090 Laptop GPU
139.7 fps +15%
Razer Blade 18 2024 RZ09-0509
Intel Core i9-14900HX, NVIDIA GeForce RTX 4090 Laptop GPU
127.2 fps +4%
MSI Titan 18 HX A14VIG
Intel Core i9-14900HX, NVIDIA GeForce RTX 4090 Laptop GPU
126.1 fps +4%
Asus ROG Strix Scar 18 G835LXG
Intel Core Ultra 9 290HX Plus, NVIDIA GeForce RTX 5090 Laptop
121.8 fps
Asus Strix Scar 18 G835LX
Intel Core Ultra 9 275HX, NVIDIA GeForce RTX 5090 Laptop
121.7 fps 0%
Acer Predator Helios 18 PH18-72-98MW
Intel Core i9-14900HX, NVIDIA GeForce RTX 4090 Laptop GPU
114.5 fps -6%
Média da turma Gaming
  (55.5 - 143.5, n=109, últimos 2 anos)
98.7 fps -19%
The Witcher 3
1024x768 Low Graphics & Postprocessing
MSI Titan 18 HX A14VIG
Intel Core i9-14900HX, NVIDIA GeForce RTX 4090 Laptop GPU
595.3 (554min) fps +33%
Alienware m18 R2
Intel Core i9-14900HX, NVIDIA GeForce RTX 4090 Laptop GPU
585.5 (526min) fps +31%
Média da turma Gaming
  (447 - 686, n=2, últimos 2 anos)
567 fps +27%
Asus ROG Strix Scar 18 G835LXG
Intel Core Ultra 9 290HX Plus, NVIDIA GeForce RTX 5090 Laptop
447 (29.3min, 93.2P0.1, 271P1) fps
Média NVIDIA GeForce RTX 5090 Laptop
  (n=1)
447 fps 0%
1366x768 Medium Graphics & Postprocessing
Alienware m18 R2
Intel Core i9-14900HX, NVIDIA GeForce RTX 4090 Laptop GPU
525.8 (493min) fps +23%
MSI Titan 18 HX A14VIG
Intel Core i9-14900HX, NVIDIA GeForce RTX 4090 Laptop GPU
506.6 (447min) fps +18%
Média da turma Gaming
  (428 - 517, n=2, últimos 2 anos)
473 fps +11%
Asus ROG Strix Scar 18 G835LXG
Intel Core Ultra 9 290HX Plus, NVIDIA GeForce RTX 5090 Laptop
428 (15.6min, 153P0.1, 268P1) fps
Média NVIDIA GeForce RTX 5090 Laptop
  (n=1)
428 fps 0%
1920x1080 High Graphics & Postprocessing (Nvidia HairWorks Off)
MSI Titan 18 HX A14VIG
Intel Core i9-14900HX, NVIDIA GeForce RTX 4090 Laptop GPU
412.2 (387min) fps +2%
Alienware m18 R2
Intel Core i9-14900HX, NVIDIA GeForce RTX 4090 Laptop GPU
405.6 (374min) fps 0%
Asus ROG Strix Scar 18 G835LXG
Intel Core Ultra 9 290HX Plus, NVIDIA GeForce RTX 5090 Laptop
404 (88.1min, 153.9P0.1, 264P1) fps
Média NVIDIA GeForce RTX 5090 Laptop
  (n=1)
404 fps 0%
Média da turma Gaming
  (341 - 404, n=2, últimos 2 anos)
373 fps -8%
1920x1080 Ultra Graphics & Postprocessing (HBAO+)
Asus ROG Strix Scar 18 G835LXG
Intel Core Ultra 9 290HX Plus, NVIDIA GeForce RTX 5090 Laptop
234 (14.7min, 99.6P0.1, 147.5P1) fps
Média NVIDIA GeForce RTX 5090 Laptop
  (192 - 240, n=5)
222 fps -5%
MSI Titan 18 HX A14VIG
Intel Core i9-14900HX, NVIDIA GeForce RTX 4090 Laptop GPU
211.2 (165min) fps -10%
Alienware m18 R2
Intel Core i9-14900HX, NVIDIA GeForce RTX 4090 Laptop GPU
205.7 (193min) fps -12%
Média da turma Gaming
  (104.7 - 240, n=7, últimos 2 anos)
196.3 fps -16%
Razer Blade 18 2024 RZ09-0509
Intel Core i9-14900HX, NVIDIA GeForce RTX 4090 Laptop GPU
193 (53.6P0.1, 119.7P1) fps -18%
Acer Predator Helios 18 PH18-72-98MW
Intel Core i9-14900HX, NVIDIA GeForce RTX 4090 Laptop GPU
180 fps -23%

Gráfico de FPS – 30 min Cyberpunk 2077 1920 x 1080 Predefinição Ultra (FSR desativado)
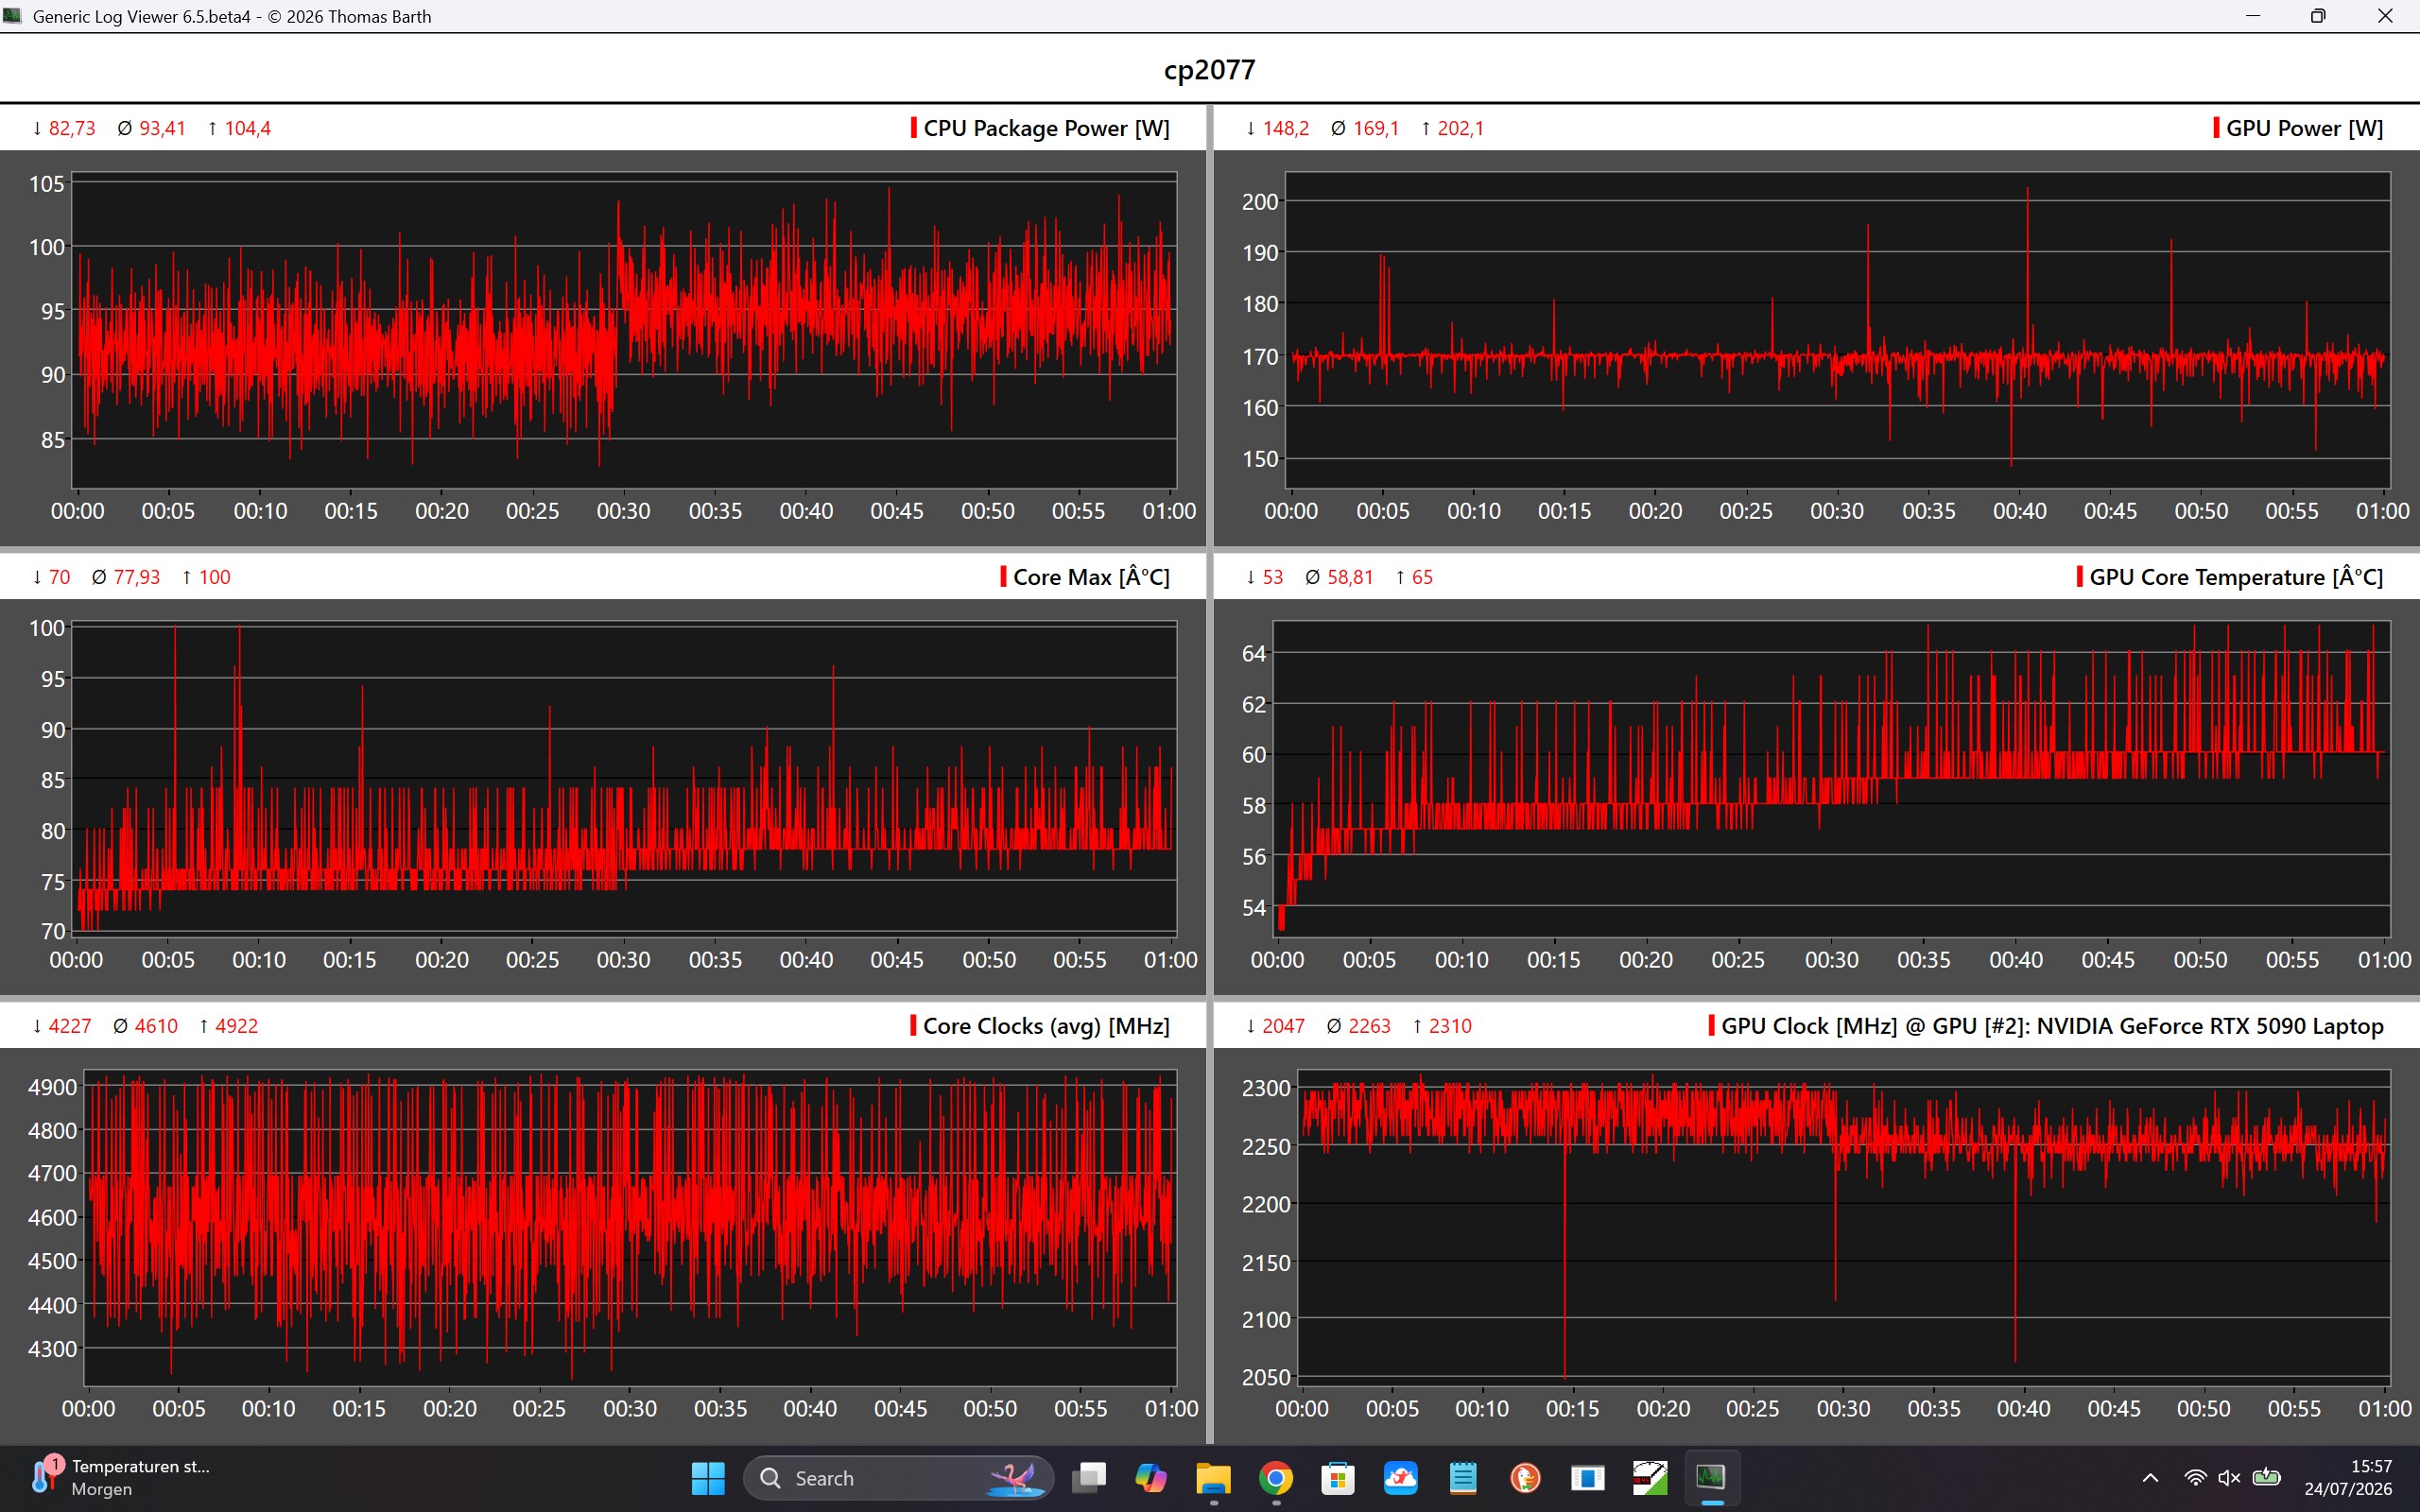
05101520253035404550556065707580859095100105110115120125130135140145150155160165Tooltip
Asus ROG Strix Scar 18 G835LXG Ultra 9 290HX Plus, GeForce RTX 5090 Laptop: Ø163.1 (152.9-166.7) fps
Asus Strix Scar 18 G835LX Ultra 9 275HX, GeForce RTX 5090 Laptop: Ø144.2 (124.3-147.1) fps
Especificações de CPU/GPU para Cyberpunk 2077
baixomédiaaltoultraQHD4K
GTA V (2015) 187.7 187.1 186.8 173 173.7 186.6
The Witcher 3 (2015) 447 428 404 234 193.5 170.9
Dota 2 Reborn (2015) 238.8 217.9 207.9 194.7 193.1
Final Fantasy XV Benchmark (2018) 234 231 214 174 107
X-Plane 11.11 (2018) 149.3 150.3 121.8 97.6
Strange Brigade (2018) 654 500 494 458 354 184.5
Baldur's Gate 3 (2023) 229 240 212 207 152.8 87.4
Cyberpunk 2077 (2023) 209 194.8 173.3 169.4 118.7 56.1
Alan Wake 2 (2023) 145.3 143.5 132.7 88.3 46
F1 24 (2024) 363 391 372 163.6 109.4 54.3
Black Myth: Wukong (2024) 182 135 107 65 49 29
Indiana Jones and the Great Circle (2024) 217 183.2 164.5 152.5 122.8 75
Kingdom Come Deliverance 2 (2025) 252 206 177.7 126.8 94.4 54.7
Assassin's Creed Shadows (2025) 113 111 96 75 64 46
F1 25 (2025) 286 266 255 65.3 39.1 18.8
Anno 117: Pax Romana (2025) 191.3 149.4 121.6 69.8 49.5 28.2
Call of Duty Black Ops 7 (2025) 216 208 170 69 47 31
Pragmata (2026) 257 199.9 164.9 125 71.4
007 First Light (2026) 135 128 111.8 108.2 78.6 45.9

Emissões e Energia

Ruído do sistema

O nível de ruído do Asus ROG Strix SCAR 18 depende fortemente do perfil de energia selecionado. Para o uso diário, recomenda-se o Modo Silencioso, já que as ventoinhas costumam parar de funcionar sob carga leve e o laptop opera com um nível de ruído agradavelmente baixo. Mesmo jogos menos exigentes podem ser jogados nesse perfil com ruído de fundo moderado.

No Modo Turbo, no entanto, as ventoinhas funcionam continuamente e atingem até 55,1 dB(A) sob carga pesada ou durante jogos. Portanto, recomenda-se o uso de fones de ouvido para sessões de jogo mais longas. Um aspecto positivo é que o desempenho de resfriamento permanece consistente mesmo nesse alto nível de ruído. Um leve ruído eletrônico de fundo ocorreu apenas em alguns benchmarks sintéticos da GPU e não foi perceptível durante a operação normal ou durante jogos.

Barulho

Ocioso
30.9 / 31 / 31.1 dB
Carga
47.8 / 55.1 dB
  red to green bar
 
 
30 dB
silencioso
40 dB(A)
audível
50 dB(A)
ruidosamente alto
 
min: dark, med: mid, max: light   Earthworks M23R (15 cm de distância)   ruído ambiente: 25 dB(A)
dB(A) 0102030405060708090Deep BassMiddle BassHigh BassLower RangeMidsHigher MidsLower HighsMid HighsUpper HighsSuper Highs2032.634.834.632.728.344.72529.728.528.624.828.833.43131.926.428.1263035.94022.922.119.92223.532.15022.525.219.919.218.933.36321.219.216.817.915.732.98023.617.515.314.511.431.710022.616.416.315.512.334.212526.516.316.316.111.432.116026.416.717.517.51332.72002817.418.518.110.431.72503018.419.418.31038.531530.819.218.218.89.236.140035.124.624.223.610.142.650032.520.120.420.110.644.363036.322.922.822.81038.180036.621.421.621.910.437.2100036.82120.620.611.939.3125037.520.319.919.61242.5160038.120.720.420.411.942.8200039.220.1202011.938.2250037.518.718.218.212.437.531503516.516.616.313.236.44000341514.91513.838.150003314.714.614.614.134.3630031.215.114.914.914.533.8800026151514.914.732.81000024.815.715.715.61534.51250025.415.11515.114.630.41600025.516.416.516.214.224.7SPL47.831.13130.92551N5.91.41.41.40.68median 32.5median 17.4median 18.2median 18.1median 12median 36.4Delta5.32.32.42.41.83.2hearing rangehide median Fan NoiseAsus ROG Strix Scar 18 G835LXG
Asus ROG Strix Scar 18 G835LXG
Ultra 9 290HX Plus, GeForce RTX 5090 Laptop
Asus Strix Scar 18 G835LX
Ultra 9 275HX, GeForce RTX 5090 Laptop
Razer Blade 18 2024 RZ09-0509
i9-14900HX, GeForce RTX 4090 Laptop GPU
Alienware m18 R2
i9-14900HX, GeForce RTX 4090 Laptop GPU
Acer Predator Helios 18 PH18-72-98MW
i9-14900HX, GeForce RTX 4090 Laptop GPU
MSI Titan 18 HX A14VIG
i9-14900HX, GeForce RTX 4090 Laptop GPU
Schenker Key 17 Pro (M24)
i9-14900HX, GeForce RTX 4090 Laptop GPU
Noise
5%
8%
12%
-5%
10%
9%
desligado / ambiente * (dB)
25
23.3
7%
23.4
6%
23.6
6%
25
-0%
22.8
9%
23.41
6%
Idle Minimum * (dB)
30.9
29.8
4%
23.9
23%
23.8
23%
30
3%
23.8
23%
25.33
18%
Idle Average * (dB)
31
29.8
4%
28.2
9%
26.1
16%
36
-16%
23.8
23%
25.33
18%
Idle Maximum * (dB)
31.1
29.8
4%
29
7%
31.5
-1%
44
-41%
28
10%
25.33
19%
Load Average * (dB)
47.8
42.9
10%
36.8
23%
31.5
34%
48
-0%
38
21%
33.57
30%
Witcher 3 ultra * (dB)
55.2
54.1
2%
52.1
6%
49
11%
57.3
-4%
Cyberpunk 2077 ultra * (dB)
55.1
53.7
3%
61.97
-12%
Load Maximum * (dB)
55.1
53.7
3%
61.1
-11%
56.6
-3%
51
7%
62.8
-14%
62.14
-13%

* ... menor é melhor

Temperatura

As temperaturas da superfície do Asus ROG Strix SCAR 18 permanecem bem controladas, mesmo sob carga pesada. Medimos temperaturas de até 45 °C apenas em áreas isoladas na parte inferior do aparelho. O teclado, por outro lado, aquece apenas ligeiramente, de modo que a área WASD, em particular, permanece agradavelmente fria mesmo durante sessões de jogo mais longas.

No teste de estresse, o sistema de resfriamento prioriza a GeForce RTX 5090 Laptop, que se estabiliza após um curto período de tempo em um TGP de aproximadamente 175 watts. O Intel Core Ultra 9 290HX opera paralelamente a cerca de 95 watts. Apesar do alto consumo de energia, as temperaturas da CPU e da GPU permanecem dentro de uma faixa segura em todos os momentos.
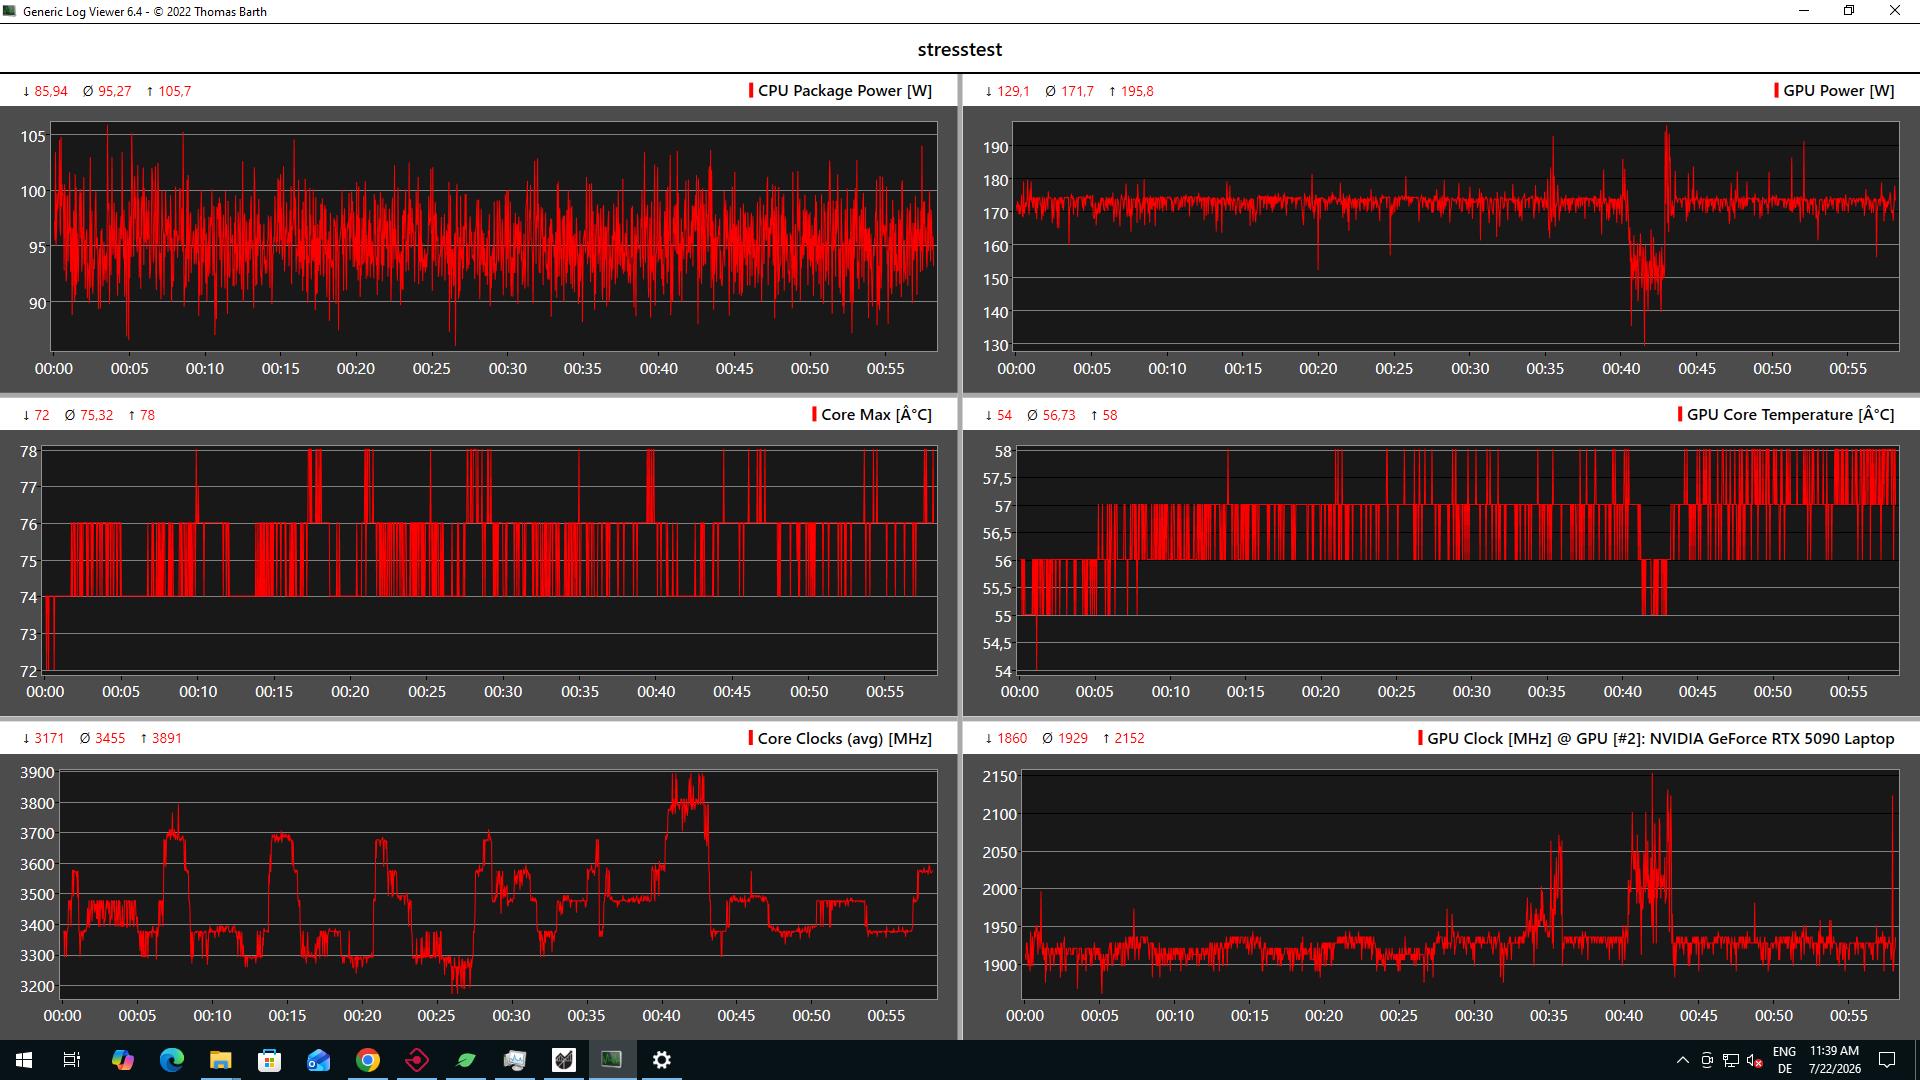
Teste de estresse de dados da CPU/GPU
 34.3 °C37.5 °C32.6 °C 
 29.2 °C34.6 °C27.7 °C 
 26.8 °C28.6 °C27.3 °C 
Máximo: 37.5 °C
Médio: 31 °C
25.8 °C40.9 °C28.5 °C
25.7 °C26.1 °C26.4 °C
26.3 °C27.5 °C27.4 °C
Máximo: 40.9 °C
Médio: 28.3 °C
alimentação elétrica  53.9 °C | Temperatura do quarto 22.7 °C | Fluke t3000FC (calibrated)
(+) A temperatura média para o lado superior sob carga máxima é 31 °C / 88 F, em comparação com a média de 33.9 °C / ###class_avg_f# ## F para os dispositivos da classe Gaming.
(+) A temperatura máxima no lado superior é 37.5 °C / 100 F, em comparação com a média de 40.4 °C / 105 F , variando de 21.2 a 68.8 °C para a classe Gaming.
(±) A parte inferior aquece até um máximo de 40.9 °C / 106 F, em comparação com a média de 43.2 °C / 110 F
(+) Em uso inativo, a temperatura média para o lado superior é 28 °C / 82 F, em comparação com a média do dispositivo de 33.9 °C / ### class_avg_f### F.
(±) 3: The average temperature for the upper side is 32.7 °C / 91 F, compared to the average of 33.9 °C / 93 F for the class Gaming.
(+) Os apoios para as mãos e o touchpad são mais frios que a temperatura da pele, com um máximo de 30.7 °C / 87.3 F e, portanto, são frios ao toque.
(±) A temperatura média da área do apoio para as mãos de dispositivos semelhantes foi 28.8 °C / 83.8 F (-1.9 °C / -3.5 F).
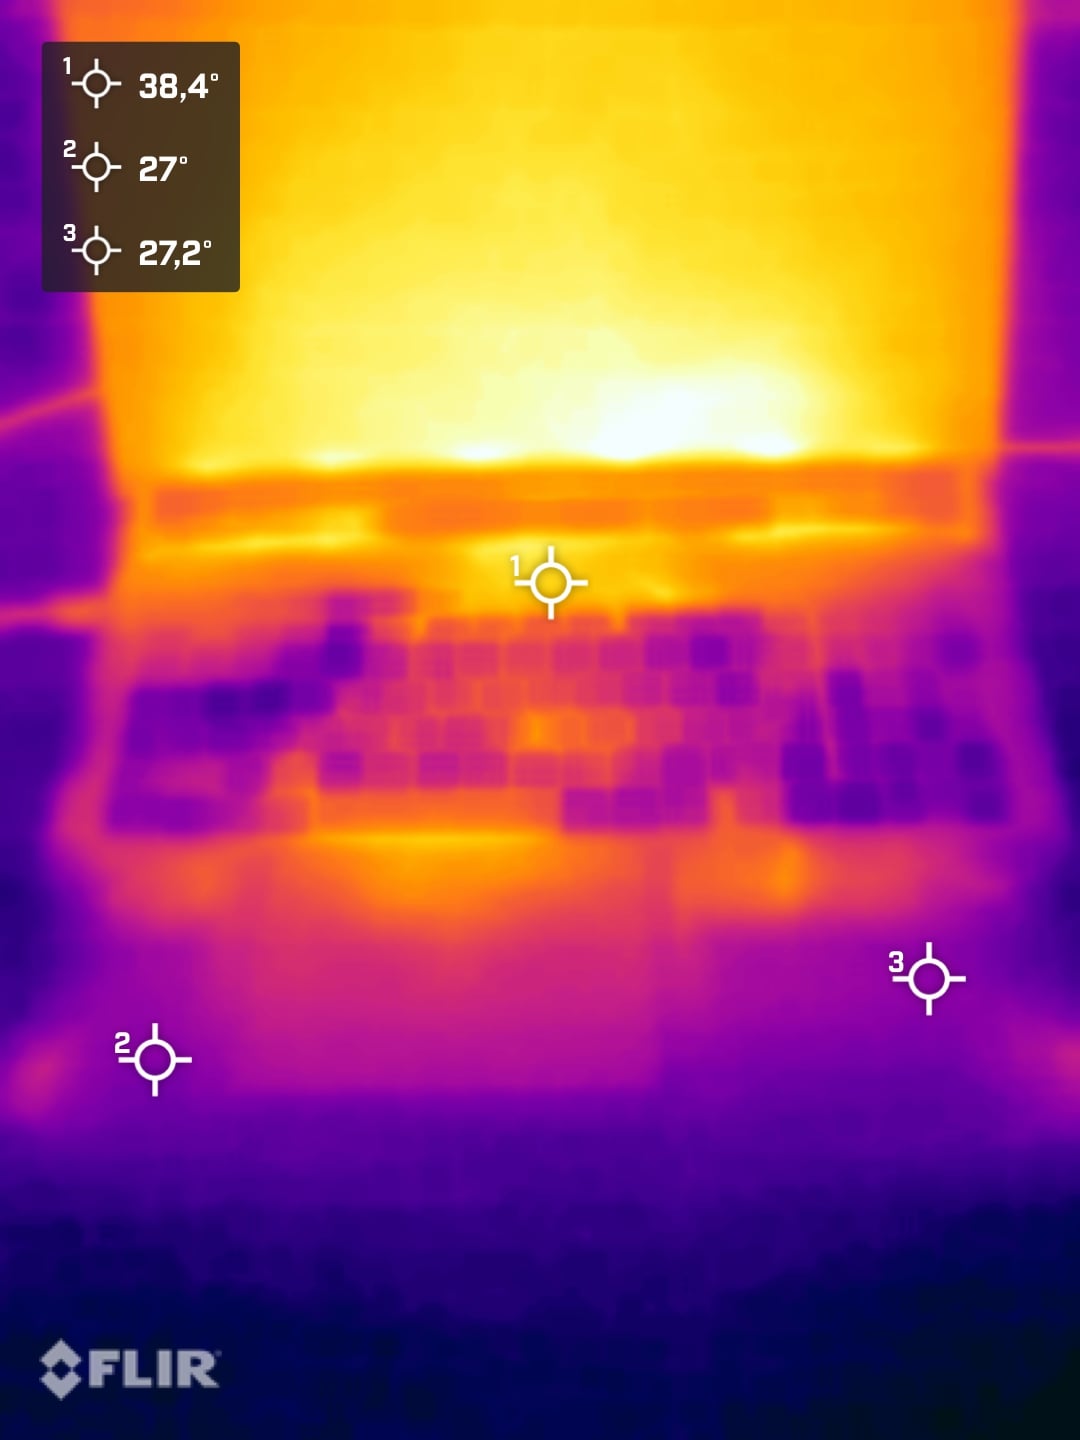
Teste de resistência à temperatura superficial (lado superior)
Teste de estresse de temperatura superficial (lado inferior)
Fonte de alimentação em teste de estresse
Asus ROG Strix Scar 18 G835LXG
Ultra 9 290HX Plus, GeForce RTX 5090 Laptop
Asus Strix Scar 18 G835LX
Ultra 9 275HX, GeForce RTX 5090 Laptop
Razer Blade 18 2024 RZ09-0509
i9-14900HX, GeForce RTX 4090 Laptop GPU
Alienware m18 R2
i9-14900HX, GeForce RTX 4090 Laptop GPU
Acer Predator Helios 18 PH18-72-98MW
i9-14900HX, GeForce RTX 4090 Laptop GPU
MSI Titan 18 HX A14VIG
i9-14900HX, GeForce RTX 4090 Laptop GPU
Schenker Key 17 Pro (M24)
i9-14900HX, GeForce RTX 4090 Laptop GPU
Heat
-6%
-14%
-19%
-19%
-6%
-45%
Maximum Upper Side * (°C)
37.5
45.6
-22%
43.2
-15%
41.2
-10%
43
-15%
37.8
-1%
51
-36%
Maximum Bottom * (°C)
40.9
46
-12%
42.6
-4%
34.6
15%
59
-44%
37.6
8%
64
-56%
Idle Upper Side * (°C)
31.1
28.9
7%
36
-16%
42.8
-38%
32
-3%
34.8
-12%
42.3
-36%
Idle Bottom * (°C)
30.2
29.2
3%
36.4
-21%
43.6
-44%
34
-13%
36
-19%
46
-52%

* ... menor é melhor

Palestrantes

O Asus ROG Strix SCAR 18 possui um sistema de quatro alto-falantes que oferece boa qualidade sonora geral. As vozes são reproduzidas com clareza, e músicas e filmes também se beneficiam de um perfil de som bem equilibrado. Em uma comparação direta com alguns concorrentes de ponta, no entanto, existem sistemas com som ainda mais potente e graves mais profundos. Para jogos, recomendamos o uso de fones de ouvido de qualquer forma, já que os ventiladores são claramente audíveis sob carga pesada.

dB(A) 0102030405060708090Deep BassMiddle BassHigh BassLower RangeMidsHigher MidsLower HighsMid HighsUpper HighsSuper Highs2028.333.42528.828.63130294023.522.65018.933.56315.722.88011.434.710012.342.812511.446.61601351.620010.455.825010603159.263.440010.165.950010.668.66301073.980010.476.1100011.973.712501275.5160011.974.1200011.967250012.464.6315013.262.6400013.858500014.153.6630014.553.4800014.759.5100001573.41250014.667.91600014.259.9SPL2582.6N0.651.8median 12median 63.4Delta1.89.426.325.821.422.12624.925.127.622.532.523.448.72655.818.860.922.167.2267019.372.317.674.217.774.319.575.31571.711.871.311.27410.574.21072.710.17210.67210.97511.374.811.671.71269.71269.612.371.112.669.61270.111.269.824.784.70.666.6median 12median 71.73.42.2hearing rangehide median Pink NoiseAsus ROG Strix Scar 18 G835LXGApple MacBook Pro 16 2021 M1 Pro
Diagrama de frequência (as caixas de seleção podem ser marcadas e desmarcadas para comparar dispositivos)
Asus ROG Strix Scar 18 G835LXG análise de áudio

(+) | os alto-falantes podem tocar relativamente alto (###valor### dB)
Graves 100 - 315Hz
(±) | graves reduzidos - em média 10% menor que a mediana
(±) | a linearidade dos graves é média (9.3% delta para a frequência anterior)
Médios 400 - 2.000 Hz
(±) | médios mais altos - em média 8.5% maior que a mediana
(+) | médios são lineares (6.2% delta para frequência anterior)
Altos 2 - 16 kHz
(±) | máximos reduzidos - em média 5.8% menor que a mediana
(±) | a linearidade dos máximos é média (9.4% delta para frequência anterior)
Geral 100 - 16.000 Hz
(±) | a linearidade do som geral é média (16.2% diferença em relação à mediana)
Comparado com a mesma classe
» 40% de todos os dispositivos testados nesta classe foram melhores, 7% semelhantes, 53% piores
» O melhor teve um delta de 6%, a média foi 18%, o pior foi 132%
Comparado com todos os dispositivos testados
» 26% de todos os dispositivos testados foram melhores, 6% semelhantes, 68% piores
» O melhor teve um delta de 4%, a média foi 23%, o pior foi 134%

Apple MacBook Pro 16 2021 M1 Pro análise de áudio

(+) | os alto-falantes podem tocar relativamente alto (###valor### dB)
Graves 100 - 315Hz
(+) | bons graves - apenas 3.8% longe da mediana
(+) | o baixo é linear (5.2% delta para a frequência anterior)
Médios 400 - 2.000 Hz
(+) | médios equilibrados - apenas 1.3% longe da mediana
(+) | médios são lineares (2.1% delta para frequência anterior)
Altos 2 - 16 kHz
(+) | agudos equilibrados - apenas 1.9% longe da mediana
(+) | os máximos são lineares (2.7% delta da frequência anterior)
Geral 100 - 16.000 Hz
(+) | o som geral é linear (4.6% diferença em relação à mediana)
Comparado com a mesma classe
» 0% de todos os dispositivos testados nesta classe foram melhores, 0% semelhantes, 100% piores
» O melhor teve um delta de 5%, a média foi 17%, o pior foi 45%
Comparado com todos os dispositivos testados
» 0% de todos os dispositivos testados foram melhores, 0% semelhantes, 100% piores
» O melhor teve um delta de 4%, a média foi 23%, o pior foi 134%

Gestão de energia

O Asus ROG Strix SCAR 18 não está entre os notebooks para jogos mais eficientes em termos de consumo de energia. Mesmo em modo de espera, seu consumo de energia é comparativamente alto devido ao seu hardware potente e à tela Mini-LED de alto brilho. Sob carga total, o sistema atinge brevemente um consumo de energia de até 354 watts, mas depois se estabiliza em torno de 230 watts. A fonte de alimentação de 450 watts incluída oferece, portanto, margem suficiente. O consumo de energia em modo de espera é desnecessariamente alto, chegando a 19 watts.

Asus ROG Strix SCAR 18 com fonte de alimentação de 450 watts
Fonte de alimentação de 450 watts

Consumo de energia e duração da bateria

Naturalmente, a bateria de 90 Wh do Asus ROG Strix SCAR 18 só consegue compensar o alto consumo de energia do sistema até certo ponto. Em um teste prático com Wi-Fi, o notebook para jogos atingiu uma autonomia de apenas 4 horas. Alguns concorrentes oferecem melhores resultados nesse aspecto.

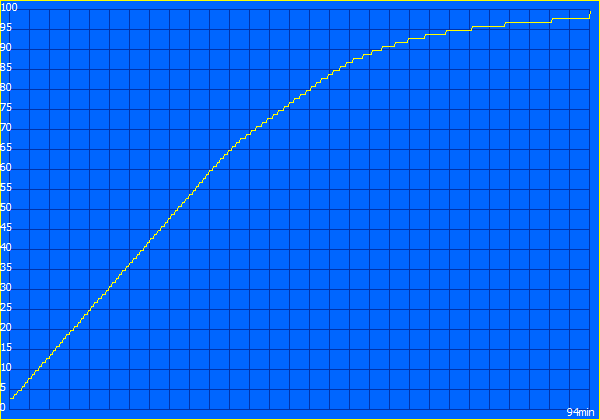
Informações sobre a bateria
Processo de carregamento
Consumo de energia
desligadodarklight 0.8 / 19.4 Watt
Ociosodarkmidlight 15.5 / 43.2 / 47.6 Watt
Carga midlight 163.9 / 354 Watt
 color bar
Key: min: dark, med: mid, max: light        Metrahit Energy

Consumo de energia: Cyberpunk / Teste de estresse

0102030405060708090100110120130140150160170180190200210220230240250260270280290300310320330340350Tooltip
Asus ROG Strix Scar 18 G835LXG; 1280x720 Prime95 28.10 and Furmark 1.25: Ø229 (160.4-354) Watt
Asus ROG Strix Scar 18 G835LXG; Idle 150cd/m2: Ø37.3 (22.4-50.4) Watt
Asus ROG Strix Scar 18 G835LXG; Cyberpunk 2077 FHD ultra no FSR 150cd: Ø254 (249-269) Watt

Consumo de energia com um monitor externo

05101520253035404550556065707580859095100105110115120125130135140145150155160165170175180185190195200205210215220225230235240245Tooltip
Asus ROG Strix Scar 18 G835LXG; Prime95 V2810 Stress (external Monitor): Ø190.3 (177.2-205) Watt
Asus ROG Strix Scar 18 G835LXG; Cinebench R15 Multi (external Monitor): Ø190.3 (189.5-191.1) Watt
Asus ROG Strix Scar 18 G835LXG; Cinebench R23 Single (external Monitor): Ø73.8 (69.2-99.1) Watt
Asus ROG Strix Scar 18 G835LXG; Cinebench R23 Multi (external Monitor): Ø189 (187.4-190.8) Watt
Asus ROG Strix Scar 18 G835LXG; 1280x720 FurMark 1.19 GPU Stress Test (external Monitor): Ø209 (192.1-223) Watt
Asus ROG Strix Scar 18 G835LXG; Idle 1min (external Monitor): Ø33.4 (17.6-51.5) Watt
Asus ROG Strix Scar 18 G835LXG; Cyberpunk 2077 FHD ultra no FSR (external Monitor): Ø241 (237-249) Watt
Tempo de Execução da Bateria
Ocioso (sem WLAN, min brilho)
2h 58min
WiFi Websurfing
4h 00min
WiFi Websurfing max. Brightness
2h 16min
Big Buck Bunny H.264 1080p
2h 08min
Carga (máximo brilho)
1h 31min
Asus ROG Strix Scar 18 G835LXG
Ultra 9 290HX Plus, GeForce RTX 5090 Laptop, 90 Wh
Asus Strix Scar 18 G835LX
Ultra 9 275HX, GeForce RTX 5090 Laptop, 90 Wh
Razer Blade 18 2024 RZ09-0509
i9-14900HX, GeForce RTX 4090 Laptop GPU, 91.7 Wh
Alienware m18 R2
i9-14900HX, GeForce RTX 4090 Laptop GPU, 97 Wh
Acer Predator Helios 18 PH18-72-98MW
i9-14900HX, GeForce RTX 4090 Laptop GPU, 90 Wh
MSI Titan 18 HX A14VIG
i9-14900HX, GeForce RTX 4090 Laptop GPU, 99.9 Wh
Schenker Key 17 Pro (M24)
i9-14900HX, GeForce RTX 4090 Laptop GPU, 99 Wh
Média da turma Gaming
 
Duração da bateria
65%
32%
20%
-24%
27%
-21%
138%
Reader / Idle (h)
3
6.6
120%
5.9
97%
H.264 (h)
2.1
5.8
176%
WiFi v1.3 (h)
4
5.5
38%
4.4
10%
4.8
20%
3.2
-20%
4.2
5%
3.4
-15%
Load (h)
1.5
1.2
-20%
1
-33%
1.1
-27%
1.2
-20%
1.1
-27%
Cyberpunk 2077 ultra 150cd (h)
0.7
1.1

Avaliação geral do Notebookcheck

Asus ROG Strix Scar 18 G835LXG - 07/24/2026 v8
Sebastian Bade

Acabamento
85 / 98 → 86%
Teclado
91%
Mouse
86%
Conectividade
75 / 80 → 94%
Peso
53 / 10-68 → 73%
Bateria
55 / 95 → 58%
Pantalha
87%
Desempenho do jogos
96%
Desempenho da aplicação
97%
Workstation
81%
Temperatura
93 / 95 → 97%
Ruído
59 / 90 → 65%
Áudio
78%
Câmera
33 / 75 → 43%
Médio
59%
87%
Gaming - Médio equilibrado
CO2 Emissions
No Data
Materials
0%
Packaging
50%
Power Use
41.8%
Repairability
40%
Software Updates
22.3%
Recycle Logo Total Sustainability Score: 25.7%

Comparação de alternativas possíveis

Imagem
Modelo / Análises
Preço
Peso
Altura
Tela
1.
87.4%
Asus ROG Strix Scar 18 G835LXG
Intel Core Ultra 9 290HX Plus ⎘
NVIDIA GeForce RTX 5090 Laptop ⎘
128 GB Memória, 8192 GB SSD
Amazon:
1. $7,439.00
HIDevolution [2026] ASUS ROG...
2. $6,284.00
HIDevolution [2026] ASUS ROG...
3. $6,019.00
HIDevolution [2026] ASUS ROG...
Preço de tabela: 8999€
3.6 kg35 mm18.00"
3840x2400
252 PPI
Mini LED
2.
88%
Asus Strix Scar 18 G835LX
Intel Core Ultra 9 275HX ⎘
NVIDIA GeForce RTX 5090 Laptop ⎘
64 GB Memória, 2048 GB SSD
Amazon: Preço de tabela: 5799€3.3 kg32 mm18.00"
2560x1600
168 PPI
Mini-LED
3.
90.5% v7 (old)
Razer Blade 18 2024 RZ09-0509
Intel Core i9-14900HX ⎘
NVIDIA GeForce RTX 4090 Laptop GPU ⎘
32 GB Memória
Amazon: Preço de tabela: 4500 USD3.1 kg21.9 mm18.00"
2560x1600
168 PPI
Mini-LED
4.
89.5% v7 (old)
Alienware m18 R2
Alienware m18 R2
Intel Core i9-14900HX ⎘
NVIDIA GeForce RTX 4090 Laptop GPU ⎘
32 GB Memória, 2048 GB SSD
Amazon:
1. $3,499.99
Dell Alienware m18 R2 Gaming...
2. $2,799.00
Alienware M18 Gaming Laptop ...
3. $3,699.00
Dell Alienware 18 Area-51 Ga...
Preço de tabela: 3300 USD
4 kg26.7 mm18.00"
2560x1600
168 PPI
IPS
5.
87.1% v7 (old)
Acer Predator Helios 18 PH18-72-98MW
Intel Core i9-14900HX ⎘
NVIDIA GeForce RTX 4090 Laptop GPU ⎘
32 GB Memória, 2048 GB SSD
Amazon:
1. $23.99
HSSDTECH DC in Power Jack Ch...
2. $84.99
330W Charger for Acer Predat...
3. $899.99
Acer Predator Helios 300 PH3...
3.3 kg29.5 mm18.00"
2560x1600
168 PPI
Mini-LED
6.
88.8% v7 (old)
MSI Titan 18 HX A14VIG
Intel Core i9-14900HX ⎘
NVIDIA GeForce RTX 4090 Laptop GPU ⎘
128 GB Memória, 4096 GB SSD
Amazon:
1. $6,699.99
msi Titan 18 HX AI 18" 240Hz...
2. $5,699.99
msi Titan 18 HX AI 18" 120Hz...
3. $2,699.99
msi Vector A18 HX 18” 240H...
Preço de tabela: 5000 USD
3.6 kg32.1 mm18.00"
3840x2400
252 PPI
Mini-LED
7.
85.1%
Schenker Key 17 Pro (M24)
Intel Core i9-14900HX ⎘
NVIDIA GeForce RTX 4090 Laptop GPU ⎘
32 GB Memória, 1024 GB SSD
Amazon:
Preço de tabela: 4273€
3.4 kg24.9 mm17.30"
3840x2160
255 PPI
IPS

Transparência

A seleção dos dispositivos a serem analisados ​​é feita pela nossa equipe editorial. A amostra de teste foi fornecida ao autor como empréstimo pelo fabricante ou varejista para fins desta revisão. O credor não teve influência nesta revisão, nem o fabricante recebeu uma cópia desta revisão antes da publicação. Não houve obrigação de publicar esta revisão. Como empresa de mídia independente, a Notebookcheck não está sujeita à autoridade de fabricantes, varejistas ou editores.

É assim que o Notebookcheck está testando

Todos os anos, o Notebookcheck analisa de forma independente centenas de laptops e smartphones usando procedimentos padronizados para garantir que todos os resultados sejam comparáveis. Desenvolvemos continuamente nossos métodos de teste há cerca de 20 anos e definimos padrões da indústria no processo. Em nossos laboratórios de teste, equipamentos de medição de alta qualidade são utilizados por técnicos e editores experientes. Esses testes envolvem um processo de validação em vários estágios. Nosso complexo sistema de classificação é baseado em centenas de medições e benchmarks bem fundamentados, o que mantém a objetividade.
Google LogoAdd as a preferred source on Google
Mail Logo
> Análises e revisões de portáteis e celulares > Análises > Análises > Monstro dos jogos com Mini-LED 4K, RTX 5090 e 128 GB de RAM – Análise do Asus ROG Strix SCAR 18 G835LXG
Sebastian Bade, 2026-07-26 (Update: 2026-07-26)