Veredicto - Uma grande economia de espaço para o escritório
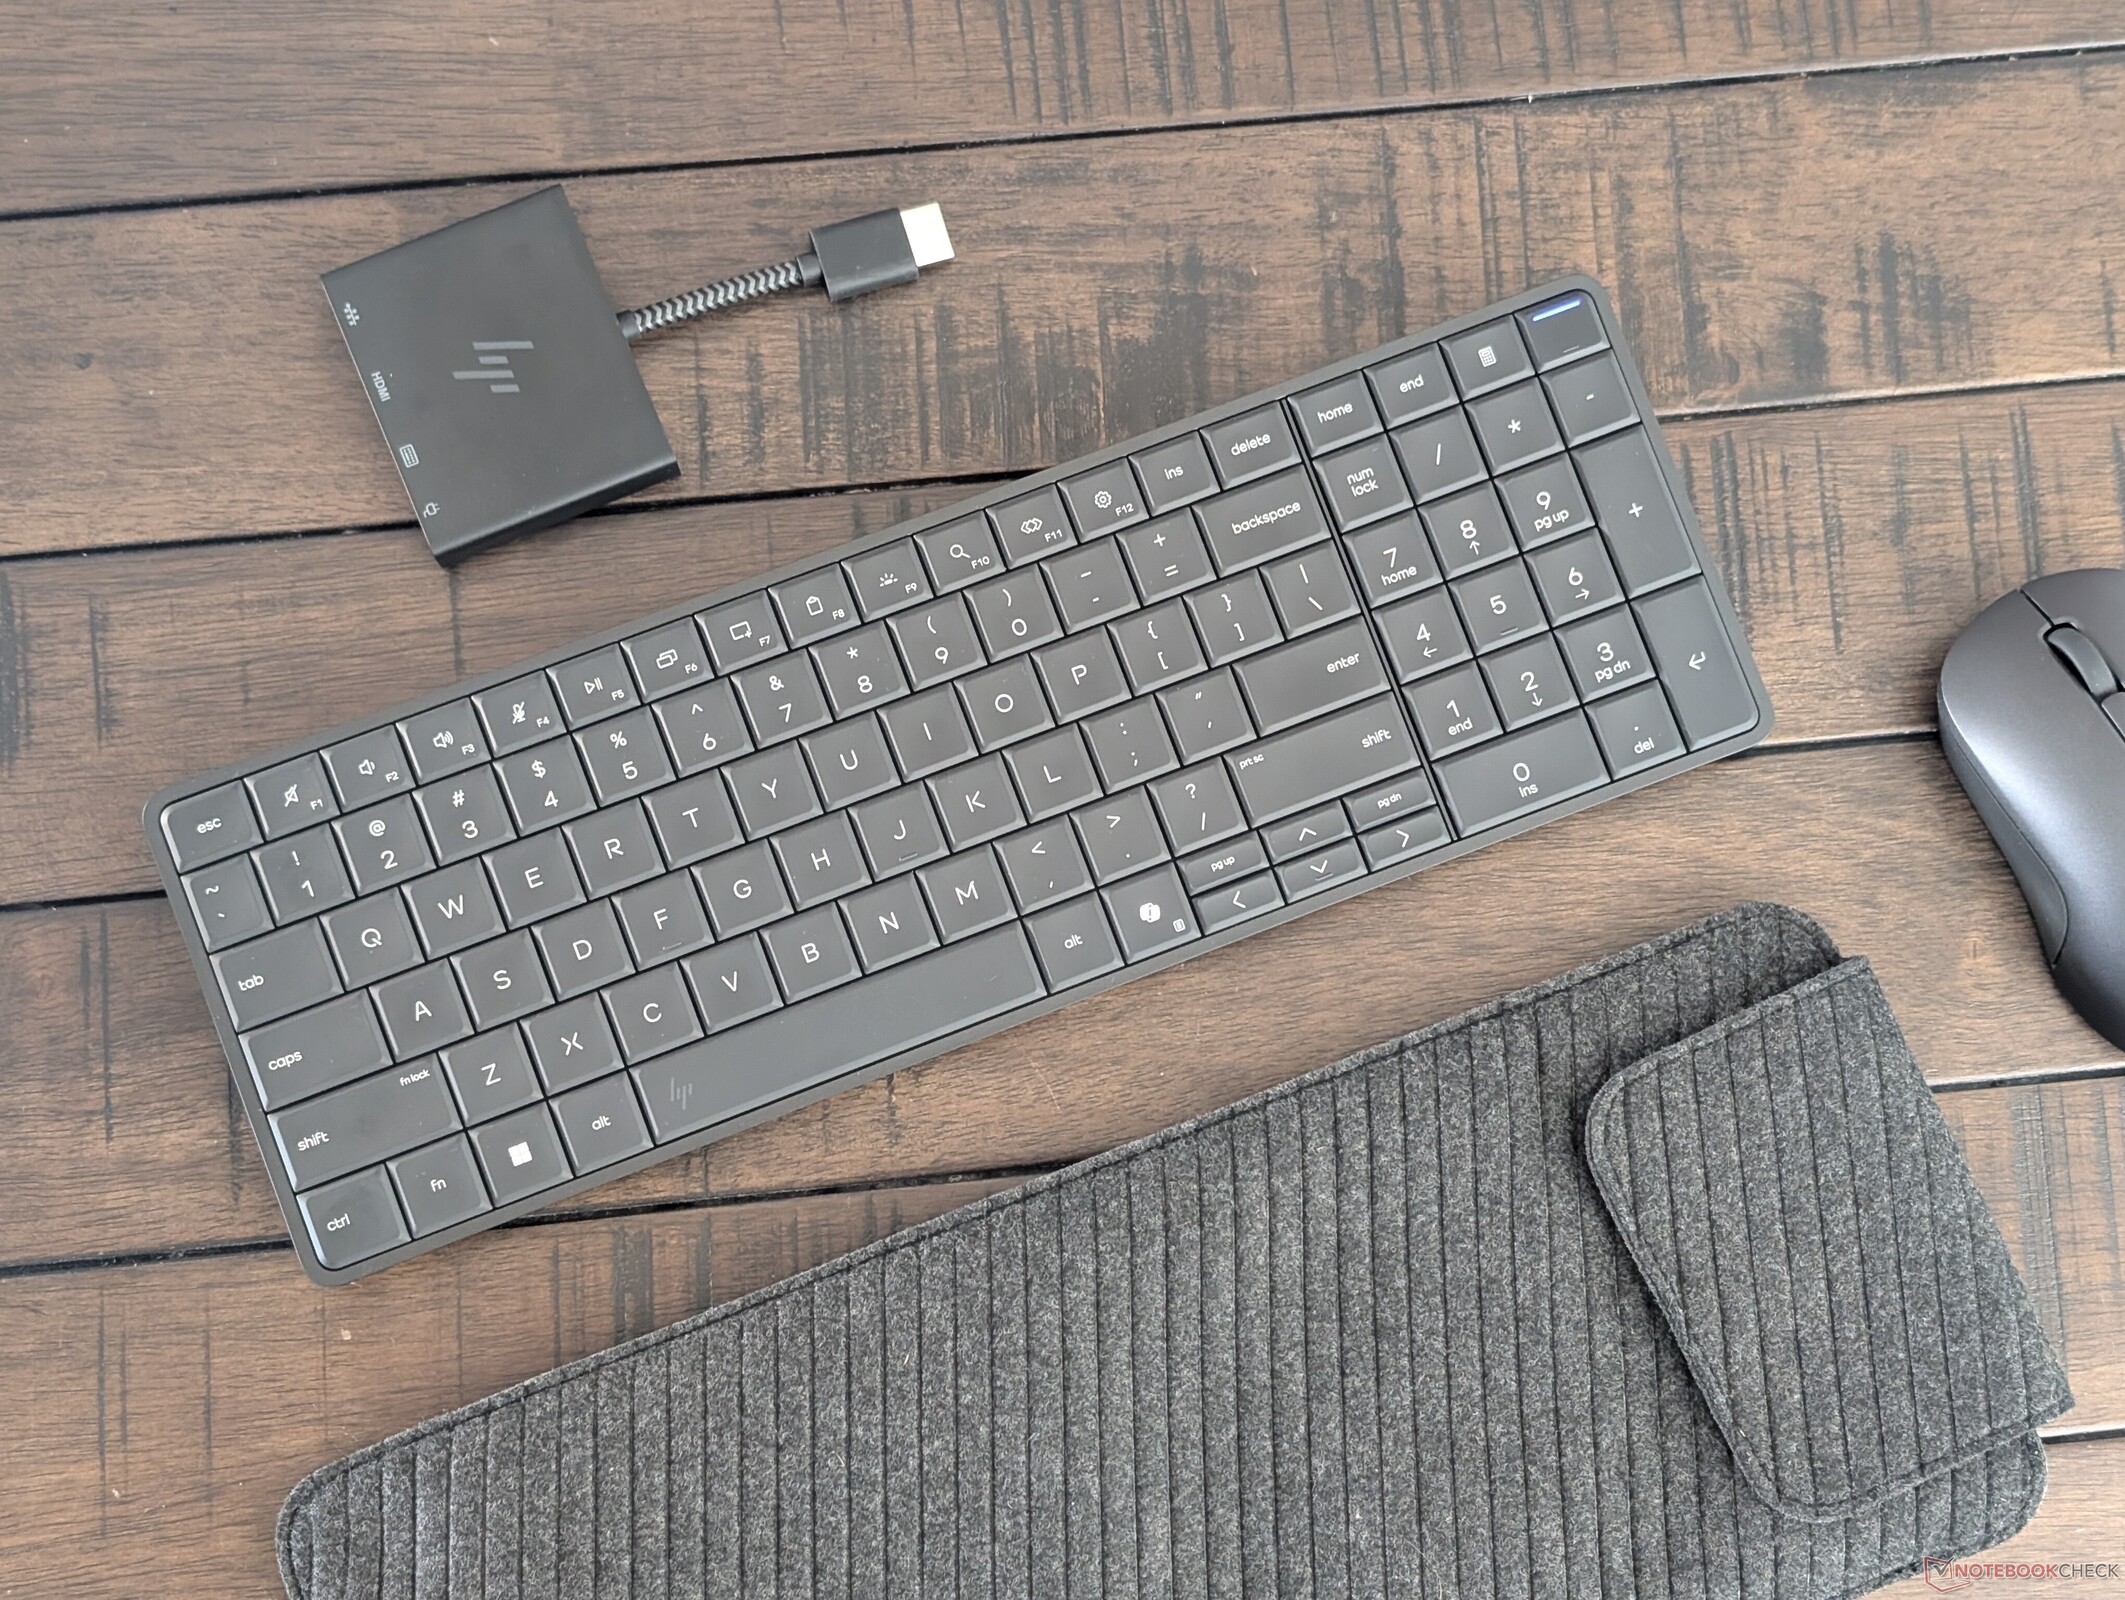
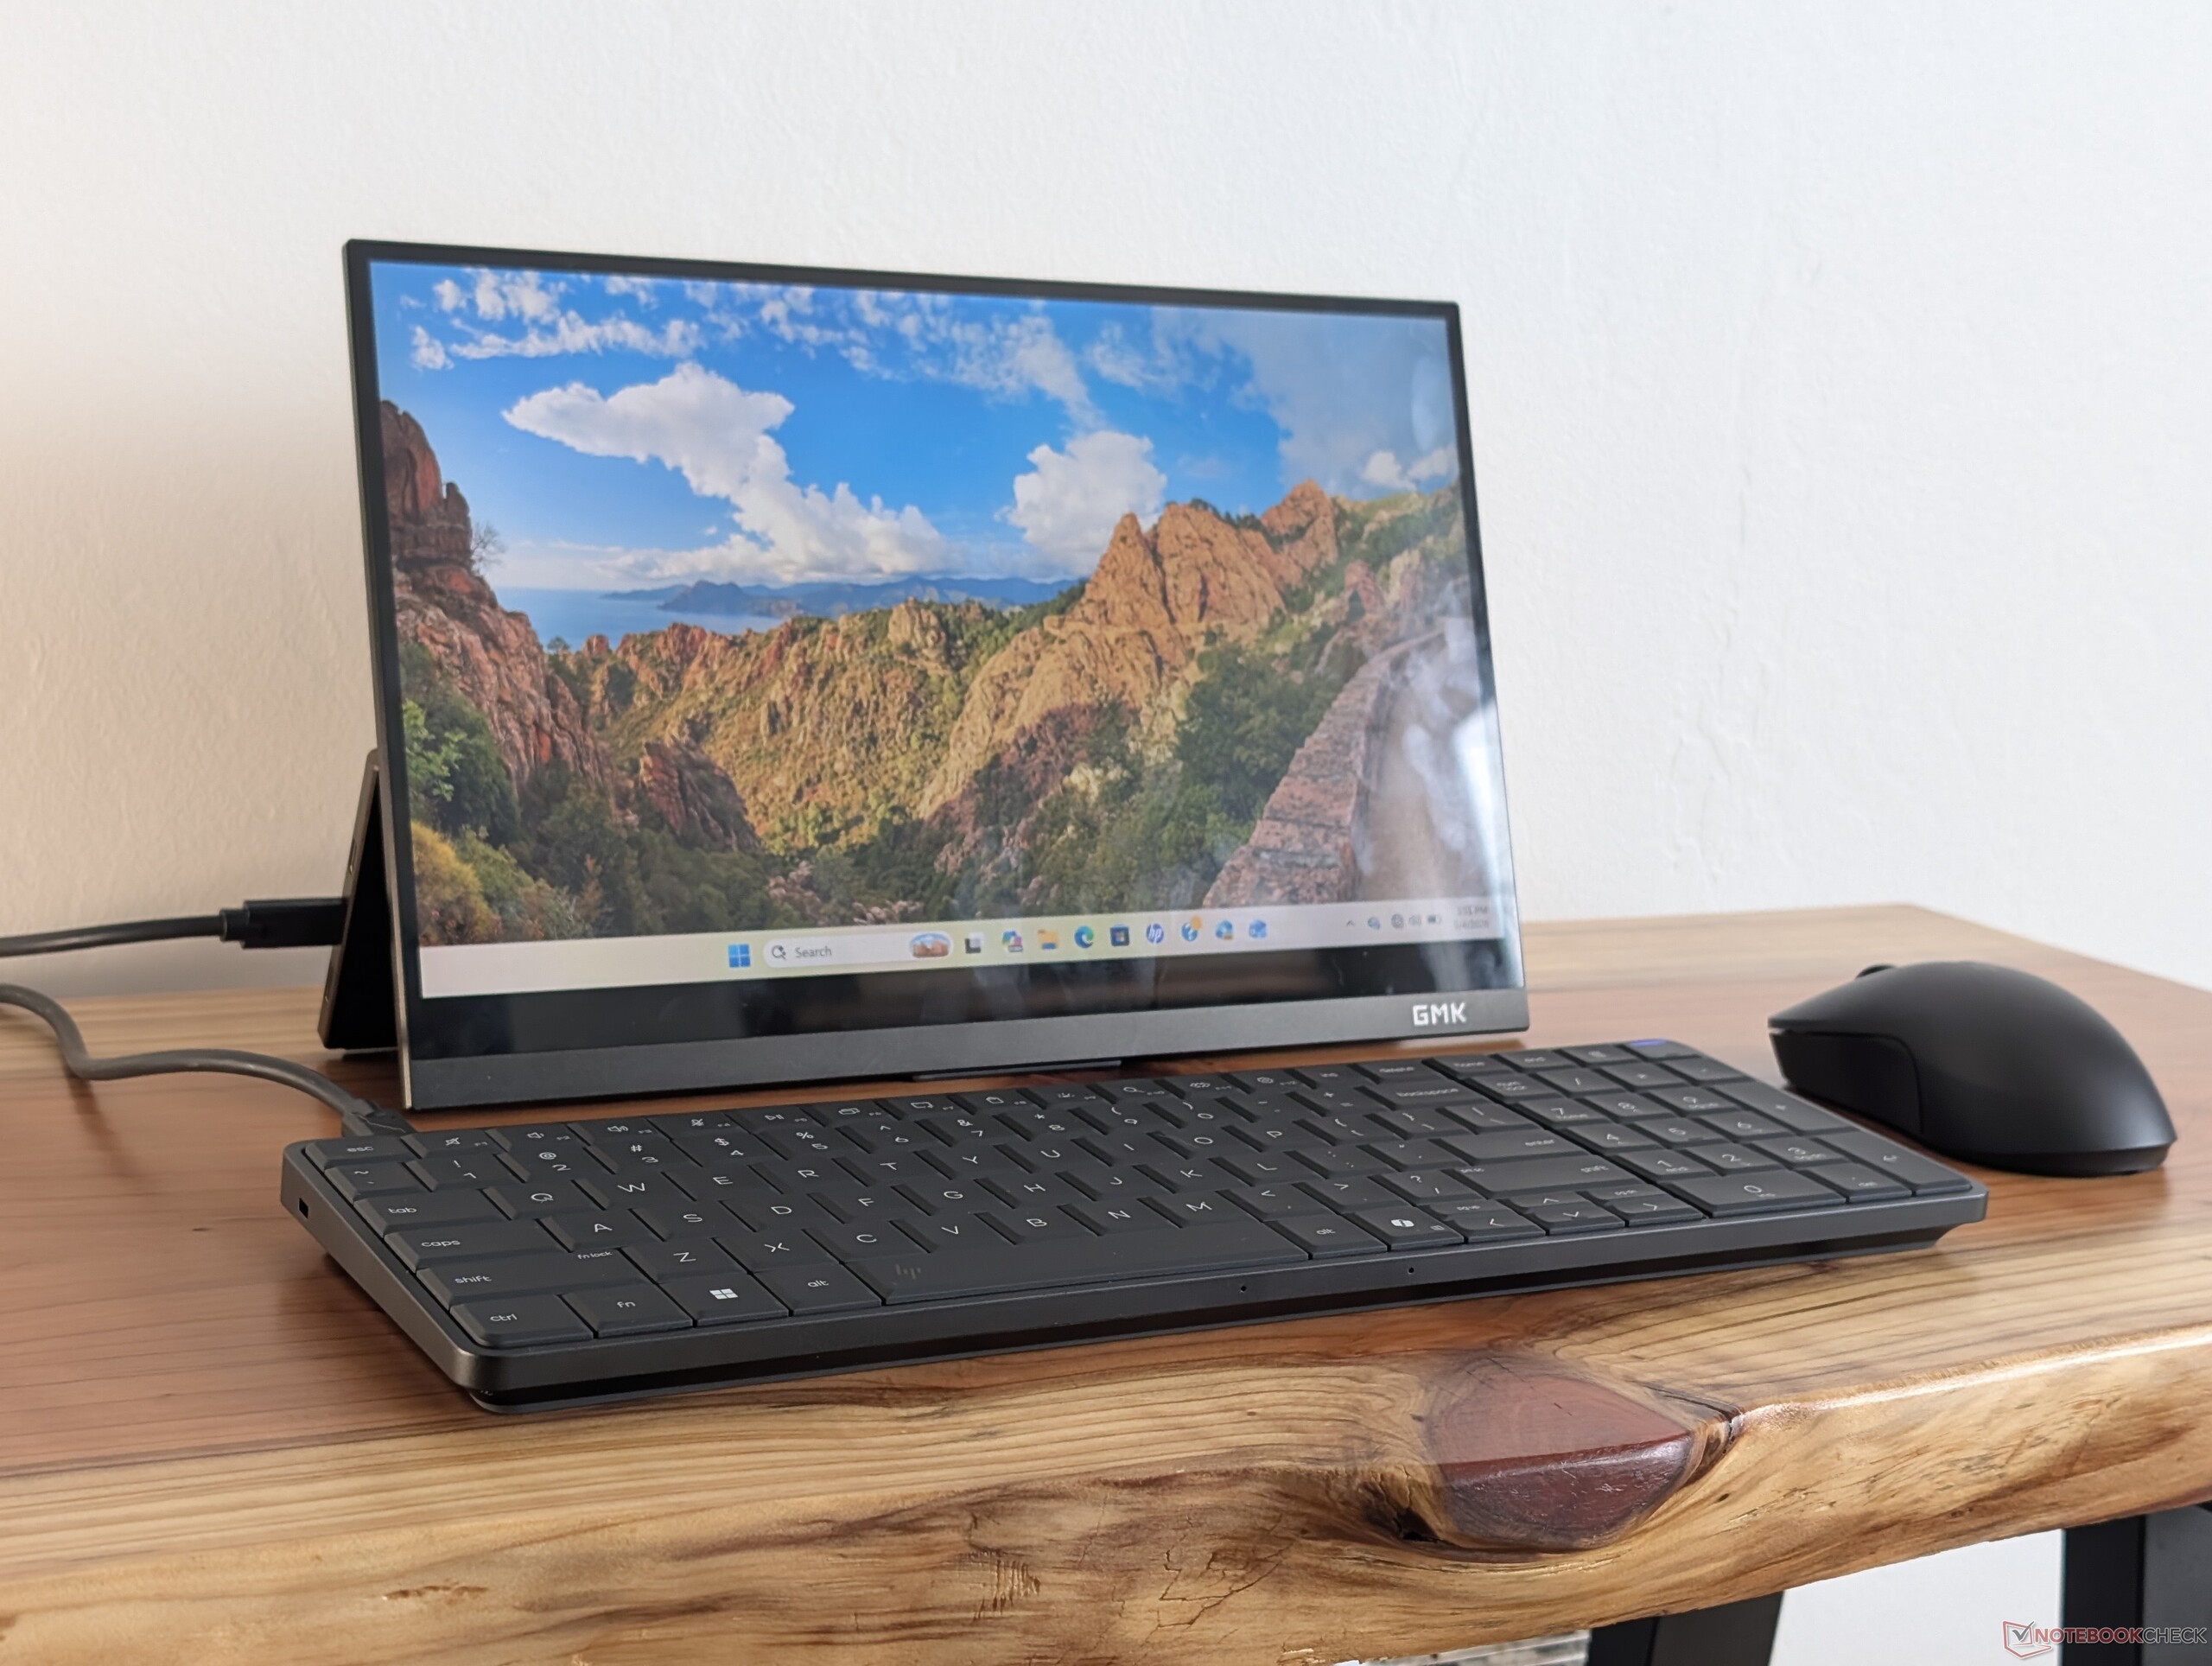
A melhor maneira de experimentar o EliteBoard G1a é com um monitor USB-C existente para reduzir a confusão de cabos em um espaço limitado na mesa. O design plug-and-play limpo e de cabo único é, sem dúvida, o aspecto mais atraente do EliteBoard quando comparado aos mini PCs ou AIOs tradicionais.
Para os usuários que se deslocam constantemente entre espaços de trabalho ou terminais, o EliteBoard pode ser configurado com uma pequena bateria, o que permite viajar sem a necessidade de desligar antes de cada local. Um laptop comum certamente pode atingir objetivos semelhantes, mas sem os benefícios de um teclado mais ergonômico.
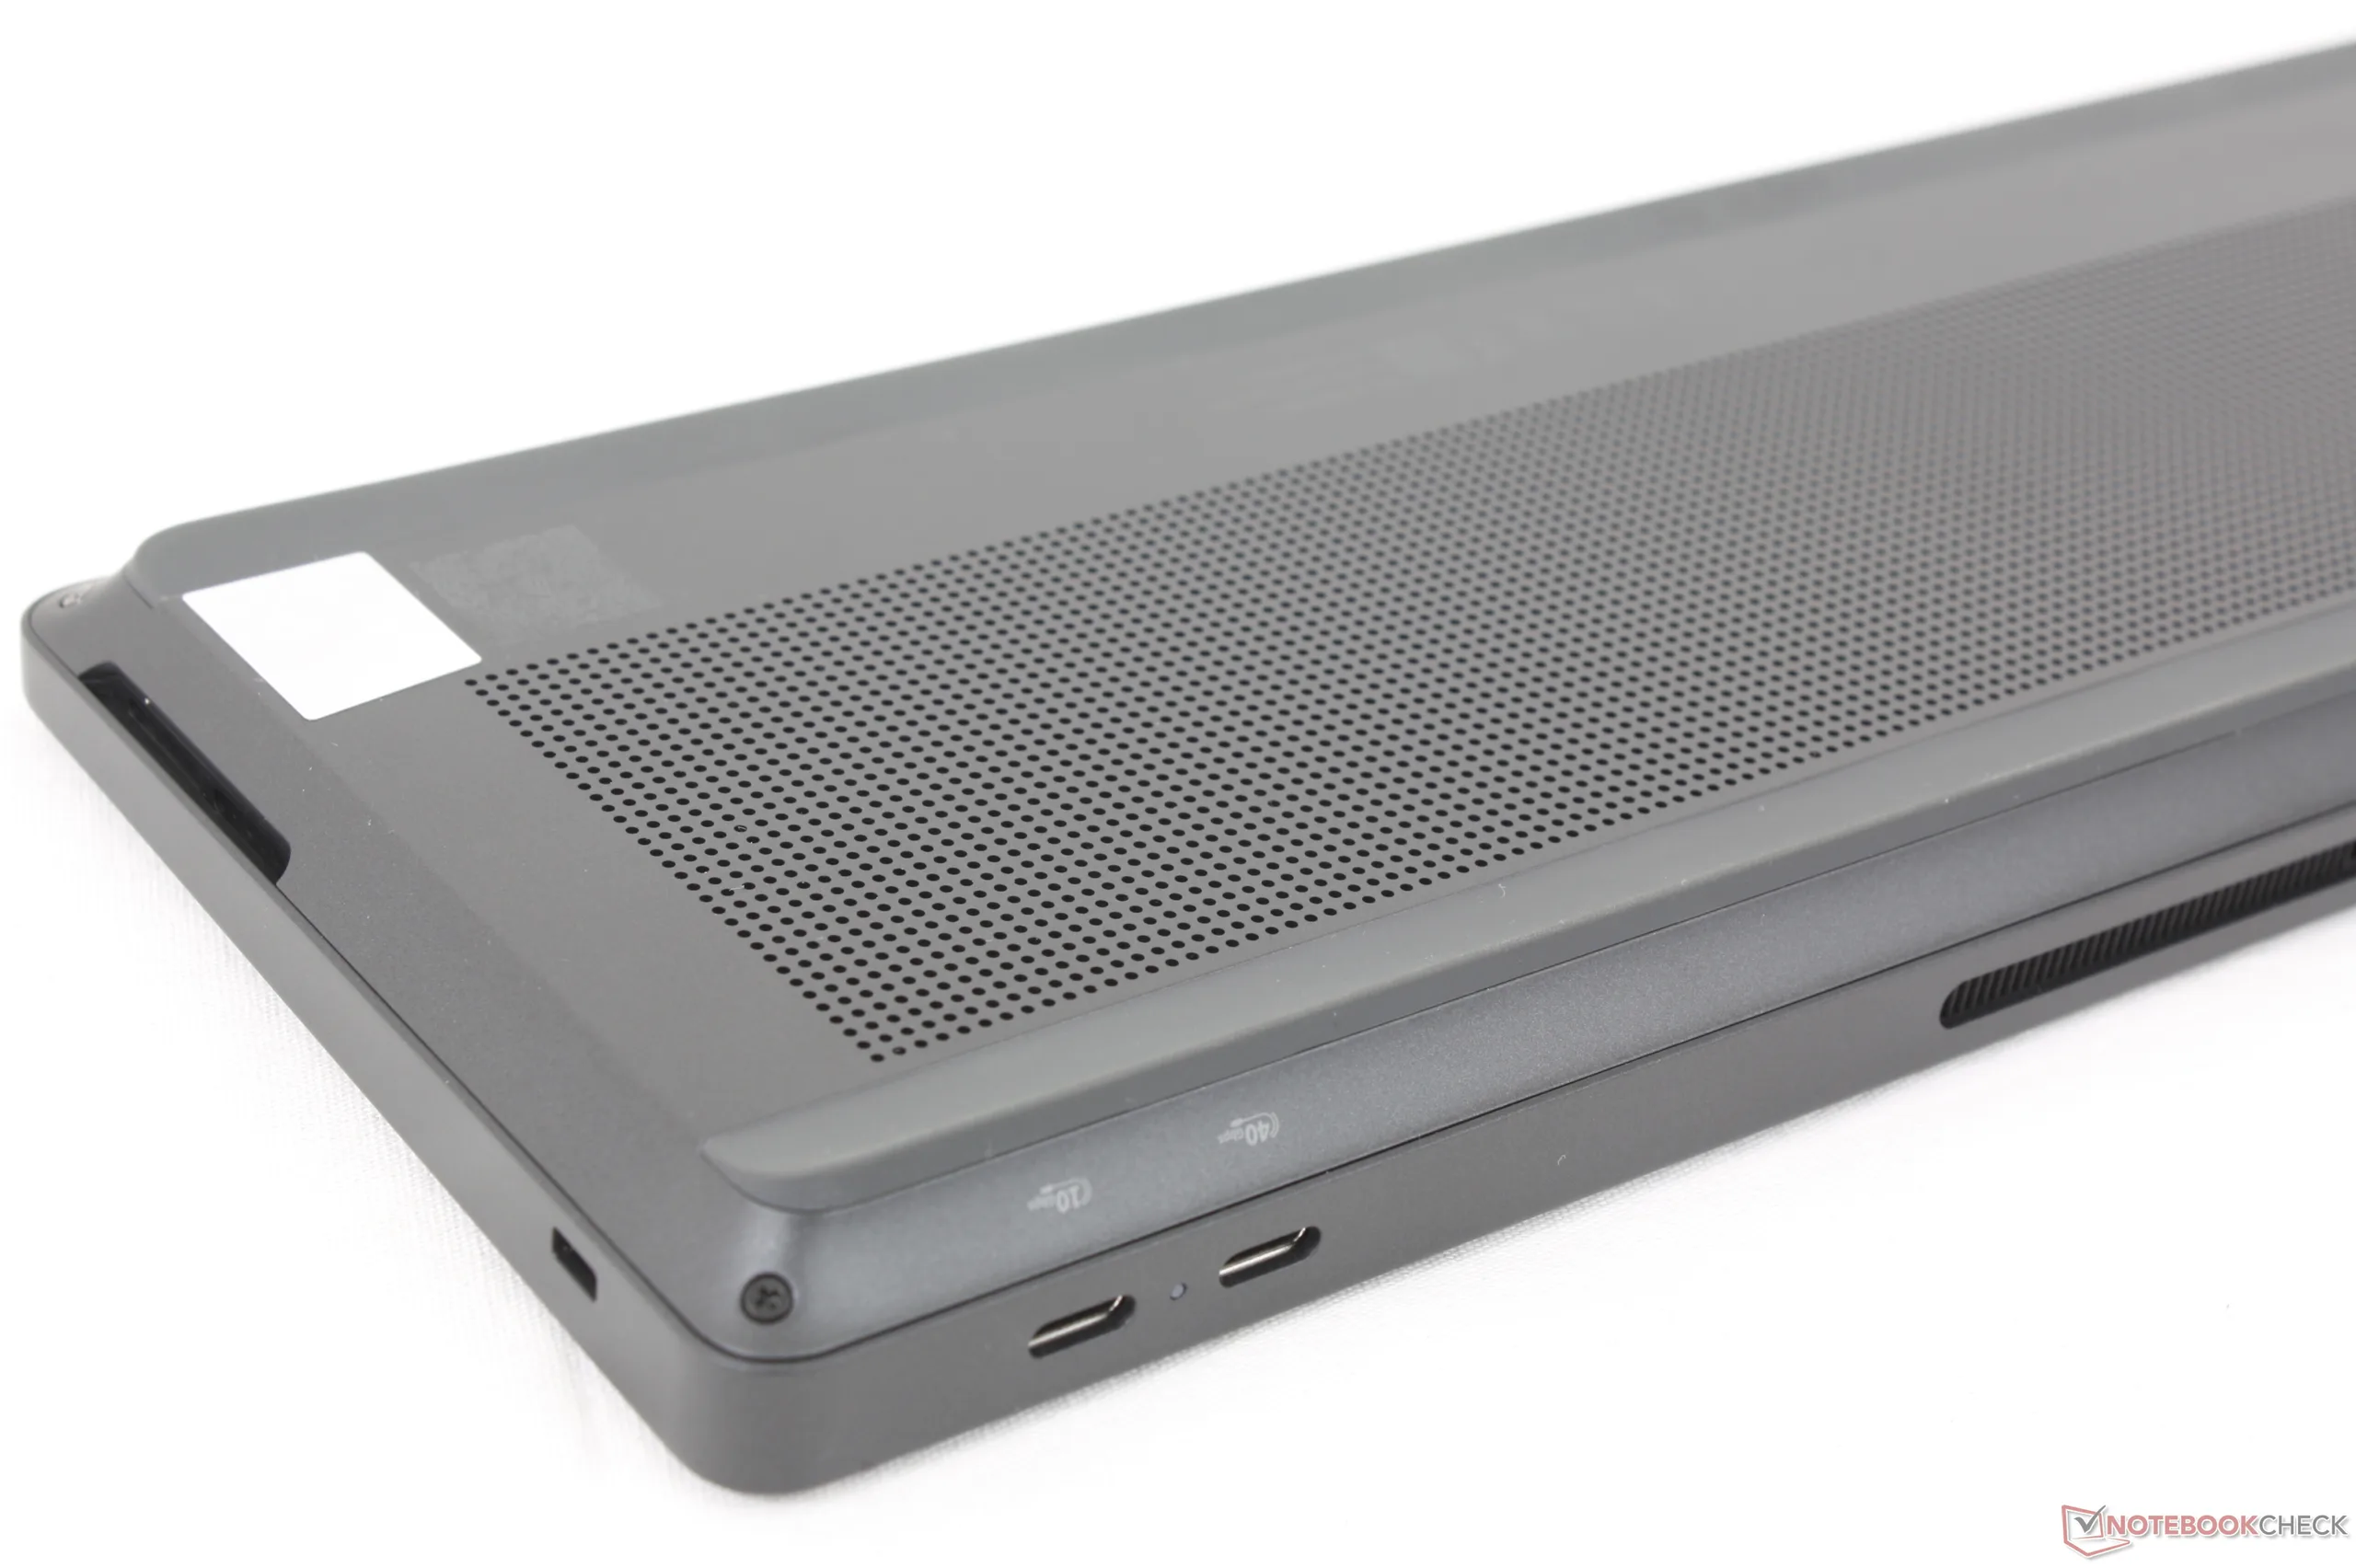
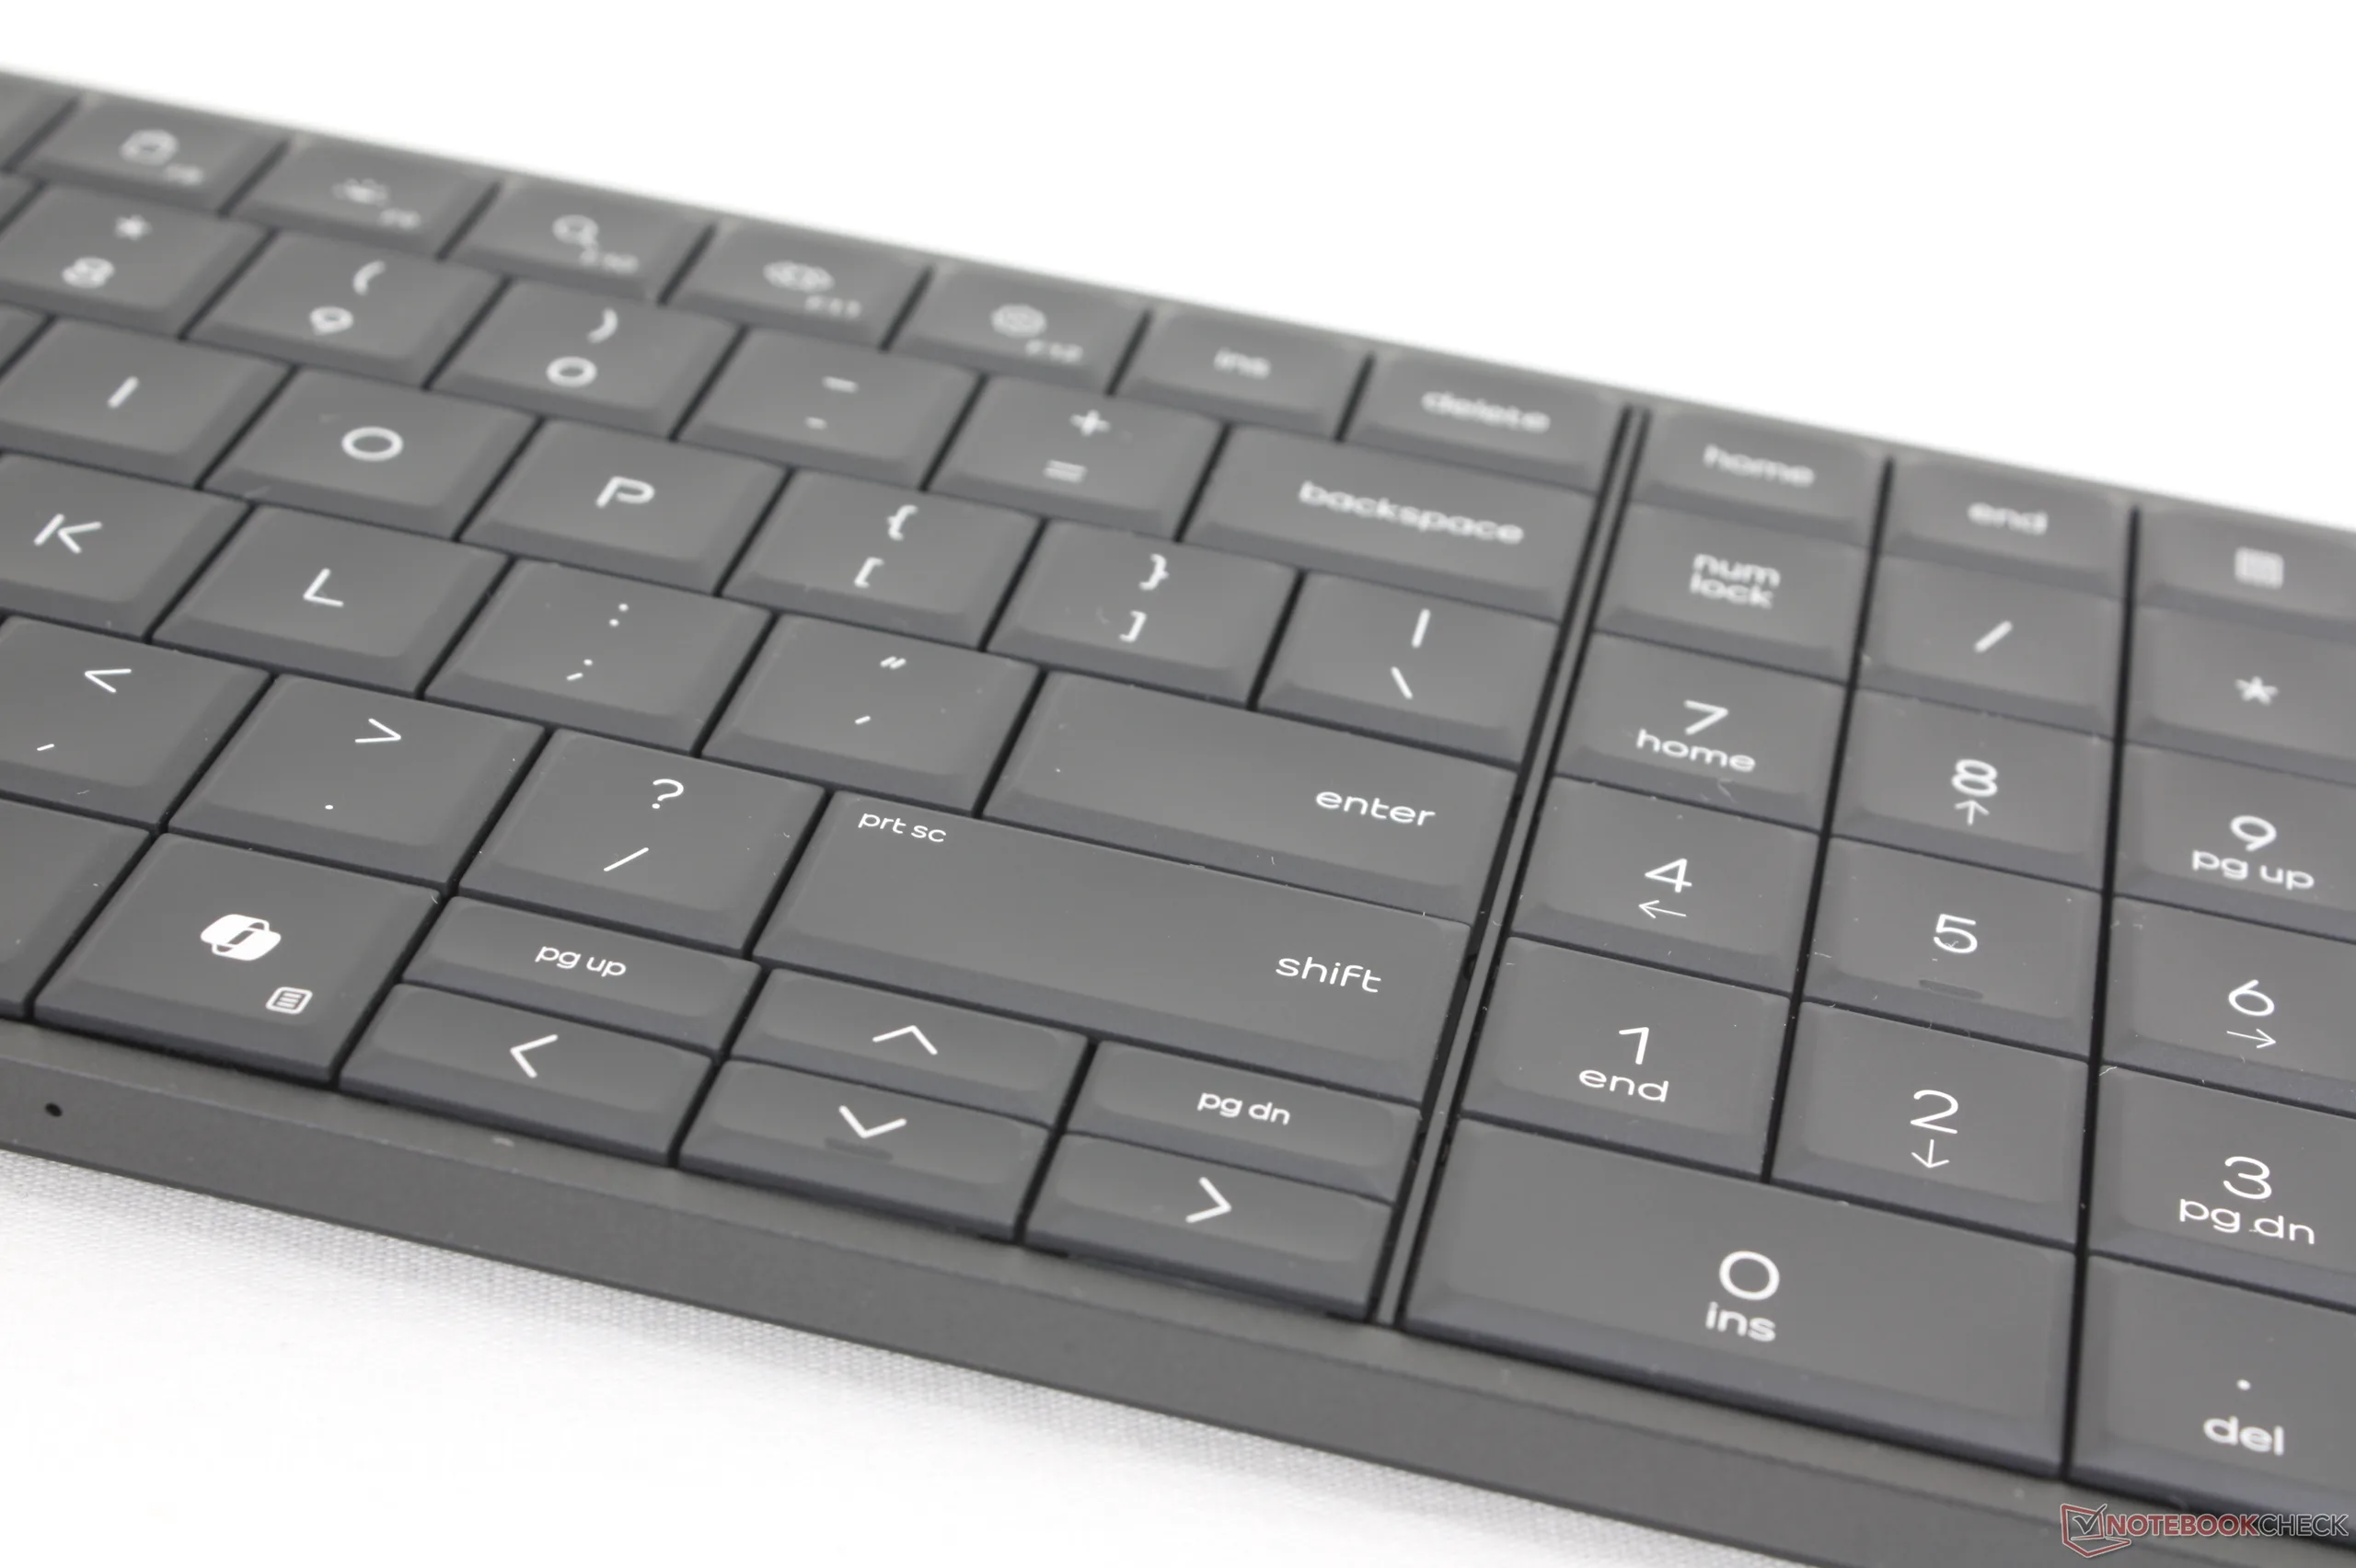
Os dois piores aspectos do EliteBoard são as opções limitadas de portas e as teclas de seta apertadas. Para um design que é mais espesso e mais largo do que muitos laptops, é intrigante ver que o EliteBoard tem menos portas ou teclas de seta menores do que modelos populares como o Yoga Pro 9 16 ou LG Gram. Quando os adaptadores USB-C e HDMI estão envolvidos, a configuração minimalista desaparece. Os mini PCs tradicionais, como o MSI Cubi NUC ou GMK NucBox têm uma vantagem nesse sentido com seu suporte nativo para monitores HDMI mais antigos que ainda são comuns na grande maioria das empresas. Em outras palavras, não nos importaríamos com um design EliteBoard um pouco maior se isso significasse teclas maiores, mais recursos auxiliares e portas integradas adicionais.
Pro
Contra
Preço e disponibilidade
O EliteBoard G1a AI é um PC em um teclado projetado para trabalhadores híbridos e espaços de trabalho simplificados. Ele é essencialmente um teclado com um PC miniaturizado embutido, muito parecido com o Commodore 64 original. Para esse modelo de primeira geração, a HP o configurou com CPUs da série Ryzen AI 300 PRO para atrair empresas e aplicativos profissionais em vez do usuário doméstico típico.
Nossa unidade de teste vem com o Ryzen AI 5 Pro 340 e 32 GB de RAM por aproximadamente US$ 1.600. Outras configurações atingem o máximo no Ryzen AI 7 Pro 350 com até 24 GB de RAM e 2 TB de armazenamento.
O EliteBoard é único, pois é o primeiro de seu tipo com uma CPU moderna que executa o Windows 11. No entanto, ele compete com os mini PCs tradicionais projetados para empresas, incluindo o MSI Cubi NUC, Asus ExpertCenterou o GMK EVO-X1.
Mais análises da HP:
Especificações
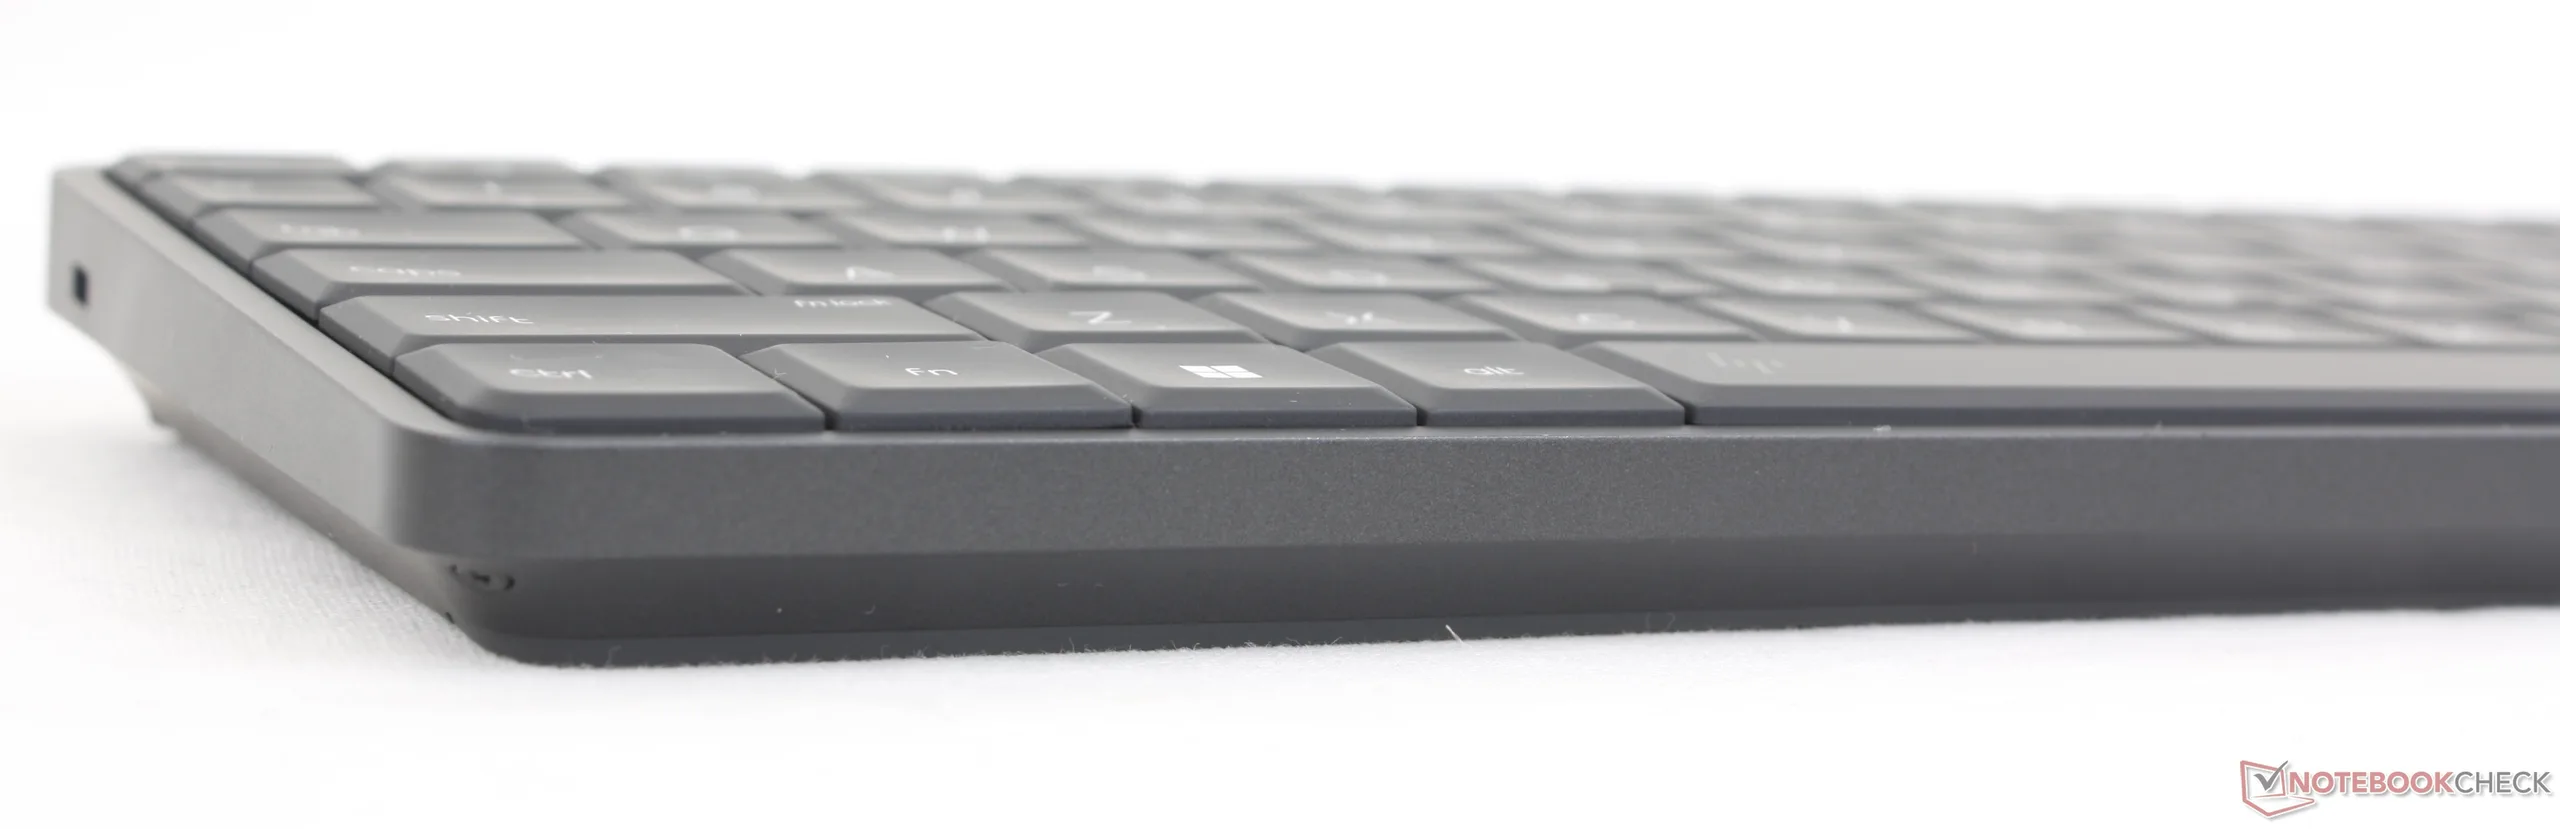
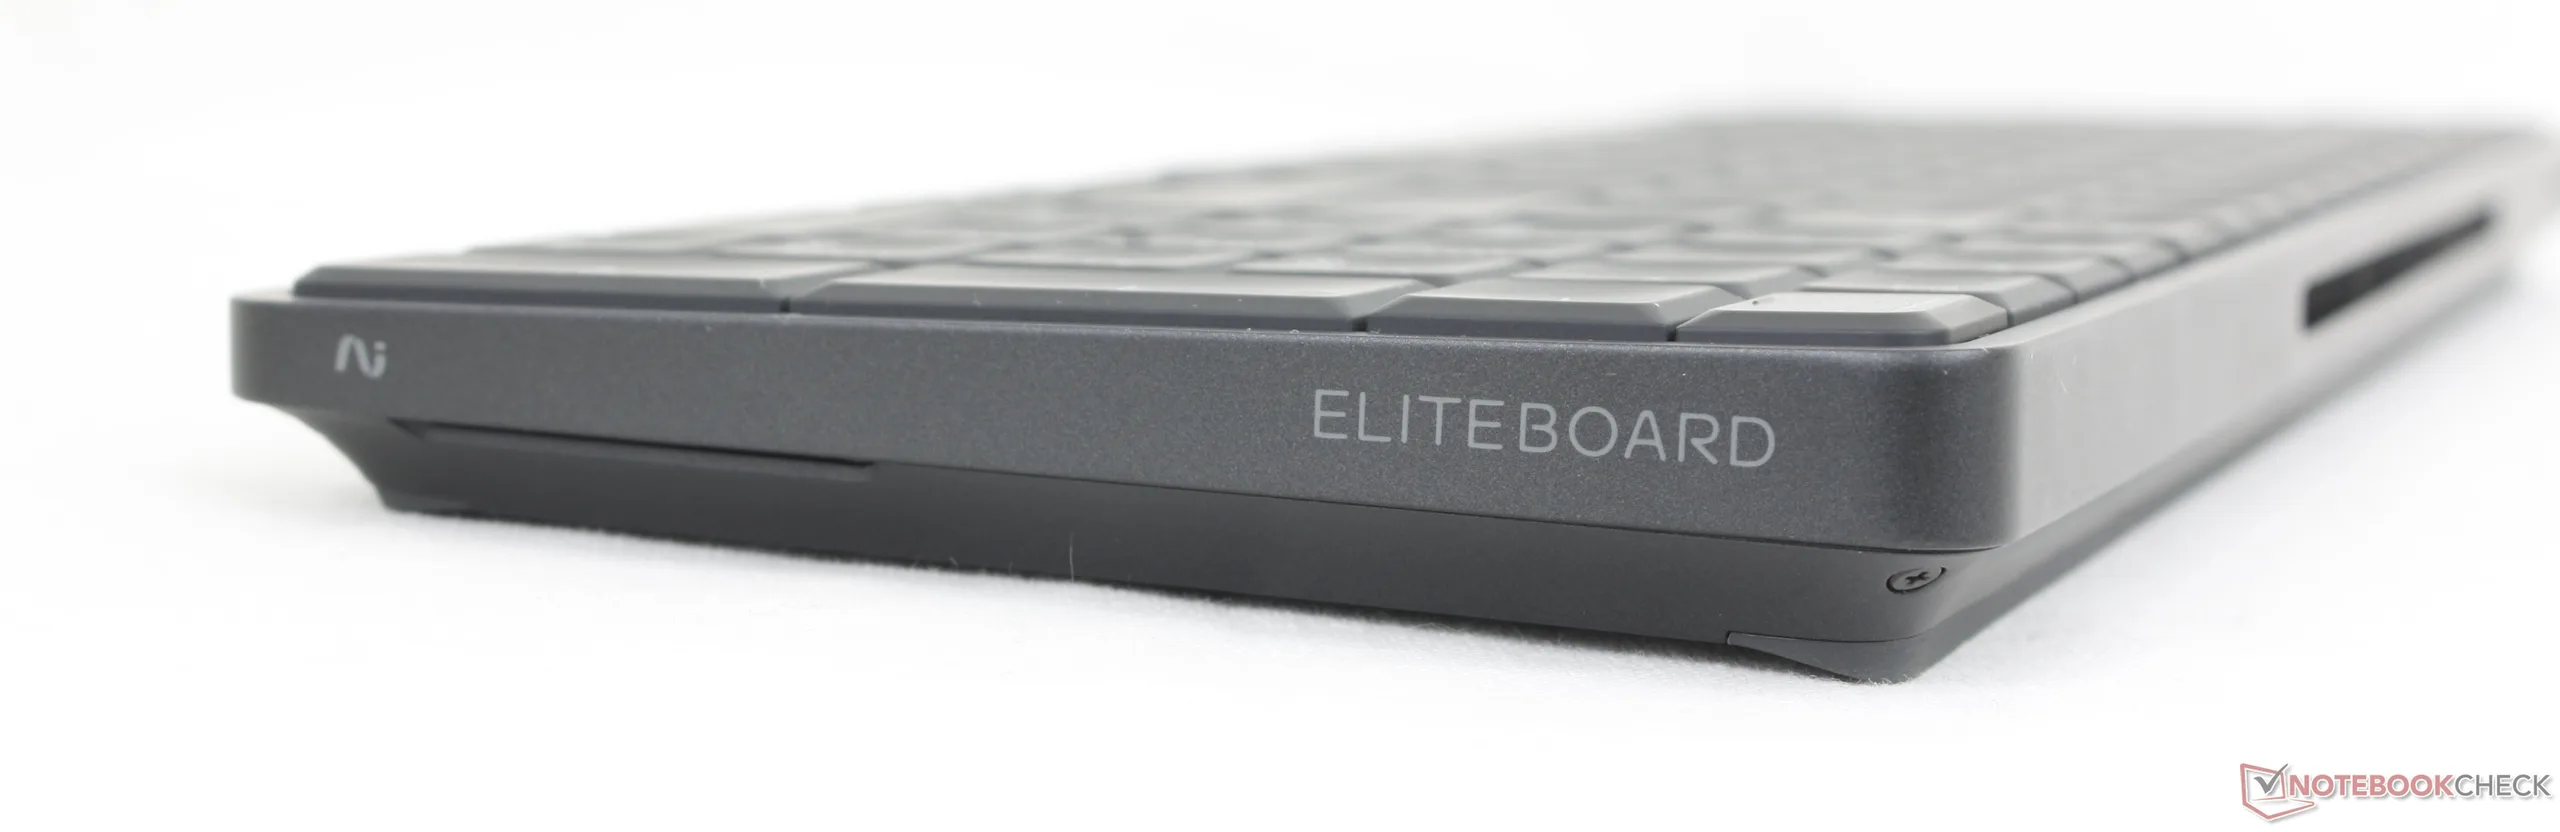
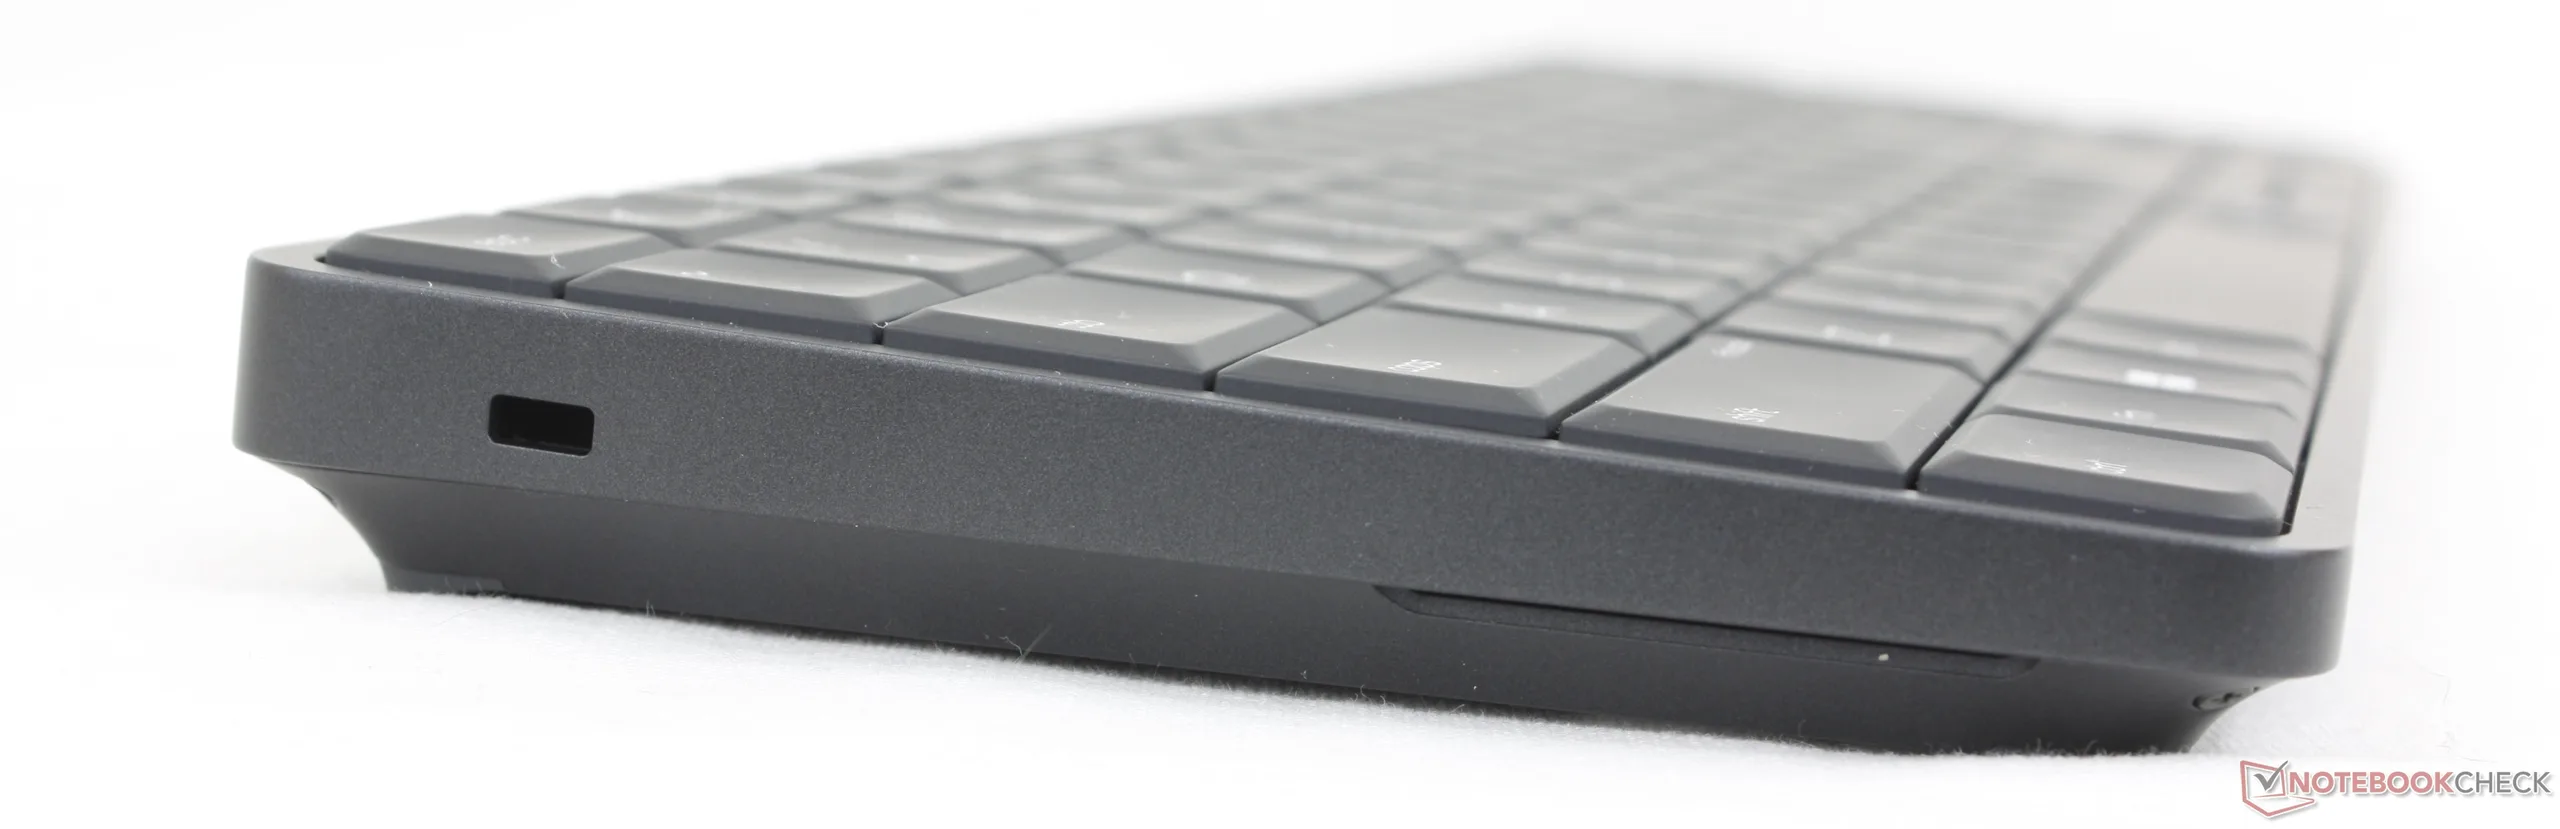
Caso
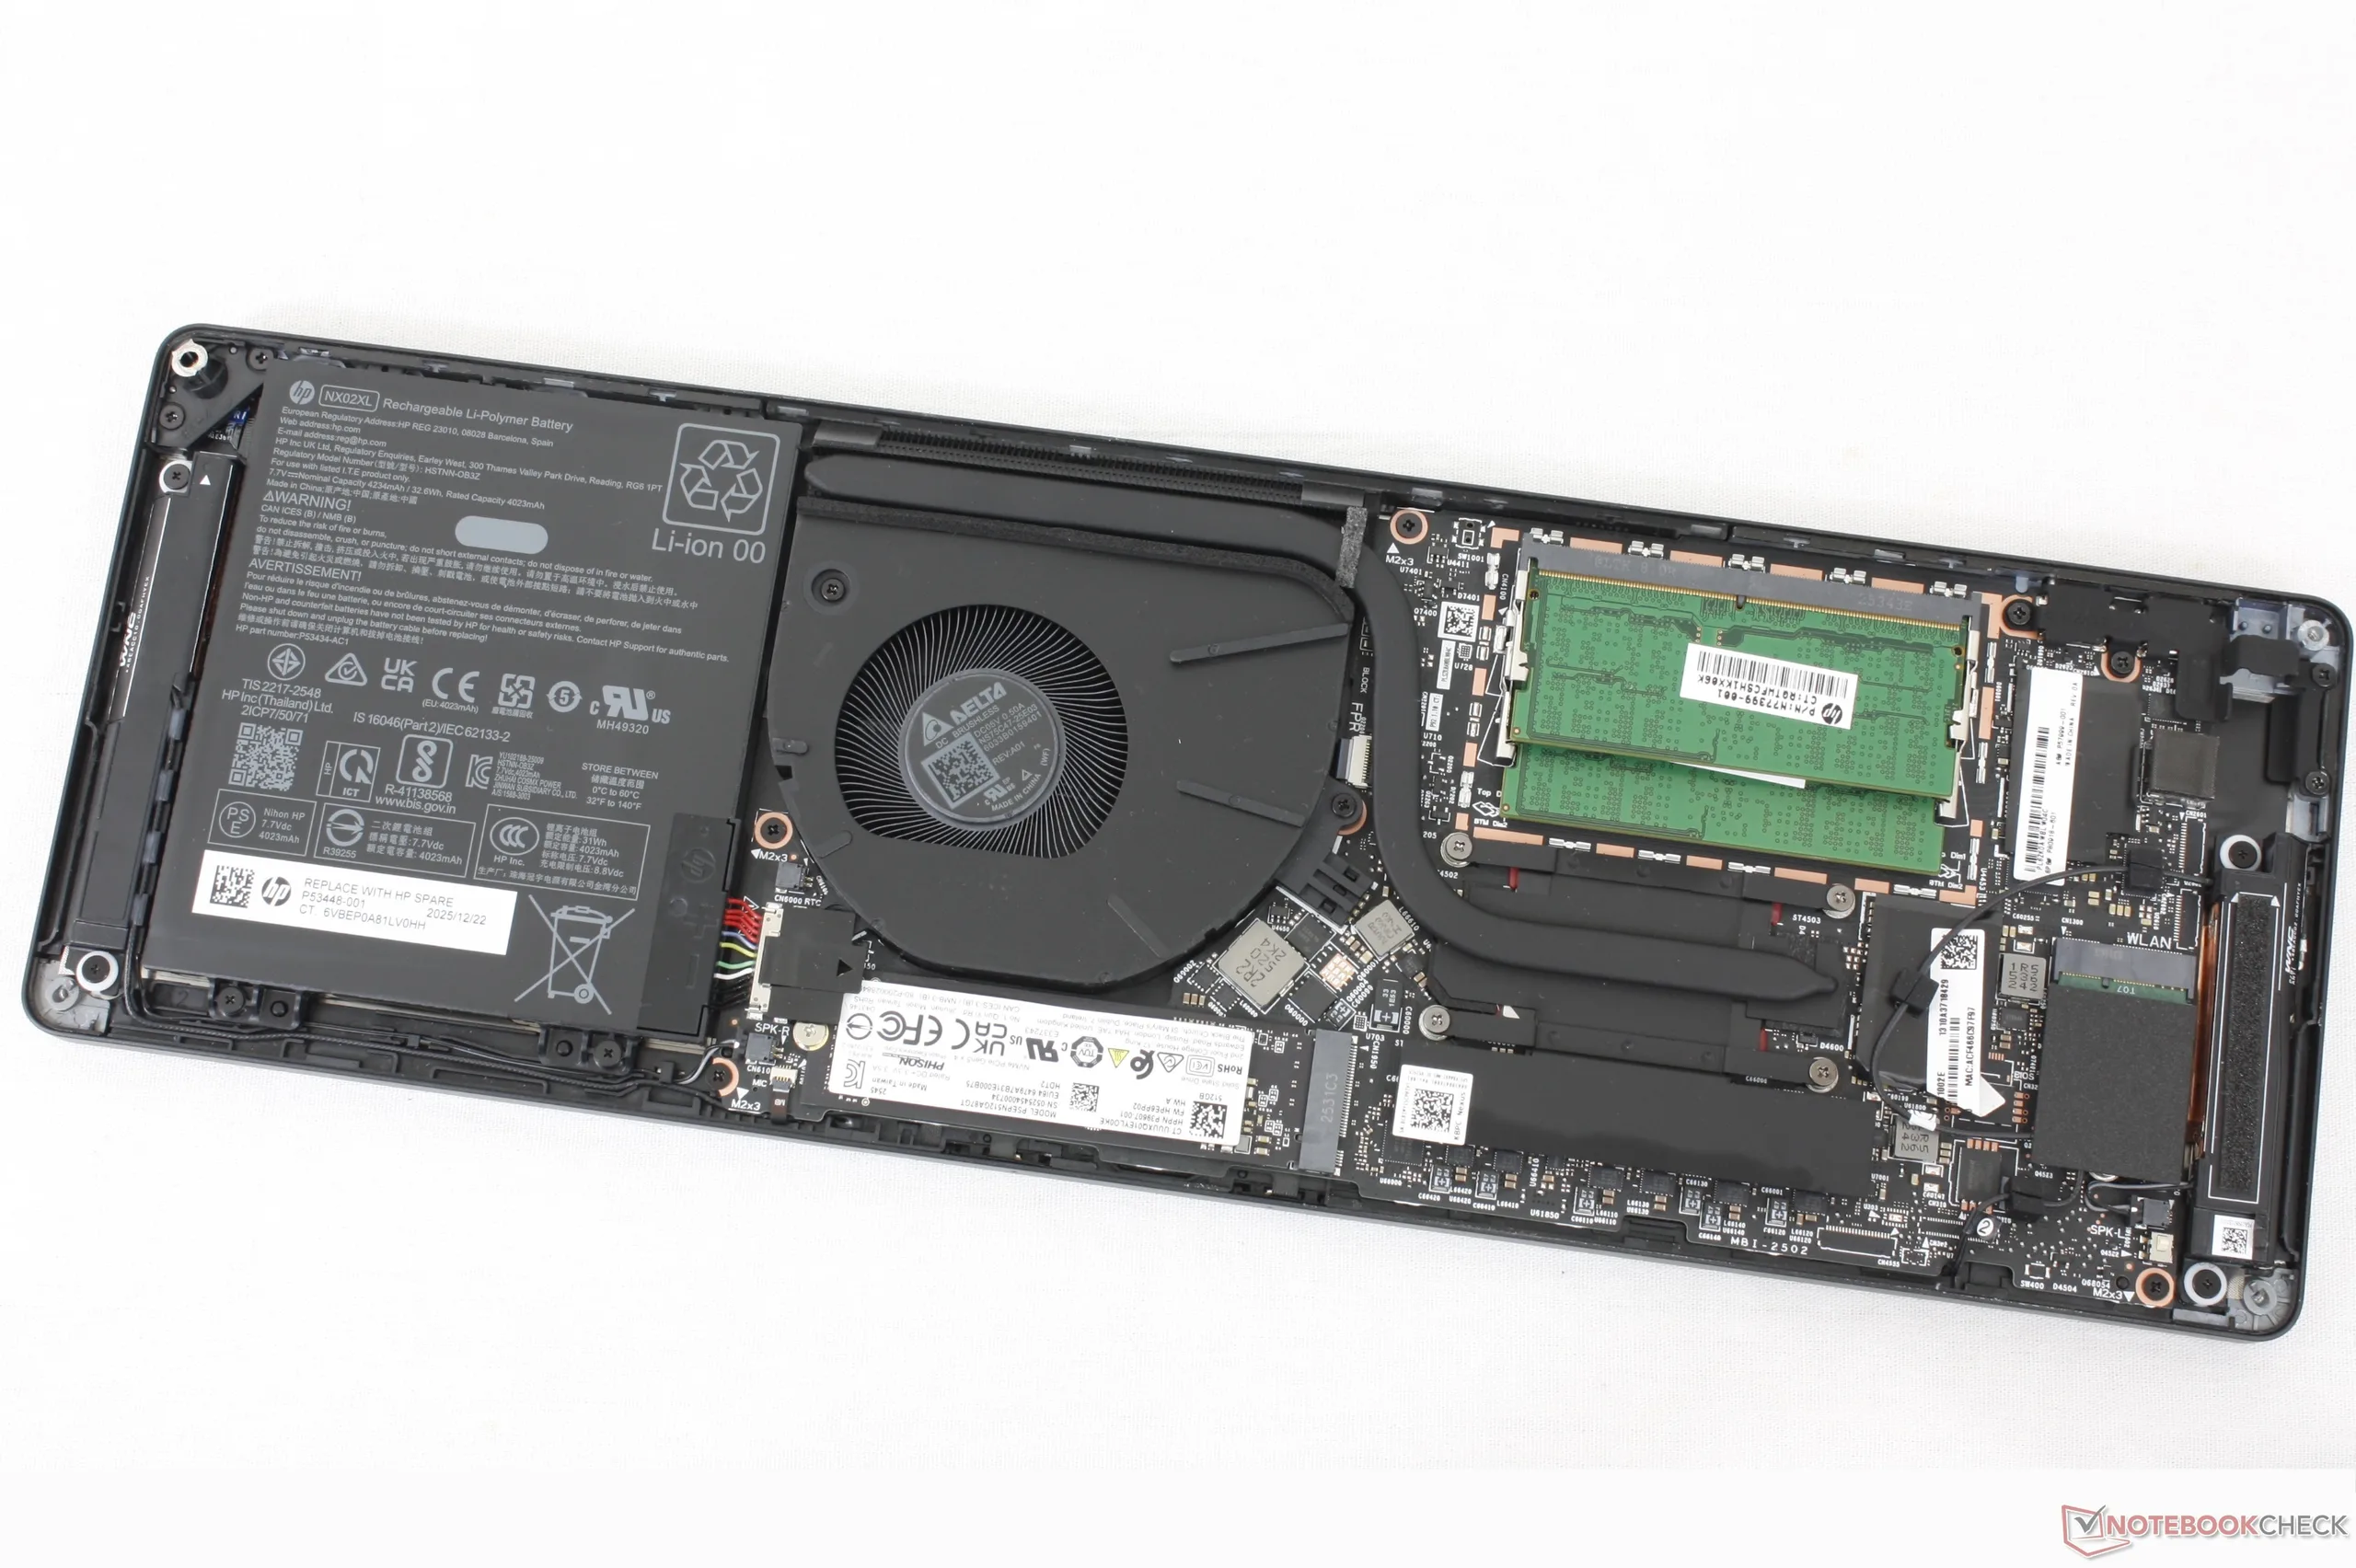
A estrutura de plástico espesso e os internos densos do PC ajudam a fortalecer o EliteBoard, proporcionando uma sensação mais forte e mais rígida do que a de um teclado tradicional. Seu design despretensioso nem parece que há um PC dentro dele, o que ajuda na abordagem minimalista.
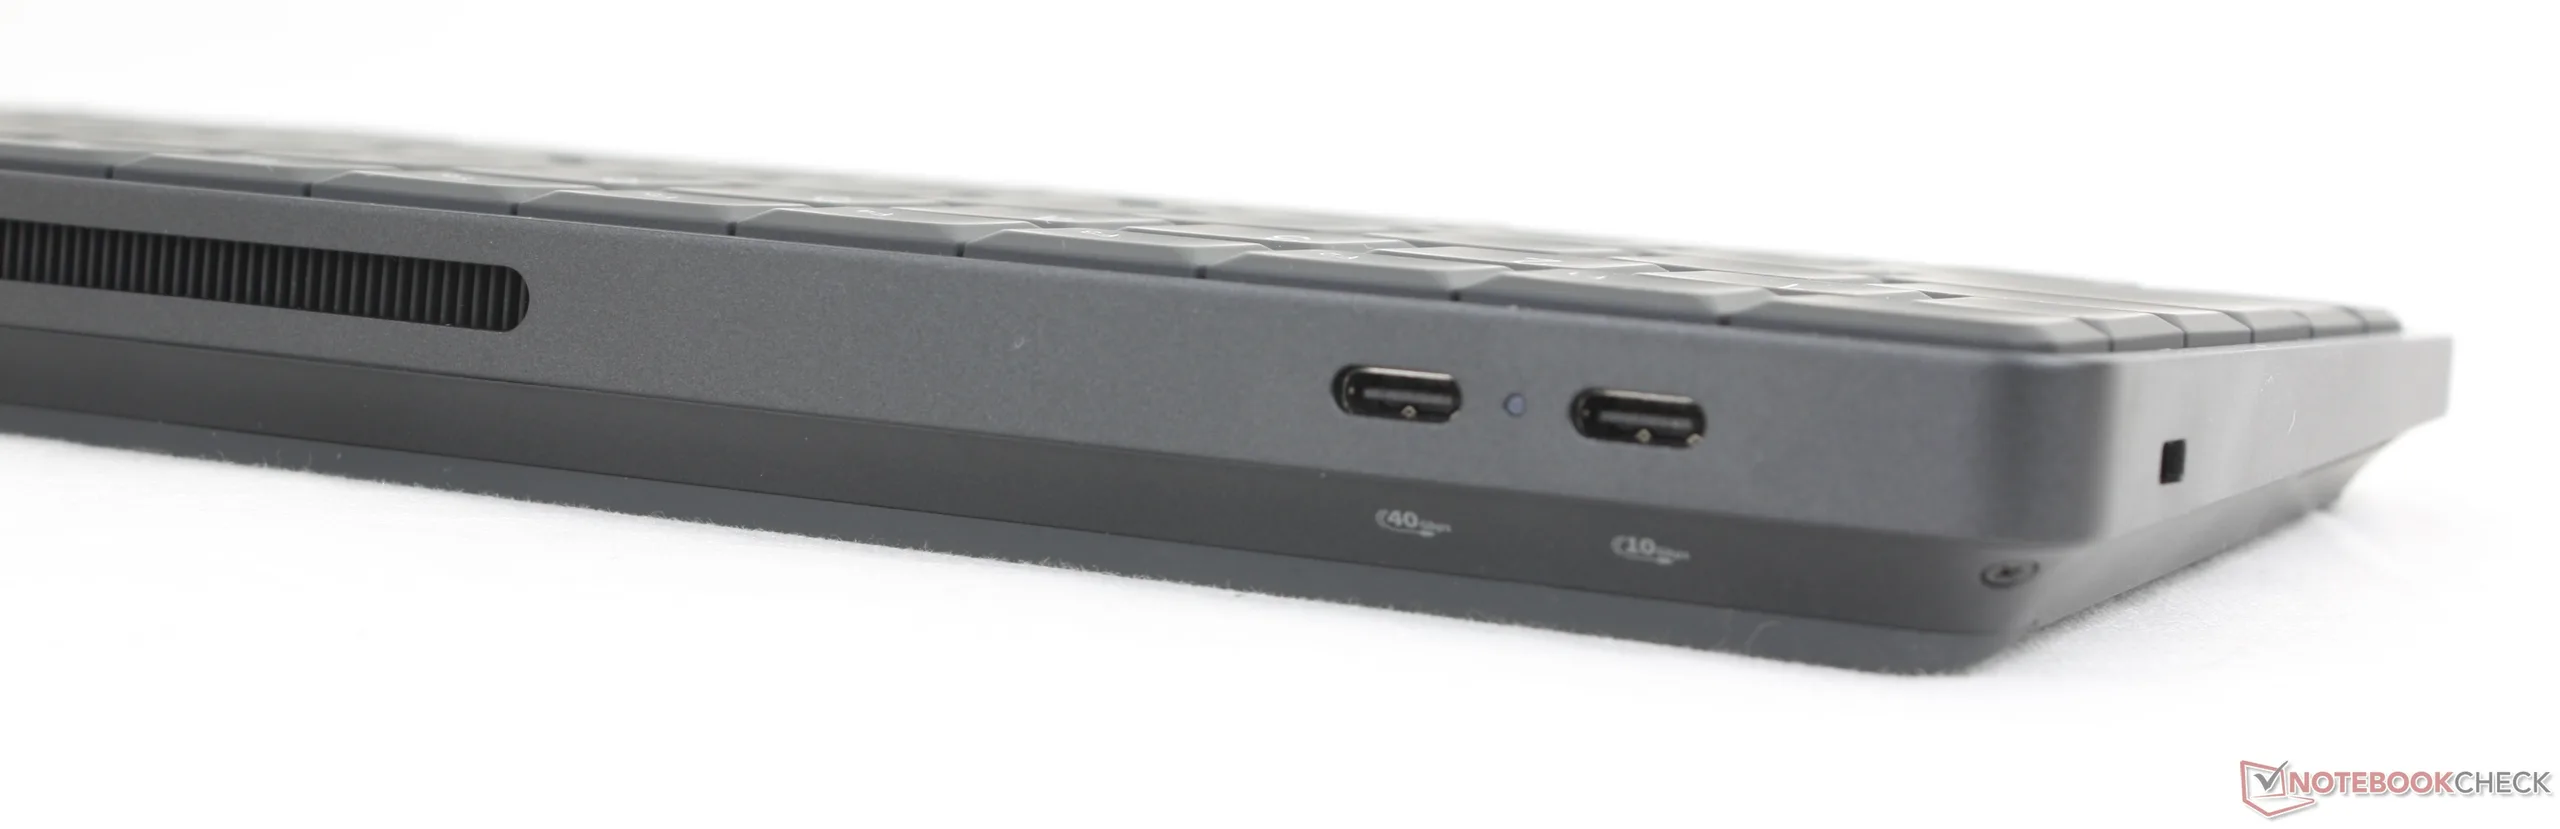
Conectividade
Há apenas duas portas USB-C para trabalhar, o que dá uma sensação de simplicidade. O ideal é que os usuários já tenham um monitor existente com vídeo USB-C e passagem Power Delivery para uma experiência plug-and-play com um único cabo. Caso contrário, prepare-se para ter dongles e estações de acoplamento bagunçados para configurar adequadamente o EliteBoard.
Infelizmente, as duas portas USB-C são assimétricas, o que significa que apenas uma porta suporta USB4 ou 40 Gbps, enquanto a outra é apenas USB 3.2 Gen. 2 ou 10 Gbps, provavelmente devido a limitações do chipset AMD.
Cada porta USB-C também pode ser usada para carregar ou alimentar dispositivos conectados, como monitores externos portáteis ou smartphones, embora apenas com até 7,5 W.
Comunicação
| Networking | |
| iperf3 transmit AXE11000 | |
| Asus NUC 15 Pro+ | |
| HP EliteBoard G1a AI | |
| MSI Cubi NUC AI+ 2MG | |
| HP Pro Mini 400 G9-937U0EA | |
| Geekom A5 Pro | |
| GMK NucBox K13 | |
| iperf3 receive AXE11000 | |
| Asus NUC 15 Pro+ | |
| HP EliteBoard G1a AI | |
| MSI Cubi NUC AI+ 2MG | |
| HP Pro Mini 400 G9-937U0EA | |
| Geekom A5 Pro | |
| GMK NucBox K13 | |
| iperf3 transmit AXE11000 6GHz | |
| HP EliteBoard G1a AI | |
| Asus NUC 15 Pro+ | |
| HP Pro Mini 400 G9-937U0EA | |
| MSI Cubi NUC AI+ 2MG | |
| GMK NucBox K13 | |
| iperf3 receive AXE11000 6GHz | |
| HP EliteBoard G1a AI | |
| GMK NucBox K13 | |
| MSI Cubi NUC AI+ 2MG | |
| Asus NUC 15 Pro+ | |
| HP Pro Mini 400 G9-937U0EA | |
Manutenção
Fiel à tradição da série Elite, a EliteBoard é de fácil manutenção com dois slots DDR5 SODIMM acessíveis, módulo M.2 WLAN removível e um único slot M.2 2280 SSD.
Sustentabilidade
O sistema é fabricado com plásticos e cobre reciclados em até 75% e 45%, respectivamente. Além disso, a embalagem não contém plástico e é totalmente reciclável.
Embora as tampas das chaves individuais possam ser substituídas, o deck ou a camada de membrana subjacente não foi projetado para ser facilmente substituível.
Acessórios
A caixa de varejo inclui um adaptador CA GaN USB-C de 65 W, cabo USB-C e um mouse HP 675M Bluetooth com baterias. Uma capa de viagem de toque suave é padrão apenas se configurada com um pacote de baterias.
Observe que o adaptador CA não é necessário para usuários com monitores existentes que suportam vídeo USB-C e Power Delivery.
Os extras opcionais incluem estações de acoplamento e adaptadores para monitores externos mais antigos que utilizam HDMI para vídeo em vez de USB-C.
Dispositivos de entrada
Teclado
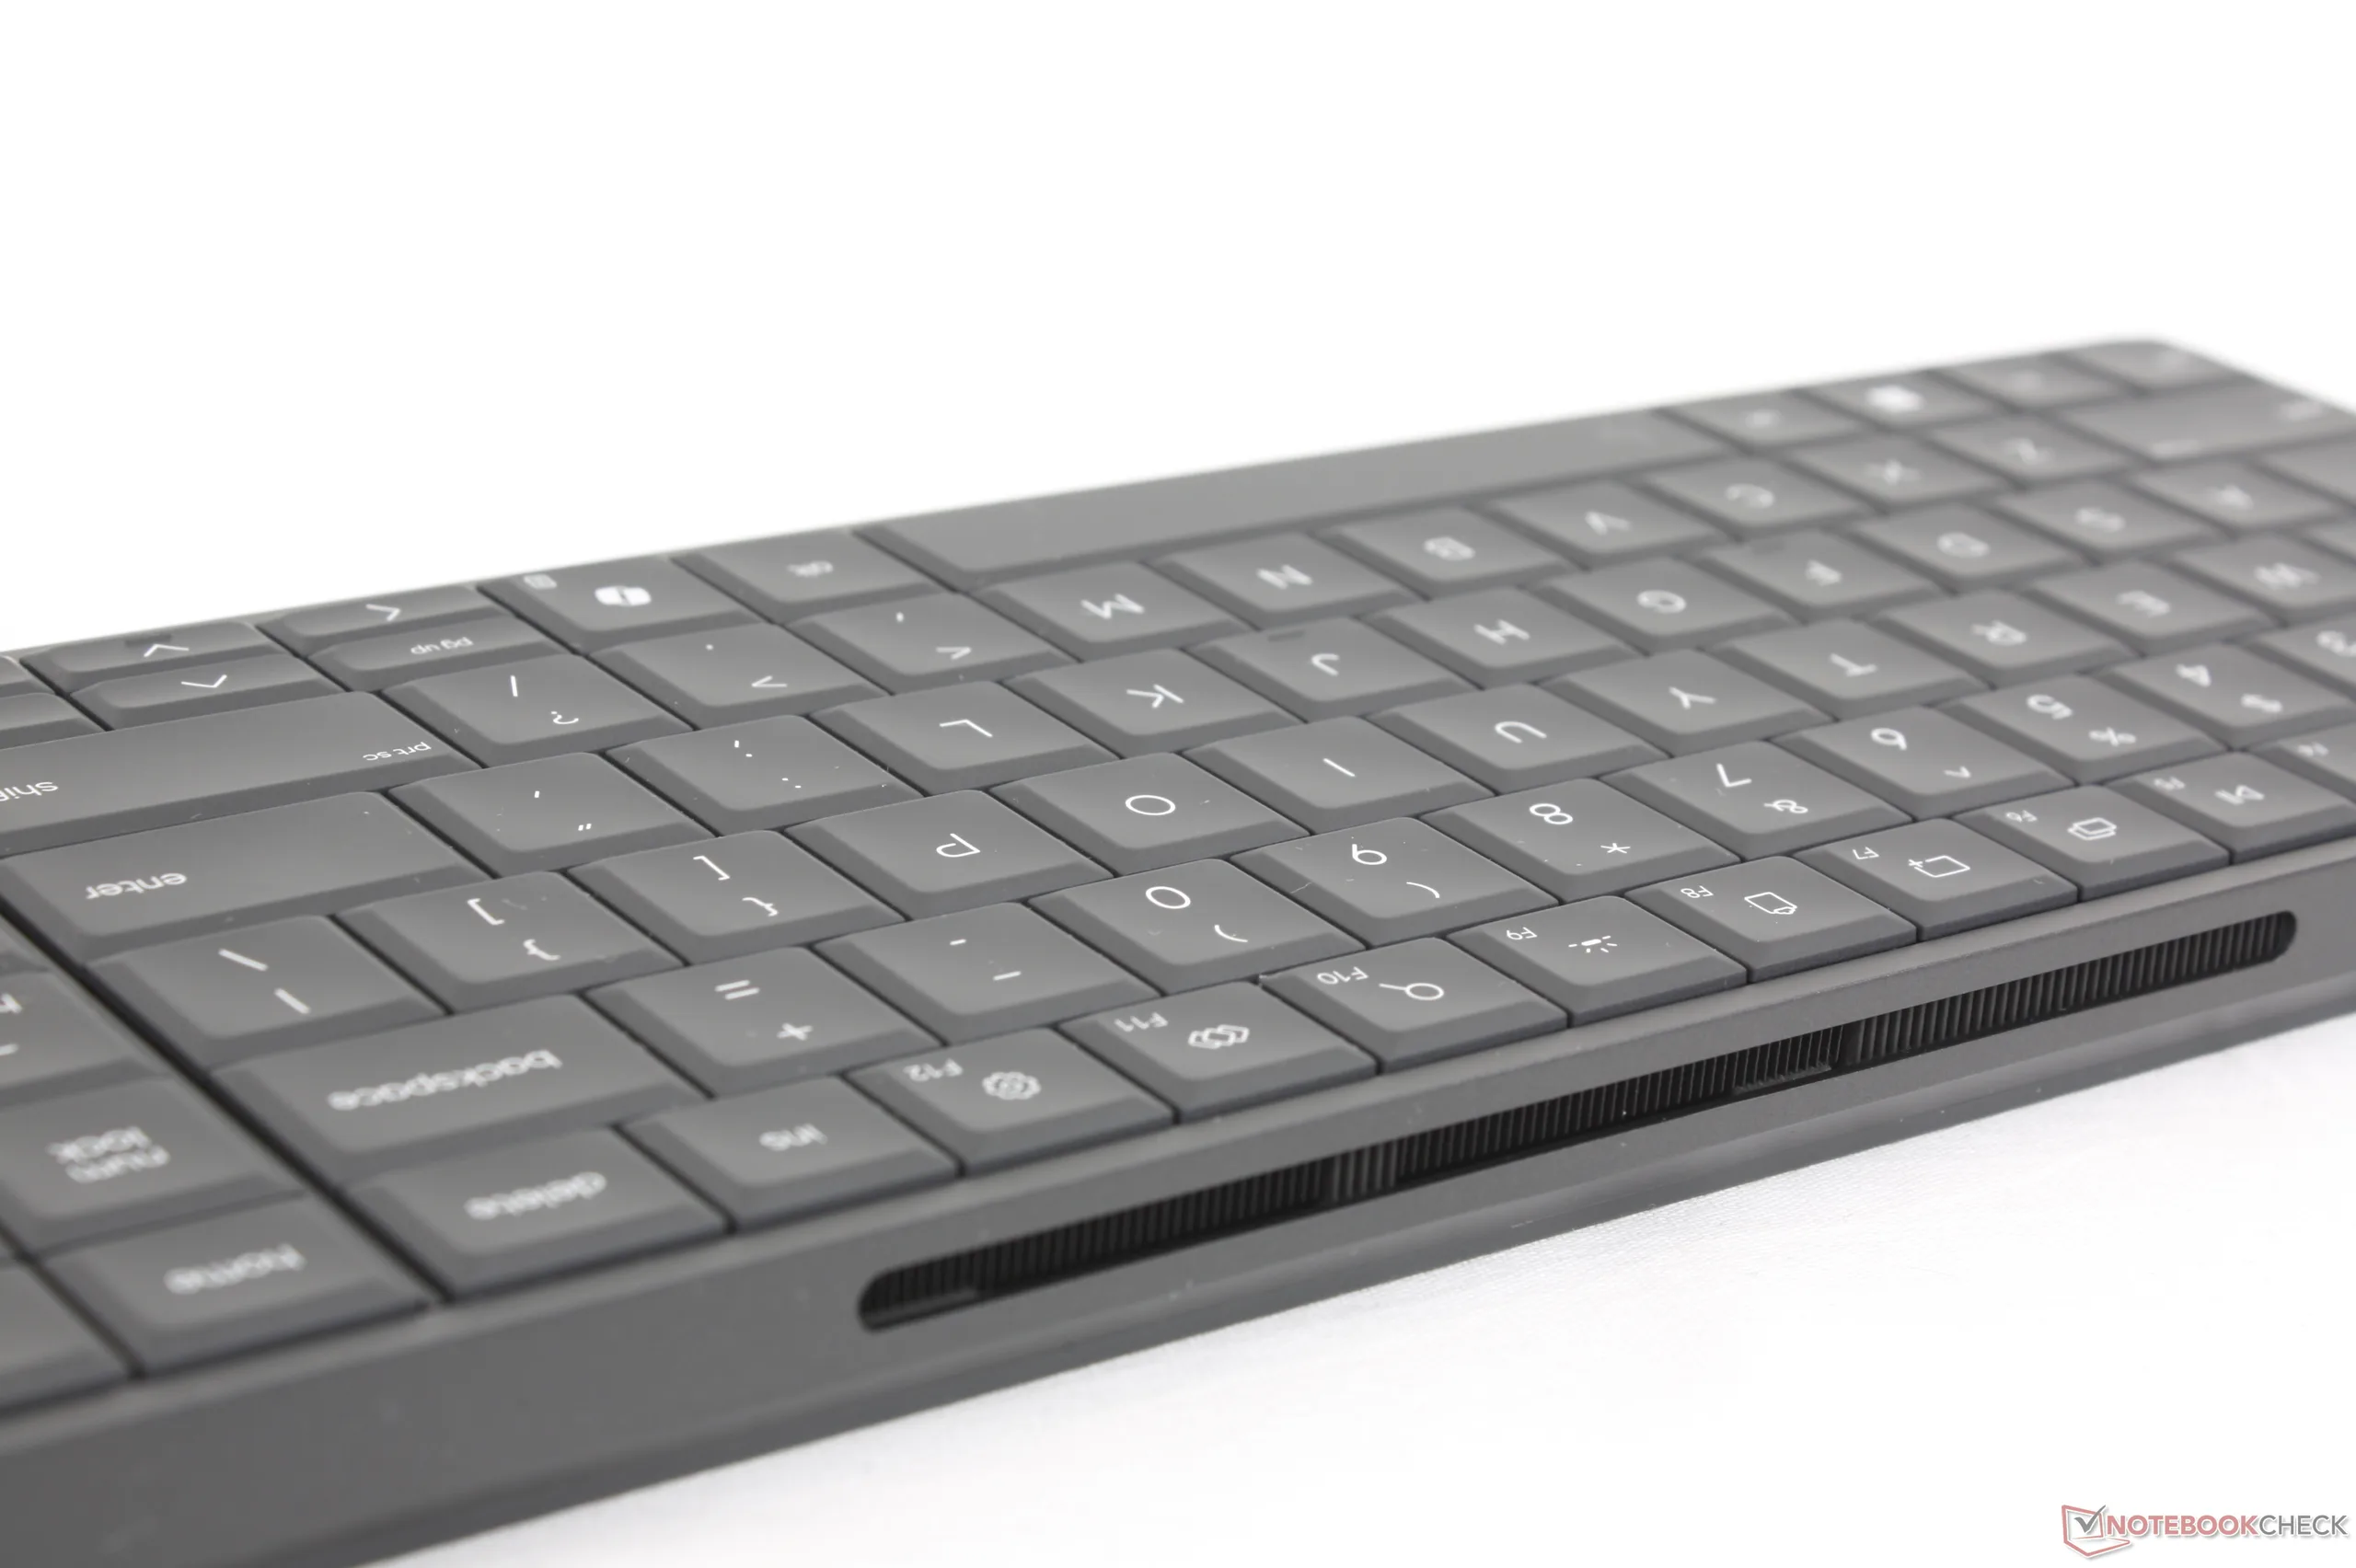
O curso das teclas de 2 mm é mais profundo do que na maioria dos teclados de laptop, proporcionando uma experiência de digitação mais próxima de um teclado de desktop típico. Embora gostemos do feedback firme, do teclado numérico de tamanho normal e do barulho das teclas, as teclas de seta são menores do que as teclas de seta de muitos laptops. A HP diz que isso foi feito de propósito para atender às rígidas especificações de design.
Além disso, o teclado está "acorrentado" ao EliteBoard PC, o que significa que não pode ser usado para controlar qualquer outro computador, ao contrário do teclado básico de um desktop.
Desempenho
Condições de teste
Colocamos o Windows no modo Desempenho antes de executar os benchmarks abaixo.
Processador
O Ryzen AI 5 PRO 340 tem desempenho semelhante ao do Lunar Lake Core Ultra 7 256V em termos de desempenho bruto. Embora não seja particularmente rápido, é uma melhoria significativa em relação às CPUs da série U mais antigas, como o Ryzen 5 7530U ou Core i7-1335U.
A atualização para o Ryzen AI 7 PRO 350 deverá melhorar o desempenho multithread em cerca de 50%, com base em nosso tempo com o Asus ExpertCenter devido ao maior número de núcleos físicos.
Cinebench R15 Multi Loop
Cinebench R23: Multi Core | Single Core
Cinebench R20: CPU (Multi Core) | CPU (Single Core)
Cinebench R15: CPU Multi 64Bit | CPU Single 64Bit
Blender: v2.79 BMW27 CPU
7-Zip 18.03: 7z b 4 | 7z b 4 -mmt1
Geekbench 6.7: Multi-Core | Single-Core
Geekbench 5.5: Multi-Core | Single-Core
HWBOT x265 Benchmark v2.2: 4k Preset
LibreOffice : 20 Documents To PDF
R Benchmark 2.5: Overall mean
| CPU Performance rating | |
| Asus NUC 15 Pro+ | |
| Khadas Mind Pro | |
| Beelink GTI15 Ultra | |
| Asus ExpertCenter PN54-S70012NN | |
| Média AMD Ryzen AI 5 PRO 340 | |
| HP EliteBoard G1a AI | |
| GMK NucBox K13 | |
| HP Pro Mini 400 G9-937U0EA | |
| MSI Cubi NUC AI+ 2MG | |
| Geekom A5 Pro | |
| Aoostar WTR Pro, N150 | |
| Cinebench R23 / Multi Core | |
| Asus NUC 15 Pro+ | |
| Khadas Mind Pro | |
| Beelink GTI15 Ultra | |
| Asus ExpertCenter PN54-S70012NN | |
| HP Pro Mini 400 G9-937U0EA | |
| HP EliteBoard G1a AI | |
| Média AMD Ryzen AI 5 PRO 340 (n=1) | |
| GMK NucBox K13 | |
| MSI Cubi NUC AI+ 2MG | |
| Geekom A5 Pro | |
| Aoostar WTR Pro, N150 | |
| Cinebench R23 / Single Core | |
| Asus NUC 15 Pro+ | |
| Khadas Mind Pro | |
| Beelink GTI15 Ultra | |
| Asus ExpertCenter PN54-S70012NN | |
| MSI Cubi NUC AI+ 2MG | |
| GMK NucBox K13 | |
| HP Pro Mini 400 G9-937U0EA | |
| HP EliteBoard G1a AI | |
| Média AMD Ryzen AI 5 PRO 340 (n=1) | |
| Geekom A5 Pro | |
| Aoostar WTR Pro, N150 | |
| Cinebench R20 / CPU (Multi Core) | |
| Asus NUC 15 Pro+ | |
| Khadas Mind Pro | |
| Beelink GTI15 Ultra | |
| Asus ExpertCenter PN54-S70012NN | |
| HP EliteBoard G1a AI | |
| Média AMD Ryzen AI 5 PRO 340 (n=1) | |
| HP Pro Mini 400 G9-937U0EA | |
| GMK NucBox K13 | |
| MSI Cubi NUC AI+ 2MG | |
| Geekom A5 Pro | |
| Aoostar WTR Pro, N150 | |
| Cinebench R20 / CPU (Single Core) | |
| Asus NUC 15 Pro+ | |
| Beelink GTI15 Ultra | |
| Khadas Mind Pro | |
| Asus ExpertCenter PN54-S70012NN | |
| MSI Cubi NUC AI+ 2MG | |
| GMK NucBox K13 | |
| HP Pro Mini 400 G9-937U0EA | |
| HP EliteBoard G1a AI | |
| Média AMD Ryzen AI 5 PRO 340 (n=1) | |
| Geekom A5 Pro | |
| Aoostar WTR Pro, N150 | |
| Cinebench R15 / CPU Multi 64Bit | |
| Asus NUC 15 Pro+ | |
| Khadas Mind Pro | |
| Asus ExpertCenter PN54-S70012NN | |
| Beelink GTI15 Ultra | |
| HP Pro Mini 400 G9-937U0EA | |
| HP EliteBoard G1a AI | |
| Média AMD Ryzen AI 5 PRO 340 (n=1) | |
| GMK NucBox K13 | |
| MSI Cubi NUC AI+ 2MG | |
| Geekom A5 Pro | |
| Aoostar WTR Pro, N150 | |
| Cinebench R15 / CPU Single 64Bit | |
| Asus NUC 15 Pro+ | |
| Khadas Mind Pro | |
| Beelink GTI15 Ultra | |
| Asus ExpertCenter PN54-S70012NN | |
| MSI Cubi NUC AI+ 2MG | |
| GMK NucBox K13 | |
| HP EliteBoard G1a AI | |
| Média AMD Ryzen AI 5 PRO 340 (n=1) | |
| HP Pro Mini 400 G9-937U0EA | |
| Geekom A5 Pro | |
| Aoostar WTR Pro, N150 | |
| Blender / v2.79 BMW27 CPU | |
| Aoostar WTR Pro, N150 | |
| Geekom A5 Pro | |
| MSI Cubi NUC AI+ 2MG | |
| GMK NucBox K13 | |
| HP Pro Mini 400 G9-937U0EA | |
| HP EliteBoard G1a AI | |
| Média AMD Ryzen AI 5 PRO 340 (n=1) | |
| Asus ExpertCenter PN54-S70012NN | |
| Beelink GTI15 Ultra | |
| Khadas Mind Pro | |
| Asus NUC 15 Pro+ | |
| 7-Zip 18.03 / 7z b 4 | |
| Asus NUC 15 Pro+ | |
| Khadas Mind Pro | |
| Beelink GTI15 Ultra | |
| Asus ExpertCenter PN54-S70012NN | |
| HP Pro Mini 400 G9-937U0EA | |
| HP EliteBoard G1a AI | |
| Média AMD Ryzen AI 5 PRO 340 (n=1) | |
| GMK NucBox K13 | |
| Geekom A5 Pro | |
| MSI Cubi NUC AI+ 2MG | |
| Aoostar WTR Pro, N150 | |
| 7-Zip 18.03 / 7z b 4 -mmt1 | |
| Khadas Mind Pro | |
| Beelink GTI15 Ultra | |
| Asus NUC 15 Pro+ | |
| HP Pro Mini 400 G9-937U0EA | |
| MSI Cubi NUC AI+ 2MG | |
| GMK NucBox K13 | |
| HP EliteBoard G1a AI | |
| Média AMD Ryzen AI 5 PRO 340 (n=1) | |
| Asus ExpertCenter PN54-S70012NN | |
| Geekom A5 Pro | |
| Aoostar WTR Pro, N150 | |
| Geekbench 6.7 / Multi-Core | |
| Asus NUC 15 Pro+ | |
| Khadas Mind Pro | |
| Beelink GTI15 Ultra | |
| Asus ExpertCenter PN54-S70012NN | |
| Média AMD Ryzen AI 5 PRO 340 (11409 - 11455, n=2) | |
| HP EliteBoard G1a AI | |
| GMK NucBox K13 | |
| HP Pro Mini 400 G9-937U0EA | |
| MSI Cubi NUC AI+ 2MG | |
| Geekom A5 Pro | |
| Aoostar WTR Pro, N150 | |
| Geekbench 6.7 / Single-Core | |
| Beelink GTI15 Ultra | |
| Asus ExpertCenter PN54-S70012NN | |
| Khadas Mind Pro | |
| GMK NucBox K13 | |
| MSI Cubi NUC AI+ 2MG | |
| Média AMD Ryzen AI 5 PRO 340 (2640 - 2771, n=2) | |
| Asus NUC 15 Pro+ | |
| HP EliteBoard G1a AI | |
| HP Pro Mini 400 G9-937U0EA | |
| Geekom A5 Pro | |
| Aoostar WTR Pro, N150 | |
| Geekbench 5.5 / Multi-Core | |
| Khadas Mind Pro | |
| Asus NUC 15 Pro+ | |
| Beelink GTI15 Ultra | |
| Asus ExpertCenter PN54-S70012NN | |
| HP EliteBoard G1a AI | |
| Média AMD Ryzen AI 5 PRO 340 (n=1) | |
| HP Pro Mini 400 G9-937U0EA | |
| GMK NucBox K13 | |
| MSI Cubi NUC AI+ 2MG | |
| Geekom A5 Pro | |
| Aoostar WTR Pro, N150 | |
| Geekbench 5.5 / Single-Core | |
| Beelink GTI15 Ultra | |
| Khadas Mind Pro | |
| Asus ExpertCenter PN54-S70012NN | |
| MSI Cubi NUC AI+ 2MG | |
| GMK NucBox K13 | |
| HP EliteBoard G1a AI | |
| Média AMD Ryzen AI 5 PRO 340 (n=1) | |
| HP Pro Mini 400 G9-937U0EA | |
| Asus NUC 15 Pro+ | |
| Geekom A5 Pro | |
| Aoostar WTR Pro, N150 | |
| HWBOT x265 Benchmark v2.2 / 4k Preset | |
| Asus NUC 15 Pro+ | |
| Khadas Mind Pro | |
| Beelink GTI15 Ultra | |
| Asus ExpertCenter PN54-S70012NN | |
| HP EliteBoard G1a AI | |
| Média AMD Ryzen AI 5 PRO 340 (n=1) | |
| GMK NucBox K13 | |
| MSI Cubi NUC AI+ 2MG | |
| HP Pro Mini 400 G9-937U0EA | |
| Geekom A5 Pro | |
| Aoostar WTR Pro, N150 | |
| LibreOffice / 20 Documents To PDF | |
| Aoostar WTR Pro, N150 | |
| HP EliteBoard G1a AI | |
| Média AMD Ryzen AI 5 PRO 340 (n=1) | |
| Geekom A5 Pro | |
| Asus NUC 15 Pro+ | |
| GMK NucBox K13 | |
| Asus ExpertCenter PN54-S70012NN | |
| HP Pro Mini 400 G9-937U0EA | |
| Khadas Mind Pro | |
| MSI Cubi NUC AI+ 2MG | |
| Beelink GTI15 Ultra | |
| R Benchmark 2.5 / Overall mean | |
| Aoostar WTR Pro, N150 | |
| Geekom A5 Pro | |
| MSI Cubi NUC AI+ 2MG | |
| HP EliteBoard G1a AI | |
| Média AMD Ryzen AI 5 PRO 340 (n=1) | |
| GMK NucBox K13 | |
| HP Pro Mini 400 G9-937U0EA | |
| Asus NUC 15 Pro+ | |
| Beelink GTI15 Ultra | |
| Khadas Mind Pro | |
| Khadas Mind Pro | |
| Asus ExpertCenter PN54-S70012NN | |
* ... menor é melhor
AIDA64: FP32 Ray-Trace | FPU Julia | CPU SHA3 | CPU Queen | FPU SinJulia | FPU Mandel | CPU AES | CPU ZLib | FP64 Ray-Trace | CPU PhotoWorxx | CPU CheckMate
| Performance rating | |
| Asus NUC 15 Pro+ -1! | |
| HP EliteBoard G1a AI -1! | |
| Média AMD Ryzen AI 5 PRO 340 -1! | |
| GMK NucBox K13 -1! | |
| HP Pro Mini 400 G9-937U0EA -1! | |
| MSI Cubi NUC AI+ 2MG -1! | |
| Geekom A5 Pro | |
| AIDA64 / FP32 Ray-Trace | |
| Asus NUC 15 Pro+ (v6.92.6600) | |
| HP EliteBoard G1a AI (v8.20.8100) | |
| Média AMD Ryzen AI 5 PRO 340 (n=1) | |
| GMK NucBox K13 (v8.20.8100) | |
| MSI Cubi NUC AI+ 2MG (v6.92.6600) | |
| HP Pro Mini 400 G9-937U0EA (v6.92.6600) | |
| Geekom A5 Pro (v8.20.8100) | |
| Geekom A5 Pro (v6.92.6600) | |
| AIDA64 / FPU Julia | |
| Asus NUC 15 Pro+ (v6.92.6600) | |
| HP EliteBoard G1a AI (v8.20.8100) | |
| Média AMD Ryzen AI 5 PRO 340 (n=1) | |
| GMK NucBox K13 (v8.20.8100) | |
| MSI Cubi NUC AI+ 2MG (v6.92.6600) | |
| HP Pro Mini 400 G9-937U0EA (v6.92.6600) | |
| Geekom A5 Pro (v8.20.8100) | |
| Geekom A5 Pro (v6.92.6600) | |
| AIDA64 / CPU SHA3 | |
| Asus NUC 15 Pro+ (v6.92.6600) | |
| GMK NucBox K13 (v8.20.8100) | |
| MSI Cubi NUC AI+ 2MG (v6.92.6600) | |
| HP Pro Mini 400 G9-937U0EA (v6.92.6600) | |
| HP EliteBoard G1a AI (v8.20.8100) | |
| Média AMD Ryzen AI 5 PRO 340 (n=1) | |
| Geekom A5 Pro (v6.92.6600) | |
| Geekom A5 Pro (v8.20.8100) | |
| AIDA64 / CPU Queen | |
| HP Pro Mini 400 G9-937U0EA (v6.92.6600) | |
| Asus NUC 15 Pro+ (v6.92.6600) | |
| Geekom A5 Pro (v6.92.6600) | |
| MSI Cubi NUC AI+ 2MG (v6.92.6600) | |
| AIDA64 / FPU SinJulia | |
| HP EliteBoard G1a AI (v8.20.8100) | |
| Média AMD Ryzen AI 5 PRO 340 (n=1) | |
| Asus NUC 15 Pro+ (v6.92.6600) | |
| Geekom A5 Pro (v6.92.6600) | |
| Geekom A5 Pro (v8.20.8100) | |
| HP Pro Mini 400 G9-937U0EA (v6.92.6600) | |
| GMK NucBox K13 (v8.20.8100) | |
| MSI Cubi NUC AI+ 2MG (v6.92.6600) | |
| AIDA64 / FPU Mandel | |
| Asus NUC 15 Pro+ (v6.92.6600) | |
| HP EliteBoard G1a AI (v8.20.8100) | |
| Média AMD Ryzen AI 5 PRO 340 (n=1) | |
| GMK NucBox K13 (v8.20.8100) | |
| MSI Cubi NUC AI+ 2MG (v6.92.6600) | |
| Geekom A5 Pro (v6.92.6600) | |
| Geekom A5 Pro (v8.20.8100) | |
| HP Pro Mini 400 G9-937U0EA (v6.92.6600) | |
| AIDA64 / CPU AES | |
| Asus NUC 15 Pro+ (v6.92.6600) | |
| GMK NucBox K13 (v8.20.8100) | |
| HP Pro Mini 400 G9-937U0EA (v6.92.6600) | |
| HP EliteBoard G1a AI (v8.20.8100) | |
| Média AMD Ryzen AI 5 PRO 340 (n=1) | |
| MSI Cubi NUC AI+ 2MG (v6.92.6600) | |
| Geekom A5 Pro (v6.92.6600) | |
| Geekom A5 Pro (v8.20.8100) | |
| AIDA64 / CPU ZLib | |
| Asus NUC 15 Pro+ (v6.92.6600) | |
| HP Pro Mini 400 G9-937U0EA (v6.92.6600) | |
| HP EliteBoard G1a AI (v8.20.8100) | |
| Média AMD Ryzen AI 5 PRO 340 (n=1) | |
| GMK NucBox K13 (v8.20.8100) | |
| MSI Cubi NUC AI+ 2MG (v6.92.6600) | |
| Geekom A5 Pro (v6.92.6600) | |
| Geekom A5 Pro (v8.20.8100) | |
| AIDA64 / FP64 Ray-Trace | |
| Asus NUC 15 Pro+ (v6.92.6600) | |
| HP EliteBoard G1a AI (v8.20.8100) | |
| Média AMD Ryzen AI 5 PRO 340 (n=1) | |
| GMK NucBox K13 (v8.20.8100) | |
| MSI Cubi NUC AI+ 2MG (v6.92.6600) | |
| HP Pro Mini 400 G9-937U0EA (v6.92.6600) | |
| Geekom A5 Pro (v8.20.8100) | |
| Geekom A5 Pro (v6.92.6600) | |
| AIDA64 / CPU PhotoWorxx | |
| GMK NucBox K13 (v8.20.8100) | |
| Asus NUC 15 Pro+ (v6.92.6600) | |
| MSI Cubi NUC AI+ 2MG (v6.92.6600) | |
| HP EliteBoard G1a AI (v8.20.8100) | |
| Média AMD Ryzen AI 5 PRO 340 (n=1) | |
| HP Pro Mini 400 G9-937U0EA (v6.92.6600) | |
| Geekom A5 Pro (v6.92.6600) | |
| Geekom A5 Pro (v8.20.8100) | |
| AIDA64 / CPU CheckMate | |
| HP EliteBoard G1a AI (v8.20.8100) | |
| Média AMD Ryzen AI 5 PRO 340 (n=1) | |
| GMK NucBox K13 (v8.20.8100) | |
| Geekom A5 Pro (v8.20.8100) | |
Desempenho do sistema
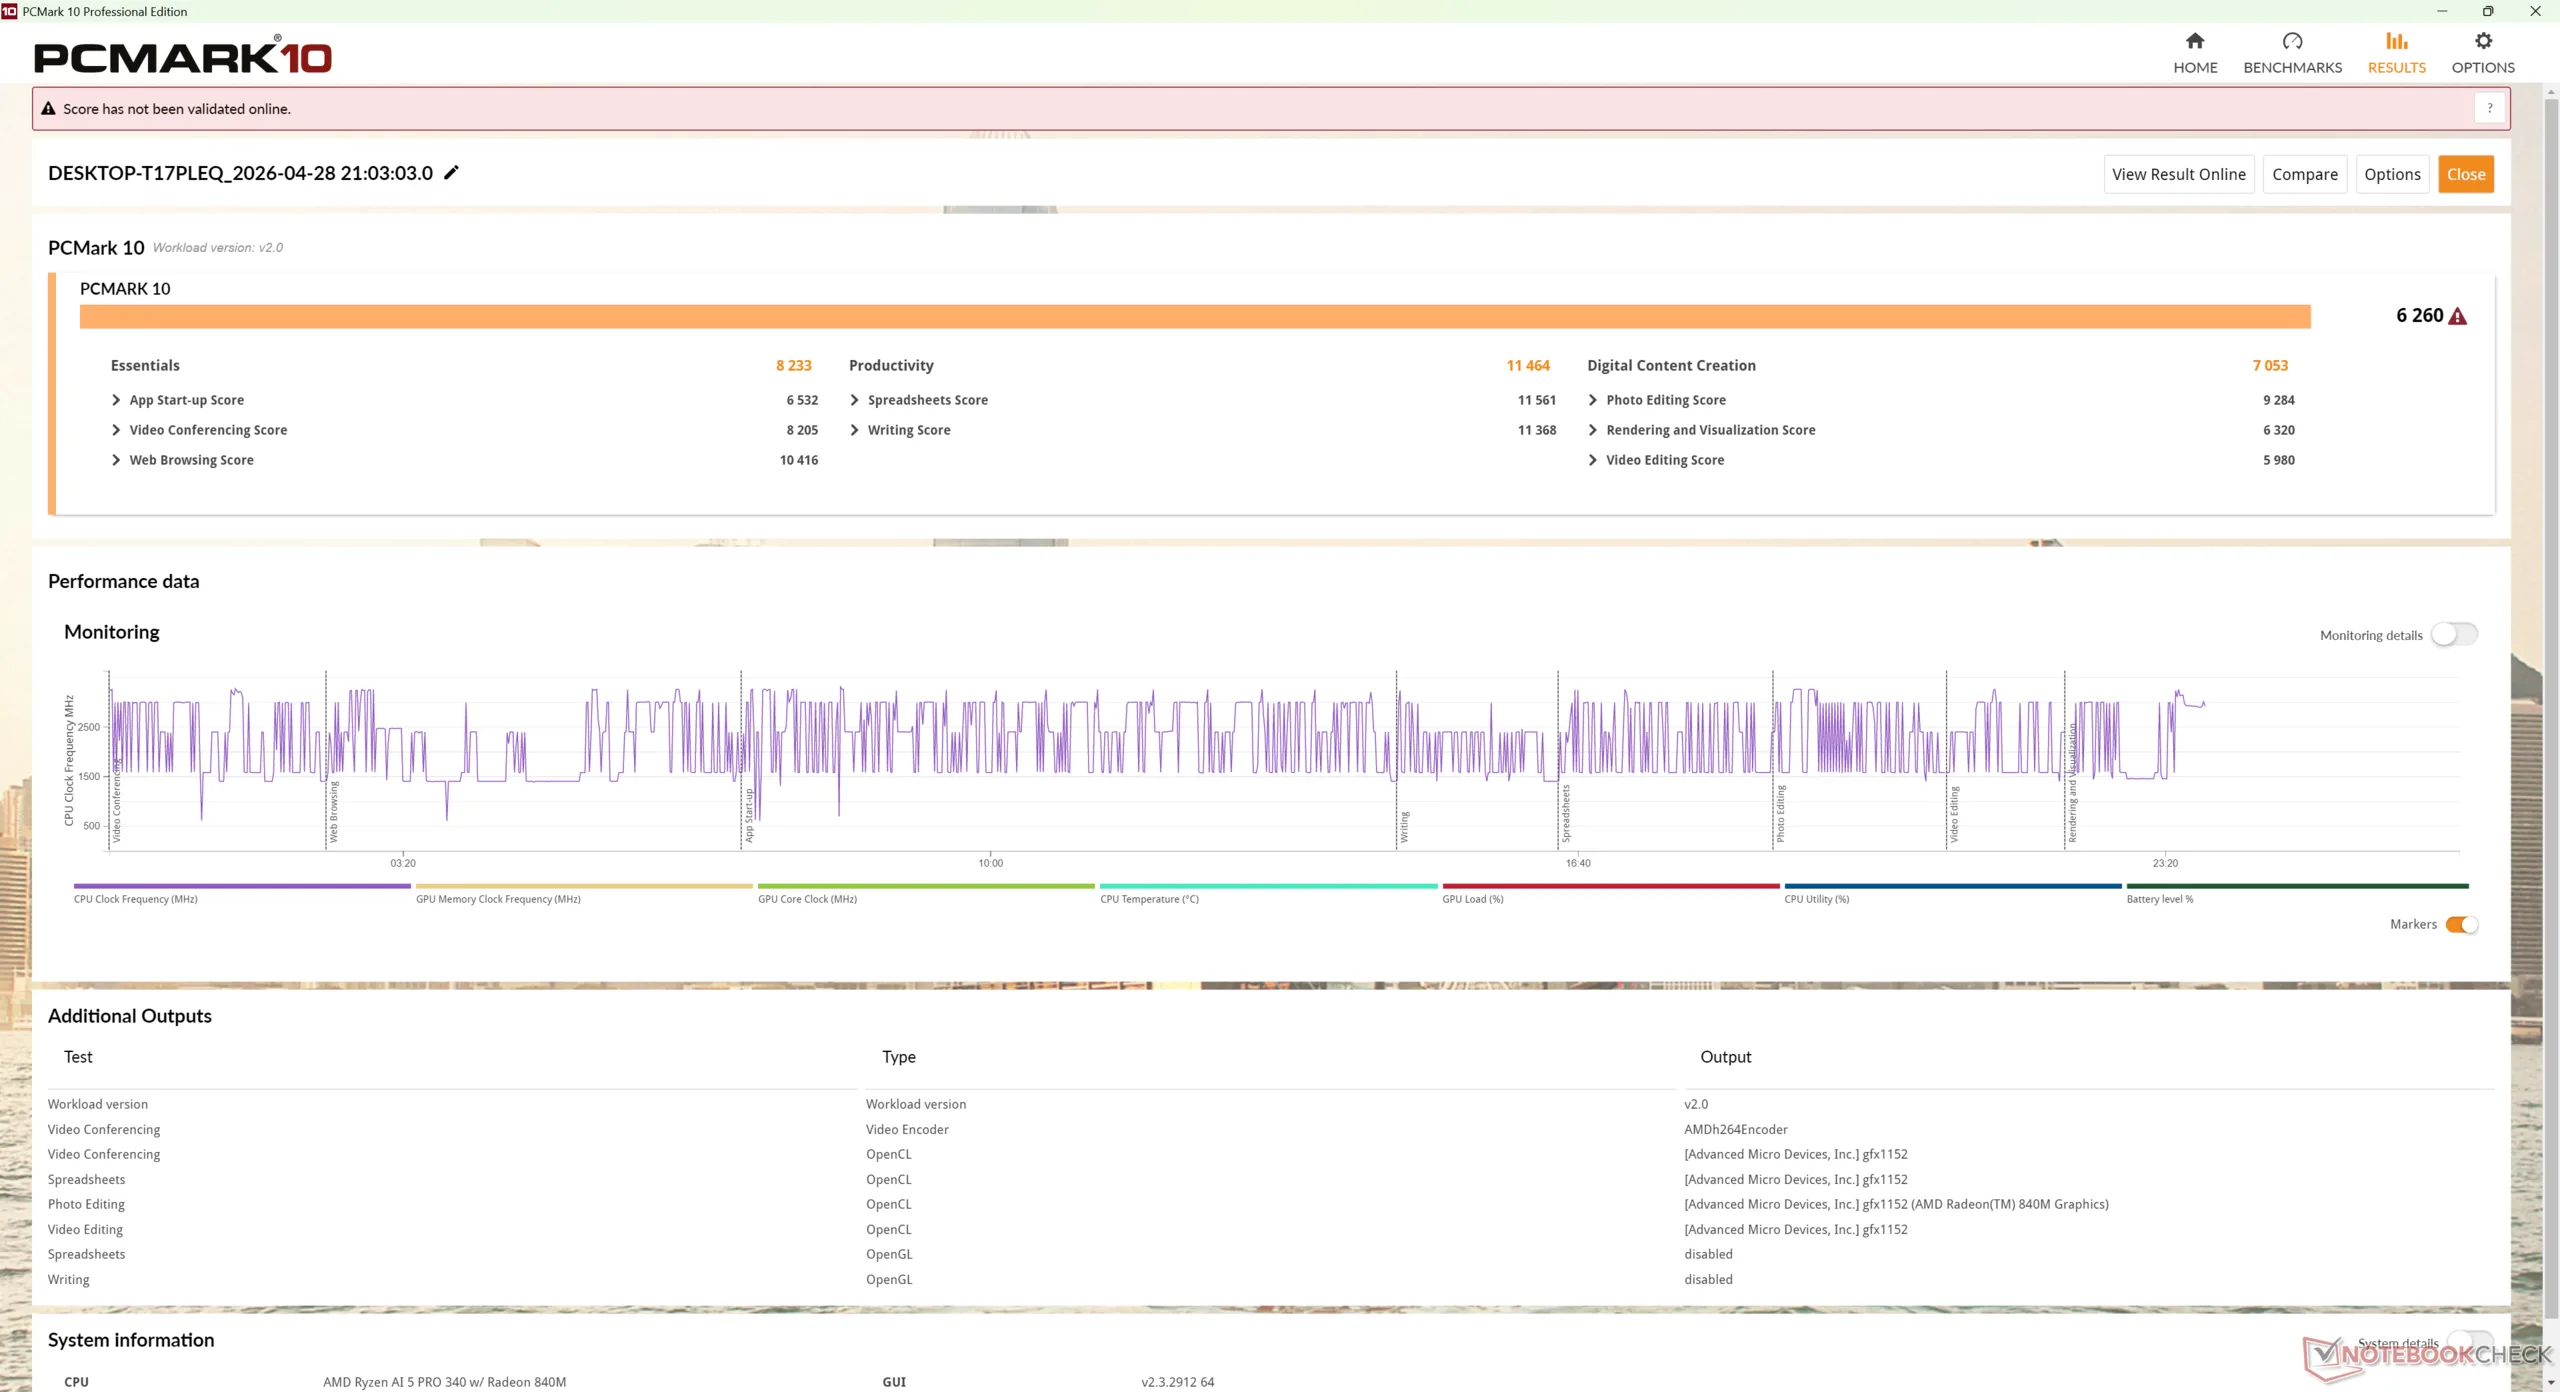
PCMark 10: Score | Essentials | Productivity | Digital Content Creation
CrossMark: Overall | Productivity | Creativity | Responsiveness
WebXPRT 3: Overall
WebXPRT 4: Overall
Mozilla Kraken 1.1: Total
Geekbench AI: Quantized GPU 1.7 | Half Precision GPU 1.7 | Single Precision GPU 1.7
| Performance rating | |
| MSI Cubi NUC AI+ 2MG | |
| GMK NucBox K13 | |
| Asus NUC 15 Pro+ | |
| HP EliteBoard G1a AI | |
| Média AMD Ryzen AI 5 PRO 340, AMD Radeon 840M | |
| HP Pro Mini 400 G9-937U0EA -3! | |
| Geekom A5 Pro | |
| PCMark 10 / Score | |
| GMK NucBox K13 | |
| Asus NUC 15 Pro+ | |
| MSI Cubi NUC AI+ 2MG | |
| HP EliteBoard G1a AI | |
| Média AMD Ryzen AI 5 PRO 340, AMD Radeon 840M (n=1) | |
| Geekom A5 Pro | |
| HP Pro Mini 400 G9-937U0EA | |
| PCMark 10 / Essentials | |
| MSI Cubi NUC AI+ 2MG | |
| GMK NucBox K13 | |
| Asus NUC 15 Pro+ | |
| HP Pro Mini 400 G9-937U0EA | |
| Geekom A5 Pro | |
| HP EliteBoard G1a AI | |
| Média AMD Ryzen AI 5 PRO 340, AMD Radeon 840M (n=1) | |
| PCMark 10 / Productivity | |
| Geekom A5 Pro | |
| GMK NucBox K13 | |
| HP EliteBoard G1a AI | |
| Média AMD Ryzen AI 5 PRO 340, AMD Radeon 840M (n=1) | |
| MSI Cubi NUC AI+ 2MG | |
| Asus NUC 15 Pro+ | |
| HP Pro Mini 400 G9-937U0EA | |
| PCMark 10 / Digital Content Creation | |
| Asus NUC 15 Pro+ | |
| GMK NucBox K13 | |
| MSI Cubi NUC AI+ 2MG | |
| HP EliteBoard G1a AI | |
| Média AMD Ryzen AI 5 PRO 340, AMD Radeon 840M (n=1) | |
| HP Pro Mini 400 G9-937U0EA | |
| Geekom A5 Pro | |
| CrossMark / Overall | |
| Asus NUC 15 Pro+ | |
| GMK NucBox K13 | |
| HP EliteBoard G1a AI | |
| Média AMD Ryzen AI 5 PRO 340, AMD Radeon 840M (n=1) | |
| MSI Cubi NUC AI+ 2MG | |
| HP Pro Mini 400 G9-937U0EA | |
| Geekom A5 Pro | |
| CrossMark / Productivity | |
| GMK NucBox K13 | |
| Asus NUC 15 Pro+ | |
| HP EliteBoard G1a AI | |
| Média AMD Ryzen AI 5 PRO 340, AMD Radeon 840M (n=1) | |
| MSI Cubi NUC AI+ 2MG | |
| HP Pro Mini 400 G9-937U0EA | |
| Geekom A5 Pro | |
| CrossMark / Creativity | |
| Asus NUC 15 Pro+ | |
| HP EliteBoard G1a AI | |
| Média AMD Ryzen AI 5 PRO 340, AMD Radeon 840M (n=1) | |
| GMK NucBox K13 | |
| MSI Cubi NUC AI+ 2MG | |
| HP Pro Mini 400 G9-937U0EA | |
| Geekom A5 Pro | |
| CrossMark / Responsiveness | |
| GMK NucBox K13 | |
| Asus NUC 15 Pro+ | |
| HP EliteBoard G1a AI | |
| Média AMD Ryzen AI 5 PRO 340, AMD Radeon 840M (n=1) | |
| MSI Cubi NUC AI+ 2MG | |
| HP Pro Mini 400 G9-937U0EA | |
| Geekom A5 Pro | |
| WebXPRT 3 / Overall | |
| HP EliteBoard G1a AI | |
| Média AMD Ryzen AI 5 PRO 340, AMD Radeon 840M (n=1) | |
| MSI Cubi NUC AI+ 2MG | |
| GMK NucBox K13 | |
| HP Pro Mini 400 G9-937U0EA | |
| Geekom A5 Pro | |
| Asus NUC 15 Pro+ | |
| WebXPRT 4 / Overall | |
| GMK NucBox K13 | |
| MSI Cubi NUC AI+ 2MG | |
| HP EliteBoard G1a AI | |
| Média AMD Ryzen AI 5 PRO 340, AMD Radeon 840M (n=1) | |
| HP Pro Mini 400 G9-937U0EA | |
| Asus NUC 15 Pro+ | |
| Geekom A5 Pro | |
| Mozilla Kraken 1.1 / Total | |
| Geekom A5 Pro | |
| HP Pro Mini 400 G9-937U0EA | |
| MSI Cubi NUC AI+ 2MG | |
| HP EliteBoard G1a AI | |
| Média AMD Ryzen AI 5 PRO 340, AMD Radeon 840M (n=1) | |
| Asus NUC 15 Pro+ | |
| GMK NucBox K13 | |
| Geekbench AI / Quantized GPU 1.7 | |
| MSI Cubi NUC AI+ 2MG | |
| Asus NUC 15 Pro+ | |
| GMK NucBox K13 | |
| HP EliteBoard G1a AI | |
| Média AMD Ryzen AI 5 PRO 340, AMD Radeon 840M (n=1) | |
| Geekom A5 Pro | |
| Geekbench AI / Half Precision GPU 1.7 | |
| MSI Cubi NUC AI+ 2MG | |
| Asus NUC 15 Pro+ | |
| GMK NucBox K13 | |
| HP EliteBoard G1a AI | |
| Média AMD Ryzen AI 5 PRO 340, AMD Radeon 840M (n=1) | |
| Geekom A5 Pro | |
| Geekbench AI / Single Precision GPU 1.7 | |
| MSI Cubi NUC AI+ 2MG | |
| Asus NUC 15 Pro+ | |
| GMK NucBox K13 | |
| HP EliteBoard G1a AI | |
| Média AMD Ryzen AI 5 PRO 340, AMD Radeon 840M (n=1) | |
| Geekom A5 Pro | |
* ... menor é melhor
| PCMark 10 Score | 6260 pontos | |
Ajuda | ||
| AIDA64 / Memory Copy | |
| MSI Cubi NUC AI+ 2MG | |
| GMK NucBox K13 | |
| Asus NUC 15 Pro+ | |
| HP EliteBoard G1a AI | |
| Média AMD Ryzen AI 5 PRO 340 (n=1) | |
| Geekom A5 Pro | |
| Geekom A5 Pro | |
| HP Pro Mini 400 G9-937U0EA | |
| AIDA64 / Memory Read | |
| GMK NucBox K13 | |
| Asus NUC 15 Pro+ | |
| MSI Cubi NUC AI+ 2MG | |
| HP EliteBoard G1a AI | |
| Média AMD Ryzen AI 5 PRO 340 (n=1) | |
| Geekom A5 Pro | |
| Geekom A5 Pro | |
| HP Pro Mini 400 G9-937U0EA | |
| AIDA64 / Memory Write | |
| MSI Cubi NUC AI+ 2MG | |
| GMK NucBox K13 | |
| HP EliteBoard G1a AI | |
| Média AMD Ryzen AI 5 PRO 340 (n=1) | |
| Asus NUC 15 Pro+ | |
| Geekom A5 Pro | |
| Geekom A5 Pro | |
| HP Pro Mini 400 G9-937U0EA | |
| AIDA64 / Memory Latency | |
| HP EliteBoard G1a AI | |
| Média AMD Ryzen AI 5 PRO 340 (n=1) | |
| Asus NUC 15 Pro+ | |
| GMK NucBox K13 | |
| Geekom A5 Pro | |
| Geekom A5 Pro | |
| MSI Cubi NUC AI+ 2MG | |
| HP Pro Mini 400 G9-937U0EA | |
* ... menor é melhor
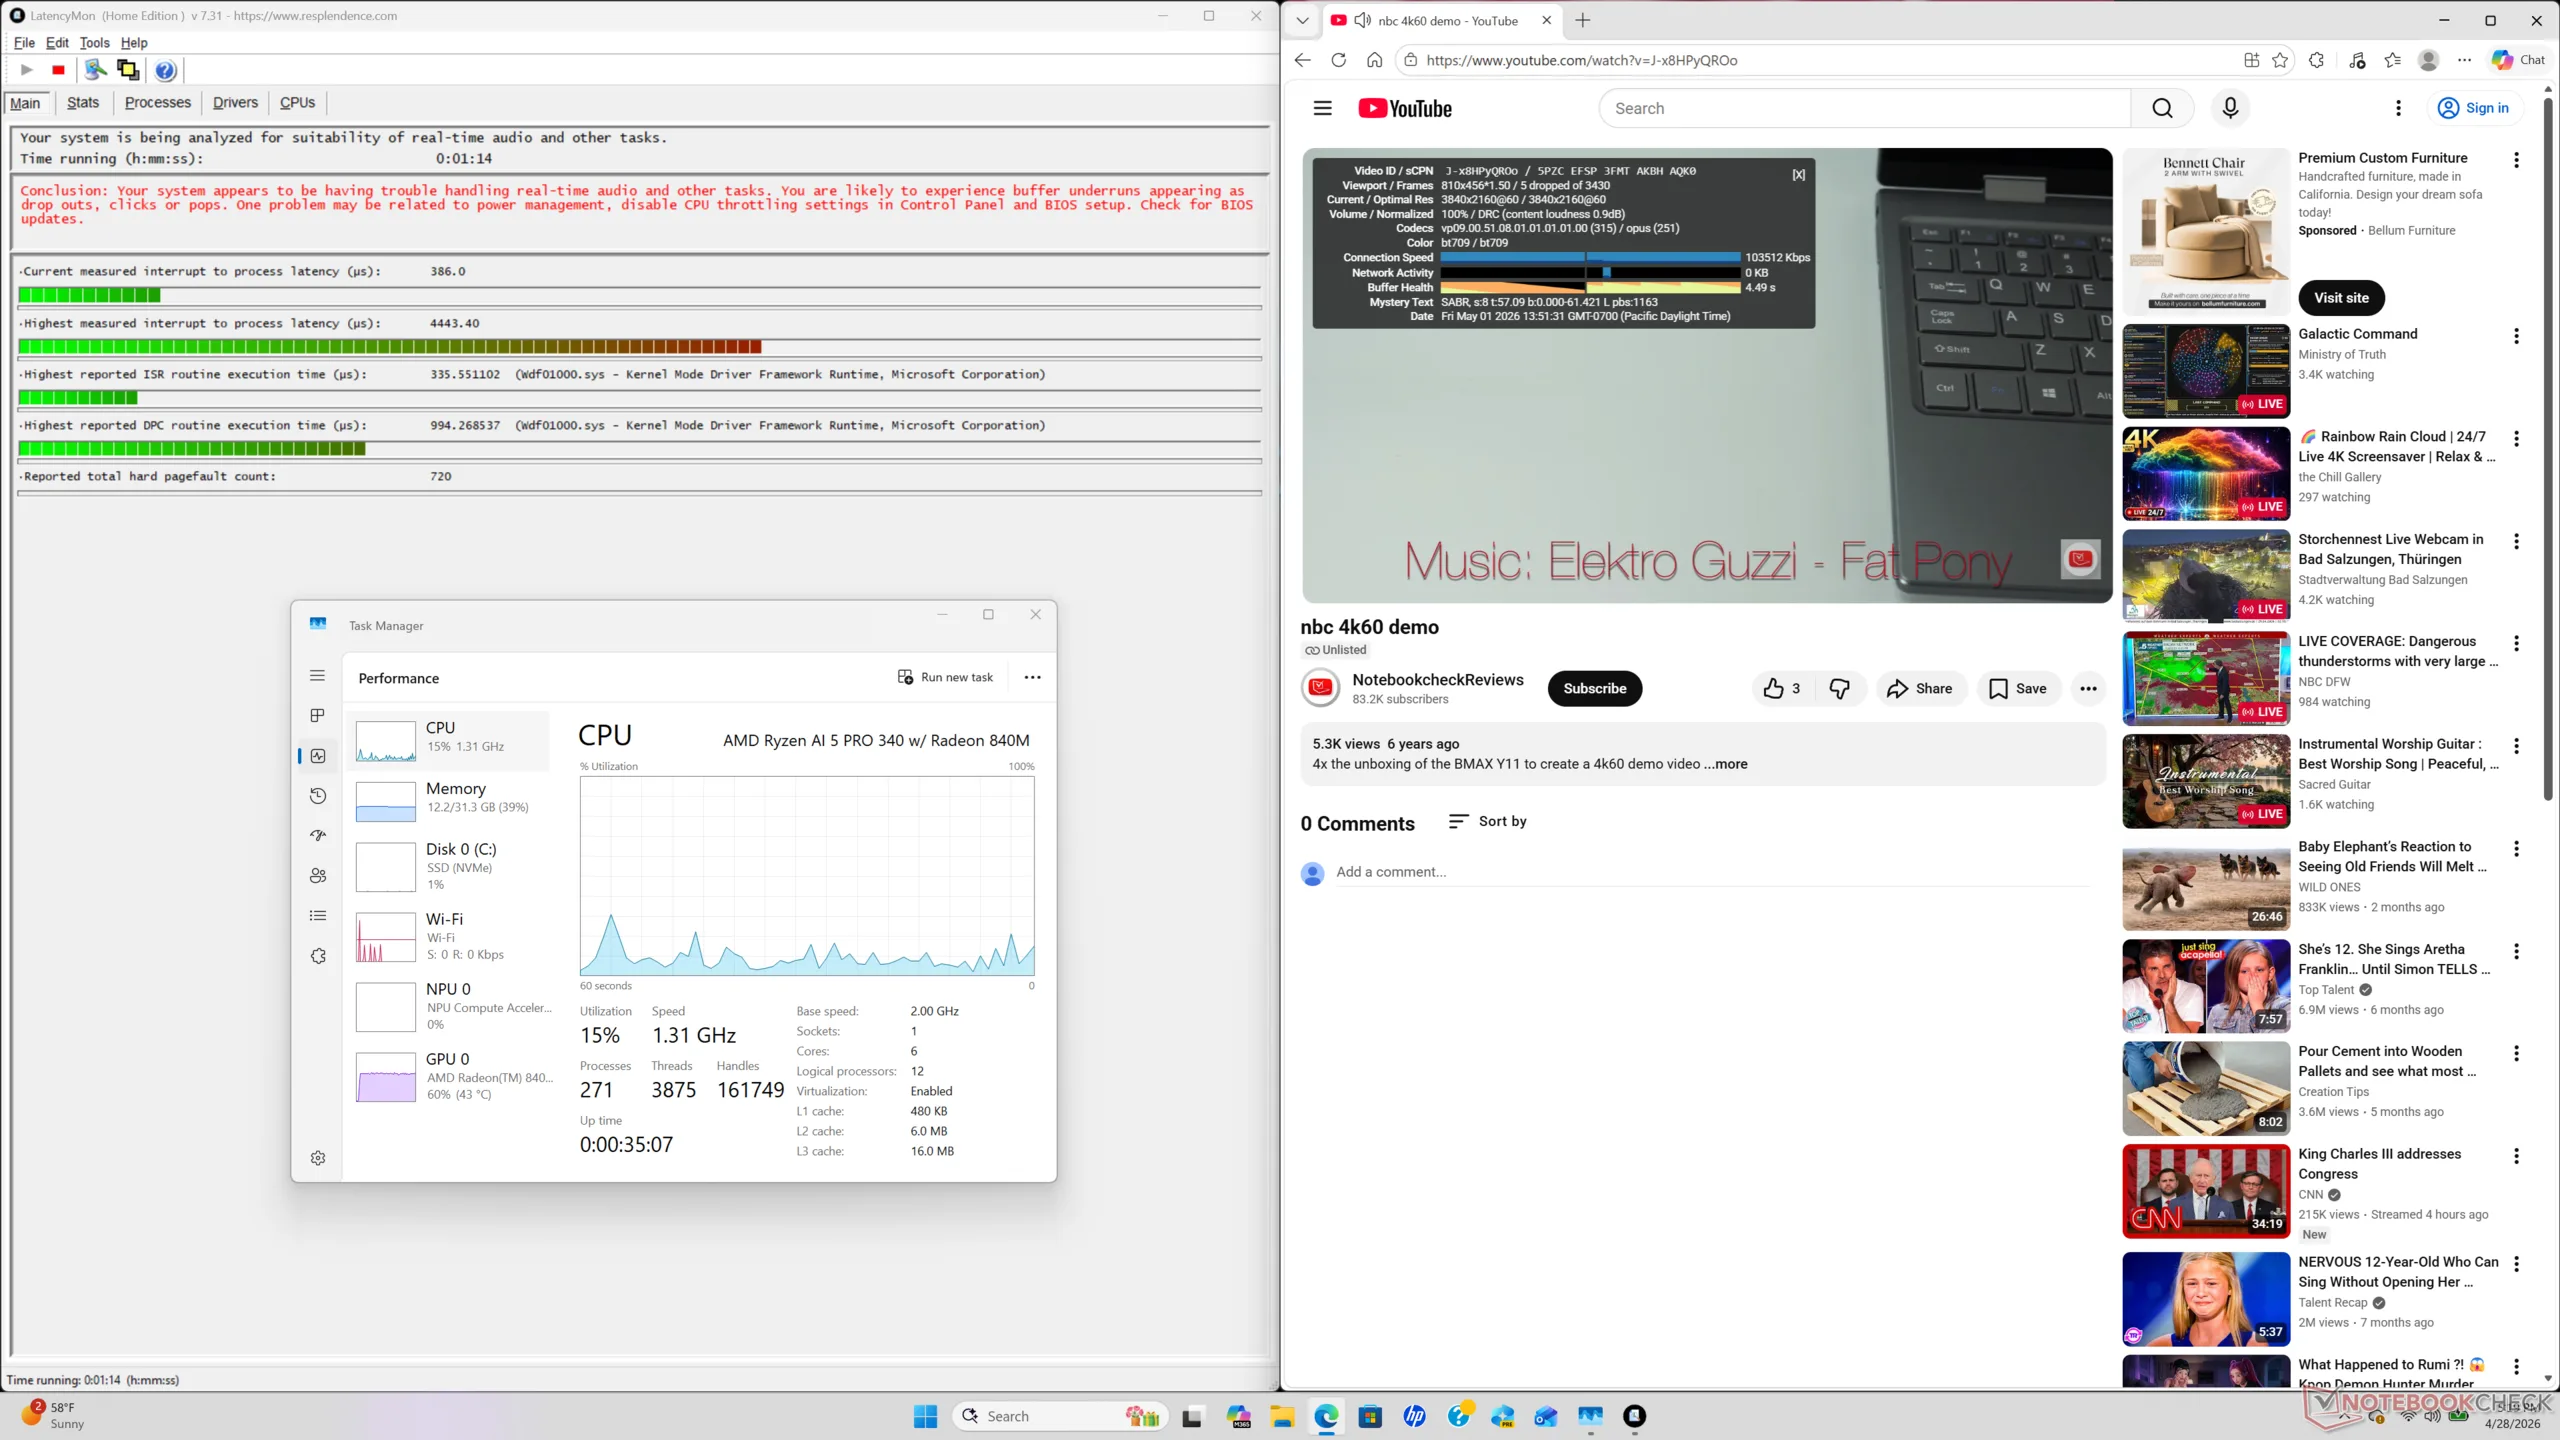
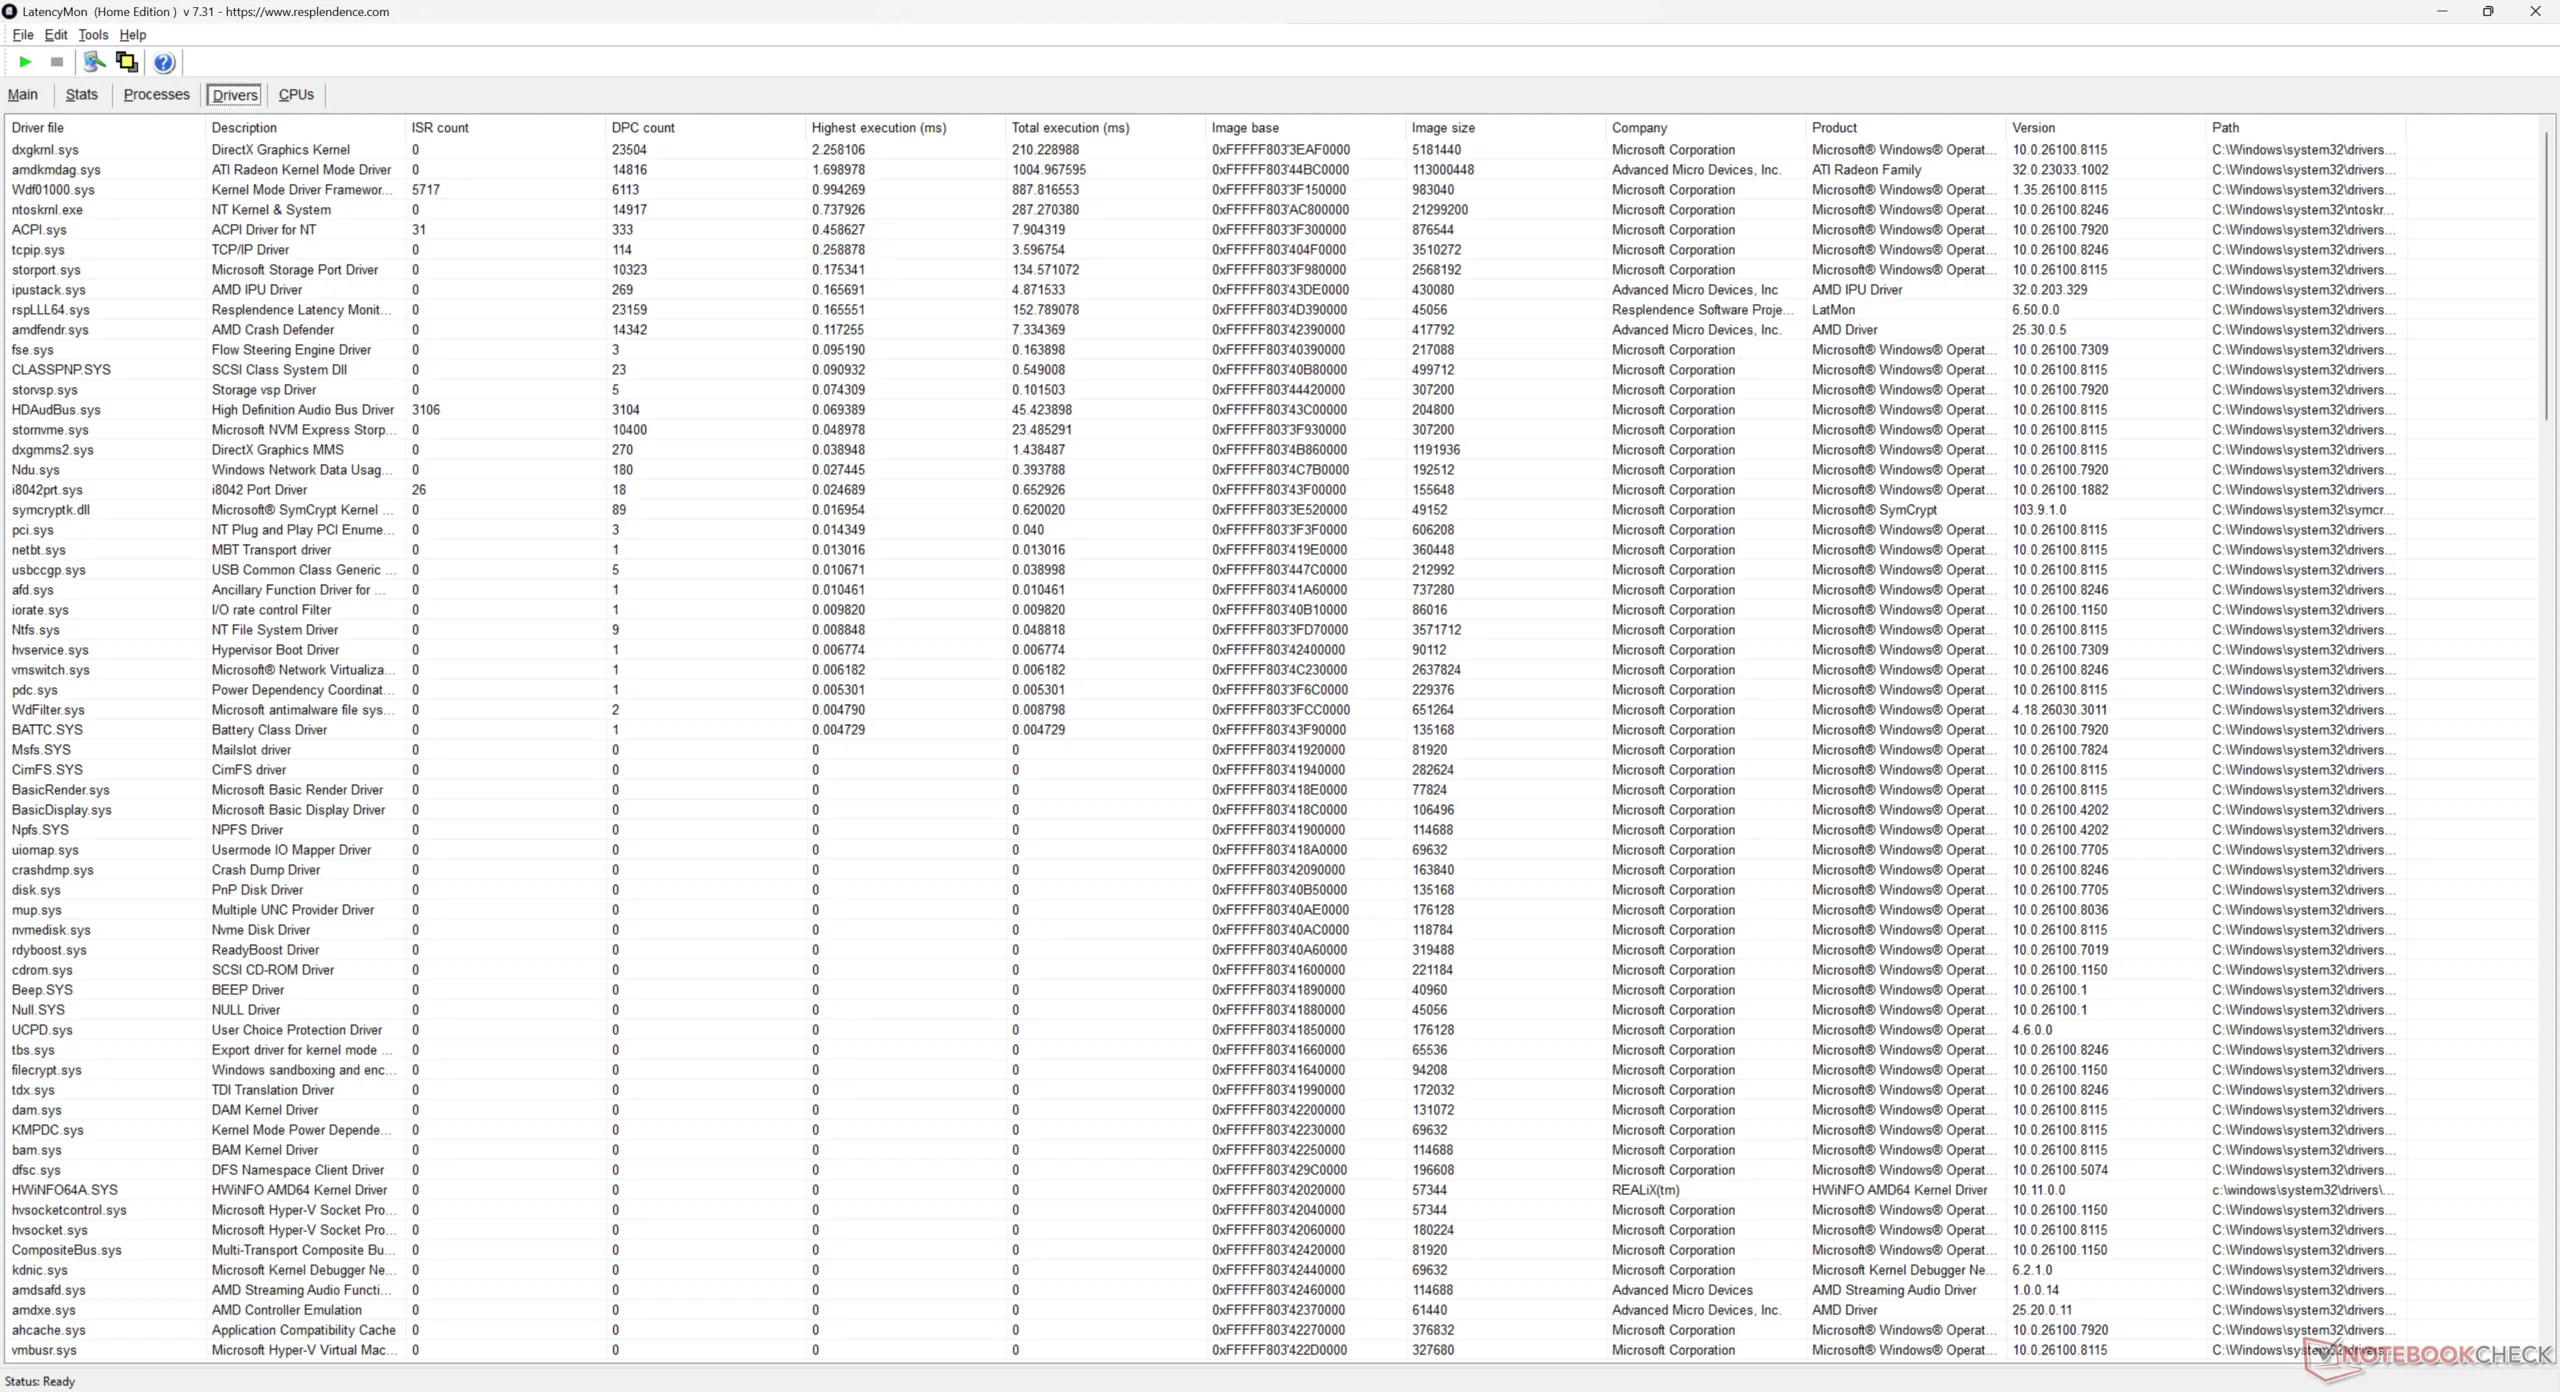
Latência DPC
O LatencyMon revela problemas de DPC e um pequeno número de quadros perdidos ao reproduzir conteúdo de vídeo 4K60. Os resultados não mudaram mesmo após a repetição dos testes com os drivers gráficos mais recentes e a versão do Edge no momento da publicação. Embora os poucos quadros perdidos durante o streaming de vídeo sejam quase imperceptíveis, o ideal é não ter nenhum.
| DPC Latencies / LatencyMon - interrupt to process latency (max), Web, Youtube, Prime95 | |
| HP EliteBoard G1a AI | |
| GMK NucBox K13 | |
| Geekom A5 Pro | |
| HP Pro Mini 400 G9-937U0EA | |
| Asus NUC 15 Pro+ | |
| MSI Cubi NUC AI+ 2MG | |
* ... menor é melhor
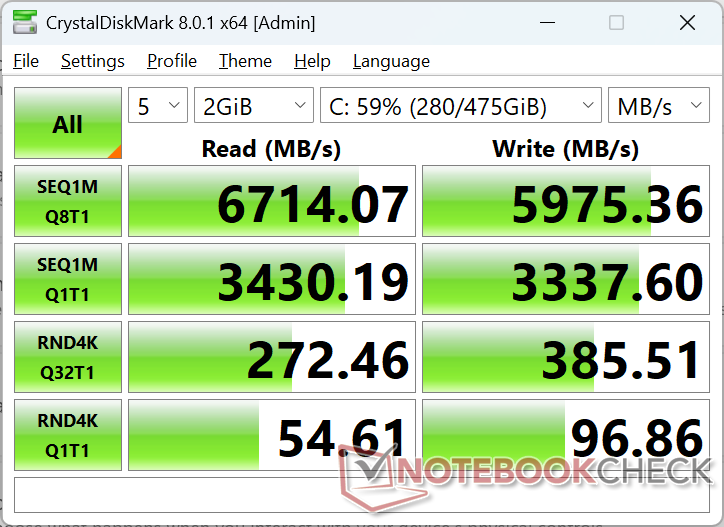
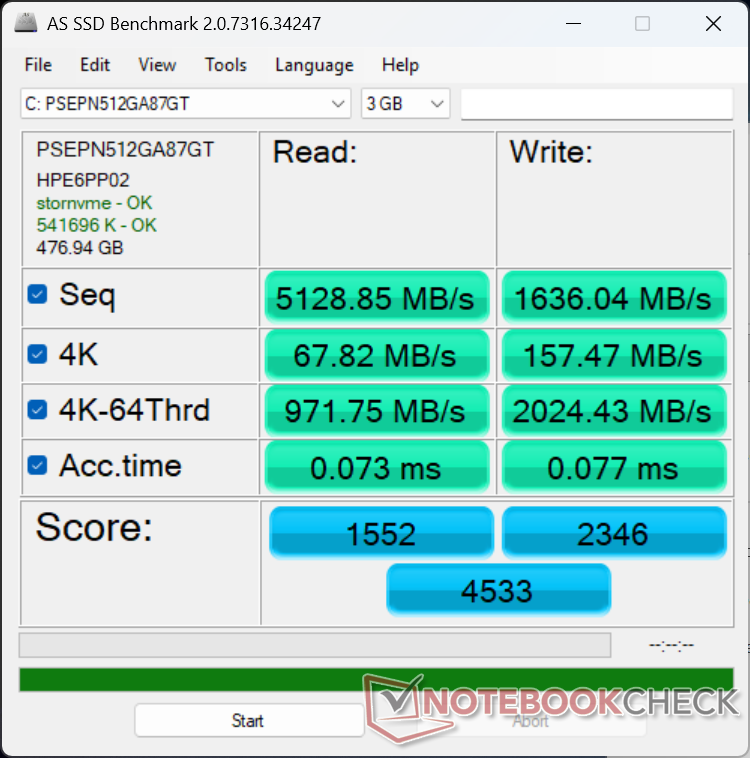
Dispositivos de armazenamento
Nossa configuração apresenta um chip de 512 GB Phison PSEPN512GA87GT PCIe4 x4 NVMe 2280 SSD que oferece taxas de transferência consistentes de até ~7000 MB/s sem limitação, mesmo quando estressado. Essas velocidades são indiscutivelmente exageradas para os tipos de cargas de trabalho para os quais o EliteBoard foi projetado, mas o desempenho rápido é bem-vindo mesmo assim.

| Drive Performance rating - Percent | |
| HP EliteBoard G1a AI | |
| Asus NUC 15 Pro+ | |
| Geekom A5 Pro | |
| MSI Cubi NUC AI+ 2MG | |
| GMK NucBox K13 | |
| HP Pro Mini 400 G9-937U0EA | |
* ... menor é melhor
Limitação de disco: Loop de leitura do DiskSpd, profundidade da fila 8
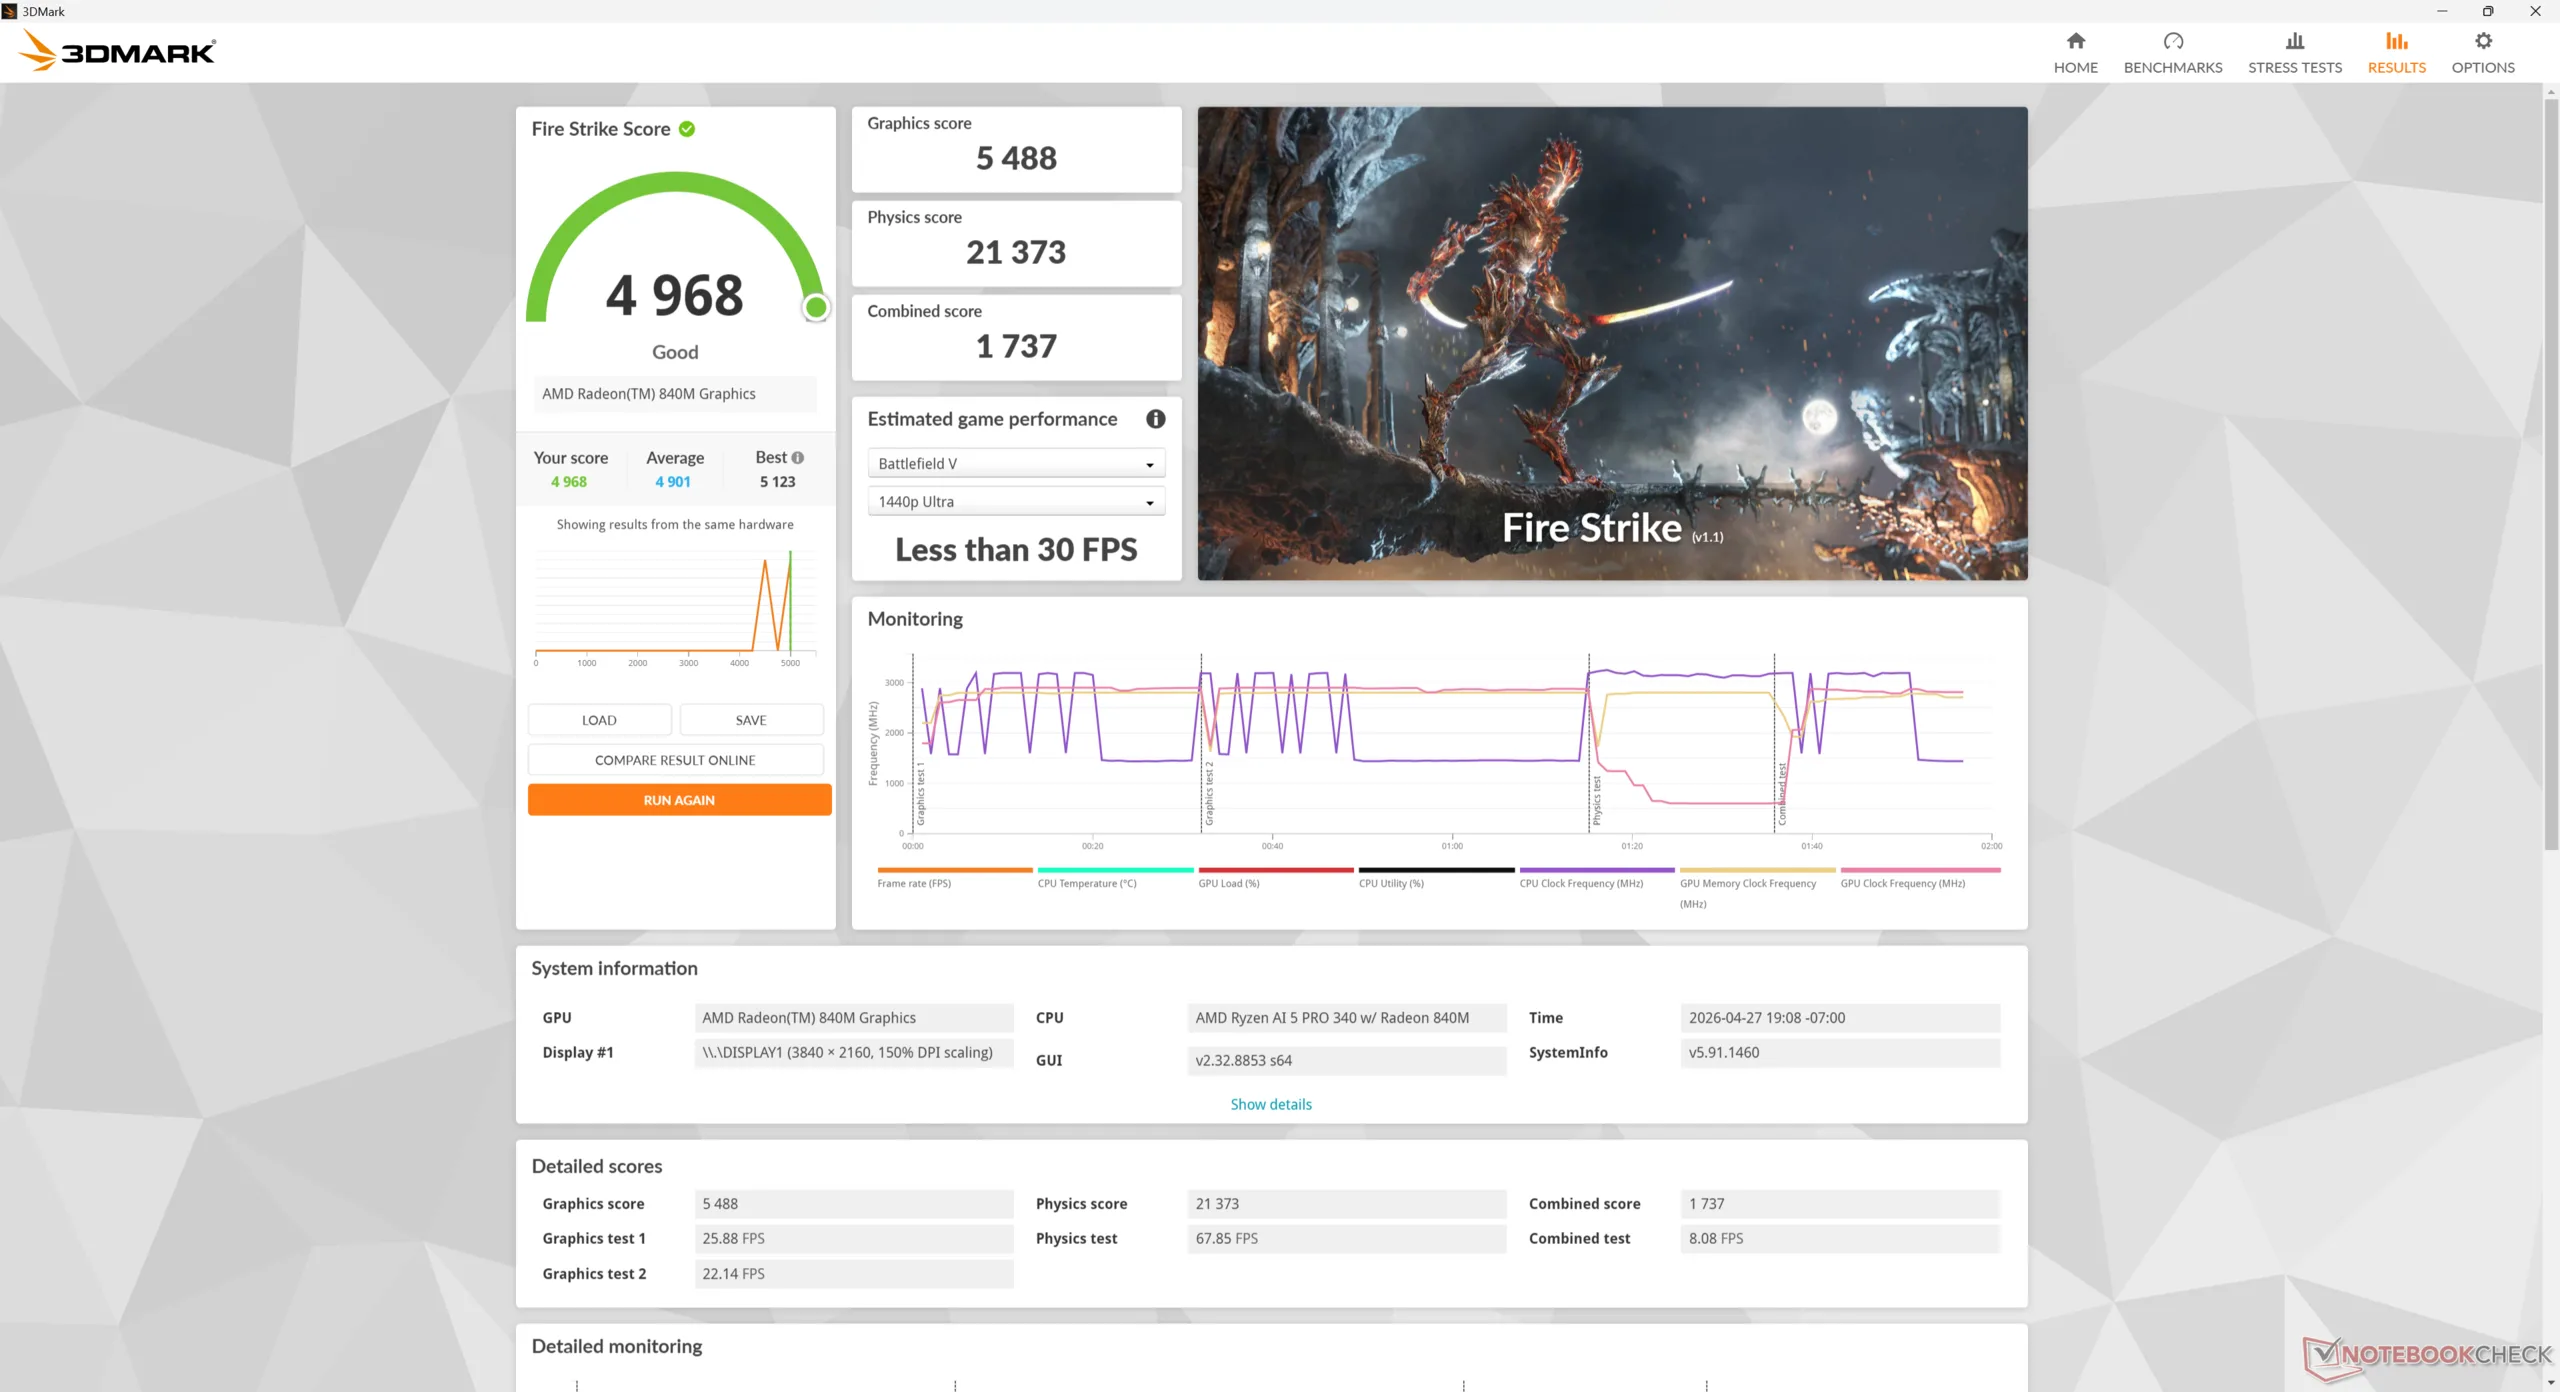
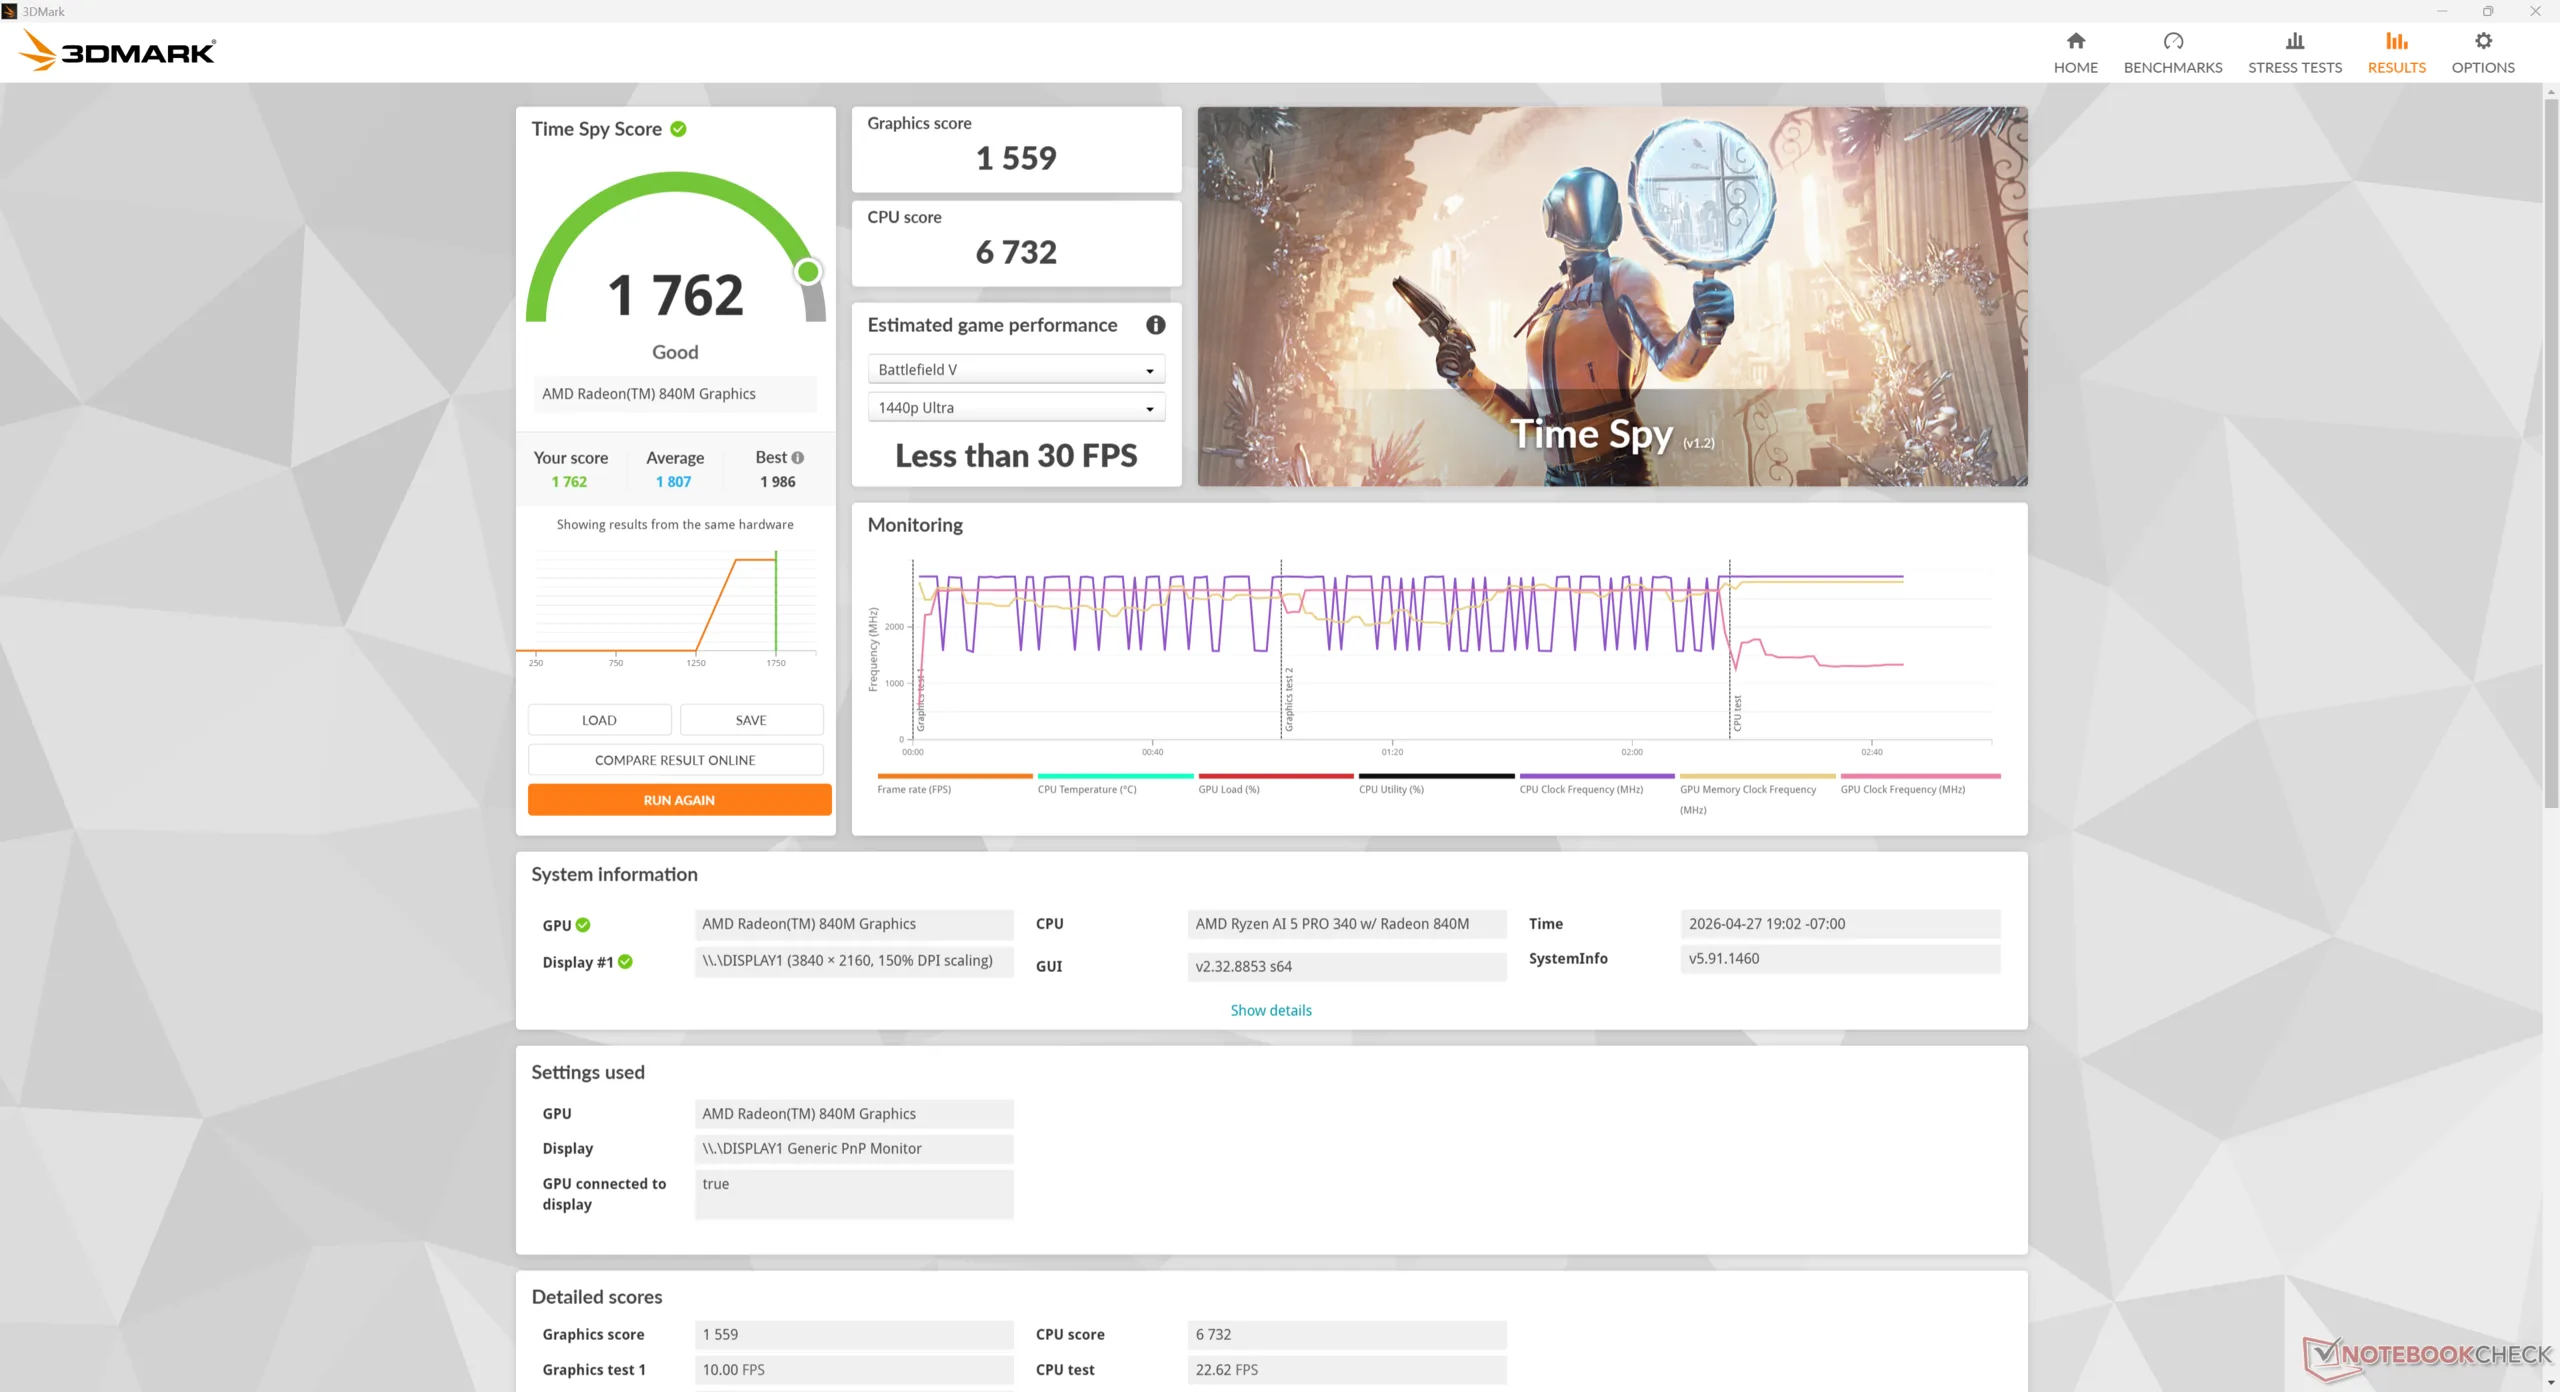
Desempenho da GPU
A placa de vídeo integrada Radeon 840M integrada está em pé de igualdade com a envelhecida Iris Xe 96EUs que era popular em subnotebooks há apenas alguns anos. Enquanto a atualização para o Ryzen AI 7 PRO 350 Radeon 860M SKU também melhoraria o desempenho gráfico em até 70%, o desempenho geral ainda seria inadequado para a maioria das tarefas intensivas de GPU. Infelizmente, a HP não oferece a Radeon 880M ou 890M para jogos.
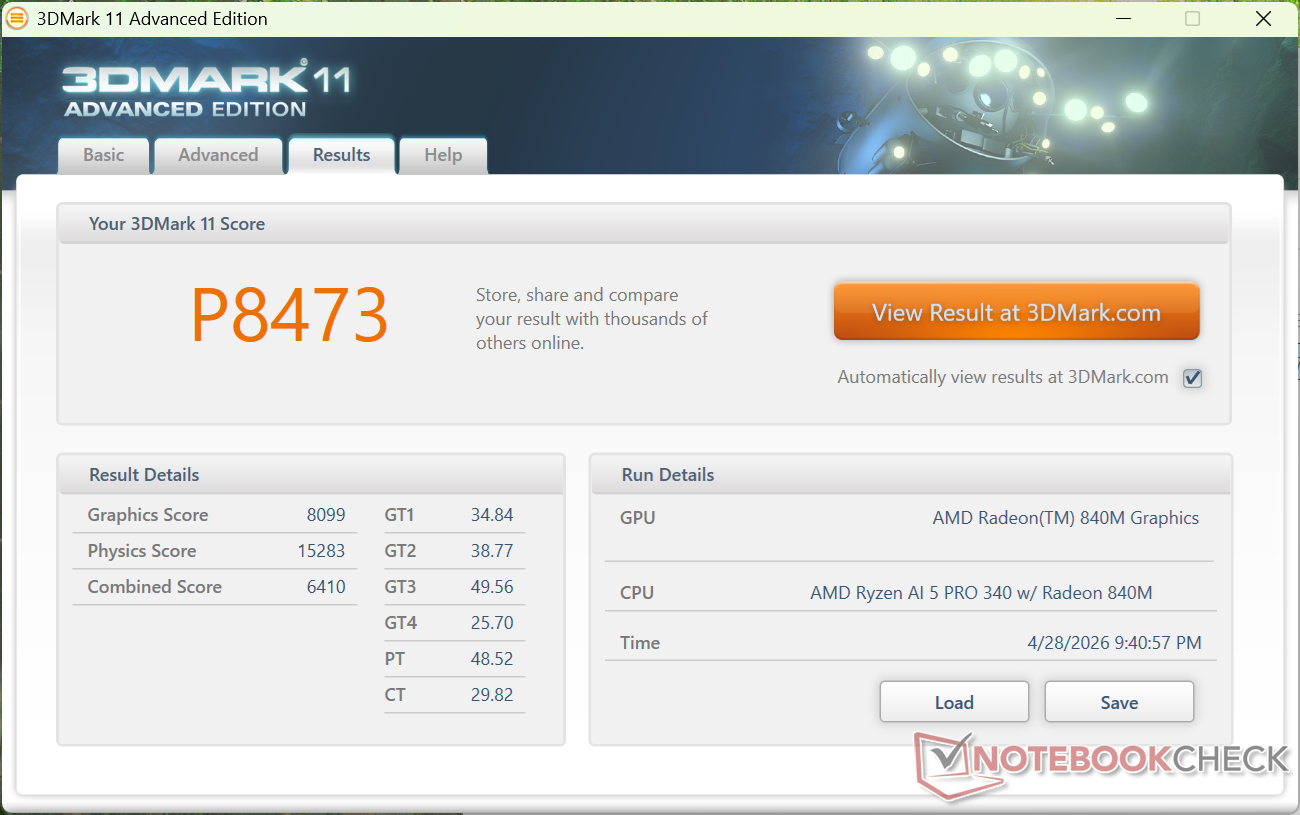
| 3DMark 11 Performance | 8473 pontos | |
| 3DMark Cloud Gate Standard Score | 25064 pontos | |
| 3DMark Fire Strike Score | 4968 pontos | |
| 3DMark Time Spy Score | 1762 pontos | |
Ajuda | ||
* ... menor é melhor
| Performance rating - Percent | |
| Asus NUC 15 Pro+ | |
| MSI Cubi NUC AI+ 2MG | |
| GMK NucBox K13 | |
| HP EliteBoard G1a AI | |
| Geekom A5 Pro -2! | |
| HP Pro Mini 400 G9-937U0EA -3! | |
| Cyberpunk 2077 - 1920x1080 Ultra Preset (FSR off) | |
| Asus NUC 15 Pro+ | |
| GMK NucBox K13 | |
| MSI Cubi NUC AI+ 2MG | |
| HP EliteBoard G1a AI | |
| Geekom A5 Pro | |
| HP Pro Mini 400 G9-937U0EA | |
| Baldur's Gate 3 - 1920x1080 Ultra Preset AA:T | |
| MSI Cubi NUC AI+ 2MG | |
| Asus NUC 15 Pro+ | |
| GMK NucBox K13 | |
| HP EliteBoard G1a AI | |
| GTA V - 1920x1080 Highest AA:4xMSAA + FX AF:16x | |
| MSI Cubi NUC AI+ 2MG | |
| GMK NucBox K13 | |
| HP EliteBoard G1a AI | |
| Asus NUC 15 Pro+ | |
| Geekom A5 Pro | |
| Final Fantasy XV Benchmark - 1920x1080 High Quality | |
| Asus NUC 15 Pro+ | |
| MSI Cubi NUC AI+ 2MG | |
| GMK NucBox K13 | |
| HP EliteBoard G1a AI | |
| Geekom A5 Pro | |
| HP Pro Mini 400 G9-937U0EA | |
| Strange Brigade - 1920x1080 ultra AA:ultra AF:16 | |
| MSI Cubi NUC AI+ 2MG | |
| Asus NUC 15 Pro+ | |
| GMK NucBox K13 | |
| HP EliteBoard G1a AI | |
| Dota 2 Reborn - 1920x1080 ultra (3/3) best looking | |
| Asus NUC 15 Pro+ | |
| GMK NucBox K13 | |
| HP EliteBoard G1a AI | |
| MSI Cubi NUC AI+ 2MG | |
| Geekom A5 Pro | |
| HP Pro Mini 400 G9-937U0EA | |
| X-Plane 11.11 - 1920x1080 high (fps_test=3) | |
| Asus NUC 15 Pro+ | |
| HP EliteBoard G1a AI | |
| MSI Cubi NUC AI+ 2MG | |
| Geekom A5 Pro | |
| GMK NucBox K13 | |
| HP Pro Mini 400 G9-937U0EA | |
Gráfico de ultra FPS do Cyberpunk 2077
| baixo | média | alto | ultra | |
|---|---|---|---|---|
| GTA V (2015) | 164.1 | 115.1 | 52.4 | 22.7 |
| Dota 2 Reborn (2015) | 160.6 | 127.2 | 80.1 | 67.7 |
| Final Fantasy XV Benchmark (2018) | 57.3 | 27 | 20.4 | |
| X-Plane 11.11 (2018) | 63.1 | 46.7 | 39.1 | |
| Strange Brigade (2018) | 128.8 | 48.1 | 40.1 | 34.5 |
| Baldur's Gate 3 (2023) | 22.7 | 18.7 | 14.3 | 14.3 |
| Cyberpunk 2077 (2023) | 26.3 | 19.7 | 15.8 | 12.6 |
| F1 24 (2024) | 48.4 | 45 | 32.4 | 6.83 |
Emissões
Ruído do sistema
O ruído do ventilador geralmente é mais perceptível, pois os usuários se sentam mais perto dos teclados do que dos desktops ou mini PCs. Se estiver executando cargas muito exigentes, o EliteBoard pode ser tão barulhento quanto alguns laptops em condições semelhantes. Por outro lado, a ventoinha é despretensiosa, sem grandes problemas de pulsação quando o usuário simplesmente navega na Web ou fica ocioso.
Barulho
| Ocioso |
| 24.1 / 24.1 / 25.8 dB |
| Carga |
| 40.5 / 45.2 dB |
 | ||
30 dB silencioso 40 dB(A) audível 50 dB(A) ruidosamente alto |
||
min: | ||
| HP EliteBoard G1a AI Ryzen AI 5 340, Radeon 840M | Geekom A5 Pro R5 7530U, Vega 7 | GMK NucBox K13 Core Ultra 7 256V, Arc 140V | Asus NUC 15 Pro+ Ultra 9 285H, Arc 140T | MSI Cubi NUC AI+ 2MG Core Ultra 7 258V, Arc 140V | HP Pro Mini 400 G9-937U0EA i5-14500T, UHD Graphics 770 | |
|---|---|---|---|---|---|---|
| Noise | 6% | -1% | -14% | -15% | 2% | |
| desligado / ambiente * (dB) | 23.6 | 25 -6% | 23.3 1% | 25.3 -7% | 24.8 -5% | 24.8 -5% |
| Idle Minimum * (dB) | 24.1 | 26.6 -10% | 24.5 -2% | 25.4 -5% | 28 -16% | 26.9 -12% |
| Idle Average * (dB) | 24.1 | 26.6 -10% | 25 -4% | 25.5 -6% | 36.1 -50% | 26.9 -12% |
| Idle Maximum * (dB) | 25.8 | 26.7 -3% | 25.1 3% | 37.3 -45% | 36.1 -40% | 26.9 -4% |
| Load Average * (dB) | 40.5 | 33.5 17% | 40.1 1% | 44.4 -10% | 38.9 4% | 32.5 20% |
| Cyberpunk 2077 ultra * (dB) | 42.2 | 31.2 26% | 44.2 -5% | 46.2 -9% | 37 12% | 37.2 12% |
| Load Maximum * (dB) | 45.2 | 33.8 25% | 45.1 -0% | 52.7 -17% | 49.2 -9% | 37.2 18% |
| Witcher 3 ultra * (dB) | 31.2 | 47.7 |
* ... menor é melhor
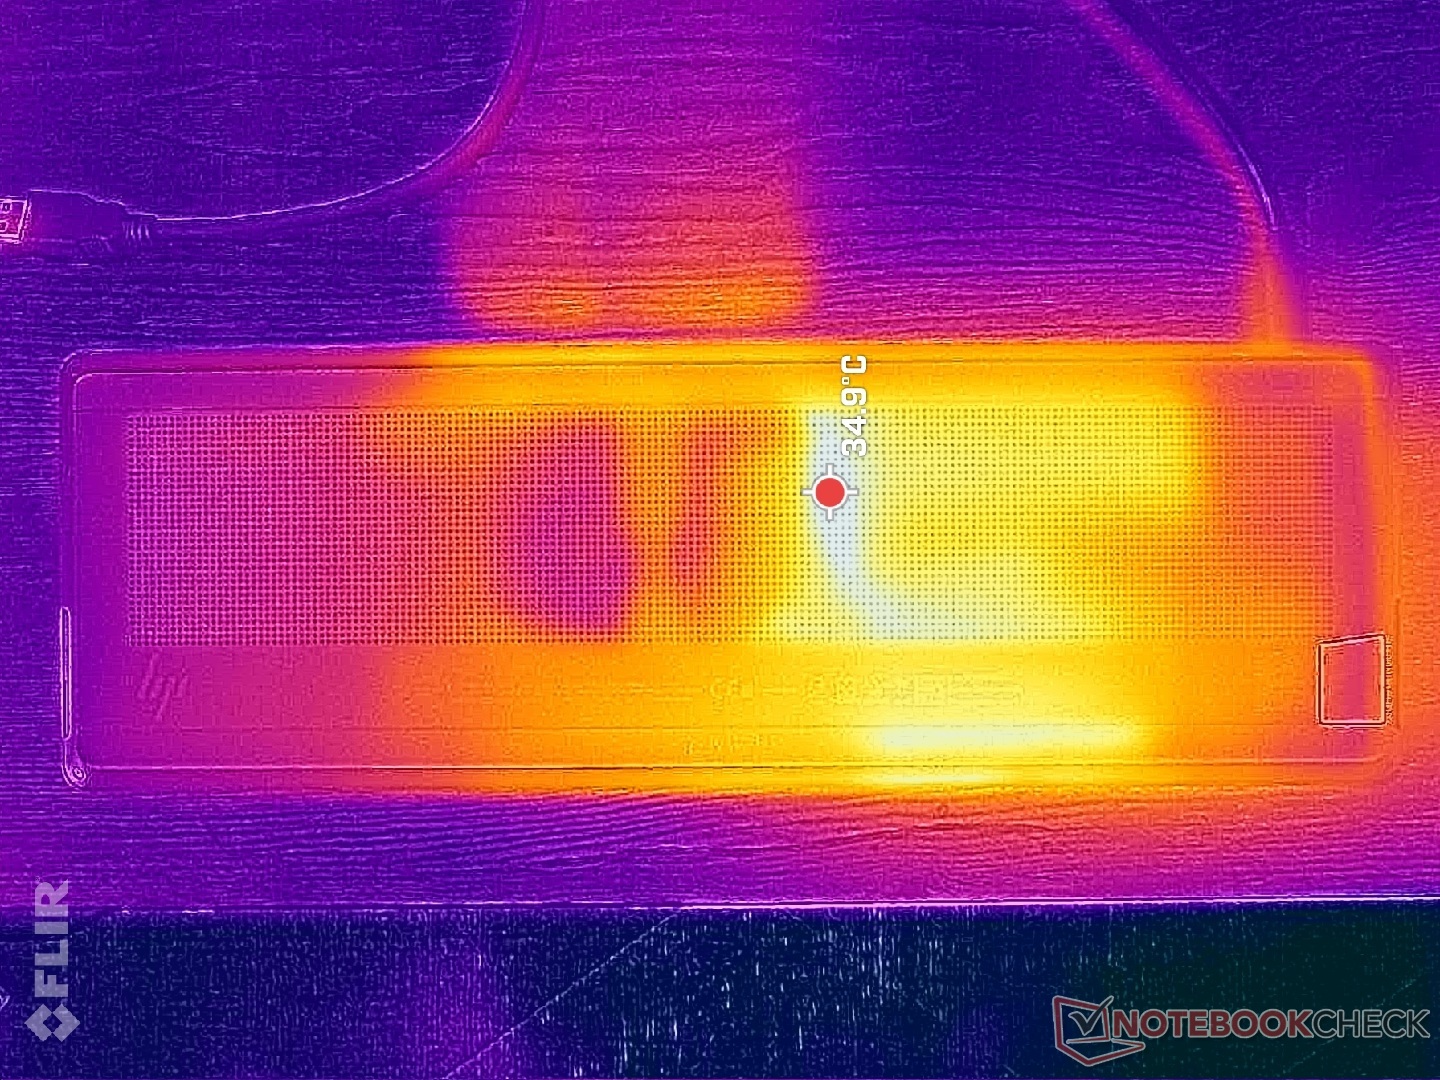
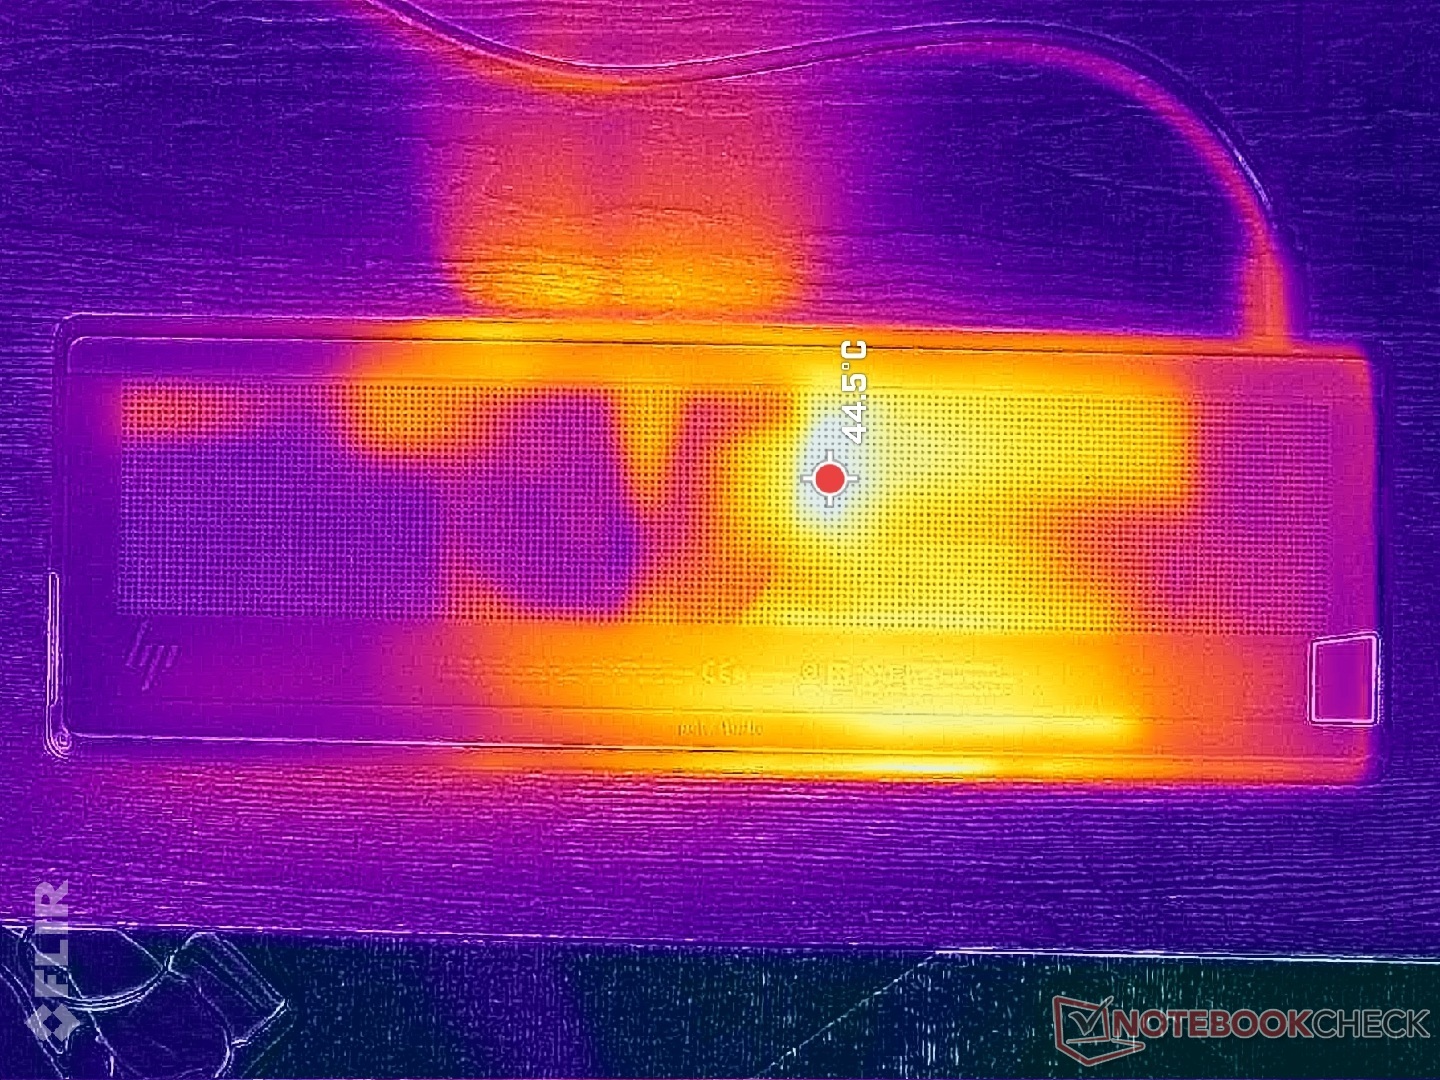
Temperatura
Os pontos de aquecimento podem chegar a mais de 39 °C na parte central do teclado ou 43 °C na parte inferior ao executar cargas exigentes por longos períodos. Embora o calor seja perceptível durante a digitação, nunca o achamos desconfortavelmente quente, pois o contato com as pontas dos dedos é mínimo durante o uso regular.
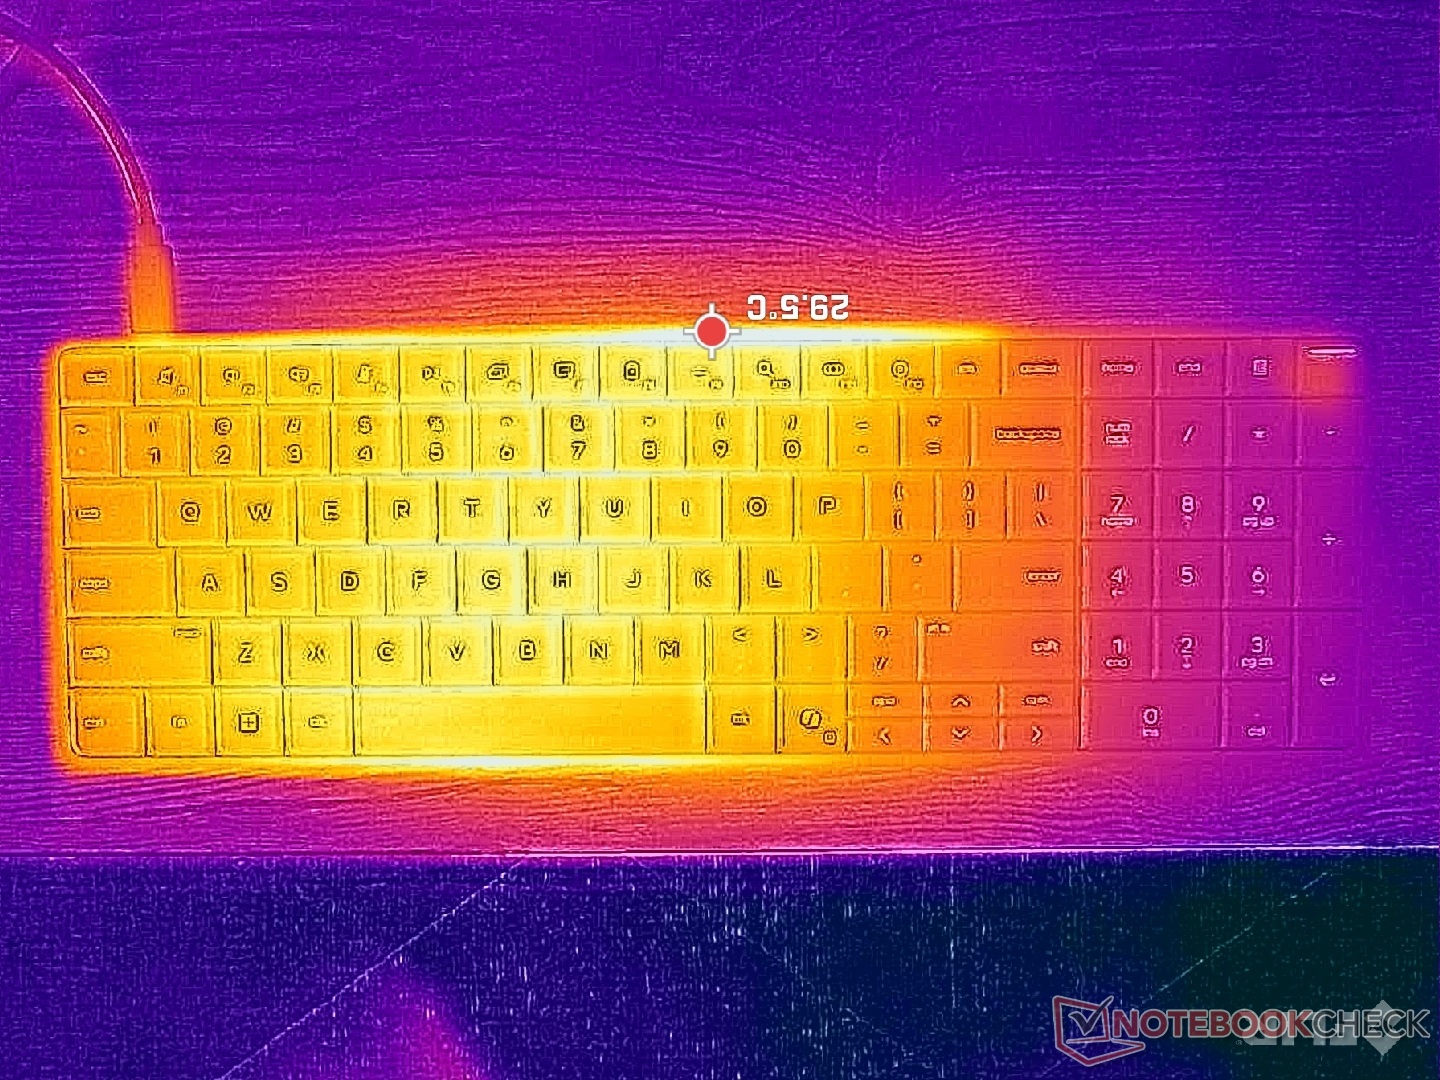
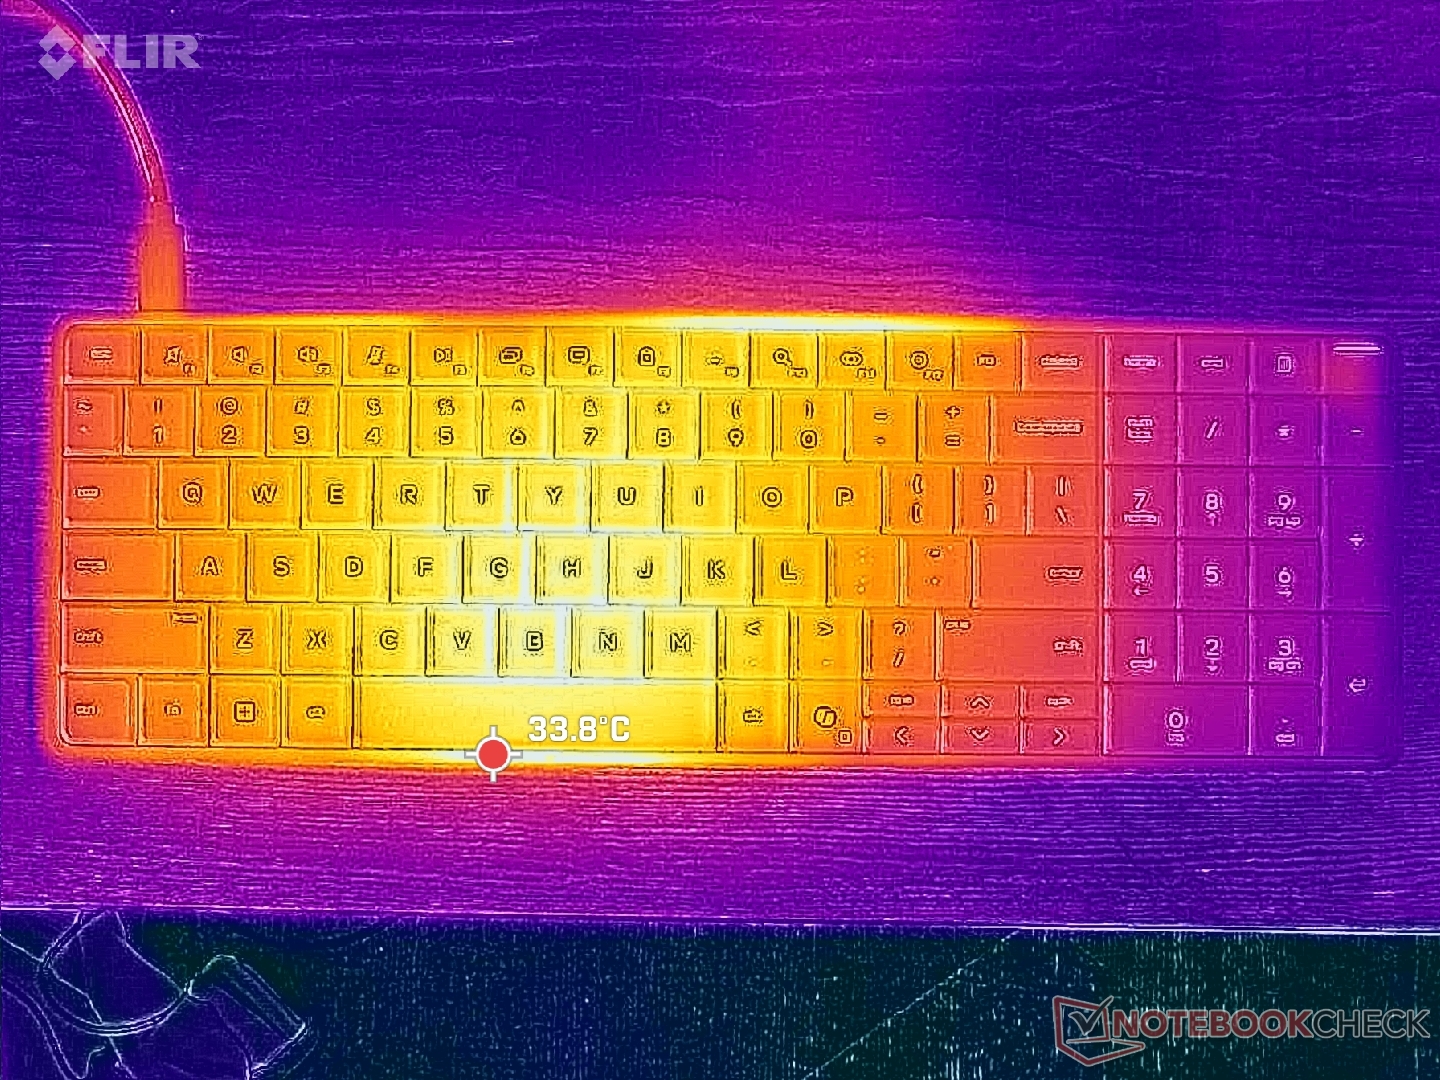
(+) A temperatura máxima no lado superior é 38.4 °C / 101 F, em comparação com a média de 35.4 °C / 96 F , variando de 20.6 a 69.5 °C para a classe Mini PC.
(±) A parte inferior aquece até um máximo de 42.6 °C / 109 F, em comparação com a média de 36.1 °C / 97 F
(+) Em uso inativo, a temperatura média para o lado superior é 30.4 °C / 87 F, em comparação com a média do dispositivo de 32.1 °C / ### class_avg_f### F.
| HP EliteBoard G1a AI Ryzen AI 5 340, Radeon 840M | Geekom A5 Pro R5 7530U, Vega 7 | GMK NucBox K13 Core Ultra 7 256V, Arc 140V | Asus NUC 15 Pro+ Ultra 9 285H, Arc 140T | MSI Cubi NUC AI+ 2MG Core Ultra 7 258V, Arc 140V | HP Pro Mini 400 G9-937U0EA i5-14500T, UHD Graphics 770 | |
|---|---|---|---|---|---|---|
| Heat | 16% | 7% | 4% | 26% | 11% | |
| Maximum Upper Side * (°C) | 38.4 | 36.7 4% | 31.6 18% | 42.2 -10% | 30.8 20% | 35.7 7% |
| Maximum Bottom * (°C) | 42.6 | 40.5 5% | 50.6 -19% | 31.3 27% | 26.4 38% | 39.6 7% |
| Idle Upper Side * (°C) | 32.4 | 23.1 29% | 27 17% | 34.9 -8% | 26.4 19% | 28.6 12% |
| Idle Bottom * (°C) | 34.6 | 25.1 27% | 31.2 10% | 32.2 7% | 25.4 27% | 29 16% |
* ... menor é melhor
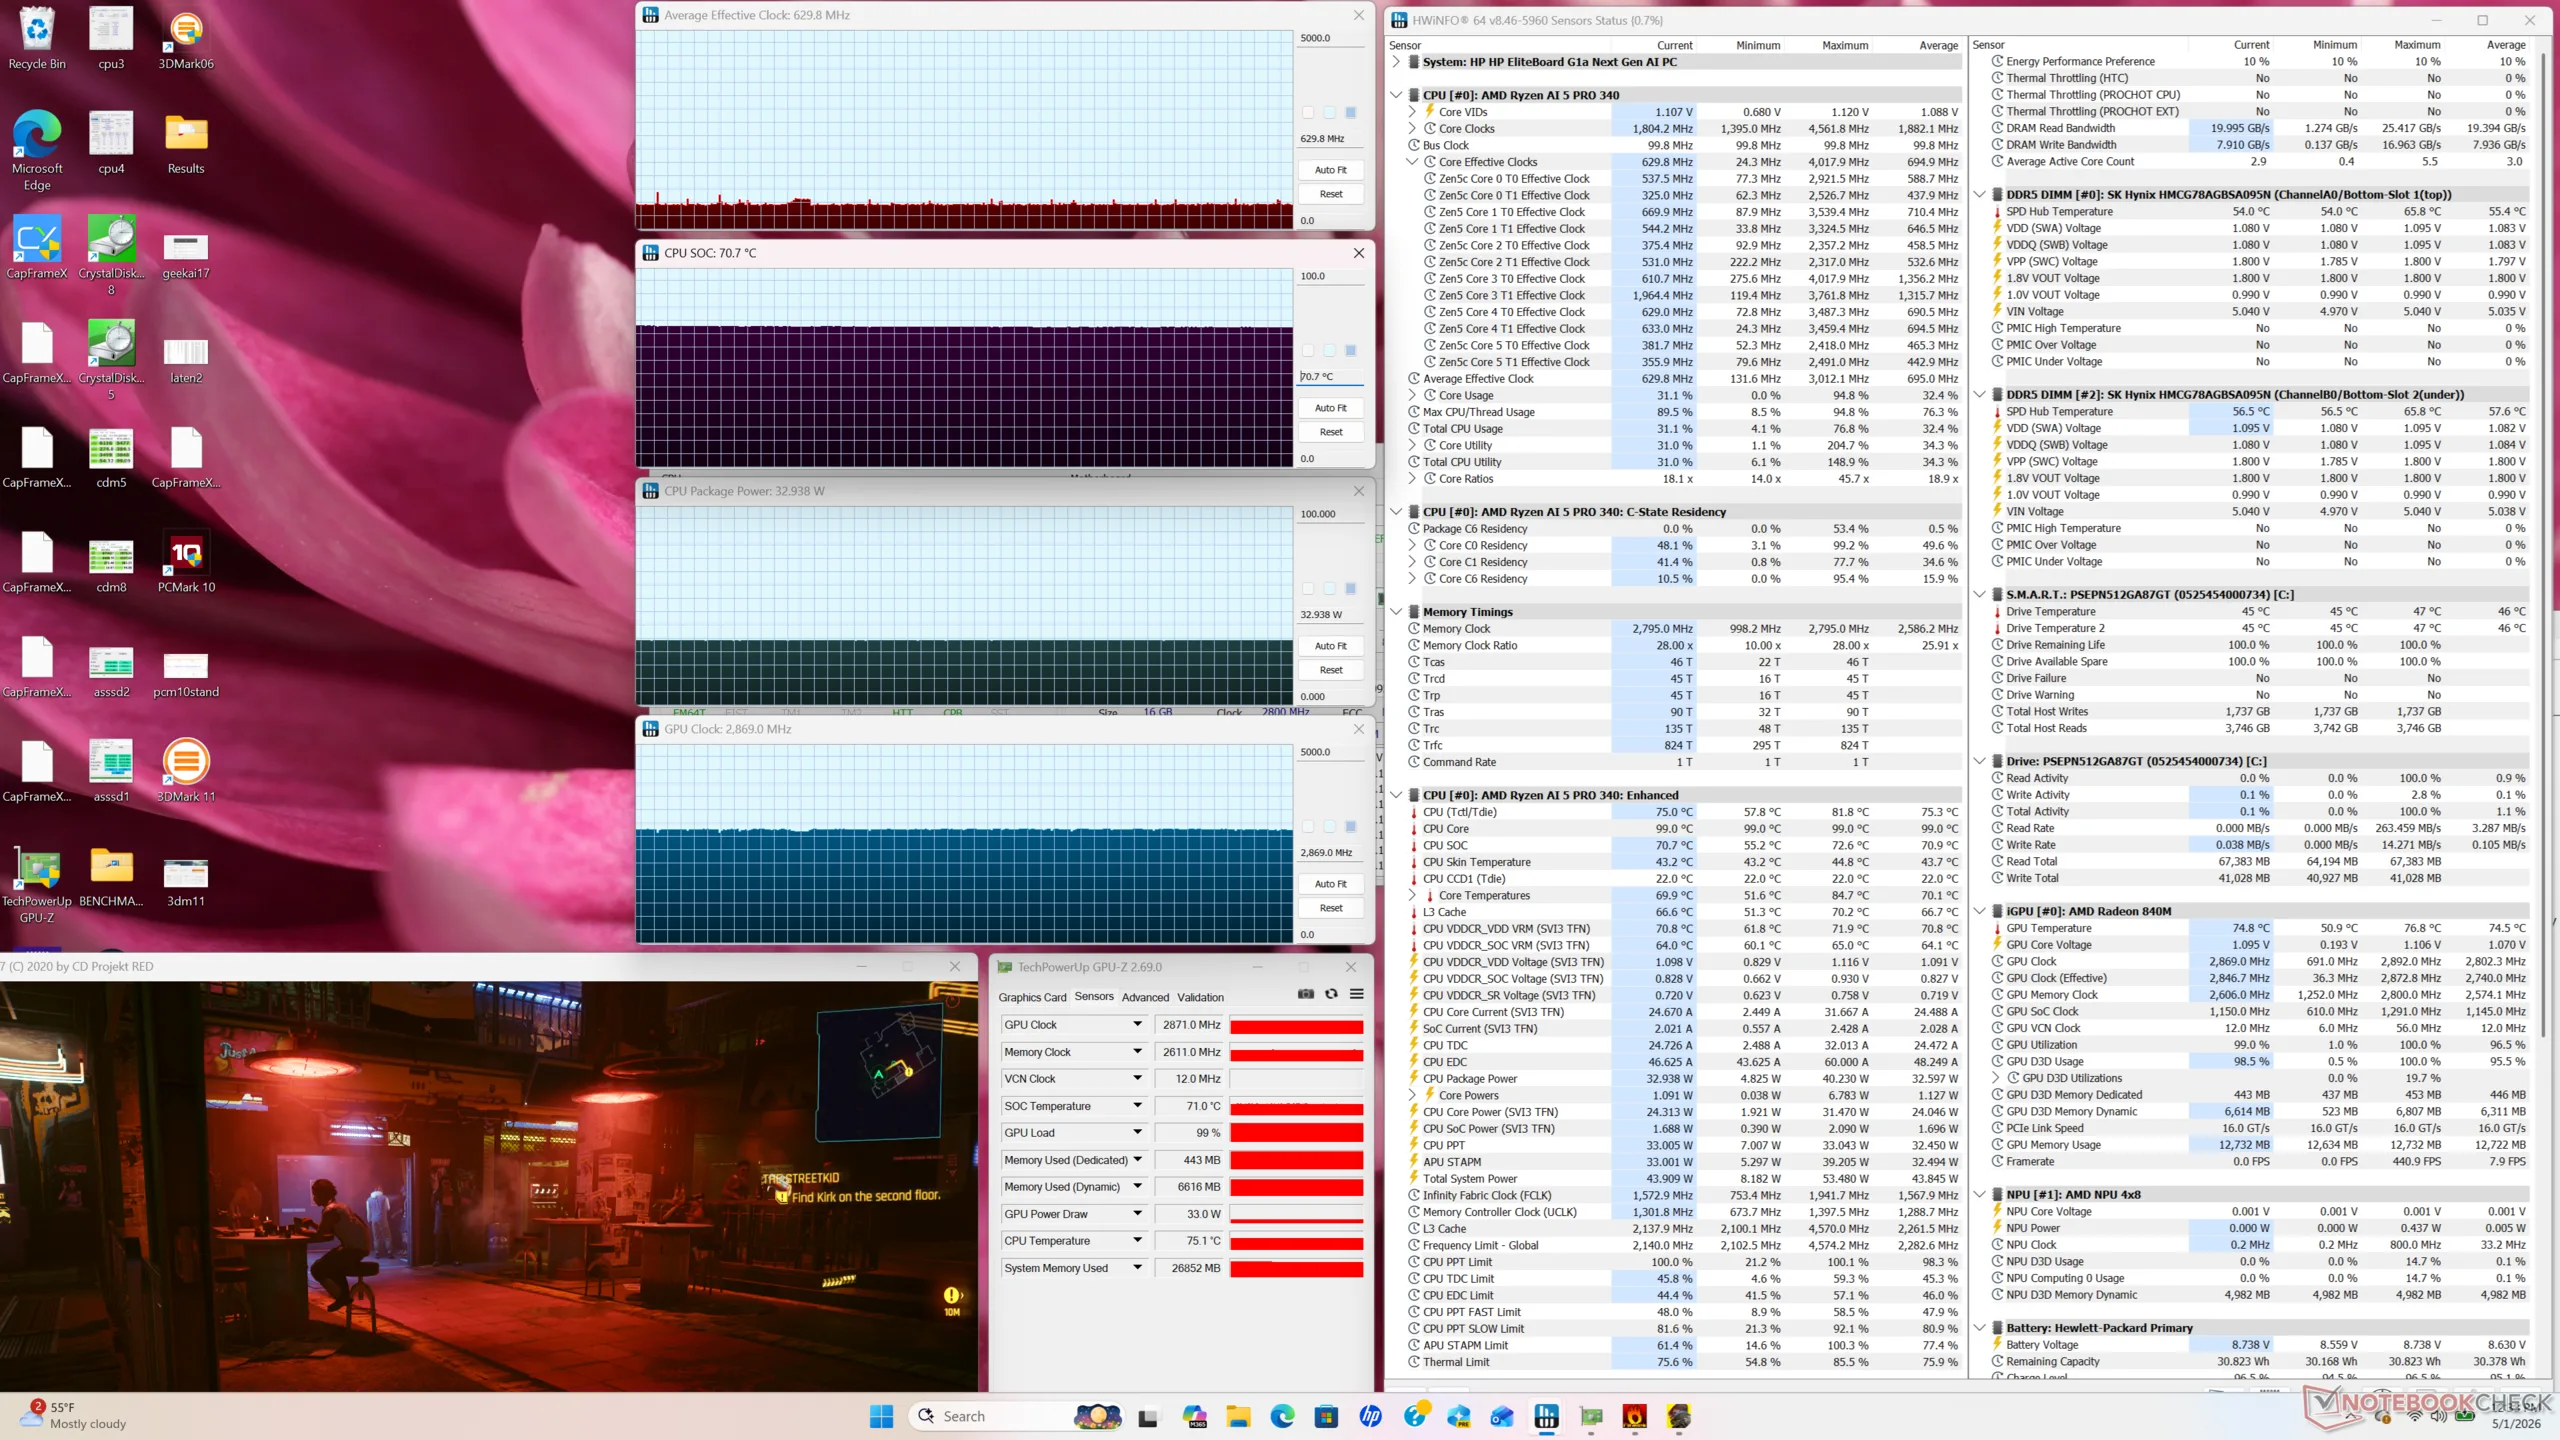
Teste de estresse
A CPU aumentaria para 3,7 GHz e 54 W antes de cair rapidamente para 3,3 GHz e 33 W para uma temperatura central estável de 72 C. O potencial do Turbo Boost é limitado, o que é de se esperar de um sistema que se preocupa mais com a versatilidade do que com o desempenho bruto. A faixa média de 70 °C ao executar cargas exigentes é típica, se não um pouco mais fria do que a maioria dos subnotebooks.
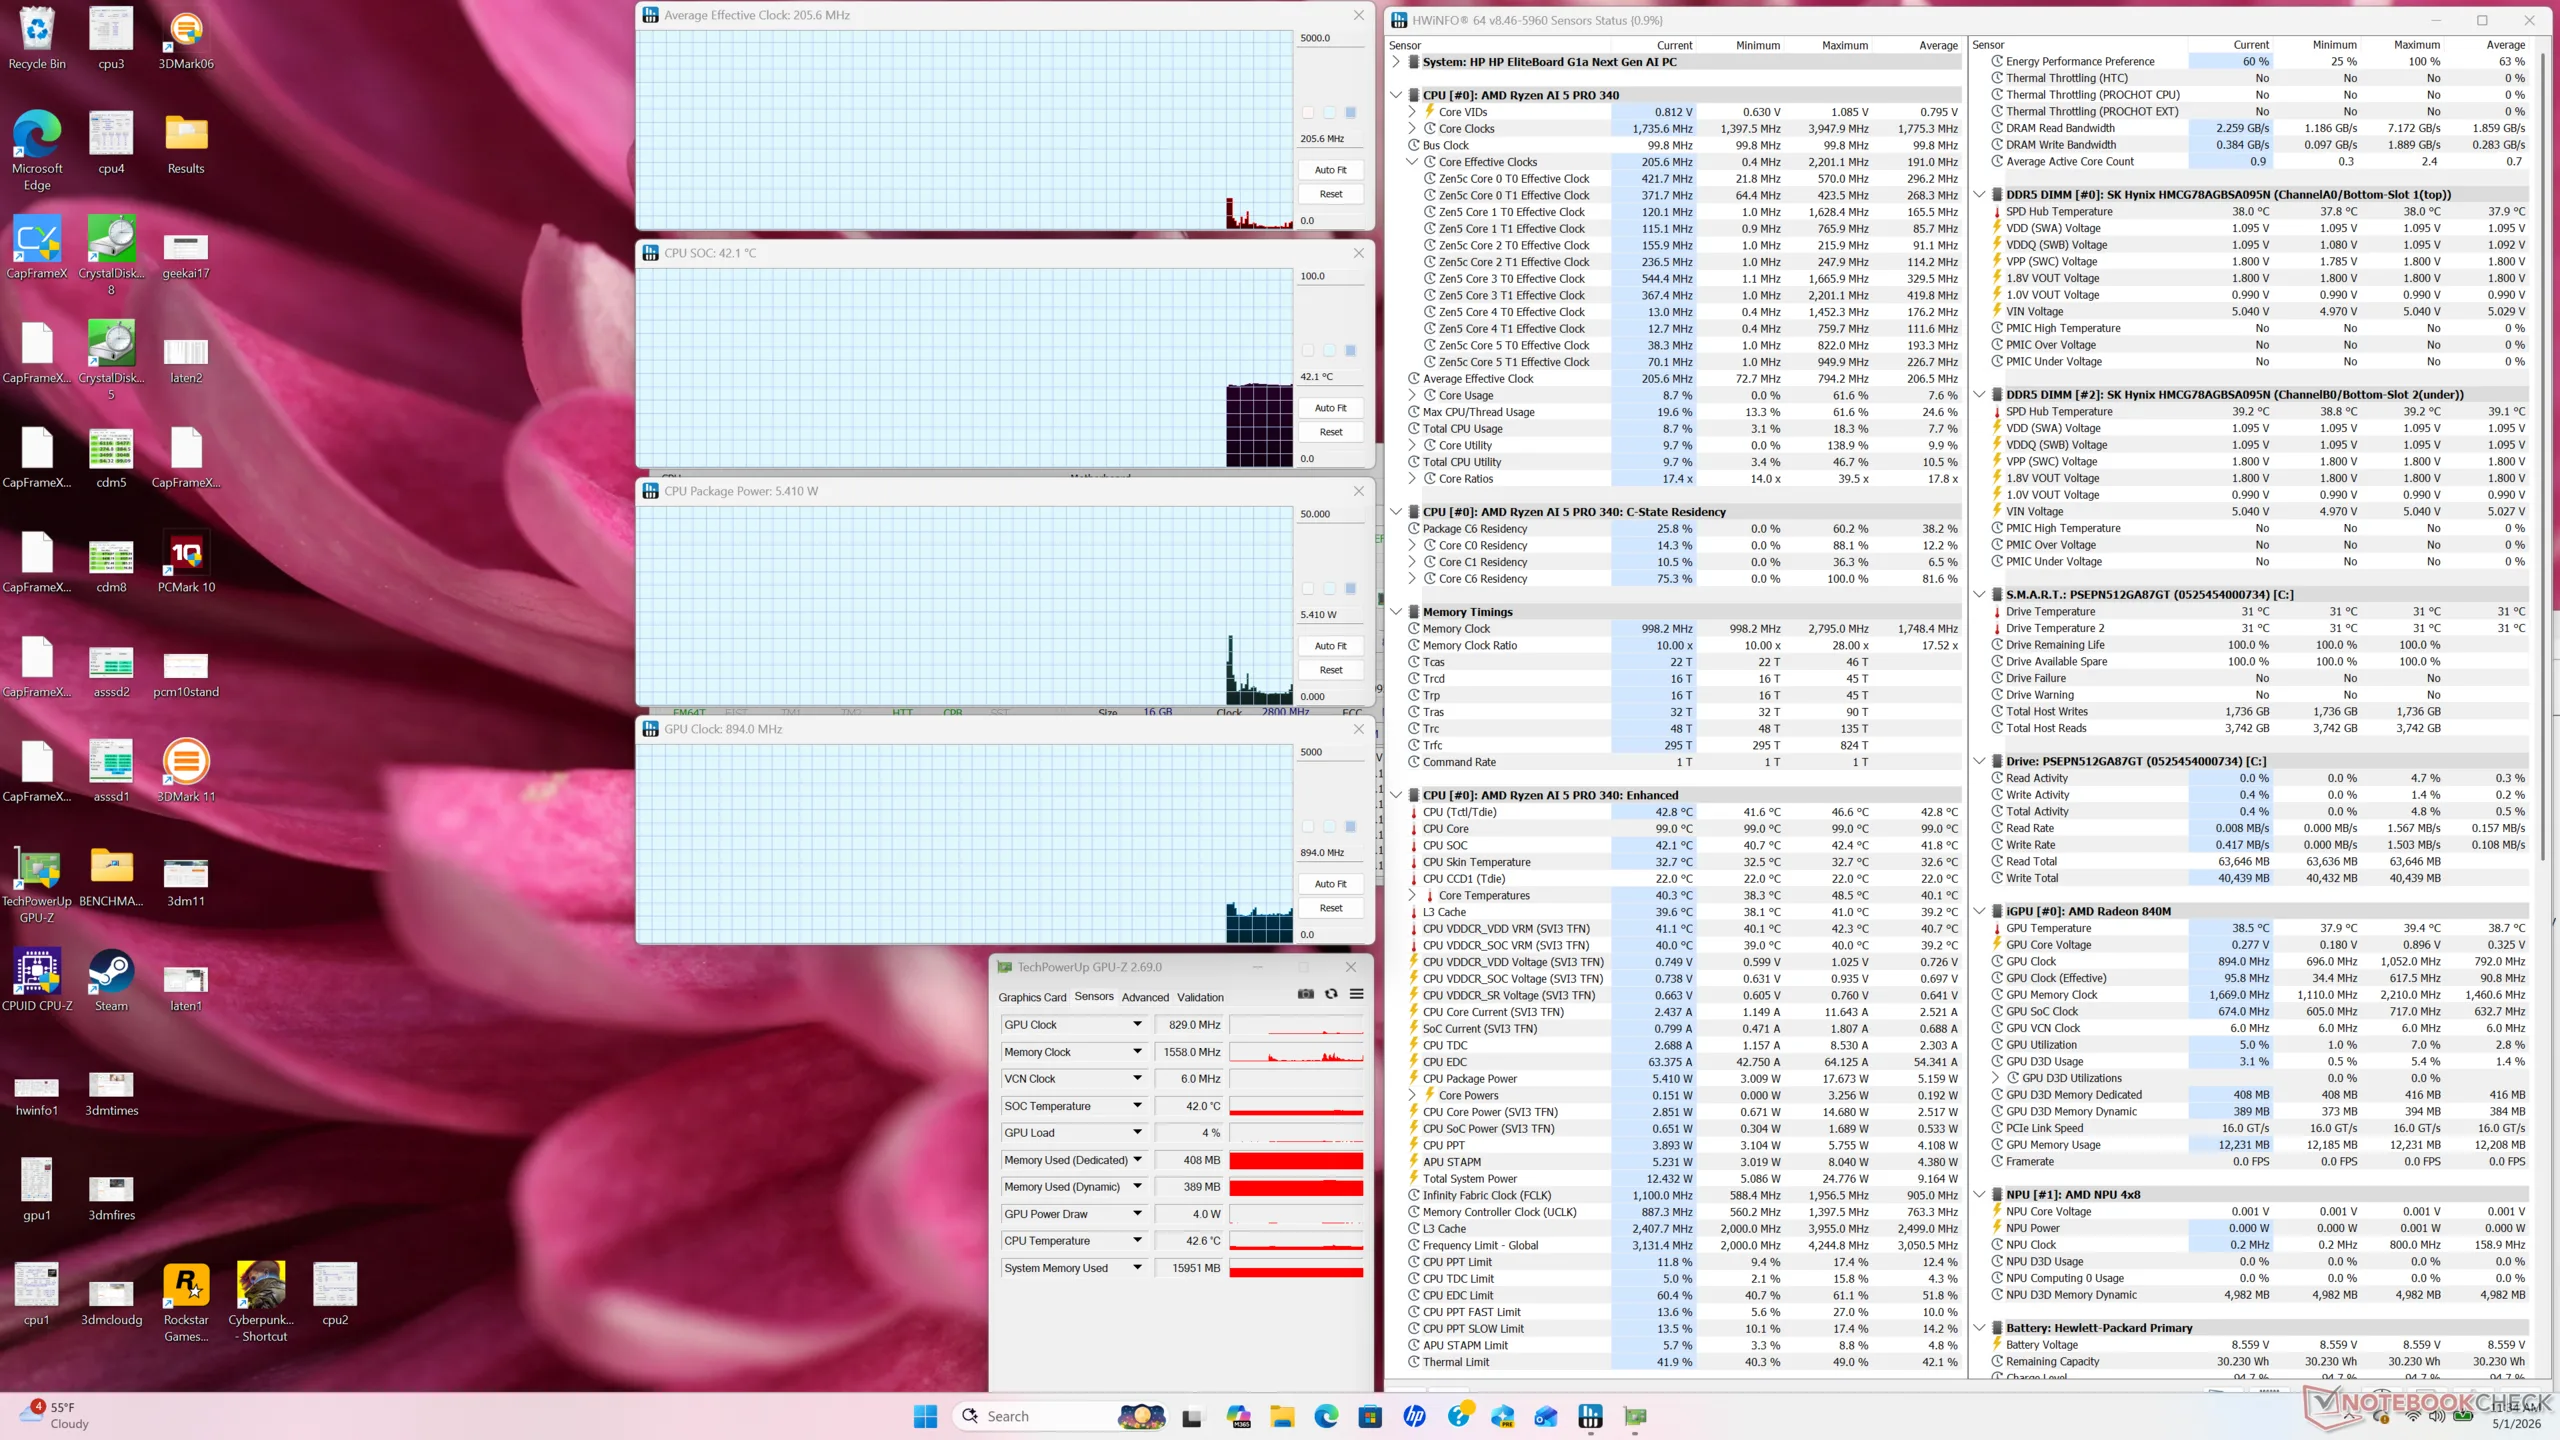
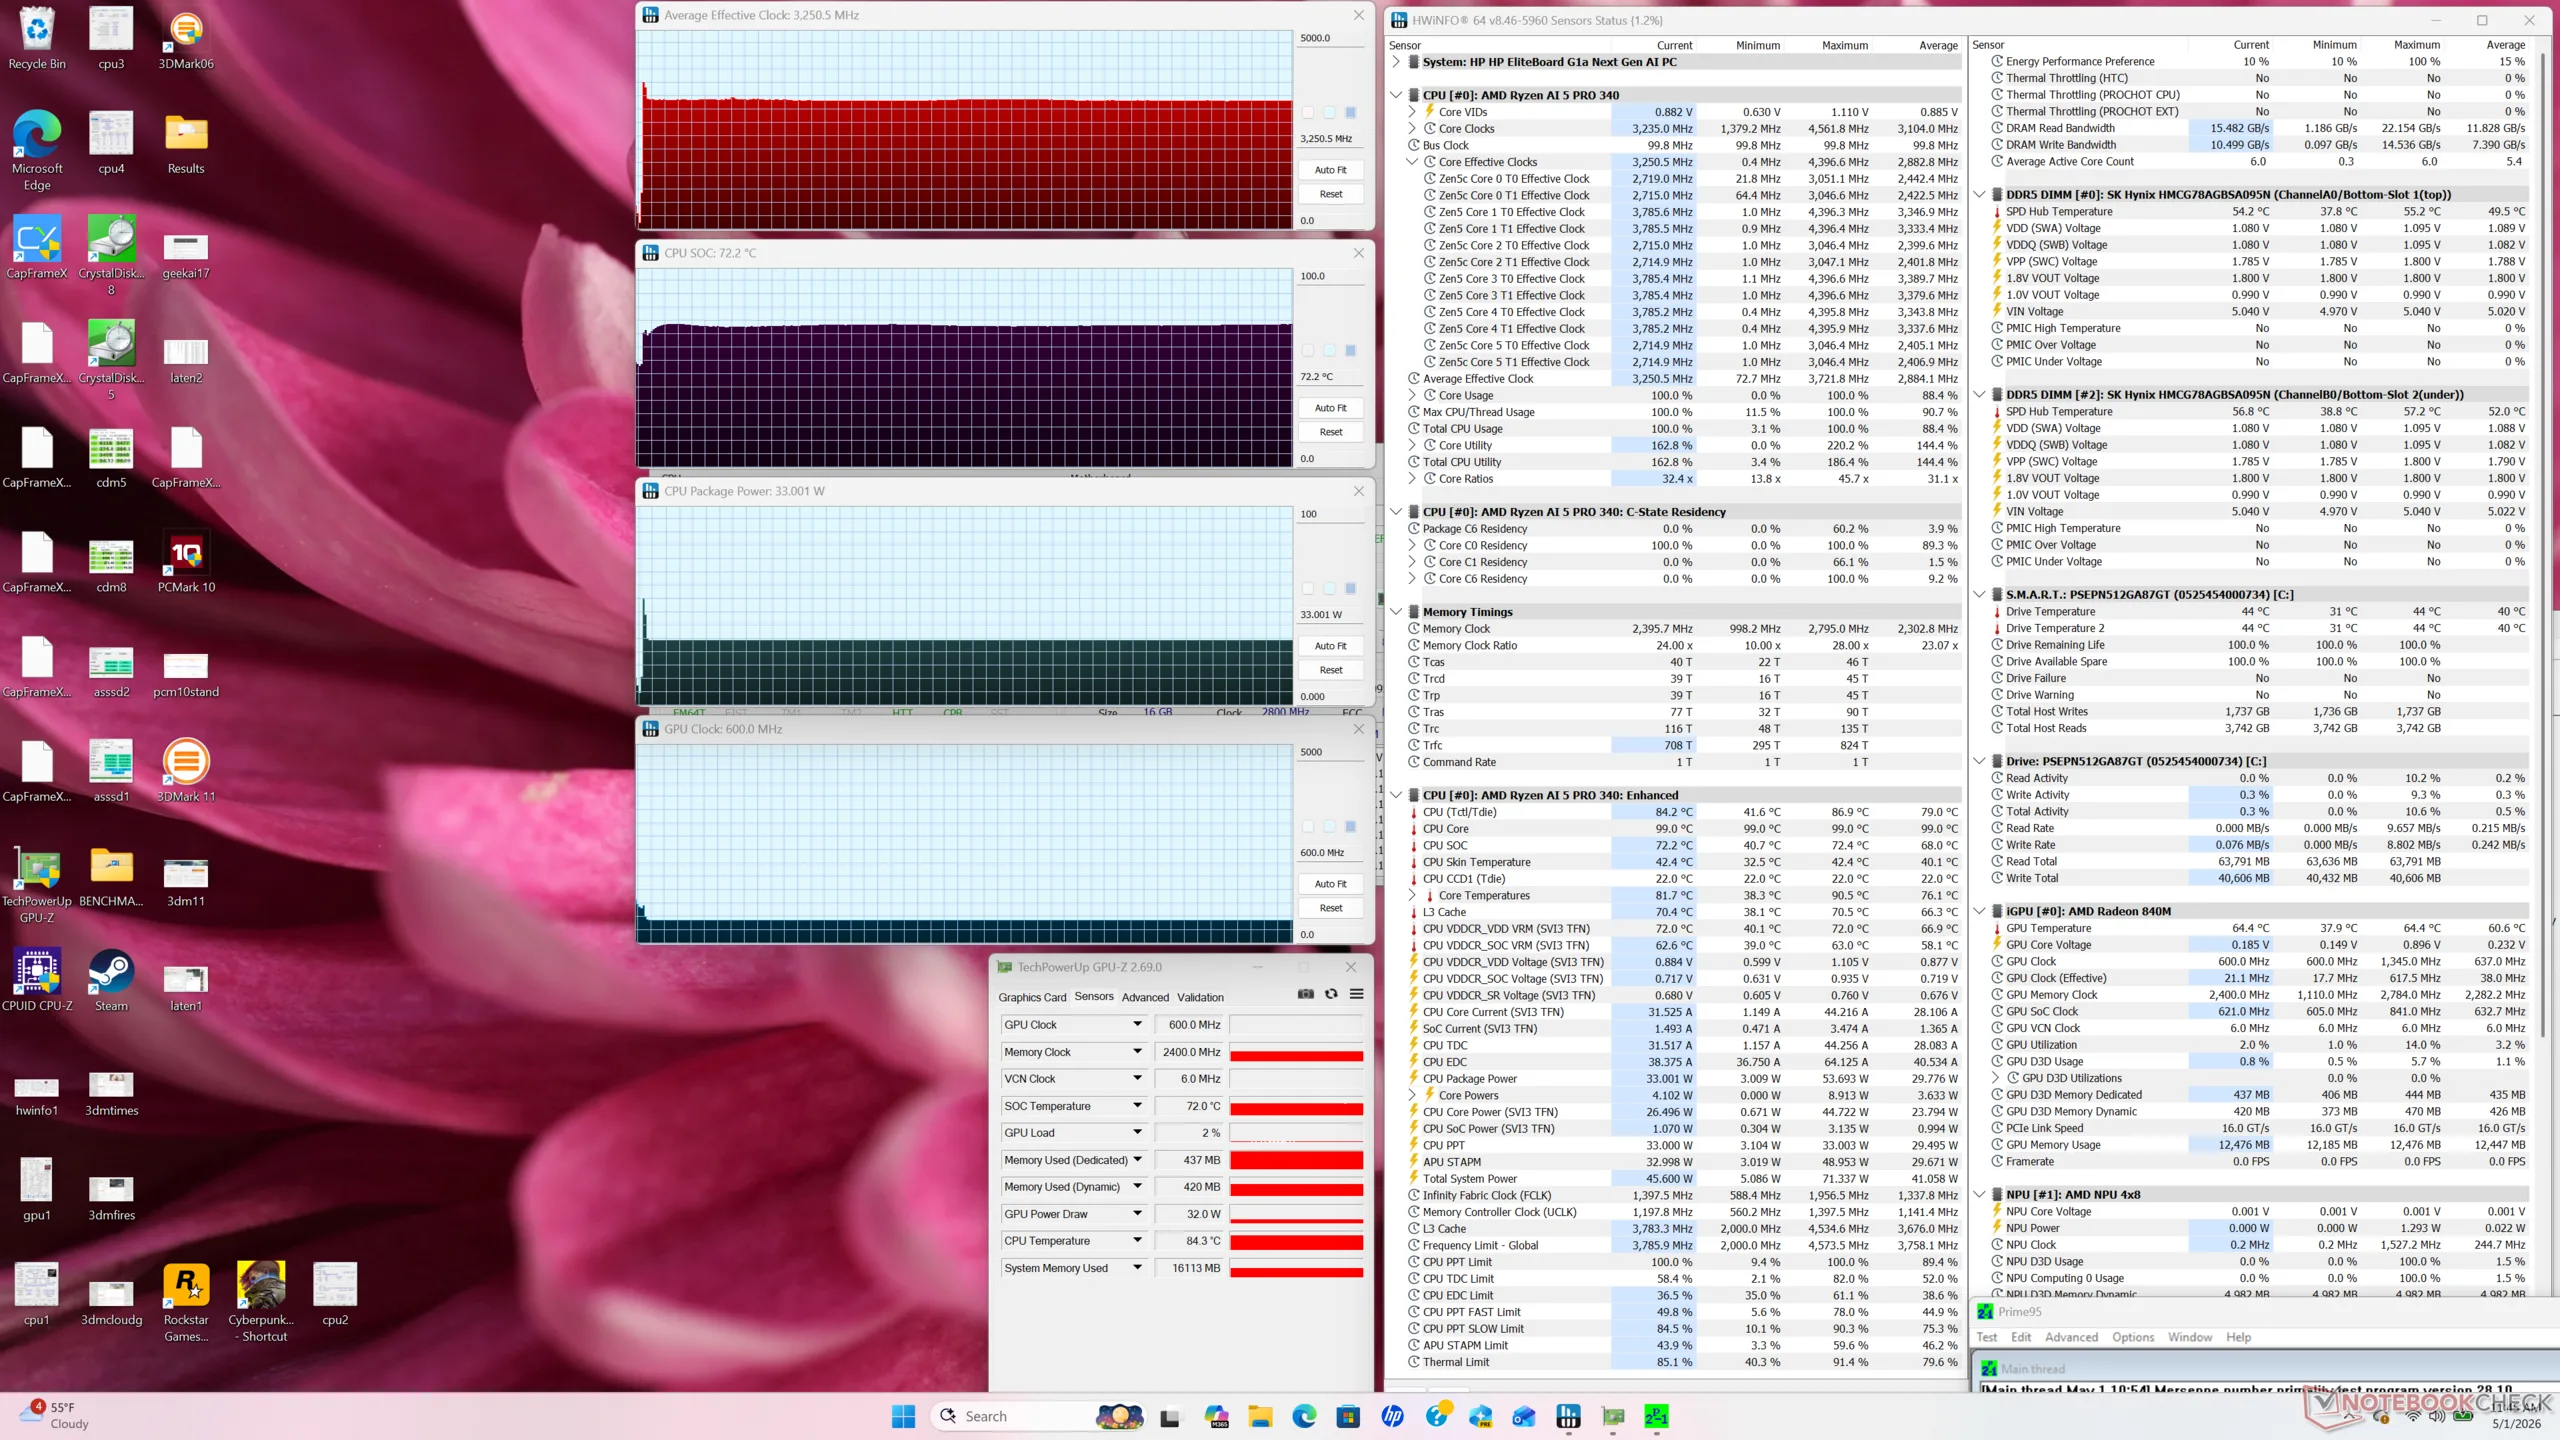
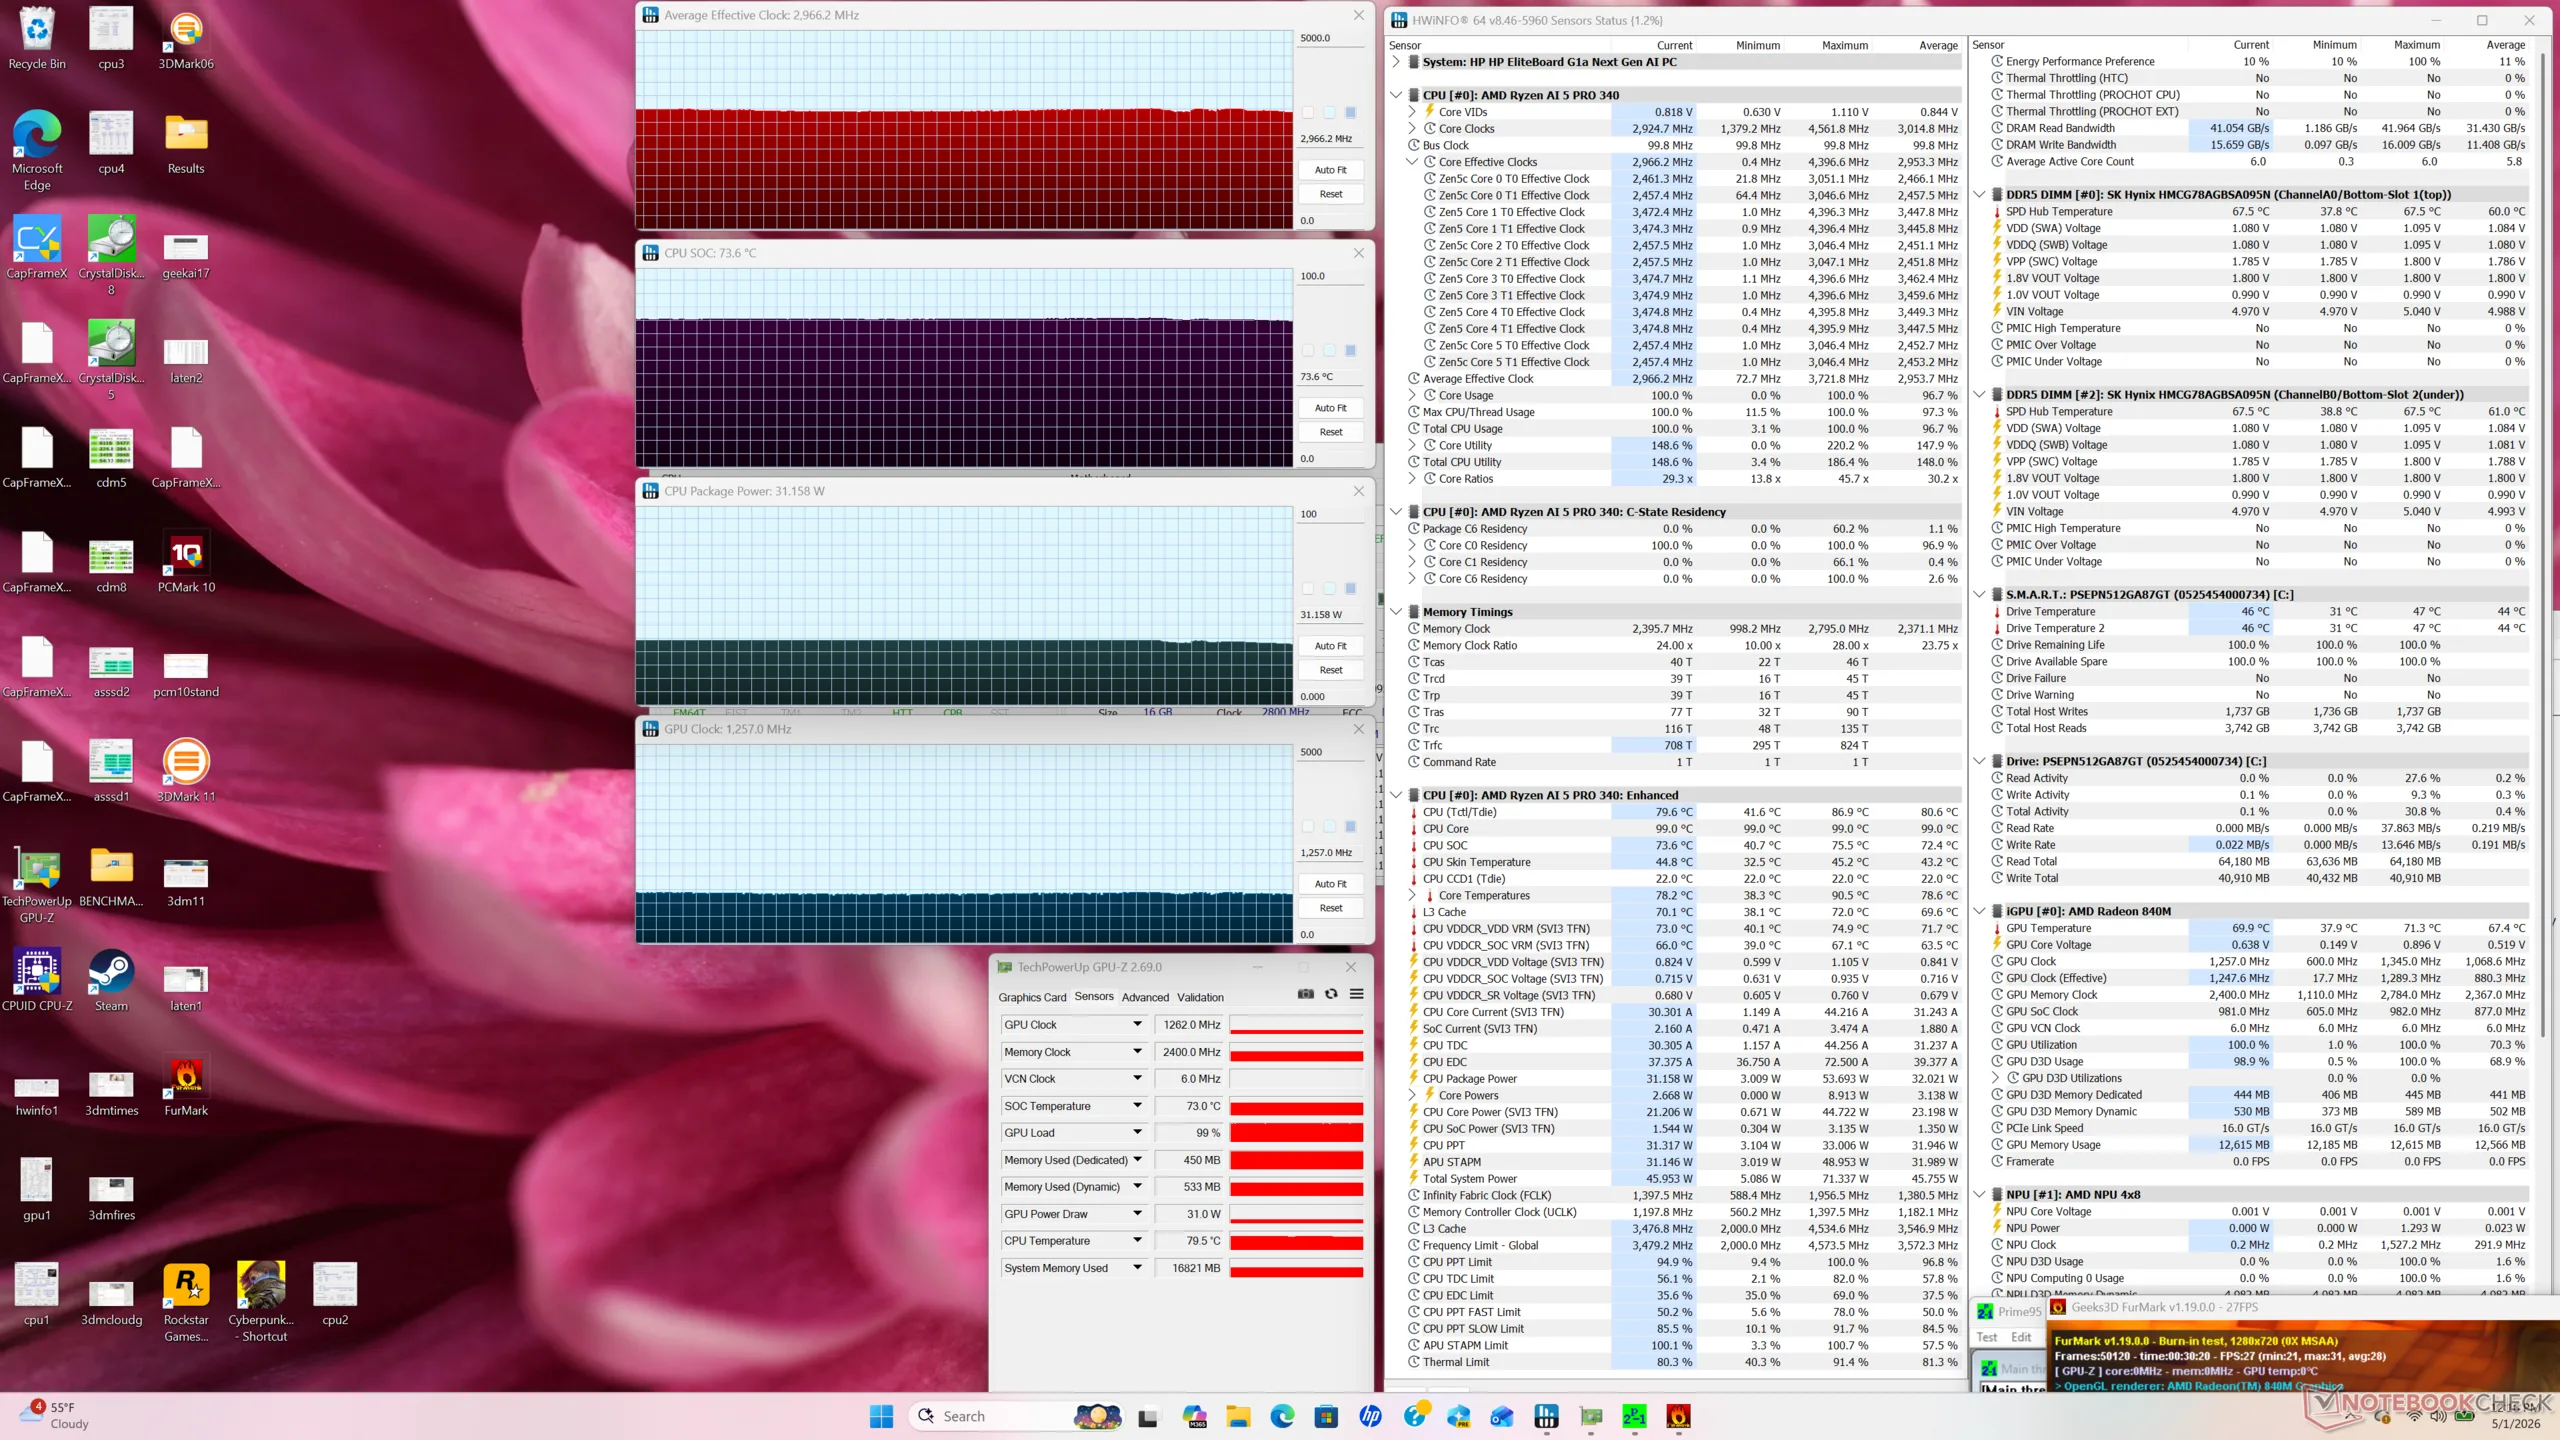
| Clock médio da CPU (GHz) | Clock da GPU (MHz) | Temperatura média da CPU (°C) | |
| Sistema ocioso | -- | 696 | 42 |
| Estresse do Prime95 | 3.3 | -- | 72 |
| Prime95 + FurMark Stress | 3.0 | 1257 | 74 |
| Cyberpunk 2077 Stress | 0.6 | 2869 | 71 |
Alto-falantes
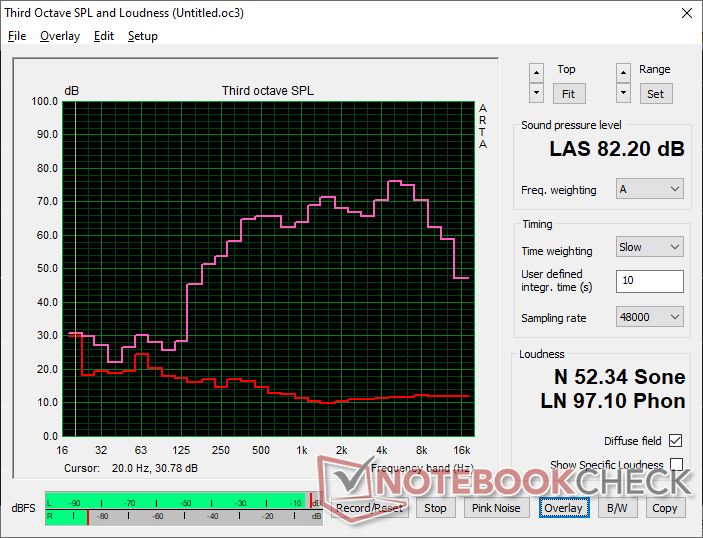
HP EliteBoard G1a AI análise de áudio
(+) | os alto-falantes podem tocar relativamente alto (###valor### dB)
Graves 100 - 315Hz
(-) | quase nenhum baixo - em média 21% menor que a mediana
(±) | a linearidade dos graves é média (11% delta para a frequência anterior)
Médios 400 - 2.000 Hz
(+) | médios equilibrados - apenas 2.4% longe da mediana
(+) | médios são lineares (5.4% delta para frequência anterior)
Altos 2 - 16 kHz
(±) | máximos mais altos - em média 5.5% maior que a mediana
(±) | a linearidade dos máximos é média (7.2% delta para frequência anterior)
Geral 100 - 16.000 Hz
(±) | a linearidade do som geral é média (17.9% diferença em relação à mediana)
Comparado com a mesma classe
» 21% de todos os dispositivos testados nesta classe foram melhores, 7% semelhantes, 71% piores
» O melhor teve um delta de 13%, a média foi 24%, o pior foi 64%
Comparado com todos os dispositivos testados
» 37% de todos os dispositivos testados foram melhores, 8% semelhantes, 55% piores
» O melhor teve um delta de 4%, a média foi 24%, o pior foi 134%
Apple MacBook Pro 16 2021 M1 Pro análise de áudio
(+) | os alto-falantes podem tocar relativamente alto (###valor### dB)
Graves 100 - 315Hz
(+) | bons graves - apenas 3.8% longe da mediana
(+) | o baixo é linear (5.2% delta para a frequência anterior)
Médios 400 - 2.000 Hz
(+) | médios equilibrados - apenas 1.3% longe da mediana
(+) | médios são lineares (2.1% delta para frequência anterior)
Altos 2 - 16 kHz
(+) | agudos equilibrados - apenas 1.9% longe da mediana
(+) | os máximos são lineares (2.7% delta da frequência anterior)
Geral 100 - 16.000 Hz
(+) | o som geral é linear (4.6% diferença em relação à mediana)
Comparado com a mesma classe
» 0% de todos os dispositivos testados nesta classe foram melhores, 0% semelhantes, 100% piores
» O melhor teve um delta de 5%, a média foi 17%, o pior foi 45%
Comparado com todos os dispositivos testados
» 0% de todos os dispositivos testados foram melhores, 0% semelhantes, 100% piores
» O melhor teve um delta de 4%, a média foi 24%, o pior foi 134%
Gerenciamento de energia
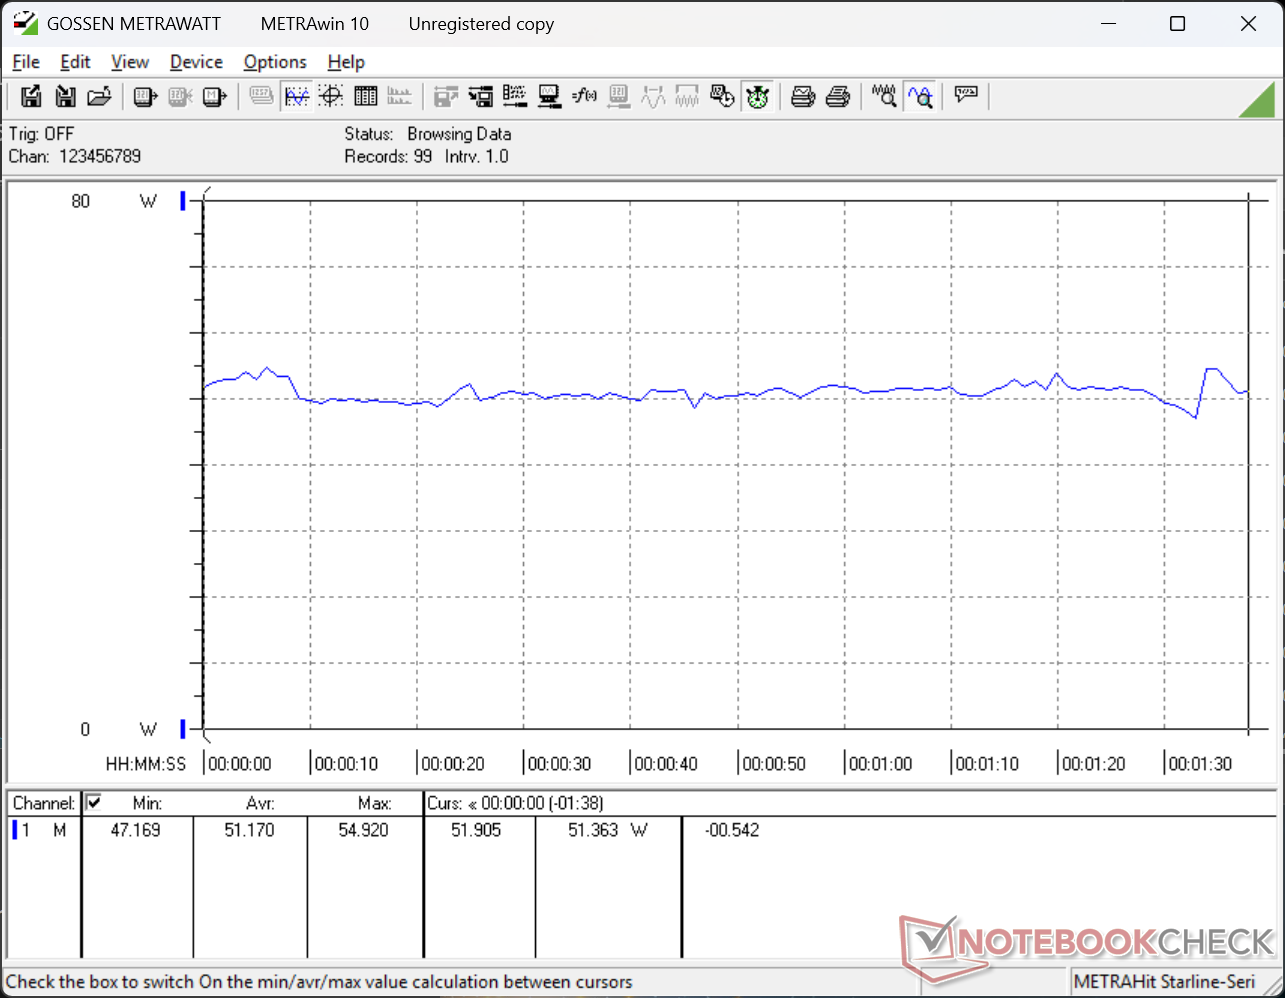
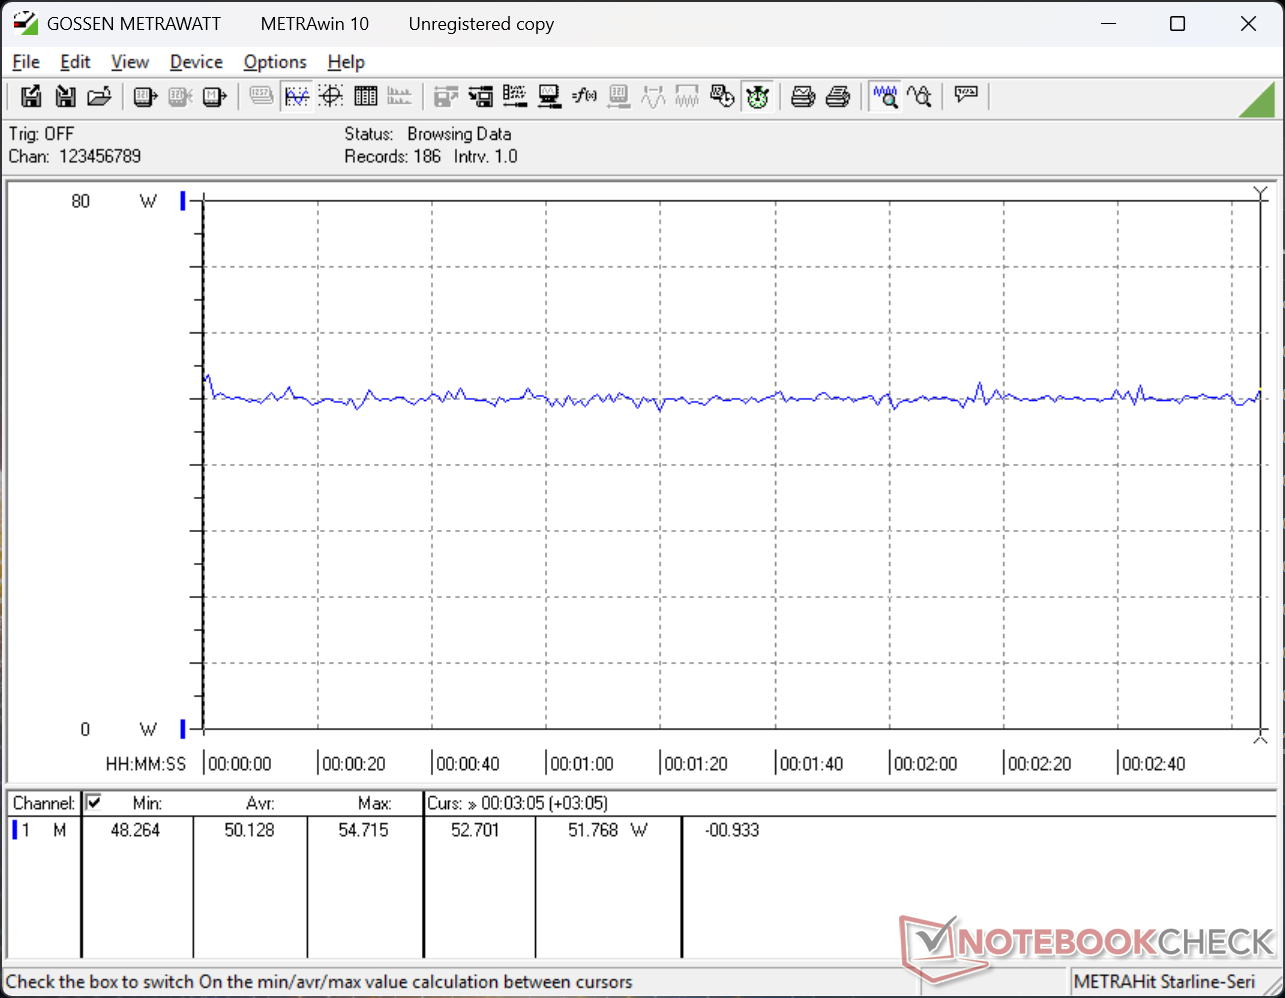
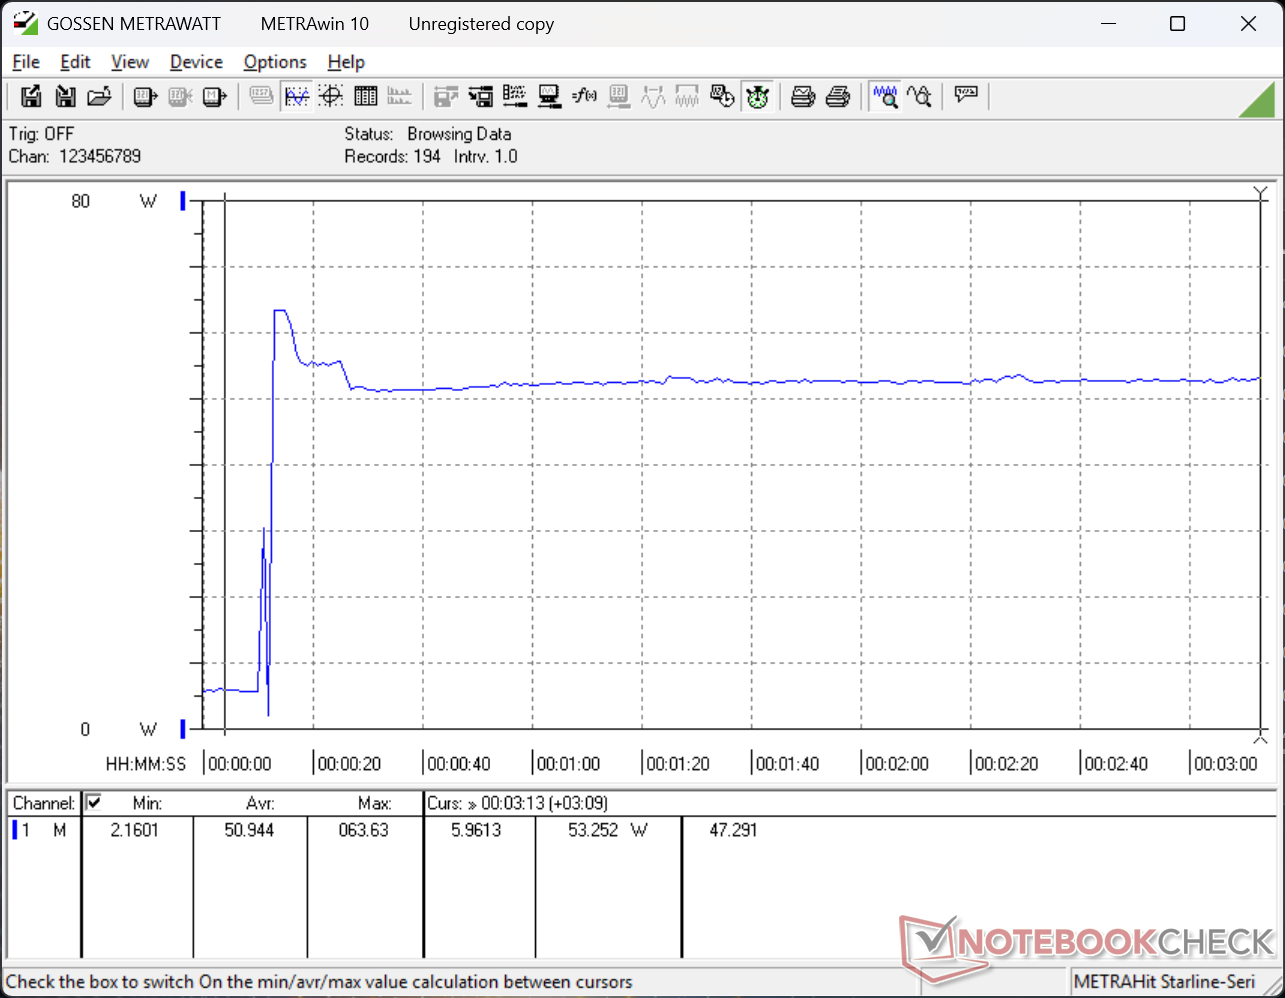
Consumo de energia
O consumo pode chegar a mais de 50 W quando sob carga, sendo mais exigente do que os mini PCs Lunar Lake, como o NucBox K13. No entanto, os baixos níveis de consumo são mais comuns quando o usuário simplesmente navega na Web ou fica ocioso.
| desligado | |
| Ocioso | |
| Carga |
|
Key:
min: | |
| HP EliteBoard G1a AI Ryzen AI 5 340, Radeon 840M, , , x, | Geekom A5 Pro R5 7530U, Vega 7, Wodposit WPBSN4M8-1TGP, , x, | GMK NucBox K13 Core Ultra 7 256V, Arc 140V, Huawei eKitStor Xtreme 200e 1 TB, , x, | Asus NUC 15 Pro+ Ultra 9 285H, Arc 140T, Micron 3500 1TB MTFDKBA1T0TGD, , x, | MSI Cubi NUC AI+ 2MG Core Ultra 7 258V, Arc 140V, Phison 1 TB ESR01TBTCCZ-27J, , x, | HP Pro Mini 400 G9-937U0EA i5-14500T, UHD Graphics 770, HP PSEJN512GA87EC0, , x, | |
|---|---|---|---|---|---|---|
| Power Consumption | 33% | 39% | -32% | 9% | -22% | |
| Idle Minimum * (Watt) | 4.7 | 3.2 32% | 2.3 51% | 3.9 17% | 2.9 38% | 4.9 -4% |
| Idle Average * (Watt) | 5.4 | 4.3 20% | 3.6 33% | 6.1 -13% | 5.7 -6% | 8 -48% |
| Idle Maximum * (Watt) | 7.9 | 5.1 35% | 5.8 27% | 8.2 -4% | 10.2 -29% | 13.3 -68% |
| Load Average * (Watt) | 51.2 | 32.1 37% | 27.3 47% | 56.1 -10% | 38.7 24% | 44.6 13% |
| Cyberpunk 2077 ultra external monitor * (Watt) | 50.1 | 29.4 41% | 31.6 37% | 63.9 -28% | 41.1 18% | 49 2% |
| Load Maximum * (Watt) | 63.6 | 43.5 32% | 39.6 38% | 160.6 -153% | 60 6% | 81.3 -28% |
* ... menor é melhor
Consumo de energia Cyberpunk / Teste de estresse
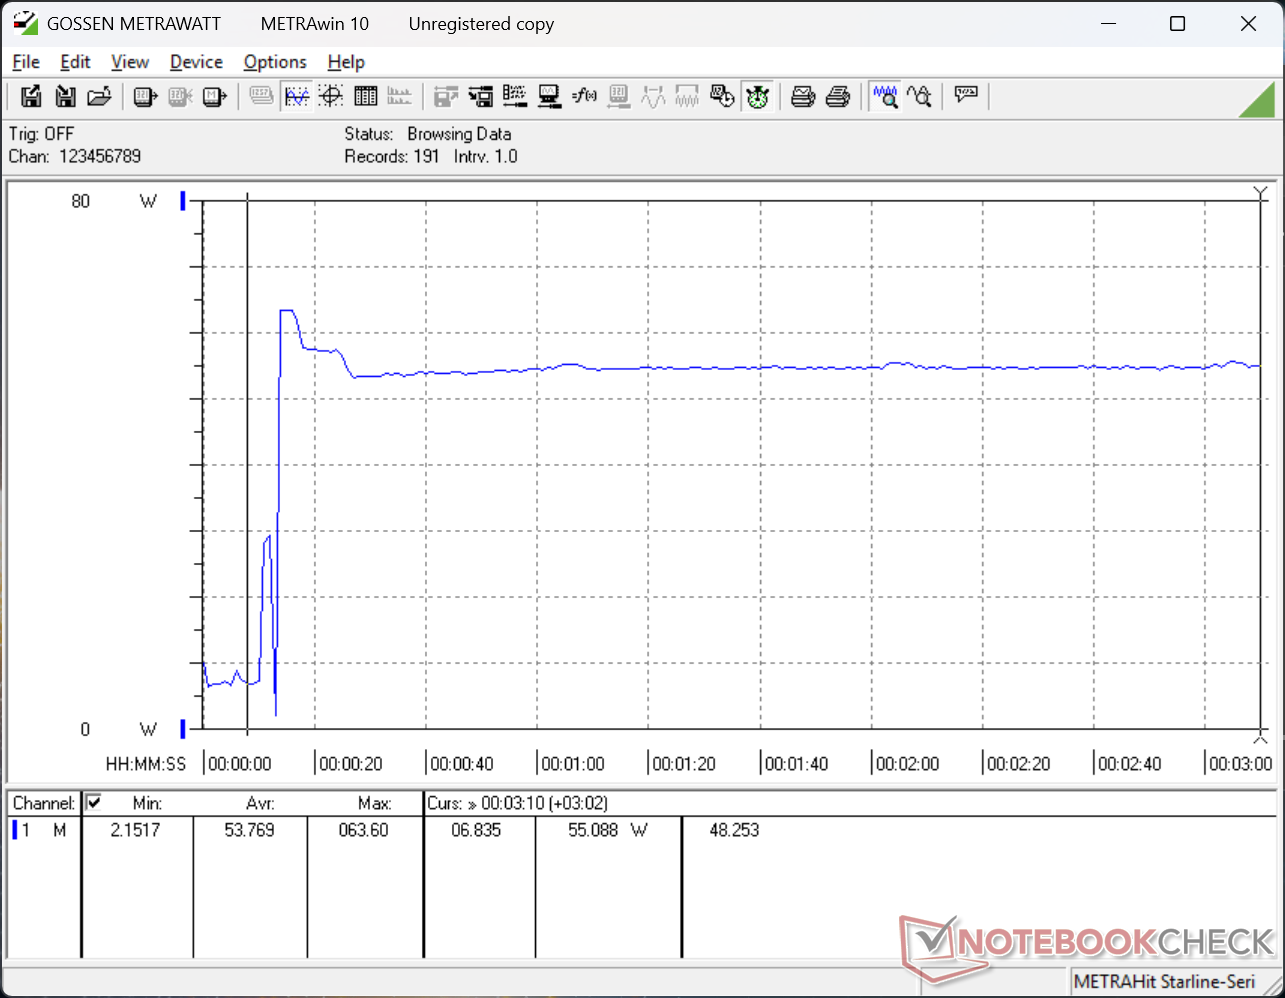
Consumo de energia do monitor externo
Duração da bateria
A bateria pequena e opcional de 32 Wh pode durar cerca de 8 horas de navegação WLAN constante quando conectada a um monitor HDMI. Quando conectado via USB-C com PD, a duração da bateria não é um problema.
Classificação do Notebookcheck
Um PC em um teclado perfeito para espaços de trabalho mais apertados ou terminais em que uma torre de PC tradicional pode ser um exagero. No entanto, o sistema somente com USB-C depende muito de adaptadores.
HP EliteBoard G1a AI
- 05/05/2026 v8
Allen Ngo
 Total Sustainability Score:
 Concorrentes potenciais em comparação
Imagem | Modelo / Análises | Preço | Peso | Altura | Tela |
|---|---|---|---|---|---|
1. 75.6%  | HP EliteBoard G1a AI AMD Ryzen AI 5 PRO 340 ⎘ AMD Radeon 840M ⎘ 32 GB Memória | Amazon: 1. $1,593.78 HP EliteBoard G1a Next Gen A... 2. HP EliteBoard G1a Next Gen A... 3. $1,964.80 HP EliteBook 6 G1a 16" Noteb... Preço de tabela: 1800 USD | 771 g | 17.9 mm | x |
2. 72.6%  | Geekom A5 Pro AMD Ryzen 5 7530U ⎘ AMD Radeon RX Vega 7 ⎘ 16 GB Memória, 1024 GB SSD | Amazon: Preço de tabela: 619€ | 423 g | 37 mm | x |
3. 77.4% 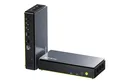 | GMK NucBox K13 Intel Core Ultra 7 256V ⎘ Intel Arc Graphics 140V ⎘ 16 GB Memória, 1000 GB SSD | Amazon: Preço de tabela: 670 USD | 506 g | 36.6 mm | x |
4. 77.5% 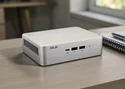 | Asus NUC 15 Pro+ Intel Core Ultra 9 285H ⎘ Intel Arc Graphics 140T ⎘ 32 GB Memória, 1024 GB SSD | Amazon: $1,642.00 Preço de tabela: 991€ | 690 g | 42 mm | x |
5. 75.2% 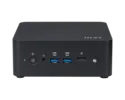 | MSI Cubi NUC AI+ 2MG Intel Core Ultra 7 258V ⎘ Intel Arc Graphics 140V ⎘ 32 GB Memória, 1000 GB SSD | Amazon: Preço de tabela: 900 USD | 669 g | 50.1 mm | x |
6. 70.8% 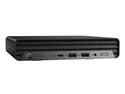 | HP Pro Mini 400 G9-937U0EA Intel Core i5-14500T ⎘ Intel UHD Graphics 770 ⎘ 16 GB Memória, 512 GB SSD | Amazon: 1. $399.99 HP Pro 400 G9 Mini PC Deskto... 2. $699.00 HP Pro Mini 400 G9 Tiny Desk... 3. $499.99 HP Pro 400 G9 Mini PC Deskto... Preço de tabela: 870€ | 1.2 kg | 34 mm | x |
Transparência
A seleção dos dispositivos a serem analisados é feita pela nossa equipe editorial. A amostra de teste foi fornecida ao autor como empréstimo pelo fabricante ou varejista para fins desta revisão. O credor não teve influência nesta revisão, nem o fabricante recebeu uma cópia desta revisão antes da publicação. Não houve obrigação de publicar esta revisão. Como empresa de mídia independente, a Notebookcheck não está sujeita à autoridade de fabricantes, varejistas ou editores.
É assim que o Notebookcheck está testando
Todos os anos, o Notebookcheck analisa de forma independente centenas de laptops e smartphones usando procedimentos padronizados para garantir que todos os resultados sejam comparáveis. Desenvolvemos continuamente nossos métodos de teste há cerca de 20 anos e definimos padrões da indústria no processo. Em nossos laboratórios de teste, equipamentos de medição de alta qualidade são utilizados por técnicos e editores experientes. Esses testes envolvem um processo de validação em vários estágios. Nosso complexo sistema de classificação é baseado em centenas de medições e benchmarks bem fundamentados, o que mantém a objetividade.
