Veredicto - As maiores mudanças até agora na série
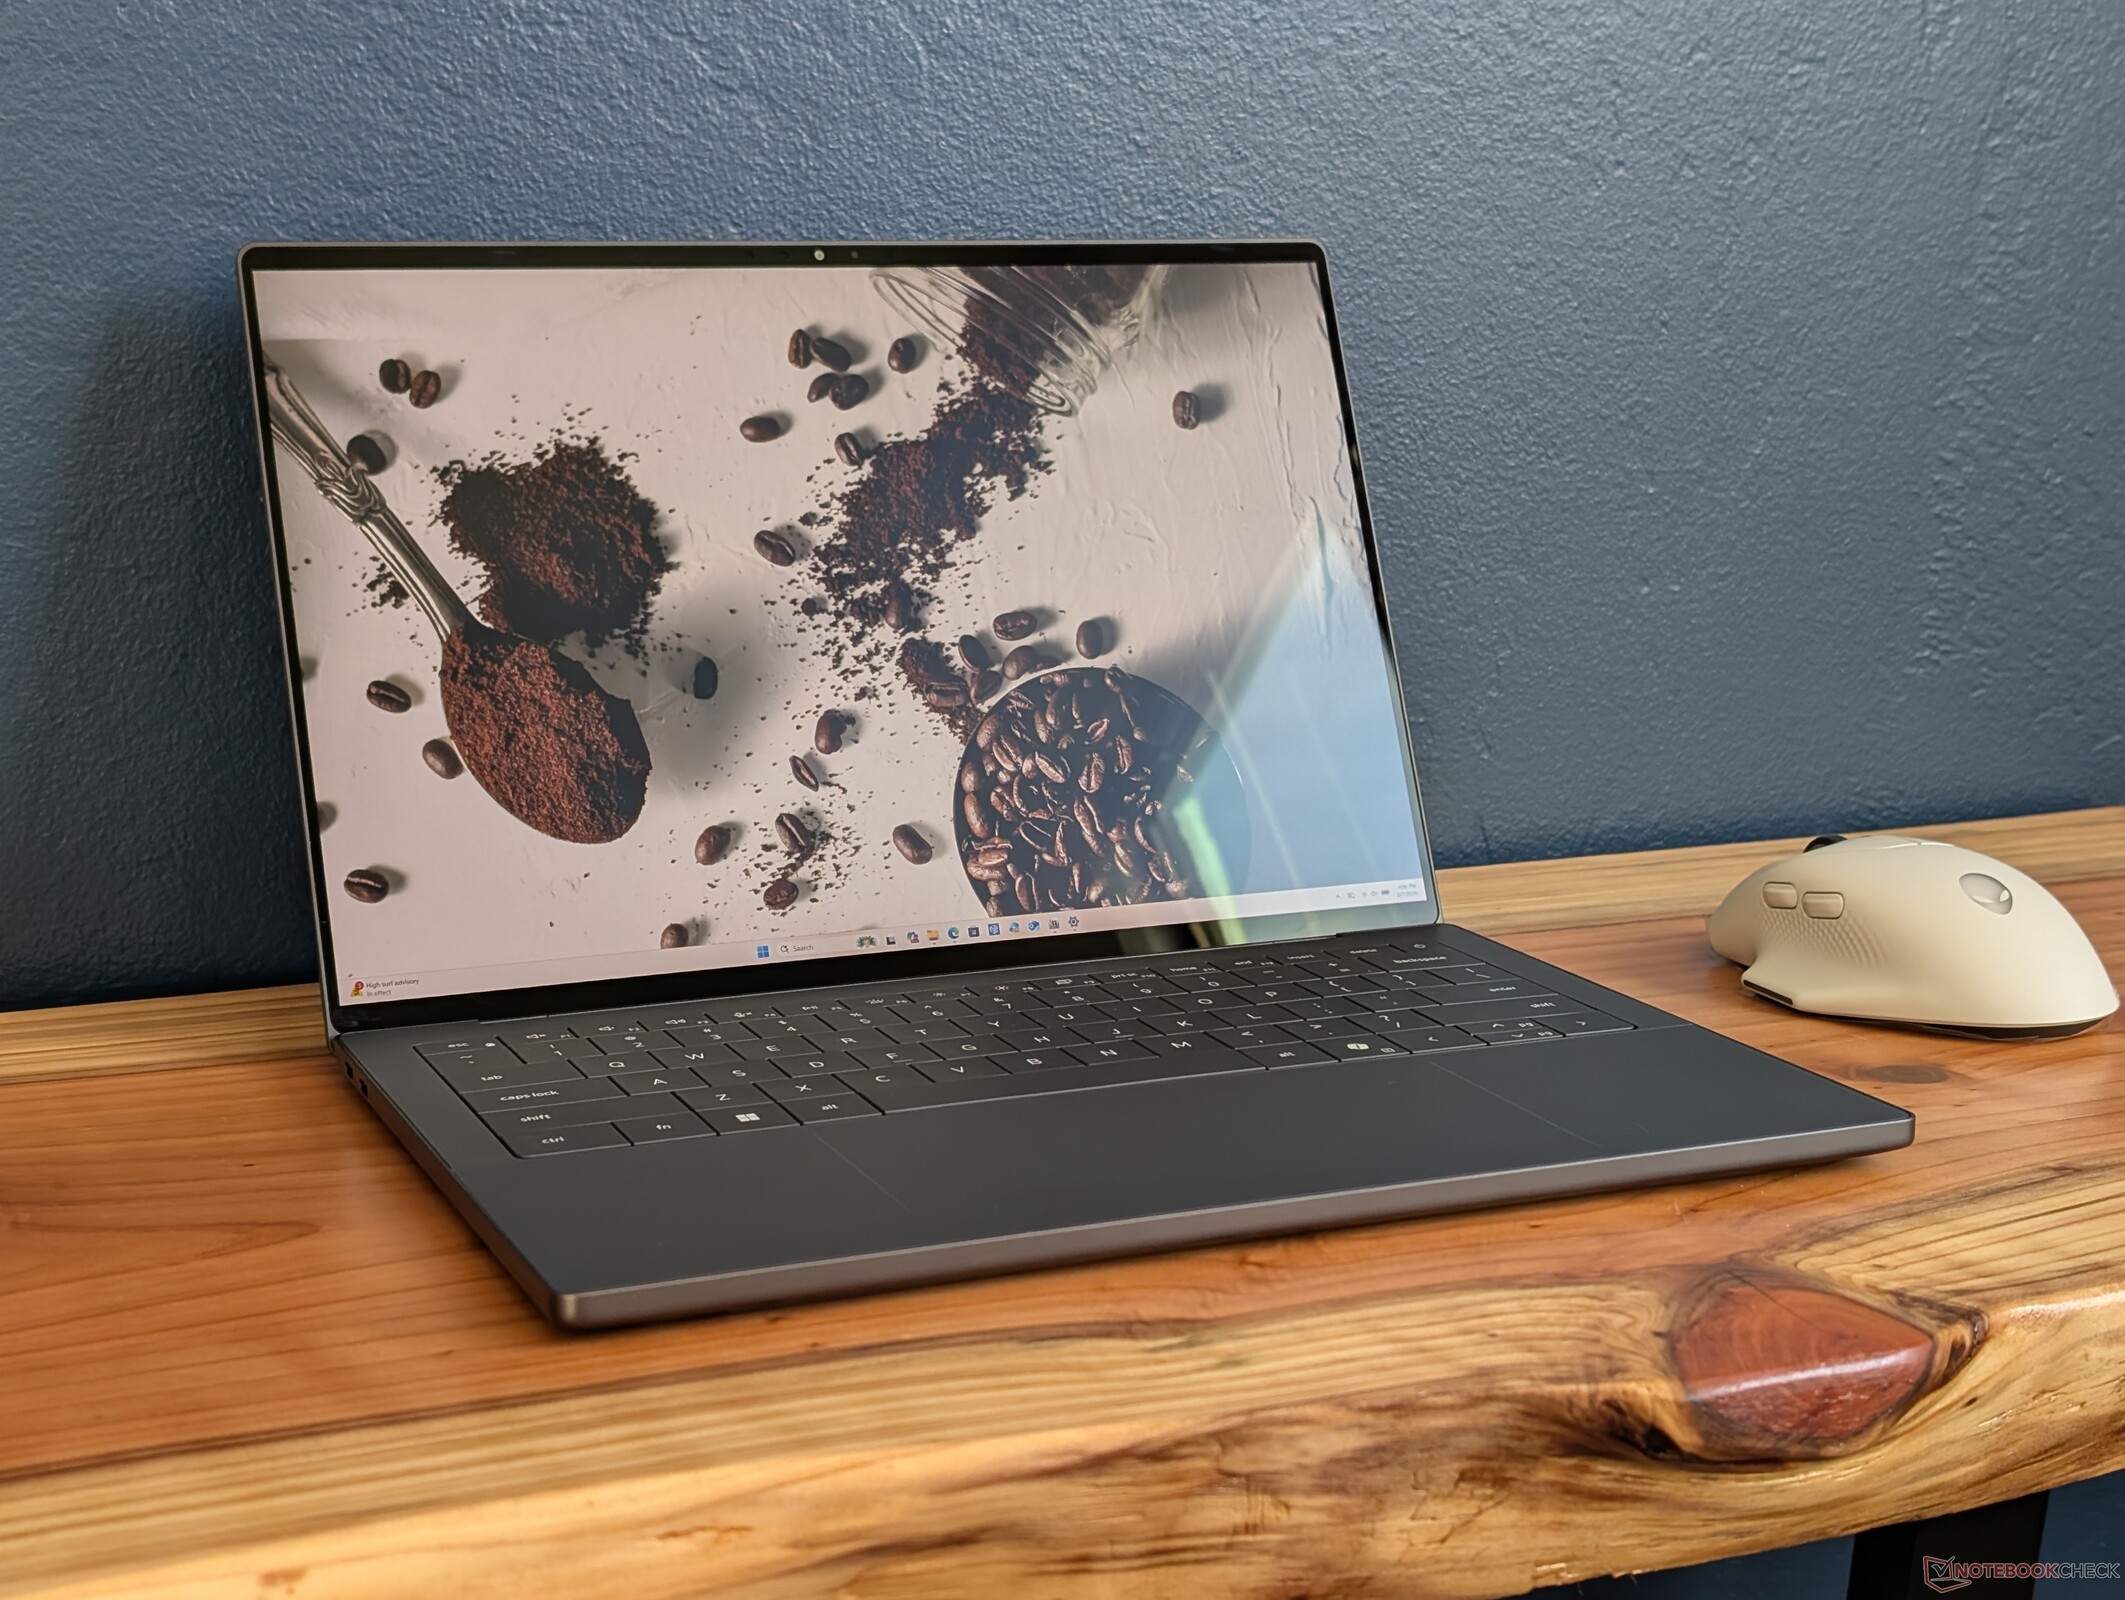
A revisão do XPS 2022 foi uma tangente tão grande para a série que muitos de seus novos recursos receberam respostas mistas dos fãs de longa data do XPS. Para 2026, essa última revisão aborda muitas das críticas com melhorias ergonômicas significativas em todos os aspectos. O chassi é mais rígido, as teclas de função sensíveis ao toque desapareceram, o clickpad é mais fácil de ver e a webcam agora é maior que 1080p para rivalizar com a maioria dos concorrentes. A manutenção é um pouco mais difícil, mas é um preço pequeno a pagar, considerando a sensação de maior resistência do novo design e o volume mais alto dos alto-falantes de 10 W.
Em termos de desempenho, o Panther Lake fez maravilhas para a série XPS 14, pois se aproxima bastante do GeForce RTX 4050 sem o peso adicional ou os requisitos de energia. Até mesmo os gamers acharão a Arc B390 muito poderosa para uma GPU integrada.
Ainda há vários aspectos do XPS 14 que podem ser melhorados. O obturador da câmera continua ausente, por exemplo, e o slot para MicroSD, que não existe, pode ser um grande problema para os criadores de conteúdo. Tanto o desempenho do Turbo Boost quanto o suporte a HDR são mais fracos do que em concorrentes como o Asus ExpertBook Ultra e o feedback relativamente suave das teclas pode não ser ideal para digitadores. Também é lamentável que o novo XPS 14 seja meia polegada menor em tamanho de tela do que o design anterior, o que resulta em menos espaço na tela.
No entanto, o novo XPS 14 é a revisão mais refinada até agora da série, sendo uma recomendação mais fácil do que o 2025 Dell 14 Premium.
Pro
Contra
Preço e disponibilidade
Atualmente, a Dell está enviando o XPS 14 2026 a partir de US$ 1.600 para a configuração básica ou US$ 2.200 para a configuração analisada.
- $1,795.49Dell XPS 14 Premium Laptop DA14250-14.5-inch Touch 3.2K OLED 48-120Hz Display, Intel Core Ultra 7 255H, Intel Arc Graphics, 32GB Memory, 1TB SSD, Backlit English Keyboard with Fingerprint Reader
- $2,049.00Dell XPS 14 9440 14.5" Notebook - Full HD Plus - Intel Core Ultra 7 155H - Intel Evo Platform - 16 GB - 512 GB SSD - English Keyboard - Platinum
- $2,099.99Dell XPS 16 9640 Laptop | Intel Core Ultra 7 155H CPU | NVIDIA GeForce RTX 4050 | 16.3" WUXGA (1920 x 1200) | 16GB DDR5 RAM | 2TB PCIe SSD + 512GB External | Win 11 | Backlit Keyboard
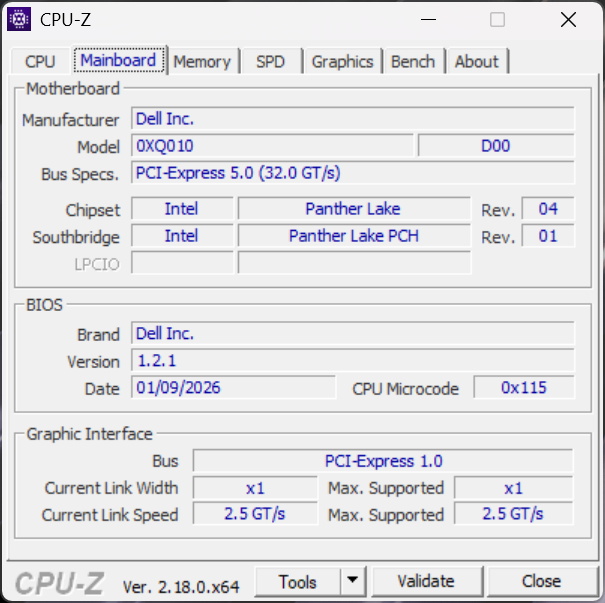
Depois de um ano indiscutivelmente confuso de transição para longe da marca XPSa Dell está voltando ao nome reconhecível com o 2026 XPS 14 completo com a mais recente plataforma de CPU Panther Lake da Intel. O modelo apresenta um design exterior totalmente novo em relação à geração anterior 2025 Dell 14 Premium ou série 2024 XPS 14.
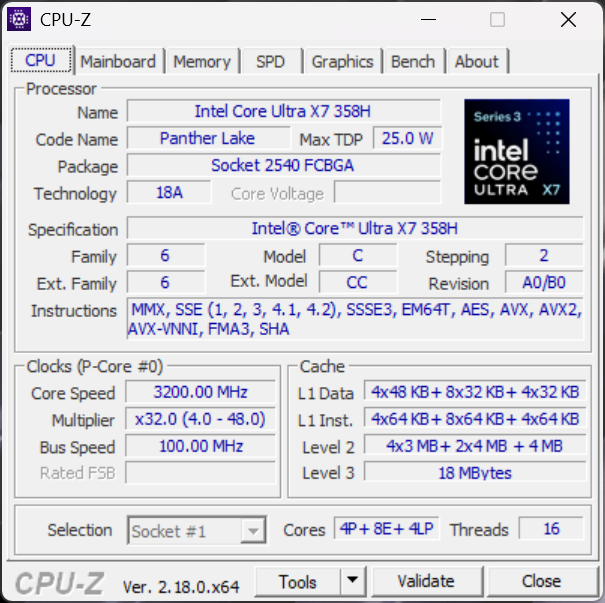
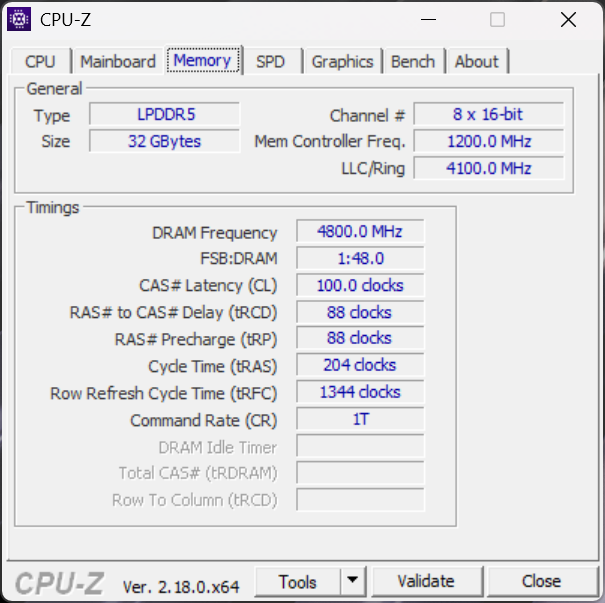
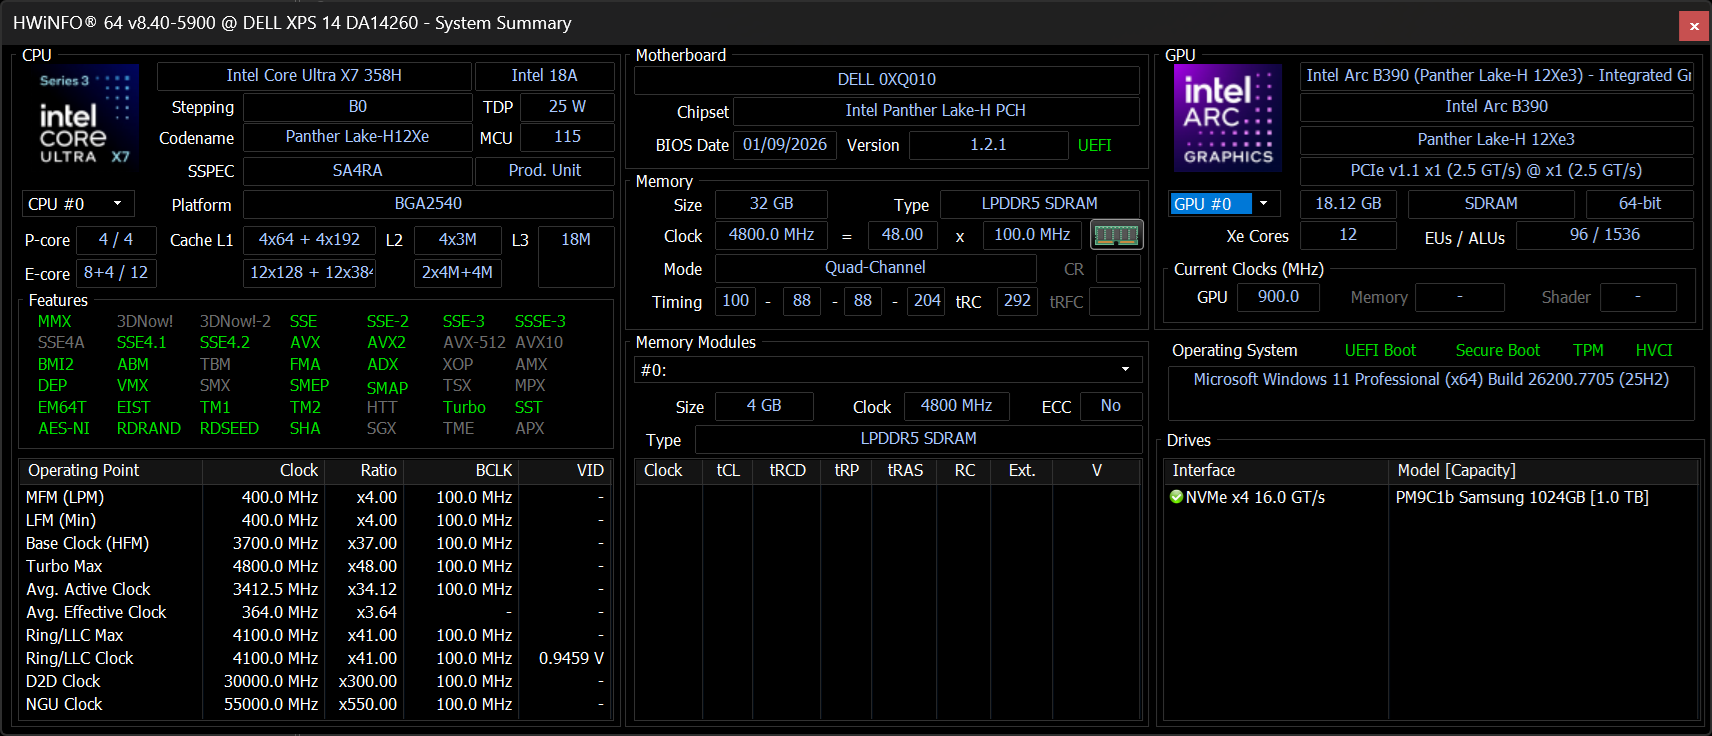
Nossa unidade de teste é uma configuração intermediária com a CPU Core Ultra X7 358H e tela sensível ao toque OLED de 2,8K por aproximadamente US$ 2200. As SKUs menores são fornecidas com o Core Ultra 5 325 e tela não sensível ao toque de 2K, enquanto a SKU mais avançada inclui o Core Ultra X9 388H.
As alternativas ao XPS 14 incluem outros subnotebooks ultrafinos prosumer, como o Asus ExpertBook Ultra, HP EliteBook X G1i 14 AI, Lenovo Yoga Pro 7 14IAH10.
Mais análises da Dell:
Especificações
Case - Uma evolução adequada
O chassi reprojetado foi amplamente abordado em nosso vídeo de visualização original, conforme mostrado abaixo. Visualmente, a mudança mais notável envolve as bordas frontal e lateral, que agora são mais planas e não mais cônicas. A borda frontal é, portanto, tão espessa quanto a borda traseira, semelhante ao MacBook Pro ou Designs do Razer Blade.
Esteticamente, os logotipos no sistema também foram trocados; enquanto os logotipos 'Dell' e 'XPS' no modelo 2025 estavam nas tampas superior e inferior, respectivamente, o logotipo 'Dell' agora está na parte inferior, enquanto o logotipo 'XPS' está na parte superior.
O modelo 2026 é, ao mesmo tempo, mais fino e mais leve do que o design anterior, mas ainda assim parece mais denso e mais rígido, especialmente na borda frontal. No entanto, grande parte dessa diferença pode ser atribuída à mudança de uma tela maior de 14,5 polegadas para apenas 14,0 polegadas. Mesmo assim, ele é mais pesado do que concorrentes como o HP EliteBook X G1i 14 ou o ExpertBook Ultra em 200 a 300 gramas cada.


Conectividade
As portas triplas USB-C Thunderbolt 4 do design do ano passado voltaram. Infelizmente, os usuários de cartões SD ficaram em desvantagem, pois o leitor foi abandonado.


Comunicação

Webcam
Apesar da grande atualização para 8 MP, em vez de apenas 2 MP no Dell 14 Premium, ainda não há um obturador de privacidade físico.


Manutenção
Os procedimentos de manutenção são diferentes e um pouco mais difíceis do que no projeto anterior. Depois de remover os quatro parafusos T5 inferiores, o deck do teclado deve ser cuidadosamente separado da base com uma borda afiada para revelar os componentes da placa-mãe.
O guia oficial de manutenção pode ser encontrado em aqui.

Sustentabilidade
O sistema consiste em 75% de alumínio reciclado nas tampas superior e inferior, 50% de cobalto reciclado na bateria, 90% de aço reciclado para as teclas, 10% de vidro reciclado para a SKU da tela sensível ao toque OLED e 100% de cobre reciclado em partes da PCB. A embalagem em si é totalmente reciclável, sem plásticos.
Acessórios e garantia
Não há extras na caixa além do adaptador CA e da documentação. A garantia limitada de um ano do fabricante se aplica se o produto for comprado nos EUA.
Dispositivos de entrada - Não há mais botões de toque!
Teclado
O novo XPS 14 aborda certas preocupações com o design antigo do teclado e do clickpad. A mais óbvia é a omissão da linha superior de teclas sensíveis ao toque em favor de teclas mais tradicionais, como as do Dell Pro 13 Premium. O deslocamento e o feedback das teclas são semelhantes ao layout de malha zero do ano passado, que consideramos mais raso e mais suave do que as teclas do Lenovo ThinkPad T14 ou da série HP EliteBook 14.
Touchpad
Embora o clickpad sem emendas do design do ano passado fosse bastante espaçoso, ele não tinha bordas visuais e, portanto, era difícil saber onde a superfície sensível ao toque começava ou terminava. O novo XPS 14 adiciona uma gravação sutil ao longo das laterais do clickpad (~15,2 x 7,5 cm) para melhorar a usabilidade sem ser visualmente intrusivo. No entanto, o feedback tátil poderia ter sido mais forte e mais sensível, mas pelo menos não é excessivamente sensível, ao contrário do que experimentamos no clickpad tátil do ExpertBook Ultra.


Tela
Há duas opções de exibição disponíveis, como segue:
- 1920 x 1200, sem toque, fosco, 500 nits, 100% sRGB, IPS, 1 - 120 Hz
- 2880 x 1800, tela sensível ao toque, brilhante, 500 nits, 100% DCI-P3, OLED, 20 - 120 Hz
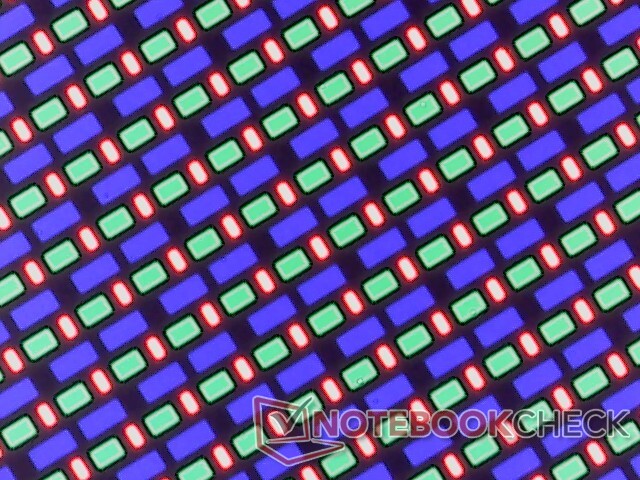
O XPS 14 utiliza uma tela OLED brilhante Gorilla Glass 3 mais tradicional, em contraste com a tela OLED em tandem Gorilla Glass Victus fosca do ExpertBook Ultra. A tela OLED aqui definitivamente não é tão granulada quanto a do Asus, mas o brilho HDR máximo é apenas metade do brilho, na melhor das hipóteses, para um suporte HDR mais fraco.
A Dell trocou os fornecedores de OLED da Samsung no modelo do ano passado para a LG Philips nesta revisão de 2026. Os principais atributos são muito semelhantes entre os painéis, além da diferença de tamanho (14 polegadas vs. 14,5 polegadas)


| |||||||||||||||||||||||||
iluminação: 96 %
iluminação com acumulador: 393.8 cd/m²
Contraste: ∞:1 (Preto: 0 cd/m²)
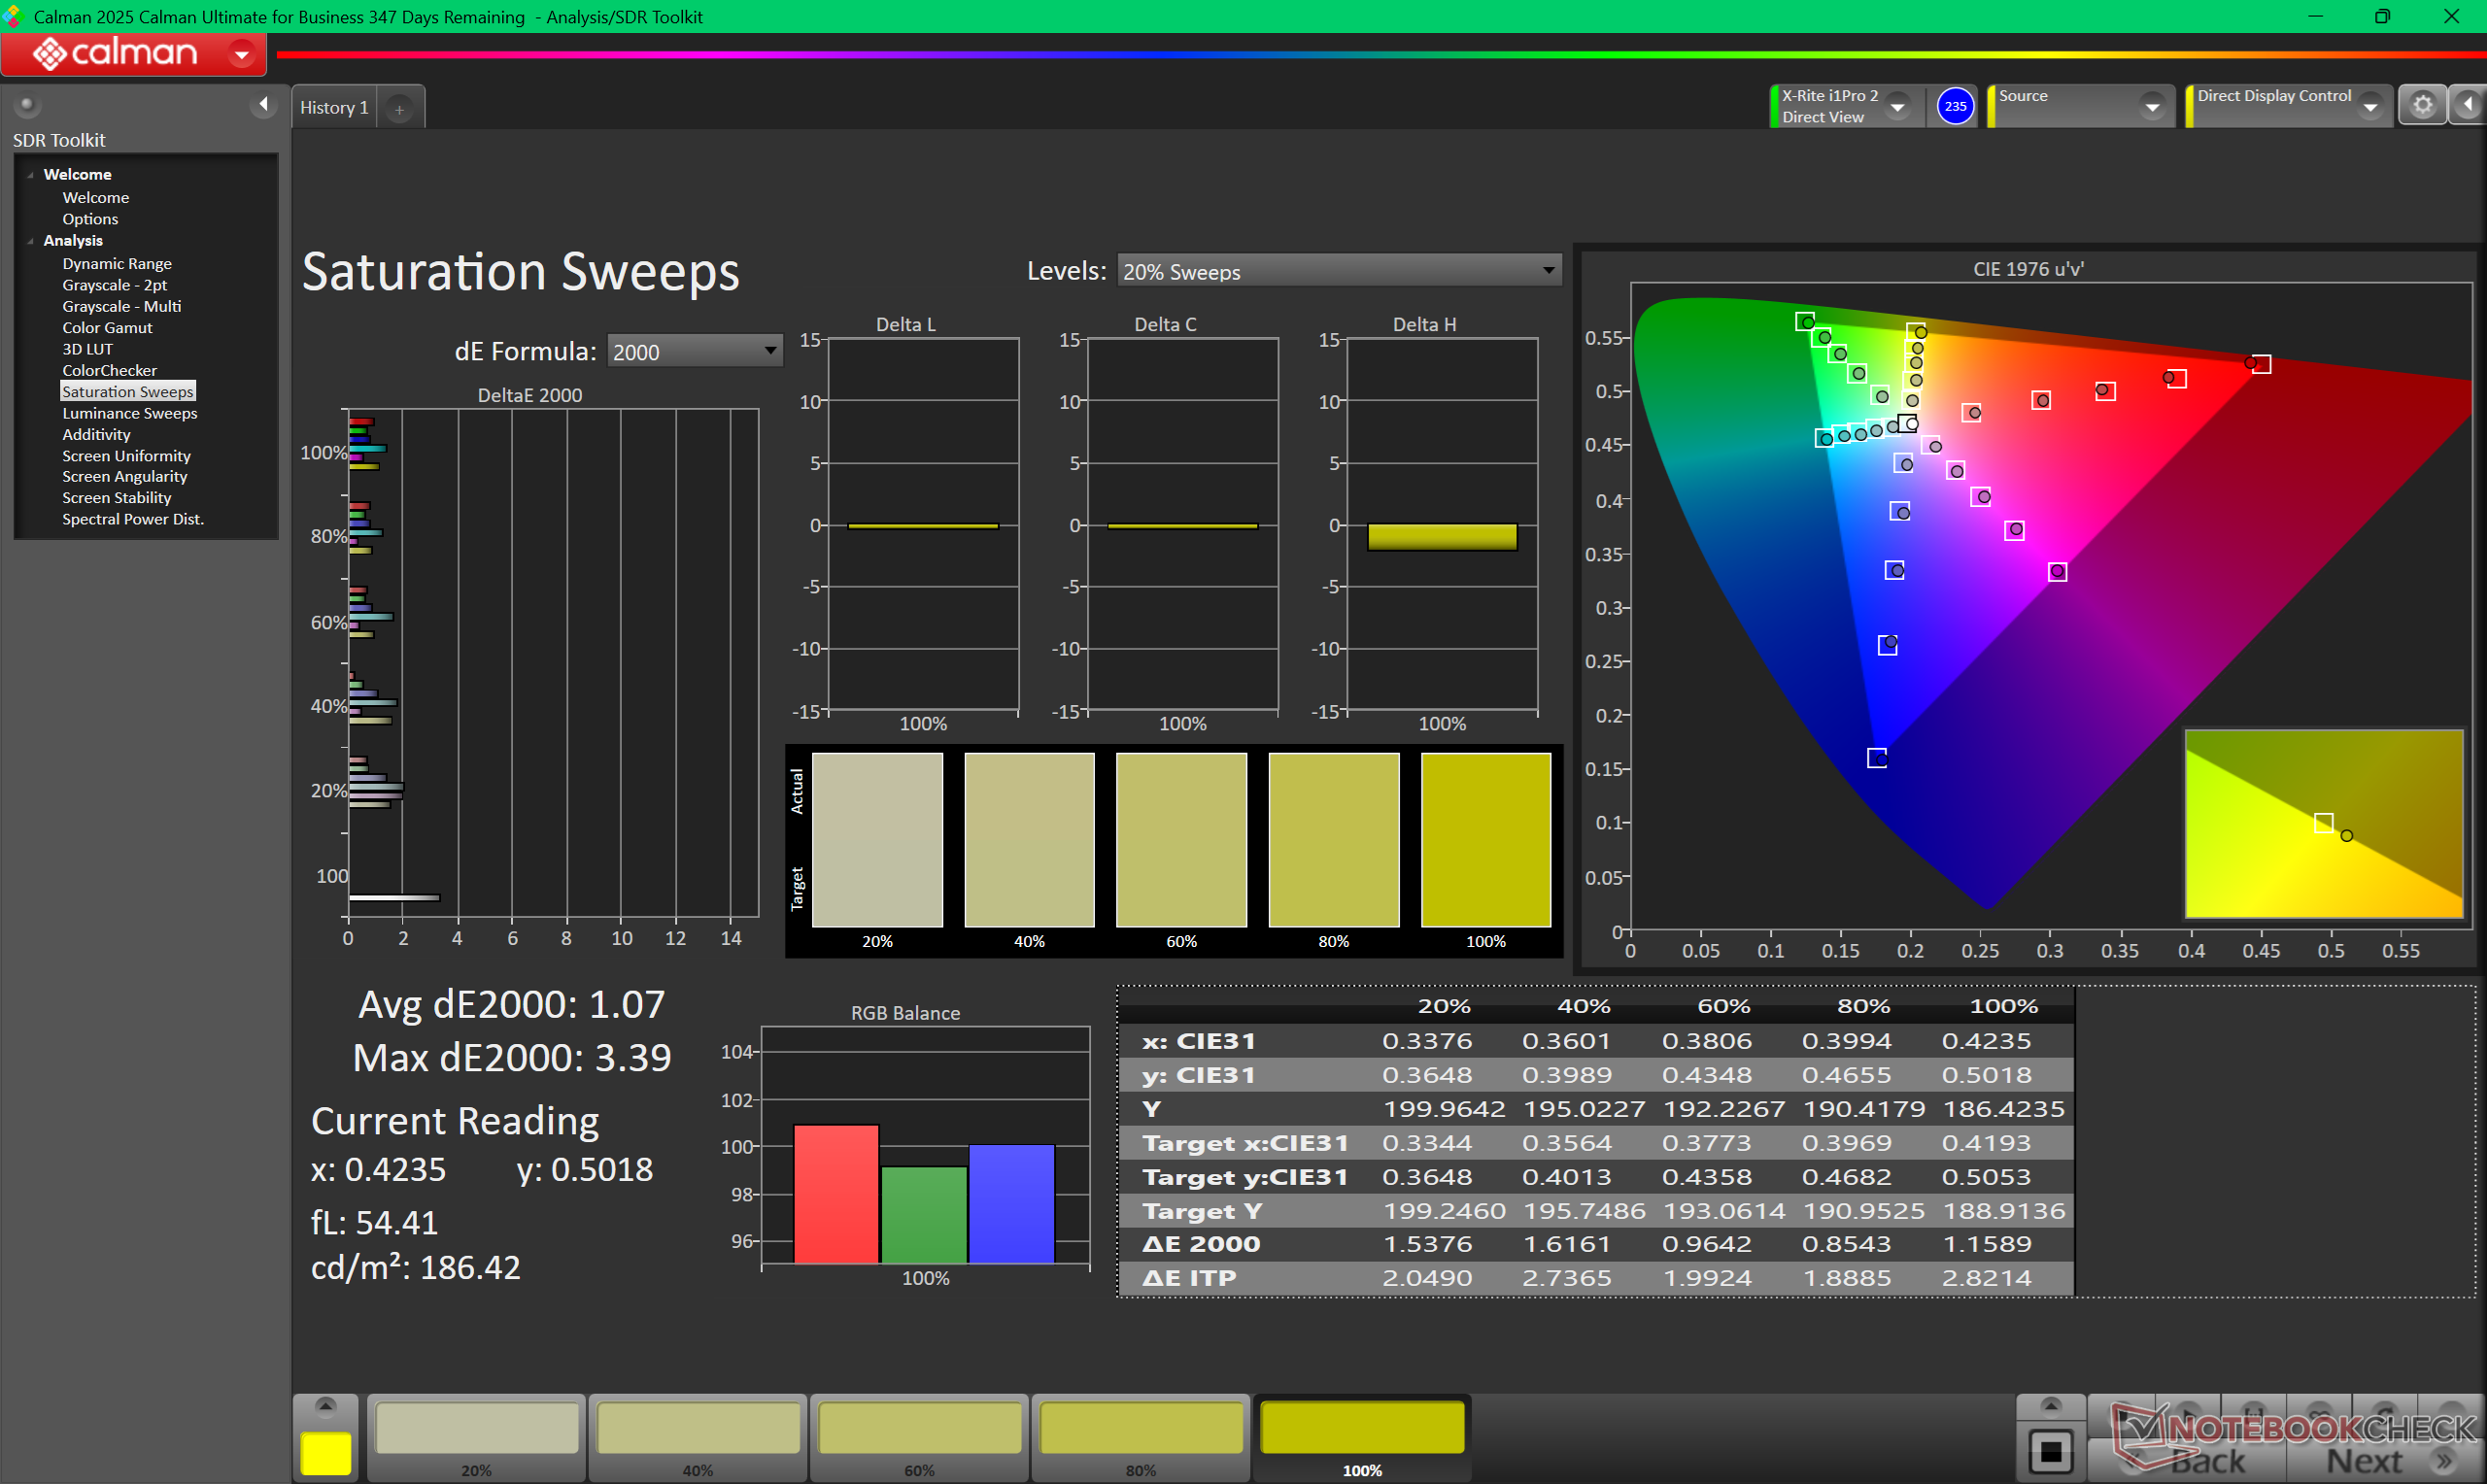
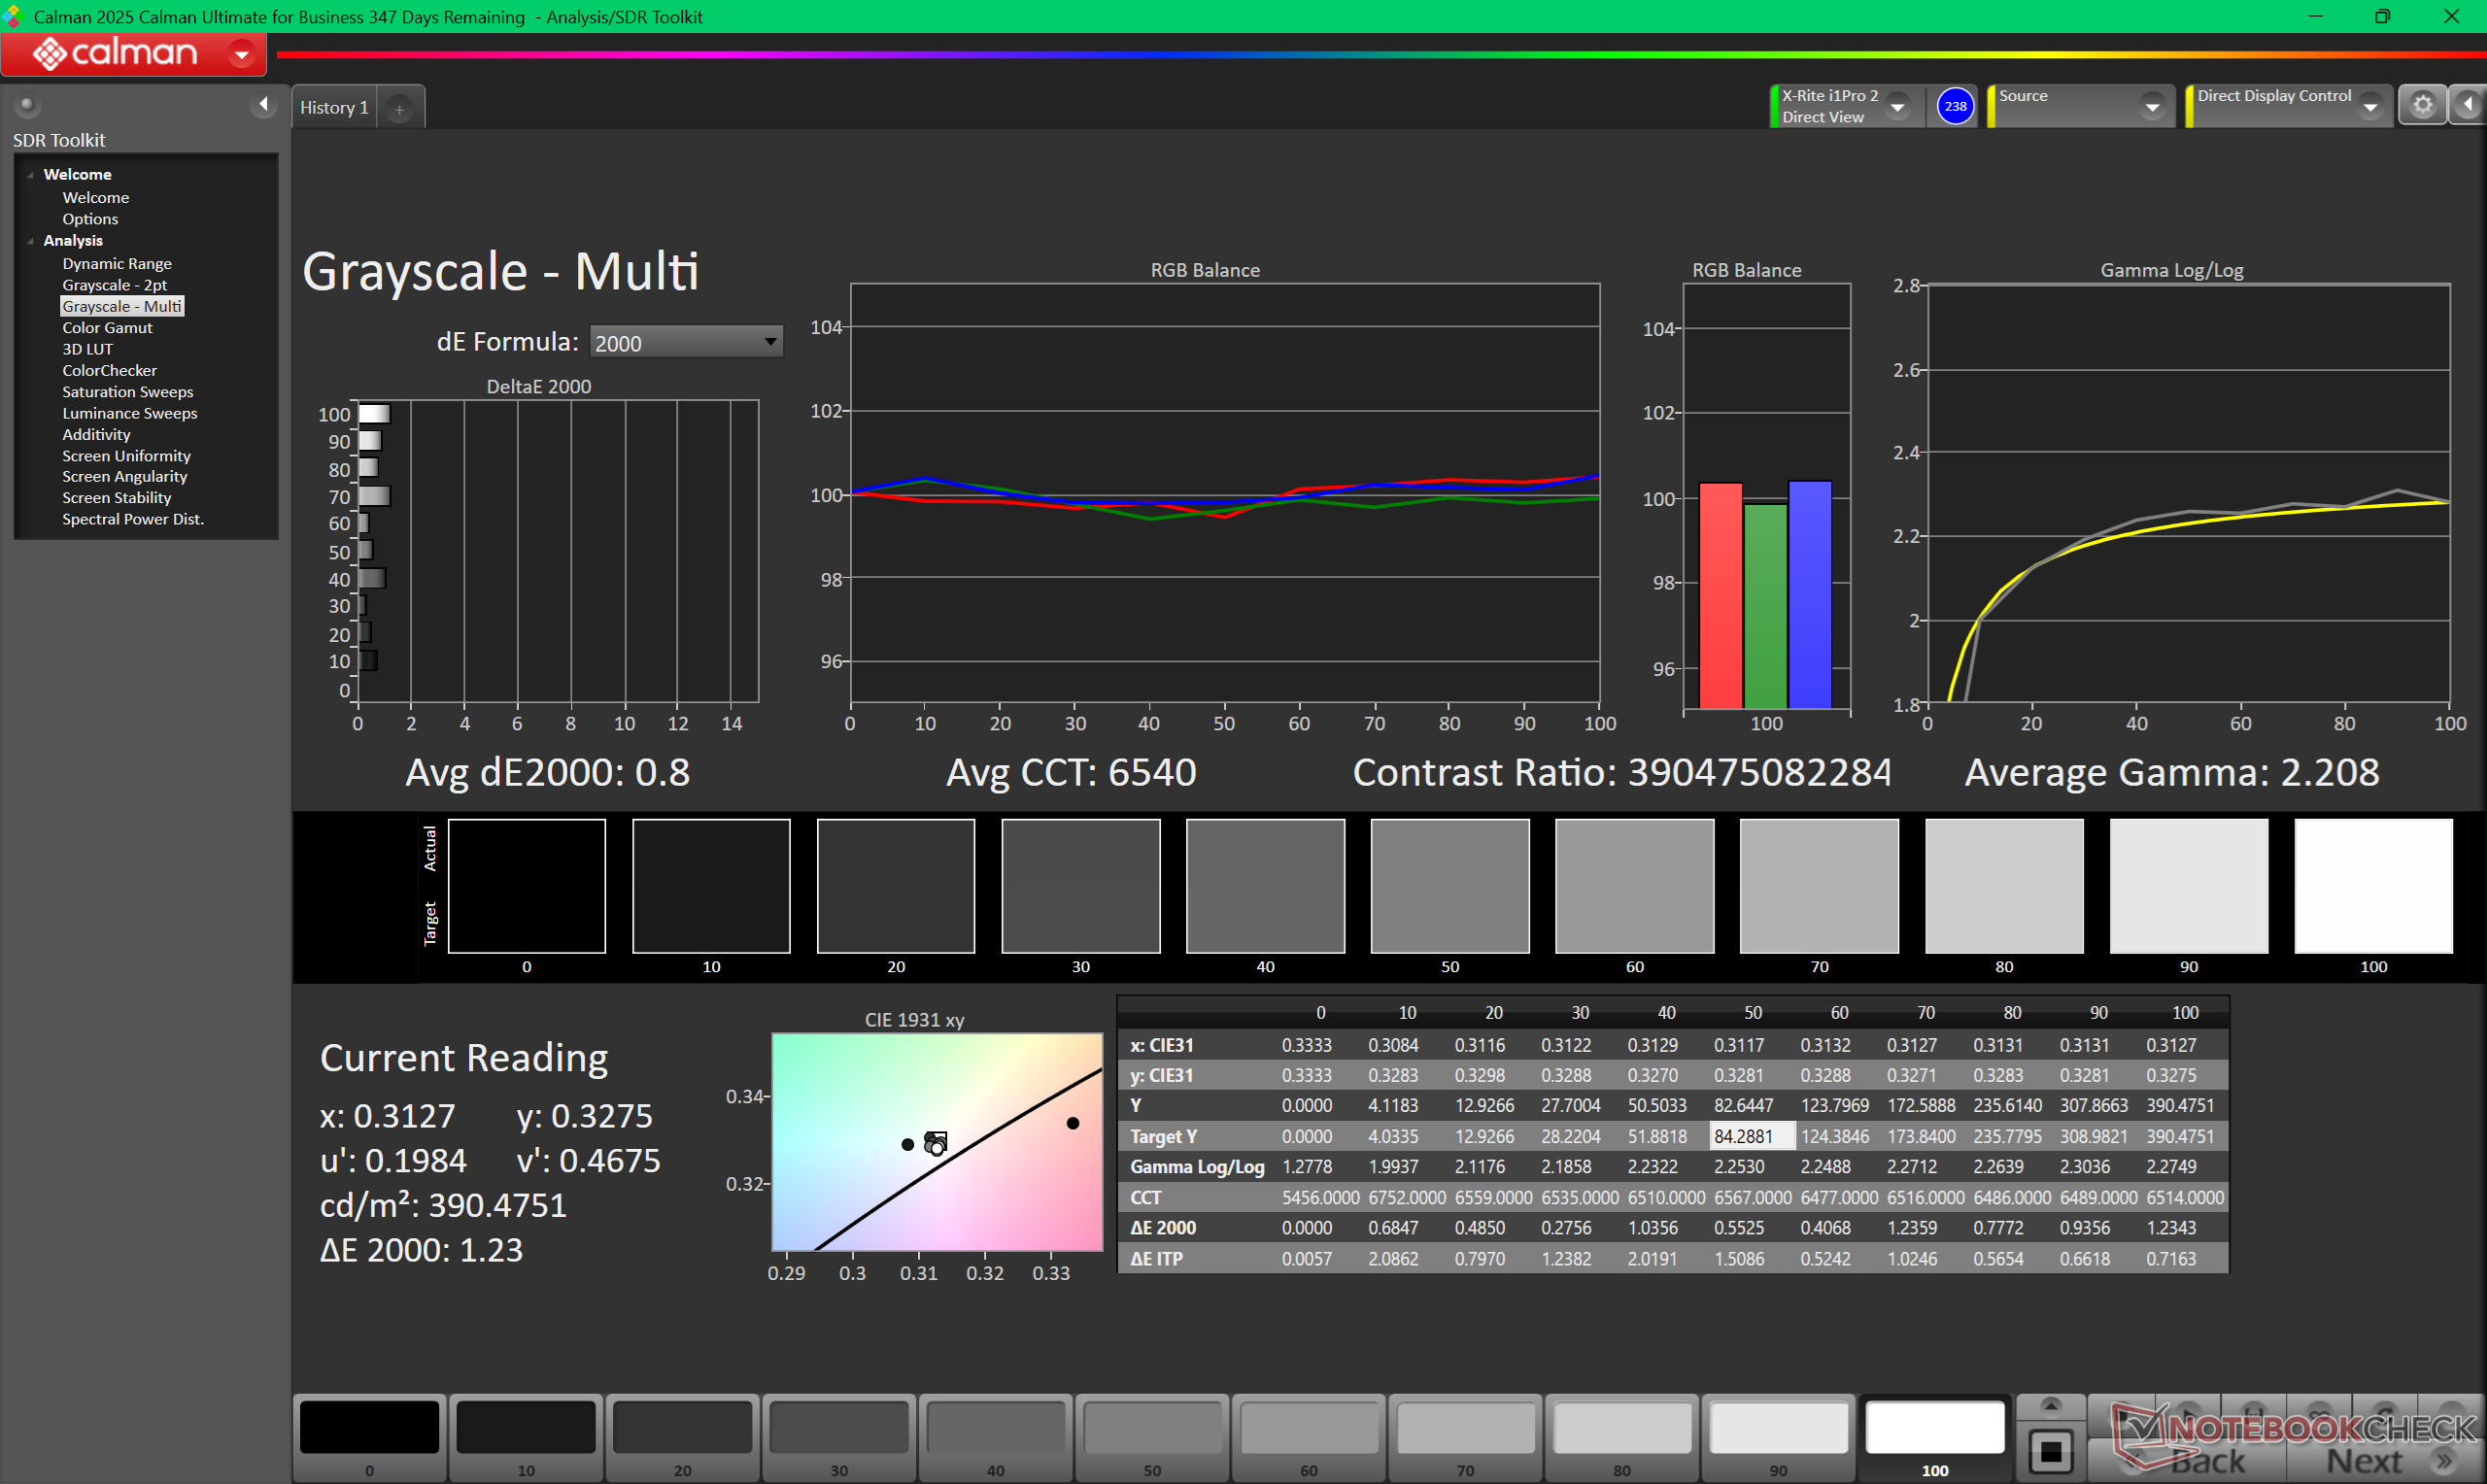
ΔE ColorChecker Calman: 1.27 | ∀{0.5-29.43 Ø4.73}
calibrated: 0.71
ΔE Greyscale Calman: 2 | ∀{0.09-98 Ø4.97}
98.2% AdobeRGB 1998 (Argyll 3D)
100% sRGB (Argyll 3D)
99.7% Display P3 (Argyll 3D)
Gamma: 2.19
CCT: 6379 K
| Dell XPS 14 Core Ultra X7 358H LG Philips 140WT2, OLED, 2880x1800, 14", 120 Hz | Dell 14 Premium Samsung 145FB02, OLED, 3200x2000, 14.5", 120 Hz | Dell XPS 14 2024 OLED SDC41A2, OLED, 3200x2000, 14.5", 120 Hz | Asus ExpertBook Ultra B9406CAA Samsung ATNA40LE01-0, OLED, 2880x1800, 14", 120 Hz | Lenovo Yoga Pro 7 14IAH10 LEN145WQ+, OLED, 3000x1876, 14.5", 120 Hz | HP EliteBook X G1i 14 AI IPS, 1920x1200, 14", 60 Hz | |
|---|---|---|---|---|---|---|
| Display | -4% | -4% | -5% | -1% | -20% | |
| HDR Peak Brightness (cd/m²) | 1104 | |||||
| Display P3 Coverage (%) | 99.7 | 99.3 0% | 98.5 -1% | 96.2 -4% | 99.5 0% | 69.9 -30% |
| sRGB Coverage (%) | 100 | 100 0% | 100 0% | 100 0% | 99.4 -1% | 98.4 -2% |
| AdobeRGB 1998 Coverage (%) | 98.2 | 87.2 -11% | 87.2 -11% | 86.7 -12% | 95.5 -3% | 71.6 -27% |
| Response Times | 11% | 16% | 15% | 37% | -4079% | |
| Response Time Grey 50% / Grey 80% * (ms) | 0.75 ? | 0.72 ? 4% | 0.7 ? 7% | 0.71 ? 5% | 0.63 ? 16% | 42.3 ? -5540% |
| Response Time Black / White * (ms) | 1.03 ? | 0.96 ? 7% | 0.77 ? 25% | 0.94 ? 9% | 0.54 ? 48% | 28 ? -2618% |
| PWM Frequency (Hz) | 240.62 ? | 475 | 480 | 968.8 ? | 120 ? | |
| PWM Amplitude * (%) | 29 | 23 21% | 20 31% | 15 48% | ||
| Screen | -61% | -12% | 23% | 33% | -33% | |
| Brightness middle (cd/m²) | 393.8 | 349.3 -11% | 351 -11% | 600.5 52% | 497 26% | 487.5 24% |
| Brightness (cd/m²) | 389 | 352 -10% | 353 -9% | 612 57% | 500 29% | 469 21% |
| Brightness Distribution (%) | 96 | 98 2% | 97 1% | 96 0% | 96 0% | 91 -5% |
| Black Level * (cd/m²) | 0.26 | |||||
| Colorchecker dE 2000 * | 1.27 | 3.47 -173% | 1.7 -34% | 1.18 7% | 0.7 45% | 2.37 -87% |
| Colorchecker dE 2000 max. * | 3.35 | 7.38 -120% | 2.2 34% | 3.4 -1% | 1.7 49% | 5.77 -72% |
| Colorchecker dE 2000 calibrated * | 0.71 | 1.3 -83% | 0.8 -13% | 0.73 -3% | 0.86 -21% | |
| Greyscale dE 2000 * | 2 | 2.6 -30% | 3.1 -55% | 1 50% | 1 50% | 3.8 -90% |
| Gamma | 2.19 100% | 2.22 99% | 2.12 104% | 2.27 97% | 2.22 99% | 2.14 103% |
| CCT | 6379 102% | 6758 96% | 6616 98% | 6567 99% | 6404 101% | 6540 99% |
| Contrast (:1) | 1875 | |||||
| Média Total (Programa/Configurações) | -18% /
-31% | 0% /
-6% | 11% /
15% | 23% /
26% | -1377% /
-704% |
* ... menor é melhor


A tela vem bem calibrada com valores médios de deltaE de escala de cinza e de cor de 2 ou menos. Calibrar ainda mais o painel com nosso colorímetro melhoraria as cores apenas marginalmente.


Exibir tempos de resposta
| ↔ Tempo de resposta preto para branco | ||
|---|---|---|
| 1.03 ms ... ascensão ↗ e queda ↘ combinadas | ↗ 0.53 ms ascensão | 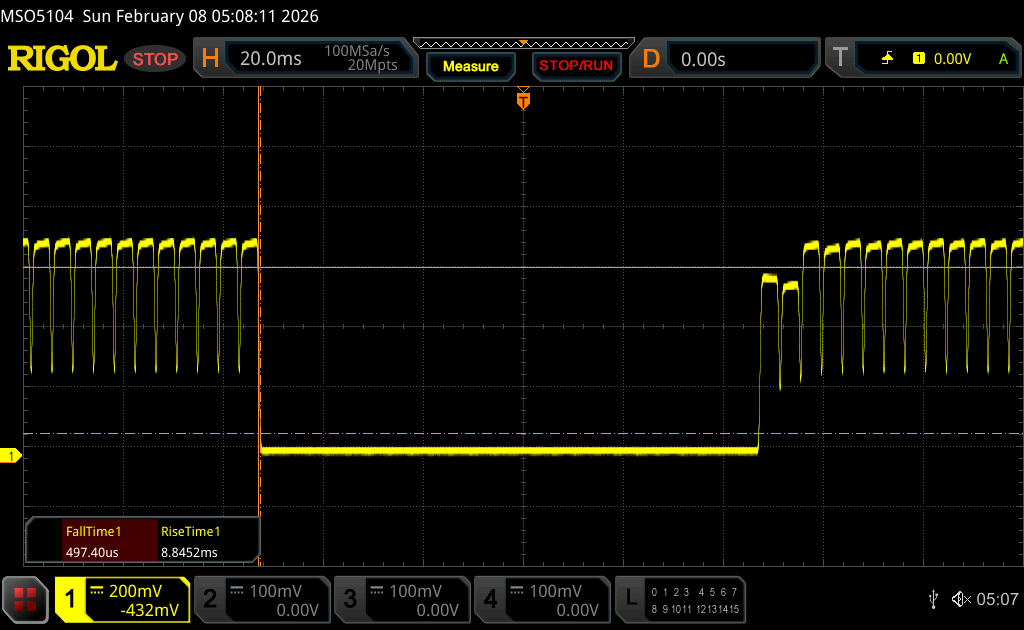 |
| ↘ 0.5 ms queda | ||
| A tela mostra taxas de resposta muito rápidas em nossos testes e deve ser muito adequada para jogos em ritmo acelerado. Em comparação, todos os dispositivos testados variam de 0.1 (mínimo) a 240 (máximo) ms. » 4 % de todos os dispositivos são melhores. Isso significa que o tempo de resposta medido é melhor que a média de todos os dispositivos testados (19.9 ms). | ||
| ↔ Tempo de resposta 50% cinza a 80% cinza | ||
| 0.75 ms ... ascensão ↗ e queda ↘ combinadas | ↗ 0.43 ms ascensão | 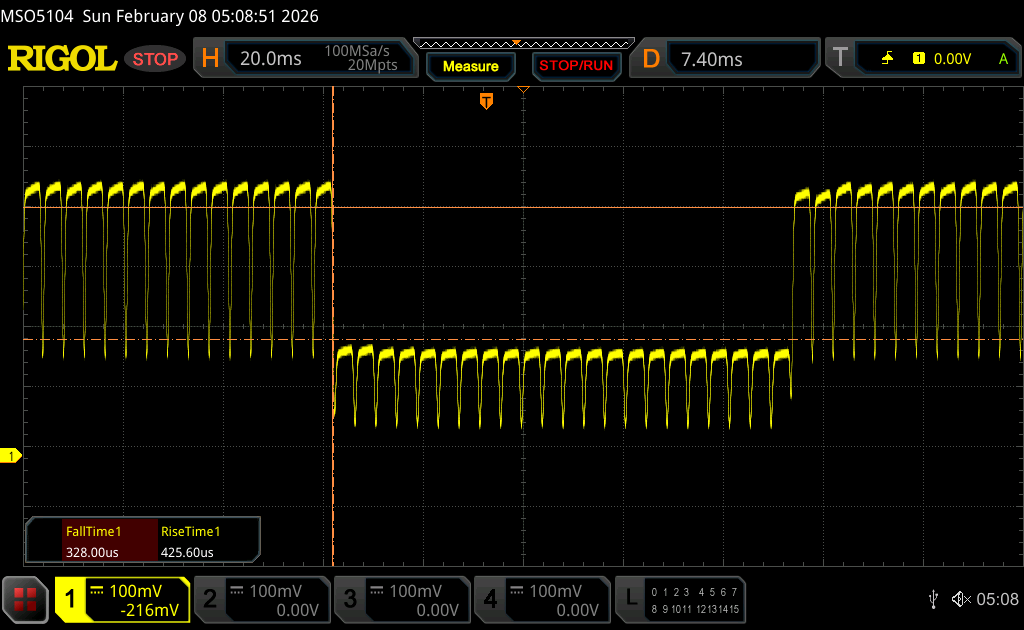 |
| ↘ 0.32 ms queda | ||
| A tela mostra taxas de resposta muito rápidas em nossos testes e deve ser muito adequada para jogos em ritmo acelerado. Em comparação, todos os dispositivos testados variam de 0.165 (mínimo) a 636 (máximo) ms. » 2 % de todos os dispositivos são melhores. Isso significa que o tempo de resposta medido é melhor que a média de todos os dispositivos testados (31.1 ms). | ||
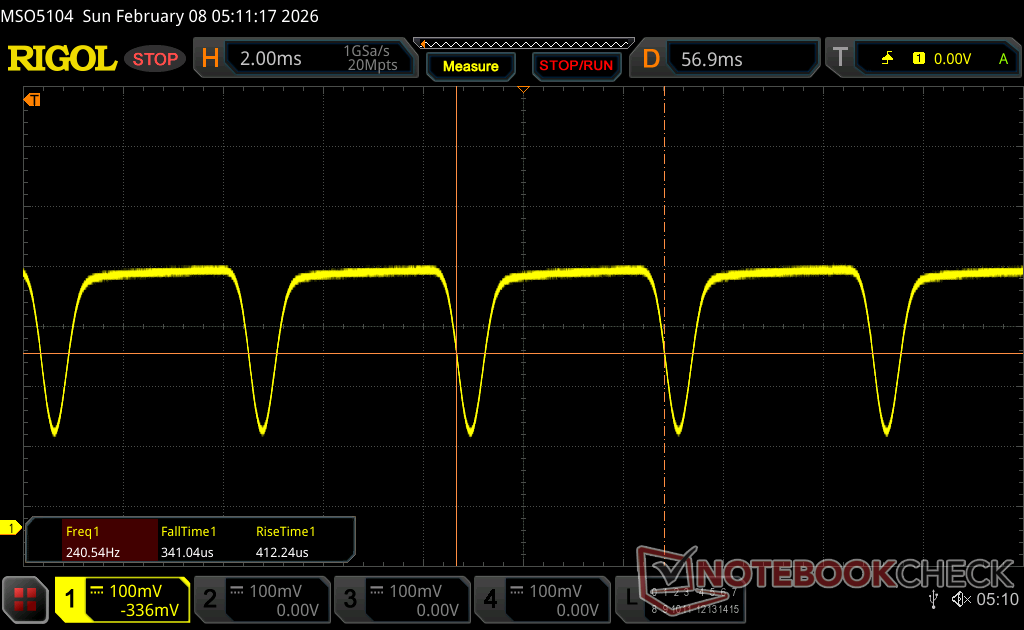
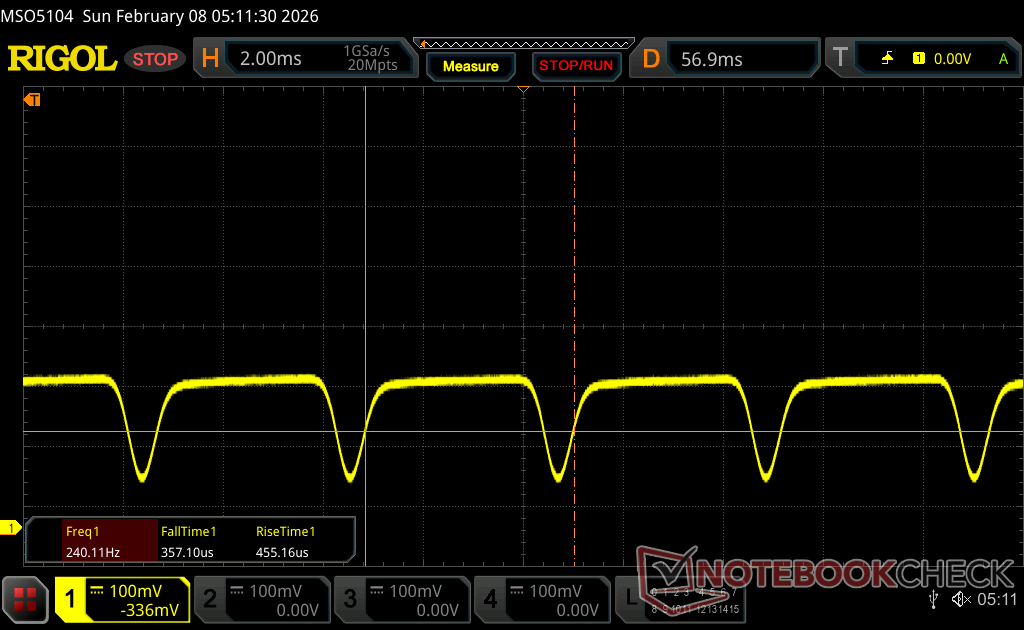
Cintilação da tela / PWM (modulação por largura de pulso)
| Tela tremeluzindo/PWM detectado | 240.62 Hz Amplitude: 29 % | ≤ 100 % configuração de brilho | 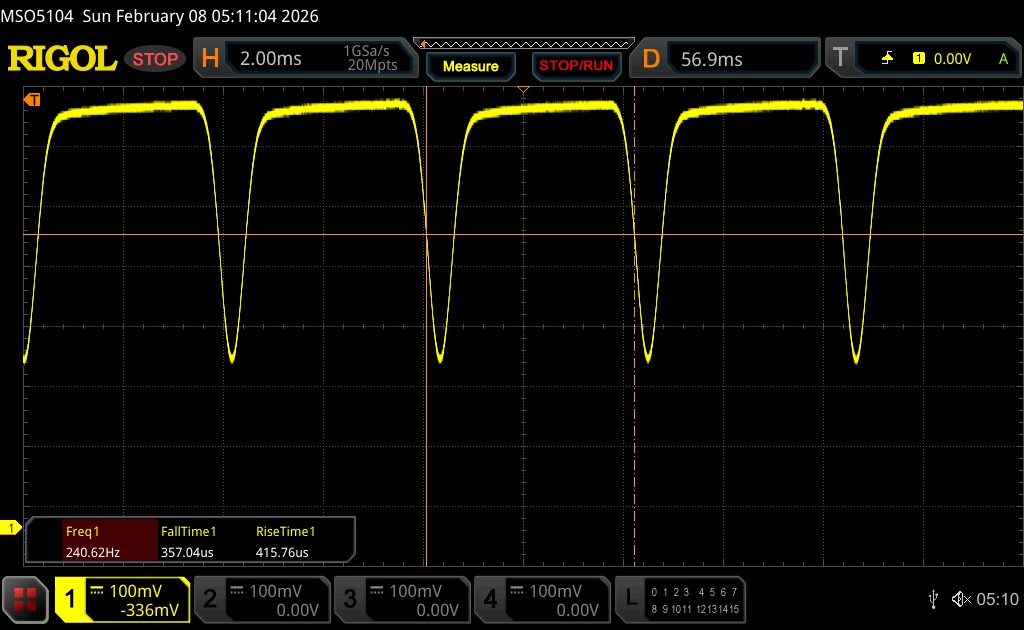 |
A luz de fundo da tela pisca em 240.62 Hz (pior caso, por exemplo, utilizando PWM) Cintilação detectada em uma configuração de brilho de 100 % e abaixo. Não deve haver cintilação ou PWM acima desta configuração de brilho. A frequência de 240.62 Hz é relativamente baixa, portanto, usuários sensíveis provavelmente notarão cintilação e sentirão fadiga ocular na configuração de brilho indicada e abaixo. [pwm_comparison] Em comparação: 52 % de todos os dispositivos testados não usam PWM para escurecer a tela. Se PWM foi detectado, uma média de 7794 (mínimo: 5 - máximo: 343500) Hz foi medida. | |||
A visibilidade externa é decente quando à sombra, mas muito fraca e reflexiva quando em condições mais claras.


Desempenho - Panther Lake Boost
Condições de teste
Colocamos o Windows e o Dell Optimizer no modo Desempenho antes de executar os benchmarks abaixo.
Processador
O desempenho bruto da CPU está dentro de 5 por cento do Core Ultra 7 255H em média, no Dell 14 Premium do ano passado e, portanto, os atuais proprietários não devem esperar nenhum aumento significativo nesse aspecto. Além disso, o desempenho multi-thread seria reduzido em até 25% ao executar o CineBench R15 xT em um loop, como mostra o gráfico de comparação abaixo. O Asus ExpertBook Ultra, que vem com o mesmo Core Ultra X7 358H Que a nossa unidade Dell, aceleraria visivelmente menos para obter um desempenho mais rápido.
A atualização para a versão mais avançada Core Ultra X9 388H Mais avançada, deverá melhorar o desempenho em apenas 5 a 10%, com base em nosso tempo com o Asus ZenBook Duo.
Cinebench R15 Multi Loop
Cinebench R23: Multi Core | Single Core
Cinebench R20: CPU (Multi Core) | CPU (Single Core)
Cinebench R15: CPU Multi 64Bit | CPU Single 64Bit
Blender: v2.79 BMW27 CPU
7-Zip 18.03: 7z b 4 | 7z b 4 -mmt1
Geekbench 6.7: Multi-Core | Single-Core
Geekbench 5.5: Multi-Core | Single-Core
HWBOT x265 Benchmark v2.2: 4k Preset
LibreOffice : 20 Documents To PDF
R Benchmark 2.5: Overall mean
* ... menor é melhor
AIDA64: FP32 Ray-Trace | FPU Julia | CPU SHA3 | CPU Queen | FPU SinJulia | FPU Mandel | CPU AES | CPU ZLib | FP64 Ray-Trace | CPU PhotoWorxx
| Performance rating | |
| Lenovo Yoga Pro 7 14IAH10 | |
| Dell XPS 14 Core Ultra X7 358H | |
| Média Intel Core Ultra X7 358H | |
| Dell XPS 14 2024 OLED | |
| HP EliteBook X G1i 14 AI | |
| Asus ExpertBook Ultra B9406CAA | |
| AIDA64 / FP32 Ray-Trace | |
| Lenovo Yoga Pro 7 14IAH10 | |
| Média Intel Core Ultra X7 358H (12221 - 17932, n=8) | |
| Dell XPS 14 Core Ultra X7 358H | |
| HP EliteBook X G1i 14 AI | |
| Asus ExpertBook Ultra B9406CAA | |
| Dell XPS 14 2024 OLED | |
| AIDA64 / FPU Julia | |
| Lenovo Yoga Pro 7 14IAH10 | |
| Média Intel Core Ultra X7 358H (29930 - 95525, n=8) | |
| Dell XPS 14 Core Ultra X7 358H | |
| Dell XPS 14 2024 OLED | |
| HP EliteBook X G1i 14 AI | |
| Asus ExpertBook Ultra B9406CAA | |
| AIDA64 / CPU SHA3 | |
| Lenovo Yoga Pro 7 14IAH10 | |
| Asus ExpertBook Ultra B9406CAA | |
| Média Intel Core Ultra X7 358H (3910 - 4911, n=8) | |
| Dell XPS 14 Core Ultra X7 358H | |
| Dell XPS 14 2024 OLED | |
| HP EliteBook X G1i 14 AI | |
| AIDA64 / CPU Queen | |
| Dell XPS 14 2024 OLED | |
| Lenovo Yoga Pro 7 14IAH10 | |
| Dell XPS 14 Core Ultra X7 358H | |
| Média Intel Core Ultra X7 358H (63425 - 63827, n=2) | |
| Asus ExpertBook Ultra B9406CAA | |
| HP EliteBook X G1i 14 AI | |
| AIDA64 / FPU SinJulia | |
| Lenovo Yoga Pro 7 14IAH10 | |
| Dell XPS 14 2024 OLED | |
| Dell XPS 14 Core Ultra X7 358H | |
| Média Intel Core Ultra X7 358H (4735 - 7038, n=8) | |
| Asus ExpertBook Ultra B9406CAA | |
| HP EliteBook X G1i 14 AI | |
| AIDA64 / FPU Mandel | |
| Lenovo Yoga Pro 7 14IAH10 | |
| Média Intel Core Ultra X7 358H (14716 - 50734, n=8) | |
| Dell XPS 14 Core Ultra X7 358H | |
| HP EliteBook X G1i 14 AI | |
| Dell XPS 14 2024 OLED | |
| Asus ExpertBook Ultra B9406CAA | |
| AIDA64 / CPU AES | |
| Lenovo Yoga Pro 7 14IAH10 | |
| Dell XPS 14 Core Ultra X7 358H | |
| Dell XPS 14 2024 OLED | |
| Média Intel Core Ultra X7 358H (5127 - 67510, n=8) | |
| HP EliteBook X G1i 14 AI | |
| Asus ExpertBook Ultra B9406CAA | |
| AIDA64 / CPU ZLib | |
| Lenovo Yoga Pro 7 14IAH10 | |
| Asus ExpertBook Ultra B9406CAA | |
| Dell XPS 14 Core Ultra X7 358H | |
| Média Intel Core Ultra X7 358H (932 - 1179, n=8) | |
| Dell XPS 14 2024 OLED | |
| HP EliteBook X G1i 14 AI | |
| AIDA64 / FP64 Ray-Trace | |
| Lenovo Yoga Pro 7 14IAH10 | |
| Média Intel Core Ultra X7 358H (6506 - 9447, n=8) | |
| Dell XPS 14 Core Ultra X7 358H | |
| HP EliteBook X G1i 14 AI | |
| Asus ExpertBook Ultra B9406CAA | |
| Dell XPS 14 2024 OLED | |
| AIDA64 / CPU PhotoWorxx | |
| Dell XPS 14 Core Ultra X7 358H | |
| Média Intel Core Ultra X7 358H (30538 - 88154, n=8) | |
| Lenovo Yoga Pro 7 14IAH10 | |
| HP EliteBook X G1i 14 AI | |
| Dell XPS 14 2024 OLED | |
| Asus ExpertBook Ultra B9406CAA | |
Desempenho do sistema
As pontuações do PCMark são algumas das mais altas de qualquer subnotebook equipado com gráficos integrados. Suas pontuações nos subtestes Produtividade e Criação de Conteúdo Digital, em particular, são melhorias significativas em relação aos modelos da geração anterior.

PCMark 10: Score | Essentials | Productivity | Digital Content Creation
CrossMark: Overall | Productivity | Creativity | Responsiveness
WebXPRT 3: Overall
WebXPRT 4: Overall
Mozilla Kraken 1.1: Total
Geekbench AI: Single Precision GPU 1.7 | Half Precision GPU 1.7 | Quantized GPU 1.7
| Performance rating | |
| Dell XPS 14 Core Ultra X7 358H | |
| Média Intel Core Ultra X7 358H, Intel Arc B390 12 Xe3 Panther Lake iGPU | |
| Asus ExpertBook Ultra B9406CAA | |
| Lenovo Yoga Pro 7 14IAH10 -3! | |
| HP EliteBook X G1i 14 AI | |
| Dell XPS 14 2024 OLED -3! | |
| Dell 14 Premium | |
| PCMark 10 / Score | |
| Dell XPS 14 Core Ultra X7 358H | |
| Média Intel Core Ultra X7 358H, Intel Arc B390 12 Xe3 Panther Lake iGPU (8834 - 9880, n=8) | |
| Asus ExpertBook Ultra B9406CAA | |
| Lenovo Yoga Pro 7 14IAH10 | |
| HP EliteBook X G1i 14 AI | |
| Dell 14 Premium | |
| Dell XPS 14 2024 OLED | |
| PCMark 10 / Essentials | |
| Dell XPS 14 Core Ultra X7 358H | |
| Média Intel Core Ultra X7 358H, Intel Arc B390 12 Xe3 Panther Lake iGPU (10282 - 11263, n=7) | |
| Lenovo Yoga Pro 7 14IAH10 | |
| Asus ExpertBook Ultra B9406CAA | |
| Dell 14 Premium | |
| HP EliteBook X G1i 14 AI | |
| Dell XPS 14 2024 OLED | |
| PCMark 10 / Productivity | |
| Dell XPS 14 Core Ultra X7 358H | |
| Média Intel Core Ultra X7 358H, Intel Arc B390 12 Xe3 Panther Lake iGPU (13908 - 16780, n=7) | |
| Asus ExpertBook Ultra B9406CAA | |
| HP EliteBook X G1i 14 AI | |
| Lenovo Yoga Pro 7 14IAH10 | |
| Dell XPS 14 2024 OLED | |
| Dell 14 Premium | |
| PCMark 10 / Digital Content Creation | |
| Dell XPS 14 Core Ultra X7 358H | |
| Média Intel Core Ultra X7 358H, Intel Arc B390 12 Xe3 Panther Lake iGPU (13082 - 13893, n=7) | |
| Asus ExpertBook Ultra B9406CAA | |
| Lenovo Yoga Pro 7 14IAH10 | |
| Dell 14 Premium | |
| HP EliteBook X G1i 14 AI | |
| Dell XPS 14 2024 OLED | |
| CrossMark / Overall | |
| Média Intel Core Ultra X7 358H, Intel Arc B390 12 Xe3 Panther Lake iGPU (1884 - 2119, n=8) | |
| Lenovo Yoga Pro 7 14IAH10 | |
| Dell XPS 14 Core Ultra X7 358H | |
| Asus ExpertBook Ultra B9406CAA | |
| Dell XPS 14 2024 OLED | |
| HP EliteBook X G1i 14 AI | |
| Dell 14 Premium | |
| CrossMark / Productivity | |
| Lenovo Yoga Pro 7 14IAH10 | |
| Média Intel Core Ultra X7 358H, Intel Arc B390 12 Xe3 Panther Lake iGPU (1678 - 1928, n=8) | |
| Dell XPS 14 Core Ultra X7 358H | |
| Asus ExpertBook Ultra B9406CAA | |
| HP EliteBook X G1i 14 AI | |
| Dell XPS 14 2024 OLED | |
| Dell 14 Premium | |
| CrossMark / Creativity | |
| Média Intel Core Ultra X7 358H, Intel Arc B390 12 Xe3 Panther Lake iGPU (2241 - 2529, n=8) | |
| Dell XPS 14 Core Ultra X7 358H | |
| Lenovo Yoga Pro 7 14IAH10 | |
| Asus ExpertBook Ultra B9406CAA | |
| Dell XPS 14 2024 OLED | |
| HP EliteBook X G1i 14 AI | |
| Dell 14 Premium | |
| CrossMark / Responsiveness | |
| Média Intel Core Ultra X7 358H, Intel Arc B390 12 Xe3 Panther Lake iGPU (1560 - 1837, n=8) | |
| Asus ExpertBook Ultra B9406CAA | |
| Lenovo Yoga Pro 7 14IAH10 | |
| Dell XPS 14 Core Ultra X7 358H | |
| Dell XPS 14 2024 OLED | |
| HP EliteBook X G1i 14 AI | |
| Dell 14 Premium | |
| WebXPRT 3 / Overall | |
| Dell XPS 14 Core Ultra X7 358H | |
| Lenovo Yoga Pro 7 14IAH10 | |
| Média Intel Core Ultra X7 358H, Intel Arc B390 12 Xe3 Panther Lake iGPU (293 - 338, n=8) | |
| HP EliteBook X G1i 14 AI | |
| Asus ExpertBook Ultra B9406CAA | |
| Dell 14 Premium | |
| Dell XPS 14 2024 OLED | |
| WebXPRT 4 / Overall | |
| Lenovo Yoga Pro 7 14IAH10 | |
| Dell XPS 14 Core Ultra X7 358H | |
| Média Intel Core Ultra X7 358H, Intel Arc B390 12 Xe3 Panther Lake iGPU (278 - 305, n=7) | |
| HP EliteBook X G1i 14 AI | |
| Asus ExpertBook Ultra B9406CAA | |
| Dell 14 Premium | |
| Dell XPS 14 2024 OLED | |
| Mozilla Kraken 1.1 / Total | |
| Dell XPS 14 2024 OLED | |
| Dell 14 Premium | |
| HP EliteBook X G1i 14 AI | |
| Média Intel Core Ultra X7 358H, Intel Arc B390 12 Xe3 Panther Lake iGPU (445 - 460, n=8) | |
| Asus ExpertBook Ultra B9406CAA | |
| Dell XPS 14 Core Ultra X7 358H | |
| Lenovo Yoga Pro 7 14IAH10 | |
| Geekbench AI / Single Precision GPU 1.7 | |
| Asus ExpertBook Ultra B9406CAA | |
| Dell XPS 14 Core Ultra X7 358H | |
| Média Intel Core Ultra X7 358H, Intel Arc B390 12 Xe3 Panther Lake iGPU (9783 - 12255, n=6) | |
| HP EliteBook X G1i 14 AI | |
| Dell 14 Premium | |
| Geekbench AI / Half Precision GPU 1.7 | |
| Asus ExpertBook Ultra B9406CAA | |
| Média Intel Core Ultra X7 358H, Intel Arc B390 12 Xe3 Panther Lake iGPU (16188 - 21963, n=6) | |
| Dell XPS 14 Core Ultra X7 358H | |
| HP EliteBook X G1i 14 AI | |
| Dell 14 Premium | |
| Geekbench AI / Quantized GPU 1.7 | |
| Asus ExpertBook Ultra B9406CAA | |
| Dell XPS 14 Core Ultra X7 358H | |
| Média Intel Core Ultra X7 358H, Intel Arc B390 12 Xe3 Panther Lake iGPU (6908 - 8011, n=6) | |
| HP EliteBook X G1i 14 AI | |
| Dell 14 Premium | |
* ... menor é melhor
| PCMark 10 Score | 9880 pontos | |
Ajuda | ||
| AIDA64 / Memory Copy | |
| Dell XPS 14 Core Ultra X7 358H | |
| Média Intel Core Ultra X7 358H (102745 - 132135, n=7) | |
| Lenovo Yoga Pro 7 14IAH10 | |
| HP EliteBook X G1i 14 AI | |
| Dell XPS 14 2024 OLED | |
| AIDA64 / Memory Read | |
| Asus ExpertBook Ultra B9406CAA | |
| Dell XPS 14 Core Ultra X7 358H | |
| Média Intel Core Ultra X7 358H (97755 - 118888, n=8) | |
| Dell XPS 14 2024 OLED | |
| Lenovo Yoga Pro 7 14IAH10 | |
| HP EliteBook X G1i 14 AI | |
| AIDA64 / Memory Write | |
| Dell XPS 14 Core Ultra X7 358H | |
| Média Intel Core Ultra X7 358H (105984 - 134998, n=8) | |
| Asus ExpertBook Ultra B9406CAA | |
| HP EliteBook X G1i 14 AI | |
| Lenovo Yoga Pro 7 14IAH10 | |
| Dell XPS 14 2024 OLED | |
| AIDA64 / Memory Latency | |
| Dell XPS 14 2024 OLED | |
| Lenovo Yoga Pro 7 14IAH10 | |
| HP EliteBook X G1i 14 AI | |
| Dell XPS 14 Core Ultra X7 358H | |
| Média Intel Core Ultra X7 358H (84.6 - 101.9, n=8) | |
* ... menor é melhor
Latência DPC
O LatencyMon relata apenas pequenos problemas de DPC e nenhuma queda de quadros ao reproduzir conteúdo de vídeo 4K60.


| DPC Latencies / LatencyMon - interrupt to process latency (max), Web, Youtube, Prime95 | |
| Dell 14 Premium | |
| Dell XPS 14 2024 OLED | |
| Lenovo Yoga Pro 7 14IAH10 | |
| Dell XPS 14 Core Ultra X7 358H | |
| HP EliteBook X G1i 14 AI | |
| Asus ExpertBook Ultra B9406CAA | |
* ... menor é melhor
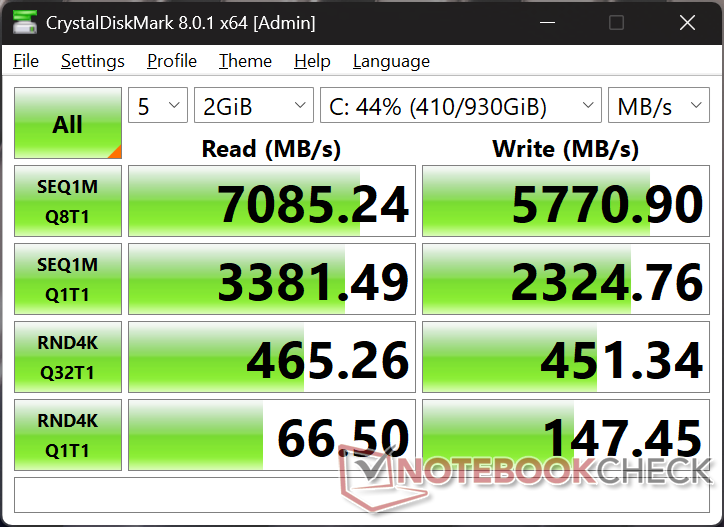
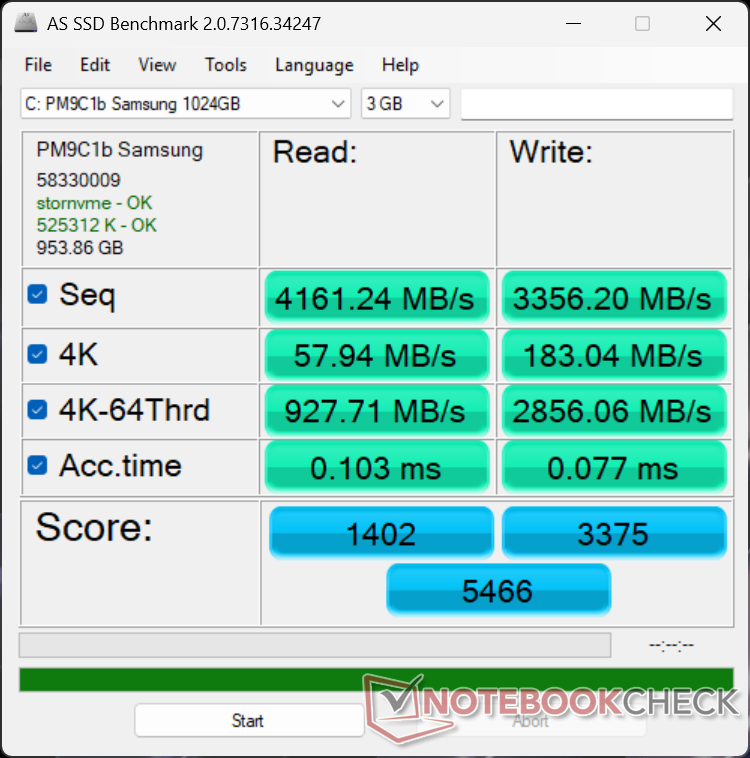
Dispositivos de armazenamento
O SSD Samsung PM9C1b PCIe4 x4 NVMe pode sustentar taxas de transferência de 7000 MB/s sem nenhum problema de estrangulamento, sendo um pouco mais rápido do que a unidade Kioxia no Dell 14 Premium.


| Drive Performance rating - Percent | |
| Asus ExpertBook Ultra B9406CAA | |
| Lenovo Yoga Pro 7 14IAH10 | |
| Dell XPS 14 Core Ultra X7 358H | |
| Dell XPS 14 2024 OLED | |
| Dell 14 Premium | |
| HP EliteBook X G1i 14 AI | |
* ... menor é melhor
Limitação de disco: Loop de leitura do DiskSpd, profundidade da fila 8
Desempenho da GPU
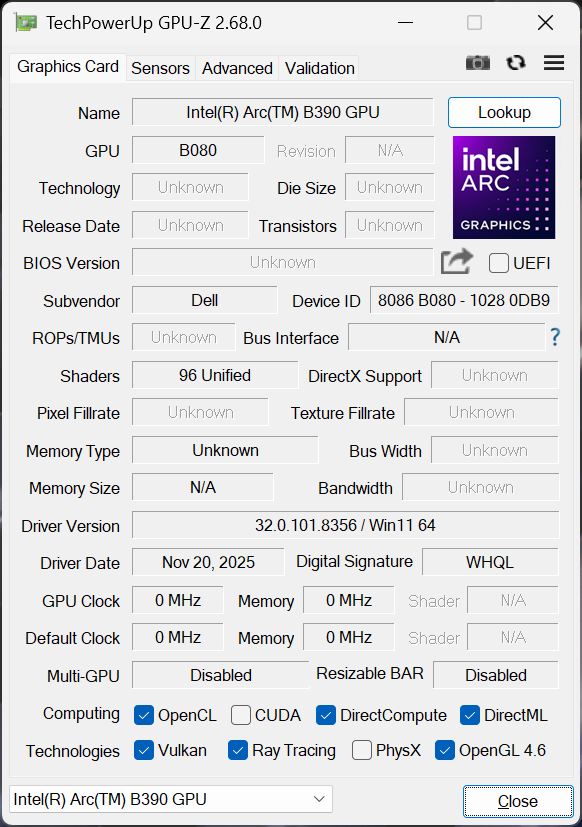
O sistema integrado Arc B390 é um dos principais destaques do XPS 14 2026. O desempenho ano a ano é uma melhoria tão grande em relação ao Arc 140T no Dell 14 Premium 2025 que ele até mesmo iguala ou supera o XPS 14 2024 com placa de vídeo dedicada GeForce RTX 4050 dedicada. as pontuações do 3DMark são aproximadamente o dobro do Arc 140T, sendo 25 a 40% maiores do que as do RTX 4050. Para operações de renderização profissional, no entanto, os núcleos CUDA da GPU Nvidia ainda são a opção mais rápida em cerca de 35%.
Infelizmente, a execução com a energia da bateria afeta ligeiramente o desempenho, como mostra a tabela de resultados do site Fire Strike abaixo. O déficit pode se tornar ainda maior se for definido para o modo Balanced em vez do modo Performance.
| Perfil de energia | Pontuação de gráficos | Pontuação de física | Pontuação combinada |
| Modo de desempenho | 17324 | 25143 | 4879 |
| Modo equilibrado | 14560 (-16%) | 21811 (-13%) | 4073 (-17%) |
| Energia da bateria | 15875 (-8%) | 27090 (-8%) | 4578 (-6%) |
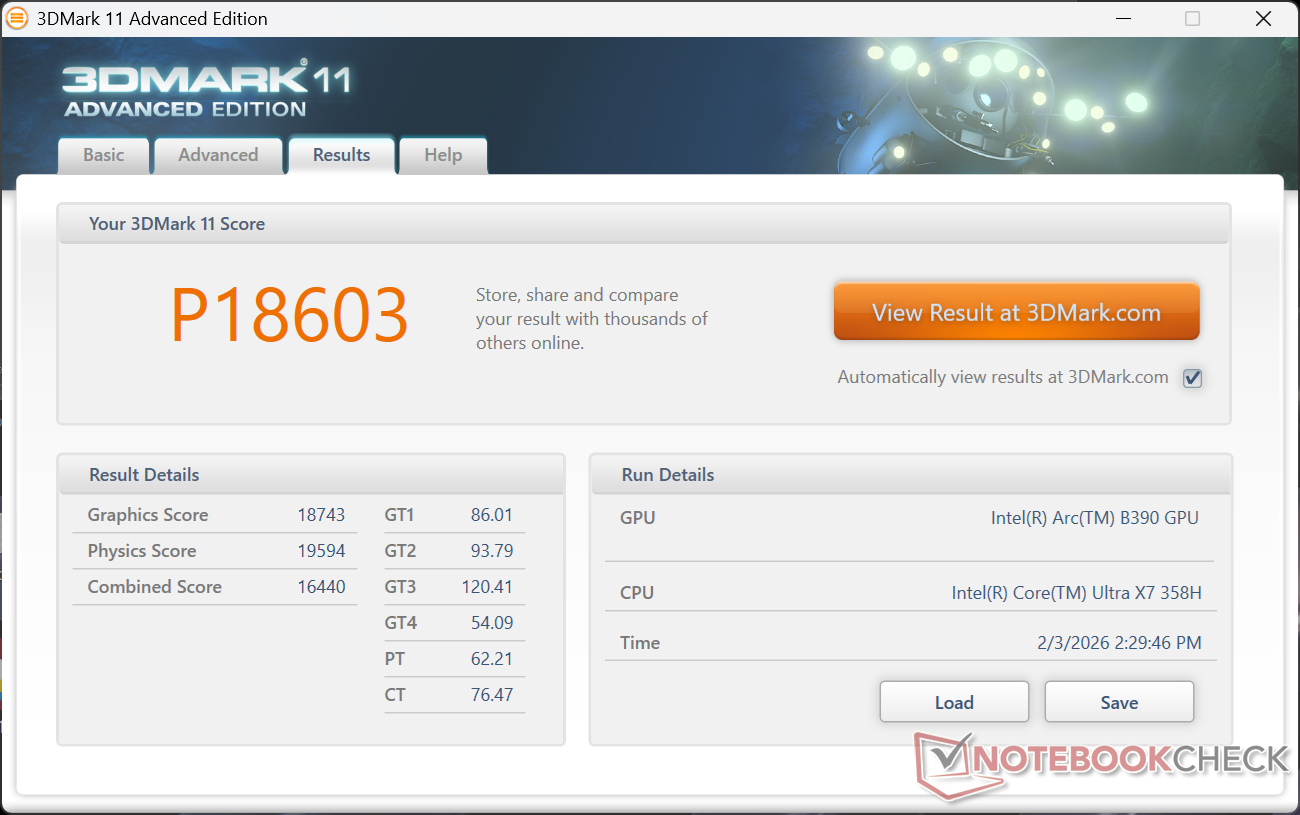


| 3DMark 11 Performance | 18603 pontos | |
| 3DMark Cloud Gate Standard Score | 48038 pontos | |
| 3DMark Fire Strike Score | 14336 pontos | |
| 3DMark Time Spy Score | 7546 pontos | |
Ajuda | ||
* ... menor é melhor
Desempenho em jogos
Embora não seja um notebook para jogos, o novo XPS 14 pode executar títulos exigentes como Black Myth Wukong em configurações decentes de 1080p. Observe que o desempenho geral em jogos está, em média, a apenas 10% do XPS 14 com RTX 4050, embora nossas pontuações sintéticas no 3DMark sugiram deltas maiores.
| Performance rating - Percent | |
| Dell XPS 14 2024 OLED | |
| Asus ExpertBook Ultra B9406CAA | |
| Dell XPS 14 Core Ultra X7 358H | |
| HP EliteBook X G1i 14 AI | |
| Lenovo Yoga Pro 7 14IAH10 | |
| Dell 14 Premium | |
| Cyberpunk 2077 - 1920x1080 Ultra Preset (FSR off) | |
| Asus ExpertBook Ultra B9406CAA | |
| Dell XPS 14 Core Ultra X7 358H | |
| Dell XPS 14 2024 OLED | |
| HP EliteBook X G1i 14 AI | |
| Lenovo Yoga Pro 7 14IAH10 | |
| Dell 14 Premium | |
| Baldur's Gate 3 - 1920x1080 Ultra Preset AA:T | |
| Asus ExpertBook Ultra B9406CAA | |
| Dell XPS 14 Core Ultra X7 358H | |
| Dell XPS 14 2024 OLED | |
| HP EliteBook X G1i 14 AI | |
| Lenovo Yoga Pro 7 14IAH10 | |
| Dell 14 Premium | |
| GTA V - 1920x1080 Highest AA:4xMSAA + FX AF:16x | |
| Dell XPS 14 2024 OLED | |
| Asus ExpertBook Ultra B9406CAA | |
| Dell XPS 14 Core Ultra X7 358H | |
| HP EliteBook X G1i 14 AI | |
| Lenovo Yoga Pro 7 14IAH10 | |
| Dell 14 Premium | |
| Final Fantasy XV Benchmark - 1920x1080 High Quality | |
| Asus ExpertBook Ultra B9406CAA | |
| Dell XPS 14 Core Ultra X7 358H | |
| Dell XPS 14 2024 OLED | |
| HP EliteBook X G1i 14 AI | |
| Dell 14 Premium | |
| Lenovo Yoga Pro 7 14IAH10 | |
| Strange Brigade - 1920x1080 ultra AA:ultra AF:16 | |
| Asus ExpertBook Ultra B9406CAA | |
| Dell XPS 14 Core Ultra X7 358H | |
| Dell XPS 14 2024 OLED | |
| Lenovo Yoga Pro 7 14IAH10 | |
| HP EliteBook X G1i 14 AI | |
| Dell 14 Premium | |
| Dota 2 Reborn - 1920x1080 ultra (3/3) best looking | |
| Dell XPS 14 Core Ultra X7 358H | |
| Dell XPS 14 2024 OLED | |
| Asus ExpertBook Ultra B9406CAA | |
| HP EliteBook X G1i 14 AI | |
| Lenovo Yoga Pro 7 14IAH10 | |
| Dell 14 Premium | |
| X-Plane 11.11 - 1920x1080 high (fps_test=3) | |
| Dell XPS 14 2024 OLED | |
| Dell 14 Premium | |
| Dell XPS 14 Core Ultra X7 358H | |
| Asus ExpertBook Ultra B9406CAA | |
| Lenovo Yoga Pro 7 14IAH10 | |
| HP EliteBook X G1i 14 AI | |
Gráfico de ultra FPS do Cyberpunk 2077
| baixo | média | alto | ultra | QHD | |
|---|---|---|---|---|---|
| GTA V (2015) | 176.7 | 171 | 98.2 | 43.3 | 30.9 |
| Dota 2 Reborn (2015) | 135 | 95.4 | 107.6 | 105.4 | |
| Final Fantasy XV Benchmark (2018) | 123.5 | 73.7 | 52.8 | 39 | |
| X-Plane 11.11 (2018) | 59.7 | 47.1 | 40.3 | ||
| Strange Brigade (2018) | 384 | 138.6 | 103.3 | 95.1 | 71.7 |
| Baldur's Gate 3 (2023) | 64.3 | 55.4 | 49 | 48.7 | 34.9 |
| Cyberpunk 2077 (2023) | 68.6 | 56.2 | 46.9 | 40.9 | 24.7 |
| F1 24 (2024) | 145.9 | 132.2 | 100.7 | 36.2 | 23.8 |
| Black Myth: Wukong (2024) | 43 | 34 | 26 | 14 | 11 |
| ARC Raiders (2025) | 104.3 | 57 | 42.4 | 28 | 19.2 |
Emissões
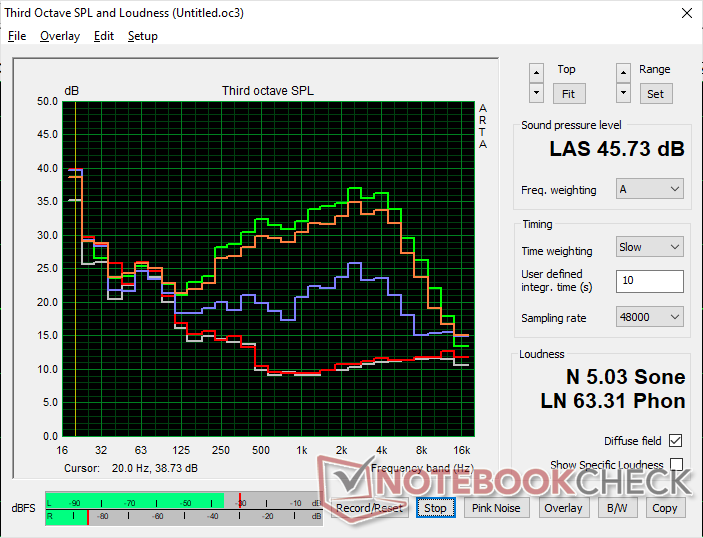
Ruído do sistema
O novo XPS 14 é capaz de permanecer mais silencioso por mais tempo do que o modelo do ano passado. Ao executar o 3DMark 06, por exemplo, o ruído da ventoinha se estabilizaria em 34 dB(A) no final da primeira cena do benchmark, em comparação com 39 dB(A) no modelo Arrow Lake mais antigo. Por outro lado, o limite máximo de ruído da ventoinha ainda é de cerca de 45 dB(A), semelhante ao anterior.


Barulho
| Ocioso |
| 23.3 / 23.3 / 23.3 dB |
| Carga |
| 34 / 45.7 dB |
 | ||
30 dB silencioso 40 dB(A) audível 50 dB(A) ruidosamente alto |
||
min: | ||
| Dell XPS 14 Core Ultra X7 358H Ultra X7 358H, Arc B390 Panther Lake iGPU | Dell 14 Premium Ultra 7 255H, Arc 140T | Dell XPS 14 2024 OLED Ultra 7 155H, GeForce RTX 4050 Laptop GPU | Asus ExpertBook Ultra B9406CAA Ultra X7 358H, Arc B390 Panther Lake iGPU | Lenovo Yoga Pro 7 14IAH10 Ultra 9 285H, Arc 140T | HP EliteBook X G1i 14 AI Core Ultra 7 268V, Arc 140V | |
|---|---|---|---|---|---|---|
| Noise | -3% | -8% | 3% | -11% | -10% | |
| desligado / ambiente * (dB) | 22.9 | 23 -0% | 24.3 -6% | 22.9 -0% | 24.5 -7% | 28.2 -23% |
| Idle Minimum * (dB) | 23.3 | 23.2 -0% | 24.3 -4% | 23.4 -0% | 24.5 -5% | 28.4 -22% |
| Idle Average * (dB) | 23.3 | 24 -3% | 26.5 -14% | 23.4 -0% | 24.5 -5% | 28.4 -22% |
| Idle Maximum * (dB) | 23.3 | 24.7 -6% | 28.5 -22% | 23.4 -0% | 24.5 -5% | 28.8 -24% |
| Load Average * (dB) | 34 | 39 -15% | 37 -9% | 28.6 16% | 46.9 -38% | 33.5 1% |
| Cyberpunk 2077 ultra * (dB) | 43.5 | 43 1% | 42.8 2% | 46.9 -8% | 39.1 10% | |
| Load Maximum * (dB) | 45.7 | 44.9 2% | 43.3 5% | 45.2 1% | 48.7 -7% | 40.4 12% |
| Witcher 3 ultra * (dB) | 39.1 |
* ... menor é melhor
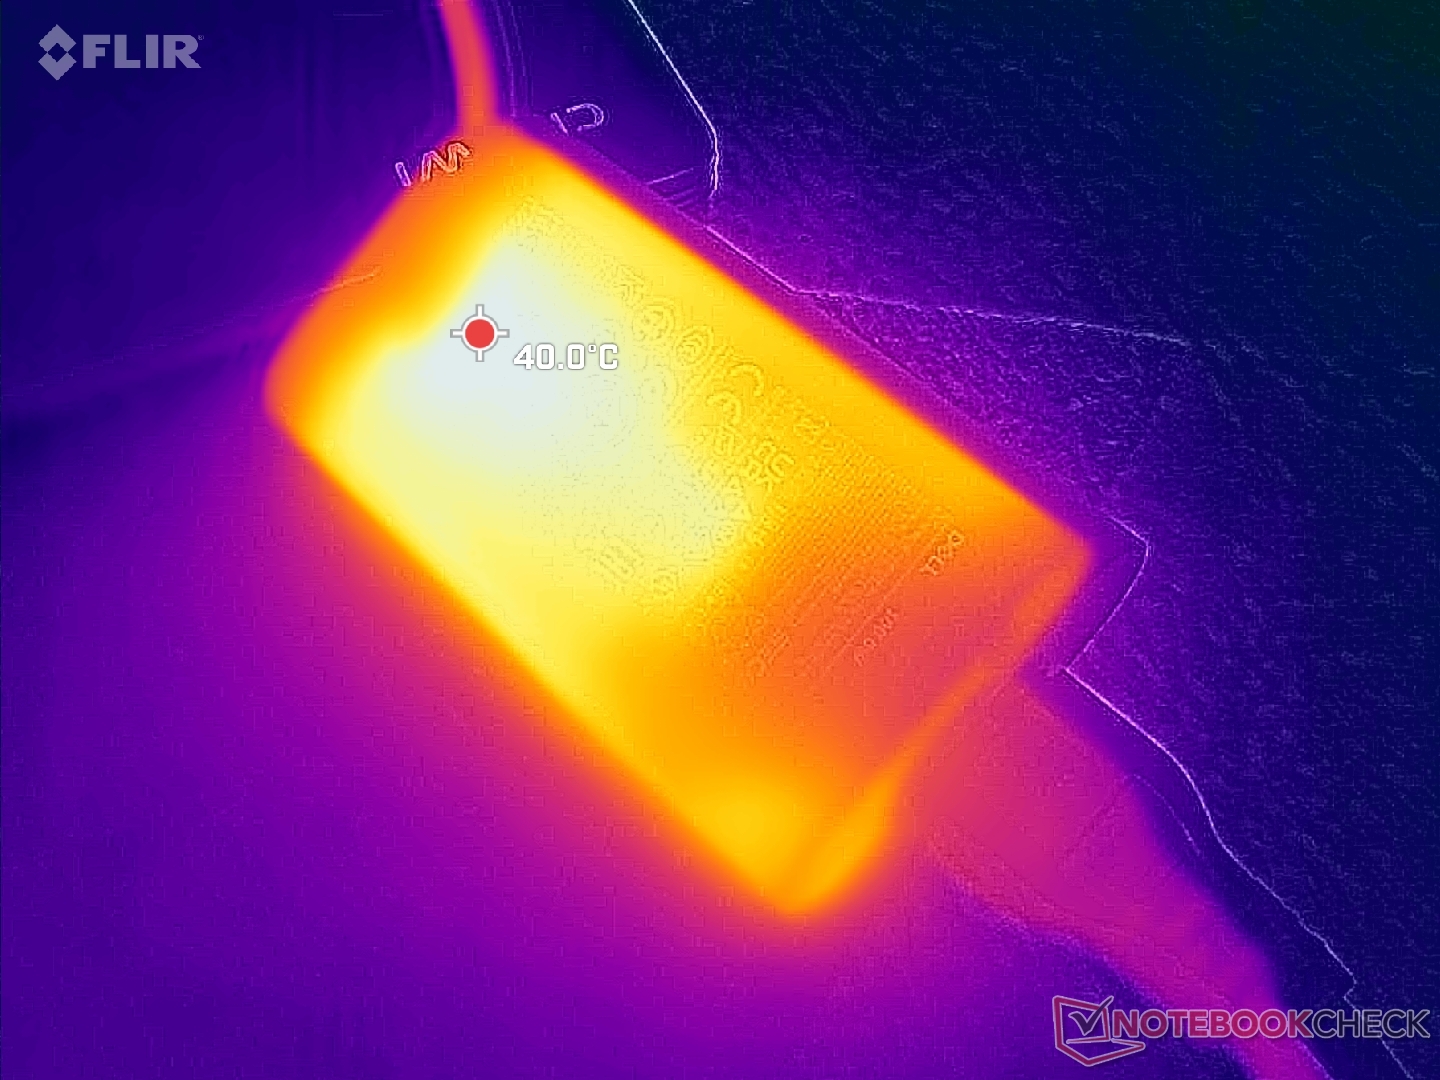
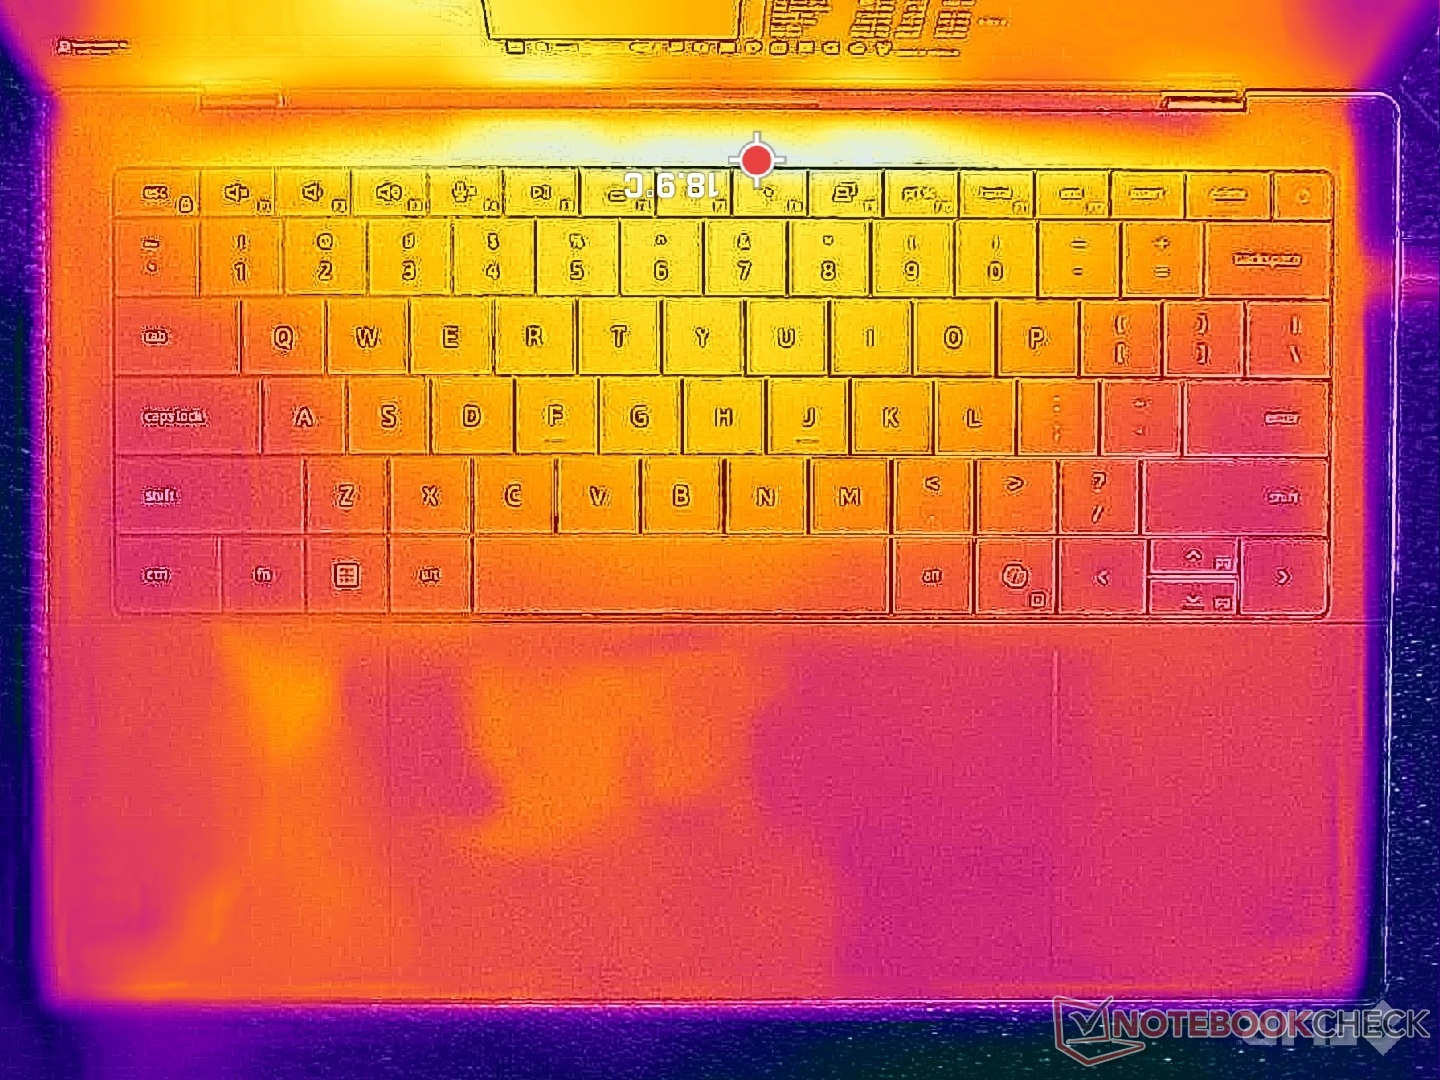
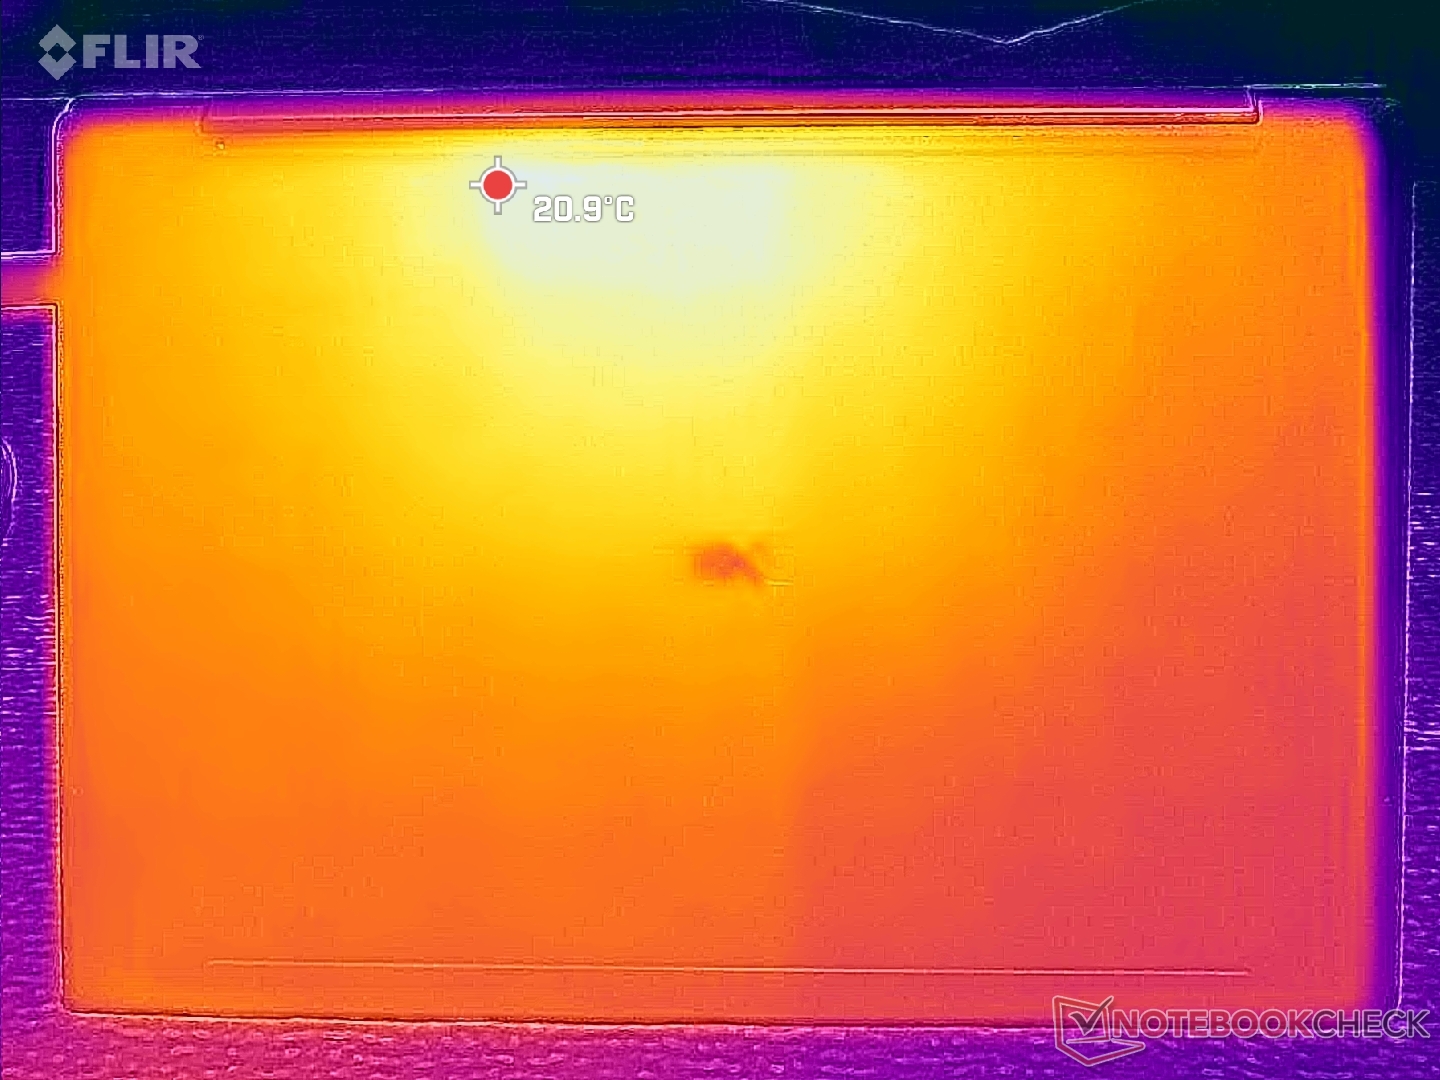
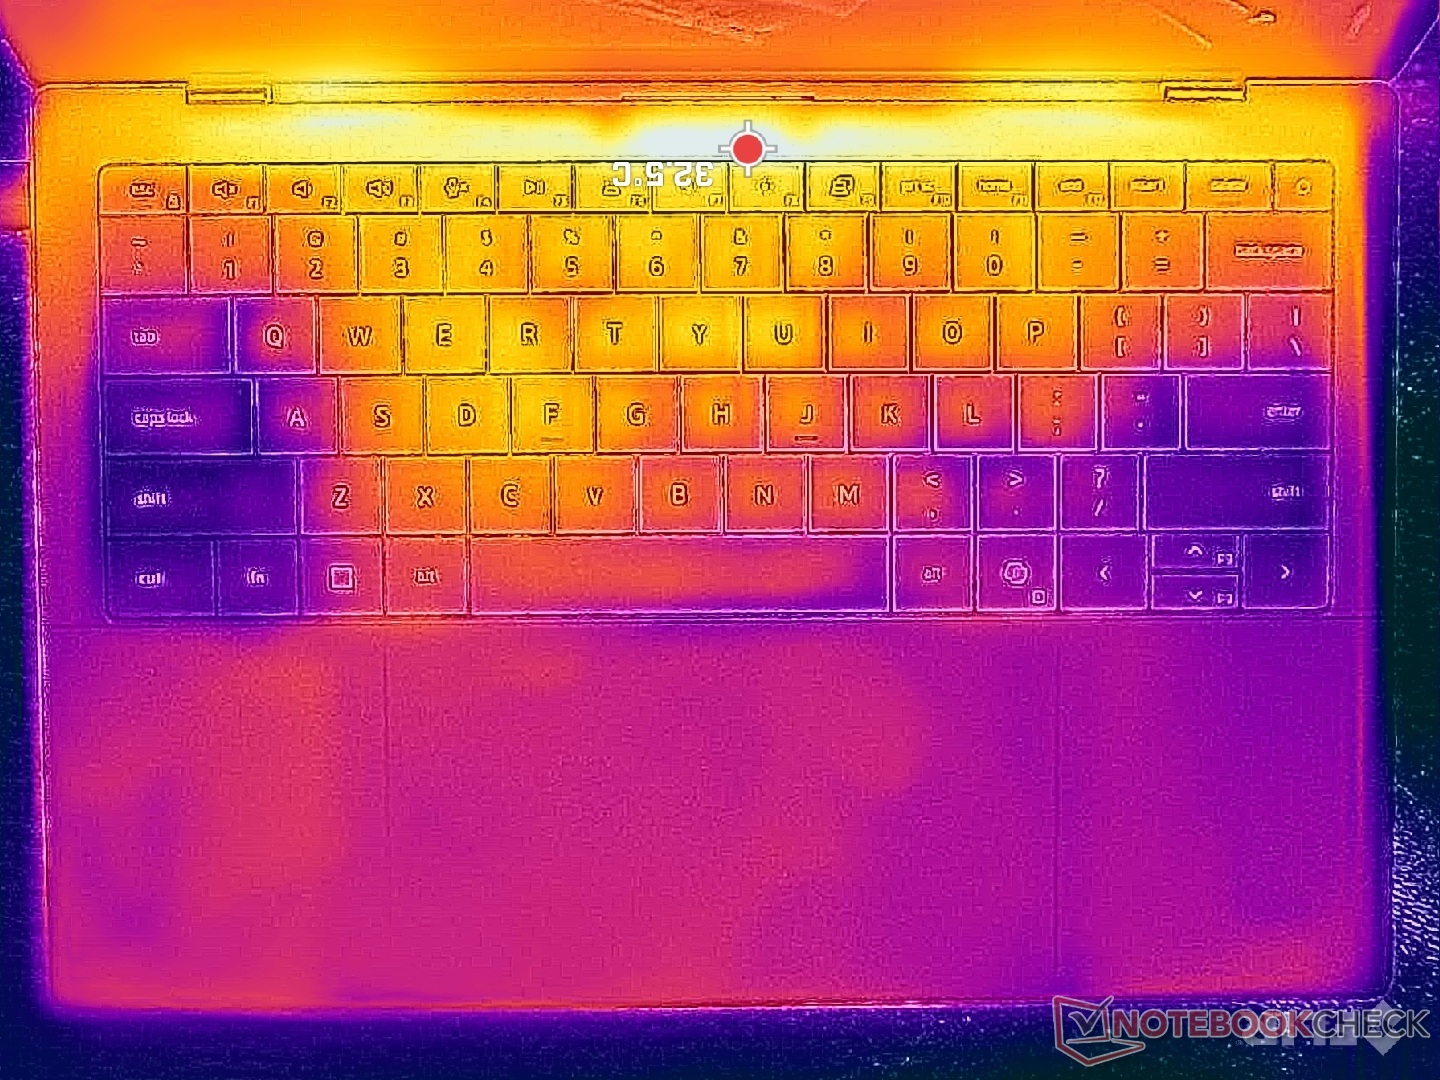
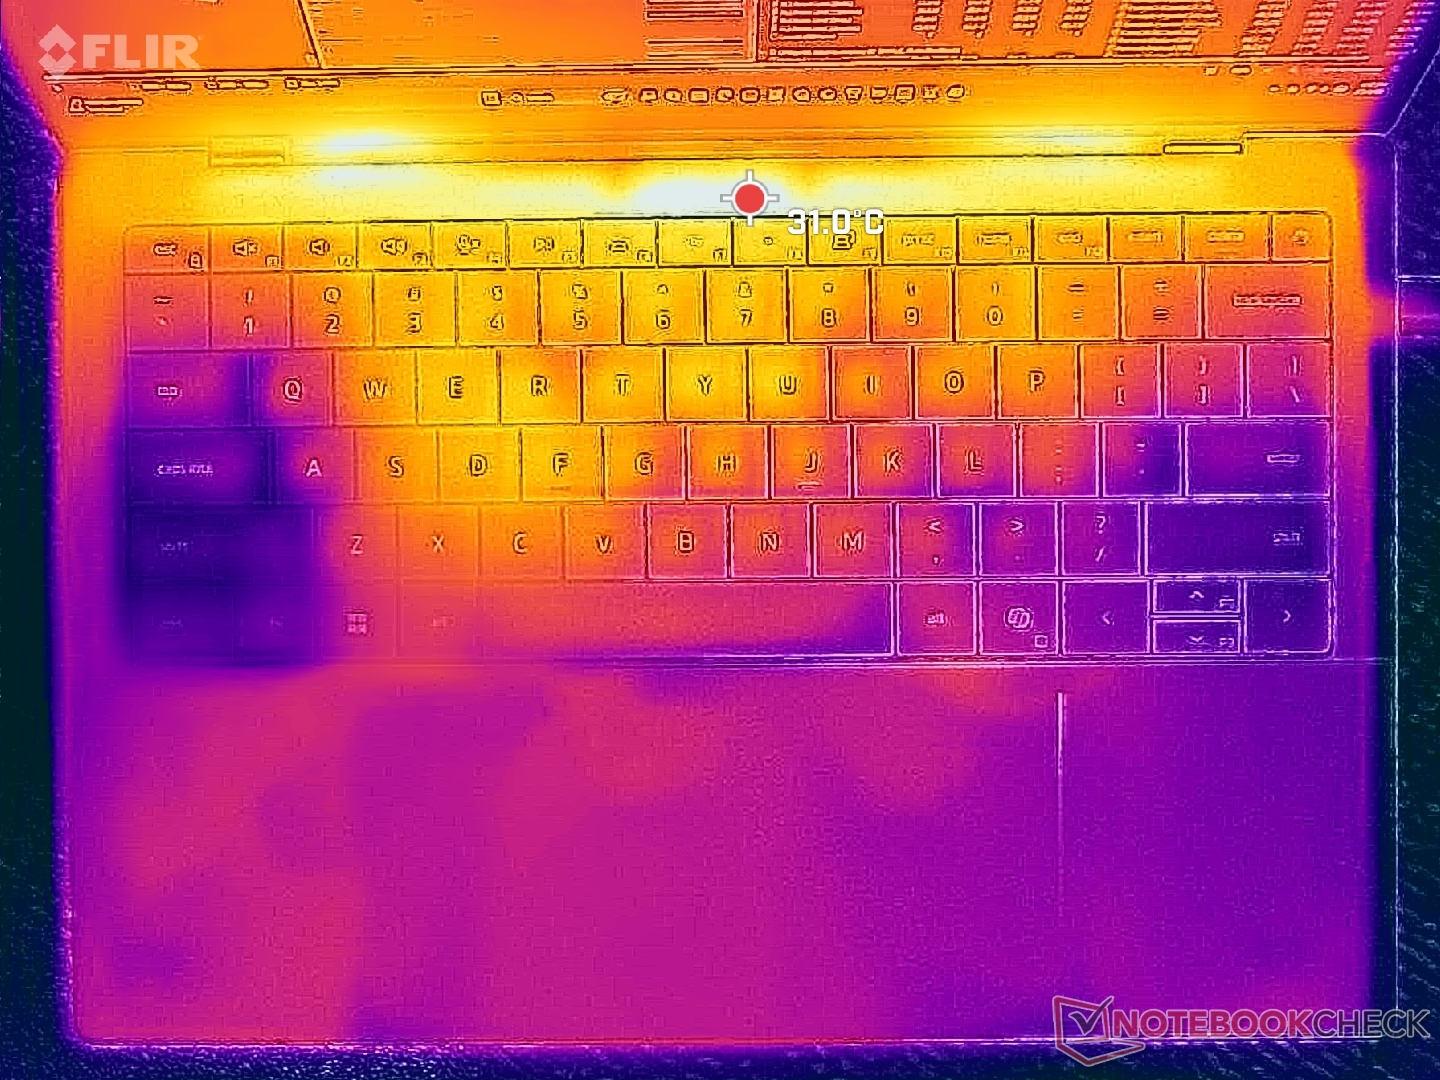
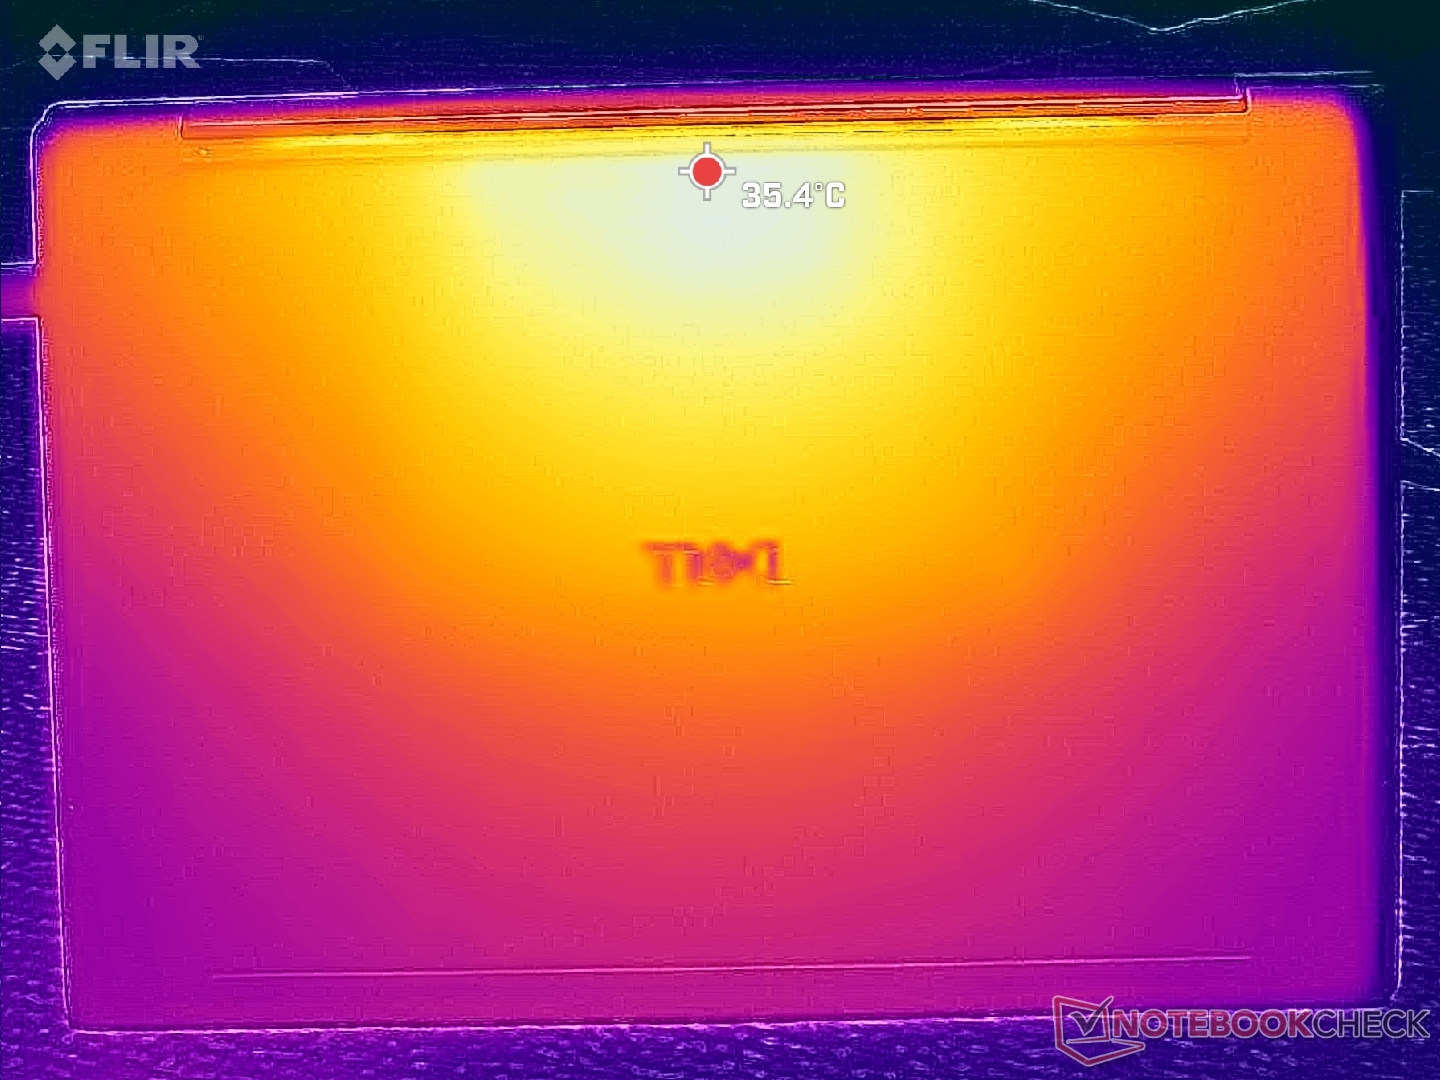
Temperatura
As temperaturas da superfície são um pouco mais quentes do que as registradas no Dell 14 Premium 2025, especialmente na parte inferior (tampa D) ao executar cargas mais exigentes. O ponto quente atingiria 36 C a 39 C em comparação com 34 C no design do ano passado. As diferenças são mínimas e não são quentes o suficiente para distrair o usuário durante o uso.
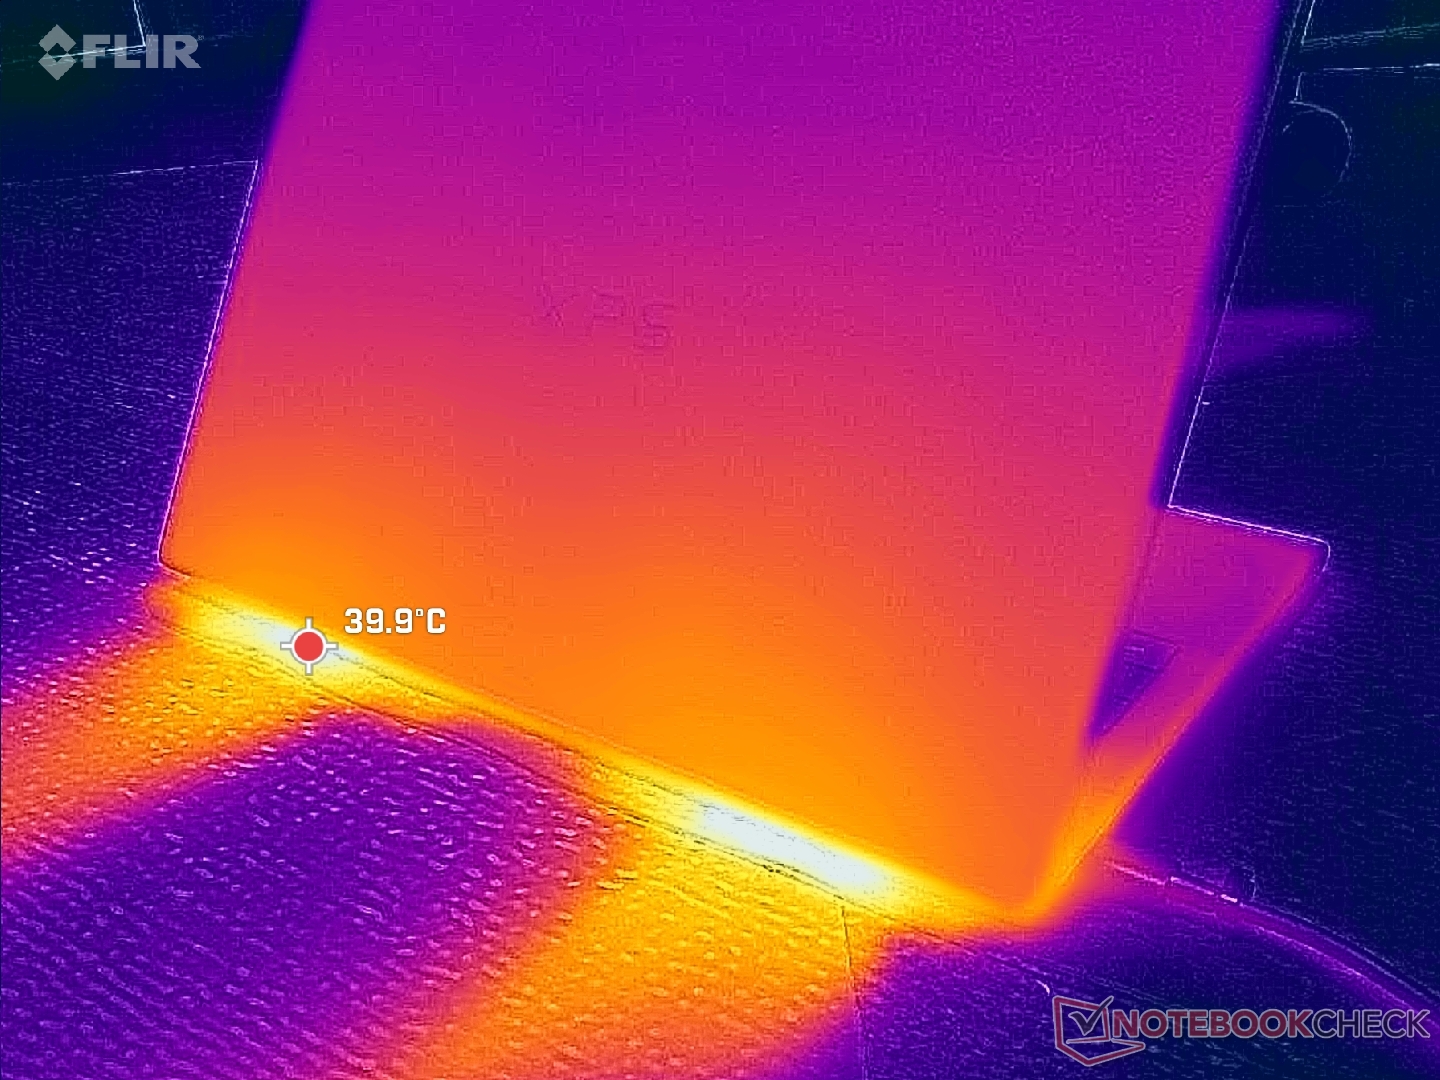
(+) A temperatura máxima no lado superior é 34 °C / 93 F, em comparação com a média de 36.8 °C / 98 F , variando de 21 a 71 °C para a classe Multimedia.
(+) A parte inferior aquece até um máximo de 35.8 °C / 96 F, em comparação com a média de 39.1 °C / 102 F
(+) Em uso inativo, a temperatura média para o lado superior é 24.6 °C / 76 F, em comparação com a média do dispositivo de 31.3 °C / ### class_avg_f### F.
(+) 3: The average temperature for the upper side is 30.1 °C / 86 F, compared to the average of 31.3 °C / 88 F for the class Multimedia.
(+) Os apoios para as mãos e o touchpad são mais frios que a temperatura da pele, com um máximo de 31.2 °C / 88.2 F e, portanto, são frios ao toque.
(-) A temperatura média da área do apoio para as mãos de dispositivos semelhantes foi 28.7 °C / 83.7 F (-2.5 °C / -4.5 F).
| Dell XPS 14 Core Ultra X7 358H Ultra X7 358H, Arc B390 Panther Lake iGPU | Dell 14 Premium Ultra 7 255H, Arc 140T | Dell XPS 14 2024 OLED Ultra 7 155H, GeForce RTX 4050 Laptop GPU | Asus ExpertBook Ultra B9406CAA Ultra X7 358H, Arc B390 Panther Lake iGPU | Lenovo Yoga Pro 7 14IAH10 Ultra 9 285H, Arc 140T | HP EliteBook X G1i 14 AI Core Ultra 7 268V, Arc 140V | |
|---|---|---|---|---|---|---|
| Heat | 2% | -12% | -4% | -8% | 5% | |
| Maximum Upper Side * (°C) | 34 | 33 3% | 40.5 -19% | 38.6 -14% | 38.1 -12% | 35 -3% |
| Maximum Bottom * (°C) | 35.8 | 33.6 6% | 42.6 -19% | 38.4 -7% | 36.5 -2% | 33.4 7% |
| Idle Upper Side * (°C) | 25.6 | 26.4 -3% | 26.9 -5% | 24.6 4% | 28.2 -10% | 23.8 7% |
| Idle Bottom * (°C) | 26.4 | 25.6 3% | 27.8 -5% | 26 2% | 28.8 -9% | 24.2 8% |
* ... menor é melhor
Teste de estresse

Ao executar o estresse do Prime95, a CPU aumentava para 3 GHz, 69 W e 100 C antes de cair para 2 GHz, 30 W e 74 C cerca de 30 segundos depois. A sustentabilidade do Turbo Boost é, portanto, limitada, o que se correlaciona com nossas observações do CineBench R15 acima. Em comparação, a mesma CPU no ExpertBook Ultra se estabilizaria em 48 W para um desempenho mais rápido do processador.
A taxa de clock e a temperatura da GPU se estabilizariam em 2000 MHz e 63 °C ao executar o Cyberpunk 2077, em comparação com 2500 MHz e 88 °C no Asus mencionado anteriormente, mesmo quando configurado no modo Ultra Performance.


| Clock médio da CPU (GHz) | Clock da GPU (MHz) | Temperatura média da CPU (°C) | |
| Sistema ocioso | -- | -- | 41 |
| Estresse do Prime95 | 2.0 | -- | 74 |
| Prime95 + FurMark Stress | 1.5 | 1350 | 67 |
| Cyberpunk 2077 Stress (Modo de desempenho) | 0.8 | 2000 | 63 |
| Cyberpunk 2077 Stress (Modo equilibrado) | 0.8 | 1950 | 62 |
Alto-falantes
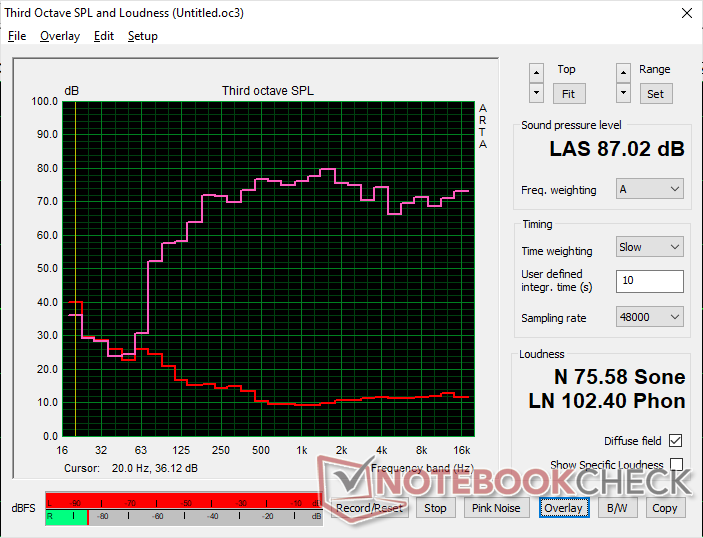

Dell XPS 14 Core Ultra X7 358H análise de áudio
(+) | os alto-falantes podem tocar relativamente alto (###valor### dB)
Graves 100 - 315Hz
(±) | graves reduzidos - em média 7.6% menor que a mediana
(+) | o baixo é linear (5.9% delta para a frequência anterior)
Médios 400 - 2.000 Hz
(+) | médios equilibrados - apenas 3.2% longe da mediana
(+) | médios são lineares (3.6% delta para frequência anterior)
Altos 2 - 16 kHz
(+) | agudos equilibrados - apenas 3.3% longe da mediana
(+) | os máximos são lineares (5.8% delta da frequência anterior)
Geral 100 - 16.000 Hz
(+) | o som geral é linear (7.3% diferença em relação à mediana)
Comparado com a mesma classe
» 6% de todos os dispositivos testados nesta classe foram melhores, 1% semelhantes, 94% piores
» O melhor teve um delta de 5%, a média foi 17%, o pior foi 45%
Comparado com todos os dispositivos testados
» 1% de todos os dispositivos testados foram melhores, 0% semelhantes, 99% piores
» O melhor teve um delta de 4%, a média foi 24%, o pior foi 134%
Apple MacBook Pro 16 2021 M1 Pro análise de áudio
(+) | os alto-falantes podem tocar relativamente alto (###valor### dB)
Graves 100 - 315Hz
(+) | bons graves - apenas 3.8% longe da mediana
(+) | o baixo é linear (5.2% delta para a frequência anterior)
Médios 400 - 2.000 Hz
(+) | médios equilibrados - apenas 1.3% longe da mediana
(+) | médios são lineares (2.1% delta para frequência anterior)
Altos 2 - 16 kHz
(+) | agudos equilibrados - apenas 1.9% longe da mediana
(+) | os máximos são lineares (2.7% delta da frequência anterior)
Geral 100 - 16.000 Hz
(+) | o som geral é linear (4.6% diferença em relação à mediana)
Comparado com a mesma classe
» 0% de todos os dispositivos testados nesta classe foram melhores, 0% semelhantes, 100% piores
» O melhor teve um delta de 5%, a média foi 17%, o pior foi 45%
Comparado com todos os dispositivos testados
» 0% de todos os dispositivos testados foram melhores, 0% semelhantes, 100% piores
» O melhor teve um delta de 4%, a média foi 24%, o pior foi 134%
Gerenciamento de energia
Consumo de energia
O desempenho gráfico por watt é um dos aspectos mais fortes do XPS 14 2026, tudo graças ao Panther Lake. A execução do Cyberpunk 2077, por exemplo, exige aproximadamente o mesmo que o XPS 14 2025 e, ainda assim, o desempenho é cerca de 80% mais rápido, o que representa uma melhoria significativa em relação ao ano anterior. No entanto, os ganhos no desempenho da CPU por watt em relação ao Core Ultra 7 255H do ano passado são relativamente pequenos.
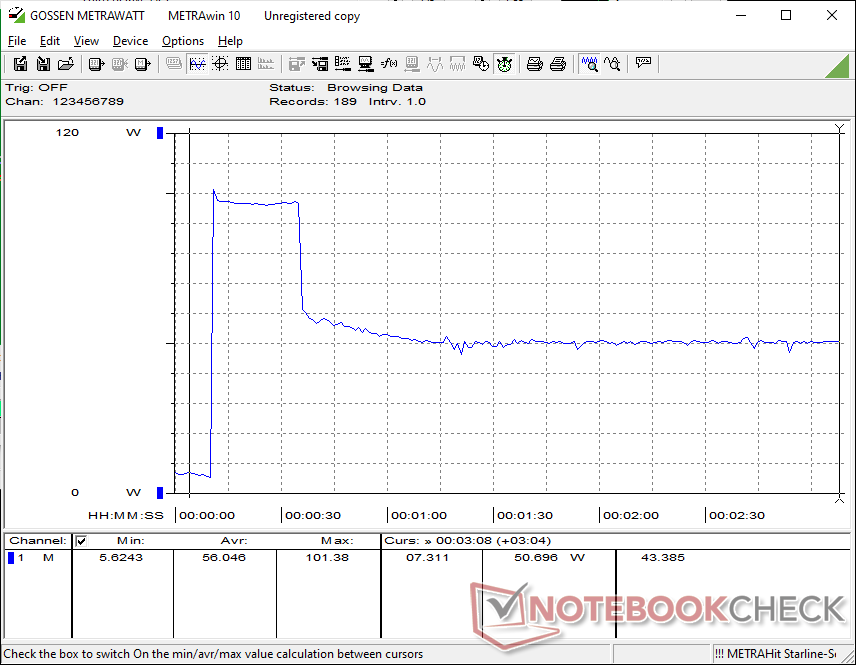
Conseguimos registrar um consumo máximo temporário de 102 W do pequeno adaptador CA USB-C de 100 W (~10,2 x 5,5 x 2,2 cm) quando a CPU está totalmente estressada, o que é muito mais alto do que no XPS 14 de 2025 em condições semelhantes. O limite máximo de energia mais alto exemplifica o limite máximo do Turbo Boost do Panther Lake-H quando comparado ao Arrow Lake-H.
| desligado | |
| Ocioso | |
| Carga |
|
Key:
min: | |
| Dell XPS 14 Core Ultra X7 358H Ultra X7 358H, Arc B390 Panther Lake iGPU, Samsung PM9C1b MZVL81T0HFLB-00BH1, OLED, 2880x1800, 14" | Dell 14 Premium Ultra 7 255H, Arc 140T, Kioxia BG6 KBG6AZNV1T02, OLED, 3200x2000, 14.5" | Dell XPS 14 2024 OLED Ultra 7 155H, GeForce RTX 4050 Laptop GPU, Samsung PM9A1 MZVL21T0HCLR, OLED, 3200x2000, 14.5" | Asus ExpertBook Ultra B9406CAA Ultra X7 358H, Arc B390 Panther Lake iGPU, Samsung PM9E1 MZVLC2T0HBLD, OLED, 2880x1800, 14" | Lenovo Yoga Pro 7 14IAH10 Ultra 9 285H, Arc 140T, WD PC SN7100S SDFPMSL-1T00-1101, OLED, 3000x1876, 14.5" | HP EliteBook X G1i 14 AI Core Ultra 7 268V, Arc 140V, Kioxia XG8 KXG80ZNV512G, IPS, 1920x1200, 14" | |
|---|---|---|---|---|---|---|
| Power Consumption | -20% | -88% | 1% | -73% | 12% | |
| Idle Minimum * (Watt) | 3.1 | 4.4 -42% | 8.1 -161% | 3.5 -13% | 7.9 -155% | 2.5 19% |
| Idle Average * (Watt) | 3.6 | 6.1 -69% | 9.9 -175% | 4 -11% | 10.5 -192% | 5.4 -50% |
| Idle Maximum * (Watt) | 10 | 13.7 -37% | 10.4 -4% | 5.3 47% | 10.8 -8% | 5.8 42% |
| Load Average * (Watt) | 39.2 | 53.8 -37% | 75.6 -93% | 43.7 -11% | 64 -63% | 36.9 6% |
| Cyberpunk 2077 ultra * (Watt) | 51.4 | 50.7 1% | 61.3 -19% | 76.3 -48% | 48.5 6% | |
| Cyberpunk 2077 ultra external monitor * (Watt) | 51.2 | 46.5 9% | 61.4 -20% | 72.6 -42% | 44.9 12% | |
| Load Maximum * (Watt) | 101.4 | 62.7 38% | 107.1 -6% | 63.4 37% | 103.2 -2% | 54.6 46% |
| Witcher 3 ultra * (Watt) | 65.6 |
* ... menor é melhor
Consumo de energia Cyberpunk / Teste de estresse
Consumo de energia do monitor externo
Duração da bateria

O tempo de execução da WLAN dura quase 17 horas no modo balanceado, o que é muito próximo do que registramos no ExpertBook Ultra equipado de forma semelhante. No entanto, observe que o Windows VRR não é ativado automaticamente para uma taxa de atualização fixa padrão de 120 Hz; a ativação manual reduziria a taxa de atualização para apenas 20 Hz quando estático para tempos de execução potencialmente mais longos.
O carregamento de uma carga vazia até a capacidade total com o adaptador CA incluído leva de 1,5 a 2 horas.
| Dell XPS 14 Core Ultra X7 358H Ultra X7 358H, Arc B390 Panther Lake iGPU, 70 Wh | Dell 14 Premium Ultra 7 255H, Arc 140T, 69.5 Wh | Dell XPS 14 2024 OLED Ultra 7 155H, GeForce RTX 4050 Laptop GPU, 69.5 Wh | Asus ExpertBook Ultra B9406CAA Ultra X7 358H, Arc B390 Panther Lake iGPU, 70 Wh | Lenovo Yoga Pro 7 14IAH10 Ultra 9 285H, Arc 140T, 84 Wh | HP EliteBook X G1i 14 AI Core Ultra 7 268V, Arc 140V, 68 Wh | |
|---|---|---|---|---|---|---|
| Duração da bateria | -36% | -54% | -4% | -39% | 10% | |
| WiFi v1.3 (h) | 16.8 | 10.8 -36% | 7.8 -54% | 16.1 -4% | 10.3 -39% | 18.5 10% |
| H.264 (h) | 10.6 | |||||
| Load (h) | 1.3 |
Classificação do Notebookcheck
O XPS 14 2026 é uma melhoria significativa em relação ao design da geração anterior, especialmente em termos de desempenho por watt, mas a facilidade de manutenção sofre um pequeno impacto.
Dell XPS 14 Core Ultra X7 358H
- 02/07/2026 v8
Allen Ngo
 Total Sustainability Score:
 Concorrentes potenciais em comparação
Imagem | Modelo / Análises | Preço | Peso | Altura | Tela |
|---|---|---|---|---|---|
1. 87.4%  | Dell XPS 14 Core Ultra X7 358H Intel Core Ultra X7 358H ⎘ Intel Arc B390 12 Xe3 Panther Lake iGPU ⎘ 32 GB Memória, 1000 GB SSD | Amazon: 1. $1,795.49 Dell XPS 14 Premium Laptop D... 2. $2,049.00 Dell XPS 14 9440 14.5" Noteb... 3. $2,099.99 Dell XPS 16 9640 Laptop | In... Preço de tabela: 2200 USD | 1.4 kg | 14.62 mm | 14.00" 2880x1800 243 PPI OLED |
2. 82.5%  | Dell 14 Premium Intel Core Ultra 7 255H ⎘ Intel Arc Graphics 140T ⎘ 32 GB Memória, 1024 GB SSD | Amazon: Preço de tabela: 1950 USD | 1.7 kg | 18 mm | 14.50" 3200x2000 260 PPI OLED |
3. 86.3% v7 (old)  | Dell XPS 14 2024 OLED Intel Core Ultra 7 155H ⎘ NVIDIA GeForce RTX 4050 Laptop GPU ⎘ 32 GB Memória, 1024 GB SSD | Amazon: Preço de tabela: 2949€ | 1.8 kg | 19 mm | 14.50" 3200x2000 260 PPI OLED |
4. 87.6%  | Asus ExpertBook Ultra B9406CAA Intel Core Ultra X7 358H ⎘ Intel Arc B390 12 Xe3 Panther Lake iGPU ⎘ 32 GB Memória, 2048 GB SSD | Amazon: | 1.1 kg | 15.9 mm | 14.00" 2880x1800 243 PPI OLED |
5. 87.3%  | Lenovo Yoga Pro 7 14IAH10 Intel Core Ultra 9 285H ⎘ Intel Arc Graphics 140T ⎘ 32 GB Memória, 1024 GB SSD | Amazon: Preço de tabela: 1500€ | 1.6 kg | 18.9 mm | 14.50" 3000x1876 244 PPI OLED |
6. 85.1%  | HP EliteBook X G1i 14 AI Intel Core Ultra 7 268V ⎘ Intel Arc Graphics 140V ⎘ 32 GB Memória, 512 GB SSD | Amazon: Preço de tabela: 3300 USD | 1.2 kg | 15 mm | 14.00" 1920x1200 162 PPI IPS |
Transparência
A seleção dos dispositivos a serem analisados é feita pela nossa equipe editorial. A amostra de teste foi fornecida ao autor como empréstimo pelo fabricante ou varejista para fins desta revisão. O credor não teve influência nesta revisão, nem o fabricante recebeu uma cópia desta revisão antes da publicação. Não houve obrigação de publicar esta revisão. Como empresa de mídia independente, a Notebookcheck não está sujeita à autoridade de fabricantes, varejistas ou editores.
É assim que o Notebookcheck está testando
Todos os anos, o Notebookcheck analisa de forma independente centenas de laptops e smartphones usando procedimentos padronizados para garantir que todos os resultados sejam comparáveis. Desenvolvemos continuamente nossos métodos de teste há cerca de 20 anos e definimos padrões da indústria no processo. Em nossos laboratórios de teste, equipamentos de medição de alta qualidade são utilizados por técnicos e editores experientes. Esses testes envolvem um processo de validação em vários estágios. Nosso complexo sistema de classificação é baseado em centenas de medições e benchmarks bem fundamentados, o que mantém a objetividade.
