Veredicto — Desempenho puro com apenas alguns luxos mínimos
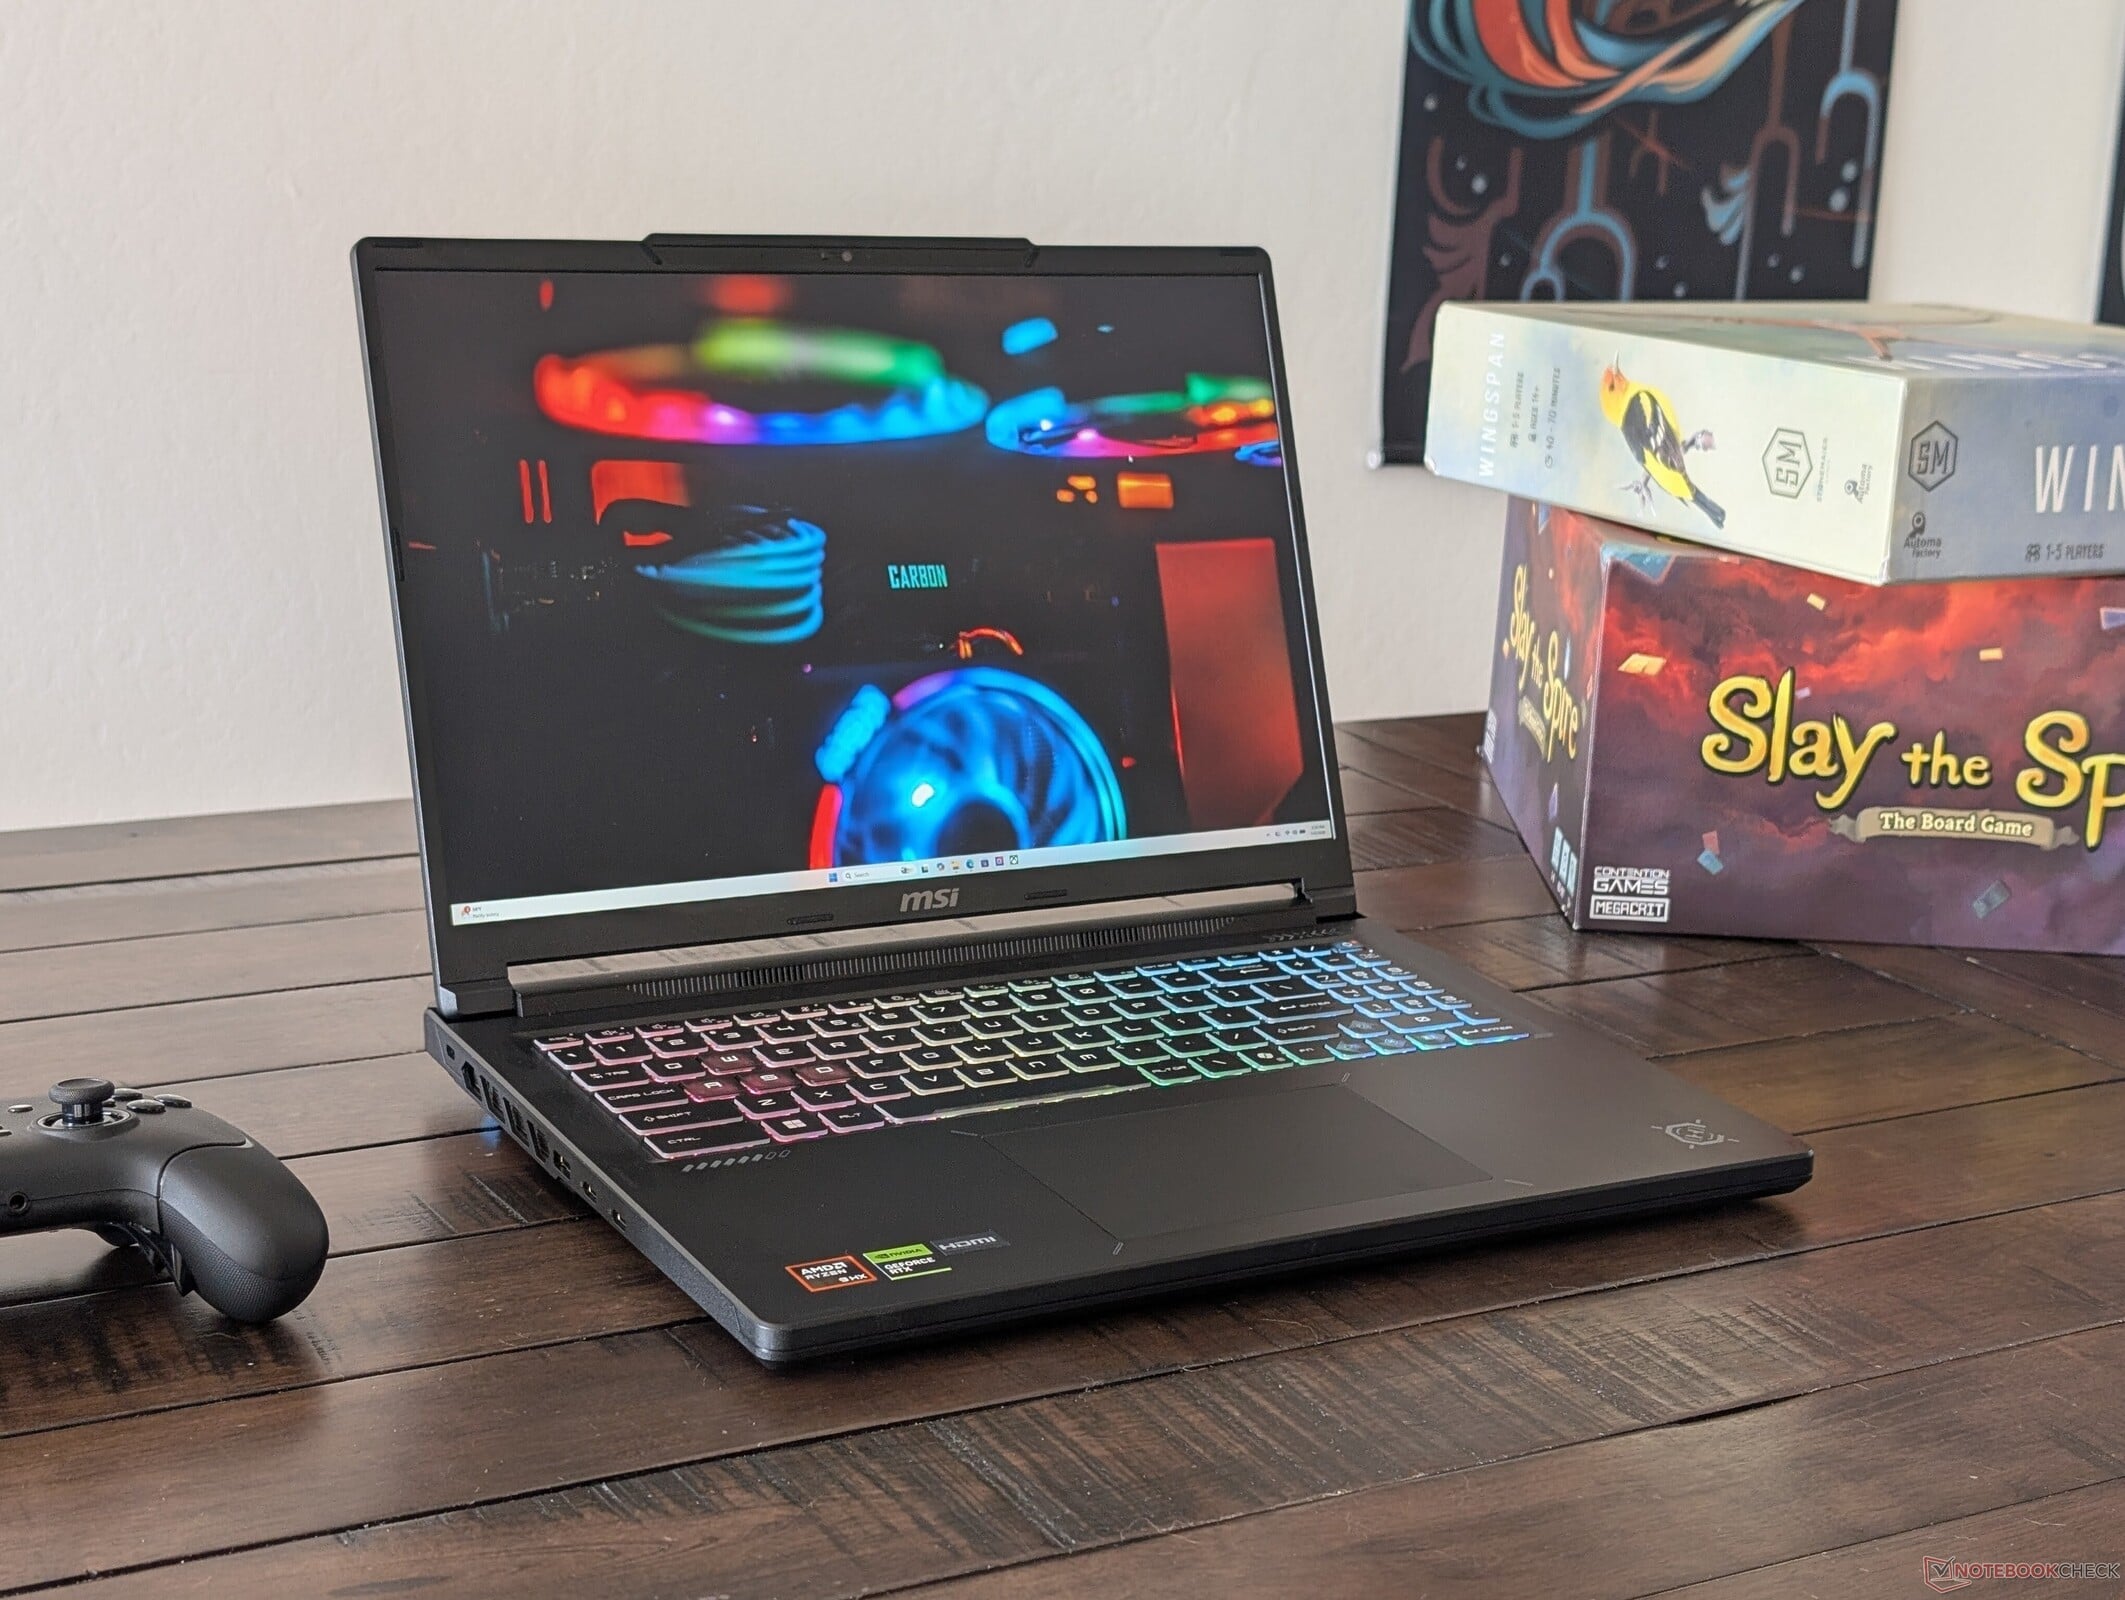
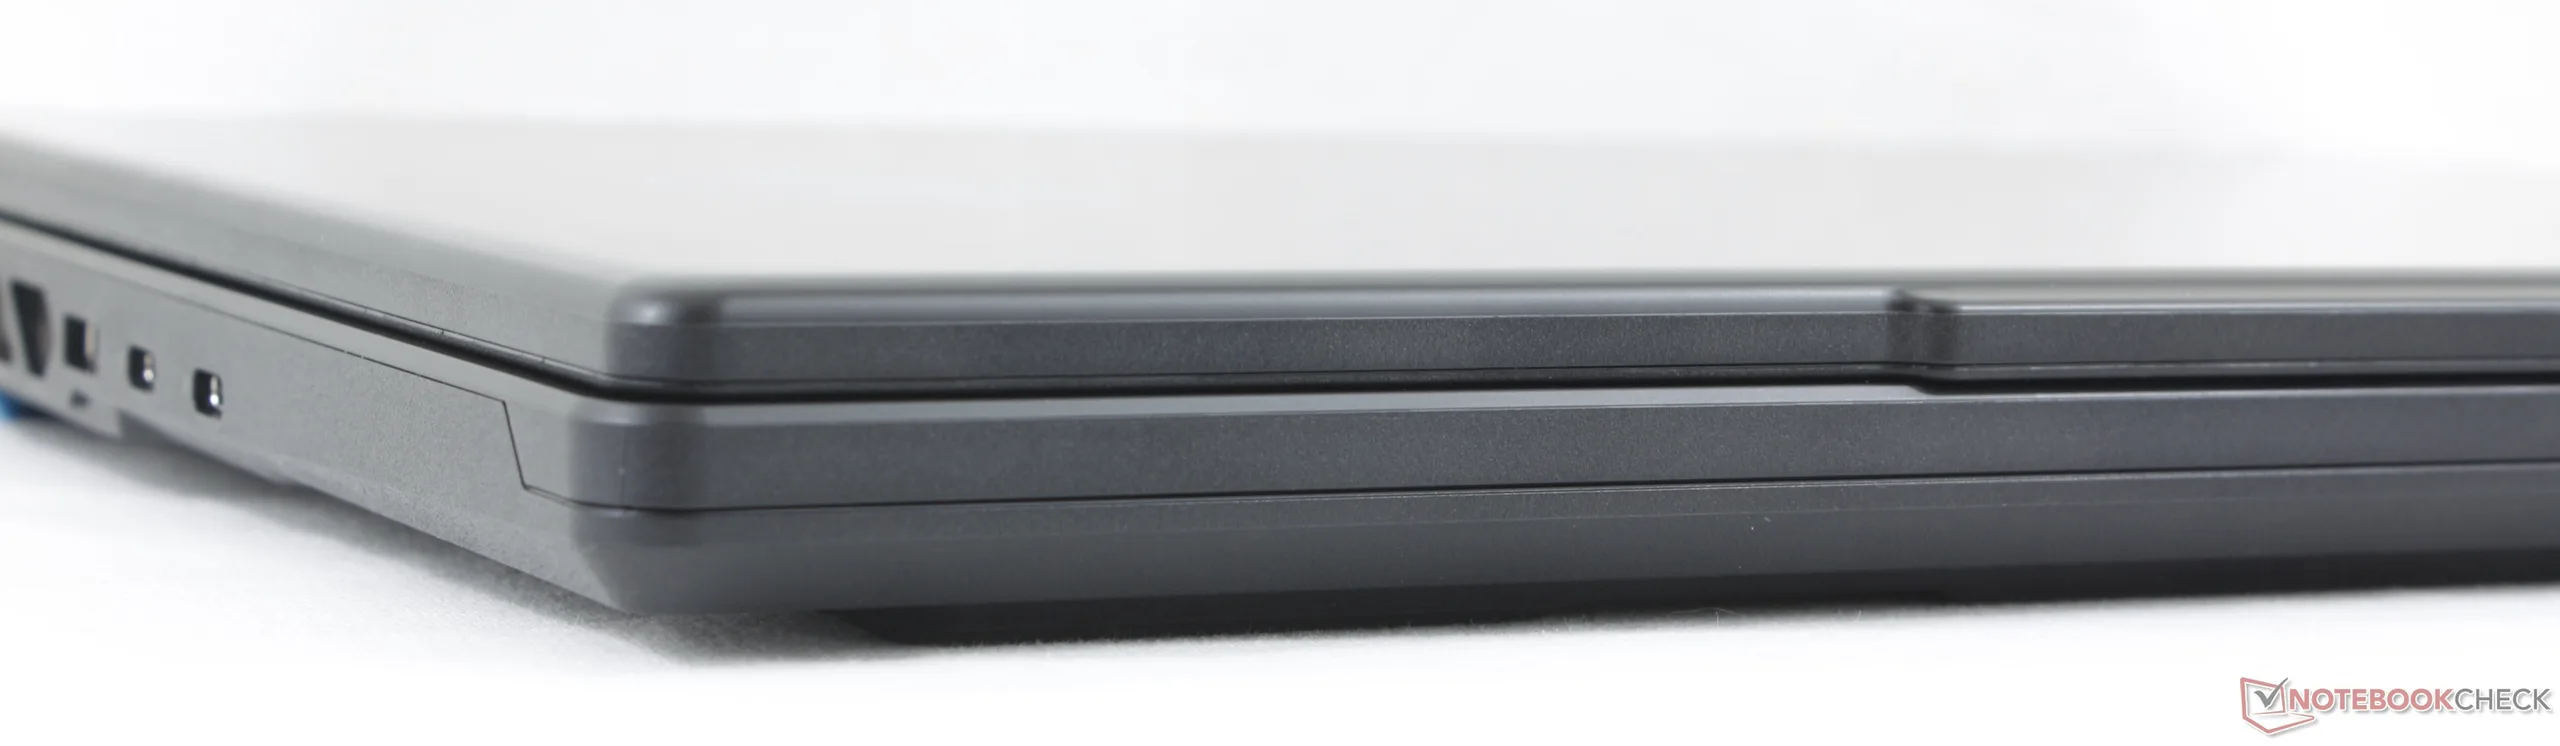
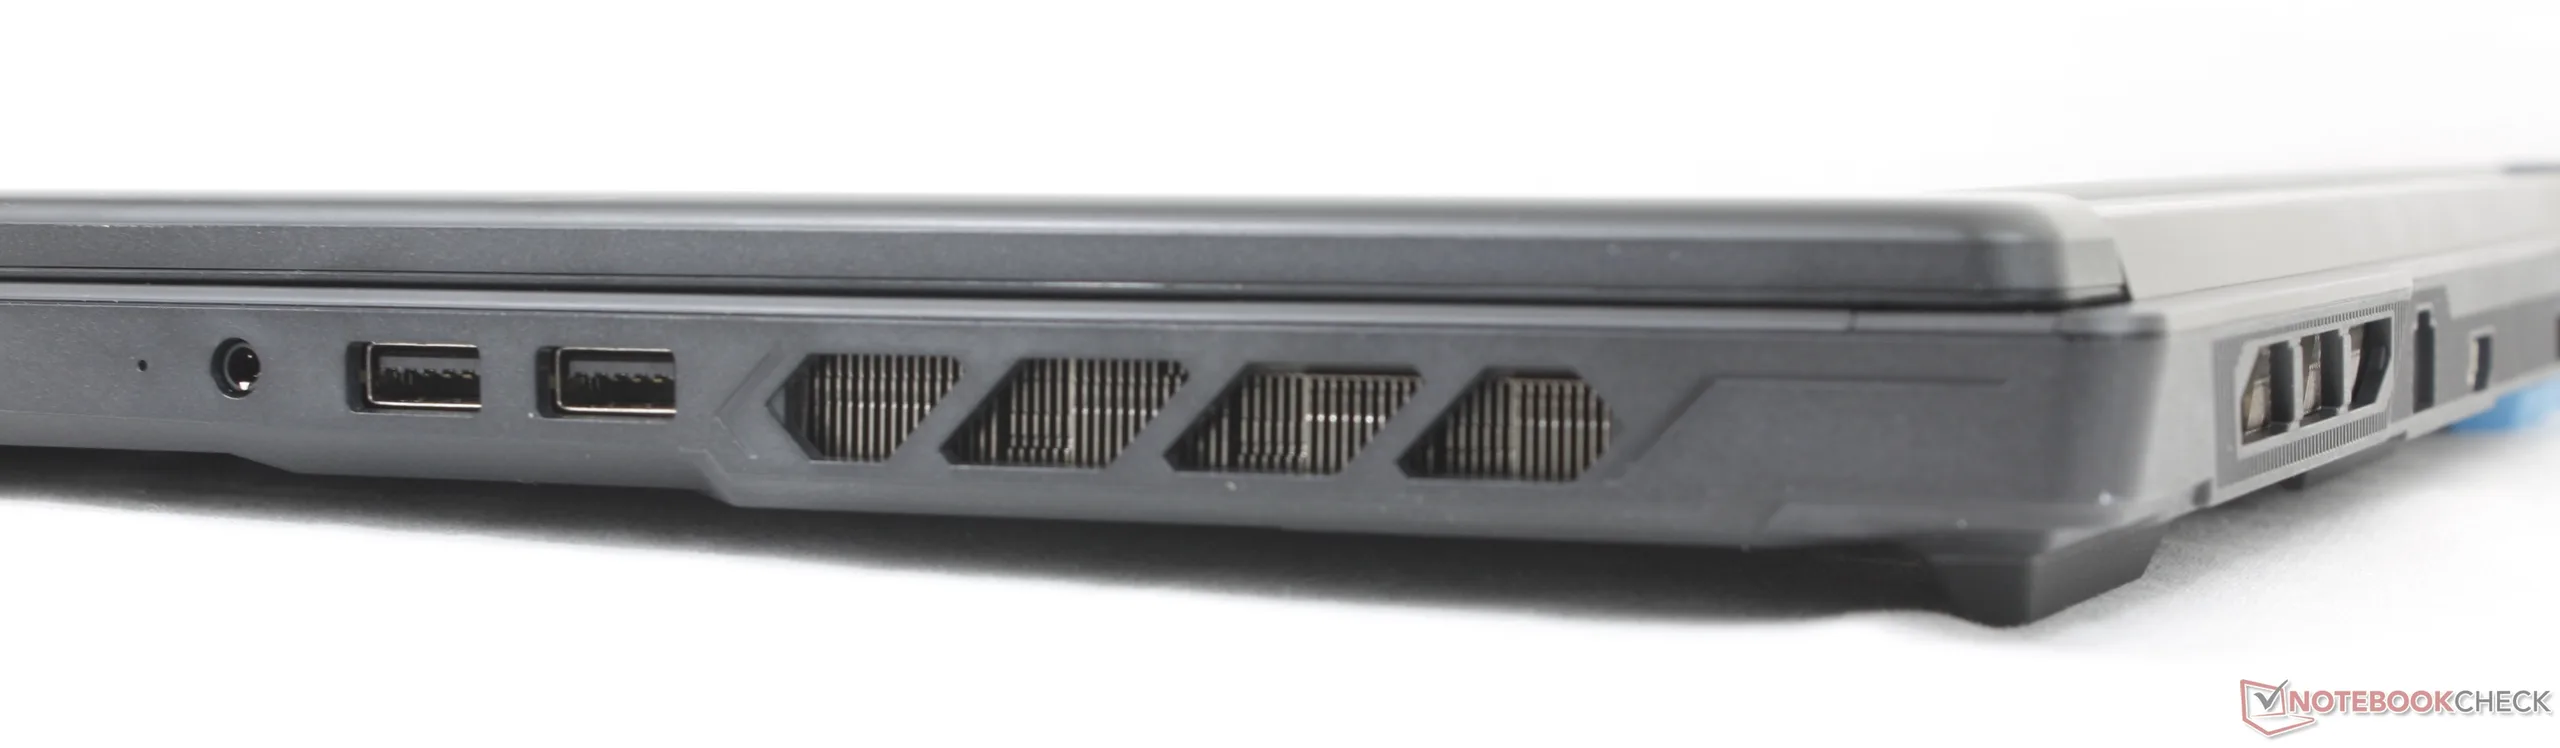
O Crosshair A16 HX se destaca pelo desempenho, especialmente para um notebook gamer de gama média com processador AMD e placa de vídeo NVIDIA. Apesar de funcionar com uma plataforma Zen 4 mais antiga, o Ryzen 9 8940HX supera o desempenho do mais recente processador Ryzen AI 9 470 Zen 5, mantendo-se dentro de uma margem de 5 a 10 por cento do mais caro Intel Core Ultra 9 275HX. As atualizações físicas no chassi também representam um passo na direção certa, já que o sistema oferece mais portas, um clickpad maior e um design ligeiramente mais fino e leve do que o Crosshair 16 HX , para facilitar o transporte.
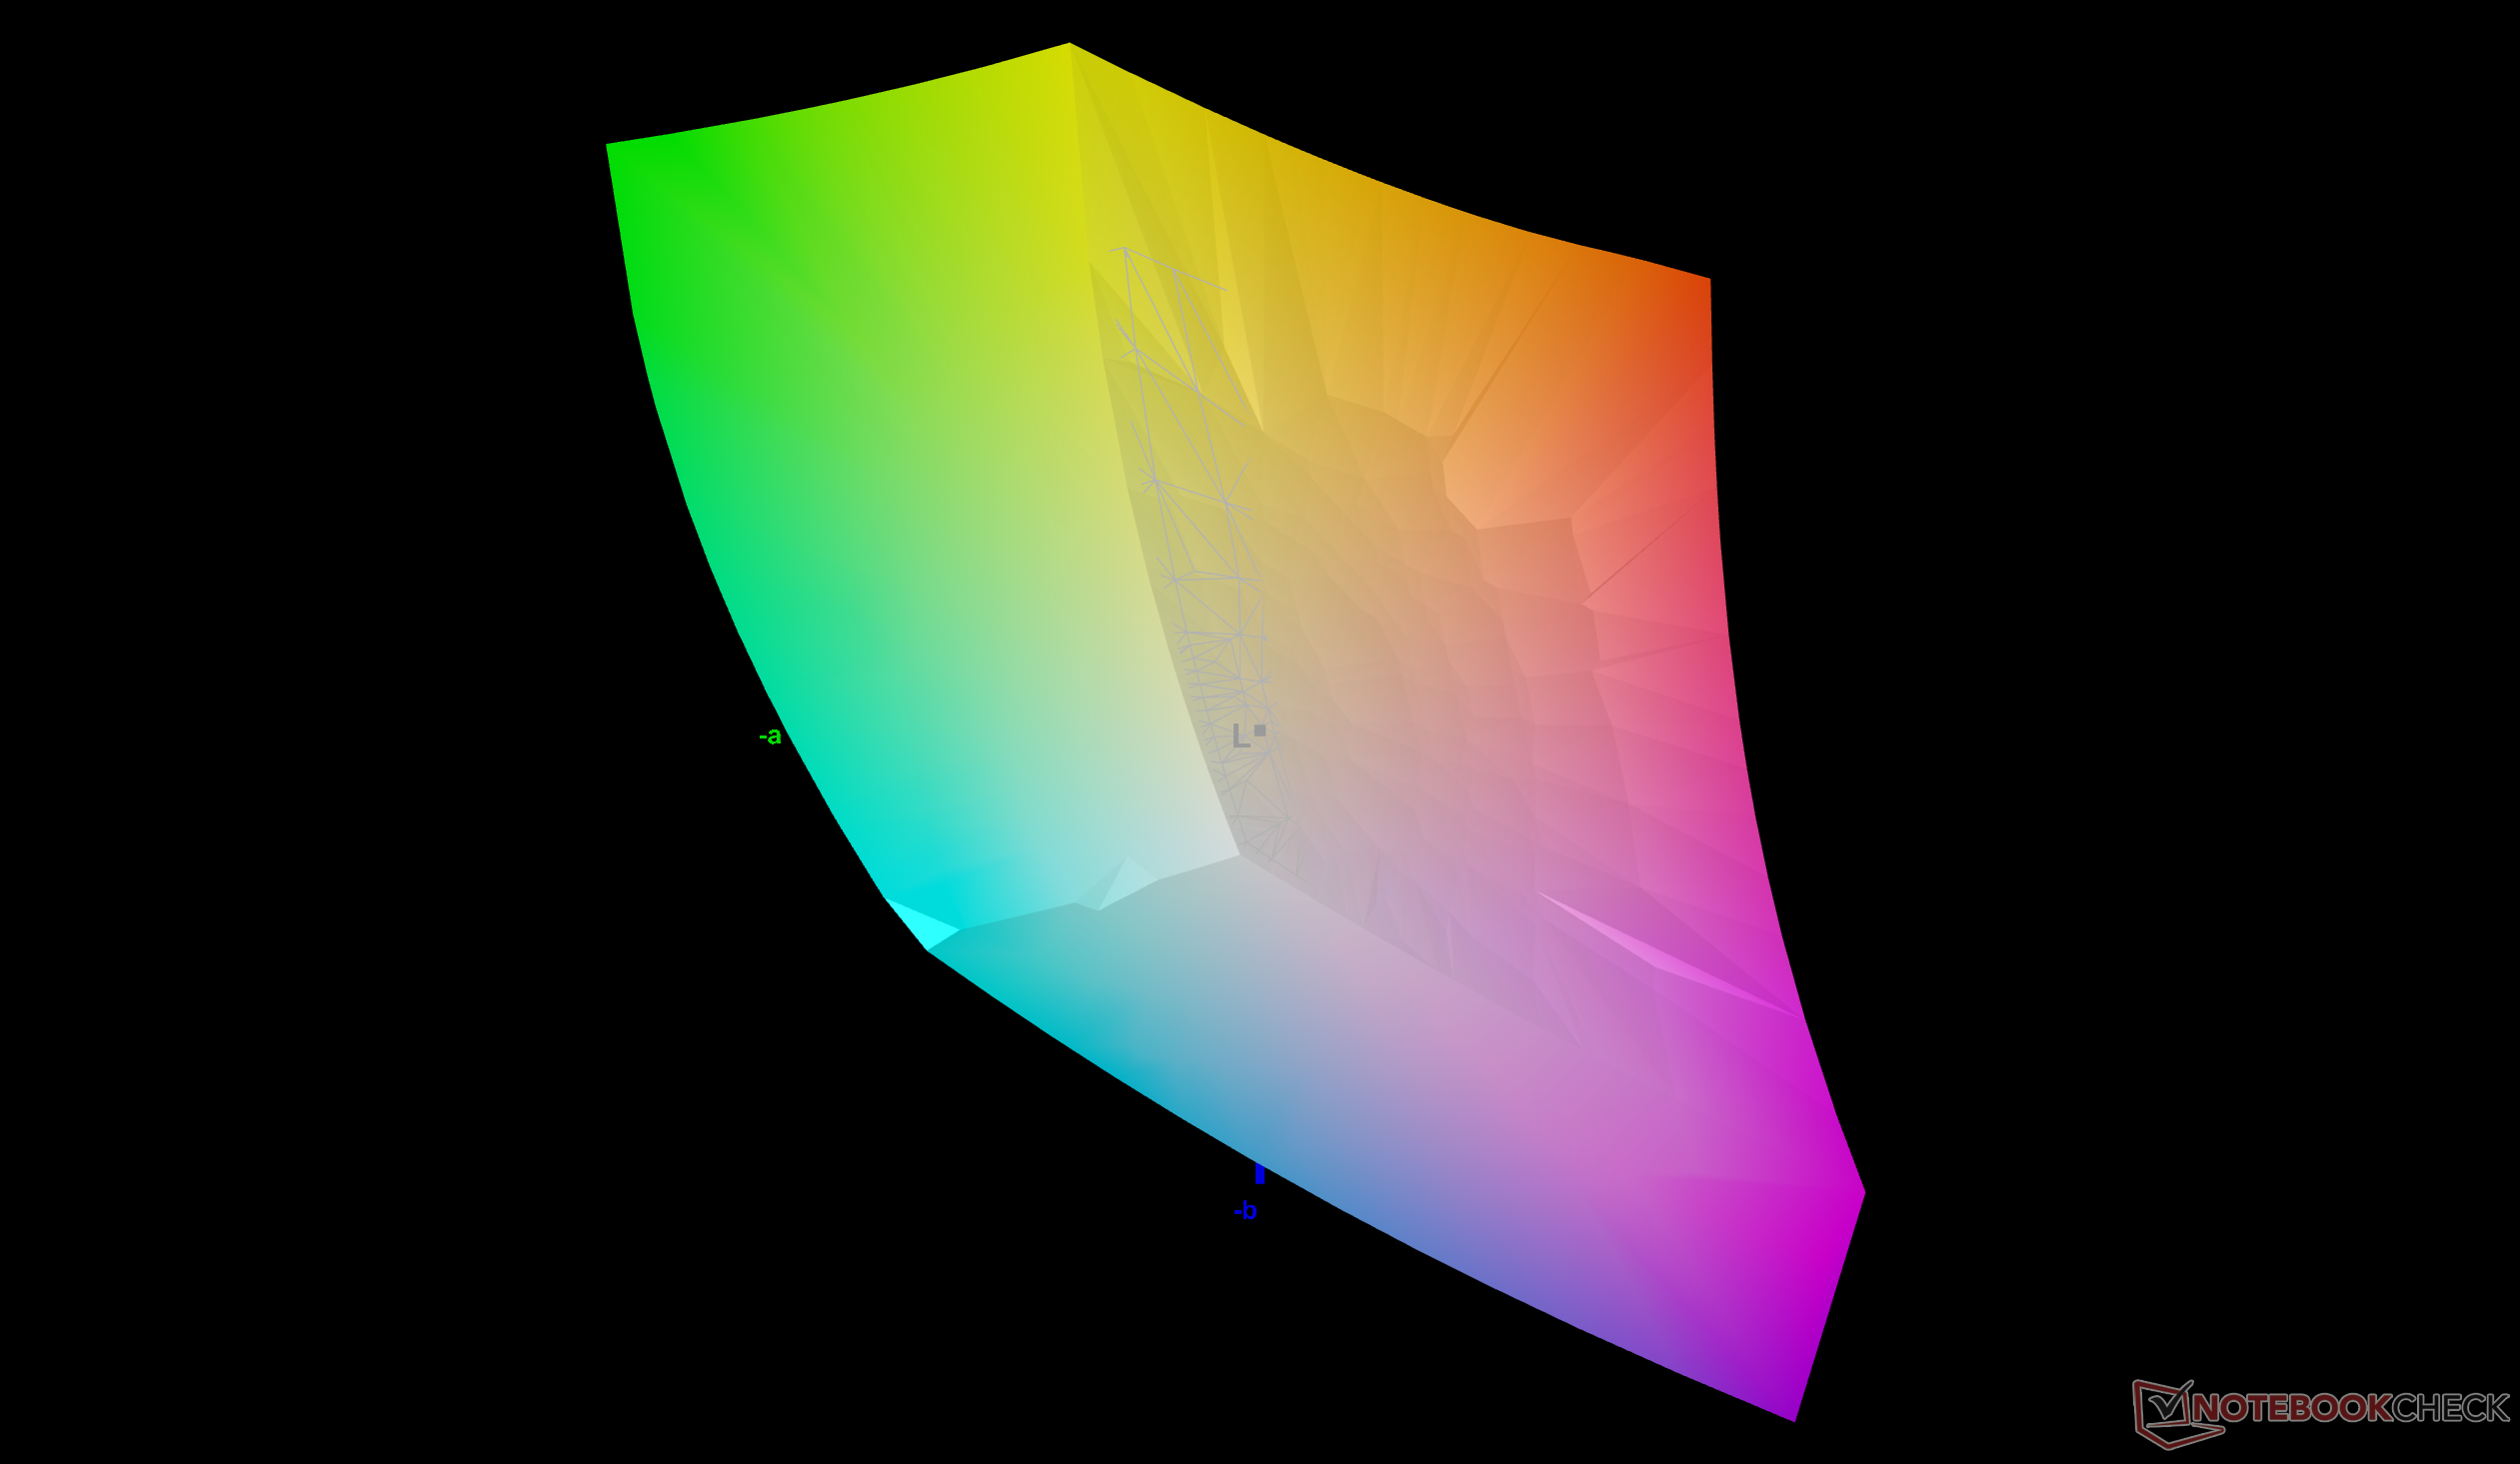
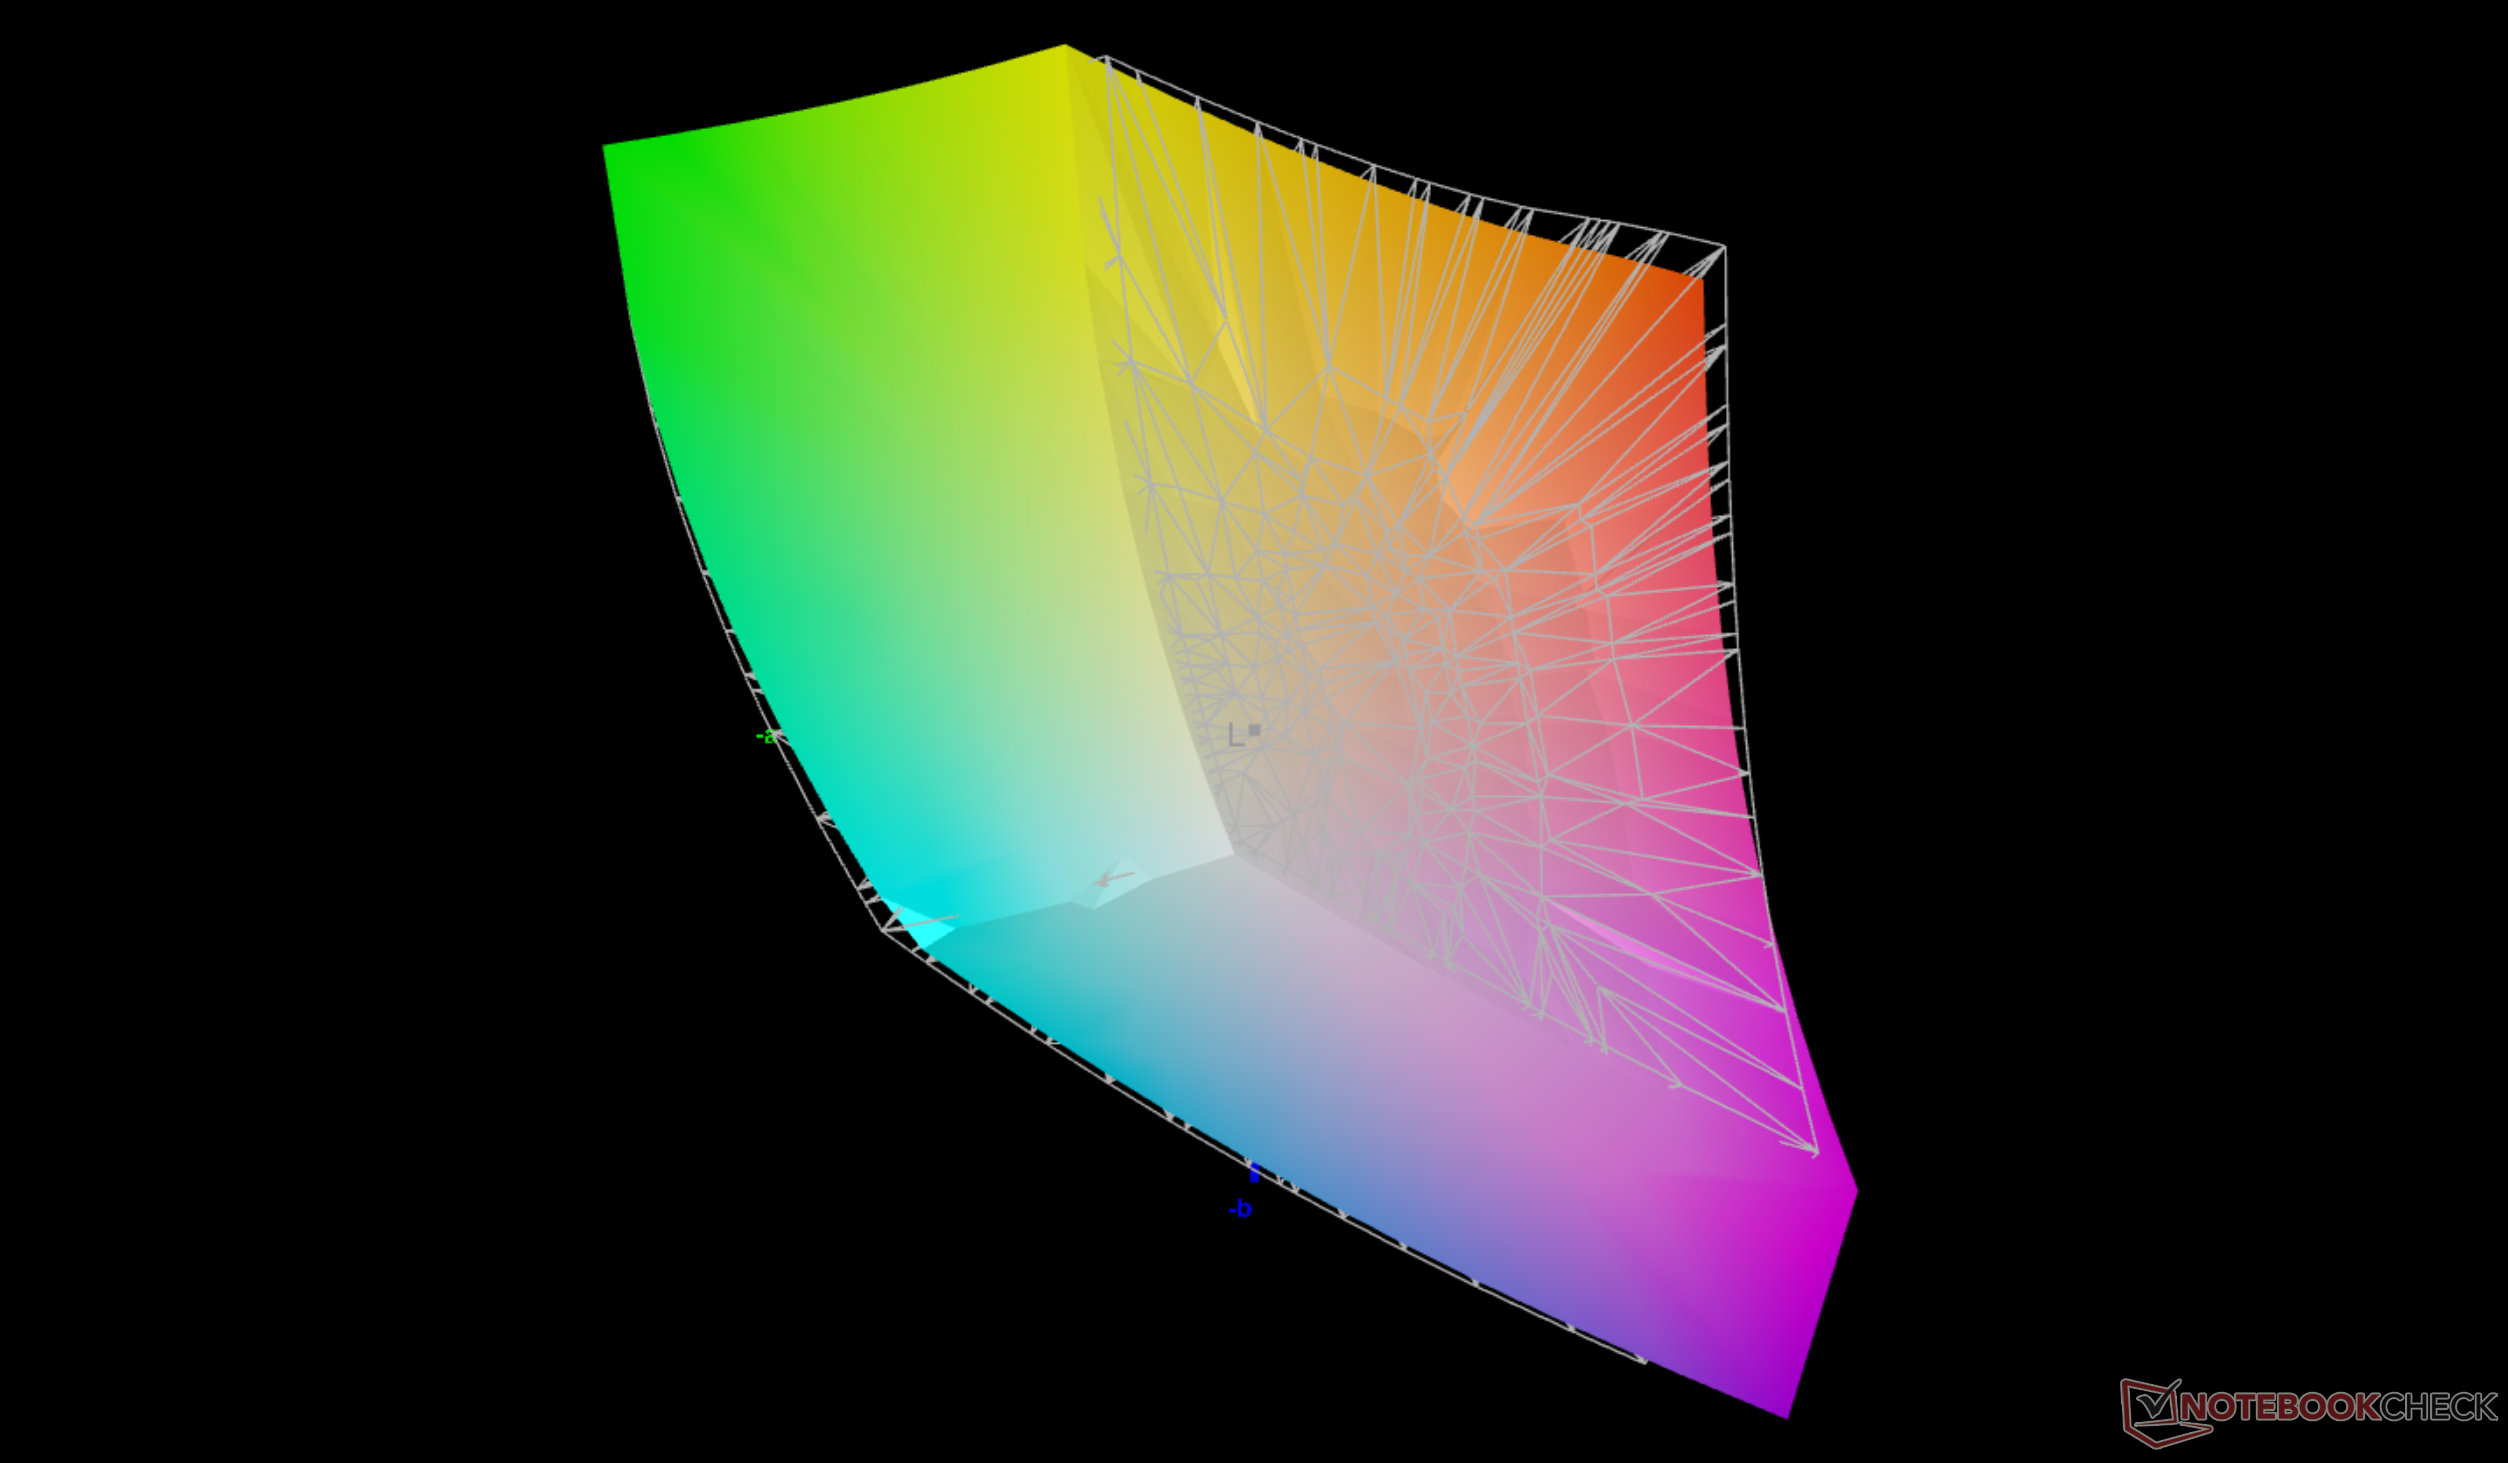
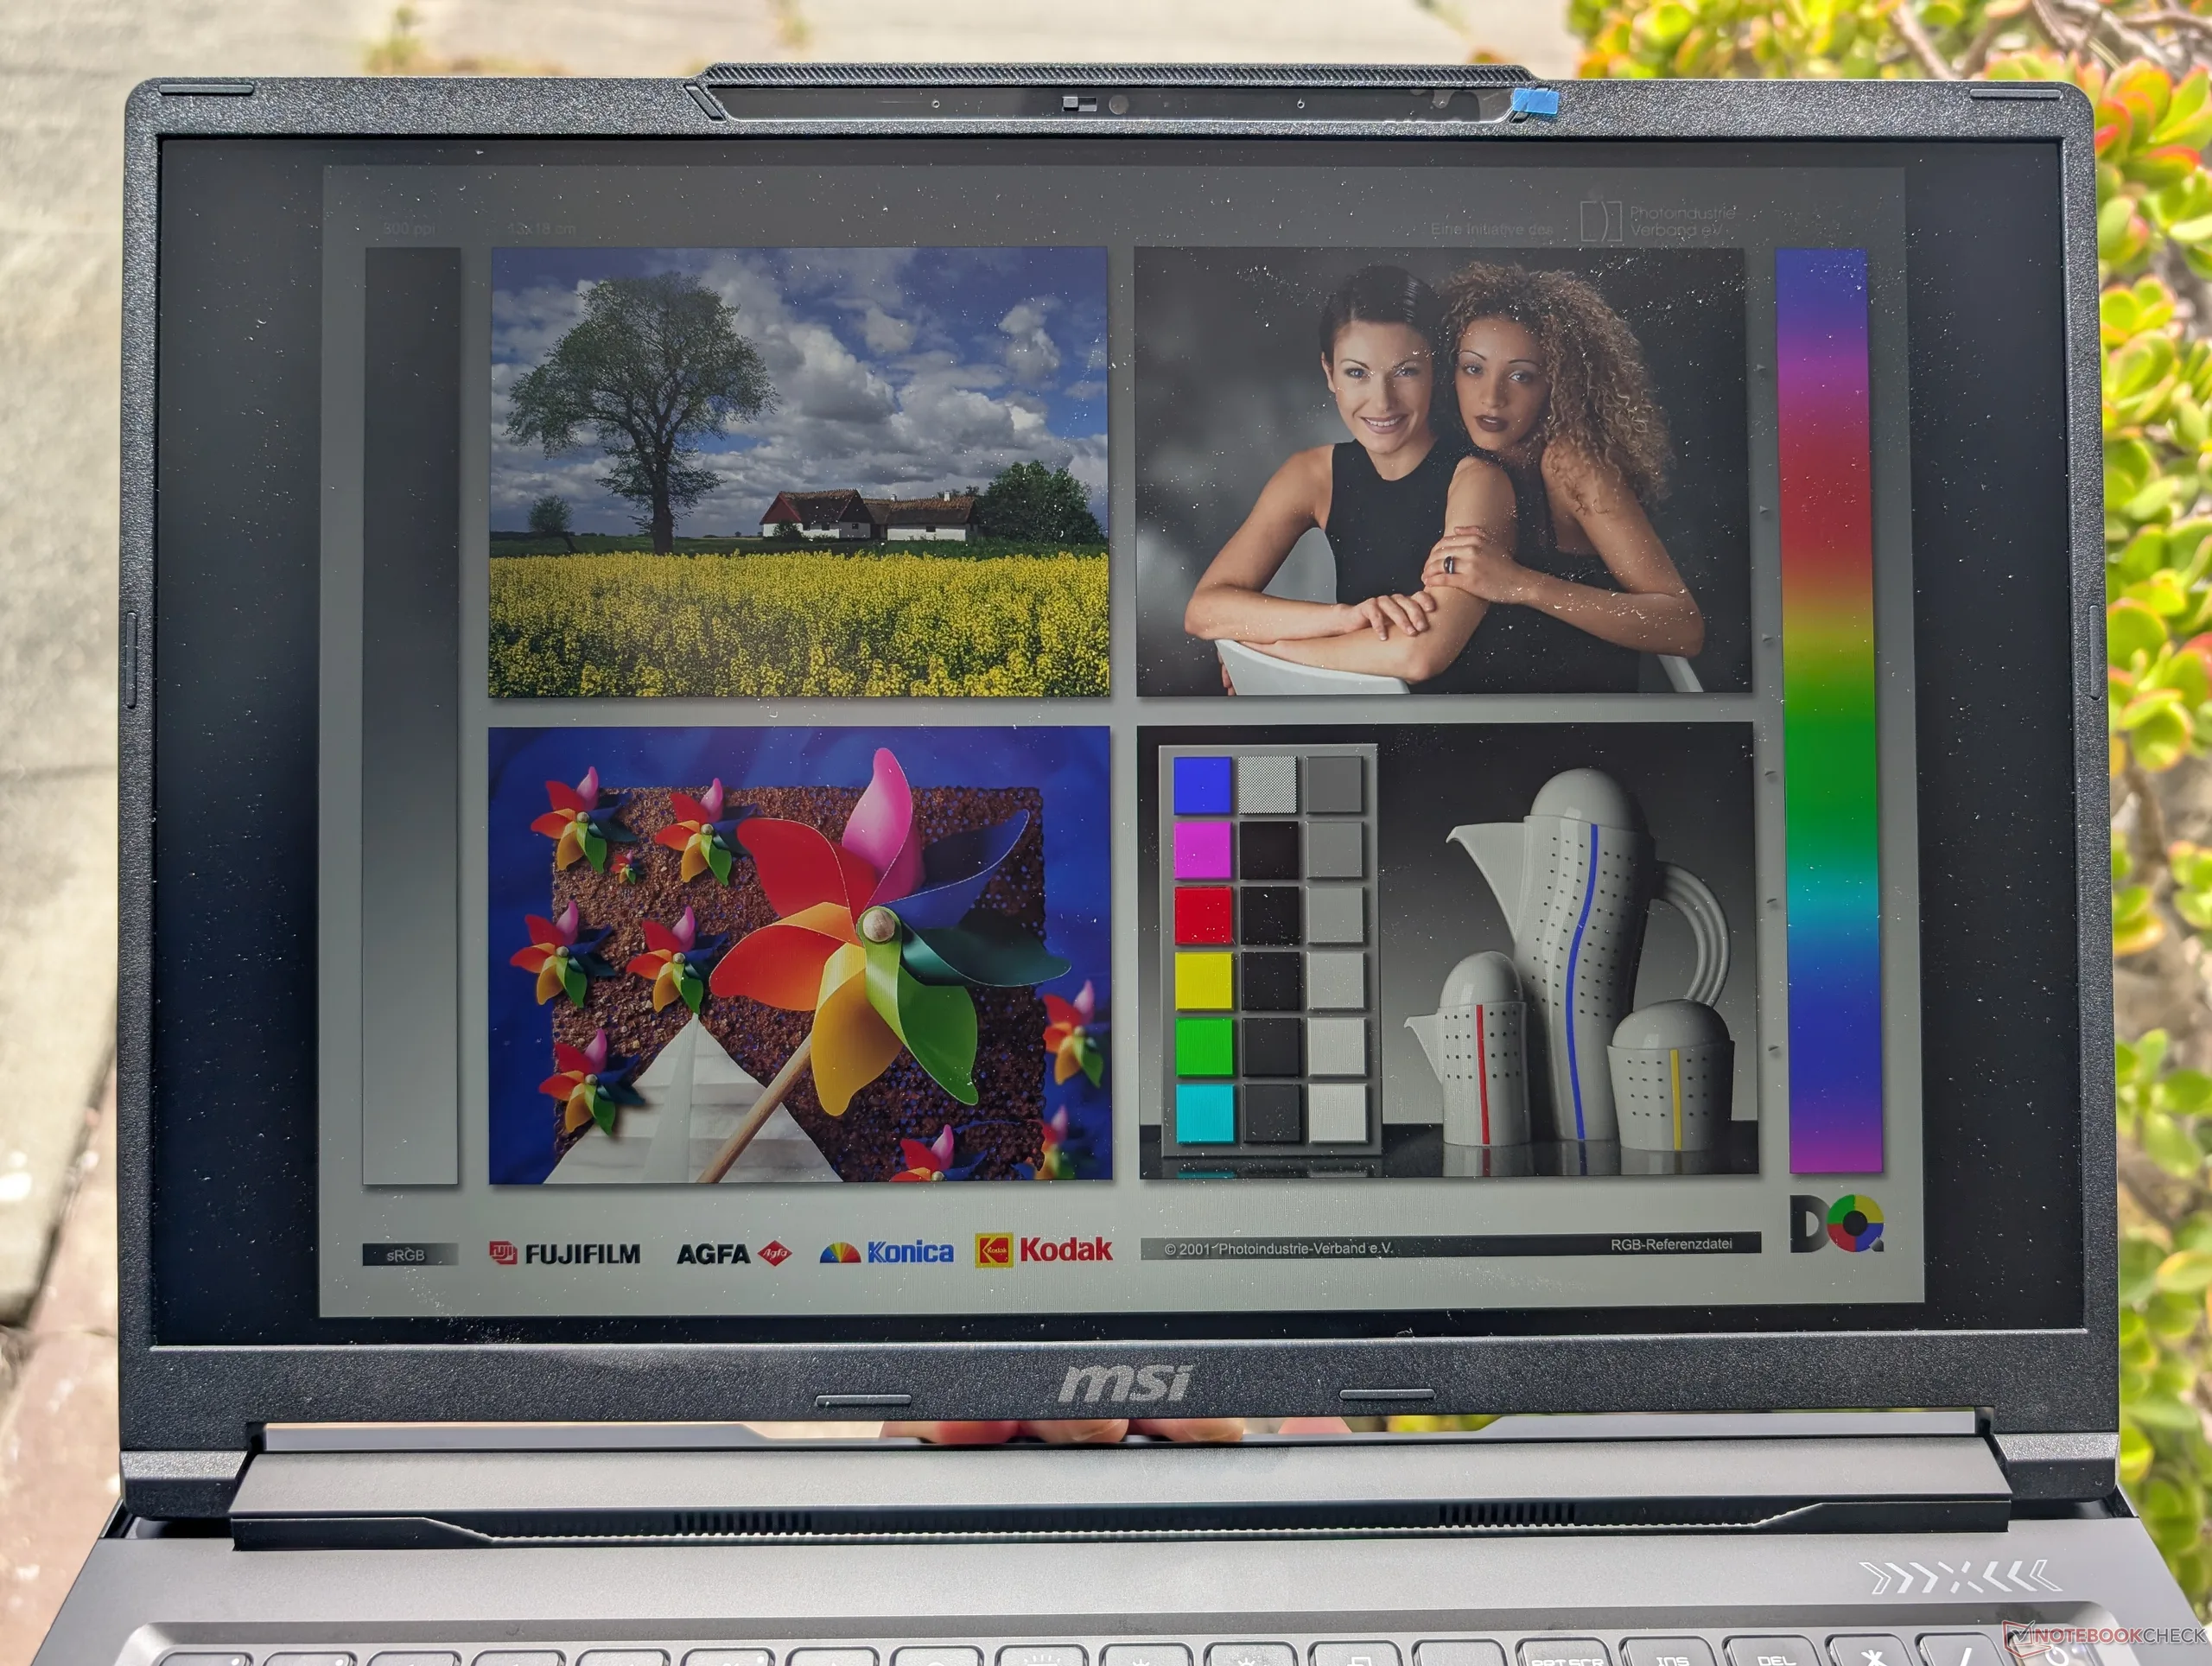
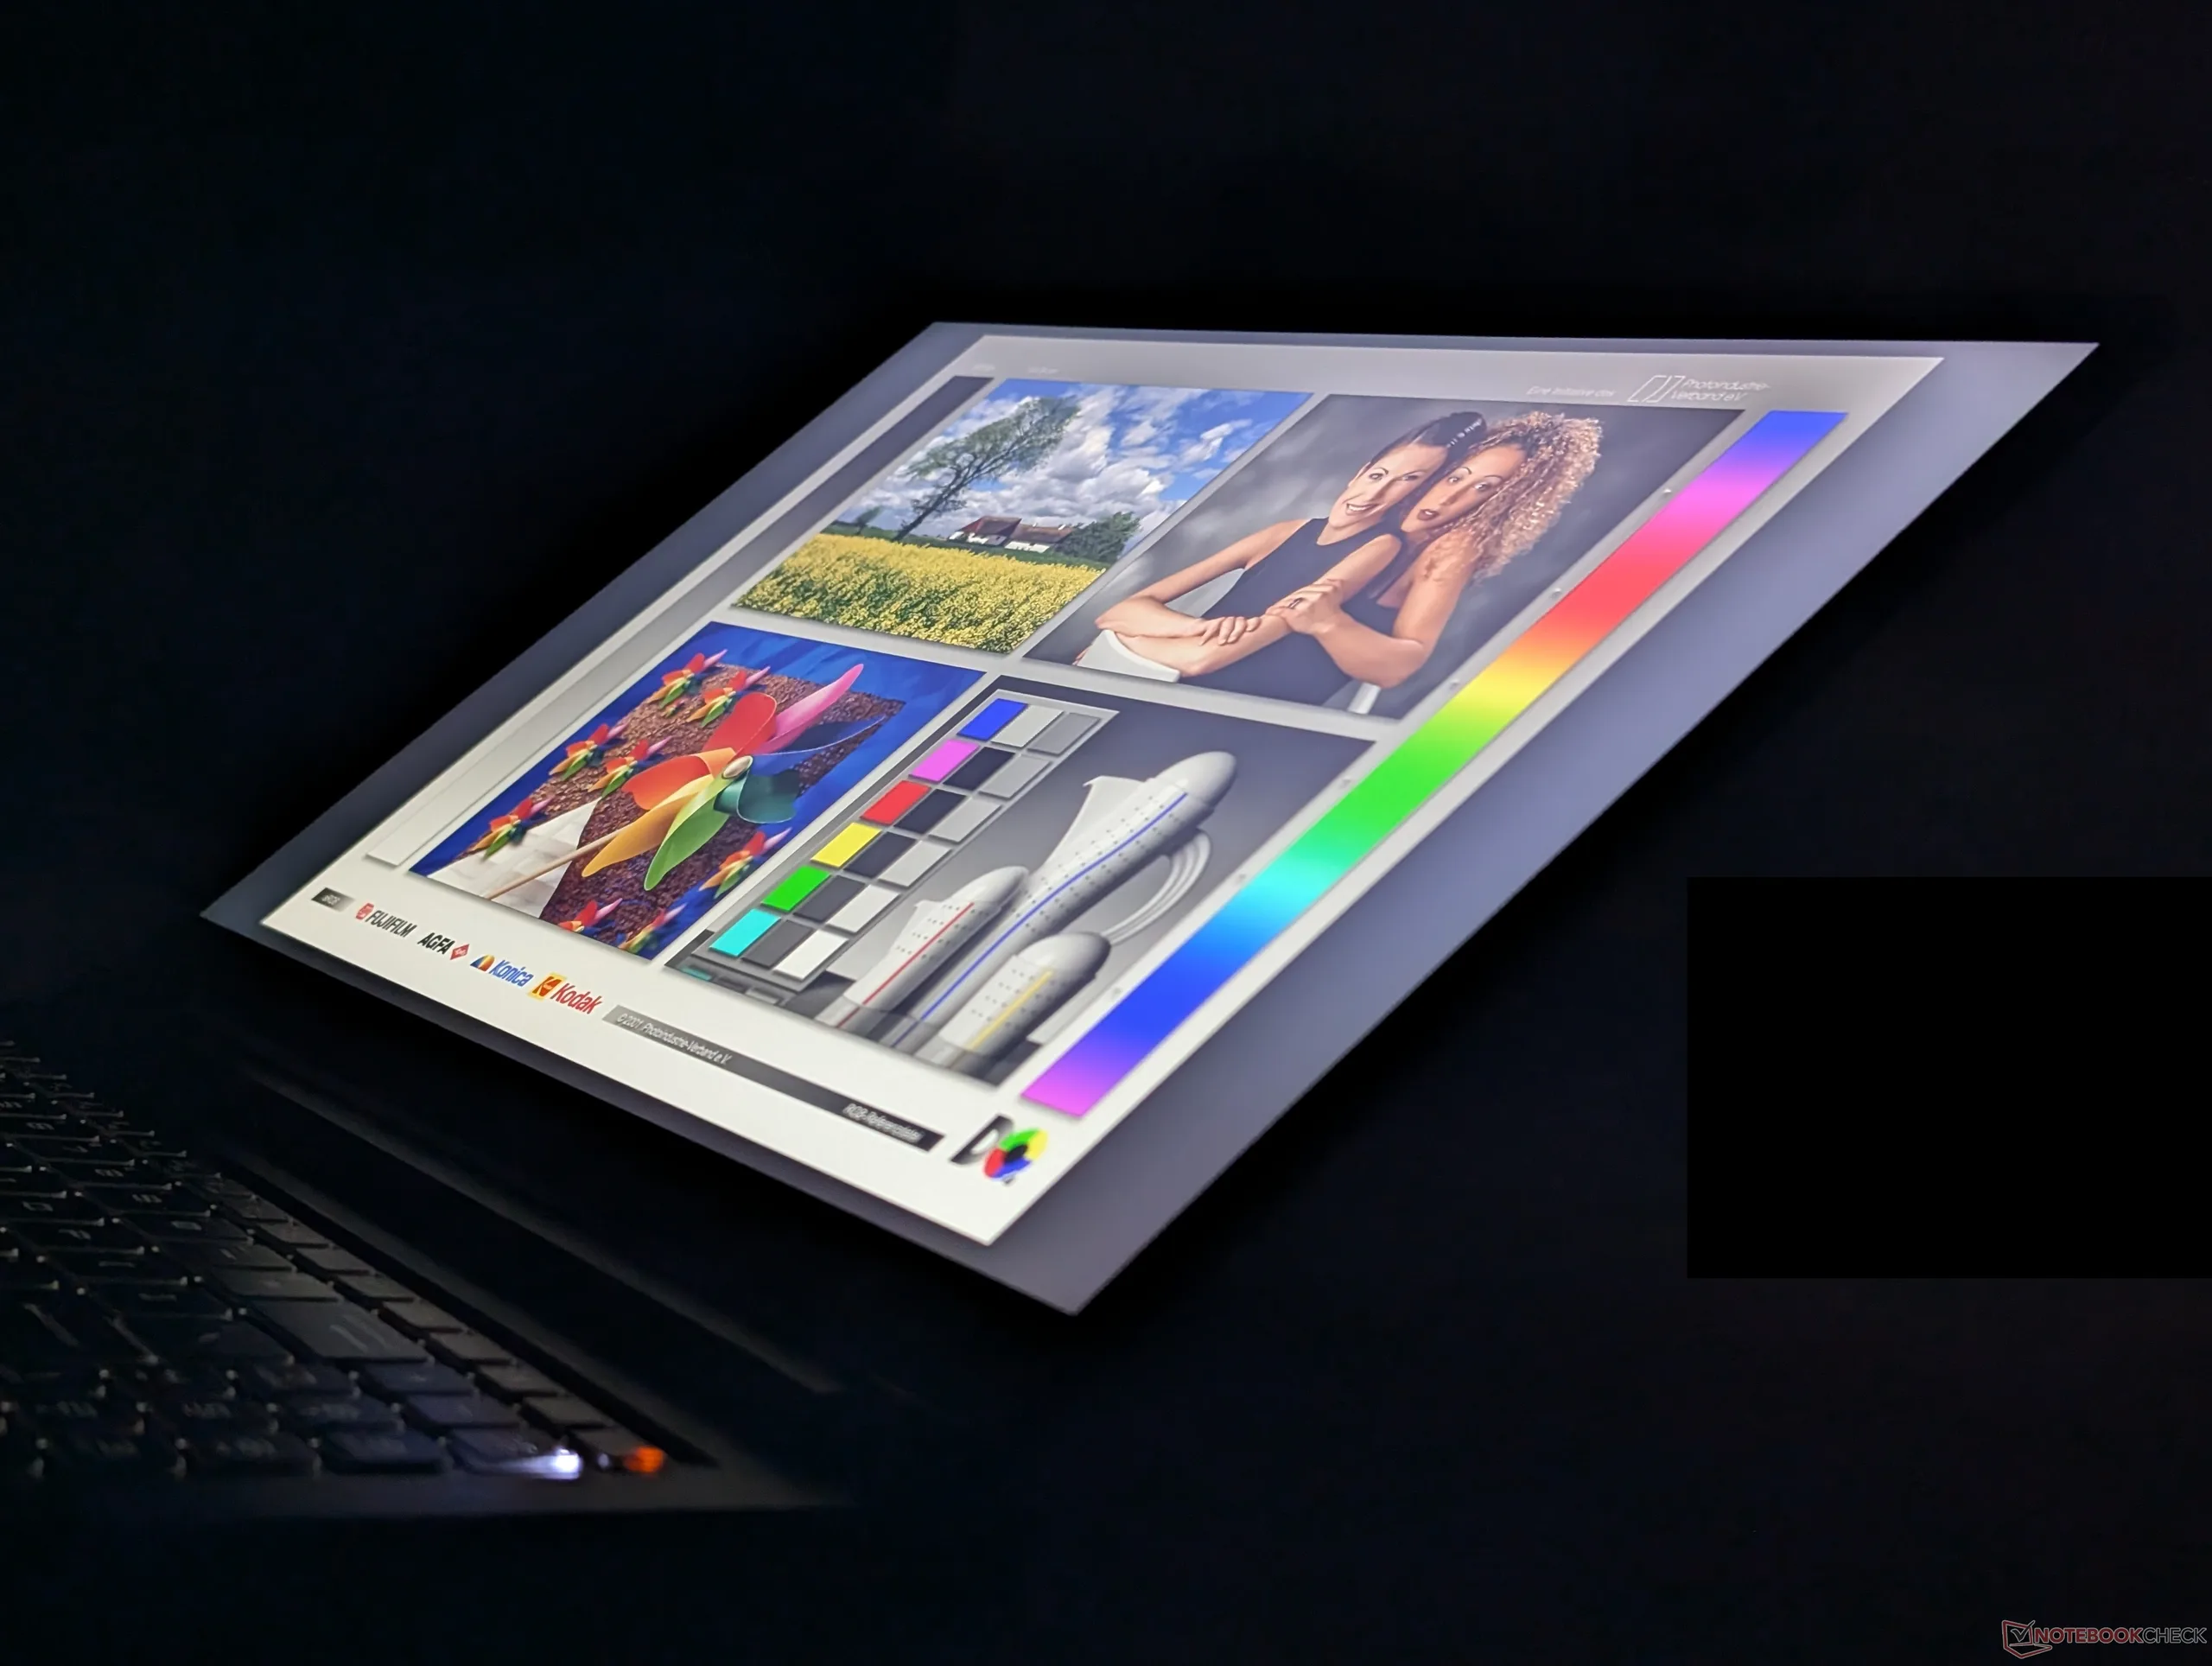
A tela IPS de 1600p240 com 95% da gama de cores P3 também merece destaque. Valorizamos o fato de todas as configurações atuais virem com o mesmo painel de alta qualidade, incluindo até mesmo a versão básica com RTX 5060, de modo que os compradores não precisam se preocupar com opções de baixa qualidade, com apenas 45% da gama NTSC.
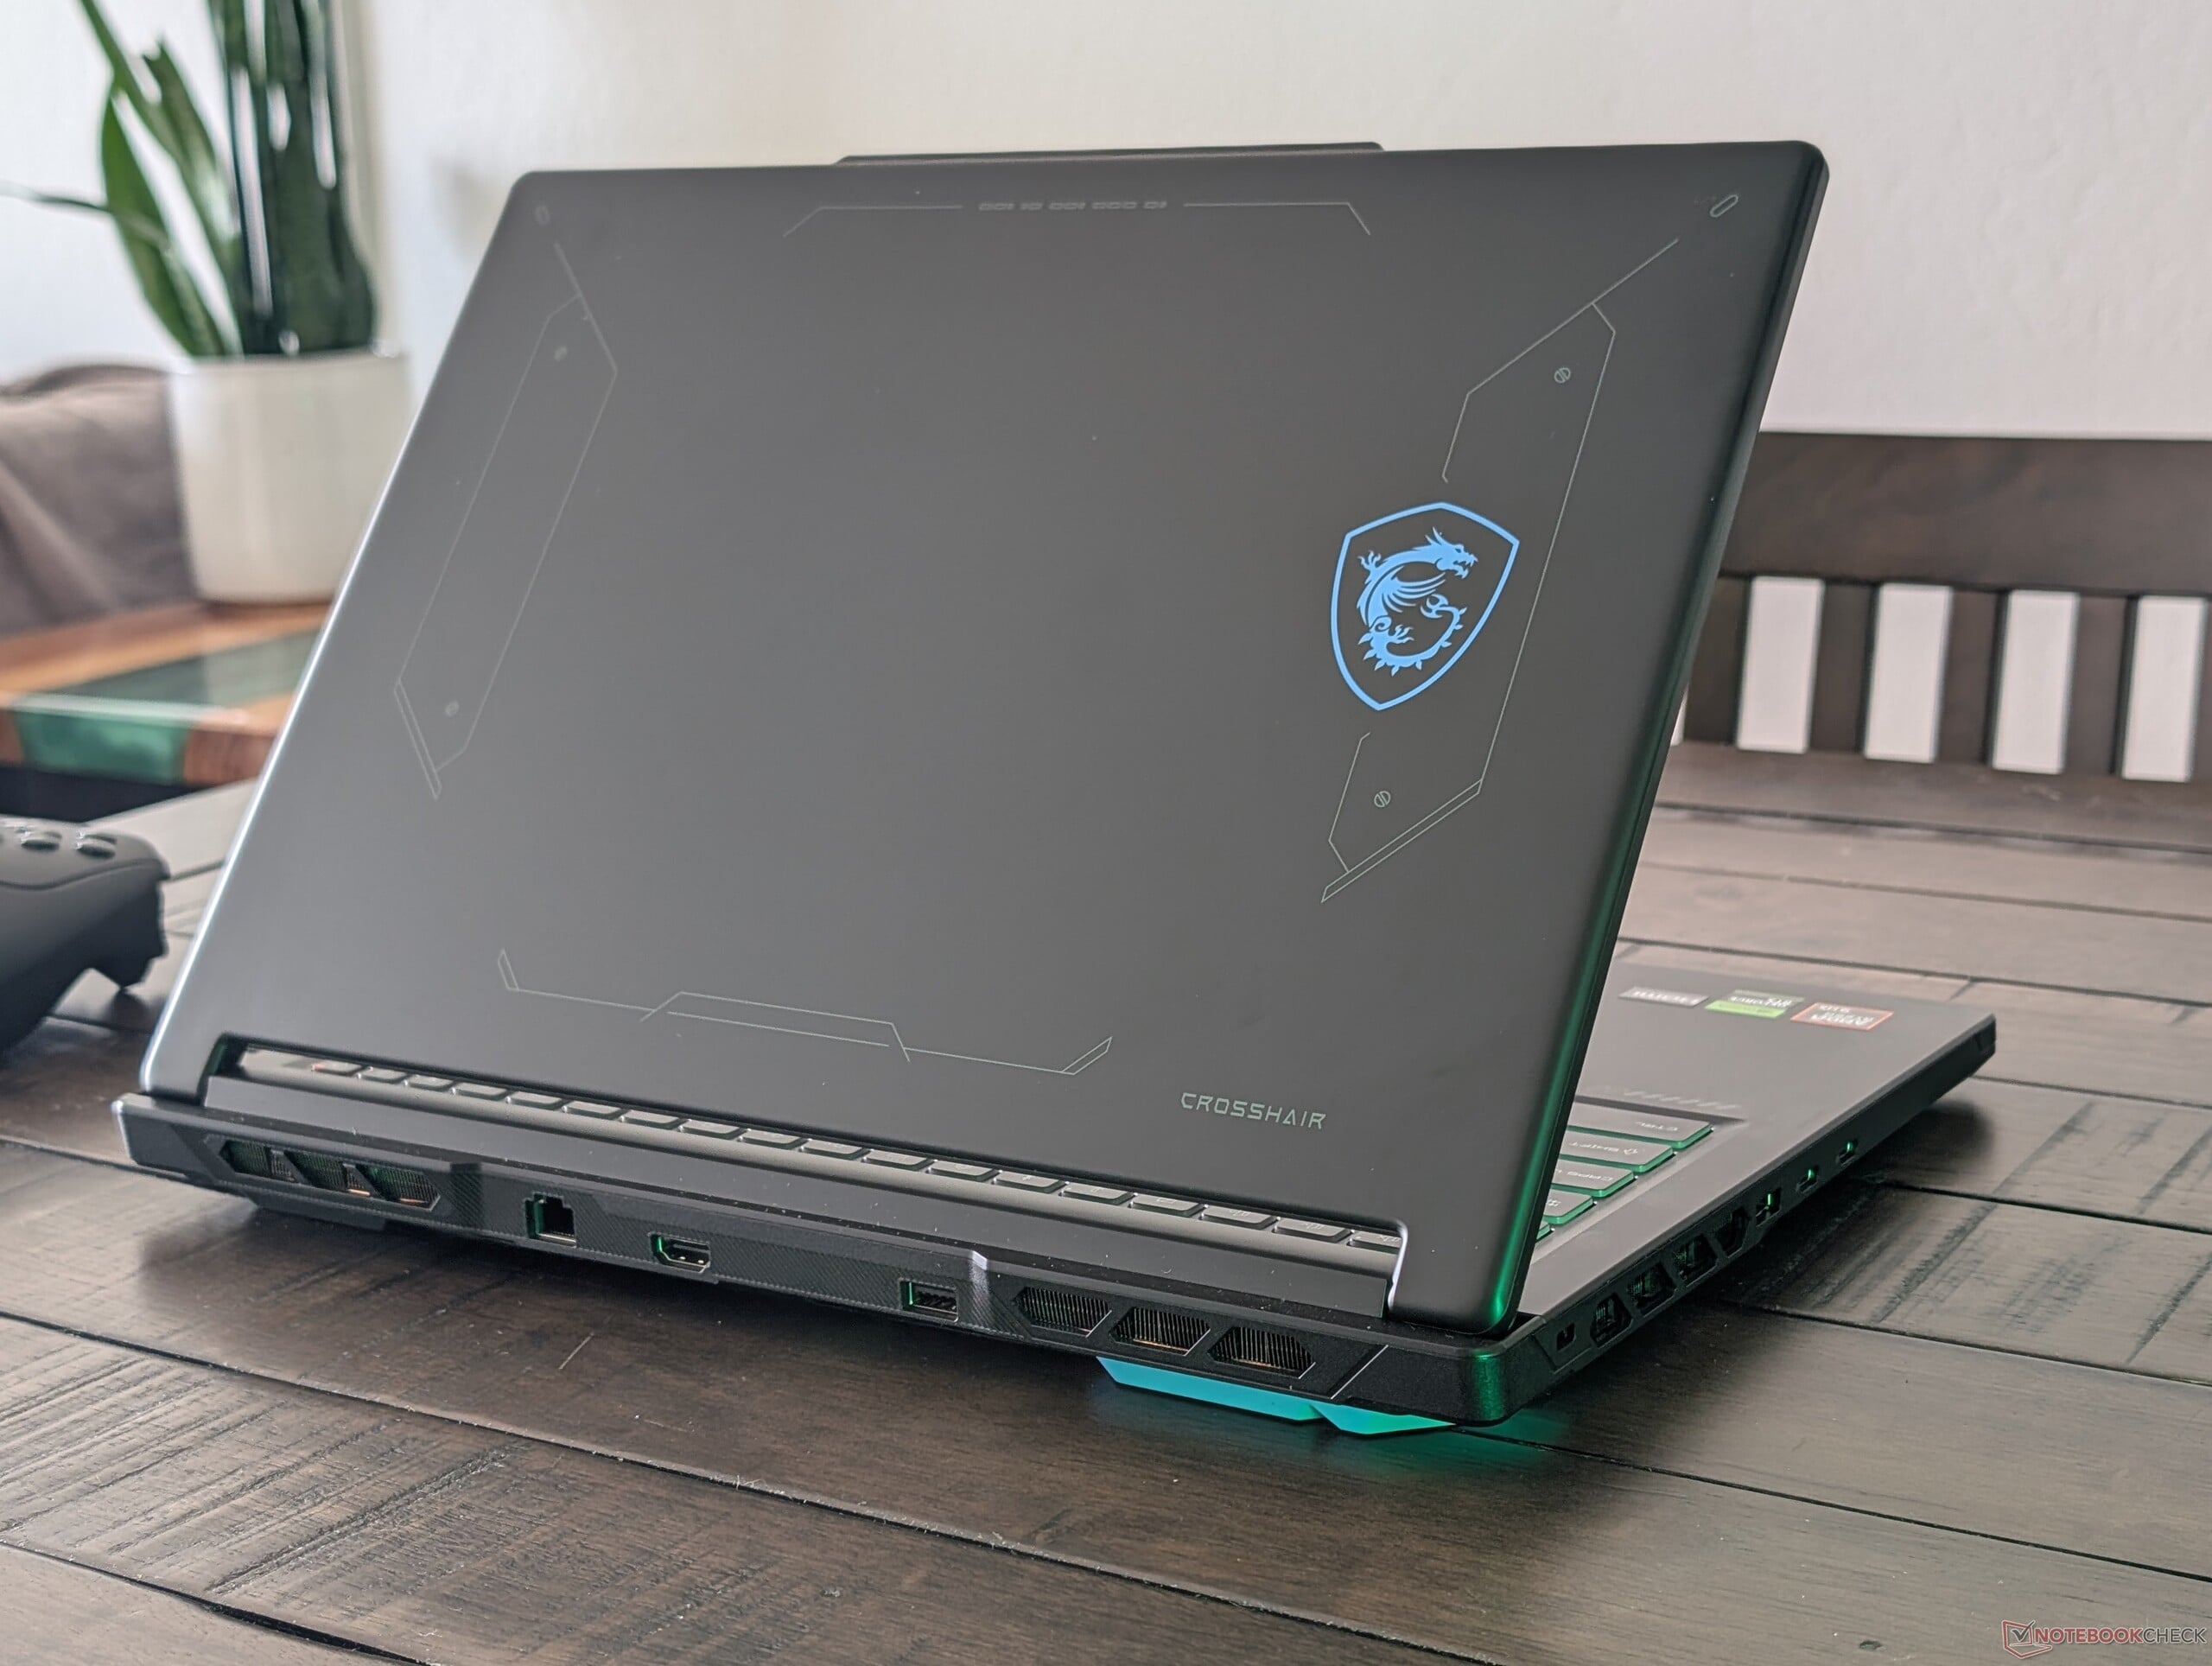
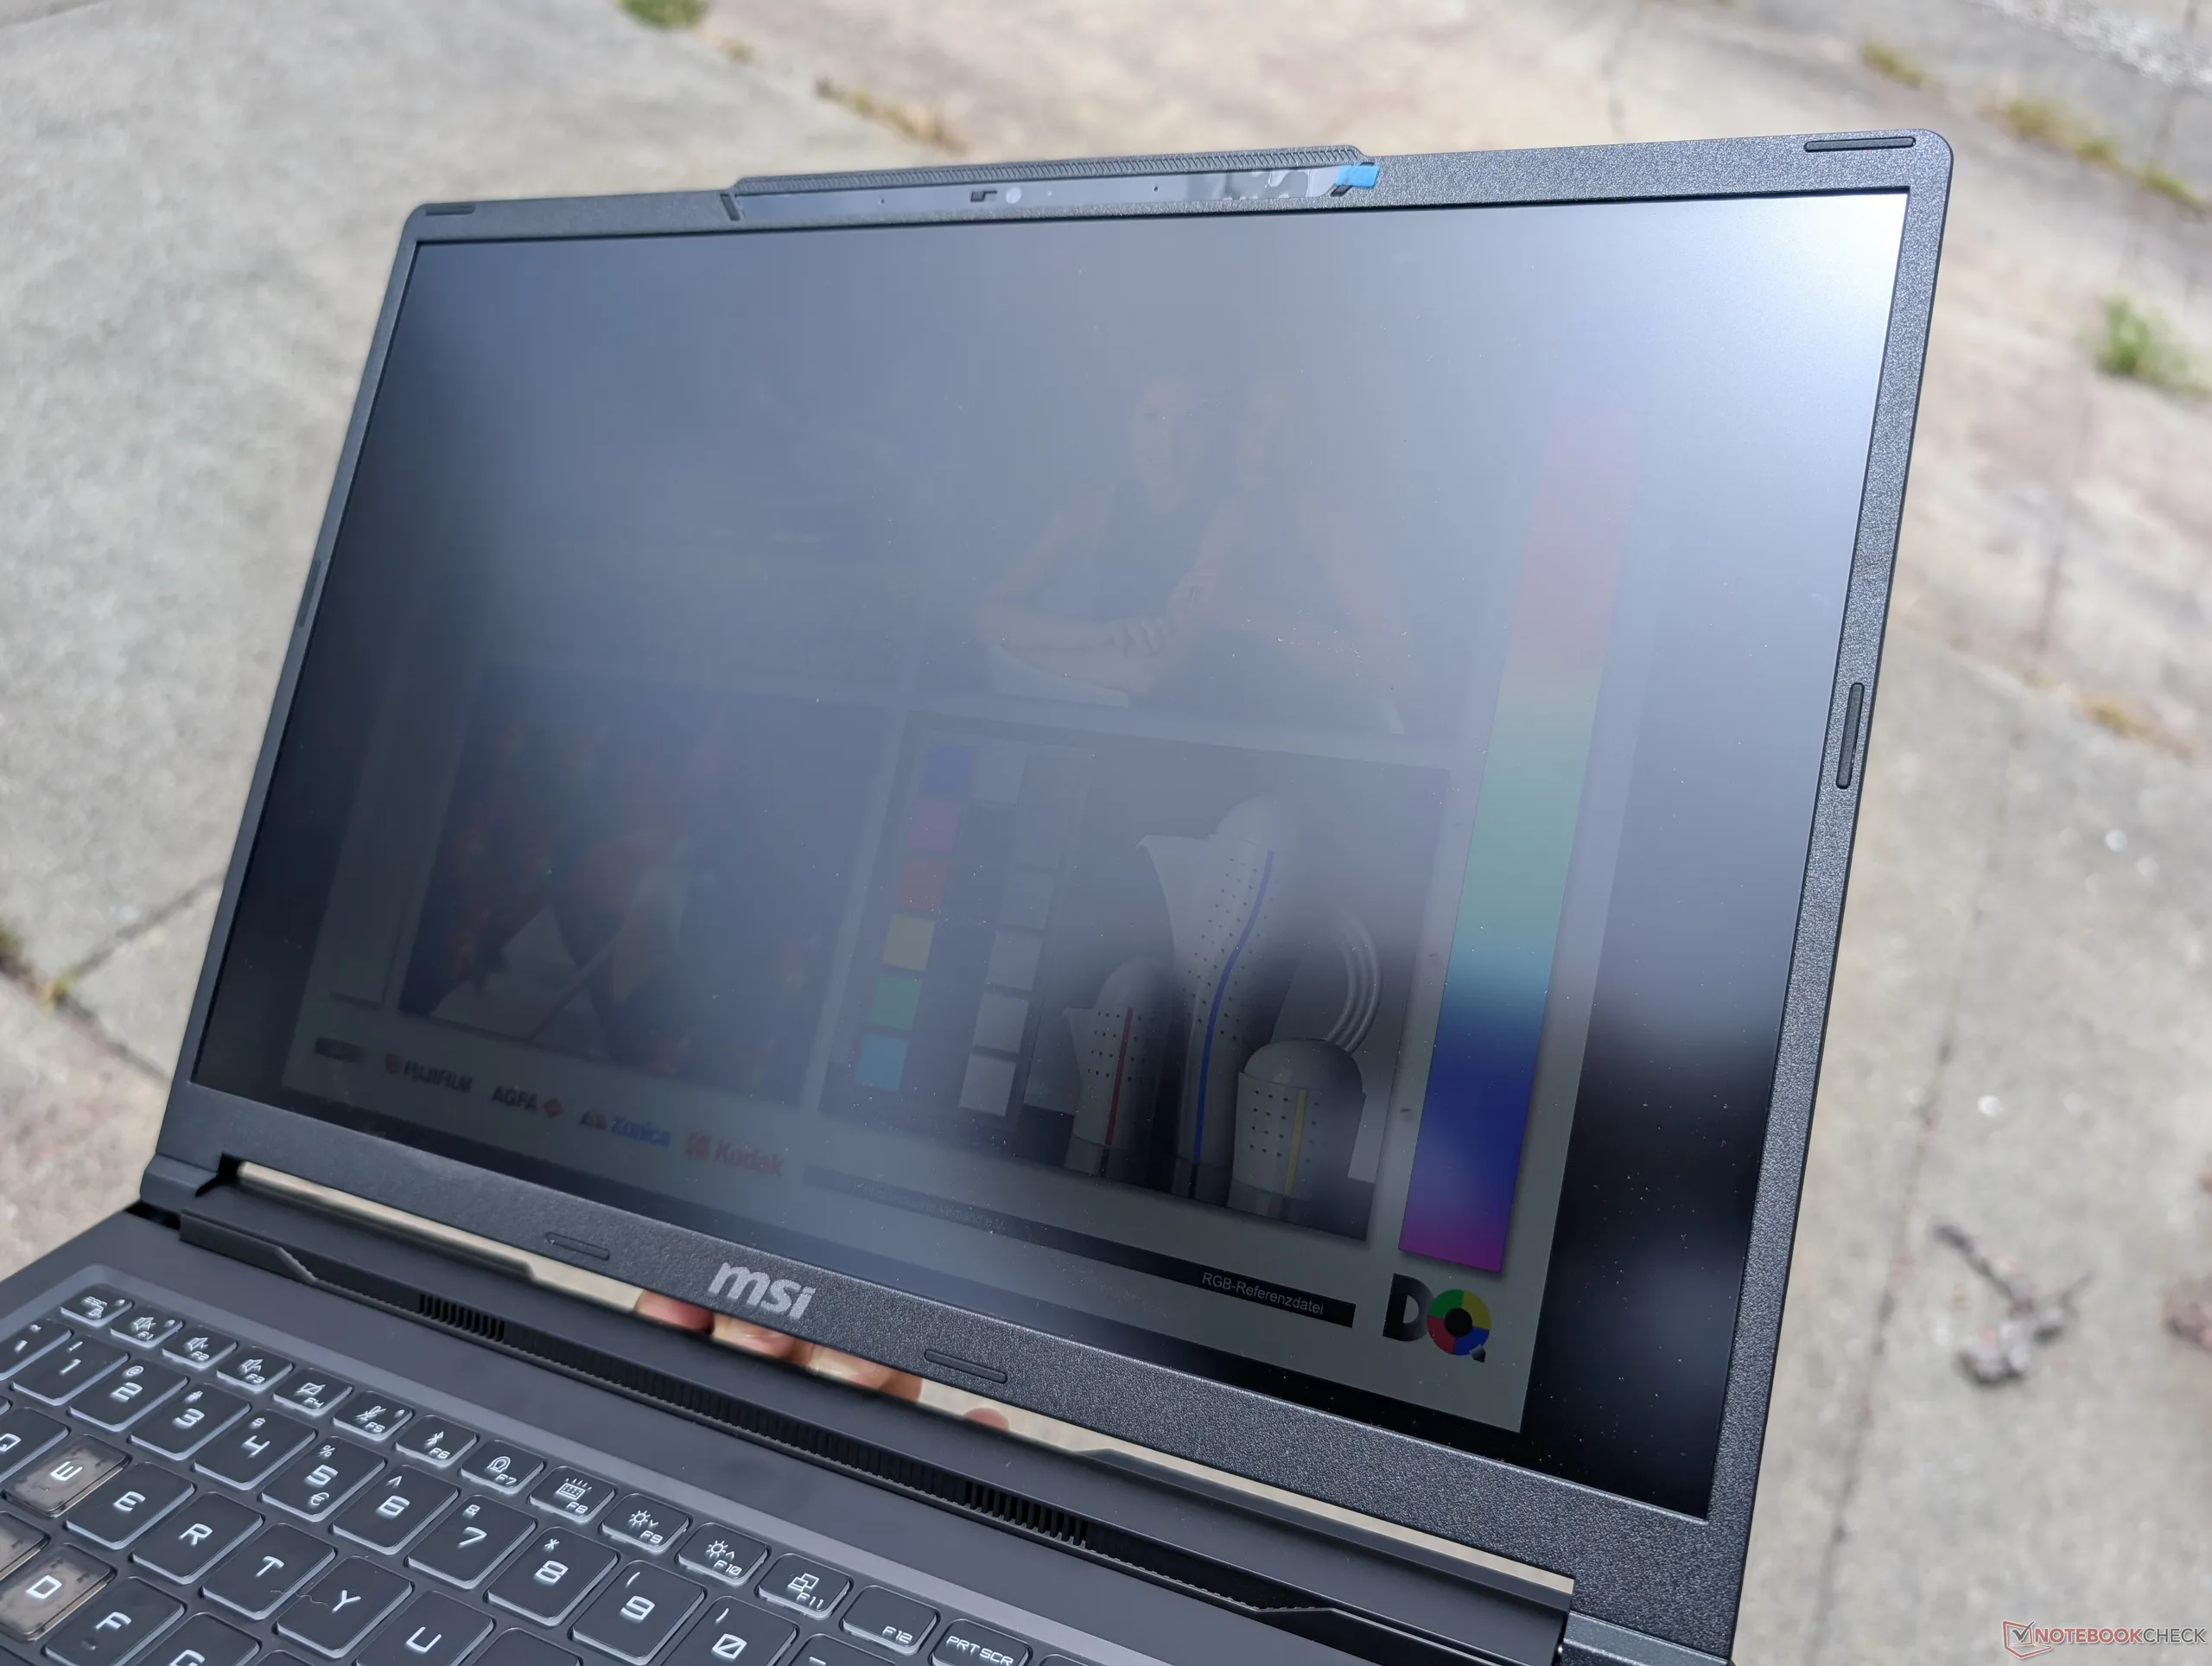
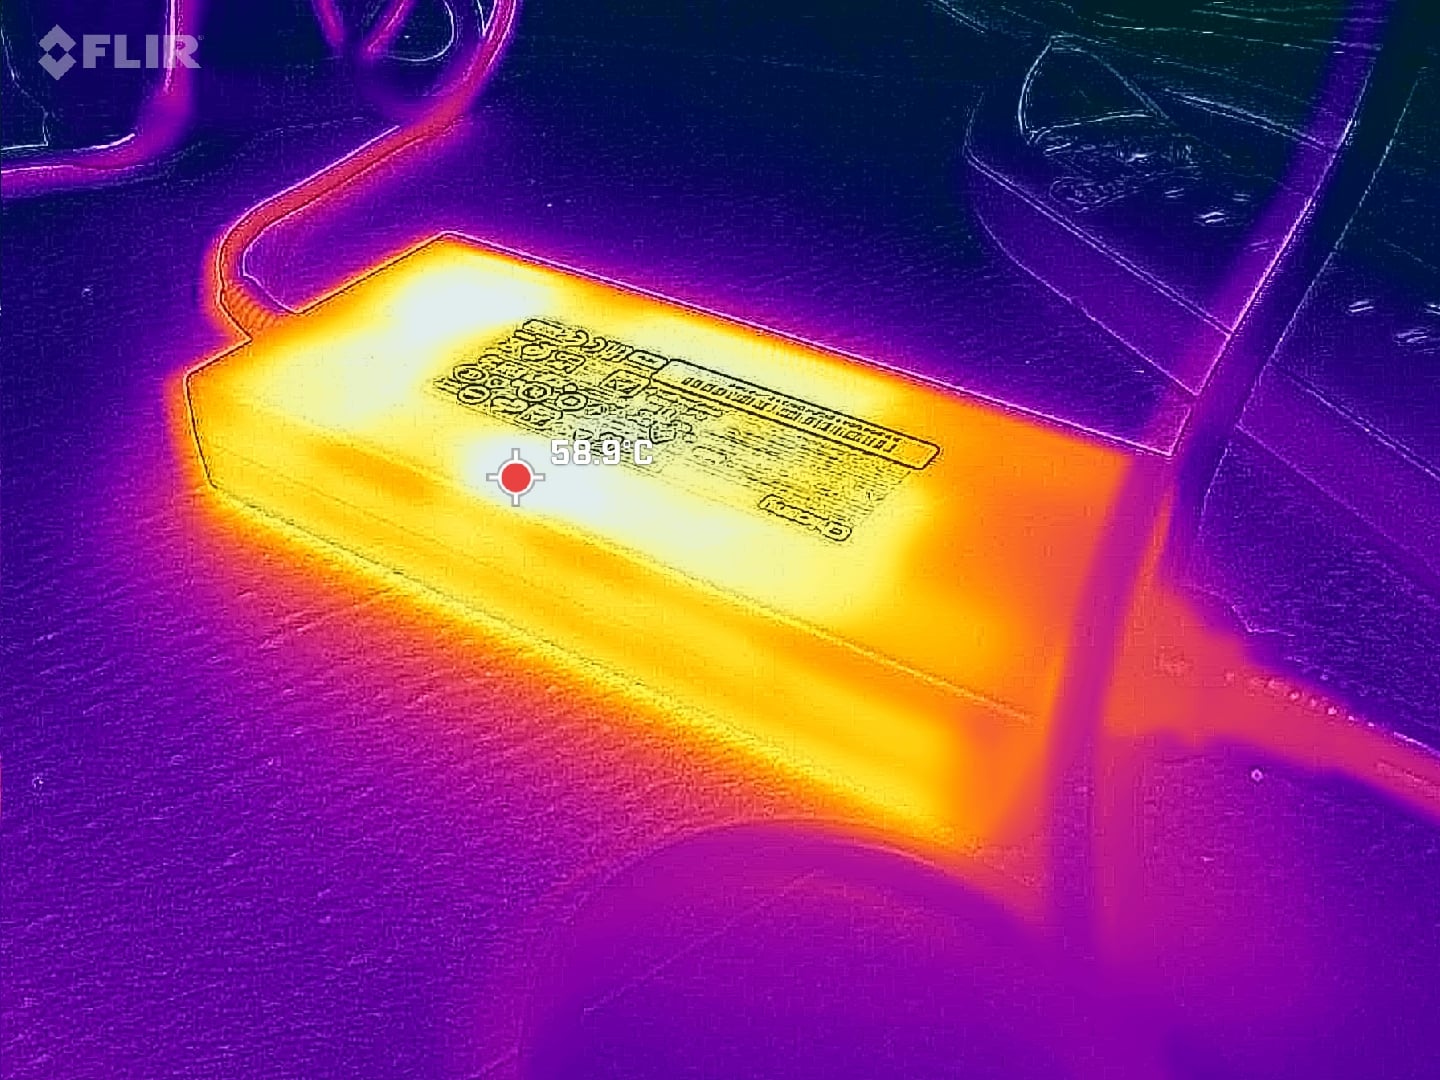
Embora as atualizações de desempenho e do chassi sejam excelentes, o Crosshair A16 HX continua sendo um modelo voltado para o orçamento, e, por isso, as economias feitas são perceptíveis. O chassi de plástico sem brilho, em particular, é muito propenso a impressões digitais, enquanto os alto-falantes de baixa qualidade, a ausência de G-Sync, Advanced Optimus, HDR e iluminação RGB por tecla prejudicam a experiência geral de jogo. O adaptador de CA de 240 W parece um pouco pequeno demais, já que o notebook, que exige bastante energia, chega a consumir em média quase 250 W durante os jogos, o que leva a temperaturas muito elevadas no adaptador e, em geral, a uma duração de bateria mais curta.
Pro
Contra
Preço e disponibilidade
A configuração analisada com a RTX 5070 já está à venda na Amazon por US$ 2.700.
O Crosshair A16 HX é a versão da AMD do modelo baseado em Intel Crosshair 16 HX. No entanto, existem várias diferenças entre os modelos, tanto no interior quanto no exterior. A série Crosshair abriga alguns dos notebooks para jogos mais acessíveis da MSI, em contraste com as séries Raider ou Titan, que são mais caras.
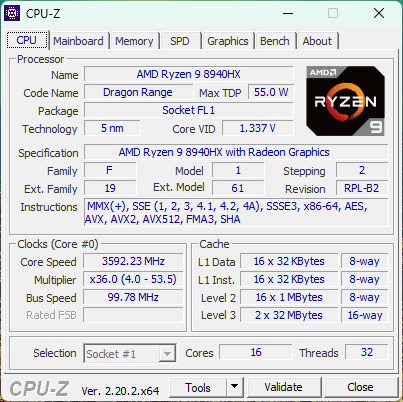
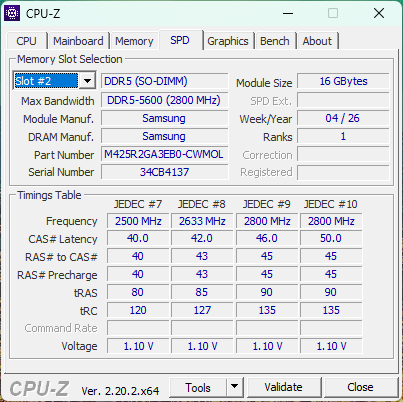
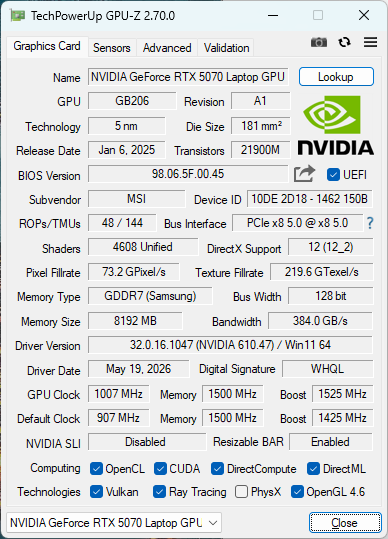
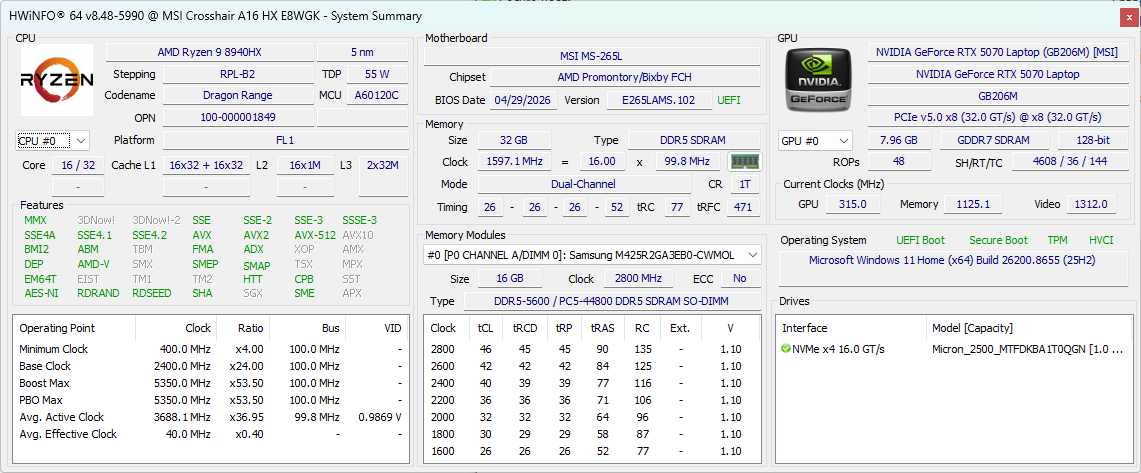
Nossa unidade de teste é uma configuração de ponta com o processador Ryzen 9 8940HX Zen 4, placa de vídeo RTX 5070 com tecnologia “ GeForce ” de 115 W e tela IPS de 1600p, por aproximadamente US$ 2.700. Modelos de gama inferior vêm equipados com a RTX 5060, mas todas as configurações contam com a mesma tela IPS.
Entre as alternativas, destacam-se outros notebooks para jogos com preços acessíveis ou de gama média, como o série Asus TUF, Alienware 16 Auroraou o Acer Nitro V 16.
Mais análises da MSI:
Especificações
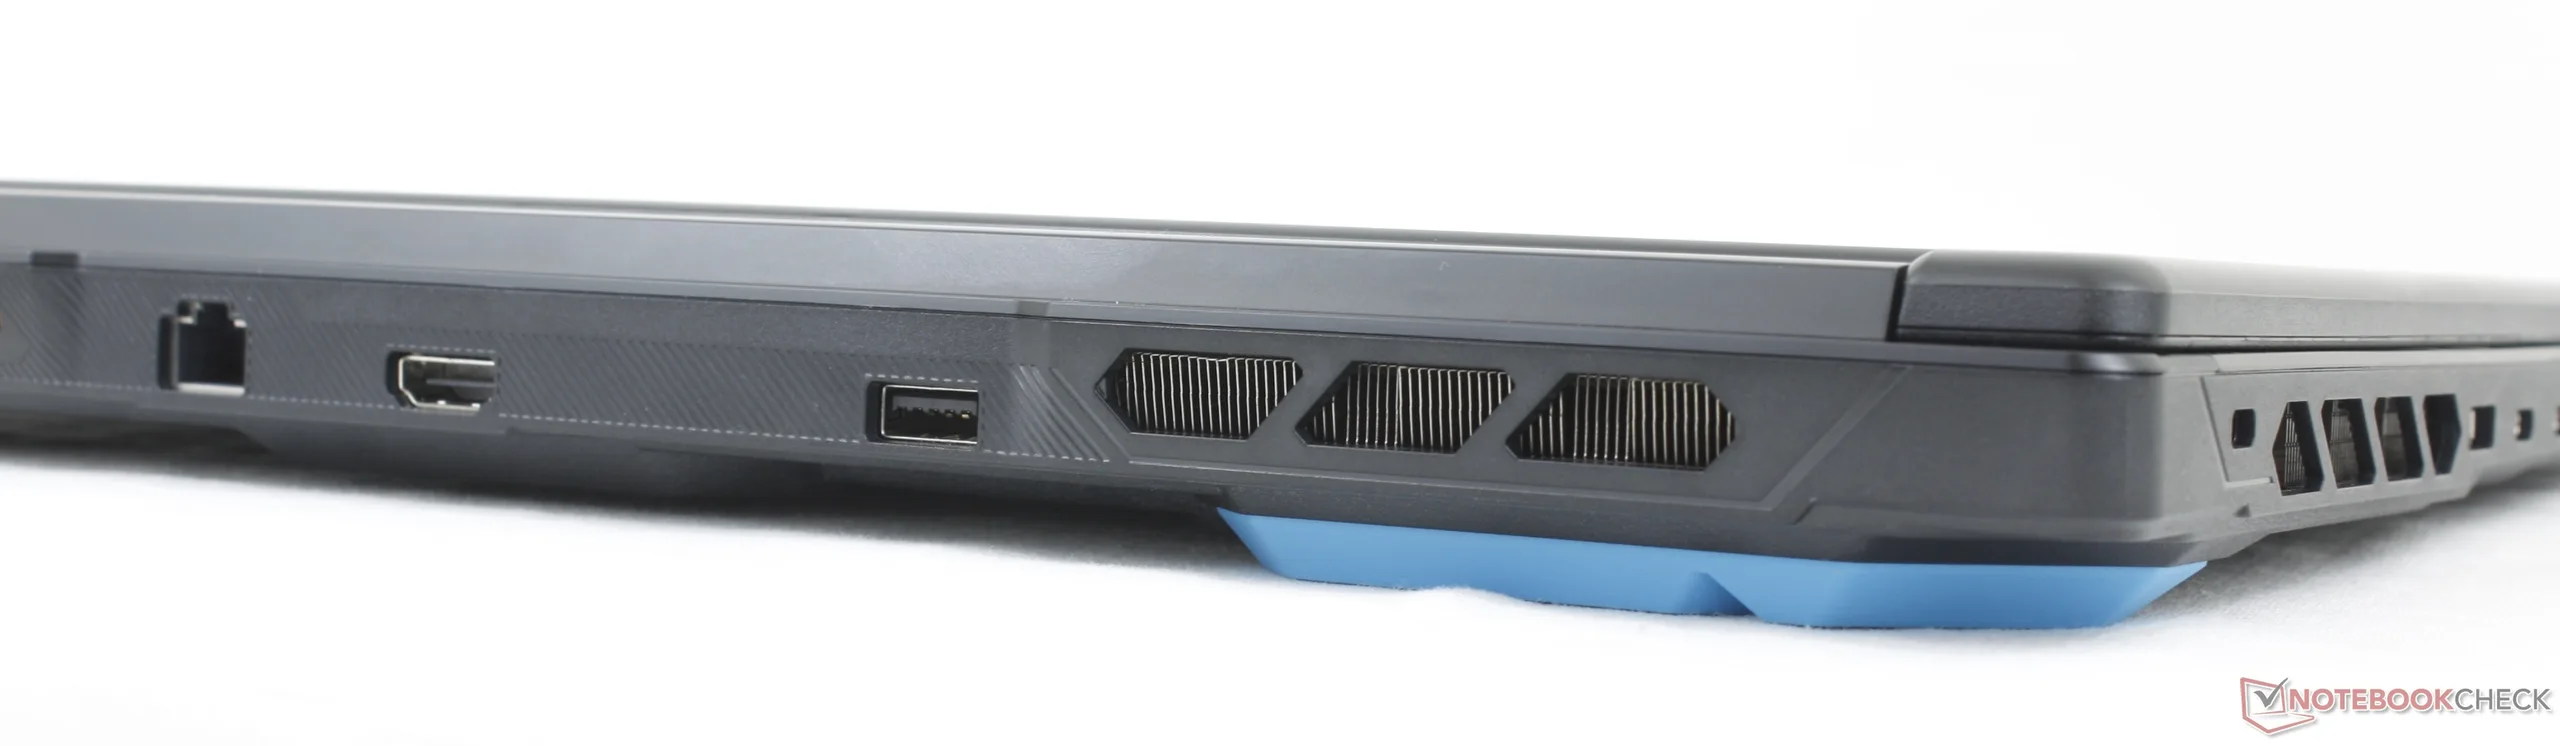
Caso
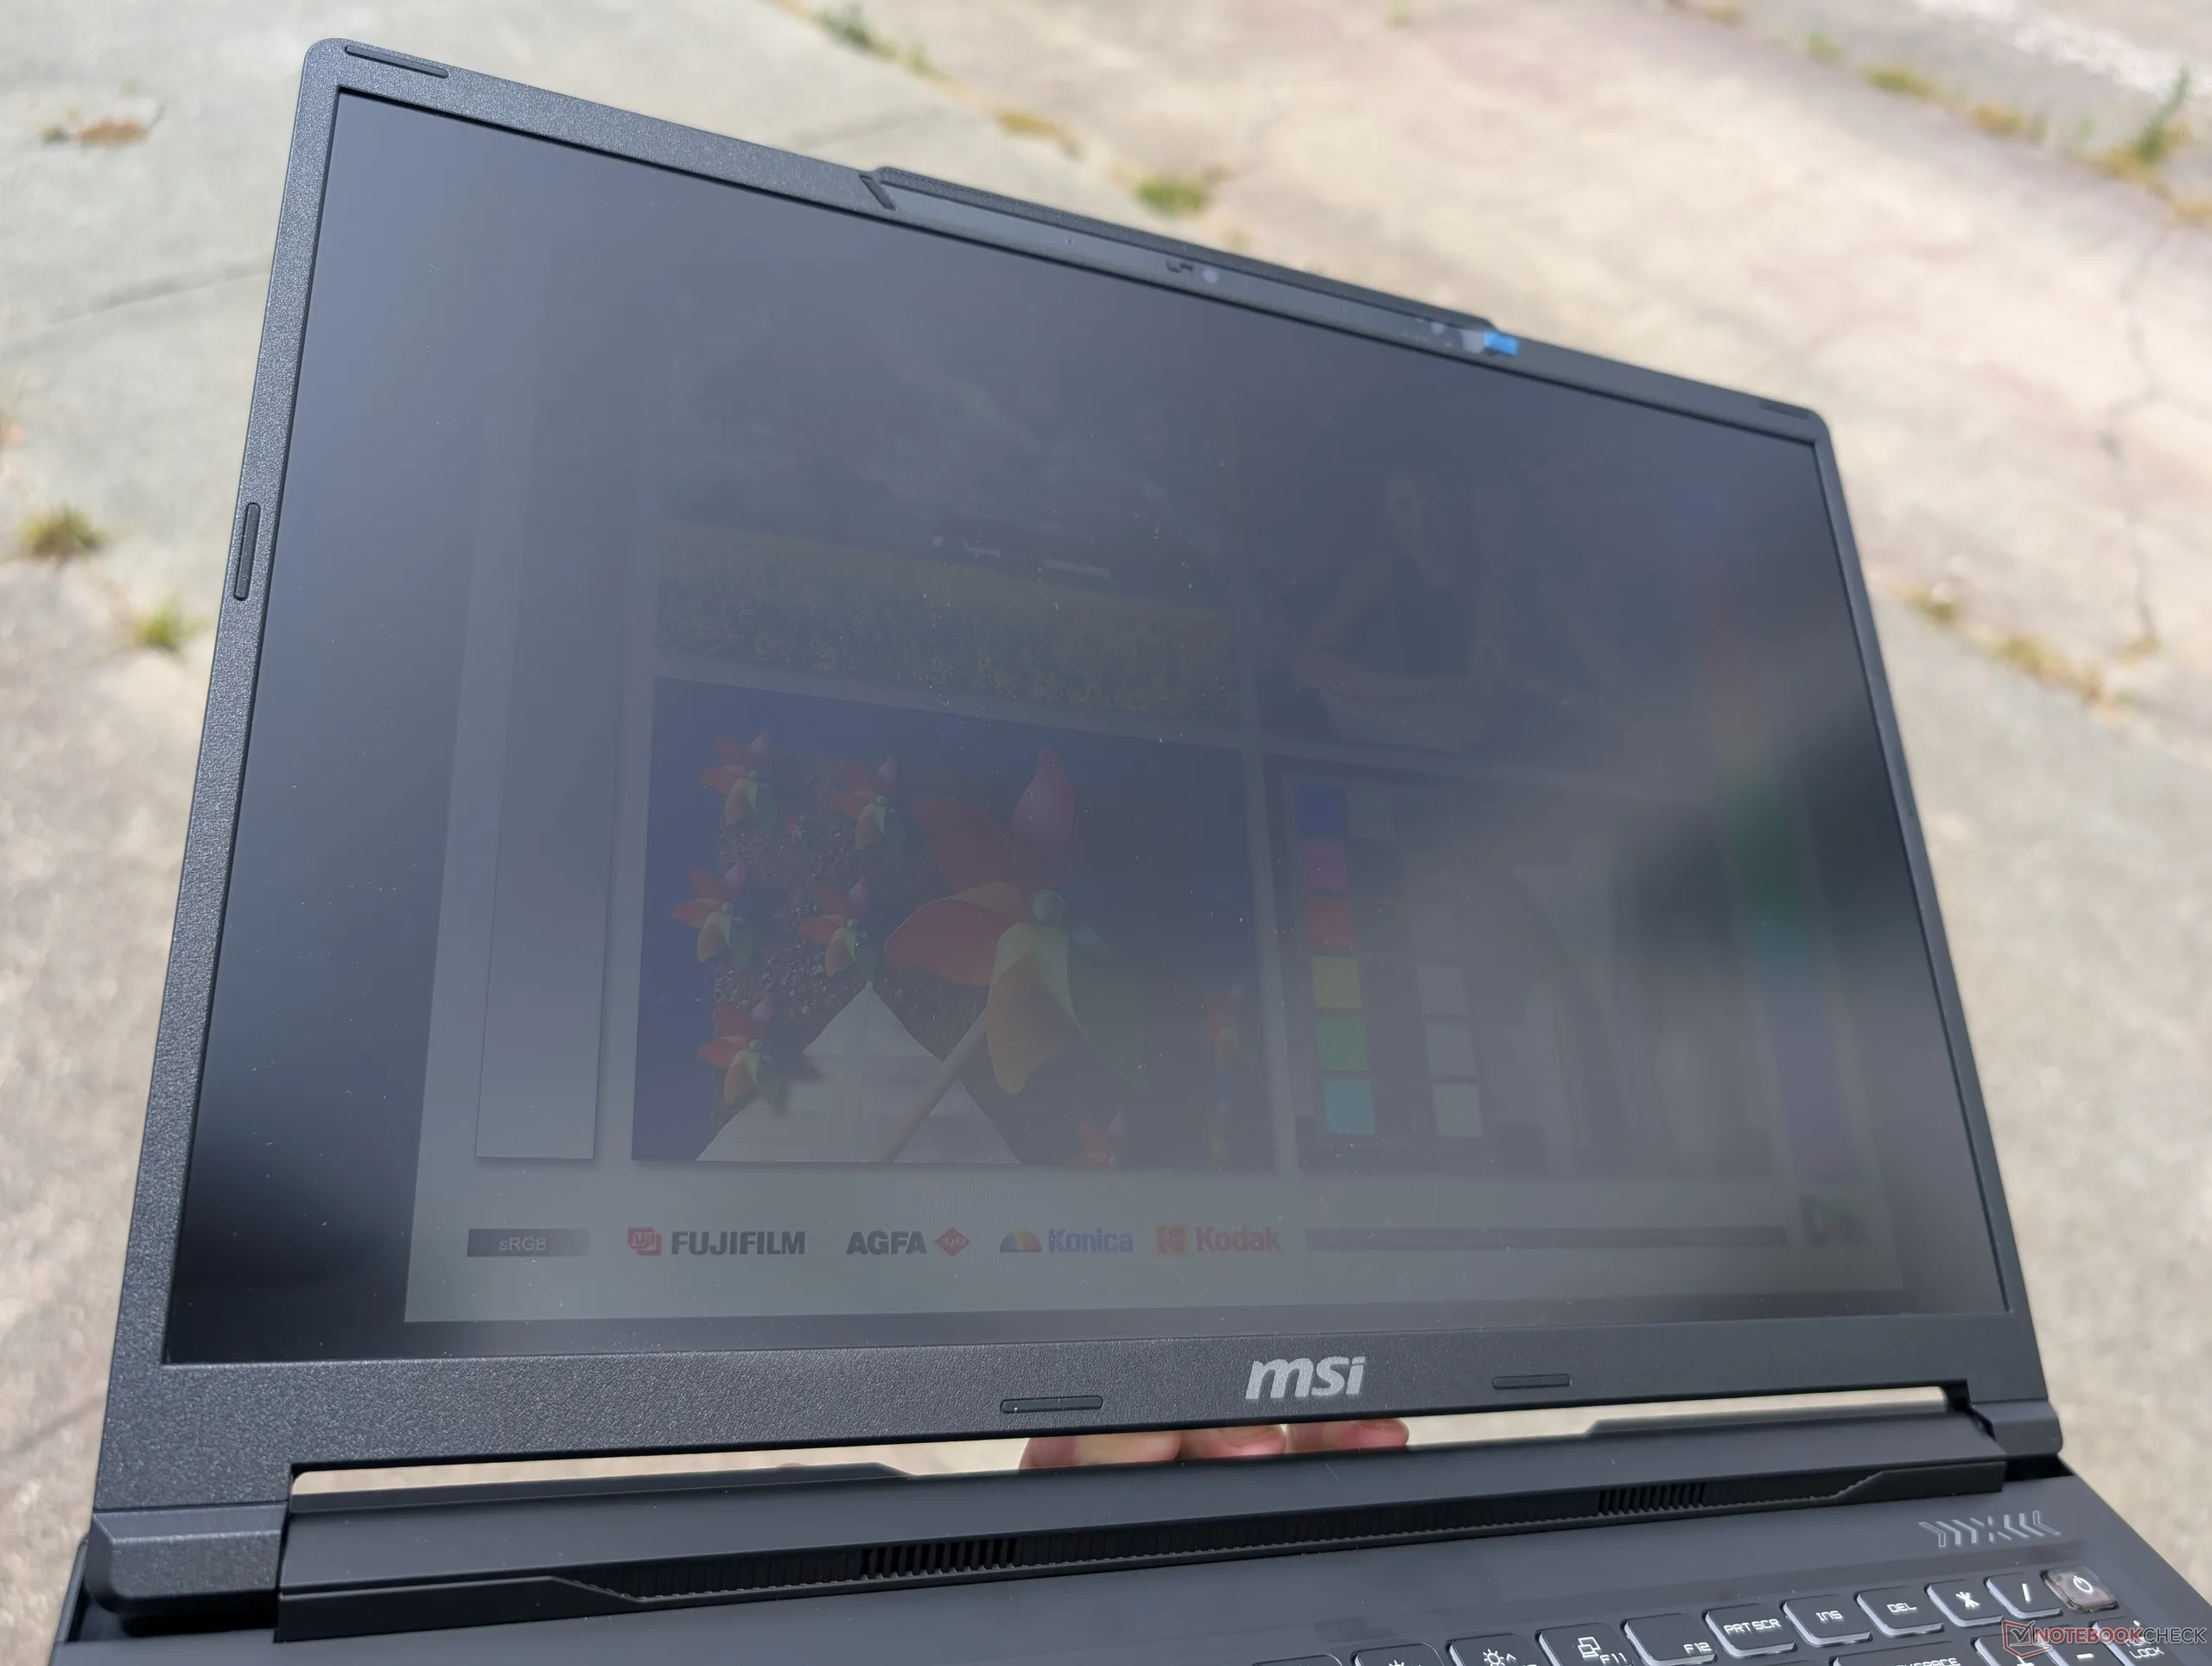
O chassi é, em sua maior parte, de plástico preto fosco, sem luzes RGB desnecessárias, a fim de reduzir custos. As dobradiças da tela permitem uma abertura de até cerca de 150 graus, no máximo.
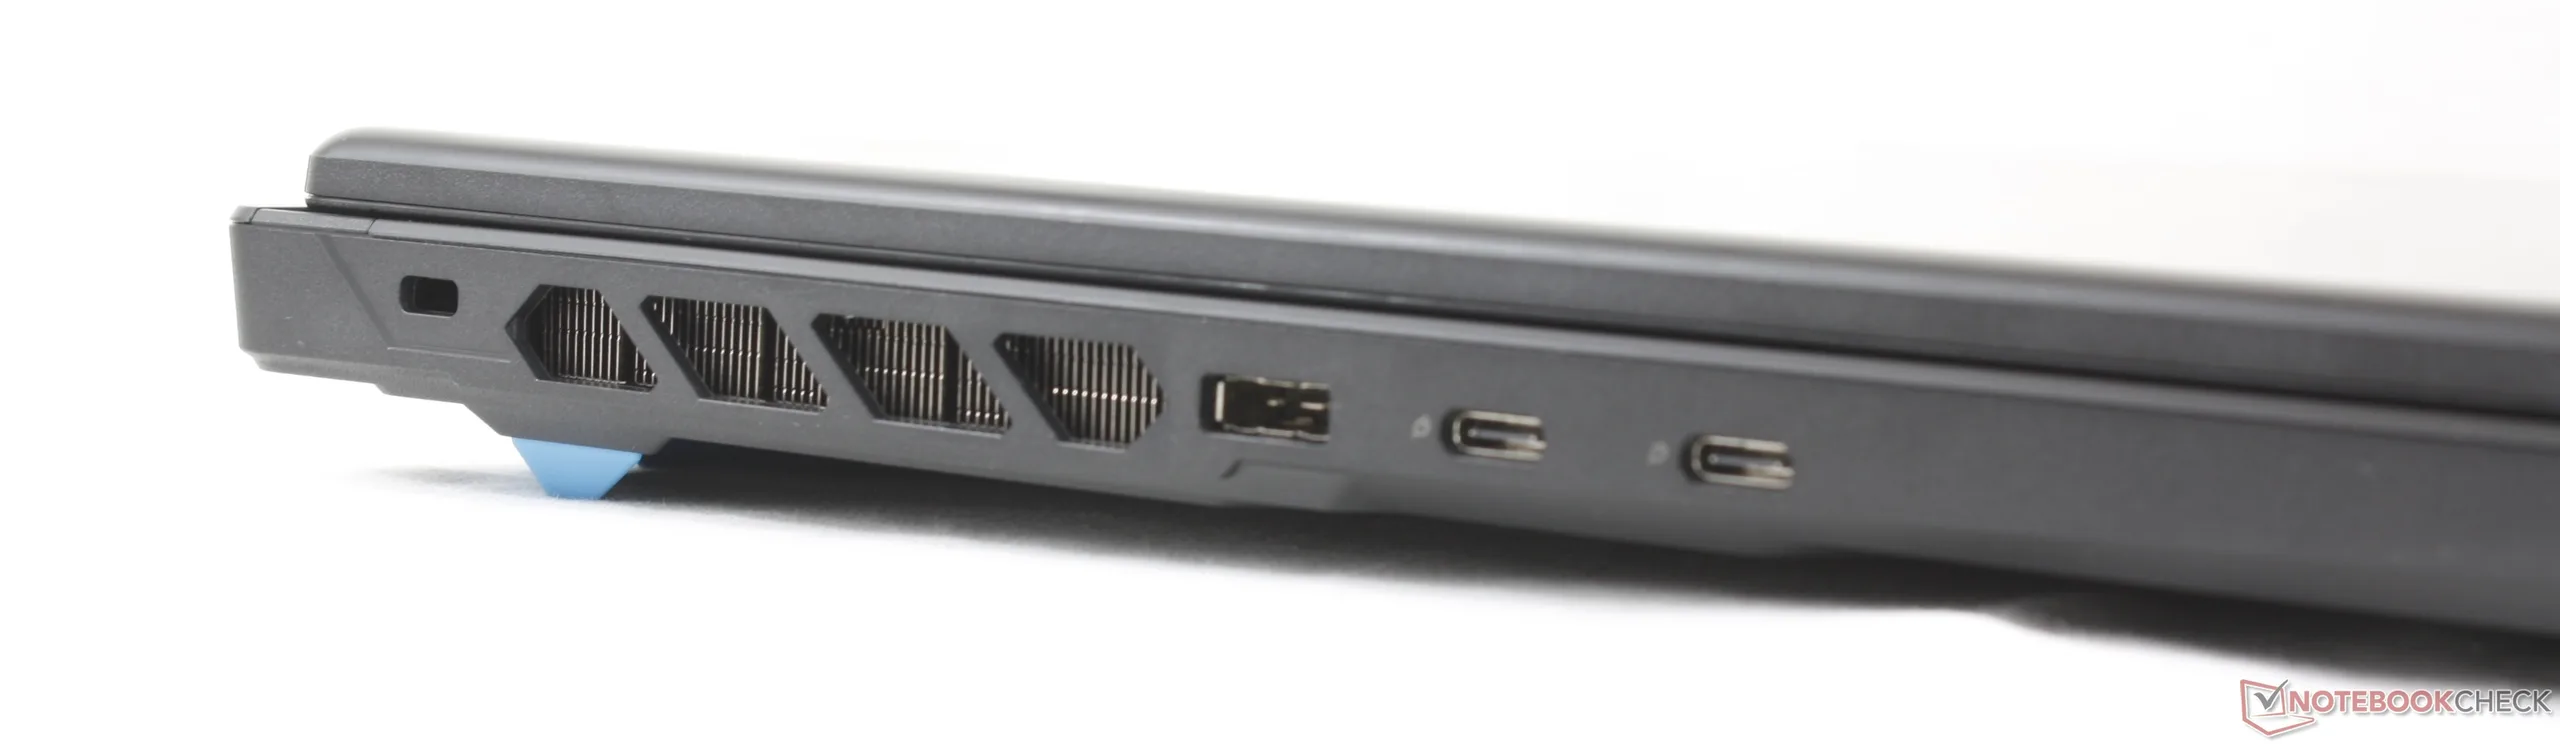
Conectividade
Comunicação
Câmera web


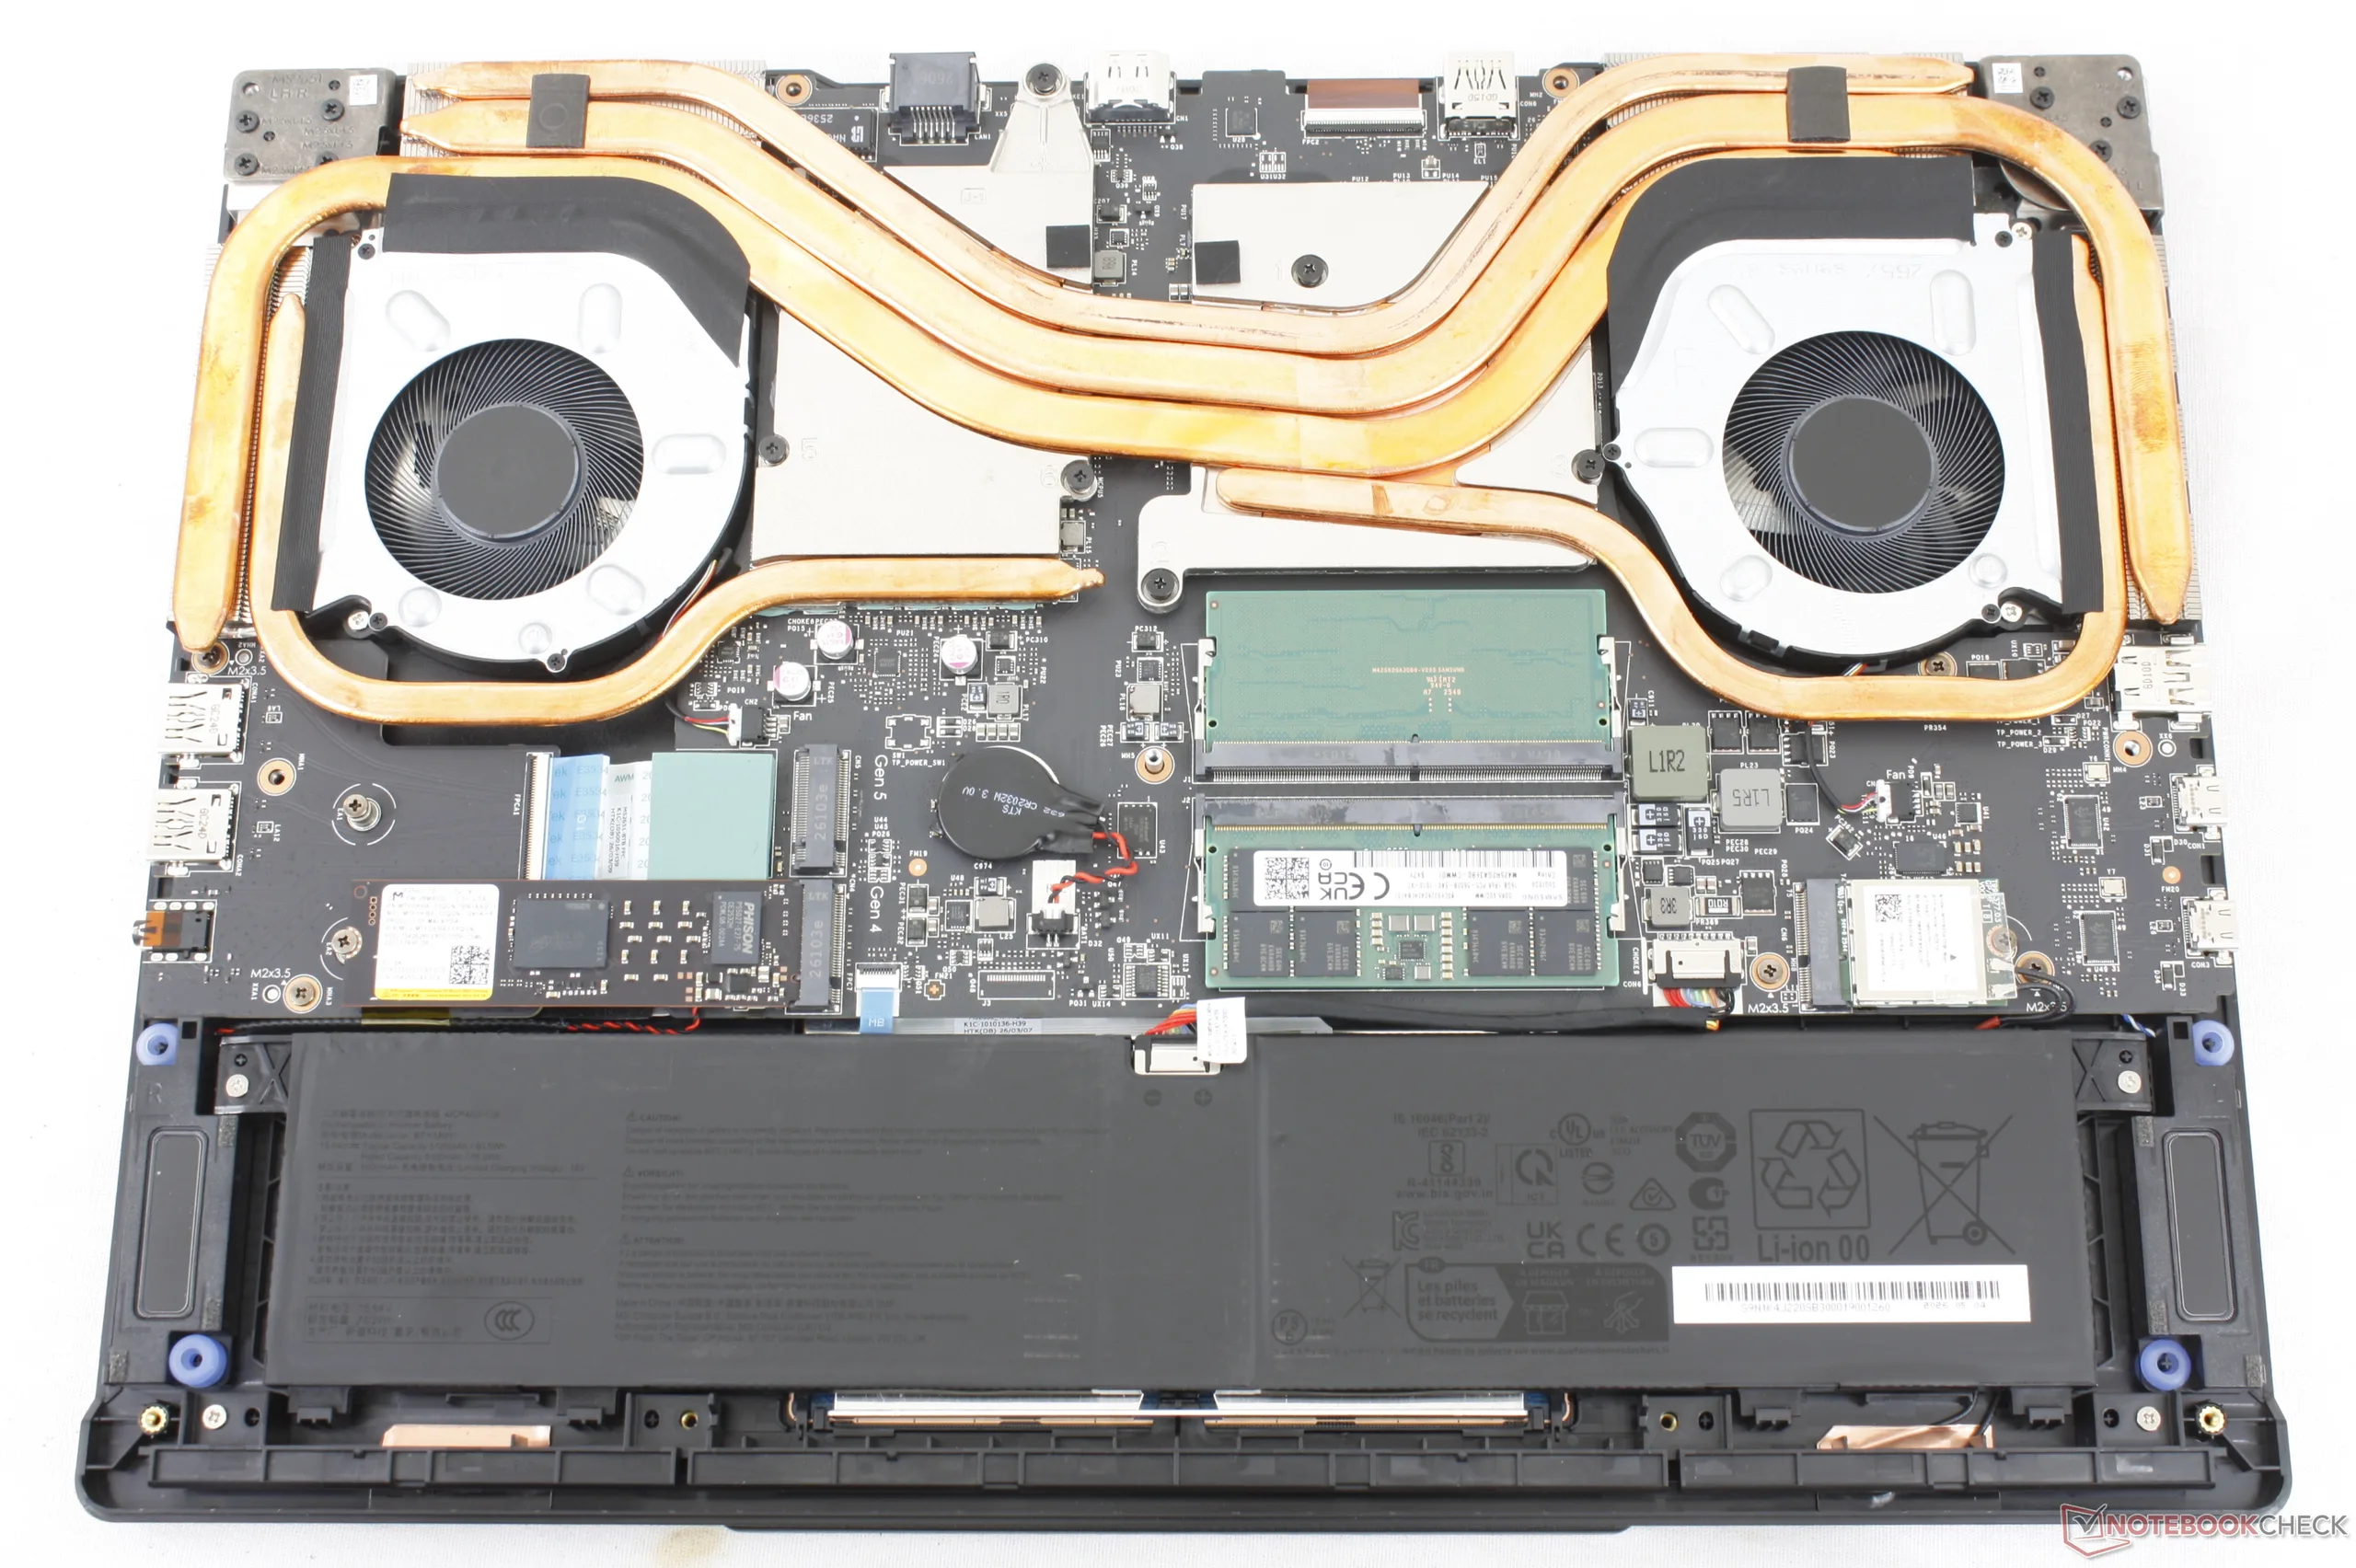
Manutenção

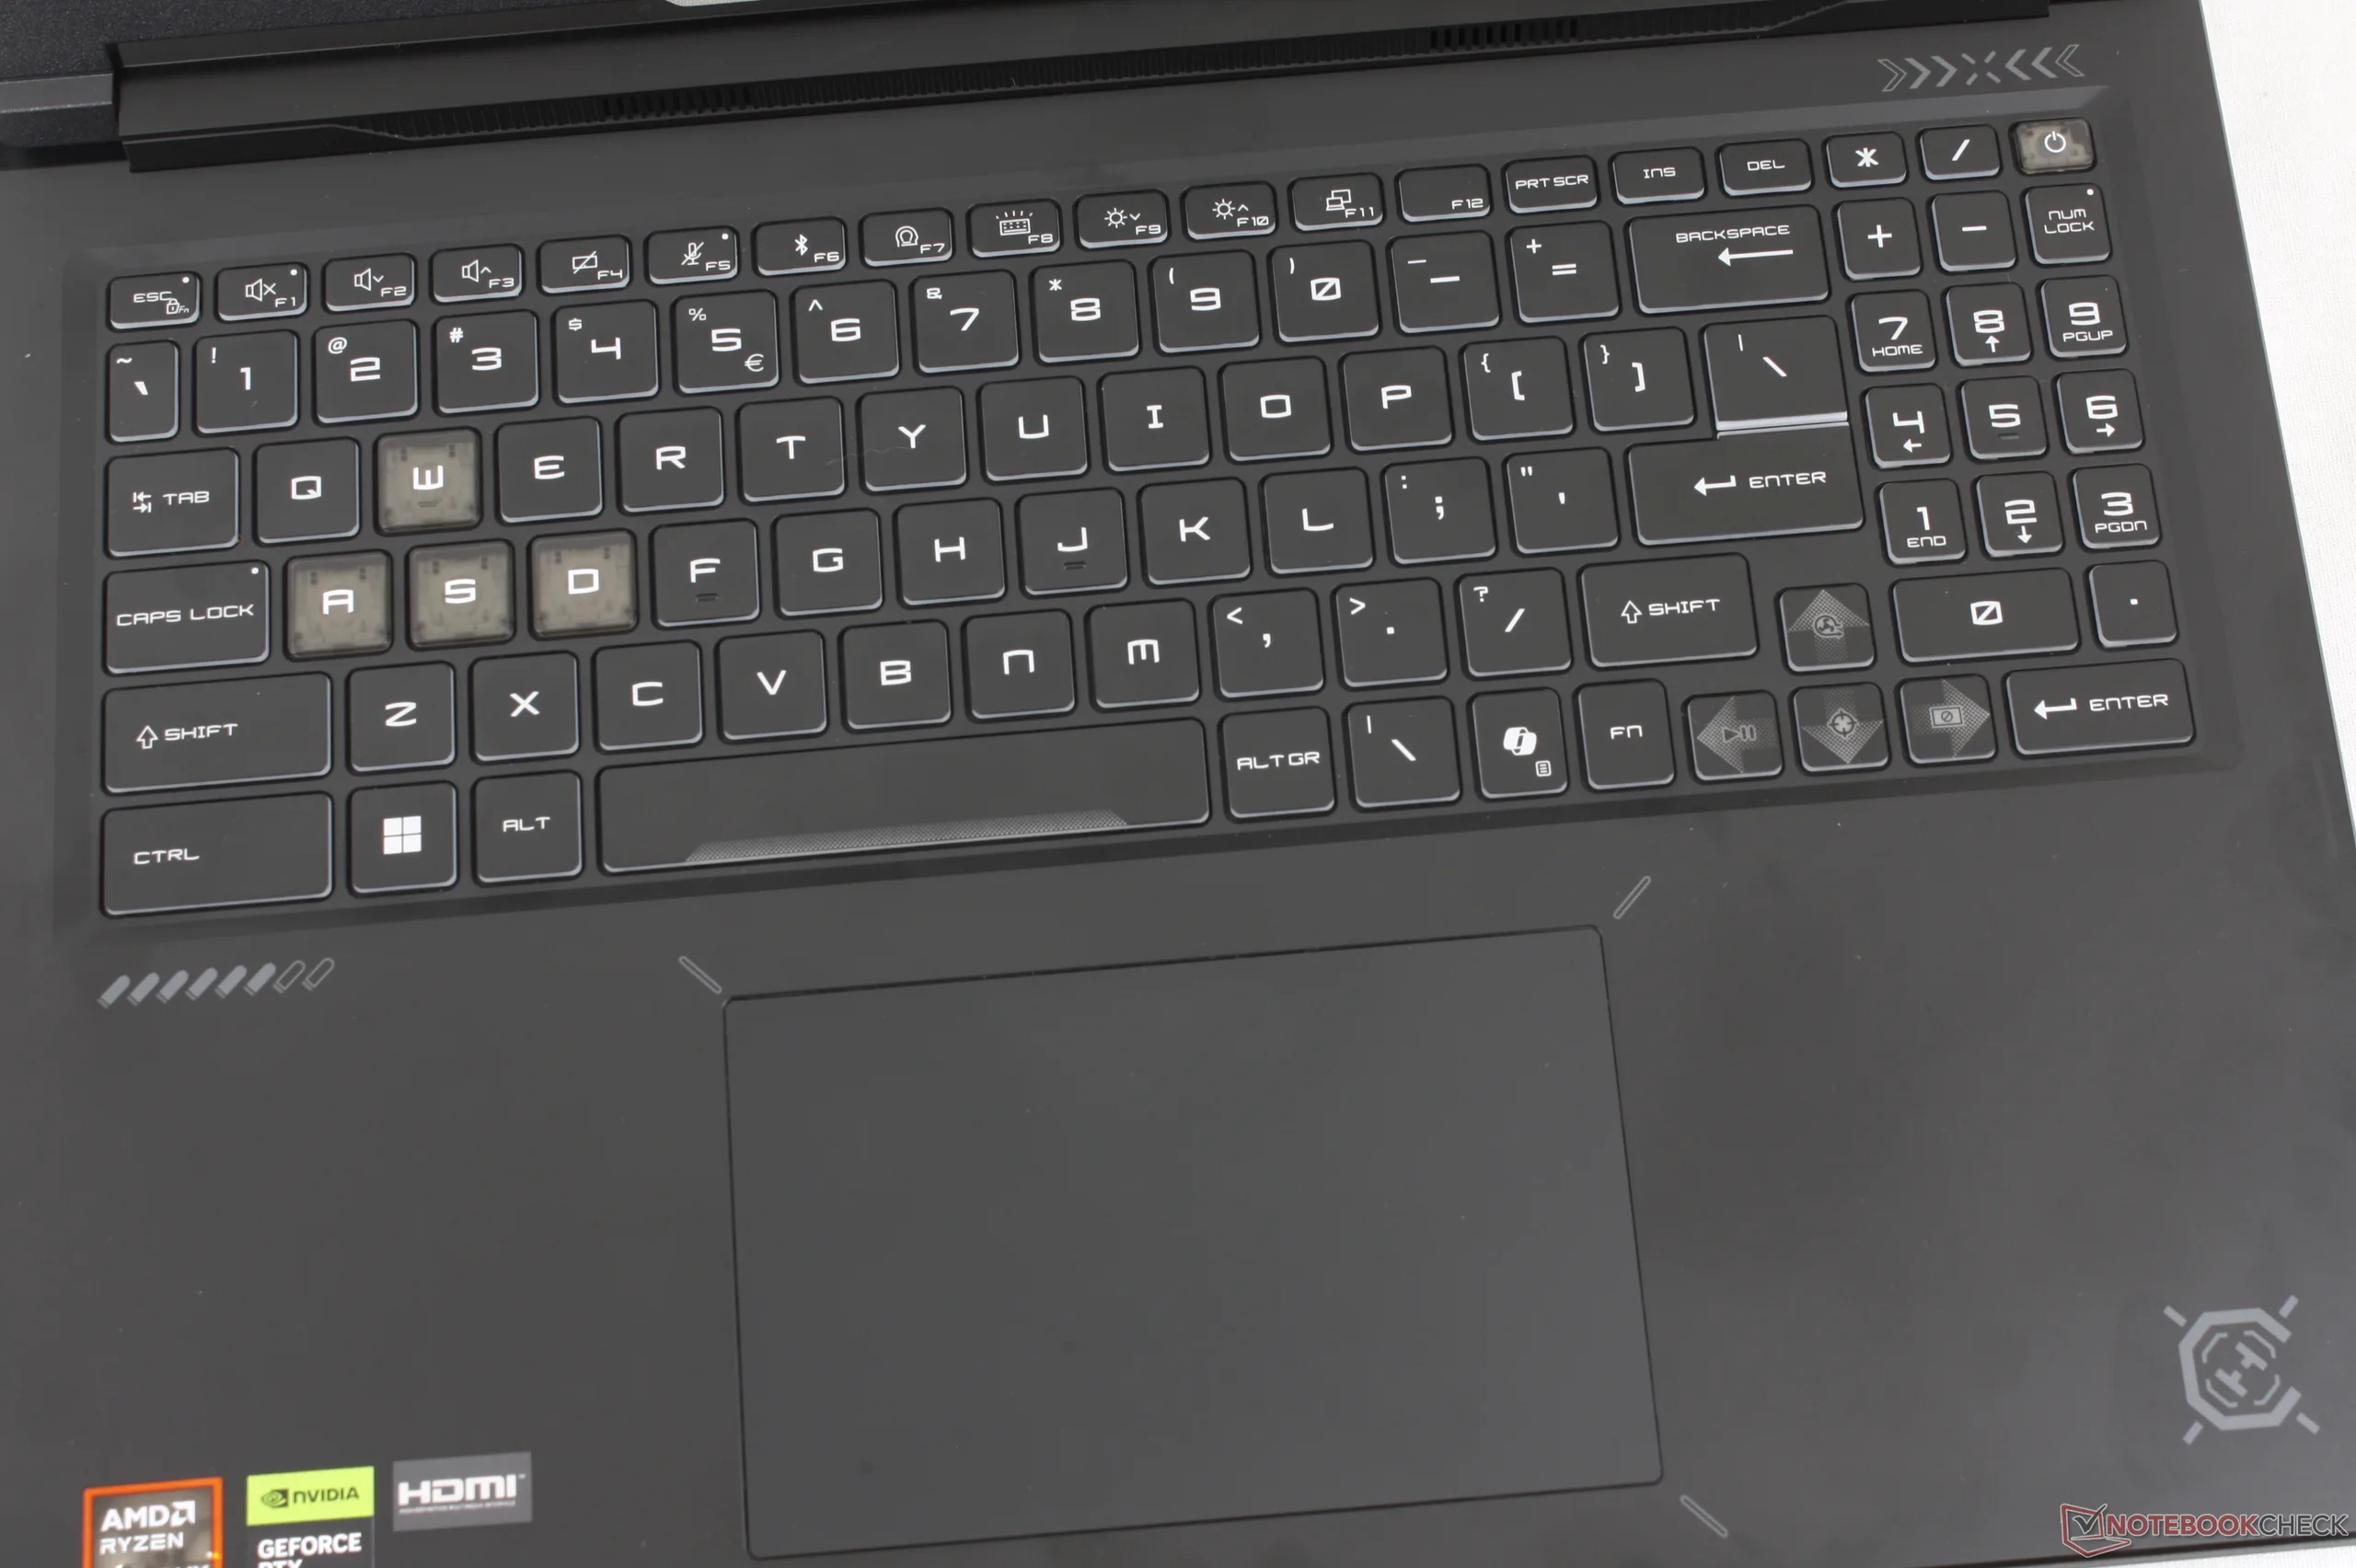
Dispositivos de entrada
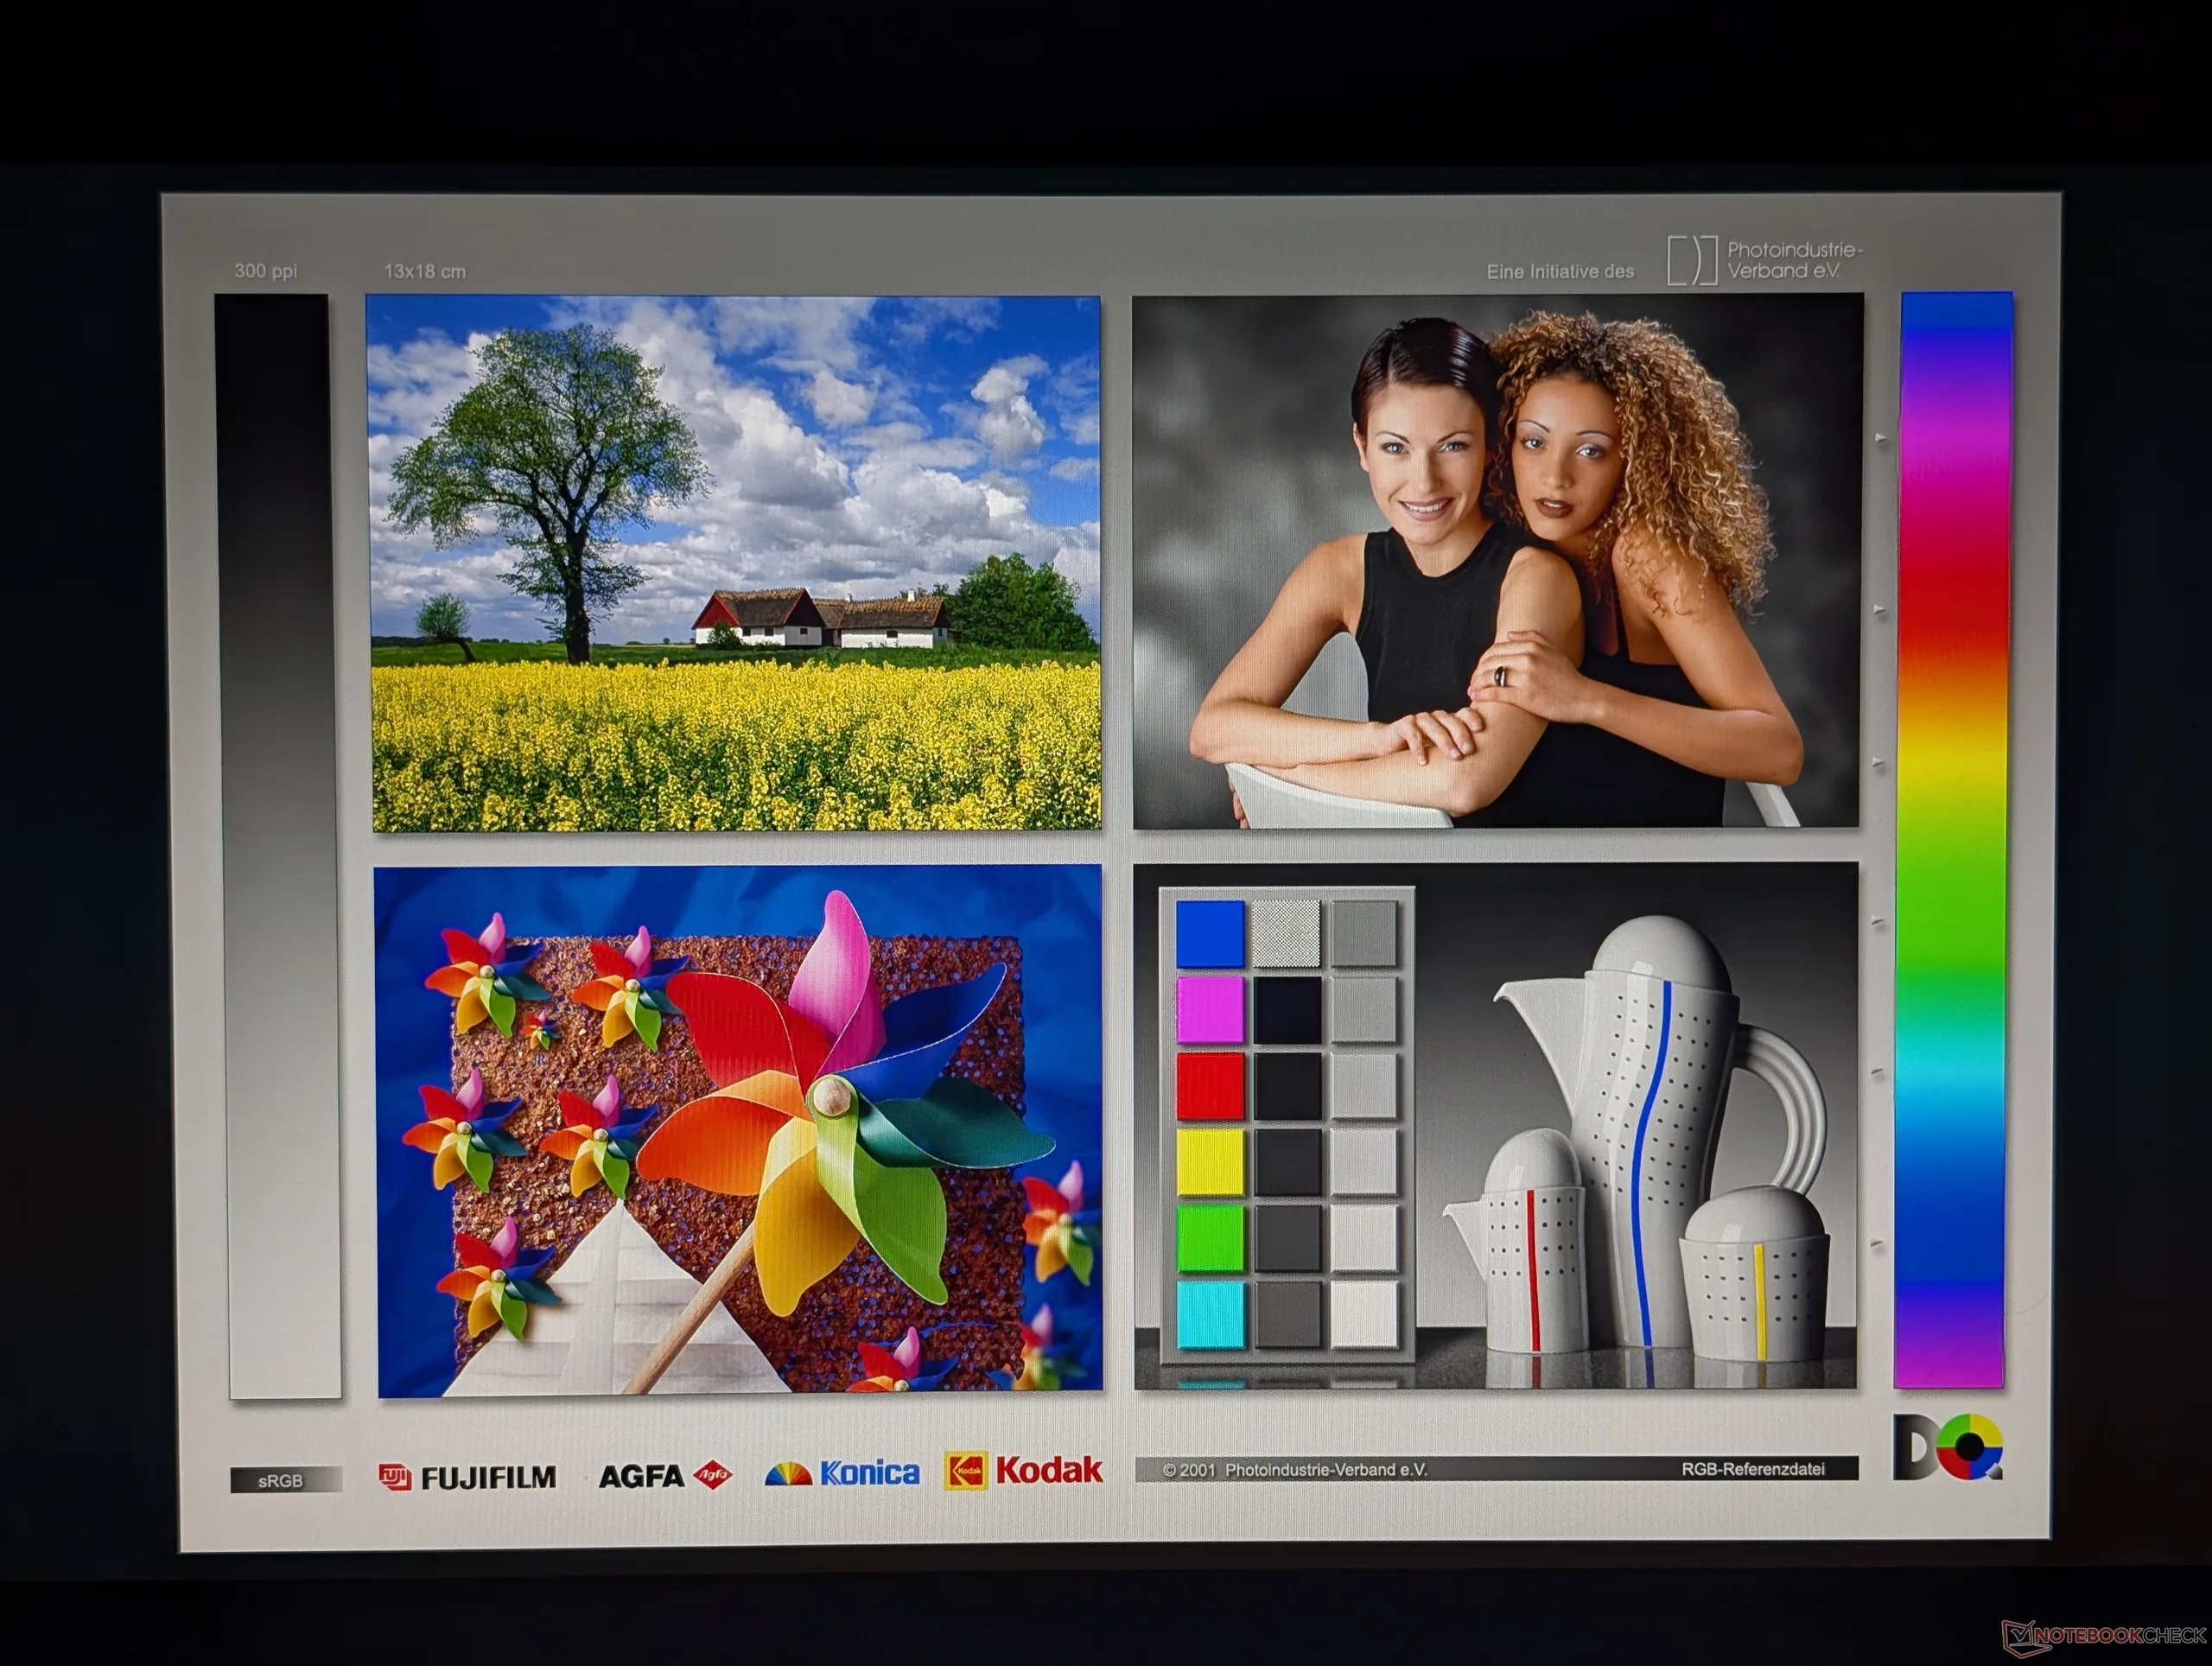
Exibição
O modelo utiliza o mesmo painel IPS B160QAN02.3 da AU Optronics encontrado no Crosshair 16 HX AI com processador Intel.


| |||||||||||||||||||||||||
iluminação: 89 %
iluminação com acumulador: 512.4 cd/m²
Contraste: 1314:1 (Preto: 0.39 cd/m²)
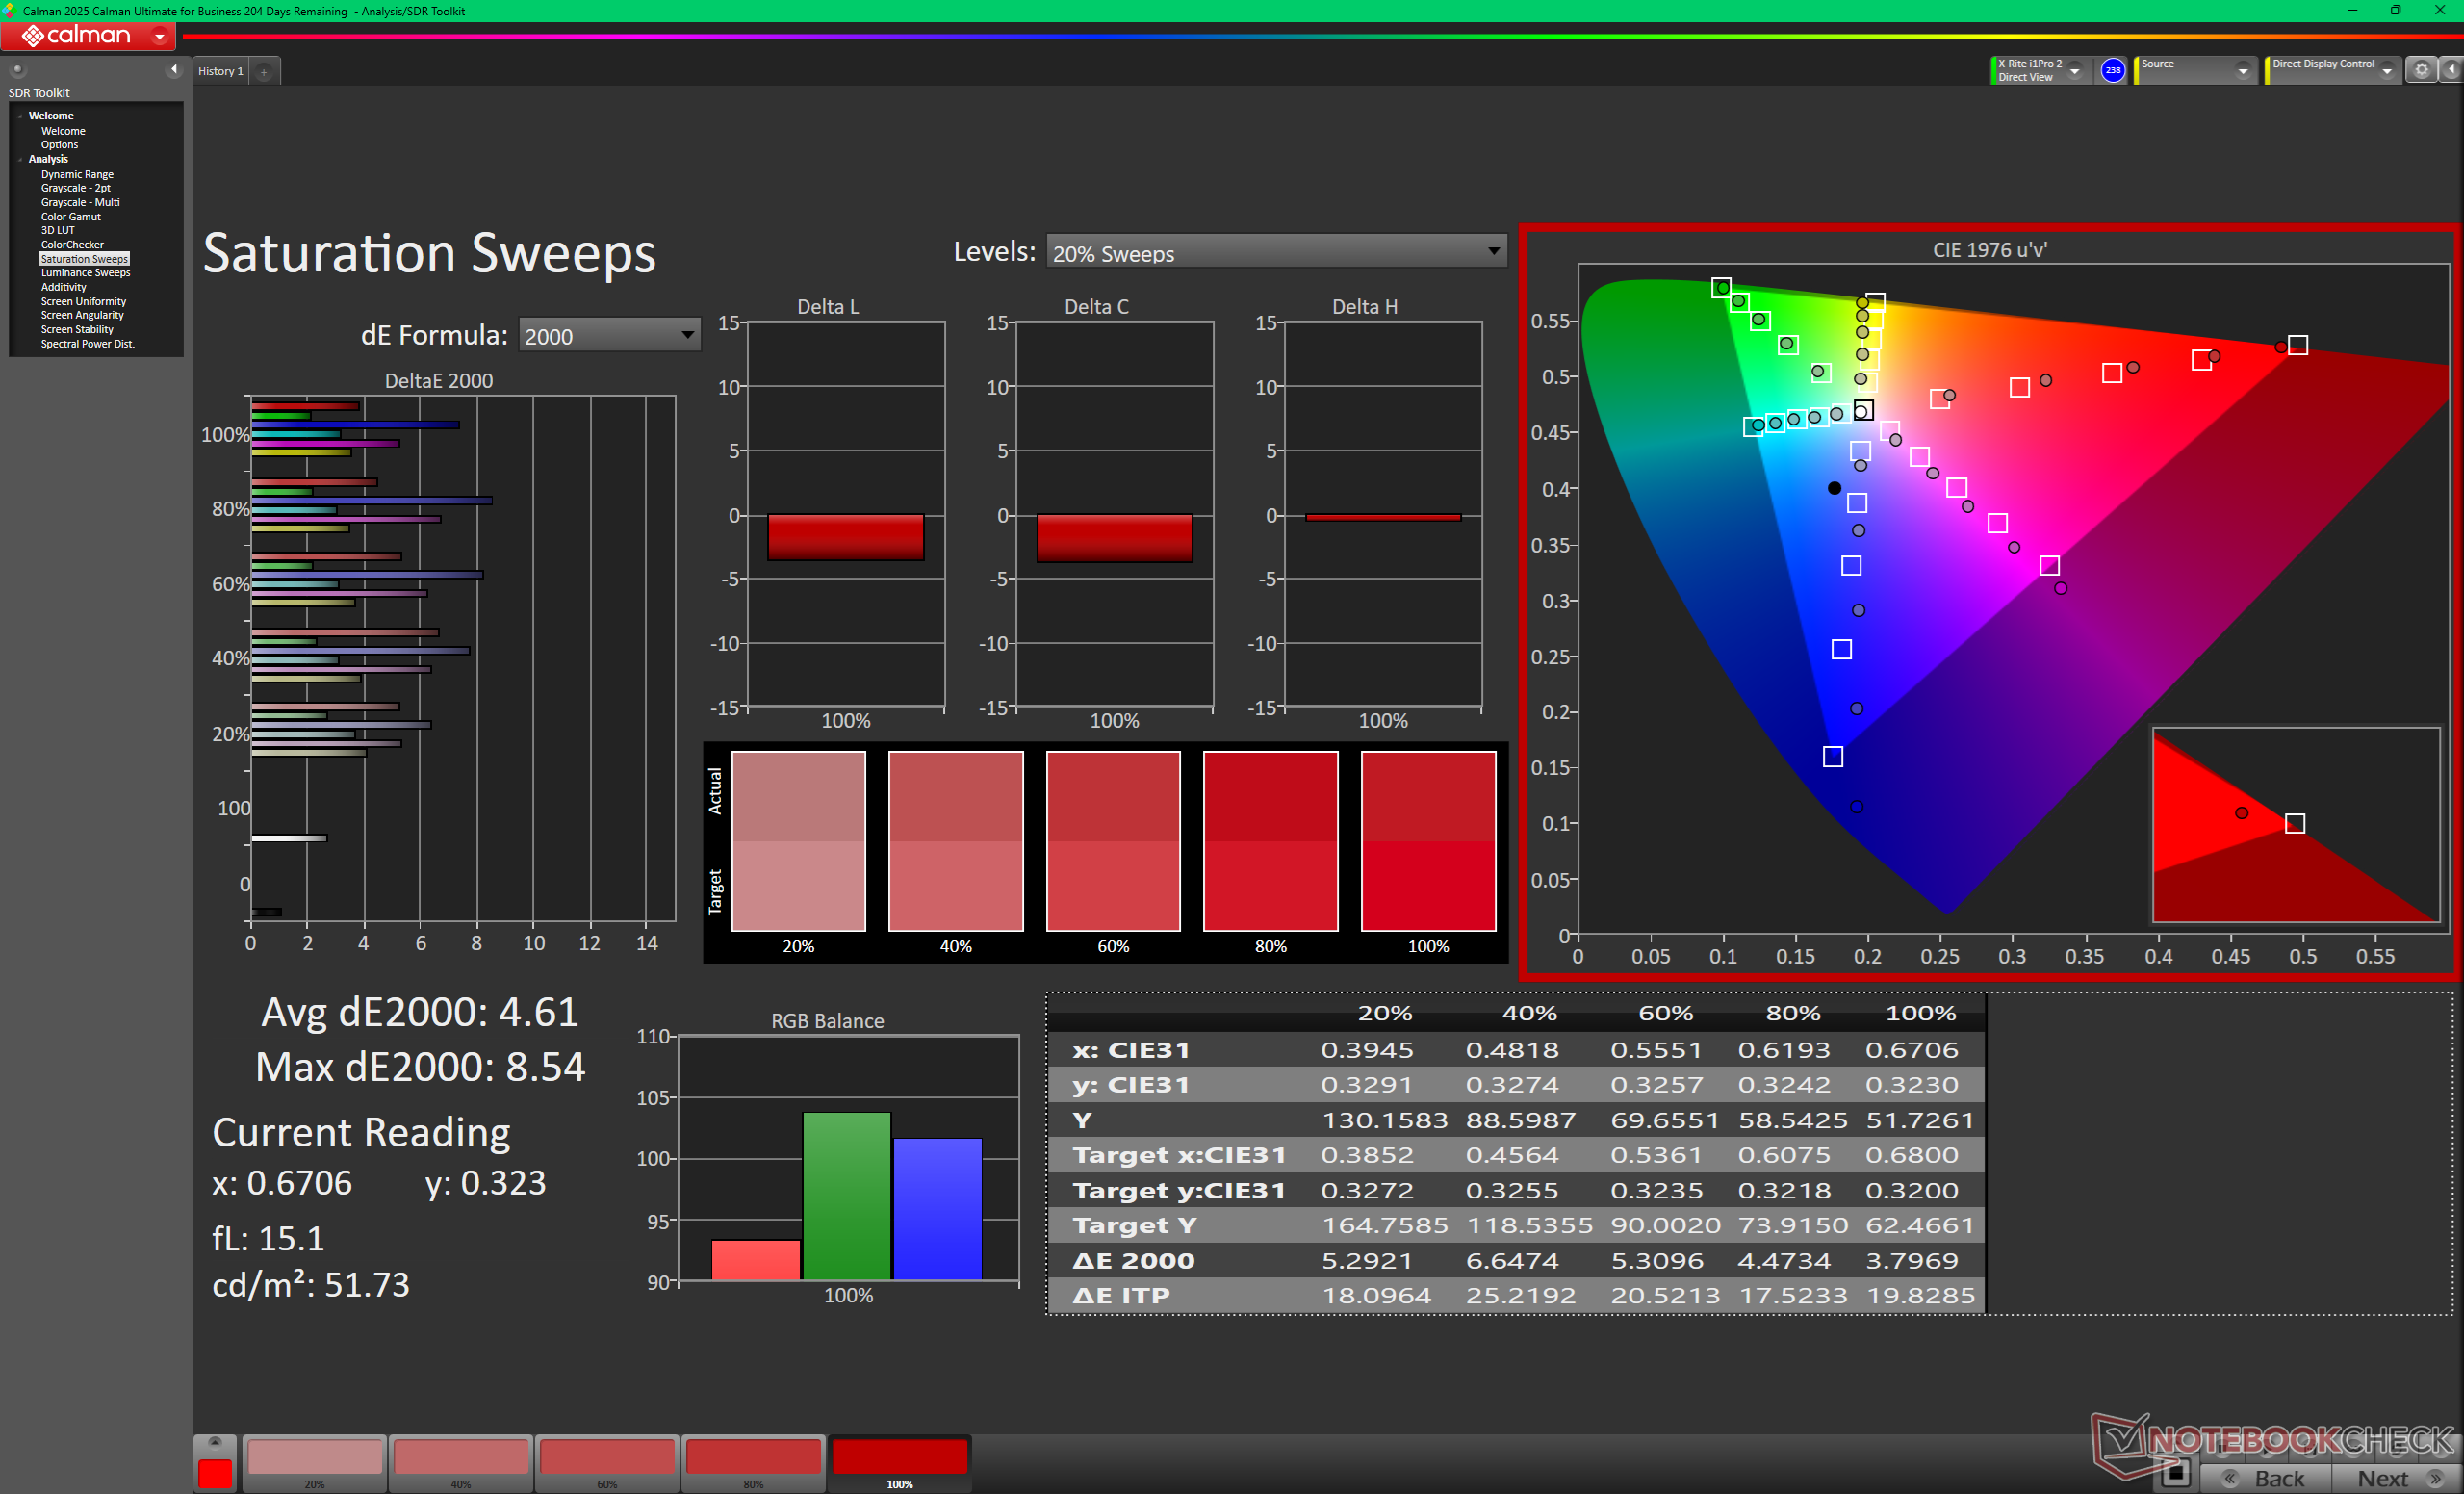
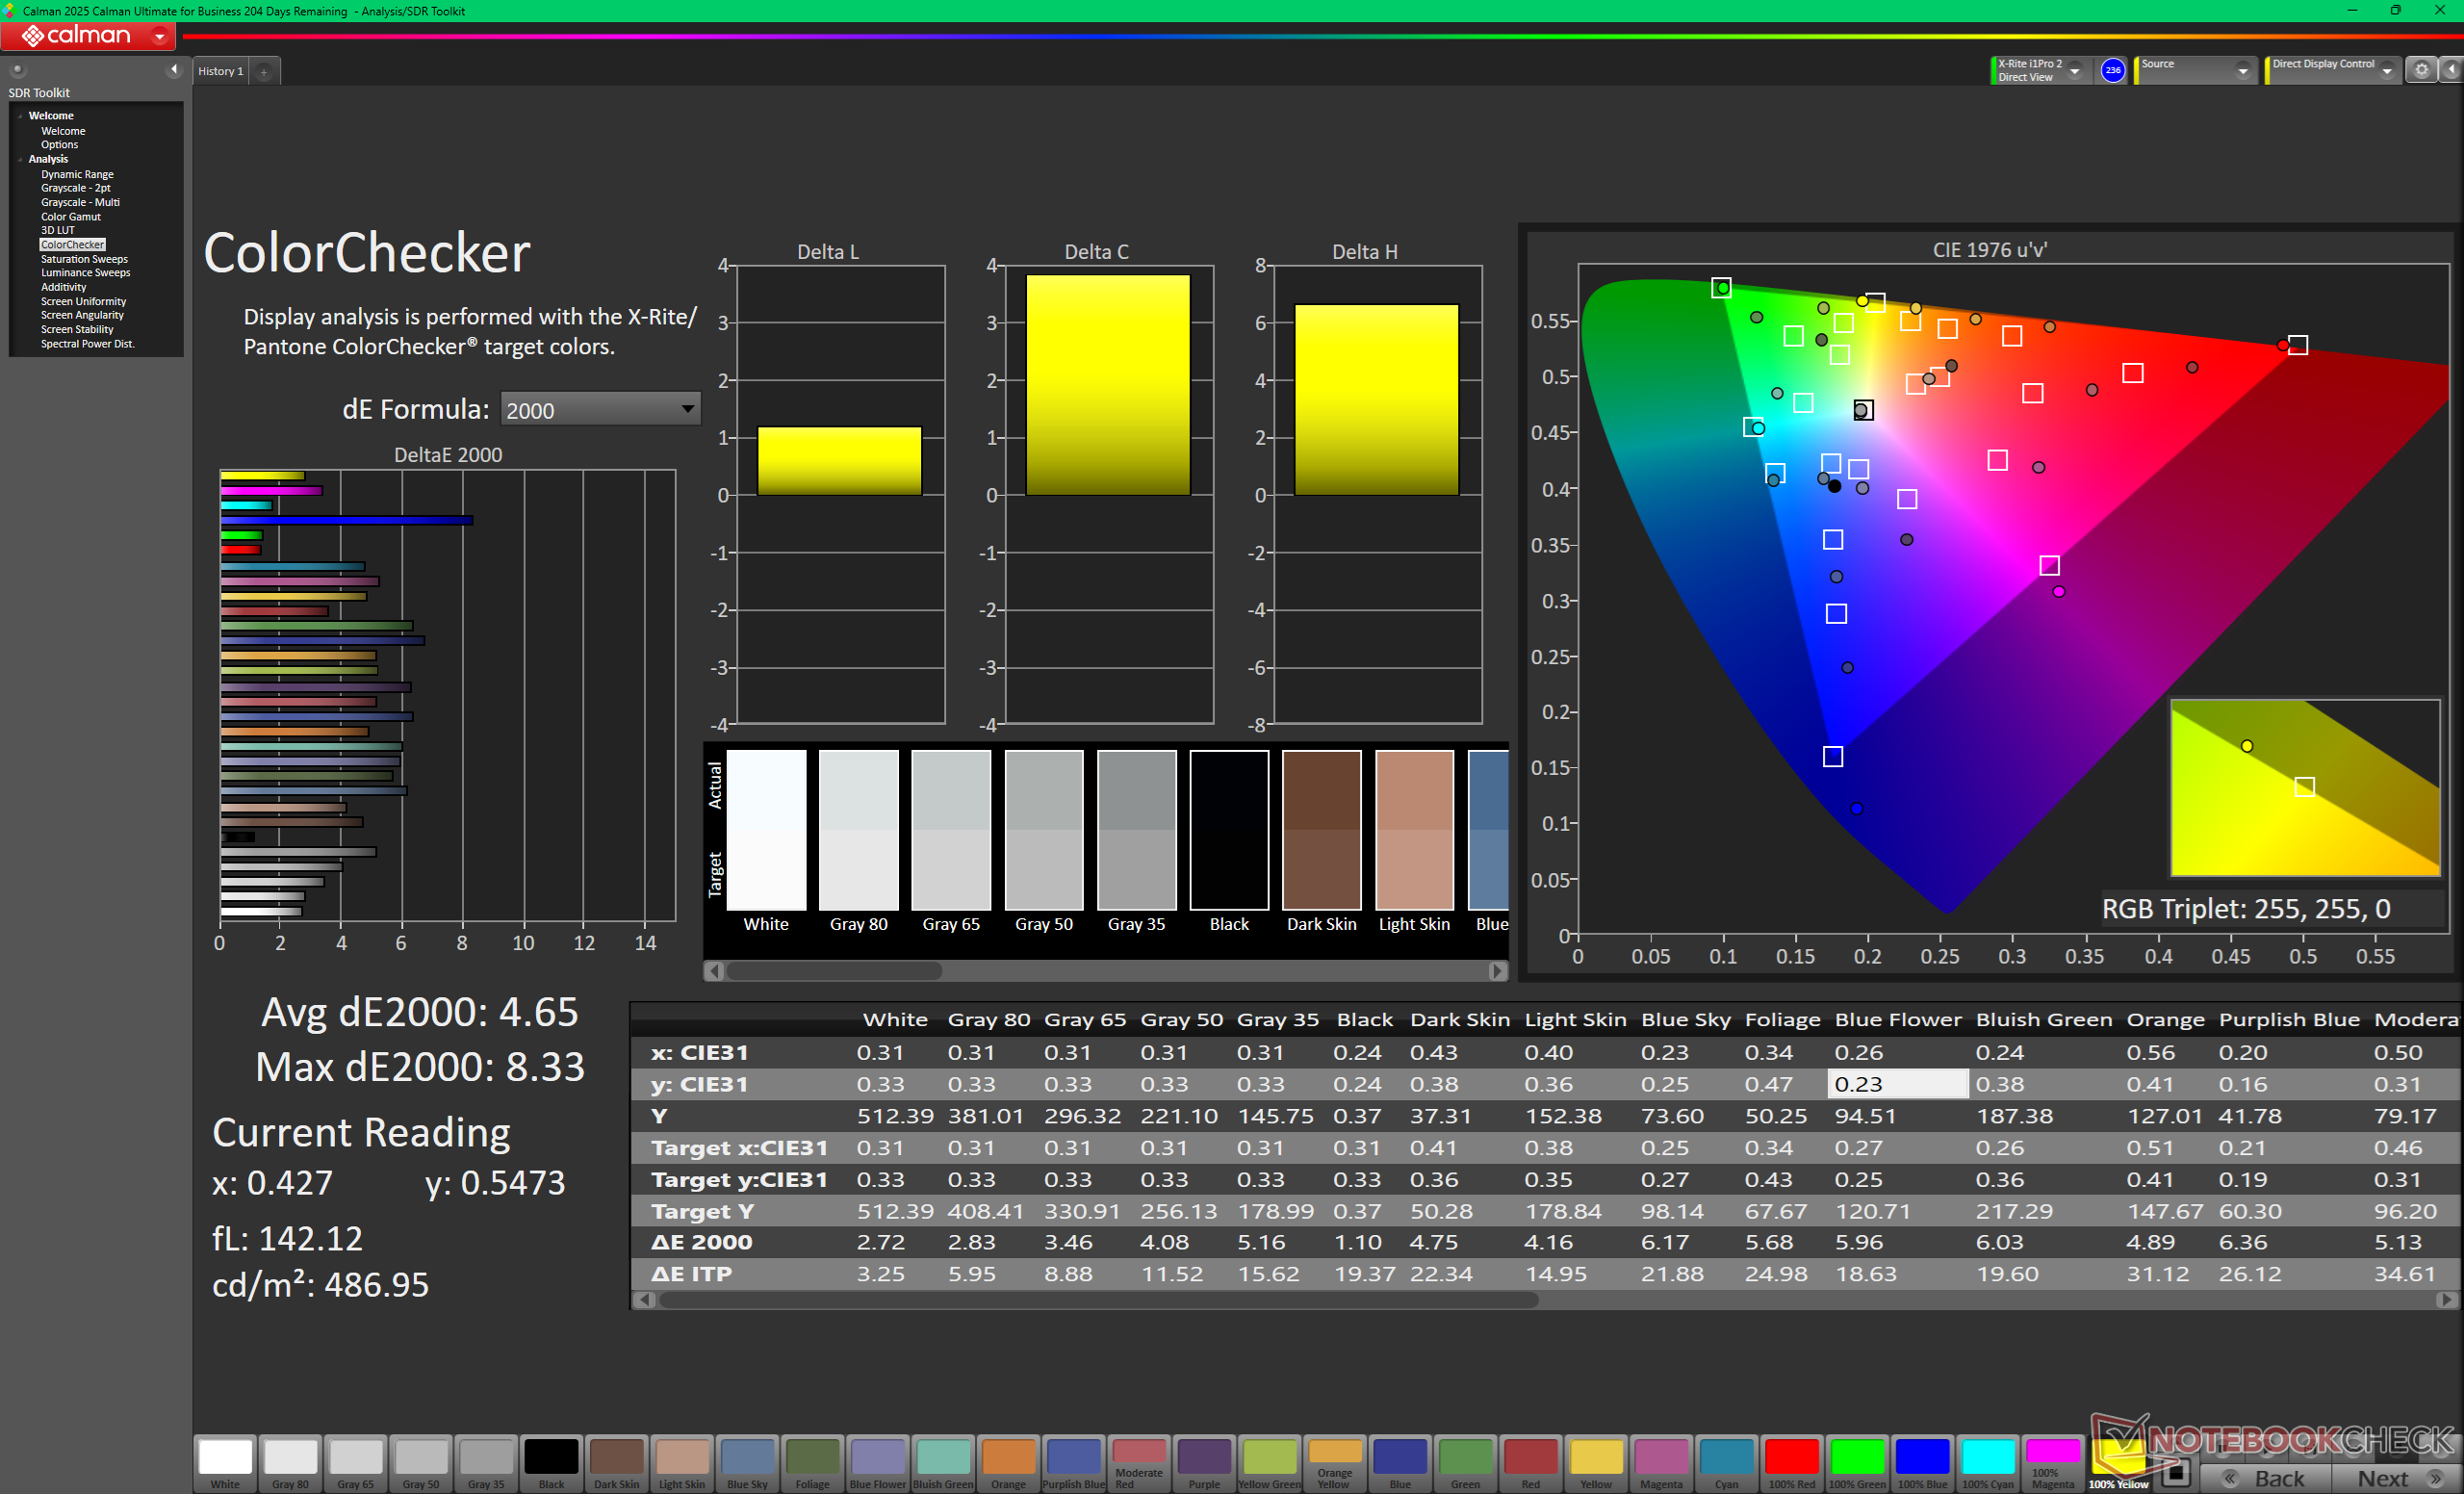
ΔE ColorChecker Calman: 4.65 | ∀{0.5-29.43 Ø4.72}
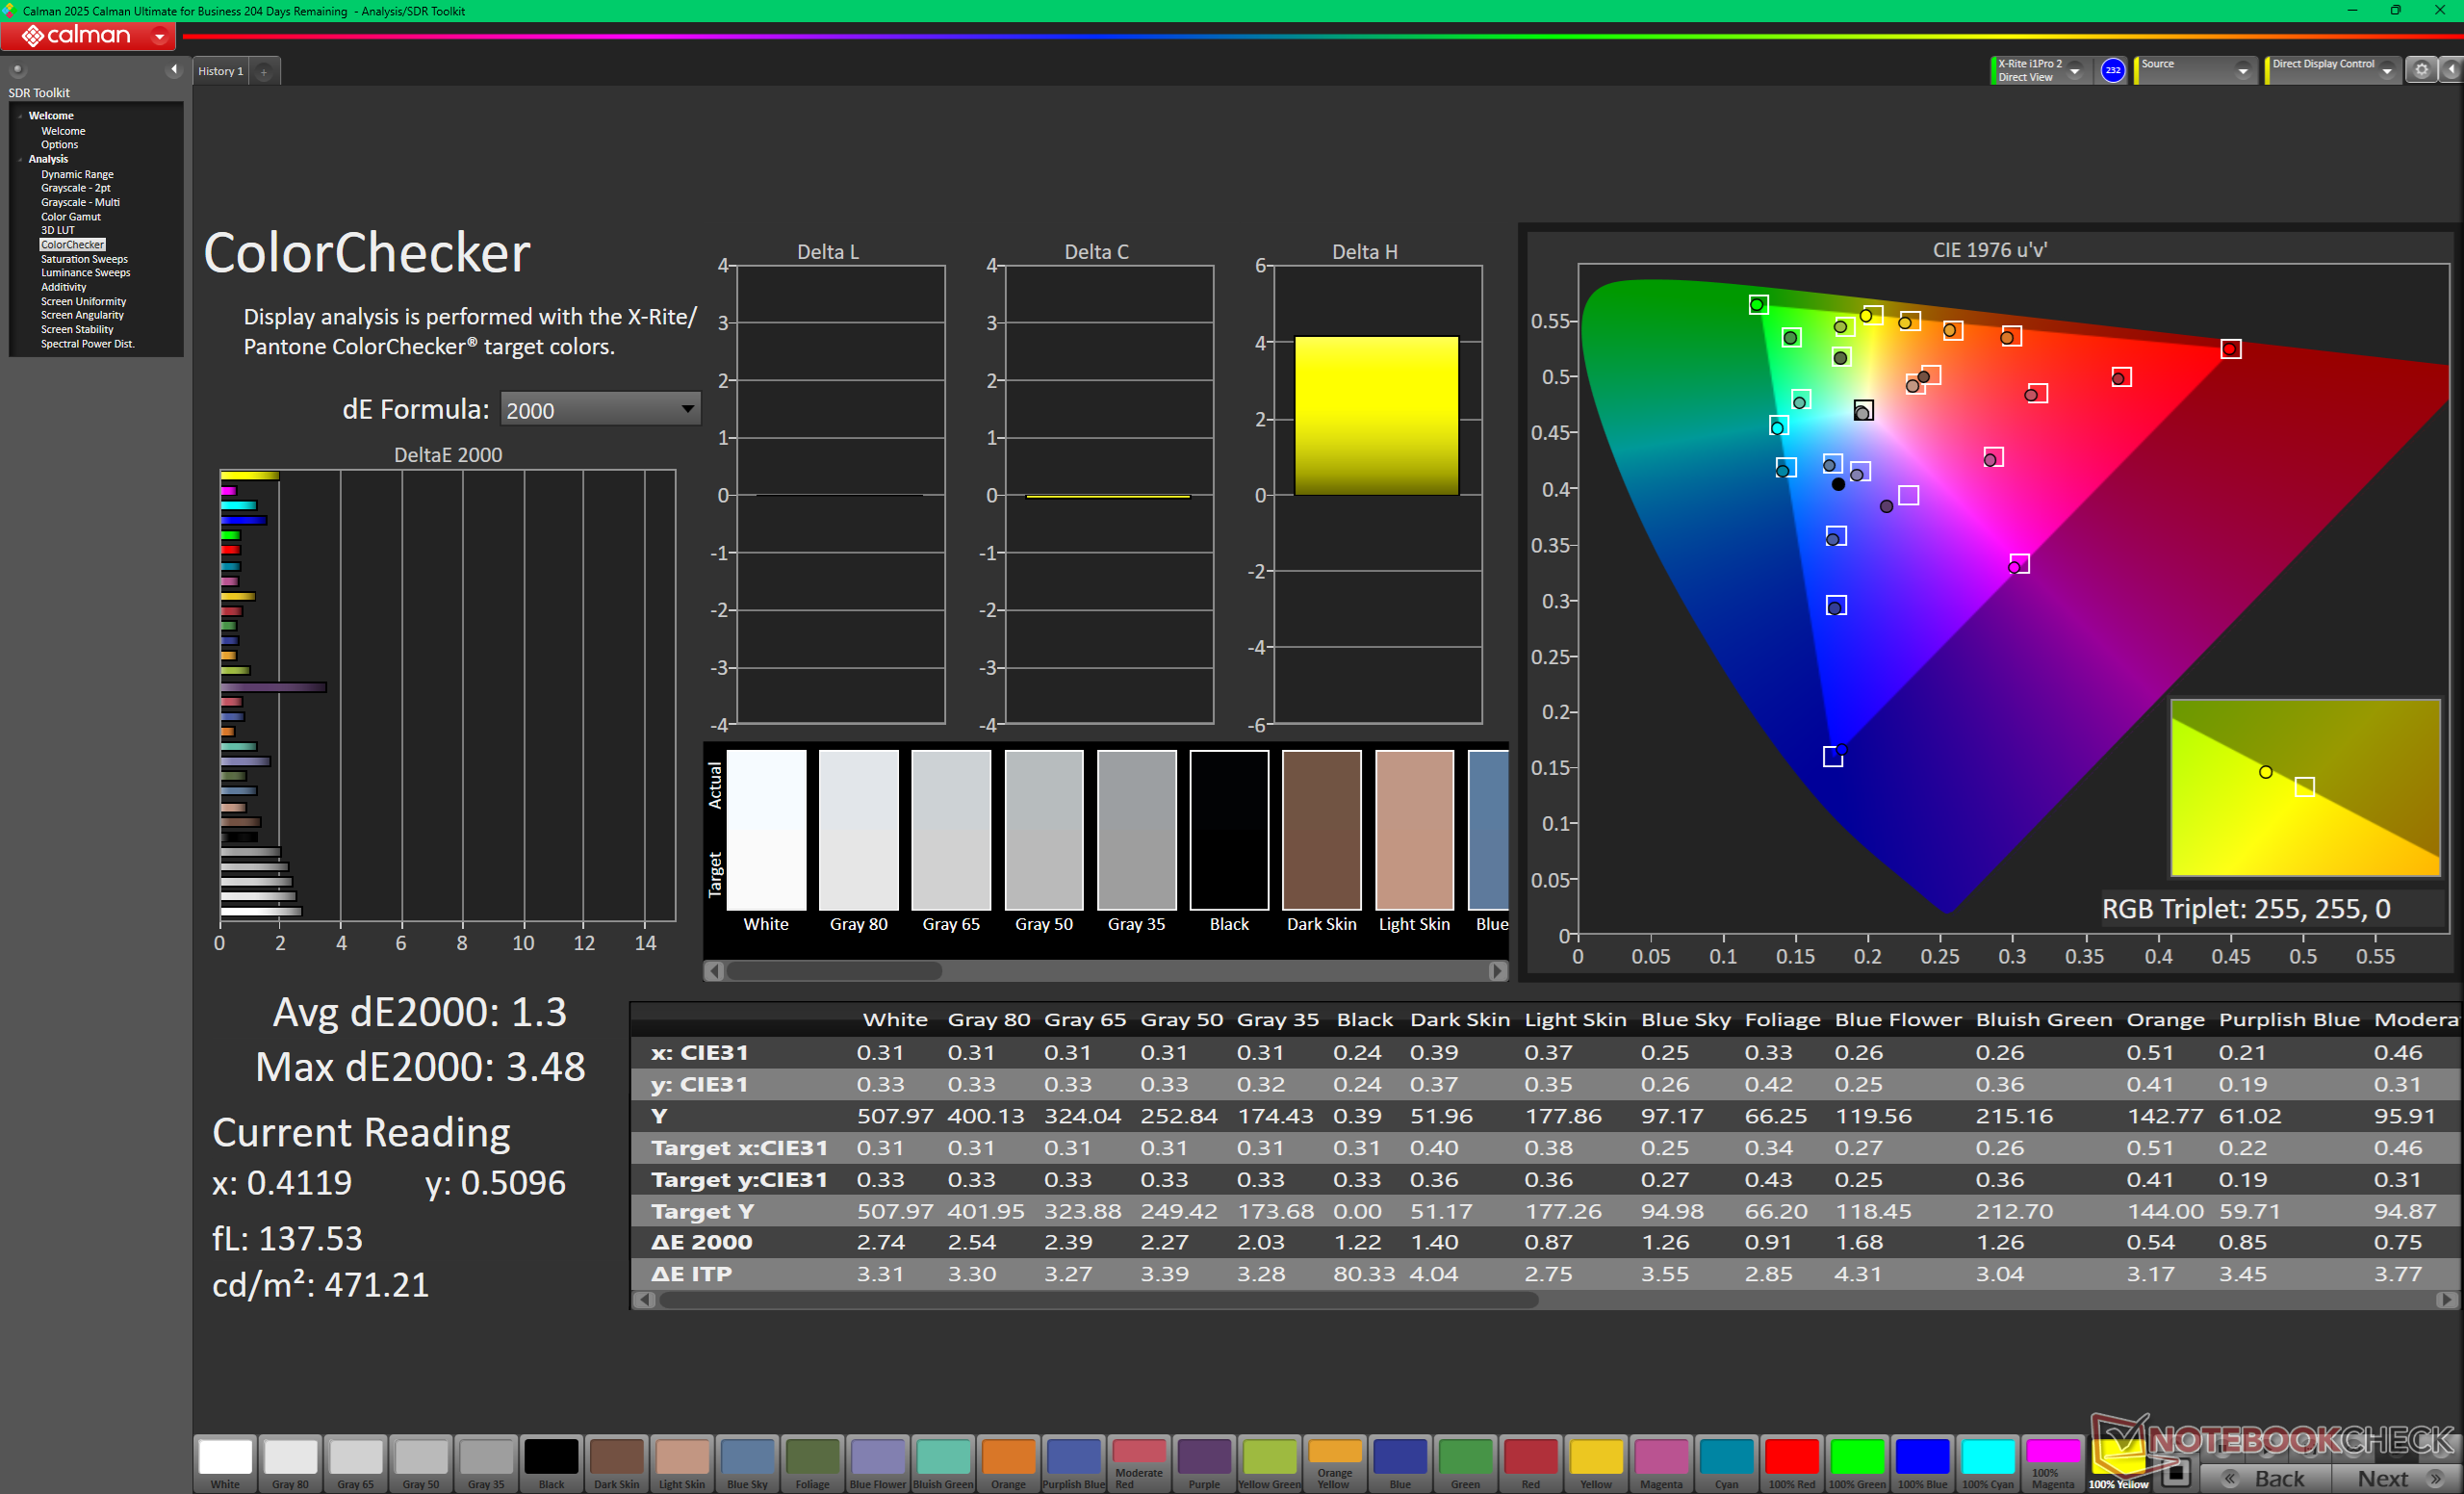
calibrated: 1.3
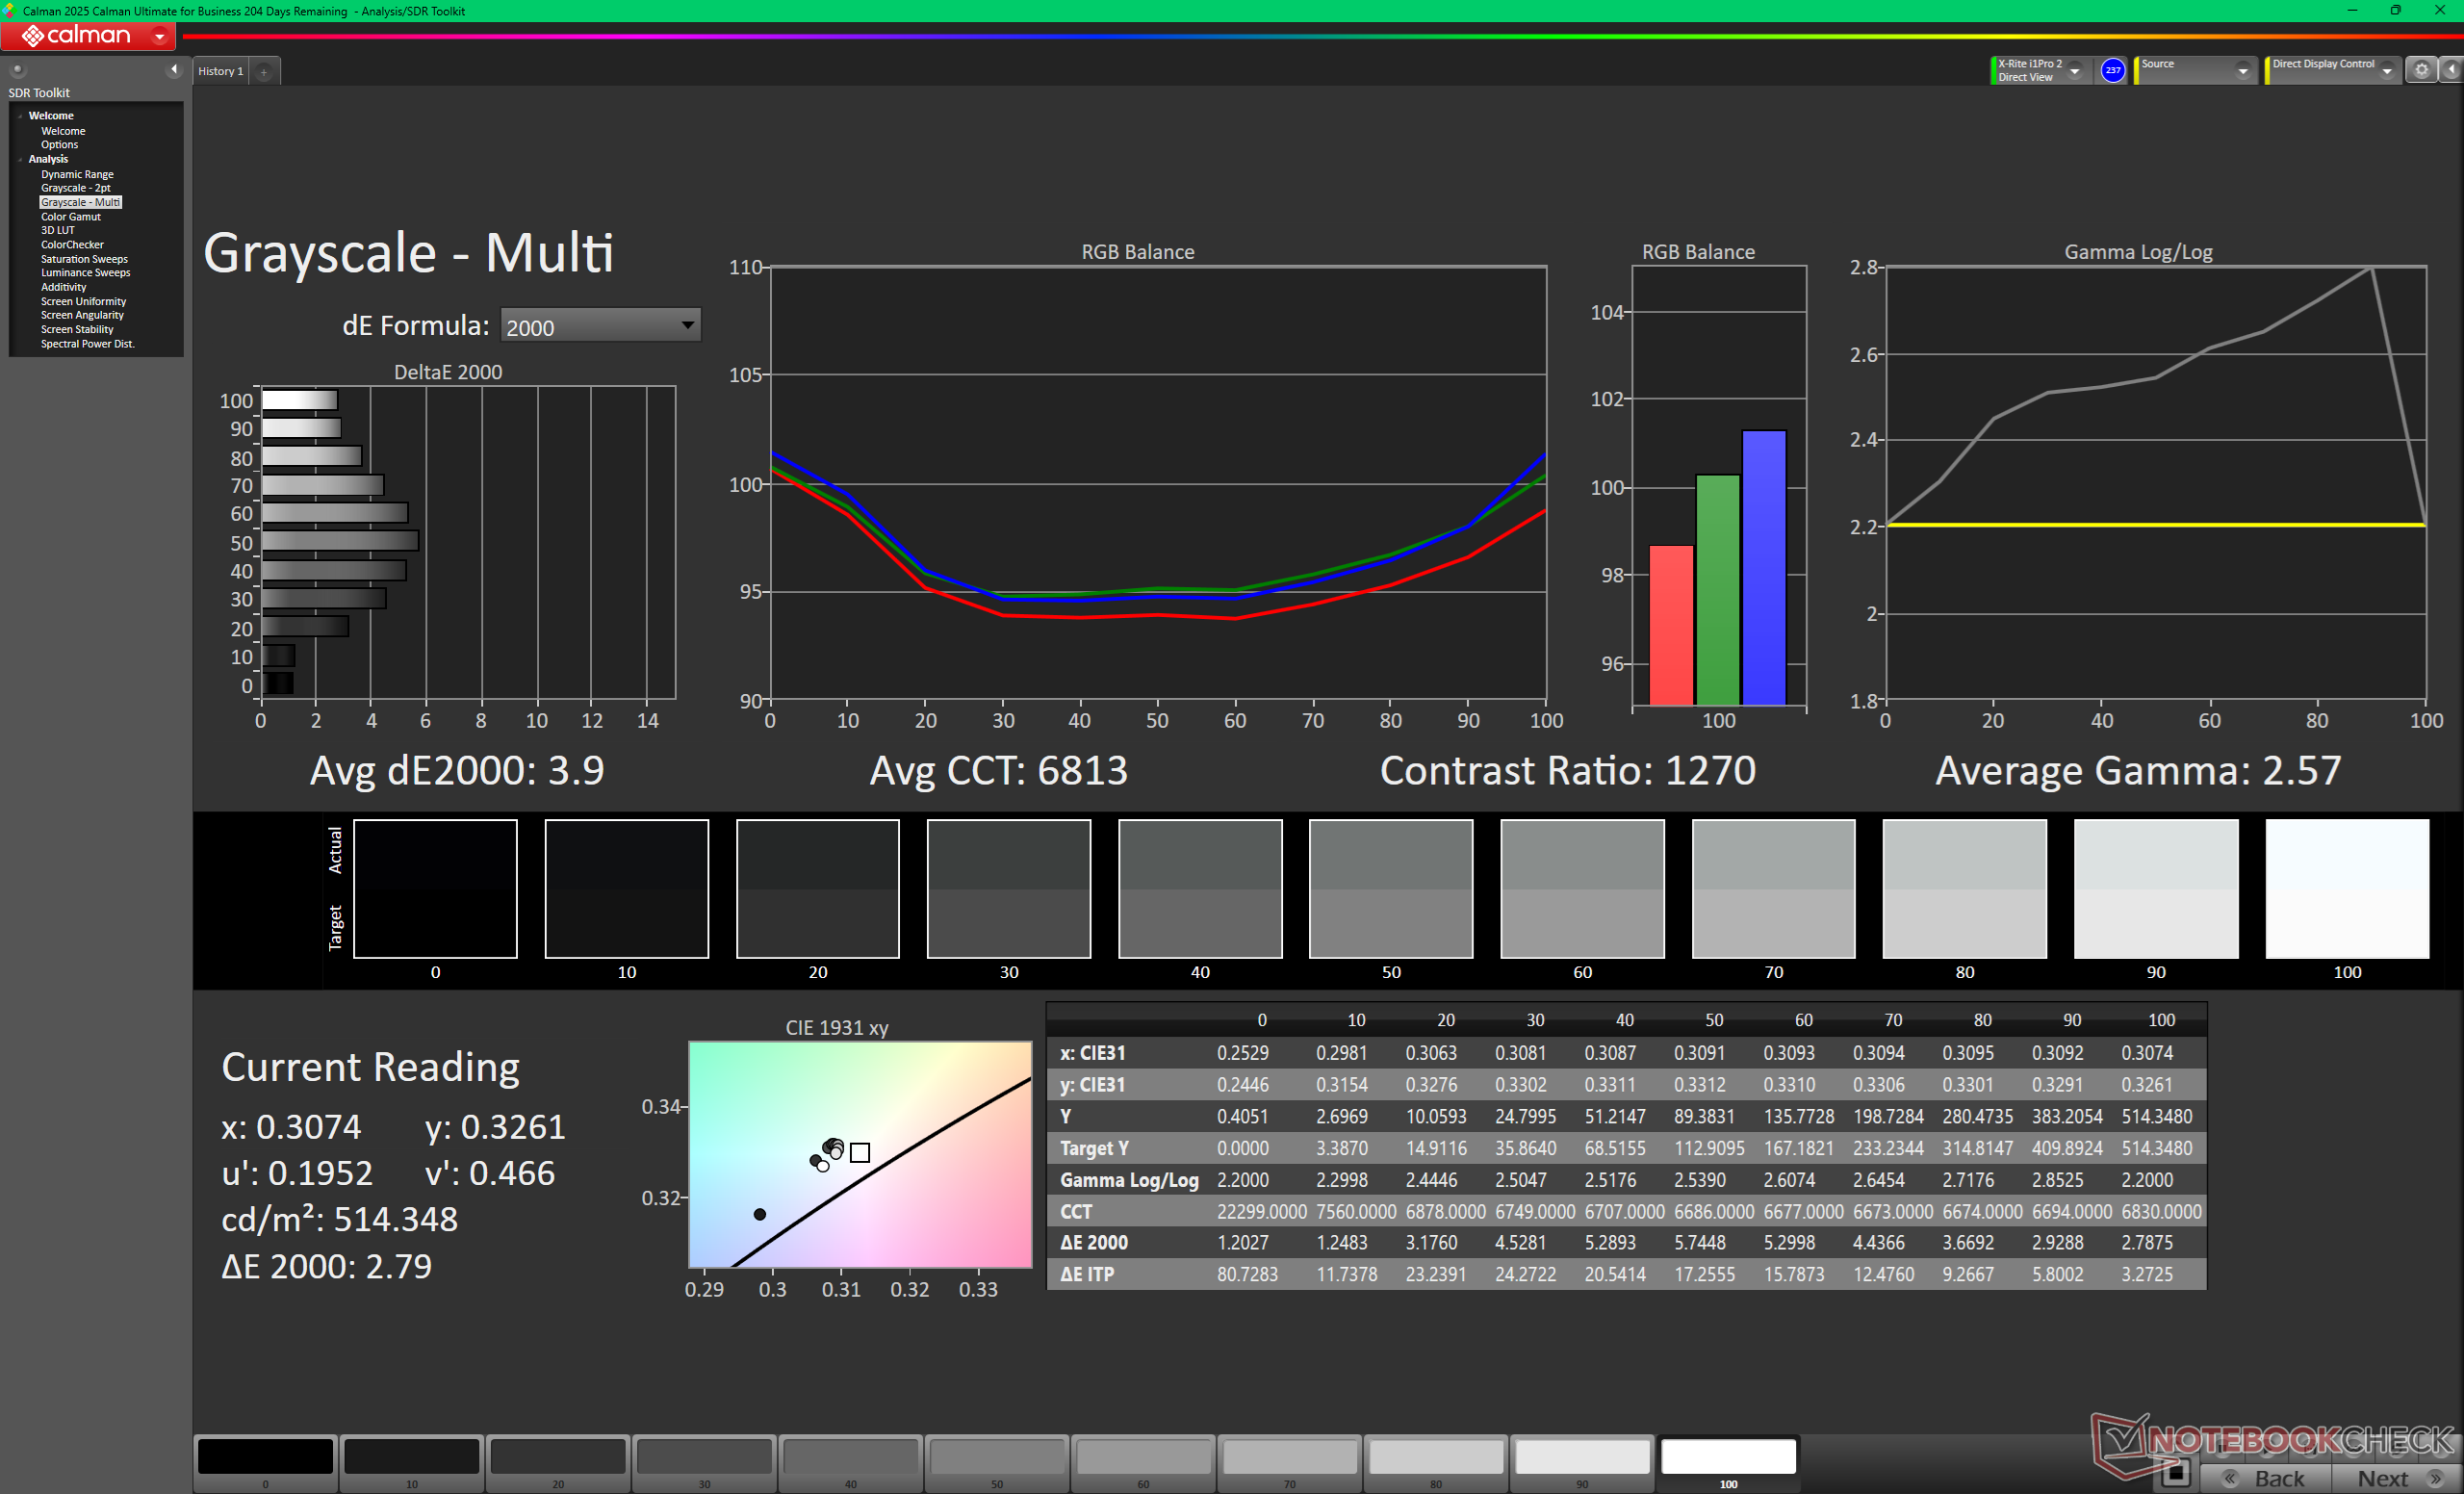
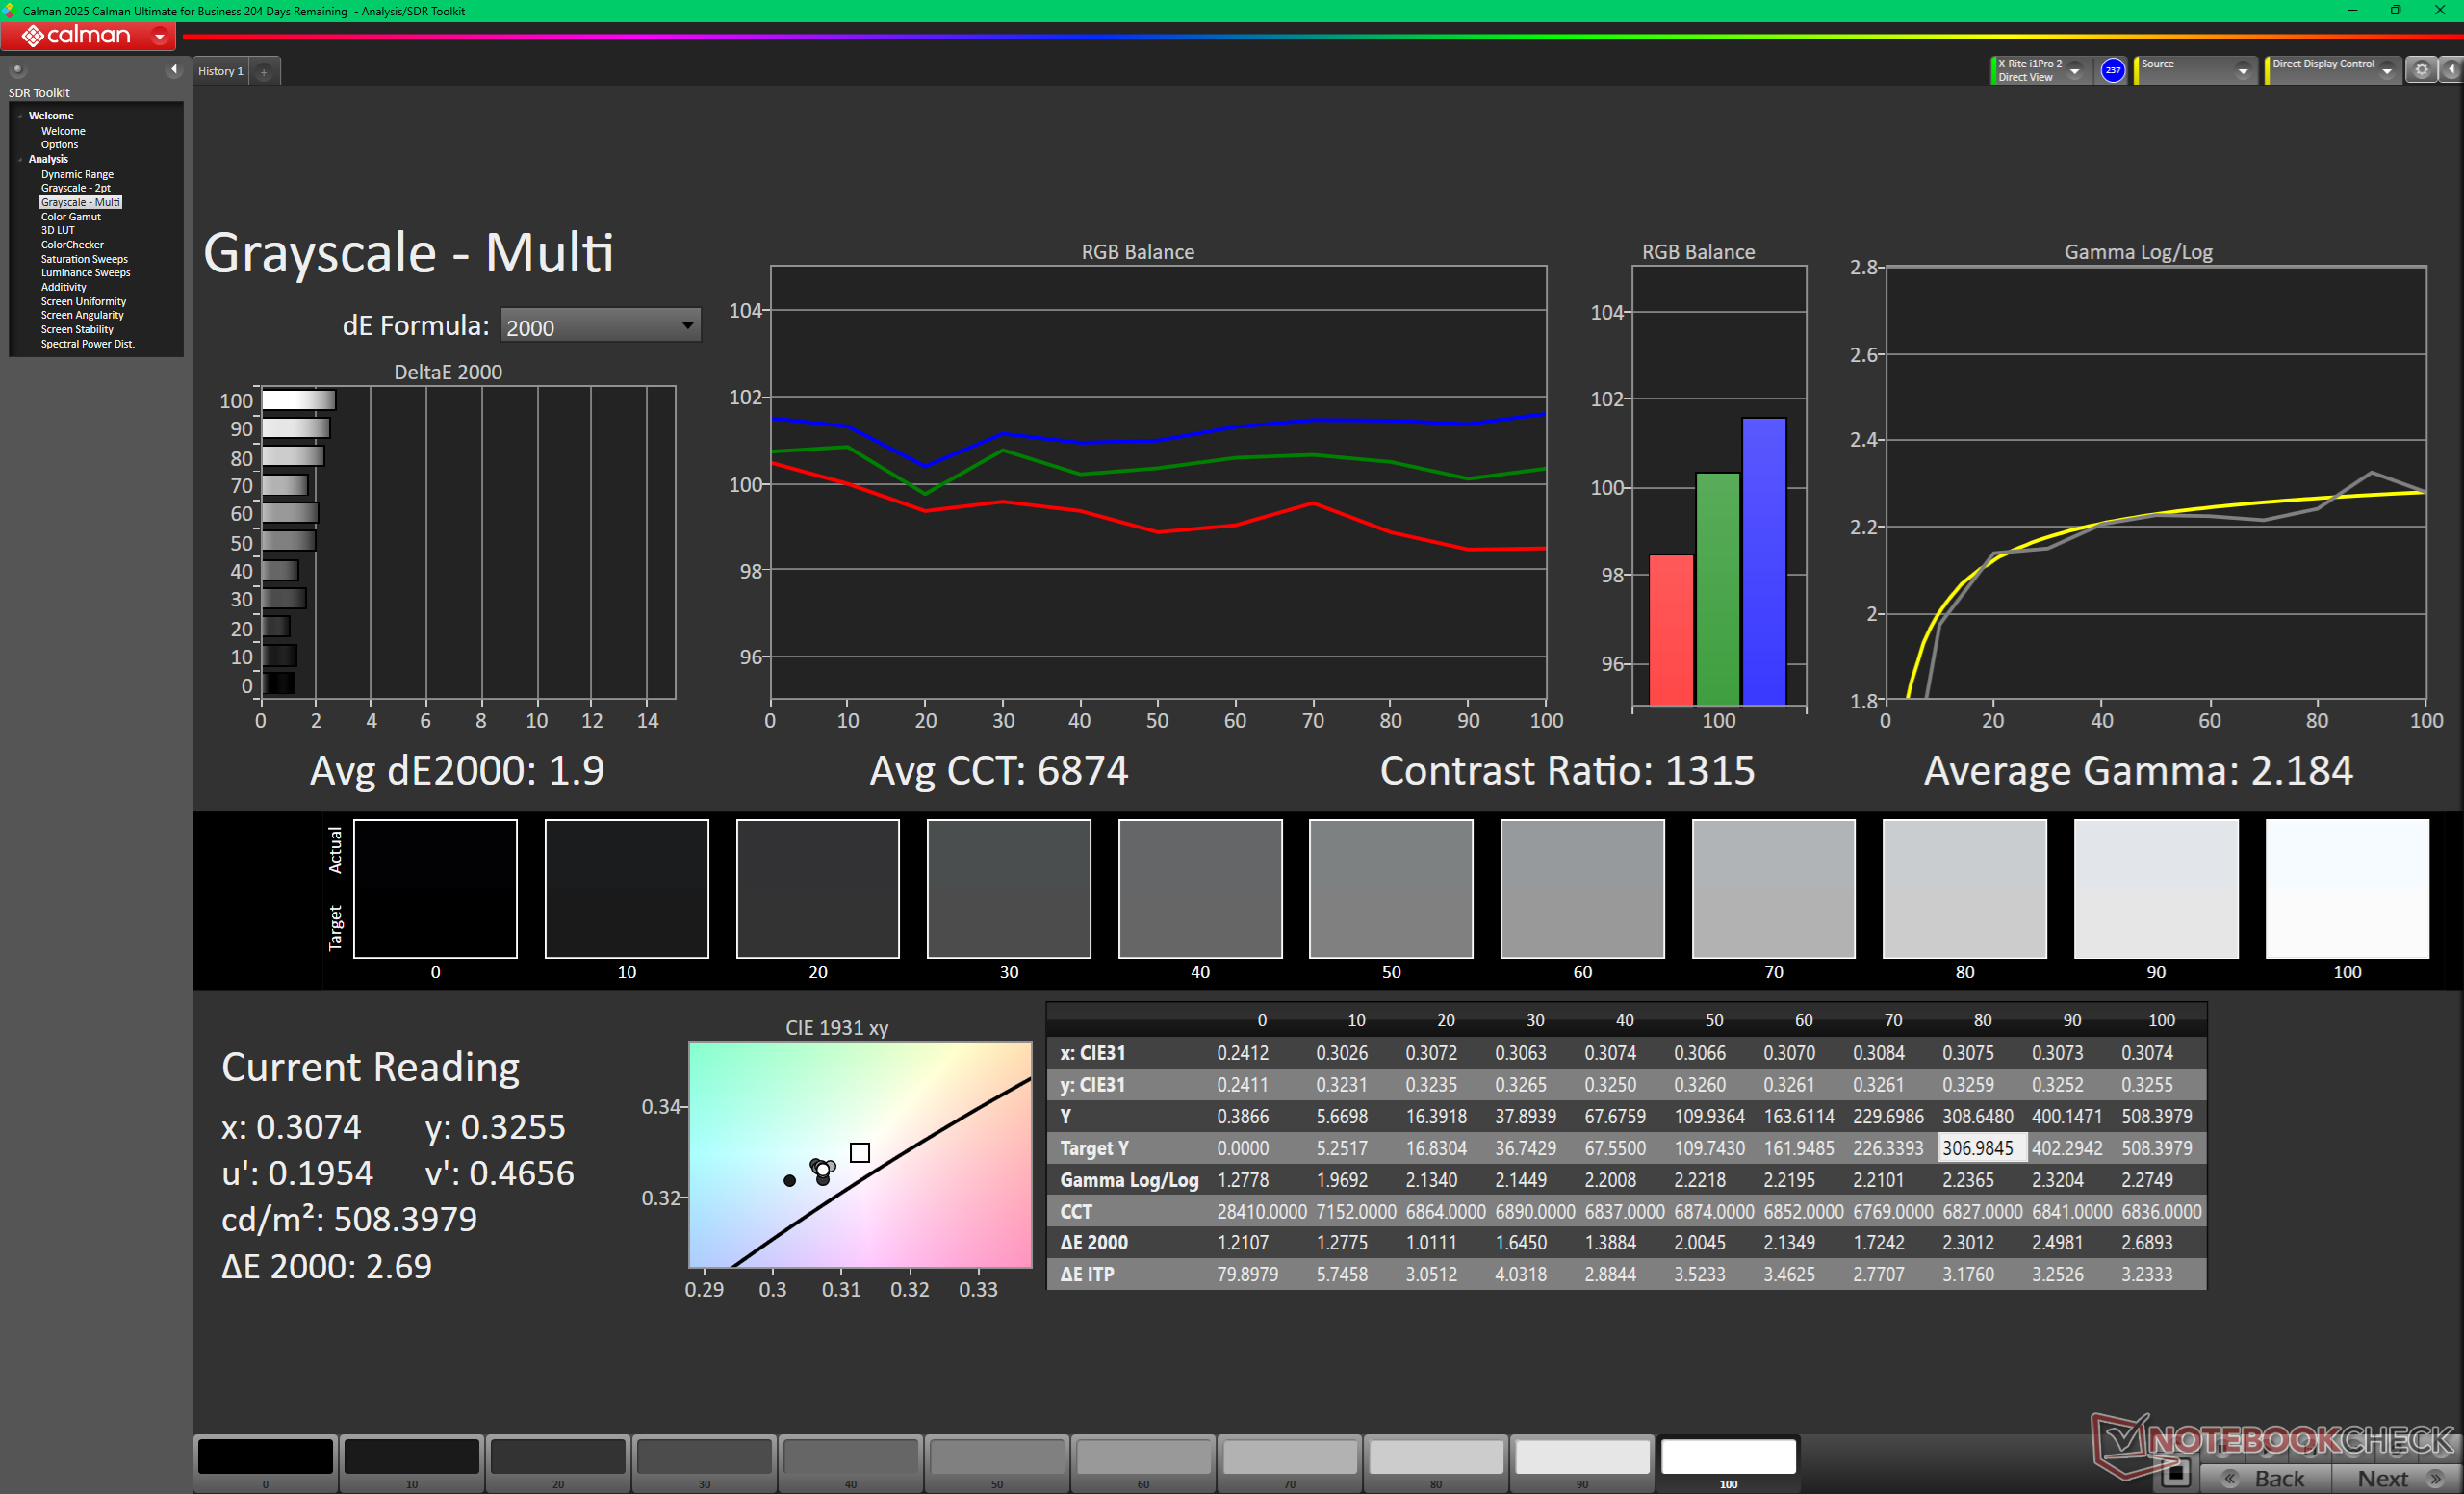
ΔE Greyscale Calman: 3.9 | ∀{0.09-98 Ø4.97}
83.1% AdobeRGB 1998 (Argyll 3D)
99.6% sRGB (Argyll 3D)
94.9% Display P3 (Argyll 3D)
Gamma: 2.57
CCT: 6813 K
| MSI Crosshair A16 HX E8WGK AU Optronics B160QAN02.3, IPS, 2560x1600, 16", 240 Hz | MSI Crosshair 16 HX AI D2XWGKG AUO B160QAN02.3, IPS, 2560x1600, 16", 240 Hz | Alienware 16X Aurora Core Ultra 9 290HX Plus Samsung 160HU05, OLED, 2560x1600, 16", 240 Hz | Lenovo Legion 7 16 AGP11 ATNA60HU02-0, OLED, 2560x1600, 16", 240 Hz | Gigabyte Gaming A16 Pro GA6DH (Core 7 240H, RTX 5070 Ti) BOE0D86 (NS160QDM-NY3), IPS, 2560x1600, 16", 165 Hz | Acer Predator Helios Neo 16S AI PHN16S-71-94L9 Samsung ATNA60DL03-0, OLED, 2560x1600, 16", 240 Hz | |
|---|---|---|---|---|---|---|
| Display | 1% | 6% | 5% | -13% | 7% | |
| Display P3 Coverage (%) | 94.9 | 95.5 1% | 99.6 5% | 99.2 5% | 72.5 -24% | 99.9 5% |
| sRGB Coverage (%) | 99.6 | 99.7 0% | 100 0% | 100 0% | 99.3 0% | 100 0% |
| AdobeRGB 1998 Coverage (%) | 83.1 | 83.9 1% | 93.9 13% | 90.2 9% | 70.4 -15% | 96.5 16% |
| Response Times | 19% | 94% | 82% | -7% | 96% | |
| Response Time Grey 50% / Grey 80% * (ms) | 4.2 ? | 3.59 ? 15% | 0.29 ? 93% | 1.41 ? 66% | 6.8 ? -62% | 0.2 ? 95% |
| Response Time Black / White * (ms) | 9.2 ? | 7.09 ? 23% | 0.45 ? 95% | 0.25 ? 97% | 4.8 ? 48% | 0.25 ? 97% |
| PWM Frequency (Hz) | 1439.8 ? | 1440 ? | 960 | |||
| PWM Amplitude * (%) | 29 | 44 | 50 | |||
| Screen | -24% | 15% | 242% | 18% | 97% | |
| Brightness middle (cd/m²) | 512.4 | 472 -8% | 380.5 -26% | 499 -3% | 517 1% | 390 -24% |
| Brightness (cd/m²) | 476 | 438 -8% | 384 -19% | 502 5% | 490 3% | 394 -17% |
| Brightness Distribution (%) | 89 | 88 -1% | 98 10% | 98 10% | 92 3% | 98 10% |
| Black Level * (cd/m²) | 0.39 | 0.4 -3% | 0.02 95% | 0.39 -0% | 0.04 90% | |
| Contrast (:1) | 1314 | 1180 -10% | 24950 1799% | 1326 1% | 9750 642% | |
| Colorchecker dE 2000 * | 4.65 | 6.07 -31% | 3.27 30% | 2.5 46% | 1.62 65% | 1.61 65% |
| Colorchecker dE 2000 max. * | 8.33 | 9.76 -17% | 6.31 24% | 7.8 6% | 3.52 58% | 3.49 58% |
| Colorchecker dE 2000 calibrated * | 1.3 | 2.25 -73% | 1.1 15% | 1.62 -25% | 1.59 -22% | |
| Greyscale dE 2000 * | 3.9 | 6.4 -64% | 1 74% | 4.7 -21% | 1.85 53% | 1.2 69% |
| Gamma | 2.57 86% | 2.52 87% | 2.23 99% | 2.21 100% | 2.36 93% | 2.235 98% |
| CCT | 6813 95% | 7987 81% | 6410 101% | 6715 97% | 6596 99% | 6580 99% |
| Média Total (Programa/Configurações) | -1% /
-13% | 38% /
26% | 110% /
163% | -1% /
8% | 67% /
77% |
* ... menor é melhor
Exibir tempos de resposta
| ↔ Tempo de resposta preto para branco | ||
|---|---|---|
| 9.2 ms ... ascensão ↗ e queda ↘ combinadas | ↗ 4.9 ms ascensão | 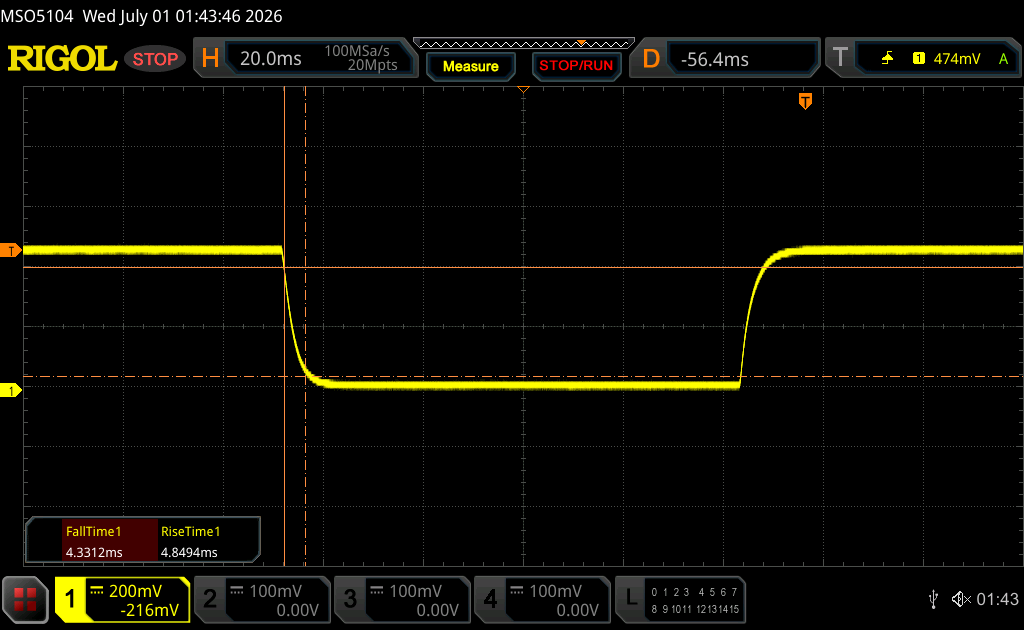 |
| ↘ 4.3 ms queda | ||
| A tela mostra taxas de resposta rápidas em nossos testes e deve ser adequada para jogos. Em comparação, todos os dispositivos testados variam de 0.1 (mínimo) a 240 (máximo) ms. » 26 % de todos os dispositivos são melhores. Isso significa que o tempo de resposta medido é melhor que a média de todos os dispositivos testados (19.8 ms). | ||
| ↔ Tempo de resposta 50% cinza a 80% cinza | ||
| 4.2 ms ... ascensão ↗ e queda ↘ combinadas | ↗ 1.8 ms ascensão | 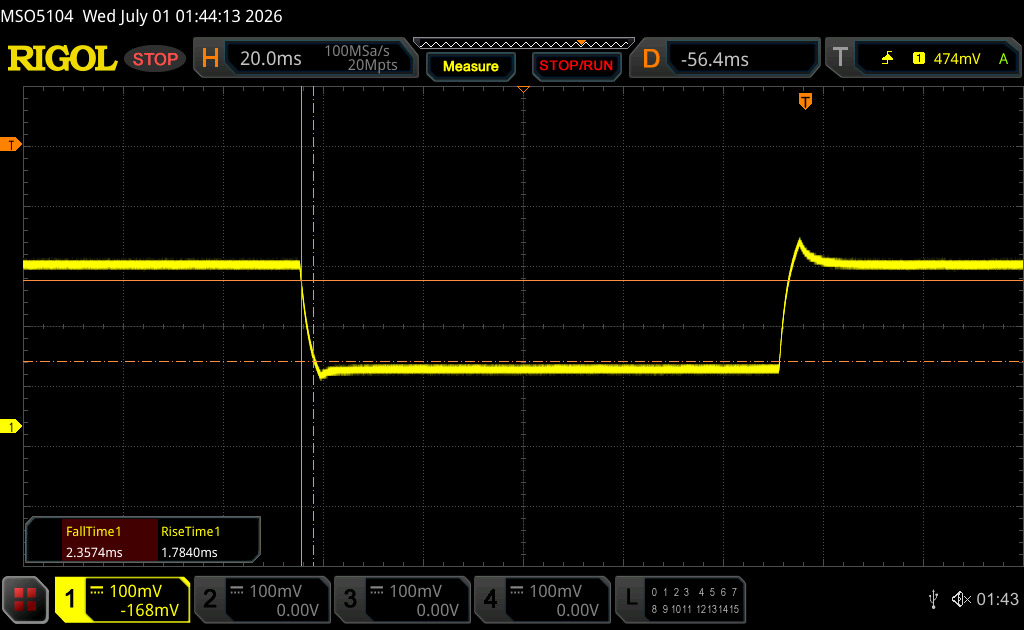 |
| ↘ 2.4 ms queda | ||
| A tela mostra taxas de resposta muito rápidas em nossos testes e deve ser muito adequada para jogos em ritmo acelerado. Em comparação, todos os dispositivos testados variam de 0.165 (mínimo) a 636 (máximo) ms. » 16 % de todos os dispositivos são melhores. Isso significa que o tempo de resposta medido é melhor que a média de todos os dispositivos testados (31 ms). | ||
Cintilação da tela / PWM (modulação por largura de pulso)
| Tela tremeluzindo / PWM não detectado | 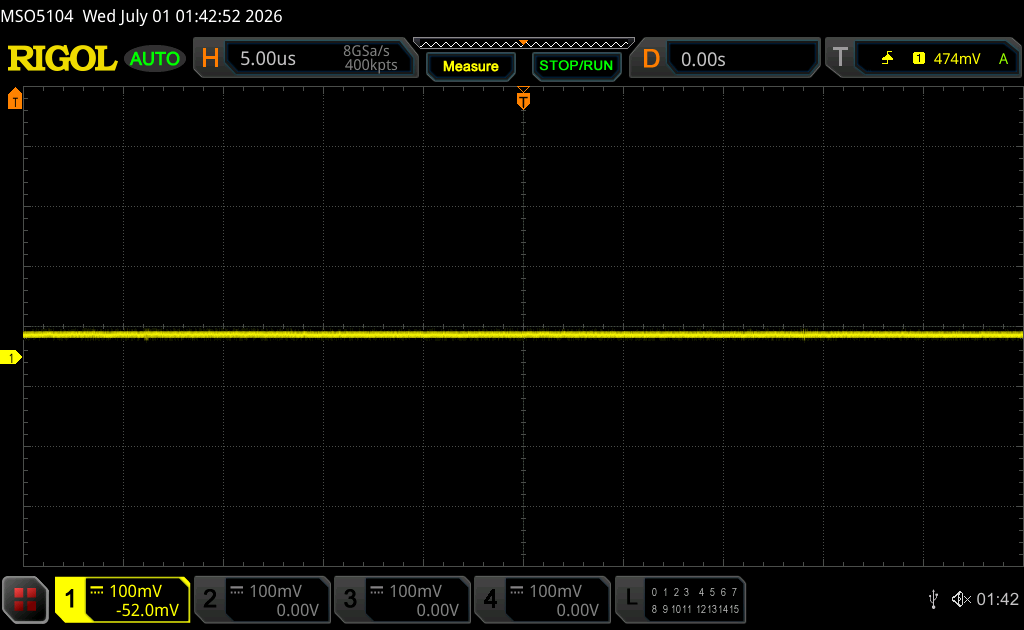 | ||
[pwm_comparison] Em comparação: 52 % de todos os dispositivos testados não usam PWM para escurecer a tela. Se PWM foi detectado, uma média de 7772 (mínimo: 5 - máximo: 343500) Hz foi medida. | |||
Desempenho
Condições de teste
O sistema vem pré-configurado no modo “Performance”, com o modo “Apex” ativado. Além disso, configuramos o sistema para o modo dGPU antes de executar os testes de desempenho abaixo.
Desempenho do processador
Cinebench R15 Multi Loop
Cinebench R23: Multi Core | Single Core
Cinebench R20: CPU (Multi Core) | CPU (Single Core)
Cinebench R15: CPU Multi 64Bit | CPU Single 64Bit
Blender: v2.79 BMW27 CPU
7-Zip 18.03: 7z b 4 | 7z b 4 -mmt1
Geekbench 6.7: Multi-Core | Single-Core
Geekbench 5.5: Multi-Core | Single-Core
HWBOT x265 Benchmark v2.2: 4k Preset
LibreOffice : 20 Documents To PDF
R Benchmark 2.5: Overall mean
* ... menor é melhor
AIDA64: FP32 Ray-Trace | FPU Julia | CPU SHA3 | CPU Queen | FPU SinJulia | FPU Mandel | CPU AES | CPU ZLib | FP64 Ray-Trace | CPU PhotoWorxx | CPU CheckMate
| Performance rating | |
| MSI Crosshair A16 HX E8WGK -1! | |
| Média AMD Ryzen 9 8940HX | |
| Alienware 16X Aurora Core Ultra 9 290HX Plus -1! | |
| MSI Crosshair 16 HX AI D2XWGKG -1! | |
| Lenovo Legion 7 16 AGP11 -1! | |
| Acer Predator Helios Neo 16S AI PHN16S-71-94L9 -1! | |
| Gigabyte Gaming A16 Pro GA6DH (Core 7 240H, RTX 5070 Ti) -1! | |
| AIDA64 / FP32 Ray-Trace | |
| MSI Crosshair A16 HX E8WGK (v8.20.8100) | |
| Média AMD Ryzen 9 8940HX (43311 - 53747, n=3) | |
| Lenovo Legion 7 16 AGP11 (v8.20.8100) | |
| MSI Crosshair 16 HX AI D2XWGKG (v6.92.6600) | |
| Alienware 16X Aurora Core Ultra 9 290HX Plus (v8.20.8100) | |
| Acer Predator Helios Neo 16S AI PHN16S-71-94L9 (v6.92.6600) | |
| Gigabyte Gaming A16 Pro GA6DH (Core 7 240H, RTX 5070 Ti) (v8.20.8100) | |
| AIDA64 / FPU Julia | |
| MSI Crosshair A16 HX E8WGK (v8.20.8100) | |
| Média AMD Ryzen 9 8940HX (171374 - 218716, n=3) | |
| MSI Crosshair 16 HX AI D2XWGKG (v6.92.6600) | |
| Alienware 16X Aurora Core Ultra 9 290HX Plus (v8.20.8100) | |
| Lenovo Legion 7 16 AGP11 (v8.20.8100) | |
| Acer Predator Helios Neo 16S AI PHN16S-71-94L9 (v6.92.6600) | |
| Gigabyte Gaming A16 Pro GA6DH (Core 7 240H, RTX 5070 Ti) (v8.20.8100) | |
| AIDA64 / CPU SHA3 | |
| MSI Crosshair A16 HX E8WGK (v8.20.8100) | |
| Média AMD Ryzen 9 8940HX (7988 - 9427, n=3) | |
| MSI Crosshair 16 HX AI D2XWGKG (v6.92.6600) | |
| Alienware 16X Aurora Core Ultra 9 290HX Plus (v8.20.8100) | |
| Acer Predator Helios Neo 16S AI PHN16S-71-94L9 (v6.92.6600) | |
| Lenovo Legion 7 16 AGP11 (v8.20.8100) | |
| Gigabyte Gaming A16 Pro GA6DH (Core 7 240H, RTX 5070 Ti) (v8.20.8100) | |
| AIDA64 / CPU Queen | |
| Média AMD Ryzen 9 8940HX (169334 - 172010, n=2) | |
| MSI Crosshair 16 HX AI D2XWGKG (v6.92.6600) | |
| Acer Predator Helios Neo 16S AI PHN16S-71-94L9 (v6.92.6600) | |
| AIDA64 / FPU SinJulia | |
| MSI Crosshair A16 HX E8WGK (v8.20.8100) | |
| Média AMD Ryzen 9 8940HX (26855 - 29886, n=3) | |
| Lenovo Legion 7 16 AGP11 (v8.20.8100) | |
| Alienware 16X Aurora Core Ultra 9 290HX Plus (v8.20.8100) | |
| MSI Crosshair 16 HX AI D2XWGKG (v6.92.6600) | |
| Acer Predator Helios Neo 16S AI PHN16S-71-94L9 (v6.92.6600) | |
| Gigabyte Gaming A16 Pro GA6DH (Core 7 240H, RTX 5070 Ti) (v8.20.8100) | |
| AIDA64 / FPU Mandel | |
| MSI Crosshair A16 HX E8WGK (v8.20.8100) | |
| Média AMD Ryzen 9 8940HX (90684 - 117231, n=3) | |
| MSI Crosshair 16 HX AI D2XWGKG (v6.92.6600) | |
| Alienware 16X Aurora Core Ultra 9 290HX Plus (v8.20.8100) | |
| Lenovo Legion 7 16 AGP11 (v8.20.8100) | |
| Acer Predator Helios Neo 16S AI PHN16S-71-94L9 (v6.92.6600) | |
| Gigabyte Gaming A16 Pro GA6DH (Core 7 240H, RTX 5070 Ti) (v8.20.8100) | |
| AIDA64 / CPU AES | |
| MSI Crosshair A16 HX E8WGK (v8.20.8100) | |
| Média AMD Ryzen 9 8940HX (150768 - 175214, n=3) | |
| Alienware 16X Aurora Core Ultra 9 290HX Plus (v8.20.8100) | |
| MSI Crosshair 16 HX AI D2XWGKG (v6.92.6600) | |
| Lenovo Legion 7 16 AGP11 (v8.20.8100) | |
| Acer Predator Helios Neo 16S AI PHN16S-71-94L9 (v6.92.6600) | |
| Gigabyte Gaming A16 Pro GA6DH (Core 7 240H, RTX 5070 Ti) (v8.20.8100) | |
| AIDA64 / CPU ZLib | |
| MSI Crosshair A16 HX E8WGK (v8.20.8100) | |
| Média AMD Ryzen 9 8940HX (1784 - 2122, n=3) | |
| MSI Crosshair 16 HX AI D2XWGKG (v6.92.6600) | |
| Alienware 16X Aurora Core Ultra 9 290HX Plus (v8.20.8100) | |
| Acer Predator Helios Neo 16S AI PHN16S-71-94L9 (v6.92.6600) | |
| Lenovo Legion 7 16 AGP11 (v8.20.8100) | |
| Gigabyte Gaming A16 Pro GA6DH (Core 7 240H, RTX 5070 Ti) (v8.20.8100) | |
| AIDA64 / FP64 Ray-Trace | |
| MSI Crosshair A16 HX E8WGK (v8.20.8100) | |
| Média AMD Ryzen 9 8940HX (23193 - 28773, n=3) | |
| Lenovo Legion 7 16 AGP11 (v8.20.8100) | |
| MSI Crosshair 16 HX AI D2XWGKG (v6.92.6600) | |
| Alienware 16X Aurora Core Ultra 9 290HX Plus (v8.20.8100) | |
| Acer Predator Helios Neo 16S AI PHN16S-71-94L9 (v6.92.6600) | |
| Gigabyte Gaming A16 Pro GA6DH (Core 7 240H, RTX 5070 Ti) (v8.20.8100) | |
| AIDA64 / CPU PhotoWorxx | |
| Lenovo Legion 7 16 AGP11 (v8.20.8100) | |
| Acer Predator Helios Neo 16S AI PHN16S-71-94L9 (v6.92.6600) | |
| Alienware 16X Aurora Core Ultra 9 290HX Plus (v8.20.8100) | |
| Gigabyte Gaming A16 Pro GA6DH (Core 7 240H, RTX 5070 Ti) (v8.20.8100) | |
| MSI Crosshair 16 HX AI D2XWGKG (v6.92.6600) | |
| MSI Crosshair A16 HX E8WGK (v8.20.8100) | |
| Média AMD Ryzen 9 8940HX (18283 - 35274, n=3) | |
| AIDA64 / CPU CheckMate | |
| MSI Crosshair A16 HX E8WGK (v8.20.8100) | |
| Média AMD Ryzen 9 8940HX (n=1) | |
| Lenovo Legion 7 16 AGP11 (v8.20.8100) | |
| Alienware 16X Aurora Core Ultra 9 290HX Plus (v8.20.8100) | |
| Gigabyte Gaming A16 Pro GA6DH (Core 7 240H, RTX 5070 Ti) (v8.20.8100) | |
Desempenho do sistema
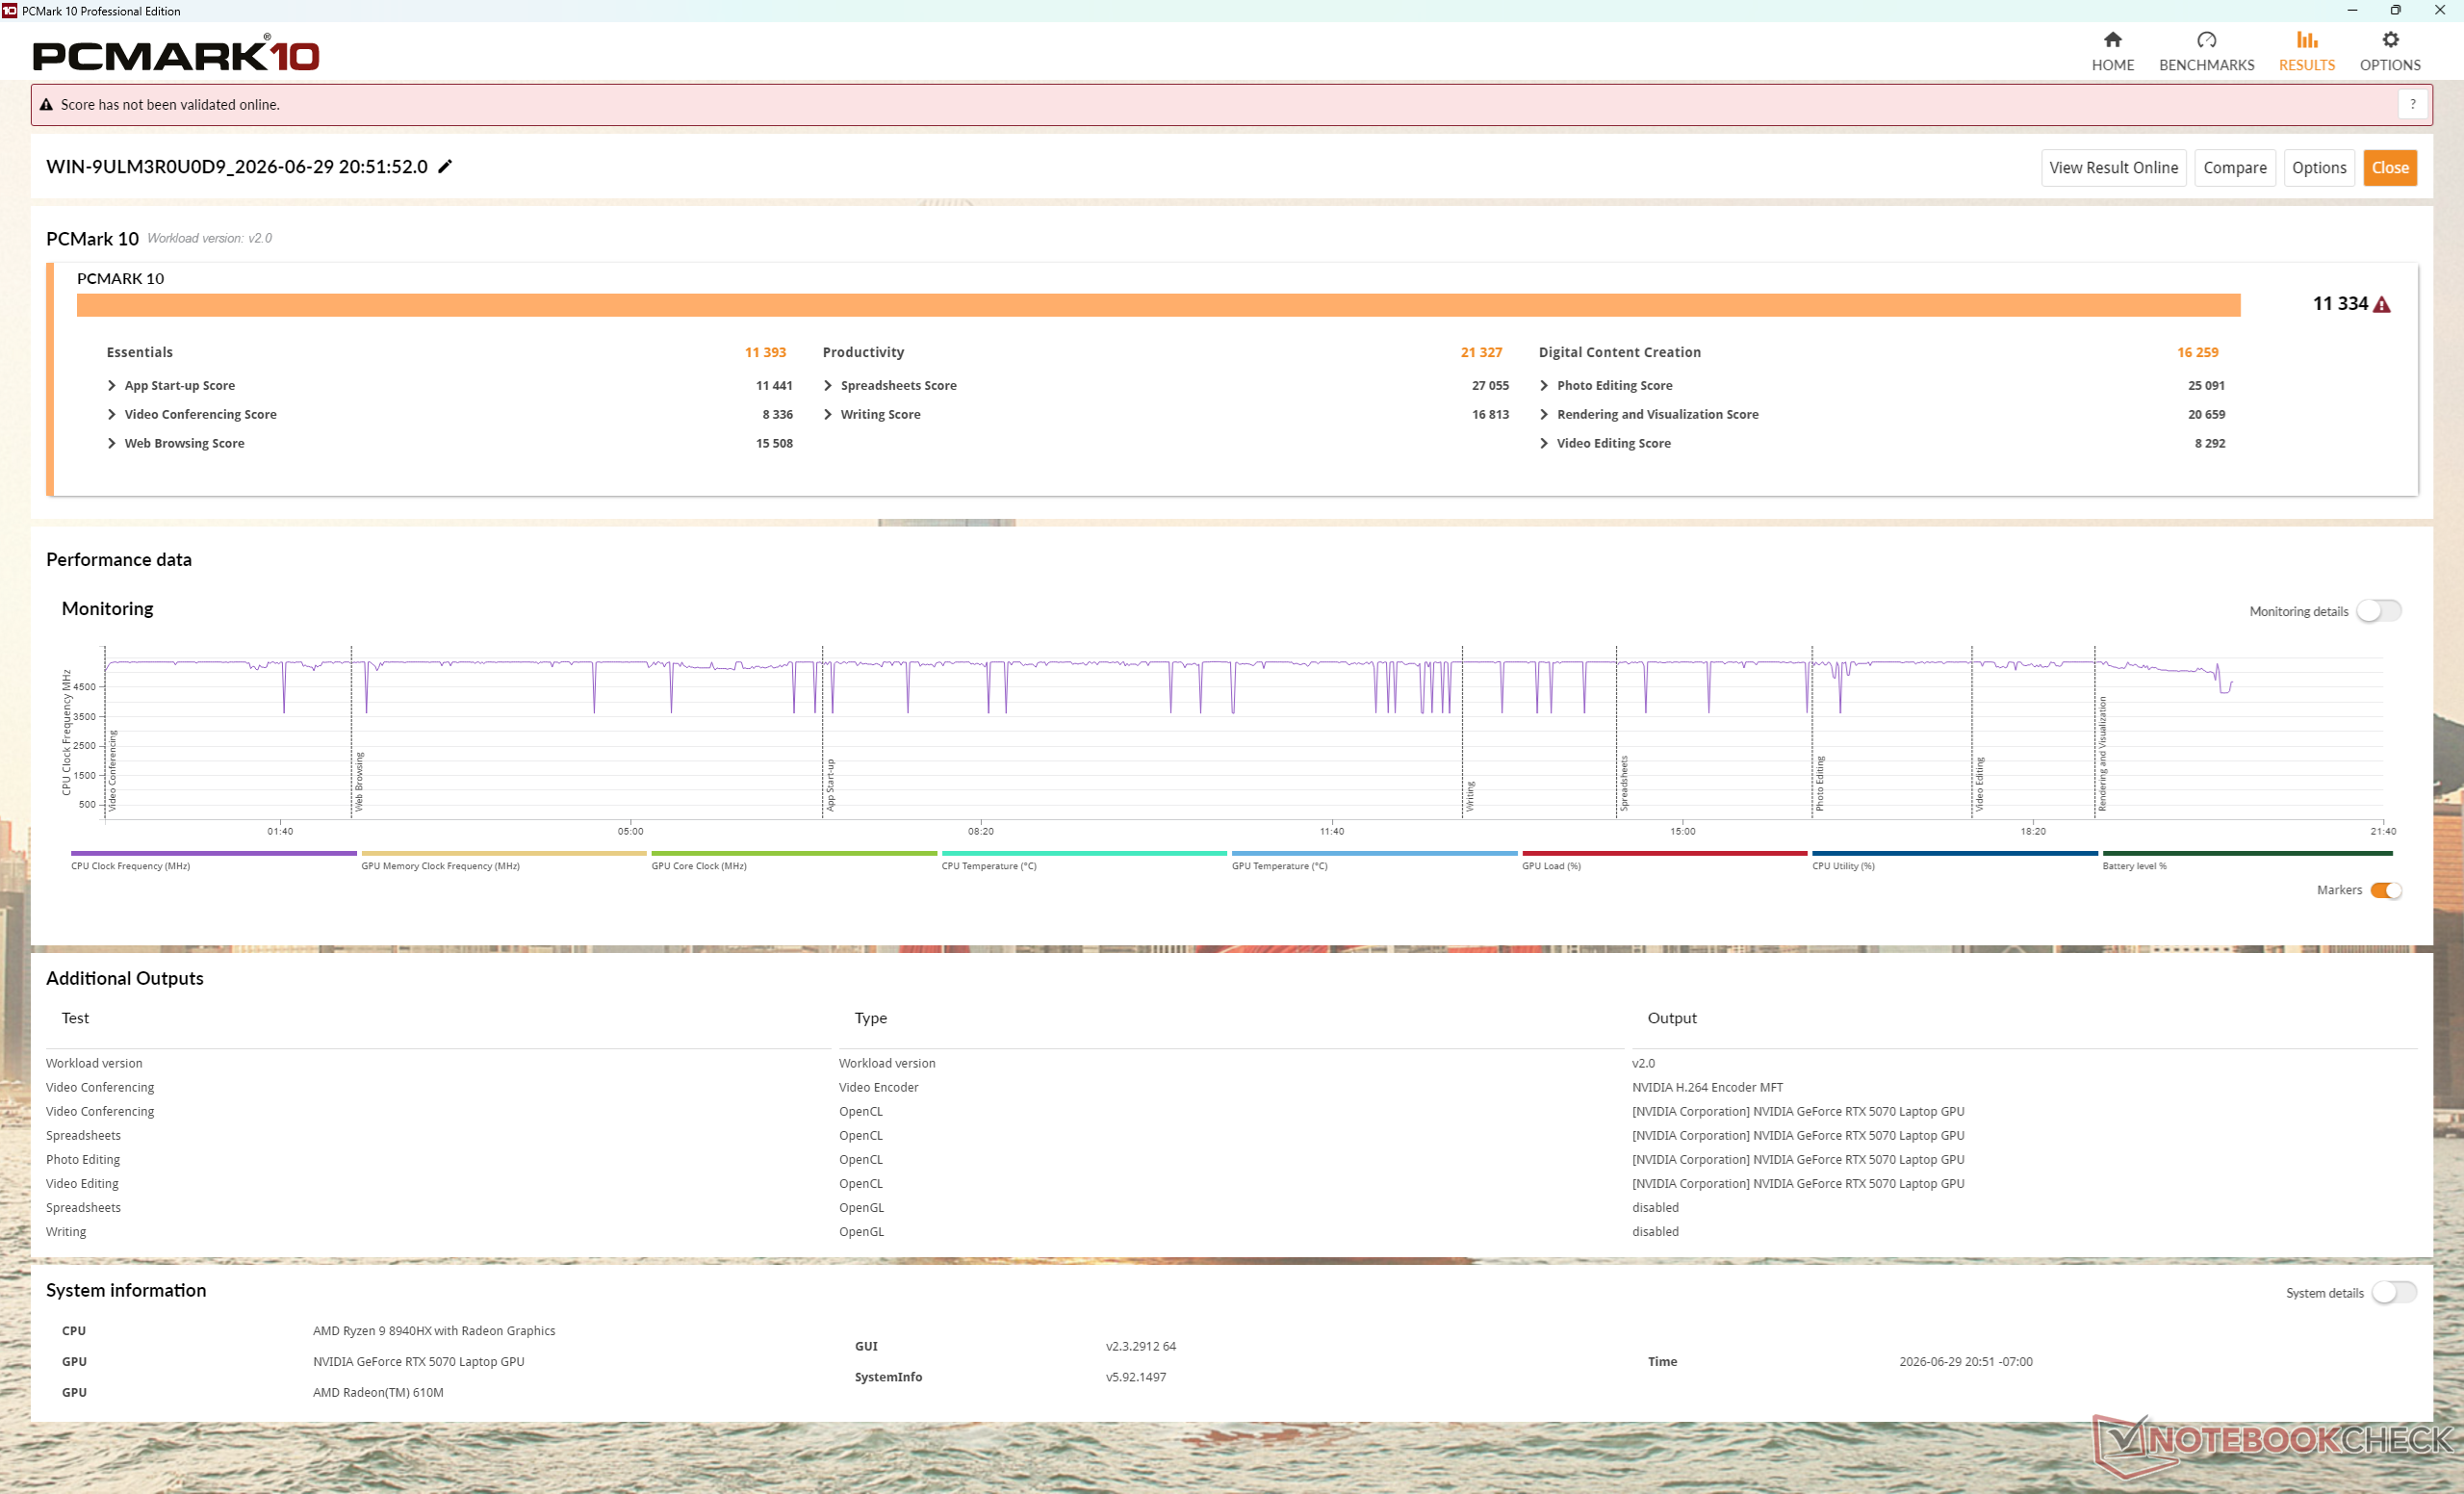
PCMark 10: Score | Essentials | Productivity | Digital Content Creation
CrossMark: Overall | Productivity | Creativity | Responsiveness
WebXPRT 3: Overall
WebXPRT 4: Overall
Mozilla Kraken 1.1: Total
Geekbench AI: Quantized GPU 1.7 | Half Precision GPU 1.7 | Single Precision GPU 1.7
| Performance rating | |
| Alienware 16X Aurora Core Ultra 9 290HX Plus | |
| MSI Crosshair A16 HX E8WGK | |
| Média AMD Ryzen 9 8940HX, NVIDIA GeForce RTX 5070 Laptop | |
| MSI Crosshair 16 HX AI D2XWGKG | |
| Acer Predator Helios Neo 16S AI PHN16S-71-94L9 -3! | |
| Lenovo Legion 7 16 AGP11 -3! | |
| Gigabyte Gaming A16 Pro GA6DH (Core 7 240H, RTX 5070 Ti) | |
| PCMark 10 / Score | |
| MSI Crosshair A16 HX E8WGK | |
| Alienware 16X Aurora Core Ultra 9 290HX Plus | |
| Média AMD Ryzen 9 8940HX, NVIDIA GeForce RTX 5070 Laptop (8106 - 11334, n=2) | |
| Lenovo Legion 7 16 AGP11 | |
| Gigabyte Gaming A16 Pro GA6DH (Core 7 240H, RTX 5070 Ti) | |
| Acer Predator Helios Neo 16S AI PHN16S-71-94L9 | |
| MSI Crosshair 16 HX AI D2XWGKG | |
| PCMark 10 / Essentials | |
| Alienware 16X Aurora Core Ultra 9 290HX Plus | |
| MSI Crosshair A16 HX E8WGK | |
| Média AMD Ryzen 9 8940HX, NVIDIA GeForce RTX 5070 Laptop (11371 - 11393, n=2) | |
| Acer Predator Helios Neo 16S AI PHN16S-71-94L9 | |
| MSI Crosshair 16 HX AI D2XWGKG | |
| Lenovo Legion 7 16 AGP11 | |
| Gigabyte Gaming A16 Pro GA6DH (Core 7 240H, RTX 5070 Ti) | |
| PCMark 10 / Productivity | |
| MSI Crosshair A16 HX E8WGK | |
| Alienware 16X Aurora Core Ultra 9 290HX Plus | |
| Lenovo Legion 7 16 AGP11 | |
| Média AMD Ryzen 9 8940HX, NVIDIA GeForce RTX 5070 Laptop (9492 - 21327, n=2) | |
| Gigabyte Gaming A16 Pro GA6DH (Core 7 240H, RTX 5070 Ti) | |
| Acer Predator Helios Neo 16S AI PHN16S-71-94L9 | |
| MSI Crosshair 16 HX AI D2XWGKG | |
| PCMark 10 / Digital Content Creation | |
| Alienware 16X Aurora Core Ultra 9 290HX Plus | |
| MSI Crosshair 16 HX AI D2XWGKG | |
| MSI Crosshair A16 HX E8WGK | |
| Média AMD Ryzen 9 8940HX, NVIDIA GeForce RTX 5070 Laptop (13392 - 16259, n=2) | |
| Acer Predator Helios Neo 16S AI PHN16S-71-94L9 | |
| Lenovo Legion 7 16 AGP11 | |
| Gigabyte Gaming A16 Pro GA6DH (Core 7 240H, RTX 5070 Ti) | |
| CrossMark / Overall | |
| Alienware 16X Aurora Core Ultra 9 290HX Plus | |
| Acer Predator Helios Neo 16S AI PHN16S-71-94L9 | |
| MSI Crosshair 16 HX AI D2XWGKG | |
| MSI Crosshair A16 HX E8WGK | |
| Média AMD Ryzen 9 8940HX, NVIDIA GeForce RTX 5070 Laptop (1977 - 2011, n=2) | |
| Gigabyte Gaming A16 Pro GA6DH (Core 7 240H, RTX 5070 Ti) | |
| Lenovo Legion 7 16 AGP11 | |
| CrossMark / Productivity | |
| Alienware 16X Aurora Core Ultra 9 290HX Plus | |
| MSI Crosshair 16 HX AI D2XWGKG | |
| Acer Predator Helios Neo 16S AI PHN16S-71-94L9 | |
| MSI Crosshair A16 HX E8WGK | |
| Média AMD Ryzen 9 8940HX, NVIDIA GeForce RTX 5070 Laptop (1844 - 1869, n=2) | |
| Gigabyte Gaming A16 Pro GA6DH (Core 7 240H, RTX 5070 Ti) | |
| Lenovo Legion 7 16 AGP11 | |
| CrossMark / Creativity | |
| Alienware 16X Aurora Core Ultra 9 290HX Plus | |
| Acer Predator Helios Neo 16S AI PHN16S-71-94L9 | |
| MSI Crosshair 16 HX AI D2XWGKG | |
| MSI Crosshair A16 HX E8WGK | |
| Média AMD Ryzen 9 8940HX, NVIDIA GeForce RTX 5070 Laptop (2225 - 2298, n=2) | |
| Gigabyte Gaming A16 Pro GA6DH (Core 7 240H, RTX 5070 Ti) | |
| Lenovo Legion 7 16 AGP11 | |
| CrossMark / Responsiveness | |
| Alienware 16X Aurora Core Ultra 9 290HX Plus | |
| MSI Crosshair 16 HX AI D2XWGKG | |
| Acer Predator Helios Neo 16S AI PHN16S-71-94L9 | |
| Média AMD Ryzen 9 8940HX, NVIDIA GeForce RTX 5070 Laptop (1680 - 1709, n=2) | |
| MSI Crosshair A16 HX E8WGK | |
| Gigabyte Gaming A16 Pro GA6DH (Core 7 240H, RTX 5070 Ti) | |
| Lenovo Legion 7 16 AGP11 | |
| WebXPRT 3 / Overall | |
| Alienware 16X Aurora Core Ultra 9 290HX Plus | |
| MSI Crosshair 16 HX AI D2XWGKG | |
| Lenovo Legion 7 16 AGP11 | |
| Acer Predator Helios Neo 16S AI PHN16S-71-94L9 | |
| MSI Crosshair A16 HX E8WGK | |
| Média AMD Ryzen 9 8940HX, NVIDIA GeForce RTX 5070 Laptop (274 - 322, n=2) | |
| Gigabyte Gaming A16 Pro GA6DH (Core 7 240H, RTX 5070 Ti) | |
| WebXPRT 4 / Overall | |
| Alienware 16X Aurora Core Ultra 9 290HX Plus | |
| MSI Crosshair 16 HX AI D2XWGKG | |
| Acer Predator Helios Neo 16S AI PHN16S-71-94L9 | |
| MSI Crosshair A16 HX E8WGK | |
| Lenovo Legion 7 16 AGP11 | |
| Média AMD Ryzen 9 8940HX, NVIDIA GeForce RTX 5070 Laptop (230 - 283, n=2) | |
| Gigabyte Gaming A16 Pro GA6DH (Core 7 240H, RTX 5070 Ti) | |
| Mozilla Kraken 1.1 / Total | |
| Gigabyte Gaming A16 Pro GA6DH (Core 7 240H, RTX 5070 Ti) | |
| Média AMD Ryzen 9 8940HX, NVIDIA GeForce RTX 5070 Laptop (474 - 507, n=2) | |
| MSI Crosshair A16 HX E8WGK | |
| Lenovo Legion 7 16 AGP11 | |
| Acer Predator Helios Neo 16S AI PHN16S-71-94L9 | |
| MSI Crosshair 16 HX AI D2XWGKG | |
| Alienware 16X Aurora Core Ultra 9 290HX Plus | |
| Geekbench AI / Quantized GPU 1.7 | |
| Alienware 16X Aurora Core Ultra 9 290HX Plus | |
| MSI Crosshair A16 HX E8WGK | |
| Média AMD Ryzen 9 8940HX, NVIDIA GeForce RTX 5070 Laptop (n=1) | |
| MSI Crosshair 16 HX AI D2XWGKG | |
| Gigabyte Gaming A16 Pro GA6DH (Core 7 240H, RTX 5070 Ti) | |
| Geekbench AI / Half Precision GPU 1.7 | |
| MSI Crosshair A16 HX E8WGK | |
| Média AMD Ryzen 9 8940HX, NVIDIA GeForce RTX 5070 Laptop (n=1) | |
| Alienware 16X Aurora Core Ultra 9 290HX Plus | |
| MSI Crosshair 16 HX AI D2XWGKG | |
| Gigabyte Gaming A16 Pro GA6DH (Core 7 240H, RTX 5070 Ti) | |
| Geekbench AI / Single Precision GPU 1.7 | |
| Alienware 16X Aurora Core Ultra 9 290HX Plus | |
| MSI Crosshair A16 HX E8WGK | |
| Média AMD Ryzen 9 8940HX, NVIDIA GeForce RTX 5070 Laptop (n=1) | |
| MSI Crosshair 16 HX AI D2XWGKG | |
| Gigabyte Gaming A16 Pro GA6DH (Core 7 240H, RTX 5070 Ti) | |
* ... menor é melhor
| PCMark 10 Score | 11334 pontos | |
Ajuda | ||
* ... menor é melhor
Latência do DPC
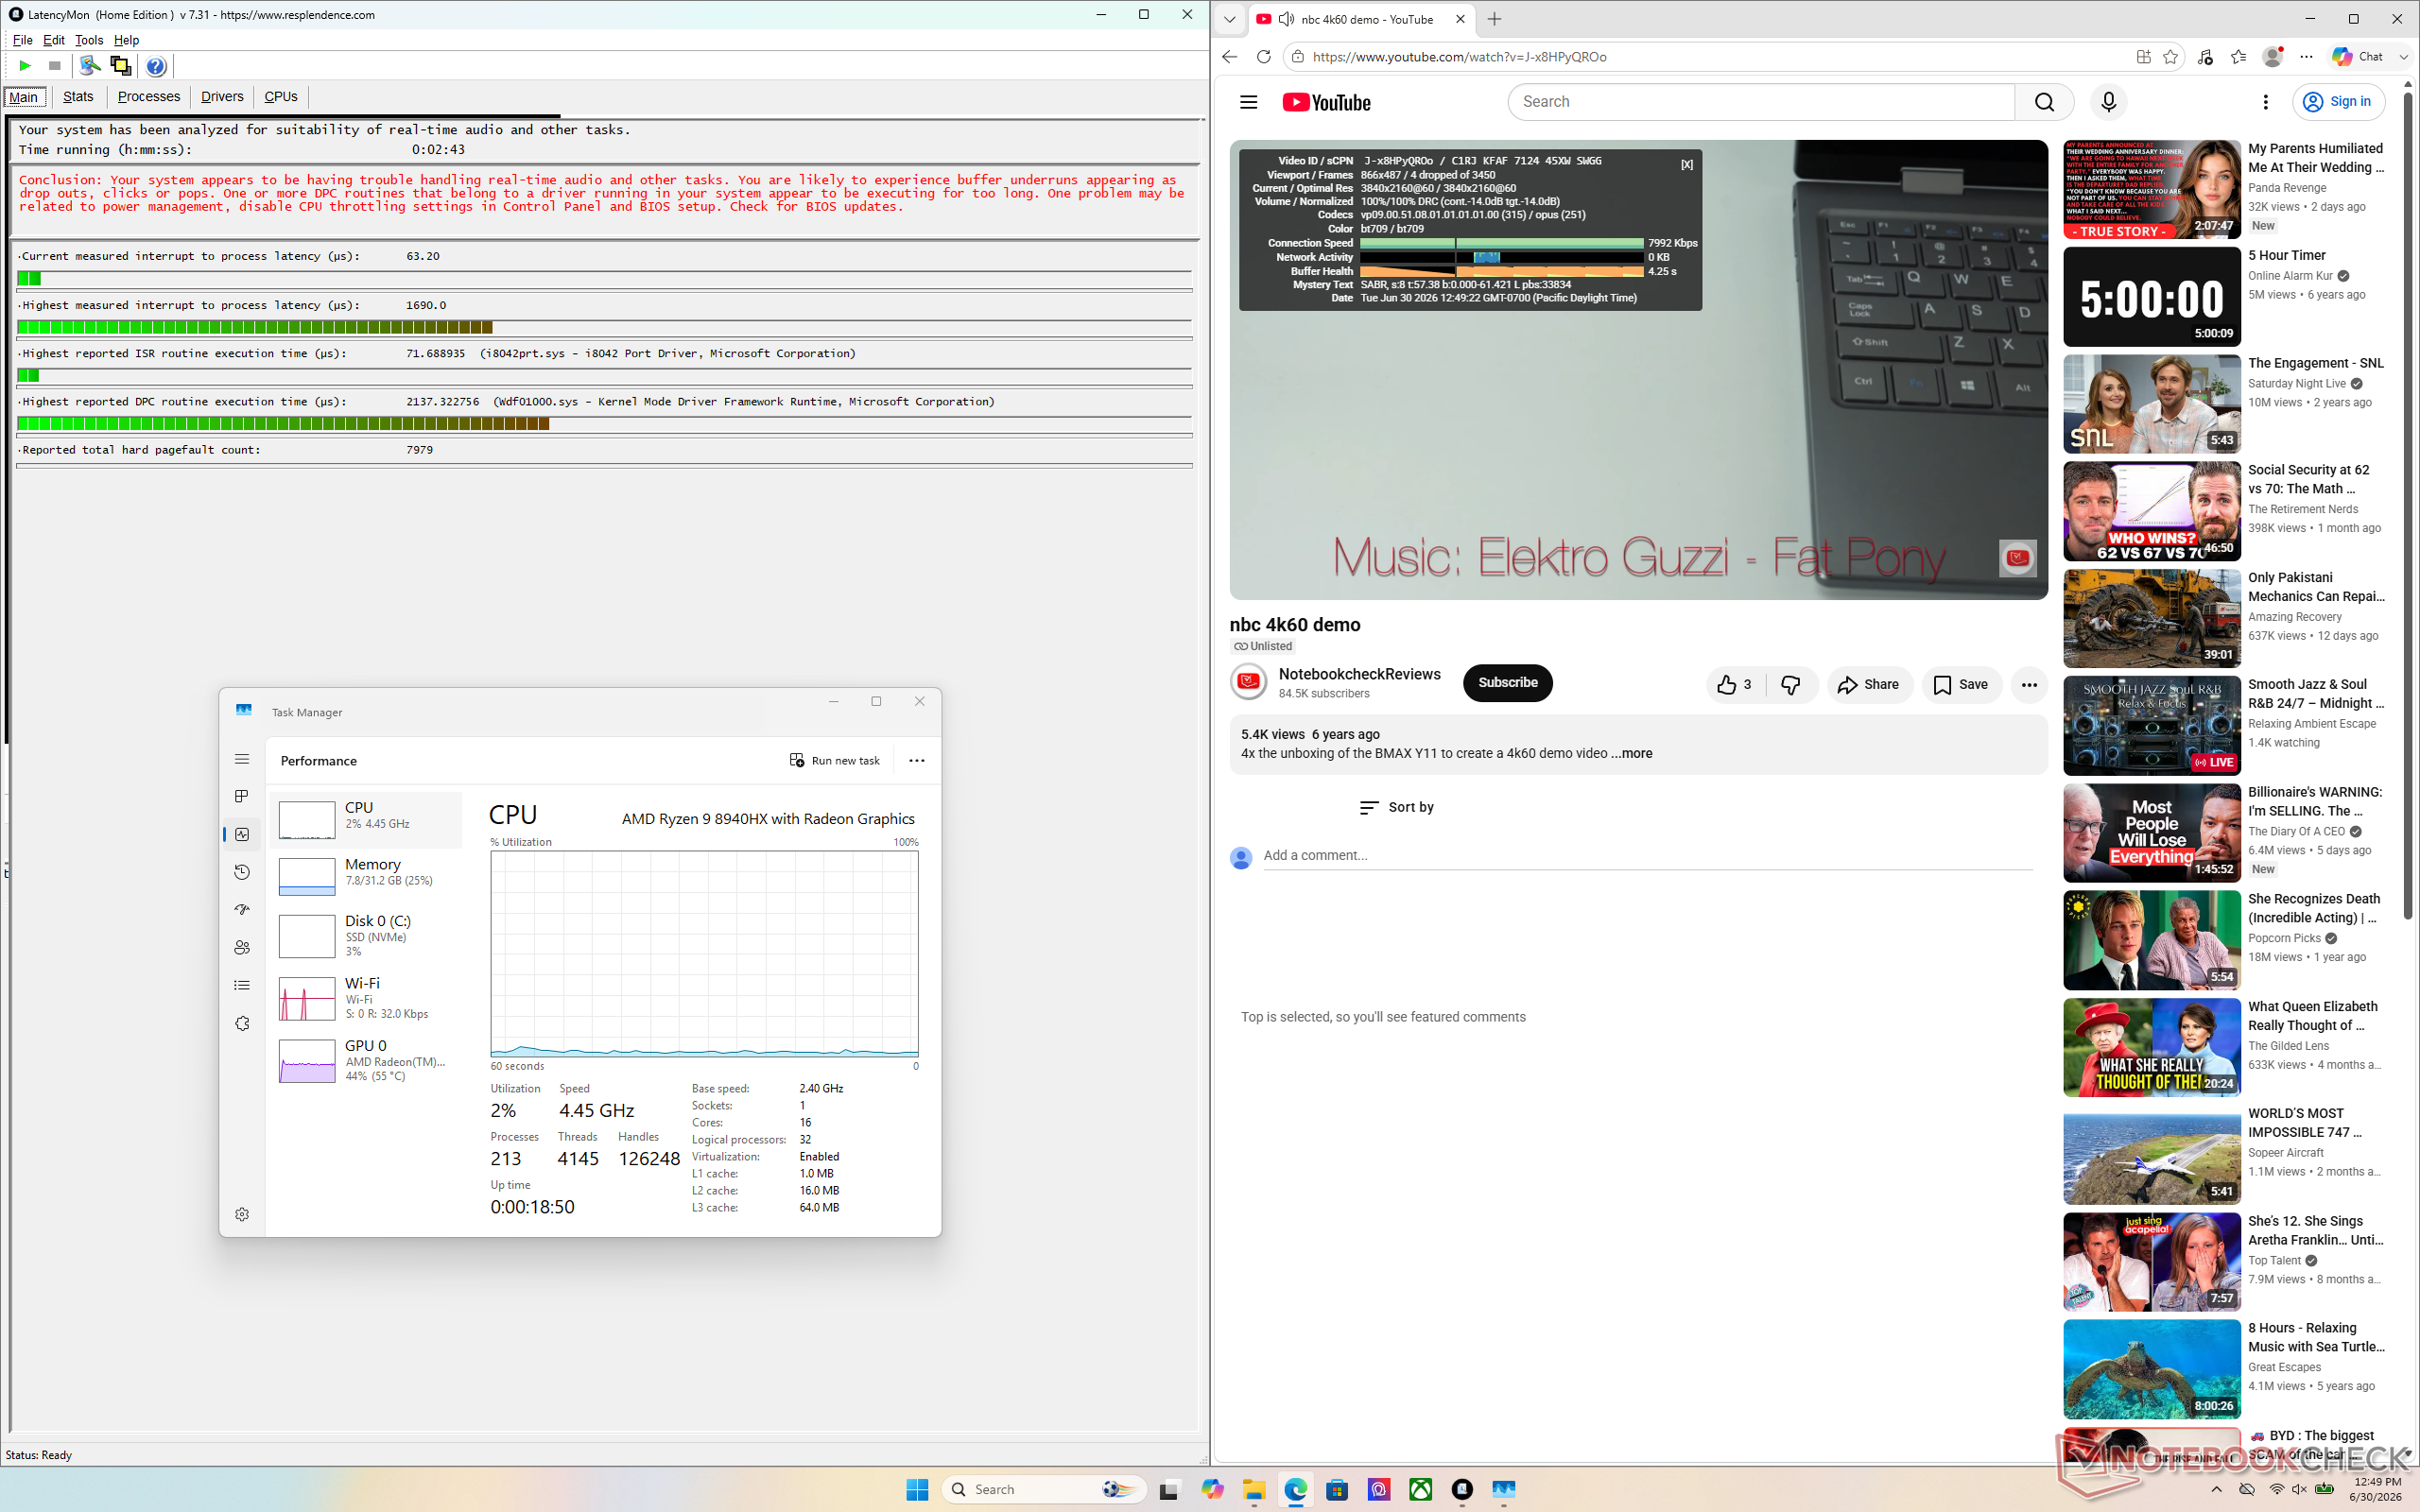
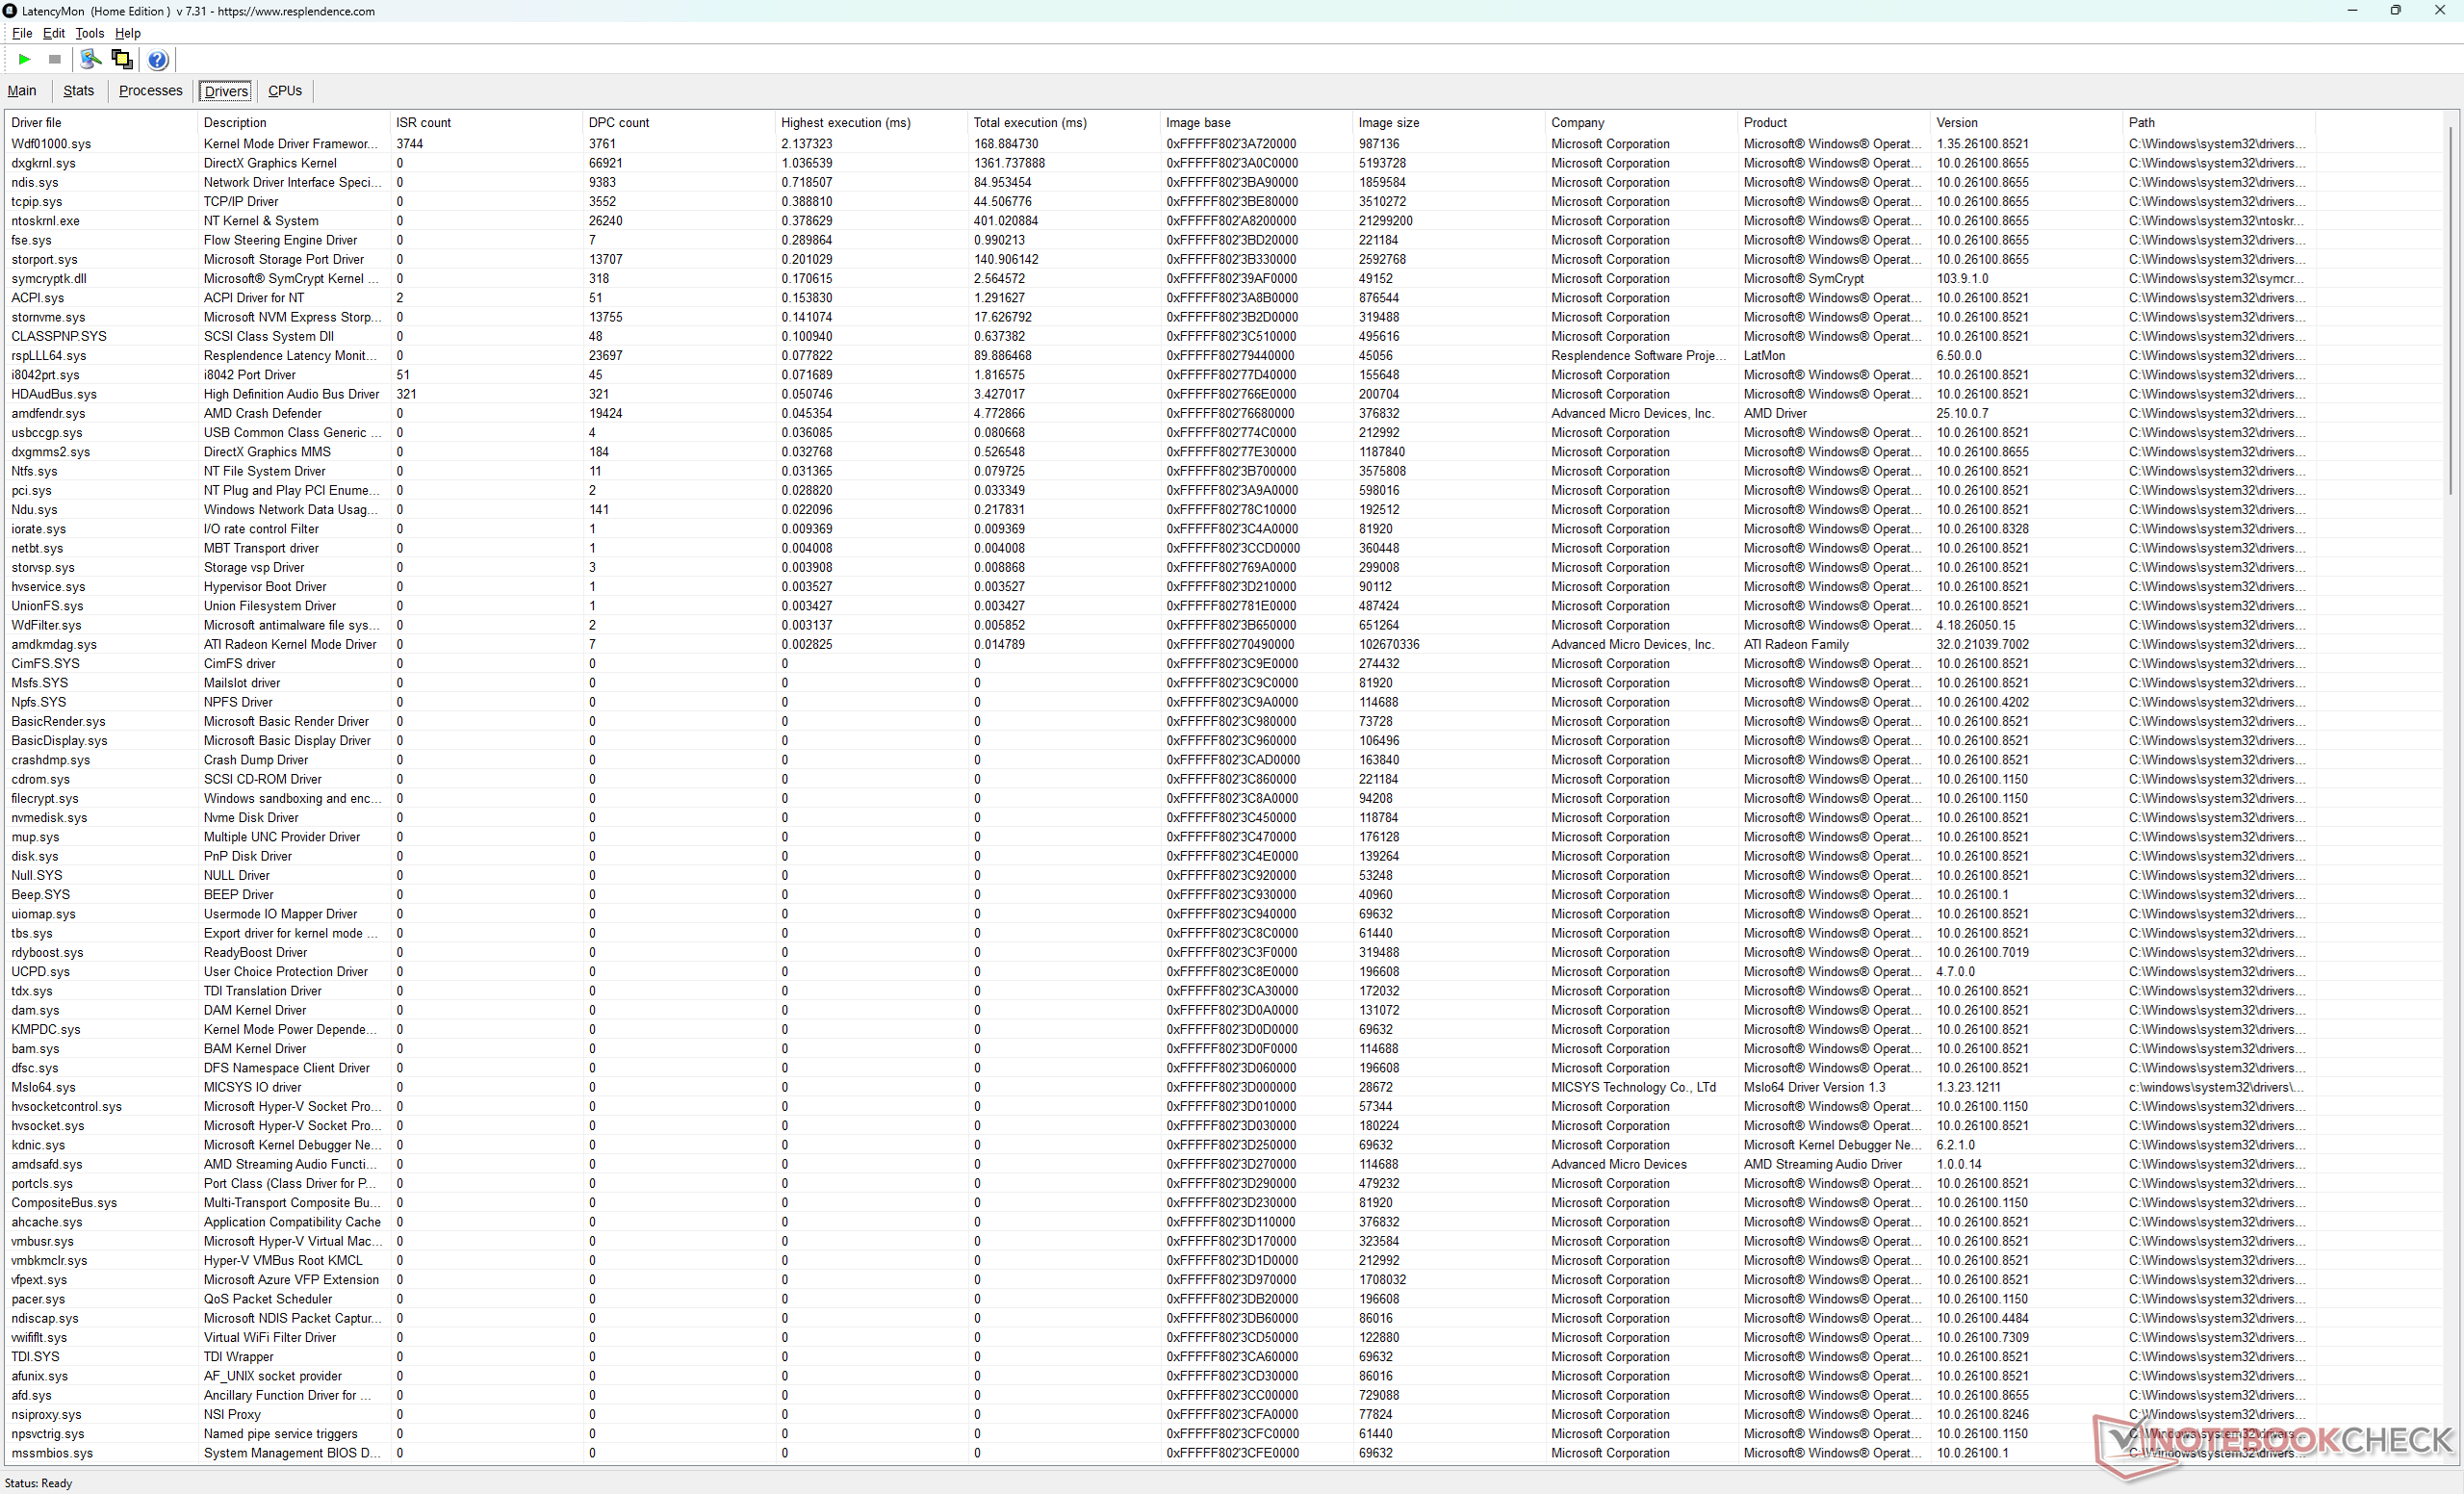
| DPC Latencies / LatencyMon - interrupt to process latency (max), Web, Youtube, Prime95 | |
| Lenovo Legion 7 16 AGP11 | |
| Gigabyte Gaming A16 Pro GA6DH (Core 7 240H, RTX 5070 Ti) | |
| Alienware 16X Aurora Core Ultra 9 290HX Plus | |
| Acer Predator Helios Neo 16S AI PHN16S-71-94L9 | |
| MSI Crosshair A16 HX E8WGK | |
| MSI Crosshair 16 HX AI D2XWGKG | |
* ... menor é melhor
Dispositivos de armazenamento
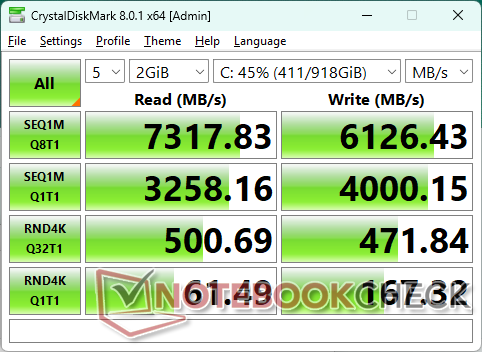
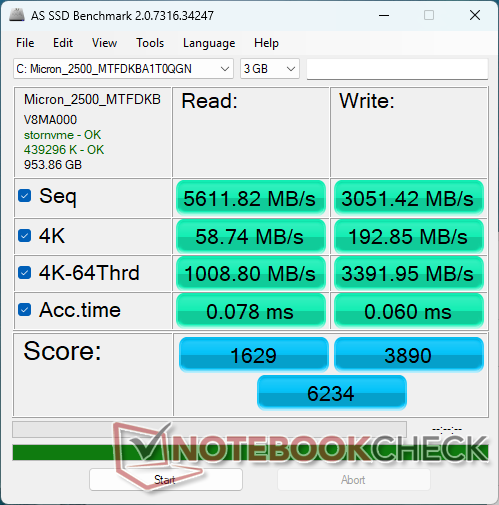

* ... menor é melhor
Limitação de disco: Loop de leitura do DiskSpd, profundidade da fila 8
Desempenho da GPU
| Perfil de potência | Pontuação em gráficos | Pontuação em física | Pontuação combinada |
| Modo de Desempenho, Cooler Boost ativado, Apex ativado | 14.087 | 13.104 | 13.930 |
| Modo de Desempenho, Cooler Boost desativado, Apex ativado | 14.118 (-0%) | 13.154 (-0%) | 13.964 (-0%) |
| Modo de Desempenho, Cooler Boost desativado, Apex desativado | 13.991 (-1%) | 13.109 (-0%) | 13.851 (-0%) |
| Modo Equilibrado | 13.451 (-5%) | 12.174 (-7%) | 13.242 (-5%) |
| Alimentação por bateria | 4.400 (-69%) | 6.518 (-50%) | 4.625 (-67%) |
| 3DMark 11 Performance | 37786 pontos | |
| 3DMark Cloud Gate Standard Score | 71413 pontos | |
| 3DMark Fire Strike Score | 35205 pontos | |
| 3DMark Time Spy Score | 13964 pontos | |
| 3DMark Steel Nomad Score | 3087 pontos | |
Ajuda | ||
* ... menor é melhor
| Final Fantasy XV Benchmark - 1920x1080 High Quality | |
| Alienware 16X Aurora Core Ultra 9 290HX Plus | |
| MSI Crosshair 16 HX AI D2XWGKG | |
| MSI Crosshair A16 HX E8WGK | |
| Lenovo Legion 7 16 AGP11 | |
| Gigabyte Gaming A16 Pro GA6DH (Core 7 240H, RTX 5070 Ti) | |
| Strange Brigade - 1920x1080 ultra AA:ultra AF:16 | |
| Alienware 16X Aurora Core Ultra 9 290HX Plus | |
| Gigabyte Gaming A16 Pro GA6DH (Core 7 240H, RTX 5070 Ti) | |
| MSI Crosshair 16 HX AI D2XWGKG | |
| MSI Crosshair A16 HX E8WGK | |
| Lenovo Legion 7 16 AGP11 | |
Gráfico de FPS em qualidade “Ultra” de Cyberpunk 2077
| baixo | média | alto | ultra | QHD DLSS | QHD | |
|---|---|---|---|---|---|---|
| GTA V (2015) | 187.6 | 186.6 | 184.6 | 152.6 | 129.7 | |
| Dota 2 Reborn (2015) | 240 | 208 | 199.1 | 183.3 | ||
| Final Fantasy XV Benchmark (2018) | 229 | 187.8 | 140 | 102 | ||
| X-Plane 11.11 (2018) | 141.9 | 131.5 | 104.8 | |||
| Strange Brigade (2018) | 502 | 369 | 305 | 258 | 170.4 | |
| Baldur's Gate 3 (2023) | 239 | 183.9 | 154.6 | 133.2 | 129.6 | 90.3 |
| Cyberpunk 2077 (2023) | 173.8 | 149 | 124.8 | 112.1 | 81.9 | 68.8 |
| F1 24 (2024) | 345 | 336 | 269 | 94.7 | 93.1 | 59.3 |
Emissões
Ruído do sistema
Barulho
| Ocioso |
| 29.1 / 29.1 / 29.1 dB |
| Carga |
| 41.7 / 59 dB |
 | ||
30 dB silencioso 40 dB(A) audível 50 dB(A) ruidosamente alto |
||
min: | ||
| MSI Crosshair A16 HX E8WGK R9 8940HX, GeForce RTX 5070 Laptop | MSI Crosshair 16 HX AI D2XWGKG Ultra 9 275HX, GeForce RTX 5070 Laptop | Alienware 16X Aurora Core Ultra 9 290HX Plus Ultra 9 290HX Plus, GeForce RTX 5070 Ti Laptop | Lenovo Legion 7 16 AGP11 Ryzen AI 9 HX 470, GeForce RTX 5060 Laptop | Gigabyte Gaming A16 Pro GA6DH (Core 7 240H, RTX 5070 Ti) Core 7 240H, GeForce RTX 5070 Ti Laptop | Acer Predator Helios Neo 16S AI PHN16S-71-94L9 Ultra 9 275HX, GeForce RTX 5070 Ti Laptop | |
|---|---|---|---|---|---|---|
| Noise | -2% | 3% | 10% | 11% | -2% | |
| desligado / ambiente * (dB) | 23.4 | 25.56 -9% | 23.4 -0% | 24.5 -5% | 23 2% | 24 -3% |
| Idle Minimum * (dB) | 29.1 | 28.3 3% | 23.8 18% | 24.5 16% | 23 21% | 24 18% |
| Idle Average * (dB) | 29.1 | 28.3 3% | 23.8 18% | 24.5 16% | 24.35 16% | 30 -3% |
| Idle Maximum * (dB) | 29.1 | 28.3 3% | 31.4 -8% | 27.1 7% | 24.35 16% | 35 -20% |
| Load Average * (dB) | 41.7 | 50.26 -21% | 48.7 -17% | 34.6 17% | 34.77 17% | 53 -27% |
| Cyberpunk 2077 ultra * (dB) | 58.7 | 57.8 2% | 51.5 12% | 53 10% | 56.18 4% | 52 11% |
| Load Maximum * (dB) | 59 | 57.95 2% | 59.8 -1% | 53 10% | 56.43 4% | 54 8% |
* ... menor é melhor
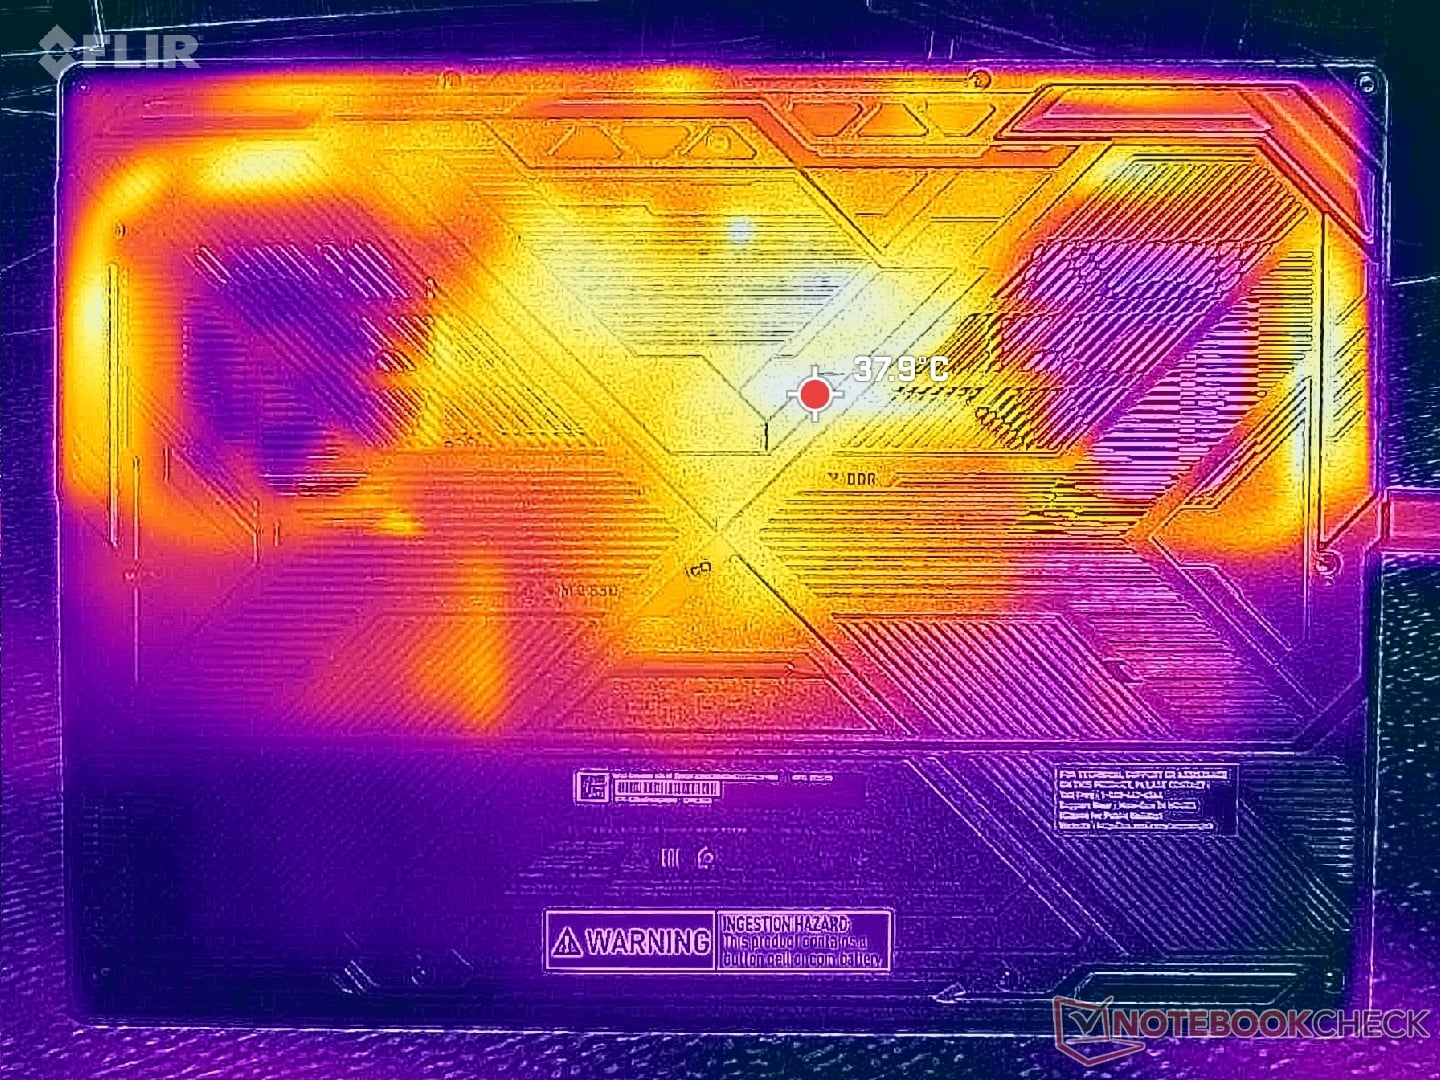
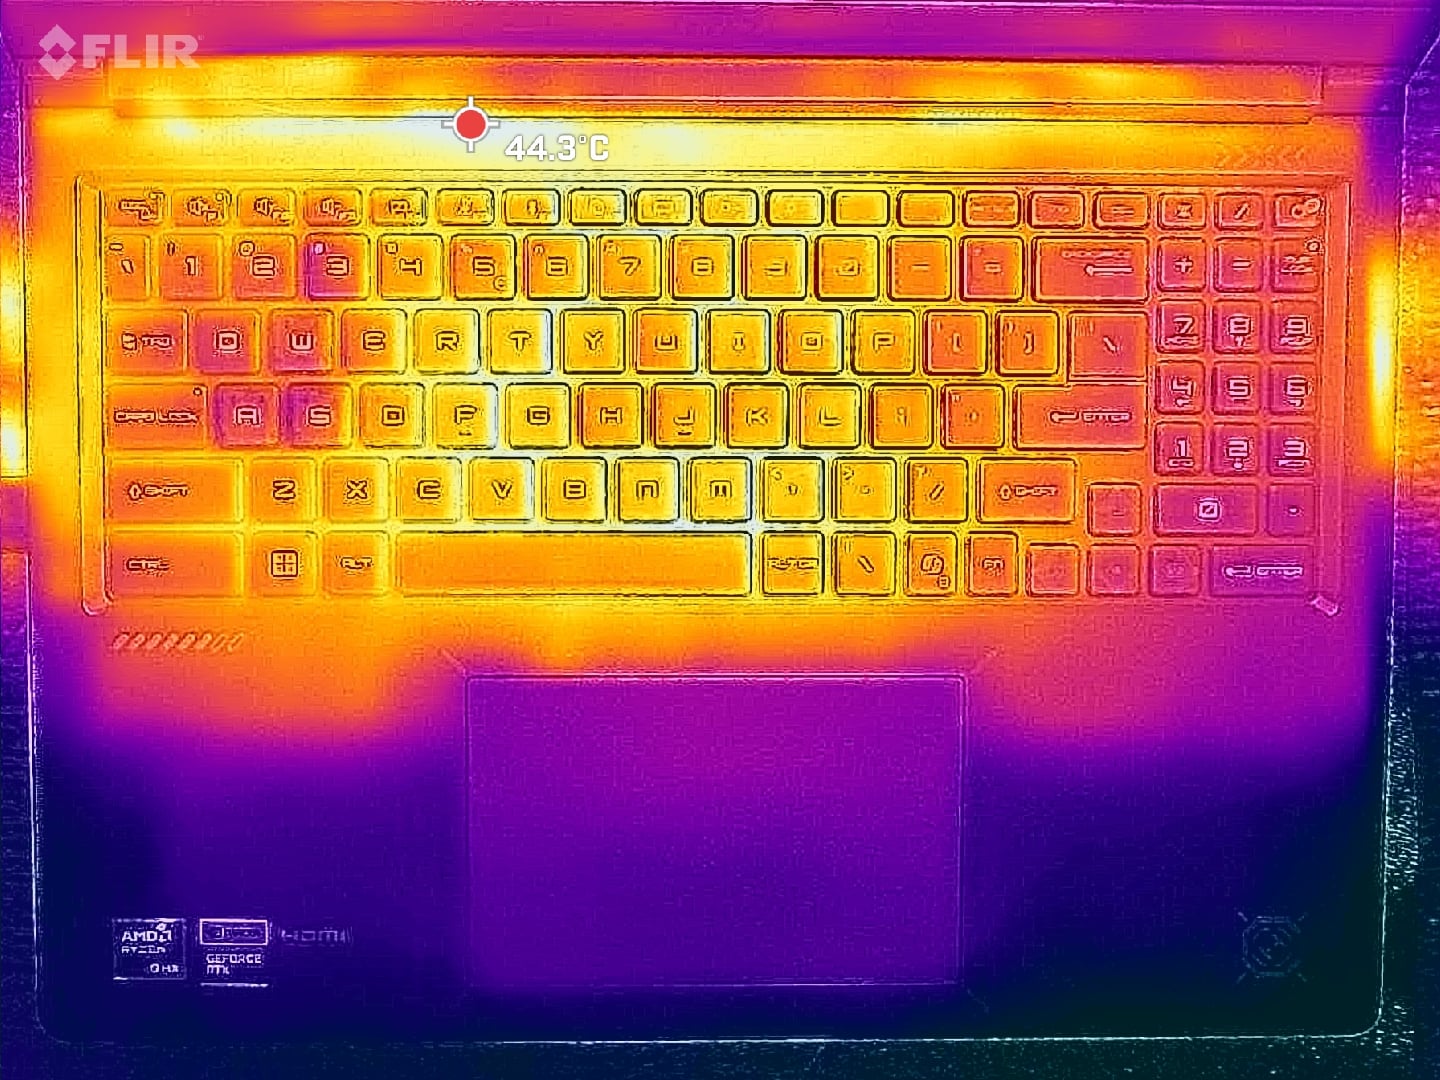
Temperatura
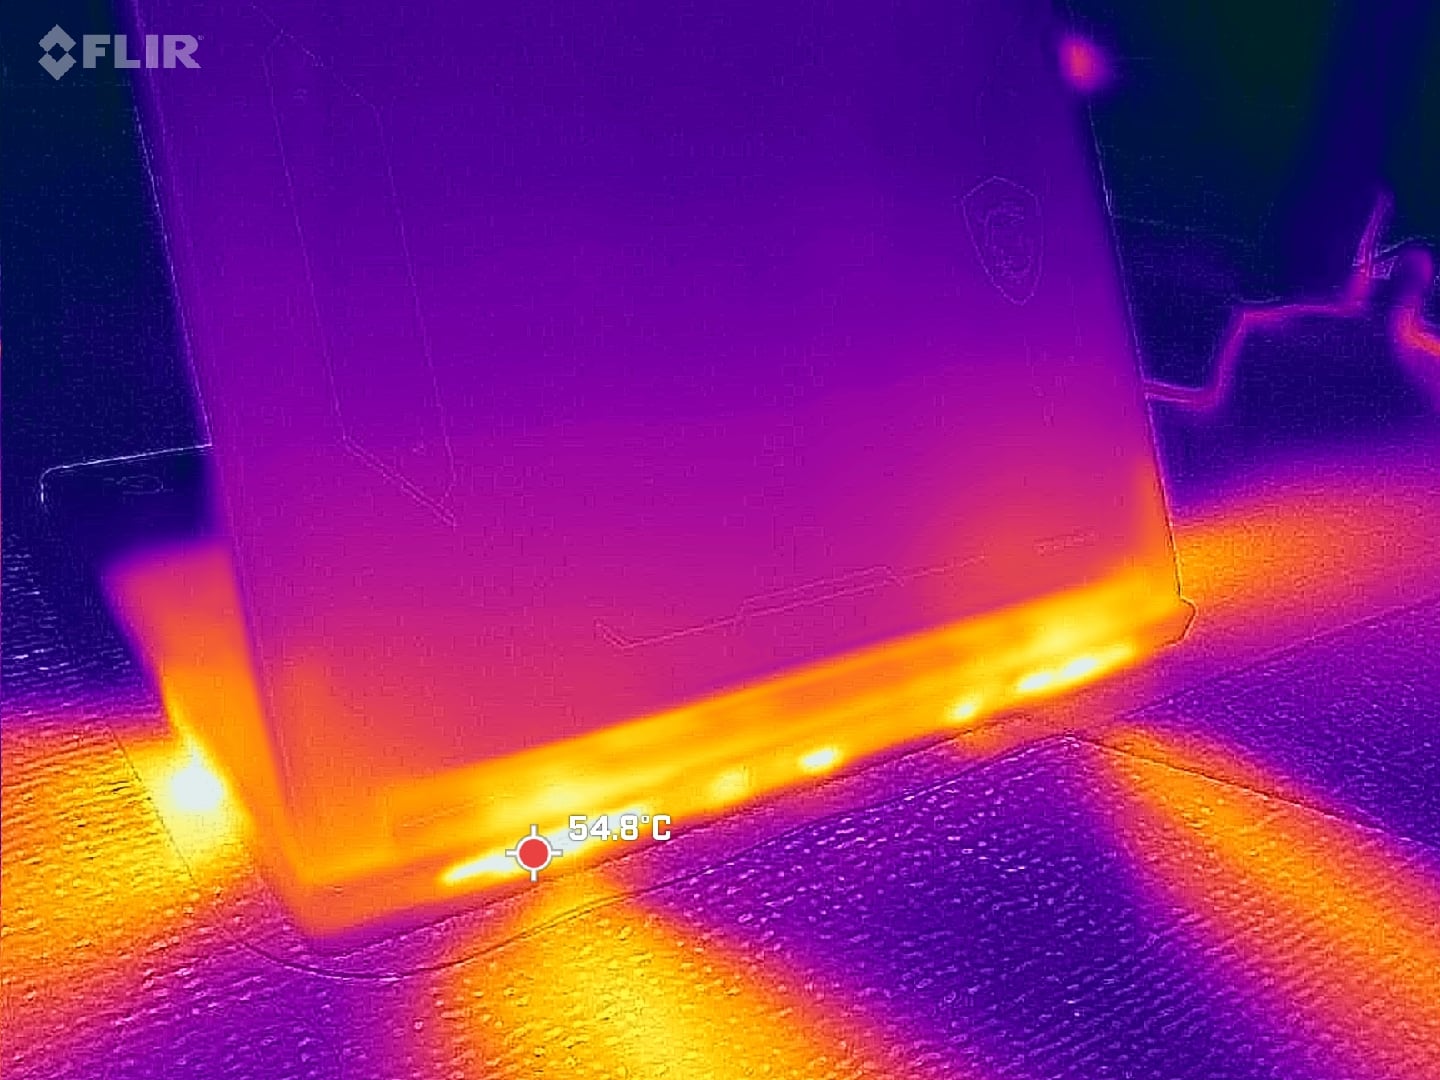
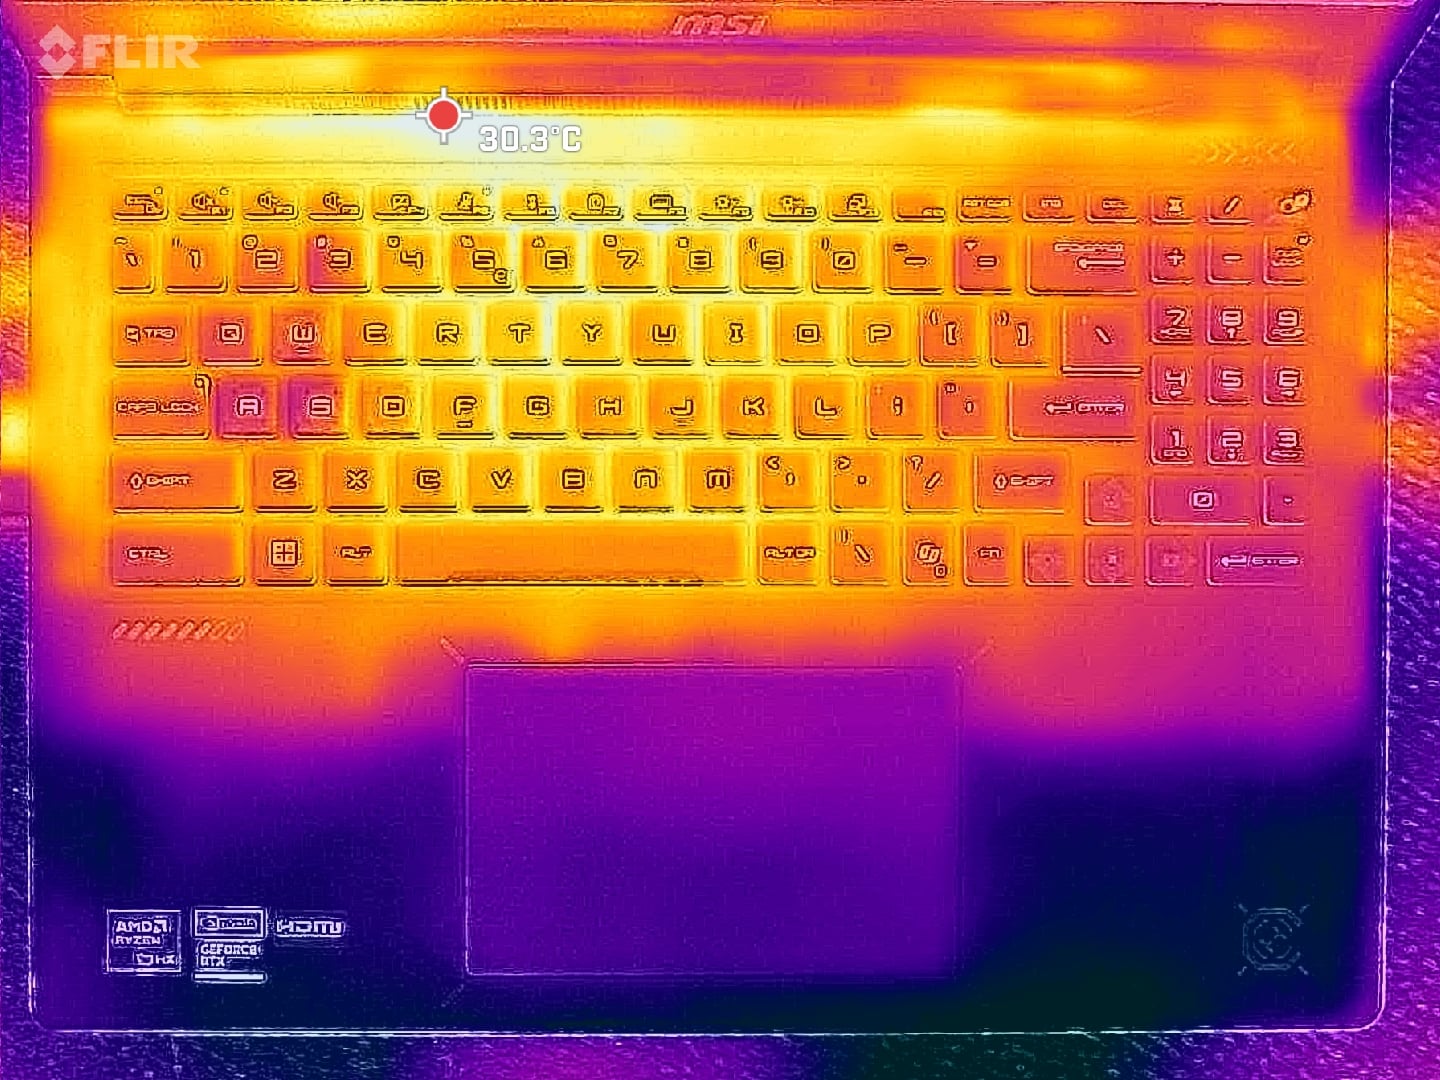
(±) A temperatura máxima no lado superior é 41.8 °C / 107 F, em comparação com a média de 40.4 °C / 105 F , variando de 21.2 a 68.8 °C para a classe Gaming.
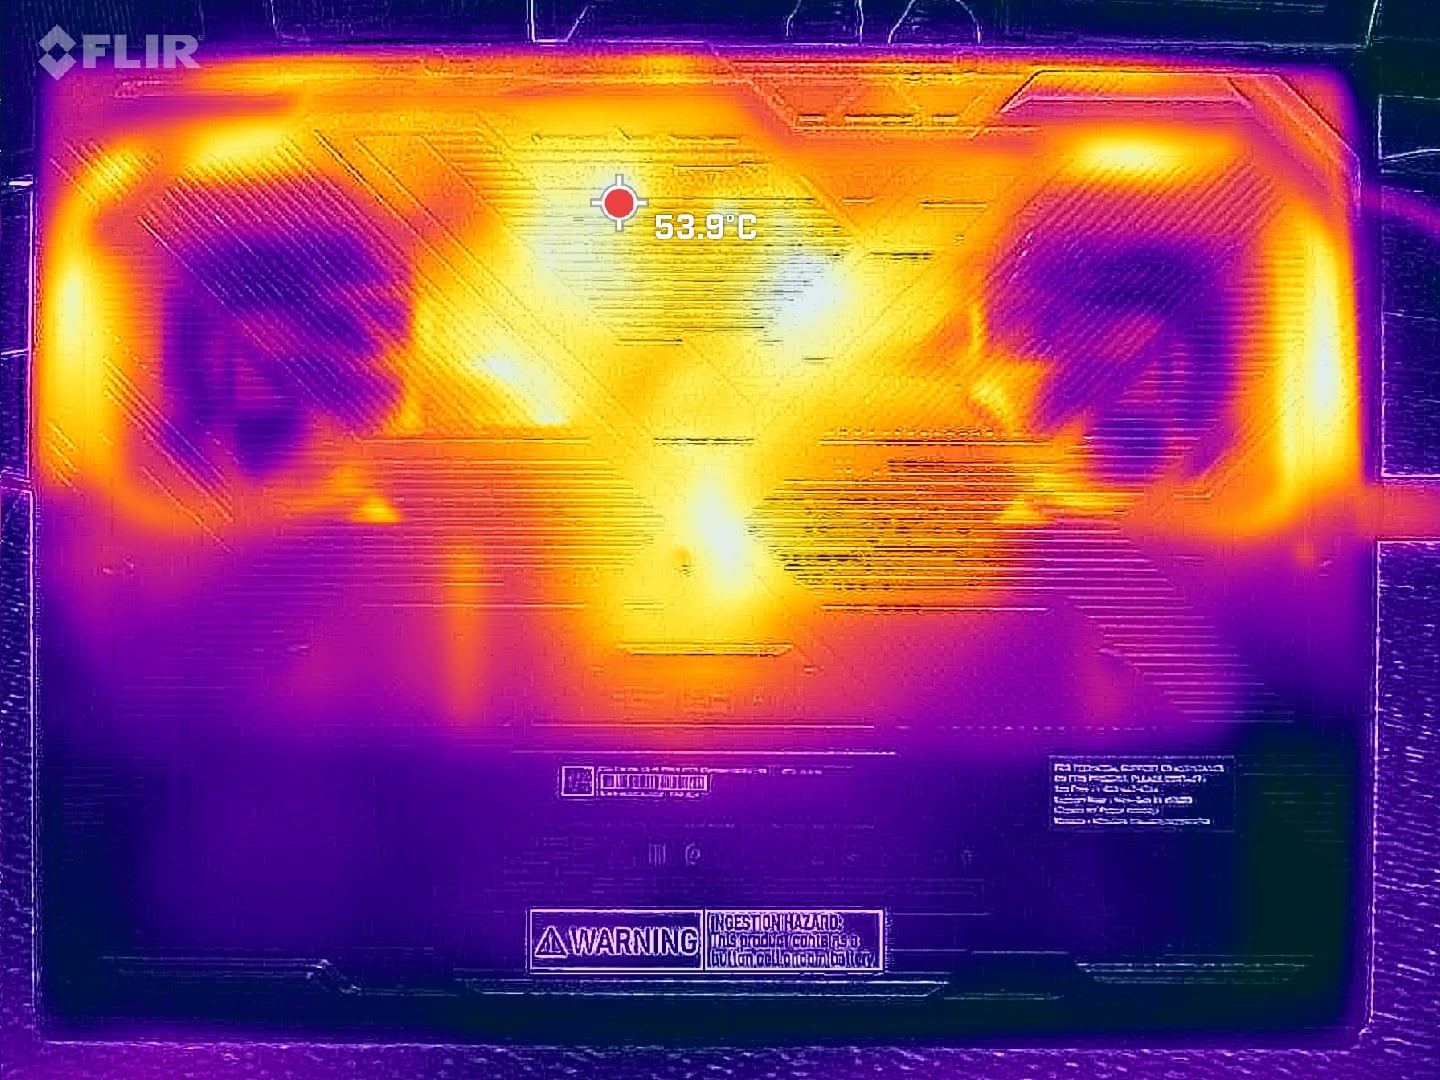
(-) A parte inferior aquece até um máximo de 50.6 °C / 123 F, em comparação com a média de 43.2 °C / 110 F
(+) Em uso inativo, a temperatura média para o lado superior é 26.2 °C / 79 F, em comparação com a média do dispositivo de 33.9 °C / ### class_avg_f### F.
(+) Os apoios para as mãos e o touchpad são mais frios que a temperatura da pele, com um máximo de 31.6 °C / 88.9 F e, portanto, são frios ao toque.
(-) A temperatura média da área do apoio para as mãos de dispositivos semelhantes foi 28.8 °C / 83.8 F (-2.8 °C / -5.1 F).
| MSI Crosshair A16 HX E8WGK R9 8940HX, GeForce RTX 5070 Laptop | MSI Crosshair 16 HX AI D2XWGKG Ultra 9 275HX, GeForce RTX 5070 Laptop | Alienware 16X Aurora Core Ultra 9 290HX Plus Ultra 9 290HX Plus, GeForce RTX 5070 Ti Laptop | Lenovo Legion 7 16 AGP11 Ryzen AI 9 HX 470, GeForce RTX 5060 Laptop | Gigabyte Gaming A16 Pro GA6DH (Core 7 240H, RTX 5070 Ti) Core 7 240H, GeForce RTX 5070 Ti Laptop | Acer Predator Helios Neo 16S AI PHN16S-71-94L9 Ultra 9 275HX, GeForce RTX 5070 Ti Laptop | |
|---|---|---|---|---|---|---|
| Heat | 7% | 10% | 7% | -2% | 2% | |
| Maximum Upper Side * (°C) | 41.8 | 44.8 -7% | 48.2 -15% | 44.9 -7% | 42 -0% | 47 -12% |
| Maximum Bottom * (°C) | 50.6 | 43.4 14% | 41 19% | 50.5 -0% | 49 3% | 55 -9% |
| Idle Upper Side * (°C) | 30.8 | 31.2 -1% | 28.2 8% | 27.3 11% | 34 -10% | 28 9% |
| Idle Bottom * (°C) | 36 | 28.8 20% | 26.2 27% | 27.5 24% | 36 -0% | 29 19% |
* ... menor é melhor
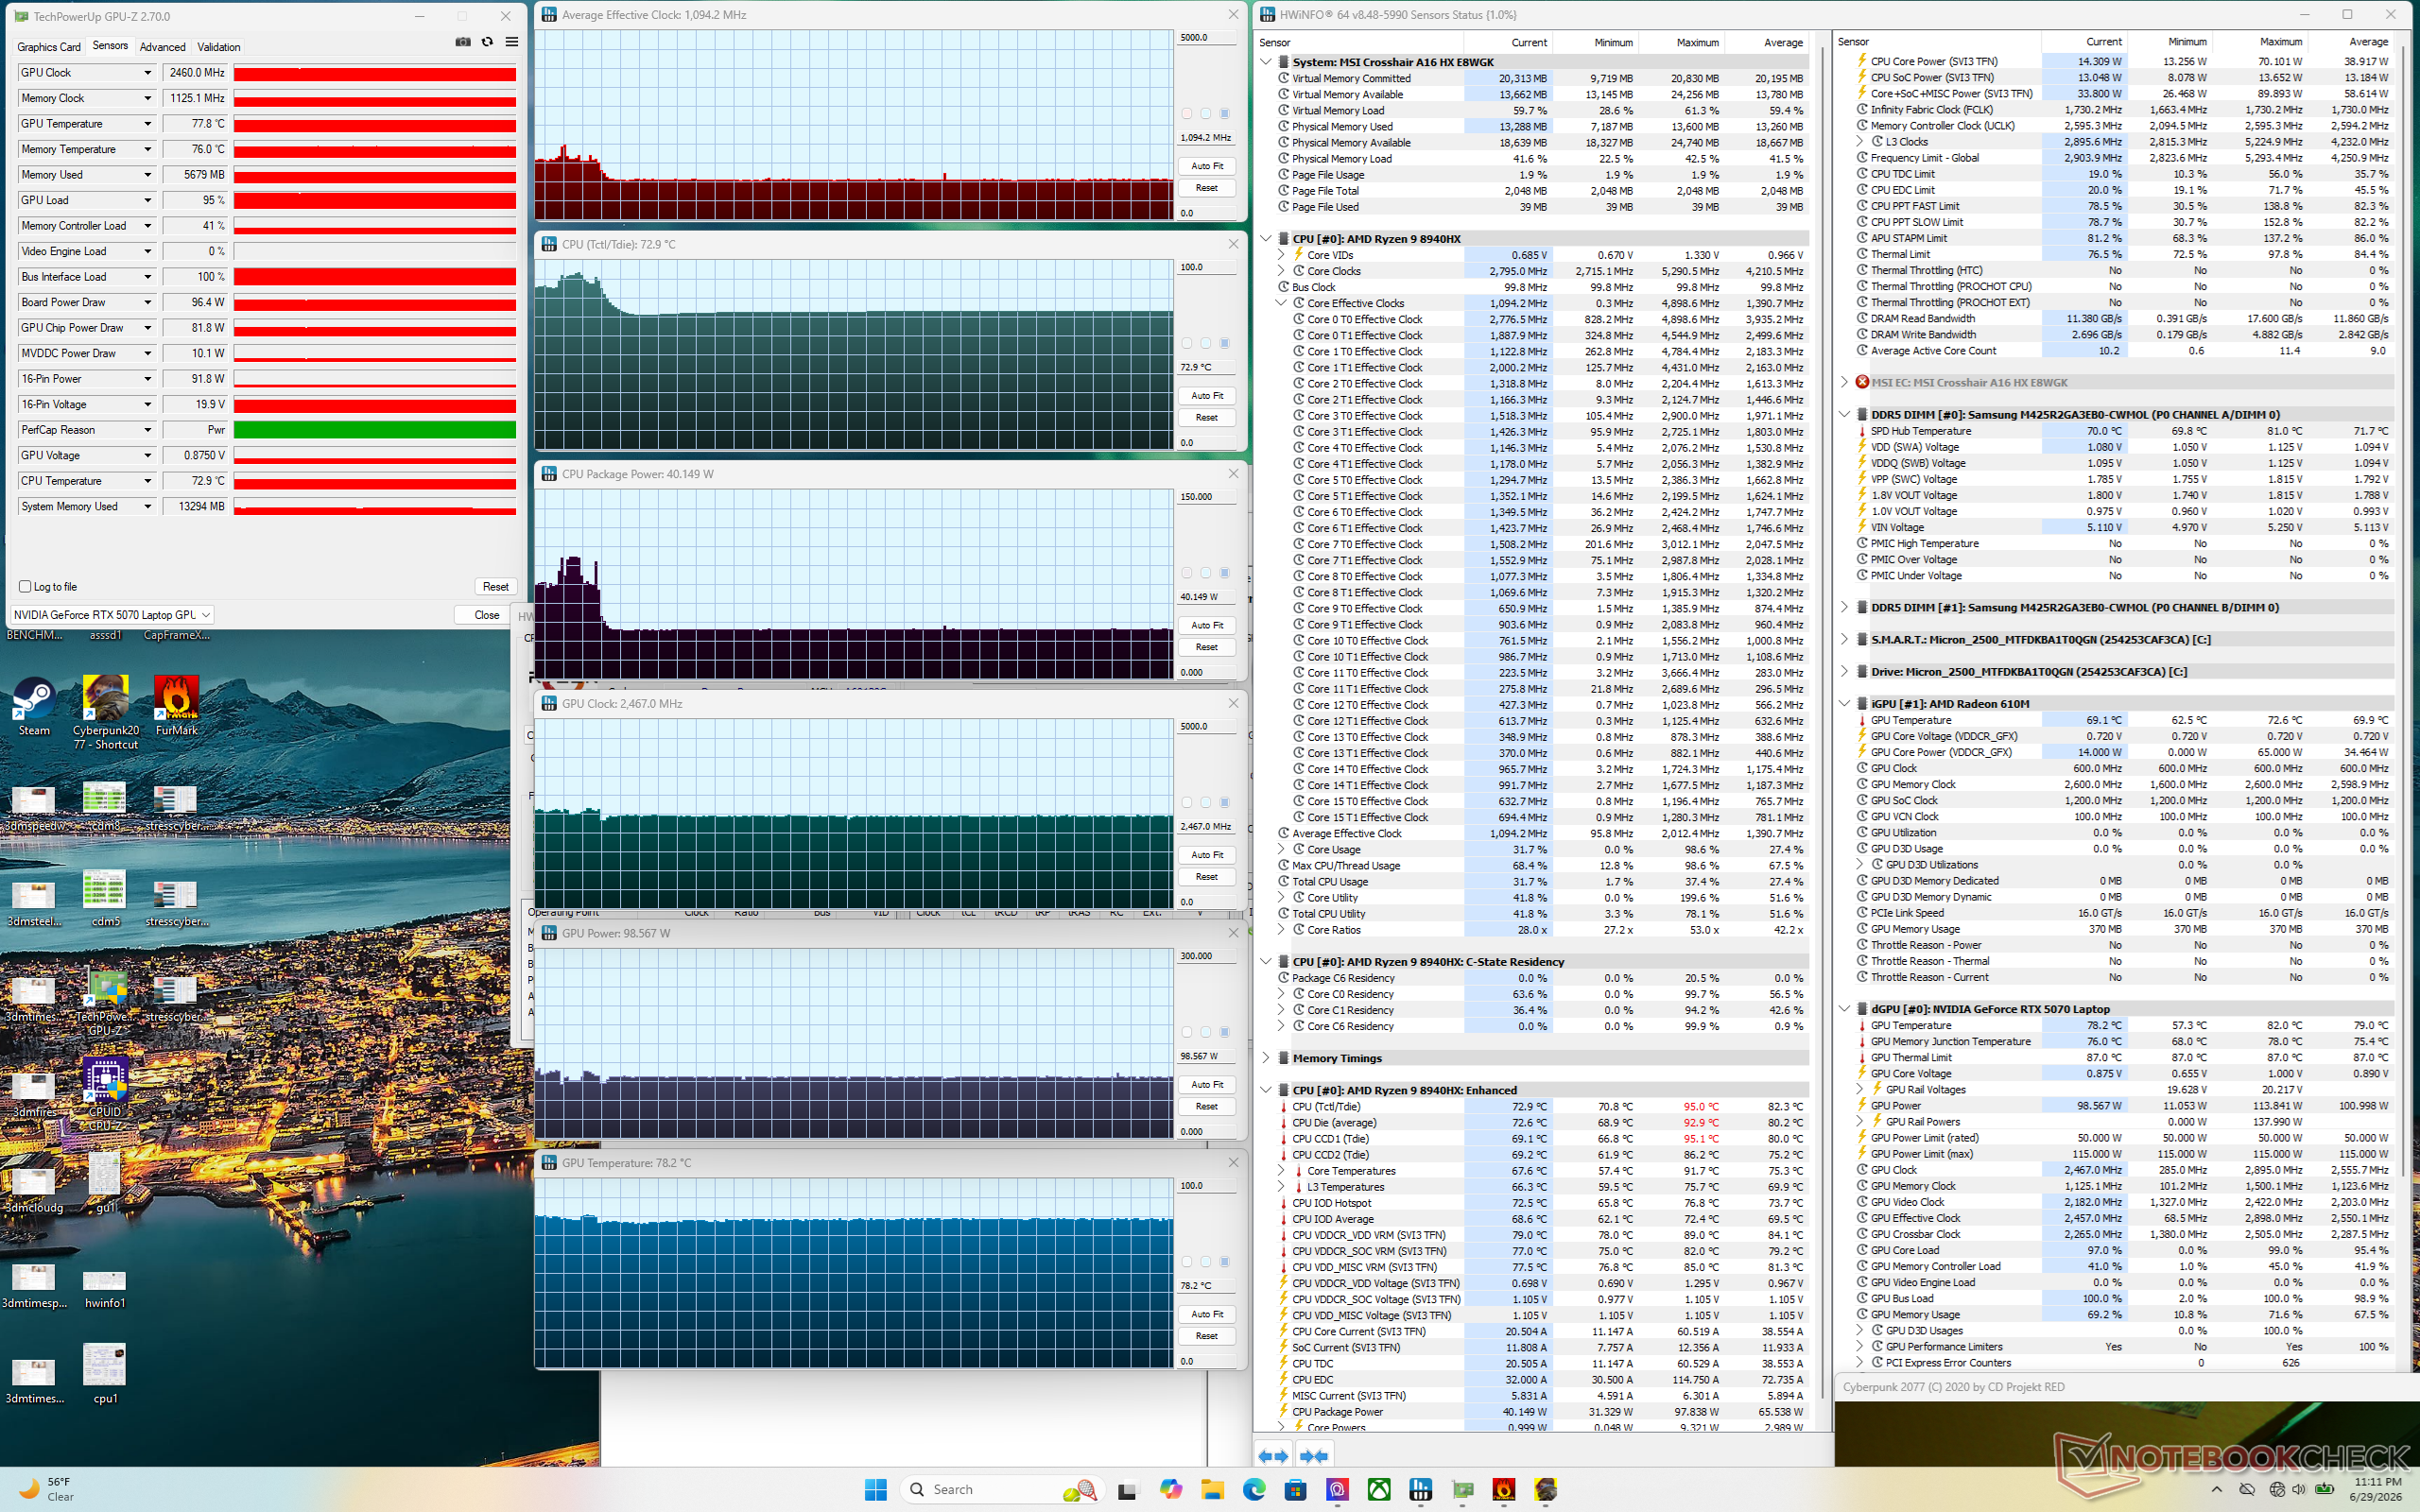
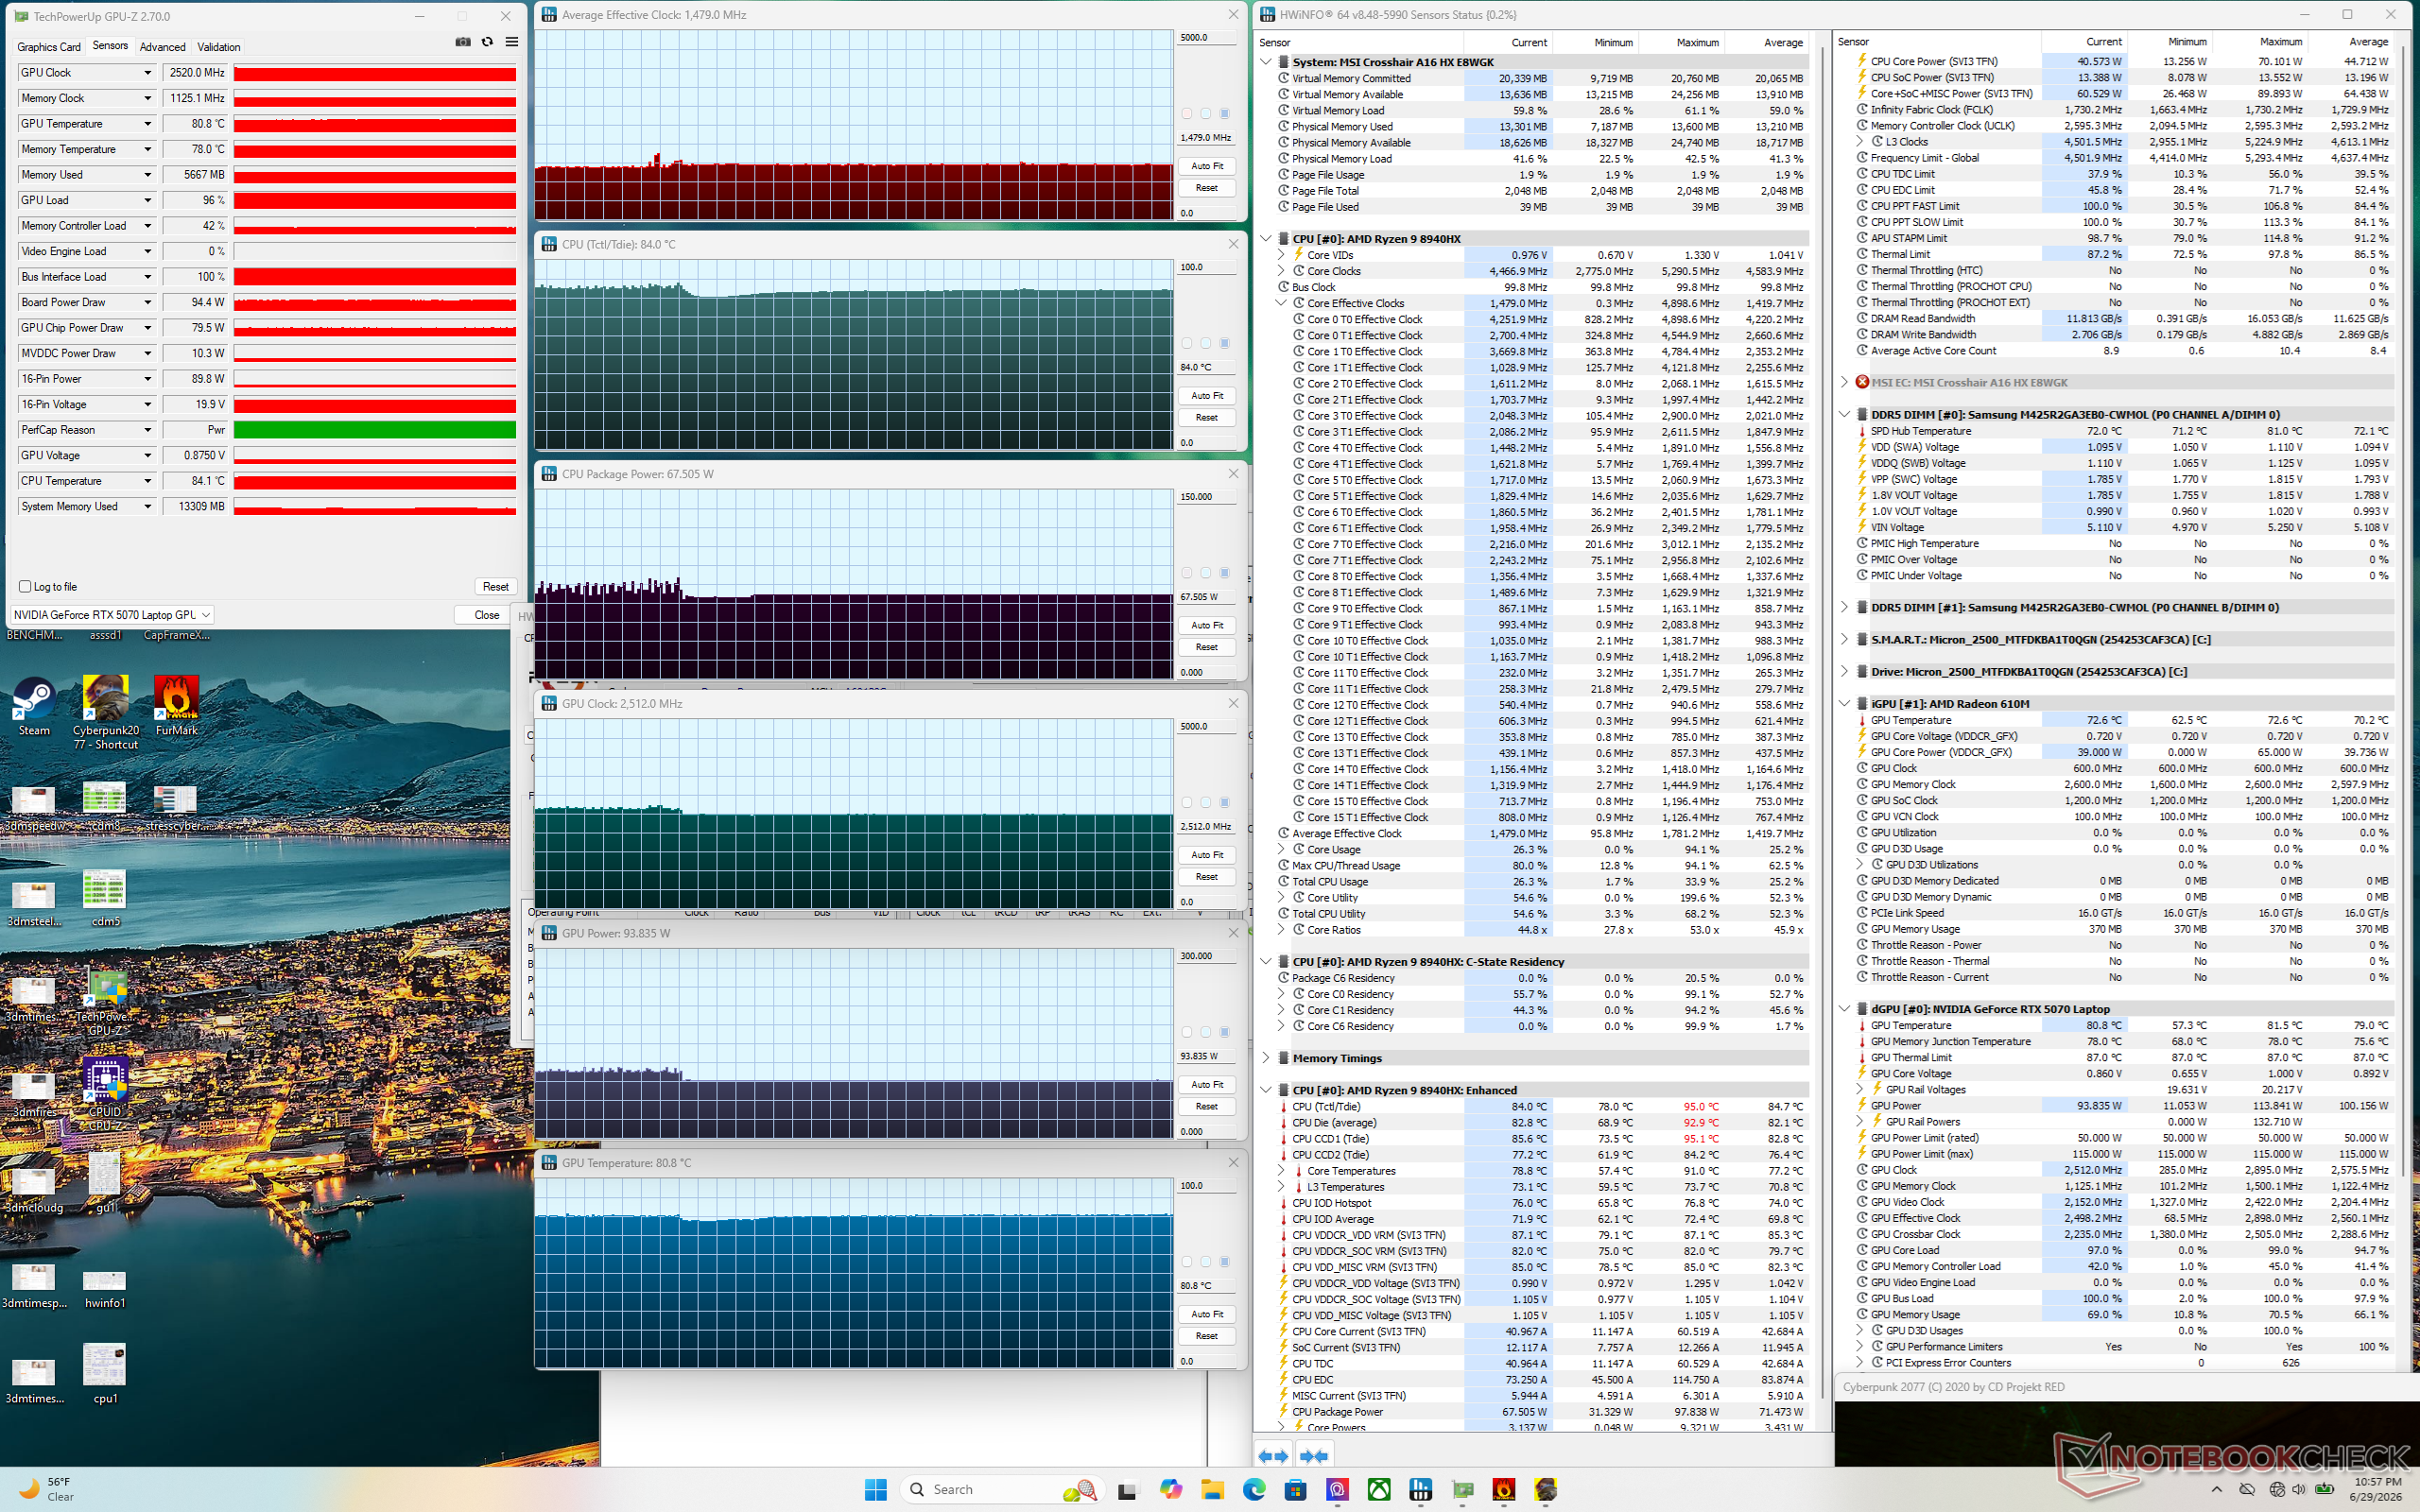
Teste de estresse
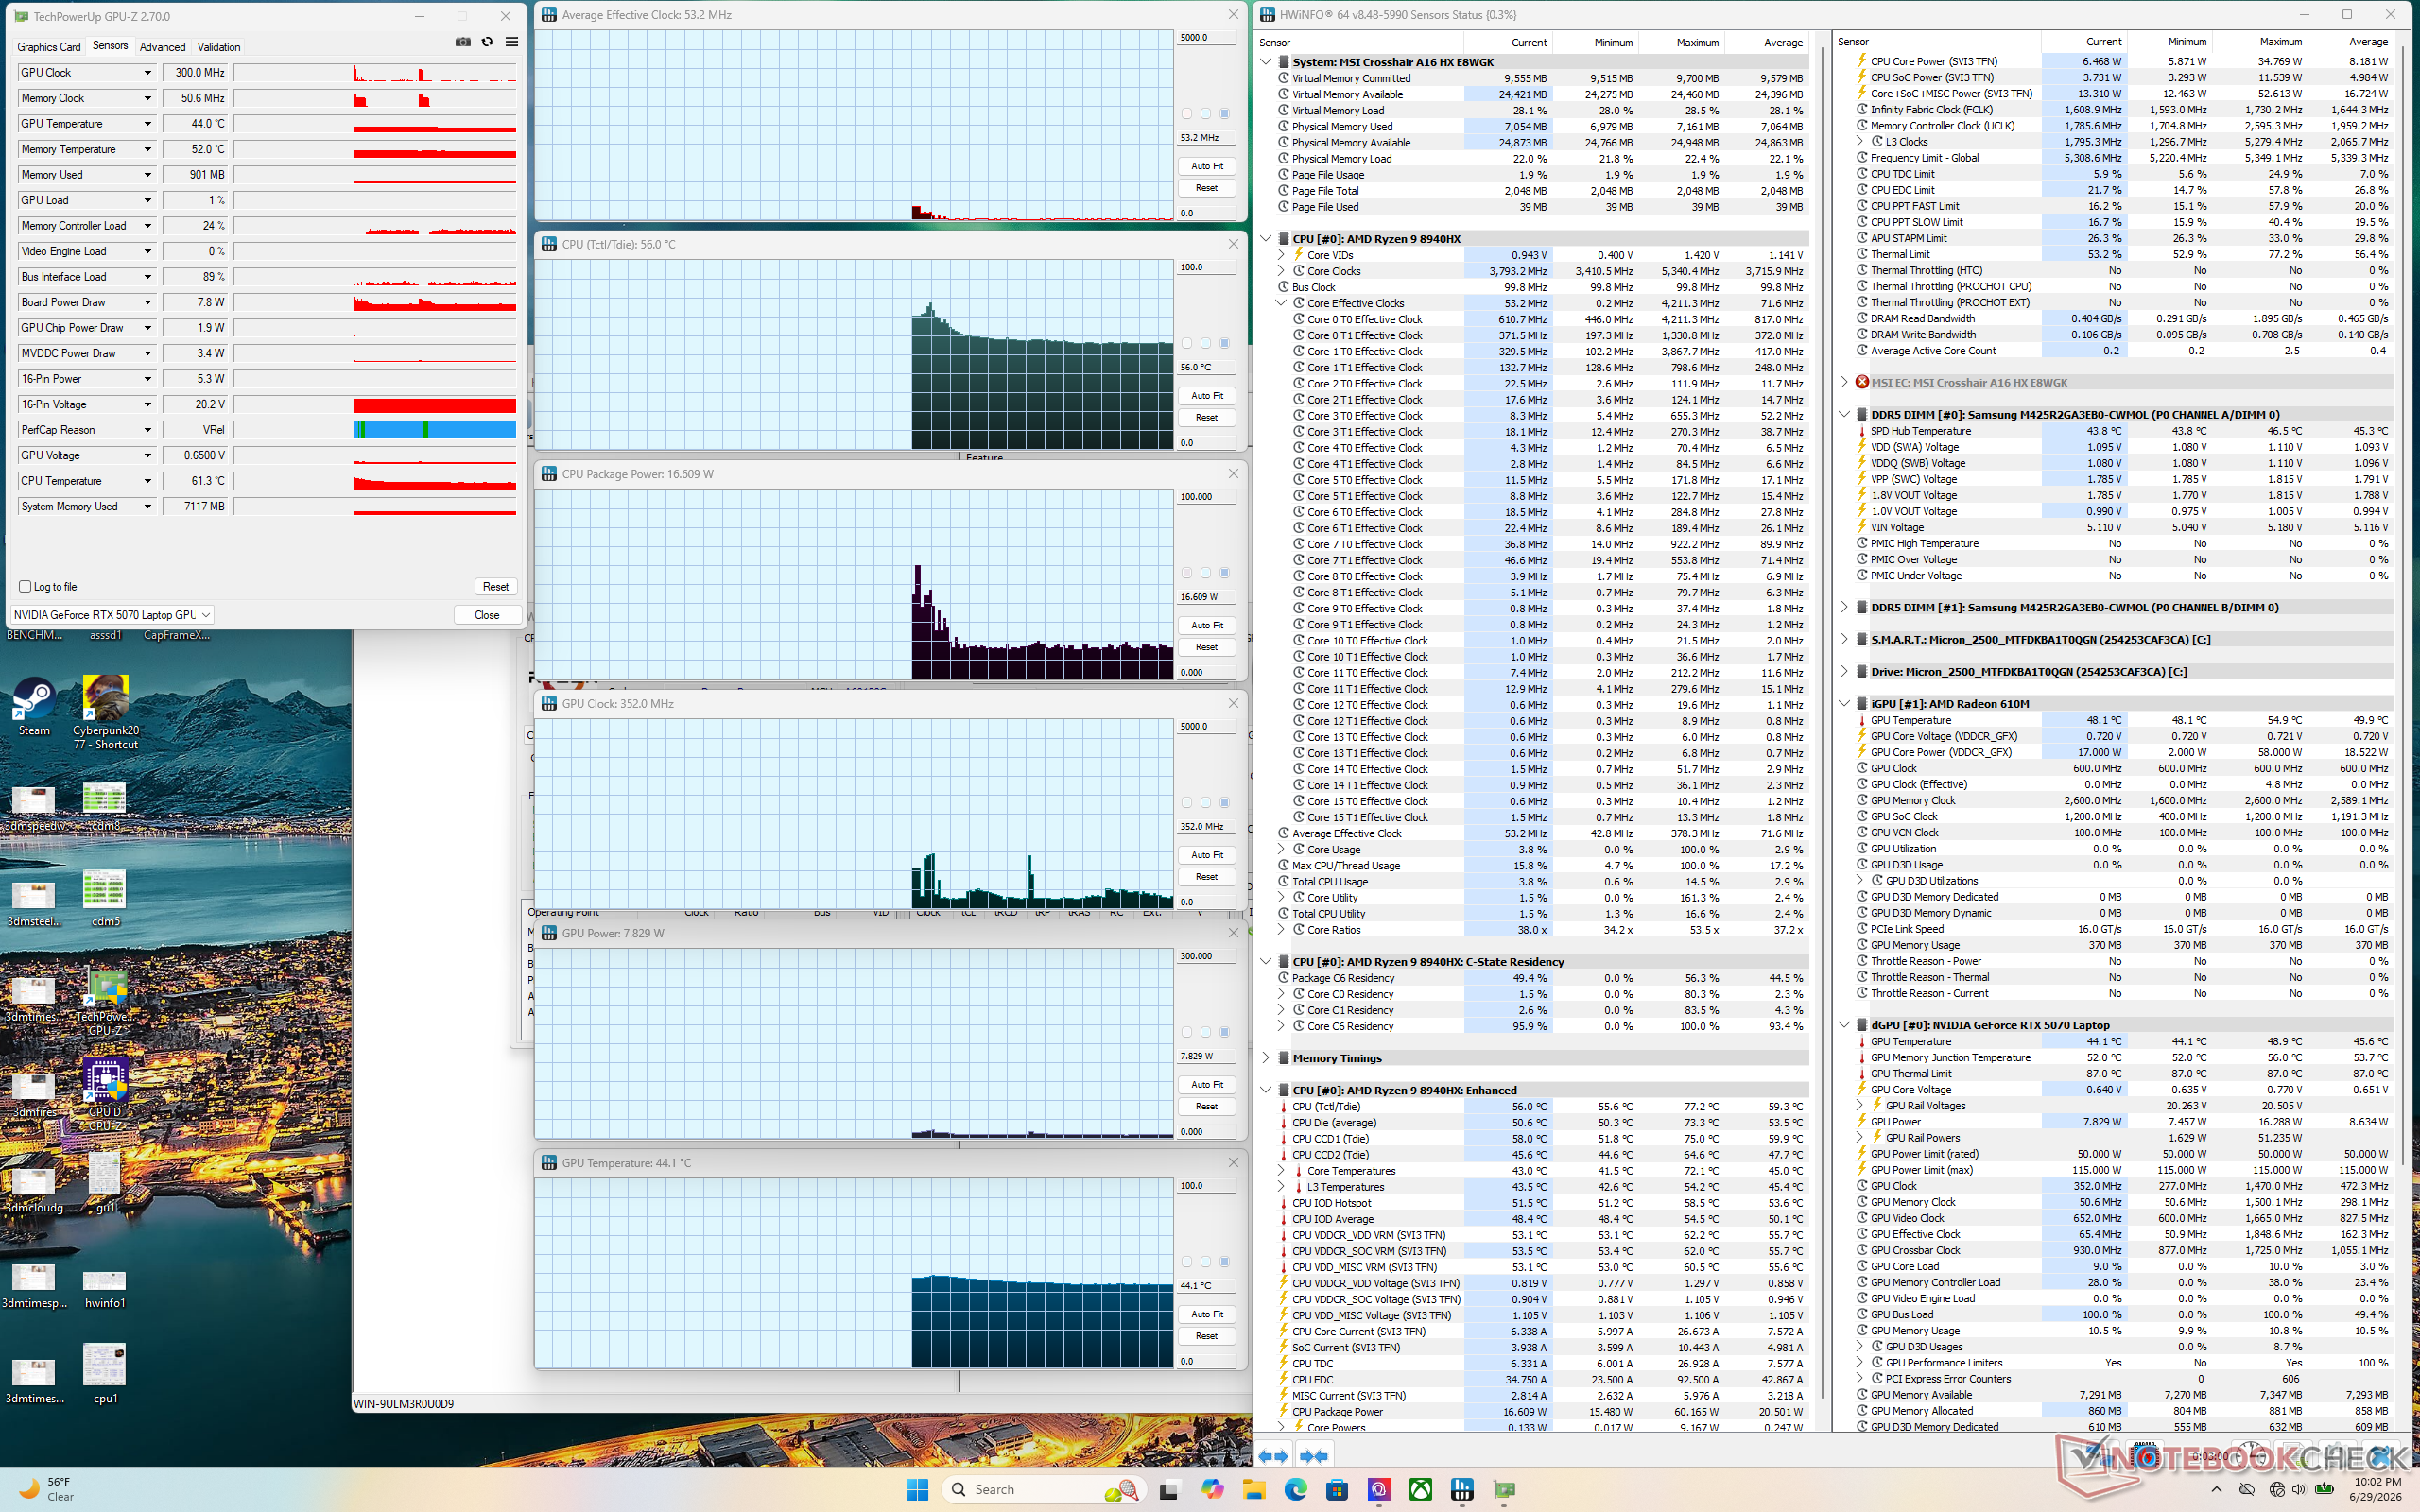
As temperaturas da CPU e da GPU durante jogos no modo Desempenho ficariam, em média, na faixa de 80s médios e 80s baixos, respectivamente. As temperaturas dos núcleos ficariam alguns graus Celsius mais baixas ao operar no modo Equilibrado; no entanto, o TGP médio cairia de 113 W para 99 W, com um desempenho gráfico mais lento.
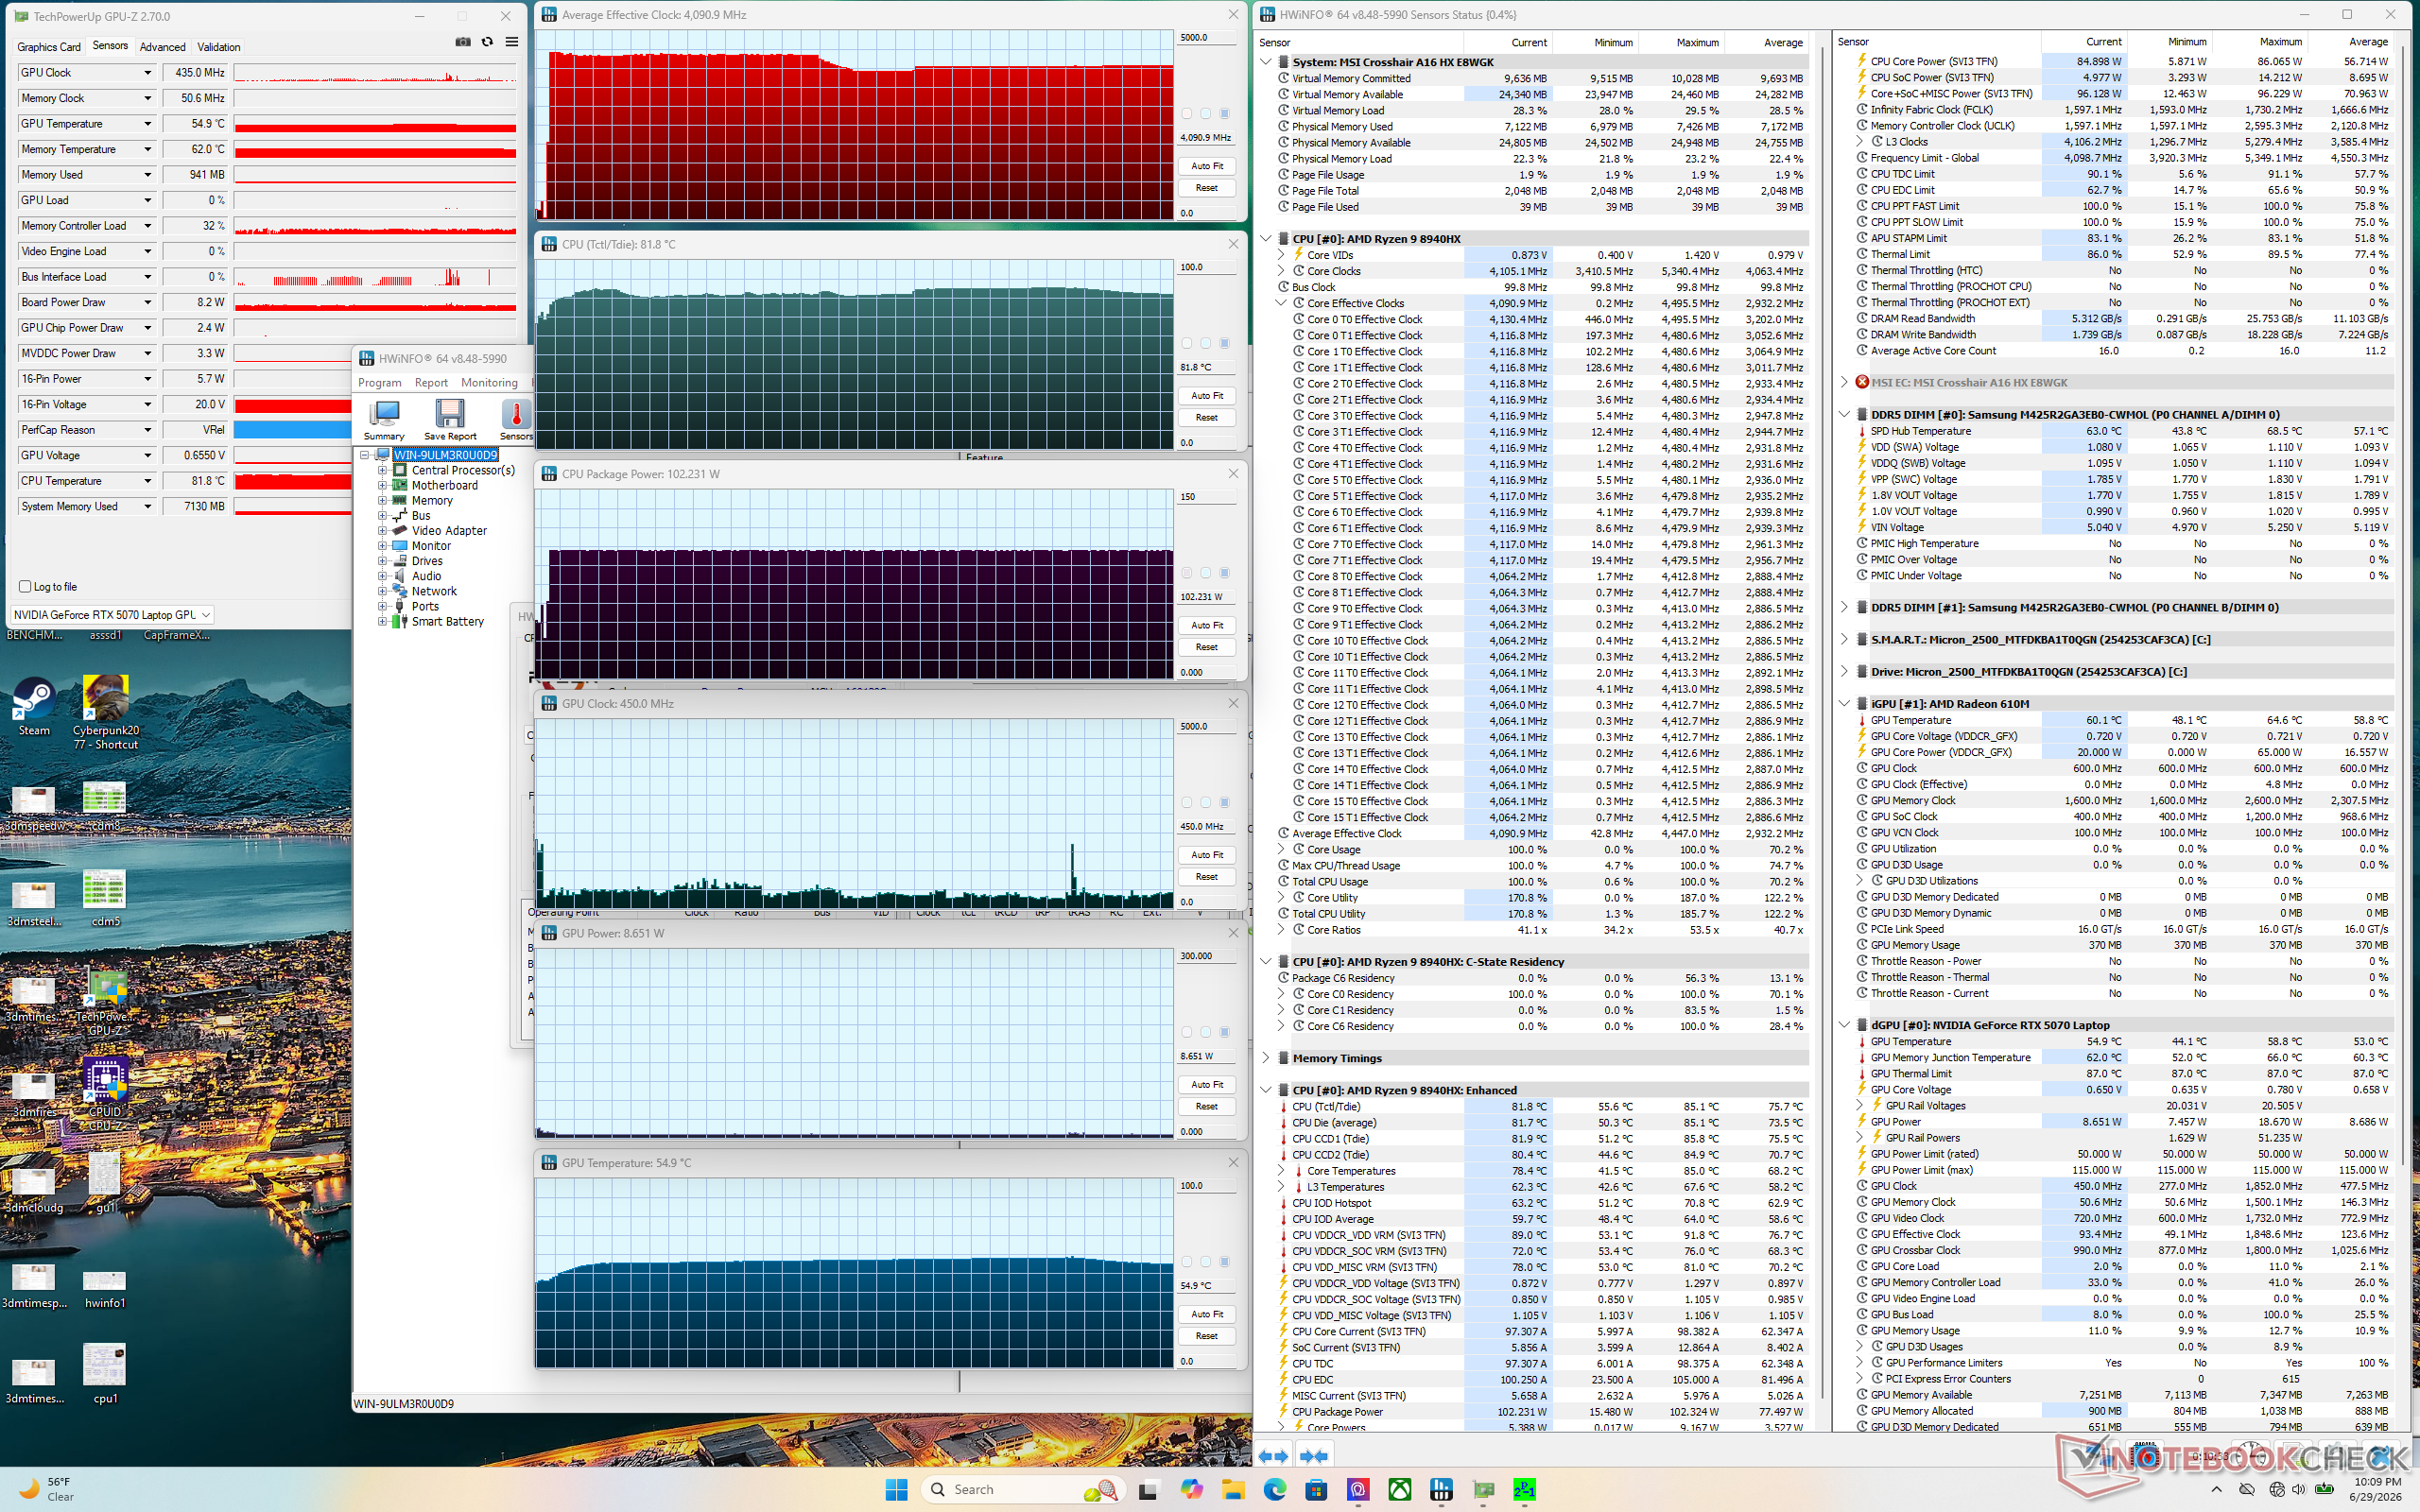
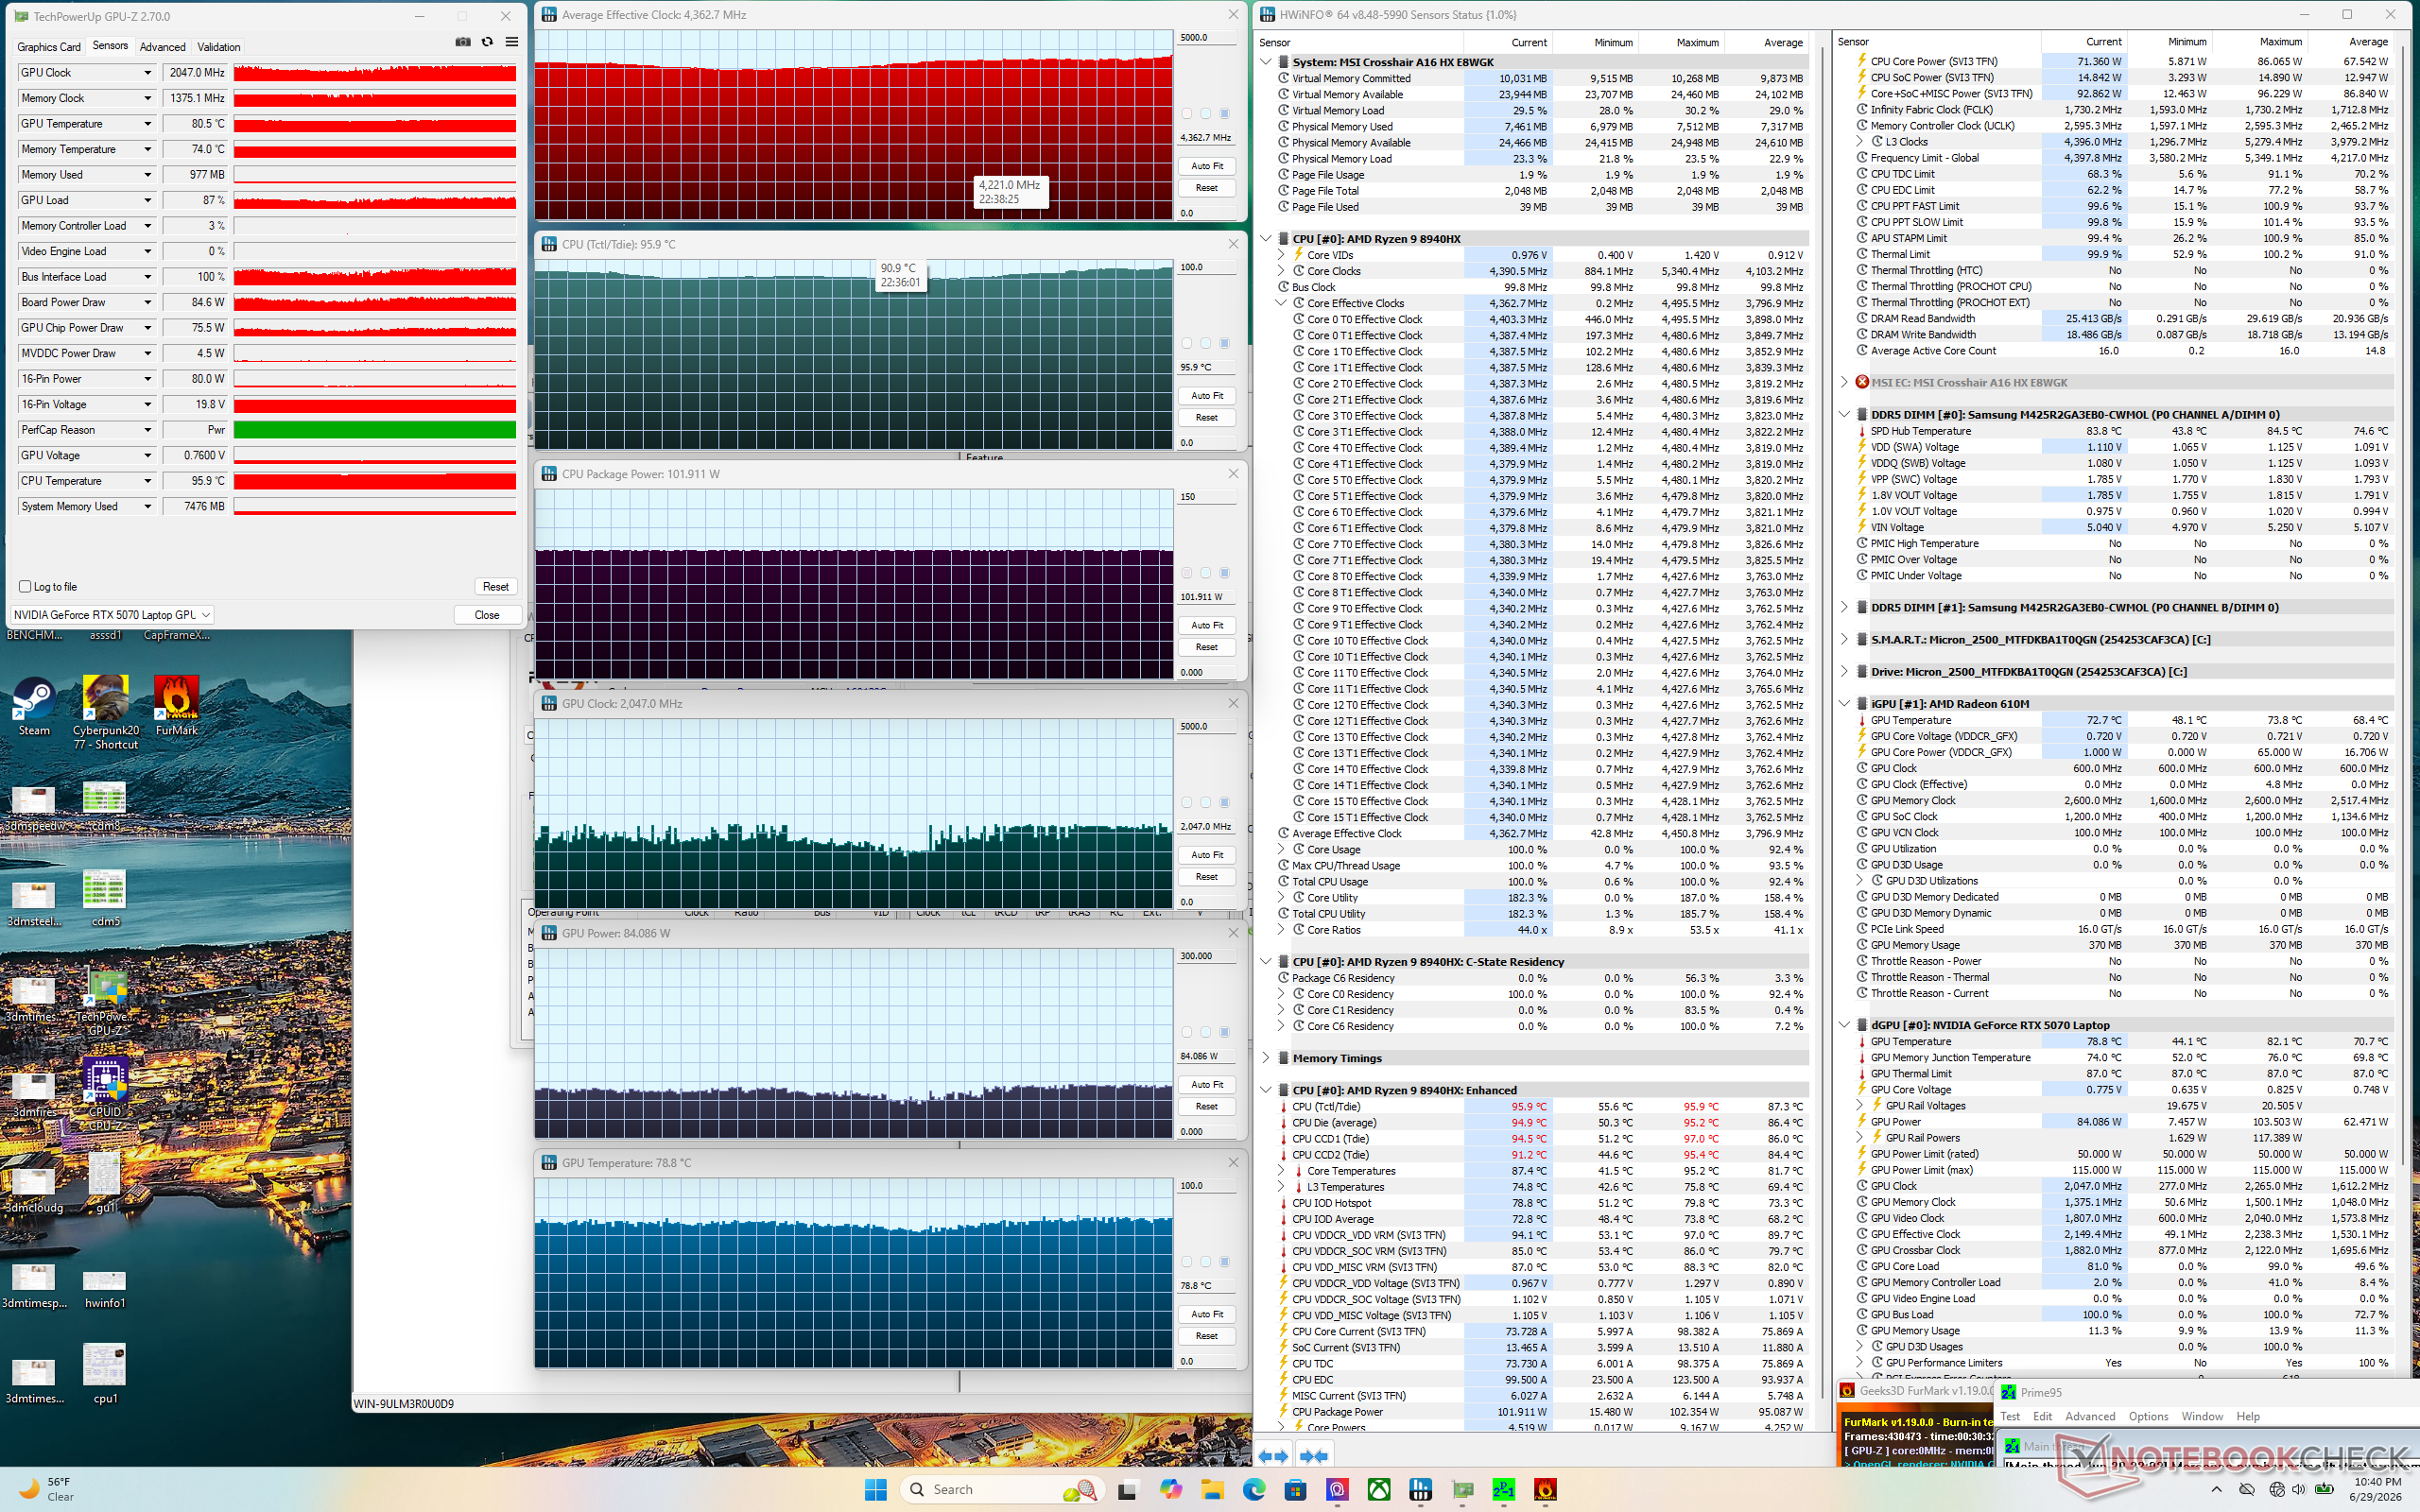
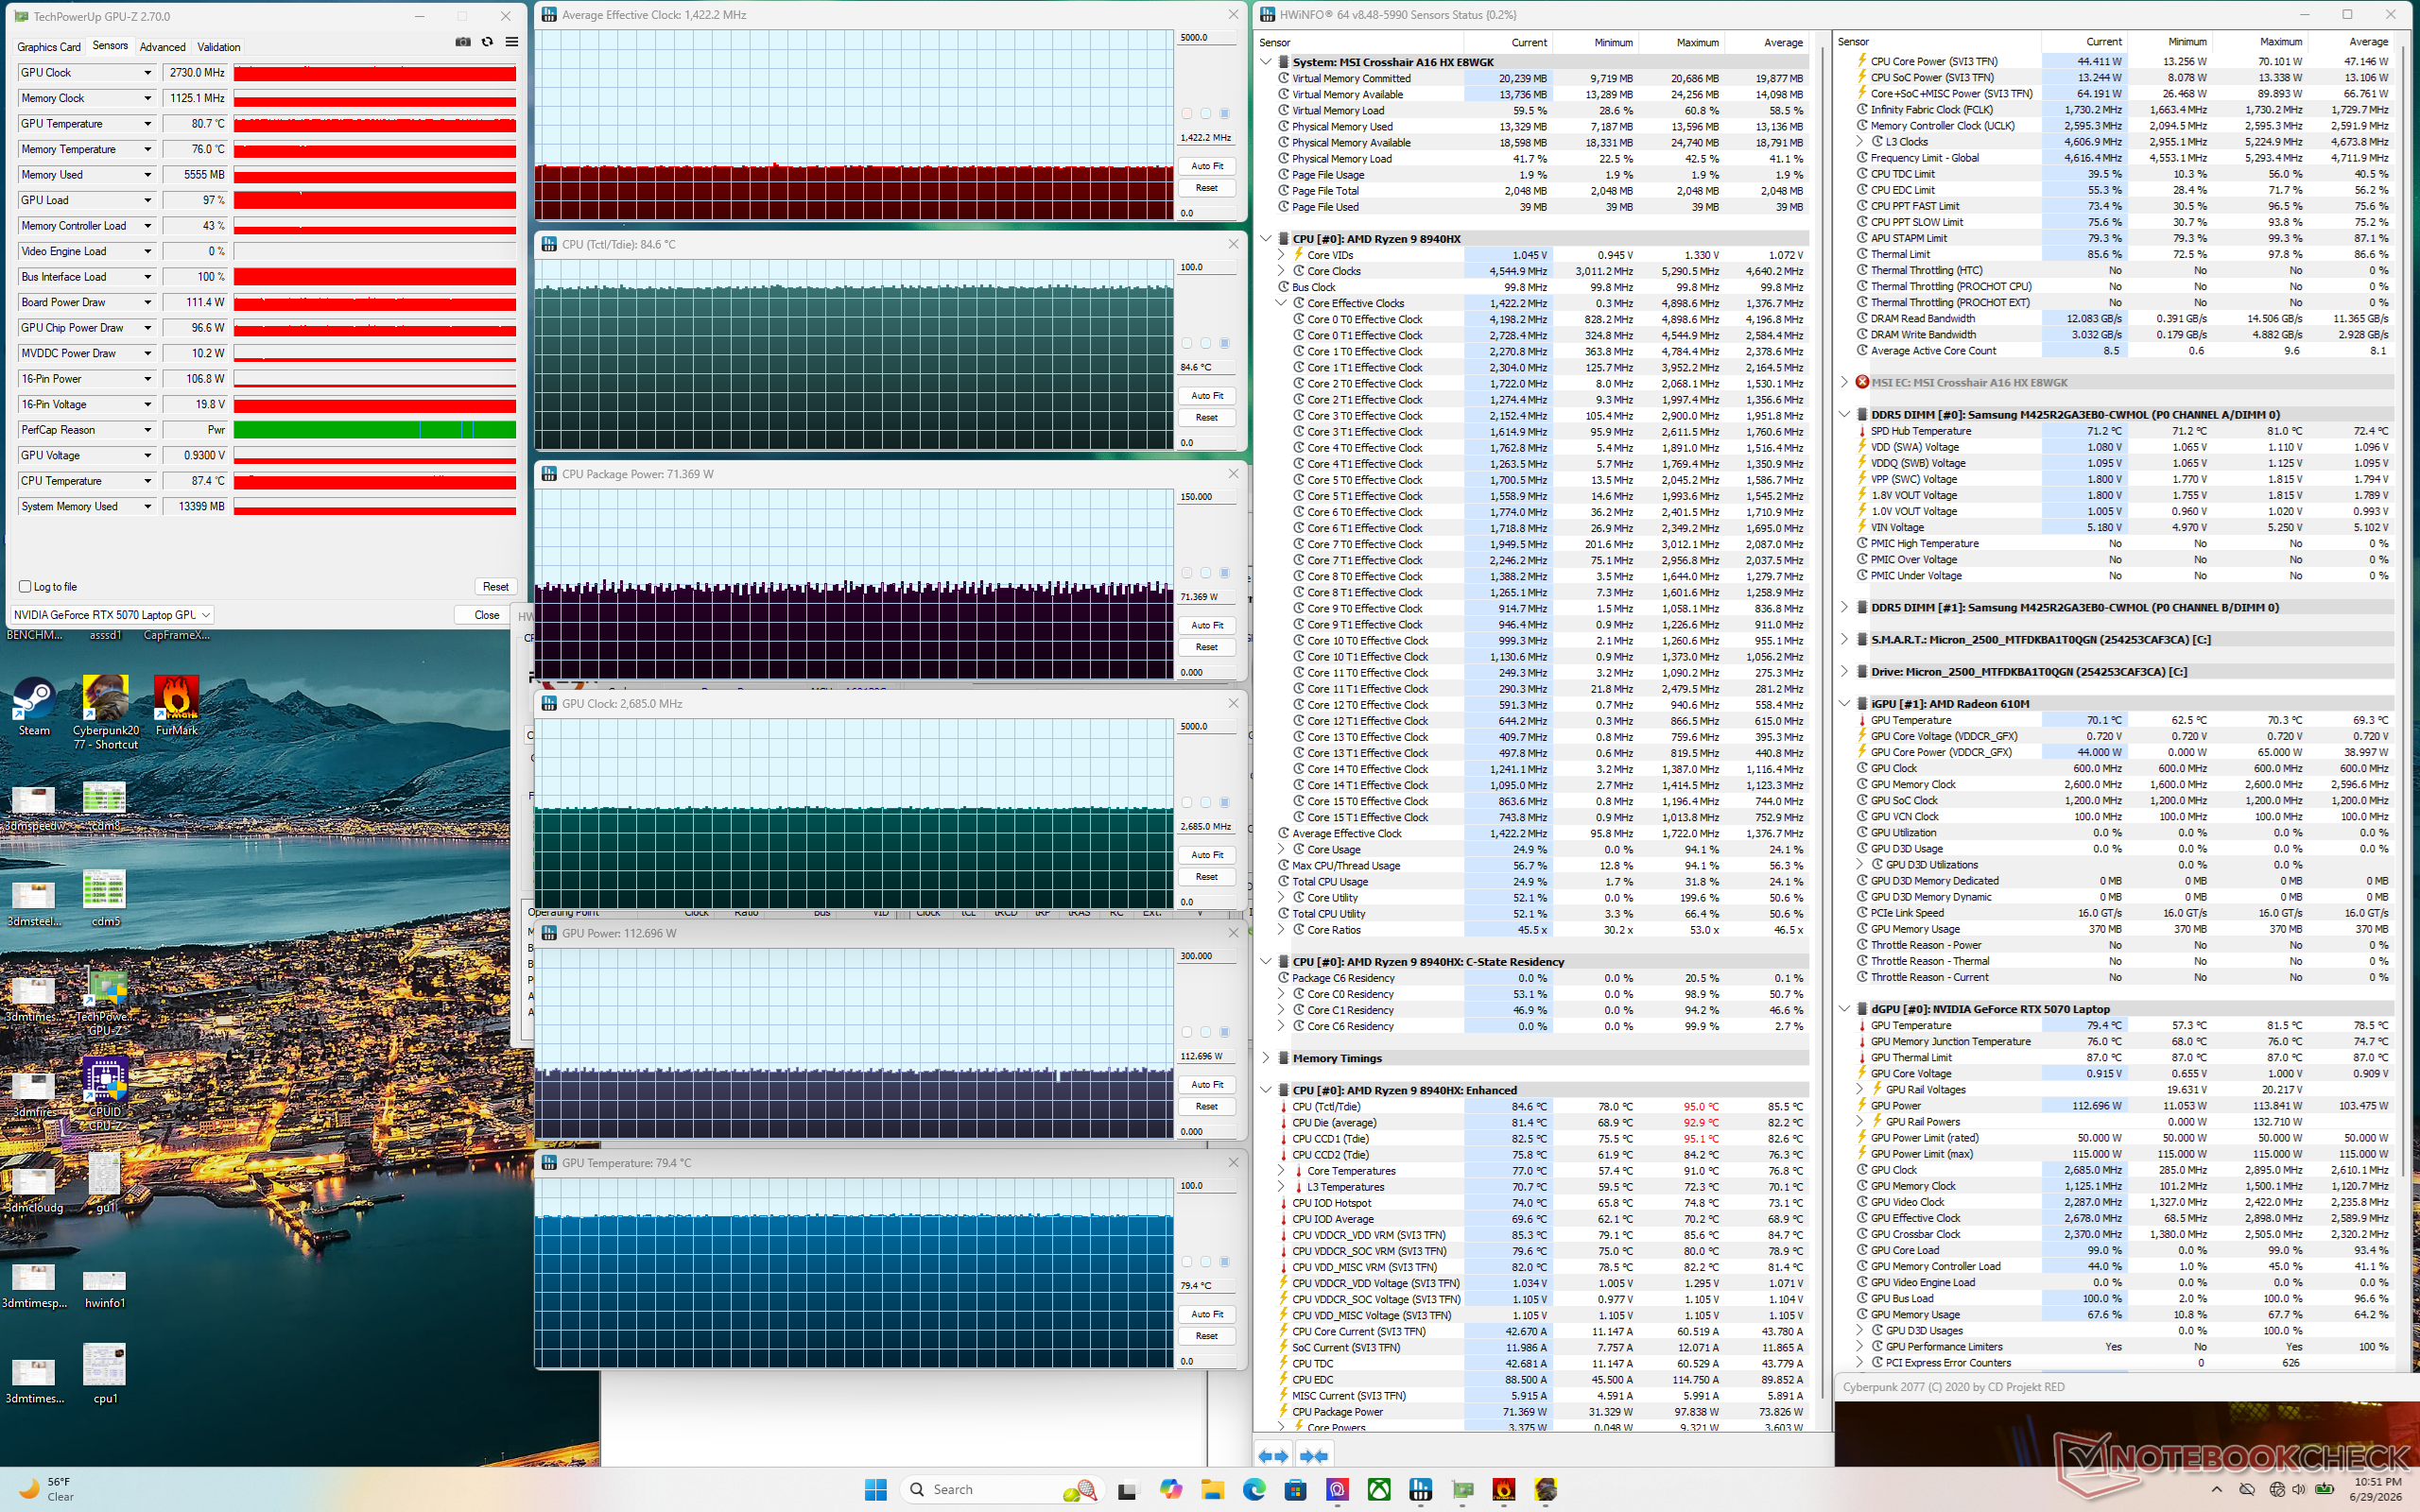

| Frequência média da CPU (GHz) | Frequência da GPU (MHz) | Temperatura média da CPU (°C) | Temperatura média da GPU (°C) | |
| Sistema em modo de espera | -- | -- | 56 | 44 |
| Teste de carga com Prime95 | 4,1 | -- | 82 | 55 |
| Teste de carga com Prime95 + FurMark | 4,4 | ~2047 | 96 | 79 |
| Teste de carga com Cyberpunk 2077 (modo equilibrado) | 1,1 | 2467 | 73 | 78 |
| Cyberpunk 2077 – Teste de carga (Apex desativado, modo Desempenho) | 1,5 | 2512 | 84 | 81 |
| Cyberpunk 2077 – Teste de carga (Apex ativado, modo Desempenho) | 1,4 | 2685 | 85 | 79 |
| Cyberpunk 2077 – Teste de carga (Apex ativado, modo Cooler Boost) | 1,6 | 2.625 | 85 | 80 |
Palestrantes
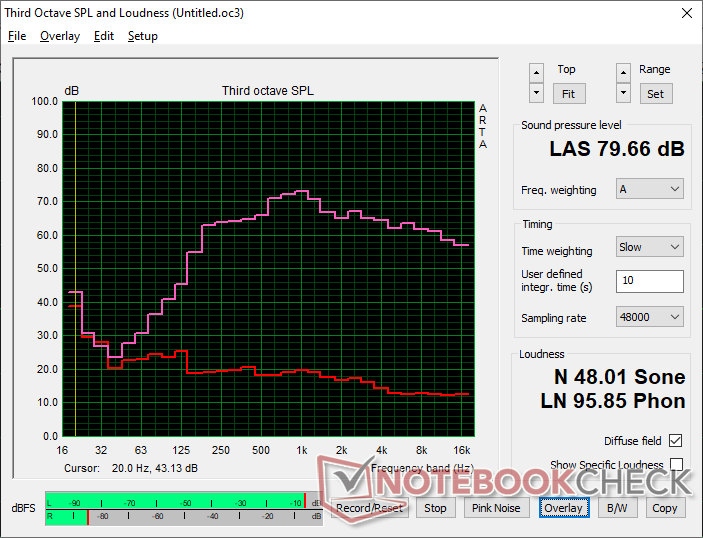
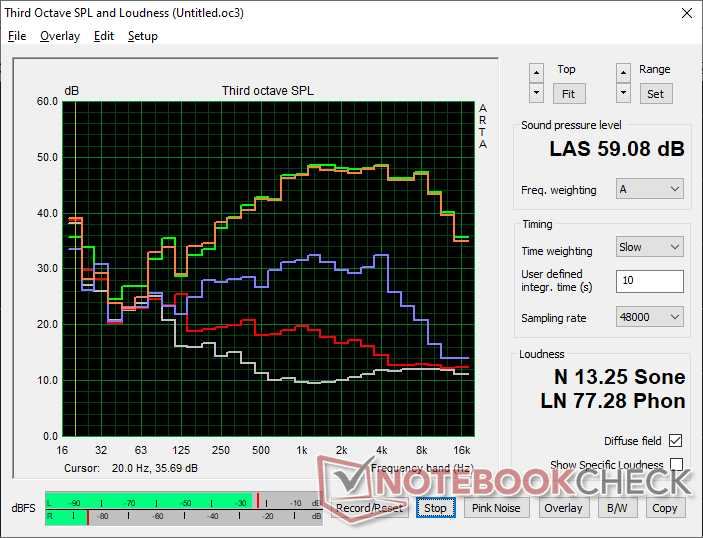
MSI Crosshair A16 HX E8WGK análise de áudio
(±) | o volume do alto-falante é médio, mas bom (###valor### dB)
Graves 100 - 315Hz
(±) | graves reduzidos - em média 8.8% menor que a mediana
(±) | a linearidade dos graves é média (10% delta para a frequência anterior)
Médios 400 - 2.000 Hz
(+) | médios equilibrados - apenas 4.5% longe da mediana
(+) | médios são lineares (4.6% delta para frequência anterior)
Altos 2 - 16 kHz
(+) | agudos equilibrados - apenas 1.7% longe da mediana
(+) | os máximos são lineares (3.6% delta da frequência anterior)
Geral 100 - 16.000 Hz
(+) | o som geral é linear (12.7% diferença em relação à mediana)
Comparado com a mesma classe
» 16% de todos os dispositivos testados nesta classe foram melhores, 4% semelhantes, 80% piores
» O melhor teve um delta de 6%, a média foi 18%, o pior foi 132%
Comparado com todos os dispositivos testados
» 12% de todos os dispositivos testados foram melhores, 3% semelhantes, 86% piores
» O melhor teve um delta de 4%, a média foi 24%, o pior foi 134%
Apple MacBook Pro 16 2021 M1 Pro análise de áudio
(+) | os alto-falantes podem tocar relativamente alto (###valor### dB)
Graves 100 - 315Hz
(+) | bons graves - apenas 3.8% longe da mediana
(+) | o baixo é linear (5.2% delta para a frequência anterior)
Médios 400 - 2.000 Hz
(+) | médios equilibrados - apenas 1.3% longe da mediana
(+) | médios são lineares (2.1% delta para frequência anterior)
Altos 2 - 16 kHz
(+) | agudos equilibrados - apenas 1.9% longe da mediana
(+) | os máximos são lineares (2.7% delta da frequência anterior)
Geral 100 - 16.000 Hz
(+) | o som geral é linear (4.6% diferença em relação à mediana)
Comparado com a mesma classe
» 0% de todos os dispositivos testados nesta classe foram melhores, 0% semelhantes, 100% piores
» O melhor teve um delta de 5%, a média foi 17%, o pior foi 45%
Comparado com todos os dispositivos testados
» 0% de todos os dispositivos testados foram melhores, 0% semelhantes, 100% piores
» O melhor teve um delta de 4%, a média foi 24%, o pior foi 134%
Gestão de Energia
Consumo de energia
| desligado | |
| Ocioso | |
| Carga |
|
Key:
min: | |
| MSI Crosshair A16 HX E8WGK R9 8940HX, GeForce RTX 5070 Laptop, Micron 2500 1TB MTFDKBA1T0QGN, IPS, 2560x1600, 16" | MSI Crosshair 16 HX AI D2XWGKG Ultra 9 275HX, GeForce RTX 5070 Laptop, Micron 2500 1TB MTFDKBA1T0QGN, IPS, 2560x1600, 16" | Alienware 16X Aurora Core Ultra 9 290HX Plus Ultra 9 290HX Plus, GeForce RTX 5070 Ti Laptop, , OLED, 2560x1600, 16" | Lenovo Legion 7 16 AGP11 Ryzen AI 9 HX 470, GeForce RTX 5060 Laptop, Lenovo UMIS AM541 1TB, OLED, 2560x1600, 16" | Gigabyte Gaming A16 Pro GA6DH (Core 7 240H, RTX 5070 Ti) Core 7 240H, GeForce RTX 5070 Ti Laptop, Samsung PM9C1b MZVL81T0HFLB-00BTW, IPS, 2560x1600, 16" | Acer Predator Helios Neo 16S AI PHN16S-71-94L9 Ultra 9 275HX, GeForce RTX 5070 Ti Laptop, Micron 3500 1TB MTFDKBA1T0TGD, OLED, 2560x1600, 16" | |
|---|---|---|---|---|---|---|
| Power Consumption | -25% | 22% | 42% | 3% | 37% | |
| Idle Minimum * (Watt) | 12.3 | 26.2 -113% | 6.9 44% | 5.7 54% | 21.5 -75% | 3.9 68% |
| Idle Average * (Watt) | 17.1 | 33.8 -98% | 8.1 53% | 8.7 49% | 28.3 -65% | 11 36% |
| Idle Maximum * (Watt) | 42.4 | 34 20% | 31 27% | 9.1 79% | 26.3 38% | 16.9 60% |
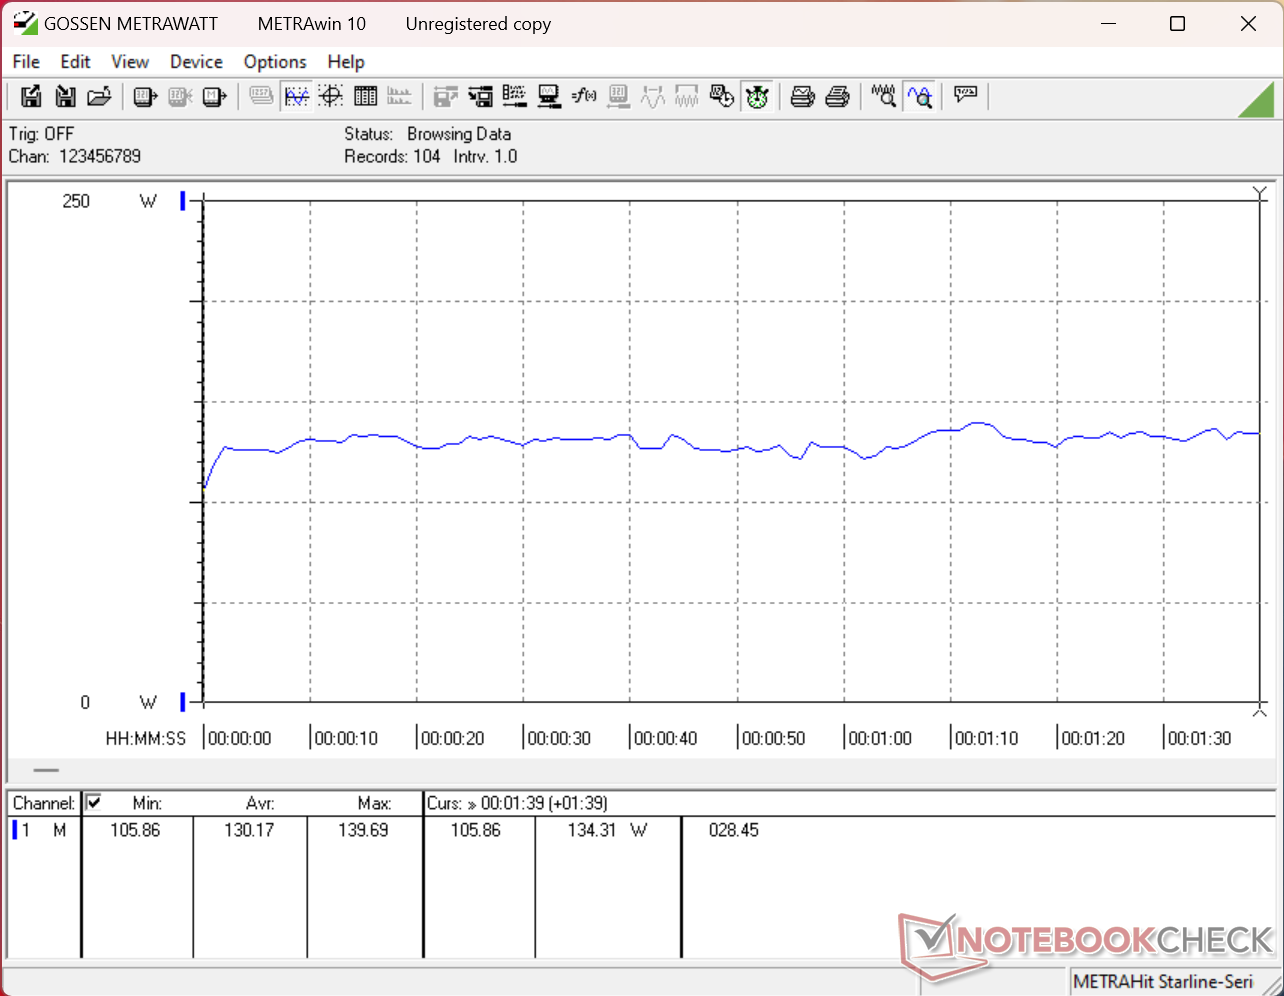
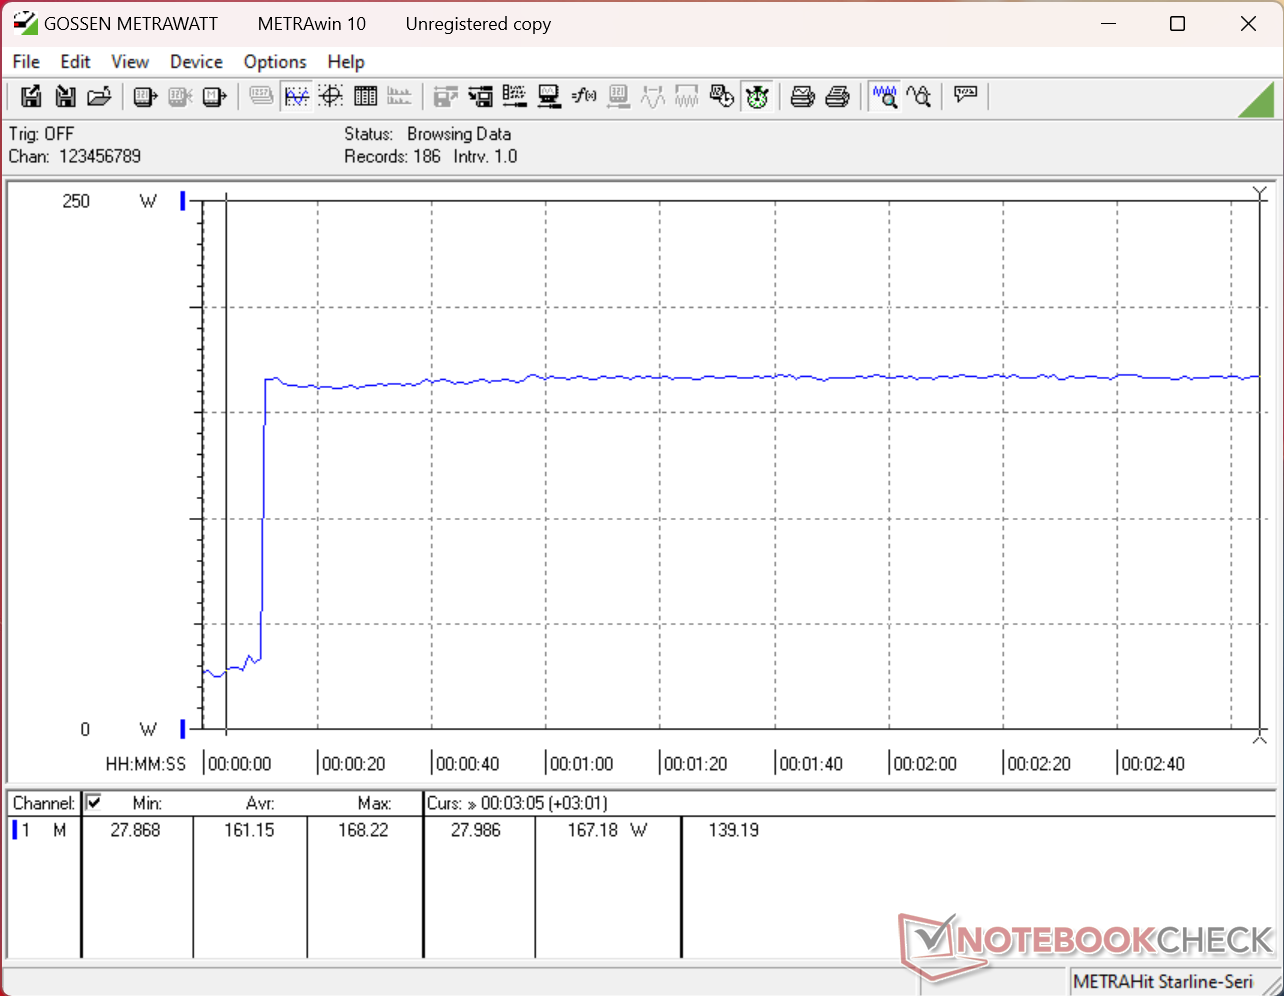
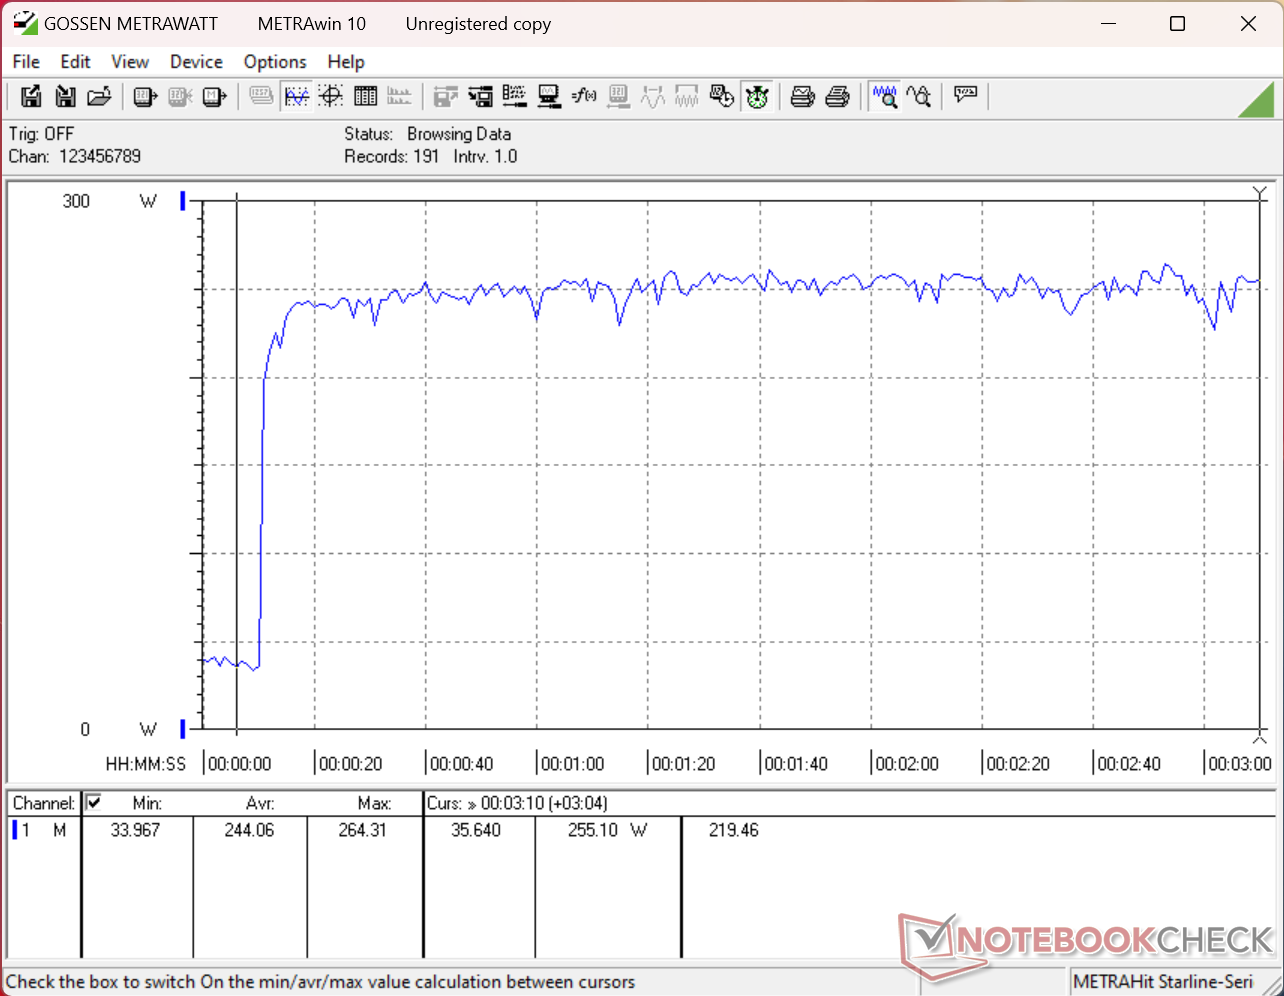
| Load Average * (Watt) | 130.2 | 112 14% | 131.6 -1% | 88.7 32% | 92.5 29% | 123 6% |
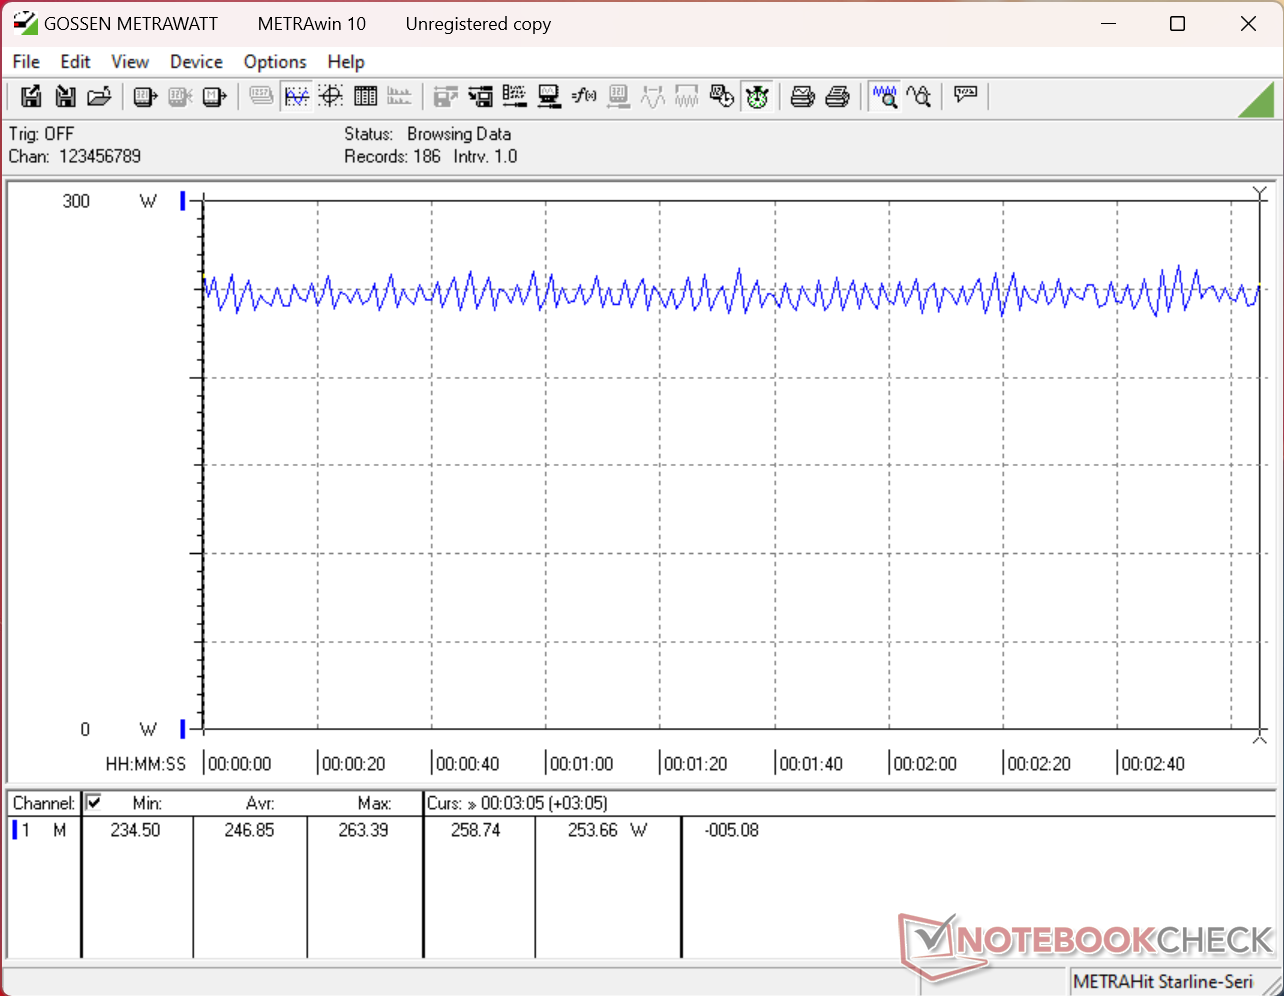
| Cyberpunk 2077 ultra * (Watt) | 246 | 224 9% | 198.3 19% | 160.3 35% | 165 33% | 152.7 38% |
| Cyberpunk 2077 ultra external monitor * (Watt) | 242 | 220 9% | 172.1 29% | 156.9 35% | 158 35% | 144.9 40% |
| Load Maximum * (Watt) | 264.3 | 315 -19% | 300.1 -14% | 234.9 11% | 195 26% | 229 13% |
* ... menor é melhor
Consumo de energia no modo Cyberpunk / Teste de carga
Consumo de energia do monitor externo
Duração da bateria
| MSI Crosshair A16 HX E8WGK R9 8940HX, GeForce RTX 5070 Laptop, 80 Wh | MSI Crosshair 16 HX AI D2XWGKG Ultra 9 275HX, GeForce RTX 5070 Laptop, 90 Wh | Alienware 16X Aurora Core Ultra 9 290HX Plus Ultra 9 290HX Plus, GeForce RTX 5070 Ti Laptop, 96 Wh | Lenovo Legion 7 16 AGP11 Ryzen AI 9 HX 470, GeForce RTX 5060 Laptop, 84 Wh | Gigabyte Gaming A16 Pro GA6DH (Core 7 240H, RTX 5070 Ti) Core 7 240H, GeForce RTX 5070 Ti Laptop, 76 Wh | Acer Predator Helios Neo 16S AI PHN16S-71-94L9 Ultra 9 275HX, GeForce RTX 5070 Ti Laptop, 76 Wh | |
|---|---|---|---|---|---|---|
| Duração da bateria | 102% | 35% | 67% | 51% | -9% | |
| WiFi v1.3 (h) | 5.5 | 11.1 102% | 7.4 35% | 9.2 67% | 8.3 51% | 5 -9% |
| H.264 (h) | 14.2 |
Avaliação do Notebookcheck
O Crosshair A16 é um dos notebooks para jogos mais acessíveis da MSI, que prioriza o desempenho e a qualidade da tela em detrimento de recursos auxiliares ou de luxo, a fim de reduzir custos.
MSI Crosshair A16 HX E8WGK
- 07/03/2026 v8
Allen Ngo
 Total Sustainability Score:
 Comparação entre possíveis concorrentes
Imagem | Modelo / Análises | Preço | Peso | Altura | Tela |
|---|---|---|---|---|---|
1. 82.5%  | MSI Crosshair A16 HX E8WGK AMD Ryzen 9 8940HX ⎘ NVIDIA GeForce RTX 5070 Laptop ⎘ 32 GB Memória, 1024 GB SSD | Amazon: $2,629.00 Preço de tabela: 2700 USD | 2.3 kg | 25.55 mm | 16.00" 2560x1600 189 PPI IPS |
2. 81.9%  | MSI Crosshair 16 HX AI D2XWGKG Intel Core Ultra 9 275HX ⎘ NVIDIA GeForce RTX 5070 Laptop ⎘ 16 GB Memória, 1024 GB SSD | Amazon: Preço de tabela: 2500 EUR | 2.5 kg | 27.9 mm | 16.00" 2560x1600 189 PPI IPS |
3. 85.9%  | Alienware 16X Aurora Core Ultra 9 290HX Plus Intel Core Ultra 9 290HX Plus ⎘ NVIDIA GeForce RTX 5070 Ti Laptop ⎘ 32 GB Memória | Amazon: Preço de tabela: 3000 USD | 2.6 kg | 23.4 mm | 16.00" 2560x1600 189 PPI OLED |
4. 86.4%  | Lenovo Legion 7 16 AGP11 AMD Ryzen AI 9 HX 470 ⎘ NVIDIA GeForce RTX 5060 Laptop ⎘ 32 GB Memória, 1024 GB SSD | Amazon: Preço de tabela: 2500€ | 1.8 kg | 16.9 mm | 16.00" 2560x1600 189 PPI OLED |
5. 81%  | Gigabyte Gaming A16 Pro GA6DH (Core 7 240H, RTX 5070 Ti) Intel Core 7 240H ⎘ NVIDIA GeForce RTX 5070 Ti Laptop ⎘ 32 GB Memória, 1000 GB SSD | Amazon: Preço de tabela: 2300 Euro | 2.4 kg | 22.99 mm | 16.00" 2560x1600 189 PPI IPS |
6. 82%  | Acer Predator Helios Neo 16S AI PHN16S-71-94L9 Intel Core Ultra 9 275HX ⎘ NVIDIA GeForce RTX 5070 Ti Laptop ⎘ 32 GB Memória, 1024 GB SSD | Amazon: Preço de tabela: 2400 EUR | 2.2 kg | 19.9 mm | 16.00" 2560x1600 189 PPI OLED |
Transparência
A seleção dos dispositivos a serem analisados é feita pela nossa equipe editorial. A amostra de teste foi fornecida ao autor como empréstimo pelo fabricante ou varejista para fins desta revisão. O credor não teve influência nesta revisão, nem o fabricante recebeu uma cópia desta revisão antes da publicação. Não houve obrigação de publicar esta revisão. Como empresa de mídia independente, a Notebookcheck não está sujeita à autoridade de fabricantes, varejistas ou editores.
É assim que o Notebookcheck está testando
Todos os anos, o Notebookcheck analisa de forma independente centenas de laptops e smartphones usando procedimentos padronizados para garantir que todos os resultados sejam comparáveis. Desenvolvemos continuamente nossos métodos de teste há cerca de 20 anos e definimos padrões da indústria no processo. Em nossos laboratórios de teste, equipamentos de medição de alta qualidade são utilizados por técnicos e editores experientes. Esses testes envolvem um processo de validação em vários estágios. Nosso complexo sistema de classificação é baseado em centenas de medições e benchmarks bem fundamentados, o que mantém a objetividade.
