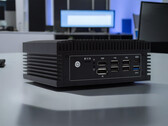
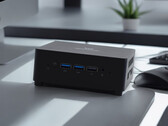
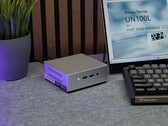
O N100 médio em nosso banco de dados oferece pontuações de benchmark multi-thread inexpressivas que são mais semelhantes às do Core i3-1115G4 . O chip é rápido o suficiente para muitas tarefas cotidianas, mas não muito mais do que isso; outra coisa a ter em mente é que, dos dois sistemas com o N100 testados por nós em outubro de 2023, ambos têm limites de potência de CPU bastante altos. O chip ficará visivelmente mais lento se for limitado a apenas seis ou sete Watts.
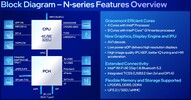
Os chips Alder Lake-N suportam apenas memória de canal único com até DDR5-4800, DDR4-3200 ou LPDDR5-4800. O chip também suporta Quick Sync e decodificação AV1 (provavelmente o mesmo mecanismo do Alder Lake). Além disso, o Wi-Fi 6E e o Bluetooth 5.2 estão parcialmente integrados (mas não há Thunderbolt). Os chips externos podem ser conectados via PCIe Gen3 x9 (via PCH).
O adaptador gráfico integrado é baseado na arquitetura Xe e oferece apenas 24 das 32 EUs (Unidades de Execução) operando a apenas 450 - 750 MHz. Devido à memória de canal único, às baixas velocidades de clock e à baixa contagem de shaders, o desempenho da iGPU em jogos é muito limitado.
O N100 tem um consumo de energia básico de apenas 6 W e, portanto, é adequado para resfriamento sem ventilador. A CPU é construída com um processo SuperFin de 10nm aprimorado da Intel (chamado Intel 7).
Codinome Alder Lake-N Série Intel Alder Lake-N Serie: Alder Lake-N Alder Lake-N Frequência 1000 - 3400 MHz Cache de Nível 3 6 MB Número de Núcelos / Subprocessos 4 / 4 4 x 3.4 GHz Intel Crestmont E-Core Consumo de Energia (TDP = Thermal Design Power) 6 Watt Tecnologia de Produção 10 nm Tempratura Máx. 105 °C Conector BGA1264 Características DDR4-3200/DDR5-4800/LPDDR5-4800 RAM (sin. chan.), PCIe 3, GNA, MMX, SSE, SSE2, SSE3, SSSE3, SSE4.1, SSE4.2, AVX, AVX2, BMI2, ABM, FMA, ADX, VMX, SMEP, SMAP, EIST, TM1, TM2, Turbo, SST, AES-NI, RDRAND, RDSEED, SHA GPU Intel UHD Graphics 24EUs (Alder Lake-N) ( - 750 MHz)64 Bit Suporte para 64 Bit Architecture x86 Preço Inicial $128 U.S. Data do Anúncio 01/03/2023 Link do Produto (externo) ark.intel.com
Performance Rating - CB R15 + R20 + 7-Zip + X265 + Blender + 3DM11 CPU
...
AMD Ryzen Embedded V1605B
Intel Core i3-8109U
Intel Core i5-6287U
Intel Core i7-6567U
...
max:
Cinebench 2024 - Cinebench 2024 CPU Single Core
min: 60 avg: 60.5 median: 60.5 (34%) max: 61 Points
CPU TDP 15 W TDP 20 W 98% 100%
Qualcomm Snapdragon 7c+ Gen 3
...
Cinebench 2024 - Cinebench 2024 CPU Multi Core
min: 194 avg: 195 median: 195 (4%) max: 196 Points
CPU TDP 15 W TDP 20 W 100% 99%
Qualcomm Snapdragon 7c+ Gen 3
...
max:
Cinebench R23 - Cinebench R23 Multi Core
min: 1577 avg: 2449 median: 2559.5 (2%) max: 2983 Points
CPU TDP ? TDP 7 W TDP 9 W TDP 10 W TDP 13 W TDP 15 W TDP 20 W 53% 68% 74% 65% 99% 100% 99%
...
AMD Ryzen Embedded R1606G
Intel Core i3-1110G4
Intel Core i3-8109U
Intel Core i5-1140G7
Intel Core i7-2860QM
Intel Core i5-1130G7
...
max:
Cinebench R23 - Cinebench R23 Single Core
min: 747 avg: 885 median: 910.5 (39%) max: 942 Points
CPU TDP ? TDP 7 W TDP 9 W TDP 10 W TDP 13 W TDP 15 W TDP 20 W 80% 93% 97% 90% 98% 99% 100%
...
AMD Ryzen Embedded V1605B
Intel Core i3-1110G4
AMD Ryzen Embedded R1606G
Intel Core i3-8109U
Intel Core i5-8259U
...
max:
Intel Core Ultra 9 285K
Cinebench R20 - Cinebench R20 CPU (Single Core)
min: 285 avg: 338 median: 347 (38%) max: 358 Points
CPU TDP ? TDP 7 W TDP 9 W TDP 10 W TDP 13 W TDP 15 W TDP 20 W 80% 93% 97% 91% 97% 99% 100%
...
Intel Core i7-5557U
AMD Ryzen Embedded V1605B
Intel Core i3-8130U
AMD Ryzen Embedded R1606G
Intel Core i3-8109U
...
max:
Cinebench R20 - Cinebench R20 CPU (Multi Core)
min: 590 avg: 934 median: 978.5 (2%) max: 1139 Points
CPU TDP ? TDP 7 W TDP 9 W TDP 10 W TDP 13 W TDP 15 W TDP 20 W 52% 68% 74% 66% 99% 100% 99%
...
Intel Core i7-10510Y
Intel Core i5-6287U
Intel Core i7-6567U
Intel Core i5-1130G7
Intel Core i7-2860QM
Intel Core i5-1140G7
...
max:
Cinebench R15 - Cinebench R15 CPU Multi 64 Bit
min: 246 avg: 384.6 median: 401.5 (3%) max: 479 Points
CPU TDP ? TDP 7 W TDP 9 W TDP 10 W TDP 13 W TDP 15 W TDP 20 W 51% 62% 70% 62% 100% 100% 99%
...
Intel Core i3-8109U
Intel Core i7-5557U
Intel Core i5-7360U
Intel Core i7-6567U
Intel Core i5-7260U
Intel Core i3-1110G4
Intel Core i5-7267U
Intel Core i7-7660U
AMD Ryzen 3 2300U
Intel Core i7-7567U
...
max:
0 25 50 75 100 125 150 175 200 225 250 275 300 325 350 375 400 425 450 475 Tooltip Asus BR1104CGA-N00007XA: Ø237 (229.37-246.24)
Minisforum Venus Series UN100L: Ø219 (212.73-224.56)
Newsmay AC8F-POE: Ø295 (290.65-304.47)
Minisforum Venus Series UN100D: Ø330 (323.31-347.87)
Beelink Mini S12 Pro: Ø461 (458.73-467.21)
Trigkey G4: Ø465 (453-467.97)
Chuwi Hi10 Max: Ø476 (470.09-477.92)
Geekom MiniAir 12: Ø472 (462.09-474.18)
Cinebench R15 - Cinebench R15 CPU Single 64 Bit
min: 118.8 avg: 143.8 median: 147.9 (42%) max: 155 Points
CPU TDP ? TDP 7 W TDP 9 W TDP 10 W TDP 13 W TDP 15 W TDP 20 W 77% 89% 95% 89% 97% 98% 100%
...
Intel Core i5-7360U
Intel Core i5-6440HQ
Intel Core i5-6287U
Intel Core i7-6567U
Intel Core i5-8350U
Intel Core i5-8259U
Intel Core i3-8145U
...
max:
Intel Core Ultra 9 285K
Cinebench R11.5 - Cinebench R11.5 CPU Multi 64 Bit
min: 3.84 avg: 4.6 median: 4.2 (5%) max: 5.99 Points
CPU TDP 7 W TDP 9 W TDP 10 W TDP 15 W TDP 20 W 65% 71% 64% 86% 100%
...
Intel Core i3-8145U
Intel Core i5-7267U
Intel Core i3-1110G4
AMD Ryzen 3 2300U
Intel Core i7-7660U
...
max:
Cinebench R11.5 - Cinebench R11.5 CPU Single 64 Bit
min: 1.55 avg: 1.7 median: 1.8 (42%) max: 1.87 Points
CPU TDP 7 W TDP 9 W TDP 10 W TDP 15 W TDP 20 W 83% 94% 89% 98% 100%
...
Intel Core i5-8259U
Intel Core i5-8350U
Intel Core i5-7360U
Intel Xeon E3-1505M v5
Intel Core i7-7700HQ
Intel Core i3-8145U
Intel Core i5-8305G
Intel Core i5-8265U
...
max:
Intel Core Ultra 9 285K
Cinebench R10 - Cinebench R10 Rend. Single (32bit)
min: 4604 avg: 4896 median: 4869 (29%) max: 5179 pontos
CPU TDP 7 W TDP 9 W TDP 10 W TDP 15 W TDP 20 W 89% 98% 92% 100% 94%
...
Intel Core i5-5257U
Intel Core i5-6360U
Intel Core i3-7100H
Intel Core i7-5600U
Intel Core i5-7200U
Intel Core i7-5650U
...
max:
Cinebench R10 - Cinebench R10 Rend. Multi (32bit)
min: 9608 avg: 12281 median: 11207 (8%) max: 15336 pontos
CPU TDP 7 W TDP 9 W TDP 10 W TDP 15 W TDP 20 W 63% 73% 66% 99% 100%
...
Intel Core i5-7267U
Intel Core i7-6600U
Intel Core i3-8130U
Intel Core i5-7360U
Intel Core i5-7300U
Intel Core i7-6567U
Intel Core i3-8145U
Intel Core i3-1110G4
...
max:
Cinebench R10 - Cinebench R10 Rend. Multi (64bit)
min: 14514 avg: 18829 median: 16948 (11%) max: 24225 Points
CPU TDP 7 W TDP 9 W TDP 10 W TDP 15 W TDP 20 W 60% 70% 60% 99% 100%
...
AMD Ryzen 3 2300U
Intel Core i7-2860QM
Intel Core i5-1035G7
AMD Ryzen 5 PRO 2500U
...
max:
Intel Core Ultra 9 285K
Cinebench R10 - Cinebench R10 Rend. Single (64bit)
min: 7171 avg: 7699 median: 7750 (9%) max: 8227 Points
CPU TDP 7 W TDP 9 W TDP 10 W TDP 15 W TDP 20 W 87% 94% 88% 98% 100%
...
Intel Core i5-8259U
Intel Xeon E3-1535M v5
Intel Core i7-7700HQ
Intel Core i7-6600U
Intel Core i5-8350U
Intel Core i5-8265U
Intel Core i5-1035G7
Intel Xeon E3-1535M v6
...
max:
Intel Core Ultra 9 285K
wPrime 2.10 - wPrime 2.0 1024m *
min: 481.652 avg: 569 median: 588.3 (7%) max: 645.884 s
CPU TDP 7 W TDP 9 W TDP 10 W TDP 15 W TDP 20 W 100% 101% 100% 102% 102%
...
Intel Core i5-6260U
AMD Phenom II X4 N950
Intel Core i3-7130U
Intel Core i5-1230U
Intel Core i5-5300U
AMD PRO A8-9600B
AMD Pro A8-8600B
...
VIA C3-M C3-M-1200
wPrime 2.10 - wPrime 2.0 32m *
min: 15.795 avg: 16.5 median: 16.2 (3%) max: 17.7 s
CPU TDP 7 W TDP 9 W TDP 10 W TDP 15 W TDP 20 W 100% 100% 100% 100% 100%
...
Intel Core i3-7100H
Intel Core i5-7Y54
AMD PRO A8-9600B
...
WinRAR - WinRAR 4.0
min: 2187 avg: 2343 median: 2372 (4%) max: 2501 pontos
CPU TDP 7 W TDP 9 W TDP 10 W TDP 15 W TDP 20 W 87% 100% 89% 95% 97%
...
Intel Core i3-7130U
Intel Core m5-6Y57
Intel Core i5-7200U
Intel Core i5-4210U
Intel Core i3-4030U
Intel Core i5-5300U
...
max:
7-Zip 18.03 - 7-Zip 18.03 Multi Thread 4 runs
min: 7532 avg: 11072 median: 11663.5 (7%) max: 13291 MIPS
CPU TDP ? TDP 7 W TDP 9 W TDP 10 W TDP 13 W TDP 15 W TDP 20 W 57% 70% 78% 66% 98% 99% 100%
...
Intel Core i7-6567U
Intel Core i5-6287U
Qualcomm Snapdragon 7c+ Gen 3
Intel Core i5-1035G4
Intel Core i5-1130G7
...
max:
7-Zip 18.03 - 7-Zip 18.03 Single Thread 4 runs
min: 3046 avg: 3629 median: 3653.5 (43%) max: 3958 MIPS
CPU TDP ? TDP 7 W TDP 9 W TDP 10 W TDP 13 W TDP 15 W TDP 20 W 77% 88% 96% 91% 93% 92% 100%
...
AMD Ryzen Embedded R1606G
Intel Core i5-1035G4
Intel Core i7-6567U
Intel Core i5-6287U
Intel Core i3-8109U
Intel Core i7-2860QM
...
max:
AMD Ryzen 7 9800X3D
X264 HD Benchmark 4.0 - x264 Pass 2
min: 20.85 avg: 27.1 median: 24.1 (8%) max: 34.7 fps
CPU TDP 7 W TDP 9 W TDP 10 W TDP 15 W TDP 20 W 63% 69% 60% 100% 98%
...
Intel Core i7-6567U
Intel Core i7-7660U
Intel Core i5-1130G7
...
max:
Intel Core Ultra 9 285K
X264 HD Benchmark 4.0 - x264 Pass 1
min: 101.8 avg: 134.8 median: 121.2 (28%) max: 173 fps
CPU TDP 7 W TDP 9 W TDP 10 W TDP 15 W TDP 20 W 61% 70% 59% 100% 100%
...
Intel Core i5-7300U
Intel Core i7-6567U
Intel Core i7-2860QM
Intel Core i7-7660U
...
max:
Intel Core Ultra 9 285K
HWBOT x265 Benchmark v2.2 - HWBOT x265 4k Preset
min: 1.72 avg: 2.8 median: 3 (5%) max: 3.49 fps
CPU TDP ? TDP 7 W TDP 9 W TDP 10 W TDP 13 W TDP 15 W TDP 20 W 50% 57% 72% 61% 99% 100% 99%
...
Intel Core i3-1110G4
Intel Core i7-6560U
Intel Core i3-8145U
Intel Core i7-5557U
Intel Core i7-2860QM
Intel Core i3-8109U
AMD Ryzen 5 PRO 2500U
Intel Core i5-1130G7
Intel Core i5-6287U
...
max:
0 1 2 3 4 5 6 Tooltip Asus BR1104CGA-N00007XA: Ø1.905 (0.2-4.62)
Minisforum Venus Series UN100L: Ø2.15 (0.22-4.88)
Newsmay AC8F-POE: Ø2.31 (0.31-5.43)
Minisforum Venus Series UN100D: Ø2.73 (0.33-5.87)
Beelink Mini S12 Pro: Ø3.62 (0.62-6.59)
Chuwi Hi10 Max: Ø3.5 (0.22-5.42)
Geekom MiniAir 12: Ø3.61 (0.38-6.13)
Trigkey G4: Ø3.68 (0.58-6.57)
TrueCrypt - TrueCrypt Serpent
min: 0.257 avg: 0.3 median: 0.3 (8%) max: 0.263 GB/s
CPU TDP 7 W TDP 9 W TDP 10 W TDP 15 W TDP 20 W 98% 100% 98% 99% 100%
...
Intel Core i5-6440HQ
...
max:
TrueCrypt - TrueCrypt Twofish
min: 0.529 avg: 0.5 median: 0.5 (9%) max: 0.538 GB/s
CPU TDP 7 W TDP 9 W TDP 10 W TDP 15 W TDP 20 W 99% 100% 98% 99% 100%
...
Intel Core i7-4712HQ
Intel Core i7-2860QM
Intel Core i5-1140G7
...
max:
TrueCrypt - TrueCrypt AES
min: 2.8 avg: 2.9 median: 2.9 (8%) max: 2.9 GB/s
CPU TDP 7 W TDP 9 W TDP 10 W TDP 15 W TDP 20 W 97% 100% 100% 100% 100%
...
Intel Core i7-2860QM
Intel Core i5-1140G7
...
max:
Blender - Blender 3.3 Classroom CPU *
min: 1992 avg: 2545 median: 2067 (26%) max: 3964 Seconds
CPU TDP ? TDP 9 W TDP 10 W TDP 13 W TDP 15 W TDP 20 W 100% 133% 124% 149% 150% 150%
...
Intel Core i7-6567U
Intel Core i3-6157U
Intel Core i5-5250U
Intel Core i3-5010U
...
Blender - Blender 2.79 BMW27 CPU *
min: 1017 avg: 1322 median: 1198.5 (8%) max: 1956 Seconds
CPU TDP ? TDP 7 W TDP 9 W TDP 10 W TDP 13 W TDP 15 W TDP 20 W 100% 103% 105% 104% 107% 107% 108%
Intel Core i5-1038NG7
...
Intel Core i5-1130G7
Intel Core i7-6567U
Intel Core i5-6287U
Intel Core i7-7660U
Intel Core i3-8109U
AMD Ryzen Embedded R1606G
Intel Core i7-6560U
Intel Core i3-1110G4
...
R Benchmark 2.5 - R Benchmark 2.5 *
min: 0.822 avg: 0.9 median: 0.9 (19%) max: 1.06 sec
CPU TDP ? TDP 7 W TDP 9 W TDP 10 W TDP 13 W TDP 15 W TDP 20 W 100% 101% 105% 102% 106% 106% 107%
...
Intel Core i5-1035G7
Intel Core i7-5557U
Intel Core i3-8109U
Intel Core i7-2860QM
...
3DMark 06 - CPU - 3DMark 06 - CPU
min: 4091 avg: 5232 median: 4838 (10%) max: 6441 Points
CPU TDP 7 W TDP 9 W TDP 10 W TDP 15 W TDP 20 W 64% 75% 68% 100% 100%
VIA C7-M C7-M-1200
...
Intel Core i3-1110G4
Intel Core i3-8145U
AMD Ryzen 5 PRO 2500U
Intel Core i7-7660U
Intel Core i5-1130G7
...
max:
Super Pi mod 1.5 XS 1M - Super Pi mod 1.5 XS 1M *
min: 19.264 avg: 19.4 median: 19.4 (4%) max: 19.531 s
CPU TDP 7 W TDP 9 W TDP 10 W TDP 15 W TDP 20 W 100% 100% 100% 100% 100%
...
Intel Core i3-5005U
Intel Core i3-350M
AMD PRO A8-9600B
AMD A12-9720P
Intel Core i3-5015U
Intel Core i3-4030U
Intel Core 2 Quad Q9100
...
VIA C3-M C3-M-1200
Super Pi mod 1.5 XS 2M - Super Pi mod 1.5 XS 2M *
min: 40.302 avg: 40.5 median: 40.4 (2%) max: 40.679 s
CPU TDP 7 W TDP 9 W TDP 10 W TDP 15 W TDP 20 W 100% 100% 100% 100% 100%
...
AMD A10-9620P
AMD PRO A12-9800B
AMD A10-9600P
...
Super Pi Mod 1.5 XS 32M - Super Pi mod 1.5 XS 32M *
min: 816.966 avg: 836 median: 818.8 (4%) max: 863.891 s
CPU TDP 7 W TDP 9 W TDP 10 W TDP 15 W TDP 20 W 100% 100% 100% 100% 100%
...
Intel Core m5-6Y54
Intel Core i3-6100U
Intel Celeron 2970M
...
VIA C3-M C3-M-1200
3DMark Vantage - 3DM Vant. Perf. CPU no Physx
min: 9434 avg: 12661 median: 11998 (9%) max: 15625 Points
CPU TDP 7 W TDP 9 W TDP 10 W TDP 15 W TDP 20 W 60% 77% 69% 100% 99%
...
Intel Core i5-4200H
Intel Core i5-6360U
Intel Core i5-4310M
AMD Ryzen 3 2300U
Intel Core i5-6267U
Intel Core i7-6600U
...
max:
Intel Core Ultra 9 285K
3DMark 11 - 3DM11 Performance Physics
min: 3723 avg: 5317 median: 5940 (15%) max: 6486 Points
CPU TDP ? TDP 7 W TDP 9 W TDP 10 W TDP 13 W TDP 15 W TDP 20 W 92% 60% 69% 59% 97% 96% 100%
AMD E-240
...
Intel Core i3-8109U
Intel Core i5-6287U
Intel Core i5-7360U
Intel Core i7-7660U
AMD Ryzen 3 2300U
Intel Core i7-6567U
AMD Ryzen 3 PRO 3300U
Intel Core i5-1130G7
...
max:
AMD Ryzen 7 9800X3D
3DMark - 3DMark Ice Storm Physics
min: 34828 avg: 42619 median: 41217 (33%) max: 51063 Points
CPU TDP 7 W TDP 9 W TDP 10 W TDP 15 W TDP 20 W 68% 81% 71% 97% 100%
...
Intel Core i7-8650U
Intel Core i5-8350U
Intel Core i5-7300U
...
max:
3DMark - 3DMark Ice Storm Extreme Physics
min: 34083 avg: 42751 median: 41809 (34%) max: 51420 Points
CPU TDP 7 W TDP 9 W TDP 10 W TDP 15 W TDP 20 W 66% 81% 72% 96% 100%
...
Intel Core i5-7300U
Intel Xeon E3-1505M v6
Intel Core i5-8350U
Intel Core i7-8650U
Intel Xeon E-2176M
Intel Xeon E3-1535M v5
...
max:
3DMark - 3DMark Ice Storm Unlimited Physics
min: 50867 avg: 52331 median: 52418.5 (43%) max: 53373 Points
CPU TDP 7 W TDP 9 W TDP 10 W TDP 13 W TDP 15 W TDP 20 W 95% 99% 98% 98% 98% 100%
...
Intel Core i5-6440HQ
Intel Core i7-7820HQ
Intel Core i5-8305G
Intel Core i7-7700HQ
Intel Core i7-7560U
Intel Core i5-7360U
Intel Core i5-1035G4
Intel Core i7-8650U
Intel Core i5-1035G1
Intel Core i5-8350U
Intel Core i7-8705G
...
max:
Intel Core Ultra 5 245K
3DMark - 3DMark Cloud Gate Physics
min: 3133 avg: 3959 median: 4061.5 (10%) max: 4693 Points
CPU TDP ? TDP 7 W TDP 9 W TDP 10 W TDP 13 W TDP 15 W TDP 20 W 67% 68% 76% 70% 97% 97% 100%
...
Intel Core i5-6287U
Intel Core i3-8130U
Intel Core i3-8145U
Intel Core i7-7660U
Intel Core i7-5557U
Intel Core i5-7360U
Intel Core i7-6567U
...
max:
Intel Core Ultra 9 285K
3DMark - 3DMark Fire Strike Standard Physics
min: 4589 avg: 5806 median: 6371 (11%) max: 6602 Points
CPU TDP 7 W TDP 9 W TDP 10 W TDP 13 W TDP 15 W TDP 20 W 70% 80% 73% 97% 99% 100%
...
Intel Core i7-7660U
Intel Core i7-7560U
Intel Core i3-8145U
Intel Core i7-6567U
Intel Core i5-7360U
Intel Core i5-10210Y
AMD Ryzen 3 2300U
AMD Ryzen 3 PRO 3300U
Intel Core i5-6440HQ
...
max:
Intel Core Ultra 9 285K
3DMark - 3DMark Time Spy CPU
min: 1407 avg: 1999 median: 2054 (9%) max: 2519 Points
CPU TDP ? TDP 7 W TDP 9 W TDP 10 W TDP 13 W TDP 15 W TDP 20 W 58% 56% 64% 59% 100% 99% 100%
AMD PRO A12-9800B
...
AMD Ryzen 3 2300U
Intel Core i7-7560U
Intel Core i5-7360U
Intel Core i5-6267U
Intel Core i5-6287U
Intel Core i7-7660U
Intel Core i3-7100H
Intel Core i5-7267U
Intel Core i7-6567U
Intel Core i3-1110G4
Intel Core i3-8109U
Intel Core i7-10510Y
AMD Ryzen 5 PRO 2500U
...
max:
Geekbench 6.3 - Geekbench 6.3 Single-Core
min: 1070 avg: 1195 median: 1221.5 (31%) max: 1245 pontos
CPU TDP ? TDP 7 W TDP 9 W TDP 10 W TDP 13 W TDP 15 W TDP 20 W 91% 86% 99% 98% 98% 99% 100%
Intel Pentium Gold 4425Y
...
Qualcomm Snapdragon 7c+ Gen 3
Intel Core i5-8400H
...
Geekbench 6.3 - Geekbench 6.3 Multi-Core
min: 2283 avg: 2937 median: 3157 (12%) max: 3282 pontos
CPU TDP ? TDP 7 W TDP 9 W TDP 10 W TDP 13 W TDP 15 W TDP 20 W 70% 72% 95% 85% 99% 100% 98%
...
Intel Pentium Gold 4425Y
Zhaoxin KaiXian KX-6000G
Qualcomm Snapdragon 7c+ Gen 3
Intel Core i5-8400H
...
Geekbench 5.5 - Geekbench 5.1 - 5.5 64 Bit Single-Core
min: 915 avg: 981 median: 986 (39%) max: 1018 pontos
CPU TDP ? TDP 7 W TDP 9 W TDP 10 W TDP 13 W TDP 15 W TDP 20 W 94% 93% 98% 96% 97% 98% 100%
...
Intel Core i5-7260U
Intel Xeon E3-1575M v5
Intel Core i5-8259U
Intel Core i7-6567U
Intel Core i3-10110Y
Intel Core i7-7700HQ
Intel Core i7-10510Y
Intel Core i5-8265U
...
Geekbench 5.5 - Geekbench 5.1 - 5.5 64 Bit Multi-Core
min: 1911 avg: 2598 median: 2829 (5%) max: 2896 pontos
CPU TDP ? TDP 7 W TDP 9 W TDP 10 W TDP 13 W TDP 15 W TDP 20 W 82% 70% 98% 81% 98% 100% 98%
...
AMD Ryzen 3 2300U
AMD Ryzen 3 3350U
Qualcomm Snapdragon 7c+ Gen 3
Intel Core i7-4722HQ
Intel Core i5-1035G7
Intel Core i7-10510Y
Intel Core i5-10210Y
...
max:
Geekbench 5.0 - Geekbench 5.0 64 Bit Single-Core
min: 968 avg: 990 median: 993 (4%) max: 1008 pontos
CPU TDP 7 W TDP 9 W TDP 10 W TDP 15 W TDP 20 W 97% 99% 96% 99% 100%
...
Intel Core i5-8259U
Intel Core i3-8145U
Intel Core i7-8850H
Intel Core i5-8265U
Intel Core i7-7700HQ
...
max:
Geekbench 5.0 - Geekbench 5.0 64 Bit Multi-Core
min: 2278 avg: 2624 median: 2753 (9%) max: 2862 pontos
CPU TDP 7 W TDP 9 W TDP 10 W TDP 15 W TDP 20 W 85% 98% 80% 100% 96%
...
Intel Core i3-8145U
Intel Core i3-1110G4
AMD Ryzen 5 2600H
Microsoft SQ1
Intel Core i7-2860QM
...
max:
AMD Ryzen Threadripper PRO 3995WX
Geekbench 4.4 - Geekbench 4.1 - 4.4 64 Bit Single-Core
min: 4278 avg: 4440 median: 4467 (45%) max: 4549 pontos
CPU TDP 7 W TDP 9 W TDP 10 W TDP 15 W TDP 20 W 97% 100% 94% 98% 99%
...
Intel Core i5-7300U
Intel Core i5-8259U
Intel Core i5-6350HQ
Intel Core i5-8265U
Intel Core i7-8709G
Intel Core i5-7287U
Intel Core i3-8109U
...
max:
Geekbench 4.4 - Geekbench 4.1 - 4.4 64 Bit Multi-Core
min: 10361 avg: 11002 median: 11197 (11%) max: 11264 pontos
CPU TDP 7 W TDP 9 W TDP 10 W TDP 15 W TDP 20 W 99% 100% 92% 100% 97%
...
Intel Core i3-1110G4
Qualcomm Snapdragon 8cx
Intel Core i7-2860QM