Intel Core i3-N305

O Intel Core i3-N305 é uma CPU móvel de nível básico para laptops finos e leves da série Alder Lake-N. Ele foi anunciado no início de 2023 e não oferece núcleos de desempenho e 8 núcleos eficientes (E-cores, arquitetura Gracemont). O chip não é compatível com HyperThreading e tem clock de até 3,8 GHz. O desempenho dos E-cores deve ser semelhante ao dos antigos núcleos Skylake (compare com o Core i7-6700HQ). Todos os núcleos podem usar até 6 MB de cache L3.
Desempenho
Até setembro de 2023, não testamos um único sistema construído com o N305. Espera-se que o chip seja 50% a 100% mais rápido do que o N95 (4 núcleos, 4 threads, até 3,4 GHz).
Sua milhagem pode variar dependendo dos limites de potência da CPU e da competência da solução de resfriamento do seu sistema.
Recursos
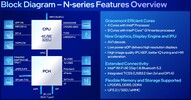
Os chips Alder Lake-N suportam apenas memória de canal único com até DDR5-4800, DDR4-3200 ou LPDDR5-4800. O chip também suporta Quick Sync e decodificação AV1 (provavelmente o mesmo mecanismo do Alder Lake). Além disso, o Wi-Fi 6E e o Bluetooth 5.2 estão parcialmente integrados (mas não há Thunderbolt). Os chips externos podem ser conectados via PCIe Gen3 x9 (via PCH).
O adaptador gráfico integrado é baseado na arquitetura Xe e oferece todas as 32 EUs (Unidades de Execução) operando a até 1,25 GHz. Além da memória de canal único, o desempenho da iGPU em jogos é muito limitado.
Consumo de energia
O i3 tem um consumo de energia básico de 15 W e pode ser configurado para até 9 W. A CPU é construída com um processo SuperFin de 10nm aprimorado da Intel (chamado Intel 7).
| Codinome | Alder Lake-N | ||||||||||||||||||||||||||||
| Série | Intel Alder Lake-N | ||||||||||||||||||||||||||||
Serie: Alder Lake-N Alder Lake-N
| |||||||||||||||||||||||||||||
| Frequência | 1800 - 3800 MHz | ||||||||||||||||||||||||||||
| Cache de Nível 1 | 768 KB | ||||||||||||||||||||||||||||
| Cache de Nível 2 | 4 MB | ||||||||||||||||||||||||||||
| Cache de Nível 3 | 6 MB | ||||||||||||||||||||||||||||
| Número de Núcelos / Subprocessos | 8 / 8 8 x 3.8 GHz Intel Gracemont E-Core | ||||||||||||||||||||||||||||
| Consumo de Energia (TDP = Thermal Design Power) | 15 Watt | ||||||||||||||||||||||||||||
| Tecnologia de Produção | 10 nm | ||||||||||||||||||||||||||||
| Tempratura Máx. | 105 °C | ||||||||||||||||||||||||||||
| Conector | BGA1264 | ||||||||||||||||||||||||||||
| Características | DDR4-3200/DDR5-4800/LPDDR5-4800 RAM (sin. chan.), PCIe 3, GNA, MMX, SSE, SSE2, SSE3, SSSE3, SSE4.1, SSE4.2, AVX, AVX2, BMI2, ABM, FMA, ADX, VMX, SMEP, SMAP, EIST, TM1, TM2, Turbo, SST, AES-NI, RDRAND, RDSEED, SHA | ||||||||||||||||||||||||||||
| GPU | Intel UHD Graphics 32EUs (Alder Lake) (1000 - 1250 MHz) | ||||||||||||||||||||||||||||
| 64 Bit | Suporte para 64 Bit | ||||||||||||||||||||||||||||
| Architecture | x86 | ||||||||||||||||||||||||||||
| Data do Anúncio | 01/03/2023 | ||||||||||||||||||||||||||||
| Link do Produto (externo) | ark.intel.com | ||||||||||||||||||||||||||||
Benchmarks
* Números menores significam um desempenho maior
Análises para Intel Core i3-N305 processador


Avaliação do Acer Aspire Go 15: Notebook para escritório com longa autonomia por 429 euros

Análise do laptop para estudantes Asus BR1402FG: Robusto para o uso diário

Análise do mini PC Maxtang MTN-ALN50: PC de escritório muito econômico com bom desempenho graças ao Intel Core i3-N305 e 8 núcleos
Acer Chromebook Spin 314 CP314-2HN: Intel UHD Graphics 32EUs (Alder Lake), 14.00", 1.6 kg
ánalise externa » Acer Chromebook Spin 314 CP314-2HN
Acer Chromebook Spin 312 CP312-1HN: Intel UHD Graphics 32EUs (Alder Lake), 12.20", 1.3 kg
ánalise externa » Acer Chromebook Spin 312 CP312-1HN
Acer Extensa 15 EX215-33: Intel UHD Graphics 32EUs (Alder Lake), 15.60", 1.7 kg
ánalise externa » Acer Extensa 15 EX215-33
Acer Aspire 3 A315-510P: Intel UHD Graphics 32EUs (Alder Lake), 15.60", 1.7 kg
ánalise externa » Acer Aspire 3 A315-510P
Acer Aspire 3 A317-55P: Intel UHD Graphics 32EUs (Alder Lake), 17.30", 2.1 kg
ánalise externa » Acer Aspire 3 A317-55P
HP Chromebook Plus x360 14b-cd0000: Intel UHD Graphics 32EUs (Alder Lake), 14.00", 1.5 kg
ánalise externa » HP Chromebook Plus x360 14b-cd0000
HP Chromebook Plus 14a-nf0000: Intel UHD Graphics 32EUs (Alder Lake), 14.00", 1.5 kg
ánalise externa » HP Chromebook Plus 14a-nf0000
Acer Chromebook Plus CB514-4H: Intel UHD Graphics 32EUs (Alder Lake), 14.00", 1.4 kg
ánalise externa » Acer Chromebook Plus 514-4HT
Acer Aspire Go 15 AG15-31P-34JP: Intel UHD Graphics 32EUs (Alder Lake), 15.60", 1.7 kg
ánalise externa » Acer Aspire Go 15 AG15-31P-34JP
Lenovo IdeaPad Slim 3 15IAN8: Intel UHD Graphics 32EUs (Alder Lake), 15.60", 1.6 kg
ánalise externa » Lenovo IdeaPad Slim 3 15IAN8
Lenovo IdeaPad Slim Chrome 14IAN8 (Slim 3i Chromebook Plus): Intel UHD Graphics 32EUs (Alder Lake), 14.00", 1.5 kg
ánalise externa » Lenovo IdeaPad Slim Chrome 14IAN8
HP Chromebook Plus 15at: Intel UHD Graphics 32EUs (Alder Lake), 15.60", 1.7 kg
ánalise externa » HP Chromebook Plus 15at
Asus Vivobook Go 15 OLED E1504G: Intel UHD Graphics 32EUs (Alder Lake), 15.60", 1.6 kg
ánalise externa » Asus Vivobook Go 15 OLED E1504G
Asus BR1402F: Intel UHD Graphics Xe 32EUs (Tiger Lake-H), 14.00", 1.6 kg
ánalise externa » Asus BR1402F
Acer Aspire 3 Spin 14 A3SP14-31PT: Intel UHD Graphics Xe 32EUs (Tiger Lake-H), 14.00", 1.5 kg
ánalise externa » Acer Aspire 3 Spin 14 A3SP14-31PT
Acer Aspire 3 A314-36M: Intel UHD Graphics Xe 32EUs (Tiger Lake-H), 14.00", 1.4 kg
ánalise externa » Acer Aspire 3 A314-36M


