Análises de Portáteis com Intel HD Graphics (Bay Trail) Placa de vídeo
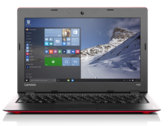
Breve Análise do Portátil Lenovo Ideapad 100S
Netbook com Windows 10. A Lenovo demonstra que você não precisa ter conversíveis complicados ou liberáveis para ter um bom netbook. Enquanto uma boa quantidade de recursos teve que ser omitida, o superleve Ideapad 100S é uma barganha por menos de $200.
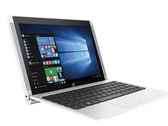
Intel Atom Z3735F, HD Graphics (Bay Trail), 11.6", 998 gBreve Análise do Conversível HP Pavilion x2 10-n013dx
Versátil e acessível… O Pavilion x2 10-n013dx é o mais recente na linha conversíveis da HP, com um design liberável e um chipset sugador de energia da Intel, destinado para lidar com o básico. Mas com este design multimodo e componentes razoáveis, é um candidato atraente para o preço.
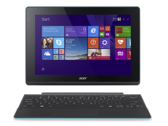
Intel Atom Z3736F, HD Graphics (Bay Trail), 10.1", 1.2 kgBreve Análise do Conversível Acer Aspire Switch 10E SW3-013
Ponto de partida 2-em-1. A Acer se saiu bem com sua série Switch de 10-polegadas. O bom valor sempre esteve no coração da oferta, portanto, é difícil ver como o novo Switch 10E se encaixa na equação de preço e valor. Damos uma olhada profunda e detalhada na análise do Acer Aspire Switch 10E abaixo.
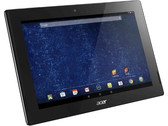
Intel Atom Z3735F, HD Graphics (Bay Trail), 10.1", 1.2 kgBreve Análise do Tablet Acer Iconia Tab 10 A3-A30
Novo, novo, novo. Android novo, novo SoC Intel, melhores câmeras - O Acer Iconia Tab 10 pretende ser melhor que os modelos anteriores. Testamos o tablet de 10,1-polegadas e agora revelaremos se vale a pena ou não.
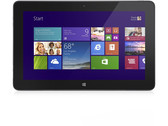
Intel Atom Z3735F, HD Graphics (Bay Trail), 10.1", 540 gBreve Análise do Tablet Dell Venue 11 Pro 5130-9356
Geração passada ainda compete. O mais recente modelo na gama Dell Venue 11 Pro 5130 inclui um processador Atom (Baytrail-M) de gama alta e o combina com 4GB de RAM e uma tela full HD o que demonstra o que pode ser feito com Atom, em um momento em que os processadores da seguinte geração estão sendo consumidos rapidamente, deixando este tablet cada vez mais obsoleto.
Intel Atom Z3795, HD Graphics (Bay Trail), 10.8", 770 gAcer Iconia One 8: Intel Atom Z3735G, 8.00", 0.3 kg
ánalise » Breve Análise do Tablet Acer Iconia One 8
Samsung Chromebook XE500C12-K01US: Intel Celeron N2840, 11.60", 1.2 kg
ánalise » Breve Análise do Portátil Samsung Chromebook 2 (XE500C12)
Dell Venue 10 Pro 5055: Intel Atom Z3735F, 10.10", 0.7 kg
ánalise » Breve Análise do Conversível Dell Venue 10 Pro 5055
Asus T100CHI-B1-BK: Intel Atom Z3775, 10.10", 1.1 kg
ánalise » Breve Análise do Tablet Conversível Asus Transformer Book T100 Chi
MSI S100: Intel Atom Z3740D, 10.10", 0.6 kg
ánalise » Breve análise do Conversível MSI S100
Lenovo Miix 3 10: Intel Atom Z3735F, 10.10", 0.6 kg
ánalise » Breve Análise do Conversível Lenovo Miix 3 10
Asus C300MA-DB01: Intel Celeron N2830, 13.30", 1.4 kg
ánalise » Breve Análise do Chromebook Asus C300MA
Lenovo Tab S8: Intel Atom Z3745, 8.00", 0.3 kg
ánalise » Breve Análise do Tablet Lenovo Tab S8
HP Stream 11 X360: Intel Celeron N2840, 11.60", 1.6 kg
ánalise » Breve Análise do Portátil Conversível HP Stream 11 X360 com 3G
HP Stream 7 5700ng: Intel Atom Z3735G, 7.00", 0.4 kg
ánalise » Breve Análise do Tablet HP Stream 7 5700ng
HP Stream 8 5900ng: Intel Atom Z3735G, 8.00", 0.4 kg
ánalise » Breve Análise do Tablet HP Stream 8 5900ng
Toshiba Satellite Radius 11 L10-B-101 : Intel Celeron N2840, 11.60", 1.3 kg
ánalise » Breve Análise do Conversível Toshiba Satellite Radius 11 L10-B-101
Asus EeeBook X205TA-FD005BS: Intel Atom Z3735F, 11.60", 1 kg
ánalise » Breve Análise do Netbook Asus EeeBook X205TA-FD005BS
HP Pavilion 10-k000ng x2: Intel Atom Z3736F, 10.10", 0.6 kg
ánalise » Breve Análise do Tablet HP Pavilion 10-k000ng x2
Lenovo Yoga Tablet 2 Pro: Intel Atom Z3745, 13.30", 1 kg
ánalise » Breve Análise do Lenovo Yoga Tablet 2 Pro
HP 14-r003ng: Intel Pentium N3530, 14.00", 2 kg
ánalise » Breve Análise do Portátil HP 14-r003ng
Dell Inspiron 15-3531: Intel Celeron N2830, 15.60", 2.1 kg
ánalise » Breve Análise do Portátil Dell Inspiron 15-3531
Lenovo S20-30: Intel Celeron N2830, 11.60", 1.3 kg
ánalise » Breve Análise do Netbook Lenovo S20-30
Acer CB3-111: Intel Celeron N2840, 11.60", 1.3 kg
ánalise » Breve Análise do Acer Chromebook 11 CB3-111
Lenovo Yoga Tablet 2 1050F: Intel Atom Z3745, 10.10", 0.6 kg
ánalise » Breve Análise do Lenovo Yoga Tablet 2 (10,1 polegadas/Wi-Fi/1050F)
Asus Memo Pad 8 ME181CX: Intel Atom Z3745, 8.00", 0.3 kg
ánalise » Breve Análise do Tablet Asus Memo Pad 8 ME181CX (Pro 7 Entertainment Pad)
Point of View WinTab 800W: Intel Atom Z3735G, 8.00", 0.3 kg
ánalise » Breve Análise do Tablet Point of View Mobii WinTab 800W
Toshiba Satellite Click 2 L30W-BST2N23: Intel Pentium N3530, 13.30", 2.1 kg
ánalise » Breve Análise do Conversível Toshiba Satellite Click 2 L30W
Asus Transformer Book T200TA: Intel Atom Z3775, 11.60", 1.6 kg
ánalise » Breve Análise do Conversível Asus Transformer Book T200TA
Acer Iconia Tab 8: Intel Atom Z3745, 8.00", 0.4 kg
ánalise » Breve Análise do Tablet Acer Iconia Tab 8 A1-840FHD
Lenovo ThinkPad Yoga 11e: Intel Celeron N2930, 11.60", 1.7 kg
ánalise » Breve Análise do Chromebook Lenovo ThinkPad Yoga 11e
Lenovo N20p-59426642 Chromebook: Intel Celeron N2830, 11.60", 1.3 kg
ánalise » Breve Análise do Chromebook Lenovo N20p-59426642 Dual-Mode
Toshiba WT8-B-102: Intel Atom Z3735G, 8.00", 0.4 kg
ánalise » Breve Análise do Tablet Toshiba WT8-B-102
HP ElitePad 1000 G2: Intel Atom Z3795, 10.10", 0.7 kg
ánalise » Breve Análise do Tablet HP ElitePad 1000 G2 (F1Q77EA)
Acer Aspire E3-111-C6LG: Intel Celeron N2930, 11.60", 1.3 kg
ánalise » Breve Análise do Portátil Acer Aspire E3-111-C6LG
Asus Transformer Pad TF303CL-1D050A: Intel Atom Z3745, 10.10", 0.6 kg
ánalise » Breve Análise do Tablet Asus Transformer Pad TF303CL-1D050A
Asus C200MA-KX003: Intel Celeron N2830, 11.60", 1.2 kg
ánalise » Breve Análise do Chromebook Asus C200MA-KX003
Lenovo B50-30: Intel Celeron N2815, 15.60", 2.2 kg
ánalise » Breve Análise do Portátil Lenovo B50-30
Lenovo ThinkPad 10: Intel Atom Z3795, 10.10", 0.6 kg
ánalise » Breve Análise do Tablet Multimodo Lenovo ThinkPad 10
Asus Memo Pad HD 7 ME176C: Intel Atom Z3745, 7.00", 0.3 kg
ánalise » Breve análise do Tablet Asus Memo Pad HD 7 ME176C
Acer Aspire Switch 10 SW5-011-12VU: Intel Atom Z3745D, 10.10", 1.1 kg
ánalise » Breve Análise do Conversível Acer Aspire Switch 10 SW5-011-12VU
Asus Transformer Pad TF103C-1B072A: Intel Atom Z3745, 10.10", 0.6 kg
ánalise » Breve Análise do Tablet Asus Transformer Pad TF103C-1B072A
Dell Venue 11 Pro 5130: Intel Atom Z3770, 10.80", 0.8 kg
ánalise » Breve Análise do Tablet Dell Venue 11 Pro 5130
Lenovo IdeaPad Flex 10: Intel Celeron N2806, 10.10", 1.2 kg
ánalise » Breve Análise do Portátil Lenovo IdeaPad Flex 10
Lenovo Miix 2 10: Intel Atom Z3740D, 10.00", 1.1 kg
ánalise » Breve Análise do Tablet Lenovo Miix 2 10
HP Pavilion 11-n070eg x360: Intel Celeron N2820, 11.60", 1.5 kg
ánalise » Breve Análise do Conversível HP Pavilion 11-n070eg x360
Asus F200MA-CT067H: Intel Celeron N2815, 11.60", 1.2 kg
ánalise » Breve Análise do Portátil Asus F200MA-CT067H
Asus F551MA-SX063H: Intel Pentium N3520, 15.60", 2.2 kg
ánalise » Breve Análise do Portátil Asus F551MA-SX063H
Asus VivoTab Note 8 (M80TA): Intel Atom Z3740, 8.00", 0.4 kg
ánalise » Breve Análise do Tablet Asus VivoTab Note 8 (M80TA)
Acer Iconia W4-820-2466: Intel Atom Z3740, 8.10", 0.4 kg
ánalise » Breve Análise do Tablet Acer Iconia W4-820-2466
HP Pavilion 11-h000sg: Intel Pentium N3510, 11.60", 1.6 kg
ánalise » Breve Análise do Conversível HP Pavilion 11-h000sg
Acer Aspire E1-510P-2671: Intel Celeron N2920, 15.60", 2.3 kg
ánalise » Breve Análise do Portátil Acer Aspire E1-510P-2671
Sony VAIO Fit 11A multi-flip SVF11AN1L2ES: Intel Celeron N2920, 11.60", 1.2 kg
ánalise » Breve Análise do Conversível Sony Vaio Fit multi-flip SV-F11AN1L2ES
HP Omni 10 5600eg (F4W59EA): Intel Atom Z3770, 10.00", 0.7 kg
ánalise » Breve Análise do Tablet HP Omni 10 5600eg (F4W59EA)
Toshiba Encore WT8-A-102: Intel Atom Z3740, 8.00", 0.5 kg
ánalise » Breve Análise do Tablet Toshiba Encore WT8-A-102
Toshiba Satellite NB10t-A-101: Intel Celeron N2810, 11.60", 1.5 kg
ánalise » Breve Análise do Netbook Toshiba Satellite NB10t-A-101
Packard Bell EasyNote ME69BMP: Intel Celeron N2805, 10.00", 1.1 kg
ánalise » Breve Análise do Netbook Packard Bell EasyNote ME69BMP
Dell Venue 8 Pro: Intel Atom Z3740D, 8.00", 0.4 kg
ánalise » Breve Análise do tablet Dell Venue 8 Pro
Lenovo Miix 2 8: Intel Atom Z3740, 8.00", 0.3 kg
ánalise » Breve Análise do Tablet Lenovo Miix 2 8
Asus Transformer Book T100TA-C1-GR: Intel Atom Z3740, 10.10", 1.1 kg
ánalise » Breve Análise do Conversível Asus Transformer Book T100TA-C1-GR
HP Chromebook 14-ak045wm: Intel Celeron N2940, 14.00", 1.7 kg
ánalise externa » HP Chromebook 14-ak045wm
Wortmann Terra Pad 1085: Intel Atom Z3745, 10.10", 0.8 kg
ánalise externa » Wortmann Terra Pad 1085
Medion Akoya E4213-MD99559 : Intel Celeron N2840, 14.00", 1.7 kg
ánalise externa » Medion Akoya E4213-MD99559
HP Stream 13-c000nd: Intel Celeron N2840, 13.30", 1.8 kg
ánalise externa » HP Stream 13-c000nd
HP Stream 11-d000nd: Intel Celeron N2840, 11.60", 1.3 kg
ánalise externa » HP Stream 11-d000nd
Prestigio MultiPad Visconte A PMP1014TE: Intel Atom Z3735F, 10.10", 0.6 kg
ánalise externa » Prestigio MultiPad Visconte A PMP1014TE
Prestigio Smartbook 141A: Intel Atom Z3735F, 14.10", 1.4 kg
ánalise externa » Prestigio Smartbook 141A
Acer Chromebook 11 CB3-131-C457: Intel Celeron N2840, 11.60", 1.1 kg
ánalise externa » Acer Chromebook 11 CB3-131-C457
Dell Latitude 11 3150: Intel Pentium N3540, 11.00", 1.4 kg
ánalise externa » Dell Latitude 11 3150
ODYS Cosmo Windows X9: Intel Atom Z3735F, 8.90", 0.4 kg
ánalise externa » ODYS Cosmo Windows X9
Dell Latitude 11-3150-4500: Intel Celeron N2840, 11.60", 1.4 kg
ánalise externa » Dell Latitude 11-3150-4500
Prestigio Smartbook 116A02: Intel Atom Z3735F, 11.60", 1.6 kg
ánalise externa » Prestigio Smartbook 116A02
Asus Chromebook C300MA-RO005: Intel Celeron N2830, 13.30", 1.4 kg
ánalise externa » Asus Chromebook C300MA-RO005
Medion Akoya E8201T-MD99751: Intel Atom Z3735G, 8.00", 0.3 kg
ánalise externa » Medion Akoya E8201T-MD99751
Medion Akoya E1235T-MD99776: Intel Atom Z3735F, 10.10", 1.2 kg
ánalise externa » Medion Akoya E1235T-MD99776
Medion Akoya E8201T-MD99751: Intel Atom Z3735G, 8.00", 0.3 kg
ánalise externa » Medion Lifetab E8201T-MD99751
Medion Akoya S6217-MD99567: Intel Pentium N3540, 15.60", 3.3 kg
ánalise externa » Medion Akoya S6217-MD99567
Lenovo B50-10 80QR0013GE: Intel Pentium N3540, 15.60", 2.3 kg
ánalise externa » Lenovo B50-10 80QR0013GE
HP Stream 13-c003: Intel Celeron N2840, 13.30", 1.6 kg
ánalise externa » HP Stream 13-c003
Acer Chromebook 11 CB3-131-C1CA: Intel Celeron N2840, 11.60", 1.1 kg
ánalise externa » Acer Chromebook 11 CB3-131-C1CA
Lenovo S21e-20 80M4004MGE: Intel Pentium N3540, 11.60", 1.1 kg
ánalise externa » Lenovo S21e-20 80M4004MGE
Asus EeeBook E402MA-WX0031T: Intel Celeron N2840, 14.10", 1.7 kg
ánalise externa » Asus EeeBook E402MA-WX0031T
Medion Lifetab P10325: Intel Atom Z3735F, 10.10", 0.6 kg
ánalise externa » Medion Lifetab P10325
HP Chromebook 11 G4: Intel Celeron N2840, 11.60", 1.3 kg
ánalise externa » HP Chromebook 11 G4
Archos 90 Cesium: Intel Atom Z3735F, 8.90", 0.8 kg
ánalise externa » Archos 90 Cesium
Medion Akoya S1219T-MD99348: Intel Atom Z3735F, 10.10", 1 kg
ánalise externa » Medion Akoya S1219T-MD99348
Acer Iconia Tab 10 A3-A30-197H: Intel Atom Z3735F, 10.10", 0.5 kg
ánalise externa » Acer Iconia Tab 10 A3-A30-197H
Lenovo B50-10-80QR0013GE: Intel Pentium N3540, 15.60", 1.9 kg
ánalise externa » Lenovo B50-10-80QR0013GE
Asus EeeBook F205TA-FD0065TS: Intel Atom Z3735F, 11.60", 1 kg
ánalise externa » Asus EeeBook F205TA-FD0065TS
Asus R515MA-SX570B: Intel Celeron N2840, 15.60", 2.3 kg
ánalise externa » Asus R515MA-SX570B
Acer Aspire Switch 10E SW3-013-100N: Intel Atom Z3735F, 10.10", 1.2 kg
ánalise externa » Acer Aspire Switch 10E SW3-013-100N
HP Chromebook 14 G4: Intel Celeron N2940, 14.00", 1.7 kg
ánalise externa » HP Chromebook 14 G4
Lenovo IdeaPad 100S-11IBY: Intel Atom Z3735F, 11.60", 1 kg
ánalise externa » Lenovo IdeaPad 100S-11IBY
Lenovo B50-10: Intel Celeron N2840, 15.60", 1.9 kg
ánalise externa » Lenovo B50-10
Lenovo IdeaPad Miix 300-10IBY: Intel Atom Z3735F, 10.10", 1.2 kg
ánalise externa » Lenovo IdeaPad Miix 300-10IBY
Lenovo IdeaPad 100s 11IBY 80R2002VFR: Intel Atom Z3735F, 11.60", 1 kg
ánalise externa » Lenovo IdeaPad 100s 11IBY 80R2002VFR
Lenovo IdeaPad 100-15IBY: Intel Pentium N3540, 15.60", 2.3 kg
ánalise externa » Lenovo IdeaPad 100-15IBY
Acer Iconia Tab 8 A1-850-13FQ: Intel Atom Z3745, 8.00", 0.4 kg
ánalise externa » Acer Iconia Tab 8 A1-850-13FQ
Lenovo Flex 3 11-80LX000DUS: Intel Celeron N2840, 11.60", 1.4 kg
ánalise externa » Lenovo Flex 3 11-80LX000DUS
HP Pavilion 11-n032tu x360: Intel Pentium N3540, 11.60", 1.5 kg
ánalise externa » HP Pavilion 11-n032tu x360
Lenovo Yoga 300-11IBY-80M0007QGE: Intel Celeron N2840, 11.60", 1.4 kg
ánalise externa » Lenovo Yoga 300-11IBY-80M0007QGE
Lenovo B40-30: Intel Celeron N2840, 14.00", 0.3 kg
ánalise externa » Lenovo B40-30
Acer Aspire Switch 10E SW5-012-11E6: Intel Atom Z3735F, 10.10", 1.2 kg
ánalise externa » Acer Aspire Switch 10E SW5-012-11E6
Lenovo IdeaPad 100-14IBY: Intel Celeron N2940, 15.60", 2 kg
ánalise externa » Lenovo IdeaPad 100-14IBY
HP Pavilion x2 10-n011nl: Intel Atom Z3736F, 10.10", 1.7 kg
ánalise externa » HP Pavilion x2 10-n011nl
Lenovo IdeaPad 100-14IBY-80MH005TGE: Intel Celeron N2840, 14.00", 1.9 kg
ánalise externa » Lenovo IdeaPad 100-14IBY-80MH005TGE
Lenovo IdeaPad 100S-80QN0000US Chromebook: Intel Celeron N2840, 11.60", 1.1 kg
ánalise externa » Lenovo 100S-80QN0000US Chromebook
HP ProSlate 10 EE G1: Intel Atom Z3735F, 7.00", 0.9 kg
ánalise externa » HP ProSlate 10 EE G1
Lenovo Ideapad 100S 80R2: Intel Atom Z3735F, 11.60", 1 kg
ánalise externa » Lenovo Ideapad 100S 80R2
Asus X553MA-XX366H: Intel Pentium N3540, 15.60", 2.2 kg
ánalise externa » Asus X553MA-XX366H
Acer Aspire Switch 10 Special Edition SW5-015-16Y3: Intel Atom Z3735F, 10.10", 1.2 kg
ánalise externa » Acer Aspire Switch 10 Special Edition SW5-015-16Y3
Acer Iconia Tab 10 A3-A30: Intel Atom Z3735F, 10.10", 0.5 kg
ánalise externa » Acer Iconia Tab 10 A3-A30
HP Pavilion x2 10-n000N: Intel Atom Z3736F, 10.10", 1.1 kg
ánalise externa » HP Pavilion x2 10-n000N
Acer Aspire V3-112P-P5B3: Intel Pentium N3540, 11.60", 1.4 kg
ánalise externa » Acer Aspire V3-112P-P5B3
Acer Aspire Switch 10E SW3-013-11N8: Intel Atom Z3735F, 10.10", 1.2 kg
ánalise externa » Acer Aspire Switch 10E SW3-013-11N8
Lenovo IdeaPad 100-15-80MJ001CGE: Intel Celeron N2840, 15.60", 2.3 kg
ánalise externa » Lenovo IdeaPad 100-15-80MJ001CGE
Medion Akoya E4214-MD99570: Intel Pentium N3540, 14.00", 1.7 kg
ánalise externa » Medion Akoya E4214-MD99570
HP Pavilion x2 10-n054sa: Intel Atom Z3736F, 10.10", 1.2 kg
ánalise externa » HP Pavilion x2 10-n054sa
Lenovo ThinkPad 11e: Intel Celeron N2940, 11.30", 1.5 kg
ánalise externa » Lenovo ThinkPad 11e
Lenovo S21e-20-80M40015US: Intel Celeron N2840, 11.60", 1.2 kg
ánalise externa » Lenovo S21e-20-80M40015US
HP ElitePad 1000 G2-J6T84AW: Intel Atom Z3795, 10.10", 0.7 kg
ánalise externa » HP ElitePad 1000 G2-J6T84AW
Acer Switch 10 SW5-015: Intel Atom Z3735F, 10.10", 1.2 kg
ánalise externa » Acer Switch 10 SW5-015
HP Pavilion x2 10-n001nf: Intel Atom Z3736F, 10.10", 1.2 kg
ánalise externa » HP Pavilion x2 10-n001nf
Lenovo Ideapad 100-14-80MH000YUS: Intel Celeron N2940, 14.10", 1.9 kg
ánalise externa » Lenovo Ideapad 100-14-80MH000YUS
Acer Extensa 2508-C3QZ: Intel Celeron N2840, 15.60", 2.5 kg
ánalise externa » Acer Extensa 2508-C3QZ
HP Pro Tablet 408 G1 L3S97AA: Intel Atom Z3736F, 8.00", 0.4 kg
ánalise externa » HP Pro Tablet 408 G1
Acer Aspire E15 ES1-512-C3YS: Intel Celeron N2840, 15.60", 2.4 kg
ánalise externa » Acer Aspire E15 ES1-512-C3YS
Dell Inspiron 15-5551: Intel Pentium N3540, 15.60", 1.2 kg
ánalise externa » Dell Inspiron 15-5551
Lenovo Flex 3 11 inch: Intel Pentium N3540, 11.60", 1.4 kg
ánalise externa » Lenovo Flex 3 11 inch
Lenovo S21e-20-80M40003GE: Intel Celeron N2840, 11.60", 1.2 kg
ánalise externa » Lenovo S21e-20-80M40003GE
Acer Iconia One 8 B1-820: Intel Atom Z3735G, 8.00", 0.4 kg
ánalise externa » Acer Iconia One 8 B1-820
Lenovo Idepad G4030: Intel Pentium N3540, 14.00", 2 kg
ánalise externa » Lenovo Idepad G4030
Acer Aspire Switch 10 SW3-013-12U1: Intel Atom Z3735F, 10.10", 1.2 kg
ánalise externa » Acer Aspire Switch 10 SW3-013-12U1
Acer Aspire ES1-512-C8JU: Intel Celeron N2840, 15.60", 2.4 kg
ánalise externa » Acer Aspire ES1-512-C8JU
Lenovo S20-30-59422752: Intel Celeron N2930, 11.60", 1.3 kg
ánalise externa » Lenovo S20-30-59422752
Lenovo N20 Chromebook: Intel Celeron N2830, 11.60", 1.2 kg
ánalise externa » Lenovo N20 Chromebook
Toshiba Satellite Radius 11 L10W-B-102 : Intel Pentium N3540, 11.60", 1.3 kg
ánalise externa » Toshiba Satellite Radius 11 L10W-B-102
Medion Akoya P2213T: Intel Pentium N3540, 11.60", 0.9 kg
ánalise externa » Medion Akoya P2213T
Asus X453MA: Intel Celeron N2840, 14.00", 2 kg
ánalise externa » Asus X453MA
Toshiba Satellite Click Mini L9W-B-102: Intel Atom Z3735F, 8.90", 0.5 kg
ánalise externa » Toshiba Satellite Click Mini L9W-B-102
Acer Aspire Switch 10 SW5-012-14HK: Intel Atom Z3735F, 10.10", 1.2 kg
ánalise externa » Acer Aspire Switch 10 SW5-012-14HK
Acer Aspire ES1-411-P5BD: Intel Pentium N3540, 14.00", 2.1 kg
ánalise externa » Acer Aspire ES1-411-P5BD
Dell Chromebook 11-3120: Intel Celeron N2840, 11.60", 1.2 kg
ánalise externa » Dell Chromebook 11-3120
Acer Chromebook 15 CB3-531: Intel Celeron N2830, 15.60", 2 kg
ánalise externa » Acer Chromebook 15 CB3-531
Dell Venue 10 Pro 5055: Intel Atom Z3735F, 10.10", 0.7 kg
ánalise externa » Dell Venue 10 Pro 5055
HP Chromebook 11 G3: Intel Celeron N2840, 11.60", 1.3 kg
ánalise externa » HP Chromebook 11 G3
Kogan Atlas X1510: Intel Pentium N3540, 15.60", 2.1 kg
ánalise externa » Kogan Atlas X1510
Acer Aspire Switch 10E SW3-013: Intel Atom Z3735F, 10.10", 1.2 kg
ánalise externa » Acer Aspire Switch 10E SW3-013
HP Stream 13-C080no: Intel Celeron N2840, 13.30", 1.6 kg
ánalise externa » HP Stream 13-C080no
Asus Transformer Book T100CHI-FG003B: Intel Atom Z3775, 10.10", 0.6 kg
ánalise externa » Asus Transformer Book T100CHI-FG003B
HP Stream 11-p085ng x360: Intel Celeron N2840, 11.60", 1.6 kg
ánalise externa » HP Stream 11-p085ng x360
Toshiba Chromebook CB30-B-103: Intel Celeron N2840, 13.30", 1.4 kg
ánalise externa » Toshiba Chromebook CB30-B-103
HP Stream 11-d023tu: Intel Celeron N2840, 11.60", 1.3 kg
ánalise externa » HP Stream 11-d023tu
HP Stream 11 X360: Intel Celeron N2840, 11.60", 1.6 kg
ánalise externa » HP Stream 11 X360
Dell Inspiron 15-3551: Intel Pentium N3540, 15.60", 2.1 kg
ánalise externa » Dell Inspiron 15-3551
Acer Iconia Tab W1-810: Intel Atom Z3735G, 7.90", 0.4 kg
ánalise externa » Acer Iconia Tab W1-810
Toshiba Satellite Radius 11 CL10W-B-100: Intel Celeron N2840, 11.60", 1.1 kg
ánalise externa » Toshiba Satellite Radius 11 CL10W-B-100
Acer Aspire ES1-111-C138: Intel Celeron N2840, 11.60", 1.1 kg
ánalise externa » Acer Aspire ES1-111-C138
HP Stream 7 5700ng: Intel Atom Z3735G, 7.00", 0.4 kg
ánalise externa » HP Stream 7 5700ng
Toshiba Encore 2 WT10-A-106: Intel Atom Z3735F, 10.10", 0.6 kg
ánalise externa » Toshiba Encore 2 WT10-A-106
Prestigio MultiPad Visconte Quad: Intel Atom Z3735G, 8.00", 0.4 kg
ánalise externa » Prestigio MultiPad Visconte Quad
Lenovo Miix 3 10: Intel Atom Z3735F, 10.10", 0.6 kg
ánalise externa » Lenovo Miix 3 10
Acer Aspire Switch 11 SW5-111-1991: Intel Atom Z3745, 11.60", 1.6 kg
ánalise externa » Acer Aspire Switch 11 SW5-111-1991
Lenovo Yoga 2-1051F: Intel Atom Z3745, 10.10", 0.9 kg
ánalise externa » Lenovo Yoga 2-1051F
Acer Aspire ES1-111-C56A: Intel Celeron N2840, 11.60", 1.3 kg
ánalise externa » Acer Aspire ES1-111-C56A
HP Stream 13-c001ng: Intel Celeron N2840, 13.30", 1.6 kg
ánalise externa » HP Stream 13-c001ng
Asus X200MA-CT339H: Intel Pentium N3530, 11.60", 1.2 kg
ánalise externa » Asus X200MA-CT339H
Dell Venue 8 Pro 3845: Intel Atom Z3735G, 8.00", 0.4 kg
ánalise externa » Dell Venue 8 Pro 3845
Acer Iconia Tab 8: Intel Atom Z3745, 8.00", 0.4 kg
ánalise externa » Acer Iconia Tab 8
Asus Transformer Pad TF103C-1A008A: Intel Atom Z3745, 10.10", 1.1 kg
ánalise externa » Asus Transformer Pad TF103C-1A008A
Toshiba Chromebook CB30-B-104: Intel Celeron N2840, 13.30", 1.4 kg
ánalise externa » Toshiba Chromebook CB30-B-104
Medion Lifetab P8912: Intel Atom Z3735F, 8.90", 0.5 kg
ánalise externa » Medion Lifetab P8912
Asus X200MA-KX130D: Intel Celeron N2815, 11.60", 1.2 kg
ánalise externa » Asus X200MA-KX130D
Lenovo IdeaPad G50-30: Intel Celeron N2830, 15.60", 2.5 kg
ánalise externa » Lenovo IdeaPad G50-30
Acer Iconia One 8 B1-810: Intel Atom Z3735G, 8.00", 0.3 kg
ánalise externa » Acer Iconia One 8 B1-810
Asus Transformer Book T90 Chi: Intel Atom Z3775, 8.90", 0.8 kg
ánalise externa » Asus Transformer Book T90 Chi
HP Stream 8 5900ng: Intel Atom Z3735G, 8.00", 0.4 kg
ánalise externa » HP Stream 8 5900ng
Toshiba Satellite Radius 11 L10W-B-101: Intel Celeron N2840, 11.60", 1.3 kg
ánalise externa » Toshiba Satellite Radius 11 L10W-B-101
Archos 80 Cesium: Intel Atom Z3735G, 8.00", 0.4 kg
ánalise externa » Archos 80 Cesium
Toshiba Satellite Radius 11 L10-B-101 : Intel Celeron N2840, 11.60", 1.3 kg
ánalise externa » Toshiba Satellite Radius 11 L10-B-101
Toshiba Encore mini WT7-C-100: Intel Atom Z3735G, 7.00", 0.4 kg
ánalise externa » Toshiba Encore mini WT7-C-100
HP Pro Tablet 610 G1: Intel Atom Z3795, 10.10", 0.7 kg
ánalise externa » HP Pro Tablet 610 G1
Medion Lifetab S10345-MD99042: Intel Atom Z3735F, 10.10", 0.6 kg
ánalise externa » Medion Lifetab S10345-MD99042
Medion Lifetab S10346-MD98992: Intel Atom Z3735F, 10.10", 0.6 kg
ánalise externa » Medion Lifetab S10346-MD98992
Lenovo Tab S8-50LC: Intel Atom Z3745, 8.00", 0.3 kg
ánalise externa » Lenovo Tab S8-50LC
Acer Travelmate B115-MP-C2TQ: Intel Celeron N2930, 11.60", 1.4 kg
ánalise externa » Acer Travelmate B115-MP-C2TQ
Trekstor SurfTab Xintron i 7.0: Intel Atom Z3735G, 7.00", 0.3 kg
ánalise externa » Trekstor SurfTab Xintron i 7.0
Acer Iconia One 7 B1-750: Intel Atom Z3735G, 7.00", 0.3 kg
ánalise externa » Acer Iconia One 7 B1-750
Acer Aspire Switch 11 SW5-111-187P: Intel Atom Z3745, 11.60", 1.5 kg
ánalise externa » Acer Aspire Switch 11 SW5-111-187P
Asus EeeBook F205TA-FD018BS: Intel Atom Z3735F, 11.60", 1 kg
ánalise externa » Asus EeeBook F205TA-FD018BS
HP Pavilion 11-n071eg x360: Intel Celeron N2820, 11.60", 1.4 kg
ánalise externa » HP Pavilion 11-n071eg x360
Asus Chromebook C200MA-KX002: Intel Celeron N2830, 11.60", 1.2 kg
ánalise externa » Asus Chromebook C200MA-KX002
Acer Aspire E3-112-C2KP: Intel Celeron N2840, 11.60", 1.3 kg
ánalise externa » Acer Aspire E3-112-C2KP
HP 250 G3: Intel Celeron N2830, 15.60", 2.1 kg
ánalise externa » HP 250 G3
Acer Extensa 2509-C052: Intel Celeron N2930, 15.60", 2.3 kg
ánalise externa » Acer Extensa 2509-C052
Toshiba Satellite CL10-B-100: Intel Celeron N2840, 11.60", 1.1 kg
ánalise externa » Toshiba Satellite CL10-B-100
Toshiba Satellite Radius 11 L15W-B1302: Intel Celeron N2840, 11.60", 1.3 kg
ánalise externa » Toshiba Satellite Radius 11 L15W-B1302
HP Stream 11-d020nr: Intel Celeron N2840, 11.60", 1.2 kg
ánalise externa » HP Stream 11-d020nr
HP Stream 13-c020nr: Intel Celeron N2840, 13.30", 1.5 kg
ánalise externa » HP Stream 13-c020nr
Asus C300MA-DB01: Intel Celeron N2830, 13.30", 1.4 kg
ánalise externa » Asus C300MA-DB01
Lenovo S20-30: Intel Celeron N2830, 11.60", 1.3 kg
ánalise externa » Lenovo S20-30
Asus C200MA-KX003: Intel Celeron N2830, 11.60", 1.2 kg
ánalise externa » Asus C200MA-KX003
Asus F200MA-CT067H: Intel Celeron N2815, 11.60", 1.2 kg
ánalise externa » Asus F200MA-CT067H
HP Pavilion 11-n070eg x360: Intel Celeron N2820, 11.60", 1.5 kg
ánalise externa » HP Pavilion 11-n070eg x360
Acer Extensa 2509-P3ZG: Intel Pentium N3530, 15.60", 2.5 kg
ánalise externa » Acer Extensa 2509-P3ZG
Prestigio Multipad Visconte 3 3G: Intel Atom Z3735F, 10.10", 0.7 kg
ánalise externa » Prestigio Multipad Visconte 3 3G
Asus EeeBook X205TA-FD005BS: Intel Atom Z3735F, 11.60", 1 kg
ánalise externa » Asus EeeBook X205TA-FD005BS
Lenovo Yoga Tablet 2 8: Intel Atom Z3745, 8.00", 0.4 kg
ánalise externa » Lenovo Yoga Tablet 2 8 inch
Acer Chromebook CB3-111-C61U: Intel Celeron N2830, 11.60", 1.3 kg
ánalise externa » Acer Chromebook CB3-111-C61U
Toshiba Satellite Pro NB10-A-10P: Intel Pentium N3510, 11.60", 1.3 kg
ánalise externa » Toshiba Satellite Pro NB10-A-10P
Acer Aspire E3-111-C37U: Intel Celeron N2840, 11.60", 1.3 kg
ánalise externa » Acer Aspire E3-111-C37U
Acer CB3-111: Intel Celeron N2840, 11.60", 1.3 kg
ánalise externa » Acer CB3-111
Toshiba Satellite Radius 11 L15W-B1310: Intel Celeron N2840, 11.60", 1.3 kg
ánalise externa » Toshiba Satellite Radius 11 L15W-B1310
Lenovo Yoga 2 8-59426324: Intel Atom Z3745, 8.00", 0.4 kg
ánalise externa » Lenovo Yoga 2 8-59426324
Lenovo G40-80FY005BUS: Intel Celeron N2830, 14.00", 2.1 kg
ánalise externa » Lenovo G40-80FY005BUS
HP Stream 11-d001dx: Intel Celeron N2840, 11.60", 1.2 kg
ánalise externa » HP Stream 11-d001dx
Dell Inspiron 15-3531: Intel Celeron N2830, 15.60", 2.1 kg
ánalise externa » Dell Inspiron 15-3531
Asus Transformer Book T200TA-CP003H: Intel Atom Z3775, 11.60", 1.6 kg
ánalise externa » Asus Transformer Book T200TA-CP003H
Acer Aspire Switch 10 SW5-012-13DP: Intel Atom Z3735F, 10.10", 1.1 kg
ánalise externa » Acer Aspire Switch 10 SW5-012-13DP
Lenovo Yoga Tablet 2 Pro: Intel Atom Z3745, 13.30", 1 kg
ánalise externa » Lenovo Yoga Tablet 2 Pro
Acer Aspire E5-511: Intel Pentium N3530, 15.60", 2.5 kg
ánalise externa » Acer Aspire E5-511
Lenovo Yoga Tablet 2 1050F: Intel Atom Z3745, 10.10", 0.6 kg
ánalise externa » Lenovo Yoga Tablet 2 1050F
Asus Transformer Book T200TA-C1-BL: Intel Atom Z3795, 11.60", 0.2 kg
ánalise externa » Asus Transformer Book T200TA-C1-BL
Acer Iconia W4-821: Intel Atom Z3740, 8.10", 0.4 kg
ánalise externa » Acer Iconia W4-821
HP Pavilion 11-n016tu x360: Intel Pentium N3520, 11.60", 1.4 kg
ánalise externa » HP Pavilion 11-n016tu x360
Toshiba CB35-B3340: Intel Celeron N2840, 13.30", 1.3 kg
ánalise externa » Toshiba CB35-B3340
Samsung Chromebook XE500C12-K01US: Intel Celeron N2840, 11.60", 1.2 kg
ánalise externa » Samsung Chromebook XE500C12-K01US
Acer Aspire Switch 10 SW5-012-17XE: Intel Atom Z3735F, 10.10", 1.1 kg
ánalise externa » Acer Aspire Switch 10 SW5-012-17XE
Acer Iconia One 8: Intel Atom Z3735G, 8.00", 0.3 kg
ánalise externa » Acer Iconia One 8
Acer Aspire E3-111-C1BW: Intel Celeron N2930, 11.60", 1.3 kg
ánalise externa » Acer Aspire E3-111-C1BW
Toshiba Encore 2 WT8-B264: Intel Atom Z3735F, 8.00", 0.4 kg
ánalise externa » Toshiba Encore 2 WT8-B264
Medion Akoya P2214T MD 99430: Intel Celeron N2940, 11.60", 1.6 kg
ánalise externa » Medion Akoya P2214T MD 99430
Toshiba WT8-B-102: Intel Atom Z3735G, 8.00", 0.4 kg
ánalise externa » Toshiba WT8-B-102
Asus X553MA-XX044H: Intel Celeron N2830, 15.60", 2.2 kg
ánalise externa » Asus X553MA-XX044H
Acer Aspire V3-111P-P6VM: Intel Pentium N3530, 11.60", 1.4 kg
ánalise externa » Acer Aspire V3-111P-P6VM
Medion Akoya S6213T MD98716: Intel Pentium N3530, 15.60", 3.3 kg
ánalise externa » Medion Akoya S6213T MD98716
Lenovo Tab S8: Intel Atom Z3745, 8.00", 0.3 kg
ánalise externa » Lenovo Tab S8
Acer Iconia Tab 8 W: Intel Atom Z3735G, 8.00", 0.4 kg
ánalise externa » Acer Iconia Tab 8 W
Asus EeeBook X205: Intel Atom Z3735D, 11.60", 1 kg
ánalise externa » Asus EeeBook X205
Toshiba Satellite Click 2 L35W-B3204: Intel Pentium N3530, 13.30", 2.2 kg
ánalise externa » Toshiba Satellite Click 2 L35W-B3204
Toshiba Encore Mini WT7-C16: Intel Atom Z3735G, 7.00", 0.4 kg
ánalise externa » Toshiba Encore Mini WT7-C16
Acer Iconia Tab 8 A1-840FHD: Intel Atom Z3745, 8.00", 0.4 kg
ánalise externa » Acer Iconia Tab 8 A1-840FHD
Toshiba Satellite C50-B-14D: Intel Celeron N2830, 15.60", 2.2 kg
ánalise externa » Toshiba Satellite C50-B-14D
Toshiba Satellite L50-B-1M6: Intel Pentium N3530, 15.60", 2.2 kg
ánalise externa » Toshiba Satellite L50-B-1M6
Asus Memo Pad 8 ME181CX: Intel Atom Z3745, 8.00", 0.3 kg
ánalise externa » Asus Memo Pad 8 ME181CX
Acer Aspire V3-111P-27AC: Intel Celeron N2830, 11.60", 1.3 kg
ánalise externa » Acer Aspire V3-111P-27AC
Lenovo IdeaPad Yoga 2 11: Intel Pentium N3520, 11.60", 1.3 kg
ánalise externa » Lenovo IdeaPad Yoga 2 11
Asus C300: Intel Celeron N2830, 13.30", 1.4 kg
ánalise externa » Asus C300
Lenovo ThinkPad Yoga 11e: Intel Celeron N2930, 11.60", 1.7 kg
ánalise externa » Lenovo ThinkPad Yoga 11e
Toshiba Satellite L30W-B-10D: Intel Pentium N3530, 13.30", 2.1 kg
ánalise externa » Toshiba Satellite L30W-B-10D
Toshiba Satellite L30W-BST2N23: Intel Pentium N3530, 13.30", 2.2 kg
ánalise externa » Toshiba Satellite L30W-BST2N23
Lenovo N20p-59426642 Chromebook: Intel Celeron N2830, 11.60", 1.3 kg
ánalise externa » Lenovo N20p-59426642 Chromebook
Asus Transformer Book T100TA-DK025H: Intel Atom Z3775, 10.10", 1.1 kg
ánalise externa » Asus Transformer Book T100TA-DK025H
Toshiba Satellite NB10t-A-10F: Intel Celeron N2820, 11.60", 1.3 kg
ánalise externa » Toshiba Satellite NB10t-A-10F
Lenovo B50-30: Intel Celeron N2815, 15.60", 2.2 kg
ánalise externa » Lenovo B50-30
Asus X200MA-KX366B: Intel Celeron N2830, 11.60", 1.2 kg
ánalise externa » Asus X200MA-KX366B
Asus Transformer Book T200TA: Intel Atom Z3775, 11.60", 1.6 kg
ánalise externa » Asus Transformer Book T200TA
Asus Transformer Book T100TAM: Intel Atom Z3775, 10.10", 0.6 kg
ánalise externa » Asus Transformer Book T100TAM
Packard Bell Easynote TF71BM-C8R1: Intel Celeron N2830, 15.60", 2.4 kg
ánalise externa » Packard Bell Easynote TF71BM
Lenovo G50-30: Intel Celeron N2830, 15.60", 2.1 kg
ánalise externa » Lenovo G50
Asus Transformer Book T100TA-DK047H: Intel Atom Z3745, 10.10", 1.1 kg
ánalise externa » Asus Transformer Book T100TA-DK047H
Toshiba Satellite Click 2: Intel Pentium N3530, 13.30", 2.1 kg
ánalise externa » Toshiba Satellite Click 2
Asus Transformer Pad TF303CL-1D050A: Intel Atom Z3745, 10.10", 0.6 kg
ánalise externa » Asus Transformer Pad TF303CL-1D050A
Medion Akoya E1232T-MD99410: Intel Celeron N2807, 10.10", 1.1 kg
ánalise externa » Medion Akoya E1232T-MD99410
Toshiba Encore 2 10.1 inch: Intel Atom Z3735G, 10.10", 0.6 kg
ánalise externa » Toshiba Encore 2 10.1 inch
Dell Inspiron 11-3147: Intel Pentium N3530, 11.60", 1.4 kg
ánalise externa » Dell Inspiron 11-3147
Acer Aspire Switch 10-SW5-011-17WL: Intel Atom Z3745, 10.10", 1.1 kg
ánalise externa » Acer Aspire Switch 10-SW5-011-17WL
Asus Memo Pad 8 ME181C: Intel Atom Z3745, 8.00", 0.3 kg
ánalise externa » Asus Memo Pad 8 ME181C
Acer Aspire V3-111P-P06A: Intel Pentium N3530, 11.60", 1.4 kg
ánalise externa » Acer Aspire V3-111P-43BC
Acer Aspire E3-111-C45G: Intel Celeron N2930, 11.60", 1.3 kg
ánalise externa » Acer Aspire E3-111-C45G
Acer Aspire E1-510: Intel Celeron N2920, 15.60", 2.4 kg
ánalise externa » Acer Aspire E1-510
Asus MeMo Pad 7 ME176CX: Intel Atom Z3745, 7.00", 0.3 kg
ánalise externa » Asus MeMo Pad 7 ME176CX
Acer Aspire Switch 10-SW5-011-18MX: Intel Atom Z3745, 10.10", 1.1 kg
ánalise externa » Acer Aspire Switch 10-SW5-011-18MX
Toshiba Satellite C55-A5140: Intel Celeron N2820, 15.60", 2.3 kg
ánalise externa » Toshiba Satellite C55-A5140
Acer Aspire Switch 10: Intel Atom Z3740, 10.10", 1.1 kg
ánalise externa » Acer Aspire Switch 10
Asus Transformer Book T100TA 64Gb Keyboard Dock: Intel Atom Z3740, 10.10", 1.1 kg
ánalise externa » Asus Transformer Book T100TA 64Gb Keyboard Dock
Asus C200MA-DS01: Intel Celeron N2830, 11.60", 1.2 kg
ánalise externa » Asus C200MA-DS01
Fujitsu Stylistic Q584: Intel Atom Z3770, 10.10", 0.7 kg
ánalise externa » Fujitsu Stylistic Q584
Asus Transformer Pad TF103C-1B072A: Intel Atom Z3745, 10.10", 0.6 kg
ánalise externa » Asus Transformer Pad TF103C
Medion Akoya E6240T-MD99290: Intel Celeron N2920, 15.60", 2.4 kg
ánalise externa » Medion Akoya E6240T-MD99290
Asus Memo Pad 7 ME176C: Intel Atom Z3745, 7.00", 0.3 kg
ánalise externa » Asus Memo Pad 7 ME176C
Schenker Element 3G: Intel Atom Z3740D, 10.10", 0.6 kg
ánalise externa » Schenker Element 3G
Toshiba Encore WT8-A-103: Intel Atom Z3740, 8.00", 0.5 kg
ánalise externa » Toshiba Encore WT8-A-103
Toshiba Satellite C50-A-1M0: Intel Pentium N3520, 15.60", 2.4 kg
ánalise externa » Toshiba Satellite C50-A-1M0
Medion Akoya S6214T-MD99380: Intel Pentium N3520, 15.60", 3.3 kg
ánalise externa » Medion Akoya S6214T-MD99380
HP Pavilion 11-n000ed: Intel Pentium N3520, 11.60", 1.4 kg
ánalise externa » HP Pavilion 11-n000ed
Lenovo Miix 2 10: Intel Atom Z3740D, 10.00", 1.1 kg
ánalise externa » Lenovo Miix 2 10
Lenovo ThinkPad 10: Intel Atom Z3795, 10.10", 0.6 kg
ánalise externa » Lenovo ThinkPad 10
Toshiba Satellite Pro NB10-A-109: Intel Celeron N2810, 11.60", 1.5 kg
ánalise externa » Toshiba Satellite Pro NB10-A-109
Asus Transformer Book T100TA-DK007H: Intel Atom Z3740, 10.10", 1 kg
ánalise externa » Asus Transformer Book T100TA-DK007H
Acer Aspire Switch 10 SW5-011-12VU: Intel Atom Z3745D, 10.10", 1.1 kg
ánalise externa » Acer Aspire Switch 10
Lenovo IdeaPad Flex 10: Intel Celeron N2806, 10.10", 1.2 kg
ánalise externa » Lenovo IdeaPad Flex 10
HP Pavilion 11t-n000 x360: Intel Pentium N3520, 11.60", 1.4 kg
ánalise externa » HP Pavilion 11t-n000 x360
Acer C720P-29552G03aii Chromebook: Intel Celeron 2955U, 11.60", 1.3 kg
ánalise externa » Acer C720P-29552G03aii Chromebook
Asus K200MA-DS01T: Intel Celeron N2815, 11.60", 1.4 kg
ánalise externa » Asus K200MA-DS01T
Sony Vaio Fit 11A SVF11N1S2E/B: Intel Pentium N3520, 11.60", 1.2 kg
ánalise externa » Sony Vaio Fit 11A SVF11N1S2E/B
Lenovo ThinkPad 8: Intel Atom Z3770, 8.30", 0.4 kg
ánalise externa » Lenovo ThinkPad 8
HP Pavilion 11-N000NF x360: Intel Pentium N3520, 11.60", 1.4 kg
ánalise externa » HP Pavilion 11-N000NF x360
Lenovo IdeaPad Yoga 2 11-9416656: Intel Pentium N3520, 11.60", 1.4 kg
ánalise externa » Lenovo IdeaPad Yoga 2 11-9416656
Acer Aspire E1-510P-2671: Intel Celeron N2920, 15.60", 2.3 kg
ánalise externa » Acer Aspire E1-510P-2671
Medion Akoya P2212T-MD99360: Intel Celeron N2920, 11.60", 0.9 kg
ánalise externa » Medion Akoya P2212T-MD99360
Toshiba Satellite NB10t-A-101: Intel Celeron N2810, 11.60", 1.5 kg
ánalise externa » Toshiba Satellite NB10t-A-101
Medion Akoya E7226T-MD99310: Intel Pentium N3520, 17.30", 3.2 kg
ánalise externa » Medion Akoya E7226T-MD99310
HP Pavilion x360: Intel Pentium N3520, 11.60", 1.4 kg
ánalise externa » HP Pavilion x360
Asus VivoTab Note 8: Intel Atom Z3740, 8.00", 0.4 kg
ánalise externa » Asus VivoTab Note 8
Sony Vaio Flip 11 SV-F11N1C5E2: unknown, 11.60", 1.2 kg
ánalise externa » Sony Vaio Flip 11 SV-F11N1C5E2
HP Omni 10 5600eg (F4W59EA): Intel Atom Z3770, 10.00", 0.7 kg
ánalise externa » HP Omni 10 5600eg (F4W59EA)
Medion Akoya P2211T MD98602: Intel Celeron N2910, 11.60", 1.7 kg
ánalise externa » Medion Akoya P2211T MD98602
HP ElitePad 1000 G2: Intel Atom Z3795, 10.10", 0.7 kg
ánalise externa » HP ElitePad 1000 G2
HP ProPad 600: , 10.10", 0.7 kg
ánalise externa » HP ProPad 600
Toshiba Satellite NB15t-A1304: Intel Celeron N2810, 11.60", 1.5 kg
ánalise externa » Toshiba Satellite NB15t-A1304
Lenovo ThinkPad Tablet 8: Intel Atom Z3770, 8.00", 0.4 kg
ánalise externa » Lenovo ThinkPad Tablet 8
Toshiba Satellite NB15T-A1302: Intel Celeron N2810, 11.60", 1.5 kg
ánalise externa » Toshiba Satellite NB15T-A1302
Sony Vaio Flip 11: Intel Pentium N3520, 11.60", 1.3 kg
ánalise externa » Sony Vaio Flip 11
Medion Akoya E6239T: Intel Pentium N3510, 15.40", 2.6 kg
ánalise externa » Medion E6239T
Toshiba Encore WT8-A-102: Intel Atom Z3740, 8.00", 0.5 kg
ánalise externa » Toshiba Encore WT8-A-102
Acer Aspire Z3-600-UR31: Intel Pentium J2850, 21.50", 6.6 kg
ánalise externa » Acer Aspire Z3-600-UR31
Packard Bell EasyNote ME69BMP: Intel Celeron N2805, 10.00", 1.1 kg
ánalise externa » Packard Bell EasyNote ME69BMP
Acer Iconia W4-820-2466: Intel Atom Z3740, 8.10", 0.4 kg
ánalise externa » Acer Iconia W4-820-2466
Lenovo Miix 2 8: Intel Atom Z3740, 8.00", 0.3 kg
ánalise externa » Lenovo Miix 2 8
Dell Venue 8 Pro: Intel Atom Z3740D, 8.00", 0.4 kg
ánalise externa » Dell Venue 8 Pro
Asus Transformer Book T100TA-C1-GR: Intel Atom Z3740, 10.10", 1.1 kg
ánalise externa » Asus Transformer Book T100TA-C1-GR
Toshiba Encore: Intel Atom Z3770, 8.00", 0.5 kg
ánalise externa » Toshiba Encore