Notebookcheck Logo

Intel Graphics 1 Xe3 Wildcat Lake iGPU

Intel Intel Graphics 1 Xe3 WCL

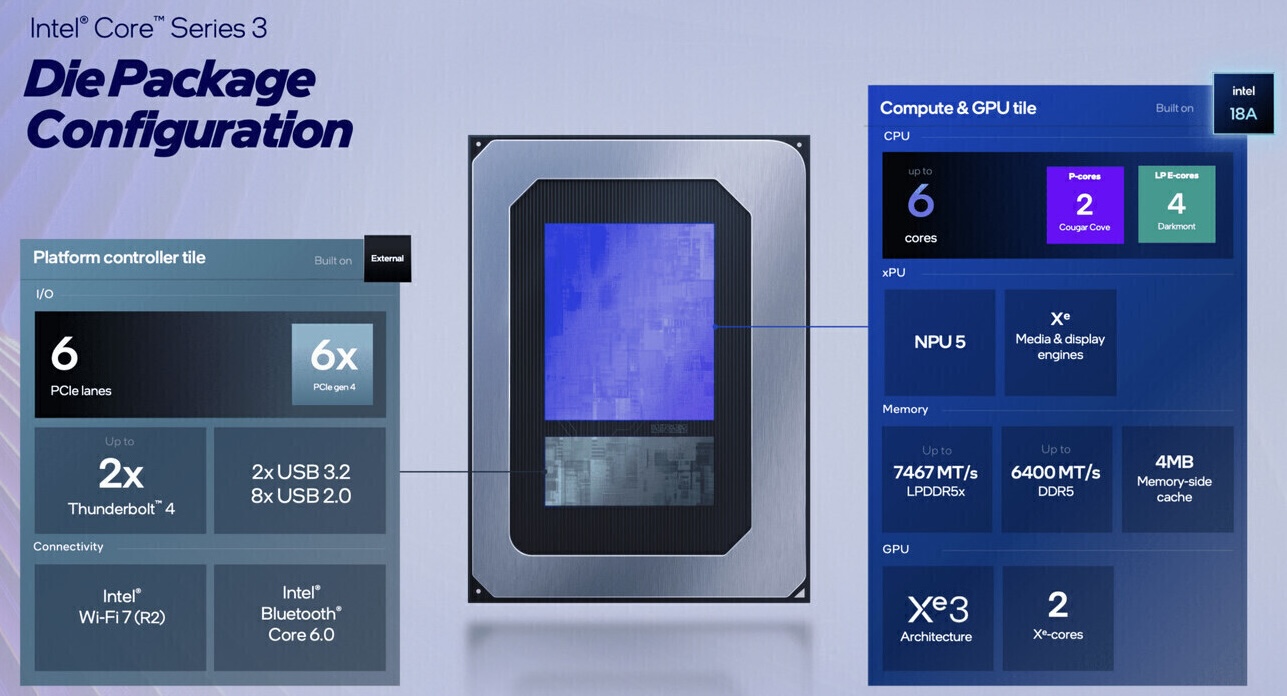
A Intel Graphics 1-Core Xe3 é uma placa gráfica integrada nos SoCs Wildcat Lake com um dos dois núcleos Xe3 (8 EUs / 128 ALUs) e um núcleo de raytracing.

O novo mecanismo de mídia agora suporta codificação e decodificação AV1, decodificação VVC, AVC de 10 bits e eDP 1.5.

A pequena iGPU não é adequada para jogos 3D exigentes. Apenas jogos pouco exigentes e muito antigos devem ser executados sem problemas.

O núcleo gráfico está no bloco de computação e GPU do chip WCL e é fabricado no moderno processo de 1,8 nm (Intel 18A).

Wildcat Lake Xe3 Serie

Intel Graphics 2 Xe3 WCL 16 @ 2.6 GHz
Intel Graphics 1 Xe3 WCL 8 @ 2.3 GHz
CódigoWildcat Lake
iGPUIntegrated Graphics
Pipelines8 - unificado
Raytracing Cores1
Velocidade do núcleo2300 (Boost) MHz
AI GPU9 TOPS INT8
Memória compartilhadanão
APIDirectX 12_2
tecnología1.8 nm
Data do anúncio01.05.2026
CPU in Intel Graphics 1 Xe3 WCLGPU Base SpeedGPU Boost / Turbo
Intel Core 3 3056 x 1400 MHz, 15 W? MHz2300 MHz
Intel Core 3 3045 x 1400 MHz, 15 W? MHz2300 MHz
min. - max.? MHz2300 MHz

Benchmarks

3DMark - 3DMark Steel Nomad Light
587 Points (1%)
3DMark - 3DMark Fire Strike Standard Score
1917 Points (3%)
3DMark - 3DMark Fire Strike Standard Graphics
1998 Points (2%)
3DMark - 3DMark Time Spy Score
858 Points (2%)
3DMark - 3DMark Time Spy Graphics
753 Points (2%)
Intel UHD Graphics 600
107.5 -86%
...
NVIDIA Quadro M600M
631 -16%
Intel Iris Plus Graphics G4 (Ice Lake 48 EU)
639 -15%
650 -14%
Intel UHD Graphics Xe 32EUs (Tiger Lake-H)
670 -11%
AMD Radeon RX Vega 8 (Ryzen 2000/3000)
673 -11%
AMD Radeon RX Vega 10
724 -4%
733 -3%
744 -1%
Intel Iris Plus Graphics G7 (Ice Lake 64 EU)
744 -1%
Intel Graphics 1 Xe3 Wildcat Lake iGPU
753
758 1%
786 4%
787 5%
AMD Radeon 540X
797 6%
Qualcomm Adreno 690
811 8%
Intel UHD Graphics Xe G4 48EUs
812 8%
AMD Radeon Pro WX 3100
820 9%
AMD Radeon RX Vega 6 (Ryzen 4000/5000)
821 9%
862 14%
...
NVIDIA RTX PRO 5000 Blackwell Generation Laptop
23277 2991%
max:
NVIDIA GeForce RTX 5090
44063 5752%
0%
100%
Restrict / Search: Model: Max. age: years
3DMark 11 - 3DM11 Performance Score
2475 Points (3%)
3DMark 11 - 3DM11 Performance GPU
2165 Points (2%)
171.8 -92%
...
2017 -7%
2085 -4%
2092 -3%
2104 -3%
2110 -3%
2118 -2%
2125 -2%
2139 -1%
2145 -1%
Intel Graphics 1 Xe3 Wildcat Lake iGPU
2165
Intel UHD Graphics G1 (Ice Lake 32 EU)
2171 0%
2185 1%
2187 1%
2187 1%
AMD Radeon R6 M255DX
2198 2%
AMD Radeon R7 M445
2208 2%
2213 2%
2215 2%
AMD FirePro W4190M
2221 3%
...
NVIDIA RTX PRO 5000 Blackwell Generation Laptop
68271 3053%
max:
NVIDIA GeForce RTX 5090
129772 5894%
0%
100%
Restrict / Search: Model: Max. age: years
Cinebench R10 Cinebench R10 Shading (32bit) +
Cinebench R10 - Cinebench R10 Shading (32bit)
11254 pontos (8%)
Cinebench R11.5 Cinebench R11.5 OpenGL 64 Bit +
Cinebench R11.5 - Cinebench R11.5 OpenGL 64 Bit
49.1 fps (5%)
Cinebench R15
Cinebench R15 OpenGL 64 Bit +
Cinebench R15 - Cinebench R15 OpenGL 64 Bit
69.8 fps (4%)
Cinebench R15 OpenGL Ref. Match 64 Bit +
Cinebench R15 - Cinebench R15 OpenGL Ref. Match 64 Bit
97.8 % (98%)
Basemark GPU 1.2 - Basemark GPU 1.2 Vulkan Official Medium Offscreen 1080
315 fps (8%)
Geekbench 6.7 - Geekbench 6.7.1 GPU OpenCL
5978 pontos (2%)
Geekbench 6.7 - Geekbench 6.7.1 GPU Vulkan
7288 pontos (2%)
LuxMark v2.0 64Bit - LuxMark v2.0 Room GPU
204 Samples/s (1%)
LuxMark v2.0 64Bit - LuxMark v2.0 Sala GPU
436 Samples/s (1%)
ComputeMark v2.1 - ComputeMark v2.1 Result
1304 pontos (1%)
- Gama de valores benchmark para essa solução gráfica
red legend - Média de valores benchmark para essa solução gráfica
* Números menores significam um desempenho maior

Benchmarks de jogos

Os seguintes benchmarks têm origem em nossos benchmarks de portáteis de análise O desempenho depende da memória gráfica utilizada, frequência, processador, configurações do sistema, controladores, e sistemas operacionais. Assim os resultados não tem que representantes para todos os portáteis com esta GPU. Para informações detalhadas sobre os resultados de benchmark, clique no número de fps.

baixo 1920x1080
9.5  fps    + Comparar
média 1920x1080
7.1  fps    + Comparar
alto 1920x1080
0 (!)  fps    + Comparar
» Não é jogável com a maioria dos notebooks testados.
Strange Brigade

Strange Brigade

2018
baixo 1280x720
62  fps    + Comparar
média 1920x1080
23.6  fps    + Comparar
alto 1920x1080
18.2  fps    + Comparar
ultra 1920x1080
0 (!)  fps    + Comparar
» Jogável em configuração de detalhes com todos os notebooks testados baixo.
baixo 1280x720
24.6  fps    + Comparar
média 1920x1080
16.3  fps    + Comparar
alto 1920x1080
16.2  fps    + Comparar
» Não é jogável com a maioria dos notebooks testados.
baixo 1280x720
23.2  fps    + Comparar
média 1920x1080
10.4  fps    + Comparar
alto 1920x1080
8.4  fps    + Comparar
» Não é jogável com a maioria dos notebooks testados.
baixo 1280x720
98.1  fps    + Comparar
média 1366x768
78.7  fps    + Comparar
alto 1920x1080
38.7  fps    + Comparar
ultra 1920x1080
36.1  fps    + Comparar
» Jogável em configuração de detalhes com todos os notebooks testados ultra.
GTA V

GTA V

2015
baixo 1024x768
90.5  fps    + Comparar
média 1366x768
71.4  fps    + Comparar
alto 1920x1080
15  fps    + Comparar
ultra 1920x1080
4.7  fps    + Comparar
» Jogável em configuração de detalhes com todos os notebooks testados média.
baixomédiaaltoultraQHD4K
Cyberpunk 20779.527.12
Strange Brigade6223.618.2
X-Plane 11.1124.616.316.2
Final Fantasy XV Benchmark23.210.48.37
Dota 2 Reborn98.178.738.736.1
GTA V90.571.4154.73
baixomédiaaltoultraQHD4K
< 30 fps
< 60 fps
< 120 fps
≥ 120 fps
3

3
4

2
4
1

1
1


Para mais jogos compatíveis e uma lista de todos os jogos e soluções gráficas visite nosso Lista de jogos

v1.35
log 01. 03:38:25

#0 ran 0s before starting gpusingle class +0s ... 0s

#1 no ids found in url (should be separated by "_") +0s ... 0s

#2 not redirecting to Ajax server +0s ... 0s

#3 did not recreate cache, as it is less than 5 days old! Created at Mon, 31 Aug 2026 05:34:52 +0200 +0.002s ... 0.002s

#4 no comparison url found in template nbc.compare_page_1 needed +0.014s ... 0.016s

#5 composed specs +0s ... 0.016s

#6 did output specs +0s ... 0.016s

#7 start showIntegratedCPUs +0s ... 0.016s

#8 getting avg benchmarks for device 13536 +0.015s ... 0.031s

#9 got single benchmarks 13536 +0.007s ... 0.038s

#10 got avg benchmarks for devices +0s ... 0.038s

#11 min, max, avg, median took s +0.89s ... 0.928s

#12 before gaming benchmark output +0s ... 0.929s

#13 Got 21 rows for game benchmarks. +0.005s ... 0.934s

#14 composed SQL query for gamebenchmarks +0s ... 0.934s

#15 got data and put it in $dataArray +0.004s ... 0.937s

#16 benchmarks composed for output. +0.068s ... 1.005s

#17 no comparison url found in template nbc.compare_page_1 needed +0.398s ... 1.403s

#18 return log +0s ... 1.403s

Google LogoAdd as a preferred source on Google
Mail Logo

Class 1

Class 2

GeForce RTX 2080 Super Mobile
RTX PRO 2000 Blackwell Generation Laptop
M5 Max 32-Core GPU *
M1 Max 32-Core GPU *
M1 Max 24-Core GPU *
GeForce RTX 2070 Super Mobile
Radeon 8050S
Quadro RTX 5000 Max-Q
Radeon RX 5700M *
Quadro RTX 4000 (Laptop)
M1 Pro 16-Core GPU *
Radeon PRO W6600M *
GeForce RTX 2070 Super Max-Q
RTX PRO 1000 Blackwell Generation Laptop *
M1 Pro 14-Core GPU *
Quadro RTX 4000 Max-Q
Radeon 8040S *
Pro A60M *

Class 3

Pro A30M
Radeon Pro 5300M
Radeon RX 5300M
GeForce GTX 1050 Ti Mobile
GeForce GTX 1050 Ti Max-Q
Radeon 680M
Arc 130T
Radeon Pro Vega 16
GeForce GTX 1050 Max-Q
Radeon 660M
Radeon Pro 560X
Radeon Pro 560
Quadro P620
Radeon RX 550X (Laptop)
Radeon Pro WX 3200 *
Radeon Pro 555X
Radeon Pro 555
Graphics 3-Core iGPU (Arrow Lake) *
Graphics 2-Core iGPU (Arrow Lake) *
Radeon 630
Quadro P520
Radeon 540X *
Vega 10
Vega 9
UHD Graphics 32EUs
UHD Graphics 750
Vega 7
UHD Graphics Xe 32EUs (Tiger Lake-H)
UHD Graphics Xe G4 48EUs
Vega 8
UHD Graphics 730
Vega 6 *
UHD Graphics 24EUs (Alder Lake-N) *
Radeon 610M *
Vega 6 *
UHD Graphics Xe 16EUs *
Adreno 690 *
Adreno 685 *
Adreno 680 *

Class 4

Posição aproximada do adaptador gráfico

Klaus Hinum, 2026-04-19 (Update: 2026-04-19)